Increasing Sales in ClientCo
23
Improving Sales Performance In ClientCo An analysis by SBP Company Inc September 27, 2011
-
Upload
deiric-mccann -
Category
Documents
-
view
212 -
download
0
description
Sample Report
Transcript of Increasing Sales in ClientCo

Improving Sales Performance In ClientCo
An analysis by SBP Company IncSeptember 27, 2011
Page | 2
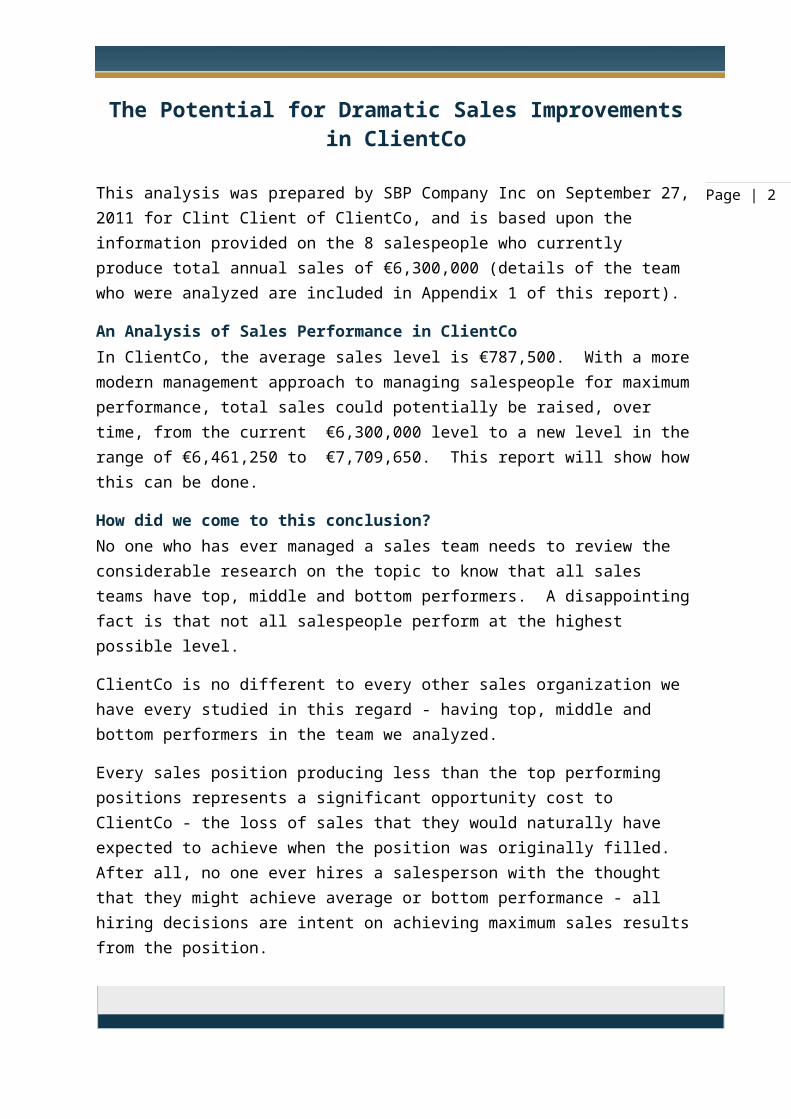
The Potential for Dramatic Sales Improvementsin ClientCo
This analysis was prepared by SBP Company Inc on September 27, 2011 for Clint Client of ClientCo, and is based upon the information provided on the 8 salespeople who currently produce total annual sales of €6,300,000 (details of the team who were analyzed are included in Appendix 1 of this report).
An Analysis of Sales Performance in ClientCo In ClientCo, the average sales level is €787,500. With a more modern management approach to managing salespeople for maximum performance, total sales could potentially be raised, over time, from the current €6,300,000 level to a new level in the range of €6,461,250 to €7,709,650. This report will show how this can be done.
How did we come to this conclusion?No one who has ever managed a sales team needs to review the considerable research on the topic to know that all sales teams have top, middle and bottom performers. A disappointing fact is that not all salespeople perform at the highest possible level.
ClientCo is no different to every other sales organization we have every studied in this regard - having top, middle and bottom performers in the team we analyzed.
Every sales position producing less than the top performing positions represents a significant opportunity cost to ClientCo - the loss of sales that they would naturally have expected to achieve when the position was originally filled. After all, no one ever hires a salesperson with the thought that they might achieve average or bottom performance - all hiring decisions are intent on achieving maximum sales results from the position.
Anything less than top performance is a lost revenue opportunity for the organization.
To identify the extent of this opportunity cost to ClientCo the first thing we did was analyze your sales performance numbers to objectively identify who are your Top, Middle, and Bottom performers.
To do this we used a technique known as 'Utility Analysis', which separates salespeople into three tiers ('Top', 'Middle' and 'Bottom' performers) using an objective analysis of their sales performance. The outcome of that analysis is presented in Table 1.

Page | 3
Table 1: Analysis of ClientCo Sales Team
Top PerformersMike: €1,500,000Bud: €1,400,000
Total Sales -Top Performers: €2,900,000 Average performance against quota - Top Performers: 145%
Middle PerformersSue: €700,000Martin: €600,000
Total Sales - Middle Performers: €1,300,000 Average performance against quota - Middle Performers: 122%
Bottom PerformersChuck: €700,000Jens: €850,000Dave: €200,000Tony: €350,000
Total Sales -Bottom Performers: €2,100,000 Average performance against quota - Bottom Performers: 90%
Look at the differences between the three groups: Bottom Performers average just 90% performance against quota
Middle Performers average 122%performance against quota - 32%-points more than Bottom Performers
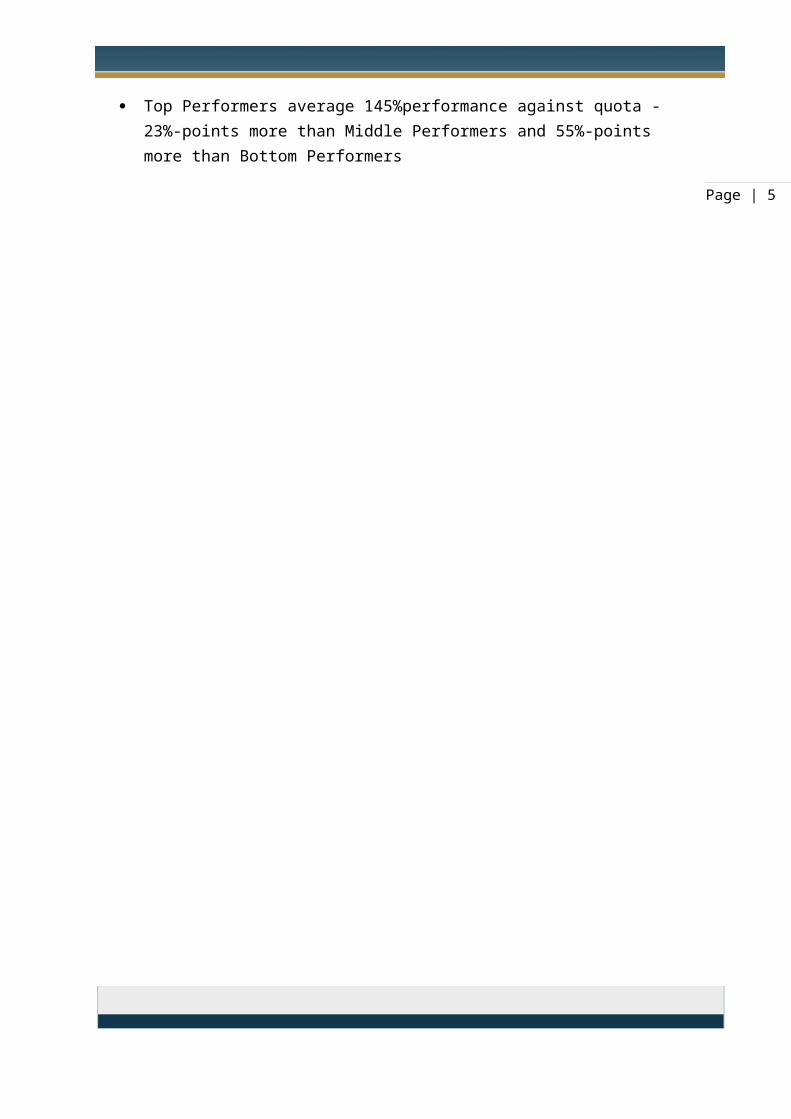
Top Performers average 145%performance against quota - 23%-points more than Middle Performers and 55%-points more than Bottom Performers

Page | 4
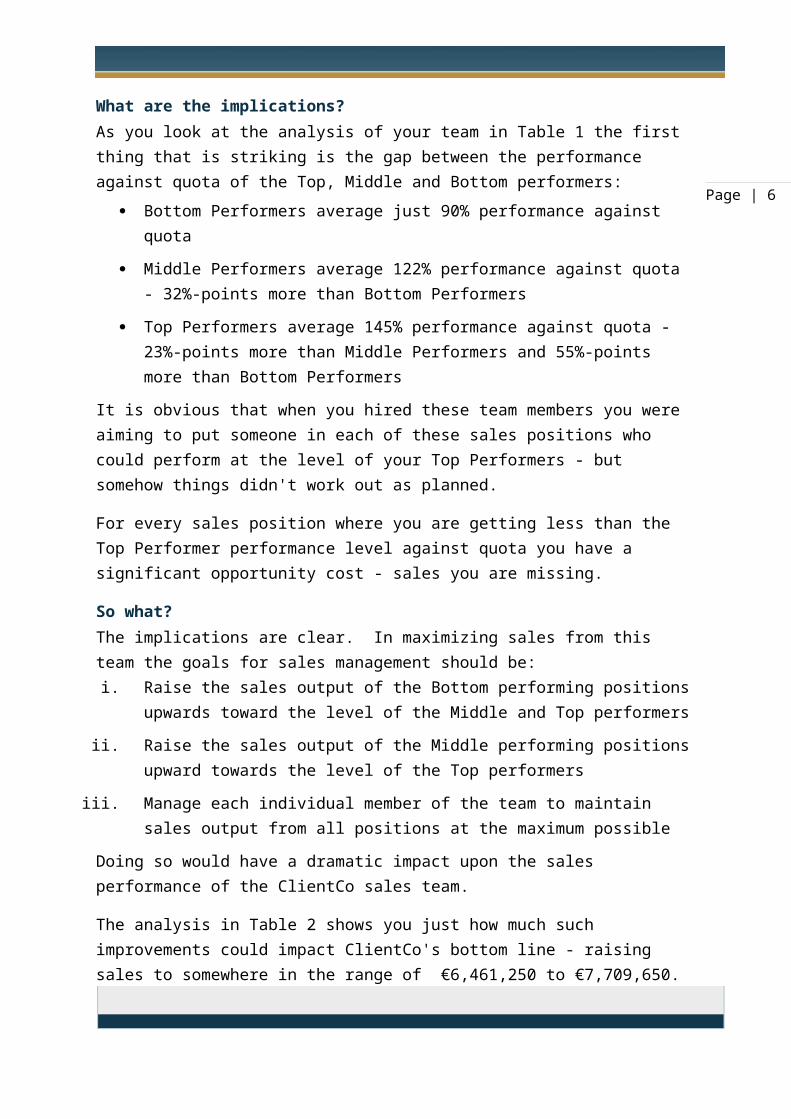
What are the implications? As you look at the analysis of your team in Table 1 the first thing that is striking is the gap between the performance against quota of the Top, Middle and Bottom performers:
Bottom Performers average just 90% performance against quota
Middle Performers average 122% performance against quota - 32%-points more than Bottom Performers
Top Performers average 145% performance against quota - 23%-points more than Middle Performers and 55%-points more than Bottom Performers
It is obvious that when you hired these team members you were aiming to put someone in each of these sales positions who could perform at the level of your Top Performers - but somehow things didn't work out as planned.
For every sales position where you are getting less than the Top Performer performance level against quota you have a significant opportunity cost - sales you are missing.
So what?The implications are clear. In maximizing sales from this team the goals for sales management should be:
i. Raise the sales output of the Bottom performing positions upwards toward the level of the Middle and Top performers
ii. Raise the sales output of the Middle performing positions upward towards the level of the Top performers
iii. Manage each individual member of the team to maintain sales output from all positions at the maximum possible
Doing so would have a dramatic impact upon the sales performance of the ClientCo sales team.
The analysis in Table 2 shows you just how much such improvements could impact ClientCo's bottom line - raising sales to somewhere in the range of €6,461,250 to €7,709,650.
A critical point is that such improvements in sales results could be achieved WITHOUT adding any more salespeople to the team. Also, once the ability of these people to produce sales at a higher level is achieved then this increase in sales is something that ClientCo will enjoy every year. This is NOT a once-off impact upon your bottom line of the type driven by special promotions or once-off offers.
Page | 5
It is clear that there are significant ongoing financial advantages to ClientCo of focusing upon achieving such an improvement in their sales team.
Page | 6
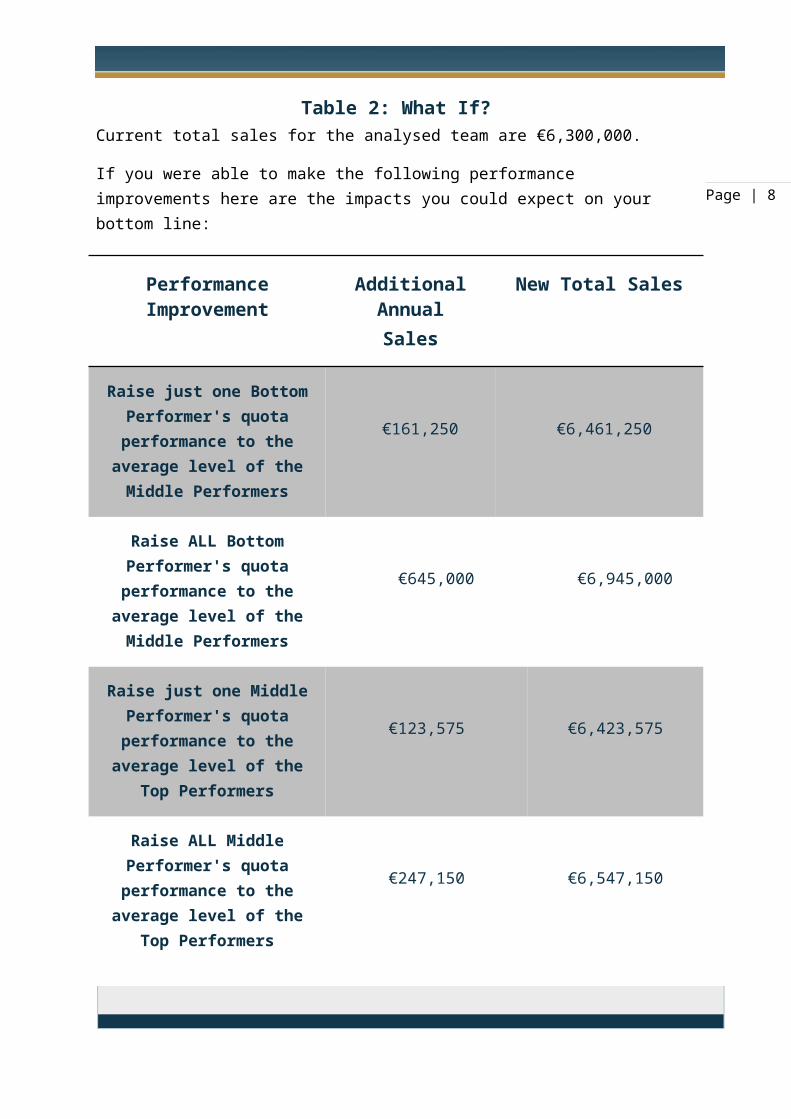
Table 2: What If?Current total sales for the analysed team are €6,300,000.
If you were able to make the following performance improvements here are the impacts you could expect on your bottom line:
Performance Improvement Additional AnnualSales
New Total Sales
Raise just one Bottom Performer's quota performance
to the average level of the Middle Performers
€161,250 €6,461,250
Raise ALL Bottom Performer's quota performance to the
average level of the Middle Performers
€645,000 €6,945,000
Raise just one Middle Performer's quota performance to the average level of the Top
Performers
€123,575 €6,423,575
Raise ALL Middle Performer's quota performance to the average level of the Top
Performers
€247,150 €6,547,150
Raise the ENTIRE TEAM's quota performance to the average level
of the Top Performers€1,409,650 €7,709,650
Page | 7
How can ClientCo raise the performance of their Middle and Bottom Performers?In Profiles we use the tool called the ‘ProfileXT Sales’ that will help you profile your entire sales team. The ProfileXT will produce a detailed profile of your top, middle and bottom performers. When we profile your salespeople we will identify those specific attributes of your top people that make them capable of such high performance – and then we’ll provide you with specific direction on how you can manage, coach and train each of your salespeople to reach this same top performance level. These profiles will not only show you what makes the difference between these three classes of seller – but will tell you precisely how you can manage your bottom and average performers so that they begin to raise their games so that they achieve at the same level as your top performers. This is not an unrealistic ‘magic bullet’ technique promising that you will take your sales through the roof overnight – we all know that such ‘magic bullets’ usually fail to produce results. No, what we’ll provide you with is a framework for continually managing your sales force in a way that maximizes your sales. This will change your sales operation forever.
Using the ProfileXT Sales you will be able to directly target each Bottom Performer with specific actions to raise their performance level from Bottom to Average, and afterwards from Average to Top performer level. And each time you raise the performance of any of your salespeople in this manner you have a dramatic, and financially measurable, effect on your sales performance (as you’ll see in the next section).
Can you think of any other way to increase your sales so dramatically?
Furthermore, these profiles will provide you with tools that will ensure that next time you hire a salesperson you consider only candidates who have the potential to be top performing salespeople in ClientCo.
The Upside Potential in ClientCo It is worth looking at the scope for improvement in ClientCo.
You’ll raise the performance of your sales positions step-by-step – taking each bottom performer to average performance, and each average performer to top performance over time. But you will see measurable financial results very quickly: you saw above that our analysis shows that every time you move one of ClientCo's positions from bottom to middle level you will add €161,250 to your sales. Raise one of your mid level positions to the top level and you add €123,575 to your sales.
Page | 8
Raise all of your positions to the same level as your top performers your total sales rise to a new total of €7,709,650, an increase in sales of €1,409,650 and a new average sales per salesperson that is €176,206 higher at €963,706.

Page | 9
Appendix 1
The analysis in this report is based upon the following sales performance information supplied by Clint Client of ClientCo:
Name Quota Actual % PerformanceMike €1,000,000 €1,500,000 150%Bud €1,000,000 €1,400,000 140%Sue €567,000 €700,000 123%Martin €500,000 €600,000 120%Chuck €600,000 €700,000 117%Jens €900,000 €850,000 94%Dave €250,000 €200,000 80%Tony €500,000 €350,000 70%

Improving Sales Performance In ClientCo
A proposal from SBP Company IncSeptember 27, 2011

Page | 2
Proving PXT Sales in ClientCoYou have seen how the ProfileXT sales can dramatically improve sales results, and have seen how it has done so in many other organisations.
Why not prove how effective it could be for you by conducting a low-cost study? The study approach will allow you to see the effectiveness of Profile XT right away.
Here’s what the study would entail:
1. First, we’ll profile all of your existing sales team – this will take just 50-70 minutes of each salesperson's time in completing an online assessment.
2. Using the results of the Top Performers identified in your sales team study we will create a Top Performer benchmark for ClientCo. This Top Performer benchmark will provide you with a very detailed description of precisely what it is that makes your Top Performers so much more successful than their peers. This will be provided to you in the form of a detailed 11-page ‘Job Analysis Report’.
3. We’ll then run all members of the team against the Top Performer benchmark, and produce Sales Management reports for each team member. These reports will be provided to their sales managers and will outline the gaps between them and the Top Performer benchmark; they will also provide specific guidance and coaching on the training, development and management each salesperson will need to raise their performance to the next level. Each report will be a blueprint for managing each salesperson to top performer success.
4. We’ll train you and your management on how to understand and make best use of these reports.
5. We’ll provide each salesperson with an Individual Report that outlines the results of their assessment – in a positive, strength-centred fashion.
6. Finally, we will provide you with access to your own Virtual Assessment Centre. This online assessment centre, private to ClientCo, will allow you to access your team’s results 24/7 from anywhere in the world, to produce as many additional reports on their results as you wish free of charge. It will also provide you with a facility to use your Top Performer benchmark next time you decide to hire a new salesperson – ensuring that you hire only people who have the potential for success at the highest levels of sales in ClientCo.

Page | 3
Study CostThe total cost for this study is just: €9,160
This cost is made up as follows:
Virtual Assessment Center setup: €5,000 (Setup & 1st year hosting – subsequently: €1,000 p.a.)
8 x ProfileXT meters @ €145: €1,160 (Once-off per salesperson – unlimited reporting)
Implementation and training: €3,000 (Once-off charge)
Once your Virtual Assessment Center site has been established you will have access to your team’s results and the reporting facilities of this site for no additional cost whatever.
Should you decide to use the system into the future then your only costs will be the annual hosting charge of €1,000 and the €145 meter cost for each new person who completes the assessment (and we even provide an attractive scales of escalating quantity discounts on this low cost for purchases greater – this kicks in at as low a quantity of ten units).
Return On InvestmentRemember, as we illustrated in your analysis report, even if all you did in the first year was raise the performance of one of bottom performers to your middle performers level you would increase your sales by €161,250 to €6,461,250.
This equals a first-year Return Of Investment of 1,660% on the €9,160 cost of putting in place a framework to make these changes.
However, raising all bottom performers to the level of your middle performers would increase your sales by €645,000 to €6,945,000.
This second scenario equals a first-year Return Of Investment of 6,941% on the €9,160 cost of putting in place a framework to make these changes.
Getting StartedWe can get this study started right away and begin putting the foundation in place for dramatically improved sales performance in ClientCo
Simply sign the Implementation Confirmation below and return to Mike deSBP of SBP Company Inc to get things started immediately.

Page | 4
Implementation Confirmation
“Please proceed with the implementation of the study on the terms outlined above.”
Signed for and on behalf of ClientCo
Name:___________________ Signature__________________
Title:____________________ Purchase Order No:__________
Date:____________________

Consultant Overview of ClientCo Sales Team
An analysis by SBP Company IncSeptember 27, 2011

Page | 2
1. Key Percentages - Current Performance
Percentage Performance Analysis
Average Percentage Performance - Entire Team 112%
Average Percentage Performance - Top Performers 145%
Average Percentage Performance - Middle Performers 122%
Average Percentage Performance - Bottom Performers 90%
Top to Middle Performer Percentage Gap 23%
Middle to Bottom Performer Percentage Gap 32%
Top to Bottom Performer Percentage Gap 55%

Page | 3
2. 'What if' Analysis
Current Sales Total €6,300,000
Raising Bottom Performers to Middle Performance
Average additional sales if one Bottom Performer sold at average Middle % against quota
€161,250
Additional sales if ALL Bottom Performers sold at average Middle % against quota
€645,000
Total sales if ALL Bottom Performers sold at average Middle % against quota
€6,945,000
Raising Middle Performers to Top Performance
Average additional sales if one Middle Performer sold at average Top % against quota
€123,575
Additional sales if ALL Middle performers sold at average Top % against quota
€247,150
Total sales if ALL Middle Performers sold at average Top% against quota
€6,547,150
Raising Entire Team to Top Performance
Additional Sales if ENTIRE TEAM sold at average Top % against quota €1,409,650
Total sales if ENTIRE TEAM sold at average Top % against quota €7,709,650

Page | 4
3. 'Downside Analysis'
Lost sales if entire team sold at average Bottom % against quota €1,514,700
Total sales if entire team sold at average Bottom % against quota €4,785,300
1,249%
2,598%