ImpactofAdditional Noise on Subjective Objective...
4
Impact of Additional Noise on Subjective and Objective Quality Assessement in VoIP Zdenek Becvar, Lukas Novak, Jan Zelenka, Miloslav Brada, Pavel Slepicka Department of Telecommunication Engineering Czech Technical University Prague, Czech Republic {becvazl, novakl5, zelenj2, bradam2, slepicp} @fel.cvut.cz Abstract The main requirement in the Voice over IP method noted as 3SQM (Speech Quality Measurement) technology is a good quality of received voice signal during according to ITU-T P.563 [4]. The results conformity was communication between subscribers. The signal quality can be evaluated by using Pearson's correlation coefficients [5] and influenced by many factors such as packet loss, jitter, packet residual errors [5]. delay, noise etc. and it can be measured by number of The rest of paper is organized subsequently. Next section methods. The main purpose of this paper is the investigation describes characteristics of tested noises and the subjective of an impact of different noise types and different noise levels .. . . . p on the qult assssen in VorP Th ariica gn rae tests composition. The third section provides the results noises and real noisessobtain fom realtelecmmunicatin obtained by subjective test and two objective methods and their discussion. Last section presents our conclusions and networks were used for testing. The next goal is a comparison future work plans. of the results obtained by subjective listening tests and objective measuring methods. PESQ and 3SQM were used for II. TESTS COMPOSITION objective testing in this paper. In the tests were used two artificial generated noises: the white noise and the grey noise. The third kind of noise signal Keyword-Speec quality; Noise; VoIwas represented by two noise signals obtained from the Topic area-Quality of service in multimedia communication. receiving side of the telecommunication chain of local telecommunication operator. There were used 4 SNR levels: I. INTRODUCTION OdB, 10dB, 20dB, 30dB. Each combination of SNR and type of noise was evaluated five times to increase the accuracy of The quality of the audio signal, which iS perceived by a fnlqaiyvle human hearing system, directly depends on several finalquality value characteristics of the signal that is reconstructed on a receiving A side of a telecommunication chain. This analog signal can be A- Types of Used Noises affected by many kinds of disturbances that are produced at an A first type of artificial noise was white noise with normal output of the voice decoder. These disturbances such as sound Gaussian distribution density of probability. White noise has dropouts, frequency disruptions, phase discontinuity, noises flat spectrum distribution of energy (Fig. 1). This noise is etc. are products of not appropriate signal processing of inherently generated by all metallic lines due to its nonzero reconstruction methods. These methods can not recover the resistance and therefore some thermal noise there will be correct waveform of the signal. That is caused by effects like always present. Another source of white noise is a packet loss, jitter and so on [1] [2]. quantization error caused during analog to digital conversion Especially, noise is a specia kindofdisturof electrical signals due to the finite number of used Especially, noise is a special kind of disturbance which has quantization levels. Moreover, there are a lot of other sources not always the disturbing effect, but in some cases it can mask in telecommunication networks which generate white noise; some undesirable effects like dropouts are. We can distinguish this was the reason of choice of this type of noise. many kinds of noises and study their influences on a human perception. In this paper will be examined three types of Grey noise was chosen as a second type of artificial noise. noises with different SNR (Signal to Noise Ratio) levels. The Grey noise has spectrum characteristic (Fig. 1) which influence of noises will be inspected with subjective and corresponds to the psychoacoustic equal loudness curve of objective testing methods. As the objective methods will be human ear [6]. A sensitivity of human ear is dependant on used PESQ (Perceptual Evaluation of Speech Quality) frequency; in the band of telecommunication channel is in the according to ITU-T P.862.1 [3] recommendation and the interval of 300-2000Hz rising with the local maximum located around 2000Hz and in the band of 2000-3400Hz is slightly decreasing. Therefore, grey noise has such spectrum distribution that an auditor perceives all tones with same This work has been supported by internal grant No. lodes CTU07 12413 funded by CTU in Prague and by FRVS grant luns No. 1439/2007/G1. 1-4244-1274-9/07/$25.00 ©2007 IEEE 39 MMSP 2007
Transcript of ImpactofAdditional Noise on Subjective Objective...
Impact of Additional Noise on Subjective andObjective Quality Assessement in VoIP
Zdenek Becvar, Lukas Novak, Jan Zelenka, Miloslav Brada, Pavel SlepickaDepartment of Telecommunication Engineering
Czech Technical UniversityPrague, Czech Republic
{becvazl, novakl5, zelenj2, bradam2, slepicp} @fel.cvut.cz
Abstract The main requirement in the Voice over IP method noted as 3SQM (Speech Quality Measurement)technology is a good quality of received voice signal during according to ITU-T P.563 [4]. The results conformity wascommunication between subscribers. The signal quality can be evaluated by using Pearson's correlation coefficients [5] andinfluenced by many factors such as packet loss, jitter, packet residual errors [5].delay, noise etc. and it can be measured by number of The rest of paper is organized subsequently. Next sectionmethods. The main purpose of this paper is the investigation describes characteristics of tested noises and the subjectiveof an impact of different noise types and different noise levels .. . ..
p
onthe qult assssen in VorP Th ariica gn rae tests composition. The third section provides the resultsnoises and real noisessobtain fom realtelecmmunicatin obtained by subjective test and two objective methods andtheir discussion. Last section presents our conclusions andnetworks were used for testing. The next goal is a comparison future work plans.of the results obtained by subjective listening tests andobjective measuring methods. PESQ and 3SQM were used for II. TESTS COMPOSITIONobjective testing in this paper. In the tests were used two artificial generated noises: the
white noise and the grey noise. The third kind of noise signalKeyword-Speec quality; Noise; VoIwas represented by two noise signals obtained from the
Topic area-Quality ofservice in multimedia communication. receiving side of the telecommunication chain of localtelecommunication operator. There were used 4 SNR levels:
I. INTRODUCTION OdB, 10dB, 20dB, 30dB. Each combination of SNR and typeof noise was evaluated five times to increase the accuracy ofThe quality of the audio signal, which iS perceived by a fnlqaiyvle
human hearing system, directly depends on several finalquality valuecharacteristics of the signal that is reconstructed on a receiving Aside of a telecommunication chain. This analog signal can be A- Types of Used Noisesaffected by many kinds of disturbances that are produced at an A first type of artificial noise was white noise with normaloutput of the voice decoder. These disturbances such as sound Gaussian distribution density of probability. White noise hasdropouts, frequency disruptions, phase discontinuity, noises flat spectrum distribution of energy (Fig. 1). This noise isetc. are products of not appropriate signal processing of inherently generated by all metallic lines due to its nonzeroreconstruction methods. These methods can not recover the resistance and therefore some thermal noise there will becorrect waveform of the signal. That is caused by effects like always present. Another source of white noise is apacket loss, jitter and so on [1] [2]. quantization error caused during analog to digital conversion
Especially, noise is a specia kindofdisturof electrical signals due to the finite number of usedEspecially, noiseis a special kind of disturbance which has quantization levels. Moreover, there are a lot of other sources
not always the disturbing effect, but in some cases it can mask in telecommunication networks which generate white noise;some undesirable effects like dropouts are. We can distinguish this was the reason of choice of this type of noise.many kinds of noises and study their influences on a humanperception. In this paper will be examined three types of Grey noise was chosen as a second type of artificial noise.noises with different SNR (Signal to Noise Ratio) levels. The Grey noise has spectrum characteristic (Fig. 1) whichinfluence of noises will be inspected with subjective and corresponds to the psychoacoustic equal loudness curve ofobjective testing methods. As the objective methods will be human ear [6]. A sensitivity of human ear is dependant onused PESQ (Perceptual Evaluation of Speech Quality) frequency; in the band of telecommunication channel is in theaccording to ITU-T P.862.1 [3] recommendation and the interval of 300-2000Hz rising with the local maximum
located around 2000Hz and in the band of 2000-3400Hz isslightly decreasing. Therefore, grey noise has such spectrumdistribution that an auditor perceives all tones with same
This work has been supported by internal grant No. lodesCTU0712413 funded by CTU in Prague and by FRVS grant lunsNo. 1439/2007/G1.
1-4244-1274-9/07/$25.00 ©2007 IEEE 39 MMSP 2007
SNR =Io (1)a) White Noise b) Grey Noise P
20 20 n__ _ _ _ _ _ _
10 r < 10 Therefore, noise generated by the LPC model xn was0- o 0 scaled by k and added to original speech signal xs to form the
[@]-10 p l O -20 distorted signal Xd (2).a) a)|1 0 d[]=X n n[ 2
-260 -i0 w4000 0 2000 4000-20~-30
-30~~ ~ ~ ~ ~ ~ ~ d[l-S[l+ Xn[n] (2)-40~~~~w3
-50 40 The scalar k was calculated (3) to reach the desired SNR of-60 ... ... -50 ..thesignalXd.0 2000 4000 0 2000 4000
Frequency (Hz) Frequency (Hz)
SNRFigure 1. Spectrum characteristics of used white noise and grey noise. k 10 10 (3)
Both types of noise were filtered with the low pass filter to n
be adapted into the band of telecommunication channel300 - 3400Hz. C. Test
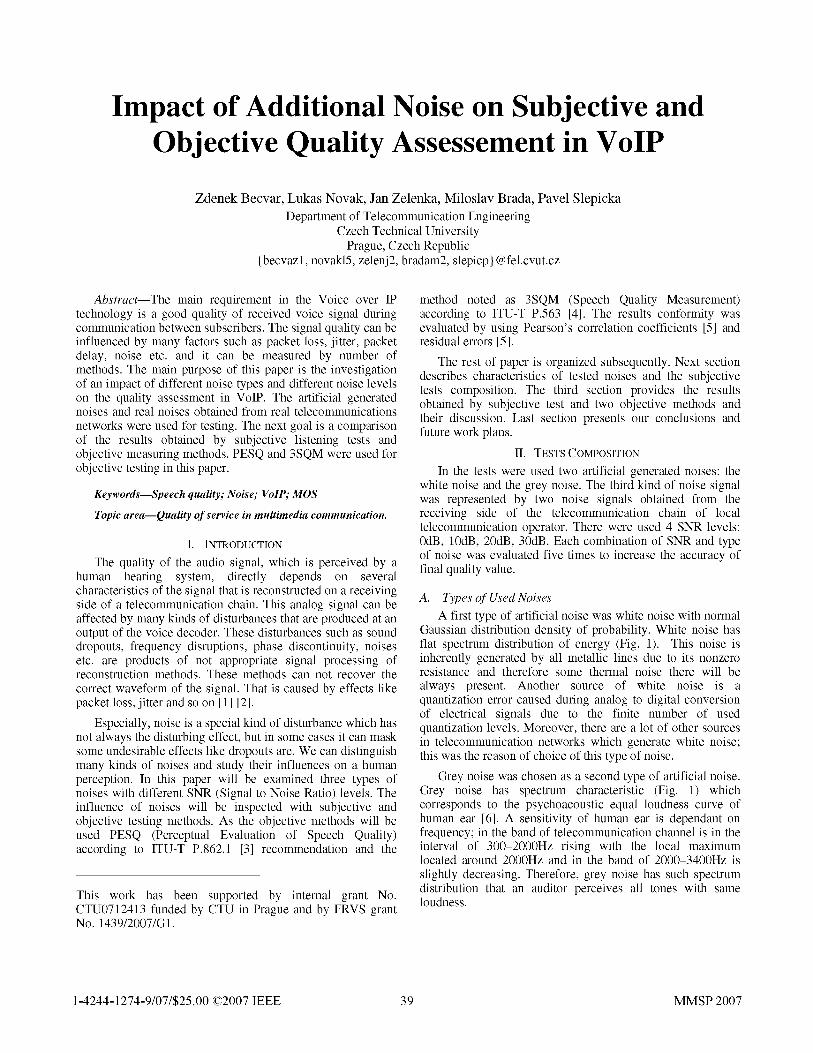
The third and the fourth type of noise were real noises The test is in accordance with recommendations ITU-Trecorded in two different points in telecommunication P.800 [8] and P.830 [9]. These standards cover a set ofnetwork. These noises are consisted of all noise contributors requirements that are necessary to fulfill to obtain reasonablewithin the telecommunication chain, but moreover, they are subjective test results. The sound samples properties, numberalso affected by transfer characteristics of signal processing of testing subjects, conditions in the testing area, acceptableelectronic circuits, e.g. SLIC (Subscriber Line Interface length of the test and methods to evaluate results are parts ofCircuit). Power spectral density of these noises can be seen in the recommendations.Fig.2. The original recordings were acquired from the radio
Akropolis. They are the studio quality sound samples recordeda) Real Noise 1 b) Real Noise 2 by professional speakers. The basic set of utterances consists
15 10 of 80 emotively neutral sentences spoken by 5 male and 5female speakers.
_10 q co 5 L5
The average utterance length was approximately 8 seconds
with defined voice to silence ratio. The speech fulfill between40% and 80% of the time of utterance, the rest of time theLUo % O X silence is present. In the next processing the samples were
U) 0~~~~~~~~~~~~)> 0_> J .> \ downsampled to the 8 kHz, converted to 16-bit linear PCM
= -5 < af -5 \ ~ (Pulse Code Modulation) and disturbed by noise.
The test was performed by 18 listeners, the employees and-10 2000. 4000 -10 2000 students of university. This is more than the acceptable
0 2000 4000 0 2000 4000 miiu of litnr eie n[]Frequency (Hz) Frequency (Hz) minmum of listeners defined in [8].
Figure 2. Spectrum characteristics of used real noise 1 and real noise 2The test was performed with high quality headphones inthe quiet laboratory at Czech Technical University. The roomwas guarded against ambient noise and disturbances. Also the
B. Noises generation conditions in the room were selected not to disturb theModification of all speech files was implemented in listeners.
MATLAB® v7.1 software. For generation of noise signals The test consists of 80 utterances and its realization takeswas used LPC (Linear Predictive Coding) [7]. A degree of about 30 minutes.LPC model was set to 200 in the case of artificial noise signalsand to 50 in the case of real noise signals. LPC was excited by The results were calculated as an average from each 5white noise with gauss distribution. There were chosen 4 utterances distorted by the same type of noise and SNR. Thelevels of SNR (1) and for each level there was generated noise same evaluation method was used in processing the 3SQMaccordingly. and PESQ results.
40
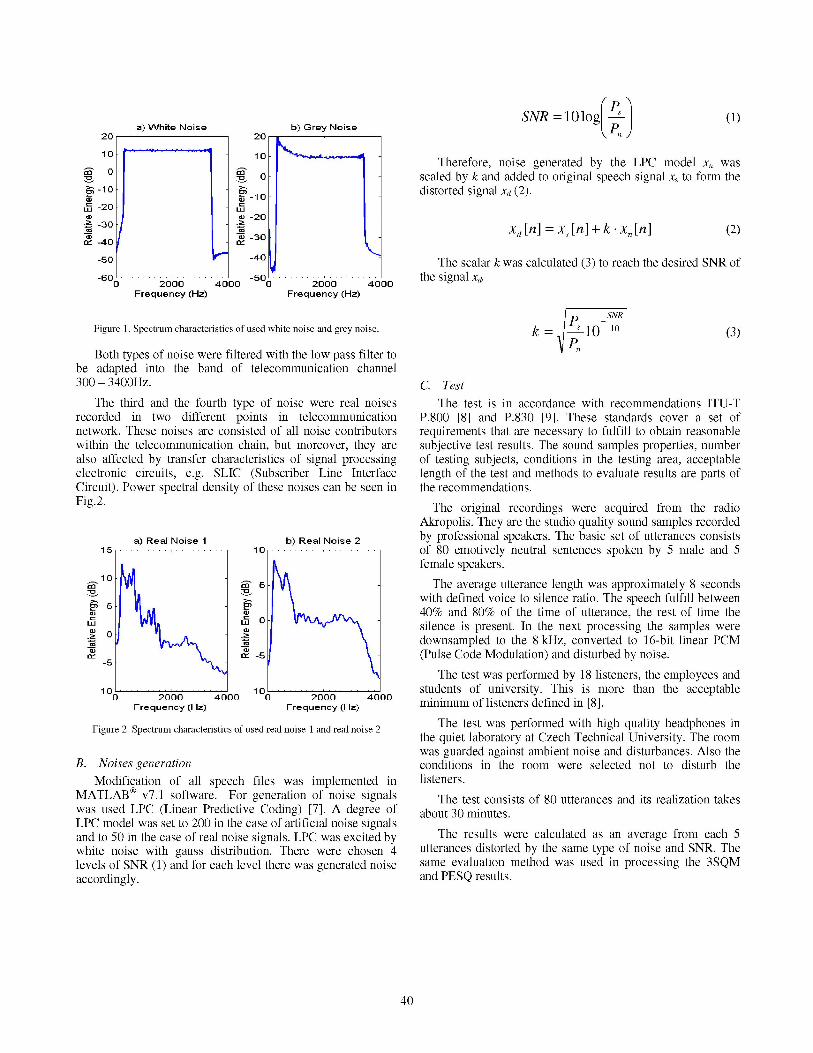
To express the conformity between the subjective and Fig. 4 shows the comparison of subjective and objectiveobjective methods we used the Pearson's coefficients defined results for white noise and grey noise. Results obtained byin (4) and residual errors (5). PESQ method were very close to the subjective results only
for SNR=0 dB. Afterwards, the difference was around 0.8MOS for all SNRs. The 3SQM results were closer to the
(xi - x)(yi -y) subjective (difference less than 0.5 MOS) than PESQ resultsr = _ _ (4) upto SRN=20 dB.
^1 (xi -x)2 E (yi _y)2 The results obtained by PESQ for both noises were similarto each other (difference between them was about 0.1 MOS).Opposite to the PESQ, 3SQM results for white and grey noise
ei = xi + yi (5) was slightly closer to the subjective ones.
III. EXPERIMENTAL RESULTS AND DISCUSSION 5,0
The results obtained by objective methods (PESQ and C 4X53SQM) and by subjective testing (in figures and tables noted 4,0as SUBJ) for four SNR levels and for different types of noises o 3,5 ,4 t
(white, grey and two real noises) are shown in Tab. 1. r 3,0 _
0TABLE 1. RESULTS OF SUBJECTIVE TEST AND OBJECTIVE METHODS m 2,0
SNR [dB] -____White noise Grey noise 1,0SUBJ 3SQM PESQ SUBJ 3SQM PESQ 0 10 20 30
Signal-to-Noise Ratio, SNR (dB)0 1,60 1,00 1,41 1,27 1,00 1,31 --SUBJWN -* - SQMWN -=PESQWN SUBJGN -A SQMGN PESQGN
10 2,68 2,58 1,72 2,68 2,11 1,82
20 3,50 3,30 2,58 3,48 3,40 2,76 Figure 4 Comparison of subjective an objetive (PESQ and 3SQM) results forwhite noise (WN) and grey noise (GN).
30 4,35 3,34 3,66 4,45 3,60 3,61
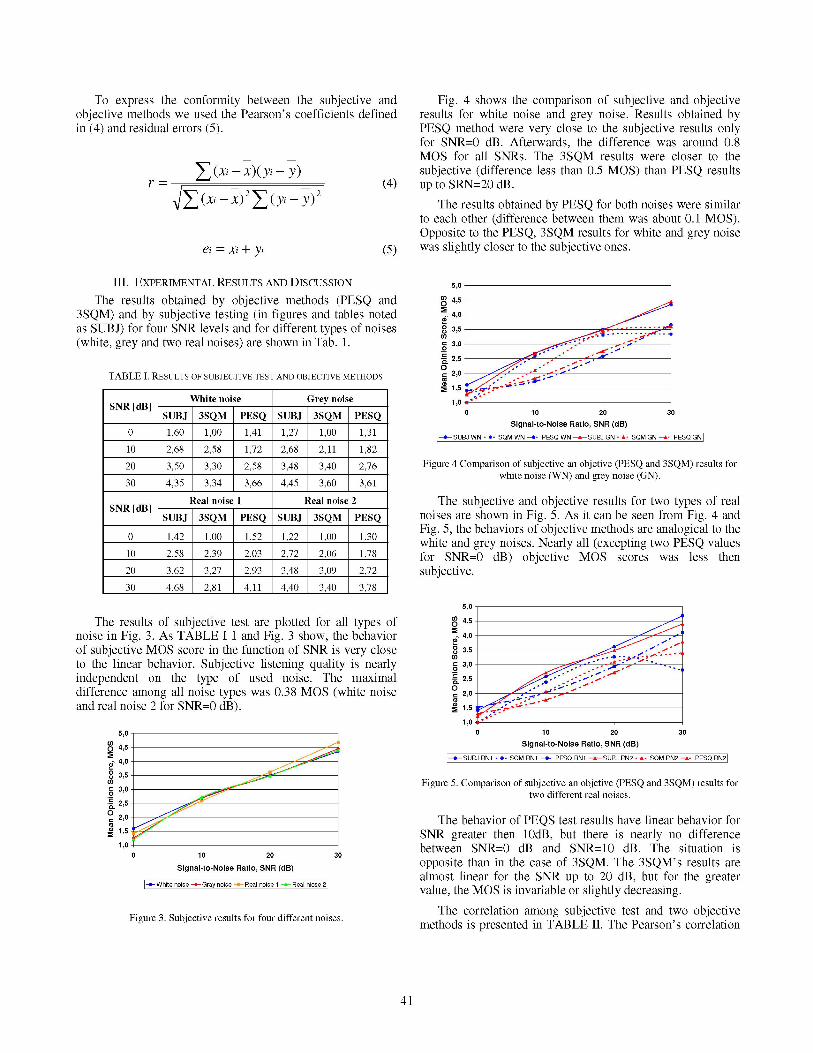
SNR [dB]Real noise 1 Real noise 2 The subjective and objective results for two types of real
SUBJ 3SQM PESQ SUBJ 3SQM PESQ noises are shown in Fig. 5. As it can be seen from Fig. 4 andFig. 5, the behaviors of objective methods are analogical to the0 1,42 1,00 1,52 1,22 1,00 1,30 white and grey noises. Nearly all (excepting two PESQ values
10 2,58 2,39 2,03 2,72 2,06 1,78 for SNR=0 dB) objective MOS scores was less then20 3,62 3,27 2,93 3,48 3,09 2,72 subjective.30 4,68 2,81 4,11 4,40 3,40 3,78
5,0
The results of subjective test are plotted for all types of ° 4X5noise in Fig. 3. As TABLE I1 and Fig. 3 show, the behavior 4,0of subjective MOS score in the function of SNR is very close 0 3,5 -_ _to the linear behavior. Subjective listening quality is nearly 3,0independent on the type of used noise. The maximal X 2,5
0difference among all noise types was 0.38 MOS (white noise r 2,0and real noise 2 for SNR=0 dB). E 1,5
1,05,0 0o 10 20 30
O__ 4X Signal-to-Noise Ratio, SNR (dB)0 4,5-RN0 PESOSUBJ RN1 SQM RN1 PESQ RN1 SUBJ RN2 SQM RN2 PESQ RN2
408 3,5 _ ,,_D=' Figure 5. Comparison of subjective an objetive (PESQ and 3SQM) results forr- 3,0-o3 two different real noises.
2,52,0 , The behavior of PEQS test results have linear behavior for
: 1,5 i.7 SNR greater then 10dB, but there is nearly no difference1,0 between SNR=0 dB and SNR=10 dB. The situation is
0 10 20 30Signal-to-NoiseRatio, SNR(dB) opposite than in the case of 3SQM. The 3SQM's results are
almost linear for the SNR up to 20 dB, but for the greater-+White noise -4 Gray noise Real noise l Real niose 21-0-Wite ois Granoie Ral nise Relnise value, the MN/OS is invariable or slightly decreasing.
The correlation among subjective test and two objectiveFigre . Sbjetivreult fo for dffeentnoies methods is presented in TABLE II. The Pearson's correlation
41
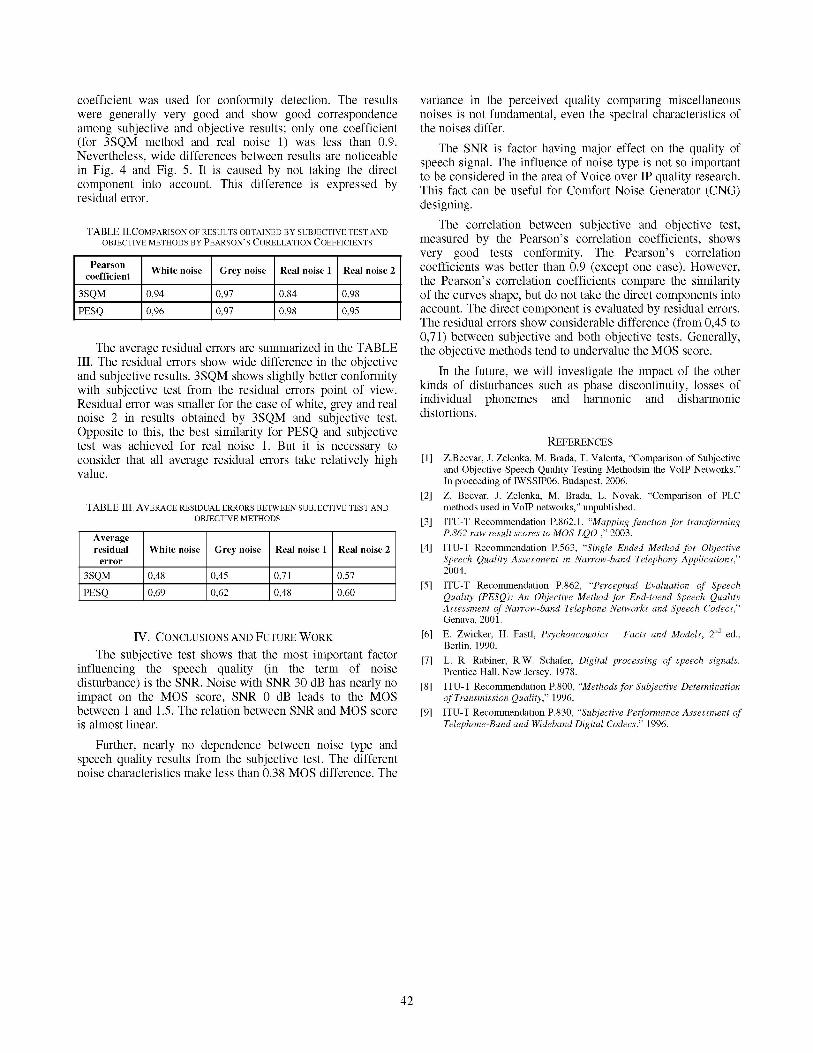
coefficient was used for conformity detection. The results variance in the perceived quality comparing miscellaneouswere generally very good and show good correspondence noises is not fundamental, even the spectral characteristics ofamong subjective and objective results; only one coefficient the noises differ.(for 3SQM method and real noise 1) was less than 0.9. The SNR is factor having major effect on the quality ofNevertheless, wide differences between results are noticeable speech signal. The influence of noise type is not so importantin Fig. 4 and Fig. 5. It is caused by not taking the direct to be considered in the area of Voice over IP quality research.component into account. This difference is expressed by This fact can be useful for Comfort Noise Generator (CNG)residual error. designing.
TABLE II.COMPARISON OF RESULTS OBTAINED BY SUBJECTIVE TEST AND The correlation between subjective and objective test,OBJECTIVE METHODS BY PEARSON'S CORELLATION COEFFICIENTS measured by the Pearson's correlation coefficients, shows
very good tests conformity. The Pearson's correlation
coefficient White noise Grey noise Real noise 1 Real noise 2 coefficients was better than 0.9 (except one case). However,the Pearson's correlation coefficients compare the similarity3SQM 0,94 0,97 0,84 0,98 of the curves shape, but do not take the direct components intoPESQ 0,96 0,97 0,98 0,95 account. The direct component is evaluated by residual errors.
The residual errors show considerable difference (from 0,45 to0,71) between subjective and both objective tests. Generally,
The average residual errors are summarized in the TABLE the objective methods tend to undervalue the MOS score.III. The residual errors show wide difference in the objectiveand subjective results. 3SQM shows slightly better conformity In the future, we will investigate the impact of the otherwith subjective test from the residual errors point of view, kinds of disturbances such as phase discontinuity, losses ofResidual error was smaller for the case of white, grey and real individual phonemes and harmonic and disharmonicnoise 2 in results obtained by 3SQM and subjective test. distortions.Opposite to this, the best similarity for PESQ and subjective REFERENCEStest was achieved for real noise 1. But it is necessary toconsider that all average residual errors take relatively high [1] Z.Becvar, J. Zelenka, M. Brada, T. Valenta, "Comparison of Subjectivevalue. and Objective Speech Quality Testing Methodsin the VoIP Networks,"
In proceeding of IWSSIP06. Budapest, 2006.[2] Z. Becvar, J. Zelenka, M. Brada, L. Novak, "Comparison of PLC
TABLE III. AVERAGE RESIDUAL ERRORS BETWEEN SUBJECTIVE TEST AND methods used in VoIP networks," unpublished.OBJECTIVE METHODS [3] ITU-T Recommendation P.862.1, "Mapping function for transforming
Average P.862 raw result scores to MOS-LQO " 2003.residual White noise Grey noise Real noise 1 Real noise 2 [4] ITU-T Recommendation P.563, "Single Ended Method for Objectiveerror Speech Quality Assessment in Narrow-band Telephony Applications,"
3SQM 0,48 0,45 0,71 0,57 2004.[5] ITU-T Recommendation P.862, "Perceptual Evaluation of Speech
PESQ 0,69 0,62 0,48 0,60 Quality (PESQ): An Objective Method for End-toend Speech QualityAssessment of Narrow-band Telephone Networks and Speech Codecs,"Genava, 2001.
IV. CONCLUSIONS AND FUTURE WORK [6] E. Zwicker, H. Fastl, Psychoacoustics - Facts and Models, 2nd ed.,Berlin, 1990.
The subjective test shows that the most important factorBeln190
[7] L. R. Rabiner, R.W. Schafer, Digital processing of speech signals.influencing the speech quality (in the term of noise Prentice Hall, New Jersey, 1978.disturbance) is the SNR. Noise with SNR 30 dB has nearly no [8] ITU-T Recommendation P.800, "Methods for Subjective Determinationimpact on the MOS score, SNR 0 dB leads to the MOS of Transmission Quality," 1996.between 1 and 1.5. The relation between SNR and MOS score [9] ITU-T Recommendation P.830, "Subjective Performance Assessment ofis almost linear. Telephone-Band and Wideband Digital Codecs," 1996.
Further, nearly no dependence between noise type andspeech quality results from the subjective test. The differentnoise characteristics make less than 0.38 MOS difference. The
42