
HMManual
327
Hydromax Windows Version 16 User Manual © Formation Design Systems Pty Ltd 1984 - 2011
-
Upload
leonar-llacc -
Category
Documents
-
view
735 -
download
7
Transcript of HMManual

Hydromax
Windows Version 16
User Manual
© Formation Design Systems Pty Ltd 1984 - 2011


iii
License and Copyright
Hydromax Program
© 1985-2011 Formation Design Systems Pty Ltd
Hydromax is copyrighted and all rights are reserved. The license for use is granted to the
purchaser by Formation Design Systems as a single user license and does not permit the
program to be used on more than one machine at one time. Copying of the program to
other media is permitted for back-up purposes as long as all copies remain in the
possession of the purchaser.
Hydromax User Manual
© 2011 Formation Design Systems Pty Ltd
All rights reserved. No part of this publication may be reproduced, transmitted,
transcribed, stored in a retrieval system, or translated into any language in any form or
by any means, without the written permission of Formation Design Systems. Formation
Design Systems reserves the right to revise this publication from time to time and to
make changes to the contents without obligation to notify any person or organization of
such changes.
DISCLAIMER OF WARRANTY
Neither Formation Design Systems, nor the author of this program and documentation
are liable or responsible to the purchaser or user for loss or damage caused, or alleged to
be caused, directly or indirectly by the software and its attendant documentation,
including (but not limited to) interruption on service, loss of business, or anticipatory
profits. No Formation Design Systems‟ distributor, agent, or employee is authorized to
make any modification, extension, or addition to this warranty.


Contents
v
Contents
License and Copyright ...................................................................................................... iii Contents .............................................................................................................................. v About this Manual .............................................................................................................. 1 Chapter 1 Introduction ........................................................................................................ 3
Input Model .............................................................................................................. 3 Analysis Types ......................................................................................................... 4 Analysis Settings ...................................................................................................... 4 Environment Options ............................................................................................... 4 Stability Criteria ....................................................................................................... 5 Output....................................................................................................................... 5
Chapter 2 Quickstart ........................................................................................................... 7 Upright Hydrostatics Quickstart .............................................................................. 7 Large Angle Stability Quickstart ............................................................................. 8 Equilibrium Condition Quickstart ............................................................................ 9 Specified Condition Quickstart .............................................................................. 10 KN Values Quickstart ............................................................................................ 10 Limiting KG Quickstart ......................................................................................... 11 Floodable Length Quickstart .................................................................................. 12 Longitudinal Strength Quickstart ........................................................................... 13 Tank Calibrations Quickstart ................................................................................. 13 MARPOL oil outflow Quickstart ........................................................................... 14 Probabilistic Damage Quickstart ............................................................................ 15
Chapter 3 Using Hydromax .............................................................................................. 16 Getting Started ....................................................................................................... 16
Installing Hydromax .................................................................................... 16 Starting Hydromax ....................................................................................... 16
Hydromax Model ................................................................................................... 17 Preparing a Design in Maxsurf .................................................................... 18 Opening a New Design ................................................................................ 21 Opening an Existing Hydromax Design File ............................................... 22 Effect of Zero Point change ......................................................................... 24 Updating the Hydromax Model ................................................................... 26 Hydromax Sections Forming ....................................................................... 27 Checking the Hydromax model ................................................................... 30 Setting Initial Conditions ............................................................................. 34 Working with Loadcases.............................................................................. 38 Modelling Compartments ............................................................................ 51 Tank sections ............................................................................................... 61 Forming Compartments ............................................................................... 62 Compartment Types ..................................................................................... 68 Sounding Pipes ............................................................................................ 69 Damage Case Definition .............................................................................. 71 Key Points (e.g. Down Flooding Points) ..................................................... 74 Margin Line Points ...................................................................................... 76 Modulus Points and Allowable Shears and Moments ................................. 76 Floodable Length Bulkheads ....................................................................... 77 Stability Criteria ........................................................................................... 77
Analysis Types ....................................................................................................... 77 Upright Hydrostatics .................................................................................... 78 Large Angle Stability ................................................................................... 80 Equilibrium Analysis ................................................................................... 87

Contents
vi
Specified Conditions .................................................................................... 90 KN Values Analysis ..................................................................................... 92 Limiting KG ................................................................................................. 95 Limiting KG for damage conditions with initially loaded tanks.................. 98 Floodable Length ....................................................................................... 102 Longitudinal Strength ................................................................................ 105 Tank Calibrations ....................................................................................... 107 MARPOL Oil Outflow .............................................................................. 112 Probabilistic Damage ................................................................................. 115 Starting and Stopping Analyses ................................................................. 137 Batch Analysis ........................................................................................... 138
Analysis Settings .................................................................................................. 141 Heel ............................................................................................................ 141 Trim ........................................................................................................... 142 Draft ........................................................................................................... 144 Displacement ............................................................................................. 145 Specified Conditions .................................................................................. 145 Permeability ............................................................................................... 145 Tolerances .................................................................................................. 146
Analysis Environment Options ............................................................................ 147 Fluids Analysis Methods ........................................................................... 148 Density of Fluids ........................................................................................ 150 Waveform .................................................................................................. 152 Grounding .................................................................................................. 153 Stability Criteria ......................................................................................... 154 Damage ...................................................................................................... 154
Analysis Output .................................................................................................... 155 Reporting ................................................................................................... 155 Copying & Printing .................................................................................... 157 Select View from Analysis Data ................................................................ 159 Saving the Hydromax Design .................................................................... 159 Exporting ................................................................................................... 160
Chapter 4 Stability Criteria ............................................................................................. 163 Criteria Concepts .................................................................................................. 163
Criteria List Overview ............................................................................... 163 Types of criteria ......................................................................................... 166
Criteria Procedures ............................................................................................... 167 Starting the Criteria dialog ......................................................................... 167 Resizing the Criteria dialog ....................................................................... 168 Working with Criteria ................................................................................ 168 Editing Criteria .......................................................................................... 170 Working with Criteria Libraries ................................................................. 172
Criteria Results ..................................................................................................... 174 Criteria Results Table ................................................................................ 174 Report and Batch Processing ..................................................................... 176
Nomenclature ....................................................................................................... 176 Definitions of GZ curve features ............................................................... 176 Glossary ..................................................................................................... 179
Chapter 5 Hydromax Reference ..................................................................................... 181 Windows .............................................................................................................. 181
Assembly View and Property Sheet .......................................................... 181 View Window ............................................................................................ 181 Loadcase Window ...................................................................................... 183
Contents
vii
Damage Window ....................................................................................... 183 Input Window ............................................................................................ 184 Results Window ......................................................................................... 185 Graph Window ........................................................................................... 188 Report Window .......................................................................................... 191
Toolbars ............................................................................................................... 194 File Toolbar................................................................................................ 194 Edit Toolbar ............................................................................................... 194 View Toolbar ............................................................................................. 194 Analysis Toolbar ........................................................................................ 195 Window Toolbar ........................................................................................ 195 Design Grid Toolbar .................................................................................. 195 Visibility Toolbar ....................................................................................... 195 Edge VIsibility Toolbar ............................................................................. 196 Render Toolbar .......................................................................................... 196 Report Toolbar ........................................................................................... 196 View (extended) Toolbar ........................................................................... 196 Design Grid Toolbar .................................................................................. 196 Extra Buttons ToolbarToolbar ................................................................... 196
Menus ................................................................................................................... 197 File Menu ................................................................................................... 197 Edit Menu .................................................................................................. 200 View Menu ................................................................................................ 202 Case Menu ................................................................................................. 204 Analysis Menu ........................................................................................... 204 Display Menu ............................................................................................. 207 Data Menu.................................................................................................. 211 Window Menu ........................................................................................... 212 Help Menu ................................................................................................. 212
Appendix A: Calculation of Form Parameters ............................................................... 214 Definition and calculation of form parameters .................................................... 214
Measurement Reference Frames ................................................................ 214 Nomenclature ............................................................................................. 216 Coefficient parameters ............................................................................... 216 Length ........................................................................................................ 217 Beam .......................................................................................................... 218 Draft ........................................................................................................... 219 Midship and Max Area Sections ................................................................ 220 Block Coefficient ....................................................................................... 221 Section Area Coefficient ............................................................................ 221 Prismatic Coefficient ................................................................................. 221 Waterplane Area Coefficient ..................................................................... 222 LCG and LCB ............................................................................................ 222 Trim angle .................................................................................................. 223 Maximum deck inclination ........................................................................ 223 Immersion .................................................................................................. 223 MTc or MTi ............................................................................................... 223 RM at 1 deg................................................................................................ 224
Potential for errors in hydrostatic calculations ..................................................... 224 Integration of wetted surface area .............................................................. 224
Appendix B: Criteria file format .................................................................................... 226 Appendix C: Criteria Help.............................................................................................. 228
Parent Calculations............................................................................................... 228

Contents
viii
Selecting a calculation in a criterion .......................................................... 228 Angle calculators ....................................................................................... 228 GM calculators ........................................................................................... 229
Parent Heeling Arms ............................................................................................ 232 Heeling Arm Definition ............................................................................. 232 Parent Heeling Moments ........................................................................... 240
Parent Stability Criteria ........................................................................................ 242 Criteria at Equilibrium ............................................................................... 242 GZ Curve Criteria (non-heeling arm) ........................................................ 243 Heeling arm criteria (xRef) ........................................................................ 260 Heeling arm criteria ................................................................................... 264 Multiple heeling arm criteria ..................................................................... 275 Heeling arm, combined criteria .................................................................. 281 Derived heeling arm criteria ...................................................................... 285 Other combined criteria ............................................................................. 290 Specific stand alone heeling arm criteria ................................................... 291 Stand alone heeling arm criteria ................................................................ 291 Stand alone heeling arm combined criteria ................................................ 292
Appendix D: Specific Criteria ........................................................................................ 295 Dynamic stability criteria ..................................................................................... 295
Capsizing moment ..................................................................................... 295 Heeling arms for specific criteria - Note on unit conversion ............................... 297
IMO Code on Intact Stability A.749(18) amended to MSC.75(69) ........... 297 IMO HSC Code MSC.36(63) .................................................................... 299 USL code (Australia) ................................................................................. 301 ISO 12217-1:2002(E) ................................................................................ 302 ISO 12217: Small craft – stability and buoyancy assessment and
categorisation. ............................................................................................ 304 Appendix E: Reference Tables ....................................................................................... 307
File Extension Reference Table ........................................................................... 307 Analysis settings reference table .......................................................................... 308
Appendix F: Quality Assurance ..................................................................................... 309 Quality Assurance ................................................................................................ 309
Quality Principles ...................................................................................... 309 Structured Programming ............................................................................ 309 Verification of Algorithms ......................................................................... 309 Testing of Implementation ......................................................................... 312 Testing of Upgrades ................................................................................... 312 Beta Testing ............................................................................................... 312 Version Control .......................................................................................... 312 But we're not Perfect .................................................................................. 312
Index ............................................................................................................................... 313
About this Manual
Page 1
About this Manual
This manual describes how to use Hydromax to perform hydrostatic and stability
analyses on your Maxsurf design.
Chapter 1 Introduction
Contains a description of Hydromax functionality and its interface to Maxsurf
Chapter 2 Quickstart
Gives a quick walk through the analysis tools available in Hydromax.
Chapter 3 Using Hydromax
Explains how to use Hydromax' powerful floatation and hydrostatic analysis routines to
best advantage.
Chapter 4 Stability Criteria
Gives details of the stability criteria that may be evaluated with Hydromax.
Chapter 5 Hydromax Reference
Gives details of Hydromax' windows and each of Hydromax' menu commands.
If you are unfamiliar with Microsoft Windows® interface, please read the owner's
manual supplied with your computer. This will introduce you to commonly used terms
and the basic techniques for using any computer program.

Chapter 1 Introduction
Page 3
Chapter 1 Introduction
Hydromax is a hydrostatics, stability and longitudinal strength program specifically
designed to work with Maxsurf. Hydromax adds extra information to the Maxsurf
surface model. This includes: compartments and key points such as downflooding points
and margin line.
Hydromax‟ analysis tools enable a wide range of hydrostatic and stability characteristics
to be determined for your Maxsurf design. A number of environmental setting options
and modifiers add further analysis capabilities to Hydromax.
Hydromax is designed in a logical manner, which makes it easy to use. The following
steps are followed when performing an analysis:
Input model
Analysis type selection
Analysis settings
Environment options
Criteria specification and selection
Run analysis
Output
Hydromax operates in the same graphical environment as Maxsurf; the model can be
displayed using hull contour lines, rendering or transparent rendering. This allows visual
checking of compartments and shows the orientation of the vessel during analysis.
Input Model
Maxsurf design files may be opened directly into Hydromax, eliminating the need for
time-consuming digitising of drawings or hand typing of offsets. This direct transfer
preserves the three-dimensional accuracy of the Maxsurf model.
Tanks can be defined and calibrated for capacity, centre of gravity and free surface
moment. Tanks and compartments can be flooded for the purpose of calculating the
effects of damage.
A number of loadcases can be created. The loadcase allows static weights and tank-
fillings to be specified and calculates the corresponding weights and centres of gravity as
well as the total weight and centre of gravity of the vessel under the specified loading
condition. Loadgroups may also be created and cross referenced into loadcases.
Other input consists of: tank sounding pipes; key points, such as downflooding points,
immersion and embarkation points; margin lines and section modulus.

Chapter 1 Introduction
Page 4
Analysis Types
Hydromax contains the following analysis tools:
Upright hydrostatics
Large angle stability
Equilibrium analysis
Specified Condition analysis
KN values and cross curves of stability
Limiting KG analysis
Floodable Length analysis
Longitudinal Strength analysis
Tank Calibrations
MARPOL oil outflow
Probabilistic damage (Hydromax Ultimate only)
Although common analysis settings are used where possible, different analyses may
require different settings. For example: the upright hydrostatics analysis simply requires
a range of drafts; whereas the longitudinal strength analysis requires a detailed load
distribution. The analysis settings for each analysis type are explained in detail in the
analysis synopsis below.
Analysis Settings
The analysis settings describe the condition of the vessel to be tested. For example, a
range of drafts in the case of upright hydrostatics, or a range of heel angles for a large
angle stability analysis.
The following analysis settings are available:
Heel
Trim
Draft
Displacement
Permeability
Specified condition
The analysis settings are specified prior to running the analysis. Settings that are not
relevant to the selected analysis type are greyed out in the Analysis menu.
Environment Options
Environmental options are modifiers that may be applied to the model or its environment
that will affect the results of the all the hydrostatic analysis types.

Chapter 1 Introduction
Page 5
Depending on the analysis being performed, different environmental options may be
applied to the Hydromax:
Type of Fluid Simulation
Density (of fluids)
Wave form
Grounding
Intact and Damage condition
Stability Criteria
Hydromax has the capability to calculate compliance with a wide range of stability
criteria. These criteria are either derived from the properties of the stability curve
calculated from a Large Angle Stability analysis or from the vessel‟s orientation and
stability properties calculated from an Equilibrium analysis. Limiting KG and Floodable
length analyses also use stability criteria.
Hydromax has an extensive range of stability criteria to determine compliance with a
wide range of international stability regulations. In addition, Hydromax has a generic set
of parent criteria from which virtually any stability criterion can be customized.
Output
Views of the hull are shown for each stage of the analysis, complete with immersed
sectional areas and actual waterlines. The centres of flotation, gravity and buoyancy are
also displayed. Heeled and trimmed hullforms and water plane shapes may be printed.
Results are stored and may be reviewed at any time, either in tabular form, or as graphs
of the various parameters across the full range of calculation. All results are accumulated
in the Report window (which can be saved, copied and printed), or output directly to a
Word document.
The criteria checks are summarised in tables listing the status (pass/fail) of each criterion
as well as the margin. The criterion settings and intermediate calculation data may also
be displayed if required.
For a brief overview of the different analysis that Hydromax has available, continue
reading Chapter 2 Quickstart.


Chapter 3 Using Hydromax
Page 7
Chapter 2 Quickstart
This chapter will briefly describe each analysis type and its output. For each analysis
type, a list of the required settings as well as the available environment options is given.
Hydromax contains the following analysis types
Upright Hydrostatics
Large Angle Stability
Equilibrium Condition
Specified Condition
KN Values
Limiting KG
Floodable Length
Longitudinal Strength
Tank Calibrations
MARPOL Oil Outflow
Probabilistic Damage
Each analysis has different settings that may be applied
Heel
Trim
Draft
Displacement
Specified condition
Permeability
Loadcase
Tank and compartment definition
Hydromax offers different environment options that may be applied to the analyses
Fluid Densities
Treatment of fluids in tanks: fluid simulation or corrected VCG
Wave form
Grounding
Damage
Hydromax offers an extensive range of stability criteria that are applicable to
equilibrium, large angle stability, limiting KG and Floodable length analysis.
The Analysis types section describes each of the analysis types, settings and environment
options in more detail.
Upright Hydrostatics Quickstart
For Upright Hydrostatics, heel is fixed at zero heel, trim is fixed at a user defined value
and draft is varied in fixed steps. Displacement and centre of buoyancy and other
hydrostatic data are calculated during the analysis.

Chapter 3 Using Hydromax
Page 8
Upright hydrostatics requirements
Range of drafts to be analysed
VCG (for calculation of some stability characteristics such as GMt and GMl only)
Trim
Upright hydrostatic options
Fluid Densities
Wave form
Damage
Compartment definition (in case of damage)
The results are tabulated and graphs of the hydrostatic data, curves of form and sectional
area at each draft are available.
For more detailed information please see: Upright Hydrostatics on page 78.
Large Angle Stability Quickstart
For the analysis of Large Angle Stability, displacement and centre of gravity are
specified in the loadcase. A range of heel angles are specified and Hydromax calculates
the righting lever and other hydrostatic data at each of these heel angles by balancing the
loadcase displacement against the hull buoyancy and, if the model is free-to-trim, the
centre of gravity against the centre of buoyancy such that the trimming moment is zero.
Large angle stability requirements
Range of heel angles to be analysed
Trim (fixed or free)
Loadcase or loadgroup
Tank definition in the case of tank loads being included in the Loadcase (and/or for
the definition of damage)
Large angle stability options
Fluid Densities
Treatment of fluids in tanks: fluid simulation or corrected VCG
Wave form
Damage
Compartment definition (in case of damage)
Key points
Margin line and deck edge
Analysis of stability criteria
The key output value is GZ (or righting lever), the horizontal distance between the
centres of gravity and buoyancy. A graph of these values at the various heel angles forms
a GZ curve. Various other information is often overlaid on the GZ curve, including
upright GM, curves for wind heeling and passenger crowding levers and the angle of the
first downflooding point. These additional data depend on which (if any) stability criteria
have been selected.
Chapter 3 Using Hydromax
Page 9
A number of other graphs may be selected from the pull-down list in the graph window.
Remember that you can access this data in tabular form by double clicking in the graph
window:
Dynamic stability curve (Area under GZ curve, integrated from upright)
Variations of other hydrostatic and form parameters may be plotted against heel
angle.
Maximum safe steady heel angle
The sectional area curve at each of the heel angles tested may also be displayed.
Note that some of these graphs have parameters that may be adjusted in the Data Format
dialog
If large angle stability criteria have been selected for analysis, these results will also be
reported in the criteria results table and they may lead to additional curves being
displayed on the GZ curve.
Downflooding angles for any key points, margin line and deck edge will also be
computed and tabulated.
For more detailed information please see: Large Angle Stability on page 80.
Equilibrium Condition Quickstart
Equilibrium Analysis uses the Loadcase, to calculate the displacement and the location
of the centre of gravity. Hydromax iterates to find the draft, heel and trim that satisfy
equilibrium and reports the equilibrium hydrostatics and a cross sectional areas curve.
Equilibrium analysis requirements
Loadcase or loadgroup
Tank definition in the case of tank loads being included in the Loadcase (and/or for
the definition of damage)
Compartment definition and damage case (in case of damage)
Equilibrium analysis options
Fluid Densities
Treatment of fluids in tanks: fluid simulation or corrected VCG
Wave form
Grounding
Damage
Compartment definition (in case of damage)
Key points
Margin line and deck edge
Analysis of equilibrium criteria
Equilibrium analysis result table lists the hydrostatic properties of the model. If a wave
form has been specified there will be a number of columns; each column contains the
results for a different position of the vessel in the wave as given by the wave phase
value. The sectional area curve is also calculated, as is the freeboard to any defined key
points, margin line and deck edge. Any equilibrium criteria will also be evaluated and
their results reported.

Chapter 3 Using Hydromax
Page 10
For more detailed information please see: Equilibrium Analysis on page 87.
Specified Condition Quickstart
In the specified condition each of the three degrees of freedom, for which the hydrostatic
properties of the model are to be calculated, can be set.
Specified Condition Requirements
Specified Conditions Input Dialog
If fixed trim is specified, you may enter the trim or specify the forward and aft drafts
(these are at the perpendiculars as specified in the Frame of Reference dialog).
Specified Conditions options
Fluid Densities
Wave form
Damage
Tank and Compartment definition (in case of damage)
The output for the specified condition consists of a curve of cross sectional areas and
hydrostatics of the vessel in the specified condition.
For more detailed information please see Specified Conditions on page 90.
KN Values Quickstart
KN values or Cross Curves of Stability are useful for assessing the stability of a vessel if
its VCG is unknown. They may be calculated for a number of displacements before the
height of the centre of gravity is known. The KN data may then be used to obtain the GZ
curve for any centre of gravity height (KG) using the following formula:
GZ = KN - KG * sin(Heel)
where GZ is the righting lever measured transversely between the Centre of Buoyancy
and the Centre of Gravity, and KG is the distance from the baseline to the vessel's
effective Vertical Centre of Gravity.
KN Values Analysis Requirements
Chapter 3 Using Hydromax
Page 11
Range of displacements to be analysed
Range of heel angles to be analysed
Trim (fixed or free)
Estimate of VCG (provides more accurate result if free-to-trim)
TCG (if required)
KN Values Analysis Options
Fluid Densities
Wave form
Damage
Tank and Compartment definition (in case of damage)
Output is in the form of a table of KN values and a graph of Cross Curves of Stability.
If the analysis is performed free-to-trim and an estimate of the VCG is known, this may
be specified. The computed KN results will then give a more accurate estimate of GZ for
KG close to the estimated VCG since the effects of VCG on trim have been more
accurately accounted for.
For more detailed information please see KN Values Analysis on page 92.
Limiting KG Quickstart
The Limiting KG analysis may be used to obtain the highest vertical position of the
centre of gravity (maximum KG) for which the selected stability criteria are just passed.
This may be done for a range of vessel displacements. At each of the specified
displacements, Hydromax runs several Large Angle Stability analyses at different KGs.
The selected stability criteria are evaluated; the centre of gravity is increased until one of
the criteria fails.
Limiting KG Analysis Requirements
Range of displacements to be analysed
Range of heel angles to be analysed
Trim (fixed or free)
Stability criteria for which limiting KG is to be found
TCG (if required)
Limiting KG Analysis Options
Fluid Densities
Wave form
Damage
Tank and Compartment definition (in case of damage)
Laodcase (in case of initial loading of damaged tanks)
Key points (if required for criteria)
Margin line and deck edge (if required for criteria)

Chapter 3 Using Hydromax
Page 12
A graph of maximum permissible GZ plotted against vessel displacement is produced as
well as tabulated results indicating which stability criteria limited the VCG. If limiting
curves are required for each of the stability criteria individually, this may be done in the
Batch Analysis mode.
A check will be made to ensure that any selected equilibrium criteria are passed,
however at least one large angle stability criterion is required. Only relevant criteria will
be used, i.e. if a damage case is chosen, only damage criteria will be evaluated; if the
intact condition is used, only intact criteria will be evaluated. Some criteria, such as
angle of maximum GZ, are very insensitive to VCG and may prevent the analysis
converging. If the analysis is unable to converge for a certain displacement this will be
noted and the next displacement tried.
For more detailed information see Limiting KG on page 95.
Floodable Length Quickstart
This analysis mode is used to compute the maximum compartment lengths based on
user-specified equilibrium criteria. Floodable Lengths may be computed for a range of
displacements; the LCG may be specified directly or calculated from a specified initial
trim. In addition a range of permeabilities may be specified. The VCG is also required to
ensure accurate balance of the CG against the CB at high angles of trim. As well as the
standard deck edge and margin line immersion criteria (one of which must be specified)
the user can also add criteria for maximum trim angle and minimum required values of
longitudinal and transverse metacentric height.
Floodable Length Analysis Requirements
Range of displacements to be analysed
VCG
Range of permeabilities to be analysed
Trim (free- to- trim to either initial trim or specified LCG)
Floodable length criteria to be tested
Margin line and deck edge (required for criteria)
Floodable Length Analysis Options
Fluid Densities
Wave form

Chapter 3 Using Hydromax
Page 13
The output is in the form of tabulated Floodable Lengths for each displacement and
permeability. The data is tabulated for each of the stations as defined in Maxsurf. The
data is also presented graphically.
For more detailed information please see Floodable Length on page 102.
Longitudinal Strength Quickstart
Hydromax calculates the net load from the buoyancy and weight distribution of the
model. That data is then used to calculate the bending moment and shear force on the
vessel.
Longitudinal Strength Analysis Requirements
Loadcase (including distributed loads if required)
Tank definition in the case of tank loads being included in the Loadcase (and/or for
the definition of damage)
Longitudinal Strength Analysis Options
Fluid Densities
Treatment of fluids in tanks: fluid simulation is always used for Longitudinal
Strength analysis
Wave form
Grounding
Damage
Compartment definition and damage case (in case of damage)
Allowable shear and bending moment
The longitudinal strength graph and tables contain all information on weight and
buoyancy distribution, the shear force and bending moment on the vessel. If defined,
graphs of allowable shear and bending moment are superimposed on the graph.
For more detailed information please see Longitudinal Strength on page 105.
Tank Calibrations Quickstart
Tanks can be defined and calibrated for capacity, centre of gravity and free surface
moment (FSM). Fluid densities and tank permeabilities can be varied arbitrarily. Tank
calibrations may be calculated for a range of trim and heel angles. Hydromax uses its
fluid simulation mode to calculate the actual position of the fluids in the tanks, taking
into account the vessel trim and heel; i.e. the position of the fluid in the tank will be
computed so that the fluid surface is parallel with the external seawater surface. Tank
ullages are measured from the top of the sounding pipe to the free surface of the liquid
within the tank along the sounding pipe and in a similar manner, soundings are measured
from the bottom of the sounding pipe to the free surface.
Tank calibrations may be performed for a range of heel and trims. The results for a
single condition are shown in the results table. The condition to be viewed may be
selected from the Results toolbar; Tabulated results may be customised using the Data
Format dialog:

Chapter 3 Using Hydromax
Page 14
Tank calibration analysis requirements
Tank definitions
Sounding pipe definition (if required)
Sounding intervals for calibration levels
Trim range
Heel range
Tank calibration analysis options
Fluid Densities
Treatment of fluids in tanks: fluid simulation always selected
Damage: Intact case always selected
What to calibrate (Analysis | Calibration options)
For each tank, a table of capacities, volumes etc. is calculated. These results are
presented in both tabular and graphical forms.
For more detailed information please see Tank Calibrations on page 107.
MARPOL Oil Outflow Quickstart
MARPOL probabilistic oil outflow calculation may be computed according to the
following MARPOL regulations:
Resolution MEPC.141(54), Regulation 12A: Oil fuel tank protection
Resolution MEPC.117(52), Regulation 23: Accidental oil outflow performance
Seltect the Reolution and tanks to be included in the analysis in the MARPOL options
(Analysis menu) dialog. Then in the MARPOL results data table, edit any values as
required; the resulting oil outflows will be calculated automatically. The “Start Analysis”
button will send the tabulated results to the Report.

Chapter 3 Using Hydromax
Page 15
For more detailed information please see MARPOL Oil Outflow on page 112
Probabilistic Damage Quickstart
Attained index using probabilistic damage analysis may be computed.
Probabilistic damage analysis requirements
Loadcase definitions
Tank and compartmentation definition
Main probabilistic damage analysis parameters and criteria setup
Subdivision definitions
Heel angle range for GZ curve calculation
Trim
Probabilistic damage analysis options
Treatment of fluids in tanks: fluid simulation or corrected VCG
Wave form
Key points
Margin line and deck edge
For more detailed information please see the Probabilistic Damage section on page 115.
Chapter 3 Using Hydromax
Page 16
Chapter 3 Using Hydromax
This chapter describes
Getting Started
Hydromax Model
Analysis Types
Analysis Settings
Analysis Environment Options
Analysis Output
Getting Started
This section contains everything you need to do to start using Hydromax
Installing Hydromax
Starting Hydromax
Installing Hydromax
Install Hydromax by inserting the CD and running the Setup program, then follow the
instructions on screen.
Note:
Before installing any program from the Maxsurf suite for the first time,
please read the purchase letter (also referred to as installation manual).
Starting Hydromax
After installation, Hydromax should be accessible through the Start Menu. Simply select
Hydromax from the Maxsurf menu item under Programs in the Start menu.
Windows Registry
Certain preferences used by Hydromax are stored in the Windows registry. It is possible
for this data to become corrupted, or you may simply want to revert back to the default
configuration. To clear the Hydromax preferences, start the program with the Shift key
depressed. You will be asked if you wish to clear the preferences, click OK, doing this
will reset all the preferences.
The following preferences are stored in the registry:

Chapter 3 Using Hydromax
Page 17
Colour and line thickness settings of contours and background
Fonts
Window size and location
Size of resizing dialogs (alternatively, these may be reset by holding down the shift
key when activating them)
Density of fluids
Heel angles for large angle stability, KN and Limiting KG analyses
Permeabilities for floodable length analysis
Location of files
Units for data input and results output
Convergence tolerance (Error values)
Maximum number of loadcases
Reporting preferences
Note:
The default density for the fluid labelled "Sea Water" is stored in the
windows registry. All hydrostatic calculations use this. Check the density of
seawater after resetting your preferences.
It is recommended to save your customized densities with your project
using the File | Save Densities As command.
Hydromax Model
This section describes how to open a Maxsurf model in Hydromax and provides some
important information to ensure that your model is correctly interpreted by Hydromax.
Preparing a Design in Maxsurf
Opening a New Design
Opening an Existing Hydromax Design File
Updating the Hydromax Model
Hydromax Sections Forming
Checking the Hydromax model
After checking the Hydromax model, the next step is to check the Hydromax settings
and initial analysis conditions.
Setting Initial Conditions
Depending on the analysis performed, you may need to set up the following additional
model data:

Chapter 3 Using Hydromax
Page 18
Working with Loadcases
Modelling Compartments
Forming Compartments
Compartment Types
Damage Case Definition
Sounding Pipes
Key Points (e.g. Down Flooding Points)
Margin Line Points
Modulus Points and Allowable Shears and Moments
Stability Criteria
Preparing a Design in Maxsurf
There are several important checks that must be carried out in Maxsurf before opening a
design in Hydromax:
Setting the Zero Point
Setting the Frame of Reference
Surface Use
Skin Thickness
Outside Arrows
Trimming
Coherence of the Maxsurf surface model
Setting the Zero Point
Ensure that the zero point is correctly setup in Maxsurf. A consistent zero point and
frame of reference should be used for the model throughout the Maxsurf suite. In
Hydromax you have the option of displaying longitudinal measurements such as LCB or
LCF from the model zero point or amidships.
Setting the Frame of Reference
It is vital that the Frame of Reference is correctly setup in Maxsurf before attempting to
analyse the model in Hydromax. The Frame of reference should not be changed in
Hydromax. The frame of reference defines the fore and aft perpendiculars, the baseline
and the datum waterline; midships is automatically defined midway between the
perpendiculars. By convention, in the profile and plan views, the vessel‟s bow is on the
right.
The perpendiculars define the longitudinal positions of the vessel‟s draft marks and
cannot be coincident. The base line is the datum from which the drafts and KG are
measured.
The frame of reference cannot be changed in Hydromax. However it is possible to
specify upto nine additional locations at which the drafts should be reported. This is done
through the Data | Draft Marks dialog.

Chapter 3 Using Hydromax
Page 19
Note: Draft and Trim specification
It should be remembered that the drafts specified for an analysis are the
drafts at the perpendiculars (or amidships) and the trim specified (and
reported) is the difference between the draft at the AP and draft at the FP.
Surface Use
In Maxsurf you can choose between two types of surface use
Hull
Hull surfaces are used to define the watertight envelope of the hull.
Internal structure
Internal structure surfaces are used for all other surfaces (any surfaces which do
not make up the watertight envelope) and also surfaces which are to be used in
Hydromax to define the boundaries of tanks and compartments that have complex
shapes.
The following table describes the difference between each surface use in Hydromax:
Included: Hull Shell Internal
Structure
Hydrostatic sections
Selection of tank/compartment
boundaries
Skin thickness applied to the surface
Verify that all surfaces that are to be used as tank/compartment boundaries are defined as
Internal Structure. If a surface is defined as internal structure, it is not included as part of
the hull shell by Hydromax, i.e. internal surfaces will be ignored in the forming of
hydrostatic sections.
Skin Thickness
If skin thickness is to be used in hydrostatic calculations, ensure that the thickness and
projection direction have been specified for the hull shell surfaces. Thickness can be
specified differently for each hull surface, resulting in more accurate hydrostatics. To
activate skin thickness in Hydromax ensure that the “Include Skin Thickness” option is
selected when reading the file or calculating the hull sections.
Note
Tank boundaries made from internal structures surfaces do not have skin
thickness. To include skin thickness, the internal structure surface should be
placed to model the inside of the tank if the tank wall has significant
thickness.
Skin thickness for hull surfaces will be treated so that the hull sections go to
the outside of the plate whilst any tanks are trimmed to the inside of the
plate.
Chapter 3 Using Hydromax
Page 20
Outside Arrows
The surfaces‟ outside arrows define the orientation of the surfaces. Ensure that you have
used the Outside Arrows command from the Maxsurf Display menu to define which
direction points outwards (towards the seawater) for each surface. The surface direction
may be flipped by clicking on the end of the arrow.
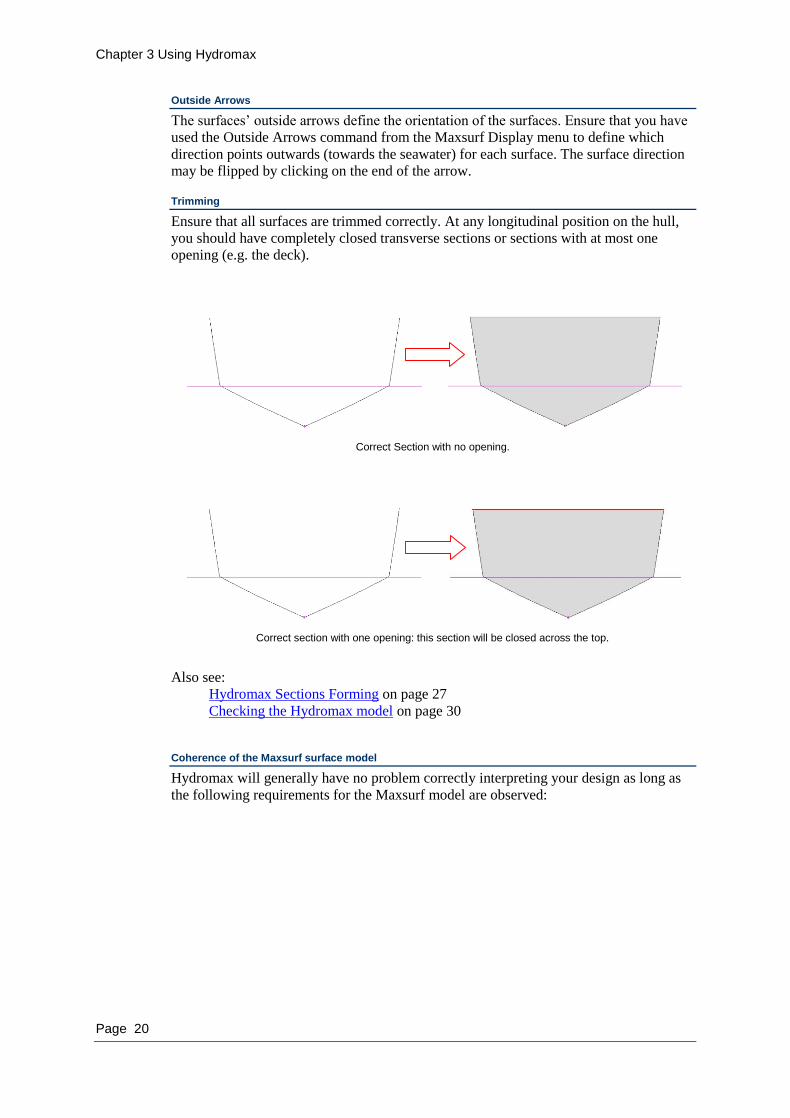
Trimming
Ensure that all surfaces are trimmed correctly. At any longitudinal position on the hull,
you should have completely closed transverse sections or sections with at most one
opening (e.g. the deck).
Correct Section with no opening.
Correct section with one opening: this section will be closed across the top.
Also see:
Hydromax Sections Forming on page 27
Checking the Hydromax model on page 30
Coherence of the Maxsurf surface model
Hydromax will generally have no problem correctly interpreting your design as long as
the following requirements for the Maxsurf model are observed:
Chapter 3 Using Hydromax
Page 21
Make sure that each surface touches its adjacent surfaces at its edge, preferably by
bonding the edges together
Where surfaces intersect, trim away the excess regions of the surface; e.g. the part
of the keel that is inside the hull and the part of the hull that is inside the keel
Do not have surfaces that cannot be closed in an unambiguous fashion, i.e. a
maximum of one gap in a transverse section through the hull.
Remember that the inner portions of each intersecting contour will be trimmed off
Check surface use; internal structure surfaces are ignored when forming the hull
sections in Hydromax
Note:
For groups internal structure surfaces that will be used to define tank (or
compartment boundaries) the same requirements apply.
Also see:
Checking the Hydromax model on page 30.
Opening a New Design
File opening in Hydromax is window specific, i.e. Hydromax will automatically look for
compartment definition files when you are in a Compartment Definition window and a
loadcase in a Loadcase window.
To open a design for analysis, ensure that the design view window is active, then select
Open Design from the File menu. Choose a Maxsurf design file (.msd).
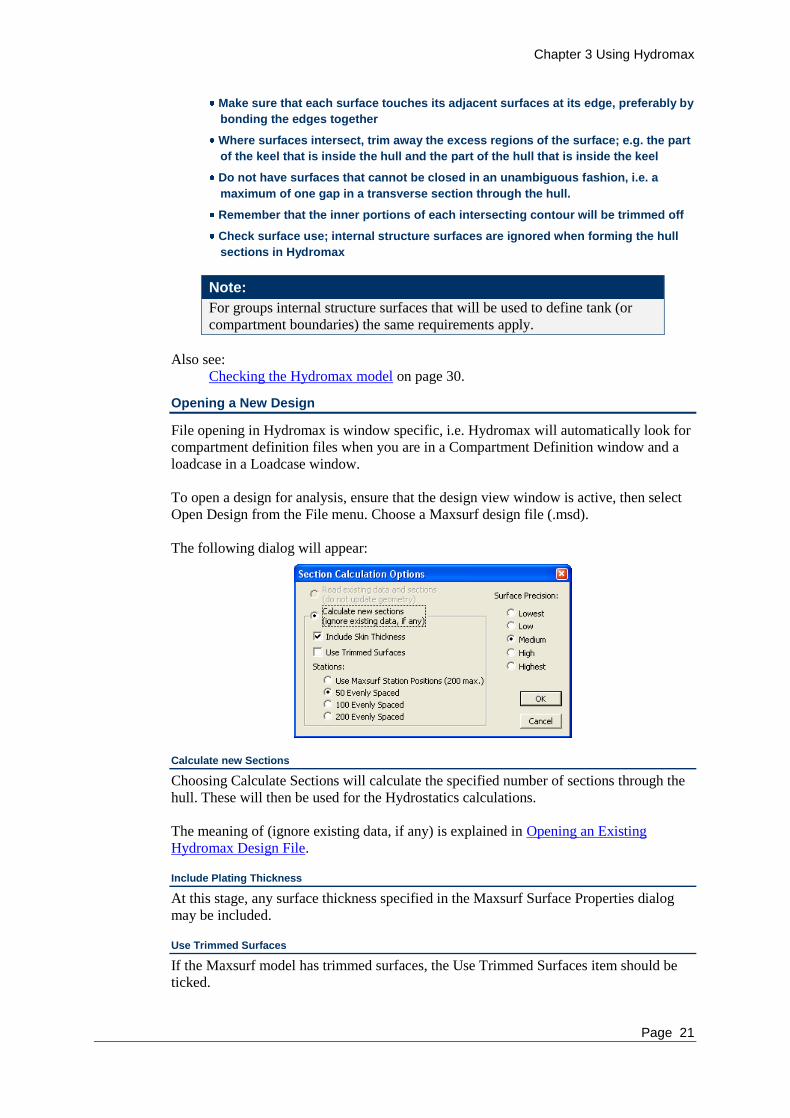
The following dialog will appear:
Calculate new Sections
Choosing Calculate Sections will calculate the specified number of sections through the
hull. These will then be used for the Hydrostatics calculations.
The meaning of (ignore existing data, if any) is explained in Opening an Existing
Hydromax Design File.
Include Plating Thickness
At this stage, any surface thickness specified in the Maxsurf Surface Properties dialog
may be included.
Use Trimmed Surfaces
If the Maxsurf model has trimmed surfaces, the Use Trimmed Surfaces item should be
ticked.
Chapter 3 Using Hydromax
Page 22
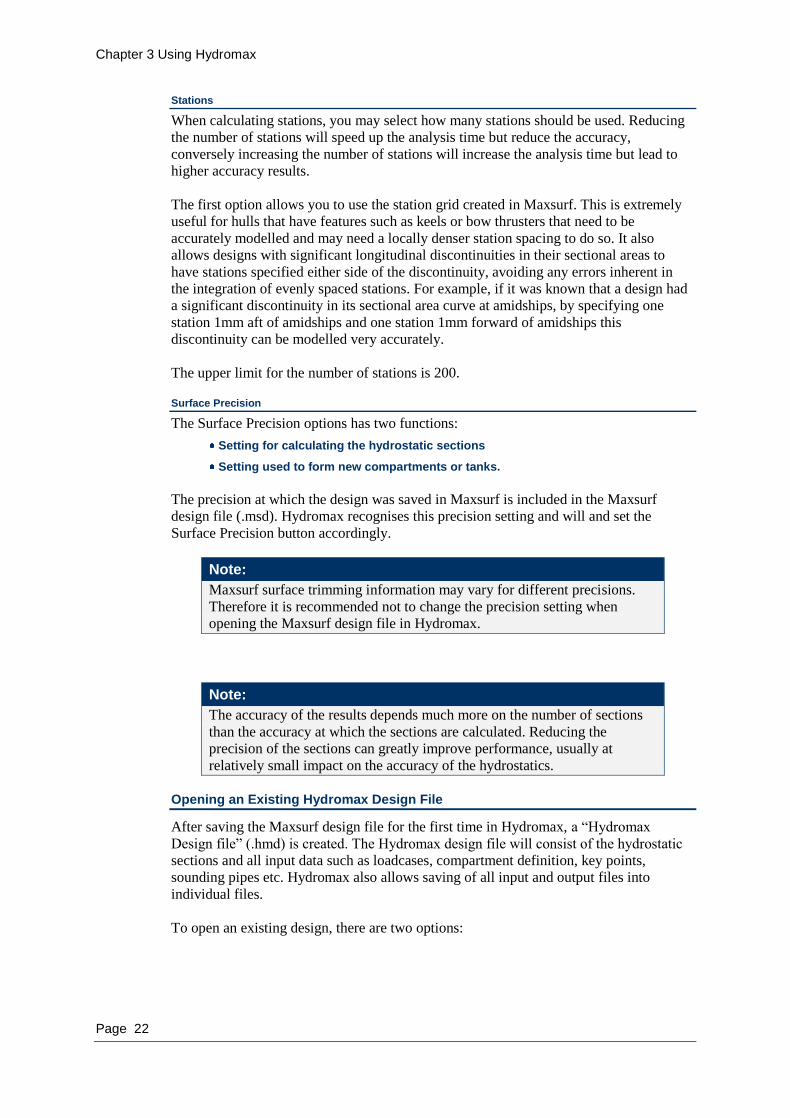
Stations
When calculating stations, you may select how many stations should be used. Reducing
the number of stations will speed up the analysis time but reduce the accuracy,
conversely increasing the number of stations will increase the analysis time but lead to
higher accuracy results.
The first option allows you to use the station grid created in Maxsurf. This is extremely
useful for hulls that have features such as keels or bow thrusters that need to be
accurately modelled and may need a locally denser station spacing to do so. It also
allows designs with significant longitudinal discontinuities in their sectional areas to
have stations specified either side of the discontinuity, avoiding any errors inherent in
the integration of evenly spaced stations. For example, if it was known that a design had
a significant discontinuity in its sectional area curve at amidships, by specifying one
station 1mm aft of amidships and one station 1mm forward of amidships this
discontinuity can be modelled very accurately.
The upper limit for the number of stations is 200.
Surface Precision
The Surface Precision options has two functions:
Setting for calculating the hydrostatic sections
Setting used to form new compartments or tanks.
The precision at which the design was saved in Maxsurf is included in the Maxsurf
design file (.msd). Hydromax recognises this precision setting and will and set the
Surface Precision button accordingly.
Note:
Maxsurf surface trimming information may vary for different precisions.
Therefore it is recommended not to change the precision setting when
opening the Maxsurf design file in Hydromax.
Note:
The accuracy of the results depends much more on the number of sections
than the accuracy at which the sections are calculated. Reducing the
precision of the sections can greatly improve performance, usually at
relatively small impact on the accuracy of the hydrostatics.
Opening an Existing Hydromax Design File
After saving the Maxsurf design file for the first time in Hydromax, a “Hydromax
Design file” (.hmd) is created. The Hydromax design file will consist of the hydrostatic
sections and all input data such as loadcases, compartment definition, key points,
sounding pipes etc. Hydromax also allows saving of all input and output files into
individual files.
To open an existing design, there are two options:
Chapter 3 Using Hydromax
Page 23
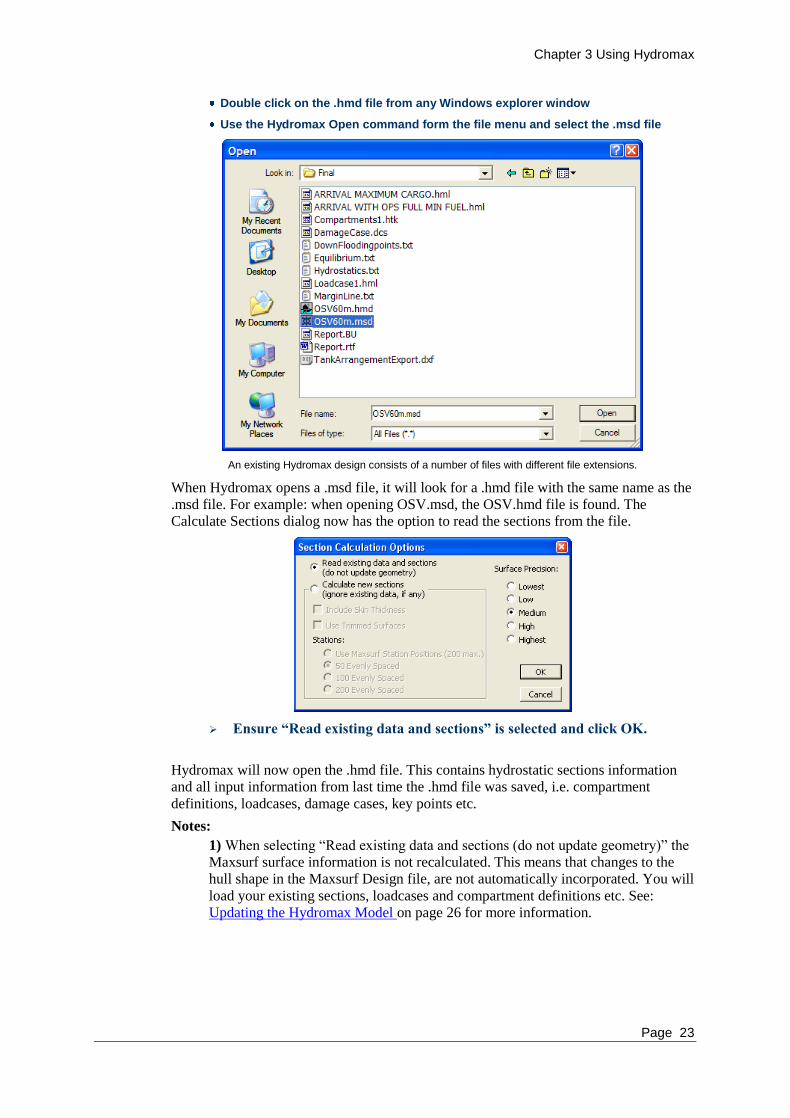
Double click on the .hmd file from any Windows explorer window
Use the Hydromax Open command form the file menu and select the .msd file
An existing Hydromax design consists of a number of files with different file extensions.
When Hydromax opens a .msd file, it will look for a .hmd file with the same name as the
.msd file. For example: when opening OSV.msd, the OSV.hmd file is found. The
Calculate Sections dialog now has the option to read the sections from the file.
Ensure “Read existing data and sections” is selected and click OK.
Hydromax will now open the .hmd file. This contains hydrostatic sections information
and all input information from last time the .hmd file was saved, i.e. compartment
definitions, loadcases, damage cases, key points etc.
Notes:
1) When selecting “Read existing data and sections (do not update geometry)” the
Maxsurf surface information is not recalculated. This means that changes to the
hull shape in the Maxsurf Design file, are not automatically incorporated. You will
load your existing sections, loadcases and compartment definitions etc. See:
Updating the Hydromax Model on page 26 for more information.

Chapter 3 Using Hydromax
Page 24
2) Calculate new sections (ignore existing data, if any) means that Hydromax will
recalculate the hull sections and ignore any data stored in the .hmd file. You will
have to reload your individual loadcases and compartment definition files etc after
you have selected this option and pressed OK. Do not choose this option if you
wish to keep the additional Hydromax data and you have not yet saved them as
individual files as if the model is saved in Hydromax the .hmd file will be
overwritten and any existing data lost. For more information on file properties and
extensions in Hydromax, please see: File Extension Reference Table on page 307.
Effect of Zero Point change
The description below relates to what happens in the following situation:
A hull model is generated in Maxsurf
Tank and load etc. data is then created in Hydromax and that data all saved in the
.hmd file (as is done when you chose Save when the drawing window is top most).
The model is closed in Hydromax
The model is opened in Maxsurf and for some reason the location of the zero point
is changed
The model is reopened in Hydromax and the tank and load etc. data is
automatically read from the .hmd file.
Hydromax 13 behaviour
It may sometimes occur that the model zero point location is changed in Maxsurf after
tank, loadcase. Etc. data is defined in Hydromax. In previous versions of Hydromax this
could cause problems because the loadcase and tank data maintained their position
relative to the zero point, where as the key points and margin line remained in the same
position relative to the hull.
The two images from Hydromax 13 show this problem. The first image shows the model
as initially defined in Hydromax with the zero point amidships and at the baseline. In the
second image, the zero point has been moved (in Maxsurf) to the aft-perpendicular and
the DWL. Note that whilst the margin line and key points have remained in their same
locations relative to the hull, the tanks and centre of gravity (from the loadcase) have
remained in their same locations relative to the zero point.
Original location of data as entered in Hydromax before zero point change in Maxsurf.

Chapter 3 Using Hydromax
Page 25
Effect of Zero point change in Maxsurf 13.
Hydromax 14 behaviour
To rectify this problem, when loading a .hmd file, Hydromax now detects if the zero
point has been modified in Maxsurf when the model is reopened in Hydromax. Note that
this is only possible with Hydromax models that have been saved from the new version
of Hydromax (because the new version of Hydromax now saves the zero point
independently so that it can check for changes).
Original location of data as entered in Hydromax before zero point change in Maxsurf.
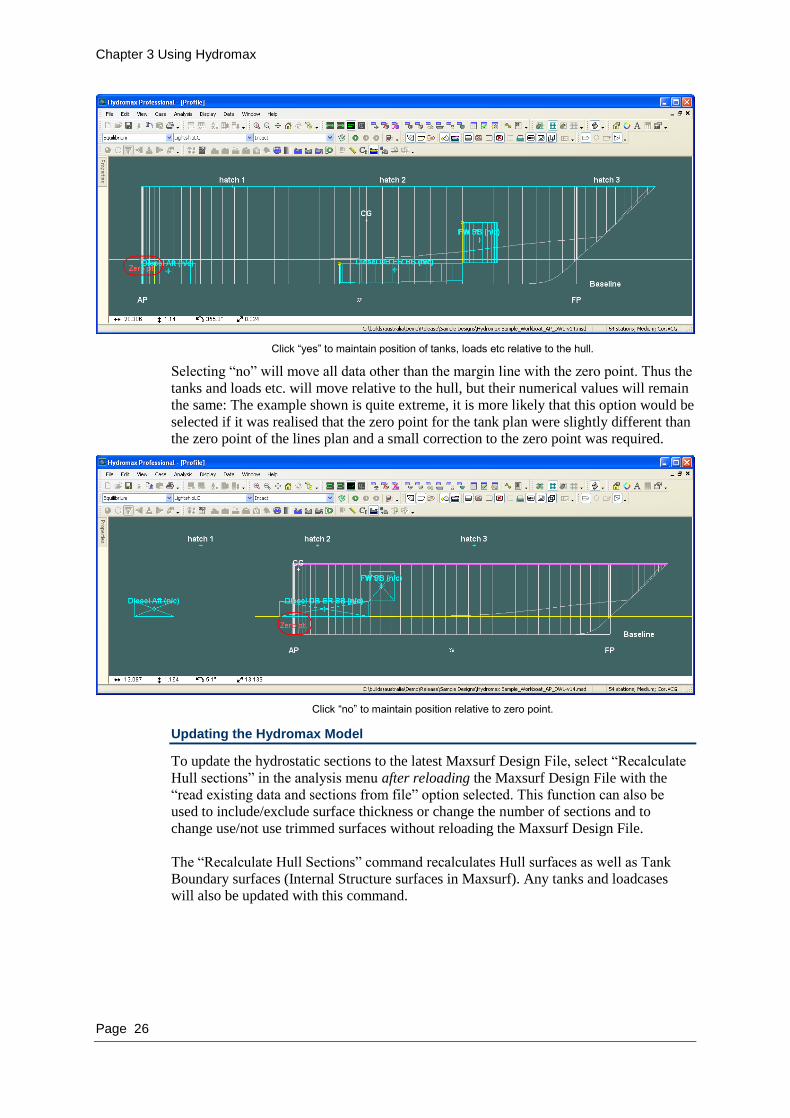
Now, if the zero point has changed, Hydromax will display the following message:
If the zero point is moved in Maxsurf, you will now be prompted.
Selecting “yes” will maintain the position all the Hydromax data relative to the hull;
essentially just the zero point it moved. This of course means that the numerical values
of the various data are changed:
Chapter 3 Using Hydromax
Page 26
Click “yes” to maintain position of tanks, loads etc relative to the hull.
Selecting “no” will move all data other than the margin line with the zero point. Thus the
tanks and loads etc. will move relative to the hull, but their numerical values will remain
the same: The example shown is quite extreme, it is more likely that this option would be
selected if it was realised that the zero point for the tank plan were slightly different than
the zero point of the lines plan and a small correction to the zero point was required.
Click “no” to maintain position relative to zero point.
Updating the Hydromax Model
To update the hydrostatic sections to the latest Maxsurf Design File, select “Recalculate
Hull sections” in the analysis menu after reloading the Maxsurf Design File with the
“read existing data and sections from file” option selected. This function can also be
used to include/exclude surface thickness or change the number of sections and to
change use/not use trimmed surfaces without reloading the Maxsurf Design File.
The “Recalculate Hull Sections” command recalculates Hull surfaces as well as Tank
Boundary surfaces (Internal Structure surfaces in Maxsurf). Any tanks and loadcases
will also be updated with this command.

Chapter 3 Using Hydromax
Page 27
Note:
Changes to the Maxsurf design are only recalculated after the new Maxsurf
design has been re-loaded into Hydromax. This means that if the model is
simultaneously being edited in Maxsurf and Hydromax, it is necessary to:
1) save and close the model in Hydromax
2) save in Maxsurf
3) open in Hydromax, using “Read existing data and sections” to make sure
the loadcase, compartment definition etc remain part of the Hydromax
design file.
4) use the “Recalculate Hull Sections” from the analysis menu.
Hydromax Sections Forming
Hydromax works by applying trapezoidal integration to data calculated from a series of
cross sections taken through the Maxsurf model surfaces. Hydromax will automatically
form these sections, called “Hydromax sections”, “hydrostatic sections” or just
“sections”. Hydromax deals only with sections that are completely closed, or can be
unambiguously closed. This section outlines the section forming process used in
Hydromax and may be helpful when preparing a Maxsurf design for Hydromax. Whilst
it is always preferable to give Hydromax a completely closed model with no ambiguities,
Hydromax will try to resolve any problems with the model definition in the manner
outlined in the following sections.
Note:
The golden rule is that for any longitudinal position, the section must be
made up of closed, non-intersecting (and non-self-intersecting) contours. In
practice, one opening is acceptable and this will be automatically closed
with a straight line.
Furthermore, contours cannot be contained wholly within another contour.
The same is true for groups of internal surfaces that have been selected to
define a tank boundary.
Where a section consists of an open shell (e.g. a hull surface with no deck), Hydromax
will automatically close the section with a straight line connecting the opening ends.
If, however, the section is made up of two line segments, (e.g. having both a gap at the
centreline as well as an open deck), an ambiguity exists as to how the two line segments
will be connected. This is not an acceptable shape.

Chapter 3 Using Hydromax
Page 28
In the example above, if either the top or bottom gap had been closed in Maxsurf the
design would cease to be ambiguous.
Multiple surfaces that are trimmed correctly, bonded together or use compacted control
points will not cause any problems when opened in Hydromax. Hydromax will form a
closed section through multiple surfaces by linking the curve segments together.

Chapter 3 Using Hydromax
Page 29
A section through a multihull containing a single closed contour
A section comprising two closed contours
Hydromax will link curve segments together if they are only separated by a small
amount. The user cannot change these tolerances, because there are too many
dependencies in the program.
Where surfaces intersect, Hydromax will make an attempt to remove excess portions of
the curve to form a single continuous contour. However this is not always possible so it
is much better practice to trim the model correctly manually.
Ambiguous Sections (e.g. decks, bulwarks)
A common example of ambiguous sections is a model with multiple decks. Hydromax
will have difficulties distinguishing the intended main deck.
Hydromax closes the outside contour and trims remnants
Chapter 3 Using Hydromax
Page 30
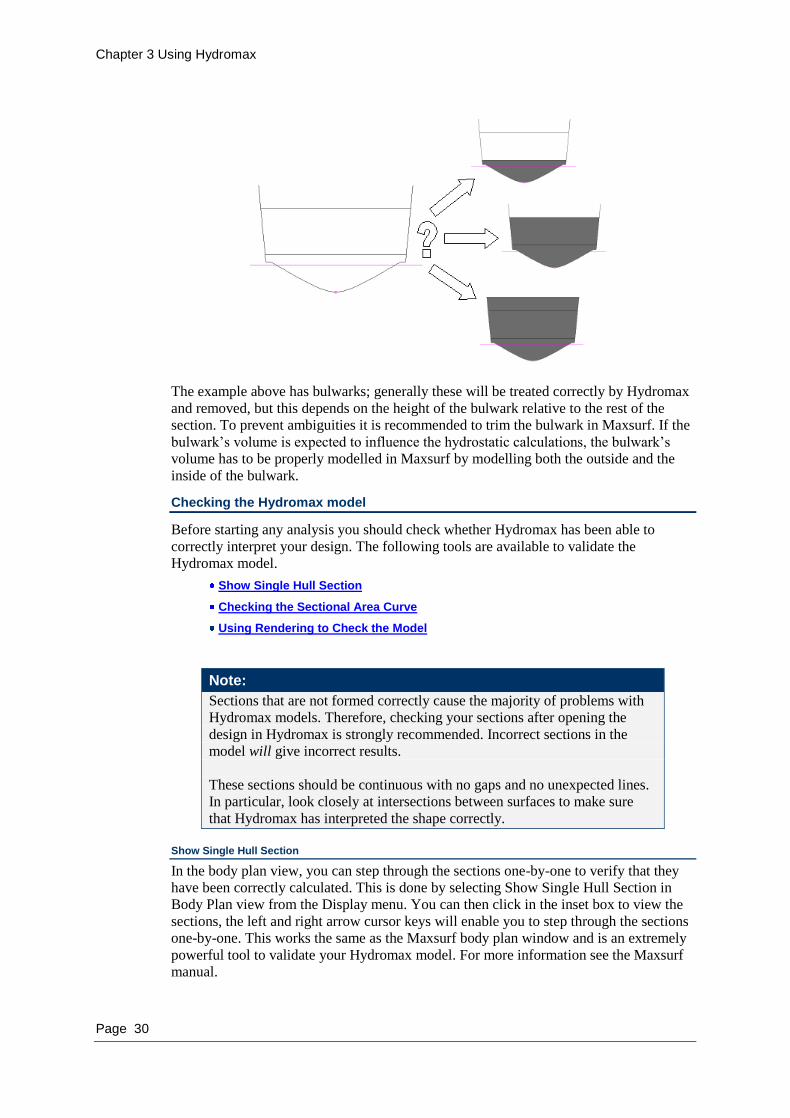
The example above has bulwarks; generally these will be treated correctly by Hydromax
and removed, but this depends on the height of the bulwark relative to the rest of the
section. To prevent ambiguities it is recommended to trim the bulwark in Maxsurf. If the
bulwark‟s volume is expected to influence the hydrostatic calculations, the bulwark‟s
volume has to be properly modelled in Maxsurf by modelling both the outside and the
inside of the bulwark.
Checking the Hydromax model
Before starting any analysis you should check whether Hydromax has been able to
correctly interpret your design. The following tools are available to validate the
Hydromax model.
Show Single Hull Section
Checking the Sectional Area Curve
Using Rendering to Check the Model
Note:
Sections that are not formed correctly cause the majority of problems with
Hydromax models. Therefore, checking your sections after opening the
design in Hydromax is strongly recommended. Incorrect sections in the
model will give incorrect results.
These sections should be continuous with no gaps and no unexpected lines.
In particular, look closely at intersections between surfaces to make sure
that Hydromax has interpreted the shape correctly.
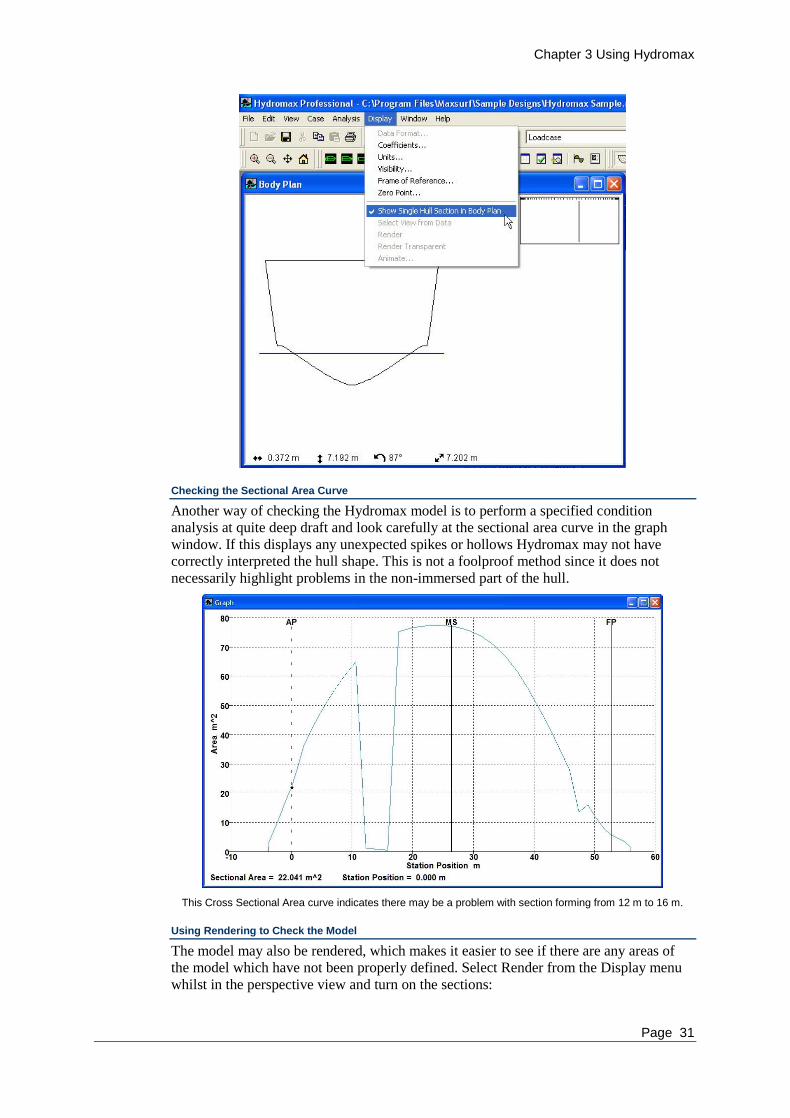
Show Single Hull Section
In the body plan view, you can step through the sections one-by-one to verify that they
have been correctly calculated. This is done by selecting Show Single Hull Section in
Body Plan view from the Display menu. You can then click in the inset box to view the
sections, the left and right arrow cursor keys will enable you to step through the sections
one-by-one. This works the same as the Maxsurf body plan window and is an extremely
powerful tool to validate your Hydromax model. For more information see the Maxsurf
manual.
Chapter 3 Using Hydromax
Page 31
Checking the Sectional Area Curve
Another way of checking the Hydromax model is to perform a specified condition
analysis at quite deep draft and look carefully at the sectional area curve in the graph
window. If this displays any unexpected spikes or hollows Hydromax may not have
correctly interpreted the hull shape. This is not a foolproof method since it does not
necessarily highlight problems in the non-immersed part of the hull.
This Cross Sectional Area curve indicates there may be a problem with section forming from 12 m to 16 m.
Using Rendering to Check the Model
The model may also be rendered, which makes it easier to see if there are any areas of
the model which have not been properly defined. Select Render from the Display menu
whilst in the perspective view and turn on the sections:

Chapter 3 Using Hydromax
Page 32
Note:
In rare instances incorrect rendering may occur. This does not necessarily
mean that the model is incorrect. As long as the sections are formed
correctly, the model is correct.
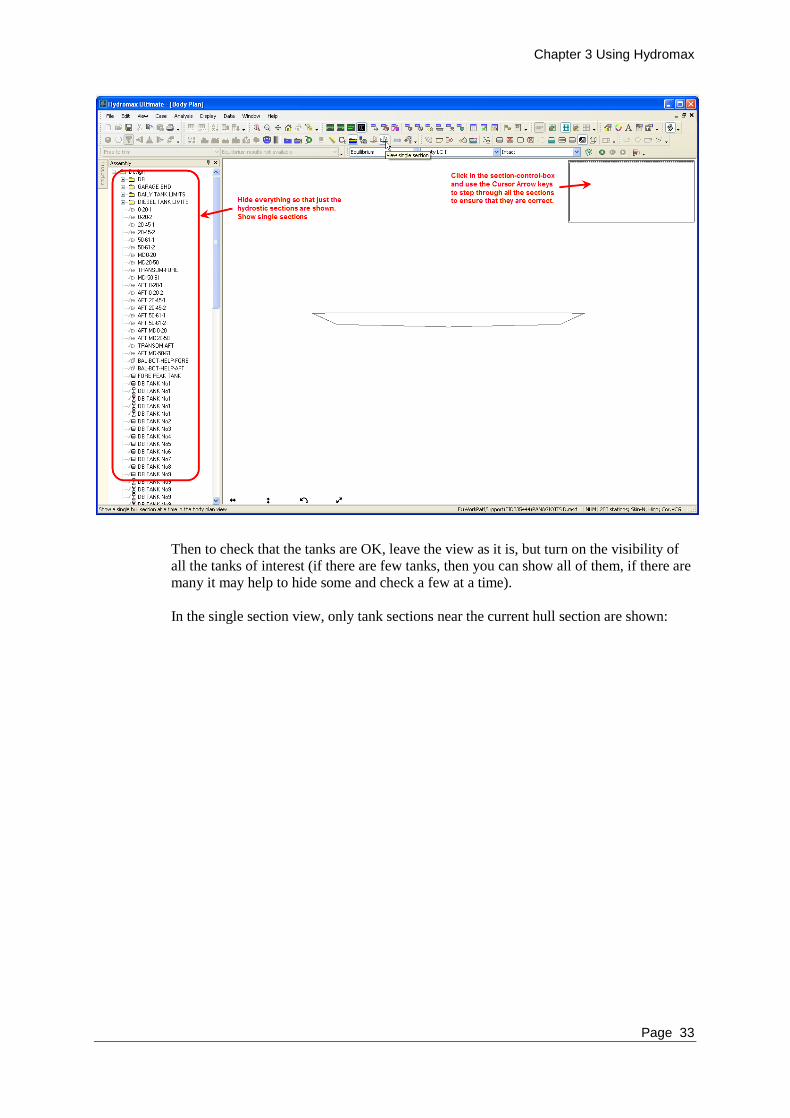
Further detailed checking of hull and tank/compartment sections
When checking that your model is correct, you are interested in whether the sections are
correct. To do this go to the body plan view in Hydromax and select “Show Single
Section”:
Chapter 3 Using Hydromax
Page 33
Then to check that the tanks are OK, leave the view as it is, but turn on the visibility of
all the tanks of interest (if there are few tanks, then you can show all of them, if there are
many it may help to hide some and check a few at a time).
In the single section view, only tank sections near the current hull section are shown:
Chapter 3 Using Hydromax
Page 34
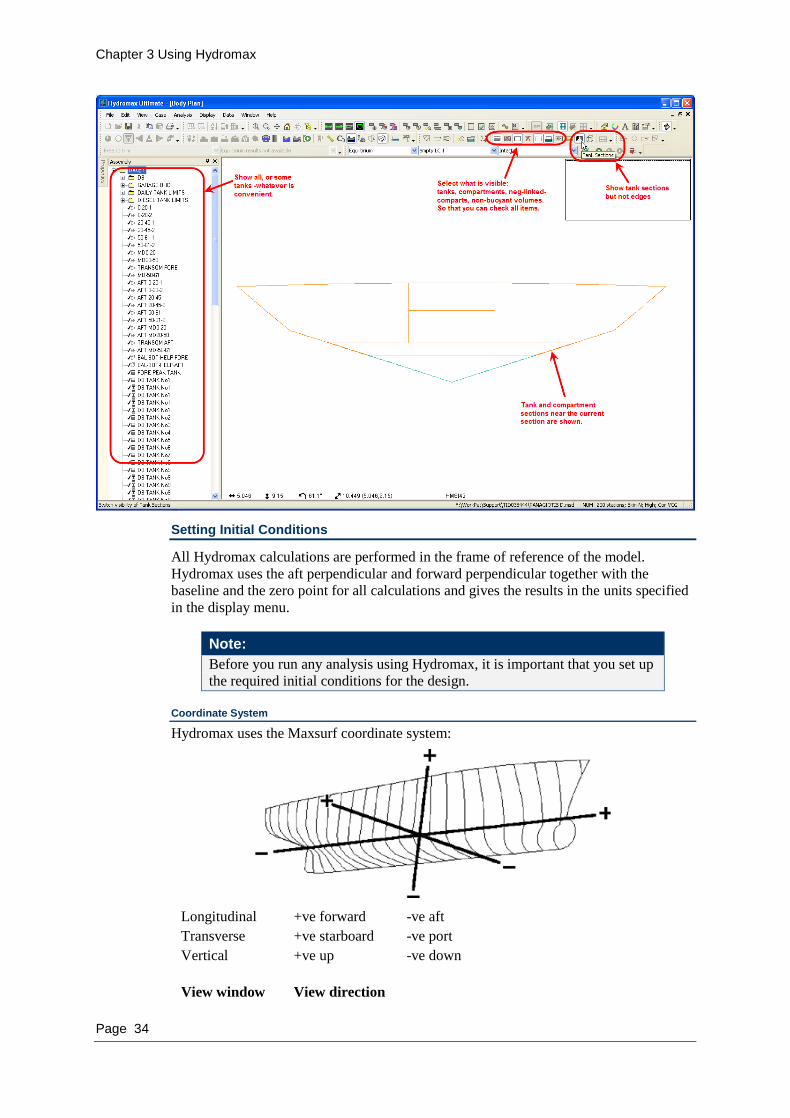
Setting Initial Conditions
All Hydromax calculations are performed in the frame of reference of the model.
Hydromax uses the aft perpendicular and forward perpendicular together with the
baseline and the zero point for all calculations and gives the results in the units specified
in the display menu.
Note:
Before you run any analysis using Hydromax, it is important that you set up
the required initial conditions for the design.
Coordinate System
Hydromax uses the Maxsurf coordinate system:
Longitudinal +ve forward -ve aft
Transverse +ve starboard -ve port
Vertical +ve up -ve down
View window View direction

Chapter 3 Using Hydromax
Page 35
Body plan From the stern, looking fwd
Plan From above, Port side above the centreline (this
the opposite direction to Maxsurf)
Profile From Starboard, bow to the right.
Frame of Reference and Zero Point
It is essential that a frame of reference be specified. This should be done in Maxsurf and
not in Hydromax. Draft and trim are measured on the forward and aft perpendiculars. If
these are not in the correct positions, some analysis results will be meaningless or may
even fail to complete.
See: Setting the Zero Point and Setting the Frame of Reference on page 18.
Note:
Changing the zero point in Maxsurf will not update the compartment
definition, loadcase and other input values. Changing the zero point after
you have started analysing the model in Hydromax is not recommended.
Draft Marks
Drafts are automatically calculated at the perpendiculars and amidships, should you
require drafts to be calculated at other locations, you may specify upto nine additional
locations at which the drafts should be reported. This is done through the Data | Draft
Marks dialog. Drafts are always measured to the Baseline in the centre plane of the
vessel. Immersed depth measurements are made perpendicualar to the free-surface.
Difference between “Immersed depth” and “Draft” measurements

Chapter 3 Using Hydromax
Page 36
User-defined Draft Marks
Note that the Trim is still defined as the difference between the drafts at the
perpendiculars and the Midship draft (used to define the range of immersions for the
Upright Hydrostatics analysis) is the mean of the drafts at the perpendiculars; i.e. neither
of these values has changed and neither are affected by the user-defined draft locations.
Drafts can only be defined when the vessel is rotated to the DWL (Display | Set vessel to
DWL).
User-defined draft locations and new toolbar button
Note: Draft and Trim specification
It should be remembered that the drafts specified for an analysis are the
drafts at the perpendiculars (or amidships) and the trim specified (and
reported) is the difference between the draft at the AP and draft at the FP.
Customising Coefficients
In Hydromax you may choose between the length between perpendiculars and the
waterline length for the calculation of Block, Prismatic and Waterplane Area
Coefficients. You may also select the draft, beam and sectional area to be used for
calculation of these coefficients.
The LCB and LCF can be displayed in the Results windows relative to the specified Zero
Point, Amidships location, Aft Perpendicular, Fwd Perpendicular or from the Aft,
Middle or fwd end of the actual waterline. You can also specify whether you want the
forward (towards the bow) or the aft (towards the stern) to have a positive sign. Finally
you can chose whether you want the LCB and LCF to be displayed as a length or as a
percentage of the waterline or LPP length as specified in the Length for Coefficients.

Chapter 3 Using Hydromax
Page 37
Data | Coefficients dialog
Setting Units
The units used may be specified using the Units command. In addition to the length and
weight (mass) units, units for force and speed (used in wind heeling and heeling due to
high-speed turn etc. criteria) and the angular units to be used for areas under GZ curves,
may also be set. The angular units for measuring heel and trim angles are always
degrees. Units may be changed at any time.

Chapter 3 Using Hydromax
Page 38
Other Initial Conditions
See:
Fluids Analysis Methods on page 148
Density on page 150
Working with Loadcases
Loadcases define the loading condition of the vessel. Static weights that make up the
vessel lightship are specified here as well as tank filling levels, expressed as either a
percentage of the full tank capacity or as a weight.
Loadcases automatically contain all the tanks defined in the Tank definition. Loadgroups
are special loadcases that contain no tanks. These may be used to define groups of fixed
weights (such as the steel weight or lightship weight) in a single location which may then
be cross-referenced into a loadcase. Any changes to the loadgroup are then automatically
incorporated into any loadcases that reference them.
A loadgroup is included in a loadcase simply by specifying the loadgroup name in the
“Item Name” column.
The loadcase will normally update the column totals automatically as weights or tank
loadings are changed. The exception to this is if tanks have not yet been formed or the
vessel is still rotated from the result of an analysis. If the loadcase does not update, click
on the update Loadcase button and ensure that the hull is at the DWL by selecting “Set
vessel to DWL”:

Chapter 3 Using Hydromax
Page 39
The individual loads can be displayed graphically:
Creating a new Loadcase File
To create a load case, switch to the loadcase view by selecting Loadcase from the
Loadcase sub-menu in the Window menu. Then select “New Load Case” from the File
menu or press Ctrl+N. A new load spreadsheet will be displayed in the Loadcase
window. The default loadcase will contain a lightship entry and an entry for each tank
(with a default filling of 50%).

Chapter 3 Using Hydromax
Page 40
The tabs in the bottom of the window can be used to skip through the different loadcases
in the design.
Create New Loadcases based on Template
To avoid rework, an existing loadcase may be used as a template when creating a new
loadcase. To do this,
In the loadcase window, select the Loadcase you wish to use as a template
Bring the loadcase you wish to use as a template to the front for example by clicking on the tab on the bottom
select File | New
First, you will be asked for a new Loadcase name after which the following dialog
appears:

Chapter 3 Using Hydromax
Page 41
A new loadcase will appear in one of the blank (…) loadcase tabs. If there are no blank
tabs left, you will either have to close an existing loadcase, or add more loadcases using
the Case | Max. Number of Loadcases command.
Note
The template is only used during the creation of the loadcase. Once a
loadcase has been created from a template loadcase, changes made in the
template are NOT automatically changed in the loadcase derived from it.
Naming and Saving a Loadcase
A loadcase can be given any name by saving it to a separate file where the loadcase
filename will be used as the loadcase name and displayed on the tab in the loadcase
window. Alternatively,
Select Edit Loadcase from the Case menu
Changing the name in the Loadcase Properties dialog.
The next time you use the File | Save Loadcase command you will be asked to confirm
the loadcase file name.
Loading a Saved Loadcase
You can load a saved loadcase into your loadcase window by:
Select an empty tab in the loadcase window that you wish to load the
loadcase into
Empty tab.
If there are no empty tabs, you should either increase the maximum number of loadcases
(see below), or close an existing loadcase.
Select File | Open Load Case

Chapter 3 Using Hydromax
Page 42
Select the .hml file you wish to open.
Setting the Maximum Number of Loadcases
The maximum number of loadcases (up to twenty-five) that can be loaded in Hydromax
at any one time is set by selecting “Max. Number of Loadcases” from the Case menu.
You may then enter the maximum number of load cases you require.
You must restart Hydromax for this change to take effect. In most cases, you will only
need to set this once to the maximum number of loadcases you are ever likely to use. For
convenience of use, a sensible number is recommended.
Each loadcase can be selected and used for analysis. Each may be saved and loaded
independently, effectively allowing you as many loadcases as you require.
Note:
When loading a design that has more loadcases than the maximum you have
currently set in Hydromax, you will receive a warning and the file will not
be loaded. You must increase the maximum number of allowable loadcases
and restart Hydromax before you can load the design.
Closing a Loadcase
Select the tab of the loadcase you wish to close in the Loadcase window
Select File | Close Load Case
Adding and Deleting Loads
To add an extra load to the loadcase,
Select Add Load from the Edit menu or press Ctrl+A.
A new load will be inserted into the table above the currently selected row. You can
repeat this process for as many loads as you wish.
If you want to remove a load from the table, simply click anywhere in the row you want
to remove, and choose Delete Load from the Edit menu (or highlight the complete row
by clicking the grey cell to the left of the row and press the Delete key). If you wish to
delete several loads simultaneously, click and drag so that all of the loading rows that
you wish to delete are selected, then select Delete Load.
Editing Loads
Click on the cell containing the load name and type in a name for this load, for example
"Lightship", and press the Tab key to go to the next column in the table (or simply click
directly in the cell you wish to edit).
For each item in the list you can specify a quantity. This is used to calculate the total
weight of that item. For example: if the item was “crew” with a weight per unit, you
could specify the quantity and unit weight, and the total weight of crew would be
automatically calculated. The weight of each item should be entered in the next column.
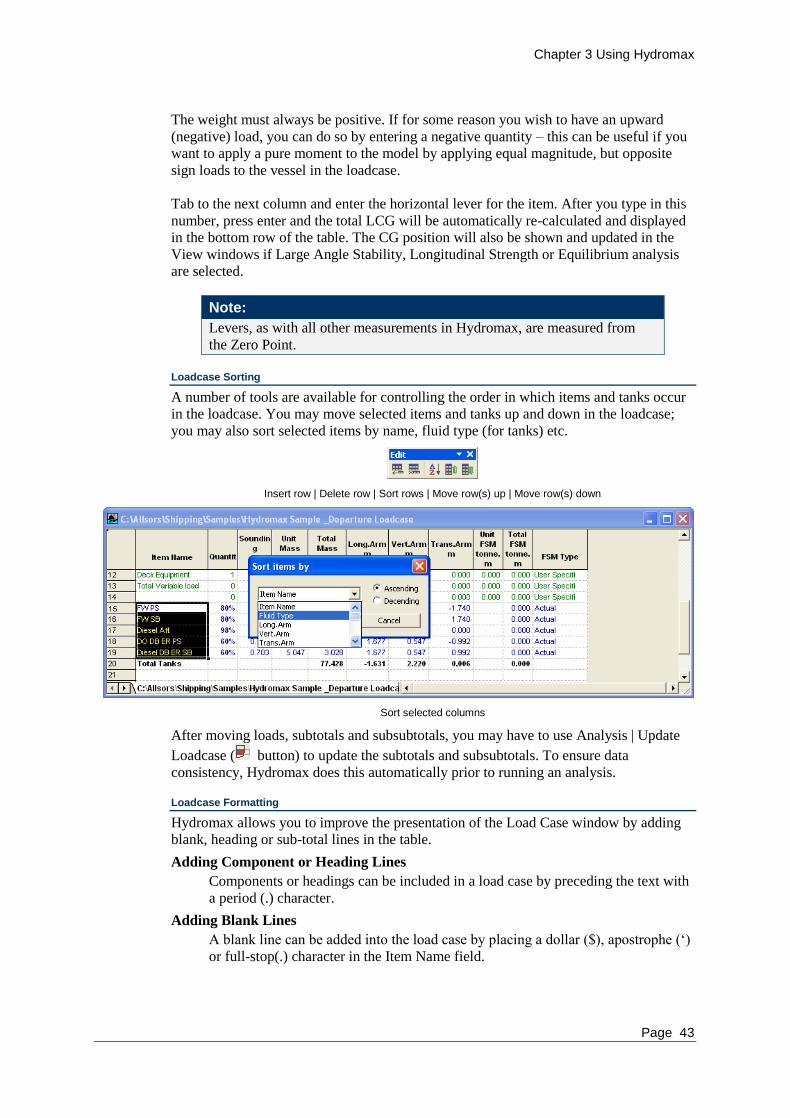
Chapter 3 Using Hydromax
Page 43
The weight must always be positive. If for some reason you wish to have an upward
(negative) load, you can do so by entering a negative quantity – this can be useful if you
want to apply a pure moment to the model by applying equal magnitude, but opposite
sign loads to the vessel in the loadcase.
Tab to the next column and enter the horizontal lever for the item. After you type in this
number, press enter and the total LCG will be automatically re-calculated and displayed
in the bottom row of the table. The CG position will also be shown and updated in the
View windows if Large Angle Stability, Longitudinal Strength or Equilibrium analysis
are selected.
Note:
Levers, as with all other measurements in Hydromax, are measured from
the Zero Point.
Loadcase Sorting
A number of tools are available for controlling the order in which items and tanks occur
in the loadcase. You may move selected items and tanks up and down in the loadcase;
you may also sort selected items by name, fluid type (for tanks) etc.
Insert row | Delete row | Sort rows | Move row(s) up | Move row(s) down
Sort selected columns
After moving loads, subtotals and subsubtotals, you may have to use Analysis | Update
Loadcase ( button) to update the subtotals and subsubtotals. To ensure data
consistency, Hydromax does this automatically prior to running an analysis.
Loadcase Formatting
Hydromax allows you to improve the presentation of the Load Case window by adding
blank, heading or sub-total lines in the table.
Adding Component or Heading Lines
Components or headings can be included in a load case by preceding the text with
a period (.) character.
Adding Blank Lines
A blank line can be added into the load case by placing a dollar ($), apostrophe („)
or full-stop(.) character in the Item Name field.
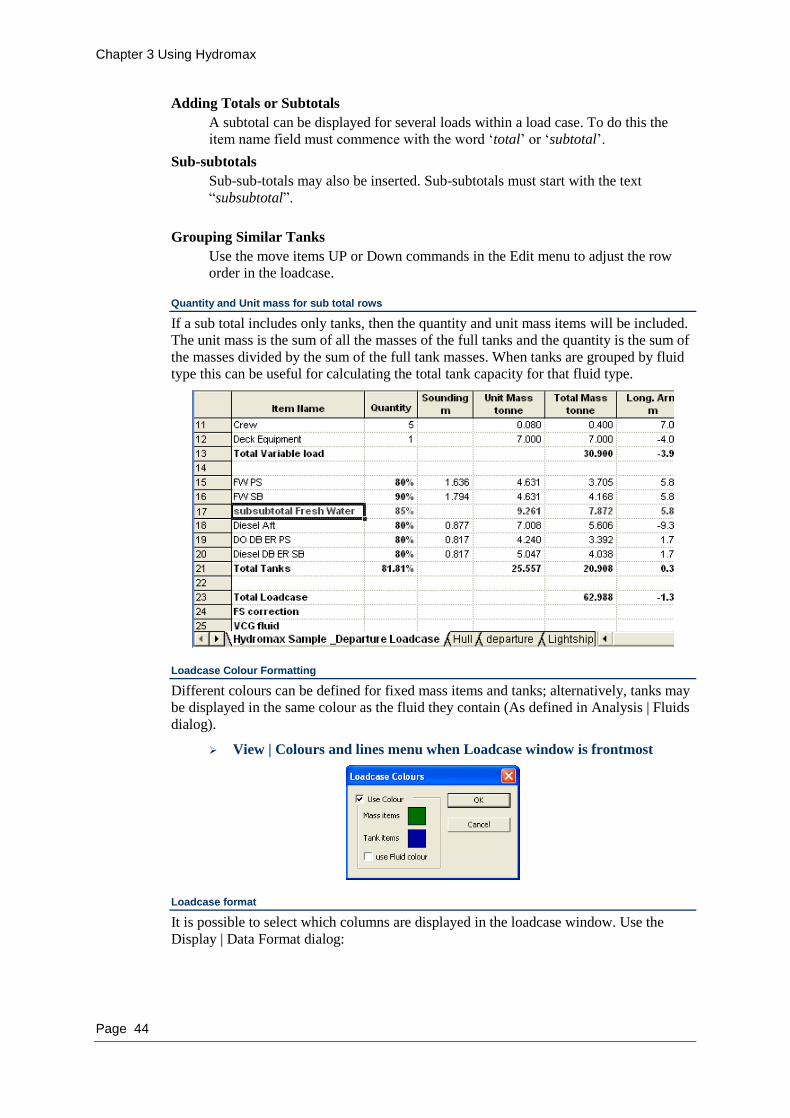
Chapter 3 Using Hydromax
Page 44
Adding Totals or Subtotals
A subtotal can be displayed for several loads within a load case. To do this the
item name field must commence with the word „total‟ or „subtotal‟.
Sub-subtotals
Sub-sub-totals may also be inserted. Sub-subtotals must start with the text
“subsubtotal”.
Grouping Similar Tanks
Use the move items UP or Down commands in the Edit menu to adjust the row
order in the loadcase.
Quantity and Unit mass for sub total rows
If a sub total includes only tanks, then the quantity and unit mass items will be included.
The unit mass is the sum of all the masses of the full tanks and the quantity is the sum of
the masses divided by the sum of the full tank masses. When tanks are grouped by fluid
type this can be useful for calculating the total tank capacity for that fluid type.
Loadcase Colour Formatting
Different colours can be defined for fixed mass items and tanks; alternatively, tanks may
be displayed in the same colour as the fluid they contain (As defined in Analysis | Fluids
dialog).
View | Colours and lines menu when Loadcase window is frontmost
Loadcase format
It is possible to select which columns are displayed in the loadcase window. Use the
Display | Data Format dialog:

Chapter 3 Using Hydromax
Page 45
The Relative density and Fluid Type which allow you to override the default tank
densities as defined for each tank in the Compartment Definition window. This can be
useful for vessels such as product carriers which may have cargos of different types of
fluids with different densities.
Moment columns (mass * lever) can be displayed if desired.
Longitudinally Distributed Loads
Distributed loads can be entered in the Loadcase window in the aft limit and forward
limit cells. The aft limit and forward limit columns only appear when Longitudinal
Strength analysis is selected and the distributed loads will only have an effect on the
results in this analysis mode. The “Long. Arm” column defines the longitudinal position
of the centre of the load; the fore and aft limits define the longitudinal extents of the
load.
If the longitudinal arm is changed in the Loadcase window, the forward and aft limits
will be moved by the same amount.
For an evenly distributed load, the centre of gravity should be midway between the
forward and aft limits.

Chapter 3 Using Hydromax
Page 46
Evenly distributed loads. Red = green and divided in the centre.
For trapezium shaped distributed loads the centre of gravity is not midway between the
boundaries, but within the middle third 1/3 of the centre.
Trapezium shaped distributed load. Red = Green divided within middle 1/3 of centre.
Note:
Since the load is distributed as a trapezium, the centre of gravity should lie
within the middle third between the forward and aft limits of the load, at
these extrema, the load distribution becomes triangular.
Tanks will be automatically treated as distributed loads for the longitudinal
strength calculations.
Tank Loads
When you create tanks using the compartment definition, they will be automatically
included in the loadcases (but not in Loadgroups which do not contain tanks).
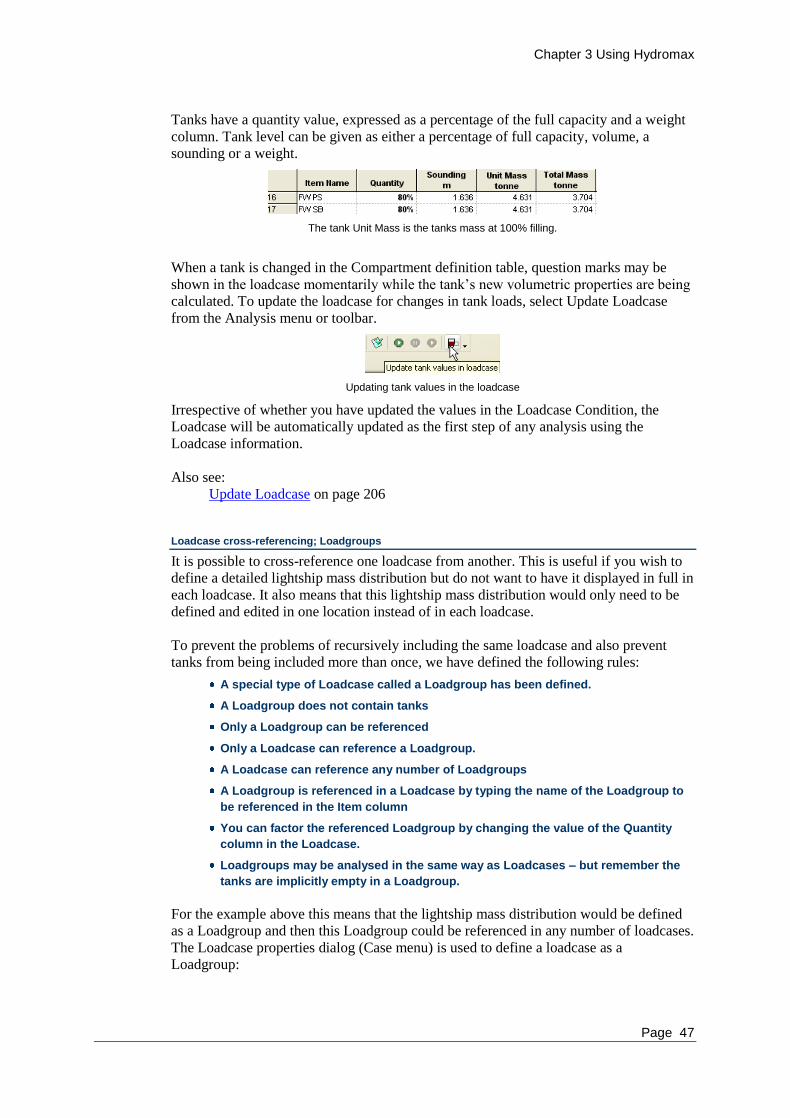
Chapter 3 Using Hydromax
Page 47
Tanks have a quantity value, expressed as a percentage of the full capacity and a weight
column. Tank level can be given as either a percentage of full capacity, volume, a
sounding or a weight.
The tank Unit Mass is the tanks mass at 100% filling.
When a tank is changed in the Compartment definition table, question marks may be
shown in the loadcase momentarily while the tank‟s new volumetric properties are being
calculated. To update the loadcase for changes in tank loads, select Update Loadcase
from the Analysis menu or toolbar.
Updating tank values in the loadcase
Irrespective of whether you have updated the values in the Loadcase Condition, the
Loadcase will be automatically updated as the first step of any analysis using the
Loadcase information.
Also see:
Update Loadcase on page 206
Loadcase cross-referencing; Loadgroups
It is possible to cross-reference one loadcase from another. This is useful if you wish to
define a detailed lightship mass distribution but do not want to have it displayed in full in
each loadcase. It also means that this lightship mass distribution would only need to be
defined and edited in one location instead of in each loadcase.
To prevent the problems of recursively including the same loadcase and also prevent
tanks from being included more than once, we have defined the following rules:
A special type of Loadcase called a Loadgroup has been defined.
A Loadgroup does not contain tanks
Only a Loadgroup can be referenced
Only a Loadcase can reference a Loadgroup.
A Loadcase can reference any number of Loadgroups
A Loadgroup is referenced in a Loadcase by typing the name of the Loadgroup to
be referenced in the Item column
You can factor the referenced Loadgroup by changing the value of the Quantity
column in the Loadcase.
Loadgroups may be analysed in the same way as Loadcases – but remember the
tanks are implicitly empty in a Loadgroup.
For the example above this means that the lightship mass distribution would be defined
as a Loadgroup and then this Loadgroup could be referenced in any number of loadcases.
The Loadcase properties dialog (Case menu) is used to define a loadcase as a
Loadgroup:

Chapter 3 Using Hydromax
Page 48
This lightship Loadgroup contains the lightship mass distribution along the ship. The
Lightship load group can then be cross-referenced into any loadcase

Chapter 3 Using Hydromax
Page 49
The referenced Loadgroup is automatically calculated and the appropriate values
included in the Loadcase:
Note: Loadgroup naming
The cross-referencing of loadgroups in a loadcase is case insensitive.
Loadcase density override
It is now possible to override the default tank fluid densities as defined in the
Compartment definition window. This allows you to load the same tanks with different
fluids in different Loadcases – as might be the case for a product carrier, for instance.
By default use tank defined densities:
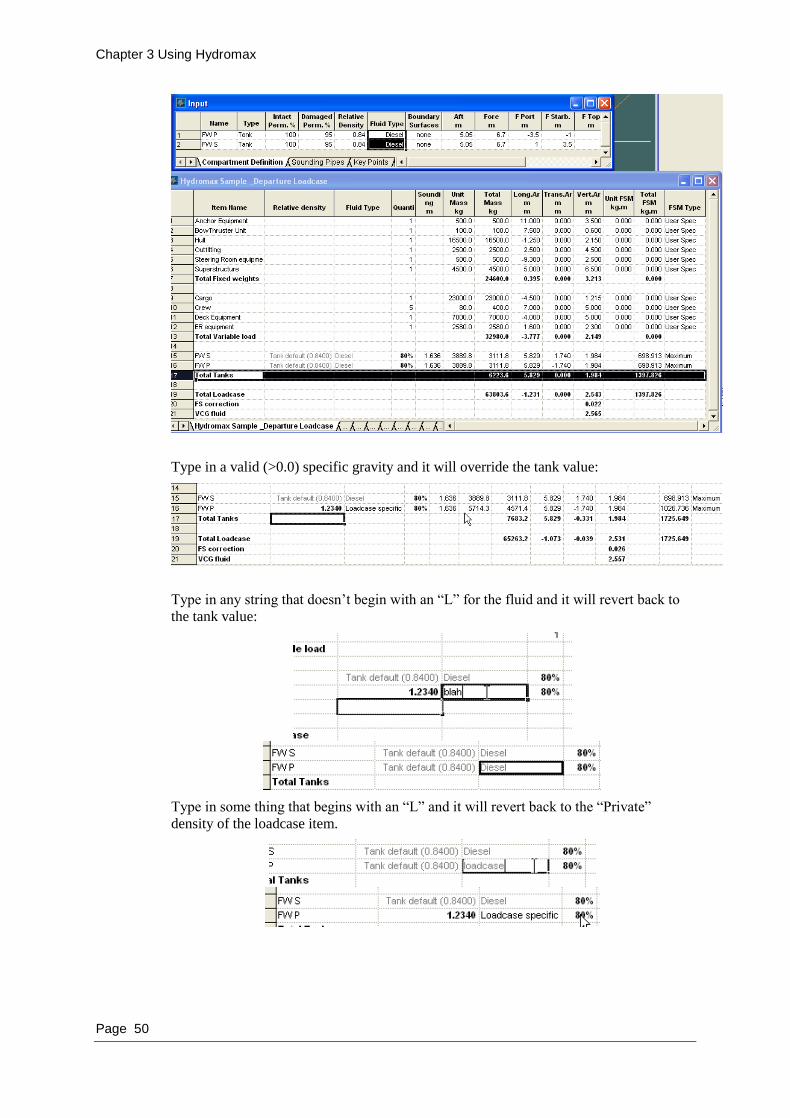
Chapter 3 Using Hydromax
Page 50
Type in a valid (>0.0) specific gravity and it will override the tank value:
Type in any string that doesn‟t begin with an “L” for the fluid and it will revert back to
the tank value:
Type in some thing that begins with an “L” and it will revert back to the “Private”
density of the loadcase item.
Chapter 3 Using Hydromax
Page 51
Free surface correction
If the corrected VCG fluid option has been chosen, the Loadcase will sum the free
surface moments, divide by the total displacement to obtain the VCG correction and
adjust the VCG accordingly to obtain the corrected fluid VCG.
Fluid simulation
If the Fluid simulation option is selected in the analysis menu, no correction
is made to the upright VCG. Instead, at every step of the analysis,
Hydromax calculates the actual position of the fluid in the tanks taking into
account heel and trim, making the tanks‟ free-surface parallel to the sea
surface, thus the actual vessel CG is recalculated accounting exactly for the
static shift of the fluids in slack tanks.
When the corrected VCG method is selected in the analysis menu, it is possible to
choose the type of free surface moment to be applied for each tank in a Hydromax
Loadcase. The options available are
Maximum
Hydromax will use the maximum free surface moment of the tank in upright
condition for all fluid levels.
Actual
Hydromax uses the free surface moment for the current fluid level of the tank in
upright condition.
IMO
Hydromax uses IMO MSC75.(69) Ch 3.3 for the calculation of the free surface
moment. This method approximates the movement of fluid due to heeling and is
based on the fluid shift in a 50% full rectangular, box-shaped-tank. For other
shapes and fillings of tanks it will not correctly approximate the free surface
moment.
User specified
A user specified value is used for all levels and heel angles.
Workshop structure
Workshop can save a Loadgroup that contains the masses of all the structural parts. This
can be loaded into Hydromax and referenced in any Loadcase.
Modelling Compartments
This section will describe in detail how to model different types of tanks and
compartments.
Besides a general explanation on how to model tanks using the compartment definition
table, this section contains a number of important sections that the user should be aware
off when modelling tanks:
Number of Sections in Tanks on page 67
Tank and Compartment Permeability on page 59
Creating a Compartment definition file (.htk)
Select the Compartment Definition table by clicking on the Compartment
Definition tab at the bottom of the Input window.
Select New Compartment Definition from the File menu

Chapter 3 Using Hydromax
Page 52
This will give you a new set of compartment definitions with one default tank.
Adding and Deleting Compartments
Before you can start adding compartments, make sure you have created a Compartment
definition file, see above.
Compartments may be added or deleted by
Select Add or Delete Compartment from the Edit menu.
Add will add a tank after the currently selected compartment and Delete will delete the
currently selected compartment(s). The accelerator keys Ctrl+A and the Delete key may
also be used to add and delete entries respectively.
Modelling Box Shape Tanks
Simple tanks and compartments are created by specifying six values that define a box-
shaped boundary for the tank. This box will be called the Boundary Box. The boundary
box is made up of the fore and aft extremities of the tank, the top and bottom, and the
port and starboard limits of the tank. Each value defines one of the six planes of the tank.
The column headings in the Compartment Definition table include terms such as 'F
Bottom, 'A Top', 'F Port' and 'A Starboard'. The 'F' and 'A' abbreviations stand for
Forward and Aft, in other words the two ends of the compartment. You will notice that
aft columns contain the word "ditto". This means that the value is identical at the aft end
of the tank to the forward end, resulting in a parallel tank.
When the “Update Loadcase” command from the Analysis menu is used, or an analysis
started, Hydromax will form the sections that define the tanks and compartments. This is
done by finding the intersection of the tank bounding box and the hull. Thus it is not
necessary to make the tanks fit the hull manually – this is done automatically by
Hydromax.
Box shaped compartments can be formed from the numerical values in the compartment definition table.
See Longitudinal Extents of Boundary Box on page 67 for some recommendations
regarding setting the boundary box.

Chapter 3 Using Hydromax
Page 53
Modelling Tapered Tanks
The default is for compartments to have parallel sides. If you wish to define tapered
compartments, it is possible to enter different transverse and vertical values for the
points defining the forward and aft ends of the compartment.
If a different value is entered in one of the “ditto” columns, a tapered tank will result.
Tanks can be tapered or sloped in Plan or Profile views. Hydromax does not have a
mechanism for creating a sloped tank boundary in the Body Plan view.
By changing the “ditto”-input fields, tapered tanks can be formed
Note:
Tapering can be done in Plan and in Profile view. Tapered tanks in Body
Plan view have to be created using a boundary surface. See Modelling
Tanks Using Boundary Surfaces on page 54.
Linked Tanks
Tanks and compartments may be linked. This means that although they are defined as
separate tanks, they act as a single tank with a common free surface. To link tanks,
compartments or non-buoyant volumes, first make them the same type as the parent and
give them the same name. The easiest way to do this is to copy and paste the name from
the Name column of the parent row into the Name column of the linked tank row. They
may then be linked to the parent by typing l or linked in the Type column. Linked tanks
and compartments do not have to be physically linked in space. However, the fluid in a
linked tank or damaged compartment is always assumed to be able to flow freely
between the linked volumes.

Chapter 3 Using Hydromax
Page 54
Modelling Tanks Using Boundary Surfaces
Tanks, compartments and non-buoyant volumes may have their boundaries defined by
surfaces as well as being constrained to particular dimensions. This allows for the
modelling of arbitrarily shaped tanks.
Forming tanks using boundary surfaces
The surfaces to be used to define the tank boundaries are selected by clicking in the
Boundary Surfaces column in the middle of the Compartments Definition table. A dialog
will appear that allows you to select which surfaces form the boundary of the tank. If a
tank uses boundary surfaces, the cell in the Boundary Surfaces column is coloured blue.

Chapter 3 Using Hydromax
Page 55
If you wish to use a Maxsurf surface to define a tank or compartment, tick next to the
surface name in the Boundary Surface list. Note that symmetrical surfaces appear twice
as there will be a starboard and a port side copy of the surface. The Starboard surface is
first in the list and the Port surface second. The port surface is also identified with the
suffix (P) after the name.
Note:
Only internal structure surfaces appear in the boundary surfaces list.
Symmetrical surfaces are duplicated, with the port-side surface having “(P)”
appended to the surface name.
After selecting the internal surfaces, it is necessary to type in the extents of
the boundary box. Hydromax will automatically set the “Fore” and “Aft”
limits of the boundary box to just within the longitudinal limits of the
Boundary Surface. This ensures that at least 12 sections are inserted in the
tank.
Also see:
Forming Compartments on page 62
Number of Sections in Tanks on page 67
Longitudinal Extents of Boundary Box on page 67
Modelling External Tanks
External tanks may not be modelled in Hydromax. However, it is normally possible to
add "Hull" surfaces in the Maxsurf model, which will enclose the external tanks. The
tanks can then be modelled in Hydromax.
Additional box-shaped hull surfaces used to define deck tanks
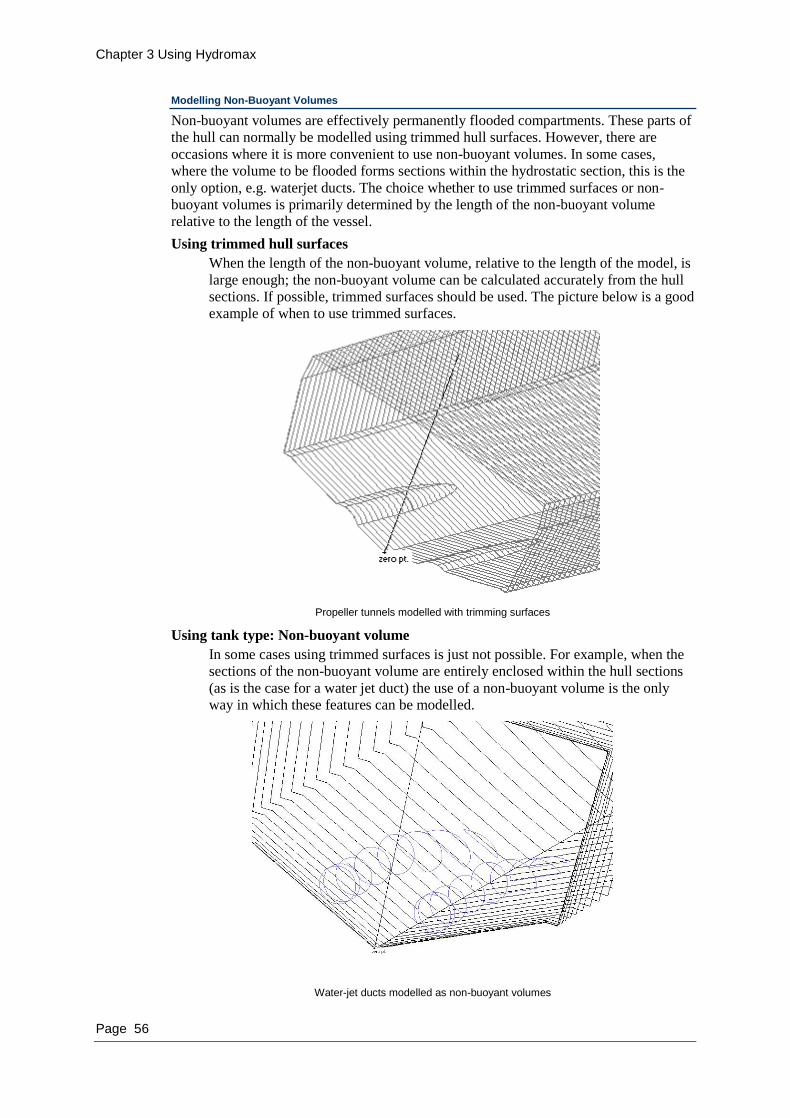
Chapter 3 Using Hydromax
Page 56
Modelling Non-Buoyant Volumes
Non-buoyant volumes are effectively permanently flooded compartments. These parts of
the hull can normally be modelled using trimmed hull surfaces. However, there are
occasions where it is more convenient to use non-buoyant volumes. In some cases,
where the volume to be flooded forms sections within the hydrostatic section, this is the
only option, e.g. waterjet ducts. The choice whether to use trimmed surfaces or non-
buoyant volumes is primarily determined by the length of the non-buoyant volume
relative to the length of the vessel.
Using trimmed hull surfaces
When the length of the non-buoyant volume, relative to the length of the model, is
large enough; the non-buoyant volume can be calculated accurately from the hull
sections. If possible, trimmed surfaces should be used. The picture below is a good
example of when to use trimmed surfaces.
Propeller tunnels modelled with trimming surfaces
Using tank type: Non-buoyant volume
In some cases using trimmed surfaces is just not possible. For example, when the
sections of the non-buoyant volume are entirely enclosed within the hull sections
(as is the case for a water jet duct) the use of a non-buoyant volume is the only
way in which these features can be modelled.
Water-jet ducts modelled as non-buoyant volumes

Chapter 3 Using Hydromax
Page 57
Another occasion when non-buoyant volumes should be used, is when the length
of the compartment relative to the length of the hull is too small to calculate its
volume from the hull sections. A good example of this is a bow thruster on a long
ship. If the vessel is very long, and the thruster duct is of small diameter, there
may not be sufficient sections to model it accurately (even if you use the
maximum of 200 sections for the Hydromax model). In this case you are better off
modelling the thruster duct as internal structure and using these surfaces to define
a non-buoyant volume. For example: in the image below the bow thruster volume
is only calculated with one section.
For more information, see Number of Sections in Tanks on page 67.
Tip: Besides increasing the number of sections through the bow thruster from 1 to 12,
modelling the thruster duct as a non-buoyant volume has the additional advantage of
being able to specify a Tank and Compartment Permeability, and hence also account for
the thruster.
Bow thruster tube modelled as two non-buoyant volumes
Tanks within Compartments
When a tank is defined within a compartment, Hydromax will automatically deduct the
volume of the tank from the compartment volume using a “linked neg. (negative)
compartment”. This is necessary for damage cases where the compartment is flooded
and the volume of the tank should be treated completely separately from the
compartment.
Linked negative compartments are deleted and recreated whenever a tank or
compartment is added, deleted or modified. Negatively linked compartments are
displayed on the bottom of the Compartment Definition table solely for reference
purposes and are not under direct user control. This means that linked negative
compartments cannot be added, deleted or modified.

Chapter 3 Using Hydromax
Page 58
Linked negative compartments are named based on both the parent compartment as well
as the tank from which the linked negative compartment was derived. For example a
linked negative compartment might be named “Compartment3 (Stbd Hydr Oil)” to
reflect that it is derived from the intersection of Compartment3 with the Stbd Hydr Oil
tank.
Tanks Overlapping
As mentioned earlier in this manual, only compartments and non buoyant volumes or
tanks can overlap with each other. Tanks or compartments of the same type (eg two
tanks) can not overlap. A tank and a non-buoyant volume are also not allowed to
overlap.
Hydromax will first try to form tank sections and then check whether these sections
overlap tank sections of adjacent tanks. When two conflicting or overlapping tanks or
compartments are detected during the forming process, you will receive an error
message:
Notice that the compartment definition row number of the tank is given in brackets i.e. tank #8 intersects tank #3.
Troubleshooting Overlapping Tanks
Sometimes the reason for the conflict can be quite simple: eg an overlapping boundary
box. However, when you are modelling tanks using boundary surfaces, the surface
boundaries act as a boundary between two adjacent tanks and the bounding box extents
are allowed to overlap. In these cases, it can be quite difficult to see why the tanks
overlap, especially if you have a large number of tanks already defined.
By temporarily deleting all tanks except for the one that does not form, it often becomes
clear why the tank overlaps. In the case of the image above, the tank‟s fwd most section
goes all the way to the CL (probably because the fwd boundary box extent is just fwd of
the boundary surfaces or exactly on the edge of a boundary surface). This causes this
particular tank to “overlap” with surrounding tanks.

Chapter 3 Using Hydromax
Page 59
Procedure to Fix Overlapping Tanks:
Save Model
Go into Comp def window
Save comp def
Delete all tanks except for one you wish to investigate
form tanks, inspect tank sections
Try to fix tank definition, eg by selecting additional boundary surfaces
Now that you know how to fix it..
Close comp def file. Do NOT save!!
Open saved Comp def file
Fix compartment.
Save & move on to next compartment.
Tank and Compartment Permeability
Tanks may have two permeabilities; one, which is used when the tank is intact, and the
other when it is damaged. Compartments and non-buoyant volumes have only one
permeability, thought it is listed in both columns. The compartment permeability is
applied when the compartment is flooded in a damage condition and the non-buoyant
volume permeability is applied at all times since it is always flooded.
In the case of damaged tanks and compartments, the permeability fraction is also applied
to the free-surface-moment contribution of that tank or compartment.
Permeability of Compartments
As opposed to tanks, compartments typically have structure (other than plate
stiffeners) and equipment inside. In case of large variations in permeability within
a compartment it is recommended to model separate linked compartments with
separate permeability to increase accuracy.
For example an engine room with engines and auxiliaries at the tanktop could be
divided up in a lower- and an upper engine room compartment. The lower
compartment will have a permeability of, for example, 60% and the upper
compartment a permeability of 95%. Depending on the level of accuracy required,
the engines and equipment could also be modelled individually as empty tanks.
Relative Density of Tank Fluids
Relative Density (Specific Gravity) values can be typed directly into the Relative
Density column of the Compartment Definition table.
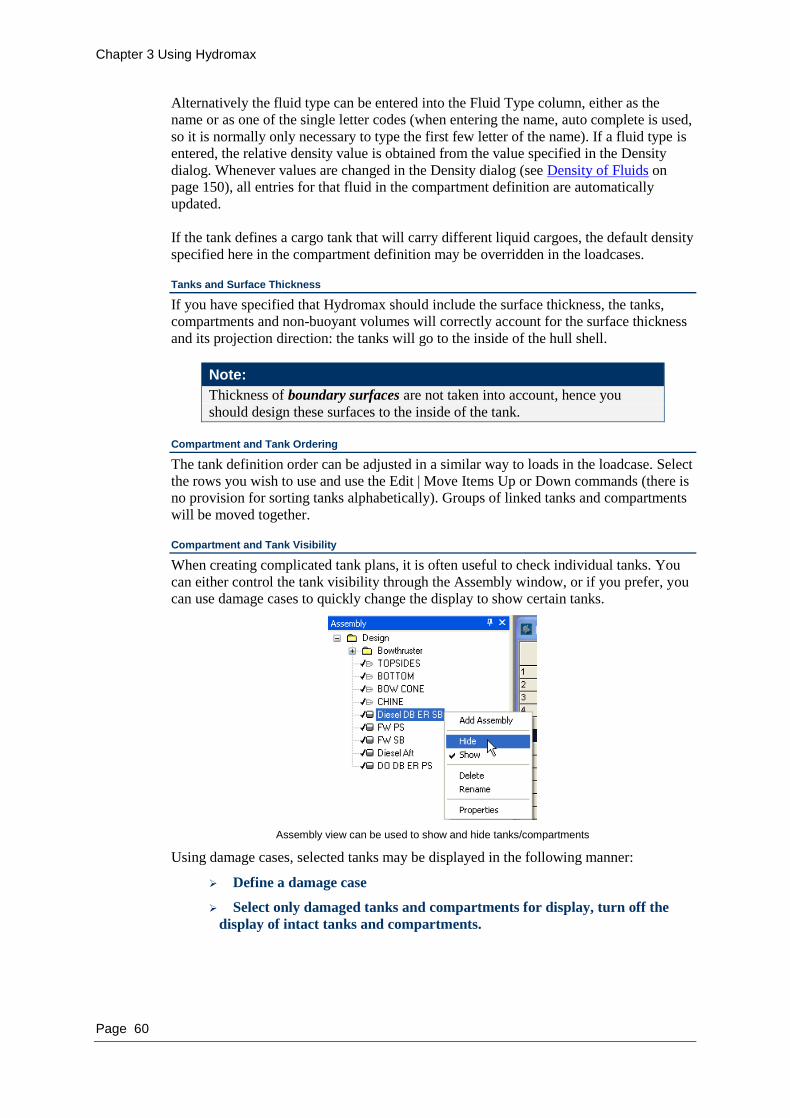
Chapter 3 Using Hydromax
Page 60
Alternatively the fluid type can be entered into the Fluid Type column, either as the
name or as one of the single letter codes (when entering the name, auto complete is used,
so it is normally only necessary to type the first few letter of the name). If a fluid type is
entered, the relative density value is obtained from the value specified in the Density
dialog. Whenever values are changed in the Density dialog (see Density of Fluids on
page 150), all entries for that fluid in the compartment definition are automatically
updated.
If the tank defines a cargo tank that will carry different liquid cargoes, the default density
specified here in the compartment definition may be overridden in the loadcases.
Tanks and Surface Thickness
If you have specified that Hydromax should include the surface thickness, the tanks,
compartments and non-buoyant volumes will correctly account for the surface thickness
and its projection direction: the tanks will go to the inside of the hull shell.
Note:
Thickness of boundary surfaces are not taken into account, hence you
should design these surfaces to the inside of the tank.
Compartment and Tank Ordering
The tank definition order can be adjusted in a similar way to loads in the loadcase. Select
the rows you wish to use and use the Edit | Move Items Up or Down commands (there is
no provision for sorting tanks alphabetically). Groups of linked tanks and compartments
will be moved together.
Compartment and Tank Visibility
When creating complicated tank plans, it is often useful to check individual tanks. You
can either control the tank visibility through the Assembly window, or if you prefer, you
can use damage cases to quickly change the display to show certain tanks.
Assembly view can be used to show and hide tanks/compartments
Using damage cases, selected tanks may be displayed in the following manner:
Define a damage case
Select only damaged tanks and compartments for display, turn off the
display of intact tanks and compartments.

Chapter 3 Using Hydromax
Page 61
Select whether you want to see the tank outline or the tank sections (tanks
sections are preferable when checking that tanks have been formed
correctly since it is these sections which are used to determine the tank
volume and other properties).
Choose the damage case from the Analysis toolbar
Set any of the tanks and compartments you wish to be visible to damaged
in the damage case window.
You can make the damage case window quite small and tile it next to the perspective
view. Use this to quickly turn tanks on and off by changing their damage status.
Using a damage case to quickly change the tank and compartment visibility
Tank sections
When in Tank Calibration mode, tank sections are also displayed in the Bodyplan view
when the “Show single section” option is selected. Only tank sections that lie on or near
the current station are shown – this makes it easier to verify that the tanks have been
formed.

Chapter 3 Using Hydromax
Page 62
Forming Compartments
Tanks and compartments are formed automatically by Hydromax (once the tank extents
and any boundary surfaces have been defined) by selecting Recalculate Tanks and
Compartments from the Analysis menu. The formed status of a tank (yes or no) is shown
in the last column of the compartment definition table.
This section describes the internal tank-forming process that Hydromax uses to form
tanks. First a step-by-step outline of the tank forming process is given, followed by the
tank section insertion process. Understanding these processes may assist you in rare
situations where the tank forming does not work as expected.
Step-by-Step Tank Forming Process
As an example, the starboard waterballast tank below will be created using boundary
surfaces.
An example of a port and starboard waterballast tank with a pipe tunnel at the centreline. The water ballast tanks have a margin plate on the side.
Hydromax uses three input items to form the compartment
Boundary surfaces (if defined)
Boundary box
Hydromax Hull sections
Starting position
The starboard tank margin plate is modelled using an Internal Structure surface from
Maxsurf.
Starting point: Hydromax Hull sections with an internal surface and a bounding box
Also see:
Modelling Tanks Using Boundary Surfaces on page 54 and the Maxsurf manual
on internal structure surfaces

Chapter 3 Using Hydromax
Page 63
Step 1: Close Internal Structure Surface
Hydromax will close the Internal Structure Surface contour by drawing a straight line between the ends of the opening.
Hydromax uses the same method for forming the tank section from the boundary
surfaces as for forming the hydrostatic sections through the hull. As with the hull
sections, the surfaces selected to form the tank boundary must form closed section
contours at all longitudinal positions through the tank. The area inside the selected
surfaces will define the tank contour.
Make sure that the boundary surfaces:
Form a closed section contour, or
There is no more than one opening – the opening will be closed with a straight line
Note:
Hydromax will close the section contour of the selected boundary surfaces
only. Often a tank is not formed as expected because only one side of the
internal structure surface was selected for example the portside (p).
Another common cause of unexpected results is trimming. If you selected
“use trimmed surfaces” while opening the Maxsurf model, Hydromax will
use the trimmed internal structure surface. Usually the internal structure
surfaces are best to be left untrimmed.
Step 2: Clip to Boundary Surface
Using the closed surface section contour Hydromax can now form a closed compartment
section. The tank or compartment looks like this at this stage:

Chapter 3 Using Hydromax
Page 64
Step 3: Clip to Hull
Hydromax will clip the compartment section to the hull.
Step 4: Clip to Boundary Box
Finally the compartment section is clipped to the boundary box. The boundary box is
formed from the numerical input in the Compartment definition table.
More realistic surface-bounded tanks
Whilst the above example shows the principles by which surface-bounded tanks are
formed, it is not really realistic because it would not be possible to define a tank above
the surface-bounded double bottom tanks. In practice additional surfaces would be
required. A more realistic example is shown in the following section.
In this example the vessel has both wing and double bottom tanks with non-rectangular
cross-sections thus requiring them to be defined by boundary surfaces – see blow:
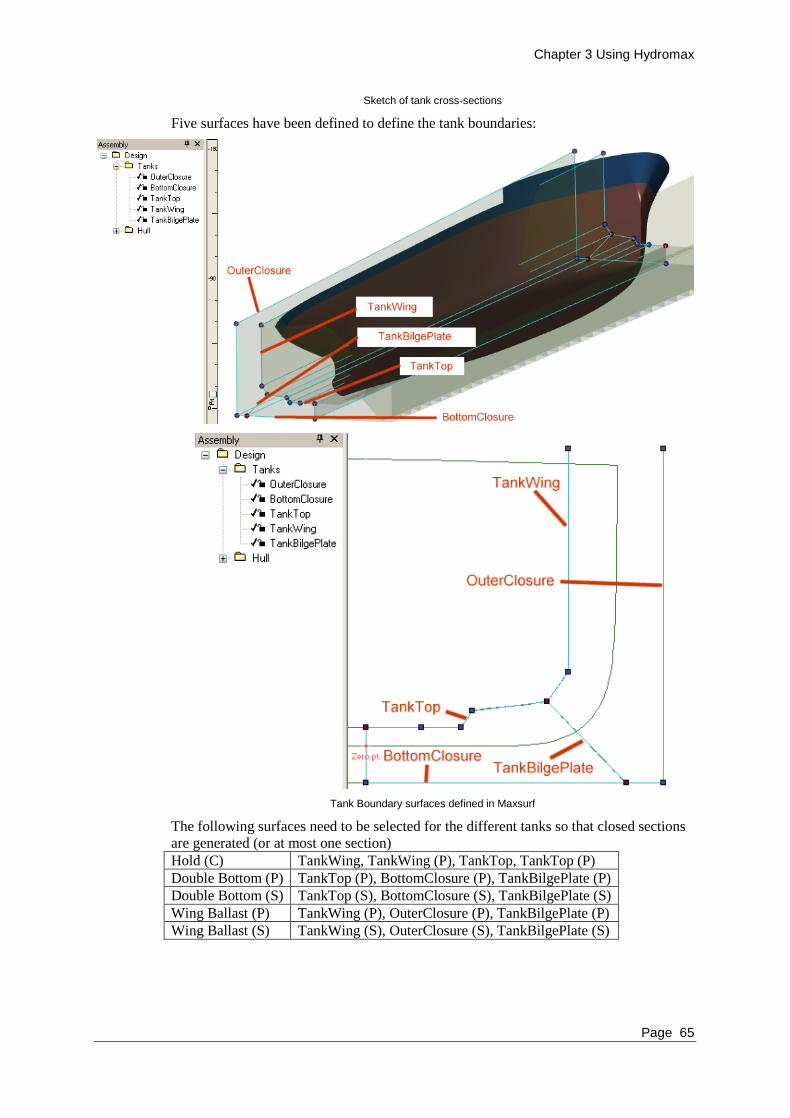
Chapter 3 Using Hydromax
Page 65
Sketch of tank cross-sections
Five surfaces have been defined to define the tank boundaries:
Tank Boundary surfaces defined in Maxsurf
The following surfaces need to be selected for the different tanks so that closed sections
are generated (or at most one section)
Hold (C) TankWing, TankWing (P), TankTop, TankTop (P)
Double Bottom (P) TankTop (P), BottomClosure (P), TankBilgePlate (P)
Double Bottom (S) TankTop (S), BottomClosure (S), TankBilgePlate (S)
Wing Ballast (P) TankWing (P), OuterClosure (P), TankBilgePlate (P)
Wing Ballast (S) TankWing (S), OuterClosure (S), TankBilgePlate (S)
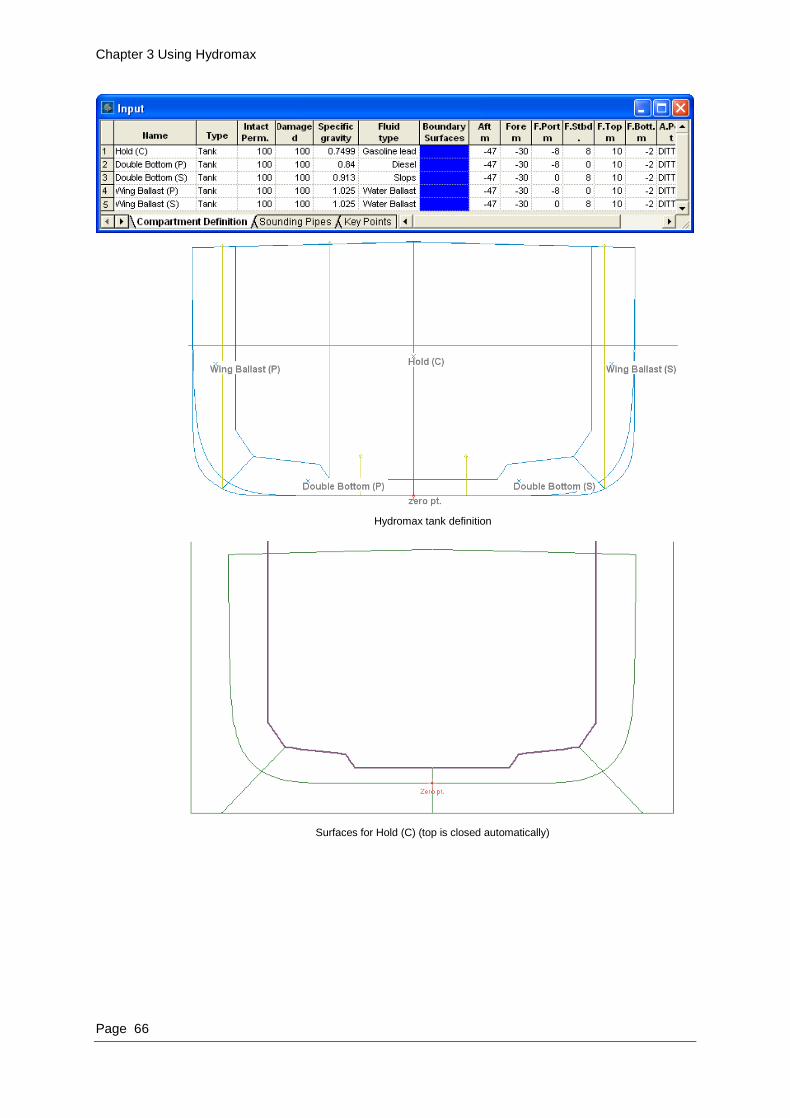
Chapter 3 Using Hydromax
Page 66
Hydromax tank definition
Surfaces for Hold (C) (top is closed automatically)

Chapter 3 Using Hydromax
Page 67
Surfaces for double bottom tanks
Surfaces for wing tanks (top is closed automatically)
Number of Sections in Tanks
The volume of a tank or compartments is calculated by integrating section properties
along the length of the tank. Thus it is important to have a sufficiently large number of
sections to accurately model the tank. Hydromax will normally place twelve sections
between the forward and aft limits defining the tank. If this results in a section spacing
greater than the spacing for the hull spacing, additional sections will be inserted into the
tank so that the tank section spacing match the hull section spacing.
Also see
Longitudinal Extents of Boundary Box on page 67
Longitudinal Extents of Boundary Box
For tanks near the ship‟s extremities it is good practise to set the “Fore” and “Aft” limits
in the compartment table to just inside the hull surface (say 1mm). In most cases, this
will be done automatically by Hydromax. The following example illustrates why:

Chapter 3 Using Hydromax
Page 68
If the boundary box is set like this:
The number of hull sections is dependent on the section spacing in the model.
But if the boundary box is set just inside the forward limit of the bulbous bow:
To recap – Near the ship‟s extremities, the longitudinal extents should not be set to
extreme values, they should be set to just inside the extents of the hull surfaces to ensure
that at least 12 sections are used to calculate the tank volumes.
For internal structure surfaces that are used as boundary surface, Hydromax will
automatically set the “Fore” and “Aft” limits of the boundary box to just within the
longitudinal limits of the boundary surface. This ensures that at least 12 sections are
inserted in the tank.
Note that transversely and vertically there are no such restrictions.
Also see
Number of Sections in Tanks on page 67
Forming Compartments on page 62
Compartment Types
Five compartment types can be created using the Compartment Definition table - tanks,
linked tanks, compartments, linked compartments and non-buoyant volumes.
Chapter 3 Using Hydromax
Page 69
Tanks
Will be included in the tank calibration output and are automatically added to the
loadcase.
Linked Tanks
Will have their volume added to the parent tank with the same tank name. They do
not have a separate entry in the loadcase. In addition, if a tank is damaged, any
tank that it is linked to will also be regarded as damaged. Tanks need not be
adjoining to be linked, they can be remote from one another. In this case the tank
linking simulates tanks with cross connections.
Compartments
Are only used to specify compartmentation for damage. They are not included in
the tank calibration output and will not be added to the loadcase.
Linked Compartments
Work in the same way as linked tanks. This allows you to damage a complex
compartment configuration by linking compartments together and damaging the
parent compartment.
Non-Buoyant Volumes
Are only used to specify compartments of the vessel which are permanently
flooded up to the static waterline. They are ideal for defining water-jet ducts,
moon pools, etc. and essentially behave as damaged compartments. They are not
included in the tank calibration output and will not be added to the loadcase.
To change the type of a tank, type the first character of the tank type (t, c or n) in the
Type column of the Compartment Definition table and then press Enter. This will
automatically set the tank/compartment to the correct type.
Sounding Pipes
Hydromax allows sounding pipes to be defined for each tank. One sounding pipe per
tank is permitted and up to nine vertices per sounding pipe, allowing inclined, bent or
curved sounding pipes to be modelled.
Hydromax creates a default sounding pipe when the tank is formed (either by running an
analysis, or using one of the following commands: Analysis | Recalculate Tanks and
Compartments; or Analysis | Update Loadcase. The default sounding pipe is placed at
the longitudinal and transverse position of the lowest point of the tank. If the lowest
point of the tank is shared between several locations (e.g. the bottom of the tank is flat
either longitudinally or transversely) the default sounding pipe location is placed at the
aft-most low point and as close to the centreline as possible. The top of the sounding
pipe is taken to be level with the highest point of the tank and the default sounding pipe
is assumed to be straight and vertical. Automatically created sounding pipes will be
recalculated if the tank geometry changes. However, once the sounding pipe has been
edited manually, any changes to the sounding pipe due to tank geometry changes will
also have to be made manually.
Edit Sounding Pipes
To customise a sounding pipe, you need to use the Sounding Pipes table in the Input
window, shown below.

Chapter 3 Using Hydromax
Page 70
You can activate this window by selecting from the Windows | Input | Sounding Pipes
menu, by clicking on the tabs at the bottom of the Input window, or by clicking on the
icon in the window toolbar.
To add vertices to create a bent sounding pipe, make the sounding pipe type User
Defined, then click on the first row of a particular sounding pipe and choose Edit | Add
or use the Ctrl+A key combination. A new row will be added to the sounding pipe and
the longitudinal position, offset and height of the vertex can be edited. Unwanted
vertices can be deleted by clicking on the relevant row in the table and selecting Edit |
Delete or by hitting the Delete key. Note that each successive vertex in a sounding pipe
must be no higher than the previous vertex i.e. it is not acceptable to have S-bends in the
sounding pipes.
Calibration Increment
Hydromax allows user definable increments (or: intervals) for tank soundings. This is
done by specifying a numerical value for the increment for each tank in the Calibration
Spacing column of the Sounding Pipes Input window.
Type the value of the desired calibration increment in the Calibration
Spacing cell for the tank calibration you wish to modify.
If no increment is entered, Hydromax uses its default value based on a reasonable
division of the depth of the tank. In this case the Sounding Pipes table will display
“Auto” in the Calibration Increment column for the tank.

Chapter 3 Using Hydromax
Page 71
Note
Increments are measured along the sounding pipe, not along the vertical
axis of the tank. If the sounding pipe is inclined or if it has multiple angles,
soundings will step evenly along the inclined length of the sounding pipe.
Damage Case Definition
In all but the floodable length and tank calibration analysis modes, Hydromax is capable
of including the effects of user-defined damage. Hydromax allows the user to set up a
number of damage cases. Volumes that are permanently flooded should be defined as
non-buoyant volumes.
Adding a Damage Case
To add a damage case, make the Damage window active and select Add Damage Case
from the Case menu. You may specify a name for the Damage Case in the dialog. Each
new damage case will have a column in the Damage Window and a tick may be placed
to indicate which tanks and compartments are damaged for that particular Damage Case.
The new damage case is added after the currently selected damage case column, to insert
a damage case immediately after the intact case, select the intact case column. Several
damage cases may be added in one go by selecting a number of columns.
Deleting a Damage Case
To delete damage cases, simply select the columns to be deleted in the Damage Window
and select Delete Damage Case from the Case menu. Note that it is not possible to delete
the intact case.
Renaming a Damage Case
The name of the current damage case may be changed by selecting Edit Damage Case
when the damage case window is active, the current damage case is selected from the
Analysis toolbar – see below.

Chapter 3 Using Hydromax
Page 72
Selecting a Damage Case
The current damage case is selected from the Analysis toolbar.
The Loadcase and View windows will reflect the damage defined in the current damage
case. To perform analyses for the intact vessel, select Intact as the current damage case.
Any subsequent analyses will take into account the damaged compartments. Note that
carrying out a Tank Calibration analysis will force the intact case to be selected. This is
also the case for the Floodable Length analysis which effectively sets up its own
longitudinal extent of damage.
When tanks have been damaged, their weights and levers are no longer displayed in the
Loadcase window and the word „Damage‟ is displayed in the quantity column. This is
because Hydromax uses the “Lost buoyancy” method rather than “Added mass”.
Note:
Hydromax uses the “Lost buoyancy” method rather than “Added mass”.
Flooding is considered to be instantaneous up to sea level. Any tank fluids
are treated as having been completely replaced by seawater up to the
equilibrium waterline.
Hydromax assumes that all compartment definition has been done after the
tanks have been defined. If you have linked tanks or compartments or added
tanks within compartments after the definition of a damage case, you should
toggle the damage status of the damaged tanks. This is simply done by
copying all the damage case data to a spread sheet, turning off all damage in
all the damage cases (use the fill down command) and then pasting back in
the original data from where it was stored in the spreadsheet.
Displaying Damage Cases
When a damage case is selected, all damaged tanks and compartments will be displayed
in damaged tank or damaged compartment colour respectively. These colours can be
specified in the View | Colours and lines menu.
In the Loadcase Window damaged tanks are displayed with the label 'Damaged' in the
Quantity column, and all values set to zero.

Chapter 3 Using Hydromax
Page 73
The Loadcase Window displays damaged tanks and excludes them from any calculations.
Extent of Damage Cases
The damaged compartments can automatically be set by using the Case | Extent of
damage command. Select the column of the damage case you wish to specify the extent
of damage for and choose Extent of Damage from the case menu:

Chapter 3 Using Hydromax
Page 74
Defining the damaged compartments by specify the extent of damage.
Specify the extent of the damage – any tanks or compartments that lie partially or wholly
within the extent of damage will be automatically flagged as damaged:
Automatically generated damage case from using Extent of Damage command.
Key Points (e.g. Down Flooding Points)
Key points such as downflooding points and hatch openings can be defined in Hydromax
using the Key Points window. The points may be displayed in the Design View window
and will be displayed in different colours depending on whether or not they are
immersed. Immersed key points will be displayed in the same colour as flooded tanks or
compartments.
Key points may be placed asymmetrically, a positive offset is to starboard and a negative
offset is to port. Vessels which have symmetrical key points on starboard and port sides
must have both key points added to the table.
There are several types of Key Points:
Down Flooding points
Potential Down flooding points
Embarkation points
Immersion Points
Only downflooding points are used in determining the downflooding angle, which is
used in criteria evaluation. The other types of points have their freeboard measured but
are not used for the evaluation of the downflooding angle and are for information only.
Adding Key Points
To start adding downflooding points go to the Key Points table, select New Key Points
from the File menu. You will be given a default point. To add additional key points to
the table, choose Add from the Edit menu or press Ctrl+A. A new point will be inserted
below the currently selected row in the table.
Deleting Key Points
To delete a Key point, click anywhere in the row of the point to be deleted and select
Delete. To delete more than one point at a time, click and drag over the rows you want
deleted.

Chapter 3 Using Hydromax
Page 75
Select Delete from the Edit menu, and the selected rows will be deleted.
Editing Key Points
Key points are defined by entering a name, a longitudinal position, a transverse offset
from the centreline, and a height. Click in any cell and enter the name or value you
require. All points are entered relative to the zero point.
The type of Key Point may be selected from the combo-box in the Type column of the
Down Flooding Points table in the Input window:
Links to Tanks or Compartments
Downflooding points may be linked to tanks or compartments. Select the tank or
compartment from the combo-box in the Linked to column of the Down Flooding Points
table in the Input window:
Downflooding points that are linked to tanks or compartments, which are damaged in the
currently selected damage case, will be ignored when computing the downflooding
angle. These downflooding points will appear italicised and an asterisk (*) is postfixed to
the downflooding point‟s name in the DF Angles table of the Results window:

Chapter 3 Using Hydromax
Page 76
The downflooding angles for each of the points are displayed in the results window. The
downflooding angles are computed during a large angle stability analysis; the freeboards
after an Equilibrium or Specified Condition analysis. Immersed points are highlighted in
red in the Freeboard column. In addition to the Key Points results, immersion angles or
freeboards (depending on the analysis) are also given for the margin line and deck edge.
In the Name column the longitudinal position where immersion first takes place (or the
lowest freeboard) is given.
Note:
Linking a downflooding point to a tank does not mean that Hydromax will
consider a tank damaged when the downflooding point is submerged. This
form of automatic flooding is not supported in Hydromax yet.
Margin Line Points
The margin line is used in a number of the criteria. Hydromax automatically calculates
the position of the margin line 76mm below the deck edge when the hull is first read in.
If necessary, the points on the margin line may be edited manually in the Margin Line
Points window (the deck edge is automatically updated so that it is kept 76mm above the
margin line).
It is only necessary to modify the height value of the margin line points. Once this has
been done for all the points that need to be changed, selecting Snap Margin Line to Hull
in the Analysis menu will project all of the points horizontally onto the hull surface,
ensuring that the margin line follows the hull shape precisely. Asymmetric margin lines
and deck edges are not supported.
Points may be added or deleted as required using the procedure described in Adding Key
Points and Deleting Key Points on page 74.
Modulus Points and Allowable Shears and Moments
The Modulus window can be used to enter maximum allowable shear forces and bending
moments for each section. One or more points can be entered in this window. Allowable
shear force and/or bending moment can be specified at each point. The modulus value is
not currently used as deflections are not calculated.

Chapter 3 Using Hydromax
Page 77
To start a table of allowable shear forces and bending moments, bring the Modulus table
to the front and choose New Modulus Points from the File menu with the Modulus
window frontmost. The allowable values can be saved and recalled as text files by using
Open and Save from the File menu. New allowable values can be inserted by selecting
Add from the Edit menu and entering a longitudinal position as well as an allowable
shear and/or moment.
Points may be added or deleted as required using the procedure described for the key
points.
These allowable values are displayed as lines on the longitudinal strength graph.
Floodable Length Bulkheads
Bulkheads entered in the Input window are used for Floodable Length analysis in order
to optionally plot the compartment lengths in the floodable length graph for easy
verification that the critical compartment lengths are not exceeded.
The Bulkheads are automatically sorted by longitudinal position. For more information
see Floodable Length on page 102.
Stability Criteria
Stability criteria may be evaluated after a Large Angle Stability analysis and after an
Equilibrium analysis. Stability criteria are required to perform a limiting KG and
Floodable Length analysis. Please refer to Chapter 4 Stability Criteria starting at page
163 for information on defining and selecting criteria.
Analysis Types
After specifying the input values and checking the Hydromax model, the analysis can be
performed. In this section the different analysis types available in Hydromax will be
described.
The following analysis types are available in Hydromax:
Upright Hydrostatics
Large Angle Stability
Equilibrium Analysis
Specified Conditions
KN Values Analysis
Limiting KG
Floodable Length
Longitudinal Strength
Tank Calibrations
MARPOL Oil Outflow
Probabilistic Damage
Also, some general information is given on:

Chapter 3 Using Hydromax
Page 78
Starting and Stopping Analyses
Batch Analysis
The required analysis settings and environment options will be discussed separately and
in more detail in the next two sections of this chapter.
Following each analysis, one or more graphs may be shown – select the graph to be
displayed from the pull-down menu in the Graph window. The Data Format dialog can
be used to specify what is displayed in some graphs and tables; the available options
depends on the current results table or graph:
Data format dialog for Upright hydrostatics table and graph
Upright Hydrostatics
Upright hydrostatics lets you determine the hydrostatic parameters of the hull at a range
of drafts, at zero or other fixed trim.
Choosing Upright Hydrostatics
Select Upright Hydrostatics from the Analysis Type option in the Analysis menu or
toolbar.
Upright Hydrostatic Analysis Settings
The following analysis settings apply for Upright Hydrostatic Analysis:
Draft from the Analysis menu, specify range of drafts for analysis
Trim from the Analysis menu, you may specify a fixed trim for all drafts
A range of drafts for upright hydrostatic calculations can be specified using the Drafts
command from the Analysis menu.

Chapter 3 Using Hydromax
Page 79
Initial and final drafts can be entered, together with the number of drafts to be used. The
Vertical Centre of Gravity is also required for the calculation of GM etc (if the vessel is
trimmed, the LCG also affects these measurements).
When a design is first opened, the initial draft defaults to the draft at the DWL in
Maxsurf. Similarly the VCG defaults to the height of the DWL.
Upright Hydrostatics Environment Options
The following environments can be applied to the upright hydrostatics analysis:
Density from the Analysis menu
Wave Form (if any)
Damage (or Intact) from the Analysis toolbar
Upright Hydrostatic Results
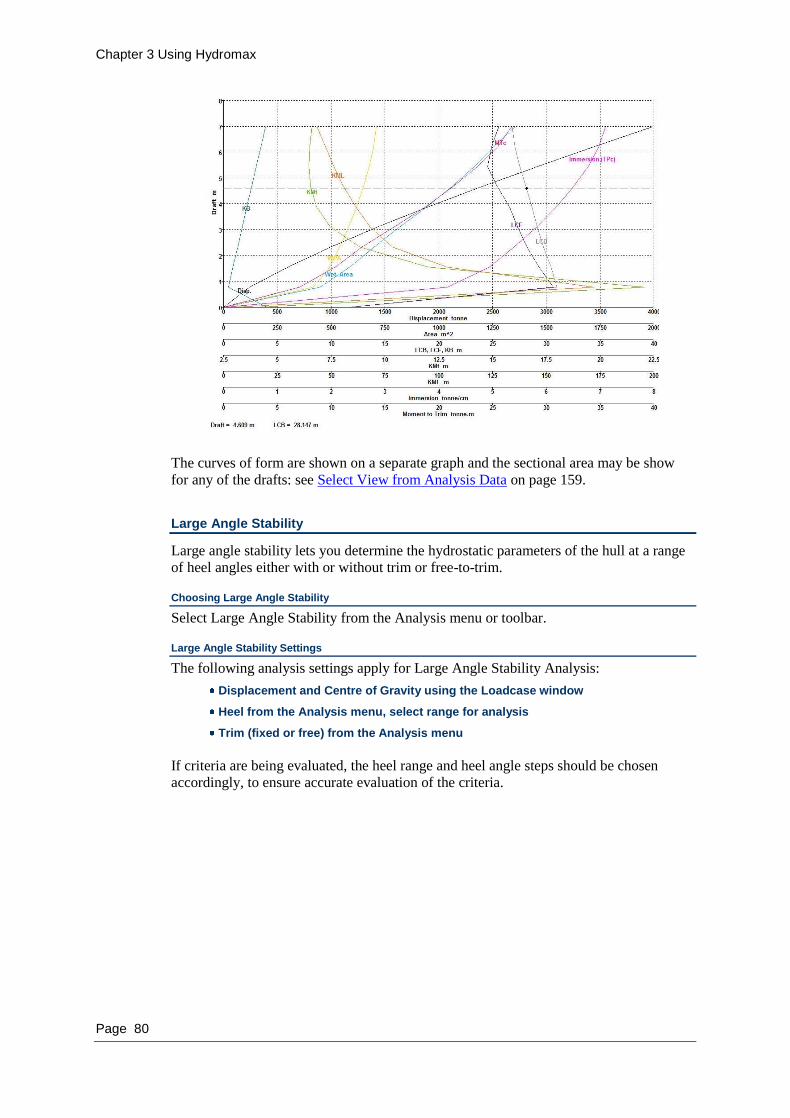
Chapter 3 Using Hydromax
Page 80
The curves of form are shown on a separate graph and the sectional area may be show
for any of the drafts: see Select View from Analysis Data on page 159.
Large Angle Stability
Large angle stability lets you determine the hydrostatic parameters of the hull at a range
of heel angles either with or without trim or free-to-trim.
Choosing Large Angle Stability
Select Large Angle Stability from the Analysis menu or toolbar.
Large Angle Stability Settings
The following analysis settings apply for Large Angle Stability Analysis:
Displacement and Centre of Gravity using the Loadcase window
Heel from the Analysis menu, select range for analysis
Trim (fixed or free) from the Analysis menu
If criteria are being evaluated, the heel range and heel angle steps should be chosen
accordingly, to ensure accurate evaluation of the criteria.

Chapter 3 Using Hydromax
Page 81
Note
You can select positive heel direction (port or starboard). However, you can
enter negative values and test full 360 degrees of stability if you wish. Some
criteria require calculations of GZ at negative heel. The criteria are only
evaluated on the side of the graph that corresponds to positive heel angles.
For example: when using a -180 to 180 heel range, the results may be two
angles of vanishing stability, the one that would be reported in the criteria
would be the one with a positive heel angle (even if the one at negative heel
occurred at an angle closer to zero).
Also see: Heel on page 141 in the Analysis Settings section.
Large Angle Stability Environment Options
The following environments can be applied to the large angle stability analysis:
Fluid simulation of tank fluids centre of gravity
Density
Wave Form (if any)
Damage (or Intact) from the Analysis toolbar
Stability Criteria
Large Angle Stability Results
Large Angle Stability Analysis results are:
Hydrostatic data table for each angle of heel
GZ curve
Dynamic stability (GZ area) curve
Graph of hydrostatic parameters against heel angle
Graph of max. safe steady heel angle
Stability Criteria evaluation
Downflooding angles to key points, deck edge and margin line
Curve of areas at each heel angle

Chapter 3 Using Hydromax
Page 82
Dynamic stability Graph A graph of the GZ area integrated from upright may be plotted, features such as
downflooding angle are also included on the graph.
Curve of Areas Shows the curve of areas for the currently selected heel angle (use Display | Select
view from data to chose the heel angle from the GZ results table).
Large Angle stability Graph; Curves of Form;
Shows the variation of hydrodynamic properties with heel angle.
Graph of maximum safe steady heeling angles for sailing vessels
These calculations are derived from the value of GZ at a critical heel angle, for
example the angle of downflooding or angle of deck edge immersion.
Once a GZ curve has been calculated, you can display the maximum safe heeling
angle curves by selecting the graph type in the pull-down menu.

Chapter 3 Using Hydromax
Page 83
The parameters for the calculation can be modified in the Display | Data Format
dialog (this graph must be selected in the topmost window):
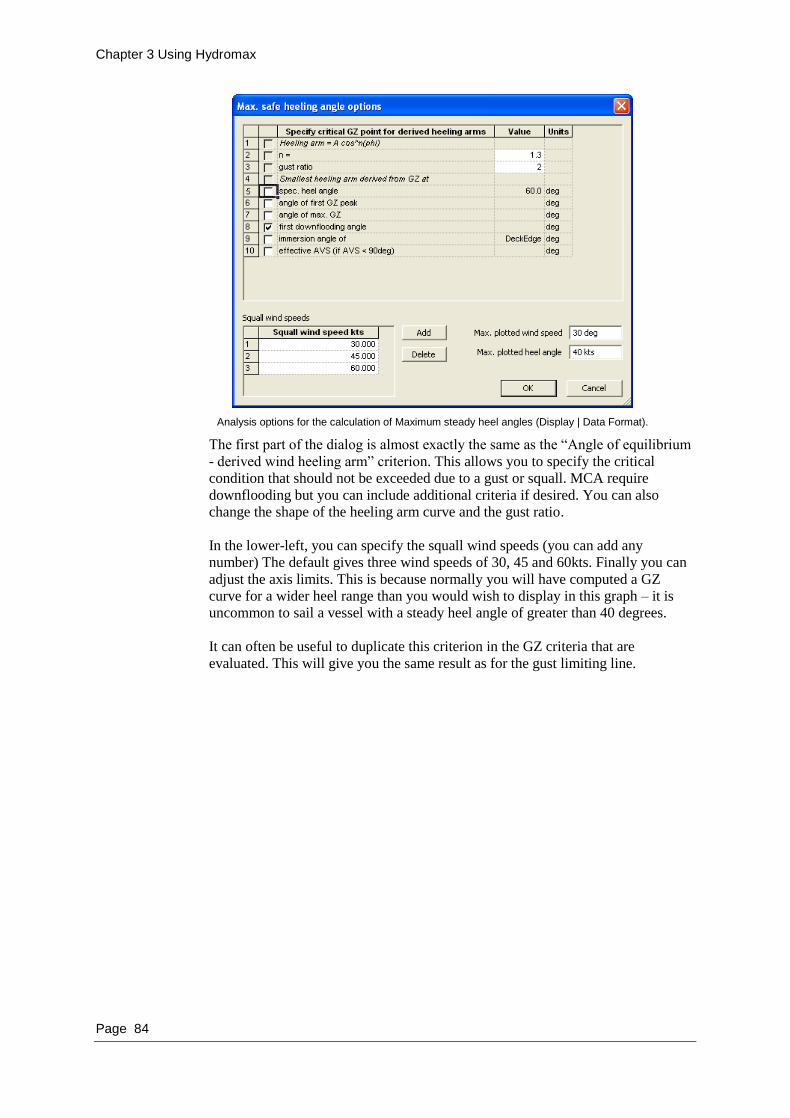
Chapter 3 Using Hydromax
Page 84
Analysis options for the calculation of Maximum steady heel angles (Display | Data Format).
The first part of the dialog is almost exactly the same as the “Angle of equilibrium
- derived wind heeling arm” criterion. This allows you to specify the critical
condition that should not be exceeded due to a gust or squall. MCA require
downflooding but you can include additional criteria if desired. You can also
change the shape of the heeling arm curve and the gust ratio.
In the lower-left, you can specify the squall wind speeds (you can add any
number) The default gives three wind speeds of 30, 45 and 60kts. Finally you can
adjust the axis limits. This is because normally you will have computed a GZ
curve for a wider heel range than you would wish to display in this graph – it is
uncommon to sail a vessel with a steady heel angle of greater than 40 degrees.
It can often be useful to duplicate this criterion in the GZ criteria that are
evaluated. This will give you the same result as for the gust limiting line.

Chapter 3 Using Hydromax
Page 85
The same safe angle of heel to prevent downflooding in the event of a gust (16.5 deg) is found.
To obtain smooth curves, the GZ curve should be calculated at small intervals of
heel, especially at the lower heel angles – typically steps of 1degree. Under some
circumstances, it may not be possible to evaluate the curves, the most common
reason for this is that the GZ curve has not been calculated up to a sufficiently
high angle of heel and downflooding angle cannot be found.
Full details of the calculations can be found in:
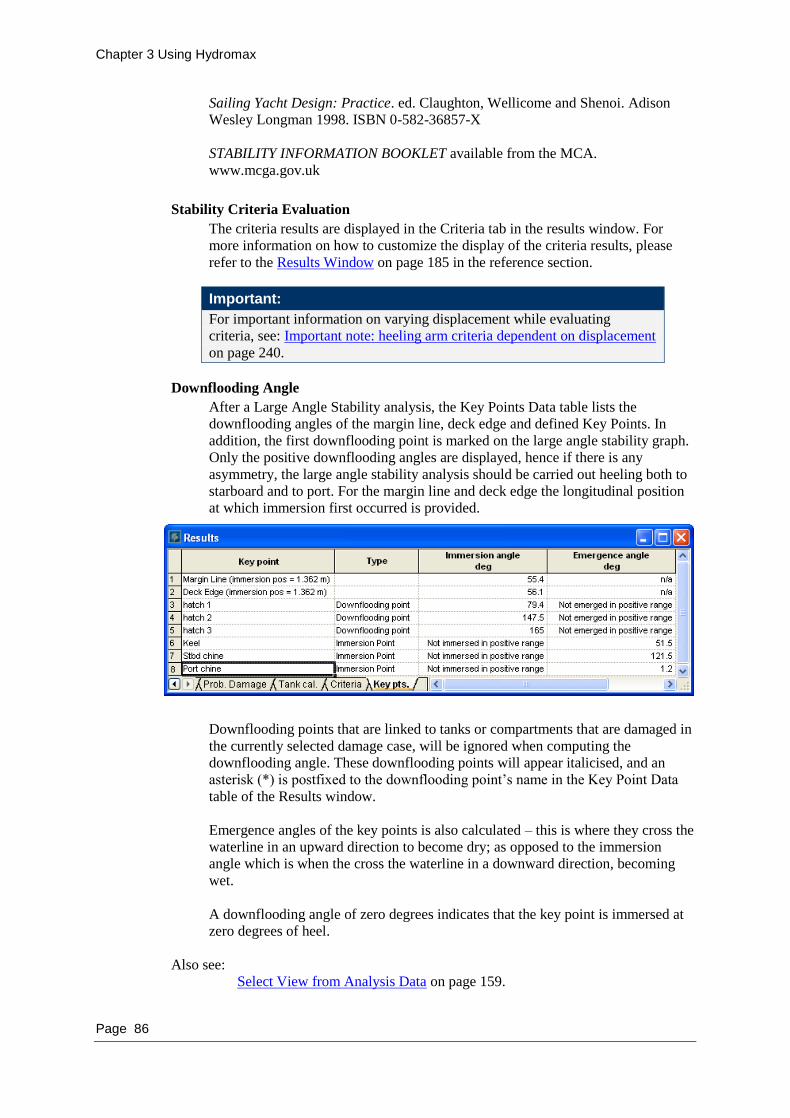
Chapter 3 Using Hydromax
Page 86
Sailing Yacht Design: Practice. ed. Claughton, Wellicome and Shenoi. Adison
Wesley Longman 1998. ISBN 0-582-36857-X
STABILITY INFORMATION BOOKLET available from the MCA.
www.mcga.gov.uk
Stability Criteria Evaluation
The criteria results are displayed in the Criteria tab in the results window. For
more information on how to customize the display of the criteria results, please
refer to the Results Window on page 185 in the reference section.
Important:
For important information on varying displacement while evaluating
criteria, see: Important note: heeling arm criteria dependent on displacement
on page 240.
Downflooding Angle
After a Large Angle Stability analysis, the Key Points Data table lists the
downflooding angles of the margin line, deck edge and defined Key Points. In
addition, the first downflooding point is marked on the large angle stability graph.
Only the positive downflooding angles are displayed, hence if there is any
asymmetry, the large angle stability analysis should be carried out heeling both to
starboard and to port. For the margin line and deck edge the longitudinal position
at which immersion first occurred is provided.
Downflooding points that are linked to tanks or compartments that are damaged in
the currently selected damage case, will be ignored when computing the
downflooding angle. These downflooding points will appear italicised, and an
asterisk (*) is postfixed to the downflooding point‟s name in the Key Point Data
table of the Results window.
Emergence angles of the key points is also calculated – this is where they cross the
waterline in an upward direction to become dry; as opposed to the immersion
angle which is when the cross the waterline in a downward direction, becoming
wet.
A downflooding angle of zero degrees indicates that the key point is immersed at
zero degrees of heel.
Also see:
Select View from Analysis Data on page 159.
Chapter 3 Using Hydromax
Page 87
Equilibrium Analysis
Equilibrium analysis lets you determine the draft, heel and trim of the hull as a result of
the loads applied in the table in the Loadcase window. The analysis can be carried out in
flat water or in a waveform.
Choosing Equilibrium Analysis
Select Equilibrium from the Analysis Type option in the Analysis menu.
Equilibrium Analysis Settings
Displacement and Centre of Gravity using the Loadcase window
Also see:
Setting the Frame of Reference on page 18
Equilibrium Analysis Environment Options
The following environments can be applied to the Equilibrium analysis:
Fluid simulation of tank fluid centre of gravity
Density
Wave Form (if any)
Damage (or Intact) from the Analysis toolbar
Grounding (if any)
Criteria
Equilibrium Results
Equilibrium Results are:
Hydrostatic data
Freeboard of key points, deck edge and margin line
Criteria evaluation
Wave phase animation
Curve of areas

Chapter 3 Using Hydromax
Page 88
Hydrostatic data
Height/freeboard above free surface
The freeboard of each Key Point is also calculated. The freeboard is for the vessel
condition currently displayed in the Design view and is recalculated after each
Equilibrium and Specified Conditions analysis. The freeboard calculated is the
vertical distance of the Key Point above the local free surface; hence the local free
surface height if a waveform is selected will be taken into account.
Freeboard of key points.
Negative freeboards, i.e. where the Key Points are immersed are displayed in red.
The longitudinal positions at which the minimum freeboard for the margin line
and deck edge occurred are also specified.
Stability Criteria Evaluation
The criteria results are displayed in the Criteria tab in the results window.

Chapter 3 Using Hydromax
Page 89
Equilibrium Animation in Waves
If performed in conjunction with analysis in waves, the Equilibrium analysis will
automatically phase-step the waveform through a complete wavelength. This gives
ten columns of results, one for each position of the wave crest. If necessary the
results of this phase stepping can be animated giving a simple, quasi-static
simulation of the hull motion in waves (Display | Animate).
Note:
This simulation only includes static behaviour at each wave phase, and does
not cover dynamic or inertial forces. This can be done using Seakeeper.
Equilibrium Concept
The definition of equilibrium is “Position or state where object will remain if
undisturbed”. You can distinguish equilibrium into two types:
Stable, when disturbed the object will return to its equilibrium position
Unstable, when disturbed the object will not return to its equilibrium position
With ships, an unstable equilibrium can exist when the KG > KM, i.e. the centre of
gravity is above the metacentre (negative GMt). In real world a ship in unstable
equilibrium will roll from the upright unstable equilibrium position to a position of stable
equilibrium and assume an “angle of loll”. Since Hydromax starts the equilibrium
analysis in upright position, it has no way of determining whether the equilibrium is
stable or unstable. This means that unstable equilibrium may be found instead of the
stable equilibrium. Therefore it is recommend to check the value of GMt yourself after
doing an equilibrium analysis or perform a Large Angle Stability analysis and look at the
slope of the GZ curve through the equilibrium heel angle.
Stable equilibrium Unstable equilibrium

Chapter 3 Using Hydromax
Page 90
Unstable equilibrium
Stable equilibrium
”Angle of loll”
The graph above shows the results of a Large Angle Stability analysis for a vessel with
negative initial GMt. In practice this vessel would have a loll angle of approximately 25
degrees. If an equilibrium analysis is performed for this vessel with the transverse arm
set to zero, Hydromax will find the unstable equilibrium position with zero degrees of
heel.
In practice, it is desirable to find the stable equilibrium position. To do this, first ensure
that the tolerances (Edit | Preferences) are set as sensitive as possible. This will ensure
that the smallest possible heeling moment is required to find stable equilibrium position.
Then create a very small heeling moment by offsetting one of the weight items in the
loadcase window TCG by just a fraction. The equilibrium analysis will now find the
stable equilibrium position.
Note:
It is good practice to always perform a Large Angle Stability analysis as
well as the equilibrium analysis to check if the vessel is in stable or unstable
equilibrium. This is most likely to occur if the VCG is too high and the
vessel has negative GM when upright. The problem can be overcome by
offsetting the weight of the vessel transversely by a small amount.
Specified Conditions
Specified Condition analysis lets you determine the hydrostatic parameters of the vessel
by specifying the heel, trim and immersion. Heel can be specified by either the angle of
heel or the TCG and VCG. Trim can be specified by the actual trim measurement, or the
LCG and VCG. Immersion can be specified by either the displacement or the draft.
Choosing Specified Conditions
Select Specified Conditions from the Analysis Type option in the Analysis menu or
toolbar.

Chapter 3 Using Hydromax
Page 91
Specified Conditions Settings
The settings required for Specified Condition analysis are:
Specified Conditions from the Analysis menu
Three Sets of variables are provided, labelled Heel, Trim and Immersion. One choice
must be made from each of these groups. Hydromax will then solve for the vessel
hydrostatics at the conditions specified.
Values from the current loading condition can be inserted into the Centre of Gravity and
Displacement fields by clicking on the Get Loadcase Values button.
Also see:
Setting the Frame of Reference on page 18
Specified Conditions on page 145 in the Analysis Settings section.
Note:
If the fluid simulation has been turned on in a previous analysis mode, then
the VCG obtained from the loadcase will not include the free surface
correction; the “Get Loadcase Values” button will return exactly the
displacement and CG as displayed in the current loadcase window.
The specified condition analysis itself ignores tank fillings and does no
correction to VCG.
Specified Conditions Environment Options
The following environments can be applied to the Specified Condition analysis:
Density
Wave Form (if any)
Damage (or Intact) from the Analysis toolbar
Specified Conditions Results
The specified conditions results are the same as equilibrium analysis results except that
criteria are not evaluated, i.e. hydrostatic data and key points freeboard are calculated.
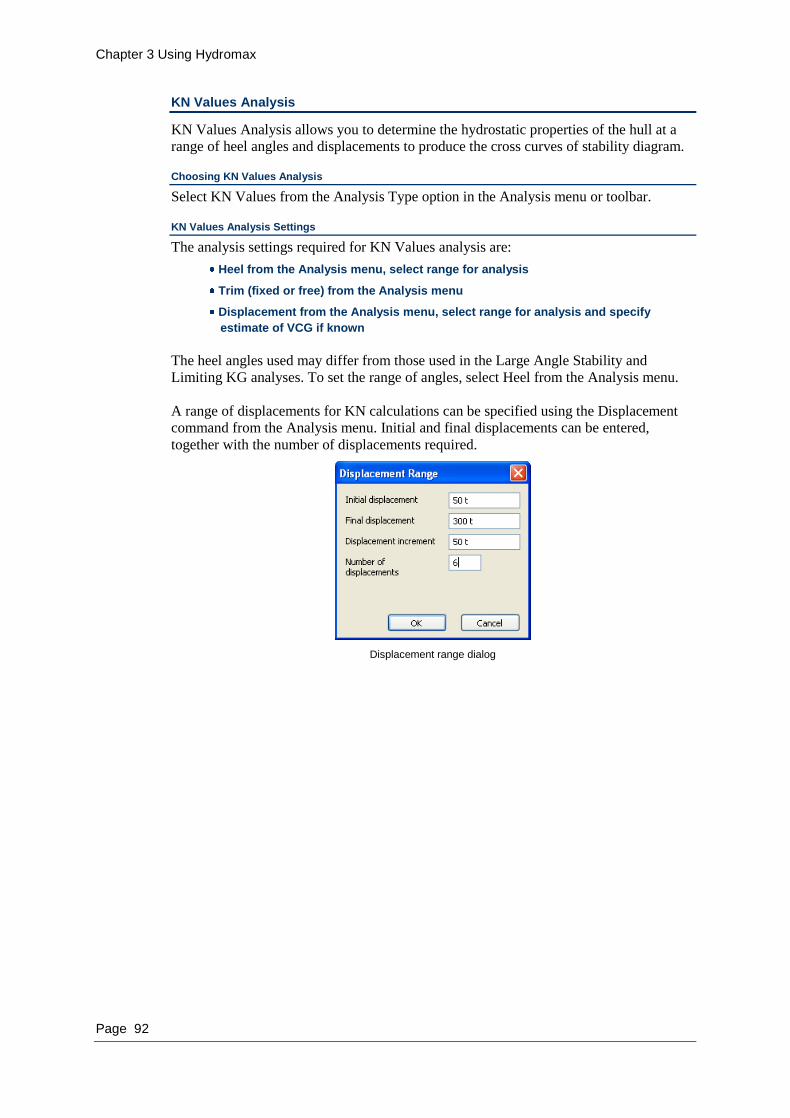
Chapter 3 Using Hydromax
Page 92
KN Values Analysis
KN Values Analysis allows you to determine the hydrostatic properties of the hull at a
range of heel angles and displacements to produce the cross curves of stability diagram.
Choosing KN Values Analysis
Select KN Values from the Analysis Type option in the Analysis menu or toolbar.
KN Values Analysis Settings
The analysis settings required for KN Values analysis are:
Heel from the Analysis menu, select range for analysis
Trim (fixed or free) from the Analysis menu
Displacement from the Analysis menu, select range for analysis and specify
estimate of VCG if known
The heel angles used may differ from those used in the Large Angle Stability and
Limiting KG analyses. To set the range of angles, select Heel from the Analysis menu.
A range of displacements for KN calculations can be specified using the Displacement
command from the Analysis menu. Initial and final displacements can be entered,
together with the number of displacements required.
Displacement range dialog

Chapter 3 Using Hydromax
Page 93
Trim dialog
The VCG can also be entered (specified from the vertical zero datum). Traditionally, KN
calculations are calculated assuming the VCG at the baseline (K). However if the
analysis is being calculated free-to-trim and an estimate of the VCG is known, the
accuracy of the KN calculations (for VCGs in the vicinity of the estimated VCG) may be
improved by calculating the GZ curve using the estimated VCG position – this will
reduce the error in the trim balance due to the vertical separation of CG and CB because
this vertical separation is specified more accurately than simply assuming the VCG at the
baseline.
If a VCG estimate is specified, the KN values are still presented in the normal manner
with the KN values calculated as follows:
KN(φ) = GZ(φ) + KG_estimated sin(φ)
For information on Trim settings for KN Analysis, see: Trim on page 142
Also see
KN Value Concepts on page 94
KN Values Analysis Environment Options
Density
Wave Form (if any)
Damage (or Intact) from the Analysis toolbar

Chapter 3 Using Hydromax
Page 94
KN Values Analysis Results
KN curves calualated at each heel angle
Immersion angles calculated at each displacement
KN Value Concepts
The righting lever, GZ, may be calculated from the KN cross curves of stability (at the
desired displacement) for any specified KG using the following equation: .
GZ = KN - KG sin(φ)
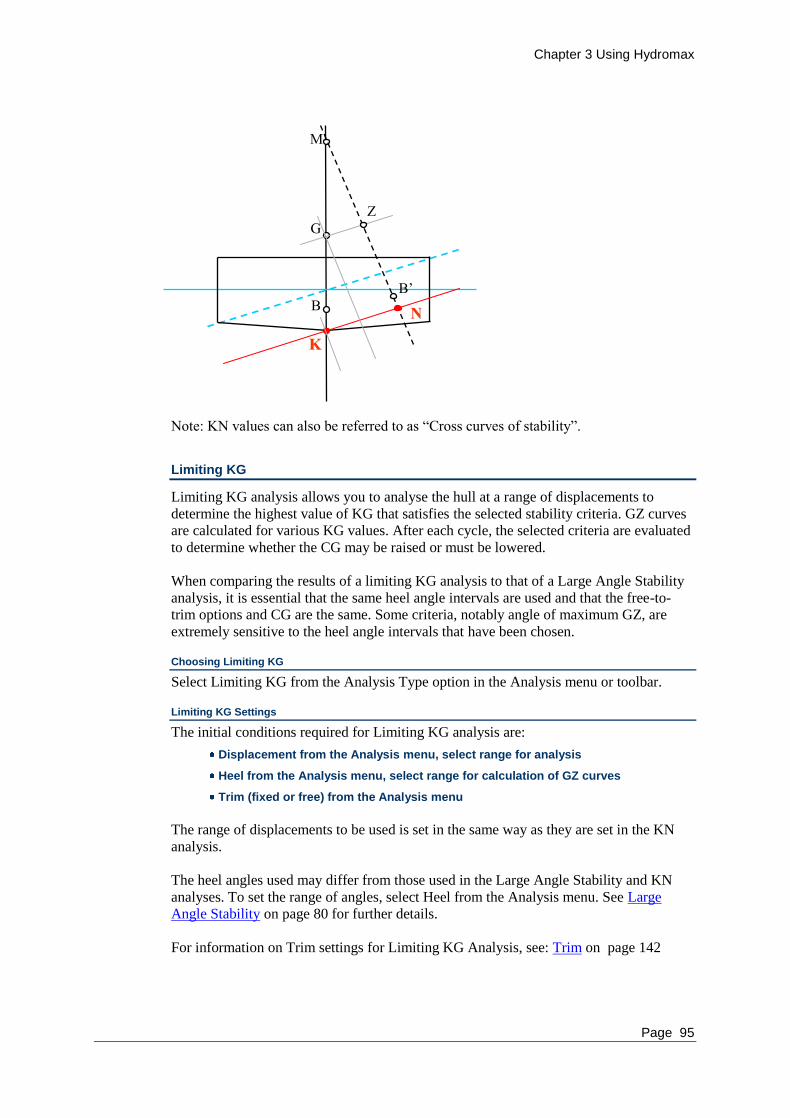
Chapter 3 Using Hydromax
Page 95
Note: KN values can also be referred to as “Cross curves of stability”.
Limiting KG
Limiting KG analysis allows you to analyse the hull at a range of displacements to
determine the highest value of KG that satisfies the selected stability criteria. GZ curves
are calculated for various KG values. After each cycle, the selected criteria are evaluated
to determine whether the CG may be raised or must be lowered.
When comparing the results of a limiting KG analysis to that of a Large Angle Stability
analysis, it is essential that the same heel angle intervals are used and that the free-to-
trim options and CG are the same. Some criteria, notably angle of maximum GZ, are
extremely sensitive to the heel angle intervals that have been chosen.
Choosing Limiting KG
Select Limiting KG from the Analysis Type option in the Analysis menu or toolbar.
Limiting KG Settings
The initial conditions required for Limiting KG analysis are:
Displacement from the Analysis menu, select range for analysis
Heel from the Analysis menu, select range for calculation of GZ curves
Trim (fixed or free) from the Analysis menu
The range of displacements to be used is set in the same way as they are set in the KN
analysis.
The heel angles used may differ from those used in the Large Angle Stability and KN
analyses. To set the range of angles, select Heel from the Analysis menu. See Large
Angle Stability on page 80 for further details.
For information on Trim settings for Limiting KG Analysis, see: Trim on page 142
KK
B
M
B’
NN
G
Z
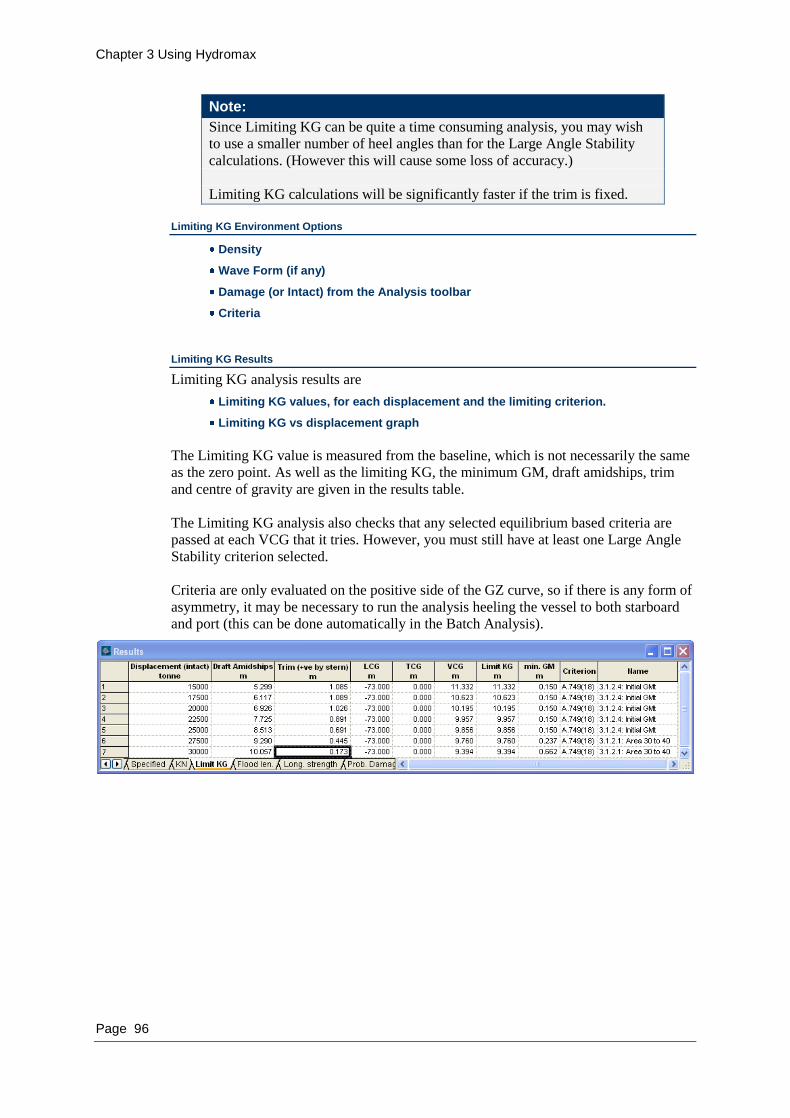
Chapter 3 Using Hydromax
Page 96
Note:
Since Limiting KG can be quite a time consuming analysis, you may wish
to use a smaller number of heel angles than for the Large Angle Stability
calculations. (However this will cause some loss of accuracy.)
Limiting KG calculations will be significantly faster if the trim is fixed.
Limiting KG Environment Options
Density
Wave Form (if any)
Damage (or Intact) from the Analysis toolbar
Criteria
Limiting KG Results
Limiting KG analysis results are
Limiting KG values, for each displacement and the limiting criterion.
Limiting KG vs displacement graph
The Limiting KG value is measured from the baseline, which is not necessarily the same
as the zero point. As well as the limiting KG, the minimum GM, draft amidships, trim
and centre of gravity are given in the results table.
The Limiting KG analysis also checks that any selected equilibrium based criteria are
passed at each VCG that it tries. However, you must still have at least one Large Angle
Stability criterion selected.
Criteria are only evaluated on the positive side of the GZ curve, so if there is any form of
asymmetry, it may be necessary to run the analysis heeling the vessel to both starboard
and port (this can be done automatically in the Batch Analysis).

Chapter 3 Using Hydromax
Page 97
After a Limiting KG analysis has completed, the results in the Criteria results table
display “Not Analysed”, this is because they do not necessarily refer to the final KG and
would be misleading. If you require the limiting KG for each criterion individually or
wish to perform a Large Angle Stability and Equilibrium analysis at each of the
displacements and the corresponding limiting KG, this can be done in the Batch
Analysis.
Some criteria may depend on the vessel displacement and or vessel‟s VCG. Where these
values are explicit in the criterion‟s definition in Hydromax, the correct values of
displacement and VCG will be used in the evaluation of these criteria. However,
problems can arise if the criterion is only available in its generic form – most commonly
heeling arm criteria where the heeling arm is specified simply as a lever and not as a
moment. In this case, since the heeling arm is not related to the vessel displacement in its
definition within Hydromax, the heeling arm will remain constant for all displacements
(where it is perhaps desired that the heeling arm should vary with displacement. For
example in the case where the heeling moment, rather than the heeling arm is constant).
Important:
For important information on varying displacement while evaluating criteria
see Important note: heeling arm criteria dependent on displacement on page
240.
Also see:
Convergence Error on page 146 in the Analysis Settings section.
Limiting KG Concepts
Hydromax will iterate to a KG value that just passes all criteria you have specified in the
criteria dialog. Hydromax will start with a set start KG value (e.g. 1 meter), run a large
angle stability analysis and check the selected criteria. If any of the criteria fail,
Hydromax will lower the KG and try again. If the criteria pass, Hydromax will raise the
KG value and try to make the criteria fail. Hydromax will continue doing this until the
limiting KG value has been iterated to within 0.1mm. If this tolerance is not achieved in
a certain number of iterations, Hydromax will move on to the next displacement.
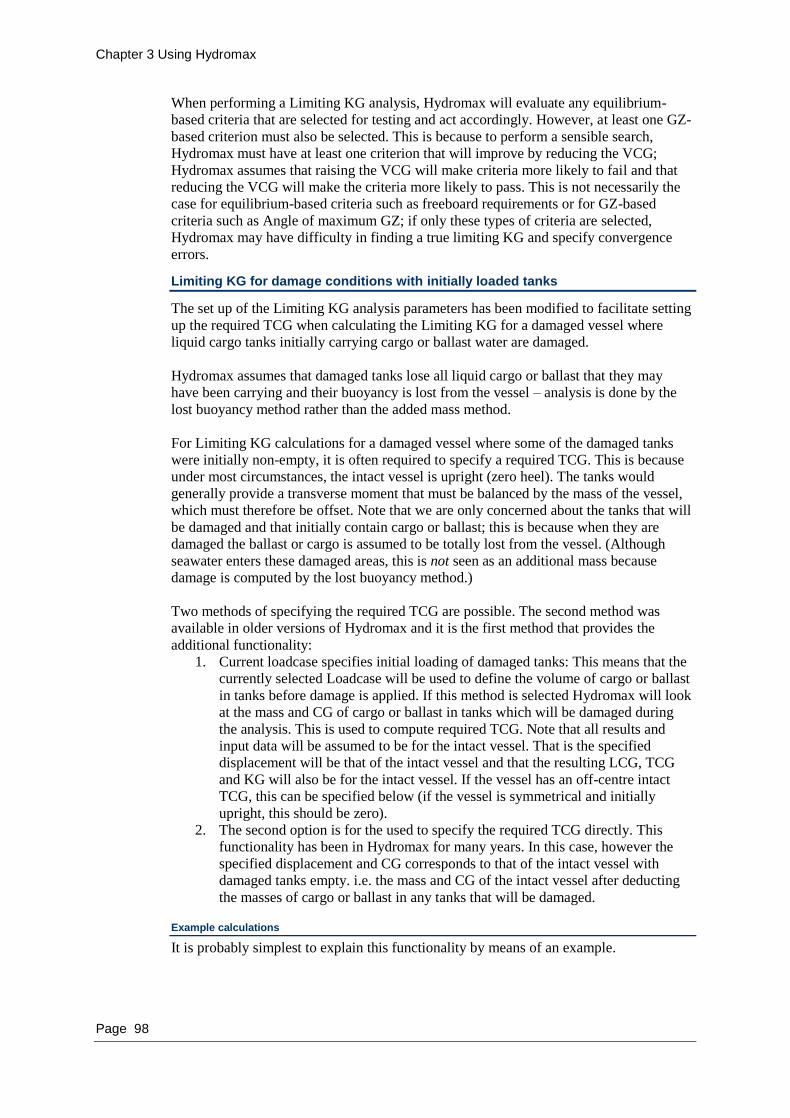
Chapter 3 Using Hydromax
Page 98
When performing a Limiting KG analysis, Hydromax will evaluate any equilibrium-
based criteria that are selected for testing and act accordingly. However, at least one GZ-
based criterion must also be selected. This is because to perform a sensible search,
Hydromax must have at least one criterion that will improve by reducing the VCG;
Hydromax assumes that raising the VCG will make criteria more likely to fail and that
reducing the VCG will make the criteria more likely to pass. This is not necessarily the
case for equilibrium-based criteria such as freeboard requirements or for GZ-based
criteria such as Angle of maximum GZ; if only these types of criteria are selected,
Hydromax may have difficulty in finding a true limiting KG and specify convergence
errors.
Limiting KG for damage conditions with initially loaded tanks
The set up of the Limiting KG analysis parameters has been modified to facilitate setting
up the required TCG when calculating the Limiting KG for a damaged vessel where
liquid cargo tanks initially carrying cargo or ballast water are damaged.
Hydromax assumes that damaged tanks lose all liquid cargo or ballast that they may
have been carrying and their buoyancy is lost from the vessel – analysis is done by the
lost buoyancy method rather than the added mass method.
For Limiting KG calculations for a damaged vessel where some of the damaged tanks
were initially non-empty, it is often required to specify a required TCG. This is because
under most circumstances, the intact vessel is upright (zero heel). The tanks would
generally provide a transverse moment that must be balanced by the mass of the vessel,
which must therefore be offset. Note that we are only concerned about the tanks that will
be damaged and that initially contain cargo or ballast; this is because when they are
damaged the ballast or cargo is assumed to be totally lost from the vessel. (Although
seawater enters these damaged areas, this is not seen as an additional mass because
damage is computed by the lost buoyancy method.)
Two methods of specifying the required TCG are possible. The second method was
available in older versions of Hydromax and it is the first method that provides the
additional functionality:
1. Current loadcase specifies initial loading of damaged tanks: This means that the
currently selected Loadcase will be used to define the volume of cargo or ballast
in tanks before damage is applied. If this method is selected Hydromax will look
at the mass and CG of cargo or ballast in tanks which will be damaged during
the analysis. This is used to compute required TCG. Note that all results and
input data will be assumed to be for the intact vessel. That is the specified
displacement will be that of the intact vessel and that the resulting LCG, TCG
and KG will also be for the intact vessel. If the vessel has an off-centre intact
TCG, this can be specified below (if the vessel is symmetrical and initially
upright, this should be zero).
2. The second option is for the used to specify the required TCG directly. This
functionality has been in Hydromax for many years. In this case, however the
specified displacement and CG corresponds to that of the intact vessel with
damaged tanks empty. i.e. the mass and CG of the intact vessel after deducting
the masses of cargo or ballast in any tanks that will be damaged.
Example calculations
It is probably simplest to explain this functionality by means of an example.

Chapter 3 Using Hydromax
Page 99
The following sample calculations demonstrate how the new Limiting KG options may
be used. A vessel with a port-side tank that are initially full will have this tank damaged.
We wish to find the maximum VCG that the intact vessel may have in order to pass the
selected stability criteria.
Initial tank loadings
First we need to define how much cargo is in the tanks that will be damaged. This is
done by defining a loadcase and switching to the intact mode to specify the tank filling
levels. Here we have specified that the tank is 80% full before the damage is applied.
Use a loadcase to specify the initial quantities of fluids in tanks
Setting the Displacements
Secondly we need to define the displacement range we wish to calculate the Limiting
KG for. This is done in the Displacements dialog:
Displacement dialog
Setting the Trim options
We now need to specify the trim options we wish to use. In this case we shall use free to
trim, but with an initial vessel trim of 0.25m by the stern. Importantly we shall also
specify that the current loadcase should be used to determine the required TCG and
because the vessel is symmetrical, the specified TCG is zero:

Chapter 3 Using Hydromax
Page 100
Trim and TCG specification
Running the Analysis
We now need to select the damage case to be evaluated, the stability criteria that need to
be passed and a suitable range of heel angles to be computed to evaluate the criteria. We
also need to determine which way we should heel the vessel and in doubt should try
heeling the vessel in both directions to see which will give the worst result. In this case
large port-side tanks are to be damaged; these are filled significantly above the waterline
so loss of ballast from these tanks will cause a list to Starboard, so the analysis should be
done in this direction.
Results from Limiting KG analysis
Limiting KG results
Validation of results
The results can be validated by completing a Large Angle Stability analysis with the
specified displacement and CG. It must be remembered that these are KG results not
VCG so when checking the VCG must be calculated. In this case the baseline (K) is at –
356.845mm
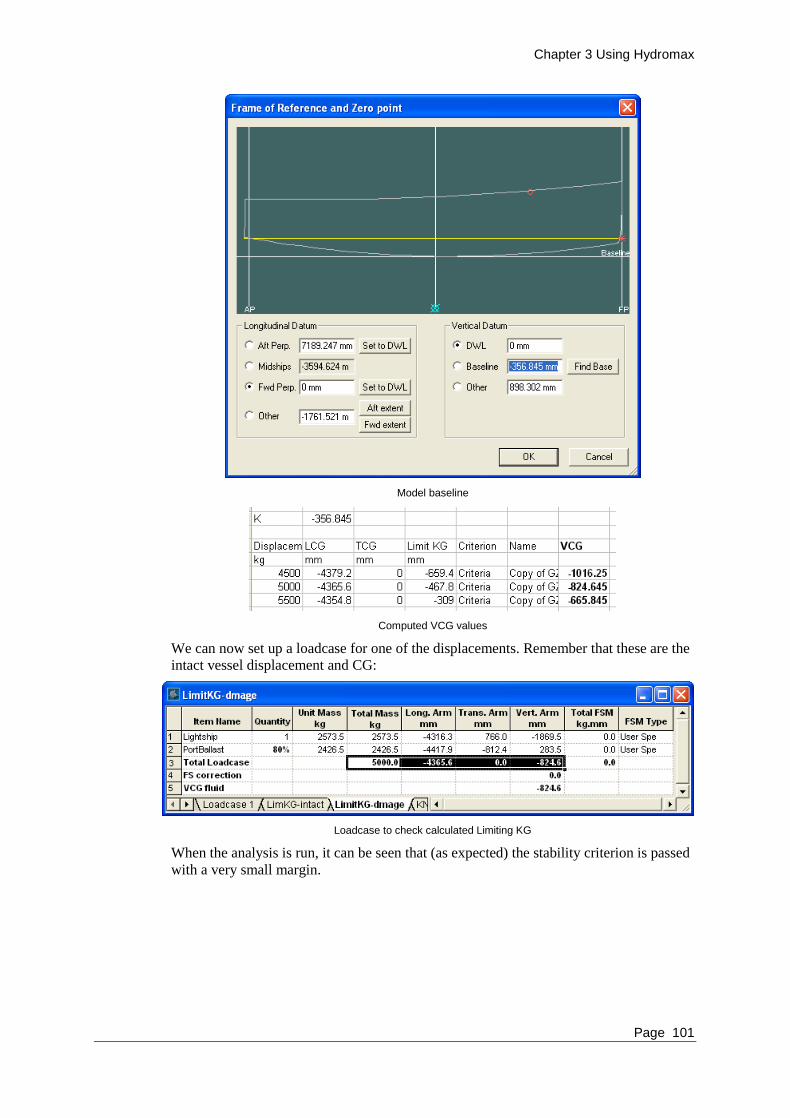
Chapter 3 Using Hydromax
Page 101
Model baseline
Computed VCG values
We can now set up a loadcase for one of the displacements. Remember that these are the
intact vessel displacement and CG:
Loadcase to check calculated Limiting KG
When the analysis is run, it can be seen that (as expected) the stability criterion is passed
with a very small margin.

Chapter 3 Using Hydromax
Page 102
Criterion is passed with a small margin
Floodable Length
The Floodable Length analysis allows you to calculate the longitudinal distribution of
maximum length of compartments that can be flooded with the vessel still passing
specified equilibrium criteria. The results are presented as the maximum length of
compartment plotted (or tabulated) against the longitudinal position of the
compartment‟s centre. Traditionally the criterion of margin line immersion is used to
compute the Floodable Length curve. The Floodable Length may be computed for a
range of displacements and compartment permeabilities.
Choosing Floodable Length
Select Floodable Length from the Analysis Type option in the Analysis
menu or toolbar.
Floodable Length Analysis Settings
The initial conditions required for Floodable Length analysis are:
Trim (free-to-trim, either initial trim or specified LCG)
Displacement, select range and specify VCG
Permeability, select range
Bulkhead location (if applicable)
1. The analysis is always carried out free-to-trim, but the centre of gravity can
either be specified directly in the Trim dialog or it is computed from the
specified initial trim. For information on Trim settings for Floodable Length
Analysis, see: Trim on page 142.
The range of displacements to be used is set in the same way as they are set in the KN
and Limiting KG analyses. The VCG must also be specified since the Floodable length
analysis is very sensitive to accurate trim calculations. This means that the vertical
separation of CG and CB is accounted for in the trim balance.
The permeability dialog is used to specify the permeabilities to be used for the Floodable
Length analysis; the permeability is applied over the entire length of the vessel and is
also applied to the free-surface when calculating the reduction of waterplane area and
inertia.
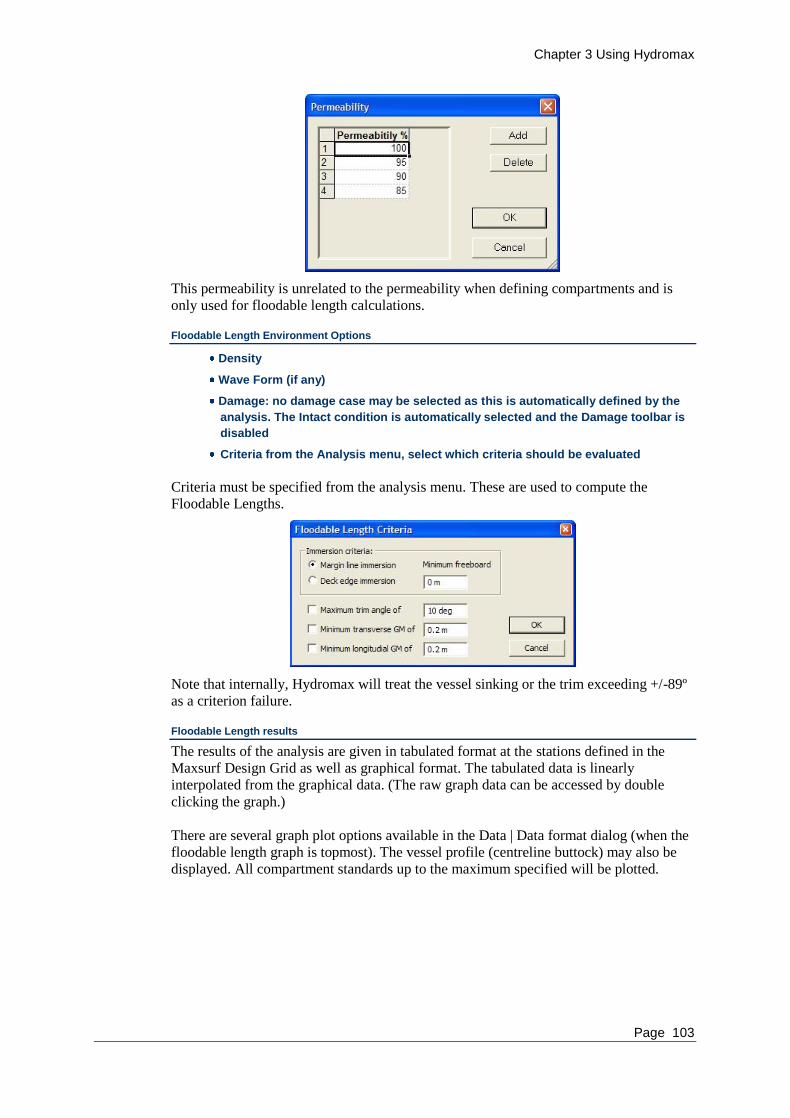
Chapter 3 Using Hydromax
Page 103
This permeability is unrelated to the permeability when defining compartments and is
only used for floodable length calculations.
Floodable Length Environment Options
Density
Wave Form (if any)
Damage: no damage case may be selected as this is automatically defined by the
analysis. The Intact condition is automatically selected and the Damage toolbar is
disabled
Criteria from the Analysis menu, select which criteria should be evaluated
Criteria must be specified from the analysis menu. These are used to compute the
Floodable Lengths.
Note that internally, Hydromax will treat the vessel sinking or the trim exceeding +/-89º
as a criterion failure.
Floodable Length results
The results of the analysis are given in tabulated format at the stations defined in the
Maxsurf Design Grid as well as graphical format. The tabulated data is linearly
interpolated from the graphical data. (The raw graph data can be accessed by double
clicking the graph.)
There are several graph plot options available in the Data | Data format dialog (when the
floodable length graph is topmost). The vessel profile (centreline buttock) may also be
displayed. All compartment standards up to the maximum specified will be plotted.

Chapter 3 Using Hydromax
Page 104
Floodable lengths graph options:
Fix the y-axis so that it is the same scale as the x-axis.
Plot the different compartment standards up to a specified maximum value.
Vessel profile (shown in light grey)
Floodable Length Bulkheads locations are specified in a table in the Input window.
The graph updates in real time as you adjust the bulkhead locations so once you
have calculated the floodable lengths, you can quickly adjust the bulkhead
locations so that the vessel meets the required compartment standard.
If the analysis is unable to find a condition where the vessel passes the selected criteria,
the following dialog will be displayed. The vessel sinking or the criteria failing in the
intact condition could cause this.
Floodable Length Concepts
The analysis is performed by defining a flooded compartment, with the centre of the
compartment at a section under investigation. The length of this flooded compartment is
increased section-by-section until one of the criteria is failed. The compartment is then
moved progressively forward along the vessel. This process may be visualised by turning
on the display of the Hydromax sections.

Chapter 3 Using Hydromax
Page 105
Note: Speed versus Accuracy
The analysis will be both considerably more accurate and slower with a
larger number of sections in the Hydromax model; it is recommended that a
minimum of 100 sections be used for most situations.
The speed of the analysis can be increased quite considerably by increasing
the allowable tolerances in the Edit | Preferences dialog.
Longitudinal Strength
Longitudinal Strength lets you determine the bending moments and shear forces created
in the hull due to the loads applied in the Loadcase window. The analysis can be carried
out in flat water or in a specified waveform.
Choosing Longitudinal Strength
Select Longitudinal Strength from the Analysis Type option in the Analysis menu or
toolbar.
Longitudinal Strength Settings
The initial conditions required for Longitudinal Strength analysis are:
Displacement and Centre of Gravity using the Loadcase window
Distributed loads using the Loadcase window
When the Longitudinal Strength analysis mode is selected, two extra columns appear in
the Loadcase window. These are used to specify the longitudinal extents of the load. A
trapezium shaped distributed load is derived from the centre and fore and aft extents of
the load. See the Loadcase Longitudinally Distributed Loads section on page 45 for more
details.
Longitudinal Strength Environment Options
Density
Wave Form (if any)
Damage (or Intact) from the Analysis toolbar
Grounding (if any)
Criteria, allowable shears and moments from Input window

Chapter 3 Using Hydromax
Page 106
Note that Hydromax will always use the fluid simulation method when performing a
longitudinal strength analysis. For more information on how Hydromax can take fluids
in tanks into account see Fluids Analysis Methods on page 148.
Longitudinal Strength Results
The output from the longitudinal strength calculations is a graph of mass, buoyancy,
damage and non-buoyant volumes and grounding loads. From these, the net load, shear
force and bending moment along the length of the hull are computed. If defined,
allowable shear forces and bending moments are overlayed on the graph.
Downward acting masses, such as normal masses in the loadcase or lost buoyancy due to
damage, are given positive values. Upward acting forces such as buoyancy and
grounding reactions are given negative values.
Name of Curve Description
Mass Vessel mass / unit length
Buoyancy Buoyancy distribution / unit length = immersed cross sectional
area * density. Damaged tanks and compartments reduce the
buoyancy.
Grounding Grounding reaction
Damage/NBV Loas buoyancy due to damaged tanks and compartments and
Non-Byoyant Volumes (NBV)
Net Load Mass + Buoyancy + Grounding + Damage (and NBV)
Shear Shear Force =
x
AftSt
dxx)(NetLoad

Chapter 3 Using Hydromax
Page 107
Moment Bending Moment =
x
AftSt
dxx)(ShearForce
Allowable shear
and moment
Allowable shear and bending moments as specified in the input
Modulus table.
This data is also displayed in the “Long. Strength” tab in the Results window. You can
display this table by choosing Longitudinal Strength from the Results sub-menu under
the Window menu; alternatively double-clicking in the graph will give you all the data as
plotted.
Note
Make sure you have defined sections in your model in Maxsurf. Without
this, the longitudinal strength table will be empty.
Note:
For the purposes of strength calculations, any point loads in the loadcase
will be applied as a load evenly distributed 100mm either side of the
position of the load.
Tanks are taken into account as distributed loads as well based on their
mass distribution that is calculated from the tank sections.
Tank Calibrations
Tank Calibration allows you to determine the properties of the tanks you have defined in
the Compartment window, at a range of capacities.
Choosing Tank Calibrations
Select Tank Calibrations from the Analysis Type option in the Analysis menu or toolbar.
Tank Calibration Input
Tank definitions and boundaries
Permeability
Fluid type
The above data are specified in the Compartment and Sounding Pipes definition tables.
Also see:

Chapter 3 Using Hydromax
Page 108
Relative Density of Tank Fluids on page 59
Tank Calibration Settings
Trim range, angle or trim measurement
Heel angle range
Which items to be calibrated: Analysis | Calibration options dialog
Analysis | Calibration options dialog: Compartments and Non-buoyant volumes may be calibrated if desired
Tank Calibration Environment Options
Calibration intervals – see Sounding Pipes
Tank Calibration Results
If a range of heel (and / or trim) angles have been defined, you may select which are
displayed in the results table and graph using the Results toolbar. If Compartments or
Non-buoyant volumes have also been calibrated, they are shown in grey.
You may chose which columns are displayed using the Data Format dialog:
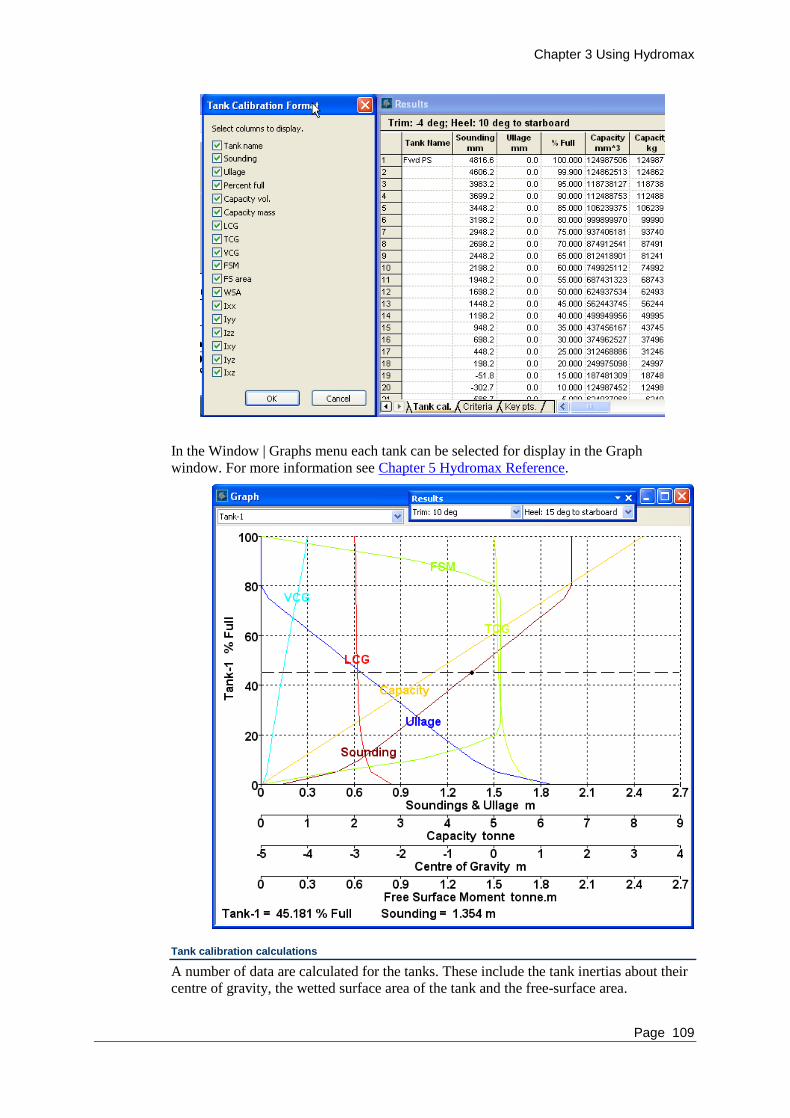
Chapter 3 Using Hydromax
Page 109
In the Window | Graphs menu each tank can be selected for display in the Graph
window. For more information see Chapter 5 Hydromax Reference.
Tank calibration calculations
A number of data are calculated for the tanks. These include the tank inertias about their
centre of gravity, the wetted surface area of the tank and the free-surface area.
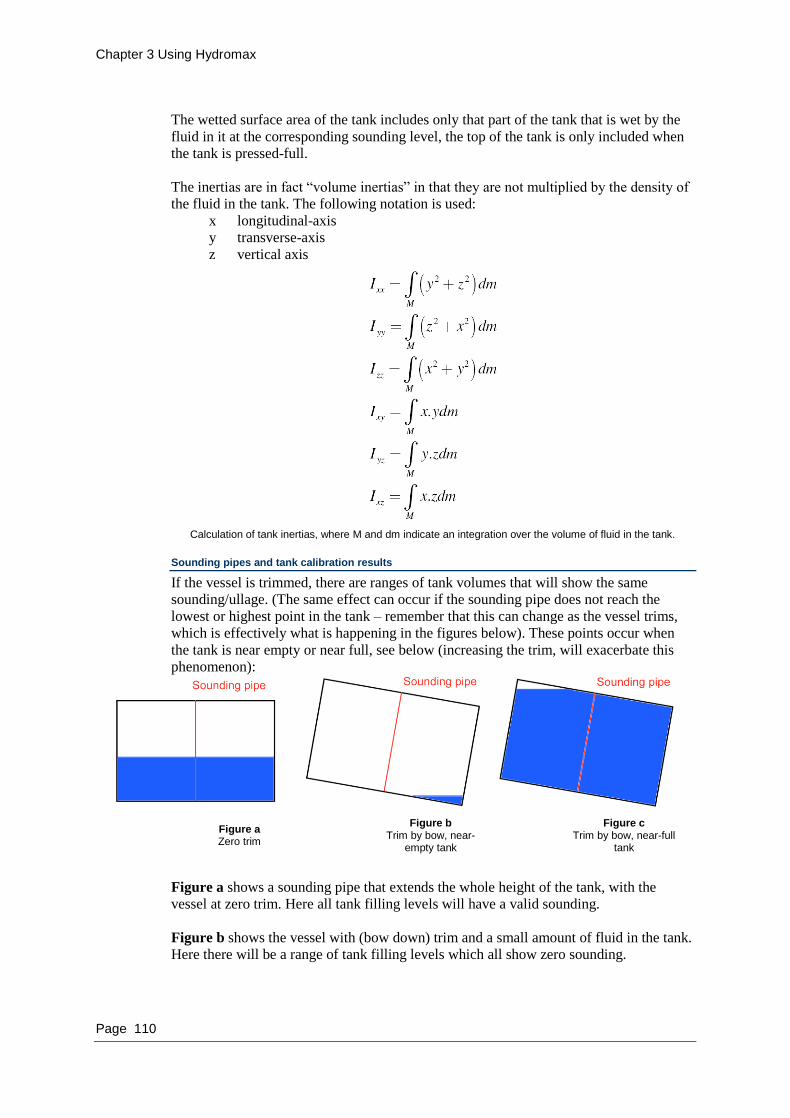
Chapter 3 Using Hydromax
Page 110
The wetted surface area of the tank includes only that part of the tank that is wet by the
fluid in it at the corresponding sounding level, the top of the tank is only included when
the tank is pressed-full.
The inertias are in fact “volume inertias” in that they are not multiplied by the density of
the fluid in the tank. The following notation is used:
x longitudinal-axis
y transverse-axis
z vertical axis
Calculation of tank inertias, where M and dm indicate an integration over the volume of fluid in the tank.
Sounding pipes and tank calibration results
If the vessel is trimmed, there are ranges of tank volumes that will show the same
sounding/ullage. (The same effect can occur if the sounding pipe does not reach the
lowest or highest point in the tank – remember that this can change as the vessel trims,
which is effectively what is happening in the figures below). These points occur when
the tank is near empty or near full, see below (increasing the trim, will exacerbate this
phenomenon):
Figure a Zero trim
Figure b Trim by bow, near-
empty tank
Figure c Trim by bow, near-full
tank
Figure a shows a sounding pipe that extends the whole height of the tank, with the
vessel at zero trim. Here all tank filling levels will have a valid sounding.
Figure b shows the vessel with (bow down) trim and a small amount of fluid in the tank.
Here there will be a range of tank filling levels which all show zero sounding.

Chapter 3 Using Hydromax
Page 111
Figure c shows the vessel with the same trim, but with the tank nearly full. Here there
will be a range of tank filling levels that all show maximum sounding.
These effects will be noted in the tank calibration results if they are extreme enough
since Hydromax always adds calibrations at 1%, 97.9%, 98% and 100% full; if the 1%
level does not intersect the sounding pipe, the sounding will be given as zero. Similarly
if the 97.9%, 98% and 100% full levels do not intersect the sounding pipe, the maximum
sounding will be displayed, see below. In the results out lined in red, there are four
results which all have a sounding of 1.0m but different capacities – the fluid levels are all
above the top of the sounding pipe. In the blue results, the last two results are below the
bottom of the sounding pipe, giving soundings of 0.0m but different capacities (the last
but one calibration point is the fluid remaining in the tank when the sounding is 0.0m).
Tank calibrations for severely trimmed vessels; sounding pipe does not cover full range of tank capacities. The
profile view of the tank in the trimmed vessel is shown on the right; the sounding pipe is in the middle of the tank and extends from the bottom to the top of the tank.
In a similar way, if the sounding pipe extends above or below the maximum and
minimum fluid levels, you will get readings which have the same capacity but different
soundings.
Sounding intervals
The sounding intervals for the calibration table may be:
Automatic,
User defined
Fredyn – {0%, 0.1%, 5%, 10%, … , 85%, 90%, 95%, 99.9%, 100%}
Max. only – {100%}
In automatic mode the increments along the sounding pipe are chosen depending on the
height of the tank to give approximately 20 soundings. Alternatively you may specify a
precise sounding step (this is the step along the sounding pipe, not the vertical step of the
tank level). Finally a “Fredyn” sounding list may be generated, this gives intervals of
{0%, 0.1%, 5%, 10%, … , 85%, 90%, 95%, 99.9%, 100%} of the full capacity of the
tank. To specify the interval, type “A”, “F”, “Max” or a numerical value in the
“Calibration Spacing” column of the Sounding Pipe definition table.

Chapter 3 Using Hydromax
Page 112
Note: Backward compatibility with earlier versions of Hydromax
If the model is saved with Fredyn calibration intervals and is loaded into an
earlier version of Hydromax, you must change the calibration intervals to
Automatic or a positive value otherwise Hydromax will crash during the
tank calibration analysis.
Fredyn calibration intervals
The tank calibrations normally follow regular length intervals along the sounding pipe. A
common sounding pipe is used for “Fredyn tanks”, this sounding pipe starts at the vessel
zero point and projects vertically upwards; all soundings for “Fredyn tanks” use this
common sounding pipe.
Fredyn sounding pipe
The tank calibration intervals required by Fredyn are (as a percentage of full capacity)
{0.1, 5.0, 10.0, …, 90.0, 95.0, 99.9}. To use these intervals, type “Fredyn” in the
Calibration Spacing column of the Sounding Pipes Definition table:
Specification of Fredyn calibration intervals
Note that Compartments and non-buoyant volumes are always calibrated at the
calibration intervals required by Fredyn. If only the 100% full values are required “Max”
may be specified for the calibratin spacing.
MARPOL Oil Outflow
MARPOL probabilistic oil outflow calculation may be computed according to the
following MARPOL regulations:
Resolution MEPC.141(54), Regulation 12A: Oil fuel tank protection
Resolution MEPC.117(52), Regulation 23: Accidental oil outflow performance
Define the tanks in the Compartment definition window then choose the MARPOL
analysis mode. Seltect the Reolution and tanks to be included in the analysis in the
MARPOL options (Analysis menu) dialog (see below).
MARPOL Options dialog (Analysis menu)
The MARPOL options dialog allows the user to select the tanks that should be included
in the analysis for both MARPOL Regulations.

Chapter 3 Using Hydromax
Page 113
Tank selection for the MARPOL analysis
The list of selected tanks is different for both Regulations since Regulation 12A is for
fuel tanks and Regulation 23 applies to cargo tanks. Further each tank has the option for
being included in the computation for outflow due to side- and bottom-damage. When
you select a Regulation with the radio buttons, the corresponding list of selected tanks
will be displayed in the grid.
MARPOL Tank measurements
If the “Update all tank measurements” check-box is ticked, then Hydromax will attempt
to measure the required tank parameters (over-writing any that have previously been
manually edited).
Due to the nature of some of the measurements, it is not possible to guarantee that
Hydromax will be 100% accurate in interpreting the measurements as defined in the
MARPOL documents, for this reason the user should carefully review the values
generated by Hydromax.
MARPOL Results and additional Input
Because the calculations of the MARPOL analysis are very quick they are done in real-
time as input data is edited by the user. For this reason the data input and results are
combined in one table. The table is in the MARPOL tab of the Results window:

Chapter 3 Using Hydromax
Page 114
MARPOL calculations: Results Window
The table is split into three parts: main Hull parameters, oil outflow due to Side damage
and finally oil outflow due to Bottom damage. Parameters that can be edited are shown
in black; those which cannot are shown in grey.
Main Hull Parameters
Different parameters are shown depending on the Regulation being used. Regulation 23
calculates the nominal oil density as the deadweight divided by the total tank capacity;
the deadweight is computed as the difference in displacements between the deepest
loadline draft and the lightship draft (or may be specified directly). For Regulation 12A,
the nominal fuel oil density is specified by the user, the default being 1000kg/m3.
Furthermore the inert gas overpressure may be specified for Regulation 23.
The deepest loadline draft is taken as the DWL draft; the lightship draft is used to
calculate the deadweight for Regulation 23 and the partial draft, which affects bottom-
damage outflow in Regulation 12A.
If a parameter is modified, it is possible to revert back to the Hydromax calculated value
or default by typing „H‟ or double clicking:
Reverting back to default/calculated parameter values
For full definitions of the parameters, please refer to the relevant IMO instruments.
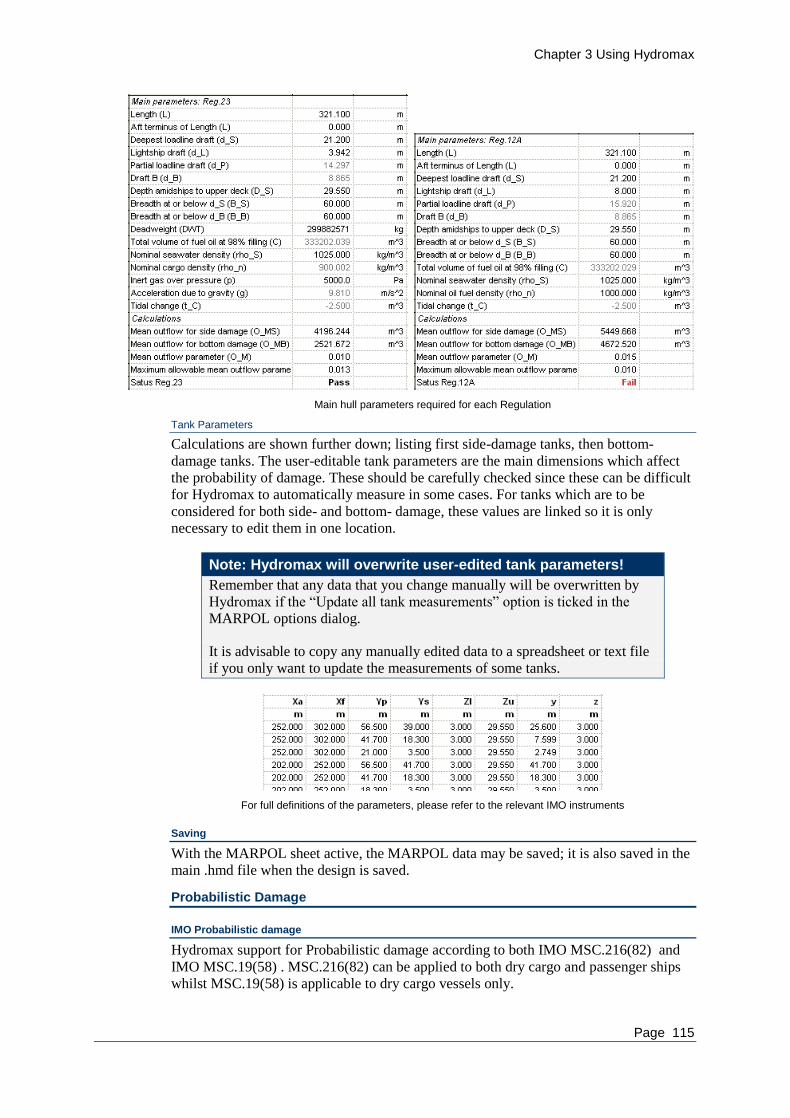
Chapter 3 Using Hydromax
Page 115
Main hull parameters required for each Regulation
Tank Parameters
Calculations are shown further down; listing first side-damage tanks, then bottom-
damage tanks. The user-editable tank parameters are the main dimensions which affect
the probability of damage. These should be carefully checked since these can be difficult
for Hydromax to automatically measure in some cases. For tanks which are to be
considered for both side- and bottom- damage, these values are linked so it is only
necessary to edit them in one location.
Note: Hydromax will overwrite user-edited tank parameters!
Remember that any data that you change manually will be overwritten by
Hydromax if the “Update all tank measurements” option is ticked in the
MARPOL options dialog.
It is advisable to copy any manually edited data to a spreadsheet or text file
if you only want to update the measurements of some tanks.
For full definitions of the parameters, please refer to the relevant IMO instruments
Saving
With the MARPOL sheet active, the MARPOL data may be saved; it is also saved in the
main .hmd file when the design is saved.
Probabilistic Damage
IMO Probabilistic damage
Hydromax support for Probabilistic damage according to both IMO MSC.216(82) and
IMO MSC.19(58) . MSC.216(82) can be applied to both dry cargo and passenger ships
whilst MSC.19(58) is applicable to dry cargo vessels only.

Chapter 3 Using Hydromax
Page 116
Probabilistic damage – Principles
Essentially the probabilistic damage analysis performs a number of large angle stability
analyses and uses the IMO criterion to determine an s-factor that depends on certain
parameters of the GZ curve. The GZ curves are calculated for a large number of different
damage conditions and several load cases. For each condition, a p-factor can be
calculated. The vessel‟s attained subdivision index is the sum of the products of the p-
factors with their corresponding s-factors. The attained subdivision index can then be
compared with a required subdivision index to see if the vessel achieves a sufficiently
high degree of safety.
Flow through – Typical Use-case
The following section shows how the probabilistic damage analysis might typically be
used.
Maxsurf model is loaded as normal
User defines (first selecting File | New to open the Probabilistic damage data table)
other ship data required for the probabilistic damage analysis in the Damage
window | Global table.
User defines the damage zones they wish to consider in the Damage window |
Zones table
Once 2 and 3 have been completed, the p-factors Damage window | p Factors table
are automatically calculated and displayed as the zone data is modified. It is useful
to have this interaction because if the p Factor is too large for a particular zone,
the user may decide to refine the zone arrangement.
User defines the bulkheads and deck values for single and groups of adjacent
zones.
When the Zones have been defined the user can then define which tanks are
damaged in each zone in the Damage window | Zone damage table. A first pass at
this can be automatically generated using the Case | Extent of damage command.
The user can then perform the probabilistic damage analysis. Hydromax runs a
large angle stability analysis for each combination of loadcase and damage and
collates the results to calculate the attained index. This is then compared with the
required index.
During the analysis each GZ curve and details on the evaluation of the s-factor may be
saved in a log file. The same log file is used for each analysis so it is important to either
change the name or copy the file at the end of the analysis if the results are to be kept.
The log file parameters may be specified in the Edit | Preferences dialog:

Chapter 3 Using Hydromax
Page 117
Probabilistic damage result logging options (Edit | Preferences)
Finding the probabilistic damage input sheets.
The probabilistic damage input sheets are in the damage window after the normal
damage condition sheet.

Chapter 3 Using Hydromax
Page 118
A Probabilistic Damage toolbar button is available in the Windows toolbar which will
take the user back to the last used probabilistic damage input table:
Probabilistic damage – Saving input parameters
The probabilistic damage data is saved in the .hmd file. However this is new to version
14.1 and if the file were read into an earlier version of Hydromax and saved, these data
would be lost. For this reason it is also possible to save the probabilistic damage data as
a separate file (in a similar way to the other Hydromax input data). To load or save the
probabilistic damage data as a separate file, ensure that one of the probabilistic damage
data sheets in the Damage window is on top.
Bring one of the probabilistic damage tables to the front to enable File menu items
Probabilistic damage – Inputs
In this section we shall look at the input parameters required for the probabilistic damage
analysis.
Settings for Probabilistic damage GZ curve calculation
Since the analysis essentially consists of a large number of GZ curve calculations, most
of the settings that are applicable to the Large Angle Stability analysis are also
applicable to the Probabilistic Damage Analysis.
Chose the Probabilistic Damage analysis mode from the pull-down or Analysis menu:

Chapter 3 Using Hydromax
Page 119
Selecting Probabilistic Damage anlysis mode
Once you have selected the probabilistic damage analysis mode, you can define the heel
angle range and trim settings to be used as well as any environmental parameters such as
waveform (as well as the fluid analysis method to be used).
During probabilistic damage analysis, it is possible to check the vessel heeling to both
port and starboard. This is useful if the tanks contain ballast or cargo and it is uncertain
in which direction the vessel will list when damaged (or indeed the vessel may list to
different directions depending on the loadcase and damage). Hydromax will calculate the
GZ curve in both directions and, if the criteria can be evaluated in both directions, the
lowest s-factor will be taken. If the criteria can only be evaluated in one direction, then
this value for the s-factor will be taken.
It is recommended to evaluate at least one negative heel angle and the direction of heel
should correspond to the side of the vessel that is being damaged (see below):

Chapter 3 Using Hydromax
Page 120
Heel angle specification (as per Large Angle Stability)
Use either fixed trim or free to trim to loadcase.
s-factor calculation
The s-factors are calculated by stability criteria. The Probailistic damage analysis has its
own set of criteria (though the same parent criteria are also available in the large angle
stability analysis criteria). When the analysis mode has been set to Proababilistic
Damage, you will see the criteria that are used for this analysis. The number of parent
criteria is reduced to only those which can calculate the s-factor. Also some “Default”
criteria are supplied, you can add or modify these should you so desire. When running
the analysis, Hydromax will look at the probabilistic criteria that have been selected and
warn you if there are any problems.

Chapter 3 Using Hydromax
Page 121
Probabilistic Damage Criteria Manager with Parent and Default criteria
The following rules should be observed when defining the probabilistic damage criteria:
As with the normal criteria manager, changes made to the parent (bold) criteria are
not saved. If you need to modify any of the criteria you should make your own
copies of the parent criteria
A set of Default criteria are provided – these can be modified and changes will be
saved.
Only one criterion should be selected and it should correspond to the IMO
Resolution being used. (Strictly, you may have up to one of each MSC.216(82) or
MSC.19(58) criteria selected and Hydromax will automatically use the appropriate
one – according to the selected Resolution in the Global sheet – but for clarity, it is
probably best practive to just have a single criterion selected.)
The criteria should always be selected for Damage analysis.
Hydromax will automatically update some of the criteria parameters according to
corresponding parameters in the probabilistic damage setup. However it is still
good practice to review criteria parameters before starting the analysis. This is
particularly true for the MSC.216(82) Resolution where the vessel type and heeling
moments must be defined correctly.
The criteria window can be closed with either of the close buttons.
For further information on how the s-factors are calculated and the different parameters,
please refer to the Criteria Help section for the appropriate criteria (and heeling arms).
Main parameters and calculation of required subdivision index
The other parameters required for the probabilistic damage analysis are defined in the
last four tables in the Damage window:

Chapter 3 Using Hydromax
Page 122
Additional tables in the Damage window define the remaining Probabilistic damage input data
Depending on the selected IMO Resolution, different rows and columns will be
displayed in the tables; both MSC.216(82) and MSC.19(58) are provided, A.265 VIII is
not included.
Tool tips have been added to provide a more detailed explanation of the input parameters
and also the options available.
Tool tips for Global data sheet
Global table
This table is used to define the main parameters for the probabilistic damage anlysis as
well as provide some intermediate calculations. Input data are shown in black whilst
results are shown in grey. Depending on the Resolution and vessel type, some rows may
be hidden.

Chapter 3 Using Hydromax
Page 123
Global table – MSC.216(82) Dry Cargo vessel and Passenger vessel

Chapter 3 Using Hydromax
Page 124
Global table – MSC.19(58) Dry Cargo
Row Description
Resolution --
MSC.216(82) or
MSC.19(58)
IMO Resolution to be used.
Deepest subdivision
draft (summer
loadline) Loadcase
Name of loadcase that defines the vessel at the deepest
subdivision draft.
Partial subdivision
draft Loadcase
Name of loadcase that defines the vessel at the partial
subdivision draft.
Light service draft
Loadcase
Name of loadcase that defines the vessel at the light subdivision
draft.
not required for MSC.19(58).
Type -- Cargo or
Passenger
Vessle type.
not required for MSC.19(58).
Lifeboat capacity
N_1
Number of persons for whom lifeboats are provided.
required for MSC.216(82), pax. Vessel only.
Permitted max. num.
of persons in excess
of N_1: N_2
Number of persons inclusing officers and crew that the vessel is
permitted to carry in excess of N_1.
required for MSC.216(82), pax. Vessel only.
max. moulded
breadth at or below
deepest subdivision
draft: B
Parameter not currently used.
max. number of
adjacent zones to
consider
Specifies the upper limit of the number of adjacent zones that
should be damaged. If you wish to limit the analysis by p-factor
only, then specify the number of zones here (see min p-factor
below).
min. p-Factor of
damage to consider
Specifies the minimum p-factor for which an analysis should be
performed. The maximum a condition can contribute to the

Chapter 3 Using Hydromax
Page 125
attained index is the p-factor. If the the p-factor is very small the
contribution to the attained index will be negligible and there is
little point in carrying out the analysis. Conditions whose p-
factor is below this minimum will not be evaluated; this can
speed up the analysis. If you wish the analysis to be purely
limited by the number of adjacent zones (see above) then specify
a small negative value. This will ensure that conditions with zero
p-factor will still be evaluated.
max. trim angle to
consider
If the vessel trim exceeds this value, then the s-factor will be
taken as zero (irrespective of the GZ curve). This can speed up
the analysis.
Limit vertical extent
of damage?
If desired the vertical extent of damage (when automatically
generating the zone damage) can be limited.
max. vertical extent
of damage
If desired the vertical extent of damage (when automatically
generating the zone damage) can be limited.
Damaged side --
Starboard or Port
Specifies which side of the vessel will be damaged (when
automatically generating the zone damage). The extent of
damage is assumed to go all the way to the centreline but you
may specify which side of the vessel is damaged. The heel
direction in the Heel setup should correspond to the side of the
vessel being damaged.
Zone 1 located at
bow or stern?
It is normal to begin the Zone numbering at the stern, but the
option to start from the bow is also allowed in Hydromax
Longitudinal Zone definition
The next table (Zones) allows for the definition of the longitudinal damage zones. Fore
and aft extents of the zone boundaries are input by the user and the length and centre of
the zone is automatically calculated; the boundaries of adjacent zones are automatically
updated if required, as are the zone names. The subdivision length is taken as the limits
of the length defined by the zones. As for other similar tables, use Edit | Add or Delete
(or Ctrl+A or Del key, with a number of complete rows selected) to add or delete zones.
Damage zones defined by fwd and aft boundaries
Zones may be shown in the drawing views (this display option is only available in
Probabilistic Damage analysis mode):

Chapter 3 Using Hydromax
Page 126
Probabilistic damage zones (stbd. side damage) shown in pink.
P-Factors
From the damage zone calculations, the probability of damaging a longitudinal zone or
group of adjacent zones is calculated as well as the cumulative probability. The columns
displayed depends on the choice of Resolution: MSC.216(82) or MSC.19(58) made in
the Global table.
All combinations of adjacent zones are calculated at this point. A subtotal for the p-
factor for a given number of adjacent zones is given as well as a cumulative to total for
all the p-factors. This will help the user to determine the maximum number of adjacent
zones that should be analysed. In practice, it probably makes more sense to limit the
analysis by specifying a desired minimum p-factor rather than a number of adjacent
zones. This can easily be done by specifying the maximum number of adjacent zones as
the number of zones defined. The last column shows whether a particular condition will
be tested (if the p-factor is sufficiently large and the maximum number of adjacent zones
is not exceeded).

Chapter 3 Using Hydromax
Page 127
p-factor calculations for individual and groups of zones
Sub zones due to transverse and vertical subdivision
As well as the main longitudinal subdivision, it is also possible to define sub-zones due
to longitudinal bulkheads (transverse subdivision) and decks (vertical subdivision).
Transverse sub-zone definition and R-Factors
Transverse sub-zone definition allows the user to limit the damage penetration to a
certain distance into the vessel towards the centerline, measured from the side-shell. I
have followed IMO notation by specifying the penetration depth from the side-shell
(rather than specifying the offset from the centerline). A column is provided for the user
to specify the side-shell offset (from the centerline) and this is used only to draw the
transverse extents of the damage zone, the inner limit being at a distance side-shell offset
minus b from the centreline. The side-shell offset value defaults to the maximum half-
beam of the vessel.
The r-factors are then calculated for each of the b-values that have been defined. Note
that there is one extra r-factor than the number of bulkheads – this represents the
probability of damaging to the centerline. The sum of all r-factors should be unity (a
check is provided).
The b-values are defined not only for each individual zone, but also for groups of
adjacent zones. This is because where the side-shell or bulkhead is not parallel to the
centerline, there is a special way of calculating the b-value and this needs to be done for
each set of adjacent zones. If no b-values are specified, the zone will be damaged up to
(but not across) the centreline.

Chapter 3 Using Hydromax
Page 128
Longitudinal bulkhead definition and corresponding r-factors
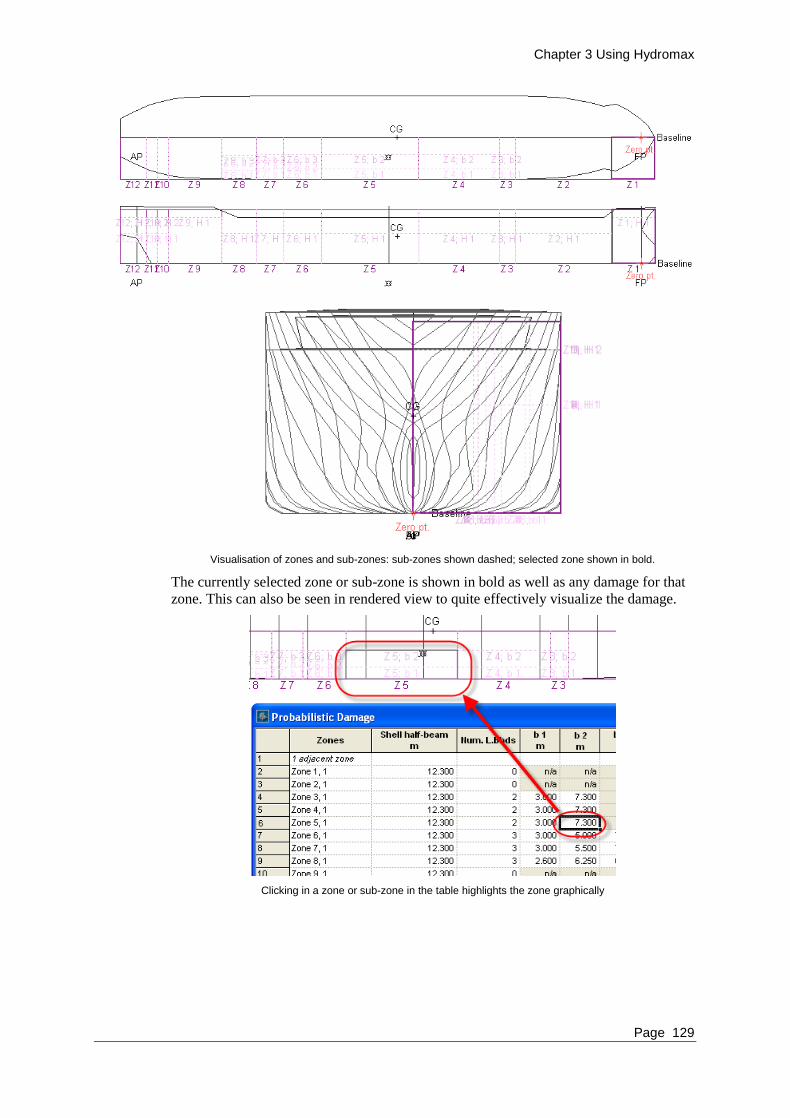
Chapter 3 Using Hydromax
Page 129
Visualisation of zones and sub-zones: sub-zones shown dashed; selected zone shown in bold.
The currently selected zone or sub-zone is shown in bold as well as any damage for that
zone. This can also be seen in rendered view to quite effectively visualize the damage.
Clicking in a zone or sub-zone in the table highlights the zone graphically
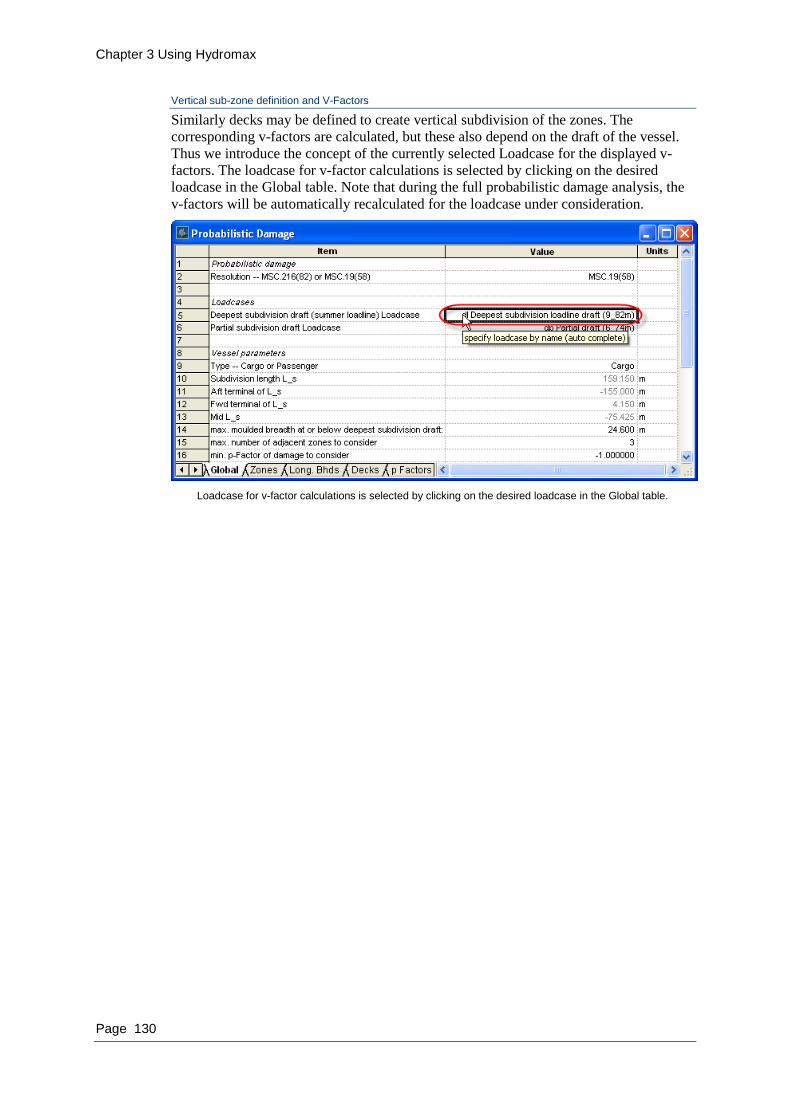
Chapter 3 Using Hydromax
Page 130
Vertical sub-zone definition and V-Factors
Similarly decks may be defined to create vertical subdivision of the zones. The
corresponding v-factors are calculated, but these also depend on the draft of the vessel.
Thus we introduce the concept of the currently selected Loadcase for the displayed v-
factors. The loadcase for v-factor calculations is selected by clicking on the desired
loadcase in the Global table. Note that during the full probabilistic damage analysis, the
v-factors will be automatically recalculated for the loadcase under consideration.
Loadcase for v-factor calculations is selected by clicking on the desired loadcase in the Global table.

Chapter 3 Using Hydromax
Page 131
Deck definition and corresponding v-factors

Chapter 3 Using Hydromax
Page 132
Zone damage
The zone damage sheet specifies which tanks are damaged for a given zone. From this
Hydromax can work out what should be damaged for any combination of adjacent
damaged zones.
Definition of whats damaged in each zone
Once the zones are defined the user can select the Case | Extent of damage command and
this will automatically generate the zone damage according to which tanks lie within the
zone boundaries. Once the automatic damage is defined, this can be modified by the user
should this prove to be necessary (or it can be defined from scratch by the user). The
“Zone damage” tab of the Damage window must be on top to enable this command.
Automatic definition of damage for each zone
Additionally the user may automatically generate damage cases for the Zone damage
that has been defined damage configurations within the maximum number of adjacent
zones range and above the minimum p-factor will be added. This stage is not required
for the probabilistic analysis, but has been added for convenience should the user wish to
manually run large angle stability analyses for the same damage cases.
The Damage window must be on top for this command to work. Damage cases will be
added up to the maximum number of adjacent zones specified in the Global tab, if the p-
factor exceeds the minimum values specified (again in the Global tab).

Chapter 3 Using Hydromax
Page 133
Automatic creation of damage cases using the damage defined for each zone
Visualization of zone damage
When in Probabilistic damage analysis mode the damaged tanks and compartments
displayed are not those of the current damage case, but those of the currently selected
zone. The zone is selected by clicking in the corresponding column of the Zone Damage
table.
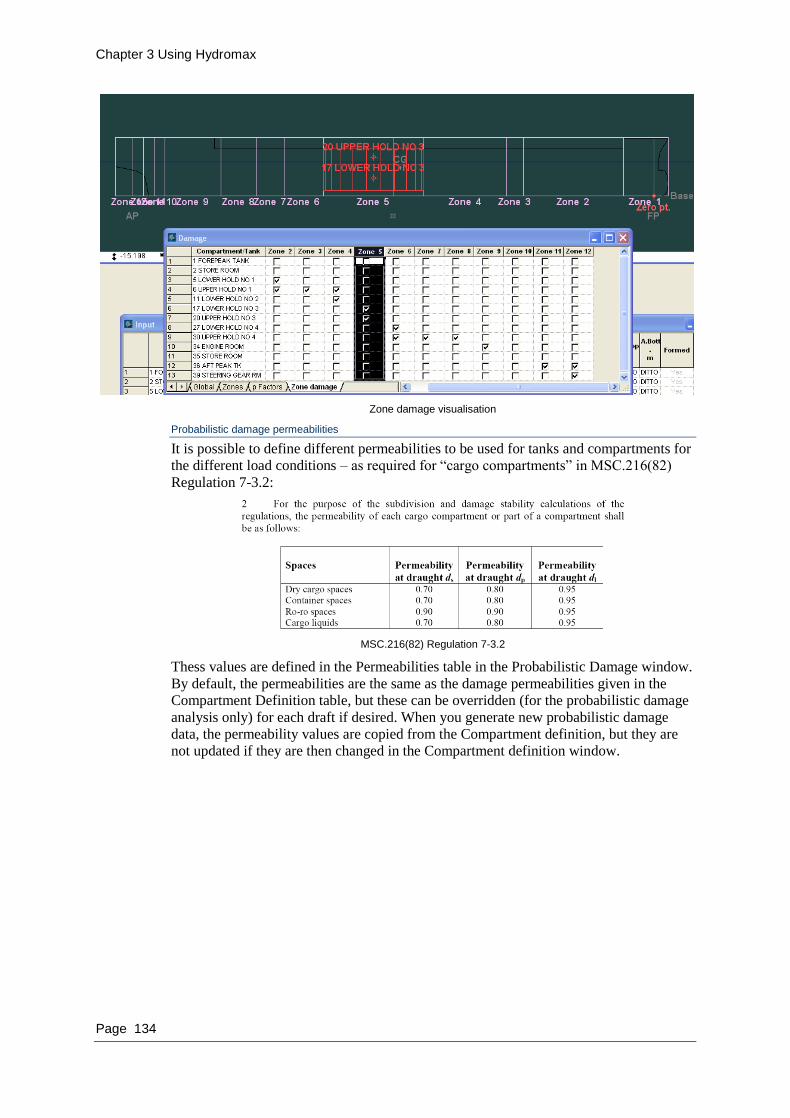
Chapter 3 Using Hydromax
Page 134
Zone damage visualisation
Probabilistic damage permeabilities
It is possible to define different permeabilities to be used for tanks and compartments for
the different load conditions – as required for “cargo compartments” in MSC.216(82)
Regulation 7-3.2:
MSC.216(82) Regulation 7-3.2
Thess values are defined in the Permeabilities table in the Probabilistic Damage window.
By default, the permeabilities are the same as the damage permeabilities given in the
Compartment Definition table, but these can be overridden (for the probabilistic damage
analysis only) for each draft if desired. When you generate new probabilistic damage
data, the permeability values are copied from the Compartment definition, but they are
not updated if they are then changed in the Compartment definition window.
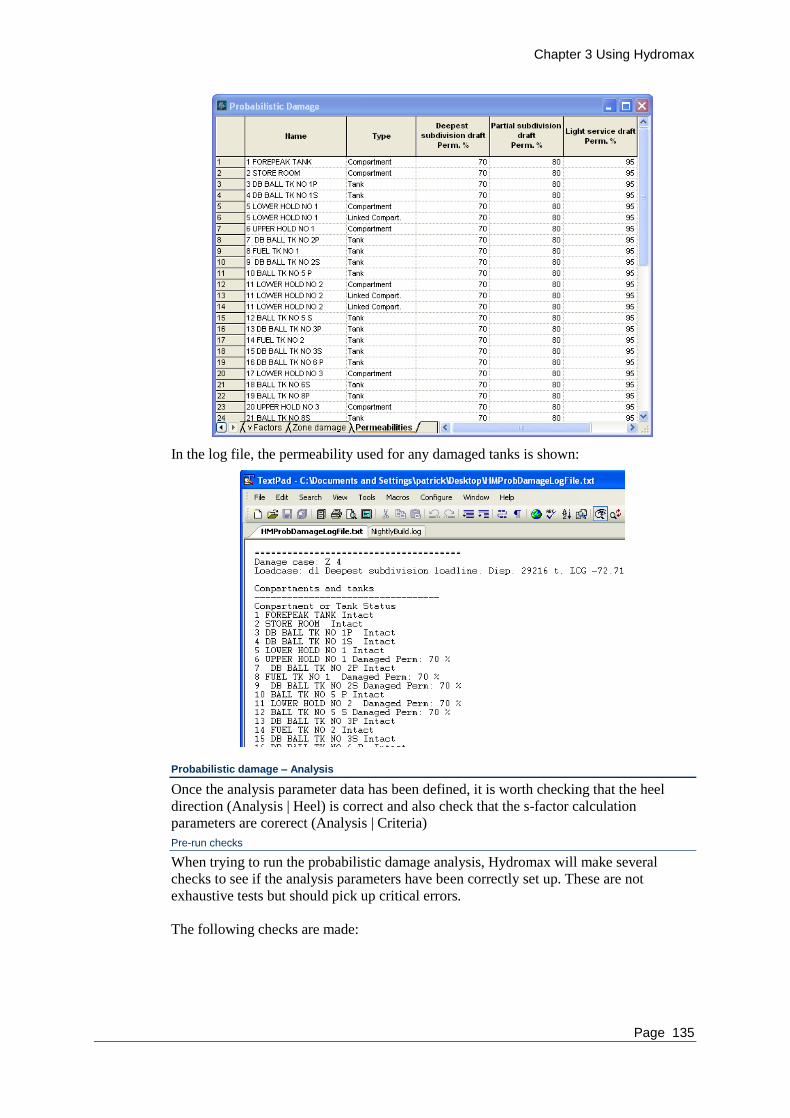
Chapter 3 Using Hydromax
Page 135
In the log file, the permeability used for any damaged tanks is shown:
Probabilistic damage – Analysis
Once the analysis parameter data has been defined, it is worth checking that the heel
direction (Analysis | Heel) is correct and also check that the s-factor calculation
parameters are corerect (Analysis | Criteria)
Pre-run checks
When trying to run the probabilistic damage analysis, Hydromax will make several
checks to see if the analysis parameters have been correctly set up. These are not
exhaustive tests but should pick up critical errors.
The following checks are made:

Chapter 3 Using Hydromax
Page 136
That loadcases that have been specified exist
That the vessel type is correct in the criteria (if MSC.216(82) is being used)
That the correct s-factor criterion has been selected. Note that only one criterion
may be selected. If Hydromax finds no criteria selected but a suitable one is
available (but unselected) then it will prompt the user to use this one:
Analysis
Large angle stability analyses are computed for each combination of loadcase and zone
damage up to either the specified maximum number of adjacent zones or the minimum
specified p-factor. Basic data pertinent to calculation of the s-factor is also presented as
well as a total Attained subdivision index at the bottom of the table. The required index
is also shown as well as pass/fail status. Should the vessel sink, excessive trim occur or
the large angle stability analysis fail to converge, this is reported and the s-factor given
as zero.
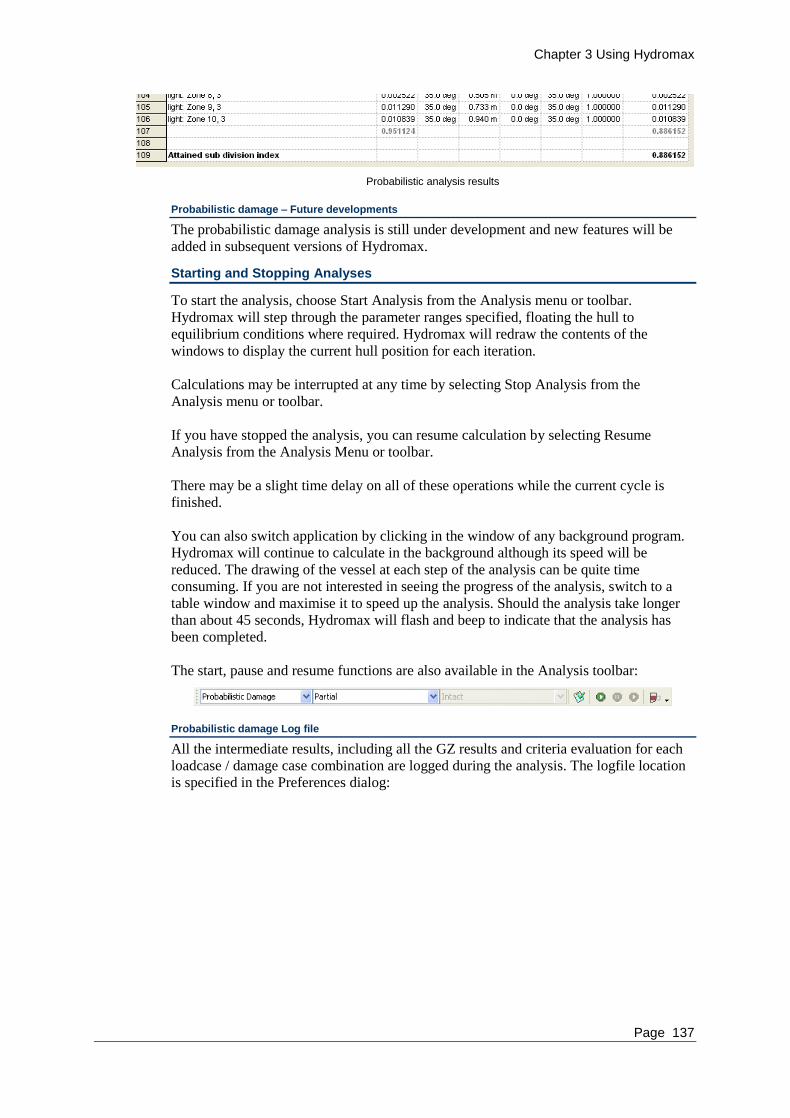
Chapter 3 Using Hydromax
Page 137
Probabilistic analysis results
Probabilistic damage – Future developments
The probabilistic damage analysis is still under development and new features will be
added in subsequent versions of Hydromax.
Starting and Stopping Analyses
To start the analysis, choose Start Analysis from the Analysis menu or toolbar.
Hydromax will step through the parameter ranges specified, floating the hull to
equilibrium conditions where required. Hydromax will redraw the contents of the
windows to display the current hull position for each iteration.
Calculations may be interrupted at any time by selecting Stop Analysis from the
Analysis menu or toolbar.
If you have stopped the analysis, you can resume calculation by selecting Resume
Analysis from the Analysis Menu or toolbar.
There may be a slight time delay on all of these operations while the current cycle is
finished.
You can also switch application by clicking in the window of any background program.
Hydromax will continue to calculate in the background although its speed will be
reduced. The drawing of the vessel at each step of the analysis can be quite time
consuming. If you are not interested in seeing the progress of the analysis, switch to a
table window and maximise it to speed up the analysis. Should the analysis take longer
than about 45 seconds, Hydromax will flash and beep to indicate that the analysis has
been completed.
The start, pause and resume functions are also available in the Analysis toolbar:
Probabilistic damage Log file
All the intermediate results, including all the GZ results and criteria evaluation for each
loadcase / damage case combination are logged during the analysis. The logfile location
is specified in the Preferences dialog:

Chapter 3 Using Hydromax
Page 138
Probabilistic Damage analysis logging
Batch Analysis
Batch Analysis Concepts
Hydromax has basic batch processing capability. With a single command, Hydromax
will run Large Angle Stability and Equilibrium analyses for all combinations of load and
damage cases. Further, Limiting KG and KN calculations can be made for each damage
condition. There are other options which allow the analysis to be performed heeling to
both port and starboard. For the Limiting KG analysis you may also check the Limiting
KG for each criterion individually. You may also choose to perform a Large Angle
Stability and Equilibrium analysis at the final VCG.
The aim of the batch processing function is to:

Chapter 3 Using Hydromax
Page 139
Provide the user with a simple and consistent way of carrying out Large Angle
Stability and Equilibrium analyses on a large number of load and damage cases.
Facilitate time consuming Limiting KG analyses, especially where results for all
individual criteria are required.
Enable Limiting KG and KN analyses to be performed automatically for all damage
cases.
Facilitate testing with heel to port and starboard for vessels with asymmetric
loading and/or damage conditions (or hulls).
Facilitate export of the data from Hydromax and import into MS Excel for post
processing and report generation.
Provide all relevant results and the data required to be able to reproduce the runs,
i.e.: analysis parameters, file name etc.
Before you can perform a Batch Analysis it is recommended that you run a number of
Analyses manually to check whether the Model has been defined correctly and all
Analysis Settings and Environment conditions have been set correctly.
Batch Analysis – Procedures
Once the loadcases, damage cases, key points, criteria and analysis parameters for the
required analyses have been set up, the Batch Analysis is started
Analysis | Start Batch Analysis

Chapter 3 Using Hydromax
Page 140
Batch analysis runs all combination of loadcases and damage cases.
Tip: Under most operating systems, minimising Hydromax can reduce the time required
to perform the calculations. This is because time consuming redrawing of the design
windows, graphs and tables is avoided.
Batch Analysis Settings
Analysis parameters such as trim, heel angles etc. are set in the normal way for each
analysis type included in the Batch analysis. For example, if you want the Large Angle
Stability to use a fixed trim of 0.5 m:
first select the Large Angle Stability analysis type from the analysis menu
set the trim to Fixed trim and 0.5 m
then select Analysis | Batch Analysis
Batch Analysis Environment Options (Criteria)
Any Analysis Environment Options specified prior to a Batch Analysis will be used
during the Batch Analysis. Any criteria that have been set are evaluated at the end of
each analysis and the results of these are also output to the text file.
Important:
For important information on varying displacement while evaluating
criteria, see Important note: heeling arm criteria dependent on displacement
on page 240.
Batch Analysis Results
Before analysis starts, you will be prompted to enter the name and location of the file
where Hydromax will write the results of the batch analysis. Once the analysis is
complete, this tab delimited text file may be imported directly into MS Excel for further
processing.
Because the analyses are simply carried out one after the other, it is not possible to go
back to the results for a specific analysis from within Hydromax; only the results of the
final analysis will be stored in Hydromax.
At the bottom of the dialog is a check box which allows users to select whether the
results of a batch analysis should go to the Report window in Hydromax as well as the
batch analysis text file. When the option for Sending the results to Word is selected in
the Edit | Preferences dialog, the batch analysis will automatically create a Word
document.
Warning:
Sending the results to the Report can slow down analysis considerably and
also consume considerable system resources. For large batch analysis, it is
advisable not to include the results in the report. The report is stored in
memory and if you have insufficient memory, it is possible that your
computer will become very slow to respond and under some circumstances
with certain operating systems even cause Hydromax to crash.
Also see: Reporting on page 155.

Chapter 3 Using Hydromax
Page 141
Analysis Settings
In the previous sections opening and preparing a model in Hydromax was discussed
together with descriptions of the different Analysis types. This section will describe the
following analysis settings:
Heel
Trim
Draft
Displacement
Specified Conditions
Permeability
Hydromax will allow specification of only those analysis settings that apply to the
currently selected analysis type.
In hydrostatic analysis, there are three degrees of freedom: Trim, Heel and Draft.
Hydromax matches the trim, heel and draft with the vessel‟s mass and centre of gravity
or visa versa. This way the volume of the displaced hull matches the required mass and
the centres of gravity and buoyancy lie one above the other in a vertical line. For
example: it can match a specified heel, trim and draft by varying the displacement and
centre of gravity; or it can match a specified displacement and centre of gravity by
varying the heel, trim and draft. Combinations of both are also possible. The following
table is a very simplified representation of the degrees of freedom and their weight
counterpart:
Degree of Freedom Weight
1 Draft Displacement
2 Trim Longitudinal Centre of Gravity (LCG)
3 Heel Transverse Centre of Gravity (TCG)
In fact it is a rather more complicated situation than that suggested by the table above,
because vertical centre of gravity is also important and also because most of the
variables are coupled.
The various analysis types and settings can be thought of as setting one variable in each
pair to a fixed value and deriving the others from the analysis.
For example: the Upright Hydrostatics analysis consists of fixing heel and trim and
stepping through a series of fixed drafts. In this case the LCB and TCB (and therefore
the required LCG and TCG) are calculated from the underwater hullshape at each draft.
For an equilibrium analysis all degrees of freedom are derived from the centre of gravity
and Displacement. In the Specified Condition Analysis any combination of the variable
pairs may be specified.
Heel
The Heel dialog from the analysis menu is used to specify the range of heel angles to be
used for Large Angle Stability, KN and Limiting KG analyses. Heel angles between -
180 and +180 may be specified. The heel steps must be positive. If only one set of
steps is required, simply put 0 in the other steps.

Chapter 3 Using Hydromax
Page 142
If there is any asymmetry in the vessel due to either: hull shape, key points, loading,
damage, etc., and there is any doubt as to which will be the worst heel direction, then the
analysis should be carried out for both heel to starboard and heel to port to find the most
pessimistic condition.
If all the heel angle intervals are 10 deg or less, Hydromax will fit a cubic spline to the
GZ curve and use this to interpolate for values between the tested heel angles. If any step
is greater than 10 deg, Hydromax will not do any curve fitting and linear interpolation
will be used.
Note:
For the angle of equilibrium to be found (when analysing criteria), it is
essential that the GZ curve crosses the GZ=0 axis with positive slope. It is
possible that the GZ at zero heel may be very slightly positive (due to
asymmetry or rounding error) for this reason, it is advisable to test at least
one negative heel angle, at say -5 degrees, to ensure that the equilibrium
angle is identified.
It is good practise to start the heel range at an angle of approximately -30°.
This is to allow roll back angle criteria to be evaluated correctly.
Note:
The heel angles to be used are specified independently for each analysis
mode. This can be a source of apparent differences in the results from the
different analyses.
Trim
For most analyses you may specify whether the vessel is free-to-trim or has fixed trim.
Select Trim in the Analysis menu to bring up the Trim dialog.
Trim may be specified for Upright Hydrostatics, Large Angle Stability, KN Analysis
Limiting KG, Floodable Length and Tank Calibrations. (For the Specified Condition
analysis, the trim may be specified in the Specified Conditions dialog.) Equilibrium and
Longitudinal Strength analyses always use a free trimming (and free heeling) analysis so
that there is no trimming (or heeling) moment applied to the vessel at the final
equilibrium.

Chapter 3 Using Hydromax
Page 143
Essentially there are three options for trim:
1. Fixed trim – the analysis is carried out at a fixed, specified initial trim. This
applies to all analyses that carry out a large angle stability-type analysis (Large
Angle Stability, Limiting KG, KN, Probabilistic Damage) as well as Upright
Hydrostatics and Tank Calibrations
2. Free to trim to loadcase – the analysis trims the vessel to the CG specified in the
loadcase. This option is available for all analyses that have a loadcase: Large
Angle Stability, Equilibrium, Longitudinal Strength, Probabilistic Damage.
3. Free to trim to specified CG – this is again free-to-trim but the CG is specified in
the dialog. This is for when a range of displacements is used for the analysis:
Limiting KG, KN, Floodable Length. In this case, all three components of the
CG need to be know. This it is possible to specify the LCG either directly or so
that the upright, intact vessel floats at a specified trim. The TCG and VCG are
specified directly. In the case of the Limiting KG analysis, the VCG is being
found by the analysis, so cannot be specified. For the Floodable Length analysis,
heel is not considered thus TCG cannot be specified.
Specification of different trim options is dependent on the type of analysis currently selected.
Fixed trim
(KN and Limiting KG analyses only).
The analysis is carried out with the specified fixed trim; the vessel is not free-to-
trim as it heels. Although considerably faster, this analysis will tend to over-
estimate ship stability properties such as GZ.
Free-to-trim using a specified initial trim value
Using this method, for each displacement, the LCB of the intact vessel at the
specified trim and zero heel is computed. The LCG is calculated using this value
and the VCG. Calculations at each heel angle of the large angle stability analysis
are then done free-to-trim using the derived LCG and VCG. Thus, for each
displacement, the upright, intact vessel trim will be the same, but the LCG will be
different.
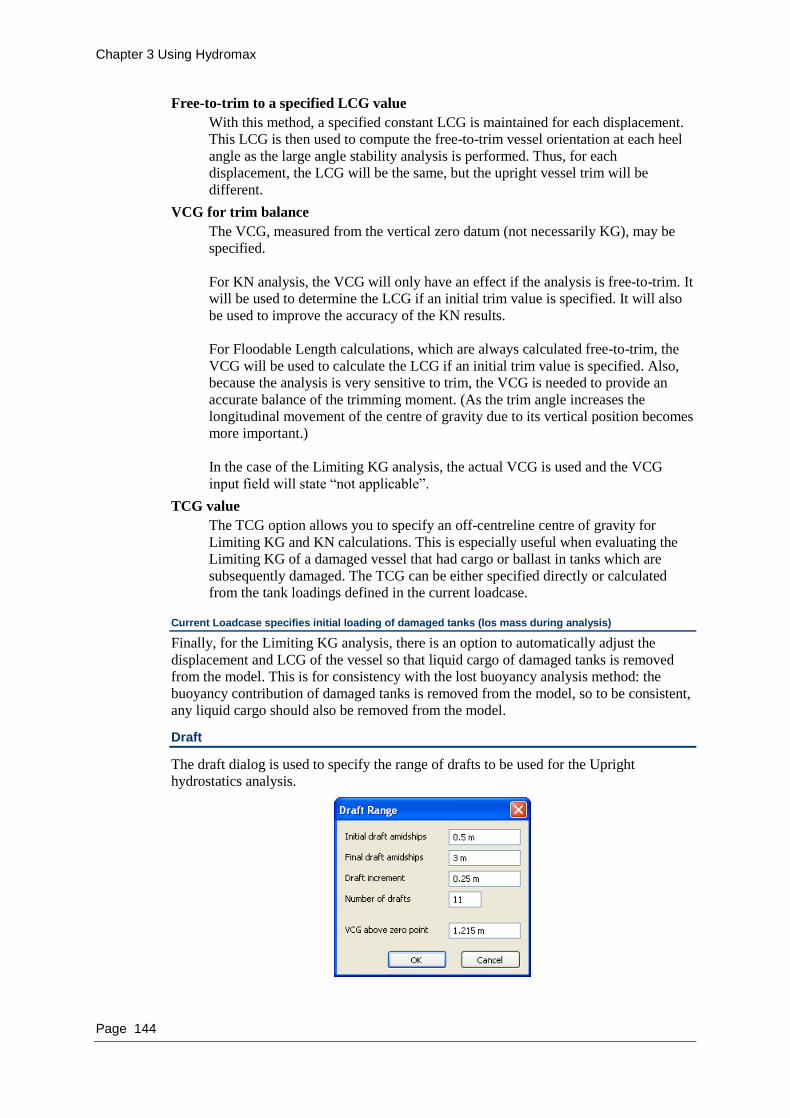
Chapter 3 Using Hydromax
Page 144
Free-to-trim to a specified LCG value
With this method, a specified constant LCG is maintained for each displacement.
This LCG is then used to compute the free-to-trim vessel orientation at each heel
angle as the large angle stability analysis is performed. Thus, for each
displacement, the LCG will be the same, but the upright vessel trim will be
different.
VCG for trim balance
The VCG, measured from the vertical zero datum (not necessarily KG), may be
specified.
For KN analysis, the VCG will only have an effect if the analysis is free-to-trim. It
will be used to determine the LCG if an initial trim value is specified. It will also
be used to improve the accuracy of the KN results.
For Floodable Length calculations, which are always calculated free-to-trim, the
VCG will be used to calculate the LCG if an initial trim value is specified. Also,
because the analysis is very sensitive to trim, the VCG is needed to provide an
accurate balance of the trimming moment. (As the trim angle increases the
longitudinal movement of the centre of gravity due to its vertical position becomes
more important.)
In the case of the Limiting KG analysis, the actual VCG is used and the VCG
input field will state “not applicable”.
TCG value
The TCG option allows you to specify an off-centreline centre of gravity for
Limiting KG and KN calculations. This is especially useful when evaluating the
Limiting KG of a damaged vessel that had cargo or ballast in tanks which are
subsequently damaged. The TCG can be either specified directly or calculated
from the tank loadings defined in the current loadcase.
Current Loadcase specifies initial loading of damaged tanks (los mass during analysis)
Finally, for the Limiting KG analysis, there is an option to automatically adjust the
displacement and LCG of the vessel so that liquid cargo of damaged tanks is removed
from the model. This is for consistency with the lost buoyancy analysis method: the
buoyancy contribution of damaged tanks is removed from the model, so to be consistent,
any liquid cargo should also be removed from the model.
Draft
The draft dialog is used to specify the range of drafts to be used for the Upright
hydrostatics analysis.

Chapter 3 Using Hydromax
Page 145
The VCG specified in the draft dialog is used for the calculation of upright stability
characteristics such as GMt only, and is specified in terms of KG – i.e. from the
baseline, which is not necessarily the vertical zero datum.
Displacement
The displacement dialog is used to specify the range of displacements to be used for the
KN, Limiting KG and Floodable Length calculations.
Specified Conditions
The specified conditions analysis setting is only available for the specified condition
analysis.
See Specified Conditions on page 90.
Permeability
The Permeabilities are set in a table in the Permeability dialog. Use the Add and Delete
buttons to add or delete rows from the table. The permeabilities may be sorted by double
clicking on the permeability column heading. The last set of permeabilities used will be
recalled from the registry when Hydromax is started.
The Permeability dialog is used to specify the permeabilities to be used for the Floodable
Length analysis; the permeability is applied over the entire length of the vessel.
This permeability is unrelated to compartment, tank or non-buoyant volume permeability
and is only used for floodable length calculations.
Individual Permeability of Tanks and Compartments
The individual permeability of each compartment (or tank) is specified in the
Compartment definition table. The compartment, tank and non-buoyant volume
permeabilities are used when calculating the effects of damage, and/or calculating the
weights of fluids in tanks in the loadcase.

Chapter 3 Using Hydromax
Page 146
Also see:
Modelling Compartments on page 51
Tolerances
In the Edit | Preferences dialog, calculation tolerances can be set. This defines the
tolerances that Hydromax uses to determine when to finish iteration during
Large Angle Stability
Equilibrium analysis
Specified conditions
KN calculations
Floodable Length
Longitudinal Strength
Ideal tolerances can range between 0.00001% and 0.1% (1 gram in 10 tonnes of
displacement). Acceptable tolerances can range from 0.001% to 1.0%. Acceptable
tolerances should always be greater than Ideal tolerances.
Convergence Error
Hydromax will attempt to solve most analysis to within the ideal tolerance. If this is not
achieved within a certain number of iterations, but the acceptable error has been
achieved, Hydromax will continue. If convergence to within the acceptable error has not
been achieved, Hydromax will display a warning.
One of the most common causes of non-convergence is if the specified displacement
exceeds the volume of the completely submerged vessel and it sinks. Also convergence
may be poor if the trim angle approaches 90 . If Hydromax thinks that it is likely that
the model has sunk (waterplane area is zero at the current condition) the following dialog
will be displayed. The specified displacement and the actual displacement at the current
iteration are provided for information.
Note
This warning is not displayed during batch analysis, instead the warning is
written in the batch file.
The warning is also not shown when accessing Hydromax from a VBA
macro using the Automation interface

Chapter 3 Using Hydromax
Page 147
If there is a convergence problem, which appears not to be due to sinking, then the
following dialog will be displayed.
This problem can sometimes occur if the specified displacement is extremely small and
the vessel has a large flat bottom, producing a highly non-linear waterplane area vs. draft
plot. Other causes of non-convergence can be non-linear moment to trim vs. trim angle
curve or moment to heel vs. heel angle curve.
Note:
There are occasions when convergence will not necessarily occur within the
maximum allowable number of iterations. If Hydromax fails to converge it
will give you a warning, but will allow you the option of continuing the
search. If you choose to continue, Hydromax will search for the equilibrium
position indefinitely. If the search is unsuccessful after a reasonable period
of time, you can interrupt Hydromax by pausing the analysis.
The analysis will also fail to converge if the trim becomes excessive. All analyses other
than Floodable Length will fail if the trim exceeds +/-45º; in the case of the Floodable
Length analysis, this limit is increased to +/-89º.
Analysis Environment Options
The analysis can be performed in different environments; this section describes the
analysis environment options available in Hydromax in more detail:
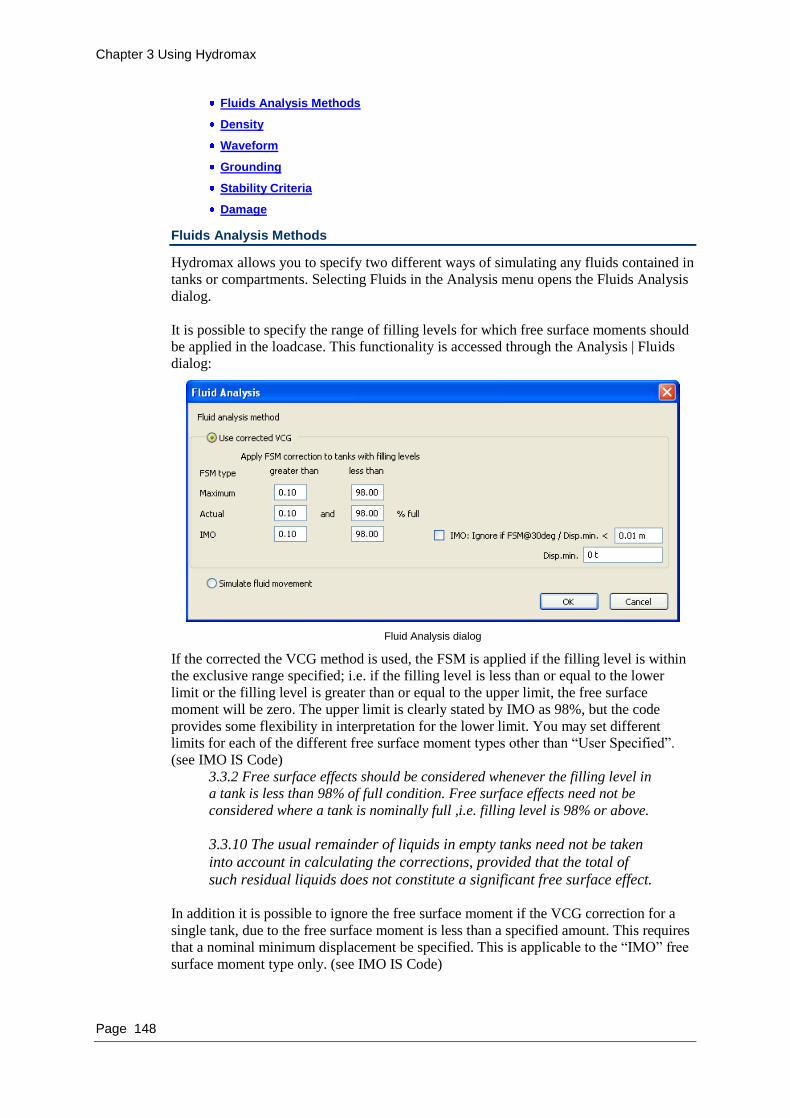
Chapter 3 Using Hydromax
Page 148
Fluids Analysis Methods
Density
Waveform
Grounding
Stability Criteria
Damage
Fluids Analysis Methods
Hydromax allows you to specify two different ways of simulating any fluids contained in
tanks or compartments. Selecting Fluids in the Analysis menu opens the Fluids Analysis
dialog.
It is possible to specify the range of filling levels for which free surface moments should
be applied in the loadcase. This functionality is accessed through the Analysis | Fluids
dialog:
Fluid Analysis dialog
If the corrected the VCG method is used, the FSM is applied if the filling level is within
the exclusive range specified; i.e. if the filling level is less than or equal to the lower
limit or the filling level is greater than or equal to the upper limit, the free surface
moment will be zero. The upper limit is clearly stated by IMO as 98%, but the code
provides some flexibility in interpretation for the lower limit. You may set different
limits for each of the different free surface moment types other than “User Specified”.
(see IMO IS Code)
3.3.2 Free surface effects should be considered whenever the filling level in
a tank is less than 98% of full condition. Free surface effects need not be
considered where a tank is nominally full ,i.e. filling level is 98% or above.
3.3.10 The usual remainder of liquids in empty tanks need not be taken
into account in calculating the corrections, provided that the total of
such residual liquids does not constitute a significant free surface effect.
In addition it is possible to ignore the free surface moment if the VCG correction for a
single tank, due to the free surface moment is less than a specified amount. This requires
that a nominal minimum displacement be specified. This is applicable to the “IMO” free
surface moment type only. (see IMO IS Code)

Chapter 3 Using Hydromax
Page 149
3.3.9 Small tanks which satisfy the following condition using the values of
"k" corresponding to an angle of inclination of 30°, need not be included in
the correction:
m01.0/ minfsM
where fsM is the free surface moment of the tank in question and min is
the ship displacement at the minimum mean service draft of the ship without
cargo, with 10% stores and minimum water ballast, if required.
Note: Tank Calibration results
In the tank calibration results the free-surface moment based on the
transverse second moment of area of the tank waterplane is given for all
filling levels. This is because the actual free surface moment to be used to
determine the VCG in a loadcase depends on the method being used and
also the heel angle in question (in the case of the IMO correction).
Note: Calculation of GM
GM values always use the centre of gravity corrected for free surface
moments even if the “simulate fluid” option has been chosen. Note that the
upright free surface moments as shown in the loadcase are used, not those
from the actual second moment of area of the inclined tank waterplane.
Note
Most documented stability criteria assume that the corrected VCG method
has been used. Although the computational potential is available, authorities
have not adopted this more accurate calculation of the shift in centre of
gravity due to fluid movement.
Fluid analysis method: Use corrected VCG
Tank capacities and free surface moments are calculated for the upright hull (zero trim
and zero heel). The effective rise in VCG due to the tanks' free surface is calculated by
summing the free surface moment of all the tanks and dividing by the total vessel
displacement (the free surface moment to be applied is specified in the loadcase).
This method should be used when compiling a stability booklet for a design, as it
corresponds with the traditional approach used by naval architects and classification
societies worldwide. It is reasonably accurate at low angles of heel and trim.
In this case, the loading window will include a column for free surface moment and cells
for corrected fluid VCG. These values are automatically calculated from the maximum
free surface moments of the tanks, calculated in the upright condition. There are several
FSM types available. For more information, see Working with Loadcases on page 38.
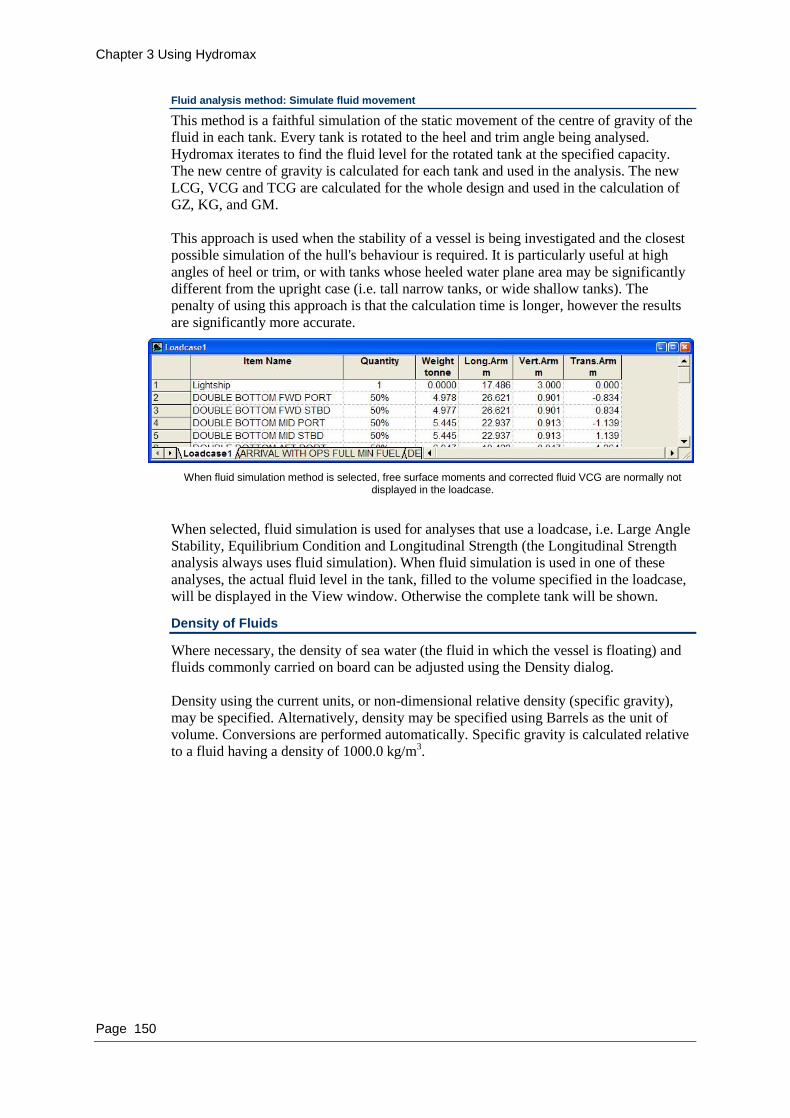
Chapter 3 Using Hydromax
Page 150
Fluid analysis method: Simulate fluid movement
This method is a faithful simulation of the static movement of the centre of gravity of the
fluid in each tank. Every tank is rotated to the heel and trim angle being analysed.
Hydromax iterates to find the fluid level for the rotated tank at the specified capacity.
The new centre of gravity is calculated for each tank and used in the analysis. The new
LCG, VCG and TCG are calculated for the whole design and used in the calculation of
GZ, KG, and GM.
This approach is used when the stability of a vessel is being investigated and the closest
possible simulation of the hull's behaviour is required. It is particularly useful at high
angles of heel or trim, or with tanks whose heeled water plane area may be significantly
different from the upright case (i.e. tall narrow tanks, or wide shallow tanks). The
penalty of using this approach is that the calculation time is longer, however the results
are significantly more accurate.
When fluid simulation method is selected, free surface moments and corrected fluid VCG are normally not displayed in the loadcase.
When selected, fluid simulation is used for analyses that use a loadcase, i.e. Large Angle
Stability, Equilibrium Condition and Longitudinal Strength (the Longitudinal Strength
analysis always uses fluid simulation). When fluid simulation is used in one of these
analyses, the actual fluid level in the tank, filled to the volume specified in the loadcase,
will be displayed in the View window. Otherwise the complete tank will be shown.
Density of Fluids
Where necessary, the density of sea water (the fluid in which the vessel is floating) and
fluids commonly carried on board can be adjusted using the Density dialog.
Density using the current units, or non-dimensional relative density (specific gravity),
may be specified. Alternatively, density may be specified using Barrels as the unit of
volume. Conversions are performed automatically. Specific gravity is calculated relative
to a fluid having a density of 1000.0 kg/m3.
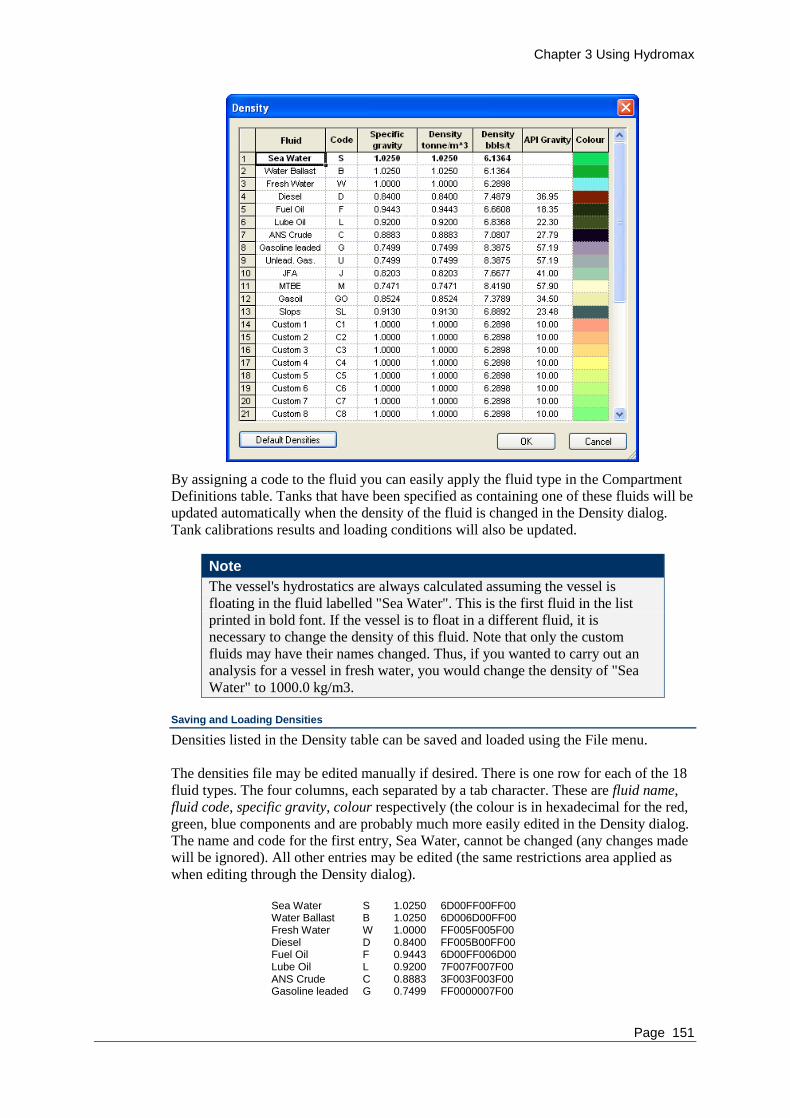
Chapter 3 Using Hydromax
Page 151
By assigning a code to the fluid you can easily apply the fluid type in the Compartment
Definitions table. Tanks that have been specified as containing one of these fluids will be
updated automatically when the density of the fluid is changed in the Density dialog.
Tank calibrations results and loading conditions will also be updated.
Note
The vessel's hydrostatics are always calculated assuming the vessel is
floating in the fluid labelled "Sea Water". This is the first fluid in the list
printed in bold font. If the vessel is to float in a different fluid, it is
necessary to change the density of this fluid. Note that only the custom
fluids may have their names changed. Thus, if you wanted to carry out an
analysis for a vessel in fresh water, you would change the density of "Sea
Water" to 1000.0 kg/m3.
Saving and Loading Densities
Densities listed in the Density table can be saved and loaded using the File menu.
The densities file may be edited manually if desired. There is one row for each of the 18
fluid types. The four columns, each separated by a tab character. These are fluid name,
fluid code, specific gravity, colour respectively (the colour is in hexadecimal for the red,
green, blue components and are probably much more easily edited in the Density dialog.
The name and code for the first entry, Sea Water, cannot be changed (any changes made
will be ignored). All other entries may be edited (the same restrictions area applied as
when editing through the Density dialog).
Sea Water S 1.0250 6D00FF00FF00 Water Ballast B 1.0250 6D006D00FF00 Fresh Water W 1.0000 FF005F005F00 Diesel D 0.8400 FF005B00FF00 Fuel Oil F 0.9443 6D00FF006D00 Lube Oil L 0.9200 7F007F007F00 ANS Crude C 0.8883 3F003F003F00 Gasoline leaded G 0.7499 FF0000007F00

Chapter 3 Using Hydromax
Page 152
Unlead. Gas. U 0.7499 FF007F007F00 JFA J 0.8203 7F007F00FF00 MTBE M 0.7471 F600FA00C900 Gasoil GO 0.8524 FF00FF007F00 Slops SL 0.9130 FF006F00FF00 Custom 1 C1 1.0000 D6000300D600 Custom 2 C2 1.0000 D600D6000300 Custom 3 C3 1.0000 0300D600D600 Custom 4 C4 1.0000 D60003000300 Custom 5 C5 1.0000 DF00DF00DF00
If you make an error, you can always reset the densities to their default values in the
Densities dialog.
Also see:
Windows Registry on page 16
Waveform
Hydromax is capable of analysing hydrostatics and stability in arbitrary waveforms as
well as for a level water plane. To specify a waveform, select the Waveform command
from the Analysis menu:
The water plane can be specified as flat, or as a sinusoidal or trochoidal waveform. If a
waveform is specified, the wavelength, wave height and phase offset can be specified.
The wavelength defaults to the waterline length of the hull at the DWL. If the
wavelength is modified the wave height defaults to a value in metres of:
Wave height [m] = 0.607 √ Wavelength [m]
This is the metric equivalent of the US Naval standard wave height:
Wave height [ft] = 1.1 √ Wavelength [ft]
For short waves of wavelength less than 64m, the waveheight reduces linearly with
wavelength given by the formula:
Wave height = 0.075875 Wavelength

Chapter 3 Using Hydromax
Page 153
Once a wavelength has been set, the wave height may be modified.
The phase offset governs the position of the wave crest aft of the forward end of the
DWL, as a proportion of the wavelength. The phase offset varies between 0 and 1, both
of which correspond to a wave crest at the forward end of the DWL.
For example, a phase offset of 0.5, with a wavelength equal to the waterline length, will
give a single wave crest at amidships.
Grounding
Grounding is an additional analysis environment option for the Equilibrium or
Longitudinal Strength analysis. It is possible to specify grounding on one or two points
of variable length. The Equilibrium analysis will determine whether the hull is grounded
or free floating and will trim the hull accordingly. Damage can be specified concurrently
with grounding.
If the vessel touches one or both grounding points, this will be reflected in the results:
The displacement column will show the total grounding reaction force in brackets;
the sum of the buoyancy and the grounding reactions equals the loadcase
displacement.
The effective centre of gravity will be modified by the grounding reactions – a
mass is effectively being removed from the vessel; this will bring the effective
centres of gravity and the centre of buoyancy in line vertically. The value of KG,
GMt and GMl are all calculated to the effective centre of gravity. Remember that
KG is measured in the upright vessel reference frame (normal to the baseline);
whilst GMt and GMl are the actual vertical separation of the metacentres above
the centre of gravity in the trimmed reference frame normal to the sea surface.
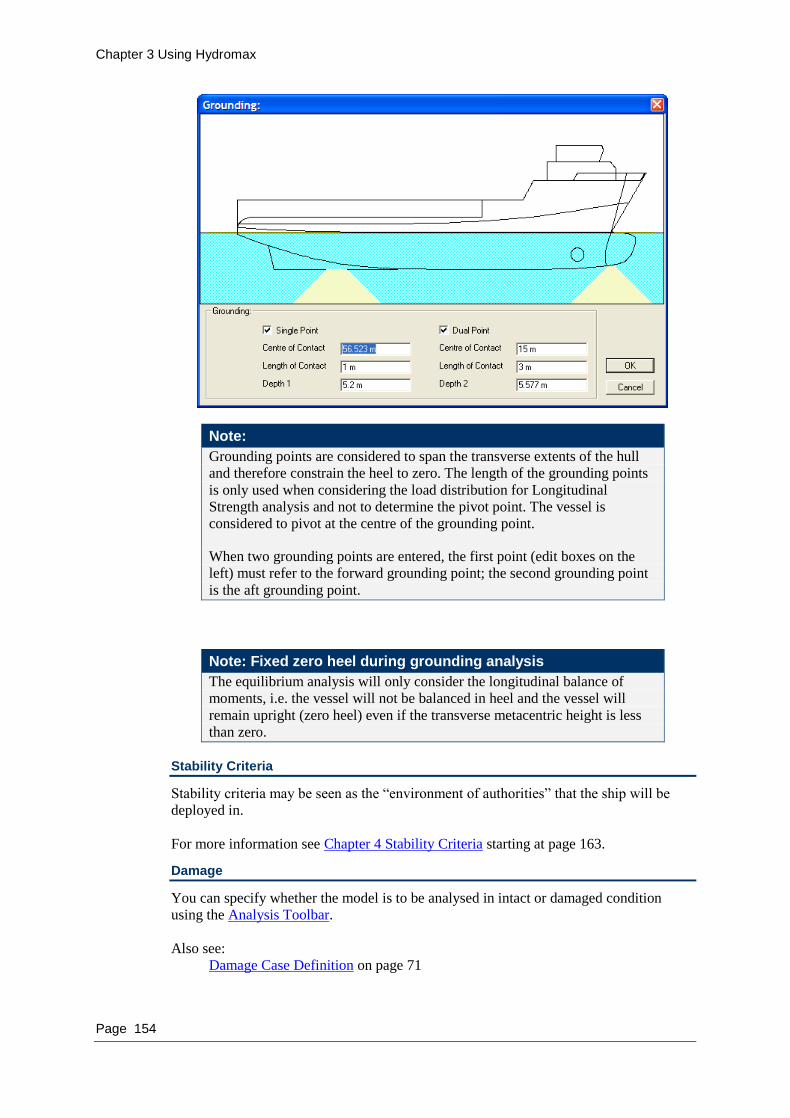
Chapter 3 Using Hydromax
Page 154
Note:
Grounding points are considered to span the transverse extents of the hull
and therefore constrain the heel to zero. The length of the grounding points
is only used when considering the load distribution for Longitudinal
Strength analysis and not to determine the pivot point. The vessel is
considered to pivot at the centre of the grounding point.
When two grounding points are entered, the first point (edit boxes on the
left) must refer to the forward grounding point; the second grounding point
is the aft grounding point.
Note: Fixed zero heel during grounding analysis
The equilibrium analysis will only consider the longitudinal balance of
moments, i.e. the vessel will not be balanced in heel and the vessel will
remain upright (zero heel) even if the transverse metacentric height is less
than zero.
Stability Criteria
Stability criteria may be seen as the “environment of authorities” that the ship will be
deployed in.
For more information see Chapter 4 Stability Criteria starting at page 163.
Damage
You can specify whether the model is to be analysed in intact or damaged condition
using the Analysis Toolbar.
Also see:
Damage Case Definition on page 71
Chapter 3 Using Hydromax
Page 155
Analysis Output
Hydromax will produce the following output data:
Hydromax model visualisation
Result data tables per analysis
Graphs per analysis
Report
o Report window
o Streamed directly to a Word document
o Report Templates
In this section:
Reporting
Copying
Select View from Analysis Data
Saving the Hydromax Design
Exporting
Reporting
Hydromax has several options to do your reporting:
Batch Analysis text file and/or streaming to Report window
Automatically generate a report in the Report Window for each analysis run
Automatically Streaming results to Word
Manually copy and paste tables and graphs from the Results Window and Graph
Window
The most efficient method depends on the number of loadcases and damage cases you
have to analyse and the output you require.
Form small number of loadcases and damage cases you can do a manual copy and paste
of the results into a report. This then allows you to validate the results at the same time.
For large numbers of cases, it is recommended to use batch analysis. Batch Analysis
results saved as text files do not include graphs. Select the option to send the results to
the report window if you require Graphs. Additionally, if the option to Stream the report
to Word has been selected in the Edit | Preferences dialog a word document is
automatically generated after a Batch Analysis.
Streaming results to Word
It is possible to stream the Analysis results directly to Word. To do this:
Edit | Preferences
Select the option to Send the Report to Word
This will send the Report document to Word instead of to the Report window. After you
have run an analysis a Word document is created and opened automatically. This also
applies to Batch Analysis.

Chapter 3 Using Hydromax
Page 156
Report Templates
Hydromax offers the ability to customise reports through a Report Template. This
feature is only available when sending reports to Microsoft Word.
With report templates, instead of just dumping the results of each analysis into a Word
document, it is possible to use template keywords to specify where in the document the
analysis results go and where each element of the output (such as graph, tables, etc) is
placed.
This gives you much greater control over how the analysis results are output than with
the normal Send Report to Word option and allows you to customise your own report
template document.
To turn on Report Templating you need to select it in the Preferences dialog box.
Simply tick the box „Use Word Templating‟. Please note that Send Report to Word
must be enabled before you can enable this option. See the dialog box below as an
example:
The Word Template File specified should be in .dot or .dotx/dotm (for Word 2007)
format and will be used when creating any future reports. You can use one of the sample
templates provided, or you can build your own template.
Two Report Templates have been included to get you started:
StabilityBooklet.dot

Chapter 3 Using Hydromax
Page 157
This is an example of a complete Stability Booklet template – this document is the
default Word Template file for new users and is recommend for users wanting to
quickly create a Stability Booklet. Users can start with StabilityBootlet.dot and then
use it customise their own report template.
HMReportTemplate.dot
This document is a good starting point for creating your own customised template. It
contains an introduction to how templates are created and configured. It also includes
all of the basic analysis blocks and variables to get you started.
Both of these templates contain macros and toolbar items to make life easier when you
design your own template. These allow you to easily add and remove the analysis
keyword blocks.
Note:
To edit a report template in Microsoft Word you will need to start Microsoft
Word and then open the template directly using the File menu. Simply
double-clicking on a template document opens up a new document based on
the template (which is not what you want).
The location of these report templates varies depending on which operating system you
are using.
On Windows XP/Server 2003 the default location for the report templates is:
C:\Program Files\Maxsurf 14\Report Templates\
On Windows Vista, due to new security changes we‟ve had to move this to an alternative
location that every user has write access to – so you can find it at:
C:\Users\Public\Documents\Maxsurf\Maxsurf14\Report Templates\
Tips:
See:
Copying Tables on page 158 for tips on how to include the table header in a copy
paste to for example Excel
Graph Formatting on page 190 for tips on how to format your graph prior to
copying to another application.
Data Format on page 207 for tips on how to specify what should be displayed and
customise how to display tables (vertical or horizontal).
Copying & Printing
A range of options for transferring data from Hydromax to other programs such as
spreadsheets and word processors is provided through copy and paste functions. This
data transfer works both ways: e.g. copying and pasting data to and from Excel
spreadsheets allows you to use the full spreadsheet capabilities of Excel on your
Hydromax model.
Copying Hull Views
Pictures of the hull in the View windows may be copied to the Clipboard using the Copy
command from the Edit menu. The image copied is as per the image displayed in the
Hydromax view window.

Chapter 3 Using Hydromax
Page 158
These pictures can then be pasted into other applications or the Hydromax Report
window.
To copy a simple bitmap image of the view at the current resolution, use Ctrl+I;
additionally, a bitmap of the current image may be saved by pressing Ctrl+Shift+I
Copying Tables
Tables may be copied to the clipboard. Simply select a cell, row, column, range of cells
or the whole table and then choose the Copy command or Ctrl+C.
The data copied from the table will be placed on the clipboard and can then be pasted
into a spreadsheet or word processor for further work.
Note:
Copying data from the table with the Shift key depressed, will also copy the
column headings.
Printing
Each of the windows in Hydromax may be printed. Simply bring the window you wish
to print to the front and choose Print from the File menu. Views of the hull in the View
window may be printed to scale as in Maxsurf.
Prior to printing you may wish to set up the paper size and orientation by using the Page
Setup command from the File menu.
Print Preview
The page to be printed is initially displayed in print preview mode. To print the page
click the Print button, otherwise click the Cancel button.
The printing may be forced to be black and white. Choose the Colours button and select
the options required. Note that the print preview is not refreshed after these changes, but
the selection will be reflected in the printout.
The titles may be edited by clicking the Titles button.
Graph Printing to Scale
When printing the graph, it is possible to ensure that the graph is plotted to a sensible
scale so that measurements can be made directly from the graph. To do this, hold the
shift key down when selecting the print command for the graph. You will be asked if you
want to print the graph to scale or to fill the page:
The scale used will depend on the length units that are currently selected. If these are
metric, then the graph will be plotted so that the grid lines are at one of the following
intervals (If the current length units are imperial then similar intervals will be used, but
they will be inches instead of cm.): 1.0cm, 2.0cm, 2.5cm, 5.0cm.
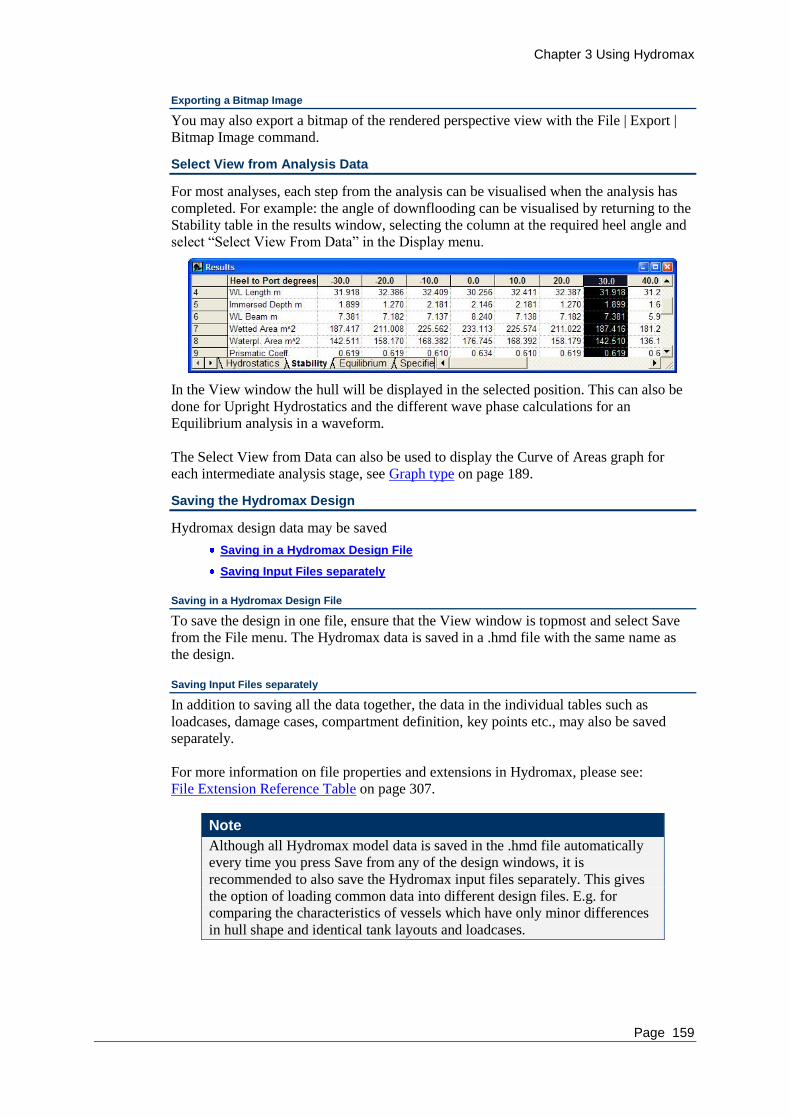
Chapter 3 Using Hydromax
Page 159
Exporting a Bitmap Image
You may also export a bitmap of the rendered perspective view with the File | Export |
Bitmap Image command.
Select View from Analysis Data
For most analyses, each step from the analysis can be visualised when the analysis has
completed. For example: the angle of downflooding can be visualised by returning to the
Stability table in the results window, selecting the column at the required heel angle and
select “Select View From Data” in the Display menu.
In the View window the hull will be displayed in the selected position. This can also be
done for Upright Hydrostatics and the different wave phase calculations for an
Equilibrium analysis in a waveform.
The Select View from Data can also be used to display the Curve of Areas graph for
each intermediate analysis stage, see Graph type on page 189.
Saving the Hydromax Design
Hydromax design data may be saved
Saving in a Hydromax Design File
Saving Input Files separately
Saving in a Hydromax Design File
To save the design in one file, ensure that the View window is topmost and select Save
from the File menu. The Hydromax data is saved in a .hmd file with the same name as
the design.
Saving Input Files separately
In addition to saving all the data together, the data in the individual tables such as
loadcases, damage cases, compartment definition, key points etc., may also be saved
separately.
For more information on file properties and extensions in Hydromax, please see:
File Extension Reference Table on page 307.
Note
Although all Hydromax model data is saved in the .hmd file automatically
every time you press Save from any of the design windows, it is
recommended to also save the Hydromax input files separately. This gives
the option of loading common data into different design files. E.g. for
comparing the characteristics of vessels which have only minor differences
in hull shape and identical tank layouts and loadcases.

Chapter 3 Using Hydromax
Page 160
Saving Loadcases to a File
Once you have set up a loading spreadsheet, you can save it in a file on disk. This
allows the same loading spreadsheet to be recalled at any time for use with the
same design or with any other hull.
To save the loadcase table, ensure the Loadcase window is topmost on the screen
and choose Save Load Case from the File Menu. Selecting this option saves all the
loads displayed in the current tab in the Loadcase window.
Saving Damage Cases to a File
Bring the Damage window to the front and select Save Damage Cases or Save
Damage Cases As from the file menu.
Saving Compartment Definitions to a File
To save a compartment definition to a file, bring the Input window to the front and
choose the compartment definition table; select Save Compartment Definition
from the File menu. You will be asked to name the file and select where it is to be
saved.
Saving Input Window Tables
To save a input window table to a file, bring the Input window to the front and
choose the required input table; select Save from the File menu. You will be asked
to name the file and select where it is to be saved.
Saving Results to a File
Once you have performed an analysis, the data generated may be saved as a text file.
This allows for further calculations to be done in a spreadsheet or for formatting to be
done in Word, Excel or other programs.
To save the data, ensure the Results window is topmost on the screen and choose the
table containing the data you wish to save. Select Save or Save As from the File Menu.
Selecting this option saves all the data currently displayed in the Results window. The
Results files are saved as tab delimited text, meaning that they can be read directly into
spreadsheets such as Excel with values being placed in individual spreadsheet cells.
Exporting
The data export function in Hydromax is similar to Maxsurf. Some Hydromax-specific
export features are described below.
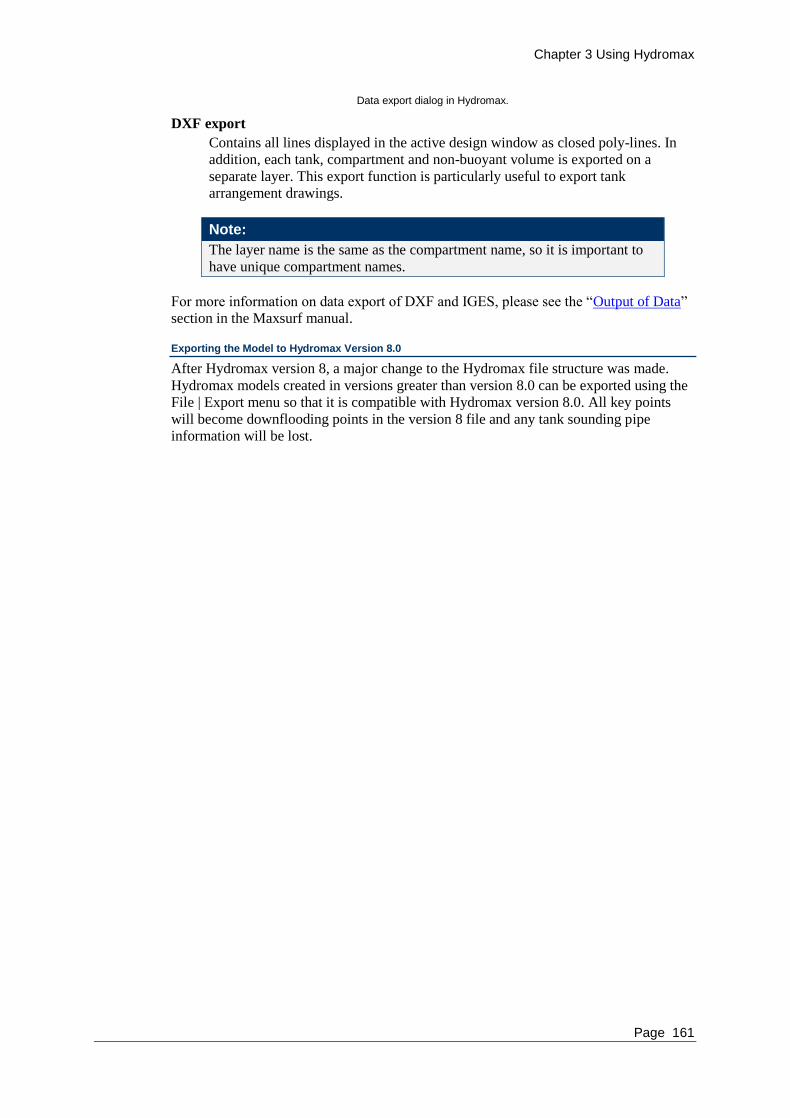
Chapter 3 Using Hydromax
Page 161
Data export dialog in Hydromax.
DXF export
Contains all lines displayed in the active design window as closed poly-lines. In
addition, each tank, compartment and non-buoyant volume is exported on a
separate layer. This export function is particularly useful to export tank
arrangement drawings.
Note:
The layer name is the same as the compartment name, so it is important to
have unique compartment names.
For more information on data export of DXF and IGES, please see the “Output of Data”
section in the Maxsurf manual.
Exporting the Model to Hydromax Version 8.0
After Hydromax version 8, a major change to the Hydromax file structure was made.
Hydromax models created in versions greater than version 8.0 can be exported using the
File | Export menu so that it is compatible with Hydromax version 8.0. All key points
will become downflooding points in the version 8 file and any tank sounding pipe
information will be lost.


Chapter 4 Stability Criteria
Page 163
Chapter 4 Stability Criteria
This chapter describes how stability criteria are used in Hydromax. Stability criteria are
evaluated for Large Angle Stability, Equilibrium and Limiting KG calculations. A fixed
sub-set of criteria is used for the Floodable length analysis and these criteria are accessed
in their own, simplified dialog.
The following sections will be discussed:
Criteria Concepts, an overview of what capabilities Hydromax offers with regards
to stability criteria.
Criteria Procedures, explanation how to work with the Hydromax criteria dialog to
create your own custom set of criteria.
Criteria Results, criteria evaluation results
Nomenclature, explanation of terms and definitions
See also:
Appendix B: Criteria file format
Appendix C: Criteria Help
Appendix D: Specific Criteria
Criteria Concepts
Hydromax includes a wide range of template criteria (or: parent criteria) as well as pre-
defined custom criteria such as IMO, HSC, DNV, ISO and more. Hydromax uses a
single dialog to control all the stability criteria. This makes it quick and easy to set which
criteria should be included for analysis and to change criteria parameters. It is also
possible for users to create their own custom sets of criteria. Users may save, import and
edit their criteria sets. These custom criteria files may be easily transferred via email.
Criteria may be identified as intact or damage criteria (or both). This ensures that the
correct criteria are evaluated and displayed during normal and batch analysis. Although
all criteria are displayed in the criteria table, only criteria that are applicable are added to
the report; i.e.: if the intact case is being computed, only the criteria that are selected for
evaluation during an intact analysis will be evaluated and added to the report, similarly
for the damage cases.
Criteria results are added to the Report after a Large Angle Stability or Equilibrium
analysis. However, only the applicable criteria are added to the report (although all are
displayed in the Results table); i.e. after an Equilibrium analysis only those criteria that
are evaluated from Equilibrium data are added, and after a Large Angle Stability analysis
only GZ based criteria are added to the report.
Help information relating to the use and parameters of each criterion is displayed in the
lower right hand corner of the dialog.
Criteria List Overview
Hydromax includes a wide range of criteria. These criteria are listed using in a tree
control on the left-hand side of the criteria dialog. This section describes how this list of
criteria can be divided up in to Parent heeling arms, Parent criteria, predefined custom
criteria and user created custom criteria. This section also explains how all criteria can be
divided up into two different criteria types: equilibrium and GZ curve based.
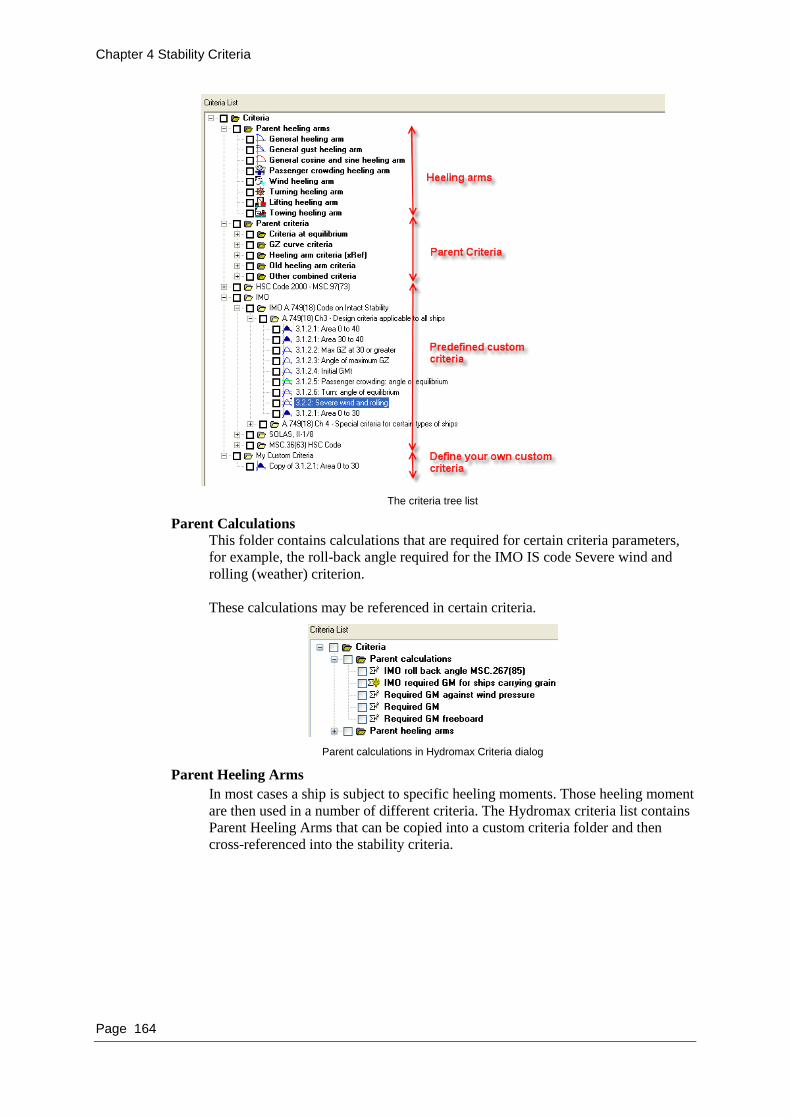
Chapter 4 Stability Criteria
Page 164
The criteria tree list
Parent Calculations
This folder contains calculations that are required for certain criteria parameters,
for example, the roll-back angle required for the IMO IS code Severe wind and
rolling (weather) criterion.
These calculations may be referenced in certain criteria.
Parent calculations in Hydromax Criteria dialog
Parent Heeling Arms
In most cases a ship is subject to specific heeling moments. Those heeling moment
are then used in a number of different criteria. The Hydromax criteria list contains
Parent Heeling Arms that can be copied into a custom criteria folder and then
cross-referenced into the stability criteria.

Chapter 4 Stability Criteria
Page 165
The advantage of using cross-referenced Heeling Arms is that a heeling arm is
now defined (and edited) in only one place. This ensures that all criteria which use
a specific heeling arm use exactly the same heeling arm. Another benefit is that,
since the heeling arm is defined in one place, it is only displayed once in the GZ
graph and not duplicated for each criterion that uses it. Furthermore some newer
heeling arm criteria are only available for cross-referenced heeling arms and a
greater variety of heeling arm definitions are available through cross-referencing.
Parent Criteria
The Parent Criteria group contains all the parent criteria types that are available in
Hydromax. Each parent criterion allows you to perform a specific calculation;
these are the fundamental criteria from which criteria for specific codes are
derived.
Parent criteria are special in that you cannot rename, delete or add criteria to the
Parent Criteria group. Also the parent criteria settings cannot be saved, they will
always revert to their default values when Hydromax is restarted. This is because
the parent criteria are intended for use as templates from which you can derive
your own custom criteria. This is done by dragging the required parent criteria in
to the “My custom criteria” group or any other group you create.
To distinguish the Parent criteria from your derived criteria, they are displayed in
bold text in the Criteria list.
Predefined Custom Criteria
A number of criteria files containing criteria for specific codes are supplied with
Hydromax. These may be found in the “HMSpecificCriteria” folder. This folder
can be found in the Maxsurf root directory: c:\program files\Maxsurf.
Most specific criteria are locked; those that are not locked require your ship design
data to be input.
Also see
Working with Criteria Libraries on page 172
Appendix D: Specific Criteriaon page 291.
Custom Criteria
You can create your own set of criteria in the tree as well. This is explained in the
section on Working with Criteria on page 168.

Chapter 4 Stability Criteria
Page 166
Types of criteria
There are two fundamental types of criteria:
Equilibrium criteria
Equilibrium criteria are evaluated after an Equilibrium analysis and refer only to
the condition of the vessel in its equilibrium state For example: margin line
immersion tests, freeboard measurements, trim angle, metacentric height, etc. This
type of criterion is also used by the Floodable Length analysis. Equilibrium
criteria can be recognised by the icon.
Criteria derived from measurements of the GZ curve.
These are calculated after a Large Angle Stability analysis and during a Limiting
KG analysis. For example, area under GZ curve between specified limits, angle of
maximum GZ, etc. These criteria are often referred to as Large Angle Stability
(LAS) or GZ criteria.
Note that there is some cross-over between the criteria types, notably angle of
equilibrium heel. This can be measured from the GZ curve by looking for an up-crossing
of the GZ=0 axis. The equilibrium heel angle is also a fundamental output of the
Equilibrium analysis. The same also applies for GMt. For this reason, in some criteria
sets some criteria are included twice, once in the form of an Equilibrium criterion and
again as a Large Angle Stability criterion.
For a criterion to be used in the search for maximum VCG in the Limiting KG analysis,
it must be a LAS criterion. This is because it is only this type of criteria that is more
likely to pass as VCG is reduced. A check is also made to ensure that any selected
Equilibrium criteria are passed, but they cannot be included directly in the search
algorithm.
You will notice that different icons are used to differentiate between different types of
criteria. These icons are derived from the parent criterion type. The different types of
criteria and their icons are described below:
Folder icon, create separate folders to store related criteria. All folders must
have unique names (even if the parent folders have different names).
Equilibrium criterion. These criteria are evaluated only after an equilibrium
analysis has been performed.
GZ criterion. These criteria make measurements from the GZ curved obtained
from a Large Angle Stability analysis.
GZ area criterion
GZ criterion with heeling arm
GZ area criterion with heeling arm
GZ criterion with several heeling arms and their combinations
GZ area criterion with several heeling arms and their combinations
Combined GZ criterion. These criteria perform several individual tests on the
GZ curve. e.g. STIX.
Combined GZ heeling arm criterion. These criteria perform several individual
tests on the GZ curve including a heeling arm. e.g. Weather criterion.
See next: Criteria Procedures
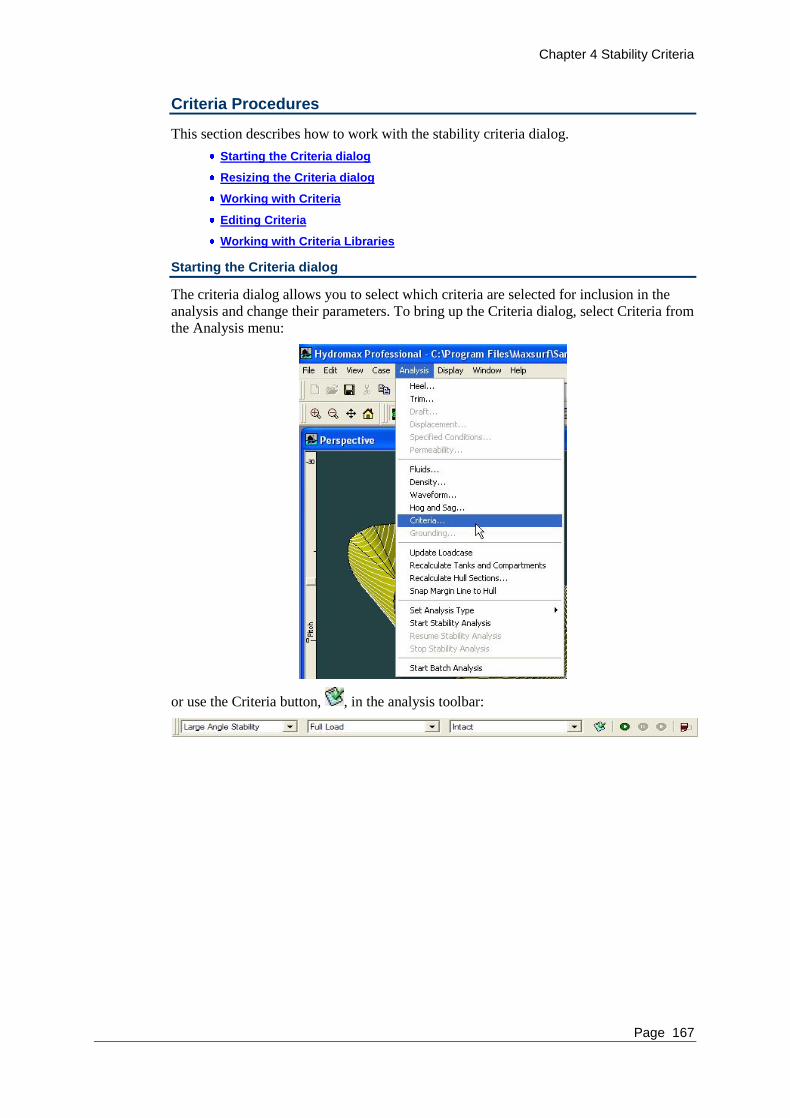
Chapter 4 Stability Criteria
Page 167
Criteria Procedures
This section describes how to work with the stability criteria dialog.
Starting the Criteria dialog
Resizing the Criteria dialog
Working with Criteria
Editing Criteria
Working with Criteria Libraries
Starting the Criteria dialog
The criteria dialog allows you to select which criteria are selected for inclusion in the
analysis and change their parameters. To bring up the Criteria dialog, select Criteria from
the Analysis menu:
or use the Criteria button, , in the analysis toolbar:
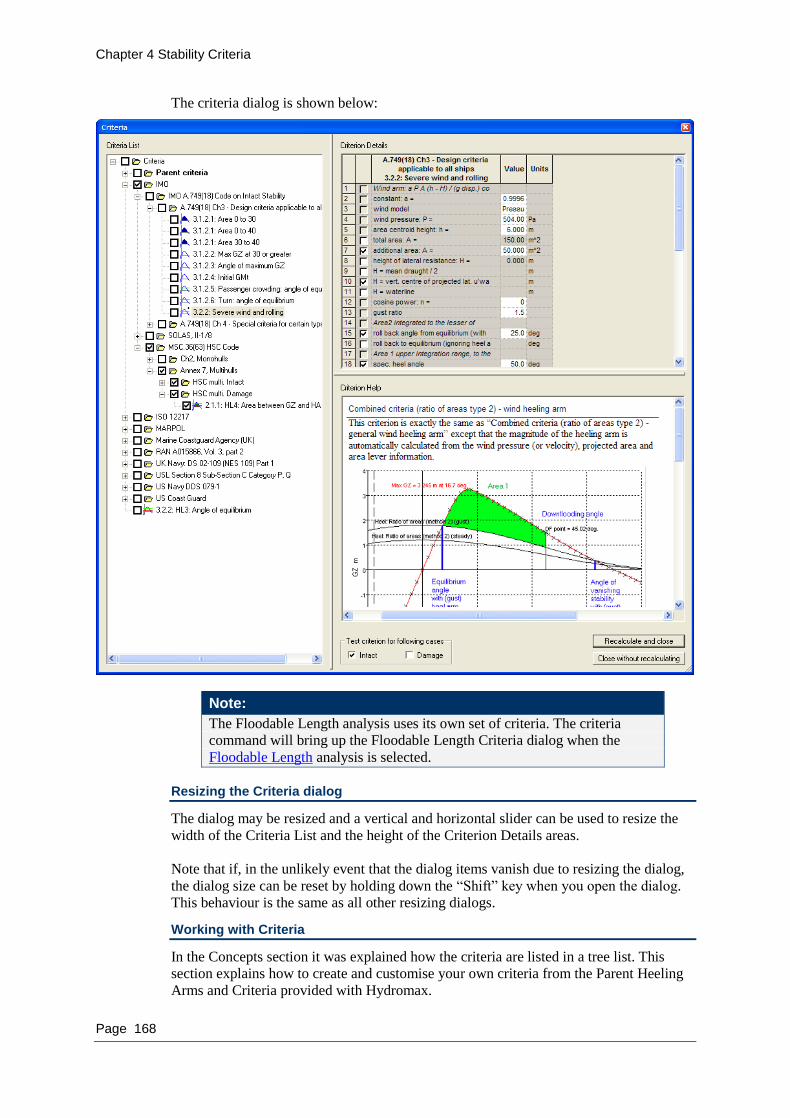
Chapter 4 Stability Criteria
Page 168
The criteria dialog is shown below:
Note:
The Floodable Length analysis uses its own set of criteria. The criteria
command will bring up the Floodable Length Criteria dialog when the
Floodable Length analysis is selected.
Resizing the Criteria dialog
The dialog may be resized and a vertical and horizontal slider can be used to resize the
width of the Criteria List and the height of the Criterion Details areas.
Note that if, in the unlikely event that the dialog items vanish due to resizing the dialog,
the dialog size can be reset by holding down the “Shift” key when you open the dialog.
This behaviour is the same as all other resizing dialogs.
Working with Criteria
In the Concepts section it was explained how the criteria are listed in a tree list. This
section explains how to create and customise your own criteria from the Parent Heeling
Arms and Criteria provided with Hydromax.
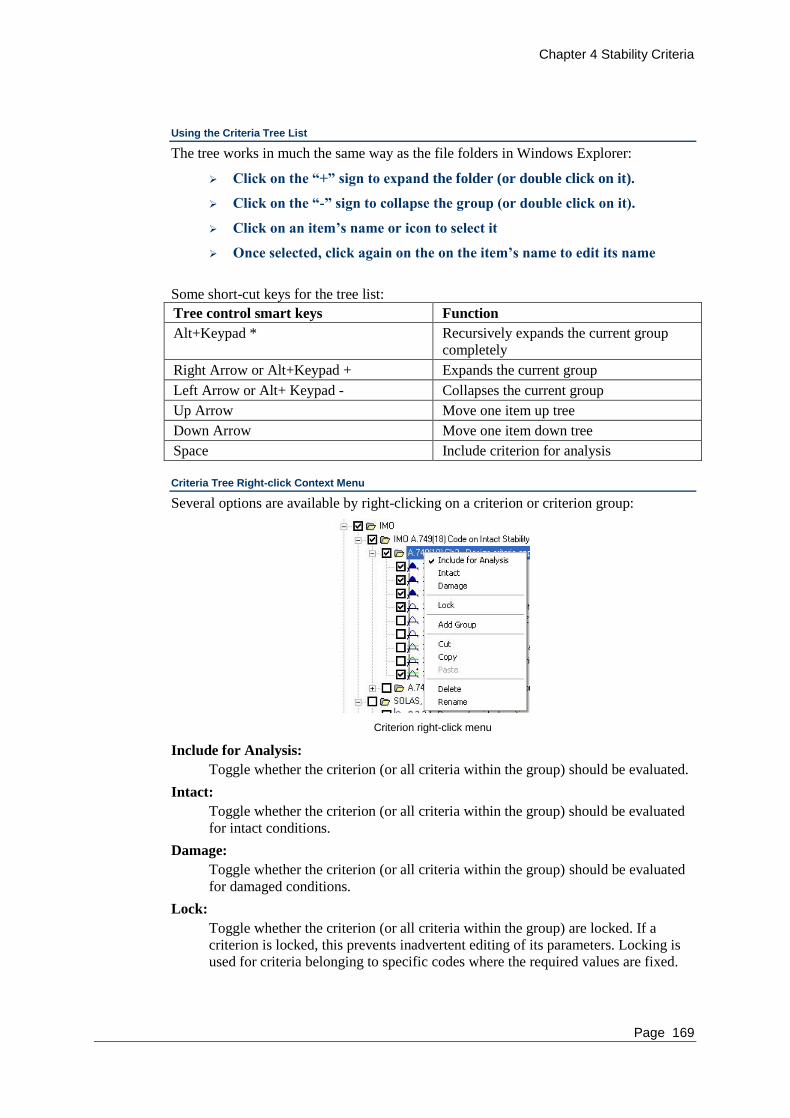
Chapter 4 Stability Criteria
Page 169
Using the Criteria Tree List
The tree works in much the same way as the file folders in Windows Explorer:
Click on the “+” sign to expand the folder (or double click on it).
Click on the “-” sign to collapse the group (or double click on it).
Click on an item’s name or icon to select it
Once selected, click again on the on the item’s name to edit its name
Some short-cut keys for the tree list:
Tree control smart keys Function
Alt+Keypad * Recursively expands the current group
completely
Right Arrow or Alt+Keypad + Expands the current group
Left Arrow or Alt+ Keypad - Collapses the current group
Up Arrow Move one item up tree
Down Arrow Move one item down tree
Space Include criterion for analysis
Criteria Tree Right-click Context Menu
Several options are available by right-clicking on a criterion or criterion group:
Criterion right-click menu
Include for Analysis:
Toggle whether the criterion (or all criteria within the group) should be evaluated.
Intact:
Toggle whether the criterion (or all criteria within the group) should be evaluated
for intact conditions.
Damage:
Toggle whether the criterion (or all criteria within the group) should be evaluated
for damaged conditions.
Lock:
Toggle whether the criterion (or all criteria within the group) are locked. If a
criterion is locked, this prevents inadvertent editing of its parameters. Locking is
used for criteria belonging to specific codes where the required values are fixed.

Chapter 4 Stability Criteria
Page 170
Add Group:
Add a new criterion group.
Cut:
Cut the criterion (or whole criterion group) to the clipboard. This may then be
pasted into another location in the tree.
Copy:
Copy the criterion (or whole criterion group) to the clipboard. This may then be
pasted into another location in the tree.
Paste:
Paste the criterion (or whole criterion group) from the clipboard to the selected
location
Rename:
Renames the criterion or group. This may also be done by selecting the label, then
clicking again in the label.
Delete:
Deletes the criterion or all the criteria and sub-groups within the group.
Defining new Custom Criteria and Groups
New custom criteria sets may be created by first creating a new criterion group and then
dragging the desired criteria into the criterion group. By holding down the Ctrl button a
copy of the criterion being dragged is created (unless it is a parent criterion, in which
case a copy will be made regardless of whether the Ctrl key is held down or not).
Alternatively use the Copy and Paste functions from the right-click context menu (see
above).
It is extremely important to ensure that all criteria groups have unique names. If
duplicate group names exit, then loading the criteria file may cause unexpected results.
As criteria (and new groups) are loaded they are inserted into the first group that is found
with a name that matches the name of the group to which the criterion should belong. If
there are groups with the same name, all criteria that should be in a group of that name
will end up in the first one and none in the second.
Moving Criteria
Criteria may be moved from one group to another by dragging them with the left-mouse-
button or by using the cut and paste functions in the right-click context menu (see
above). Note that if you drag a criterion from the Parent Criteria group a copy will be
made and the original will not be deleted.
Copying criteria
You can use the Criteria Tree Right-click Context Menu to copy and paste criteria.
Alternatively, you can hold down the CTRL-key while moving the criteria you will copy
the criteria.
Selecting the Criteria for Analysis
Criteria may be selected for analysis by ticking the tick box to the left of the criterion.
Other functions are available from a menu activated when the right button is clicked on
your mouse. To select an entire group, right-click on the group and choose Include for
Analysis from the menu.
Editing Criteria
The specific details for a criterion are displayed in the table in the top-right of the dialog:

Chapter 4 Stability Criteria
Page 171
Criterion details table
To edit the parameters for a specific criterion, click on the criterion‟s name in the tree
and the criterion‟s parameters will be displayed in the table on the right. Edit the
parameters as required and then select the next criterion to be edited from the tree, or
click the dialog‟s Close button. Please note that the criteria are updated as you change
their data and that there is no “Cancel” function for this dialog. If in doubt, use the File |
Save Criteria command to save a copy of your current criteria selection and data before
making any changes in the Criteria dialog.
The parameters that may be adjusted have a white background; those which cannot be
edited, have a grey background.
The values that are required for passing a criterion are in bold.
Check Boxes in Criteria Properties Section of Criteria Dialog
There is some subtly different behaviour for the check boxes in the dialog depending on
their context. In most cases there will be group of related options used to define a
criterion parameter. For example the limits for an upper integration range or the
individual criteria to be evaluated for a more complex criterion:
In both of these cases the selection is cumulative and none of the selections are mutually
exclusive. However, at least one must be selected.
In other cases, where the items are mutually exclusive, the check boxes act as radio
buttons and only one may be selected. This occurs, for example, with the “Value of GMt
at” criterion:
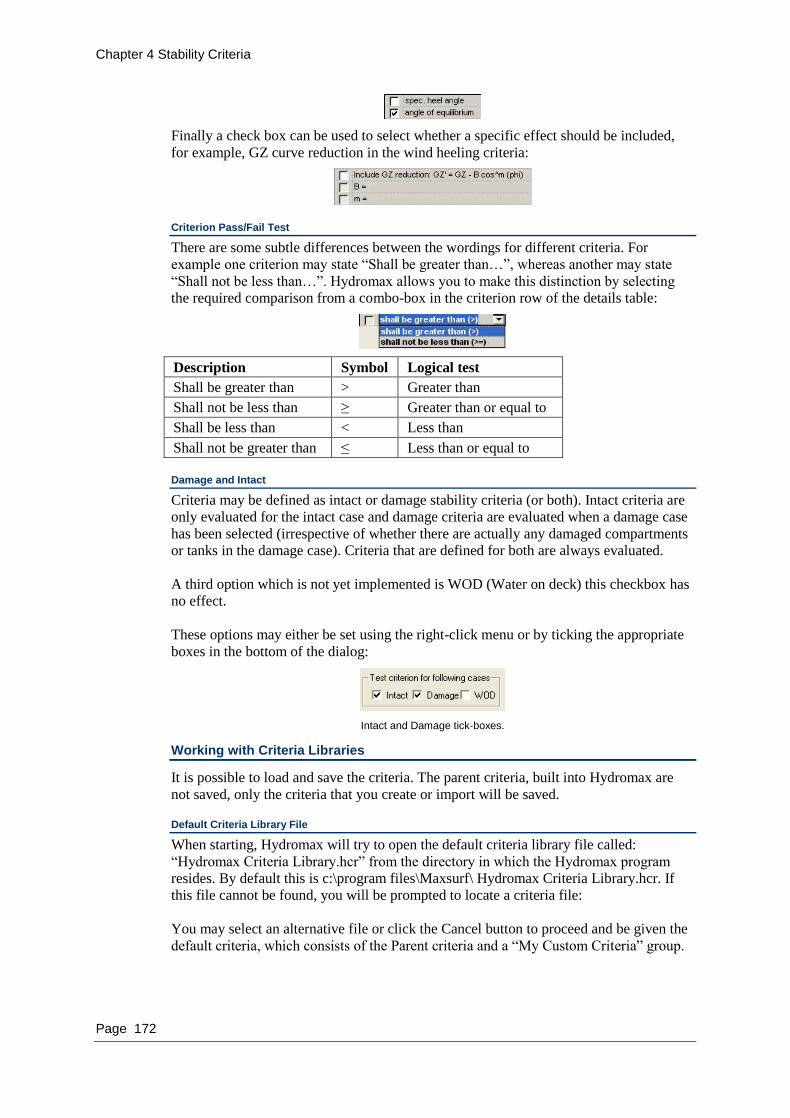
Chapter 4 Stability Criteria
Page 172
Finally a check box can be used to select whether a specific effect should be included,
for example, GZ curve reduction in the wind heeling criteria:
Criterion Pass/Fail Test
There are some subtle differences between the wordings for different criteria. For
example one criterion may state “Shall be greater than…”, whereas another may state
“Shall not be less than…”. Hydromax allows you to make this distinction by selecting
the required comparison from a combo-box in the criterion row of the details table:
Description Symbol Logical test
Shall be greater than > Greater than
Shall not be less than ≥ Greater than or equal to
Shall be less than < Less than
Shall not be greater than ≤ Less than or equal to
Damage and Intact
Criteria may be defined as intact or damage stability criteria (or both). Intact criteria are
only evaluated for the intact case and damage criteria are evaluated when a damage case
has been selected (irrespective of whether there are actually any damaged compartments
or tanks in the damage case). Criteria that are defined for both are always evaluated.
A third option which is not yet implemented is WOD (Water on deck) this checkbox has
no effect.
These options may either be set using the right-click menu or by ticking the appropriate
boxes in the bottom of the dialog:
Intact and Damage tick-boxes.
Working with Criteria Libraries
It is possible to load and save the criteria. The parent criteria, built into Hydromax are
not saved, only the criteria that you create or import will be saved.
Default Criteria Library File
When starting, Hydromax will try to open the default criteria library file called:
“Hydromax Criteria Library.hcr” from the directory in which the Hydromax program
resides. By default this is c:\program files\Maxsurf\ Hydromax Criteria Library.hcr. If
this file cannot be found, you will be prompted to locate a criteria file:
You may select an alternative file or click the Cancel button to proceed and be given the
default criteria, which consists of the Parent criteria and a “My Custom Criteria” group.

Chapter 4 Stability Criteria
Page 173
The default criteria library will be automatically updated every time the criteria dialog is
closed. Even if you loaded an alternative file, updates will be saved in the default criteria
library, either overwriting the existing one or creating a new one.
Note
It is good practise to save the criteria file with the project in the project
folder. That way, when at a later stage you need to re-analyse the project, all
criteria are still available. See Saving Criteria below.
Saving Criteria
It is also possible to save the criteria into a new file. This can be useful when you are
defining new custom sets of criteria that you wish to keep separate or when defining
criteria sets for different vessels. Choose Save Criteria As from the File menu. This will
simply export all the custom criteria (parent criteria are not saved) to the specified file.
Further updates will, however, continue to be saved to the default criteria library file that
was opened when Hydromax was first started, so if you want to save any further changes
you will have to resave as described above.
Importing Criteria and Specific Criteria Files
New criteria may be added to your criteria list by importing them – choose Import
Criteria from the File menu. You will then be asked if you wish to keep the existing
criteria:
If you choose “Yes” your existing criteria will be kept, if you choose “No”, all existing
criteria except the parent criteria will be removed and replaced by those in the file you
are opening. The default criteria library will be over-written with the new criteria so if
you wish to keep any custom criteria that you may have added to your default criteria
library, you must save them in a new file first.
Note that when keeping your existing criteria, it is important to ensure that the group
names in the file you are importing are not the same as those that already exist. If this
does occur, the imported criteria will be found in the original groups, not in the new
groups.
A number of criteria containing criteria for specific codes are supplied with Hydromax.
These may be found in the “HMSpecificCriteria” folder.
You can import several criteria files in one go using Shift, or Ctrl select to select
multiple files in the Open Hydromax Criteria dialog.
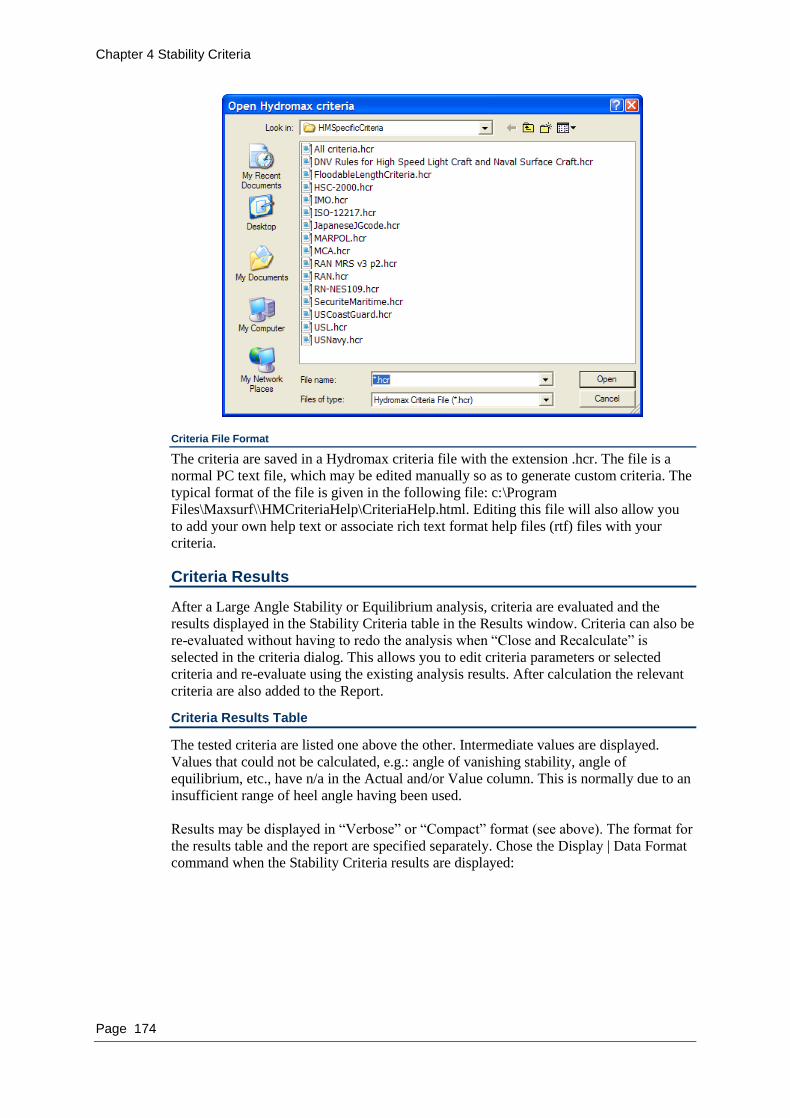
Chapter 4 Stability Criteria
Page 174
Criteria File Format
The criteria are saved in a Hydromax criteria file with the extension .hcr. The file is a
normal PC text file, which may be edited manually so as to generate custom criteria. The
typical format of the file is given in the following file: c:\Program
Files\Maxsurf\\HMCriteriaHelp\CriteriaHelp.html. Editing this file will also allow you
to add your own help text or associate rich text format help files (rtf) files with your
criteria.
Criteria Results
After a Large Angle Stability or Equilibrium analysis, criteria are evaluated and the
results displayed in the Stability Criteria table in the Results window. Criteria can also be
re-evaluated without having to redo the analysis when “Close and Recalculate” is
selected in the criteria dialog. This allows you to edit criteria parameters or selected
criteria and re-evaluate using the existing analysis results. After calculation the relevant
criteria are also added to the Report.
Criteria Results Table
The tested criteria are listed one above the other. Intermediate values are displayed.
Values that could not be calculated, e.g.: angle of vanishing stability, angle of
equilibrium, etc., have n/a in the Actual and/or Value column. This is normally due to an
insufficient range of heel angle having been used.
Results may be displayed in “Verbose” or “Compact” format (see above). The format for
the results table and the report are specified separately. Chose the Display | Data Format
command when the Stability Criteria results are displayed:

Chapter 4 Stability Criteria
Page 175
Stability criteria results window: compact format
Stability criteria results window: verbose format
Chapter 4 Stability Criteria
Page 176
Report and Batch Processing
As noted earlier, only the relevant criteria results are added to the Report and/or Batch
file. Criteria that are not relevant, i.e. any criteria that have a “not analysed” result, are
not added to the Report (although they are displayed in the Criteria Results table). For
example damage criteria during intact analysis or Equilibrium criteria during a Large
Angle Stability analysis are not added to the report.
Also see
Reporting on page 155
Batch Analysis on page 138
Nomenclature
This section gives a brief description of the various values that are determined by
Hydromax in the evaluation of criteria.
There are two distinct types of criteria:
Equilibrium criteria
Equilibrium criteria are evaluated after an Equilibrium analysis and refer only to
the condition of the vessel in its equilibrium state For example: margin line
immersion tests, freeboard measurements, trim angle, metacentric height, etc. This
type of criterion is also used by the Floodable Length analysis. Equilibrium
criteria can be recognised by the icon.
Criteria derived from measurements of the GZ curve.
These are calculated after a Large Angle Stability analysis and during a Limiting
KG analysis. For example, area under GZ curve between specified limits, angle of
maximum GZ, etc. These criteria are often referred to as Large Angle Stability
(LAS) or GZ criteria.
Note:
The metacentre is always (even for Large Angle Stability criteria) computed
directly from the vessel‟s hydrostatic properties (i.e. water-plane inertia and
immersed volume) at the specified heel angle and not from the slope of the
GZ curve. This gives an accurate result that is not dependent on the heel
angles and intervals tested during the analysis.
Definitions of GZ curve features
Some typical GZ curves are shown below, the third graph shows the GZ curve with a
heeling arm overlayed.

Chapter 4 Stability Criteria
Page 177
Typical GZ curve
Unusual GZ curve with double peak
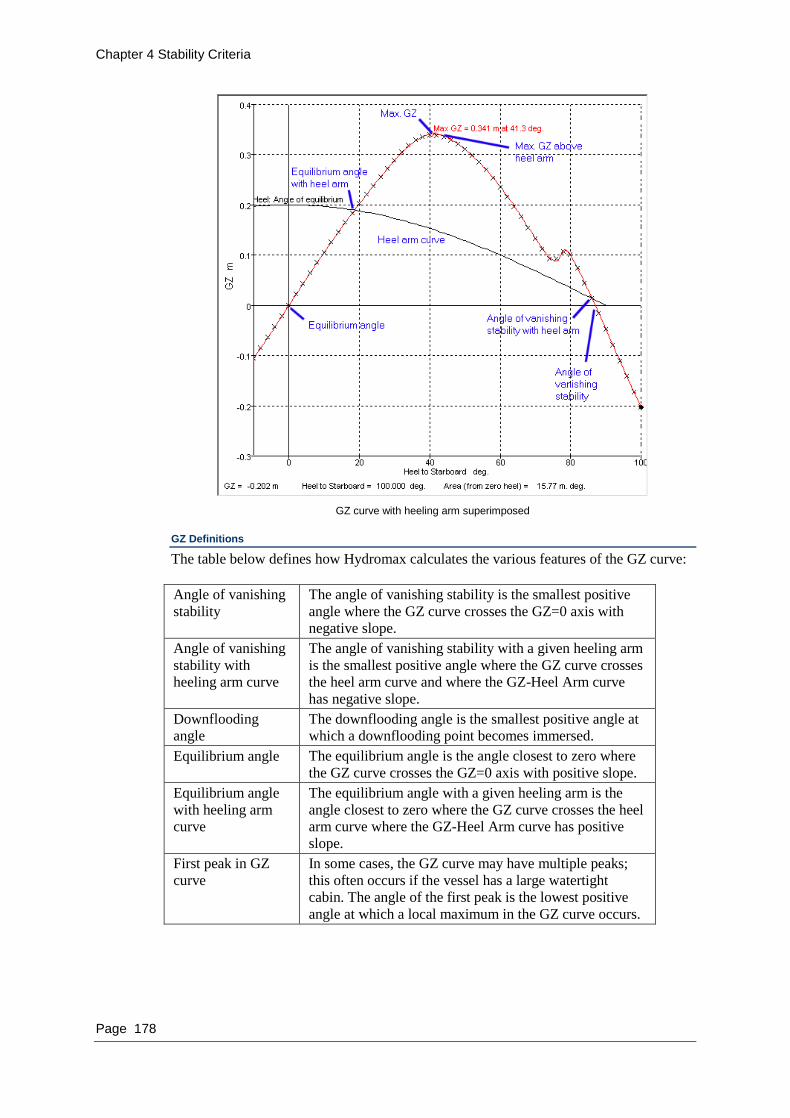
Chapter 4 Stability Criteria
Page 178
GZ curve with heeling arm superimposed
GZ Definitions
The table below defines how Hydromax calculates the various features of the GZ curve:
Angle of vanishing
stability
The angle of vanishing stability is the smallest positive
angle where the GZ curve crosses the GZ=0 axis with
negative slope.
Angle of vanishing
stability with
heeling arm curve
The angle of vanishing stability with a given heeling arm
is the smallest positive angle where the GZ curve crosses
the heel arm curve and where the GZ-Heel Arm curve
has negative slope.
Downflooding
angle
The downflooding angle is the smallest positive angle at
which a downflooding point becomes immersed.
Equilibrium angle The equilibrium angle is the angle closest to zero where
the GZ curve crosses the GZ=0 axis with positive slope.
Equilibrium angle
with heeling arm
curve
The equilibrium angle with a given heeling arm is the
angle closest to zero where the GZ curve crosses the heel
arm curve where the GZ-Heel Arm curve has positive
slope.
First peak in GZ
curve
In some cases, the GZ curve may have multiple peaks;
this often occurs if the vessel has a large watertight
cabin. The angle of the first peak is the lowest positive
angle at which a local maximum in the GZ curve occurs.
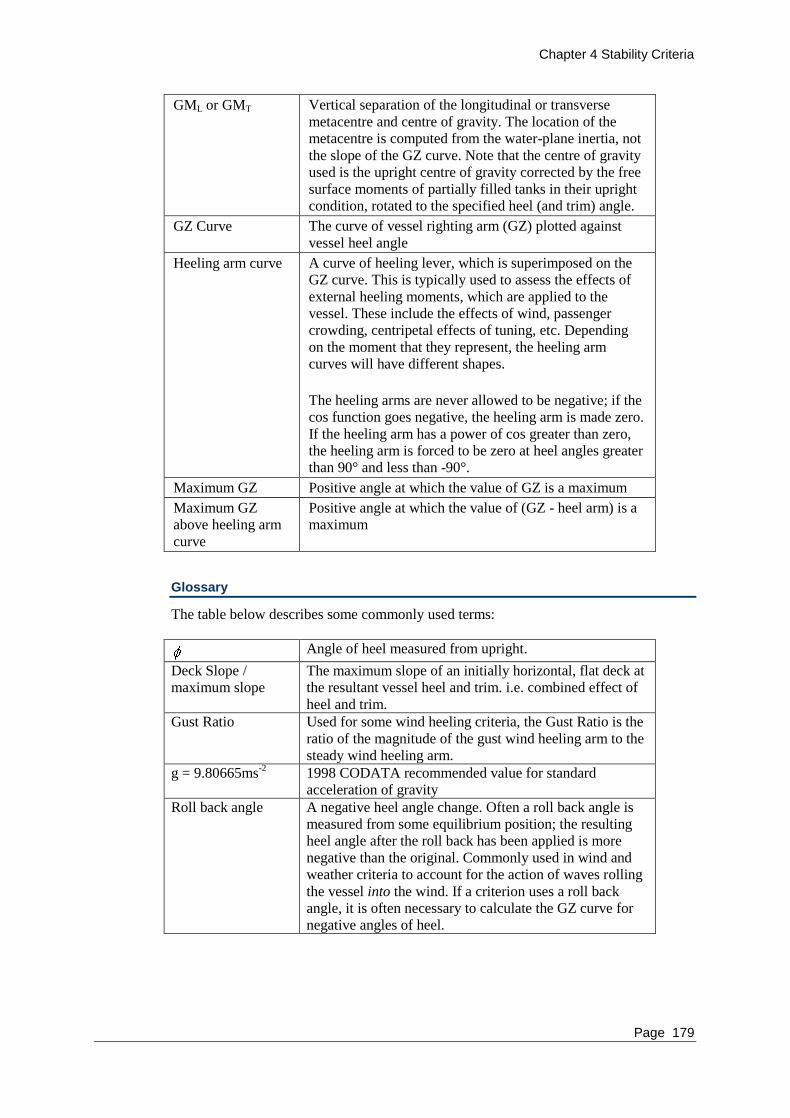
Chapter 4 Stability Criteria
Page 179
GML or GMT Vertical separation of the longitudinal or transverse
metacentre and centre of gravity. The location of the
metacentre is computed from the water-plane inertia, not
the slope of the GZ curve. Note that the centre of gravity
used is the upright centre of gravity corrected by the free
surface moments of partially filled tanks in their upright
condition, rotated to the specified heel (and trim) angle.
GZ Curve The curve of vessel righting arm (GZ) plotted against
vessel heel angle
Heeling arm curve A curve of heeling lever, which is superimposed on the
GZ curve. This is typically used to assess the effects of
external heeling moments, which are applied to the
vessel. These include the effects of wind, passenger
crowding, centripetal effects of tuning, etc. Depending
on the moment that they represent, the heeling arm
curves will have different shapes.
The heeling arms are never allowed to be negative; if the
cos function goes negative, the heeling arm is made zero.
If the heeling arm has a power of cos greater than zero,
the heeling arm is forced to be zero at heel angles greater
than 90° and less than -90°.
Maximum GZ Positive angle at which the value of GZ is a maximum
Maximum GZ
above heeling arm
curve
Positive angle at which the value of (GZ - heel arm) is a
maximum
Glossary
The table below describes some commonly used terms:
Angle of heel measured from upright.
Deck Slope /
maximum slope
The maximum slope of an initially horizontal, flat deck at
the resultant vessel heel and trim. i.e. combined effect of
heel and trim.
Gust Ratio Used for some wind heeling criteria, the Gust Ratio is the
ratio of the magnitude of the gust wind heeling arm to the
steady wind heeling arm.
g = 9.80665ms-2
1998 CODATA recommended value for standard
acceleration of gravity
Roll back angle A negative heel angle change. Often a roll back angle is
measured from some equilibrium position; the resulting
heel angle after the roll back has been applied is more
negative than the original. Commonly used in wind and
weather criteria to account for the action of waves rolling
the vessel into the wind. If a criterion uses a roll back
angle, it is often necessary to calculate the GZ curve for
negative angles of heel.

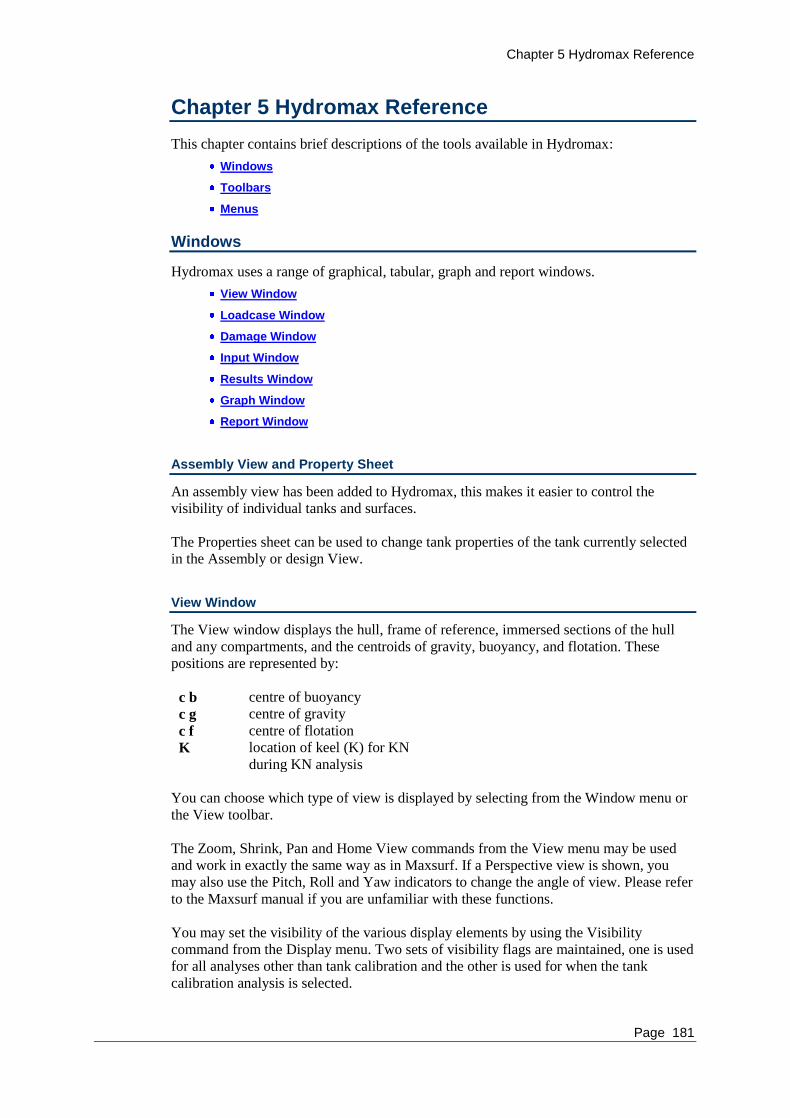
Chapter 5 Hydromax Reference
Page 181
Chapter 5 Hydromax Reference
This chapter contains brief descriptions of the tools available in Hydromax:
Windows
Toolbars
Menus
Windows
Hydromax uses a range of graphical, tabular, graph and report windows.
View Window
Loadcase Window
Damage Window
Input Window
Results Window
Graph Window
Report Window
Assembly View and Property Sheet
An assembly view has been added to Hydromax, this makes it easier to control the
visibility of individual tanks and surfaces.
The Properties sheet can be used to change tank properties of the tank currently selected
in the Assembly or design View.
View Window
The View window displays the hull, frame of reference, immersed sections of the hull
and any compartments, and the centroids of gravity, buoyancy, and flotation. These
positions are represented by:
c b centre of buoyancy
c g centre of gravity
c f centre of flotation
K location of keel (K) for KN
during KN analysis
You can choose which type of view is displayed by selecting from the Window menu or
the View toolbar.
The Zoom, Shrink, Pan and Home View commands from the View menu may be used
and work in exactly the same way as in Maxsurf. If a Perspective view is shown, you
may also use the Pitch, Roll and Yaw indicators to change the angle of view. Please refer
to the Maxsurf manual if you are unfamiliar with these functions.
You may set the visibility of the various display elements by using the Visibility
command from the Display menu. Two sets of visibility flags are maintained, one is used
for all analyses other than tank calibration and the other is used for when the tank
calibration analysis is selected.

Chapter 5 Hydromax Reference
Page 182
If a view window is visible when an analysis is being carried out, it will display the hull
shape using the correct heel trim and immersion for the current step of the analysis.
After an analysis, the Select View from Data command in the Display menu may be used
to move the hull to a selected position from the Results window.
The view of the tanks, compartments and non-buoyant volumes can be toggled between
an outline view and a view of the sections.
Perspective view
In the perspective view, the model may be rendered.
The rendered view also enables tanks and compartments to be more easily visualised,
especially when the hull shell is made transparent.
The rendering options are to be found in the Display menu, with further lighting options
in the Render toolbar.
Please refer to the Maxsurf manual for more information on the different rendering
options available in perspective view.

Chapter 5 Hydromax Reference
Page 183
Note:
Fastest performance will be achieved by reducing the amount of redrawing
that is required from Hydromax. For this reason, it is best to turn off
sections, and especially waterlines, when performing an analysis. You may
then turn them on again after the analysis has completed. For fastest
performance, e.g. when running in Batch mode, minimise the Hydromax
window so that no redrawing occurs.
Loadcase Window
In the Loadcase window a spreadsheet table of all loads and tanks is displayed.
Using the tabs on the bottom of the window allow you to quickly browse through the
different loadcases.
Hydromax allows you to improve the presentation of the Load Case window by adding
blank, heading or sub-total lines in the table. For more information see Working with
Loadcases on page 38.
The columns that are displayed may be selected using the Display | Data Format dialog.
Damage Window
The Damage window is used to specify which tanks and compartments are flooded in
each damage case. There is always an Intact case, which cannot be edited, this is the
default condition. If flooded volumes are required in the intact case they should be
defined as non-buoyant volumes.
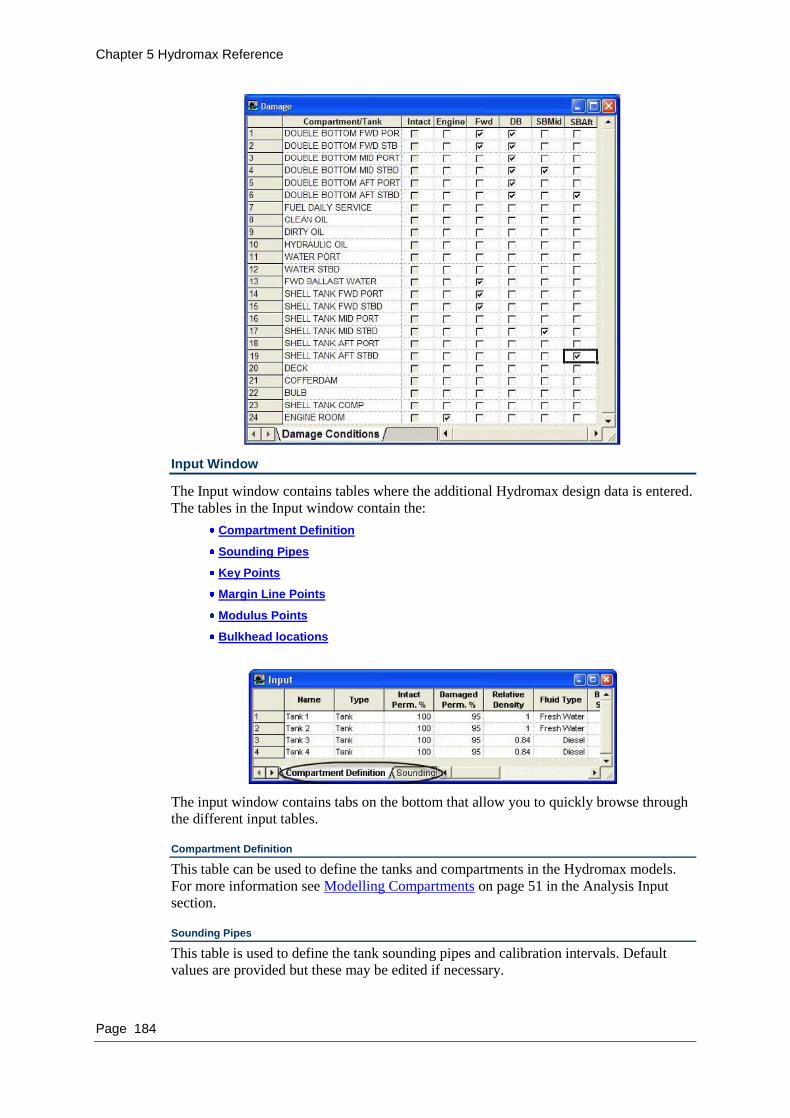
Chapter 5 Hydromax Reference
Page 184
Input Window
The Input window contains tables where the additional Hydromax design data is entered.
The tables in the Input window contain the:
Compartment Definition
Sounding Pipes
Key Points
Margin Line Points
Modulus Points
Bulkhead locations
The input window contains tabs on the bottom that allow you to quickly browse through
the different input tables.
Compartment Definition
This table can be used to define the tanks and compartments in the Hydromax models.
For more information see Modelling Compartments on page 51 in the Analysis Input
section.
Sounding Pipes
This table is used to define the tank sounding pipes and calibration intervals. Default
values are provided but these may be edited if necessary.
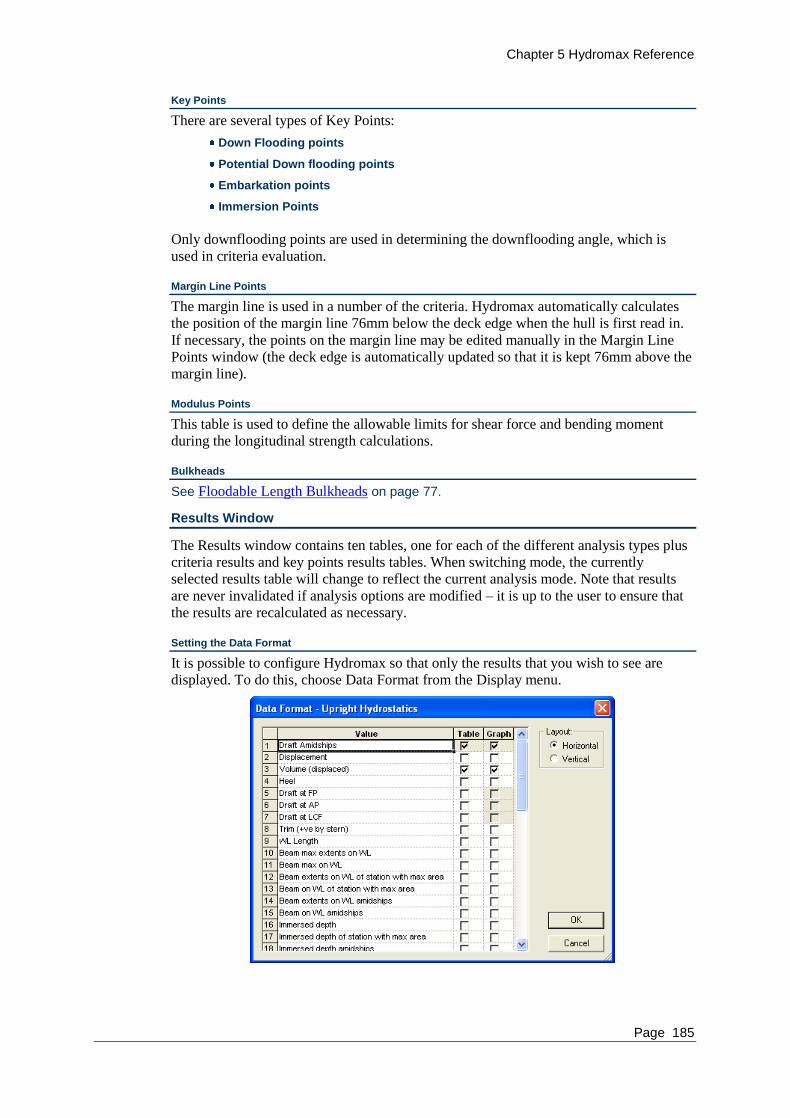
Chapter 5 Hydromax Reference
Page 185
Key Points
There are several types of Key Points:
Down Flooding points
Potential Down flooding points
Embarkation points
Immersion Points
Only downflooding points are used in determining the downflooding angle, which is
used in criteria evaluation.
Margin Line Points
The margin line is used in a number of the criteria. Hydromax automatically calculates
the position of the margin line 76mm below the deck edge when the hull is first read in.
If necessary, the points on the margin line may be edited manually in the Margin Line
Points window (the deck edge is automatically updated so that it is kept 76mm above the
margin line).
Modulus Points
This table is used to define the allowable limits for shear force and bending moment
during the longitudinal strength calculations.
Bulkheads
See Floodable Length Bulkheads on page 77.
Results Window
The Results window contains ten tables, one for each of the different analysis types plus
criteria results and key points results tables. When switching mode, the currently
selected results table will change to reflect the current analysis mode. Note that results
are never invalidated if analysis options are modified – it is up to the user to ensure that
the results are recalculated as necessary.
Setting the Data Format
It is possible to configure Hydromax so that only the results that you wish to see are
displayed. To do this, choose Data Format from the Display menu.
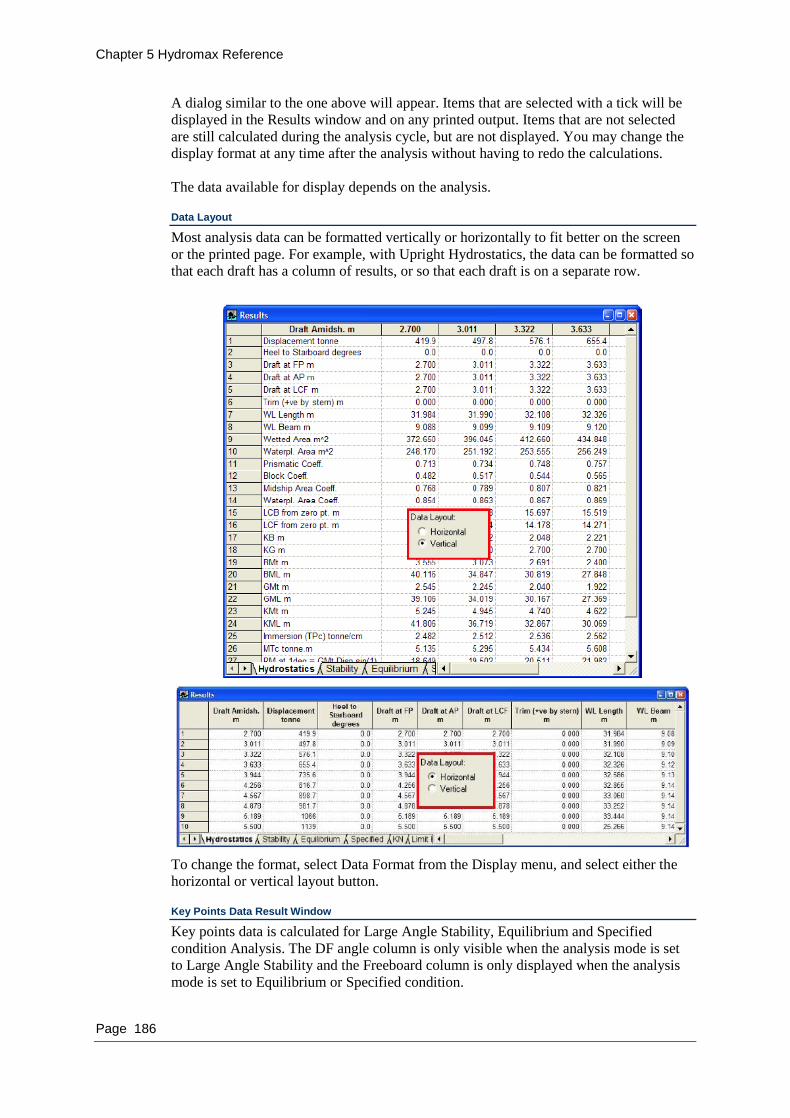
Chapter 5 Hydromax Reference
Page 186
A dialog similar to the one above will appear. Items that are selected with a tick will be
displayed in the Results window and on any printed output. Items that are not selected
are still calculated during the analysis cycle, but are not displayed. You may change the
display format at any time after the analysis without having to redo the calculations.
The data available for display depends on the analysis.
Data Layout
Most analysis data can be formatted vertically or horizontally to fit better on the screen
or the printed page. For example, with Upright Hydrostatics, the data can be formatted so
that each draft has a column of results, or so that each draft is on a separate row.
To change the format, select Data Format from the Display menu, and select either the
horizontal or vertical layout button.
Key Points Data Result Window
Key points data is calculated for Large Angle Stability, Equilibrium and Specified
condition Analysis. The DF angle column is only visible when the analysis mode is set
to Large Angle Stability and the Freeboard column is only displayed when the analysis
mode is set to Equilibrium or Specified condition.

Chapter 5 Hydromax Reference
Page 187
Stability Criteria Result Window
If stability criteria are turned on in the analysis menu, they will be evaluated during
Large Angle Stability, Limiting KG and Equilibrium analyses. The results of the criteria
evaluation are presented in this table after Large Angle Stability and Equilibrium
analyses. Criteria results are not displayed in this table after a Limiting KG analysis. The
results may be displayed in compact format:
Alternatively, the results can be displayed in verbose format, where all the intermediate
calculations are shown, by selecting the desired format in the Display | Data format
dialog.

Chapter 5 Hydromax Reference
Page 188
Graph Window
The Graph window displays graphs, which show the results of the current analysis.
Hydromax will automatically display the graph that displays the result of the current
analysis when you select Graph from the Windows menu or press the toolbar button.
Alternatively you can select a specific graph using the Windows | Graphs menu item.
Only the graphs that are applicable to the current analysis can be displayed.
Graphs can be copied using the Edit | Copy command.
Depending on the analysis mode, different graphs are available.
Upright Hydrostatics Analysis:
Hydrostatics
Curves of Form
Curve of areas – different graph for each draft tested (selected using
Display|Select view from data)
Large angle stability Analysis
Righting Lever (GZ)
Curve of areas – different graph for each heel angle tested (selected using
Display|Select view from data)
Max steady heel angle
Large angle stability (hydrostatic data other than GZ)
Curves of Form
Dynamic stability (GZ area)
Equilibrium Analysis:
Curve of areas
Specified condition Analysis:
Curve of areas
KN Values Analysis:
Cross curves (KN)
Limiting KG Analysis:
Limiting KG
Floodable length Analysis:
Floodable length
Longitudinal strength Analysis:
Longitudinal strength
Curve of areas
Tank Calibration
One graph for each tank
For many graphs you can select what is plotted and other options with the Display | Data
Format dialog.

Chapter 5 Hydromax Reference
Page 189
Graph type
Hydromax can graph many types of data depending on the type of analysis being
performed. These graphs include Upright Hydrostatics, Curves of Form, Curve of Areas,
Righting Lever (GZ curve), Longitudinal Strength, Floodable Length and Tank
Capacities. These can all be displayed via the Graphs item in the Windows menu.
Tip: You can use the Select View from Analysis Data option (page 159) to see the Curve
of Areas for each heel angle and/or intermediate stage during the analysis.
Interpolating Graph Data
To display an interpolated value from one of the curves, use the mouse to click anywhere
on the curve. The data in the lower left corner of the window will change to display the
curve name and co-ordinates of the mouse on the curve. Click anywhere on the dashed
line and drag it with the mouse; as you move the cursor the interpolated values will be
displayed.
Note:
In case multiple curves are plotted in the same graph you can switch
between the curves by clicking on them. Hydromax will ignore the exact
position you click on the curve to allow reading all related interpolated
values along the black dashed line.
GZ Graph
The GZ value, Area and corresponding heel angle can be measured by using the slider;
the slider data is displayed at the bottom of the Graph window. The area is integrated
from zero heel angle to the location of the graph slider.
Note:
Because the horizontal axis scale is always in degrees, the area is always
given in units of length.degrees and cannot be displayed in units of
length.radians.

Chapter 5 Hydromax Reference
Page 190
Note
The lower integration limit is always zero (irrespective of the equilibrium
angle). Thus if you require the area between two limits, you must subtract
the area at the lower limit from the area at the higher limit.
Curve fitting for GZ graph
A curve fit will be performed if all the heel angle intervals are less than or equal to 10˚.
If this is the case, a parametric cubic spline is used to fit a smooth curve through the
calculated GZ data at the specified heel angles. This ensures that the fitted line goes
exactly through the calculated GZ points. If you wish to prevent this curve fitting, add a
heel angle interval of greater than 10˚ as the final step. This can sometimes be useful if
you expect a discontinuity in the GZ curve.
Graph data
The graphed data can be obtained by double clicking on the graph. Since the graph data
contains more data points than most tables in the results window, this double click can
be extremely helpful to export the analysis data to for example Excel fro further
processing. Especially in the case of the sectional area curve, where there is no tabular
data available.
Also see: Copying Tables on page 158.
Graph Formatting
When you are in the Graph window you can use the View | Colours and lines dialog to
change the colours of the curves in the graph as well as the background. The View | Font
command allows you to change the text size and font size.
Copying Graphs
You can copy the contents of the Graph window using the Copy command or Ctrl+C.
Note that the picture is placed in the clipboard as a meta-file which can be resized in
Word or Excel.

Chapter 5 Hydromax Reference
Page 191
Note
When the graph is pasted in Microsoft Word®, the graph can be edited by
right clicking on the graph and selecting “edit picture”.
Report Window
Hydromax contains a Report window. This window is used to create a progressive
summary of the analyses that have been carried out. This report can be edited via Cut,
Copy and Paste; printed, saved to and recalled from a disk file.
Report Window Page Setup
When you are in the Report window, the File | Page setup command allows you to
customise the page orientation and size you wish to use for reporting. This is important
because, inserted tables will be automatically formatted to fit the current page set up.
However, once the tables have been placed into the report, their formatting will not be
changed by changes to the print set up. Hence it is often most convenient to select the
desired report page set up before any analyses have been made. You can for example
choose the landscape Page Setup prior to running an analysis to make the tables fit
better.
Hydromax will split most results tables so they fit the specified page set up. However,
both Loadcase and Criteria results tables will not be split.
Editing a Report
The Report window has it's own toolbar permanently attached to the view, as well as a
ruler showing you tab stops, indentation and margin widths. Underneath all of this you
have your actual editing area.
As the built-in report window only has basic editing and formatting functionality, it is
recommended that the report window be used only to accumulate the results. Once all
the results have been gathered in the report window, these should be saved and opened in
a word processor such as Microsoft Word or Open Office for formatting:
set the results tables up as you want them to appear in the report (the report uses
the same column widths, fonts etc.); do the same for the graph widow;
choose an appropriate paper size for the report (the tables will be split to fit this
paper size, so choosing a wide paper size will prevent all but the widest tables
from being split);
copy and paste the Hydromax report into Microsoft word. Use the Format |
Autoformat function in Word (with the default settings) to set the correct styles for
the different levels of heading in the document, this will facilitate generating a table
of contents and also allows you to re-format the various styles (or import a custom
set of styles using the style organiser in Word).

Chapter 5 Hydromax Reference
Page 192
The information below is provided for reference, but it is strongly recommended not to
use any of the formatting commands in the Report window. The toolbar has a number of
buttons that allow you to change either the current settings, or the section of text that is
currently highlighted.
The toolbar contains the following items:
Font combo box Use this to change the current font
Font Size combo box Use this to change the current font size
Bold Use this to toggle the Bold style
Italic Use this to toggle the Italic style
Underline Use this to toggle the Underline style
Colour Use this to set Text Colour
Left Justify Use this to set Left Justification
Centre Justify Use this to set Centre Justification
Right Justify Use this to set Right Justification
Bullet Use this to toggle Bullet Points
The Ruler comes in two formats, in metric and in inches - the format you have displayed
on your screen depends on the current Dimension Units you have (use Units in the
Display menu to change this). The format shown below is metric.
Chapter 5 Hydromax Reference
Page 193
The Ruler allows you to set left, right, centre, and decimal tab stops. The tab stops are
very useful for creating columns and tables. A paragraph can have as many as 20 tab
positions.
The 'left' tab stop indicates where the text following the tab character will start. To create
a left tab stop, click the left mouse button at the specified location on the ruler. The left
tab stop is indicated on the ruler by an arrow with a tail toward the right.
The 'right' tab stop aligns the text at the current tab stop such that the text ends at the tab
marker. To create a right tab stop, click the right mouse button at the specified location
on the ruler. The right tab stop is indicated on the ruler by an arrow with a tail toward the
left.
The 'centre' tab stop centres the text at the current tab position. To create a centre tab
stop, hold the shift key and click the left mouse button at the specified location on the
ruler. The centre tab stop is indicated on the ruler by a straight arrow.
The 'decimal' tab stop aligns the text at the decimal point. To create a decimal tab stop,
hold the shift key and click the right mouse button at the specified location on the ruler.
The decimal tab stop is indicated on the ruler by a dot under a straight arrow.
To move a tab position using the mouse, simply click the left mouse button on the tab
symbol on the ruler. While the mouse button is depressed, drag the tab to the desired
location and release the mouse button.
To clear a tab position, simply click on the desired tab marker and drag it off the ruler.
Normally, a tab command is applicable to every line of the current paragraph. However,
if you highlight a block of text before initiating a tab command, the tab command is then
applicable to all the lines in the highlighted block of text.
Keyboard Support for Reports
In addition to menu support, there are also several useful keystrokes that are available
while editing the report. These are listed below for convenience:
Ctrl+B Toggle Bold on/off
Ctrl+U Toggle Underline on/off
Ctrl+PageUp Position at the top of the report
Ctrl+PageDown Position at the bottom of the report
Ctrl+Enter Insert a page break
Opening and Saving the Report
The report can be saved to a file or read in from a file using the Save and Open Menu
commands with the report window highlighted. This is useful if you wish to append an
analysis to a report that had been calculated at some time in the past. (Load in the old
report, perform the analyses; the new results will be appended to the end of the report
which may then be resaved).

Chapter 5 Hydromax Reference
Page 194
Pasting images into the report
Sometimes, it is desirable to insert schematic images of the vessel into the report. This is
very easily done, by copying an image from one of the design views and then pasting it
into the report at the desired location. The image copied is as per the image displayed in
the Hydromax view window. Ensure that the colors selected will be easily visible in the
white background of the report view.
Depending on which Microsoft operating system you are using (notably Win98), the
image may not maintain its aspect ratio and may be pasted into the report as a square. To
overcome this problem, paste the image into Microsoft Word first, then copy it from
Word back into the Hydromax report window.
Toolbars
Hydromax has a number of icons arranged in toolbars to speed up access to some
commonly used functions. You can hold your mouse over an icon to reveal a pop-up tip
of what the icon does.
File Toolbar
The File toolbar contains icons that execute the following commands:
New – Open – Save – Cut – Copy – Paste – Print
Edit Toolbar
The Edit toolbar contains icons that execute the following commands:
Add Row - Delete Row | Sort Loadcase Rows – Move Loadcase/Tank Row up – Move
Loadcase/Tank Row Down
View Toolbar
The View toolbar contains icons that execute the following commands:
Zoom – Shrink – Pan – Home View – Rotate – Assembly window.

Chapter 5 Hydromax Reference
Page 195
The Rotate command is only available in the Perspective window. The Assembly
window is not available in Hydromax.
Analysis Toolbar
The Analysis toolbar contains icons for selecting the current analysis, loadcase and
damage case:
Analysis Type – Current Loadcase – Current Damage Case
The Analysis toolbar also contains icons that execute the following commands:
Criteria (dialog) | Start Analysis – Pause Analysis – Resume Analysis | Update Tank
Values in Loadcase
The “Update Tank Values in Loadcase” is exactly the same as the menu command for
“Recalculate Tanks and Compartments on page 206.
Window Toolbar
Allows quick switching between commonly used windows:
Perspective – Plan – Profile – Body Plan |
Loadcase – Damage Case |
Compartment – Downflooding – Margin Line – Modulus – Bulkheads |
Results for Current Analysis – Criteria Results – Key Point Results |
Graph – Report
Design Grid Toolbar
The Design Grid toolbar contains icons that show or hide various items in the graphical
views
Frame of Reference (always on) | Toggle Design Grid Visibility
Design Grid | Design Grid Labels | Design Grid Tickmarks
Visibility Toolbar
The Visibility toolbar contains icons that show or hide various items in the graphical
views:
Sections – Datum Waterline – Waterlines |
Key Points – Margin Line |
Loadcase mass items |
Tanks – Damaged Tanks – Compartments – Damaged Compart. – Linked Negative
Compartment. – NBV – Tank Names – Tank Fluid Level – Tank Sections – Tank
Outlines |
Probabilistic Damage Zones
* NBV = Non Buoyant Volume

Chapter 5 Hydromax Reference
Page 196
Edge VIsibility Toolbar
The Visibility toolbar contains icons that show or hide various items in the graphical
views:
Hull Surface Edges – Internal Surface Edges – Feature Edges – Bonded Edges
Render Toolbar
Render – Render transparent – Toggle custom light 1 – Toggle custom light 2 – Toggle
custom light 3 – Toggle custom light 4 – Customise light settings
Report Toolbar
Spool results to report
View (extended) Toolbar
Set Home View – Colour – Font – Preferences – Properties
Design Grid Toolbar
Display Frame of Reference (always on) – Display Design Grid – Show Grid – Show
Labels – Show Ticks
Extra Buttons ToolbarToolbar
Add surface areas to loadcase – Preferences |
Heel – Trim – Draft – Displacement – Displacement – Specified Condition –
Permiability – Fluid simulation – Densities – Waveform – Grounding – Batch Analysis
Data Format – Units – Coefficients – Set to DWL – Set View from Data –Visibility
Dialog – Show Single Section

Chapter 5 Hydromax Reference
Page 197
This toolbar provides a number of buttons for commonly used commands in case you
should wish to customise your toolbars.
Menus
The following section describes all of the menu commands available in the Hydromax
program.
File Menu
Edit Menu
View Menu
Case Menu
Analysis Menu
Display Menu
Data Menu
Window Menu
Help Menu
File Menu
The File menu contains commands for opening and saving files and printing.
New
Creates a new table for whichever input table is frontmost, e.g: when the Loadcase
Condition is the frontmost window, the New command will create a new loading
condition. When the Compartment Definition table is frontmost, New creates a new
compartment definition.
Open
When no design is open, selecting the Open command will show a dialog box with a list
of available Maxsurf designs. Select the design you wish to open, click the Open button.
The requested design will be read in and its hull shape calculated for use in Hydromax.
If a design is already open, the Open command will open whichever file corresponds to
the frontmost input window.
Close
The Close command will delete the data in the frontmost window. Hydromax will ask
whether you wish to save any changes.
Selecting Close when one of the design view windows is frontmost will close the current
Maxsurf design.
Save
Selecting Save will save the contents of the frontmost window to a file on the disk.
Save As
Selecting Save As performs the same function as save but allows you to specify a new
filename preventing the original file from being overwritten.
Import
Allows import of file types other than Maxsurf design files

Chapter 5 Hydromax Reference
Page 198
nuShallo
Allows direct import of a nuShallo pan file.
GHS
Allows direct import of a GHS geometry file. A full GHS model file may be
imported directly into Hydromax for analysis. Because the GHS file does not
contain a full, interconneceted, three-dimensional model of the hull, the geometry
is locked: the tank geometry is locked and tanks cannot be added to the model.
The full model including critical points, tanks and sounding pipes are read from
the GHS file. The following limitations currently apply, but will be removed in
subsequent versions:
Hydromax supports only a single buoyant hull part. The buoyant hull part with the
most sections is loaded from the GHS file.
Linked negative tanks are not supported in Hydromax. Any container parts with
elements with negative effectiveness will be read in as tanks. All other cotainers
are read in as tanks.
Sail parts are ignored
Import DXF Background
Enables you to import a DXF file into Hydromax to use as construction lines. The
DXF file will be displayed in the design views.
Import Image Background
Enables you to import an image file (jpg, gif, bmp or png) file into the background
of any of the Hydromax design views.
Export
Selecting Export enables you to export a Hydromax file as a variety of different file
formats such as:
DXF or IGES
DXF exports sections as closed poly-lines. In addition, each tank, compartment
and non-buoyant volume is exported on a separate layer (the layer name being the
same as the compartment name, so it is important to have unique compartment
names).
IGES exports the NURB surface data. See the Maxsurf manual for more
information.
GHS
If you have a Hydrolink license, you may export the Hydromax model to a GHS
geometry file. The hull, tanks and compartments and key points are all exported.
To enable the export command, chose Edit | Activate GHS export.
Hydromax supports only a single buoyant hull part with one byouant component.
The buoyant hull is exported as a single part with a single buoyant component
(Non-buoyant volumes are included in this part as components with negative
effectiveness). It is possible that this might cause problems for some models
where the section through the hull at a certain location contains more than one
closed contour. In subsequent versions of Hydromax we will add the capability to
divide the main buoyant hull into different components.
Hydromax v8.0 file
Also allows users to export Hydromax files that are compatible with earlier
versions of Hydromax.

Chapter 5 Hydromax Reference
Page 199
Export Bitmap
Allows you to export the rendered image as a bitmap file at the specified
resolution. This command is only available when the Perspective window is
frontmost with rendering turned on.
Fredyn
Hydromax is able to export data suitable for input into Fredyn, exporting
Hydromax calibration results, hull form and compartment definitions into Fredyn
input files. To export use the File|Export|Fredyn… command. The Export will
generate 3 files, all with the name you specify in the “Fredyn Export XML”
dialog. The following files will be generated
.xml: Containing compartment definition
.out: Tank calibration results and compartment definitions
.txt: Mesh file representing the current hull shape.
Before doing the Fredyn export ensure you have specified the desired trim and
heel ranges, and performed a tank calibration, as this information is required for
the export.
Fredyn mesh group definition
When exporting from Hydromax to Fredyn you will be asked to name the .xml file
and also the location to which it should be saved. After assigning the .xml file
name, the following dialog will appear:
“Fredyn group definition” dialog
This dialog is where the user will specify the values for the variables used to
generate the mesh file that defines the geometry of the hull.
The most important part of the procedure is setting up the groups required in the
mesh file. The groups are defined by selecting the surfaces to be measured and
defining a boundary box that defines the limiting extents of the group. Contours
will be formed through the selected surfaces and then trimmed back to the
bounding box.
In the group definition dialog, any number of groups may be added and for each
group. For more information on each of the fields in the table click on the Help
button on the right hand side of the dialog.
Allows you to export the rendered image as a bitmap file at the specified Import Main Criteria
Imports criteria from the selected criteria files. Current criteria may be kept or discarded.
Chapter 5 Hydromax Reference
Page 200
Save Main Criteria As
Exports the current criteria set to the specified file. It is good practice to save the criteria
library with each project in a project folder.
Note that a branch of the criteria tree may be saved in its own file by right-clicking on
the branch folder in the Criteria dialog tree. The whole library may be saved by right
clicking on the root “Criteria” branch; this is not normally necessary as this is done after
any major changes to the criteria definition.
Import Prob Damage Criteria
As for main criteria but applies to the probabilistic damage criteria.
Save Prob Damage Criteria As
As for main criteria but applies to the probabilistic damage criteria.
Rest Prob Damage Criteria to defaults
Results the probabilistic damage criteria to their default values.
Load Densities
Loads density table data previously saved from Hydromax – can be useful for
synchronising the densities on several computers.
Save Densities As
Saves the Fluid densities table data, see Density of Fluids on page 150.
Page Setup
The Page Setup dialog allows you to change page size and orientation for printing.
The Print command allows you to print the contents of the frontmost window on the
screen.
Exit
Exit will close Hydromax and all the data windows. If you have any data or results,
which have not been saved to disk, Hydromax will ask you if you wish to save them
before quitting.
Edit Menu
The Edit menu contains commands for working with tables.
Undo
Undo may be used with desk accessories, but cannot be used on Hydromax drawing
windows or data windows.
Cut
Cut may be used in the Report window but cannot be used on Hydromax drawing or data
windows.
Copy
The Copy command allows you to copy data from any of the windows, including the
design view, input tables, results tables and graph window.

Chapter 5 Hydromax Reference
Page 201
Paste
Choose the Paste command to Paste data into the Loadcase window or other input tables,
or the Report window. Paste cannot be used in the View, Graph or Results windows.
Select All
Selects the entire Report.
Fill Down
Copies text in a table down a column like a spreadsheet.
Table
Performs operations on Hydromax's Report window.
Insert New Table
Create a new table in the Report.
Insert Row
Insert a new row into the current table in the Report.
Split Cell
Split the currently selected cell into two separate cells in a table in the Report.
Merge Cells
Merge the selected cells in a table into a single cell in the Report.
Delete Cells
Delete current cell, column or row or a range of cells, columns or rows in the
Report.
Row Positioning
Set Justification for the current table row or an entire table in the Report.
Cell Border
Set Cell Border Width for a single cell or range of cells in the Report.
Cell Shading
Set Cell Shading Percentage for a single cell or a range of cells in the Report.
Show Grid
Toggle table grid lines in the Report.
Add
The Add command is used to add an entry to the input tables (Load, tank, margin line
point etc.).
Delete
The Delete command will delete rows from the input tables. If no rows are selected, the
last row in the window will be deleted, otherwise all selected rows will be deleted.
Sort Items
Sorts the selected rows in the Loadcase window

Chapter 5 Hydromax Reference
Page 202
Move Items Up
Moves the selected rows up (if possible) in the Loadcase and Compartment definition
tables.
Move Items Down
Moves the selected rows down (if possible) in the Loadcase and Compartment definition
tables.
Add Surface Areas
This command automatically adds the surface areas and centres of gravity of all hull
surfaces into the current loading condition. This is useful for estimating the initial weight
of hull plating.
Activate / Deactivate GHS Export
This command activates the GHS Import command in the File menu if a Hydrolink
License is available. It can also be used to release the Hydrolink license – a restart of
Hydromax will be required for this to take effect.
Preferences
The Hydromax preferences dialog allows you to set your analysis tolerances (or: error
values) and select the option to stream the report to a Microsoft Word document.
Also see:
Tolerances on page 146
Streaming results to Word on page 155.
View Menu
The View menu contains commands for controlling the views in the graphics windows.
Zoom
The Zoom function allows you to examine the contents of the design view windows in
detail by enlarging the selected area to fill the screen.
Shrink
Choosing Shrink will reduce the size of the displayed image in the design view windows
by a factor of two.
Pan
Choosing Pan allows you to move the image around within the View window.
Home View
Choosing Home View will set the image back to its Home View size.
Rotate
Activates the Rotate command, which is a virtual trackball which lets you freely rotate a
design in the Perspective view window.
Set Home View
Choosing Set Home View allows you to set the Home View in the View window. To set
the Home View, use Zoom, Shrink, and Pan to arrange the view, then select Set Home
View from the View menu.

Chapter 5 Hydromax Reference
Page 203
Colours and lines
The Colours and lines function allows you to set the colour and thickness of the lines,
labels, and graphs.
Remember to always be careful when using colour. It is very easy to get carried away
with bright colours and end up with a garish display that is uncomfortable to work with.
In general it is best to use a neutral background such as mid grey or dull blue and use
lighter or darker shades of a colour rather than fully saturated hues.
From the scrollable list, select the item whose colour you wish to change. The item‟s
current colour will be displayed on the left of the dialog. To change the colour click in
the box and select a new colour from the palette. To Change the thickness select the
thickness from the drop down list.
When Loadcase window is frontmost, Colours for the loadcase items can be set. See
Loadcase Colour Formatting on page 44.
Font
Font command allows you to set the size and style of text.
The text style chosen will affect the display and printing of all text in the Report,
Loadcase, Graph, Curve of Areas, and Results windows.
Toolbar
Allows you to turn the Toolbars on and off.
Status Bar
Allows you to turn the Status Bar on and off at the bottom of the screen.
Assembly
Show or hide the assembly tree view.
Properties
Displays the properties sheet, which may be used to view parameters of selected objects
(such as tanks).

Chapter 5 Hydromax Reference
Page 204
Full Screen
Maximises screen usage.
Case Menu
Commands associated with the Loadcases and Damage cases
Edit Loadcase
Edit the properties of the current Loadcase (name and whether it is a loadcase or
Loadgroup). Loadcases are created, opened and closed through the file menu. See
Working with Loadcases on page 38.
Add Damage case
Add another damage case
Delete Damage case
Delete the selected damage cases
Edit Damage case
Edit the properties of the selected damage case
Extent of Damage
Automatically finds the breached tanks and compartments due to a cuboid extent of
damage (or in the case of Probabilisitic damage, the zone or sub-zone).
Create cases from Zone Damage
Automatically creates damage cases based on the zones that have been defined for
Probabilistic damage analysis. (This is only required if you want to manually recreate
some or all of the Proabilistic damage analysis conditions; when running Probabilistic
damage analysis, temporary damage conditionas are created automatically.)
Max. number of Loadcases
Specify the number of loadcase tabs – this requires a restart to activate the changes
made.
Analysis Menu
The Analysis menu can be used to change the current analysis mode. It also contains
commands to set the input data and analysis settings and environment options required
for the current analysis.
Chapter 5 Hydromax Reference
Page 205
Note:
It is good practice when preparing to run analysis to work down the
Analysis menu starting at the top and checking all of the settings and
environment options.
Heel
Selecting Heel allows you to specify the three ranges of heel angles that you wish
Hydromax to step through. Separate ranges are used for Large Angle Stability, KN and
Limiting KG analyses.
Trim
Allows the specification of the trimming mode to be used for the analysis. This can be
fixed trim; free-to-trim to loadcase; free-to-trim specifying initial trim value and free-to-
trim specifying LCG position.
Draft
The range of drafts used for the analysis of upright hydrostatics can be set using this
command. KG for the upright hydrostatics is also specified in this dialog.
Displacement
The range of displacements used for the analysis of KN values, Limiting KG and
Floodable Length can be set using this command. The vertical centre of gravity to be
used for KN and Floodable Length analyses is specified here.
Permeability
The range of permeabilities used for the Floodable Length analysis are set using this
command.
Calibration Options
Specify whether compartments and non-buoyant volumes should also be calibrated.
MARPOL Options
Select MARPOL Regulation and specify which tanks should be incuded in the
MARPOL oil outflow analysis.
Specified Condition
Allows you to specify Heel, Trim, CG, Displacement and Draft for the Specified
Condition analysis.
Fluids
Allows you to specify whether to use Corrected VCG method or Simulate Fluid
Movement method when treating the fluid contained in slack tanks. See Fluids Analysis
Methods on page 148.
Density
This command allows you to set the density of fluids used in the analysis. See Density
on page 150.
Waveform
The Waveform command allows you to perform analysis for a flat waterplane or
sinusoidal or trochoidal waveforms.

Chapter 5 Hydromax Reference
Page 206
Criteria
The criteria menu item will bring up the criteria dialog. This allows you to specify which
criteria will be checked during the analysis.
See Criteria on page 163.
When the floodable length analysis is selected, the criteria command will bring up a
Floodable Length Criteria dialog with criteria that only apply to floodable length
analysis.
Grounding
Specifies grounding on one or two points of variable length for use with the Equilibrium
and Longitudinal Strength analyses.
Update Loadcase
Checks for changed tanks and makes sure that any tanks and compartments that have not
been formed are correctly calculated. It then updates the loadcase with the correct
capacities and free surface moments for the tanks. Also recalculates totals and sub-
subtotals after a row sorting or moving command.
Also see:
Tank Loads on page 46
Recalculate Tanks and Compartments
Forces all tanks and compartments to be re-formed from their initial definition. This
command also updates the loadcase.
If any of the tank boundaries are made up from boundary surfaces, it is better to use
“Recalculate Hull Sections” after re-opening the Maxsurf model to make sure the latest
internal structure surfaces are being used as well.
Recalculate Hull Sections
Deletes all existing hull, tank and compartment sections and recalculates them from the
hull surface data and compartment definition. This is particularly useful if the underlying
Maxsurf model has been modified, if you wish to recalculate at a different precision, or
if you wish to modify whether skin thickness or trimming options are applied.
Note:
To be able to update the Hydromax model to changes made in Maxsurf see
Updating the Hydromax Model on page 26 for a step-by-step procedure you
can follow.
Snap Margin Line to Hull
Project all of the margin line points horizontally onto the hull surface, ensuring that the
margin line follows the hull shape precisely.
Also see:
Margin Line Points on page 76.
Set Analysis Type
Choose the analysis type you wish to use from the sub-menu.

Chapter 5 Hydromax Reference
Page 207
Start Analysis
Selecting Start Analysis causes Hydromax to start performing the specified analysis. The
analysis may be halted at any time by choosing Stop Analysis from this menu, also.
Resume Analysis
If you have halted analysis by choosing Stop Analysis, Resume Analysis may be used to
restart the calculation from the point where it was interrupted.
Stop Analysis
This command halts the analysis at the current iteration. Note that the analysis may not
have been completed and in the case of large angle stability, equilibrium condition and
KN values, any data displayed for the final iteration may be incorrect.
Start Batch Analysis
Hydromax will run the selected analyses for all combinations of load and damage cases
using the batch processing command. Results are written to a tab delimited text file as
specified by the user at the start of the analysis.
Spool to Report
Send the results of the analysis to the report upon completion. This should be turned on
before commencing the analysis to ensure that results are added to the report when the
analysis is completed.
Display Menu
The Display menu contains commands for controlling the data, which are displayed in
the graphics and other windows.
Data Format
Data Format allows you to choose which data are tabulated and graphed (Upright
Hydrostatics, Stability, Equilibrium and Specified Condition). A dialog box allows you
to choose from a range of stability variables. See Setting the Data Format on page 185.
Hydrostatic results Data format dialog
Used to select display options for Criteria results:

Chapter 5 Hydromax Reference
Page 208
Criteria table Data format dialog
Used to select which columns are displayed in the Loadcase window:
Loadcase Data format dialog
When the Max. Safe heeling angle angles graph is shown as a result of a Large Angle
Stability analysis the Data Format dialog may be used to customise the graph layout:

Chapter 5 Hydromax Reference
Page 209
Max safe heeling angle Data format dialog
May be used to customise the Floodable length graph:
Floodable length Data format dialog
Set Vessel to DWL
Rotates the vessel back to upright and to DWL after an analysis has been completed (or
Select View from Data used). This is required for automatic update of the Loadcase
(note that if you do not rotate back to the DWL, the Loadcase will not update while
editing – only when start another analysis). This is to ensure that tank data in the
Loadacase are for the vessel in the upright condition, not for tanks with the vessel at the
final heel and trim of the last analysis.
Select View from Data
This function may be used to synchronise the display in the Design View window with
one of the sets of data in Results window. The view may be set from any of the results
from Upright Hydrostatics, Large Angle Stability or Equilibrium analyses. Simply
highlight the column or row that corresponds to the condition you wish to view and
select “Select View From Data”; the Design View will change to match the condition in
the selected row or column in the Results window.
Visibility
The visibility of tanks, compartments, labels, hull contours, and other items in the design
view may be set by using this dialog.
Prob damage zones
Toggle the visibility of the probabilistic damage zones.

Chapter 5 Hydromax Reference
Page 210
Individual Loadcase masses
Toggle the visibility of the individual mass items in the current loadcase.
Background
Controls whether the background DXF construction lines and the background images are
displayed or not. The background may be loaded from an existing DXF file using the
Import function in the File menu. Tools for positioning and scaling the background
image are also here.
The commands in the submenu are only available when a background image or DXF has
been imported. See the Maxsurf manual for more details
Hide DXF
Hides the DXF background.
Show DXF
Shows the DXF background.
Delete DXF background
Deletes the DXF background.
Hide Image
Hides the background image in the current view window.
Show Image
Shows the image in the current view window.
Set Image Zero Point
Sets the image zero point. This command is not available for images in the
perspective window.
Set Image Reference Point
Sets the image reference point..
Delete Image
Deletes the background image in the current view window.
Design Grid
The grid submenu allows you to hide the grid or show the grid with or without station
grid labels. The grid can only be displayed when the vessel is in upright position on its
design waterline. The option to display the grid will be greyed out when the ship is
currently displayed in, for example, a trimmed state at the end of an equilibrium analysis.
Switching analysis type puts the boat back into upright position on its design waterline.
Show Single Hull Section in Body Plan
Selecting the Show Single Hull Section item from the Display menu will change the
display in the Body Plan window to show only one section through the hull, as well as a
control box, similar to the one in Maxsurf, in the top right corner of the window.
The section being displayed can be chosen by clicking on the section indicators at the top
of the control box. Alternatively, the section chosen can be changed by pressing the left
or right cursor keys on your keyboard. This allows you to rapidly step through the hull
sections from bow to stern.
Also see:
Show Single Hull Section on page 30

Chapter 5 Hydromax Reference
Page 211
Render
When the Perspective window is the current view for the model the Render option may
be toggled on and off to render the surfaces.
Render Transparent
When the Perspective window is the current view for the model the Render Transparent
option may be toggled on and off. Render Transparent makes the hull surfaces of the
model semi transparent so that the rendered tanks and compartments within the model
may be viewed.
Animate
This command is available for any analysis that steps through several steps. For
example, when a waveform has been specified and an equilibrium analysis is selected or
after a Large Angle Stability analysis over a heeling range.
Selecting Animate will animate the stability sequence in the design View window,
through the range of heel angles specified. You may set the initial viewing position in
the Perspective View window using the Pitch, Roll and Yaw indicators. When
Hydromax has finished calculating the frames the sequence may be replayed by moving
the mouse from side to side. Clicking the mouse button will terminate the animation.
If animation is chosen after an Equilibrium Analysis has been performed in waves, the
animation will automatically cycle through the full range of wave phases, giving a
simple visual simulation of the motion of the hull through the wave.
Hold the shift key down while selecting the command to save the animation.
Data Menu
Units
The units used may be specified using the Units command. In addition to the length and
mass units classes, units for speed (used in wind heeling and heeling due to high-speed
turn etc. criteria) and the angular units to be used for areas under GZ curves, may also be
set. The angular units for measuring heel and trim angles are always degrees. See
Setting Units on page 37 for more information.
Coefficients
Allows you to customise how you wish to calculate the coefficients as well as the display
format for the LCB and LCF.
See Customising Coefficients on page 36 for more information.
Design Grid
Access to the Design Grid is intended for information only. You are not expected to
change the Design Grid in Hydromax.
Frame of Reference
Access to the Frame of Reference is intended for information only. You are not expected
to change the Frame of Reference in Hydromax.

Chapter 5 Hydromax Reference
Page 212
If the position(s) of the Baseline and/or Perpendiculars need to be changed from those
defined in the Maxsurf model, they may be changed using the Frame of Reference
command. It is highly recommended that the correct frame of reference be set in
Maxsurf prior to loading the design into Hydromax. This will ensure that a consistent
frame of reference is used in all the programs. See: Setting the Frame of Reference on
page 18.
Window Menu
For the items in this menu, each represents a Hydromax window. Selecting the item
brings the appropriate window to the front.
Cascade
Displays all the Windows behind the active Windows.
Tile Horizontal
Layout all visible windows across the screen.
Tile Vertical
Layout all visible windows down the screen.
Arrange Icons
Rearranges the icons of any iconised window so that they are collected together at the
bottom of the Maxsurf program window.
View Direction
Select the desired view direction from the sub-menu. The selected design window will
then be brought to the front.
Loadcase
Brings the Loadcase window to the front. The Loadcase window allows you to enter a
series of component weights, together with their longitudinal and vertical distances from
the zero point. These inputs are used to calculate the total Displacement and Centre of
Gravity for Stability, KN and Equilibrium analysis.
Input
Choose from the Input item to bring the desired Input window to the front and display
the Compartment Definition, Key Points, Margin Line Points or Modulus table.
Results
Choose from the Results item to bring the desired Results window to the front and
display the desired table.
Graph
Brings the selected Graph window to the front. The Graph window displays a number of
different graphs, depending on which analysis mode is currently active.
Help Menu
Provides access to Hydromax Help.
Hydromax Help
Invokes Hydromax Help.

Chapter 5 Hydromax Reference
Page 213
Hydromax Automation Reference
Invokes the Automation Reference help system.
Online Support
Provides access to a wide range of support resources available on the internet.
Check for Updates
Provides access to our website with the most recent version listed.
About Hydromax
Displays information about the current version of Hydromax you are using.
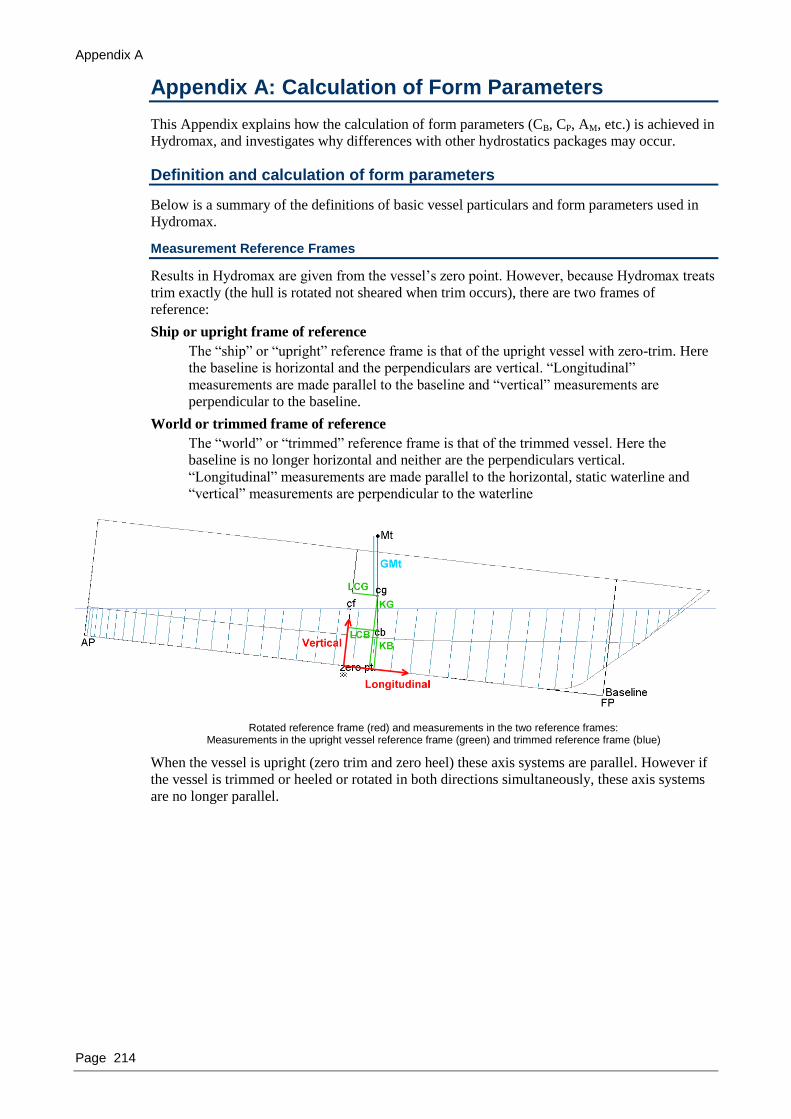
Appendix A
Page 214
Appendix A: Calculation of Form Parameters
This Appendix explains how the calculation of form parameters (CB, CP, AM, etc.) is achieved in
Hydromax, and investigates why differences with other hydrostatics packages may occur.
Definition and calculation of form parameters
Below is a summary of the definitions of basic vessel particulars and form parameters used in
Hydromax.
Measurement Reference Frames
Results in Hydromax are given from the vessel‟s zero point. However, because Hydromax treats
trim exactly (the hull is rotated not sheared when trim occurs), there are two frames of
reference:
Ship or upright frame of reference
The “ship” or “upright” reference frame is that of the upright vessel with zero-trim. Here
the baseline is horizontal and the perpendiculars are vertical. “Longitudinal”
measurements are made parallel to the baseline and “vertical” measurements are
perpendicular to the baseline.
World or trimmed frame of reference
The “world” or “trimmed” reference frame is that of the trimmed vessel. Here the
baseline is no longer horizontal and neither are the perpendiculars vertical.
“Longitudinal” measurements are made parallel to the horizontal, static waterline and
“vertical” measurements are perpendicular to the waterline
Rotated reference frame (red) and measurements in the two reference frames: Measurements in the upright vessel reference frame (green) and trimmed reference frame (blue)
When the vessel is upright (zero trim and zero heel) these axis systems are parallel. However if
the vessel is trimmed or heeled or rotated in both directions simultaneously, these axis systems
are no longer parallel.
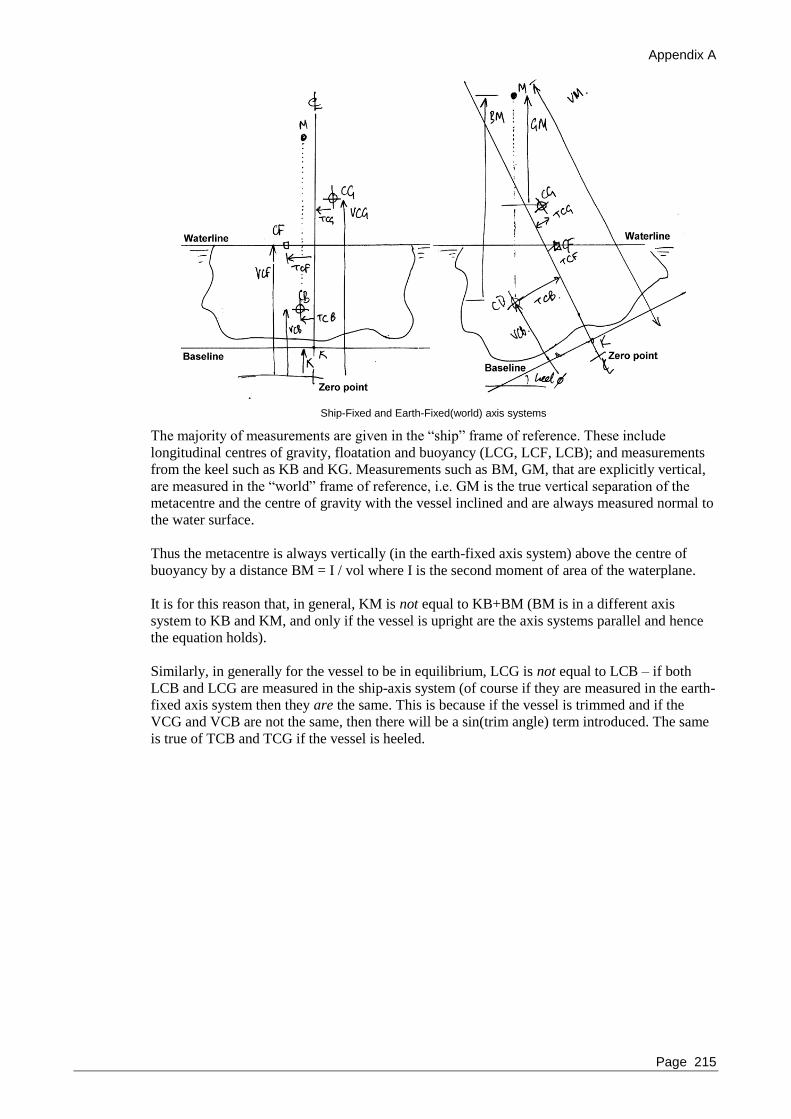
Appendix A
Page 215
Ship-Fixed and Earth-Fixed(world) axis systems
The majority of measurements are given in the “ship” frame of reference. These include
longitudinal centres of gravity, floatation and buoyancy (LCG, LCF, LCB); and measurements
from the keel such as KB and KG. Measurements such as BM, GM, that are explicitly vertical,
are measured in the “world” frame of reference, i.e. GM is the true vertical separation of the
metacentre and the centre of gravity with the vessel inclined and are always measured normal to
the water surface.
Thus the metacentre is always vertically (in the earth-fixed axis system) above the centre of
buoyancy by a distance BM = I / vol where I is the second moment of area of the waterplane.
It is for this reason that, in general, KM is not equal to KB+BM (BM is in a different axis
system to KB and KM, and only if the vessel is upright are the axis systems parallel and hence
the equation holds).
Similarly, in generally for the vessel to be in equilibrium, LCG is not equal to LCB – if both
LCB and LCG are measured in the ship-axis system (of course if they are measured in the earth-
fixed axis system then they are the same. This is because if the vessel is trimmed and if the
VCG and VCB are not the same, then there will be a sin(trim angle) term introduced. The same
is true of TCB and TCG if the vessel is heeled.

Appendix A
Page 216
Nomenclature
Amax Maximum immersed cross-sectional area to waterline
under investigation
Ams Immersed cross-sectional area to waterline under
investigation amidships
A Immersed cross-section area: Amax or Ams as selected by
user
AWP Area of waterplane at the waterline under investigation
BOA Overall beam of whole vessel (above and below
waterline)
BWL Maximum waterline beam at design waterline
B Maximum beam of waterline under investigation
b Waterline beam of station under investigation
GM Metacentric height: vertical distance from centre of
gravity to metacentre, measured in the trimmed reference
frame
KB Distance from keel (baseline) to centre of buoyancy,
measured normal to the baseline.
KG Distance from keel (baseline) to centre of gravity,
measured normal to the baseline.
LOA Length overall
LCB Longitudinal Centre of Buoyancy, measured in upright
reference frame, parallel to baseline.
LCF Longitudinal Centre of Floatation, measured in upright
reference frame, parallel to baseline.
LCG Longitudinal Centre of Gravity, measured in upright
reference frame, parallel to baseline.
LWL Length of design waterline
LBP Length between perpendiculars
L length of waterline under investigation
T0 Draft from some arbitrary baseline (normally the lowest
point on the design)
T Maximum immersed depth (draft) of hull
t Draft (immersed depth) of station under investigation
Immersed volume of displacement at waterline under
investigation
Coefficient parameters
There are several options for calculating hullform coefficients. These can be modified in the
Data | Coefficients dialog shown below:

Appendix A
Page 217
Length
The datum/design waterline or DWL is a waterline near which the fully loaded design is
intended to float under normal circumstances. The forward perpendicular is normally defined as
the intersection of the DWL with the bow. The after perpendicular is normally defined as the
position of the rudder post, or possibly the transom.
Several lengths may be defined: the LBP is the length between perpendiculars, this may be
different from the length of the DWL (LWL) and in general, will also be different from the
LOA (overall length). In some cases, particularly for resistance prediction purposes, it may be
more appropriate to define an effective length of the underwater body, features such as bulbous
bows and overhangs can make the LBP, LWL and LOA quite different. In addition, for
calculations at drafts other than the DWL, it may be appropriate to use the actual waterline
length at that draft (L).
Some of the more common lengths that may be used to characterise a vessel.
In Hydromax you may choose between the length between perpendiculars and the waterline
length for the calculation of Block, Prismatic and Waterplane Area Coefficients. Select
Coefficients from the Display menu:
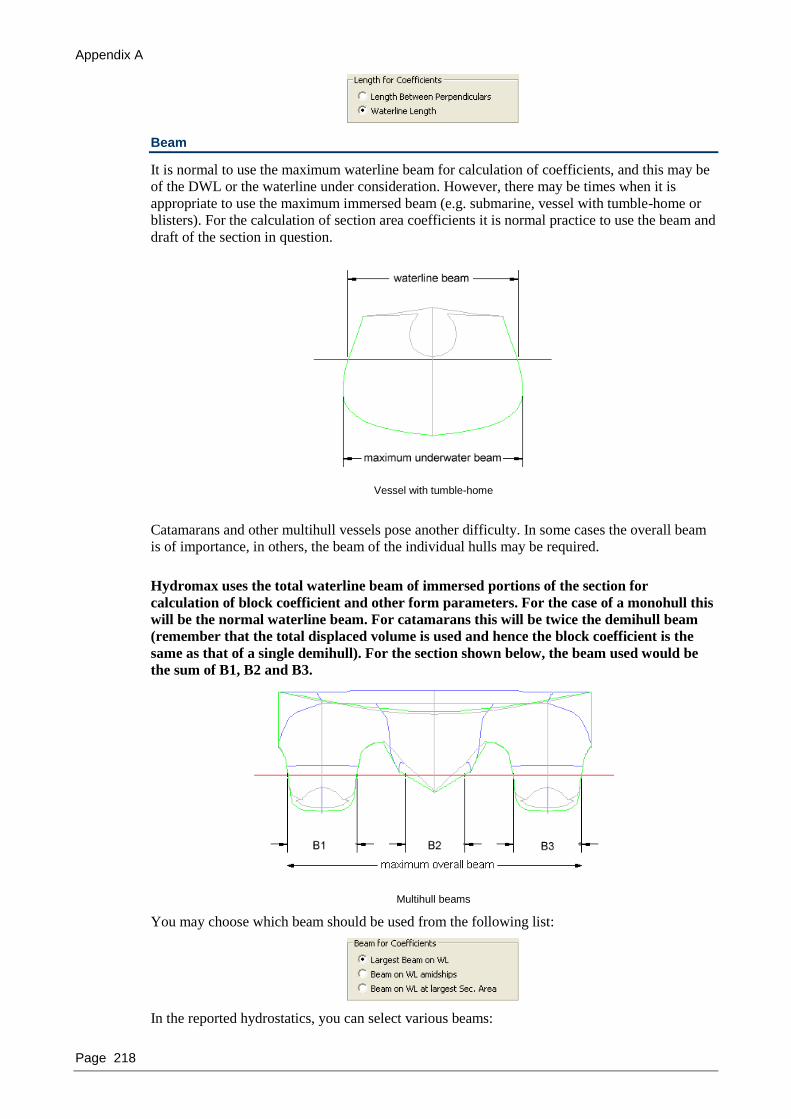
Appendix A
Page 218
Beam
It is normal to use the maximum waterline beam for calculation of coefficients, and this may be
of the DWL or the waterline under consideration. However, there may be times when it is
appropriate to use the maximum immersed beam (e.g. submarine, vessel with tumble-home or
blisters). For the calculation of section area coefficients it is normal practice to use the beam and
draft of the section in question.
Vessel with tumble-home
Catamarans and other multihull vessels pose another difficulty. In some cases the overall beam
is of importance, in others, the beam of the individual hulls may be required.
Hydromax uses the total waterline beam of immersed portions of the section for
calculation of block coefficient and other form parameters. For the case of a monohull this
will be the normal waterline beam. For catamarans this will be twice the demihull beam
(remember that the total displaced volume is used and hence the block coefficient is the
same as that of a single demihull). For the section shown below, the beam used would be
the sum of B1, B2 and B3.
Multihull beams
You may choose which beam should be used from the following list:
In the reported hydrostatics, you can select various beams:

Appendix A
Page 219
Calculated beams
The values “Beam extents” are those that measure the beam across the maximum port and
starboard extents of the vessel. For a catamaran this would be from the outside of the port
demihull to the outside of the starboard demihull. For a monhull, this would simply be the
distance from the port side to the starboard side.
The other beam values are calculated by summing the breadth of waterline crossings as
described above. For a monhull without tunnels, this will be the same as the extents value, but
for a multihull, it will be less than the extents value. Hydromax uses these values for computing
coefficients.
Draft
The draft is normally specified from a nominal datum. Normally this datum is the lowest part of
the upright hull. However, for vessels with raked keel lines or yachts, the datum may be
elsewhere. In Hydromax drafts are defined from the datum line. However, there are also
occasions when the immersed depth of the section is a more relevant measure of draft, this is
often the case when form parameters are calculated.
Hydromax uses the depths that stations extend below the waterline for calculation of form
coefficients. Both depths are measured in upright position.
You may select which depth should be used for the calculation of form parameters, including
the option of measuring the draft to the baseline – this gives the option of ignoring appendages
such as fin keels when determining the draft to be used to calculate the form parameter (if the
baseline is defined to the bottom of the canoe body for example). It should be noted that the
section area will, however, include the appendages.:

Appendix A
Page 220
Draft measurements
Draft measurement at heel angle
When the vessel is heeled, the draft is measured through the intersection of the upright
waterline and the centreline, perpendicular to the heeled waterline (see figure below).
Essentially the draft is measured along the heeled and trimmed perpendiculars on the
centreline. It is for this reason that as the heel approaches 90degrees, the draft becomes
very large.
Draft measured along the inclined perpendicular lines
Immersed depth and Draft measurements
The images below show the difference between the draft measurements (which are made
in the inclined centreline plane of the vessel) and the immersed depth measurements
(which are made normal to the free-surface).
Difference between “Immersed depth” and “Draft” measurements
Midship and Max Area Sections
It is current usual practice to define the midship section as midway between the perpendiculars,
however for some vessels it is defined as the midpoint of the DWL. For vessels with no parallel
mid-body, the section with greatest cross-sectional area may also be of particular interest. In
Hydromax, the position midway between the perpendiculars is defined as midships.
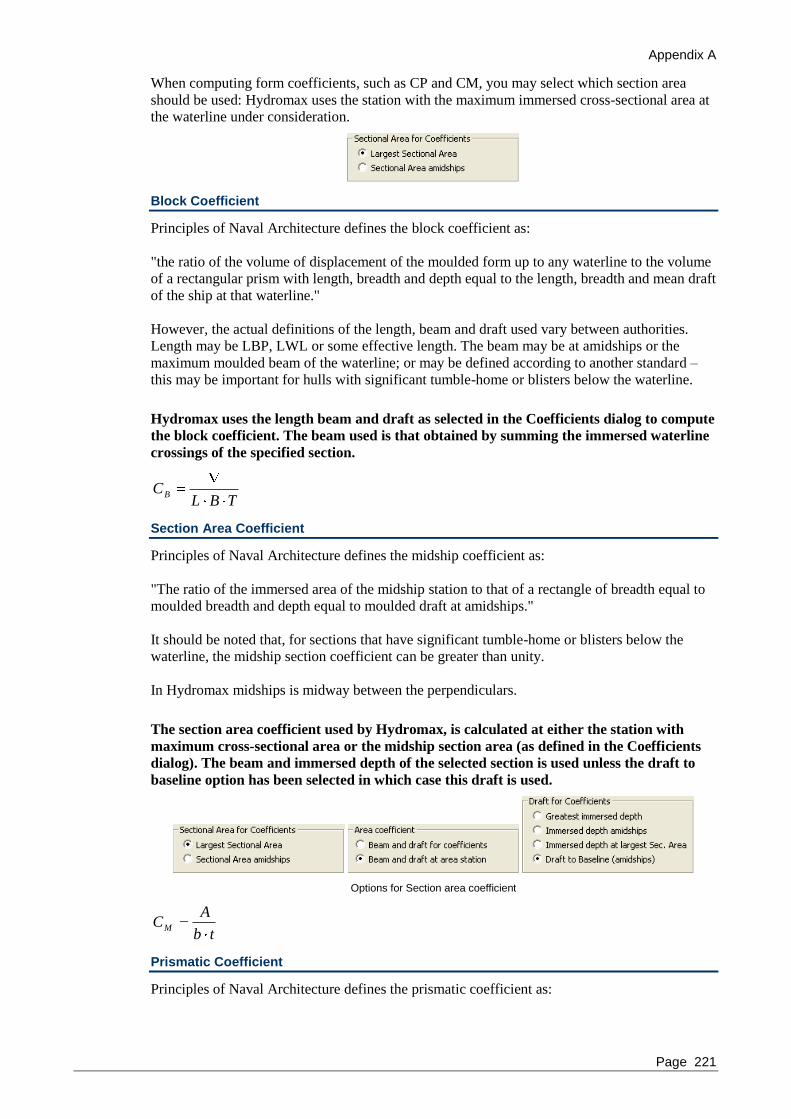
Appendix A
Page 221
When computing form coefficients, such as CP and CM, you may select which section area
should be used: Hydromax uses the station with the maximum immersed cross-sectional area at
the waterline under consideration.
Block Coefficient
Principles of Naval Architecture defines the block coefficient as:
"the ratio of the volume of displacement of the moulded form up to any waterline to the volume
of a rectangular prism with length, breadth and depth equal to the length, breadth and mean draft
of the ship at that waterline."
However, the actual definitions of the length, beam and draft used vary between authorities.
Length may be LBP, LWL or some effective length. The beam may be at amidships or the
maximum moulded beam of the waterline; or may be defined according to another standard –
this may be important for hulls with significant tumble-home or blisters below the waterline.
Hydromax uses the length beam and draft as selected in the Coefficients dialog to compute
the block coefficient. The beam used is that obtained by summing the immersed waterline
crossings of the specified section.
TBLCB
Section Area Coefficient
Principles of Naval Architecture defines the midship coefficient as:
"The ratio of the immersed area of the midship station to that of a rectangle of breadth equal to
moulded breadth and depth equal to moulded draft at amidships."
It should be noted that, for sections that have significant tumble-home or blisters below the
waterline, the midship section coefficient can be greater than unity.
In Hydromax midships is midway between the perpendiculars.
The section area coefficient used by Hydromax, is calculated at either the station with
maximum cross-sectional area or the midship section area (as defined in the Coefficients
dialog). The beam and immersed depth of the selected section is used unless the draft to
baseline option has been selected in which case this draft is used.
Options for Section area coefficient
tb
ACM
Prismatic Coefficient
Principles of Naval Architecture defines the prismatic coefficient as:

Appendix A
Page 222
"The ratio between the volume of displacement and a prism whose length equals the length of
the ship and whose cross-section equals the midship section area."
Again the definition of midship section and vessel length depend on the standard being used.
Hydromax uses the selected length and the selected immersed cross-section area Amax or
Ams.
ALCP
Waterplane Area Coefficient
Principles of Naval Architecture defines the waterplane area coefficient as:
"The ratio between the area of the waterplane and the area of a circumscribing rectangle."
Hydromax uses the length and beam as selected.
BL
AC WP
WP
LCG and LCB
Hydromax allows you to fully customise how you want to display the LCB and LCF values. See
Customising Coefficients on page 36 for more information.
The LCG and LCB are calculated in the “ship” or “upright” frame of reference; see
Measurement Reference Frames on page 214. When the vessel is free-to-trim, the LCG and
LCB will be at the same longitudinal position in the global coordinate system, but not in the
frame of reference. Therefore a difference between the LCG and the LCB value will occur when
the vessel is trimmed. This is explained in the figure below:
Effect of vertical separation of CG and CB on LCG and LCB measured in the Ship reference frame

Appendix A
Page 223
Note:
LCG and LCB are calculated in the vessels‟ frame of reference and therefore will
have different longitudinal positions when the vessel is trimmed then for when it is
upright.
This is the same for differences in TCG and TCB values due to heeling.
Trim angle
The trim angle as defined by:
pp
fa
L
TT1tan
where: is the trim angle; Ta , Tf are the aft and forward drafts at the corresponding
perpendiculars and LPP is the length between perpendiculars.
Maximum deck inclination
The inclination angle is a combination of heel and trim angle. Hydromax calculates the steepest
slope of the deck when the ship is trimmed and/or heeled. Deck camber and initial deck slope
are not taken into account.
For example:
The Max deck inclination is the
maximum slope of the deck when
combining the trim and heel angle
of the vessel, assuming the deck
inclination is zero when the vessel is
in upright position.
Immersion
The weight required to sink the model one unit-length below its current waterline. The unit-
length can be either in cm or inch depending on your unit settings.
MTc or MTi
The required moment to make the vessel trim one unit-length. That can be either cm or inch
depending on your unit settings.

Appendix A
Page 224
RM at 1 deg
The righting Moment at 1 degree heel angle, calculated by
)1sin(**GMtDisplRM
Potential for errors in hydrostatic calculations
There are a number of potential sources of error when calculating the hydrostatic properties of
immersed shapes. These mainly occur from the integration method used, and occur in both hand
calculations, and most automatic calculations carried out by computers. Both methods use
numerical integration techniques, which are normally either based on Simpson's rule or the
Trapezium rule. As with all numerical integration schemes, the accuracy increases as the step
size is reduced, hence computer calculations offer an enormous advantage compared with hand
calculations, due to the increased speed and accuracy with which these calculations may be
carried out. With hand calculations, it is normal to use perhaps 21 sections and perhaps 3-5
significant figures; with computer calculations, it is quite feasible to use 200 sections or more
with 10s of significant figures. These effects are noted from comparing the results of different
hydrostatics packages on the same hullform. In general, differences for basic parameters such as
displacement etc. are under 0.5% (note that, in general, agreement of hand calculations to within
2% is considered good). Differences in derived form parameters may show considerable
variation. However, this is primarily due to differences in the definitions used – see discussion
above.
The 0.5% error discrepancy noted above, may be attributed to a number of causes:
Convergence limits when balancing a hull to a specified displacement or centre of gravity.
Different number of integration stations used, and their distribution. Where there are large
changes in shape, such as near the bow and stern, the stations should be more closely
spaced. This can be of particular importance if the waterline intersects the stem profile
between two sections.
Differences in the hull definition, and number of interpolation points used to define each
section. If the surface is exported as DXF poly-lines then the precision used and the
number of straight-line sections used to make up the poly-line are important.
The integration method used: trapezium, Simpson, or higher order methods.
Integration of wetted surface area
At first glance, it may seem that wetted surface area may be calculated by simply integrating the
station girth along the length of the hull, in a similar way that one might integrate the station
cross-sectional area along the length of the hull to obtain the volume. However, this is not the
case, and the wetted surface area can only be accurately found by summing elemental areas over
the complete surface. Further, the error due to integrating girths along the vessel length cannot
be removed simply by increasing the number of integration stations. The only accurate
numerical method is to sum the areas of individual triangles interpolated on the parametric
surface.
The differences are easily shown by considering the surface area of half a sphere. This is given
analytically by: 22 RA , where R is the radius of the circle.
It may be shown that the area obtained by integrating the girth of the sphere along its length is
given by:
2
22' R
A , note that this is with an infinite number of integration steps, and hence the
integration of section girths underestimates by error factor of 27.1/45.0
222
2
R
R, or
approximately 27%.

Appendix A
Page 225
However, for normal ship hulls the differences will be much less, due to the greatly reduced
longitudinal curvature. Surface areas calculated by the 'Calculate Areas' dialog in Maxsurf are
the most accurate, since they are derived from the actual parametric definition of the surface.
Those calculated by Hydromax and most other hydrodynamics packages, which use a number of
vertical stations to define the hull, will be subject to the error described above.
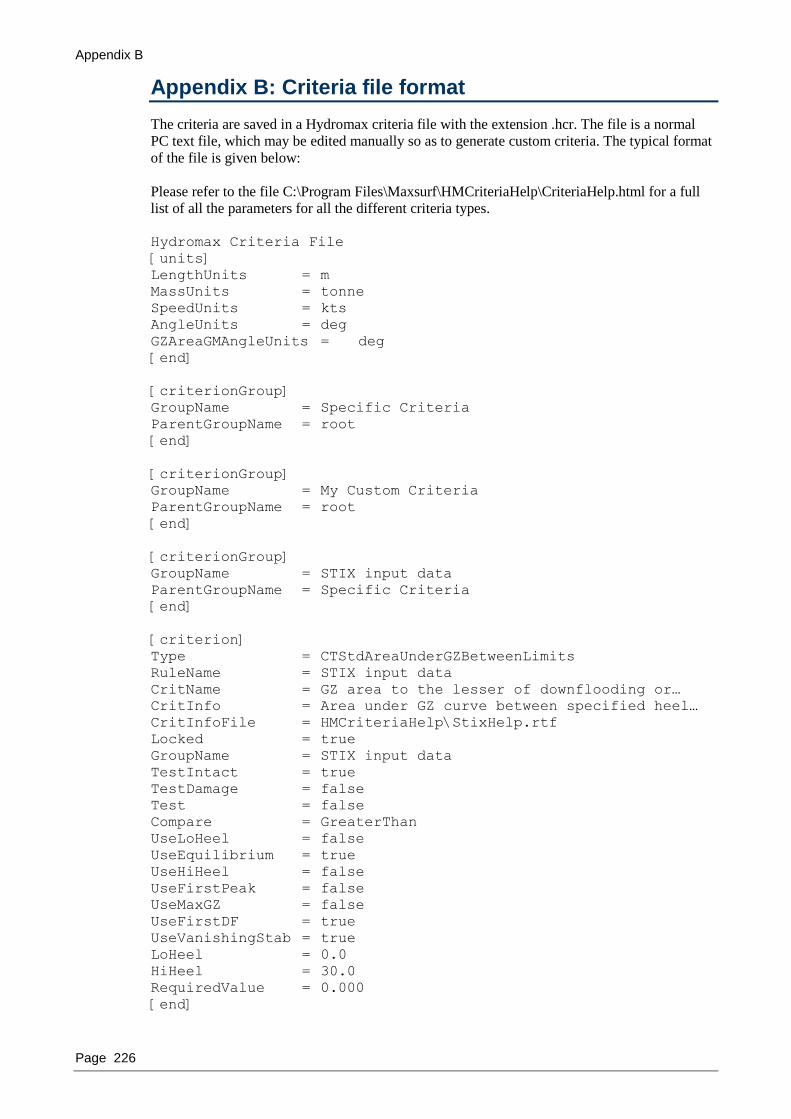
Appendix B
Page 226
Appendix B: Criteria file format
The criteria are saved in a Hydromax criteria file with the extension .hcr. The file is a normal
PC text file, which may be edited manually so as to generate custom criteria. The typical format
of the file is given below:
Please refer to the file C:\Program Files\Maxsurf\HMCriteriaHelp\CriteriaHelp.html for a full
list of all the parameters for all the different criteria types.
Hydromax Criteria File
[units]
LengthUnits = m
MassUnits = tonne
SpeedUnits = kts
AngleUnits = deg
GZAreaGMAngleUnits = deg
[end]
[criterionGroup]
GroupName = Specific Criteria
ParentGroupName = root
[end]
[criterionGroup]
GroupName = My Custom Criteria
ParentGroupName = root
[end]
[criterionGroup]
GroupName = STIX input data
ParentGroupName = Specific Criteria
[end]
[criterion]
Type = CTStdAreaUnderGZBetweenLimits
RuleName = STIX input data
CritName = GZ area to the lesser of downflooding or…
CritInfo = Area under GZ curve between specified heel…
CritInfoFile = HMCriteriaHelp\StixHelp.rtf
Locked = true
GroupName = STIX input data
TestIntact = true
TestDamage = false
Test = false
Compare = GreaterThan
UseLoHeel = false
UseEquilibrium = true
UseHiHeel = false
UseFirstPeak = false
UseMaxGZ = false
UseFirstDF = true
UseVanishingStab = true
LoHeel = 0.0
HiHeel = 30.0
RequiredValue = 0.000
[end]
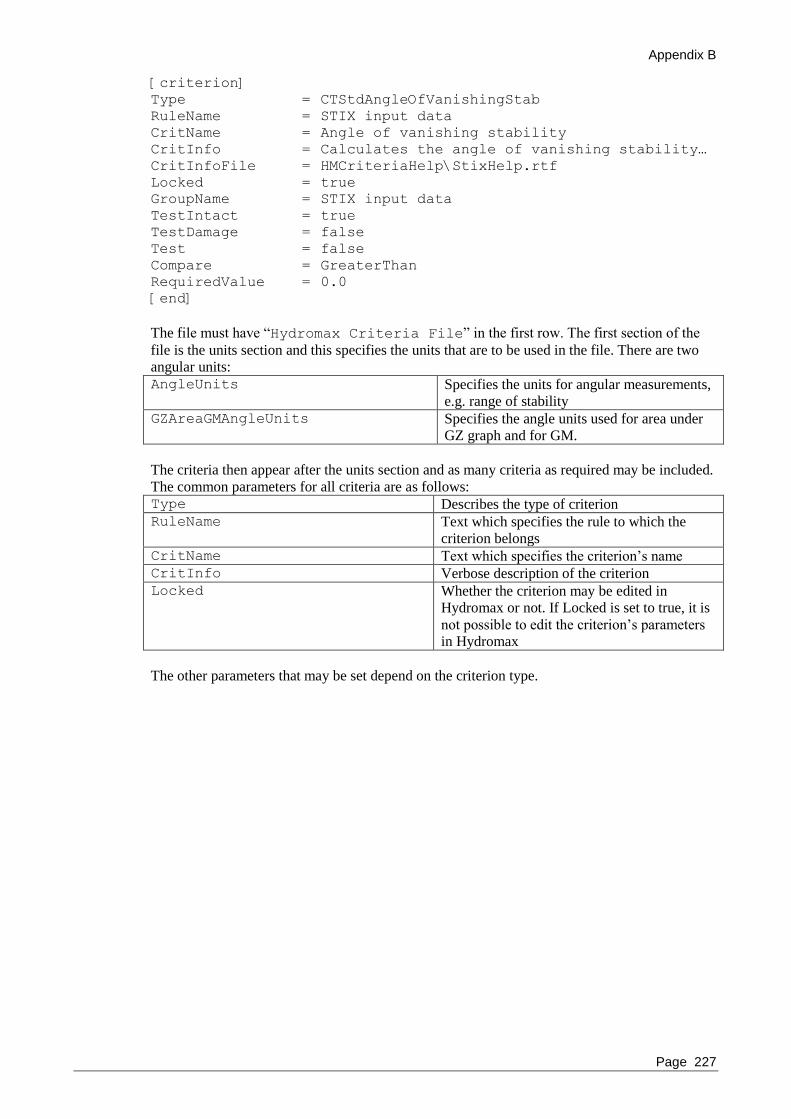
Appendix B
Page 227
[criterion]
Type = CTStdAngleOfVanishingStab
RuleName = STIX input data
CritName = Angle of vanishing stability
CritInfo = Calculates the angle of vanishing stability…
CritInfoFile = HMCriteriaHelp\StixHelp.rtf
Locked = true
GroupName = STIX input data
TestIntact = true
TestDamage = false
Test = false
Compare = GreaterThan
RequiredValue = 0.0
[end]
The file must have “Hydromax Criteria File” in the first row. The first section of the
file is the units section and this specifies the units that are to be used in the file. There are two
angular units:
AngleUnits Specifies the units for angular measurements,
e.g. range of stability
GZAreaGMAngleUnits Specifies the angle units used for area under
GZ graph and for GM.
The criteria then appear after the units section and as many criteria as required may be included.
The common parameters for all criteria are as follows: Type Describes the type of criterion
RuleName Text which specifies the rule to which the
criterion belongs
CritName Text which specifies the criterion‟s name CritInfo Verbose description of the criterion
Locked Whether the criterion may be edited in
Hydromax or not. If Locked is set to true, it is
not possible to edit the criterion‟s parameters
in Hydromax
The other parameters that may be set depend on the criterion type.
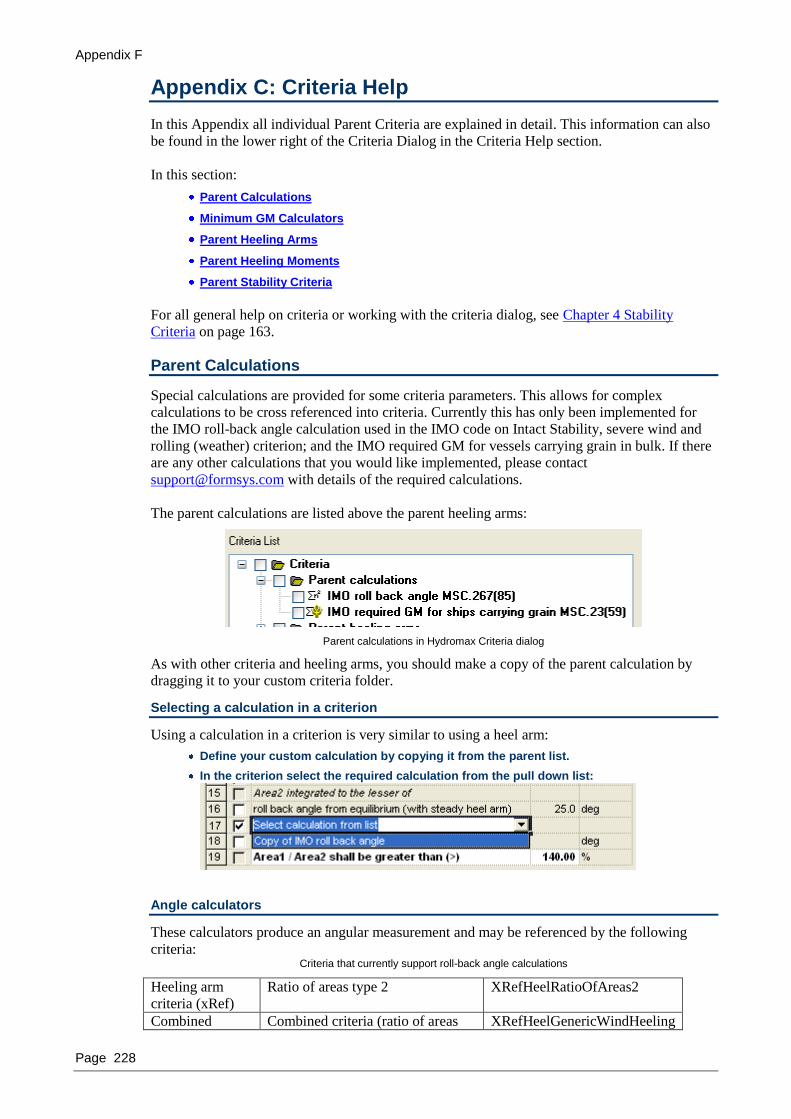
Appendix F
Page 228
Appendix C: Criteria Help
In this Appendix all individual Parent Criteria are explained in detail. This information can also
be found in the lower right of the Criteria Dialog in the Criteria Help section.
In this section:
Parent Calculations
Minimum GM Calculators
Parent Heeling Arms
Parent Heeling Moments
Parent Stability Criteria
For all general help on criteria or working with the criteria dialog, see Chapter 4 Stability
Criteria on page 163.
Parent Calculations
Special calculations are provided for some criteria parameters. This allows for complex
calculations to be cross referenced into criteria. Currently this has only been implemented for
the IMO roll-back angle calculation used in the IMO code on Intact Stability, severe wind and
rolling (weather) criterion; and the IMO required GM for vessels carrying grain in bulk. If there
are any other calculations that you would like implemented, please contact
[email protected] with details of the required calculations.
The parent calculations are listed above the parent heeling arms:
Parent calculations in Hydromax Criteria dialog
As with other criteria and heeling arms, you should make a copy of the parent calculation by
dragging it to your custom criteria folder.
Selecting a calculation in a criterion
Using a calculation in a criterion is very similar to using a heel arm:
Define your custom calculation by copying it from the parent list.
In the criterion select the required calculation from the pull down list:
Angle calculators
These calculators produce an angular measurement and may be referenced by the following
criteria: Criteria that currently support roll-back angle calculations
Heeling arm
criteria (xRef)
Ratio of areas type 2 XRefHeelRatioOfAreas2
Combined Combined criteria (ratio of areas XRefHeelGenericWindHeeling

Appendix B
Page 229
heeling arm
criteria (xRef)
type 2)
Heeling arm
criteria (stand
alone)
Ratio of areas type 2 - general
wind heeling arm
CritHeelRatioOfAreas2
Heeling arm,
combined
criteria (stand
alone)
Combined criteria (ratio of areas
type 2) - general wind heeling arm
CritHeelGenericWindHeeling
Heeling arm,
combined
criteria (stand
alone)
Combined criteria (ratio of areas
type 2) - wind heeling arm
CritHeelWindHeeling
IMO roll-back angle calculator
The IMO roll back angle calculator calculates the roll back angle as per the severe wind and
rolling (weather) criterion as defined in the IMO Code on Intact Stability. The input parameters
may be specified by the user or calculated by Hydromax for the vessel in the upright condition
for the current loadcase. The block coefficient is calculated with the current user settings for
length and beam (not necessarily the waterline beam which another parameter required for the
calculation). The method used for the k-factor can be one of three options: “Round bilge: k =
1.0”, “Sharp bilge: k = 0.7” or “Tabulated value for k” – these are auto completed so you only
need to type the first letter.
This calculation follows the function defined in the Intact Stability codes A.749(18) and
MSC.267(85).
Input parameters for: IMO roll-back angle calculation
GM calculators
These calculators produce a GM measurement and may be referenced by the following criteria: Criteria that currently support roll-back angle calculations
GZ curve criteria Value of GMt at (calc) CTStdValueOfGMAt
Minimum GM calculator – Grain
The required GM for vessels carrying grain, as defined in IMO Resolution MSC.23(59), is
calculated as follows:
SF
VBBVBLGM
dd
0875.0
645.025.0
Where (using consistent units):
L is the combined length of all full compartments

Appendix F
Page 230
B is the moulded breadth of the vessel
SF is the stowage factor
Vd is the calculated average void depth
Δ is the vessel displacement
Input parameters for: Grain heeling min. required GM
Minimum GM calculator – Wind pressure
The GM required to withstand wind pressure is calculated as follows:
)sin(
)(cos)(
0
0
2
1
0
nHhAk
Lk
GM
Where (using consistent units):
L is the waterline length of the vessel (if the criterion required LPP or LOA then enter the
value directly rather than having it calculated by Hydromax.
Δ is the vessel displacement
0 is a critical heel angle which may be a fixed angle or a fraction of the deck-edge or
marginline immersion angle
A is the windage area which may be specified as a total area or as an area additional to the
area of the hull above the waterline; h is height of the centroid of A above the zero point.
H is the height of the assumed centre of lateral resistance of the vessel.
k0 and k1 are constants, for example:
For CFR 46, 170.170: ocean service:
k0 = 0.005 Ton/ft2 and k1 = 14200 ft
4/Ton
k0 = 0.055 t/m2 and k1 = 1309 m
4/t
For CFR 46, 170.170: service on partially protected water:
k0 = 0.0033 Ton/ft2 and k1 = 14200 ft
4/Ton
k0 = 0.036 t/m2 and k1 = 1309 m
4/t
For CFR 46, 170.170: service on protected water:
k0 = 0.0025 Ton/ft2 and k1 = 14200 ft
4/Ton
k0 = 0.028 t/m2 and k1 = 1309 m
4/t
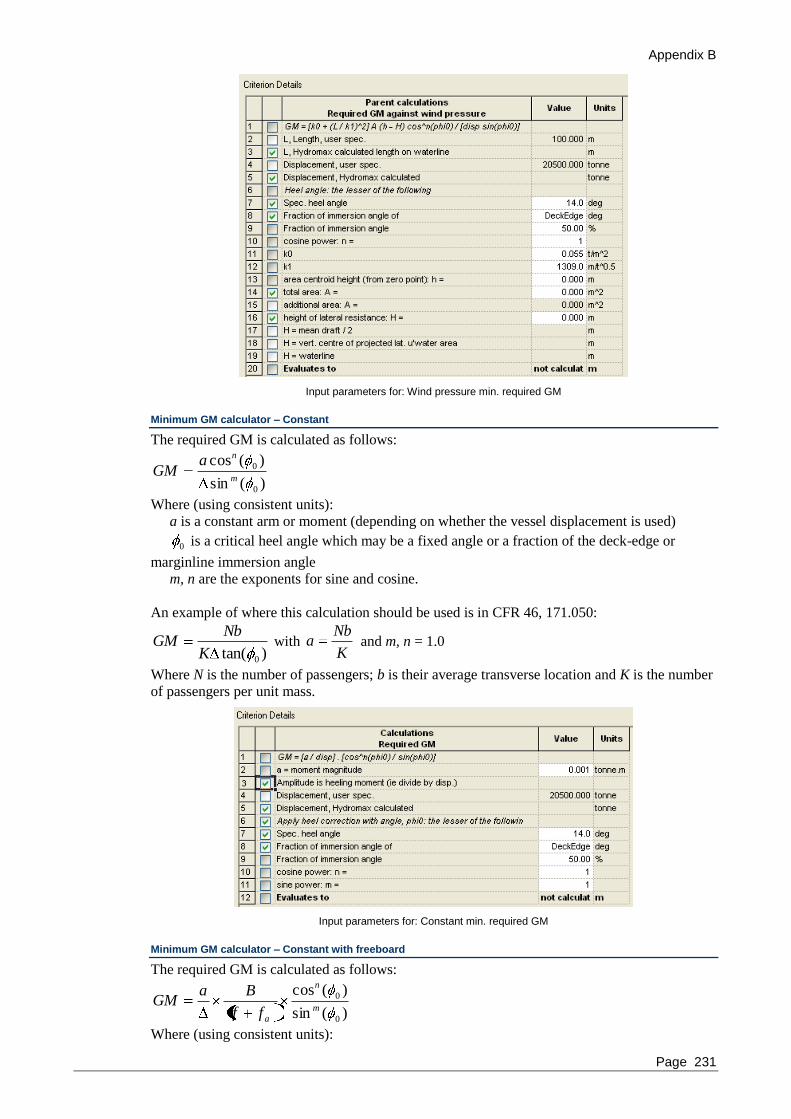
Appendix B
Page 231
Input parameters for: Wind pressure min. required GM
Minimum GM calculator – Constant
The required GM is calculated as follows:
)(sin
)(cos
0
0
m
naGM
Where (using consistent units):
a is a constant arm or moment (depending on whether the vessel displacement is used)
0 is a critical heel angle which may be a fixed angle or a fraction of the deck-edge or
marginline immersion angle
m, n are the exponents for sine and cosine.
An example of where this calculation should be used is in CFR 46, 171.050:
)tan( 0K
NbGM with
K
Nba and m, n = 1.0
Where N is the number of passengers; b is their average transverse location and K is the number
of passengers per unit mass.
Input parameters for: Constant min. required GM
Minimum GM calculator – Constant with freeboard
The required GM is calculated as follows:
)(sin
)(cos
0
0
m
n
aff
BaGM
Where (using consistent units):

Appendix F
Page 232
a is a constant arm or moment (depending on whether the vessel displacement is used)
B is the vessel beam
f is the minimum freeboard for the upright (zero heel) condition to the deck-edge or
marginline.
fa is the additional freeboard allowance calculated as follows (additionally the freeboard
allowance may be limited to a maximum specified value):
1
02b
B
bb
L
lhkf a
Where (using consistent units):
L is the waterline length of the vessel (if the criterion required LPP or LOA then enter the
value directly rather than having it calculated by Hydromax.
B is the same as that used in the expression for GM
k is a dimensionless constant
h is a height, typically the height of the watertight trunk
l is a length, typically the length of the watertight trunk
b is a breadth, typically the breadth of the watertight trunk
b0 is a constant with the same units as b
b1 is a dimensionless constant
If desired, a heel adjustment may be included:
0 is a critical heel angle which may be a fixed angle or a fraction of the deck-edge or
marginline immersion angle
m, n are the exponents for sine and cosine.
Parent Heeling Arms
As with the criteria, there is a list of parent heeling arms, from which custom heeling arms may
be derived:
Available heeling arms and moments
To learn how to cross reference these heeling arms into criteria, please see Heeling arm criteria
(xRef) on page 260.
Heeling Arm Definition
This section describes how to define heeling arms and is valid for both the parent heeling arms
that can be cross referenced into the heeling arm criteria, and for the Old heeling arm criteria
where the heeling arm is specified for each criterion separately.
Appendix B
Page 233
There are several heeling arms that are used for the criteria. They are defined below.
General heeling arm
General heeling arm with gust
General cos+sin heeling arm
User Defined Heeling Arm
Passenger crowding heeling arm
Wind
Turning
Lifting heeling
Towing heeling
Forces heeling arm
Trawling heeling arm
Grain heeling arm
Areas and leavers
Important note: heeling arm criteria dependent on displacement
Note:
When you are working with the parent heeling arms, make sure you copy them into
a custom heeling arms folder before editing them. Same as for the Parent criteria,
the Parent heeling arms will be reset to their default values each time you start up
Hydromax.
General heeling arm
The general form of the heeling arm is given below:
)(cos)( nAH where:
is the heel angle,
A is the magnitude of the heeling arm, ncos describes the shape of the curve.
Typically n=1 is used for passenger crowding and vessel turning since the horizontal lever for
the passenger transverse location reduces with the cosine of the heel angle. For wind n=2 is
often used for heeling because both the projected area as well as the lever decrease with the
cosine of the heel angle. However, some criteria, such as IMO Severe wind and rolling (weather
criterion) have a heeling arm of constant magnitude, in this case n=0 should be used.
Make sure you read Important note: heeling arm criteria dependent on displacement on page
240.
General heeling arm with gust
Some criteria require a Gust Ratio, this is the ratio of the magnitude of the wind heeling arm
during a gust to the magnitude of the wind heeling arm under steady wind.
steady
gust
H
HGustRatio
Both the steady and the gust heel arm have the same shape.
)(cos)( n
steady AH
)(cos)( n
gust GustRatioAH
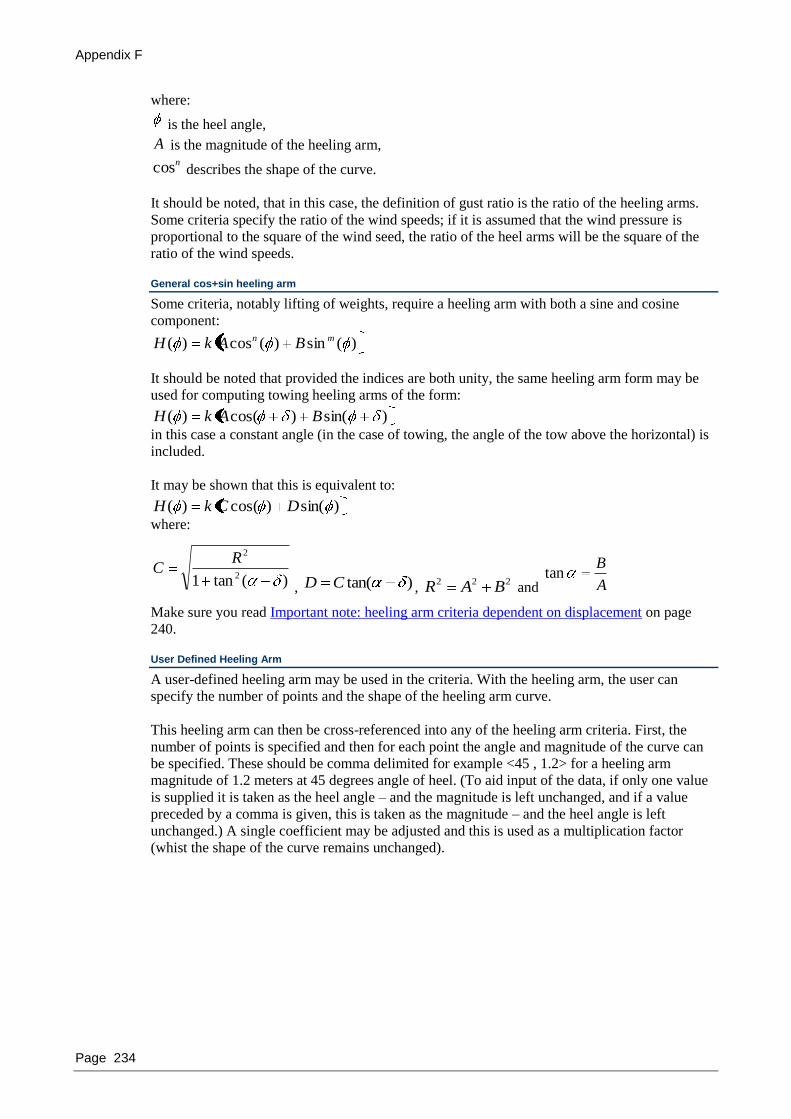
Appendix F
Page 234
where:
is the heel angle,
A is the magnitude of the heeling arm, ncos describes the shape of the curve.
It should be noted, that in this case, the definition of gust ratio is the ratio of the heeling arms.
Some criteria specify the ratio of the wind speeds; if it is assumed that the wind pressure is
proportional to the square of the wind seed, the ratio of the heel arms will be the square of the
ratio of the wind speeds.
General cos+sin heeling arm
Some criteria, notably lifting of weights, require a heeling arm with both a sine and cosine
component:
)(sin)(cos)( mn BAkH
It should be noted that provided the indices are both unity, the same heeling arm form may be
used for computing towing heeling arms of the form:
)sin()cos()( BAkH
in this case a constant angle (in the case of towing, the angle of the tow above the horizontal) is
included.
It may be shown that this is equivalent to:
)sin()cos()( DCkH
where:
)(tan1 2
2RC
, )tan(CD , 222 BAR and A
Btan
Make sure you read Important note: heeling arm criteria dependent on displacement on page
240.
User Defined Heeling Arm
A user-defined heeling arm may be used in the criteria. With the heeling arm, the user can
specify the number of points and the shape of the heeling arm curve.
This heeling arm can then be cross-referenced into any of the heeling arm criteria. First, the
number of points is specified and then for each point the angle and magnitude of the curve can
be specified. These should be comma delimited for example <45 , 1.2> for a heeling arm
magnitude of 1.2 meters at 45 degrees angle of heel. (To aid input of the data, if only one value
is supplied it is taken as the heel angle – and the magnitude is left unchanged, and if a value
preceded by a comma is given, this is taken as the magnitude – and the heel angle is left
unchanged.) A single coefficient may be adjusted and this is used as a multiplication factor
(whist the shape of the curve remains unchanged).
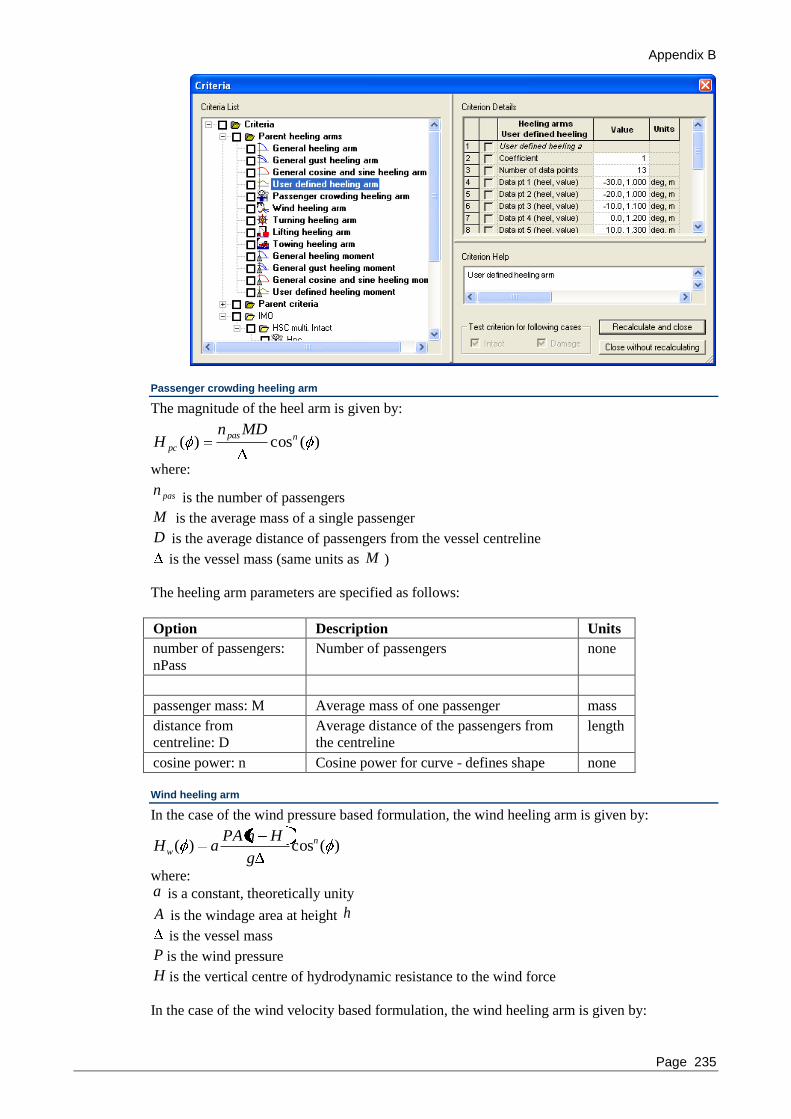
Appendix B
Page 235
Passenger crowding heeling arm
The magnitude of the heel arm is given by:
)(cos)( npas
pc
MDnH
where:
pasn is the number of passengers
M is the average mass of a single passenger
D is the average distance of passengers from the vessel centreline
is the vessel mass (same units as M )
The heeling arm parameters are specified as follows:
Option Description Units
number of passengers:
nPass
Number of passengers none
passenger mass: M Average mass of one passenger mass
distance from
centreline: D
Average distance of the passengers from
the centreline length
cosine power: n Cosine power for curve - defines shape none
Wind heeling arm
In the case of the wind pressure based formulation, the wind heeling arm is given by:
)(cos)( n
wg
HhPAaH
where: a is a constant, theoretically unity
A is the windage area at height h
is the vessel mass
P is the wind pressure
H is the vertical centre of hydrodynamic resistance to the wind force
In the case of the wind velocity based formulation, the wind heeling arm is given by:

Appendix F
Page 236
)(cos)(2
n
wg
HhAvaH
where: a is now effectively an average drag coefficient for the windage area multiplied by the air
density and has units of density v is the wind speed.
And the other parameters are described as above.
Option Description Units
constant: a Constant which may be used to modify
the magnitude of the heel arm, normally
unity for pressure based formulation or
0.5 ρair CD for the velocity formulation;
where ρair is the density of air and CD is
an average drag coefficient for the
windage area
none for
pressure
based
formulation;
mass/length3
for velocity
based
formulation
wind model Pressure or Velocity (type “P” or “V”)
wind pressure or
velocity
Actual velocity of pressure - depends on
wind model
mass/(time2
length) or
length/
time
area centroid height: h Height of user defined total or additional
windage area
length
total area: A User may specify either a total windage
area length
2
additional area: A Or, an area to be added to the windage
area computed by Hydromax based on
the hull sections
length2
height of lateral
resistance: H
There are four options for specifying H
(all options are calculated with the vessel
upright at the loadcase displacement and
LCG):
User specified
length
H = mean draft / 2 H is taken as half the mean draft. length
H = vert. centre of
projected lat. u'water
area
H is taken as the vertical centre of
underwater lateral projected area. length
H = waterline H is taken as the waterline length
cosine power: n Cosine power for curve - defines shape none
Turning heeling arm
The magnitude of the heel arm is derived from the moment created by the centripetal force
acting on the vessel during a high-speed turn and the vertical separation of the centres of gravity
and hydrodynamic lateral resistance to the turn. The heeling arm is obtained by dividing the
heeling moment by the vessel weight. The heeling arm is thus given by:
)(cos)(2
n
t hRg
vaH
where (in consistent units): a is a constant, theoretically unity v is the vessel velocity

Appendix B
Page 237
R is the radius of the turn
h is the vertical separation of the centres of gravity and lateral resistance
The heeling arm parameters are specified as follows:
Option Description Units
constant: a Constant which may be used to modify the
magnitude of the heel arm, normally unity
none
vessel speed: v Vessel speed in turn length/time
turn radius: R Turn radius may be specified directly length
turn radius, R, as
percentage of LWL
Or, as some criteria require, as percentage
of LWL %
Vertical lever: h There are four options for specifying h (all
options are calculated with the vessel
upright at the loadcase displacement and
LCG):
User specified
length
h = KG h is taken as KG - position of G above
baseline in upright condition
length
h = KG - mean draft / 2 h is taken as KG less half the mean draft. length
h = KG - vert. centre of
projected lat. u'water
area
h is taken as the vertical separation of the
centres of gravity and underwater lateral
projected area.
length
cosine power: n Cosine power for curve - defines shape none
Lifting heeling arm
This is used to simulate the effect of lifting a weight from its stowage position. (The weight is
lifted from a stowage position onboard the vessel by a crane on the vessel; i.e. the vessel
displacement remains constant, but there is an effective change of its centre of gravity.) The
magnitude of the heel arm is given by:
)sin()cos( )( vhM
H lw
where:
M is the mass of the weight being lifted
h is horizontal separation of the centre of gravity of the weight in its stowage position and the
suspension position (upper tip of lifting boom)
v is vertical separation of the centre of gravity of the weight in its stowage position and the
suspension position (upper tip of lifting boom)
is the vessel mass (same units as M )
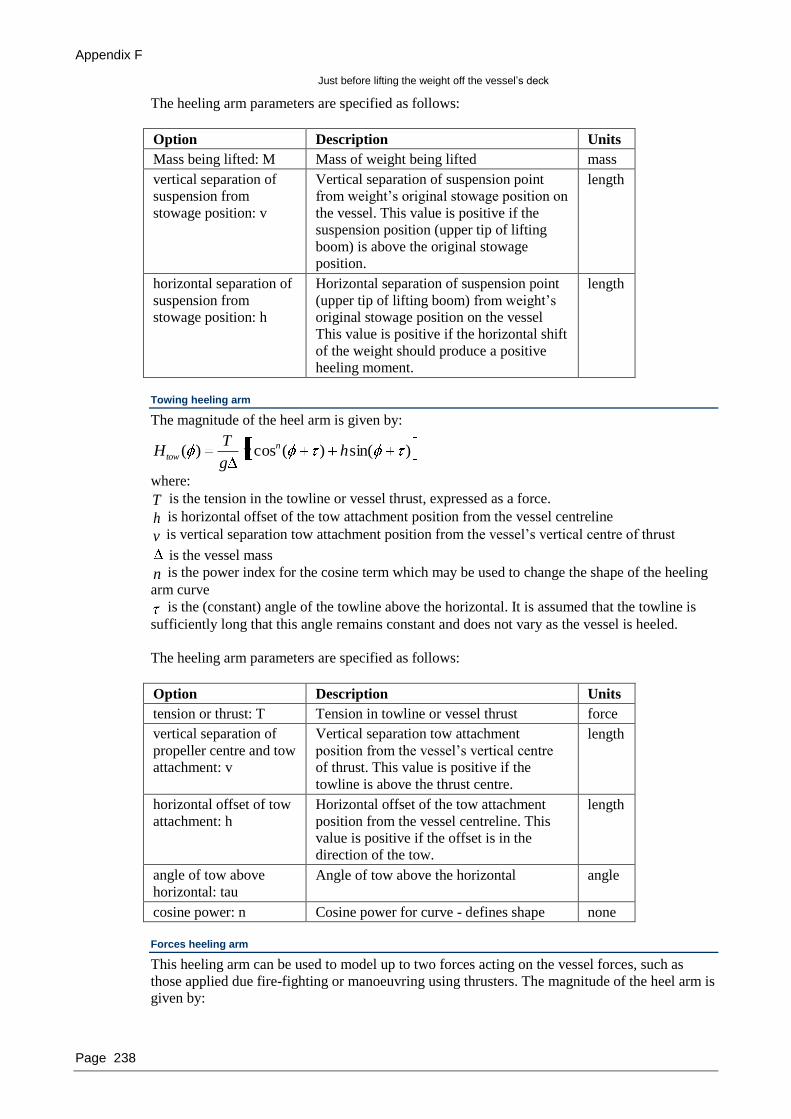
Appendix F
Page 238
Just before lifting the weight off the vessel’s deck
The heeling arm parameters are specified as follows:
Option Description Units
Mass being lifted: M Mass of weight being lifted mass
vertical separation of
suspension from
stowage position: v
Vertical separation of suspension point
from weight‟s original stowage position on
the vessel. This value is positive if the
suspension position (upper tip of lifting
boom) is above the original stowage
position.
length
horizontal separation of
suspension from
stowage position: h
Horizontal separation of suspension point
(upper tip of lifting boom) from weight‟s
original stowage position on the vessel
This value is positive if the horizontal shift
of the weight should produce a positive
heeling moment.
length
Towing heeling arm
The magnitude of the heel arm is given by:
)sin()(cos )( hvg
TH n
tow
where:
T is the tension in the towline or vessel thrust, expressed as a force.
h is horizontal offset of the tow attachment position from the vessel centreline
v is vertical separation tow attachment position from the vessel‟s vertical centre of thrust
is the vessel mass
n is the power index for the cosine term which may be used to change the shape of the heeling
arm curve
is the (constant) angle of the towline above the horizontal. It is assumed that the towline is
sufficiently long that this angle remains constant and does not vary as the vessel is heeled.
The heeling arm parameters are specified as follows:
Option Description Units
tension or thrust: T Tension in towline or vessel thrust force
vertical separation of
propeller centre and tow
attachment: v
Vertical separation tow attachment
position from the vessel‟s vertical centre
of thrust. This value is positive if the
towline is above the thrust centre.
length
horizontal offset of tow
attachment: h
Horizontal offset of the tow attachment
position from the vessel centreline. This
value is positive if the offset is in the
direction of the tow.
length
angle of tow above
horizontal: tau
Angle of tow above the horizontal angle
cosine power: n Cosine power for curve - defines shape none
Forces heeling arm
This heeling arm can be used to model up to two forces acting on the vessel forces, such as
those applied due fire-fighting or manoeuvring using thrusters. The magnitude of the heel arm is
given by:

Appendix B
Page 239
)(cosh )(cosh 1
)( 21
2211
nn
forces HAHAg
H
where:
1A and 2A are two forces acting on the vessel, expressed as a force, not a mass.
1h and 2h are the vertical heights (from the zero point) at which these forces act.
1n and 2n define the shapes of the heeling arms created by the two forces.
H is the assumed vertical position of the vessel‟s centre of lateral resistance (or the centre of
rotation from which the forces are applied)
is the vessel mass
g is acceleration due to gravity
Trawling heeling arm
This heeling arm can be used model the effects of trawl net snagging as defined in Annex G of
the Australian NSCV requirements:
)(cos)(trawling
n
m
ymH
where:
m is a mass parameter determined from the breaking load of the trawl gear and the downwards
angle of the trawl net.
y is the transverse distance of the line of action of the trawl wire from the vessel centreline
n defines the shape of the heeling arm.
is the vessel mass
Grain heeling arm
This heeling arm can be used model the effects of bulk grain shift as defined in IMO Resolution
MSC.23(59):
The heeling arm is defined by a straight line through two points A, B. It is mirrored about the
heel=0 axis and is not allowed to go below zero.
Point A = (0 deg heel, λ0)
Point B = ( 1 deg heel, α λ0)
i.e the heeling arm magnitude is reduced by a factor α at a heel angle of 1 . The equation of the
line is given below:
1
0grain
)1(abs1)(H

Appendix F
Page 240
The heeling arm magnitude at zero heel, λ0, is given by:
StowFact
volHM0
Where:
volHM is the assumed volumetric heeling moment due to transverse grain shift in units of
Length3.Length;
StowFact is the stowage factor in units of Length3/Mass; and
is the vessel mass
Areas and levers
Some criteria require the evaluation of above and below water lateral projected areas and their
vertical centroids. The user may also specify additional areas and vertical centroids or the total
areas and vertical centroids. In all cases the vertical centroids are given in the
Maxsurf/Hydromax co-ordinate system; i.e.: from the model‟s vertical datum, positive upwards.
The lateral projected area and its centroid of area are calculated for the upright vessel (zero heel)
at the draft and trim defined in the loadcase or trim dialog. The area is calculated from the
hydrostatic sections used by Hydromax; thus, increasing the number of sections will increase
the accuracy of the area calculation; further, only “Hull” surfaces are included in the calculation
- “Structure” surfaces are ignored.
The vertical position of the keel, K, is assumed to be at the baseline (as set up in the Frame of
Reference dialog), even if the baseline does not correspond to the physical bottom of the vessel.
Important note: heeling arm criteria dependent on displacement
Some heeling arm criteria are dependent on the displacement of the vessel for the calculation of
the Heeling Arm. For example, the value “A” in:
)(cos)( nAH
,is manually calculated from:
MA , where
M = heeling moment
Δ = displacement.
For these types of heeling arms you should use the various heeling moment curves that are
available – see below:
Heeling moment curves
Parent Heeling Moments
Heeling moments work the same way as the Minimum GM Calculations in that they can be
cross referenced into criteria. The advantage of using heeling moments is that they provide a
constant heeling moment (varying heeling arm) as the vessel displacement changes (due to
different loadcases or during a limiting KG analysis).
These are in addition to the existing specific heeling arm curves for passenger crowding, wind
heeling etc., which take account of the vessel displacement as required.

Appendix B
Page 241
The following heeling moments are available in the Hydromax criteria dialog:
General heeling moment
General cos+sin heeling moment
General heeling moment with gust
User Defined Heeling Moment
General heeling moment
The general form of the heeling moment is given below. It allows you to specify a constant
heeling moment as opposed to a constant heeling arm:
)(cos)( nAH
where:
is the heel angle,
A is the magnitude of the heeling moment (mass.length) and the vessel displacement
(mass); thus A
is the magnitude of the heeling arm (length).
ncos describes the shape of the curve.
Typically n=1 is used for passenger crowding and vessel turning since the horizontal lever for
the passenger transverse location reduces with the cosine of the heel angle. For wind n=2 is
often used for heeling because both the projected area as well as the lever decrease with the
cosine of the heel angle. However, some criteria, such as IMO Severe wind and rolling (weather
criterion) have a heeling arm of constant magnitude, in this case n=0 should be used.
General cos+sin heeling moment
Some criteria, notably lifting of weights, require a heeling moment with both a sine and cosine
component:
)(sin)(cos)( mn BAk
H
where:
is the heel angle,
A and B the magnitudes of the cosine and sine components of the heeling moment
(mass.length) and the vessel displacement (mass); thus A
and B
are the magnitude of the
heeling arm (length).
It should be noted that provided the n and m indices are both unity, the same heeling moment
form may be used for computing towing heeling moments of the form:
)sin()cos()( BAk
H
in this case a constant angle (in the case of towing, the angle of the tow above the horizontal) is
included.
It may be shown that this is equivalent to:
)sin()cos()( DCk
H
where:
)(tan1 2
2RC
, )tan(CD , 222 BAR and A
Btan

Appendix F
Page 242
General heeling moment with gust
Some criteria require a Gust Ratio, this is the ratio of the magnitude of the wind heeling arm
during a gust to the magnitude of the wind heeling arm under steady wind.
steady
gust
H
HGustRatio
The general form of the heeling moment is given below. It allows you to specify a constant
heeling moment as opposed to a constant heeling arm. Both the steady and the gust heel moment
have the same shape.
)(cos)( n
steady
AH
)(cosGustRatio)( n
gust
AH
where:
is the heel angle,
A is the magnitude of the heeling moment (mass.length) and the vessel displacement
(mass); thus A
is the magnitude of the heeling arm (length).
ncos describes the shape of the curve.
It should be noted, that in this case, the definition of gust ratio is the ratio of the heeling arms.
Some criteria specify the ratio of the wind speeds; if it is assumed that the wind pressure is
proportional to the square of the wind seed, the ratio of the heel arms will be the square of the
ratio of the wind speeds.
User Defined Heeling Moment
With the User Defined Heeling Moment, the user can specify the number of points and the
shape of the heeling moment curve. Defining User Defined Heeling Moments works in much
the same as for User Defined Heeling Arm. This heeling moment can then be linked into a
Heeling arm criteria (xRef) for evaluation.
Parent Stability Criteria
The parent criteria are divided up into different categories depending on their basic types.
Criteria at Equilibrium
These criteria are calculated after an equilibrium analysis and relate to the equilibrium position
of the vessel after the analysis. The equilibrium criteria are only displayed in the report if you
run an equilibrium analysis.
Maximum value of Heel, Trim or Slope at Equilibrium
This criterion may be used to check the value of maximum Heel, Pitch or Maximum Slope
(compared with an originally horizontal and flat deck).
Option Description Units
The angle of Choose from the following (case
insensitive auto-completion is used):
Heel
Pitch
MaxSlope
deg
Appendix B
Page 243
Shall be less than /
Shall not be greater than
Permissible value deg
Minimum Freeboard at Equilibrium
Checks whether the minimum freeboard is greater than a minimum required value. This could
be used to check margin line or downflooding point immersion.
Option Description Units
The value of Choose from the following (case
insensitive auto-completion is used):
Marginline
DeckEdge
DownfloodingPoints
PotentialDfloodingPoints
EmbarkationPoints
ImmersionPoints
length
Shall be greater than /
Shall not be less than
Permissible value length
Maximum Freeboard at Equilibrium
Check that the maximum freeboard is less than a maximum required value. This could be used
to check that an embarkation point is sufficiently close to the waterline.
Option Description Units
The value of Choose from the following (case
insensitive auto-completion is used):
Marginline
DeckEdge
DownfloodingPoints
PotentialDfloodingPoints
EmbarkationPoints
ImmersionPoints
length
Shall be greater than /
Shall not be less than
Permissible value length
To check that the freeboard lies within a specified range, use a combination of both forms of the
minimum/maximum freeboard criteria.
Value of GMT or GML at Equilibrium
This criterion is used to check that the GM (transverse or longitudinal) exceeds a specified
minimum value.
Option Description Units
The value of Choose from the following (case
insensitive auto-completion is used):
GMtransverse
GMlongitudinal)
length
Shall be greater than /
Shall not be less than
Permissible value length
GZ Curve Criteria (non-heeling arm)
These criteria, calculated from the GZ curve, are calculated from the Large Angle Stability
analysis in Hydromax.

Appendix F
Page 244
Value of GMt at
Finds the value of GMt at either a specified heel angle or the equilibrium angle. The criterion is
passed if the value of GMt is greater then the required value. GMt is computed from water-
plane inertia and immersed volume (not the slope of the GZ curve as this is inaccurate if the
heel angle resolution is insufficient).
In addition to a fixed required value, you may also select a calculation to provide the required
minimum GM.
Option Description Units
Value of GMt at either
specified heel angle User specified heel angle deg
angle of equilibrium See Nomenclature deg
Select calculation from
list
Chose a calculation for the minimum
required GM from a copy of one of the
Parent calculations
length
Shall be greater than /
Shall not be less than
Permissible value length
Value of GZ at
Finds the value of GZ at either a specified heel angle, first peak in GZ curve, angle of maximum
GZ or the downflooding angle. The criterion is passed if the value of GZ is greater then the
required value.
Option Description Units
Value of GZ at either
specified heel angle User specified heel angle deg
angle of first GZ peak See Nomenclature deg
angle of maximum GZ See Nomenclature deg
first downflooding
angle
See Nomenclature deg
Shall be greater than /
Shall not be less than
Permissible value length
Value of Maximum GZ
Finds the maximum value of GZ within a specified heel angle range. The criterion is passed if
the value of GZ is greater than the required value. If you want to check the value of GZ at a
certain angle you can set both specified angles as the required angle. If any of the calculated
angles for the upper limit are less than the lower limit, they will be ignored when selecting the
lowest. If all the upper limit values are less than the lower limit, then the criterion will fail. This
functionality is to allow criteria such as “The maximum GZ at 30deg or greater”.
Note: Upper limit and analysis heel angle range
It is required that the range of heel angles specified for the Large Angle Stability
analysis is equal, or exceeds, the upper range heel angle specified in the criterion.
Option Description Units
Value of maximum GZ
in the range from the
greater of
Lower limit for heel angle range, the
greater of the following:
specified heel angle User specified heel angle deg
angle of equilibrium See Nomenclature

Appendix B
Page 245
to the lesser of Upper limit for heel angle range, the lesser
of the following:
specified heel angle User specified heel angle; this should
normally be specified and be less than or
equal to the upper limit of the range of
heel angles used for the Large Angle
Stability analysis.
deg
angle of first GZ peak See Nomenclature deg
angle of maximum GZ See Nomenclature deg
first downflooding
angle See Nomenclature deg
Shall be greater than /
Shall not be less than
Permissible value length
Value of Maximum GZ
Value of GZ at Specified Angle or Maximum GZ below Specified Angle
If the angle at which maximum GZ occurs is greater than a specified value, the value of GZ at
the specified angle is calculated. Otherwise the value of maximum GZ is calculated. The
required GZ value depends on the angle at which the maximum occurs, see graph below.
Option Description Units
heel angle at which
required GZ is constant
If the angle of maximum GZ is greater
than or equal to this value, the required
value of GZ is constant and is taken at this
specified angle. Otherwise the required
value of maximum GZ varies as a
hyperbolic function with the angle of
maximum GZ. This is 0.
deg
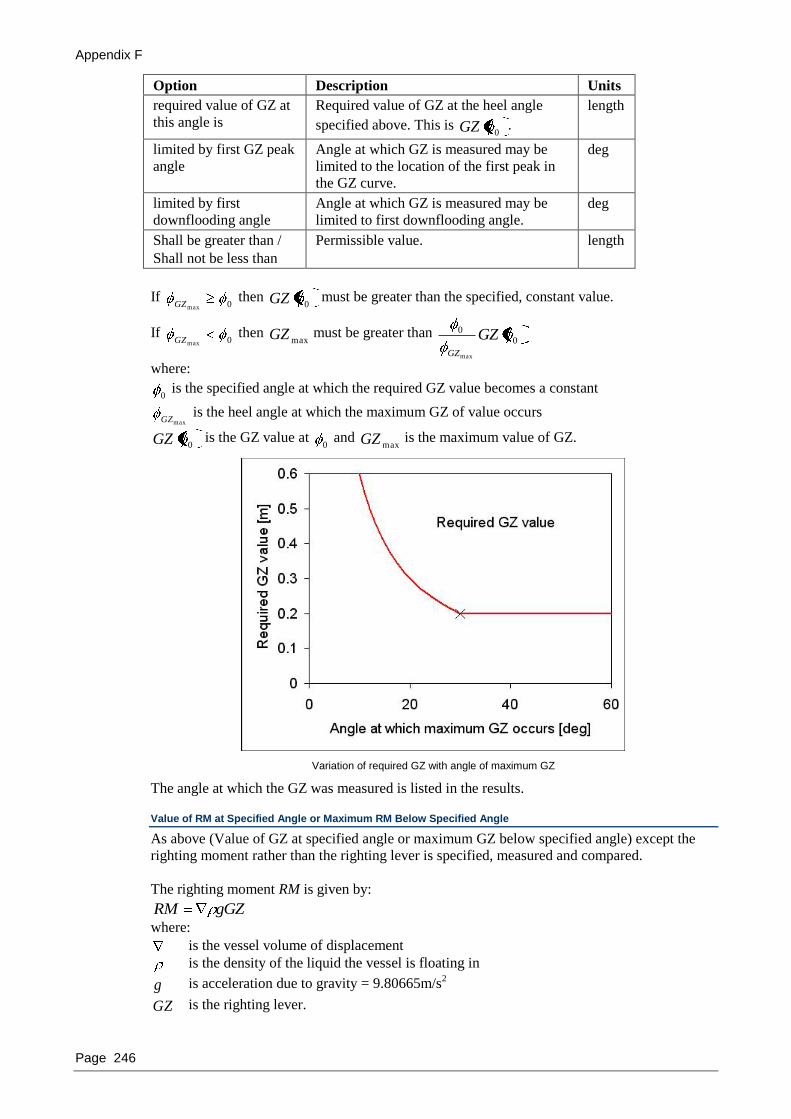
Appendix F
Page 246
Option Description Units
required value of GZ at
this angle is
Required value of GZ at the heel angle
specified above. This is 0GZ .
length
limited by first GZ peak
angle
Angle at which GZ is measured may be
limited to the location of the first peak in
the GZ curve.
deg
limited by first
downflooding angle
Angle at which GZ is measured may be
limited to first downflooding angle.
deg
Shall be greater than /
Shall not be less than
Permissible value. length
If 0maxGZ
then 0GZ must be greater than the specified, constant value.
If 0maxGZ
then maxGZ must be greater than
0
0
max
GZGZ
where:
0 is the specified angle at which the required GZ value becomes a constant
maxGZ is the heel angle at which the maximum GZ of value occurs
0GZ is the GZ value at 0 and
maxGZ is the maximum value of GZ.
Variation of required GZ with angle of maximum GZ
The angle at which the GZ was measured is listed in the results.
Value of RM at Specified Angle or Maximum RM Below Specified Angle
As above (Value of GZ at specified angle or maximum GZ below specified angle) except the
righting moment rather than the righting lever is specified, measured and compared.
The righting moment RM is given by:
gGZRM
where:
is the vessel volume of displacement
is the density of the liquid the vessel is floating in
g is acceleration due to gravity = 9.80665m/s2
GZ is the righting lever.

Appendix B
Page 247
Ratio of GZ Values at Phi1 and Phi2
Calculates the ratio of the GZ values at two specified heel angles. The criterion is passed if the
ratio is less then the required value.
2
1RatioGZ
GZ
Option Description Units
Ratio of GZ values at phi1 and phi2
Phi1, first heel angle,
the lesser of
First heel angle, the lesser of the
following:
specified heel angle User specified heel angle deg
angle of first GZ peak See Nomenclature deg
angle of maximum GZ See Nomenclature deg
first downflooding
angle
See Nomenclature deg
Phi2, second heel angle,
the lesser of
Second heel angle, the lesser of the
following:
specified heel angle User specified heel angle deg
angle of first GZ peak See Nomenclature deg
angle of maximum GZ See Nomenclature deg
first downflooding
angle
See Nomenclature deg
Shall be less than /
Shall not be greater than
Permissible value %
Ratio of GZ values at phi1 and phi2
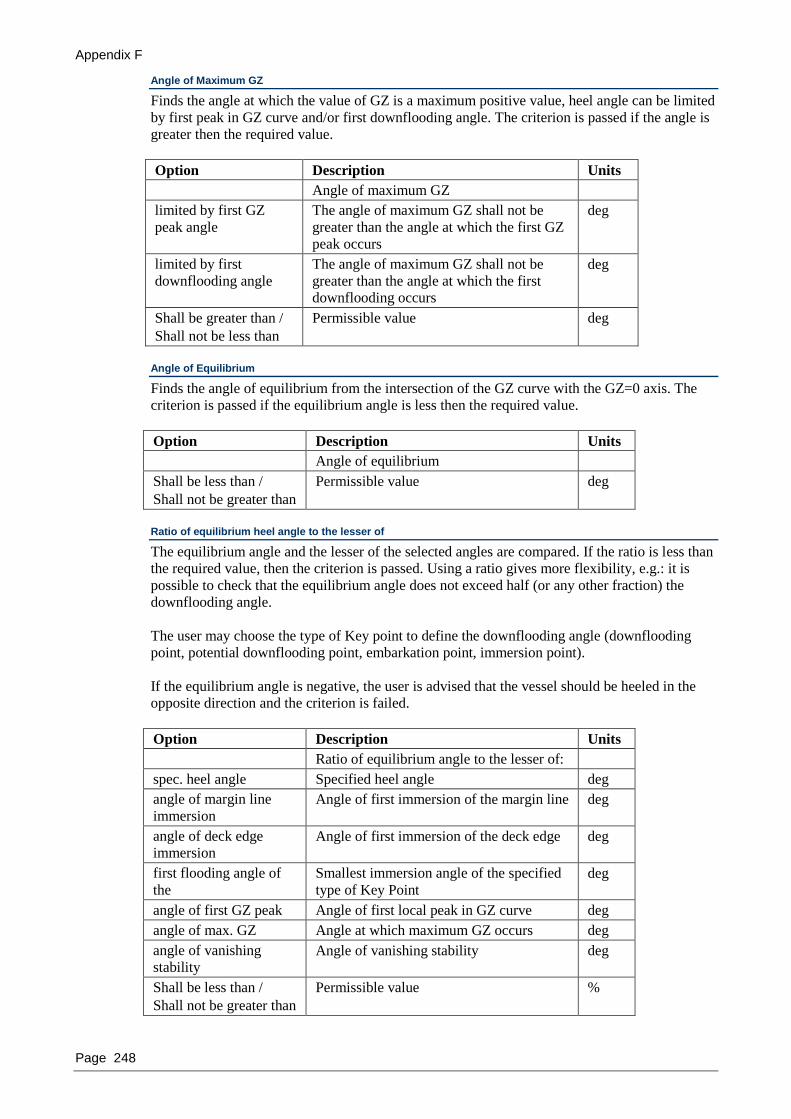
Appendix F
Page 248
Angle of Maximum GZ
Finds the angle at which the value of GZ is a maximum positive value, heel angle can be limited
by first peak in GZ curve and/or first downflooding angle. The criterion is passed if the angle is
greater then the required value.
Option Description Units
Angle of maximum GZ
limited by first GZ
peak angle
The angle of maximum GZ shall not be
greater than the angle at which the first GZ
peak occurs
deg
limited by first
downflooding angle
The angle of maximum GZ shall not be
greater than the angle at which the first
downflooding occurs
deg
Shall be greater than /
Shall not be less than
Permissible value deg
Angle of Equilibrium
Finds the angle of equilibrium from the intersection of the GZ curve with the GZ=0 axis. The
criterion is passed if the equilibrium angle is less then the required value.
Option Description Units
Angle of equilibrium
Shall be less than /
Shall not be greater than
Permissible value deg
Ratio of equilibrium heel angle to the lesser of
The equilibrium angle and the lesser of the selected angles are compared. If the ratio is less than
the required value, then the criterion is passed. Using a ratio gives more flexibility, e.g.: it is
possible to check that the equilibrium angle does not exceed half (or any other fraction) the
downflooding angle.
The user may choose the type of Key point to define the downflooding angle (downflooding
point, potential downflooding point, embarkation point, immersion point).
If the equilibrium angle is negative, the user is advised that the vessel should be heeled in the
opposite direction and the criterion is failed.
Option Description Units
Ratio of equilibrium angle to the lesser of:
spec. heel angle Specified heel angle deg
angle of margin line
immersion
Angle of first immersion of the margin line deg
angle of deck edge
immersion Angle of first immersion of the deck edge deg
first flooding angle of
the
Smallest immersion angle of the specified
type of Key Point
deg
angle of first GZ peak Angle of first local peak in GZ curve deg
angle of max. GZ Angle at which maximum GZ occurs deg
angle of vanishing
stability Angle of vanishing stability deg
Shall be less than /
Shall not be greater than
Permissible value %

Appendix B
Page 249
Equilibrium heel angle satisfies either
This criterion is nothing more than two “Ratio of equilibrium heel angle to the lesser of”
criteria. The actual criterion is passed if either of the individual criteria is passed. This type of
criterion is used to formulate criteria such as:
The maximum allowable angle of equilibrium is 15 degrees in the damage condition, but
this can be allowed to increase to 17 degrees if the deck edge is not immersed.
Angle of Downflooding
Finds the angle of first downflooding. The criterion is passed if the downflooding angle is
greater then the required value.
Option Description Units
Angle of downflooding
Shall be greater than /
Shall not be less than
Permissible value deg
Angle of Margin Line Immersion
Finds the first/minimum angle at which the margin line immerses. The criterion is passed if the
smallest angle at which the margin line immerses is greater then the required value.
Option Description Units
Angle of margin line immersion
Shall be greater than /
Shall not be less than
Permissible value deg
Angle of Deck Edge Immersion
Finds the first/minimum angle at which the deck edge immerses. The criterion is passed if the
smallest angle at which the deck edge immerses is greater then the required value.
Option Description Units
Angle of deck edge immersion
Shall be greater than /
Shall not be less than
Permissible value deg
Angle of Vanishing Stability
Finds the angle of vanishing stability from the intersection of the GZ curve with the GZ=0 axis.
The criterion is passed if the angle of vanishing stability is greater then the required value.
Option Description Units
Angle of vanishing stability
Shall be less than /
Shall not be greater than
Permissible value deg
Range of Positive Stability
The angular range for which the GZ curve is positive is computed. The criterion is passed if the
computed range is greater then the required value.
Option Description Units
Range of positive stability
from the greater of Lower limit

Appendix F
Page 250
Option Description Units
specified heel angle User specified heel angle deg
angle of equilibrium See Nomenclature deg
to the lesser of Upper limit of the range
first downflooding
angle See Nomenclature deg
angle of vanishing
stability
See Nomenclature deg
Shall be greater than /
Shall not be less than
Permissible value deg
GZ Area between Limits type 1 - standard
The area below the GZ curve and above the GZ=0 axis is integrated between the selected limits
and compared with a minimum required value. The criterion is passed if the area under the
graph is greater than the required value.
Option Description Units
GZ area between limits type 1 - standard
from the greater of Lower limit for integration, from greatest
angle of
specified heel angle User specified heel angle deg
angle of equilibrium See Nomenclature deg
to the lesser of Upper limit of integration, from lesser
angle of
specified heel angle User specified heel angle deg
spec. angle above
equilibrium
User specified heel angle above the
equilibrium heel angle deg
angle of first GZ peak See Nomenclature deg
angle of maximum GZ See Nomenclature deg
first downflooding
angle See Nomenclature deg
immersion angle of
Marginline or
DeckEdge
See Nomenclature deg
angle of vanishing
stability
See Nomenclature deg
Shall be greater than /
Shall not be less than
Permissible value length.angle

Appendix B
Page 251
GZ area between limits type 1 - standard
GZ area between limits type 2- HSC monohull type
The area under the GZ curve is integrated between the specified limits. However the required
minimum area depends on the upper integration limit. The required area is defined below and is
based on the area required for IMO MSC.36(63) §2.3.3.2 and IMO A.749(18) §4.5.6.2.1. The
criterion is passed if the computed area under the graph is greater then the required value.
The required area is defined as follows:
If 2max : required area = 2A ;
If 1max : required area = 1A ;
If 2max1 : required area = max2
12
212
AAA
;
Where:
max is the upper integration limit;
1A is the area under the GZ curve required at the specified lower heel angle 1 ; and 2A is the
area under the GZ curve required at the specified higher heel angle 2 .
For example, if the lower angle was 15 and the required area at this angle was 0.07m.rad and
the upper angle was 30 and the required area at this angle was 0.055m.rad, then the required
area would be given by:
max301530
055.007.055.0A
or simplifying:
max30 001.055.0A
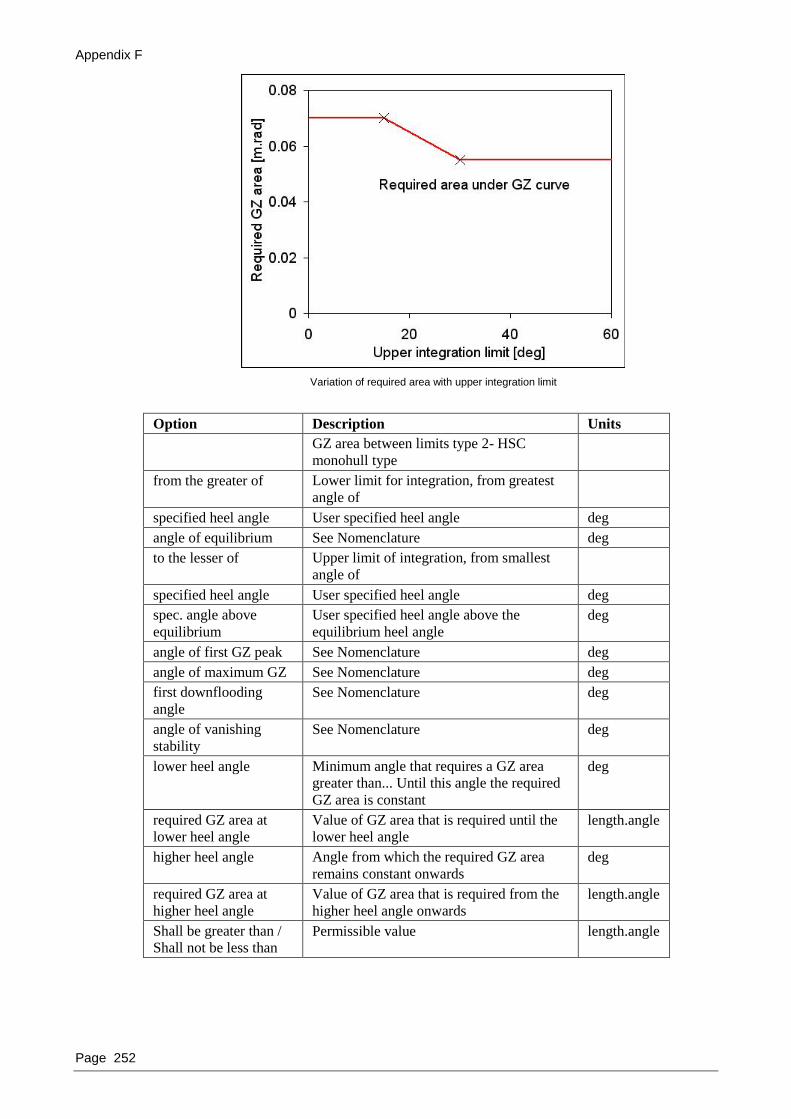
Appendix F
Page 252
Variation of required area with upper integration limit
Option Description Units
GZ area between limits type 2- HSC
monohull type
from the greater of Lower limit for integration, from greatest
angle of
specified heel angle User specified heel angle deg
angle of equilibrium See Nomenclature deg
to the lesser of Upper limit of integration, from smallest
angle of
specified heel angle User specified heel angle deg
spec. angle above
equilibrium
User specified heel angle above the
equilibrium heel angle
deg
angle of first GZ peak See Nomenclature deg
angle of maximum GZ See Nomenclature deg
first downflooding
angle
See Nomenclature deg
angle of vanishing
stability
See Nomenclature deg
lower heel angle Minimum angle that requires a GZ area
greater than... Until this angle the required
GZ area is constant
deg
required GZ area at
lower heel angle
Value of GZ area that is required until the
lower heel angle length.angle
higher heel angle Angle from which the required GZ area
remains constant onwards
deg
required GZ area at
higher heel angle
Value of GZ area that is required from the
higher heel angle onwards
length.angle
Shall be greater than /
Shall not be less than Permissible value length.angle
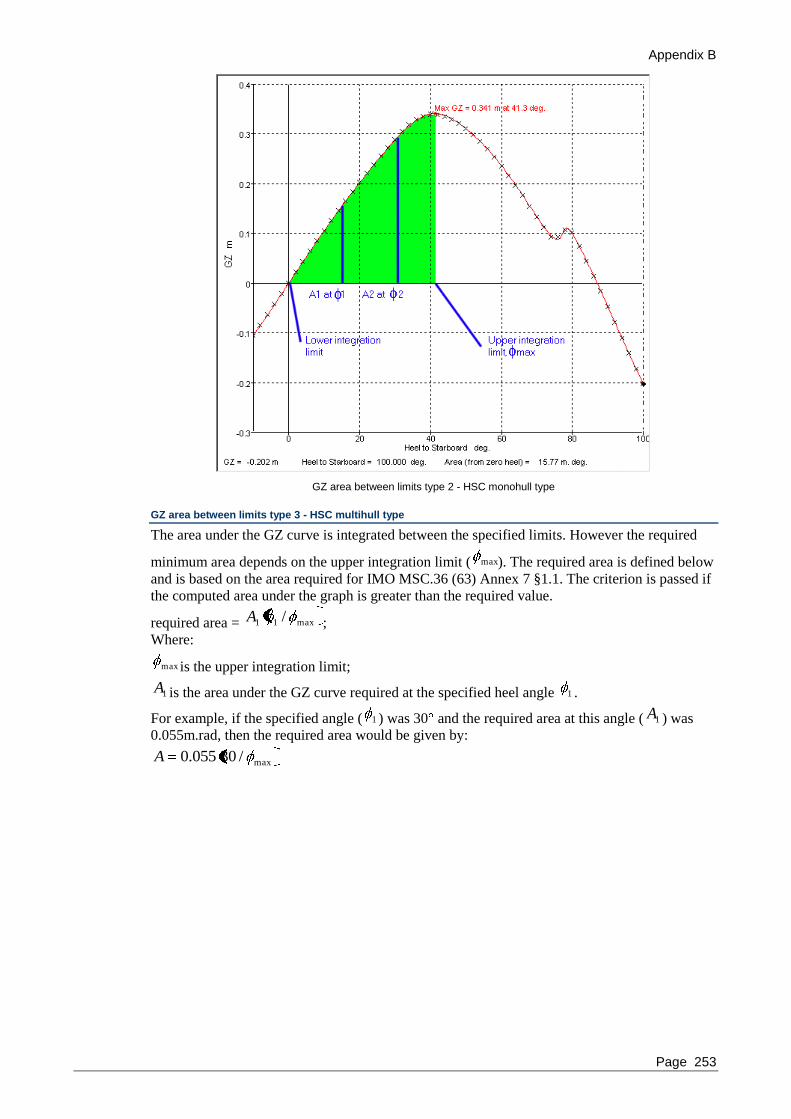
Appendix B
Page 253
GZ area between limits type 2 - HSC monohull type
GZ area between limits type 3 - HSC multihull type
The area under the GZ curve is integrated between the specified limits. However the required
minimum area depends on the upper integration limit ( max11 /A ). The required area is defined below
and is based on the area required for IMO MSC.36 (63) Annex 7 §1.1. The criterion is passed if
the computed area under the graph is greater than the required value.
required area = max11 /A ;
Where:
max is the upper integration limit;
1A is the area under the GZ curve required at the specified heel angle 1 .
For example, if the specified angle ( 1 ) was 30 and the required area at this angle ( 1A ) was
0.055m.rad, then the required area would be given by:
max/30055.0A

Appendix F
Page 254
Variation of required area with upper integration limit
Option Description Units
GZ area between limits type 3 - HSC
multihull type
from the greater of Lower limit for integration, from greatest
angle of
specified heel angle User specified heel angle deg
angle of equilibrium See Nomenclature deg
to the lesser of Upper limit of integration, from lesser
angle of
specified heel angle User specified heel angle deg
spec. angle above
equilibrium
User specified heel angle above the
equilibrium heel angle deg
angle of first GZ peak See Nomenclature deg
angle of maximum GZ See Nomenclature deg
first downflooding
angle See Nomenclature deg
angle of vanishing
stability
See Nomenclature deg
higher heel angle Heel angle at which required GZ area is
specified
deg
required GZ area at
higher heel angle
Value of GZ area that is required until the
higher heel angle length.angle
Shall be greater than /
Shall not be less than
Permissible value length.angle

Appendix B
Page 255
GZ area between limits type 3 - HSC multihull type
Ratio of GZ area between limits
This criterion calculates the ratio of the two areas between the GZ curve and the GZ=0 axis.
Ratio = 2 Areaabs
1 Area =
dGZ
dGZ
4
3
2
1
abs
, where “abs” means the absolute value of.
Option Description Units
Ratio of GZ area between limits
Area 1 from the greater of Area 1 lower integration limit, 1
specified heel angle User specified heel angle deg
angle of equilibrium See Nomenclature deg
Area 1 to the lesser of Area 1 upper integration limit, 2 deg
specified heel angle User specified heel angle deg
angle of first GZ peak See Nomenclature deg
angle of maximum GZ See Nomenclature deg
first downflooding angle See Nomenclature deg
angle of vanishing stability See Nomenclature deg
Area 2 from the lesser of Area 2 lower integration limit, 3
specified heel angle User specified heel angle deg
angle of first GZ peak See Nomenclature deg
angle of maximum GZ See Nomenclature deg
first downflooding angle See Nomenclature deg
angle of vanishing stability See Nomenclature deg

Appendix F
Page 256
Option Description Units
Area 2 to Area 1 upper integration limit, 4
specified heel angle User specified heel angle deg
Shall be greater than /
Shall not be less than
Permissible value %
This criterion is designed to be calculated on the positive side of the GZ curve only; GZ areas
below the GZ=0 axis on the negative heel angle side of the GZ curve are not considered
positive. Typically, Area 1 would be from equilibrium to vanishing stability and Area 2 would
be from vanishing stability to 180 deg, see graph below.
In the example below, the lower and upper integration limits for Area 1 are equilibrium and
vanishing stability, respectively and the limits for Area 2 are vanishing stability and 180 deg.
Ratio of GZ area between limits – Example 1
In the following example the upper limit for Area 1 has been set to the downflooding angle. The
limits for Area 2 remain unchanged.

Appendix B
Page 257
Ratio of GZ area between limits – Example 2
In the final example, the lower integration range for Area 2 has been reduced to the
downflooding angle. Note that Area 2 is now A1 – A2.
Ratio of GZ area between limits – Example 3
Ratio of positive to negative GZ area between limits
This criterion calculates the ratio of GZ area above the GZ=0 axis to that below the axis in the
given heel angle range.
Option Description Units

Appendix F
Page 258
Option Description Units
Ratio of positive to negative GZ area
between limits
in the heel angle range from User specified lower limit heel angle deg
to User specified upper limit heel angle deg
Shall be greater than /
Shall not be less than
Permissible value %
Ratio = 2 Areaabs
1 Area,
where “abs” means the absolute value of. And the areas are defined as follows:
If both heel angle limits are ≥ zero: Area 1 is the total area between the GZ curve and GZ=0
axis, where the value of GZ > 0; Area 2 is the total area between the GZ curve and GZ=0 axis,
where the value of GZ < 0. Area 1 is positive, Area 2 is negative.
Ratio of positive to negative GZ area between limits. Positive heel: lower limit = 0deg, upper limit = 180deg.
If both heel angle limits are < zero: Area 1 is the total area between the GZ curve and GZ=0
axis, where the value of GZ < 0; Area 2 is the total area between the GZ curve and GZ=0 axis,
where the value of GZ > 0. Area 1 is positive, Area 2 is negative.

Appendix B
Page 259
Ratio of positive to negative GZ area between limits. Negative heel: lower limit = -180deg, upper limit = 0deg.
If the lower heel angle limit < zero, and the upper heel angle limit > zero (the upper limit is
assumed to be greater than the lower limit): Area 1 is the total area between the GZ curve and
GZ=0 axis, where the value of GZ > 0 for heel angles ≥ 0 plus the area between the GZ curve
and GZ=0 axis, where the value of GZ < 0 for heel angles < 0; Area 2 is the total area between
the GZ curve and GZ=0 axis, where the value of GZ < 0 for heel angles ≥ 0 plus the area
between the GZ curve and GZ=0 axis, where the value of GZ > 0 for heel angles < 0. Area 1 is
positive, Area 2 is negative.
Ratio of positive to negative GZ area between limits. Positive and negative heel: lower limit = -180deg, upper limit = 180deg.

Appendix F
Page 260
Subdivision Index s-factor - MSC 19(58)
Probabilistic damage s-factor according to MSC 19(58)
Option Description Units
Lower angle of range : the
greater of
The greater of the selected angles is be
to specify the lower limit of the range
of positive stability and the range in
which the maximum value of GZ
should be found.
specified heel angle User specified heel angle deg
angle of equilibrium See Nomenclature deg
Upper angle of range: lesser
of
The lowest of the selected angles is be
to specify the upper limit of the range
of positive stability and the range in
which the maximum value of GZ
should be found.
specified heel angle See Nomenclature deg
spec. angle above
equilibrium
See Nomenclature deg
angle of first GZ peak See Nomenclature deg
angle of maximum GZ See Nomenclature deg
first downflooding angle See Nomenclature deg
immersion angle of
Marginline or DeckEdge See Nomenclature deg
angle of vanishing stability See Nomenclature deg
Max. GZ limit Upper limit of allowable maximum
GZ value when computing s
length
Range limit Upper limit of allowable range of
positive stability when computing s
deg
S = C sqrt( 0.5 GZmax . range)
Both the values of maximum GZ and range of positive stability can be clipped.
Heeling arm criteria (xRef)
The cross-reference heeling arm criteria are set up to allow you to define heeling arms or
heeling moments in a central location and then cross-reference or link them into the criteria. The
criteria themselves work much the same as the Heeling arm criteria (page 264), except for the
fact that you don‟t have to specify the heeling arm for each criterion separately, but can simply
select which heeling arm you wish to apply.
After you have defined your heeling arms, these can be cross-referenced into new heeling arm
criteria:

Appendix B
Page 261
The heeling arms are cross-referenced simply by selecting the desired heeling arm from the
pull-down list:
For information on defining heeling arms or moments, see Minimum GM calculator – Grain
The required GM for vessels carrying grain, as defined in IMO Resolution MSC.23(59), is
calculated as follows:
SF
VBBVBLGM
dd
0875.0
645.025.0
Where (using consistent units):
L is the combined length of all full compartments
B is the moulded breadth of the vessel
SF is the stowage factor
Vd is the calculated average void depth
Δ is the vessel displacement
Input parameters for: Grain heeling min. required GM

Appendix F
Page 262
Minimum GM calculator – Wind pressure
The GM required to withstand wind pressure is calculated as follows:
)sin(
)(cos)(
0
0
2
1
0
nHhAk
Lk
GM
Where (using consistent units):
L is the waterline length of the vessel (if the criterion required LPP or LOA then enter the
value directly rather than having it calculated by Hydromax.
Δ is the vessel displacement
0 is a critical heel angle which may be a fixed angle or a fraction of the deck-edge or
marginline immersion angle
A is the windage area which may be specified as a total area or as an area additional to the
area of the hull above the waterline; h is height of the centroid of A above the zero point.
H is the height of the assumed centre of lateral resistance of the vessel.
k0 and k1 are constants, for example:
For CFR 46, 170.170: ocean service:
k0 = 0.005 Ton/ft2 and k1 = 14200 ft4/Ton
k0 = 0.055 t/m2 and k1 = 1309 m4/t
For CFR 46, 170.170: service on partially protected water:
k0 = 0.0033 Ton/ft2 and k1 = 14200 ft4/Ton
k0 = 0.036 t/m2 and k1 = 1309 m4/t
For CFR 46, 170.170: service on protected water:
k0 = 0.0025 Ton/ft2 and k1 = 14200 ft4/Ton
k0 = 0.028 t/m2 and k1 = 1309 m4/t
Input parameters for: Wind pressure min. required GM
Minimum GM calculator – Constant
The required GM is calculated as follows:
)(sin
)(cos
0
0
m
naGM
Where (using consistent units):
a is a constant arm or moment (depending on whether the vessel displacement is used)
0 is a critical heel angle which may be a fixed angle or a fraction of the deck-edge or
marginline immersion angle
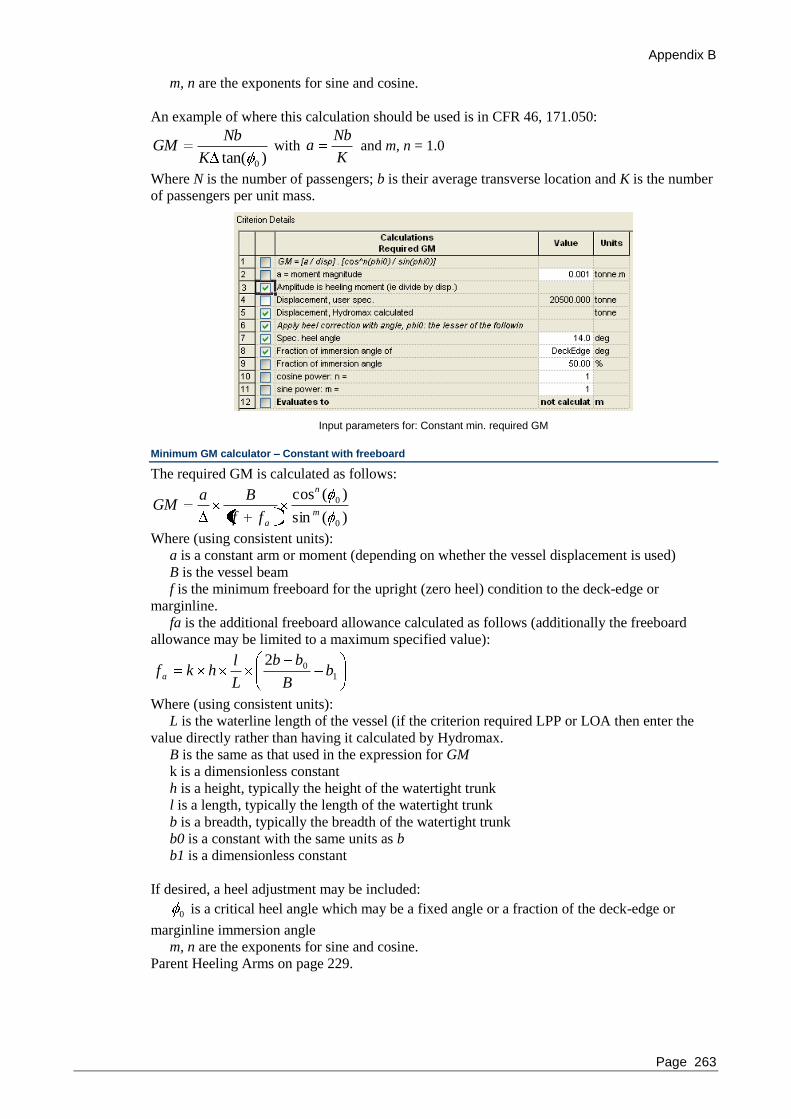
Appendix B
Page 263
m, n are the exponents for sine and cosine.
An example of where this calculation should be used is in CFR 46, 171.050:
)tan( 0K
NbGM with
K
Nba and m, n = 1.0
Where N is the number of passengers; b is their average transverse location and K is the number
of passengers per unit mass.
Input parameters for: Constant min. required GM
Minimum GM calculator – Constant with freeboard
The required GM is calculated as follows:
)(sin
)(cos
0
0
m
n
aff
BaGM
Where (using consistent units):
a is a constant arm or moment (depending on whether the vessel displacement is used)
B is the vessel beam
f is the minimum freeboard for the upright (zero heel) condition to the deck-edge or
marginline.
fa is the additional freeboard allowance calculated as follows (additionally the freeboard
allowance may be limited to a maximum specified value):
1
02b
B
bb
L
lhkf a
Where (using consistent units):
L is the waterline length of the vessel (if the criterion required LPP or LOA then enter the
value directly rather than having it calculated by Hydromax.
B is the same as that used in the expression for GM
k is a dimensionless constant
h is a height, typically the height of the watertight trunk
l is a length, typically the length of the watertight trunk
b is a breadth, typically the breadth of the watertight trunk
b0 is a constant with the same units as b
b1 is a dimensionless constant
If desired, a heel adjustment may be included:
0 is a critical heel angle which may be a fixed angle or a fraction of the deck-edge or
marginline immersion angle
m, n are the exponents for sine and cosine.
Parent Heeling Arms on page 229.

Appendix F
Page 264
Heeling arm criteria
The preferred method is to use the xRef heeling arm criteria rather than the stand alone heeling
arm criteria. This is because a wider range of heeling arm formulations is available and for some
criteria, they only exist in xRef form.
The heeling arm criteria available in the Hydromax Criteria dialog are listed below. Also
available are:
Multiple heeling arm criteria; these are where the same criterion is applied to up to three
heeling arms and/or combinations of these heeling arms
Heeling Arm, combined criteria; these are where several criteria are applied to the same
heeling arm
Value of GMT at equilibrium - general heeling arm
Calculates the transverse metacentric height (GMT) at the intersection of the GZ and heel arm
curves. The criterion is passed if the GMT value is greater then the required value. GMT is
computed from the waterplane inertia and the displaced volume at the equilibrium heel angle.
Ratio of GMT and heeling arm
Calculates the following ratio and the criterion is passed if the ratio exceeds the specified value.
)()sin( HAGM
Where the heel angle, , is the lesser of: a user-specified heel angle; angle of margin line
immersion; angle of deck edge immersion; or first flooding angle of the specified key point
type. In addition, this angle may also be multiplied by a user-specified factor. The specified
cross-referenced heel arm is then evaluated at this heel angle to give: )(HA . Finally, The
transverse GM is taken at a user-specified heel angle or angle of equilibrium (without heel arm).
Ratio of GMt and heel arm criterion
Value of GZ at equilibrium - general heeling arm
Calculates the value of the GZ curve at the equilibrium intersection of the GZ and heel arm
curves. The criterion is passed if the GZ value is greater then the required value.
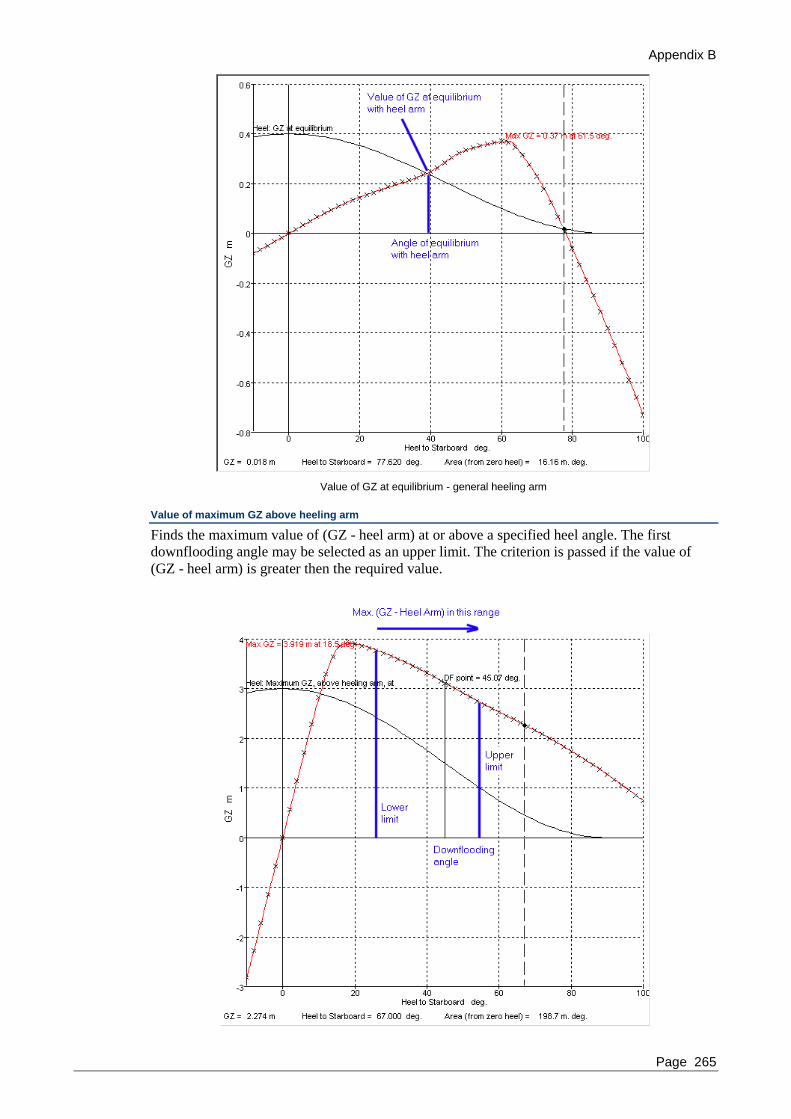
Appendix B
Page 265
Value of GZ at equilibrium - general heeling arm
Value of maximum GZ above heeling arm
Finds the maximum value of (GZ - heel arm) at or above a specified heel angle. The first
downflooding angle may be selected as an upper limit. The criterion is passed if the value of
(GZ - heel arm) is greater then the required value.

Appendix F
Page 266
Value of maximum GZ above heeling arm
The upper limit may be specified as a certain percentage of the selected limits. This is applied to
all selected upper angle limits, including “specified heel angle”. However this option would
normally be used to specify an upper limiting angle of “half the angle of margin line
immersion”.
Maximum ratio of GZ to heeling arm
This criterion calculates the maximum ratio of GZ : Heeling arm (for the same heel angle)
within the range of heel angles specified. The value of GZ at this heel angle must be greater
than zero. If the heeling arm is zero or negative in the range, then the point with maximum
positive GZ (where the heeling arm 0.0) will be selected.
The upper limit may be specified as a certain percentage of the selected limits. This is applied to
all selected upper angle limits, including “specified heel angle”. However this option would
normally be used to specify an upper limiting angle of “half the angle of margin line
immersion”.
Examples:
Upper limit is 50% of angle of margin line immersion (43 / 2 = 21.5 ). In the range 0 to 21.5 , the maximum ratio of
GZ:heel arm occurs at 21.5 . At this heel angle the value of GZ is 0.553m and the heel arm 0.930m giving a ratio of 59%.

Appendix B
Page 267
In this case a constant heeling arm is used, thus the maximum ratio occurs at the angle of maximum GZ (62.4 ). At this heel angle the value of GZ is 1.122m and the heel arm 0.5m giving a ratio of 224%.
Finally, the downflooding angle is 94.3 , at this heel angle the heel arm is zero (thus the ratio infinite). Hence the criterion is passed. The angle and value of GZ is given for the location where it is a maximum (in the region where the heel arm is zero; the exact value will depend slightly on the heel angles tested in the Large Angle Stability analysis.)
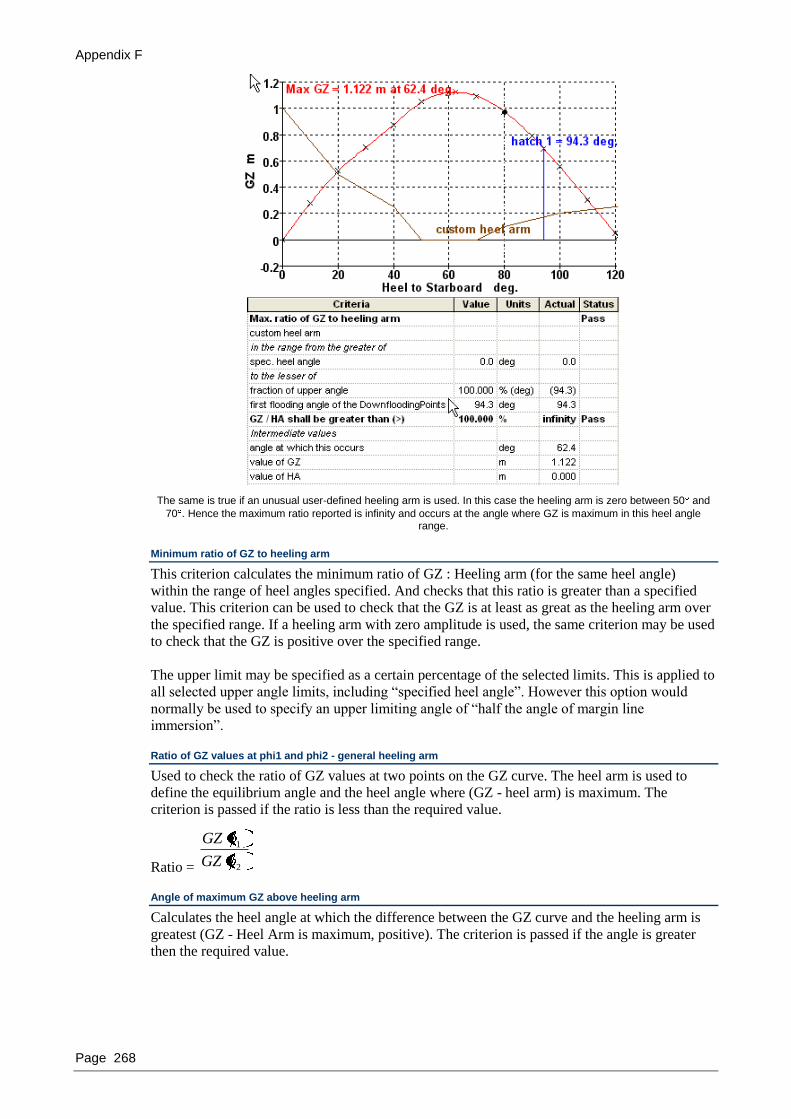
Appendix F
Page 268
The same is true if an unusual user-defined heeling arm is used. In this case the heeling arm is zero between 50 and
70 . Hence the maximum ratio reported is infinity and occurs at the angle where GZ is maximum in this heel angle range.
Minimum ratio of GZ to heeling arm
This criterion calculates the minimum ratio of GZ : Heeling arm (for the same heel angle)
within the range of heel angles specified. And checks that this ratio is greater than a specified
value. This criterion can be used to check that the GZ is at least as great as the heeling arm over
the specified range. If a heeling arm with zero amplitude is used, the same criterion may be used
to check that the GZ is positive over the specified range.
The upper limit may be specified as a certain percentage of the selected limits. This is applied to
all selected upper angle limits, including “specified heel angle”. However this option would
normally be used to specify an upper limiting angle of “half the angle of margin line
immersion”.
Ratio of GZ values at phi1 and phi2 - general heeling arm
Used to check the ratio of GZ values at two points on the GZ curve. The heel arm is used to
define the equilibrium angle and the heel angle where (GZ - heel arm) is maximum. The
criterion is passed if the ratio is less than the required value.
Ratio = 2
1
GZ
GZ
Angle of maximum GZ above heeling arm
Calculates the heel angle at which the difference between the GZ curve and the heeling arm is
greatest (GZ - Heel Arm is maximum, positive). The criterion is passed if the angle is greater
then the required value.

Appendix B
Page 269
Angle of maximum GZ above heeling arm - general heeling arm
Angle of equilibrium - general heeling arm
Calculates the angle of equilibrium with the specified heeling arm. The equilibrium angle is the
smallest positive angle where the GZ and heeling arm curves intersect and the GZ curve has
positive slope. The criterion is passed if the equilibrium angle is less then the required value.
Angle of equilibrium - general heeling arm

Appendix F
Page 270
Angle of equilibrium ratio - general heeling arm
Calculates the ratio of the angle of equilibrium (with the specified heeling arm) to another,
selectable angle. The angle of equilibrium is computed as described in §Angle of equilibrium -
general heeling arm.
Ratio =
specified
mequilibriu
The other angle used to compute the ratio may be one of the following:
Required angle for ratio calculation Auto complete text
Marginline immersion angle MarginlineImmersionAngle
Deck edge immersion angle DeckEdgeImmersionAngle
Angle of first GZ peak DownfloodingAngle
Angle of maximum GZ MaximumGZAngle
First downflooding angle FirstGZPeakAngle
Angle of vanishing stability with heel arm VanishingStabilityWithHeelArmAngle
Angle of vanishing stability - general heeling arm
Calculates the location of the first intersection of the GZ curve and heel arm curve where the
slope of the GZ curve is negative. The criterion is passed if the angle is greater then the required
value. This criterion should not be confused with the range of positive stability.
Angle of vanishing stability - general heeling arm
Range of positive stability - general heeling arm
Computes the range of positive stability with the heeling arm.
[Range of stability] = [Angle of vanishing stability] – [Angle of equilibrium]
The criterion is passed if the value of range of stability is greater then the required value.

Appendix B
Page 271
Range of positive stability - general heeling arm
GZ area between limits type 1 - general heeling arm
Computes the area below the GZ curve and above the heel arm curve between the specified heel
angles. The criterion is passed if the area is greater than the required value.
Area =
2
1
)(arm heel)( dGZ
GZ area between limits type 1 - general heeling arm
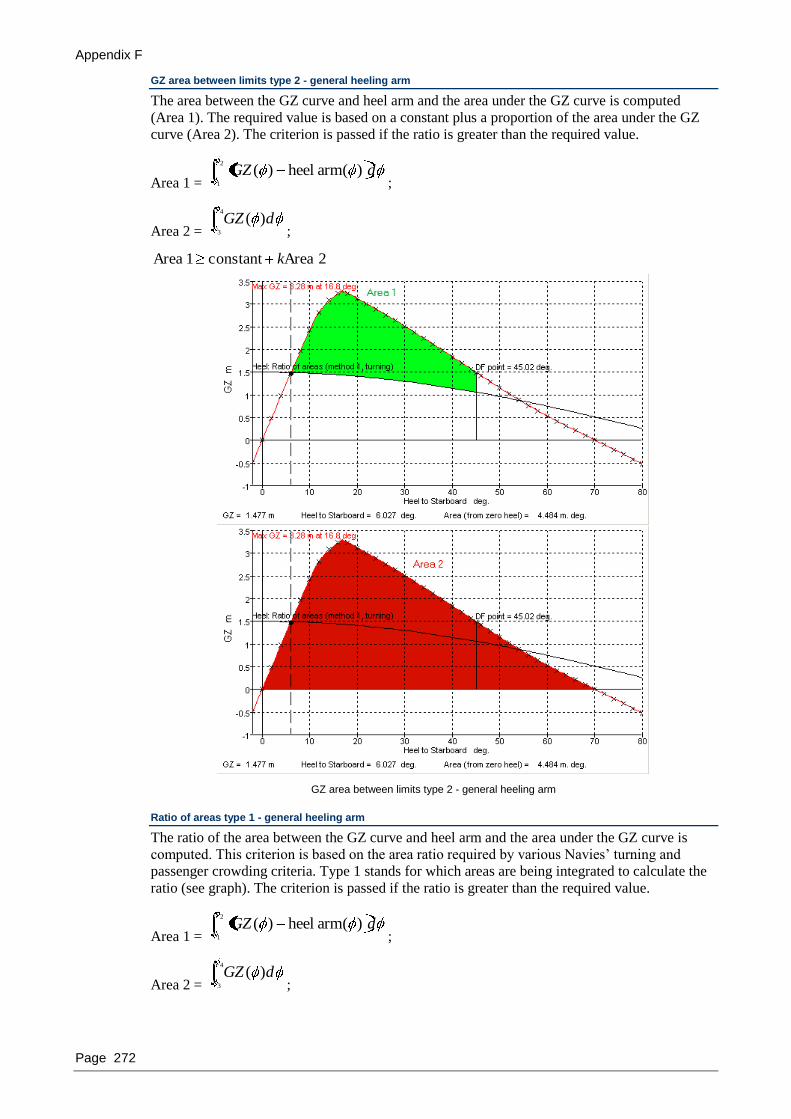
Appendix F
Page 272
GZ area between limits type 2 - general heeling arm
The area between the GZ curve and heel arm and the area under the GZ curve is computed
(Area 1). The required value is based on a constant plus a proportion of the area under the GZ
curve (Area 2). The criterion is passed if the ratio is greater than the required value.
Area 1 =
2
1
)(arm heel)( dGZ;
Area 2 =
4
3
)( dGZ;
2 Areaconstant1 Area k
GZ area between limits type 2 - general heeling arm
Ratio of areas type 1 - general heeling arm
The ratio of the area between the GZ curve and heel arm and the area under the GZ curve is
computed. This criterion is based on the area ratio required by various Navies‟ turning and
passenger crowding criteria. Type 1 stands for which areas are being integrated to calculate the
ratio (see graph). The criterion is passed if the ratio is greater than the required value.
Area 1 =
2
1
)(arm heel)( dGZ;
Area 2 =
4
3
)( dGZ;
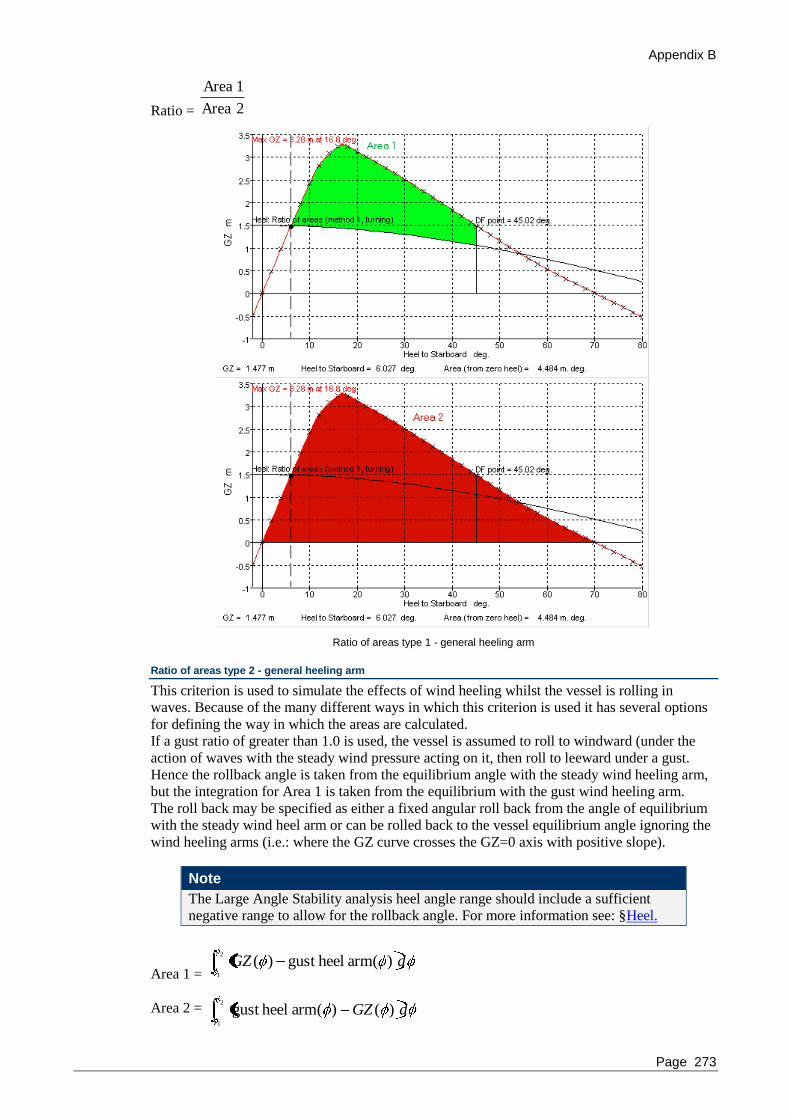
Appendix B
Page 273
Ratio = 2 Area
1 Area
Ratio of areas type 1 - general heeling arm
Ratio of areas type 2 - general heeling arm
This criterion is used to simulate the effects of wind heeling whilst the vessel is rolling in
waves. Because of the many different ways in which this criterion is used it has several options
for defining the way in which the areas are calculated.
If a gust ratio of greater than 1.0 is used, the vessel is assumed to roll to windward (under the
action of waves with the steady wind pressure acting on it, then roll to leeward under a gust.
Hence the rollback angle is taken from the equilibrium angle with the steady wind heeling arm,
but the integration for Area 1 is taken from the equilibrium with the gust wind heeling arm.
The roll back may be specified as either a fixed angular roll back from the angle of equilibrium
with the steady wind heel arm or can be rolled back to the vessel equilibrium angle ignoring the
wind heeling arms (i.e.: where the GZ curve crosses the GZ=0 axis with positive slope).
Note
The Large Angle Stability analysis heel angle range should include a sufficient
negative range to allow for the rollback angle. For more information see: §Heel.
Area 1 =
2
1
)(arm heelgust )( dGZ
Area 2 = 2
1
)()(arm heelgust dGZ
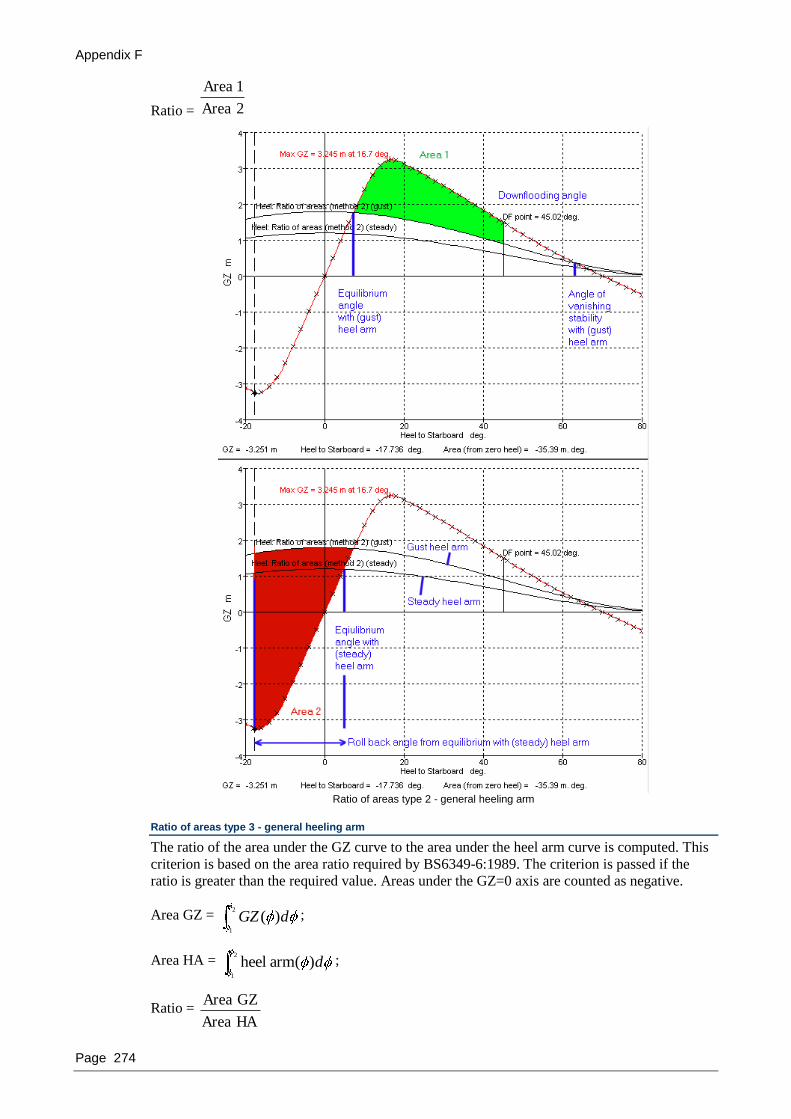
Appendix F
Page 274
Ratio = 2 Area
1 Area
Ratio of areas type 2 - general heeling arm
Ratio of areas type 3 - general heeling arm
The ratio of the area under the GZ curve to the area under the heel arm curve is computed. This
criterion is based on the area ratio required by BS6349-6:1989. The criterion is passed if the
ratio is greater than the required value. Areas under the GZ=0 axis are counted as negative.
Area GZ = 2
1
)( dGZ ;
Area HA = 2
1
)(arm heel d ;
Ratio = HA Area
GZ Area
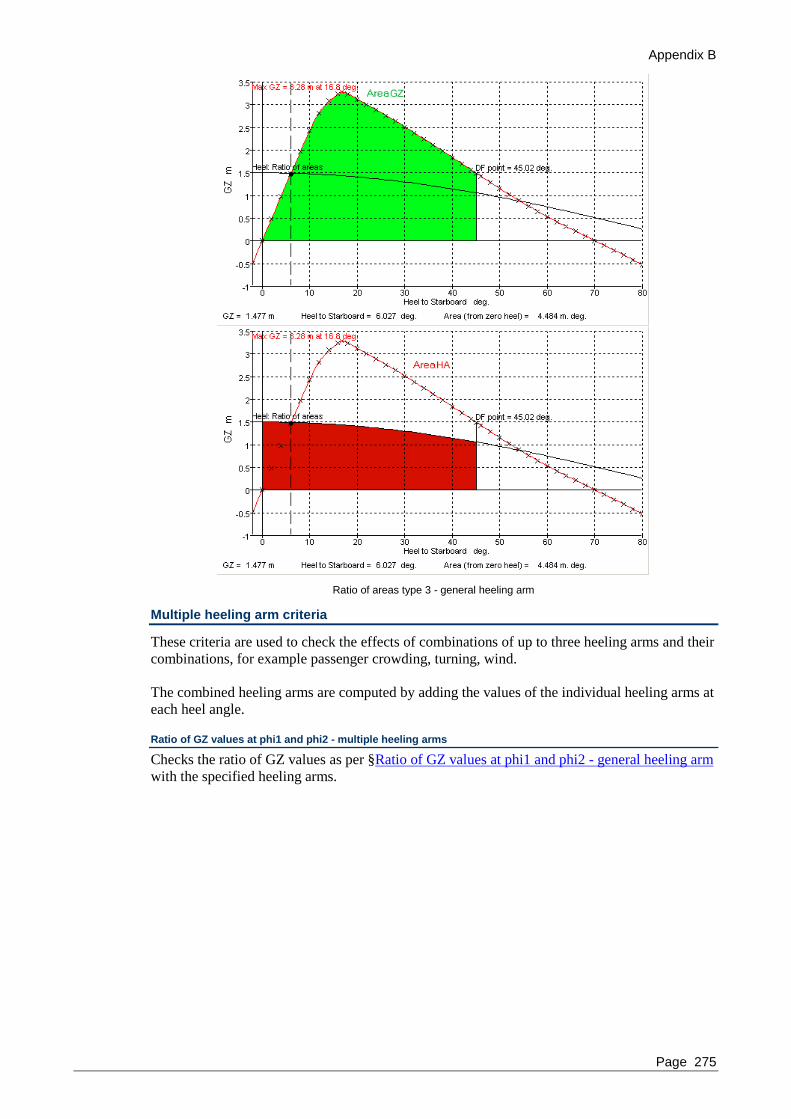
Appendix B
Page 275
Ratio of areas type 3 - general heeling arm
Multiple heeling arm criteria
These criteria are used to check the effects of combinations of up to three heeling arms and their
combinations, for example passenger crowding, turning, wind.
The combined heeling arms are computed by adding the values of the individual heeling arms at
each heel angle.
Ratio of GZ values at phi1 and phi2 - multiple heeling arms
Checks the ratio of GZ values as per §Ratio of GZ values at phi1 and phi2 - general heeling arm
with the specified heeling arms.
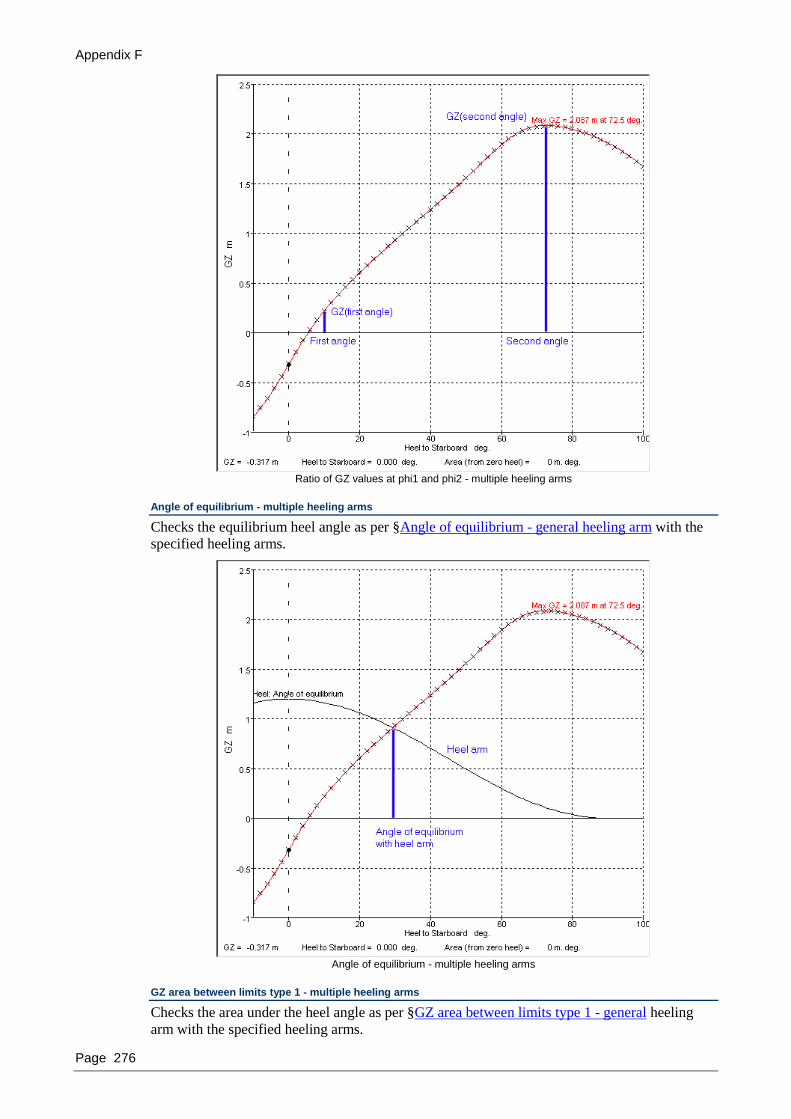
Appendix F
Page 276
Ratio of GZ values at phi1 and phi2 - multiple heeling arms
Angle of equilibrium - multiple heeling arms
Checks the equilibrium heel angle as per §Angle of equilibrium - general heeling arm with the
specified heeling arms.
Angle of equilibrium - multiple heeling arms
GZ area between limits type 1 - multiple heeling arms
Checks the area under the heel angle as per §GZ area between limits type 1 - general heeling
arm with the specified heeling arms.

Appendix B
Page 277
GZ area between limits type 1 - multiple heeling arms
GZ area between limits type 2 - multiple heeling arms
Checks the area under the heel angle as per §GZ area between limits type 2 - general heeling
arm with the specified heeling arms.
Area 1 =
2
1
)(arm heel)( dGZ;
Area 2 =
4
3
)( dGZ;
2 Areaconstant1 Area k

Appendix F
Page 278
GZ area between limits type 2 - general heeling arm
Ratio of areas type 1 - multiple heeling arms
Checks the area under the heel angle as per §Ratio of areas type 1 - general heeling arm with the
specified heeling arms.

Appendix B
Page 279
Ratio of areas type 1 - multiple heeling arms
Subdivision Index s-factor - MSC_216(82)
The Subdivision Index s-factor as described in IMO MSC.216(82) is computed. Several extra
options are presented to the user.
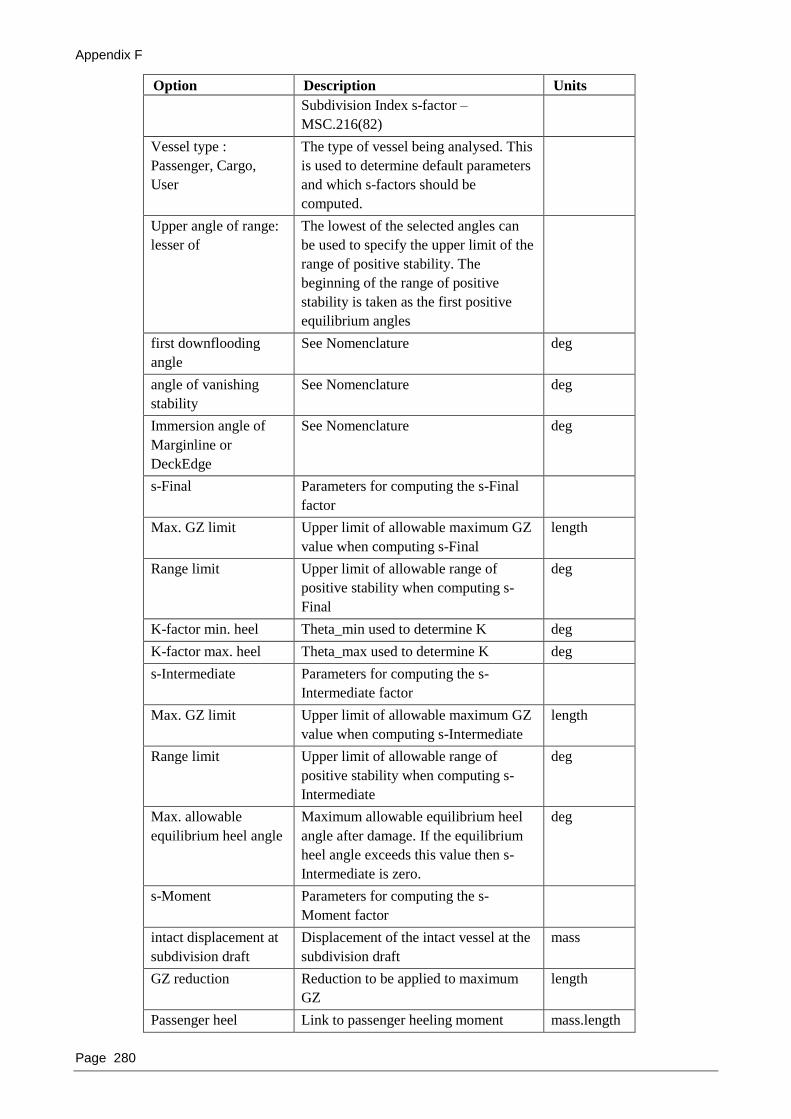
Appendix F
Page 280
Option Description Units
Subdivision Index s-factor –
MSC.216(82)
Vessel type :
Passenger, Cargo,
User
The type of vessel being analysed. This
is used to determine default parameters
and which s-factors should be
computed.
Upper angle of range:
lesser of
The lowest of the selected angles can
be used to specify the upper limit of the
range of positive stability. The
beginning of the range of positive
stability is taken as the first positive
equilibrium angles
first downflooding
angle
See Nomenclature deg
angle of vanishing
stability
See Nomenclature deg
Immersion angle of
Marginline or
DeckEdge
See Nomenclature deg
s-Final Parameters for computing the s-Final
factor
Max. GZ limit Upper limit of allowable maximum GZ
value when computing s-Final
length
Range limit Upper limit of allowable range of
positive stability when computing s-
Final
deg
K-factor min. heel Theta_min used to determine K deg
K-factor max. heel Theta_max used to determine K deg
s-Intermediate Parameters for computing the s-
Intermediate factor
Max. GZ limit Upper limit of allowable maximum GZ
value when computing s-Intermediate
length
Range limit Upper limit of allowable range of
positive stability when computing s-
Intermediate
deg
Max. allowable
equilibrium heel angle
Maximum allowable equilibrium heel
angle after damage. If the equilibrium
heel angle exceeds this value then s-
Intermediate is zero.
deg
s-Moment Parameters for computing the s-
Moment factor
intact displacement at
subdivision draft
Displacement of the intact vessel at the
subdivision draft
mass
GZ reduction Reduction to be applied to maximum
GZ
length
Passenger heel Link to passenger heeling moment mass.length
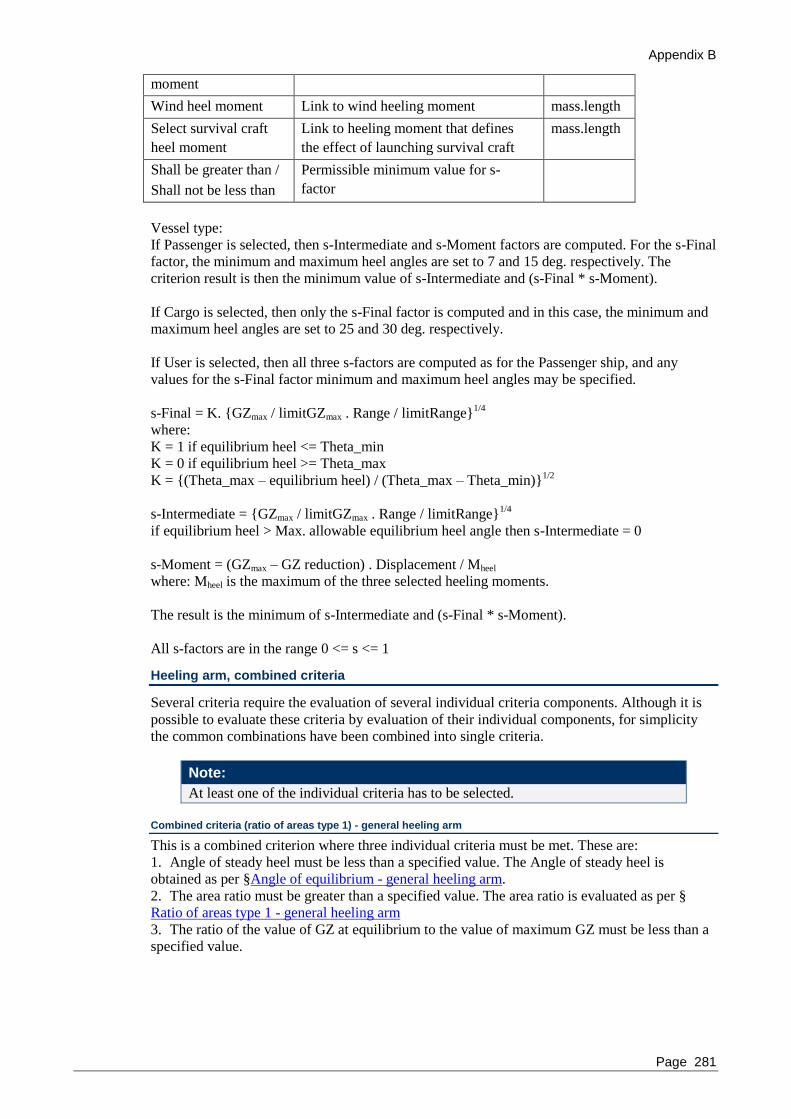
Appendix B
Page 281
moment
Wind heel moment Link to wind heeling moment mass.length
Select survival craft
heel moment
Link to heeling moment that defines
the effect of launching survival craft
mass.length
Shall be greater than /
Shall not be less than
Permissible minimum value for s-
factor
Vessel type:
If Passenger is selected, then s-Intermediate and s-Moment factors are computed. For the s-Final
factor, the minimum and maximum heel angles are set to 7 and 15 deg. respectively. The
criterion result is then the minimum value of s-Intermediate and (s-Final * s-Moment).
If Cargo is selected, then only the s-Final factor is computed and in this case, the minimum and
maximum heel angles are set to 25 and 30 deg. respectively.
If User is selected, then all three s-factors are computed as for the Passenger ship, and any
values for the s-Final factor minimum and maximum heel angles may be specified.
s-Final = K. {GZmax / limitGZmax . Range / limitRange}1/4
where:
K = 1 if equilibrium heel <= Theta_min
K = 0 if equilibrium heel >= Theta_max
K = {(Theta_max – equilibrium heel) / (Theta_max – Theta_min)}1/2
s-Intermediate = {GZmax / limitGZmax . Range / limitRange}1/4
if equilibrium heel > Max. allowable equilibrium heel angle then s-Intermediate = 0
s-Moment = (GZmax – GZ reduction) . Displacement / Mheel
where: Mheel is the maximum of the three selected heeling moments.
The result is the minimum of s-Intermediate and (s-Final * s-Moment).
All s-factors are in the range 0 <= s <= 1
Heeling arm, combined criteria
Several criteria require the evaluation of several individual criteria components. Although it is
possible to evaluate these criteria by evaluation of their individual components, for simplicity
the common combinations have been combined into single criteria.
Note:
At least one of the individual criteria has to be selected.
Combined criteria (ratio of areas type 1) - general heeling arm
This is a combined criterion where three individual criteria must be met. These are:
1. Angle of steady heel must be less than a specified value. The Angle of steady heel is
obtained as per §Angle of equilibrium - general heeling arm.
2. The area ratio must be greater than a specified value. The area ratio is evaluated as per §
Ratio of areas type 1 - general heeling arm
3. The ratio of the value of GZ at equilibrium to the value of maximum GZ must be less than a
specified value.

Appendix F
Page 282
Combined criteria (ratio of areas type 1) - general heeling arm
Combined criteria (ratio of areas type 2) - general wind heeling arm
This is a widely applicable wind heeling criterion in its most generic format. The heeling arm is
specified simply by a magnitude and cosine power. Optionally, a gust wind can be applied.
1. Angle of steady heel must be less than a specified value. The angle of steady heel is obtained
as per Angle of equilibrium - general heeling arm.
2. The area ratio must be greater than a specified value. The area ratio is evaluated as per Ratio
of areas type 2 - general heeling arm.
3. The ratio of the value of GZ at equilibrium to the value of maximum GZ must be less than a
specified value.
Note
The Large Angle Stability analysis heel angle range should include a sufficient
negative range to allow for the rollback angle. For more information see: §Heel.

Appendix B
Page 283
Area definition
If required, a reduction of the GZ curve may be applied. If this is done, all calculations are done
using a reduced GZ‟ curve which is computed at each heel angle as follows:
)(cos)()(' mBGZGZ
This criterion may be used to evaluate the following specific criteria (as well as many others of
similar format):
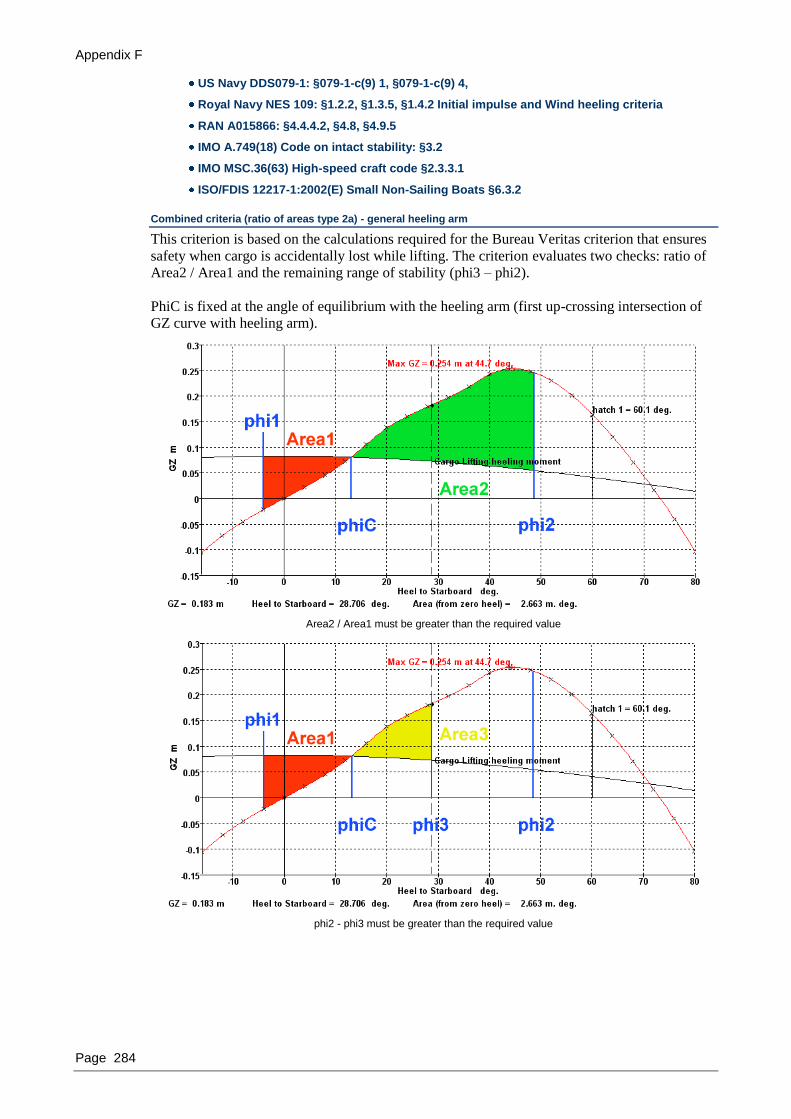
Appendix F
Page 284
US Navy DDS079-1: §079-1-c(9) 1, §079-1-c(9) 4,
Royal Navy NES 109: §1.2.2, §1.3.5, §1.4.2 Initial impulse and Wind heeling criteria
RAN A015866: §4.4.4.2, §4.8, §4.9.5
IMO A.749(18) Code on intact stability: §3.2
IMO MSC.36(63) High-speed craft code §2.3.3.1
ISO/FDIS 12217-1:2002(E) Small Non-Sailing Boats §6.3.2
Combined criteria (ratio of areas type 2a) - general heeling arm
This criterion is based on the calculations required for the Bureau Veritas criterion that ensures
safety when cargo is accidentally lost while lifting. The criterion evaluates two checks: ratio of
Area2 / Area1 and the remaining range of stability (phi3 – phi2).
PhiC is fixed at the angle of equilibrium with the heeling arm (first up-crossing intersection of
GZ curve with heeling arm).
Area2 / Area1 must be greater than the required value
phi2 - phi3 must be greater than the required value

Appendix B
Page 285
Option Description Units
Combined criteria (ratio of areas type
2a)
Area1 integrated from
the greater of (phi1)
Angle that defines the lower heel angle
for the integration range of Area1. The
lesser of the following three options
spec. heel angle
(equilibrium angle
during lifting)
A specified, fixed heel angle deg
roll back from angle
of equilibrium with
heeling arm
A roll-back angle (positive) from the
angle of equilibrium with the heeling
arm (first up-crossing intersection of
the GZ and heeling arm curves)
deg
angle of equilibrium
(without heel arm)
Roll back to the angle of equilibrium of
the vessel (ignoring the heeling arm)
deg
Area2 integrated to
the lesser of (phi2)
Upper integration limit of Area2
chosen from the lesser of the seven
options.
deg
Max. heeling angle
due to roll taken as the
lesser of (phi3)
This angle is used to evaluate the
second part of the criterion: the
difference phi2-phi3 must be greater
than the required value.
phi3 may be determined from a number
of features of the GZ curve including
being chosen such that Area3/Area1 is
some specified value.
deg
angle at which Area3 /
Area1 is
The required ratio of Area3/Area2 used
to determine the angle phi3
deg
Note
The Large Angle Stability analysis heel angle range should include a sufficient
negative range to allow for the rollback angle. For more information see: §Heel.
Derived heeling arm criteria
For these criteria, the magnitude of the heeling arm is derived (rather than specified directly)
from a required relationship between the GZ curve and the heeling arm curve. The shape of the
heeling arm (e.g. cos1.3
) must be specified. The heeling arm is normally derived from a GZ
value, GZ area or angle of equilibrium requirement.
The criterion is then evaluated by comparing some requirement of the derived heeling arm with
a specified value.
GZ derived heeling arm
This criterion is used to calculate the amplitude of a heeling arm derived from the value of GZ
at a certain heel angle. The GZ value used to define the heeling arm is the GZ at one of the
following heel angles:

Appendix F
Page 286
specified angle of heel
angle of first peak in GZ curve
angle at which maximum GZ occurs
angle of first downflooding
immersion angle of margin line or deck edge
The heeling arm is then calculated as described by the equation below, and is then compared
with a minimum required value.
n
GZA
cos
where:
A Amplitude of heeling arm
n Shape of heeling arm (n = 0 for constant heeling arm)
Specified heel angle
GZ Value of GZ at specified heel angle
Required ratio = HAGZ /
GZ area derived heeling arm type 1
This criterion is used to calculate the amplitude of a heeling arm derived from the area under the
GZ curve between specified limits. The area under both the GZ and heeling arm curves is
integrated between the same specified limits, see below.
Lower integration limit, 1 :
specified angle of heel
angle of equilibrium
Upper integration limit, 2 :
spec. heel angle
spec. angle above equilibrium
angle of first GZ peak
angle of max. GZ
first downflooding angle
angle of vanishing stability
It is also possible to specify a minimum heel angle for the upper integration limit. Any negative
areas (due to negative GZ) up to this minimum upper integration heel angle will be deducted
from the total area under the GZ curve.
The amplitude of the heeling, which satisfies the equation below arm is then found and
compared with a minimum required value. 2
12
1
d d cos
GZA n
A Amplitude of heeling arm
n Shape of heeling arm (n = 0 for constant heeling arm)
heel angle
GZ GZ curve
Required ratio

Appendix B
Page 287
GZ area derived heeling arm type 2
This criterion is used to simulate the effects of wind heeling whilst the vessel is rolling in
waves. Because of the many different ways in which this criterion is used it has several options
for defining the way in which the areas are calculated. With the wind pressure acting on it, the
vessel is assumed to roll to windward under the action of waves and then roll to leeward. The
rollback angle is taken from the equilibrium angle with the wind heeling arm.
A heeling arm of prescribed shape is found such that the specified area ratio is met. The
amplitude of the heeling arm is then compared with a required minimum value.
The roll back may be specified as either:
a fixed angular roll back from the angle of equilibrium with the wind heel arm;
roll back to the vessel equilibrium angle ignoring the wind heeling arms (i.e.: where the GZ
curve crosses the GZ=0 axis with positive slope); or
roll back to a specified heel angle.
Note
The Large Angle Stability analysis heel angle range should include a sufficient
negative range to allow for the rollback angle. For more information see: §Heel.
Area 1 = 2
1
)(arm heel)( dGZ
Area 2 = 2
1
)()(arm heel dGZ
Ratio = 2 Area
1 Area
GZ area derived heeling arm (type 2) - general heeling arm
Angle of equilibrium - GZ derived wind heeling arm
The derived wind heeling criterion is used to check that the steady heel angle due to wind
pressure exceeds a certain value. The steady heel arm is derived from a gust of specified ratio.
The wind gust will cause the vessel to heel over to the lesser of a specified heel angle, angle of
the first GZ peak, angle of maximum GZ or the first downflooding angle.

Appendix F
Page 288
The vessel is assumed to be safe from gusts up to the specified ratio, if the angle of steady heel
is greater than the angle. This means that the lesser of: a specified heel angle, first peak in GZ
curve, angle of maximum GZ or the first downflooding angle, should be large enough to
withstand a gust from a steady wind heeling angle larger than ….
Angle of equilibrium - derived wind heeling arm
Ratio of equilibrium angles - GZ area derived heeling arm
This criterion is used to compare the equilibrium angles with two different heeling arms. The
first equilibrium angle, φ1, is the angle of equilibrium with a derived heeling arm. The second
equilibrium angle, φ2, is the angle of equilibrium with a specified heeling arm.
The derived heeling arm is chosen such that the areas, A1 and A2, are in the specified ratio.
There are several options which can be used to define the upper and lower ranges for the area
integrations. The specified heeling arm is specified by an amplitude and cosine power; the same
cosine power is used for both the specified and the derived heeling arms.

Appendix B
Page 289
Ratio of equilibrium angles - derived heeling arm
Area 1 = 2
1
)(arm heel)( dGZ
Area 2 = 2
1
)()(arm heel dGZ
Ratio of areas = 2 Area
1 Area
φ1 = Angle of equilibrium with heeling arm derived from required area ratio (purple heeling
arm)
φ2 = Angle of equilibrium with specified heeling arm (orange heeling arm)
The criterion is passed if the ratio φ2 : φ1 is less than the required value. Thus if it is required
that φ2 be less than φ1, then the ratio φ2 : φ1 must be less than unity.
Option Description Units
A Magnitude of specified heeling arm length
n Cosine power to describe shape of both
specified and derived heelning arms
required area ratio
Area1 / Area2
The required area ratio used to find the
derived heeling arm magnitude
options Specify lower integration limit for Area1 deg
options Specify upper integration limit for Area1 deg
options Specify lower integration limit for Area2; the
upper integration limit is always the angle of deg

Appendix F
Page 290
equilibrium with derived heel arm
required value Specifies the maximum allowable ratio of
equilibrium heel angle with the specified heel
arm to the equilibrium heel angle with the
derived heel arm (phi2 / phi1). This value is
normally less than or equal to 100%,
indicating that the equilibrium heel angle with
the specified heel arm must be less than the
equilibrium heel angle with the derived heel
arm
Note
The Large Angle Stability analysis heel angle range should include a sufficient
negative range to allow for the rollback angle. For more information see: §Heel.
Other combined criteria
Other criteria, which do not easily fall into the categories above, are found here.
Other criteria - STIX
The stability index criterion or STIX criterion as described in ISO/FDIS 12217-2:2002(E) is
used to assess the stability of sailing craft. The required input parameters are described below.
Please refer to ISO/FDIS 12217-2:2002(E) for exact definitions of parameters and how they
should be calculated.
Option Description Units
delta Adjustment to STIX rating, either 0 or 5.
5 if the vessel, when fully flooded
with water, has reserve buoyancy and
positive righting lever at a heel angle of 90º
. 0 in all other cases.
AS, sail area ISO 8666 Sail area as defined in ISO 8666. Note that
no additional windage areas are calculated
by Hydromax for this criterion.
length2
height of centroid of
AS
Height of sail area centre of effort from
model‟s vertical datum (not necessarily the
waterline, this is not the same as the STIX
variable CEh which is measured from the
waterline, positive up).
length
LH, length Hull length as defined by ISO 8666. This
may be either specified or calculated by
Hydromax. Hydromax calculates this
parameter as the overall length of the
vessel (all hull surfaces) in the upright,
zero trim condition.
length
BH, beam of hull Hull beam as defined by ISO 8666. This
may be either specified or calculated by
Hydromax. Hydromax calculates this
parameter as the overall beam of the vessel
(all hull surfaces) in the upright, zero trim
condition.
length

Appendix B
Page 291
Option Description Units
LWL, length waterline Hull waterline length in the current load
condition as defined by ISO 8666. This
may be either specified or calculated by
Hydromax. Hydromax calculates this
parameter as the waterline length of the
vessel (all hull surfaces) at zero heel and at
the loadcase displacement and centre of
gravity; if the analysis is carried out free-
to-trim, the waterline of the trimmed vessel
is used.
length
BWL, beam waterline Hull waterline beam in the current load
condition as defined by ISO 8666. This
may be either specified or calculated by
Hydromax. Hydromax calculates this
parameter as the waterline beam of the
vessel (all hull surfaces) at zero heel and at
the loadcase displacement and centre of
gravity; if the analysis is carried out free-
to-trim, the waterline of the trimmed vessel
is used.
length
height of immersed
profile area centroid Height of centre of the lateral projected
immersed area of the hull from model‟s
vertical datum (not necessarily the
waterline, this is not the same as the STIX
variable LPh ); may be specified or
calculated by Hydromax. Hydromax
calculates this parameter at zero heel and at
the loadcase displacement and centre of
gravity; if the analysis is carried out free-
to-trim, the waterline of the trimmed vessel
is used.
length
Shall be greater than /
Shall not be less than
Hydromax uses the numerical STIX rating
value rather than the STIX design category.
Hydromax calculates the various factors and STIX rating according to ISO/FDIS 12217-
2:2002(E). Note that a downflooding angle is required to calculate the STIX index. Hence, if no
downflooding points are defined, or defined downflooding points do not immerse within the
selected heel angle range, the angle of downflooding is taken to be the largest heel angle tested.
This affects the calculation of the Wind Moment and Downflooding factors.
Specific stand alone heeling arm criteria
These criteria provide some specific stand alone heeling arm criteria. They are included for
compatibility with criteria sets defined in earlier versions of Hydromax, but it is highly
recommended to use the equivalent xRef criteria with the desired heeling arms.
Stand alone heeling arm criteria
Angle of equilibrium - passenger crowding heeling arm
Calculates the angle of equilibrium with the heeling arm due to passenger crowding applied.
The heeling arm is calculated from the number, weight and location of the passengers, see
§Passenger crowding.

Appendix F
Page 292
Angle of equilibrium - high-speed turn heeling arm
Calculates the angle of equilibrium with the heeling arm due to high speed turning applied. The
heeling arm is calculated from the turn radius, vessel speed and height of the vessel‟s centre of
gravity, see §Turning.
Ratio of areas type 1 - general cos+sin heeling arm
This is a very similar criterion to § Ratio of areas type 1 - general heeling arm; the only
difference being the shape of the heel arm. In this criterion the heel arm has both a sine and a
cosine component. This is used to simulate the effects of lifting weights and is used by several
Navies.
The modified form of the heeling arm is given below, for further information also see §General
cos+sin heeling arm
)(sin)(cos)( mn BAkH
Area 1 =
2
1
)(arm heel)( dGZ ;
Area 2 =
4
3
)( dGZ ;
Ratio = 2 Area
1 Area
Stand alone heeling arm combined criteria
Combined criteria (ratio of areas type 1) - passenger crowding
This criterion is essentially the same as its generic form: Combined criteria (ratio of areas type
1) - general heeling arm, however the heel arm is the specific passenger crowding form.
Combined criteria (ratio of areas type 1) - high-speed turn
This criterion is essentially the same as its generic form: Combined criteria (ratio of areas type
1) - general heeling arm, however the heel arm is the specific high-speed turning form.
Combined criteria (ratio of areas type 1) - general cos+sin heeling arm
The lifting criterion is the same as the Combined criteria (ratio of areas type 1) - general heeling
arm except that the heel arm has both a cos and sin component.

Appendix B
Page 293
Combined criteria (ratio of areas type 1) – cos+sin heeling arm
Combined criteria (ratio of areas type 1) - lifting weight
This criterion is essentially the same as its generic form: Combined criteria (ratio of areas type
1) - general cos+sin heeling arm, however the heel arm is the specific lifting of a heavy weight
form.
Combined criteria (ratio of areas type 1) - towing
This criterion is essentially the same as its generic form: Combined criteria (ratio of areas type
1) - general cos+sin heeling arm, however the heel arm is the specific towing form.
Combined criteria (ratio of areas type 2) - wind heeling arm
This criterion is exactly the same as §Combined criteria (ratio of areas type 2) - general wind
heeling arm except that the magnitude of the heeling arm is automatically calculated from the
wind pressure (or velocity), projected area and area lever information.
Area definition

Appendix F
Page 294
Note
The Large Angle Stability analysis heel angle range should include a sufficient
negative range to allow for the rollback angle. For more information see: §Heel.
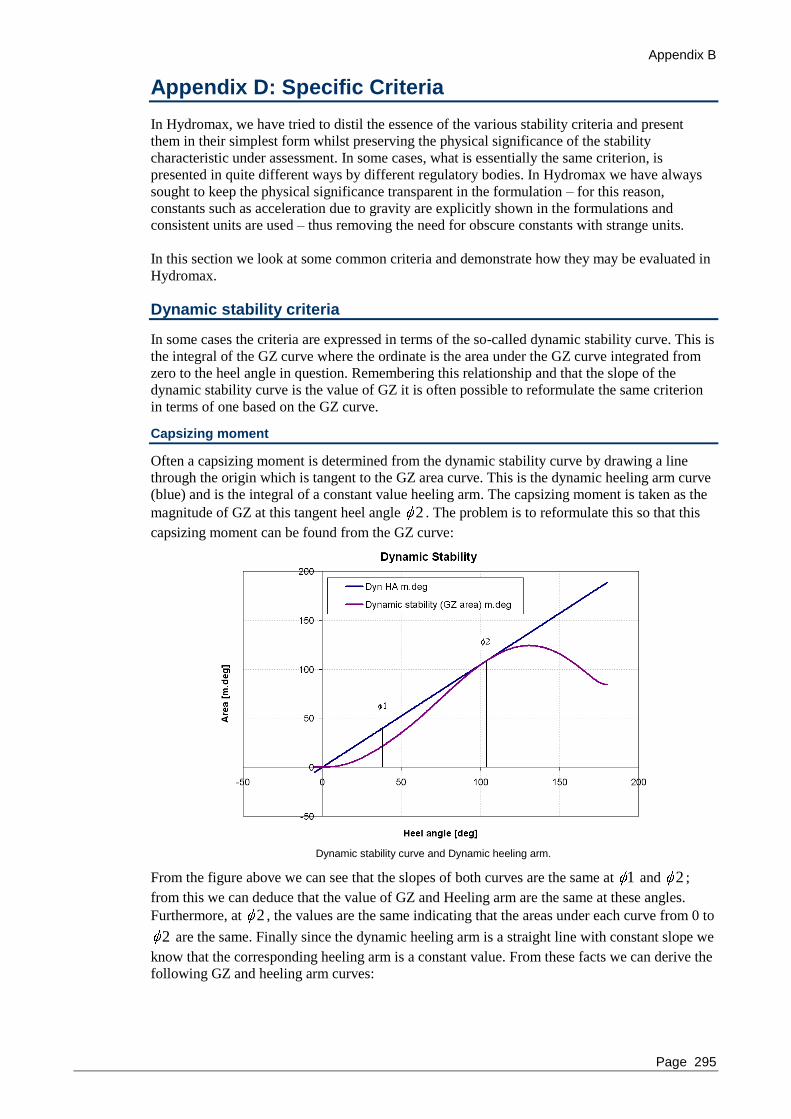
Appendix B
Page 295
Appendix D: Specific Criteria
In Hydromax, we have tried to distil the essence of the various stability criteria and present
them in their simplest form whilst preserving the physical significance of the stability
characteristic under assessment. In some cases, what is essentially the same criterion, is
presented in quite different ways by different regulatory bodies. In Hydromax we have always
sought to keep the physical significance transparent in the formulation – for this reason,
constants such as acceleration due to gravity are explicitly shown in the formulations and
consistent units are used – thus removing the need for obscure constants with strange units.
In this section we look at some common criteria and demonstrate how they may be evaluated in
Hydromax.
Dynamic stability criteria
In some cases the criteria are expressed in terms of the so-called dynamic stability curve. This is
the integral of the GZ curve where the ordinate is the area under the GZ curve integrated from
zero to the heel angle in question. Remembering this relationship and that the slope of the
dynamic stability curve is the value of GZ it is often possible to reformulate the same criterion
in terms of one based on the GZ curve.
Capsizing moment
Often a capsizing moment is determined from the dynamic stability curve by drawing a line
through the origin which is tangent to the GZ area curve. This is the dynamic heeling arm curve
(blue) and is the integral of a constant value heeling arm. The capsizing moment is taken as the
magnitude of GZ at this tangent heel angle 2 . The problem is to reformulate this so that this
capsizing moment can be found from the GZ curve:
Dynamic stability curve and Dynamic heeling arm.
From the figure above we can see that the slopes of both curves are the same at 1 and 2 ;
from this we can deduce that the value of GZ and Heeling arm are the same at these angles.
Furthermore, at 2 , the values are the same indicating that the areas under each curve from 0 to
2 are the same. Finally since the dynamic heeling arm is a straight line with constant slope we
know that the corresponding heeling arm is a constant value. From these facts we can derive the
following GZ and heeling arm curves:

Appendix F
Page 296
Stability curve, Area 1 corresponds to the area under the heeling arm curve up to the second intercept
Stability curve, Area 2 corresponds to the area under the GZ curve up to the second intercept
Knowing that Area1 = Area2 we can deduce that Area 3 = Area 4 in the figure below:

Appendix B
Page 297
The magnitude of the heeling arm must be chosen so that Area 3 = Area 4
So the capsizing moment can also be determined by finding the heeling moment that gives
Area3 = Area4. This can easily be done in Hydromax using the GZ area derived heeling arm
type 2 criterion.
Heeling arms for specific criteria - Note on unit conversion
There are quite a few different ways in which different authorities define their heeling arms. The
approach that has been taken in Hydromax is to reflect the physics of what is generating the
heeling moment.
Be careful as some criteria specify heeling arms and some specify heeling moments or
“moments” in mass.length. All Hydromax criteria use a heeling arm since this is what is
ultimately plotted on the GZ curve. To obtain the heeling arm from the heeling moment, it is
necessary to divide by vessel weight ( g ); and in the case of “moments” in mass.length, it is
necessary to divide by vessel mass.
Hydromax uses an internal conversion of knots to m/s based on the International Nautical mile
which is defined as exactly 1852m (International Hydrographic Conference, Monaco, 1929).
Thus 1 knot = 1852/3600 = 0.5144444... m/s.
(Note that the UK nautical mile is 6080ft = 1853.184m; giving a conversion multiplier for knots
to m/s of 0.51477333...)
In the following section, the conversions for some common criteria have been explained.
IMO Code on Intact Stability A.749(18) amended to MSC.75(69)
3.1.2.6 - Heeling due to turning
Heeling moment defined by:
22.0
2
0 dKG
L
VM tonneR
[kNm]
Where:
RM = heeling moment in kNm
0V = service speed in m/s
L = length of ship at waterline in m
tonne = displacement in tonne
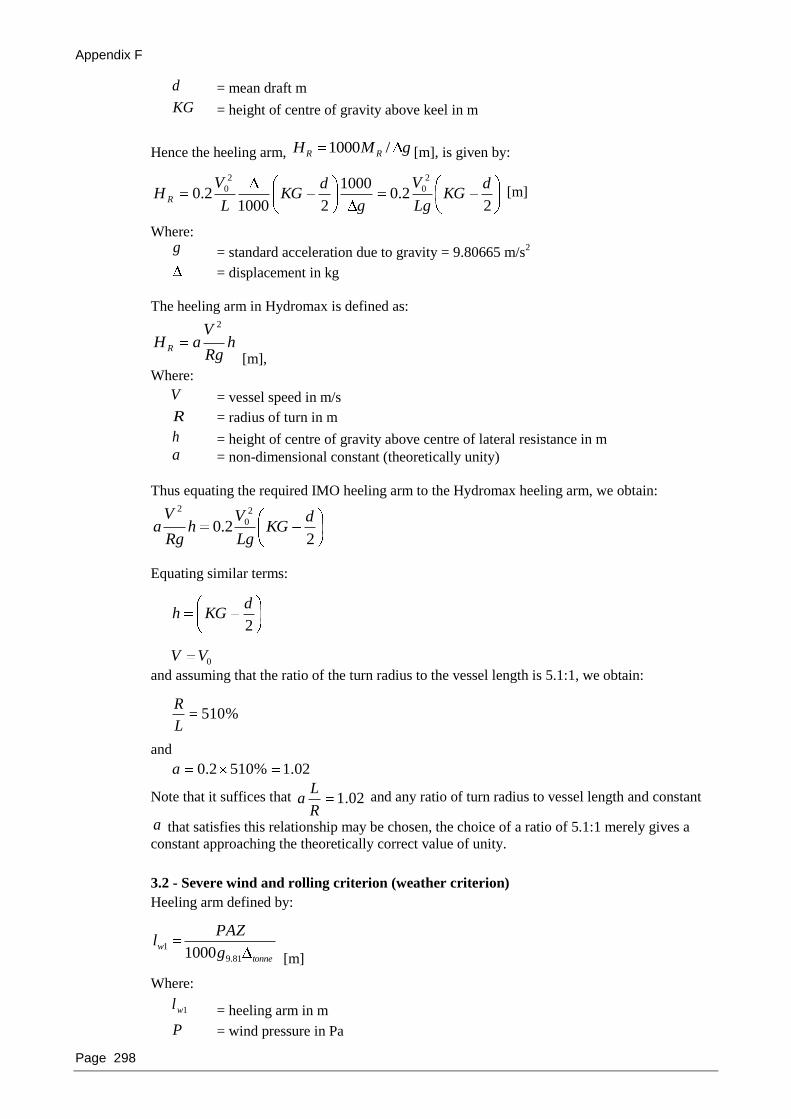
Appendix F
Page 298
d = mean draft m
KG = height of centre of gravity above keel in m
Hence the heeling arm, gMH RR /1000 [m], is given by:
22.0
1000
210002.0
2
0
2
0 dKG
Lg
V
g
dKG
L
VH R
[m]
Where:
g = standard acceleration due to gravity = 9.80665 m/s2
= displacement in kg
The heeling arm in Hydromax is defined as:
hRg
VaH R
2
[m],
Where:
V = vessel speed in m/s
R = radius of turn in m
h = height of centre of gravity above centre of lateral resistance in m
a = non-dimensional constant (theoretically unity)
Thus equating the required IMO heeling arm to the Hydromax heeling arm, we obtain:
22.0
2
0
2d
KGLg
Vh
Rg
Va
Equating similar terms:
2
dKGh
0VV and assuming that the ratio of the turn radius to the vessel length is 5.1:1, we obtain:
%510
L
R
and
02.1%5102.0a
Note that it suffices that 02.1R
La and any ratio of turn radius to vessel length and constant
a that satisfies this relationship may be chosen, the choice of a ratio of 5.1:1 merely gives a
constant approaching the theoretically correct value of unity.
3.2 - Severe wind and rolling criterion (weather criterion)
Heeling arm defined by:
tonne
wg
PAZl
81.9
11000 [m]
Where:
1wl = heeling arm in m
P = wind pressure in Pa

Appendix B
Page 299
A = projected lateral windage in m2
Z = vertical separation of centroids of A and underwater lateral area in m
tonne = displacement in tonne
81.9g = IMO assumed value of gravitational acceleration - 9.81m/s2
The heeling arm in Hydromax is defined as:
g
HhPAaHw
)(
[m]
Where:
g = standard acceleration due to gravity = 9.80665 m/s2
= displacement in kg
h = height of centroid of A in m
H = height of centroid of underwater lateral area in m
a = non-dimensional constant (theoretically unity)
Thus equating the required IMO heeling arm to the Hydromax heeling arm, we obtain:
tonneg
PAZ
g
HhPAa
81.91000
)(
Equating similar terms:
ZHh
and
99966.081.9
80665.9
81.9g
ga
IMO HSC Code MSC.36(63)
Annex 6 1.1.4 - Heeling moment due to wind pressure
Heeling moment defined by:
PAZM v 001.0 [kNm]
Where:
vM = heeling moment in kNm
P = wind pressure in Pa
A = projected lateral windage in m2
Z = vertical separation of centroids of A and underwater lateral area in m
Hence the heeling arm, gMH vv /1000 [m], is given by:
g
PAZ
gPAZHR
1000001.0
[m]
Where:
g = standard acceleration due to gravity = 9.80665 m/s2
= displacement in kg
The heeling arm in Hydromax is defined as:
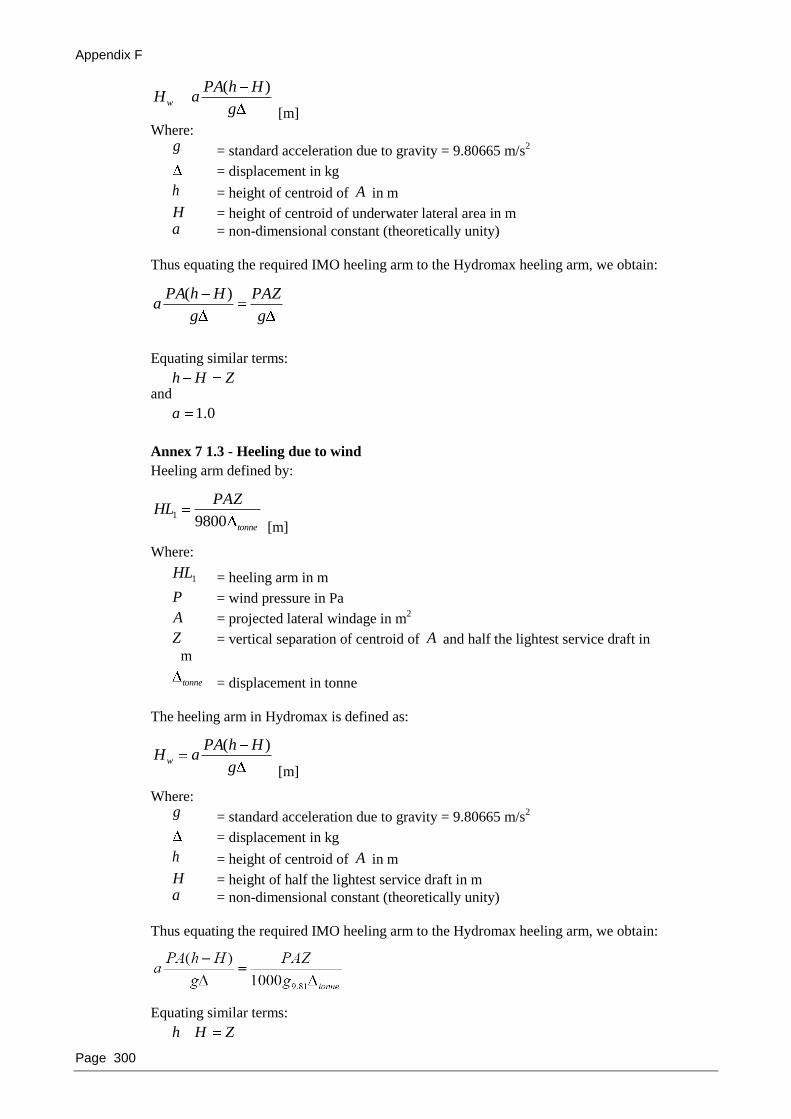
Appendix F
Page 300
g
HhPAaHw
)(
[m]
Where:
g = standard acceleration due to gravity = 9.80665 m/s2
= displacement in kg
h = height of centroid of A in m
H = height of centroid of underwater lateral area in m
a = non-dimensional constant (theoretically unity)
Thus equating the required IMO heeling arm to the Hydromax heeling arm, we obtain:
g
PAZ
g
HhPAa
)(
Equating similar terms:
ZHh and
0.1a
Annex 7 1.3 - Heeling due to wind
Heeling arm defined by:
tonne
PAZHL
98001
[m]
Where:
1HL = heeling arm in m
P = wind pressure in Pa
A = projected lateral windage in m2
Z = vertical separation of centroid of A and half the lightest service draft in
m
tonne = displacement in tonne
The heeling arm in Hydromax is defined as:
g
HhPAaHw
)(
[m]
Where:
g = standard acceleration due to gravity = 9.80665 m/s2
= displacement in kg
h = height of centroid of A in m
H = height of half the lightest service draft in m
a = non-dimensional constant (theoretically unity)
Thus equating the required IMO heeling arm to the Hydromax heeling arm, we obtain:
Equating similar terms:
ZHh
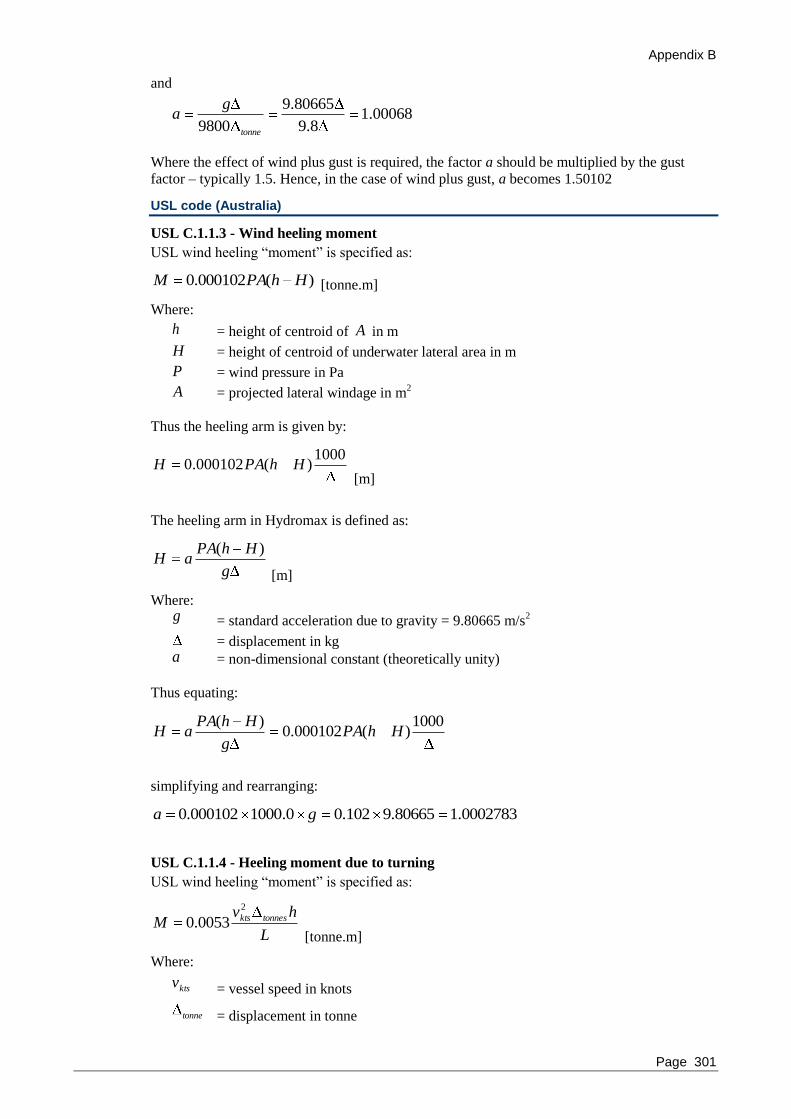
Appendix B
Page 301
and
00068.18.9
80665.9
9800 tonne
ga
Where the effect of wind plus gust is required, the factor a should be multiplied by the gust
factor – typically 1.5. Hence, in the case of wind plus gust, a becomes 1.50102
USL code (Australia)
USL C.1.1.3 - Wind heeling moment
USL wind heeling “moment” is specified as:
)(000102.0 HhPAM [tonne.m]
Where:
h = height of centroid of A in m
H = height of centroid of underwater lateral area in m
P = wind pressure in Pa
A = projected lateral windage in m2
Thus the heeling arm is given by:
1000)(000102.0 HhPAH
[m]
The heeling arm in Hydromax is defined as:
g
HhPAaH
)(
[m]
Where:
g = standard acceleration due to gravity = 9.80665 m/s2
= displacement in kg
a = non-dimensional constant (theoretically unity)
Thus equating:
1000)(000102.0
)(HhPA
g
HhPAaH
simplifying and rearranging:
0002783.180665.9102.00.1000000102.0 ga
USL C.1.1.4 - Heeling moment due to turning
USL wind heeling “moment” is specified as:
L
hvM tonneskts
2
0053.0 [tonne.m]
Where:
ktsv = vessel speed in knots
tonne = displacement in tonne

Appendix F
Page 302
h = height of centre of gravity above centre of lateral resistance in m
L = waterline length of vessel in m
Thus the heeling arm is given by:
0.10001
0053.02
L
hvH tonneskts
[m]
Where:
= displacement in kg
The heeling arm in Hydromax is defined as:
hRg
VaH
2
[m],
Where:
V = vessel speed in m/s
R = radius of turn in m
h = height of centre of gravity above centre of lateral resistance in m
a = non-dimensional constant (theoretically unity)
Thus equating the required USL heeling arm to the Hydromax heeling arm, we obtain:
0.10001
0053.022
L
hvh
Rg
Va tonneskts
simplifying and rearranging:
0.1000
1
5144.0
13.53.5
22
2
L
Rg
V
v
L
Rga tonneskts
finally, with g = 9.80665 [ms-2
]:
L
Ra 196424.0
Assuming that the ratio of the turn radius to the vessel length,%509
L
R
gives a value for a:
999798.0%509196424.0a
Note that it suffices that 196424.0
L
Ra
, and any ratio of turn radius to vessel length and
constant a that satisfies this relationship may be chosen, the choice of a ratio of 509% merely
gives a constant approaching the theoretically correct value of unity.
ISO 12217-1:2002(E)
This section explains how the ISO 12217-1 code calculates the heeling arm and how you can
replicate this calculation with a Hydromax criterion.
“6.3.2 Rolling in beam waves and wind
The curve of righting moments of the boat shall be established up to the downflooding angle or
the angle of vanishing stability or 50°, whichever is the least, using annex D. The heeling
moment due to wind, MW, expressed in newton metres, is assumed to be constant at all angles
of heel and shall be calculated as follows:

Appendix B
Page 303
MW = 0.3 ALV * (ALV / LWL + TM)* vW2
Where
LWL is the waterline length;
TM is the draft at the mid-point of the waterline length, expressed in metres;
vW = 28 m/s for design category A, and 21 m/s for design category B;
ALV is the windage area as defined in 3.3.7, but shall not be taken as less than 0.55*LH *
BH.”
Basically they are using moment = force * lever, where
the force is calculated as 0.3 * ALV * vW2, and
the lever is (ALV / LWL + TM)
This lever is a bit confusing so let‟s concentrate on that.
Hydromax‟ wind heeling arm calculation uses H for the vertical height of the hydrodynamic
centre (underwater area) and h as the vertical height of the aerodynamic centre (windage area) –
all measured consistently from the zero point, positive up.
Thus the lever is (h-H) in Hydromax should be the same as the (ALV / LWL + TM) lever from ISO.
You can calculate (ALV / LWL + TM) manually and then make sure the (h-H) value in Hydromax is
the same by specifying:
Velocity based heeling arm;
H = 0.0;
h = (ALV / LWL + TM);
a = 0.3 kg/m3
Note: the centre of the windage area -h- applies to the additional windage area or the total
windage area depending on which option you have selected. Make sure you check your total
windage lever in the intermediate results in the criteria results tab of the Results window.
For example, supposing we have a vessel with the following characteristics:
Displacement 105.7 tonne = 1037 kN
LH 24 m
BH 5 m
LWL 21.1 m
TM 1.9 m
vW 28 m/s for design category A
ALV 72 m2 ( this is greater than 0.55 LH BH = 66 m
2)
Thus according to the ISO 12217 formula, the heeling moment is given as:
MW = 0.3 * 72 * (72 / 21.1 + 1.9) * 282 = 89961 Nm
Thus the heeling arm = MW / Displacement = 89961 / 1037000 = 0.0868 m
The input for Hydromax requires:
Total area A = 72 m2;
area centroid height: h = ALV / LWL + TM = 72 / 21.1 + 1.9 = 5.312 m;
a = 0.3 kg/m3
giving the expected result for heeling arm amplitude:

Appendix F
Page 304
Intermediate results for the wind heeling arm.
ISO 12217: Small craft – stability and buoyancy assessment and categorisation.
This section gives some details on implementing the ISO 12217 stability criteria in Hydromax.
See also the note on converting units for the definition of the heeling arms in ISO 12217-
1:2002(E).
Part 1: Non-sailing boats of hull length greater than or equal to 6m
In many cases the user must determine the required pass value for the criteria, which depends on
the category and length of vessel being tested. In most cases the default required value would
exceed the worst case.
6.1.2: Downflooding height
Minimum freeboard to downflooding points must be determined from Figures 2 and 3 (Section
6.1.2) and entered into the required value field; the default value is set at 1.42m which is slightly
greater than the height required for a category A vessel of 24m in length.
6.1.3: Downflooding angle
Must be greater than a certain value as determined according to the design category; see Tables
3 and 4 (Sections 6.1.3, 6.2). The default value is set to 49.7
6.2: Offset-load test
There are several ways of evaluating this criterion:
1. Define a heeling arm and calculate the intersection of the heeling arm with the GZ
curve to determine the angle of equilibrium.
2. Specify a loadcase with the offset load specified and carry out an equilibrium analysis.
Verify that the angle of equilibrium does not exceed the maximum permissible value.
An additional requirement in this section is that a specified freeboard must be exceeded.
6.3: Resistance to wind and waves
Determine the windage area and lever and enter them in the appropriate fields in the criterion.
Also determine the required wind speed and roll-back angle (depending on the design category)
and enter these values.
In Hydromax, there is no option for placing the height, H, of the centre of lateral resistance at
the bottom of the vessel, so this must be specified manually (it is measured from the model zero
point, positive upwards).
6.3.3: Resistance to waves
This criterion comprises two parts, one to check that the righting moment is sufficient and a
second to determine whether the righting lever is sufficient.
6.4: Heel due to wind action

Appendix B
Page 305
Determine the parameters required for calculation of the wind heeling moment as per 6.3, but
note the different wind speeds to be used. Determine the limiting heel angle from Table 4
(Sections 6.2)
Part 2: Sailing boats of hull length greater than or equal to 6m
6.2.2: Downflooding height
Minimum freeboard to downflooding points must be determined from Figure 2 (Section 6.2.2)
and entered into the required value field, the default value is set at 1.42m which is slightly
greater than the height required for a category A vessel of 24m in length.
6.2.3: Downflooding angle
Must be greater than a certain value as determined according to the design category, see Tables
3 (Sections 6.2.3). The default value is set to 40
6.3: Angle of vanishing stability
Determine the required angle of vanishing stability which depends on design category and
vessel displacement. The default value is 130.
6.4: Stability index (STIX)
Determine the required STIX value depending on the design category, see Table 5 (Section
6.4.9). Also specify the sail area and vertical position of the sail area centroid and enter these
values in the appropriate fields in the criterion. If desired you can specify the other values or let
Hydromax calculate them for you.
6.5: Knockdown-recovery test
The test can be approximated by examining the angle of vanishing stability in the flooded
condition. If the flooded vessel has positive GZ at the knockdown angle, it should self right.
6.6.6: Wind stiffness test
Determine the wind heeling moment as defined in 6.6.6 for the wind speed of interest (Table 6,
Section 6.6.7). Convert this to a heeling lever. Calculate the GZ curve with the crew seated to
windward, this criterion will then look at the angle of equilibrium of the vessel under the
applied wind heeling arm.
Part 3: Boats of hull length less than 6m
These criteria are evaluated after an equilibrium analysis under the specified loading condition.
Non-Sailing Boats:
6.2.2: Downflooding-height tests
Determine the required downflooding height and specify the appropriate loading condition. The
criterion is evaluated after an equilibrium analysis.
6.3: Offset-load test
This criterion is most effectively evaluated by performing an equilibrium analysis with the
required offset loading condition
Sailing Boats:
7.2: Downflooding height
Minimum freeboard to downflooding points must be determined from Figure 2 (Section 6.2.2)
and entered into the required value field, the default value is set at 1.42m which is slightly
greater than the height required for a category A vessel of 24m in length.
7.5: Knockdown-recovery test
The test can be approximated by examining the angle of vanishing stability in the flooded
condition. If the flooded vessel has positive GZ at the knockdown angle, it should self right.
7.6.6: Wind stiffness test

Appendix F
Page 306
Determine the wind heeling moment as defined in 6.6.6 for the wind speed of interest (Table 6,
Section 6.6.7). Convert this to a heeling lever. Calculate the GZ curve with the crew seated to
windward, this criterion will then look at the angle of equilibrium of the vessel under the
applied wind heeling arm.
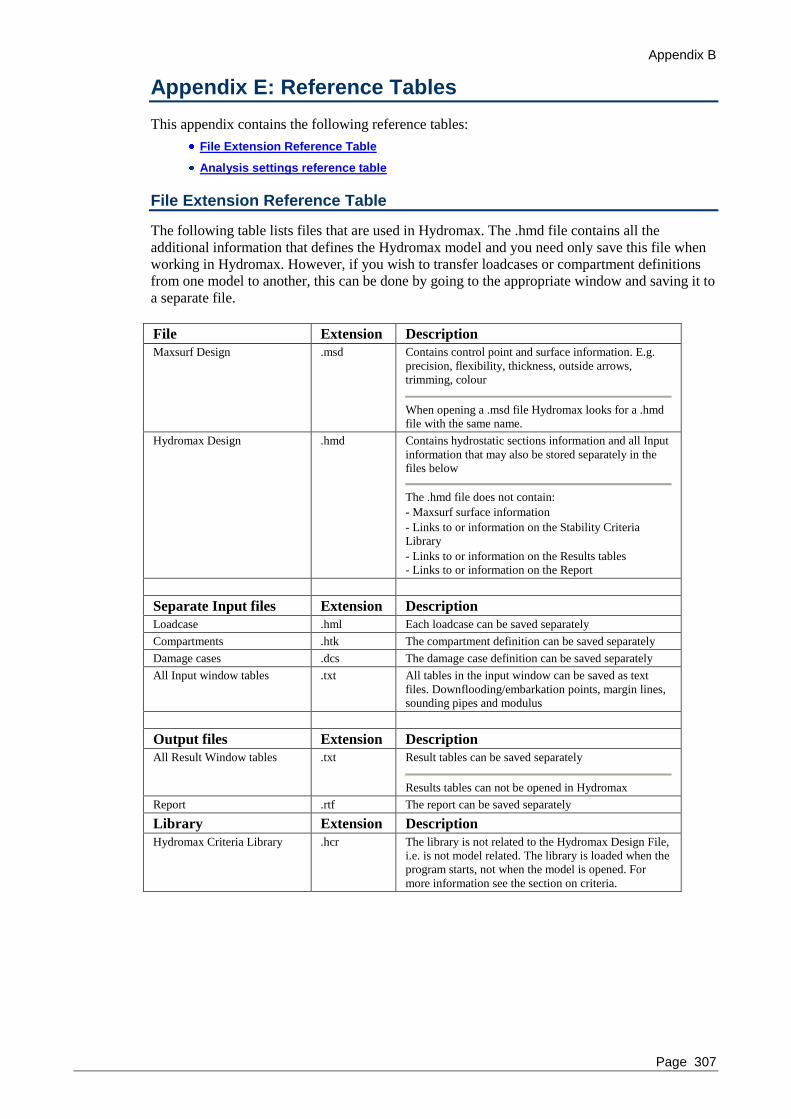
Appendix B
Page 307
Appendix E: Reference Tables
This appendix contains the following reference tables:
File Extension Reference Table
Analysis settings reference table
File Extension Reference Table
The following table lists files that are used in Hydromax. The .hmd file contains all the
additional information that defines the Hydromax model and you need only save this file when
working in Hydromax. However, if you wish to transfer loadcases or compartment definitions
from one model to another, this can be done by going to the appropriate window and saving it to
a separate file.
File Extension Description
Maxsurf Design .msd Contains control point and surface information. E.g.
precision, flexibility, thickness, outside arrows,
trimming, colour
When opening a .msd file Hydromax looks for a .hmd
file with the same name.
Hydromax Design .hmd Contains hydrostatic sections information and all Input
information that may also be stored separately in the
files below
The .hmd file does not contain:
- Maxsurf surface information
- Links to or information on the Stability Criteria
Library
- Links to or information on the Results tables
- Links to or information on the Report
Separate Input files Extension Description
Loadcase .hml Each loadcase can be saved separately
Compartments .htk The compartment definition can be saved separately
Damage cases .dcs The damage case definition can be saved separately
All Input window tables .txt All tables in the input window can be saved as text
files. Downflooding/embarkation points, margin lines,
sounding pipes and modulus
Output files Extension Description
All Result Window tables .txt Result tables can be saved separately
Results tables can not be opened in Hydromax
Report .rtf The report can be saved separately
Library Extension Description
Hydromax Criteria Library .hcr The library is not related to the Hydromax Design File,
i.e. is not model related. The library is loaded when the
program starts, not when the model is opened. For
more information see the section on criteria.
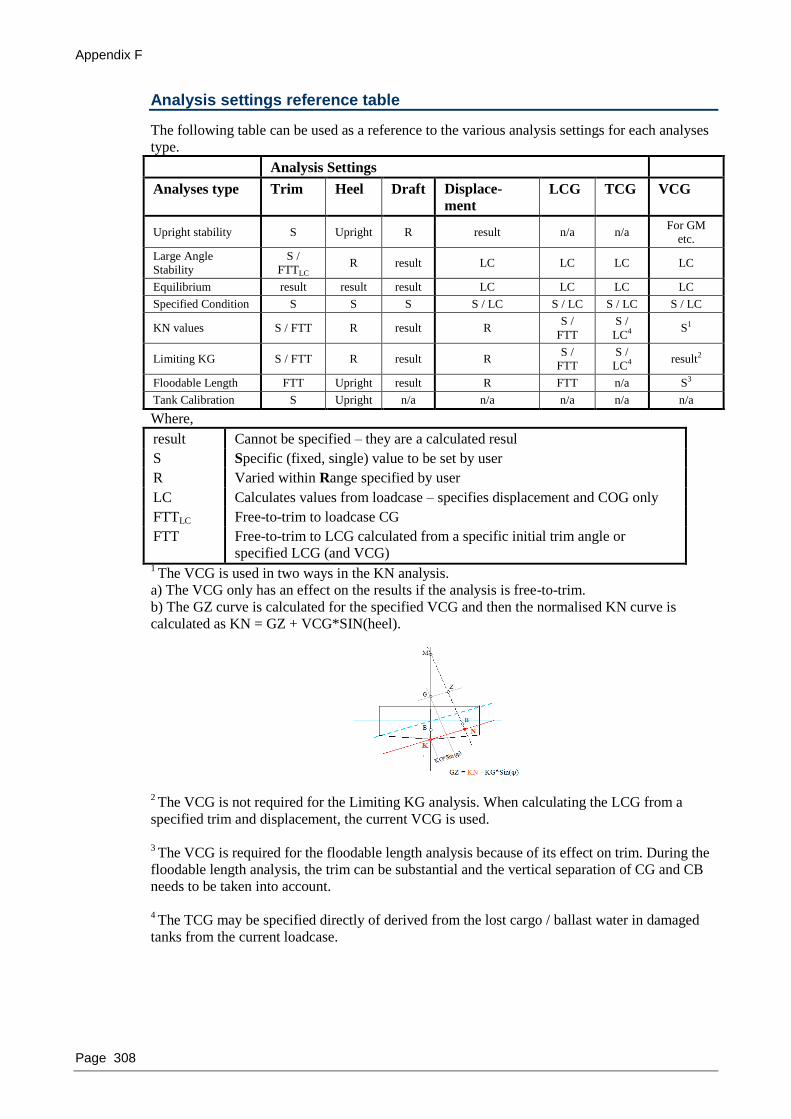
Appendix F
Page 308
Analysis settings reference table
The following table can be used as a reference to the various analysis settings for each analyses
type.
Analysis Settings
Analyses type Trim Heel Draft Displace-
ment
LCG TCG VCG
Upright stability S Upright R result n/a n/a For GM
etc.
Large Angle
Stability
S /
FTTLC R result LC LC LC LC
Equilibrium result result result LC LC LC LC
Specified Condition S S S S / LC S / LC S / LC S / LC
KN values S / FTT R result R S /
FTT
S /
LC4 S1
Limiting KG S / FTT R result R S /
FTT
S /
LC4 result2
Floodable Length FTT Upright result R FTT n/a S3
Tank Calibration S Upright n/a n/a n/a n/a n/a
Where,
result Cannot be specified – they are a calculated resul
S Specific (fixed, single) value to be set by user
R Varied within Range specified by user
LC Calculates values from loadcase – specifies displacement and COG only
FTTLC Free-to-trim to loadcase CG
FTT Free-to-trim to LCG calculated from a specific initial trim angle or
specified LCG (and VCG) 1 The VCG is used in two ways in the KN analysis.
a) The VCG only has an effect on the results if the analysis is free-to-trim.
b) The GZ curve is calculated for the specified VCG and then the normalised KN curve is
calculated as KN = GZ + VCG*SIN(heel).
2 The VCG is not required for the Limiting KG analysis. When calculating the LCG from a
specified trim and displacement, the current VCG is used.
3 The VCG is required for the floodable length analysis because of its effect on trim. During the
floodable length analysis, the trim can be substantial and the vertical separation of CG and CB
needs to be taken into account.
4 The TCG may be specified directly of derived from the lost cargo / ballast water in damaged
tanks from the current loadcase.

Appendix B
Page 309
Appendix F: Quality Assurance
This appendix describes the quality assurance processes used to ensure Hydromax gives reliable
and accurate results.
Quality Assurance
Many Hydromax users ask us how we know that Hydromax produces the correct results. This
following explains how Formation Design Systems has verified that Hydromax gives accurate
results and what steps we take to make sure that each version of the software we ship is as
reliable as possible.
Quality Principles
While it is impossible to ensure that any software product is completely free of bugs, we follow
a series of engineering and testing principles and procedures to ensure that Hydromax will
produce results which are consistent with the level of accuracy and thoroughness a professional
engineer applies to design work. To this end we follow a development and testing path which
includes use of structured programming techniques, verification of the underlying algorithms,
testing of the computer implementation of those algorithms, testing of real world problems in-
house and beta testing in the field at Hydromax user sites.
Structured Programming
The best defence against bugs in software is to use structured programming techniques that have
been proven to improve software reliability. Without going into the technical details of our
software development methodology, we summarize by saying that we utilize structured code,
object oriented design, data hiding and encapsulation and fault tolerant programming practices
to enhance our software's reliability. Hydromax is a complex software system of over 400,000
lines of code and we believe our history of reliability reflects the effort we have put into using
reliable coding practices.
Verification of Algorithms
When new design or analysis algorithms are introduced into Hydromax, we first carry out
testing on the algorithms on Reference Designs – these are proven test cases with known
analytical solutions, see Reference Calculations.
Reference Designs
A folder of reference hull shapes is included with Maxsurf and Hydromax. These designs are of
simple geometric shapes and can be used to validate calculations performed by Hydromax.
Below is a table of results derived analytically from these shapes compared with results
obtained from Maxsurf and Hydromax at different precisions.
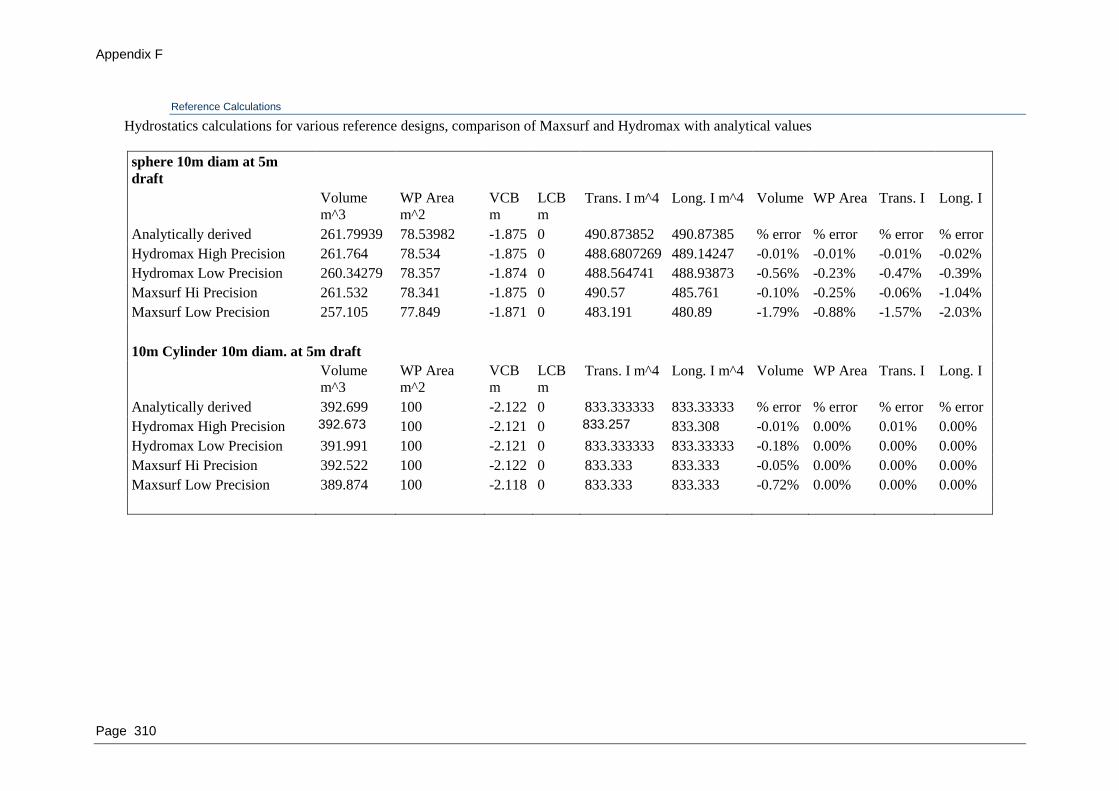
Appendix F
Page 310
Reference Calculations
Hydrostatics calculations for various reference designs, comparison of Maxsurf and Hydromax with analytical values
sphere 10m diam at 5m
draft
Volume
m^3
WP Area
m^2
VCB
m
LCB
m Trans. I m^4 Long. I m^4 Volume WP Area Trans. I Long. I
Analytically derived 261.79939 78.53982 -1.875 0 490.873852 490.87385 % error % error % error % error
Hydromax High Precision 261.764 78.534 -1.875 0 488.6807269 489.14247 -0.01% -0.01% -0.01% -0.02%
Hydromax Low Precision 260.34279 78.357 -1.874 0 488.564741 488.93873 -0.56% -0.23% -0.47% -0.39%
Maxsurf Hi Precision 261.532 78.341 -1.875 0 490.57 485.761 -0.10% -0.25% -0.06% -1.04%
Maxsurf Low Precision 257.105 77.849 -1.871 0 483.191 480.89 -1.79% -0.88% -1.57% -2.03%
10m Cylinder 10m diam. at 5m draft
Volume
m^3
WP Area
m^2
VCB
m
LCB
m Trans. I m^4 Long. I m^4 Volume WP Area Trans. I Long. I
Analytically derived 392.699 100 -2.122 0 833.333333 833.33333 % error % error % error % error
Hydromax High Precision 392.673 100 -2.121 0 833.257 833.308 -0.01% 0.00% 0.01% 0.00%
Hydromax Low Precision 391.991 100 -2.121 0 833.333333 833.33333 -0.18% 0.00% 0.00% 0.00%
Maxsurf Hi Precision 392.522 100 -2.122 0 833.333 833.333 -0.05% 0.00% 0.00% 0.00%
Maxsurf Low Precision 389.874 100 -2.118 0 833.333 833.333 -0.72% 0.00% 0.00% 0.00%
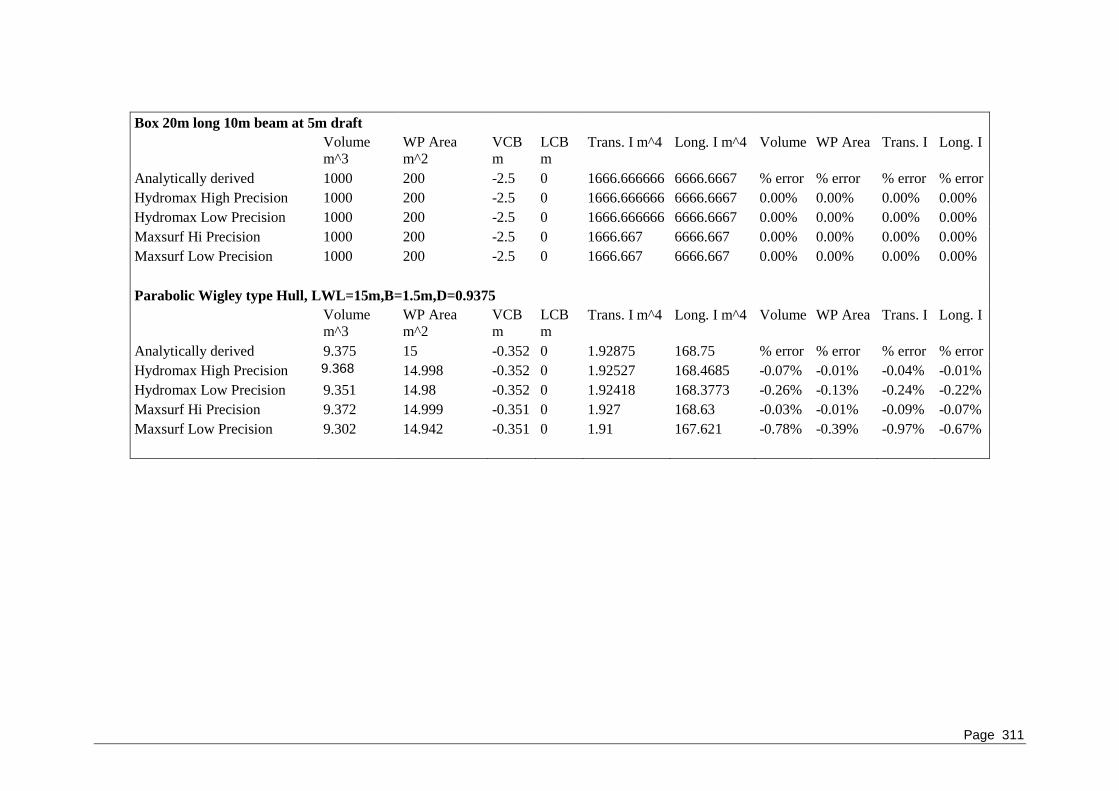
Page 311
Box 20m long 10m beam at 5m draft
Volume
m^3
WP Area
m^2
VCB
m
LCB
m Trans. I m^4 Long. I m^4 Volume WP Area Trans. I Long. I
Analytically derived 1000 200 -2.5 0 1666.666666 6666.6667 % error % error % error % error
Hydromax High Precision 1000 200 -2.5 0 1666.666666 6666.6667 0.00% 0.00% 0.00% 0.00%
Hydromax Low Precision 1000 200 -2.5 0 1666.666666 6666.6667 0.00% 0.00% 0.00% 0.00%
Maxsurf Hi Precision 1000 200 -2.5 0 1666.667 6666.667 0.00% 0.00% 0.00% 0.00%
Maxsurf Low Precision 1000 200 -2.5 0 1666.667 6666.667 0.00% 0.00% 0.00% 0.00%
Parabolic Wigley type Hull, LWL=15m,B=1.5m,D=0.9375
Volume
m^3
WP Area
m^2
VCB
m
LCB
m Trans. I m^4 Long. I m^4 Volume WP Area Trans. I Long. I
Analytically derived 9.375 15 -0.352 0 1.92875 168.75 % error % error % error % error
Hydromax High Precision 9.368 14.998 -0.352 0 1.92527 168.4685 -0.07% -0.01% -0.04% -0.01%
Hydromax Low Precision 9.351 14.98 -0.352 0 1.92418 168.3773 -0.26% -0.13% -0.24% -0.22%
Maxsurf Hi Precision 9.372 14.999 -0.351 0 1.927 168.63 -0.03% -0.01% -0.09% -0.07%
Maxsurf Low Precision 9.302 14.942 -0.351 0 1.91 167.621 -0.78% -0.39% -0.97% -0.67%

Appendix C
Page 312
Testing of Implementation
Once the basic algorithms have been proven correct, testing is then carried out on more complex
sample problems to which a solution has already been established using a proven analysis
program. These results may either come from Naval Architecture and Marine Engineering texts
such as well as from other results carried out by Formation Design Systems or other engineers
using other software products such as NAPA, AutoShip etc.
Testing of Upgrades
As each new version of Hydromax is released we perform a series of tests to ensure it functions
correctly. At each release the results from these tests are compared with the results from the
previous release to ensure conformance with answers which have been established as being
correct.
Beta Testing
Immediately prior to the release of each new version of Hydromax, we conduct a beta test of the
software. This involves sending the software to practicing engineers and having them use it on
design work in progress to determine its reliability for actual design use. These beta testers
provide us with feedback on the reliability and accuracy of the program as well as its useability
and suitability for everyday work. Once the beta test program is completed and all testers are
happy with the program, we begin shipping the commercial version.
Version Control
Each new version of Hydromax displays a version number indicating the version and the date
the software was first shipped. If the version is a development, alpha test or beta test release,
the version number may also include a letter and number suffix indicating the type and number
of the release. A development version is usually only for internal use and is a very early
demonstration of a possible new product or feature. It is highly experimental and not reliable.
An alpha release is a first public release of a program for initial testing and comment, it is not
reliable. A beta release is a final test version of the program released for field testing prior to
commercial release. It is mostly reliable but may contain some bugs. A commercial release is a
completed, debugged program reliable and ready for professional use.
For example
1.0d1 The first development release of version 1.0
1.5a2 The second alpha test release of version 1.5
1.6b2 The second beta test release of version 1.6
1.64 A commercial release of version 1.64
But we're not Perfect
We make every effort to ensure that our software will meet our users' needs and perform
accurately. However, as with all complex software systems, it is possible for errors to occur. If
you suspect a problem with Hydromax, please contact our technical support staff by email at
[email protected] and explain what you believe the problem to be. In the unlikely event of
a problem being found, we will correct it as soon as practicable, and send you a new corrected
version of the program.
To get accurate results from Hydromax, it is necessary for you to model the problem correctly
and to correctly interpret the results produced. It is the users' responsibility to correctly model
the structure and assume responsibility for the results.

Index
Page 313
Index
A
About Hydromax ....................................... 213
Activate GHS Export ................................. 202
Add Damage case ...................................... 204
Add Load ..................................................... 42
Add Surface Areas ..................................... 202
Allowable shears and moments ................... 77
Analysis
Menu ...................................................... 204
Output .................................................... 156
Settings ................................................... 309
Toolbar ................................................... 195
Analysis in waves ........................................ 90
Analysis type
Equilibrium .............................................. 88
Floodable Length ................................... 103
KN Values Analysis ................................. 93
Large Angle Stability ............................... 82
Limiting KG ............................................. 96
Longitudinal Strength ............................ 106
Specified Conditions ................................ 91
Tank Calibrations ................................... 108
Upright Hydrostatics ................................ 79
Animate ...................................................... 211
Arrange Icons ............................................. 212
Assembly View .......................................... 181
Automation Reference ............................... 213
B
Background ................................................ 210
Batch Analysis ........................................... 139
Beam .......................................................... 218
Beta Testing ............................................... 313
Block Coefficient ....................................... 221
Boundary Box .............................................. 52
Bulkheads ............................................. 78, 185
C
Calibration Increment .................................. 71
Cascade ...................................................... 212
Case
Menu ...................................................... 204
Cell Border ................................................. 201
Cell Shading ............................................... 201
Centre of buoyancy .................................... 181
Centre of flotation ...................................... 181
Centre of gravity ........................................ 181
Check for Updates ...................................... 213
Closing a Loadcase ...................................... 42
Coefficient parameters ............................... 216
Coefficients,
calculation of .......................................... 211
Hydrostatic ............................................... 36
Colour ........................................................ 203
Compartment Definition .......................51, 184
New .......................................................... 52
Saving .................................................... 161
Compartment types ...................................... 69
Compartments .......................................... 70
Linked ...................................................... 70
Linked Tanks ........................................... 70
Non-Buoyant Volumes ............................ 70
Tanks ........................................................ 70
Compartments,
add, delete ................................................ 52
Forming .................................................... 62
Convergence Error ..................................... 147
Coordinate system ........................................ 34
Copy ....................................................158, 200
Copying Graphs ......................................... 191
Copying Tables .......................................... 159
Corrected VCG .......................................... 150
Create cases from Zone Damage ............... 204
Creating a Compartment definition file ....... 52
Creating a new Loadcase File ...................... 39
Criteria ....................................................... 205
Criteria File Format.................................... 174
Criteria Libraries ........................................ 172
Criteria, Main
Import..................................................... 199
Save As .................................................. 200
Criteria, Prob Damage
Import..................................................... 200
Reset to defaults ..................................... 200
Save As .................................................. 200
Curve of Areas ............................................. 84
Curves of Form ............................................ 84
Cut .............................................................. 200
D
Damage .................................................72, 155
Damage Case
Add........................................................... 72
Delete ....................................................... 72
Display ..................................................... 73
Extent of damage ..................................... 74
Rename .................................................... 72
saving ..................................................... 161
Select ........................................................ 73
Damage Window ....................................... 183
Data Format ........................................185, 207

Index
Page 314
Data layout ................................................. 186
Data Menu .................................................. 211
Deactivate GHS Export .............................. 202
Delete Cells ................................................ 201
Delete Damage case ................................... 204
Delete DXF background ............................ 210
Density ............................................... 151, 205
Design Grid ................................................ 211
Design Grid Toolbar .......................... 195, 196
Design Preparation ....................................... 18
Design,
coherence ................................................. 20
Saving .................................................... 160
Displacement...................................... 146, 205
Display
Background ............................................ 210
Display Menu ............................................. 207
Downflooding Angles .................................. 87
Downflooding points ........................... 75, 185
Linking to tanks or compartments ........... 76
Draft .............................. 80, 145, 205, 219, 220
Draft marks ............................................ 18, 35
DWL ............................................................ 80
DXF export ................................................ 162
DXF, Export ............................................... 198
Dynamic Stability ........................................ 83
E
Edge Visibility Toolbar .............................. 196
Edit Damage case ....................................... 204
Edit Loadcase ............................................. 204
Edit Menu .................................................. 200
Edit Toolbar ............................................... 194
Edit,
Add ......................................................... 201
Delete ..................................................... 201
Move Items Down .................................. 202
Move Items Up ...................................... 202
Sort Items ............................................... 201
Emergence Angles ....................................... 87
Equilibrium .............................................. 9, 88
Equilibrium Condition ................................... 9
Export ......................................................... 198
Export Bitmap ............................................ 199
Exporting ................................................... 161
Extent of Damage ...................................... 204
External Tanks ............................................. 56
Extra Buttons Toolbar ................................ 196
F
File Extension Table .................................. 308
File Menu ................................................... 197
File Toolbar ................................................ 194
File,
Close ...................................................... 197
Exit ......................................................... 200
Hydromax Version 8.0 ........................... 162
New ........................................................ 197
Open ..................................................21, 197
Save ........................................................ 197
Save As .................................................. 197
Fill Down ................................................... 201
Floodable Length ......................................... 12
Floodable Length Criteria dialog ............... 205
Flooding ....................................................... 73
Fluid analysis method ................................ 149
Fluid VCG .............................................51, 151
Fluids ......................................................... 205
Font ............................................................ 203
Form parameters ........................................ 214
Frame of Reference .........................18, 35, 211
Fredyn ........................................................ 199
Free Surface Moment ............................51, 150
Freeboard ..................................................... 89
Full Screen ................................................. 204
G
GHS, Export ............................................... 198
GHS, Import ............................................... 198
Graph ......................................................... 212
Curve of Areas ....................................... 189
Curves of Form ...................................... 189
Data interpolation................................... 189
double click ............................................ 190
get data ................................................... 190
Righting Lever (GZ) .............................. 189
Type ....................................................... 189
Graph colours ............................................. 190
Graph Formatting ....................................... 190
Graph Printing to Scale .............................. 159
Graph Window ........................................... 188
Graphs ........................................................ 189
Grid ............................................................ 210
Grounding ...........................................154, 206
GZ .................................................................. 8
H
Heel .....................................................142, 205
Heeling Moments ....................................... 240
Help Menu ................................................. 212
Hide DXF ................................................... 210
Home View .........................................181, 202
Horizontal lever ........................................... 43
Hull Sections
Recalculate ............................................. 206
Hydromax v8.0 file, Export ....................... 198
Index
Page 315
I
IGES, Export .............................................. 198
Immersed depth .................................... 35, 220
Immersion .................................................. 223
Immersion Angles ........................................ 87
Import ......................................................... 197
Import DXF Background ........................... 198
Import Image Background ......................... 198
Individual Loadcase ................................... 210
Initial Conditions ......................................... 34
Input ........................................................... 212
Input Tables, saving ................................... 161
Input Window ............................................ 184
Insert New Table ........................................ 201
Insert Row .................................................. 201
Installing Hydromax .................................... 16
ISO 12217-1 ............................................... 303
K
Key points ............................................ 75, 185
adding ....................................................... 75
Data .......................................................... 87
deleting ..................................................... 76
editing ...................................................... 76
Results .................................................... 186
KN Values .............................................. 10, 93
L
Large Angle Stability ......................... 8, 82, 84
lateral projected area .................................. 240
LCB, LCG .................................................. 222
Length ........................................................ 217
Libraries ..................................................... 172
Limiting KG ........................................... 11, 96
Linked negative compartments .................... 58
Loadcase .............................................. 38, 212
Adding and Deleting loads ....................... 42
Distributed loads ...................................... 45
Editing loads ............................................ 42
Free surface correction ............................. 51
maximum number .................................... 42
Renaming ................................................. 41
saving ..................................................... 161
Update ...................................................... 47
Loadcase Colour Formatting ........................ 44
Loadcase Formatting .................................... 43
Blank lines ............................................... 43
Grouping tanks ......................................... 44
Headings lines .......................................... 43
Totals ....................................................... 44
Loadcase Sorting .......................................... 43
Loadcase Template ...................................... 40
Loadcase Window ...................................... 183
Loadcase, cross referencing ......................... 47
Loadcase, density ......................................... 49
Loadcase, Distributed Loads ........................ 45
Loadcase, formatting, column selection ...... 44
Loadcase, max. number ............................. 204
Loadcase, Tank loads ................................... 46
Loadgroup ...............................................38, 47
Loadgroup, Workshop structure .................. 51
Loading a Saved Loadcase ........................... 41
Longitudinal Strength ...........................13, 106
M
Margin Line points ................................77, 185
Margin Line, Snap to hull .......................... 206
MARPOL ..................................................... 14
MARPOL oil outflow ................................ 113
Max. Area Section ..................................... 220
Maximum deck inclination ........................ 223
Maximum shears and moments ................... 77
Measurement reference frames .................. 214
Menus......................................................... 197
MEPC.117(52) Reg.23............................... 113
MEPC.141(54) Reg.12A ............................ 113
Merge Cells ................................................ 201
Midship Section ......................................... 220
Modulus points .......................................... 185
Modulus Window ........................................ 77
Moment to trim .......................................... 223
MSC.19(58) ............................................... 116
MSC.216(82) ............................................. 116
N
Non-Buoyant Volume Definition ................ 51
nuShallo, Import ........................................ 198
O
Online Support ........................................... 213
Outside arrows ............................................. 20
overlap ......................................................... 59
P
Page Setup .................................................. 200
Pan ......................................................181, 202
Paste ........................................................... 201
Permeability ............................ 13, 58, 146, 205
Perspective view ........................................ 182
Precision, surface ......................................... 22
Preferences ............................................16, 202
Print ............................................................ 200
Print Preview .............................................. 159
Printing ....................................................... 159
Printing to scale ......................................... 159
Prismatic Coefficient ................................. 221
Prob damage zones .................................... 209

Index
Page 316
Probabilistic Damage ........................... 15, 116
Probabilistic Damage – Analysis ............... 136
Probabilistic Damage – Inputs ................... 119
Probabilistic Damage – log file .................. 117
Probabilistic Damage – Principles ............. 116
Probabilistic Damage – Saving input
parameters .............................................. 119
Properties ................................................... 203
Property Sheet ............................................ 181
Q
Quality Assurance ...................................... 310
Quality Principles....................................... 310
R
Ratio of equilibrium angles – GZ area derived
heeling arm............................................. 289
Reference Calculations .............................. 311
Reference Designs ..................................... 310
Relative Density ................................... 60, 151
Render ........................................................ 211
Render Transparent .................................... 211
Report Toolbar ........................................... 196
Report Window .......................................... 191
Keystrokes.............................................. 193
Reporting ................................................... 156
Results ........................................................ 212
Results Window ......................................... 185
Results, saving ........................................... 161
Resume Analysis ................................ 138, 206
Righting Moment ....................................... 224
Rotate ......................................................... 202
Row Positioning ......................................... 201
S
Safe steady heeling angles ........................... 84
Save ............................................................ 161
Saving Densities......................................... 152
Section Area Coefficient ............................ 221
Section, show single ................................... 210
Sectional Area Curve ................................... 31
Sections, Forming ........................................ 27
Select All .................................................... 201
Select View from Data ....................... 160, 209
Set Analysis Type ...................................... 206
Set Home View .......................................... 202
Set Vessel to DWL ..................................... 209
Shift Key ...................................................... 16
Show DXF ................................................. 210
Show Grid .................................................. 201
Show single hull section .............................. 30
Shrink ................................................. 181, 202
Simulate fluid movement ........................... 151
Skin Thickness ............................................. 19
Sounding Pipes .....................................70, 184
Calibration Increment .............................. 71
Edit ........................................................... 70
Specific Gravity ....................................60, 151
Specified Condition ........................10, 91, 205
Specified Conditions, dialog ...................... 146
Split Cell .................................................... 201
Spool to Report .......................................... 207
Stability booklet ......................................... 150
Stability criteria ............................................ 78
Stability Criteria Results ............................ 187
Stability criteria, angle calculators ............. 228
Stability criteria, Angle of deck edge
immersion .............................................. 250
Stability criteria, Angle of downflooding .. 249
Stability criteria, Angle of equilibrium ...... 248
Stability criteria, Angle of equilibrium -
general heeling arm .........................269, 270
Stability criteria, Angle of equilibrium - GZ
derived wind heeling arm ....................... 288
Stability criteria, Angle of equilibrium - high-
speed turn heeling arm ........................... 293
Stability criteria, Angle of equilibrium -
multiple heeling arms ............................. 277
Stability criteria, Angle of equilibrium -
passenger crowding heeling arm ............ 292
Stability criteria, Angle of margin line
immersion .............................................. 249
Stability criteria, Angle of maximum GZ .. 248
Stability criteria, Angle of maximum GZ
above heeling arm .................................. 268
Stability criteria, Angle of vanishing stability
............................................................... 250
Stability criteria, Angle of vanishing stability -
general heeling arm ................................ 270
Stability criteria, Areas and levers ............. 240
Stability criteria, capsizing moment........... 296
Stability criteria, check boxes .................... 171
Stability criteria, Combined criteria (ratio of
areas type 1) - general cos+sin heeling arm
............................................................... 293
Stability criteria, Combined criteria (ratio of
areas type 1) - general heeling arm ........ 282
Stability criteria, Combined criteria (ratio of
areas type 1) - high-speed turn ............... 293
Stability criteria, Combined criteria (ratio of
areas type 1) - lifting weight .................. 294
Stability criteria, Combined criteria (ratio of
areas type 1) - passenger crowding ........ 293
Stability criteria, Combined criteria (ratio of
areas type 1) - towing ............................. 294
Stability criteria, Combined criteria (ratio of
areas type 2) - general wind heeling arm 283

Index
Page 317
Stability criteria, Combined criteria (ratio of
areas type 2) - wind heeling arm ............ 294
Stability criteria, Combined criteria (ratio of
areas type 2a) - general heeling arm ...... 285
Stability criteria, copying criteria............... 170
Stability criteria, criteria library file .......... 172
Stability criteria, damage and intact settings
............................................................... 172
Stability criteria, defining custom criteria .. 170
Stability criteria, equilibrium ..................... 242
Stability criteria, General cos+sin heeling arm
............................................................... 234
Stability criteria, General heeling arm ....... 233
Stability criteria, glossary .......................... 179
Stability criteria, GM calculators ............... 229
Stability criteria, Gust ratio ........................ 233
Stability criteria, GZ area between limits type
1 - general heeling arm .......................... 271
Stability criteria, GZ area between limits type
1 - multiple heeling arms ....................... 278
Stability criteria, GZ area between limits type
1 - standard ............................................. 250
Stability criteria, GZ area between limits type
2 - general heeling arm .......................... 272
Stability criteria, GZ area between limits type
2 - multiple heeling arms ....................... 278
Stability criteria, GZ area between limits type
2- HSC monohull type ........................... 251
Stability criteria, GZ area between limits type
3 - HSC multihull type ........................... 253
Stability criteria, GZ area derived heeling arm
type 1 ...................................................... 287
Stability criteria, GZ area derived heeling arm
type 2 ...................................................... 288
Stability criteria, GZ curve features ........... 176
Stability criteria, GZ definitions ................ 178
Stability criteria, GZ derived heeling arm . 286
Stability criteria, GZ, non-healing arm ...... 244
Stability criteria, heeling arm definition .... 232
Stability criteria, heeling arm dependency on
displacement .......................................... 240
Stability criteria, heeling arm units ............ 298
Stability criteria, Heeling due to arbitrary
forces ...................................................... 239
Stability criteria, Heeling due to bollard-pull
............................................................... 238
Stability criteria, Heeling due to grain shift 239
Stability criteria, Heeling due to lifting of
weights ................................................... 237
Stability criteria, Heeling due to passenger
crowding ................................................ 235
Stability criteria, Heeling due to towing .... 238
Stability criteria, Heeling due to trawling .. 239
Stability criteria, Heeling due to turning .... 236
Stability criteria, Heeling due to wind ....... 235
Stability criteria, IMO Code on Intact Stability
A.749(18) ............................................... 298
Stability criteria, IMO HSC Code MSC.36(63
............................................................... 300
Stability criteria, IMO roll back angle
calculator ................................................ 229
Stability criteria, importing .................172, 173
Stability criteria, ISO 12217 ...................... 305
Stability criteria, list ................................... 163
Stability criteria, Maximum Freeboard at
equilibrium ............................................. 243
Stability criteria, Maximum ratio of GZ to
heeling arm ............................................ 266
Stability criteria, Maximum value of heel,
pitch or slope at equilibrium .................. 242
Stability criteria, Minimum Freeboard at
equilibrium ............................................. 243
Stability criteria, minimum GM calculator –
Constant ..........................................231, 262
Stability criteria, minimum GM calculator –
Constant with freeboard ..................231, 263
Stability criteria, minimum GM calculator –
Grain ...............................................229, 261
Stability criteria, minimum GM calculator –
Wind pressure .................................230, 262
Stability criteria, Minimum ratio of GZ to
heeling arm ............................................ 268
Stability criteria, moving criteria ............... 170
Stability criteria, Other criteria - STIX ...... 291
Stability criteria, parent criteria ..........165, 242
Stability criteria, pass/fail test .................... 172
Stability criteria, Range of positive stability
............................................................... 250
Stability criteria, Range of positive stability -
general heeling arm ................................ 270
Stability criteria, Ratio of areas type 1 -
general cos+sin heeling arm ................... 293
Stability criteria, Ratio of areas type 1 -
general heeling arm ................................ 273
Stability criteria, Ratio of areas type 1 -
multiple heeling arms ............................. 279
Stability criteria, Ratio of areas type 2 -
general heeling arm ................................ 274
Stability criteria, Ratio of areas type 3 -
general heeling arm ................................ 275
Stability criteria, Ratio of GMT and heeling
arm ......................................................... 264
Stability criteria, Ratio of GZ area between
limits ...................................................... 255
Stability criteria, Ratio of GZ values at phi1
and phi2 .................................................. 247

Index
Page 318
Stability criteria, Ratio of GZ values at phi1
and phi2 - general heeling arm ............... 268
Stability criteria, Ratio of GZ values at phi1
and phi2 - multiple heeling arms............ 276
Stability criteria, Ratio of positive to negative
GZ area between limits .......................... 257
Stability criteria, report and batch processing
............................................................... 176
Stability criteria, results ............................. 174
Stability criteria, saving ............................. 173
Stability criteria, selecting for analysis ...... 170
Stability criteria, Subdivision Index s-factor -
MSC 19(58 ............................................. 260
Stability criteria, Survivability Index -
MSC_216(82) ........................................ 280
Stability criteria, tree list ............................ 169
Stability criteria, User Defined Heeling Arm
............................................................... 234
Stability criteria, USL code ........................ 302
Stability criteria, Value of GMt at ............. 244
Stability criteria, Value of GMt at equilibrium
- general heeling arm ............................. 264
Stability criteria, Value of GMt or GMl at
equilibrium ............................................. 243
Stability criteria, Value of GZ at ................ 244
Stability criteria, Value of GZ at equilibrium -
general heeling arm ................................ 264
Stability criteria, Value of GZ at specified
angle or maximum GZ below specified
angle ....................................................... 245
Stability criteria, Value of maximum GZ .. 244
Stability criteria, Value of maximum GZ
above heeling arm .................................. 265
Stability criteria, Value of RM at specified
angle or maximum RM below specified
angle ....................................................... 246
Start Analysis ..................................... 138, 206
Start Batch Analysis ................................... 207
Starting Hydromax ....................................... 16
Status Bar ................................................... 203
Stop Analysis ..................................... 138, 207
Streaming results to Word ......................... 156
Surface Use .................................................. 19
T
Table .......................................................... 201
Tank
adding, deleting ........................................ 52
Fluids ....................................................... 60
Ordering ................................................... 61
Permeability ....................................... 58, 60
Saving .................................................... 161
Surface Thickness .................................... 61
Visibility .................................................. 61
Tank Calibrations ..................................13, 108
Tank Type
external ..................................................... 56
linked ....................................................... 54
simple ....................................................... 52
tapered ...................................................... 53
tanks
overlap ..................................................... 59
Tanks
Recalculate ............................................. 206
Tanks within Compartments ........................ 58
Tanks,
boundary surfaces .................................... 54
complex .................................................... 54
Non-Buoyant Areas ................................. 56
Recalculate ............................................. 195
TCG, Limiting KG, KN ............................. 145
Tile Horizontal ........................................... 212
Tile Vertical ............................................... 212
Tolerances .................................................. 147
Toolbars ..............................................194, 203
Trapezoidal integration ................................ 27
Trim ....................................................143, 205
Fixed ...................................................... 144
Free-to-trim to a specified LCG value ... 145
Free-to-trim using a specified initial trim
value ................................................... 145
Trim angle .................................................. 223
Trimmed surfaces, checking ........................ 20
U
Undo........................................................... 200
Units ......................................................37, 211
Update Loadcase ........................................ 206
Upright Hydrostatics .................................7, 79
V
Validate Hydromax model ........................... 30
VCG for trim balance................................. 145
View (extended)Toolbar ............................ 196
View Direction ........................................... 212
View Menu ................................................ 202
View Toolbar ............................................. 194
View Window ............................................ 181
Visibility .................................................... 209
Visibility Toolbar ................................195, 196
W
Waterplane Area Coefficient ..................... 222
Wave definition .......................................... 153
Wave height ............................................... 154
Waveform .................................................. 205
sinusoidal ............................................... 153
trochoidal ............................................... 153

Index
Page 319
Wavelength ................................................ 154
Wetted surface area, integration of ............ 224
Window Menu ........................................... 212
Window Toolbar ........................................ 195
Windows Registry ........................................ 16
Word, report streaming to .......................... 156
Word, report templates ............................... 157
Z
Zero Point ........................................ 18, 35, 43
Zoom .................................................. 181, 202


