Haemodynamics and Biochemistry of a Hypertensive ... and Biochemistry of a Hypertensive Response to...
191
Haemodynamics and Biochemistry of a Hypertensive Response to Exercise By Sonja B. Nikolic BMedRes (Hons), BPharm A thesis submitted in fulfilment of the degree of Doctor of Philosophy November 2014 Menzies Institute for Medical Research University of Tasmania Hobart, Tasmania, Australia
Transcript of Haemodynamics and Biochemistry of a Hypertensive ... and Biochemistry of a Hypertensive Response to...
Haemodynamics and Biochemistry of a Hypertensive
Response to Exercise
By
Sonja B. Nikolic
BMedRes (Hons), BPharm
A thesis submitted in fulfilment of the degree of Doctor of Philosophy
November 2014
Menzies Institute for Medical Research
University of Tasmania
Hobart, Tasmania, Australia

i
Statements and Declarations
Declaration of Originality
This thesis contains no material which has been accepted for a degree or diploma by the
University of Tasmania or any other institution, except by way of background information
and of which is duly acknowledged in the thesis. To the best of my knowledge and belief, this
thesis contains no material previously published or written by another person except where
due acknowledgement is made in the text of the thesis, nor does the thesis contain any
material that infringes copyright. I have also acknowledged, where appropriate, the specific
contributions made by co-authors of published and submitted manuscripts.
Authority of Access
The publishers of the manuscripts comprising Chapter 2 (Review of Literature – Part II),
Chapter 5 and Appendix 1 hold the copyright for that content, and access to the material
should be sought from the respective journals. The remaining non-published content of the
thesis may be made available for loan and limited copying and communication in accordance
with the Copyright Act 1968.
Statement of Ethical Conduct
All research associated with this thesis abides by the International and Australian codes on
human and animal experimentation, and full ethical approval from the relevant institutions
was obtained for all studies outlined in this thesis. All individual participants provided written
informed consent for involvement in the respective research studies.
_____________________
Sonja B. Nikolic
November 2014

ii
Publications by the Author and Statement of Co-Author
Contributions to Papers Contained Within This Thesis
The following papers are incorporated into Chapters of this thesis and were either published
or submitted for publication in peer reviewed scientific journals during the course of
candidature.
Chapter 2 – Review of Literature – Part II
Nikolic SB, Sharman JE, Adams MJ, Edwards LM. Metabolomics in hypertension.
J Hypertens. 2014; 32:1159-1169
Author contributions:
Nikolic B. Sonja Conception and design, literature review, manuscript preparation
Sharman E. James Conception and design, critical manuscript revision
Adams J. Murray Critical manuscript revision
Edwards M. Lindsay Conception and design, critical manuscript revision
Chapter 4
Nikolic SB, Adams MJ, Otahal P, Edwards LM, Sharman JE. Association of von Willebrand
factor blood levels with exercise hypertension – Submitted to European Journal of Applied
Physiology, July 2014
Author contributions:
Nikolic B. Sonja Conception and design, data collection, data analysis and
interpretation, manuscript preparation
Adams J. Murray Study conception and design, data interpretation, critical
manuscript revision
Otahal Peter Data analysis, critical manuscript revision
Edwards M. Lindsay Critical manuscript revision
Sharman E. James Study conception and design, data interpretation, critical
manuscript revision
Chapter 5
Nikolic SB, Wilson R, Hare JL, Adams MJ, Edwards LM, Sharman JE. Spironolactone
reduces aortic stiffness via blood pressure-dependent effects of canrenoate. Metabolomics.
2014, 10:105-113
Author contributions:
gcoleman
Typewritten Text

iii
Nikolic B. Sonja Conception and design, data collection, data analysis and
interpretation, manuscript preparation
Wilson Richard Data collection, critical manuscript revision
Hare L. James Data collection, critical manuscript revision
Adams J. Murray Critical manuscript revision
Edwards M. Lindsay Study conception and design, data interpretation, critical
manuscript revision
Sharman E. James Study conception and design, data collection, data interpretation,
critical manuscript revision
Chapter 6
Nikolic SB, Edwards LM, Karpievitch YV, Wilson R, Horne J, Adams MJ, Sharman JE.
Serum metabolic profile predicts adverse central haemodynamics in patients with type 2
diabetes mellitus – Submitted to Metabolomics, August 2014
Author contributions:
Nikolic B. Sonja Study conception and design, data collection, data analysis and
interpretation, manuscript preparation
Edwards M. Lindsay Study conception and design, data interpretation, critical
manuscript revision
Karpievitch V. Yuliya Data analysis, critical manuscript revision
Wilson Richard Data collection, critical manuscript revision
Horne James Data collection, critical manuscript revision
Adams J. Murray Critical manuscript revision
Sharman E. James Study conception and design, data interpretation, critical
manuscript revision
Appendix 1
Nikolic SB, Abhayaratna WP, Leano R, Stowasser M, Sharman JE. Waiting a few extra
minutes before measuring blood pressure has potentially important clinical and research
ramifications. Journal of Human Hypertension. 2014 Jan; 28(1):56-61
Author contributions:
Nikolic B. Sonja Study conception and design, data collection, data analysis and
interpretation, manuscript preparation
Abhayaratna P. Walter Critical manuscript revision
Leano Rodel Data collection, critical manuscript revision
Michael Stowasser Critical manuscript revision
Sharman E. James Study conception and design, data interpretation, critical
manuscript revision

iv
Appendix 2
Karpievitch YV, Nikolic SB, Wilson R, Sharman JE, Edwards LM: Metabolomics data
normalisation with EigenMS. Submitted to PLoS ONE, July 2014
Author contributions:
Karpievitch V. Yuliya Study conception and design, data analysis and interpretation,
manuscript preparation
Nikolic B. Sonja Study conception and design, data collection, critical manuscript
revision
Wilson Richard Data collection, critical manuscript revision
Sharman E. James Critical manuscript revision
Edwards M. Lindsay Study conception and design, data interpretation, critical
manuscript revision
We, the undersigned agree with the above stated contributions for each of the above
published (or submitted) peer-reviewed manuscripts contained within this thesis:
________________________________
Associate Professor James E. Sharman
Primary candidate supervisor
Menzies Institute for Medical Research
University of Tasmania
_________________________________
Professor Thomas H. Marwick
Director
Menzies Institute for Medical Research
University of Tasmania
v
Abstracts and Presentations at Scientific Conferences that Relate
to This Thesis
The following abstracts relate specifically to this thesis and were presented at national and/or
international scientific conferences during the period of candidature.
Nikolic SB, Wilson R, Hare JL, Adams MJ, Edwards LM, Sharman JE. Spironolactone
reduces aortic stiffness in people with a hypertensive response to exercise via the blood
pressure-dependent effects of canrenoate. ARTERY 12 (Association for Research into
Arterial Structure and Physiology). Young Investigator Oral presentation - student
finalist. Vienna, Austria. October 2012
Nikolic SB, Wilson R, Hare JL, Adams MJ, Edwards LM, Sharman JE. Effects of
downstream drug metabolites of spironolactone on aortic stiffness and ambulatory blood
pressure. The 2nd
ISH New Investigators Symposium. Oral presentation. Sydney, Australia.
September 2012
Nikolic SB, Abhayaratna WP, Leano R, Stowasser M, Sharman JE. Waiting a few extra
minutes before measuring central blood pressure has potentially important clinical and
research ramifications. High Blood Pressure Research Council of Australia (HBPRCA)
annual scientific meeting. Oral presentation - student finalist. Perth, Australia. December
2011
Nikolic SB, Otahal P, Adams MJ, Edwards LM, Sharman JE. Exercise systemic vascular
resistance and raised triglycerides independently predict a hypertensive response to exercise.
HBPRCA (High Blood Pressure Research Council of Australia) annual scientific meeting.
Early Career Moderated Poster presentation. Melbourne, Australia. December 2013
Nikolic SB, Edwards LM, Karpievitch YV, Wilson R, Horne J, Adams MJ, Sharman JE.
Serum metabolic profile predicts adverse central haemodynamics in patients with type 2
diabetes mellitus. Joint meeting ESH-ISH, Hypertension. Poster presentation. Athens,
Greece, June 2014

vi
Nikolic SB, Otahal P, Adams MJ, Edwards LM, Sharman JE. Increased systemic vascular
resistance during moderate exercise independently predicts a hypertensive response to
exercise. ARTERY 13 (Association for Research into Arterial Structure and Physiology).
Poster presentation. London, UK. October 2013
Nikolic SB, Wilson R, Hare JL, Adams MJ, Edwards LM, Sharman JE. Effects of
downstream drug metabolites of spironolactone on aortic stiffness and ambulatory blood
pressure. Omics Australasia Symposium. Poster presentation. Perth, Australia. December
2012
Nikolic SB, Wilson R, Hare JL, Adams MJ, Edwards LM, Sharman JE. Effects of
downstream drug metabolites of spironolactone on aortic stiffness and ambulatory blood
pressure. ISH 2012 - 24th
Scientific Meeting of the International Society of Hypertension.
Poster presentation. Sydney, Australia. October 2012
Nikolic SB, Wilson R, Hare JL, Adams MJ, Edwards LM, Sharman JE. Effects of
downstream drug metabolites of spironolactone on aortic stiffness and ambulatory blood
pressure. Central Haemodynamics Satellite Meeting: The 4th
Pulse of Asia. Poster
presentation. Sydney, Australia. October 2012
Nikolic SB, Abhayaratna WP, Leano R, Stowasser M, Sharman JE. Waiting a few extra
minutes before measuring central blood pressure potentially has important clinical and
research ramifications. ARTERY 11 (Association for Research into Arterial Structure and
Physiology). Poster presentation. Paris, France. October 2011
Nikolic SB, Abhayaratna WP, Leano R, Stowasser M, Sharman JE. Waiting a few extra
minutes before measuring central blood pressure potentially has important clinical and
research ramifications. Sharing Excellence in Research Conference (UTAS Graduate
Research). Poster presentation. Hobart, Australia. August 2011

vii
Abstract
A hypertensive response to exercise (HRE) at moderate intensity is associated with an
increased cardiovascular (CV) risk, irrespective of a normal resting BP. This is an important
observation, as moderate intensity exercise blood pressure (BP) is akin to the condition
experienced during normal daily life activities and may better represent a chronic BP load
that people experience on a daily basis when compared to resting office BP. However, the
pathophysiological mechanisms of an HRE are unclear. Therefore, the overall aim of this
thesis was to explore the haemodynamic and biochemical (haemostatic and metabolic)
correlates of an HRE.
In study 1 (Chapter 4), haemodynamic and haemostatic factors were examined in 64
participants (aged 57 ± 10 years, 71% male) with a clinical indication for exercise stress
testing. This study showed for the first time that people with an HRE have higher blood
levels of the von Willebrand factor (vWf; a haemostatic marker of endothelial dysfunction),
as well as a significantly different response of vWf to exercise compared to people with
normal exercise BP. Moreover, vWf was associated with moderate intensity exercise systolic
BP, independent of resting office BP and other CV risk factors, whereas haemodynamic
factors (including increased aortic stiffness) were not independently related to exercise
systolic BP. This study suggests that haemostatic abnormalities reflecting endothelial
dysfunction, rather than haemodynamic irregularities, may contribute to an HRE at moderate
intensity.
In study 2 (Chapter 5), retrospective metabolomics analysis of data collected in a clinical trial
of people with an HRE was conducted in 115 participants (aged 55 ± 1 years, 58% male) in
order to develop a metabolomics technique, as well as to investigate the underlying
mechanisms of spironolactone’s action on exercise BP and other haemodynamics. This study
showed that spironolactone reduced exercise BP, as well as aortic stiffness, via BP-dependent
effects of canrenoate, a downstream drug metabolite of spironolactone. Importantly, this
study also showed that a reduction in exercise BP was not associated with the decrease in
aortic stiffness, giving further support that aortic stiffness may not be as relevant to an HRE
as is widely believed.

viii
In study 3 (Chapter 6), untargeted metabolomics analysis was used to explore possible
metabolic factors related to an HRE in 39 participants with type 2 diabetes mellitus (T2DM;
62 ± 9 years; 51% male; a population with the high prevalence of an HRE) compared with 39
non-diabetic controls (52 ± 10 years; 46% male). Metabolomics analysis demonstrated that a
metabolic pattern of disordered carbohydrate metabolism in T2DM may be a possible
metabolic mechanism explaining central (but not peripheral) exercise hypertension. These
findings have clinical relevance as central haemodynamics have shown a greater
pathophysiological importance when compared with peripheral haemodynamics. Also,
inosine levels (a metabolite with anti-inflammatory actions) were found to be decreased in
people with T2DM and were also inversely associated with the peripheral moderate intensity
exercise systolic BP. This indicates that inflammation may be a contributing factor to an HRE
in people with T2DM.
This research program also involved publication of a review article on the application of
metabolomics analysis in hypertension research (Journal of Hypertension, 2014; Chapter 2-
Review of Literature – Part II), which will allow especially the non-experts in this field to
better understand and interpret studies utilising metabolomics techniques. Importantly, the
research program contained in this thesis demonstrates how metabolomics analysis could be
used for exploring new insights into the underlying pathophysiological processes associated
with high BP (which could be easily applied to different disease conditions). Also, the
research projects included the development of methodology regarding metabolomics analysis
(manuscript in submission - Appendix 2), as well as the development of a protocol for resting
BP measurements (Journal of Human Hypertension, 2014; Appendix 1).
Overall, the work contained in this thesis has found that people with an HRE have abnormal
haemodynamics, but these do not explain exercise hypertension. However, people with an
HRE have abnormal blood biochemistry (haemostasis and metabolic markers related to
carbohydrate metabolism and inflammation in T2DM) and these explain exercise
hypertension independent of resting BP and other CV risk factors. Taken altogether, this
thesis provides novel information, and represents a significant advancement to the
understanding of the pathophysiology of an HRE at moderate intensity.

ix
Dedication
This thesis is dedicated to my husband Dusan Nikolic, for his love, endless support and
eternal patience.

x
Acknowledgements
I feel particularly honoured to have been able to work with many world-class academics and
clinicians during the course of this research project. I owe gratitude to many people for their
contribution and support over the past three and a half years, and would like to specifically
thank the following.
Associate Professor James Sharman, my primary supervisor, for giving me the opportunity to
undertake this research project, for providing a constant source of scientific inspiration, and
for many hours of guidance, support and patience along the way. Dr Murray Adams, for
teaching me laboratory techniques related to haemostasis and for a great deal of support.
Also, I would like to thank to Dr Lindsay Edwards for teaching me metabolomics techniques,
and for his encouragement and patience during the challenging learning process.
I owe thanks to all past and present members of the Blood Pressure Research Group,
Dr Martin Schultz, Rachel Climie, Penny Veloudi, Dianna Marston and Dean Picone for the
abundance of friendly assistance in the research process and my friends Harbeer Ahedi, Laura
Laslett and Heidi Laugesen for the great deal of support.
I would like to thank to Dr Richard Wilson, Dr James Horne and Associate Professor Noel
Davies from the Central Science Laboratory for their scientific input and practical assistance
with the metabolomics analysis. Also, special thanks to Dr Yuliya Karpievitch and Petr
Otahal for providing statistical support.
I am grateful to Dr Warrick Bishop and clinical staff at the Calvary Cardiac Centre for
helping to recruit study participants. Also, I would like to thank all my study participants, for
their willingness and time in participating in my study. I truly enjoyed working with you all.
My family has always been a pillar of enormous support and encouragement throughout my
entire education for which I am very grateful. My deepest gratitude is owed to my husband
Dusan Nikolic, for always being supportive and believing in me.
Thank you.

xi
Table of Contents
Statements and Declarations ....................................................................................................... i
Publications by the Author and Statement of Co-Author Contributions to Papers Contained
Within This Thesis ..................................................................................................................... ii
Abstracts and Presentations at Scientific Conferences that Relate to This Thesis .................... v
Abstract .................................................................................................................................... vii
Dedication ................................................................................................................................. ix
Acknowledgements .................................................................................................................... x
Table of Contents ...................................................................................................................... xi
List of Figures .......................................................................................................................... xv
List of Tables .......................................................................................................................... xvi
Chapter 1. Introduction .......................................................................................................... 1
Chapter 2. Review of Literature ............................................................................................ 6
2.1 Part I. Hypertensive response to exercise: reviewing the clinical importance and
physiology .............................................................................................................................. 7
2.1.1 Hypertension and cardiovascular risk........................................................................ 7
2.1.2 A hypertensive response to exercise – definition and prevalence ............................. 8
2.1.3 The prognostic significance of a hypertensive response to exercise ......................... 9
2.1.4 A hypertensive response to exercise at moderate intensity ....................................... 9
2.1.5 Central haemodynamics and exercise ...................................................................... 11
2.1.6 Mechanisms of a hypertensive response to exercise ............................................... 12
2.1.7 Metabolomics profiling - potential for new discoveries .......................................... 18
2.2 Part II. Metabolomics in hypertension ........................................................................... 20
2.2.1 Abstract .................................................................................................................... 20
2.2.2 Introduction ............................................................................................................. 21
2.2.3 Metabolomics: analytical tools, preanalytical steps and study design .................... 22
2.2.4 Metabolomics in hypertension research .................................................................. 31
2.2.5 Future directions ...................................................................................................... 37
2.2.6 Conclusions ............................................................................................................. 39
xii
2.3 Review of literature summary and overall thesis aim .................................................... 40
Chapter 3. Methodology ...................................................................................................... 42
3.1 Introduction .................................................................................................................... 43
3.2 Haemodynamic variables ............................................................................................... 43
3.2.1 Office brachial blood pressure ................................................................................. 43
3.2.2 Exercise brachial blood pressure ............................................................................. 44
3.2.3 Out-of-office blood pressure ................................................................................... 45
3.2.4 Office central blood pressure ................................................................................... 45
3.2.5 Arterial stiffness ...................................................................................................... 46
3.2.6 Bioimpedance cardiography .................................................................................... 47
3.3 Haemostatic and clinical biochemistry markers............................................................. 48
3.4 Metabolomics ................................................................................................................. 48
3.4.1 Liquid chromatography-mass spectrometry (LC-MS) ............................................ 48
3.4.2 Proton nuclear magnetic resonance (1H NMR) spectroscopy ................................. 50
Chapter 4. Association of Von Willebrand Factor Blood Levels with Exercise
Hypertension 52
4.2 Introduction .................................................................................................................... 54
4.3 Materials and Methods ................................................................................................... 55
4.3.1 Study participants .................................................................................................... 55
4.3.2 Study protocol.......................................................................................................... 55
4.3.3 Haemostatic markers ............................................................................................... 56
4.3.4 Haemodynamic variables ........................................................................................ 57
4.3.5 Biochemical analysis ............................................................................................... 58
4.3.6 Statistical analysis.................................................................................................... 58
4.4 Results ............................................................................................................................ 58
4.4.1 Clinical characteristics ............................................................................................. 58
4.4.2 Haemostatic markers ............................................................................................... 59
4.4.3 Haemodynamic variables ........................................................................................ 60
4.4.4 Correlates of moderate intensity exercise systolic BP ............................................. 61
4.4.5 Multiple regression analysis .................................................................................... 61
4.5 Discussion ...................................................................................................................... 66

xiii
4.6 Contribution of Chapter 4 to thesis aims ........................................................................ 68
Chapter 5. Spironolactone Reduces Aortic Stiffness via Blood Pressure-Dependent Effects
of Canrenoate ........................................................................................................................... 70
5.1 Abstract .......................................................................................................................... 71
5.2 Introduction .................................................................................................................... 72
5.3 Methods .......................................................................................................................... 74
5.3.1 Study participants .................................................................................................... 74
5.3.2 Study protocol.......................................................................................................... 74
5.3.3 Liquid chromatography-mass spectrometry (LC-MS) ............................................ 75
5.3.4 Nuclear magnetic resonance (NMR) spectroscopy ................................................. 75
5.3.5 Aortic stiffness, blood pressure and clinical biochemistry ...................................... 76
5.3.6 Data analysis, statistics and feature annotation ....................................................... 76
5.4 Results ............................................................................................................................ 77
5.4.1 Clinical characteristics ............................................................................................. 77
5.4.2 Metabolomics (LC-MS) .......................................................................................... 79
5.4.3 Metabolomics (NMR).............................................................................................. 80
5.4.4 Hemodynamic response to spironolactone .............................................................. 80
5.4.5 Associations between hemodynamic parameters and spironolactone metabolites . 81
5.4.6 Multiple regression analysis .................................................................................... 81
5.5 Discussion ...................................................................................................................... 83
5.6 Contribution of chapter 5 to thesis aims......................................................................... 85
Chapter 6. Serum Metabolic Profile Predicts Adverse Central Haemodynamics in Patients
with Type 2 Diabetes Mellitus ................................................................................................. 86
6.1 Abstract .......................................................................................................................... 87
6.2 Introduction .................................................................................................................... 88
6.3 Methods .......................................................................................................................... 89
6.3.1 Study participants .................................................................................................... 89
6.3.2 Study protocol.......................................................................................................... 89
6.3.3 Clinical chemistry .................................................................................................... 90
6.3.4 Haemodynamic variables ........................................................................................ 90
6.3.5 Metabolomics analysis ............................................................................................ 91
6.3.6 Data analysis, statistics and feature annotation ....................................................... 92

xiv
6.4 Results ............................................................................................................................ 93
6.4.1 Clinical characteristics ............................................................................................. 93
6.4.2 Haemodynamic variables ........................................................................................ 93
6.4.3 Metabolomics analysis ............................................................................................ 95
6.4.4 Associations between metabolomics principal components and haemodynamic
variables. ........................................................................................................................... 98
6.5 Discussion .................................................................................................................... 101
6.6 Contribution of chapter 6 to thesis aims....................................................................... 104
Chapter 7. Summary and Future Directions ...................................................................... 106
Appendix 1 ............................................................................................................................. 113
Appendix 2 ............................................................................................................................. 128
Appendix 3 ............................................................................................................................. 139
References .............................................................................................................................. 143
Publications Arising From This Thesis.................................................................................. 172

xv
List of Figures
Figure 2.1 The association of systolic BP (left) and diastolic BP (right) with mortality due to
stroke in each age category increasing by decade.2 ................................................................... 7
Figure 2.2 Forest plots for categorical exercise BP (maximal and moderate intensity) ......... 10
Figure 2.3 Pulse pressure amplification ................................................................................... 11
Figure 3.1 Aortic pressure waveform ...................................................................................... 46
Figure 3.2 Estimation of aortic stiffness using pulse wave velocity........................................ 47
Figure 4.1 Von Willebrand factor levels at three different conditions .................................... 63
Figure 4.2 Correlations between moderate intensity exercise systolic blood pressure and von
Willebrand factor. .................................................................................................................... 65
Figure 5.1 Metabolic pathway of spironolactone ................................................................... 73
Figure 5.2 Spironolactone downstream metabolites ............................................................... 79
Figure 5.3 Correlations with the spironolactone metabolite canrenoate ................................. 82
Figure 5.4 Correlations with the change in aortic pulse wave velocity .................................. 82
Figure 6.1 Score plot ................................................................................................................ 96
Figure 6.2 Difference in inosine in participants with type 2 diabetes mellitus (T2DM)
relative to non-diabetic controls, measured in arbitrary units (a.u.). ....................................... 97
Figure 6.3 Heat plot ................................................................................................................ 99
xvi
List of Tables
Table 2.1 Strengths and weaknesses of example sample types used in metabolomics analysis
.................................................................................................................................................. 27
Table 4.1 Clinical characteristics of study participants ........................................................... 59
Table 4.2 Haemostatic markers measured across three different conditions in participants
with normotensive and hypertensive response to exercise ...................................................... 62
Table 4.3 Haemodynamic variables measured during treadmill exercise stress testing (Bruce
protocol), and at rest and during moderate intensity exercise at the research clinic in
participants with normotensive and hypertensive response to exercise ................................... 64
Table 5.1 Clinical characteristics of study participants at baseline ........................................ 78
Table 5.2 Changes in hemodynamic variables in placebo compared to spironolactone group
after three months of treatment ................................................................................................ 80
Table 6.1 Clinical characteristics of study participants .......................................................... 93
Table 6.2 Peripheral and central haemodynamic variables measured at rest and during
exercise in participants with type 2 diabetes mellitus compared with non-diabetic controls .. 94
Table 6.3 Summary of identified serum metabolites with significantly different
concentrations in participants with type 2 diabetes mellitus versus non-diabetic controls ..... 97
Table 6.4 Multiple regression analysis assessing the associations of negative ion mass
spectrometry principal component 1 (NIMS PC1) with peripheral and central haemodynamic
variables ................................................................................................................................. 100
Table 6.5 Multiple regression analysis assessing the associations of nuclear magnetic
resonance principal component 2 (NMR PC2) with peripheral and central haemodynamic
variables ................................................................................................................................. 101

xvii
‘Any large-scale accomplishment is achieved only when tackled little by
little. Be patient and tackle only one thing at a time. Then watch the big
picture unfold.’
By Penelope Sac

1
Chapter 1. Introduction

2
Hypertension or high blood pressure (BP) is associated with adverse cardiovascular (CV)
outcomes1, 2
and is a leading risk factor for global disease burden.3 The current
recommendations for identifying individuals with hypertension and estimating the overall CV
risk is based on resting office peripheral BP measurements.4 However, some individuals,
despite having normal resting office peripheral BP, experience an exaggerated BP during
exercise, a condition defined as a ‘hypertensive response to exercise’ (HRE). A recent meta-
analysis in people with a clinical indication for exercise stress testing showed that those with
an HRE at moderate intensity (akin to the condition experienced during normal daily life
activities) were at greater risk for CV events and mortality, independent from resting office
peripheral BP and other CV risk factors.5 This may support the notion that physiological
stress during exercise may be a useful tool to reveal CV abnormalities that fail detection by
conventional BP screening.6 The mechanisms of an HRE are unclear, but may be due to
haemodynamic, haemostatic and/or metabolic factors. The overall aim of this thesis was to
explore the haemodynamic and biochemical (haemostatic and metabolic) correlates of an
HRE.
Chapter 2 – Review of Literature - Part I of this thesis provides an overview of the literature
regarding the clinical relevance of an HRE and potential mechanisms underlying an HRE.
Previous studies examining metabolic factors associated with high peripheral BP (rest and
exercise) involved the detection and analysis of already known ‘targeted’ metabolites. This
approach reduces the possibility for new discoveries. The recent development of
metabolomics analysis has allowed the detection of a large number of unknown ‘untargeted’
metabolites and the potential discovery of new pathophysiological mechanisms associated
with diseases. Metabolomics analysis has never been used before to reveal the underlying
metabolic mechanisms of an HRE, and Chapter 5 and Chapter 6 of this thesis represent the
first studies of this kind. Due to limited information available regarding the application of
metabolomics analysis in hypertension research, Review of Literature – Part II represents the
synthesis of the literature available in this field. Analytical techniques, pre-analytical steps
and study designs used in metabolomics studies, as well as the emerging role for
metabolomics in gaining mechanistic insights into the development of hypertension have
been summarised. Also, suggestions as to the future directions for metabolomics research in
the field of hypertension are proposed. This literature summary has been published as a

3
review article in the Journal of Hypertension,20147 and it represents a separate presentation
of the review of literature in this thesis.
In Chapter 4, haemodynamic and haemostatic factors of an HRE have been examined in 64
participants (aged 57 ± 10 years, 71% male) with a clinical indication for exercise stress
testing. Study participants underwent CV assessment at rest and during moderate intensity
exercise, aligning with the intensity of exercise BP shown to best predict CV events.5 Twenty
participants with an HRE had higher von Willebrand factor levels (vWf; a haemostatic
marker of endothelial dysfunction),8 as well as a significantly different response of vWf to
exercise compared to people with normal exercise BP. Moreover, vWf was associated with
exercise peripheral systolic BP, independent of resting office peripheral BP and other CV risk
factors. Although haemodynamic factors such as aortic stiffness or exercise systemic vascular
resistance were higher in people with an HRE and related to exercise peripheral systolic BP,
these associations were not independent of other CV risk factors. These findings suggested
that haemostatic abnormalities reflecting endothelial dysfunction, rather than haemodynamic
irregularities, may contribute to an HRE.
To investigate possible metabolic mechanisms of an HRE in an exploratory and ‘untargeted’
way using a metabolomics technique (applied in Chapter 5 and Chapter 6), it was first
necessary to develop methodology regarding the metabolomics analysis. Chapter 5 represents
a retrospective analysis of data (including haemodynamic measures and serum samples for
metabolomics analysis) collected in a clinical trial of 115 participants with an HRE (aged
55 ± 1 years, 58% male).9 Serum samples collected in this clinical trial were primarily used to
develop metabolomics protocols and methodology. This clinical trial also represented a
convenient sample to explore the metabolic actions of the aldosterone antagonist
spironolactone on exercise BP, and other haemodynamics, in people with an HRE.
Downstream spironolactone metabolites were identified using metabolomics techniques, and
exercise peripheral BP (as well as aortic stiffness) was reduced by active spironolactone
metabolite canrenoate via BP-dependent effects. Also, there was no significant relationship
between the reduction in exercise peripheral BP and aortic stiffness by spironolactone
treatment, giving further support that aortic stiffness is less relevant to an HRE than is widely
believed. The results of this study were published in Metabolomics, 2014.10
In Chapter 6, metabolomics analysis was used to explore the metabolic factors that may
contribute to an HRE in a population with the high prevalence of exercise hypertension, such

4
as those with type 2 diabetes mellitus (T2DM).11
Serum samples from 39 participants with
T2DM (62 ± 9 years; 54% female) and 39 non-diabetic controls (52 ± 10 years; 49% female)
were analysed using untargeted metabolomics to investigate the relationships between
metabolic profiles and haemodynamic variables measured at rest and during moderate
intensity exercise. The metabolomics analysis demonstrated that a signature metabolic pattern
of disordered carbohydrate metabolism in T2DM was independently associated with exercise
central, but not peripheral, BP haemodynamic indices in patients with T2DM. These findings
have clinical relevance as central haemodynamic indices have been shown to have greater
pathophysiological importance compared with conventional peripheral BP indices.12
Metabolic perturbations with the decreased inosine levels in people with T2DM (naturally
occurring purine with anti-inflammatory properties) were inversely and independently
associated with the peripheral exercise systolic BP. This may suggest that inflammation may
be a contributing factor of an HRE in people with T2DM.
In Appendix 1, a retrospective analysis of data collected in 250 people with treated
hypertension (64 ± 8 years; 52% male) was conducted to define the appropriate timing
(protocol) for resting peripheral and central BP measurements. Current guidelines for
peripheral BP measurements recommend that office resting peripheral BP should be
measured after five minutes of seated rest,4 but peripheral BP may decrease for up to 10
minutes. This drop in peripheral BP over time may have significant implications when
assessing BP-related risk and managing patients with hypertension. Therefore, this
retrospective analysis of data aimed to determine the change and its clinical relevance in
peripheral, as well as in central, BP from five to 10 minutes of seated rest. Office peripheral
and central BP were significantly lower at 10 minutes compared with five minutes peripheral
and central BP. But importantly, peripheral and central BP measured at 10 minutes better
correlated with end-organ damage (left ventricular [LV] mass index), and was a better
representative of true BP control compared to five minutes BP. Therefore, a 10 minute
waiting period was used before the resting office peripheral and central BP was measured in
all studies within this thesis. These findings have relevance for the appropriate diagnosis of
hypertension, as well as the design of research studies in which resting office peripheral and
central BP is measured. The results were published in the Journal of Human Hypertension,
2014.13

5
Appendix 2 represents a separate study conducted in the same study population as in Chapter
6 (people with T2DM and non-diabetic controls) to investigate a method for the
normalisation of metabolomics data. Normalisation of serum spectral data is an important
step in metabolomics analysis due to variations in instrument sensitivity (mass spectrometer)
and signal intensity loss, but it is complicated by the high complexity of biases. A novel
singular value decomposition-based normalisation method was developed through
collaboration with Karpievitch et al.14
The main finding was that normalisation removed
systematic bias from the metabolomics data and normalised values better correlated with the
corresponding haemodynamic data. Thus, this method proved to be useful and was used for
the metabolomics data normalisation in Chapter 6, with the details explained in Appendix 2.
The primary analysis was conducted by Dr Karpievitch, with significant input regarding
haemodynamic measures, study conception/design and data collection provided by the author
of this thesis.
Overall, this research further supports that exercise hypertension is associated with CV
abnormalities and it represents a clinically important entity, irrespective of normal resting
peripheral BP. People with an HRE have increased aortic stiffness and exercise systemic
vascular resistance, but these do not explain exercise hypertension independent of resting
peripheral BP and other CV risk markers. However, people with an HRE have abnormal
blood biochemistry (haemostasis, lipids, metabolic markers related to carbohydrate
metabolism and inflammation in T2DM) and these explain exercise hypertension independent
of resting peripheral BP and other CV risk factors. The research program contained in this
thesis also highlights the emerging role of metabolomics analysis for exploring new insights
into the underlying pathophysiological processes associated with high BP.

6
Chapter 2. Review of Literature
This chapter includes two sections: Part I reviews the clinical importance and proposed
mechanisms of a hypertensive response to exercise; Part II contains a review article that has
been published in the Journal of Hypertension, 2014, and includes a synthesis of the literature
on the application of metabolomics analysis in hypertension research. Metabolomics analysis
is used in two studies within this thesis to reveal the underlying metabolic contributors of a
hypertensive response to exercise.

7
2.1 Part I. Hypertensive response to exercise: reviewing the clinical
importance and physiology
2.1.1 Hypertension and cardiovascular risk
Hypertension or high blood pressure (BP) is associated with adverse cardiovascular (CV)
outcomes, including myocardial infarction, stroke, kidney disease and death1, 2
(Figure 2.1),
and is a leading risk factor for global disease burden.3 There are approximately one billion
individuals with hypertension worldwide, with an annual death rate associated with the
disease of around seven million people.15
In 2003, up to 29% of the adult population in
Australia were diagnosed with hypertension.16
Due to the increasing prevalence of
contributing factors of hypertension including obesity, unhealthy diet and physical inactivity,
the number of people with hypertension is predicted to rise, and is estimated that the total
number of hypertensive individuals in 2025 will reach approximately 1.56 billion
worldwide.17
The pathogenesis of hypertension is greatly influenced by genetic, lifestyle and
environmental factors, but the exact underlying pathophysiological mechanisms of the
development of hypertension are still unclear, except in only a small number of cases such as
in those with renovascular disease, aldosteronism or over-activity of the sympathetic nervous
system.18
Figure 2.1 The association of systolic BP (left) and diastolic BP (right) with mortality due to
stroke in each age category increasing by decade.2

8
The general recommendation for identifying individuals with hypertension is based on resting
office peripheral BP measurements, usually taken in a clinical environment.4 However, this
conventional type of BP measurement has some limitations that may interfere with the
correct diagnosis of hypertension and estimation of the overall CV risk. Relying solely on
resting office peripheral BP may lead to the incorrect diagnosis of hypertension in individuals
who have white coat hypertension or ‘isolated clinic hypertension’.19
More importantly,
office peripheral BP measurement may miss a significant number of people who have normal
resting office peripheral BP, but who are hypertensive ‘out-of-office’ or during normal daily
life activities.20
It appears that these individuals have uncontrolled BP that is not easily
identified at rest. These individuals have masked hypertension and have almost equal CV risk
to those having sustained hypertension.21
If we consider the high prevalence of masked
hypertension in the general community (up to 19%),22
the consideration of other means of BP
measures including out-of-office BP, or even exercise BP as recently suggested,6 may be
important in identifying these individuals at higher risk and appropriately evaluating their
‘true BP’.23
2.1.2 A hypertensive response to exercise – definition and prevalence
Irrespective of apparently normal resting office peripheral BP, some people may have
exaggerated peripheral BP during exercise, a condition defined as a ‘hypertensive response to
exercise’ (HRE). Although there is no specific threshold to define an HRE, most studies have
widely used values of peripheral systolic BP exceeding the 90th
to 95th
percentile of the
studied population24
or in most cases a systolic BP of ≥ 210 mmHg for men and ≥ 190 mmHg
for women.25, 26
Due to the inconsistent definition of an HRE and different study populations
examined, the prevalence of an HRE varies between studies. A prevalence of 3% to 4%
across most of cohort-based studies was identified in a recent systematic review, from which
one third had normal resting peripheral BP.27
However, the prevalence of an HRE in a cohort
of consecutive 2216 men and 1229 women with known or suspected coronary artery disease
referred for exercise stress testing was 39% (a total of 1319 individuals).28
An HRE is also
highly prevalent in people with type 2 diabetes mellitus (T2DM), reported to be more than
50% of the studied population.11
Given the high prevalence of an HRE in people with masked
hypertension (up to 58%),29
exercise BP may be a useful tool to identify individuals with
masked hypertension or to ‘unmask’ those with uncontrolled BP.6

9
2.1.3 The prognostic significance of a hypertensive response to exercise
There is a growing evidence that BP recorded during exercise may be more useful than
conventional office resting BP measurements with respect to determining an individual’s risk
related to BP.5, 30
To determine the prognostic significance of an HRE, Allison et al24
conducted a follow-up study in 150 healthy, normotensive individuals with exercise systolic
BP over 90th
percentile (equating to ≥ 214 mmHg) and 150 age- and gender-matched subjects
with normal BP response to exercise. Investigators found that exaggerated exercise systolic
BP was a significant independent predictor of total CV events and future onset of essential
hypertension, suggesting that an HRE carries an additional CV risk irrespective of normal
resting office BP.24
Similarly, in a study of Kohl et al31
maximal exercise systolic BP of
20387 men and 6234 women followed-up for an average of 8.1 years was associated with the
increased risk of all-cause, CV and coronary heart disease mortality. Relative risk of CV
mortality increased with the increase in exercise systolic BP and the change in systolic BP
from rest to exercise was associated with total, CV and non-CV mortality in the study of
Filipovsky et al.32
A population-based follow-up study in 1731 middle-aged men without
prior history of coronary heart disease showed that exercise systolic BP ≥ 230 mmHg was
associated with a 2.47 fold risk of acute myocardial infarction, even after adjustment for
resting systolic BP and other CV risk factors.33
2.1.4 A hypertensive response to exercise at moderate intensity
Exercise BP in previous studies was measured during both moderate and maximal exercise
intensity. However, the prognostic value of maximal exercise BP for predicting adverse CV
outcomes is less consistent and less powerful when compared to moderate intensity exercise
BP. Indeed, an increase of 10 mmHg in moderate intensity exercise systolic BP recorded
during stage 2 Bruce protocol had a stronger association with the risk of CV mortality than
systolic BP measured at maximal exercise intensity.34
A follow-up study in 1999 apparently
healthy individuals that performed a bicycle ergometer exercise test at baseline and were
followed for 21 years demonstrated that exercise systolic BP taken at an early moderate
workload provided independent prognostic information on CV mortality, whereas maximal
exercise systolic BP failed to show this independent association.35
Schultz et al5 have recently conducted a systematic review and meta-analysis to investigate
the prognostic value of exercise systolic BP at maximal and moderate intensity exercise in

10
people with a clinical indication for exercise stress testing. The authors found that an HRE at
moderate intensity, but not maximal, was associated with a 36% increased risk of CV events
and mortality when compared to those having a normotensive BP response to exercise,
independently of resting office BP (Figure 2.2).5 An increase of 10 mmHg in moderate
intensity exercise systolic BP was associated with a 4% increased risk for CV events and
mortality.5 The stronger association of moderate intensity exercise may partially be attributed
to difficulties associated with measuring BP especially during maximal intensity exercise BP
due to movement artefacts and measurement errors.
Figure 2.2 Forest plots for categorical exercise BP (maximal and moderate intensity)
Pooled hazard ratio (95% confidence intervals) of an HRE at moderate and maximal intensity
for predicting CV outcomes after adjusting for resting BP and other CV risk factors.
Moderate intensity: p = 0.039, I2
= 51.8%; maximal intensity: p = 0.118, I2 = 65.0%.
5
Besides having the higher prognostic values compared to maximal intensity exercise systolic
BP, moderate intensity exercise systolic BP may also have an important clinical significance.
Exercise BP at moderate intensity is akin to the ambulatory condition experienced during
normal daily life activities. As people spend most of a day in ambulatory condition, moderate
intensity exercise BP may represent a chronic BP load that people experience on a daily basis
and may provide better representation of an individual’s true BP when compared to resting or

11
maximal exercise BP.6 Nevertheless, the underlying pathophysiological mechanisms that link
an exaggerated moderate intensity exercise BP and adverse CV outcomes are still unclear.
2.1.5 Central haemodynamics and exercise
Although current recommendations for identifying individuals with hypertension and
increased CV risk is based on peripheral BP measurements, recent research findings have
placed an emphasis on central BP, the pressure to which the vital organs (heart, brain and
kidneys) are directly exposed. It has been shown that central haemodynamic indices
(including augmentation index [AIx]; a marker of left ventricular afterload) predict CV
events independently of brachial BP.12
Therefore, measuring central BP (at rest and during
exercise) may add clinically relevant information to the overall assessment of CV risk
associated with hypertension. However, central BP may not be truly represented by BP
measured at the periphery,36
as peripheral systolic BP is not the same as central systolic BP,
due to pulse pressure (PP) amplification from large central elastic arteries towards the
smaller, more muscular peripheral arteries (Figure 2.3).37
Indeed, central systolic BP is
normally lower than brachial systolic BP (up to 30 mmHg), and this difference is highly
variable between individuals even with similar brachial systolic BP.38-40
With advancing age
or CV diseases, the central large arteries undergo changes and become stiffer, due to a greater
recruitment of collagen fibres, resulting in an increase in BP in the predominantly central
arteries when compared to peripheral, and a decrease in PP amplification.41
Figure 2.3 Pulse pressure amplification
The amplitude of the pressure wave and systolic BP (the highest point of the pressure wave)
increases as the pressure wave propagates away from the large central arteries towards the
smaller, peripheral muscular arteries.

12
The role of exercise central BP has been rarely investigated. Invasive measurements of
central BP during exercise demonstrated that central systolic BP increases to a lesser extent
than peripheral systolic BP, leading to the increased PP amplification.42, 43
Indeed, a study of
Sharman et al44
showed that PP amplification increased from rest to moderate intensity
exercise in healthy individuals.44
However, in older individuals with hypercholesterolemia
and increased CV risk, the PP amplification is blunted due to a higher central systolic BP
relative to peripheral systolic BP when compared to healthy controls.45
These finding also
support the fact that risk related to BP may be more evident from moderate intensity exercise
central BP, rather than resting peripheral BP. Central BP can be readily estimated via a non-
invasive measurement of the radial pulse, in a technique that is both valid and reproducible at
rest and during exercise.46-49
Future research should be directed towards gaining further
insight into the pathophysiological role of central BP during exercise, as this may likely add
significant information to the clinical understanding of an HRE.
2.1.6 Mechanisms of a hypertensive response to exercise
Normal physiological response to exercise
With exercise onset, the metabolic needs of skeletal muscles increase which requires the body
to simultaneously coordinate multiple physiological responses in order to meet this demand
and maintain blood flow to vital organs, such as heart and brain.27
Heart rate and cardiac
output rise as a result of elevated sympathetic activity, and blood flow is diverted from low-
priority vascular areas to the activated muscles.27
An increase in peripheral vascular dilatation
allows blood to be supplied to the periphery which consequently decreases the systemic
vascular resistance.27
As workload of exercise increases, the rise in cardiac output
predominates over the decrease in systemic vascular resistance leading to an elevation of
mean arterial pressure by approximately 40%.27
Systolic BP raises gradually with exercise
intensity, whereas diastolic BP goes down slightly.27
However, in some cases, exercise
systolic BP increases excessively, although the underlying pathophysiological mechanisms of
this rise are unclear.27
This excessive rise in exercise BP (irrespective of normal BP at rest) is
associated with adverse CV outcomes (as previously described), and as such, the BP response
to exercise may help reveal CV abnormalities that are not otherwise detected at rest.6

13
Haemodynamic contributors to a hypertensive response to exercise
Although the mechanisms of an HRE remain unclear, abnormalities in haemodynamics
(which represent BP and flow within the arterial system) are thought to play a key role.
Appropriate vascular function is essential in maintaining BP, especially during exercise.
Previous studies have suggested that possible causative factors of an HRE might be increased
large arterial stiffness, as this may fail to buffer the rise in BP that will occur with increased
cardiac output and blood flow during exercise.50
Indeed, increased aortic stiffness (as
measured by carotid-to-femoral pulse wave velocity; PWV) has been shown to be
significantly associated with moderate intensity exercise systolic BP in Framingham
Offspring cohort study in 2115 participants even after adjusting for known CV risk factors.50
Tsioufis et al51
also found a significant positive association between aortic stiffness
(measured by the same method) and maximal exercise systolic BP, although study
participants included those with established essential hypertension, which may have
influenced the results. Increased aortic stiffness may also lead to raised central BP and left
ventricular (LV) afterload, and ultimately affect cardiac structural and functional
characteristics.11, 25
A cross-sectional study showed that people with an HRE have a higher
prevalence of LV hypertrophy and diastolic dysfunction than those with normal systolic BP
during exercise.52
Aortic PWV is an independent predictor of CV risk, observed in different populations,
including people with hypertension, T2DM, and in older adults.53
The prognostic importance
of aortic PWV is most likely reflected by being a measure of the effect of different CV risk
factors (including aging and high BP) on the arterial wall. Indeed, with advancing age,
arteries undergo major structural and functional changes, predominantly in large central and
elastic arteries and least in muscular arteries, such as those of the upper limb.54
Large arteries
become stiff and dilated due to a degeneration of elastin fibres and greater recruitment of
inelastic collagen, progressively affecting the aortic cushioning function.55
Previous studies
also reported a close association between aortic PWV and BP.56
It is possible that high BP
(and its pulsatile load over time) further contributes to structural alterations within the wall,
and increase age-related changes and arterial stiffness, leading to ‘premature arterial
stiffening.’ Furthermore, a number of metabolic CV risk factors including dyslipidaemia,
insulin resistance and altered carbohydrate metabolism are also associated with increased
large artery stiffness, and this is described in more details below. Thus, arterial stiffness

14
appears to be an important marker of CV risk; and therefore, represents a potential
therapeutic target for the prevention of increased CV morbidity and mortality.
Aldosterone has also been implicated as an important mediator of increased arterial stiffening
by acting through the mineralocorticoid receptors in vascular walls.57
Recent studies have
indicated that BP-lowering drugs that interfere with the renin-angiotensin-aldosterone system,
such as spironolactone, exert potentially beneficial effects on vascular structure (may prevent,
or lessen, arterial stiffening) beyond the reduction in BP, probably due to blocking the
adverse effects of aldosterone.58-60
Indeed, Edwards et al60
showed that 25mg of
spironolactone daily for 40 weeks, reduced aortic stiffness (measured by aortic PWV) in 56
patients with early-stage chronic kidney disease when compared to controls, even after
correcting for mean BP. Aortic stiffness was also reduced by 50mg of spironolactone in 24
previously untreated patients with essential hypertension, which remained significant after
correcting for the reduction in mean BP.61
As increased aortic stiffness has been suggested as
a possible causative factor of an HRE, a recent clinical trial has been conducted in order to
investigate the role of aldosterone antagonism with spironolactone on the reduction in aortic
stiffness and exercise BP in 115 subjects with an HRE. Spironolactone has been found to
decrease aortic stiffness, as well as exercise BP in these people;62
however, the exact
mechanism of its action on these haemodynamic measures remained unclear. To explore this
in more detail, Chapter 5 of this thesis represents a retrospective analysis of data
(haemodynamic and metabolic) collected in this clinical trial.
Several previous studies have suggested that the condition of the peripheral vasculature (or
endothelium function) may also significantly contribute to an HRE.63, 64
Failure of the
endothelium to regulate endothelial-dependent vasoactivity, also referred as endothelial
dysfunction, will disable peripheral vasculature to appropriately dilate and compensate for an
increase in blood flow. An impaired capacity for exercise-induced vasodilatation will lead to
an excessive rise in systemic vascular resistance and consequently exercise BP.65
Indeed, a
study of healthy untreated subjects with high normal BP or mild hypertension showed that
exaggerated exercise systolic BP was associated with reduced endothelial-dependent
vasodilatation (assessed by brachial artery reactive hyperaemia).63
Also, flow-mediated
vasodilation was negatively associated with exercise systolic BP at moderate intensity in a
large community-based population cohort from the Framingham Heart Study.50
However,
most of the previous studies examined the haemodynamic variables at rest to uncover the
15
underlying mechanisms of exercise hypertension. Therefore, studies contained in this thesis
include examination of haemodynamics measured during resting and exercise conditions.
Arterial stiffness has been traditionally viewed as a measure of vessel wall structural
elements and mean BP. However, the increasing body of evidence suggest that arterial
stiffness is also regulated by the vascular endothelium,66-69
and these two should not be
studied independently. Indeed, besides the distribution of elastic and collagen fibres that
change with arterial ‘aging’,55
arterial walls also have a layer of smooth muscle cells that can
be modified by a number of vasoactive modulators including nitric oxide. The changes in
nitric oxide levels may alter vascular smooth muscle tone and potentially regulate arterial
stiffness.70
Endothelial dysfunction is generally characterized by the reduction in nitric oxide
bioavailability, and numerous studies utilizing therapeutic interventions to improve
endothelial function (or nitric oxide bioavailability) also demonstrated the reduction in
arterial stiffness. A glyceryl trinitrate (drug metabolized to nitric oxide within the vascular
wall) reduced brachial artery stiffness66
and decreased the AIx,68
a composite measure of
arterial stiffness, without any effects on mean BP in humans. Furthermore, intra-arterial
infusion of glycerol trinitrate also decreased PWV in the common iliac artery in sheep,
without any observed changes in mean BP,67
whereas intra-arterial infusion of the nitric oxide
synthase inhibitor (NG-monomethyl-L-arginine) increased brachial artery compliance.
69
Together, this data suggests that nitric oxide may act to reduce large artery stiffness,
independent from BP changes. Therefore, therapeutic intervention aimed at increasing the
nitric oxide bioavailability may potentially be useful in conditions associated with endothelial
dysfunction, as well as increased arterial stiffening, such as an HRE.
The potential relation of haemostatic factors with an HRE
Haemostasis represents the body’s physiological system that involves an integrated effort
between platelets, vascular endothelial cells and haemostatic clotting factors to ensure normal
blood fluidity and blood vessel integrity. Under normal physiological conditions, the vascular
endothelium plays a crucial role in regulating normal haemostasis by expressing various
membrane molecules and synthesising/releasing a spectrum of regulatory (procoagulant and
anticoagulant) substances of coagulation. The endothelium is constantly exposed to different
CV risk factors (e.g. high shear pressure, hyperglycaemia, dyslipidaemia, inflammation), and
under pathological conditions, a delicate balance of endothelium-derived factors may be
disturbed in favour of procoagulant substances. Furthermore, sub-endothelial cells in vascular

16
vessel walls (e.g. smooth muscle cells) express haemostatic markers, including tissue factor
(TF)71
leading to the rapid initiation of the coagulation cascade and an increase in markers of
thrombin generation when the vessel walls are damaged. Indeed, it has been suggested that
high BP confers a prothrombotic state, which may have considerable importance in the
pathogenesis of target-organ damage and CV disease.72
Abnormalities of haemostasis,
characterised by endothelial dysfunction and an activation of procoagulant haemostatic
markers, including TF,73-75
are present in hypertension and are related to target organ damage
and adverse CV prognosis.76-78
Von Willebrand factor (vWf) is a pro-coagulant haemostatic marker synthesized/stored in
endothelial cells with an important role in mediating platelet aggregation and adhesion to the
vascular endothelium.79
Since vWf is released into the circulation by secretion from
endothelial cells when cells are damaged, the concentrations of vWf has been proposed as an
indicator of endothelial damage or dysfunction.79
Increased plasma vWf levels may lead to
thrombin generation and eventually adverse CV events. It has been demonstrated that people
with hypertension (a state of endothelial dysfunction)80
have increased vWf levels that are
positively associated with both systolic and diastolic BP.8 Also, elevated plasma vWf levels
are associated with CV events in the general population,8, 81
as well as in those with
established CV disease.82
Given that an HRE is also a state of endothelial dysfunction,63
this
may suggest that vWf levels may also be raised in people with an HRE. In support of this
statement, Lee et al83
have found that vWf was increased in people with high ambulatory BP
indices measured during normal daily-life activities (akin to moderate intensity exercise) in
73 patients with stable coronary artery disease, even after adjustment for mean BP. Therefore,
endothelial dysfunction may represent a platform on which impaired haemostasis might be
contributing to an HRE and associated CV complications.
Other haemostatic markers, such as fibrinogen (an acute phase haemostatic marker that is
converted to insoluble fibrin during the clotting process) has also been found to be elevated in
people with high BP (rest and ambulatory)83, 84
and significantly associated with the presence
of hypertension-related target organ damage.85
Importantly, fibrinogen is highly predictive of
CV risk progression,77
where fibrinogen levels over 3.5 g/L were reported to be associated
with a 12-fold higher CV risk than those with normal levels.86
Whilst there are few studies
exploring haemostatic markers in people with an HRE, better understanding of potential
17
haemostatic abnormalities in this population would provide a significant advance in
knowledge regarding HRE development and its associated CV risk.
Metabolic influences to a hypertensive response to exercise
An HRE is associated with various metabolic CV risk factors including increased total
cholesterol and triglyceride levels. The Framingham Offspring cohort study of 2115
participants has demonstrated that the total cholesterol-to-high-density cholesterol ratio was
independently associated with moderate intensity exercise systolic BP in multiple regression
analysis, independent of other CV risk factors.50
Men with high levels of total cholesterol had
significantly higher levels of mean BP during exercise than age-matched men with normal
total cholesterol levels in the study of Sharman et al.45
Also, increased triglyceride levels
were significantly associated with central exercise systolic BP.78
Some of the mechanisms
proposed for these associations include the effects of lipids on the arterial wall leading to
arterial stiffening.87
However, a recent systematic review failed to show these strong
associations between aortic stiffness and lipids.56
On the other hand, dyslipidaemia is also
associated with endothelial dysfunction and reduced nitric oxide bioavailability.88
This has
been evidenced by impaired endothelium-dependent vasodilatation of forearm resistance
vessels in response to acetylcholine in patients with hypercholesterolemia88
as well as
hypertriglyceridemia89
compared with controls.
Insulin resistance and altered carbohydrate metabolism may be involved in haemodynamic
abnormalities that lead to an HRE, given the high prevalence of an HRE in people with
T2DM.11
Indeed, insulin resistance assessed by HOMRIR (homeostasis model of insulin
resistance) index was found to be significantly higher in subjects with an HRE and
independently related to the magnitude of elevation in systolic BP from rest to exercise, even
after adjusting for age, sex, body mass index and resting systolic BP.90
Insulin is a vasodilator
of peripheral resistance arteries due to stimulation of endothelial nitric oxide synthesis.91
In
the presence of insulin resistance, endothelial vasodilatation is impaired leading to increased
peripheral vascular resistance and increased BP.
The large Hoorn Study92
reported reduced compliance of large arteries in individuals with
impaired glucose metabolism compared to non-diabetic controls, suggesting that changes in
vascular structure may occur even before the onset of T2DM.92
Cameron et al93
reported
higher values of PWV in all segments of large arteries in individuals with T2DM compared
with non-diabetic age-matched controls,93
most likely due to formation of advanced glycation

18
end-products by non-enzymatic crosslinks between sugars and amino acids.94
These
alterations in vascular structure may possibly lead to increased large artery stiffness, although
the strength of the association between arterial stiffness and the presence of T2DM has
recently been found to be rather weak.56
Hyperglycaemia may also cause increased
production of oxidative reactive species and lead to a generalized state of increased oxidative
stress,95
which can further damage vascular wall properties. Nevertheless, the underlying
mechanisms linking the high prevalence of an HRE in people with T2DM are still unclear.
2.1.7 Metabolomics profiling - potential for new discoveries
Previous studies examining the metabolic abnormalities associated with high BP involved the
detection and analysis of already known ‘targeted’ metabolites (e.g. triglycerides, total
cholesterol). In recent years, development of analytical techniques and bioinformatics has
allowed the ‘untargeted’ systematic detection of 100s to 1000s of low-molecular weight
metabolites in a single sample and this new approach, called metabolomics profiling, is an
ideal platform for new discoveries, as it may provide a metabolic ‘fingerprints’ for different
disease states.96
Since metabolic irregularities appear to play a significant part in abnormal
BP control and also occur even before appreciable increases in office resting BP are
recognised, metabolomics has increasingly been used in hypertension research to gain
mechanistic insights into hypertension development.
Importantly, no study has conducted metabolomics profiling in people with an HRE, and it
appears that metabolomics analysis may have potential for uncovering the mechanisms of this
condition. Indeed, metabolomics profiling or mapping of all endogenous metabolites in
individuals with an HRE and their healthy-matched controls, and identifying metabolites (and
associated metabolic pathways) that discriminate these two groups may provide unique
information on underlying mechanisms of an HRE. This type of analysis is able to identify
completely novel metabolites associated with the disease, and is ideal for discovery-based
investigations. Since an HRE may represent a ‘warning signal’ of uncontrolled BP,6
identified new metabolic perturbations of an HRE may elucidate early stage development of
essential hypertension and these discoveries would represent a major clinical advance.
Metabolomics-based studies in an HRE population, however, should also include a
comprehensive haemodynamic assessment of BP (rest and exercise), alongside measures of
arterial stiffness, endothelial dysfunction, as well as haemostatic markers, in order to provide
a broad picture of possible mechanisms of an HRE.

19
Metabolomics analysis in hypertension research is still in its early stages. Previous
metabolomics studies in hypertension research have had many limitations, including a poor
characterisation of the hypertensive phenotype (e.g. relying solely on office resting BP
measurements) which may have led to spurious results and inappropriate conclusions. Being
a powerful technique for new discoveries and due to the limited information available
regarding the application of metabolomics analysis in the hypertension research, Review of
Literature – Part II represents the synthesis of the literature available in this field. This
literature summary has been published as a review article in the Journal of Hypertension,
2014 and it is included as a separate part of the review of literature.

20
2.2 Part II. Metabolomics in hypertension
2.2.1 Abstract
Hypertension is the most prevalent chronic medical condition and a major risk factor for
cardiovascular (CV) morbidity and mortality. In the majority of hypertensive cases, the
underlying cause of hypertension cannot be easily identified due to the heterogeneous,
polygenic and multifactorial nature of hypertension. Metabolomics is a relatively new field of
research that has been used to evaluate metabolic perturbations associated with disease,
identify disease biomarkers and to both assess and predict drug safety and efficacy.
Metabolomics has been increasingly used to characterise risk factors for CV disease,
including hypertension, and appears to have significant potential for uncovering mechanisms
of this complex disease. This review details the analytical techniques, pre-analytical steps and
study designs used in metabolomics studies, as well as the emerging role for metabolomics in
gaining mechanistic insights into the development of hypertension. Suggestions as to the
future direction for metabolomics research in the field of hypertension are also proposed.
Review of Literature - Part II has been previously published:
Nikolic SB, Sharman JE, Adams MJ, Edwards LM. Metabolomics in hypertension.
J Hypertens. 2014; 32:1159-1169

21
2.2.2 Introduction
Hypertension is a complex, multifactorial disease that has a significant positive association
with adverse cardiovascular (CV) outcomes, including myocardial infarction, stroke, kidney
disease and death.1, 2
There are approximately one billion individuals with hypertension
worldwide, with an annual death rate associated with the disease of around seven million
people.15
Hypertension can occur as a consequence of renovascular disease, renal failure,
aldosteronism or over-activity of the sympathetic nervous system, but these forms of
hypertension account for only a small number of cases.18
In the majority of cases
hypertension occurs without evidence of other disease. Although the pathogenesis of
hypertension is greatly influenced by genetic, lifestyle and environmental factors, the
underlying physiological and metabolic drivers remain to be fully elucidated.
The traditional method for identifying hypertension is via blood pressure (BP) measurements
at the upper arm, usually taken in a clinic environment.97
However, pathophysiological
changes may occur during the development of hypertension before appreciable increases in
clinic upper arm BP are recognised.98
The identification of these early perturbations - whether
physiological or biochemical - is expected to lead to a better understanding of the
pathogenesis of hypertension and, consequently, new opportunities for the development of
novel therapies and improved diagnostic methods.
In recent years, technical developments have allowed the unbiased detection, identification
and semi-quantification of an increasing range of low-molecular weight compounds
(metabolites) that are present within cells, tissues, and body fluids.96
This component of
systems biology called metabolomics (i.e. the study of the metabolic phenotype or
metabolome) is often thought to have emerged quite recently (following genomics,
transcriptomics and proteomics);99
however, its true roots emerged some decades ago.100
Since metabolites represent the final products of cellular processes including genes, mRNA,
protein activity and bidirectional, complex interactions between these system biology
components,101
metabolomics offers an unique view of the metabolic phenotype and
phenotypic perturbations associated with diseases as well as the influence of environmental
factors (e.g. diet, activity, behaviour, disease and medical/surgical treatment).102-104
To date,
however, relatively few studies have employed metabolomics in the study of hypertension in
animals or humans.10, 105-114

22
In this review, the analytical tools, pre-analytical steps and study designs used in
metabolomics studies are described, and the challenges associated with metabolomics
analysis are appraised. It is also discussed how metabolomics has been used to study
hypertension in animals and humans, provided insights into the potential benefits that this
approach offers, and proposed future directions in hypertension metabolomics research.
2.2.3 Metabolomics: analytical tools, preanalytical steps and study design
Analytical tools
Current estimates suggest that the human metabolome comprises many thousands of small
molecules, both confirmed115
and predicted.116
However, unlike DNA or peptide chains,
where information is encoded via repeating patterns of relatively uniform chemical subunits,
the information contained within the metabolome is intrinsic to the metabolites themselves.
Metabolites vary profoundly in polarity, size and concentration (e.g. µmol/L, nmol/L,
pmol/L), ranging from hydrophilic, polar metabolites with a low molecular weight (e.g.
amino acids) to hydrophobic, non-polar high molecular weight metabolites (e.g. lipids). This
diversity means that the unbiased detection, identification and quantification of the entire
metabolome is extremely technically challenging.117
Indeed, there is currently no single
analytical approach that can detect or quantify all metabolites present in human samples.
However, multiple analytical techniques have been employed to provide complementary
coverage of a range of metabolites with considerable success.118
The combination of nuclear
magnetic resonance (NMR) spectroscopy with mass spectrometry (MS) has proven
particularly effective and has, therefore, gained increasing popularity.119
The principle of NMR spectroscopy is that atomic nuclei with nonzero spin (a quantum
property corresponding to angular momentum), when placed in a powerful magnetic field and
irradiated with radiofrequency waves, emit a characteristic radiofrequency signal as they
relax from the induced state and return to equilibrium.120
This signal is a rich source of
information regarding the composition of the irradiated sample, including data regarding
chemical structure and abundance.120
NMR spectroscopy is quantitative in nature and offers
precise structural information that enables relatively easy metabolite identification.96
Furthermore, this technique is not destructive (i.e. samples can be re-used many times) and
does not require extensive sample preparation.120
However, it is somewhat disadvantaged by
relatively low analytical sensitivity that allows only the detection of high abundance

23
metabolites (concentration of 100 nmol/L to 1 µmol/L or higher; with usually less than 100
metabolites in a human sample).96, 120
Furthermore, typical one-dimensional NMR results in
complex metabolite profiles with many signals lying close to, or directly on top of each other,
such that low abundance metabolites can be masked by high abundance metabolites with a
similar or identical chemical shift (a technical term for the ‘frequency’ of an NMR signal).
Sophisticated and expensive solutions to this latter problem exist, including two-dimensional
NMR spectroscopy and hyphenated methods such as liquid chromatography–NMR (LC-
NMR). However, complex biological matrices can also be simplified using cost-effective,
traditional analytical preparations prior to analysis (e.g. solid-phase extraction or the use of
organic solvents to separate hydrophobic and hydrophilic metabolites).
Mass spectrometry, coupled with separation techniques such as LC or gas chromatography
(GC), has a higher sensitivity than NMR spectroscopy, and has the potential to detect a
significant number of very low abundance metabolites (as low as 1 pmol/L).121
The initial
chromatography step, coupled with the extremely high resolution of modern instruments,
such as ThermoFisher’s Orbitrap, means that thousands of species can be resolved in a single
experiment. In MS, molecules are charged or ionized in the ionization process, and these
charged molecules and their fragments are separated according to their mass-to-charge
ratio.121
In metabolomics experiments, where ions only rarely carry a charge greater than one,
the mass-to-charge ratio is equivalent to their mass. Multiple ionization techniques have been
used in efforts to increase the number of detected metabolites, with some doubling the
number of detected metabolic features (e.g. electrospray ionization in both positive (+) and
negative (-) ionization modes).122
However, even though it is possible to resolve many
thousands of signals in a single experiment using such sophisticated MS techniques, their
unambiguous assignment and identification still represents a significant bioinformatics (and
experimental) challenge and one that is difficult, slow and can only be partially resolved.123
For a metabolite to be positively identified, a number of orthogonal parameters such as
accurate mass, isotope abundance pattern, retention time and/or MS/MS spectrum should
match with those of a purified standard under identical conditions.123, 124
Clearly this is not
plausible for more than a few dozen metabolites. Thus, it is currently broadly accepted that
metabolites must be ‘putatively annotated’ unless their unambiguous annotation is absolutely
necessary. This specific use of language (e.g. ‘putative annotation’) has been recommended
by the Metabolomics Standards Initiative.124
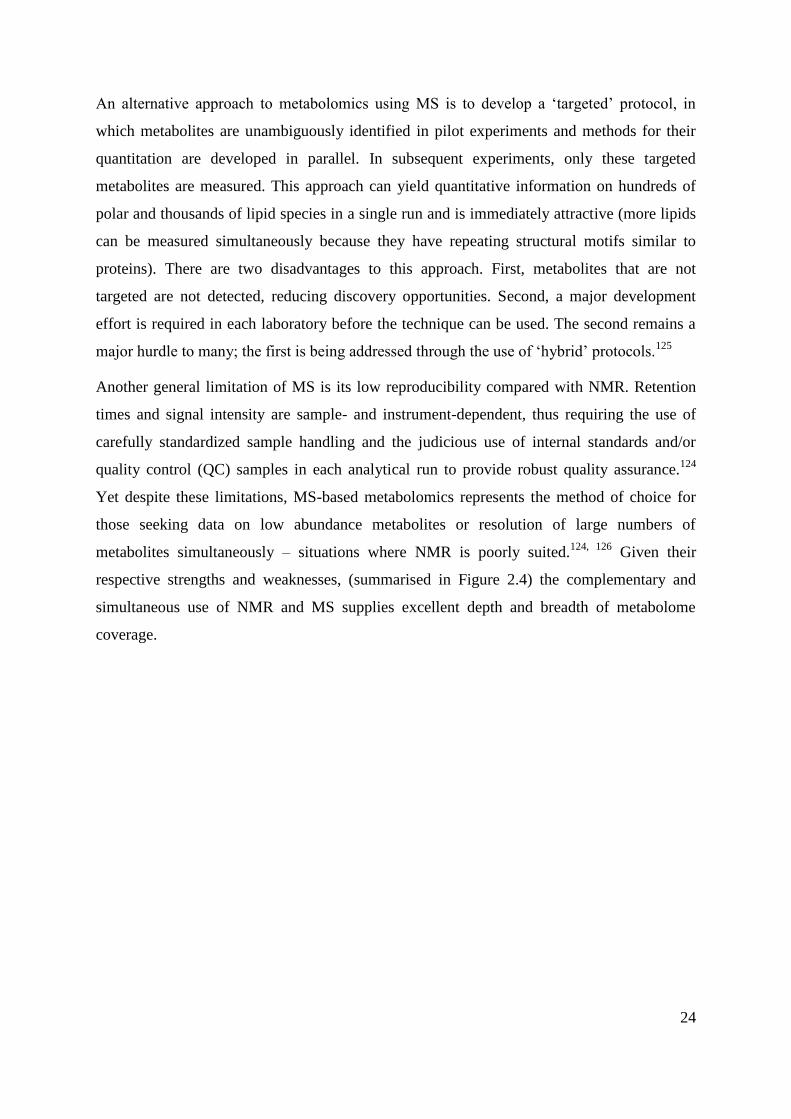
24
An alternative approach to metabolomics using MS is to develop a ‘targeted’ protocol, in
which metabolites are unambiguously identified in pilot experiments and methods for their
quantitation are developed in parallel. In subsequent experiments, only these targeted
metabolites are measured. This approach can yield quantitative information on hundreds of
polar and thousands of lipid species in a single run and is immediately attractive (more lipids
can be measured simultaneously because they have repeating structural motifs similar to
proteins). There are two disadvantages to this approach. First, metabolites that are not
targeted are not detected, reducing discovery opportunities. Second, a major development
effort is required in each laboratory before the technique can be used. The second remains a
major hurdle to many; the first is being addressed through the use of ‘hybrid’ protocols.125
Another general limitation of MS is its low reproducibility compared with NMR. Retention
times and signal intensity are sample- and instrument-dependent, thus requiring the use of
carefully standardized sample handling and the judicious use of internal standards and/or
quality control (QC) samples in each analytical run to provide robust quality assurance.124
Yet despite these limitations, MS-based metabolomics represents the method of choice for
those seeking data on low abundance metabolites or resolution of large numbers of
metabolites simultaneously – situations where NMR is poorly suited.124, 126
Given their
respective strengths and weaknesses, (summarised in Figure 2.4) the complementary and
simultaneous use of NMR and MS supplies excellent depth and breadth of metabolome
coverage.
25
Figure 2.4 Strengths and weaknesses of nuclear magnetic resonance spectroscopy and mass spectrometry.

26
Pre-analytical steps
Selection of sample types. A huge range of biological samples have been used for
metabolomics studies each providing different information and each with particular strengths
and weaknesses (Table 2.1). These include extracellular fluids (e.g. blood, urine,
cerebrospinal fluid, saliva), tissue extracts from biopsies, or cell extracts (e.g. from primary
cultures). The selection of sample source is largely dependent on the study question and
sample availability.121
The most frequently used samples in human metabolomics studies are
blood and urine. This is due to the relative easy and minimally invasive nature of collection
alongside the widely-held belief that these samples can provide a metabolic overview or
‘footprint’ of a biological system as a whole.127
These sample types are commonly described
as ‘integrative body fluids’ and represent the net metabolic outflow and uptake of every tissue
and organ in the body (and renal function and glomerular filtration, in the case of urine).127
Nevertheless, these samples may not accurately reflect pathophysiological changes in specific
tissues or cells that could still have important implications in many disease states, including
hypertension. For instance, local tissue renin-angiotensin systems (RAS) that are believed to
play a role in systemic BP control 128
may not mediate changes in tissue metabolite exchange
at a level that could be detected in serum by current methods. In this case, tissue samples may
provide valuable additional information; however, biopsies present ethical and technical
challenges that can be difficult to meet.129
For example, metabolites that are substrates for
enzymes with rapid turnover rates may be significantly degraded in the time taken to extract a
biopsy and freeze it.130
In addition, many tissues are compositionally heterogeneous (e.g.
skeletal muscle is a mix of myocytes, fibroblasts, adipocytes and satellite cells); this
complicates interpretation of the metabolic profile.129
One strategy to address this is to
establish primary cultures of specific cell types from biopsies and profile these.
Sample acquisition and sample handling. Different sample acquisition and subsequent
handling can introduce systematic bias into data that may consequently interfere with the
metabolomics analysis and possibly produce false discoveries. The process of sampling (e.g.
invasive vs. non-invasive techniques) may produce different metabolic patterns as it has been
shown that invasive techniques such as venepuncture may increase blood levels of
catecholamine due to subject’s anxiety or fear of needles.131
Many studies have also reported
the influence of diurnal variations (daytime vs. night-time) on metabolite profiles, and hence,
the sampling time should be consistent; particularly in longitudinal investigations.106

27
Consumption of a standard diet before the sample collection may also reduce the inter-
subjects variations, as differences in diet may cause metabolic changes (especially in urine
metabolites) that may be difficult to differentiate from normal physiological variations.132
Table 2.1 Strengths and weaknesses of example sample types used in metabolomics analysis
Strengths Weaknesses Blood Provides a metabolic overview or
‘footprint’ of a biological system
as a whole.
Easy, minimally invasive sample
collection.
Reflects changes in tissue
metabolism almost immediately.
Requires deproteination for mass
spectrometry.
May not reflect tissue-level changes.
Changes in intra/inter-tissue metabolite
flux may not appear.
Urine Provides a metabolic overview or
‘footprint’ of a biological system
as a whole.
Easy, non-invasive sample
collection.
Less complex biological fluid
composition compared to blood (at
least in healthy subjects).
Represents a period of several hours of
systemic metabolism, so not able to
provide metabolic information at smaller
timescales.
Contains high urea concentrations
harmful to GC-MS instrumentation.
Can contain protein in diseased
individuals which can interfere with
analysis.
Variable pH a challenge for NMR
analysis.
Tissue Provides highly selective
metabolite information.
Technically demanding, time consuming
and expensive sample collection.
Complex and experimentally difficult
metabolite extraction.
Usually more than 20 mg of tissue is
required.
Delays in quenching metabolism can
significantly affect results.
Primary
cell
culture
Homogeneous.
Can be subjected to further
experimentation.
Phenotype can depart from host.
Sufficient quantity of cell material for
NMR can be challenging.
Blood requires an additional step of preparation to allow separation of serum or plasma which
is recognised as one of the major sources of pre-analytical variation in blood-based
metabolomics studies. The selection of tubes containing appropriate anticoagulants (lithium

28
heparin, potassium ethylenediamine-tetra-acetic acid-EDTA and citrate) for plasma collection
is vital as these substances differently affect detection of endogenous metabolites.133
Citrate
and EDTA produce various large peaks in the NMR spectrum that selectively mask smaller
endogenous metabolite peaks and inhibit information recovery in downstream metabolomics
analysis.133
However, lithium heparin (recommended for plasma collection) produces only a
weak and broad peak (from polysaccharide metabolites) and does not significantly mask
metabolites of importance.133
Also, MS-based metabolomics studies have found that
commercially available tubes for serum collection with gel separators shed polymeric
substances into blood samples that may cause artificially high levels of analytes and produce
false results.134
The time interval between blood sample collection and cell separation (centrifugation) can
also impact on metabolite composition. The optimal time is considered to be no more than 35
minutes and preferably over ice, as longer waiting time may increase lactate levels due to
continued glucose metabolism in blood cells.135
Many studies have also examined the impact
of the short- and medium-term storage of samples (up to 13 months) and shown minimal
impact on metabolic profiles.136
However, limited data is available on long-term storage,
although a recent pilot study of heparinised bovine plasma samples stored for up to 15 years
reported minimal effects.137
Nevertheless, experience in our laboratory suggests that some
metabolites may degrade rapidly at -20°C. Stability of samples stored for extended periods of
time still has to be fully investigated. Differences caused by freeze-thaw cycles were found to
be minimal; however, repeated freeze-thaw steps should be avoided.138
Metabolite extraction. Serum and plasma are complex biological biofluids consisting of low
molecular weight metabolites (organic and inorganic) that are present in a manifold range of
concentrations combined with high molecular weight lipids and proteins. Thus, an additional
step of metabolite extraction is often required.124
The type of metabolite extraction is largely
dependent on the metabolites of interest (and budget!), and numerous studies have
investigated different methods and organic solvents for extraction and separation of polar and
nonpolar metabolites (ethanol, methanol, acetonitrile or acetone). However, we have found
that the addition of cold methanol in a ratio of 3:1 (vol/vol) is highly efficient in metabolite
extraction and protein depletion, while remaining straightforward to perform (as reported by
others).124
Urine samples have less complex biological composition compared to blood
samples and usually do not require additional metabolite extraction steps due to low protein

29
content (except for diseased patients that may have high levels of proteins and consequently
interfere with the analysis).121
However, a disadvantage of urine samples is high urea levels
which may damage GC-MS instruments, as well as the presence of magnesium and calcium
that bind with various metabolites and broaden NMR resonances.121
Buffers are also typically
required to minimize peak-shifting in NMR spectra due to large variations in urinary pH.
Traditionally, tissue analysis also requires laborious metabolite extraction including
homogenization and lysation of cell walls to release the metabolites.129
However, high
resolution magic-angle spinning 1H NMR spectroscopy can be used for analysis of intact
tissues and is possible even without any pre-treatment of samples.139
Data acquisition and data normalisation. A number of technical issues can introduce
systematic bias in metabolomics studies. These mostly relate to mass spectrometry; a great
strength of NMR is the relative analytical robustness and reproducibility. In small-scale
studies when the number of samples is low (< 100), samples can be analysed in a single batch
in a relatively short time period. However, large-scale studies require more care when
designing the analytical protocol, especially in MS-based studies, due to low instrument day-
to-day reproducibility; several groups (including ours) experience signal attenuation over
time as samples directly interact with the instrument. In these cases, samples should be
analysed in multiple batches (up to 60 study samples per batch), with three to five study
samples bracketed with quality controls (QC) and regular instrument cleaning.124
There are
three types of QC samples used in metabolomics studies:
1. Pooled QC samples consisting of small aliquots taken from each study sample (good
representation of the composition of study samples),
2. Predetermined mixtures of ‘representative’ metabolites,
3. Commercially available samples.
Profiles of QC samples can be analysed later to ensure analytical consistency, and correct for
systematic drift where it exists.124
Computational methods are also being developed to
address these issues, in our lab and elsewhere. Even in small-scale studies, it is critical to
distribute experimental and control samples evenly throughout an MS run to reduce the risk
of systematic bias.
Study design in metabolomics research
Given that full coverage of the metabolome is not currently possible (and may never be),
there are two approaches to metabolomics research, termed untargeted and targeted analysis,

30
respectively.121
Targeted analysis was discussed briefly above. Untargeted analysis, or
metabolic profiling, comprises an agnostic profile of as wide a range as possible of
metabolites (tens to thousands) within the biological system.121
The advantage of this
approach is that it allows the detection of previously unpredicted metabolic perturbations and
discriminatory metabolites (potential disease biomarkers) associated with a certain disease (or
condition). To conduct an untargeted metabolomics experiment, one designs analytical
approaches that allow the unbiased detection of as wide a range of metabolites as possible.
Metabolic ‘features’ that discriminate between conditions (e.g. individuals diagnosed with
disease, such as hypertension, and their healthy-matched controls)112
are identified, and these
features are then annotated (i.e. the corresponding metabolites are unambiguously identified).
Untargeted analysis does not require prior knowledge of biologically relevant metabolites and
is usually referred to as hypothesis-generating or discovery-phase experimentation.140
In
contrast to this approach, targeted methods aim to measure a more focused number of
previously defined metabolites (e.g. metabolites from a single metabolic pathway or a
specific class of small molecule, such as glycero-phospholipids) in order to test a previously
defined scientific hypothesis (however broad) or perhaps validate a biomarker or biomarkers
(usually identified in an earlier untargeted experiment).121
The advantages of targeted over
untargeted methods are: i) that detection and quantification can be robustly validated in
advance (particularly if MS is the technical platform) and; ii) they do not require post-hoc
metabolite annotation (as this is a component of the initial technical development phase). The
advantage of untargeted methods is that they are able to identify completely novel
compounds and pathways without recourse to an a priori hypothesis.
The sample size required to detect differences between two phenotypes in metabolomics
studies varies and is predicated, as ever, on two factors: first, the effect size; and second, the
metabolic homogeneity of the biological system under study (e.g. laboratory animals vs.
humans).141
Metabolomics analyses in laboratory animals are usually conducted in a small
number of samples (up to 20 in total),105, 106
as these animals are often homogeneous, are kept
under well-controlled conditions (e.g. controlled humidity, temperature, light exposure, diet),
and so the influence of genetics, environment and diet on their metabolic profile is
(hopefully) minimized. The resulting reduction in inter-individual variability means that
orthogonal differences (i.e. those due to treatment or experimental intervention) should be
more readily detectable. However, one should always be alert to the law of unintended

31
consequences: the possibility that other factors related to different animal models (e.g.
normotensive versus hypertensive rats) cannot be excluded.142
On the other hand,
considerable variation in genetic, environmental, and dietary factors in humans provides
significant diversity in individual phenotypes (large inter- and intra- individual variability)
and, consequently, in metabolomic profiles.113, 143
That being the case, slight but clinically
important effects in disease states may not be detected if studies are underpowered.141
Thus, a
significantly larger number of samples are required in human studies if effect sizes are
unknown in advance, sometimes to the extent of epidemiological proportions (i.e. 100s to
1000s).141
Besides potentially being underpowered, confounding factors and comorbidities in complex
diseases such as hypertension, can also hinder interpretation of results.144
For example, statin
treatment, hormonal status, exercise/cardiorespiratory fitness and gender are all known to
change the lipid profile in human serum and, thus, a diagnosis of disease based on lipids may
also be affected.144-147
Furthermore, hypertension is associated with the development of other
CV, cerebrovascular and renal complications that create unique signatures in the metabolic
profile.148, 149
The influence of these potential confounders should be taken into consideration
when identifying the study subjects and interpreting the results. Careful characterisation of
the phenotype under examination using standardized methods and matching disease-case
subjects with healthy controls by known confounders (e.g. age, gender, ethnicity or body
mass index) would be the preferred approach in human metabolomics studies to address these
limitations.141
2.2.4 Metabolomics in hypertension research
Studies in animals
In hypertension research, metabolomics has mostly been used in animal models such as
spontaneously hypertensive rats (SHR), as their pathophysiological processes have been
recognised as similar to those of essential hypertension.150
The BP in SHR (typically
measured by the tail-cuff method) gradually rises with aging and becomes significantly
increased after approximately 10 weeks of age when compared with healthy-matched
normotensive pairs (e.g. Wistar Kyoto; WKY).150
Akira et al105
analyzed urine samples of six
SHR in the developing stage of hypertension (eight-weeks old) on the assumption that
metabolic perturbations during this early-life phase would provide insights to the

32
pathogenesis of hypertension. Using NMR-based metabolomics and Principal Component
Analysis (PCA), urine levels of citrate and α-ketoglutarate were decreased in SHR compared
with WKY, presumably resulting from early metabolic perturbations of the citric acid cycle
(Krebs cycle) in SHR - a common metabolic pathway for the oxidation of carbohydrates,
lipids and proteins in which these two metabolites are intermediates.105
Metabolic
impairments of the citric acid cycle with the increased levels of succinate were also noticed in
slightly older male SHR (10 weeks of age) when compared with healthy normotensive
control animals.106
Recent work has confirmed the presence of the succinate receptors GPR91
in macula densa cells of the juxtaglomerular apparatus in kidneys, through which succinate
can regulate renin release - an initial step in the activation of RAS.151, 152
Thus, increased
levels of plasma (and hence urinary) succinate could have an influential role in modulating
body fluid homeostasis and BP via the activation of these receptors.
Metabolomics has also been applied to stroke-prone SHR (SHRSP) models that typically
develop severe hypertension.107
Increased levels of taurine and creatine have been found in
SHRSP rats at 12 and 26 weeks of age using NMR-based metabolomics.107
These findings
are difficult to place in context with previous studies (although mostly conducted in humans)
in which decreased (rather than increased) urinary levels of taurine have been linked with
essential hypertension.153
Furthermore, an oral administration of taurine attenuated BP of
patients with hypertension,154
as well as SHR and SHRSP rats,155
possibly via actions on the
local RAS in the brain.156
Differences in the metabolism of taurine between humans and
animals, as well as the possibility of altered renal handling of taurine (and creatine) in the
SHRSP model may potentially explain these contradictory findings. However, targeted
metabolomics analysis using an LC-NMR method in the same study samples identified a
novel urinary metabolite, succinyl-taurine, that was only detected in WKY urine.157
The
absence of succinyl-taurine in SHRSP rats, as well as the structural similarity with the
hypotensive-acting taurine, may elucidate the involvement of succinyl-taurine in the
regulation of BP in these rat models; however, the pathophysiological significance of
succinyl-taurine still remains to be examined.
A profound set of metabolic differences between hypertensive and normotensive rat models
were also reflected in blood samples. A GC/time-of-flight (TOF)-MS-based metabolomics
study investigated age/hypertension-related metabolic changes in blood plasma samples from
10 to 18 weeks of age in SHR compared with WKY controls.109
Similar age-related changes

33
in many metabolic compounds (e.g. decrease in amino acids: serine, methionine, ornithine,
phenylalanine and an increase in lysine) were detected in both animal models. However, an
increase in free fatty acids (FFA) including oleic, linoleic, hexadecanoid and stearic acids
were noted in SHR only, along with the rise in BP levels from 10 to 18 weeks of age,
indicating a possible role of perturbed FFA metabolism in BP regulation. Indeed, normalised
peak areas of increased levels of FFA (oleic, linoleic and palmitic acids) in SHR significantly
correlated with systolic BP values on multiple regression analysis in the GC/TOF-MS-based
metabolomics study of Aa et al.108
These investigators have also demonstrated that standard
antihypertensive therapy (angiotensin-converting enzyme inhibition [captopril], calcium
channel blockade [amlodipine], α1-adrenoreceptor blockade [terazosin] and diuretic
[hydrochlorothiazide]) significantly reduced BP in SHRs, as expected, but treatment had
minimal effects on the increased FFA levels.108
However, total ginsenosides (extracts of the
medicinal plant, ginseng, purported to have beneficial antihypertensive properties through
unknown mechanisms) caused not only a sustained reduction in BP that persisted even after
the withdrawal of therapy, but also down-regulated the increased FFA levels toward normal
levels.108
Therefore, FFA regulation may have some role in maintaining BP control, but his
remains to be fully tested.
Studies in humans
As with animal work, the number of metabolomics studies related to hypertension in humans
is limited. Among the first was an NMR- and PCA-based metabolomics analysis designed to
investigate whether it was possible to distinguish between different BP categories based on
metabolic profile.110
Only 64 individuals were studied and these participants were classified
into three BP categories (low/normal [≤ 130 mmHg], borderline [131-149 mmHg] and high
systolic BP [≥ 150 mmHg]) based on a single BP measurement taken in a hospital
environment.110
Investigators used Orthogonal Signal Correction (a filtering method) on the
NMR data to minimize/remove the differences between the samples unrelated to BP, and the
model was validated against over-fitting using the SIMCA method.110
Interestingly, the PCA
scores showed many similarities in serum metabolic profiles between subjects in borderline
and high systolic BP categories, whereas regions of NMR spectra attributed to different lipids
(in particular lipoproteins associated with very low-density [VLDL] and low-density [LDL]
cholesterol) clearly distinguished the borderline/high BP categories from the low/normal BP
category (lipids being higher in the higher BP categories).110
This tends to imply that

34
metabolic changes related to BP (e.g. lipids abnormalities) might be evident in blood samples
before overt BP elevation. However, a limitation of this work was reliance on one in-hospital
BP reading to classify BP status, which is a low standard of assessment and likely to
misclassify true BP. In any case, the findings are generally supportive of many studies that
have reported relationships between plasma lipoprotein abnormalities (e.g. increased levels of
total cholesterol, high density lipoprotein subfraction HDL3, apolipoprotein B, and
lipoprotein a) and raised BP, or other vascular abnormalities related to hypertension, such as
increased arterial stiffness.87, 98
Similar to the animal hypertensive models, GC/TOF MS-based metabolomics analysis has
showed significantly increased serum FFA levels (heptanoic, oleic, nonanoic, eicosanoic and
hexanoic acids) in 34 elderly patients diagnosed with hypertension compared to 29 age-
matched normotensive controls; however, limited information was provided as to how BP
measures were acquired.111
Although still unknown, some explanations for the causal
relationship between FFA and the development of hypertension have been proposed. FFA
may promote adverse effects on neurovascular tone by increasing the sensitivity of α1-
adrenoreceptors and sympathetic drive or have inhibiting effects on endothelium-dependent
vasodilatation and endothelial nitric-oxide synthase.158
Furthermore, increased levels of FFA
may potentially change membrane fluidity by altering the Na+
K+
ATPase pump, Na+, K
+ and
Ca2+
currents, as well as the structure of membrane phospholipids and increase intracellular
levels of Na+ and Ca
2+ (mechanisms that lead to increased vascular muscle tone and
consequently BP).159
These findings also lend support to epidemiological studies in which
FFA have been demonstrated to be independent risk factors for the development of
hypertension, even after correcting for known confounders, such as body mass index, weight
change, and baseline BP.160
Besides increased levels of FFA, altered carbohydrate
metabolism (including high levels of glucose and galactose, and decreased levels of fructose)
was also found in patients with hypertension compared to normotensive controls,111
confirming the already known information on the high prevalence of impaired glucose
tolerance in patients with essential hypertension.161
People with an already established T2DM have high BP (affecting up to 40% of newly
diagnosed T2DM patients)162
and also develop premature vascular aging and arterial
structural remodelling, most likely due to underlying metabolic irregularities.92
An
increasing number of metabolomics studies have been conducted in people with T2DM to

35
detect the underlying metabolic disturbances in this population, and to investigate their
associations with CV complications.163
Besides identifying alterations of carbohydrate and
lipid metabolism, metabolomics studies have also revealed abnormalities in tricarboxylic
acid, amino acid and bile acid metabolism.164
These metabolic disturbances may adversely
impact on arterial function and possibly contribute to CV complications (including high
BP).87
Indeed, a metabolomics study in the Framingham Offspring cohort showed that
increased levels of three amino acids (isoleucine, tyrosine and phenylalanine) were
significantly associated with the future development of CV disease, independent of standard
CV disease and diabetes risk factors.165
Also, a cross-sectional analysis in individuals free of
CV disease reported that each increase in the score of the same three amino acids was
associated with a higher risk of having subclinical carotid atherosclerosis.166
A more recent
study by Ha et al167
also demonstrated increased levels of three amino acids in people with
T2DM, as well as of lysophosphatidylcholines (lysoPC; intermediates of lipid metabolism),
with levels significantly and positively correlated with the brachial pulse wave velocity
(PWV; a measure of arterial stiffness). These findings may suggest that the association
between metabolic abnormalities and the progression of CV complications may be mediated
by irregularities in vascular function, although more studies are needed to investigate the
causal mechanisms. Chapter 6 of this thesis represents one of the first studies using
untargeted metabolomics analysis to investigate the relationships between abnormal
metabolic profile in people with T2DM and arterial/hemodynamic measures under resting
and exercise conditions. This was done toprovide mechanistic insights of CV complications
and high BP in people with T2DM.
Other BP metabolomics studies have also provided some evidence for the role of
inflammation as a contributing factor in the development of hypertension. The acute phase
inflammatory protein α-1 acid glycoprotein was at an increased level in a group of 40 patients
with hypertension (defined as resting BP ≥ 140/90 mmHg) compared with 40 healthy
controls (defined as resting BP < 130/80 mmHg).112
Inflammation may cause vascular
endothelial dysfunction and modifications in the synthesis and degradation of endothelial
vasodilators and vasoconstrictors and, consequently, influence the regulation of BP.168
This
was a robust metabolomics study in terms of appropriate methods to define hypertension
(triplicate measures of BP on each arm recorded at seated rest) and minimize the effects of
potential confounders related to disease (two groups were well-matched by all known risk
36
factors). There are also some indications that metabolites associated with diet and gut
microbial activity might also be linked to BP regulation.113
A large-scale hypertension-
metabolomics study conducted in 4630 subjects across four populations (United Kingdom,
United States of America, China and Japan) has reported an inverse association between
urinary excretion of formate (a by-product of fermentation of dietary fibre by the gut
microbiome) and both systolic and diastolic BP, whereas alanine (being higher in people who
consume predominantly a diet high in meat products) had a positive association with BP.
Furthermore, hippurate (a normal constituent of urine typically increased with dietary
consumption of phenolic compounds) had an inverse association with BP.113
This finding is
in agreement with the previous work in the SHR model in which decreased urine levels of
hippurate were observed when compared with control WKY rats, even though both rat strains
were fed under the same conditions.105
The most recent human BP metabolomics study was
in a population of 896 normotensive black men and women who were followed over 10
years.114
In this study, a 1SD difference in serum metabolite 4-hydroxyhippurate (also an
end-product of polyphenol metabolism by the intestine microflora) was associated with 17%
higher risk of developing hypertension, even after correcting for conventional risk factors that
included baseline BP.114
Several metabolomics studies have been conducted in preeclampsia.169-172
This condition is
characterised by maternal hypertension and proteinuria. It affects 3-5% of pregnancies
annually and is one of the main causes of foetal and maternal morbidity and mortality
worldwide.173
Essential hypertension and preeclampsia share numerous features including
organ damage (renal and endothelial dysfunction), multifactorial origin and risk factors for
future development of CV disease.173
A UPLC-MS-based metabolomics study showed
metabolic perturbations in 60 women at 15 ± 1 weeks of gestation that subsequently
developed preeclampsia.169
Forty five metabolites from 11 metabolic classes were
significantly different in the plasma from women with preeclampsia (including amino acids,
carnitines, fatty acids, lipids, phospholipids and carbohydrates). A more recent LC-MS-based
metabolomics study in 41 women that developed preeclampsia also found carnitine
(hydroxyhexanoylcarnitine) and amino acids (alanine, phenylalanine and glutamate) to be
elevated compared to healthy controls.170
Badaho-Singh et al171
used NMR-based
metabolomics to identify 20 discriminatory metabolites from which a set of four metabolites
(citrate, glycerol, hydroxyisovalerate and methionine) was predictive of preeclampsia.171
The

37
same group also identified glycerol and carnitine to discriminate late-onset preeclampsia.172
These findings implicate abnormal lipid metabolism in the pathogenesis of preeclampsia,
although much work remains to be done. Taken altogether, the utilisation of metabolomics in
hypertension research highlights the potential for revealing the underlying (suspected and
possibly unknown) pathophysiological processes of hypertension, but there is still much to be
done.
2.2.5 Future directions
Better definition of the hypertensive phenotype
Along with the analytical, technical and study design improvements, future directions in
human metabolomics studies should include much stronger characterisation of the
hypertensive phenotype than attempted to date. Dissimilar (and in some cases inadequate)
methods to assess BP in previous metabolomics studies could have led to inappropriate
interpretation of results. If we consider the high prevalence of white coat hypertension and
masked hypertension in the general community (15% and 19%, respectively),22, 174
accurate
office BP as well as the consideration of out-of-office BP measurements are essential to
appropriately evaluate BP status.23
Individuals with masked hypertension have almost equal
CV risk21
and may have similar metabolic profiles to those having sustained hypertension. On
the other hand, individuals with white coat hypertension that experience an exaggerated
sympathetic nervous system response to an experimental intervention may be prone to an
acute elevation of FFA at the time of BP measurement (due to the activation of a hormone-
sensitive lipase by adrenaline),175
and this could potentially lead to spurious metabolomics
conclusions. Importantly, the development of hypertension is usually accompanied by arterial
structural remodelling, increased large artery stiffness and central systolic BP.176
Thus,
rigorous BP examination that also includes measures of arterial stiffness and central BP could
uncover important mechanistic insights when combined with metabolomics analyses.10, 177
Furthermore, metabolomics may also prove to be a powerful tool for the detection of early
signs of target organ damage, such as renal, heart or cerebrovascular complications that
produce distinctive signatures in the metabolic profiles, even before disease symptoms are
observed and medical attention is required.

38
Metabolomics in clinical trials
Clinical trials conducted even decades ago have produced blood samples for subsequent
disease phenotyping or disease risk studies. These remain in storage and may contain clinical
information that can be recovered using metabolomics methods. Although the capital cost of
instruments such as NMR magnets or high-resolution mass spectrometers is very high (more
than $100000 per instrument), these analytical platforms are often already available to
researchers (e.g. in chemistry departments) and can provide NMR or MS analysis at
reasonably low cost (approximately $15-20 per sample). This potentially allows the
application of metabolomics profiling to large-scale sets of study samples. A word of caution,
however; although metabolomics data is relatively easy to acquire, robust analysis is a far
greater technical challenge that requires significant experience in the field. Further, the highly
dynamic nature of the metabolome and the significant influences that may arise from
different sample acquisition, handling and storage methods may set some limitations for the
use of samples acquired for other purposes (as previously described). Only samples collected,
handled and stored in standard and identical ways may be directly compared using
metabolomics methods, as any variations in sample handling would introduce systematic bias
into the data and potentially produce spurious findings.124
It is also important that in case-
control studies, case and control samples were not collected at different centres, as this may
also produce differences in metabolite patterns that should not be assigned to disease
exposure.124
Finally, citrate and EDTA have been widely used as anticoagulants for plasma
collection in most clinical trials but are generally not recommended for metabolomics
analysis; yet in this last case, samples can still often be used and significant and valuable
biological information recovered effectively.133
Reproducible standard operating procedures that define the protocols for sample collection,
handling and storage are important for clinical trials planning on analysis of the samples
collected over extended time periods (several months or years for some clinical trials) and at
different study centres.124
The Human Serum Metabolome (HUSERMET) project is an
example in which samples are collected at different study cites in a reproducible and standard
way and analysed in multiple analytical experiments and integrated into a single data set.124
Quality control samples are implemented and used throughout the course of the study to
provide the robust quality assurance.

39
Biomarker discovery
Biomarkers are widely used diagnostic tools for the evaluation of normal physiological
conditions, as well as the presence of pathophysiological processes.178
Given that metabolic
perturbations associated with hypertension are most likely to develop before hypertension is
detected by standard methods (rise in upper arm BP), a reliable biomarker and/or several
biomarkers/metabolic patterns (due to the complexity of the underlying pathophysiological
mechanisms associated with hypertension) that may elucidate early stage development of
hypertension would represent a major clinical advance. To date, none of the potential
metabolomic biomarkers have transitioned to being clinically useable. Moreover, abnormal
metabolic patterns such as that associated with lipid metabolism do not provide significant
improvements over well-established risk factors such as standard lipid profiles. This is a
problem of all biomarker research, 179
but does not detract from the possibility that useful
hypertension biomarkers of could yet be discovered to allow detection of early pathological
changes beyond conventional risk factors.
Pharmacometabolomics
Pharmacometabolomics is a promising new field in metabolomics that uses the profiling of
metabolites in body fluids (blood or urine) before drug treatment to predict patient responses
to therapy, including drug metabolism, efficacy and adverse effects.180-182
Since
pharmacometabolomics offers the possibility to optimize treatment more effectively
according to the metabolic profile of each individual and avoid adverse drug effects, this
approach has major potential for developing personalized drug treatment.182
As hypertension
represents the most prevalent chronic condition worldwide with high costs of prescribed
medications and health care services, individual tailored treatment could provide substantial
benefits, not only in terms of efficacy and safety of drug treatment, but also in terms of cost
savings and treatment efficiency. Further investigations in pharmacometabolomics will also
be required to determine the metabolic effects of multiple drug usage, as polypharmacy is
common in hypertension management.
2.2.6 Conclusions
Metabolomics in hypertension research has the potential to provide new insights into the
underlying pathophysiological processes associated with hypertension, detect early metabolic
perturbations (biomarkers) and monitor the efficacy and effects of drug (and other) therapies.

40
Future metabolomics studies should, however, include a more comprehensive physiological
(phenotypic) assessment of BP, alongside more robust determination of BP control category.
Although this review focused only on one part of the systems biology paradigm in the study
of hypertension, metabolomics should also be interpreted in combination with other system
biology methods such as computation, genomics, transcriptomics and proteomics. The
genome provide predictive information regarding an individuals’ risk for the development of
hypertension at any stages of life, as the genetic code itself remains stable and unchanged
throughout life. On the other hand, other components of system biology such as
transcriptome, proteome and metabolome change noticeably in parallel with the disease
developments, as well as therapeutic measures, and therefore would be more appropriate to
characterise the disease process while they integrate with environmental factors and genetic
predisposition. Up until recently, big emphasis was placed on transcriptomics and
proteomics; however, with the further development of analytical techniques and
bioinformatics, the role of metabolomics among other system biology fields is expected to
continue to grow.
2.3 Review of literature summary and overall thesis aim
An HRE during moderate intensity exercise is associated with an increased CV risk,
irrespective of normal resting BP. The incidence of an HRE varies between different
populations, but it is highly prevalent in people with masked hypertension and T2DM,
reported to be more than 50%. The underlying mechanisms of an HRE and associated
increased CV risk are unknown, although previous studies suggested that this may be due to
abnormalities in haemodynamic, haemostatic and/or metabolic factors. Increased aortic
stiffness and impaired endothelial dysfunction are widely believed haemodynamic
contributing factors to an HRE. However, most of the previous studies included people with
already developed essential hypertension, which may have led to spurious results.
Furthermore, impaired haemostasis is present in people with hypertension, associated with
increased CV events and correlated with high BP (rest and ambulatory BP), but still little is
known about haemostasis in people with an HRE. Exaggerated exercise BP has been found to
be associated with metabolic CV risk factors including elevated lipids and glucose
intolerance, and importantly, the recent developments of metabolomics analysis have offered
opportunities for exploring new insights into the underlying pathophysiological processes
associated with high BP. The underlying contributors of an HRE are still unclear, but it is

41
important to understand this condition in order to improve detection of individuals with an
increased CV risk, reduce the CV risk in these people and potentially develop new treatment
strategies; therefore, the overall aim of this thesis was:
To explore the haemodynamic and biochemical (haemostatic and metabolic) correlates of
an HRE.
Each Chapter contains specific aims (outlined below) which contribute to the overall thesis
aim. This is specifically outlined at the end of each thesis Chapter.
Aim 1. To investigate the haemostatic and haemodynamic abnormalities in individuals with
an HRE and determine their relationships with exercise BP
Hypothesis 1. Individuals with an HRE will have haemostatic abnormalities (in
particular raised haemostatic markers that reflect endothelial dysfunction) compared
to individuals with normotensive response to exercise and these markers will be
significantly associated with exercise BP
Hypothesis 2. Individuals with an HRE will have arterial haemodynamic
abnormalities (e.g. increased arterial stiffness and systemic vascular resistance)
compared to individuals with normotensive response to exercise and these
haemodynamic measures will be significantly associated with exercise BP
Aim 2. To develop the methodology regarding metabolomics analysis and to explore the
metabolic actions of the aldosterone antagonist spironolactone on exercise BP and aortic
stiffness in individuals with an HRE
Hypothesis 1. Aldosterone antagonist spironolactone will reduce exercise BP and
aortic stiffness via BP-independent effects of spironolactone
Hypothesis 2. The reduction in aortic stiffness by spironolactone treatment will be
significantly associated with the reduction in exercise BP
Aim 3. To investigate the metabolic abnormalities in a population with the high prevalence of
an HRE (people with T2DM) using untargeted metabolomics analysis and determine their
relationships with exercise BP (peripheral and central)
Hypothesis 1. Individuals with T2DM will have metabolic abnormalities (including
increased levels of glucose, fructose and lactate) compared to non-diabetic individuals
and these metabolic markers will be significantly associated with exercise BP

42
Chapter 3. Methodology
This chapter describes methodology involved in examining the haemodynamic, haemostatic,
and metabolic contributors of a hypertensive response of exercise in all studies that comprise
this thesis.

43
3.1 Introduction
Validated and highly reproducible haemodynamic measures were included in most of the
chapters in this thesis, as individually described below. Haemostatic markers were measured
in the study within Chapter 4 and included standard haemostatic protocols and measures.
Importantly, a significant part of this research program also involved development of the
protocol regarding resting blood pressure (BP) measurements (the details described in 3.2.1
section), as well as metabolomics analysis. Metabolomics analysis is still in its infancy, and
despite a lot of effort employed worldwide from various research groups, standard protocols
and operating procedures involving the sample preparation, sample analysis and data analysis
in metabolomics analysis are still not clearly defined. Inappropriate sample preparation and
subsequent data analysis can introduce systematic bias into data that may consequently
interfere with the metabolomics analysis and possibly produce false discoveries. Therefore, in
order to apply metabolomics analysis to explore metabolic contributors of a hypertensive
response to exercise (HRE), we first had to define the protocols that would be used for the
subsequent analysis of study data (used in Chapter 5 and Chapter 6). In section 3.4, the final
protocols for the sample preparation, sample analysis and data analysis are described, and in
Appendix 2, a novel method for the normalisation of metabolomics data is presented as a
separate study.
3.2 Haemodynamic variables
3.2.1 Office brachial blood pressure
Resting office brachial BP was measured using a validated semi-automated oscillometric
device183
(Omron HEM-907; OMRON Europe B.V. (OMCE), Hoofddorp, The Netherlands)
or a validated mercury-free manual sphygmomanometer (UM-101B, A&D Medical,
Thebarton, South Australia).184
Office brachial BP was measured by a trained non-clinician in
duplicate and the mean of these two readings was used for subsequent analysis. Brachial
pulse pressure (PP) was calculated as the difference between brachial systolic and diastolic
BP. As number of factors may influence the BP measurement such as room temperature,
background noise, alcohol or nicotine consumption,4 participants were examined in a quiet
and temperature-controlled room. Participants were also asked to refrain from consuming
heavy meals and caffeine or smoking for at least three hours prior to examination and avoid

44
exercise on a day of examination. Blood pressure was measured in accordance with
guidelines, using an appropriately sized cuff with the arm supported at heart level.4
Current guidelines for the management of hypertension recommend that office brachial blood
pressure (BP) should be optimally measured after five minutes of rest,4 but brachial BP may
decrease for up to 10 minutes of rest before reaching a plateau level.185, 186
In setting up the
protocol for BP measurements for our studies, we conducted a retrospective analysis of data
collected in the BP GUIDE study (http://www.anzctr.org.au; ACTRN12608000041358) in
which brachial BP was measured after five and 10 minutes of rest to determine the most
appropriate time for BP measurements.13
We found that BP recorded after 10 minutes was
more representative of true blood pressure control which was assessed by comparison with
patients’ out-of-office BP (regarded as a ‘gold-standard’ measure of BP).13
Also, BP recorded
at 10 minutes but not after the conventional five minute wait was highly associated to BP-
related end-organ damage such as left ventricular (LV) mass.13
These findings suggest that
BP measured after the recommended five minute rest period may not be an appropriate time
for BP measurement and using this as the sole method to assess BP control may result in
misclassification or inappropriate management of some individuals. Therefore, 10 minutes
waiting period before the BP measurement was used in our studies. The results of this study
were published in the Journal of Human Hypertension and are included in the Appendix 1.
3.2.2 Exercise brachial blood pressure
Stress test brachial BP. Exercise stress tests were performed at local cardiology departments
where study participants were recruited for the Chapter 4 study. Brachial BP during the
exercise stress testing (standard Bruce protocol) was measured using either a validated
mercury-free sphygmomanometer (UM-101B, A&D Medical, Thebarton, South Australia)184
or automated device (Tango, SunTech Medical Instruments, NC, USA)187
in the final two
minutes of each three-minute exercise stage. The initial speed of the treadmill was set to 2.7
km/h and the inclination was set to 10% (stage 1). At three minute intervals, the inclination of
the treadmill was increased by 2% and the speed increased to 4.0 km/h at stage 2; 5.5 km/h at
stage 3; 6.8 km/h at stage 4 and; 8.0 km/h at stage 5.
Research clinic exercise brachial BP. Exercise brachial BP at the research clinic (moderate
intensity) was measured using a validated mercury-free sphygmomanometer (UM-101B,
A&D Medical, Thebarton, South Australia).184
Exercise was performed on an upright cycle

45
ergometer (WattBike, Wattbike Ltd, Nottingham, United Kingdom; Chapter 4) or on a
bicycle ergometer positioned on the bed in a semi-recumbent position (Chapter 6), as
described in Keith et al188
(Rehab Trainer 881, MONARK Exercise110 AB, Vansbro,
Sweden). The workload of exercise was set for each individual to achieve a heart rate of 60%
of age-predicted maximal heart rate calculated as per formula (220 - age × 0.60). Exercise
brachial BP was measured in duplicate and the mean value was used for analysis. During the
BP measurements, the participant’s arm was supported at the level of the heart using an
adjusted platform, and the participant was asked to keep the arm as still as possible.
3.2.3 Out-of-office blood pressure
24 hour ambulatory BP. A validated device (TM-2430, A&D Mercury, A&D Medical,
Thebarton, South Australia)189
was used for 24 hour ambulatory BP monitoring. Participants
were advised to maintain routine daily activities during BP monitoring and to have their arm
still and relaxed during each measurement. The device was set to record BP in previously
determined intervals (every 20 minutes during the day and every 30 minutes during the night
or every 30 minutes during the day and every hour during the night).23
The mean values of
BP measured during daytime (daytime BP), night time (night time BP) and overall 24 hour
(24 hour ambulatory BP) were used for the analysis.
Home BP. Seven-day home BP was self-measured using a validated oscillometric device
(UA-767, A&D Mercury, A&D Medical, Thebarton, South Australia).190
Participants were
instructed to take BP measurements in a warm and quite room after at least five minutes of
seated rest in a chair enabling back support, with feet flat on the ground and the arm
supported at heart level.191
Home BP was measured in duplicate in the morning (between
6am and 10am), midday and evening (between 6pm and 10pm). The first of two BP
measurements was discarded and the second BP was recorded and used for analysis.
3.2.4 Office central blood pressure
Office central BP was measured at rest, as well as during exercise, using radial applanation
tonometry and validated generalized transfer function (SphygmoCor 8.1, AtCor Medical,
Sydney, NSW).13, 14
Central BP was measured in duplicate and the mean value was used for
the analysis. Acquired pressure waveforms were calibrated by brachial BP values taken
immediately prior to applanation tonometry. Central PP was calculated as the difference
between systolic and diastolic BP (Figure 3.1). Augmentation index (AIx) was defined as the
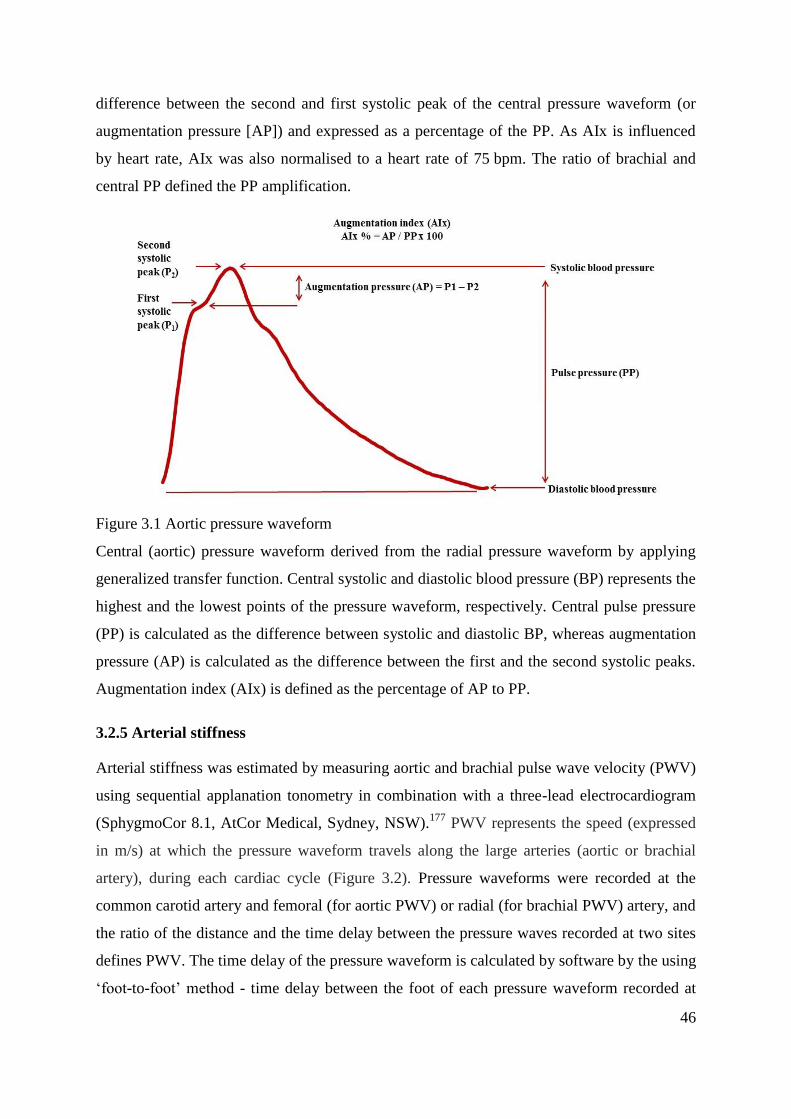
46
difference between the second and first systolic peak of the central pressure waveform (or
augmentation pressure [AP]) and expressed as a percentage of the PP. As AIx is influenced
by heart rate, AIx was also normalised to a heart rate of 75 bpm. The ratio of brachial and
central PP defined the PP amplification.
Figure 3.1 Aortic pressure waveform
Central (aortic) pressure waveform derived from the radial pressure waveform by applying
generalized transfer function. Central systolic and diastolic blood pressure (BP) represents the
highest and the lowest points of the pressure waveform, respectively. Central pulse pressure
(PP) is calculated as the difference between systolic and diastolic BP, whereas augmentation
pressure (AP) is calculated as the difference between the first and the second systolic peaks.
Augmentation index (AIx) is defined as the percentage of AP to PP.
3.2.5 Arterial stiffness
Arterial stiffness was estimated by measuring aortic and brachial pulse wave velocity (PWV)
using sequential applanation tonometry in combination with a three-lead electrocardiogram
(SphygmoCor 8.1, AtCor Medical, Sydney, NSW).177
PWV represents the speed (expressed
in m/s) at which the pressure waveform travels along the large arteries (aortic or brachial
artery), during each cardiac cycle (Figure 3.2). Pressure waveforms were recorded at the
common carotid artery and femoral (for aortic PWV) or radial (for brachial PWV) artery, and
the ratio of the distance and the time delay between the pressure waves recorded at two sites
defines PWV. The time delay of the pressure waveform is calculated by software by the using
‘foot-to-foot’ method - time delay between the foot of each pressure waveform recorded at

47
two sites. The surface distance between the two recording sites is taken as the distance
covered by the waves.
Figure 3.2 Estimation of aortic stiffness using pulse wave velocity
The ‘Foot-to-foot’ method for calculating the carotid-femoral pulse wave velocity (PWV)
which is expressed in m/s. Pressure waveforms are recorded at the common carotid and
femoral arteries and the speed of wave is calculated as the ratio of the distance (L) and the
time delay (∆t) between the pressure waveforms recorded at two sites.
Aortic PWV during moderate intensity exercise (Chapter 6) was measured in the semi-
recumbent position by the modified protocol as designed by Keith et al.188
Participants
exercised on a bicycle ergometer (Rehab Trainer 881, MONARK Exercise AB, Vansbro,
Sweden) that was placed on the bed and participants were instructed to pedal until they
achieved a heart rate of 10 beats per minute (bpm) above the set heart rate target. When the
required heart rate was reached, participants were asked to stop pedalling in order for the
femoral (or carotid) pressure waveform to be acquired by the operator. The process lasted for
approximately 15 seconds, during which time the participants heart rate declined towards the
target heart rate. Duplicate measures were acquired and the mean value was used for the
analysis.
3.2.6 Bioimpedance cardiography
Stroke volume (SV), cardiac output (CO) and systemic vascular resistance (SVR) were
measured at rest and during exercise using a validated and reproducible Physio Flow device
(Physio Flow; Manatec Biomedical; Macheren, France).192, 193
This was achieved by placing
six pre-gelled sensor electrodes on the participant’s chest and detecting changes in blood
volume and velocity during each cardiac cycle which results in changes in electrical

48
conductivity and impedance. SV was estimated as the largest change in impedance during
systole, whereas CO was defined by multiplying the heart rate (HR) with SV. SVR was
defined as the ratio of the sum of mean arterial pressure and CO.
3.3 Haemostatic and clinical biochemistry markers
Vacutainer® tubes with 3.8% sodium citrate were used for blood sample collection and
analysis of haemostatic markers including von Willebrand factor (vWf), fibrinogen, tissue
factor (TF) and thrombin-antithrombin complexes (TAT). Study participants were seated for
at least 10 minutes after which blood was drawn by venepuncture from cubital veins via an
inserted indwelling cannula to enable direct access for blood sampling during different
physiological conditions (at rest, during exercise and post-exercise). Immediately following
sample collection, the cannula was filled with heparin solution (to prevent blood clotting
within the cannula) and collected blood samples were centrifuged for 20 minutes at 2000 g to
obtain citrated plasma, with 0.5 mL aliquots stored at -80°C until analysis. Prior to analysis
of haemostatic markers, plasma samples were thawed at 37°C. TF, vWf, and TAT were
determined using commercially available immunoassays according to manufacturer’s
instructions (ELISA; Assaypro, St. Charles, MO, USA). Fibrinogen was measured using a
standardised clotting-based Clauss assay. Clotting times were measured using the STart®-4
haemostasis analyser (Diagnostica Stago, Asniéres-sur-Seine, France) and compared to
specialty assayed reference plasma (SARP, Helena Laboratories, Beaumont, TX, USA).
A fasted or non-fasted blood samples were drawn to determine standard metabolic markers
(total, low-density and high-density lipoprotein cholesterol, glucose, glycosylated
haemoglobin [HbA1c], insulin and triglycerides) and samples were analysed in local hospital
pathology laboratory, as per standard pathology procedures.
3.4 Metabolomics
3.4.1 Liquid chromatography-mass spectrometry (LC-MS)
Sample preparation. Fasting serum samples were collected and 0.5 mL aliquots were stored
at -80°C until analysis. Samples were thawed and a 100 µL aliquot of each sample was mixed
with 300 µL of ice-cold methanol, incubated at 4°C for 20 minutes and centrifuged at 13200
g for 10 minutes. The supernatant was lyophilized in a vacuum centrifuge (Labconco, Kansas
City, USA) and re-stored at -80°C. The dried samples were reconstituted in 100 µL of HPLC-

49
grade water prior to LC-MS analysis. Samples were vortexed and centrifuged for 15 minutes,
and supernatant was transferred to vials. Quality control samples were prepared by pooling
10 µL of random samples and analysed throughout the LC-MS runs (four study samples were
bracketed by two quality controls) to assess the equipment drift and ‘batch-to-batch’
variability, as recommended in the paper of Dunn et al.124
Sample analysis. Samples were analysed using an LTQ-Orbitrap XL mass spectrometer
(ThermoFisher Scientific, Bremen, Germany) controlled by XCalibur v2 software
(ThermoFisher Scientific). To prevent systematic bias, samples were randomly distributed
throughout the runs. Chromatographic separation was performed on a Waters Nova-Pak
4.0 µm C18 column (3.91x150 mm) with an injection volume of 10 µL. The mobile phases
used for the sample elution were A) 0.1% formic acid in water and B) 0.1% formic acid in
methanol, with a flow rate of 0.8 mL/minute. Gradient conditions were as follows: 0-4
minutes hold at 10% B, 4-6.5 minutes linear gradient 10-50% B, 6.5-14.5 minutes linear
gradient 50-80% B, 14.5-15.5 minutes linear gradient 80-100% B, 15.5-17.5 minutes hold at
100% B, 0.5 minutes re-equilibration in 10% B. Centroid mass spectra was acquired in full
scan mode at the resolution of 30,000 across a mass range of 50-1000 mass/charge (m/z).
Data were acquired in both positive (+) and negative (-) ionization modes. Ionization
conditions were as follows: capillary temperature of 300°C, flow rate of sheath gas of 30 au,
auxiliary gas flow rate of 5 au, capillary voltage of 7 V for (+) ion acquisition and capillary
voltage of -44 V for (-) ion acquisition. Spectra for tandem mass spectrometry (MS/MS) were
acquired using FTMS Mode at an isolation width of two mass units and collision energy of
20 V. Retention times for MS/MS targets were specified according to retention time values
acquired by LC-MS. Raw LC-MS data were converted to mzXML format. Data were then
processed for peak finding, grouping and retention time alignment using XCMS running in
the R environment (R 2.14; http://cran.r-project.org/). Karpievitch et al14
have developed and
applied a novel singular value decomposition-based method (EigenMS) for data
normalisation to detect and correct for any systematic bias, caused by different batch effects,
day-to-day variations in instrument performance, signal intensity loss due to time-dependent
effects of the LC-MS column performance, accumulation of the contaminants in the MS ion
source and MS sensitivity among others. The EigenMS normalisation technique is described
in more details in Appendix 2.

50
LC-MS data analysis. The LC-MS data was analysed by either a repeated-measures ANOVA
to compare each feature and then corrected the resulting p values using the Benjamini and
Hochberg False Discovery Rate correction194
or principal component analysis (PCA). The
LC-MS data were mean-centred and Pareto-scaled before using PCA to dimensionally reduce
the data using PLS Toolbox 6.5 (Eigenvector Research Inc., Wenatchee, US). Visual
inspection of a ‘scree’ plot of captured variance versus number of components was used to
identify the number of PC comprising each model (prior to any further analysis). Plots of
scores on each PC were visually inspected. Those that appeared to separate the groups were
compared using an independent t-test. Loading coefficients were used to identify metabolites
that significantly contributed to discriminatory PCs. In addition to PCA, individual
metabolites were compared across groups by independent t-test with the false discovery rate
held at 5% using the method of Benjamini and Hochberg.195
Features were accepted as being
significantly different if the corrected p < 0.05. Metabolomics data, when included in an
analysis with conventional data, was checked for normality and non-normally distributed data
was square-root-transformed. The LC-MS data were checked for artefacts (for example,
Fourier-transform ‘shoulders’), de-isotoped and putatively annotated using online databases
(Human Metabolome Database [HMDB] and Metlin) and the Taverna workflows of Brown et
al.196
Compounds of interest were further examined by tandem mass spectrometry (MS/MS)
to provide additional structural information and to confirm annotation, where possible, by
comparison with MS/MS spectra held in public databases.
3.4.2 Proton nuclear magnetic resonance (1H NMR) spectroscopy
Sample preparation for Bruker spectrometer operating at 800.13 MHz. Fasting serum
samples were collected and 0.5 mL aliquots were stored at -80°C until analysis. Samples
were thawed and 300 µL was added to 300 µL of D2O in a 1.5 mL Eppendorf tube. The
mixture was briefly vortexed and then centrifuged at 16606 g for five minutes after which
550 µL of the supernatant was transferred to a 5 mm NMR tube for analysis.
Sample analysis. NMR data were acquired on a Bruker Avance III spectrometer operating at
800.13 MHz (Bruker Biospin, Karlsruhe, Germany). Data were acquired with a Carr-Purcell-
Meiboom-Gill pulse sequence with presaturation during the recycle delay (2 s) and a total
echo time of 51.2 ms. The time domain was 128 k and the sweep width was 20 ppm. Data
were Fourier transformed with exponential line broadening of 0.5 Hz in the frequency
domain. Spectra were phased and baselined in Topspin 3.0 (Bruker Biospin, Karlsruhe,

51
Germany) before being imported into Matlab (Mathworks, Natick, MA) at full resolution.
Resulting spectra were normalised and bucketed using probabilistic-quotient normalisation197
and adaptive intelligent binning112
respectively, both in Matlab.
Sample preparation for Agilent/Varian Inova spectrometer operating at 400 MHz. Fasting
serum samples were collected and 0.5 mL aliquots were stored at -80 °C until analysis. A
500 µL aliquot of serum was mixed with 1 mL of methanol (2:1 v/v with original sample),
incubated in a -20°C freezer for 20 minutes and centrifuged for 10 minutes at 13,200 g.
Supernatants were dried in a vacuum centrifuge overnight (Labconco, Kansas City, USA), re-
suspended in 700 µL NMR buffer (2 mM 3-(trimethylsilyl)-1-proponesulfonic acid sodium
salt in D2O).
Sample analysis. 1H NMR spectra were acquired using an Agilent/Varian Inova 400 MHz
wide bore spectrometer (Varian Medical Systems, Palo Alto, CA, USA), in a 5mm ID-PFG
probe. Spectra were acquired with 90° pulse excitation, sweep width of 4,299 ppm and
relaxation delay of 2 seconds at 25°C. A total of 128 transients were collected into 32000
complex data points. The water resonance was set to the centre of the sweep width on the
transmitter offset and attenuated using a presaturation pulse of 2 seconds during the
relaxation delay and the mixing time (100 ms) of the NOESY pulse sequence. Resulting
spectra were normalised and bucketed using probabilistic-quotient normalisation197
and
adaptive intelligent binning112
respectively, both in Matlab.
NMR data analysis. NMR data were mean-centred and Pareto-scaled, before being analyzed
using PCA and partial least squares-discriminant analysis (PLSDA), both in PLS Toolbox
(PLS Toolbox 6.5, Eigenvector Research Inc., Wenatchee, US). Visual inspection of a ‘scree’
plot of captured variance versus number of components was used to identify the number of
PC comprising each model (prior to any further analysis). Plots of scores on each PC were
visually inspected. Those that appeared to separate the groups were compared using an
independent t-test. Loading coefficients were used to identify metabolites that significantly
contributed to discriminatory PCs. Permutation testing was used to assess whether PLSDA
models were the result of over-fitting; models were considered significant if the estimated
p < 0.05. Data processing of metabolomics data were conducted in Matlab. Features of
interest were putatively annotated using online databases HMDB and Metlin.

52
Chapter 4. Association of Von Willebrand Factor Blood
Levels with Exercise Hypertension
At the time of thesis submission, this chapter is under resubmission in European Journal of
Applied Physiology:
Sonja B. Nikolic, Murray J. Adams, Petr Otahal, Lindsay M. Edwards, James E. Sharman
This chapter reports on haemodynamic and haemostatic correlates of a hypertensive response
to exercise at moderate intensity, akin to intensity of exercise blood pressure shown to best
predict cardiovascular events, in participants with a clinical indication for exercise stress
testing.

53
4.1 Abstract
Background. A hypertensive response to moderate intensity exercise (HRE) is associated
with increased cardiovascular (CV) risk. The mechanisms of an HRE are unclear, although
previous studies suggest this may be due to haemostatic and/or haemodynamic factors. We
investigated the relationships between an HRE with haemostatic and hemodynamic indices.
Methods. Sixty four participants (aged 57 ± 10 years, 71% male) with indication for exercise
stress testing underwent CV assessment at rest and during moderate intensity exercise, from
which 20 participants developed an HRE (defined as moderate exercise systolic BP≥170
mmHg/men and ≥160 mmHg/women). Rest, during exercise and post-exercise blood samples
were analysed for haemostatic markers (von Willebrand factor (vWf), fibrinogen, thrombin-
antithrombin complexes and tissue factor), as well as haemodynamic measures of brachial
and central blood pressure (BP), aortic stiffness and systemic vascular resistance index
(SVRi).
Results. HRE participants had higher rest vWf compared with normal BP response to
exercise (NRE) participants (1927 mU/mL, 95% CI: 1240-2615, vs. 1129 mU/mL, 95% CI:
871-1386; p=0.016). VWf levels significantly decreased from rest to post-exercise in HRE
participants (p=0.005), whereas vWf levels significantly increased from rest to exercise in
NRE participants (p=0.030). HRE participants also had increased triglycerides, aortic
stiffness, resting BP and exercise SVRi (p < 0.05 for all). vWf at rest (but no other
haemostatic marker) predicted exercise brachial systolic BP (β = 0.220, p = 0.043; Adjusted
R2
= 0.451, p < 0.001) independent of age, sex, body mass index, triglycerides, resting
brachial systolic BP and aortic stiffness.
Conclusions: Increased resting blood levels of vWf are independently associated with
moderate intensity exercise systolic BP. These findings implicate abnormalities in
haemostasis as a possible factor contributing to an HRE at moderate intensity.

54
4.2 Introduction
A recent meta-analysis in people with a clinical indication for exercise stress testing showed
that those with a hypertensive response to exercise (HRE) at moderate intensity were at
greater risk for cardiovascular (CV) events and mortality independent of resting blood
pressure (BP)5. The mechanisms of an HRE are unclear, although abnormal haemostatic
and/or haemodynamic factors may play key roles. With respect to haemodynamics, an HRE
is associated with endothelial dysfunction50
and increased large artery stiffness,51
which
together may lead to raised left ventricular (LV) afterload, and ultimately affect cardiac
structural and functional characteristics.11, 25
However, little is still known on systemic
haemodynamic function (including central BP, stroke volume, cardiac output and peripheral
vascular resistance) during moderate intensity exercise in people with an HRE.
Under pathological conditions (e.g. increased shear pressure), the vascular endothelium plays
a crucial role in regulating normal haemostasis by expressing/releasing regulatory substances
of coagulation including tissue factor (TF).71
This may lead to an initiation of the coagulation
cascade, an increase in thrombin generation, and potentially CV complications. Indeed,
fibrinogen (a haemostatic marker that is elevated during coagulation) has been shown to be
associated with an increased CV risk.77
The von Willebrand factor (vWf) is also one of the
haemostatic markers that is released with endothelial damage, and is therefore proposed to be
an indicator of endothelial damage/dysfunction.79
Importantly, raised vWf is positively
associated with both systolic and diastolic BP, and is higher in patients with hypertension
compared with controls.8 VWf is also an independent correlate of increased 24-hour
ambulatory pulse pressure in select patient populations.83
Altogether, the above data raises
the possibility that irregularities of haemostasis, as well as arterial haemodynamics, may
contribute to an exaggerated exercise BP. In this study, we investigated the relationships
between haemostatic and haemodynamic markers with moderate exercise BP. We
hypothesized that haemostatic markers (vWf, TF, fibrinogen and markers of thrombin
generation) and systemic haemodynamics (including central BP, stroke volume, cardiac
output and peripheral vascular resistance) would be significantly different in people with an
HRE and significantly associated with moderate intensity exercise BP.

55
4.3 Materials and Methods
4.3.1 Study participants
The study population consisted of people with an indication for exercise stress testing who
were free from coronary artery disease. The recruitment was conducted through local hospital
cardiology departments, but all haemodynamic and haemostatic measurements (under rest
and moderate intensity exercise conditions) were collected at the research clinic on another
occasion. Participants were excluded if they were under 18 years of age, had a hypotensive
response to exercise (failure of systolic BP to increase with increasing exercise intensity) or
BP reading during exercise was not of good quality, had resting BP ≥ 140/90 mmHg when
tested at the research clinic or were unable to attend the research clinic for comprehensive
cardiovascular (CV) examination under resting and moderate intensity exercise conditions.
From 109 potential participants, several were excluded due to coronary artery disease
(n = 18), exercise hypotension (n = 1), poor quality exercise BP (cardiac nurses were not
confident with the BP reading during exercise due to movement and noise; n=15) or were
hypertensive at rest (n = 11). This left 64 participants who completed the study. The study
was approved by the Human Research Ethics Committee of the University of Tasmania.
Written informed consent was obtained from all participants and procedures were in
agreement with the Declaration of Helsinki.
4.3.2 Study protocol
All participants underwent a standard maximal intensity treadmill exercise stress test (Bruce
protocol) at local hospital cardiology departments. The initial speed of the treadmill was set
to 2.7 km/h and the inclination was set to 10% (stage 1). At three minute intervals, the
inclination of the treadmill was increased by 2% and the speed increased to 4.0 km/h at stage
2; 5.5 km/h at stage 3; 6.8 km/h at stage 4 and; 8.0 km/h at stage 5. Those meeting inclusion
criteria were invited to attend the research clinic on another occasion in the morning after an
overnight fast (scheduled as soon as possible after exercise stress testing) for cardiovascular
examination at rest and during moderate intensity exercise. An indwelling cannula was
placed in the participant’s arm to enable direct access for blood sampling of haemostatic
markers at three different conditions: 1) at rest, 2) during exercise, and 3) post-exercise.
Samples used to measure standard clinical biochemistry markers were collected at rest only.
Participants were examined in a quiet, temperature-controlled room that included

56
haemodynamic measurements of office brachial and central BP, arterial stiffness, cardiac
output, stroke volume and systemic vascular resistance index (SVRi). After resting
measurements, participants performed exercise at moderate intensity on an upright cycle
ergometer (WattBike, Wattbike Ltd, Nottingham, United Kingdom). The workload of
exercise was set for each individual to achieve a heart rate of 60% of age-predicted maximal
heart rate, simulating the moderate intensity levels achieved during exercise stress testing
(approximately stage 2, Bruce protocol), in keeping with the intensity of exercise BP shown
to best predict CV events.5 Heart rate was calculated as per the formula (220 - age × 0.60).
When steady-state heart rate was achieved, haemodynamic measurements were repeated.
Exercise brachial systolic BP levels measured at this stage were used to identify those with an
HRE. Blood samples ‘during moderate intensity exercise’ were collected immediately on
stopping exercise, and this was completed within 30 seconds. Post-exercise samples were
collected after 15 minutes of seated rest.
4.3.3 Haemostatic markers
Vacutainer® tubes with 3.8% sodium citrate were used for blood sample collection and
analysis of haemostatic markers that best reflect the coagulation activation and thrombin
generation (TF and thrombin-antithrombin complexes; TAT), abnormal vascular function
(vWf), as well as a marker previously reported to be significantly associated with adverse
cardiovascular outcomes (fibrinogen).Tubes were centrifuged immediately following sample
collection for 20 minutes at 2000 g to obtain citrated platelet-poor plasma, with 0.5 mL
aliquots stored at -80°C until analysis until batched analysis at the end of the study. Prior to
analysis of haemostatic markers, plasma samples from all participants were thawed at 37°C.
TF, vWf, and TAT were determined using commercially available immunoassays according
to manufacturer’s instructions (ELISA; Assaypro, St. Charles, MO, USA). Fibrinogen was
measured using a standardised clotting-based Clauss assay. Clotting times were measured
using the STart®-4 haemostasis analyser (Diagnostica Stago, Asniéres-sur-Seine, France)
and compared to specialty assayed reference plasma (SARP, Helena Laboratories, Beaumont,
TX, USA). All standards and controls were measured in duplicate, with participants’ samples
measured singularly. All controls for each assay were within acceptable limits. Intra- and
inter-assay coefficient of variations (CV) for immunoassays were 4.8% and 7.2% for TAT;
4.9% and 7.0% for TF; 5.0% and 7.1% for vWF, and 1.4% and <5.0% for fibrinogen.

57
4.3.4 Haemodynamic variables
A validated manual mercury-free sphygmomanometer (UM-101B, A&D Medical, Thebarton,
South Australia) 184
or automated device (Tango, SunTech Medical Instruments, NC, USA)187
were used for brachial BP measurements during exercise stress testing (in the final two
minutes of each three-minute exercise stage) at hospital cardiology departments. Seated
resting brachial BP at the research clinic was measured in duplicate after 10 minutes using a
validated semi-automated oscillometric device (Omron HEM-907; OMRON Europe B.V.
(OMCE), Hoofddorp, The Netherlands). 183
BP was measured by a trained non-clinician in
accordance with guidelines.4, 198
Exercise BP at the research clinic was measured in duplicate
using a validated mercury-free sphygmomanometer (UM-101B, A&D Medical, Thebarton,
South Australia).184
A previous study in a large sample of apparently healthy subjects,
including both men and women undertaking exercise stress testing, has defined an HRE as
the upper limits of exercise BP responses.199
The same convention was followed in this
current study conducted in a similar study population where an HRE was defined as moderate
intensity exercise systolic BP in the highest tertile of the study population (this equated to
systolic BP ≥ 170 mmHg for men and ≥ 160 mmHg for women). However, the criteria used
in this study to define an HRE may not be applicable to different study populations, such as
younger healthy individuals. Accordingly, a normotensive response to exercise (NRE) was
defined as moderate intensity exercise systolic BP in the first and second tertiles of the study
population. Central BP at rest and during moderate intensity exercise was recorded using
radial applanation tonometry and calibrated by brachial BP values taken immediately prior to
applanation tonometry (SphygmoCor 8.1, AtCor Medical, Sydney, NSW).47, 48
Pulse pressure
(PP) was defined as the difference between systolic and diastolic BP. Augmentation index
was defined as the difference between the second and first systolic peak of the central
pressure waveform (or augmentation pressure) and expressed as a percentage of the PP. The
ratio of brachial and central PP defined the PP amplification. Aortic and brachial pulse wave
velocities (measures of arterial stiffness) were measured using applanation tonometry
(SphygmoCor 8.1, AtCor Medical, Sydney, NSW).177
Cardiac output, stroke volume and
SVRi were measured using a validated and reproducible Physio Flow device (Physio Flow;
Manatec Biomedical; Macheren, France).193

58
4.3.5 Biochemical analysis
Standard pathology laboratory procedures were performed using serum samples to determine
levels of glucose, triglycerides, total, low-density lipoprotein (LDL) and high-density
lipoprotein (HDL).
4.3.6 Statistical analysis
Data are presented as mean and standard deviation unless otherwise stated. The unequal-
variance independent t-test was used to compare clinical characteristics between HRE and
NRE groups. Comparisons between categorical variables were conducted by chi-squared
tests. Pearson correlation was used to determine the associations between continuous
variables (after appropriate transformations, see below).
Repeated measures regression analysis for haemostatic outcome variables was used to
compare groups (HRE vs. NRE) over time (including an interaction of group with time).
Residuals were found to be non-normally distributed and this was rectified by
transformations; natural logarithm for vWf, square root transformation for TAT and TF, and
square transformation for fibrinogen. Models were adjusted for age, sex, body mass index,
triglycerides and resting systolic BP. Model contrasts were used to compare between groups
at each time point and to compare time within each group. Multiple linear regression analysis
was used to examine predictors (resting) of moderate intensity exercise brachial systolic BP.
Regression diagnostics were examined in all models to ensure assumptions were not violated.
A value of p < 0.05 was taken as statistically significant. Statistical analysis was conducted
using SPSS 20.0 (IBM SPSS Statistics for Windows, Armonk, NY: IBM Corp) and Stata
12.1 (StataCorp. 2011. Stata Statistical Software: Release 12. College Station, TX: StataCorp
LP).
4.4 Results
4.4.1 Clinical characteristics
Table 4.1 summarises the clinical characteristics of study participants. Out of 64 participants,
20 were identified with an HRE. The majority of study participants were male and there were
no significant differences in age, sex or use of antihypertensive medications between HRE
and NRE participants. Serum triglycerides were significantly higher in HRE participants
compared with NRE participants.

59
Table 4.1 Clinical characteristics of study participants
Characteristics NRE
(n = 44)
HRE
(n = 20)
p value
Age (years) 56 ± 10 60 ± 10 0.140
Sex, male (%) 31 (71) 14 (70) 1.000
Body mass index (kg/m2) 26.6 ± 3.4 28.9 ± 5.1 0.075
Antihypertensive medications (%) 10 (23) 8 (40) 0.261
Angiotensin converting enzyme inhibitors (%) 2 (10) 6 (14) 1.000
Calcium channel blocks (%) 3 (7) 4 (20) 0.257
Angiotensin receptor inhibitors (%) 3 (7) 4 (20) 0.257
Statins (%) 8 (18) 6 (30) 0.463
Glucose (mmol/L) 5.9 ± 2.7 5.2 ± 0.5 0.138
Triglycerides (mmol/L) 1.28 ± 0.56 1.62 ± 0.47 0.017
Total cholesterol (mmol/L) 5.19 ± 0.89 5.38 ± 1.29 0.547
High density lipoprotein (mmol/L) 1.40 ± 0.37 1.32 ± 0.26 0.348
Low density lipoprotein (mmol/L) 3.18 ± 0.76 3.39 ± 1.19 0.478
Data are mean ± standard deviation or n (%); NRE, normotensive response to exercise;
HRE, hypertensive response to exercise: ACEi, angiotensin converting enzyme inhibitors
4.4.2 Haemostatic markers
Repeated measures regression analysis of vWf showed significant between groups effect
(p = 0.016), no significant effect of time (p = 0.080) and a significant interaction effect for
group*time (p = 0.003). Also, there was a significant effect of time (p < 0.001) for TF, but no
significant interaction effect for group*time (p = 0.434) or between groups effect (p = 0.699).
Fibrinogen and TAT had no significant main effects or interactions for time and/or group.
Table 4.2 shows back-transformed predicted marginal means and 95% confidence intervals
(CI) from the repeated measures regression and shows the tests for between group effects at
each time point for the haemostatic markers in HRE and NRE participants across three
conditions (rest, during exercise and post-exercise) after adjusting for age, sex, body mass
index, triglycerides and resting systolic BP. vWf at rest was significantly higher in HRE
participants compared to NRE participants, but there were no significant differences between
groups in vWf during or post-exercise (also shown in Figure 4.1).

60
Examining within each group, vWf significantly increased from rest to exercise for the NRE
group (355 mU/mL, 95% CI: 35 – 676, p = 0.030), whereas vWf significantly decreased from
rest to post-exercise for the HRE group (-882 mU/mL, 95% CI: -1494 – -269, p = 0.005).
Further, the NRE group showed significant changes for TF from rest to post-exercise (-
16.3 pg/mL, 95% CI: -28.0 – -4.6, p = 0.006) and from exercise to post-exercise (-
22.6 pg/mL, 95% CI: -35.2 – -10.1, p < 0.001). No further significant changes were observed
within groups.
4.4.3 Haemodynamic variables
There were no significant differences between the groups in the duration of hospital exercise
stress testing (NRE: 10.5 ± 2.6 minutes vs. HRE: 9.7 ± 2.6 minutes, p = 0.252), or in maximal
exercise metabolic equivalents units (METS; NRE: 12.4 ± 2.5 METS vs. HRE 11.6 ± 2.7
METS, p = 0.277). Table 4.3 summarises the haemodynamic variables measured during the
hospital exercise stress testing (maximal and moderate intensity - stage 2 levels, Bruce
protocol), and during rest and moderate intensity exercise at the research clinic. There was no
significant differences between hospital stage 2 exercise systolic BP and clinic moderate
intensity exercise systolic BP in NRE or HRE groups (mean difference 4.4 ± 23.7, p = 0.233;
and -0.2 ± 23.2, p = 0.970; respectively). Although all participants were normotensive at rest,
brachial systolic and central systolic BP variables were significantly higher in HRE
participants compared to NRE participants. Also, aortic pulse wave velocity was significantly
higher in HRE participants even after correcting for mean BP (p = 0.003). The change in
brachial systolic BP from rest to moderate intensity exercise was significantly different
between groups (NRE: 29 ± 10 vs. HRE: 47 ± 11; p < 0.001), as well as the change in central
systolic BP (NRE: 12 ± 8 vs. HRE: 20 ± 11; p = 0.010). Augmentation pressure,
augmentation index and PP amplification, and changes from rest to during moderate intensity
exercise in these variables, were not significantly different between the groups. There were
also no significant differences in heart rate, cardiac output or stroke volume at rest or during
moderate intensity exercise between the two groups, although HRE participants had
significantly increased SVRi at moderate intensity exercise compared to NRE participants.
The duration of exercise was similar in both groups (NRE: 18 ± 7 minutes vs. HRE:
19 ± 8 minutes, p = 0.630), and there were no significant differences in workloads between
groups (NRE: 69 ± 23 watts vs. HRE: 76 ± 29 watts, p = 0.373).

61
4.4.4 Correlates of moderate intensity exercise systolic BP
Moderate intensity exercise systolic BP was significantly, positively correlated with rest vWf
but inversely correlated with the change in vWf from rest to exercise. However, the
correlation with the change in vWf from rest to post-exercise was not significant (Figure 4.2).
Furthermore, triglycerides (r = 0.411, p = 0.001), body mass index (r = 0.256, p = 0.046) and
aortic pulse wave velocity (r = 0.325, p = 0.011) were also associated with the moderate
intensity exercise systolic BP. During moderate intensity exercise, SVRi was significantly
and positively correlated with exercise systolic BP (r = 0.385, p = 0.002).
4.4.5 Multiple regression analysis
A multiple regression model was constructed with moderate intensity exercise systolic BP as
the dependent variable and age, sex, body mass index, vWf, triglycerides, resting brachial
systolic BP and aortic pulse wave velocity as independent variables. Rest vWf (β = 0.220,
p = 0.043) was a predictor of moderate intensity exercise systolic BP, independent of age
(β = 0.024, p = 0.847), sex (β = 0.089, p = 0.432), body mass index (β = 0.109, p = 0.334),
triglycerides (β = 0.228, p = 0.035), resting brachial systolic BP (β = 0.458, p < 0.001) and
aortic pulse wave velocity (β = 0.064, p = 0.643). Adjusted R2
for the model = 0.451;
p < 0.001. When we constructed the same model with exercise SVRi entered in the model
instead of aortic pulse wave velocity, rest vWF (β = 0.225, p = 0.041) was still a predictor of
moderate intensity exercise systolic BP, independent of age (β = 0.052, p = 0.632), sex
(β = 0.073, p = 0.506), body mass index (β = 0.118, p = 0.290), triglycerides (β = 0.220,
p = 0.048), resting brachial systolic BP (β = 0.462, p < 0.001) and exercise SVRi (β = 0.038,
p = 0.643). Adjusted R2
for the model = 0.447; p < 0.001. When aortic pulse wave velocity
and exercise SVRi were included in the same model, the association with vWf changed to the
borderline of statistical significance but with no major shift in the standardised beta
coefficient (β = 0.219, p = 0.050; adjusted R2
for the model = 0.437; p < 0.001).

62
Table 4.2 Haemostatic markers measured across three different conditions in participants with normotensive and hypertensive response to
exercise
Characteristics NRE (n = 44) HRE (n = 20) p value
Rest 1129 (871-1386) 1927 (1240-2615) 0.016
Von Willebrand factor (mU/mL) Exercise 1484 (1143-1825)* 1488 (945-2030) 0.992
Post-exercise 1286 (980-1592) 1045 (658-1433)* 0.369
Rest 3.59 (3.41-3.78) 3.78 (3.52-4.04) 0.265
Fibrinogen (g/L) Exercise 3.63 (3.44-3.82) 3.76 (3.49-4.03) 0.448
Post-exercise 3.47 (3.27-3.67) 3.80 (3.53-4.08) 0.067
Rest 104.8 (51.0-158.5) 130.0 (15.2-244.8) 0.669
Tissue factor (pg/mL) Exercise 111.1 (55.7-166.5) 126.7 (13.4-239.9) 0.812
Post-exercise 88.5 (38.9-138.0)*+ 118.0 (8.3-227.7) 0.629
Rest 1.22 (0.94-1.51) 1.22 (0.80-1.65) 0.997
Thrombin-antithrombin complex (ng/mL) Exercise 1.21 (0.92-1.49) 1.01 (0.62-1.39) 0.438
Post-exercise 1.17 (0.89-1.45) 1.08 (0.68-1.48) 0.726
NRE, normotensive response to exercise; HRE, hypertensive response to exercise. Values represent means (95% confidence interval)
adjusted for age, sex, body mass index, triglycerides and resting systolic blood pressure. The p values are for the difference between
NRE and HRE at each of the three time points. *p < 0.05 for the comparison with the rest haemostatic marker within group; +p < 0.05
for the comparison with the exercise haemostatic marker within group.

63
Figure 4.1 Von Willebrand factor levels at three different conditions
Von Willebrand factor (vWf) at rest, during exercise and post-exercise in participants with normotensive response to exercise (NRE) and
hypertensive response to exercise (HRE). There was a significant difference in vWf at rest between groups (*p = 0.016). Error bars represent
means and standard error of the mean after adjusting for age, sex, body mass index, triglycerides and resting systolic blood pressure.

64
Table 4.3 Haemodynamic variables measured during treadmill exercise stress testing (Bruce
protocol), and at rest and during moderate intensity exercise at the research clinic in
participants with normotensive and hypertensive response to exercise
Characteristics NRE
(n=44)
HRE
(n=20)
p value
Treadmill exercise stress testing
Max. ex brachial systolic BP (mmHg) 172 ± 24 191 ± 23 0.006
Max. ex brachial diastolic BP (mmHg) 81 ± 11 82 ± 11 0.752
Max. ex brachial PP (mmHg) 92 ± 20 109 ± 23 0.007
Max. ex heart rate (bpm) 157 ± 15 149 ± 20 0.106
Stage 2 ex brachial systolic BP (mmHg) 154 ± 26 174 ± 24 0.004
Stage 2 ex brachial diastolic BP (mmHg) 77 ± 11 80 ± 11 0.422
Stage 2 ex brachial PP (mmHg) 77 ± 22 95 ± 22 0.005
Stage 2 heart rate (bpm) 129 ± 17 129 ± 20 0.992
Research clinic rest conditions
Office brachial systolic BP (mmHg) 120 ± 12 128 ± 12 0.021
Office brachial diastolic BP (mmHg) 73 ± 9 74 ± 8 0.517
Office brachial PP (mmHg) 47 ± 8 54 ± 9 0.009
Central systolic BP (mmHg) 110 ± 12 117 ± 13 0.043
Central diastolic BP (mmHg) 73 ± 9 75 ± 8 0.518
Central PP (mmHg) 37 ± 9 43 ± 10 0.029
Aortic pulse wave velocity (m/s) 7.7 ± 1.6 9.0 ± 1.3 0.001
Brachial pulse wave velocity (m/s) 8.5 ± 1.0 8.2 ± 0.9 0.215
Heart rate (bpm) 62 ± 10 61 ± 7 0.549
Cardiac output (L/min) 4.8 ± 1.2 4.8 ± 1.0 0.815
Stroke volume (mL) 77 ± 14 81 ± 17 0.468
SVRi (dyne/s/cm5) 3086 ± 624 3250 ± 781 0.412
Research clinic moderate intensity exercise
Ex brachial systolic BP (mmHg) 150 ± 12 175 ± 8 <0.001
Ex brachial diastolic BP (mmHg) 76 ± 6 76 ± 7 0.855
Ex brachial PP (mmHg) 74 ± 12 98 ± 9 <0.001
Ex central systolic BP (mmHg) 123 ± 9 137 ± 7 <0.001
Ex central diastolic BP (mmHg) 79 ± 6 79 ± 7 0.723
Ex central PP (mmHg) 44 ± 8 58 ± 7 <0.001
Ex heart rate (bpm) 102 ± 9 101 ± 9 0.862
Ex cardiac output (L/min) 10.3 ± 1.2 10.7 ± 1.8 0.405
Ex stroke volume (mL) 102 ± 13 106 ± 17 0.409
Ex SVRi (dyne/s/cm5) 1573 ± 231 1725 ± 222 0.019
Data are mean ± standard deviation ; NRE, normotensive response to exercise; HRE,
hypertensive response to exercise; max, maximal; ex, exercise; BP, blood pressure; PP, pulse
pressure; SVRi, systemic vascular resistance index

65
Figure 4.2 Correlations between moderate intensity exercise systolic blood pressure and von
Willebrand factor.
Correlations between moderate intensity exercise systolic blood pressure (BP) and (A) rest
von Willebrand factor (vWf); (B) change in vWf from rest to exercise (ex); and (C) change in
vWf from rest to post-exercise (post ex). *VWf and changes in vWf are represented on the
natural logarithm scale.
66
4.5 Discussion
An HRE at moderate intensity is associated with increased CV risk.5 In a sample of 64 people
undergoing routine exercise stress testing, we identified an independent relationship between
resting vWf levels and moderate intensity exercise systolic BP, as well as higher resting vWf
levels in those with an HRE. Furthermore, participants with an HRE had significantly
different responses of vWf to moderate exercise compared to people with normal exercise
systolic BP. Measures of arterial haemodynamics (large artery stiffness and SVRi during
moderate intensity exercise) were also higher in HRE individuals. These findings implicate
haemostatic abnormalities as a possible factor contributing to an HRE at moderate intensity.
The vascular endothelium is involved in production of many vasoactive substances, including
haemostatic factors that are released with endothelial damage/dysfunction. Our study showed
that vWf was increased in participants with an HRE, suggesting the presence of endothelial
dysfunction.79
Interestingly, vWf was significantly correlated with the moderate intensity
exercise systolic BP. This positive association may reflect the interaction between endothelial
dysfunction and high BP, due to the dysregulation of endothelial vasoactive substances
(including vWf) and an altered capacity of the endothelium to maintain homeostasis and
vascular tone. Indeed, the association between endothelial dysfunction and high BP could be
a failure of the peripheral vasculature to appropriately dilate in order to mitigate pressure
rises, particularly during exercise. These findings are in agreement with previous studies that
also found the association between endothelial dysfunction (although measured by different
methods) and exercise systolic BP. Indeed, in a large community-based population cohort of
2115 participants from the Framingham Heart Study, flow-mediated vasodilation was
negatively associated with exercise systolic BP at moderate intensity.50
Similarly, a study of
healthy subjects with high normal BP or mild hypertension showed that reduced endothelial-
dependent vasodilatation (assessed by the same method) was inversely associated with
exaggerated exercise systolic BP, but only in men.63
vWf facilitates platelet adhesion and aggregation, and also contributes to blood coagulation
by acting as a carrier for factor VIII. In this current study, the observed elevation of vWF in
the absence of a significant increase in TAT complexes suggests low grade activation of the
coagulation system rather than extensive amplification and propagation that would be
reflected by increased thrombin generation. Nevertheless, increased levels of vWf may be
clinically significant in patients with an HRE, especially in those with other CV risk

67
factors.200
It was also interesting to observe that vWf levels significantly decreased in HRE
individuals 15 minutes following moderate intensity exercise, despite having elevated
exercise BP levels. This finding may possibly suggest that moderate intensity exercise could
act to suppress coagulation and/or platelet activation and potentially have beneficial effects
that may be more pronounced in those with excessive initial vWf levels (such as HRE
subjects). Moderate intensity exercise (in contrast to strenuous exercise) has been found to
suppress agonist-and shear-induced platelet aggregation by reducing vWF binding to platelets
and down-regulation of platelet activation (GPIIb/IIIa) in sixteen sedentary men.201
Another
possible contributing factor to lower vWf levels in HRE subjects following the exercise may
be disturbed nitric oxide bioavailability from endothelial dysfunction.63
Indeed, the study of
Jilma et al202
showed that vWf levels were significantly attenuated during exercise when
systemic nitric oxide was blocked. However, further studies are needed to explore these
postulates.
A reduction in large central artery compliance could contribute to BP elevation during
exercise. Indeed, increased aortic stiffness (measured by carotid-to-femoral pulse wave
velocity) has been shown to be associated with peak exercise systolic BP at maximal intensity
in 171 untreated essential hypertension subjects.51
Similarly, the study by Thanassoulis et al50
found that aortic stiffness (in addition to endothelial dysfunction, as mentioned above) was
independently associated with moderate intensity exercise systolic BP, measured during the
second stage of an exercise stress test. Consistent with these data, this current study found
that aortic stiffness, measured by the same technique as Thanassoulis et al 50
, was associated
with the exercise systolic BP at moderate intensity, and was higher in those with an HRE.
Furthermore, we also found that SVRi during moderate intensity exercise (but not at rest) was
increased in HRE participants. The combination of increased central artery stiffness with
increased vascular resistance would reasonably expect to increase exercise BP from the
ejection of higher cardiac output into a stiff arterial system together with impaired peripheral
run-off of blood. Interestingly, one study has shown that an excessive rise in systemic
vascular resistance measured invasively during submaximal or maximal exercise
independently predicted incident CV events and total mortality.203
This tends to support the
notion that some of the risk attributable to an HRE may be due to altered vascular function
although we did not find an independent relationship in this current study.

68
Our study was a cross-sectional analysis of data from a selected study population. The
findings do not establish causality and may not be generalizable to other populations.
Endothelial function of specific arterial beds, such as the brachial artery, was not measured in
this study and would have been a valuable addition. Also, different devices were used to
measure resting and exercise BP. Although both devices have been validated, the use of
separate machines might have affected the study results. Furthermore, the use of a standard
formula to estimate heart rate might have underestimated heart rate and the intensity of
exercise, as per Tanaka et al.204
However, it should be noted that the same formula was used
to determine the heart rate in all study participants (HRE and NRE groups), and the possible
underestimation of heart rate would not significantly affect the results of this study. Future
studies may be worth directing attention towards the role of vWf and endothelial dysfunction
as contributors to an HRE at moderate intensity, as well as therapeutic/exercise interventions
targeting haemostatic markers and endothelial function with benefit to vascular function and
BP control.
In summary, this study has demonstrated that abnormal haemostasis as reflected by higher
resting vWf, as well as structural and functional vascular abnormalities (such as increased
aortic stiffness and systemic vascular resistance during exercise) were present in subjects
with an HRE. Although endothelial dysfunction was not estimated with standard measures in
this study (e.g. flow-mediated vasodilation), an increased vWf (also a marker of endothelial
dysfunction) may provide some indications that endothelial dysfunction may be present in
people with an HRE and may be a contributing factor of an HRE. For the first time, we show
that resting blood levels of vWf were significantly associated with moderate intensity
exercise systolic BP, independent of resting brachial systolic BP and other CV risk factors.
4.6 Contribution of Chapter 4 to thesis aims
Previously published literature highlights the potential clinical relevance of an HRE at
moderate intensity. Chapter 4 represents the first comprehensive CV assessment at rest and
during moderate intensity exercise to explore the haemodynamic and haemostatic correlates
of an HRE in people with a clinical indication for exercise stress testing. This study showed
for the first time that haemostatic abnormalities reflecting endothelial dysfunction (increased
vWf levels) were present in people with an HRE, and were significantly and independently
correlated with moderate intensity exercise systolic BP. Endothelial function is not only

69
required for appropriate vascular tone and BP, but also for the regulation of normal
haemostasis. Therefore, endothelial dysfunction may be a platform on which abnormal
haemostasis might be contributing to an HRE and associated CV complications. These
findings may have significant clinical relevance in people with an HRE, especially in those
with other (possibly metabolic) co-morbidities. Furthermore, haemodynamic factors,
including increased aortic stiffness, appeared to have a minimal role in an HRE at moderate
intensity, as there were no independent significant associations with exercise systolic BP. On
the other hand, there were some indications that metabolic factors may be contributing to an
HRE, evidenced by increased triglyceride levels in people with an HRE, and their
independent associations with moderate intensity exercise systolic BP. In order to explore
other metabolic contributors of an HRE in an exploratory and ‘untargeted’ way using
metabolomics analysis, next chapter (Chapter 5) represents the study that was primarily used
for the development of methodology regarding metabolomics analysis (utilised in Chapter 5
and Chapter 6), but it was also a convenient sample to explore the metabolic actions of the
aldosterone antagonist spironolactone on exercise BP, as well as other haemodynamic
measures, in people with an HRE.

70
Chapter 5. Spironolactone Reduces Aortic Stiffness via Blood
Pressure-Dependent Effects of Canrenoate
This thesis chapter has been previously published:
Nikolic SB, Wilson R, Hare JL, Adams MJ, Edwards LM, Sharman JE. Spironolactone
reduces aortic stiffness via blood pressure-dependent effects of canrenoate. Metabolomics.
2014;10:105-113
This chapter represents the first application of the metabolomics analysis in people with a
hypertensive response of exercise and was primarily used to develop methodology regarding
metabolomics analysis (also utilised in Chapter 6). However, this study was also a
convenient sample to explore the metabolic actions of the aldosterone antagonist
spironolactone on exercise blood pressure and aortic stiffness in people with a hypertensive
response to exercise. The final published version of this paper (as presented in Chapter 5)
included the exploration of the underlying metabolic effects of spironolactone on aortic
stiffness only (a proposed contributor of a hypertensive response to exercise), whereas
additional analysis and results regarding the spironolactone effects on exercise blood pressure
are presented in Appendix 3.

71
5.1 Abstract
Background. Spironolactone is thought to improve aortic stiffness via blood pressure (BP)
independent (antifibrotic) effects, but the exact mechanism is unknown. We used
metabolomics and hemodynamic measures to reveal the underlying actions of spironolactone
in people with a hypertensive response to exercise (HRE).
Methods. Baseline and follow-up serum samples from 115 participants randomized to three
months spironolactone (25 mg/day) or placebo were analysed using liquid
chromatography/mass spectrometry and nuclear magnetic resonance spectroscopy.
Hemodynamic measures recorded at baseline and follow-up included aortic pulse wave
velocity (stiffness) and 24 hour ambulatory BP.
Results. Aortic stiffness was significantly reduced by spironolactone compared with placebo
(-0.18 ± 0.17 m/s versus 0.30 ± 0.16 m/s; p < 0.05), but this was no longer significant after
adjustment for the change in daytime systolic BP (p = 0.132). Further, the change in aortic
stiffness was correlated with the change in daytime and 24 hour systolic BP (p < 0.05).
Metabolomics detected 42 features that were candidate downstream metabolites of
spironolactone (no endogenous metabolites), although none were correlated with changes in
aortic stiffness (p > 0.05 for all). However, the spironolactone metabolite canrenoate was
associated with the change in daytime systolic BP (r = -0.355, p = 0.017) and 24 hour pulse
pressure (r = -0.332, p = 0.026). This remained highly significant on multiple regression and
was independent of age, body mass index and sex.
Conclusion. Canrenoate appears to be an active metabolite with BP-dependent effects on the
attenuation of aortic stiffness in people with an HRE. This finding, together with the lack of
change in endogenous metabolites, suggests that the antifibrotic effects of spironolactone
could be BP-dependent.

72
5.2 Introduction
Spironolactone is a diuretic that acts as a competitive aldosterone antagonist at the
mineralocorticoid receptors of the epithelial cells in the kidneys.205
Studies in animals and
humans have indicated that spironolactone exerts broad metabolic, structural and functional
effects via mineralocorticoid receptors outside the kidneys, although the details of these
actions remain unclear.58-60
Recently, mineralocorticoid receptors have been implicated in the
function of the vasculature and it has been suggested that blockade by spironolactone may
prevent, or lessen, arterial fibrosis and aortic stiffness independent of blood pressure (BP)
changes.58, 60
Indeed, spironolactone has been shown to prevent aortic collagen accumulation,
improve carotid artery distensibility, and lower aortic stiffness despite no significant changes
in resting or office BP.58, 61
However, some of these studies did not consider the ambulatory
or central BP-lowering effects of spironolactone, which are likely to be different to
spironolactone’s effect on resting BP.61
Thus, the magnitude of the association between the
BP-lowering effect of spironolactone and arterial stiffness might have been underestimated.
Metabolomics is the systematic profiling of metabolites in biological systems and their
changes in response to physiological stimuli. It may be used to characterise metabolic
pathways associated with cardiovascular (CV) diseases and therapy.206
Indeed, mapping of
endogenous metabolites pre- and post-drug treatment, and identifying perturbed metabolic
pathways, may provide unique information on underlying drug mechanisms of action.206
To
our knowledge, this approach has never been used to characterise the effects of
spironolactone. Given that this drug undergoes extensive metabolism, and its activity is
mainly attributed to its breakdown products (e.g. canrenoate and canrenone; Figure 5.1),207
the identification of these products and consequent correlation with arterial/hemodynamic
changes induced by spironolactone, may shed new light on the underlying physiological
actions of the drug. This study sought to achieve this by conducting a metabolomic analysis
of serum from subjects in a convenience sample from our recently completed randomized
clinical trial where aortic stiffness and BP measures were acquired at baseline and after three
months of spironolactone treatment in patients with a hypertensive response to exercise
(HRE).9 We hypothesized that metabolite drug responses would be associated with changes
in aortic stiffness and BP.

73
Figure 5.1 Metabolic pathway of spironolactone
Metabolic pathway of spironolactone (A) forming two main downstream metabolites: canrenone (B) and canrenoate (C). Spironolactone is
dethioacetylated to canrenone that further undergoes hydrolysis of its lactone ring to canrenoate.

74
5.3 Methods
5.3.1 Study participants
A total of 115 participants with an HRE were recruited into this randomized placebo-
controlled, double-blind clinical trial (htpp://www.anzctr.org.au; ACTRN12609000835246).
HRE was defined as resting BP < 140/90 mmHg with a peak exercise BP ≥ 210/110 mmHg
for men and ≥ 190/105 mmHg for women.30
Exclusion criteria for the principal clinical trial
were: age over 70 years, a prior history of hypertension or taking antihypertensive
medications, a history of known coronary artery disease or renal dysfunction (serum
creatinine > 80 µmol/L), gynecomastia and pregnancy. Eligible participants were selected
from hospital and community cardiology clinic records of exercise stress tests that were
conducted in a period between 2004 and 2008. The study was approved by the Human
Research Ethics Committee of the University of Queensland and all procedures conformed to
the Declaration of Helsinki. Study participants gave written informed consent prior to
participation.
5.3.2 Study protocol
Study participants attended the clinic at two different occasions. First clinic baseline visit was
conducted in the morning where fasting blood samples were collected for metabolomics
analysis (pre-samples) and standard clinical biochemistry. Resulting serum samples were
stored at -80°C for later analysis. Following this, participants were examined with
hemodynamic measurements including 24 hour ambulatory BP, office brachial BP, office
central BP and aortic stiffness. After the baseline visit, participants were randomly assigned
either 25 mg of spironolactone or placebo daily for three months. Participants and researchers
were blinded to treatment allocations. Subjects then returned to the clinic for their follow-up
examination after the three months of treatment. All participants were advised to take their
last dose of spironolactone on the day of the examination. This maintained the steady-state
concentration of long half-life metabolites of spironolactone (e.g. canrenoate and canrenone)
that was achieved after daily drug intake. Blood samples were collected as before (post-
samples) and all hemodynamic measurements were repeated at three months.

75
5.3.3 Liquid chromatography-mass spectrometry (LC-MS)
Serum samples were thawed and a 100 µL aliquot of each sample was mixed with 300 µL of
ice-cold methanol. The sample was then incubated at 4°C for 20 minutes and centrifuged at
13200 g for 10 minutes. The supernatant was collected and lyophilized in a vacuum
centrifuge (Labconco, Kansas City, USA) and re-stored at -80°C. The dried samples were
rehydrated in 100 µL of HPLC-grade water immediately prior to LC-MS analysis. Quality
control samples were also prepared by pooling 10 µL of 40 random samples (placebo and
spironolactone) and analysed throughout the LC-MS runs to assess the equipment drift and
‘batch-to-batch’ variability, as recommended by Dunn et al.124
Samples were analysed using
an LTQ-Orbitrap XL mass spectrometer (ThermoFisher Scientific, Bremen, Germany)
controlled by XCalibur v2 software (ThermoFisher Scientific). To prevent systematic bias,
samples from participants on spironolactone and placebo samples were randomly distributed
throughout the runs. Each participant’s pre- and post-treatment samples were analysed
together. Data were acquired in both positive (+) and negative (-) ionization modes. Retention
times for tandem mass spectrometry (MS/MS) targets were specified according to retention
time values acquired by LC-MS. Data were processed for peak finding, grouping and
retention time alignment using XCMS running in the R environment (R 2.14; http://cran.r-
project.org/).
5.3.4 Nuclear magnetic resonance (NMR) spectroscopy
Serum samples were thawed and 300 µL was added to 300 µL of D2O in a 1.5 mL Eppendorf
tube. The mixture was briefly vortexed and then centrifuged at 16606 g for five minutes after
which 550 µL of the supernatant was transferred to a 5 mm NMR tube for analysis. NMR
data were acquired on a Bruker Avance III spectrometer operating at 800.13 MHz (Bruker
Biospin, Karlsruhe, Germany). Data were acquired with a Carr-Purcell-Meiboom-Gill pulse
sequence with presaturation during the recycle delay (2 s) and a total echo time of 51.2 ms.
The time domain was 128 k and the sweep width was 20 ppm. Data were Fourier transformed
with exponential line broadening of 0.5 Hz in the frequency domain. Spectra were phased and
baselined in Topspin 3.0 (Bruker Biospin, Karlsruhe, Germany) before being imported into
Matlab (Mathworks, Natick, MA) at full resolution. Resulting spectra were normalised and
bucketed using probabilistic-quotient normalisation197
and adaptive intelligent binning112
respectively, both in Matlab.

76
5.3.5 Aortic stiffness, blood pressure and clinical biochemistry
Aortic stiffness: ECG-gated sequential applanation tonometry of the carotid and femoral
arteries using the SphygmoCor system (SphygmoCor 8.1, AtCor Medical, Sydney, NSW)
was used to measure aortic pulse wave velocity (PWV), a measure of aortic stiffness.177
24
hour ambulatory BP: A validated device (TM-2430, A&D Mercury, A&D Medical,
Thebarton, South Australia)189
- which was set to take measurements every 30 minutes during
the day (between 6 am and 10 pm) and every hour during night (between 10 pm and 6 am) -
recorded 24 hour ambulatory BP.23
The mean 24 hour pulse pressure (PP) was calculated as
the difference between 24 hour systolic and diastolic BP. Office brachial BP: After at least 10
minutes of rest in a supine position, office brachial BP was measured by trained technician in
duplicate using a validated manual sphygmomanometer with suitable sized cuff, as per
recommendations.4, 198
The mean of these two readings was used for subsequent analysis.
Office central BP: A validated and highly reproducible radial applanation tonometry47, 48
using the SphygmoCor system (SphygmoCor 8.1, AtCor Medical, Sydney, NSW) was used
to measure office central BP. The mean of the office brachial BP measurements, measured
before the radial applanation tonometry, was used to calibrate the radial pressure waveform.
Clinical biochemistry: Standard clinical biochemistry included analysis of glucose,
glycosylated haemoglobin (HbA1c), triglycerides, total, low-density and high-density
lipoprotein cholesterol, as per routine pathology laboratory procedures.
5.3.6 Data analysis, statistics and feature annotation
As previously reported,194
we found that principle components analysis (PCA; and its
variants) was ineffective for identifying differences in the LC-MS data. Thus, as before, we
used a repeated-measures ANOVA to compare each feature and then corrected the resulting p
values using the Benjamini and Hochberg False Discovery Rate correction.194
Features were
accepted as being significantly different if the corrected p < 0.05. The LC-MS data were
hand-checked for artefacts (for example, Fourier-transform ‘shoulders’) before being de-
isotoped and putatively annotated using the Human Metabolome Database (HMDB) and the
Taverna workflows.196
Compounds of interest were further examined by MS/MS to provide
additional structural information and to confirm annotation, where possible, by comparison
with MS/MS spectra held in public databases.
77
Post-intervention NMR data were mean-centred and Pareto-scaled, before being analyzed
using PCA and partial least squares-discriminant analysis (PLSDA), both in PLS Toolbox
(PLS Toolbox 6.5, Eigenvector Research Inc., Wenatchee, US). Permutation testing was used
to assess whether PLSDA models were the result of over-fitting; models were considered
significant if the estimated p < 0.05.
Data processing of metabolomics data and subsequent statistical analysis were all conducted
in Matlab. All additional statistical analysis was conducted using SPSS 17.0 (SPSS Inc.,
Chicago, Illinois, USA). Clinical characteristics of study participants are presented as mean
and standard error of the mean (SEM). Comparisons between placebo and spironolactone
groups were performed by independent t-tests. Comparisons between categorical variables
were assessed by chi-squared tests. Changes in hemodynamic variables were adjusted by
analysis of covariance (ANCOVA) for potential confounders. Metabolomics data, when
included in an analysis with conventional data, was checked for normality and non-normally
distributed data was square-root-transformed. Associations between metabolites of interest
and physiological variables were assessed by linear correlation. Multiple regression was used
for the predictors of change in physiological parameters after treatment. In all cases, a value
of p < 0.05 was taken as statistically significant.
5.4 Results
5.4.1 Clinical characteristics
Of the 115 participants included in the clinical trial, 58 were randomized to spironolactone
treatment and 57 to placebo. Of these, serum samples were available from 92 participants for
the metabolomics analysis (43 in placebo group and 49 in spironolactone group). Two study
participants were taking antihypertensive drugs (one in the placebo and one in the
spironolactone group), but these were not excluded from the metabolomics analysis. Table
5.1 represents the baseline clinical characteristics of study participants, which was not
significantly different from the complete study population.

78
Table 5.1 Clinical characteristics of study participants at baseline
Variable Placebo
(n = 43)
Spironolactone
(n = 49)
p value
Age (years) 55 ± 1 55 ± 1 0.961
Sex (% male) 55.8 59.2 0.833
BMI (kg/m2) 29.1 ± 0.6 29.2 ± 0.7 0.993
Type 2 diabetes mellitus (%) 4 (9.3) 9 (18.4) 0.344
24 hour SBP (mmHg) 133 ± 2 133 ± 1 0.894
24 hour PP (mmHg) 53 ± 1 54 ± 1 0.288
Day SBP (mmHg) 137 ± 2 137 ± 1 0.978
Day PP (mmHg) 54 ± 1 55 ± 1 0.575
Night SBP (mmHg) 117 ± 2 118 ± 2 0.694
Night PP (mmHg) 47 ± 1 50 ± 1 0.050
Office brachial SBP (mmHg) 125 ± 2 126 ± 2 0.724
Office brachial PP (mmHg) 52 ± 2 52 ± 1 0.802
Office central SBP (mmHg) 114 ± 2 114 ± 2 0.795
Office central PP (mmHg) 40 ± 1 39 ± 1 0.954
Aortic PWV (m/s) 8.2 ± 0.3 8.4 ± 0.3 0.588
Glucose (mmol/L) 5.7 ± 0.2 5.9 ± 0.3 0.461
HbA1c (%) 5.9 ± 0.1 6.0 ± 0.2 0.531
Triglycerides (mmol/L) 1.5 ± 0.2 1.5 ± 0.2 0.790
Total cholesterol (mmol/L) 5.3 ± 0.1 5.1 ± 0.1 0.368
LDL cholesterol (mmol/L) 3.3 ± 0.1 3.2 ± 0.1 0.608
HDL cholesterol (mmol/L) 1.4 ± 0.1 1.4 ± 0.1 0.965
ACE inhibitors (%) 1 (2.3) 1 (2.0) 1.000
Statins (%) 9 (20.9) 7 (14.3) 0.573
BMI, body mass index; SBP, systolic blood pressure; PP, pulse pressure; PWV, pulse wave
velocity; HbA1c, glycosylated haemoglobin; LDL, low density lipoprotein; HDL, high density
lipoprotein; ACE, angiotensin converting enzyme; values are mean ± SEM or %; p < 0.05
was considered significant

79
5.4.2 Metabolomics (LC-MS)
All data (pre/post and spironolactone/placebo) were combined and pre-processed together
using XCMS. We identified 7363 common features across the combined mass spectra
acquired in negative ionization mode and 9185 features from the spectra acquired in positive
ionization mode. Of these, 42 features (34 from negative and eight from positive ionization
mode) were significantly different in the spironolactone group compared with placebo
(p < 0.05 after the Benjamini and Hochberg False Discovery Rate correction). Nine isotopes
and 17 adducts were subsequently identified and removed, leaving 16 features for further
investigation. However, we were not able to putatively annotate any of these as being
endogenous (i.e. non-xenobiotic) metabolites. Since these 16 features were undetectable in
any but the post-spironolactone group and none could be annotated using any public human
metabolomics repositories, we concluded that these features were almost certainly
downstream breakdown products of spironolactone itself. As a result, several were
immediately identified (from accurate mass and MS/MS) as signals from the most
commonly-reported breakdown products of spironolactone: canrenoate (CHEBI: 50159;
357.2071 m/z in negative ion mode) and canrenone (CHEMBL42874: 341.2111 m/z in
positive ion mode; Figure 5.2).
Figure 5.2 Spironolactone downstream metabolites
Spironolactone downstream metabolites (A) canrenoate and (B) canrenone measured by LC-
MS (n = 49).

80
5.4.3 Metabolomics (NMR)
The post-spironolactone and post-placebo groups were normalised and pre-processed
together. The adaptive intelligent binning algorithm identified 336 spectral regions of
interest. Yet despite outstanding spectral quality resulting from the high field strengths
employed, subsequent analysis of the NMR data using both principal component analysis and
partial least squares-discriminant analysis was unable to identify any significant effect of
spironolactone treatment (p > 0.05 for all models).
5.4.4 Hemodynamic response to spironolactone
As per Table 5.2, the group that received spironolactone for three months had a significant
reduction in all ambulatory BP values, except for night systolic BP where the reduction was
of borderline significance. There was a larger decrease in office brachial and central BP in the
spironolactone treatment group compared to placebo, but these changes were also of
borderline statistical significance. Aortic PWV decreased significantly in the spironolactone
group compared with placebo group. However, the reduction in aortic PWV was no longer
significant after adjustment for the change in daytime systolic BP (p = 0.132).
Table 5.2 Changes in hemodynamic variables in placebo compared to spironolactone group
after three months of treatment
Variable Placebo
(n = 43)
Spironolactone
(n = 49)
p value
Δ 24 hour SBP (mmHg) 0.8 ± 1.3 -3.5 ± 1.0 0.010
Δ 24 hour PP (mmHg) 2.3 ± 1.1 -2.3 ± 0.7 <0.001
Δ Day SBP (mmHg) 1.1 ± 1.4 -3.3 ± 1.1 0.014
Δ Day PP (mmHg) 2.6 ± 1.5 -2.0 ± 0.8 0.007
Δ Night SBP (mmHg) 0.5 ± 1.9 -3.9 ± 1.5 0.067
Δ Night PP (mmHg) 1.4 ± 1.2 -2.6 ± 0.9 0.010
Δ Office brachial SBP (mmHg) -0.4 ± 1.3 -3.6 ± 1.2 0.070
Δ Office brachial PP (mmHg) -0.9 ± 1.3 -1.9 ± 1.0 0.560
Δ Office central SBP (mmHg) -0.7 ± 1.3 -3.9 ± 1.1 0.063
Δ Office central PP (mmHg) -1.3 ± 1.1 -2.2 ± 0.8 0.488
Δ Aortic PWV (m/s) 0.30 ± 0.16 -0.18 ± 0.17 0.047
SBP, systolic blood pressure; PP, pulse pressure; PWV, pulse wave velocity; values are mean
± SEM; p < 0.05 was considered significant

81
5.4.5 Associations between hemodynamic parameters and spironolactone metabolites
Changes in hemodynamic parameters were correlated with the post-spironolactone signal
intensity for each of the metabolomic features of interest. There were no significant
correlations between the change in aortic PWV and any metabolic features, including
canrenoate and canrenone (p > 0.05 for all). However, canrenoate was associated with the
change in daytime systolic BP and the change in 24 hour PP (Figure 5.3). On the other hand,
there were no significant associations between the changes in canrenone and ambulatory BP
values after treatment (p < 0.05 for all). The change in aortic PWV was significantly related
to the change in daytime systolic BP and the change in 24 hour systolic BP (Figure 5.4).
5.4.6 Multiple regression analysis
The change in daytime systolic BP was significantly correlated with canrenoate (r = -0.355,
p = 0.017), the change in aortic PWV (r = 0.333, p = 0.024), body mass index (r = -325,
p = 0.023), change in 24 hour systolic BP (r = 0.875, p < 0.001), change in 24 hour PP
(r = 0.527, p < 0.001), change in 24 hour diastolic BP (r = 0.583, p < 0.001) and change in
daytime diastolic BP (r = 0.610, p < 0.001). A multiple regression model for predictors of the
change in daytime systolic BP was constructed, with the following variables entered as
covariates; age, sex, body mass index, the use of statins and angiotensin converting enzyme
inhibitors, canrenoate and the change in aortic PWV. Ambulatory BP variables were not
included in the model due to collinearity or non-significance. Canrenoate (β = -0.394,
p = 0.012) and the change in aortic PWV (β = 0.445, p = 0.011) were independent predictors
of the change in daytime systolic BP (Adjusted R2
= 0.212, p = 0.031). A multiple regression
model for predictors of the change in aortic PWV was also constructed, with the age, sex,
body mass index, the use of statins and angiotensin converting enzyme inhibitors, canrenoate,
the change in office brachial systolic BP and the change in daytime systolic BP entered as
independent variables. The change in daytime systolic BP (β = 0.344, p = 0.029) and female
gender (β = -0.410, p = 0.006) were independent predictors of the change in aortic PWV
(Adjusted R2
= 0.315, p = 0.006), whereas canrenoate was of borderline significance
(β = 0.293, p = 0.058) and the change in office brachial systolic BP was not significant
(β = 0.167, p = 0.230).
Further data analysis concerning the effects of spironolactone treatment on exercise BP is
presented in Appendix 3 of the thesis.

82
Figure 5.3 Correlations with the spironolactone metabolite canrenoate
Correlations with the spironolactone metabolite canrenoate (expressed relative to the group
mean signal intensity). LEFT: the change in daytime systolic blood pressure (SBP); RIGHT:
the change in 24 hour pulse pressure (PP), both after three months of spironolactone
treatment (n = 49).
Figure 5.4 Correlations with the change in aortic pulse wave velocity
Correlations with the change in aortic pulse wave velocity (PWV). LEFT: the change in
daytime systolic blood pressure (SBP); RIGHT: the change in 24 hour pulse pressure (PP),
both after three months of spironolactone treatment (n = 49).

83
5.5 Discussion
To our knowledge, this is the first study that has used the combination of metabolomics and
hemodynamics to examine the underlying physiological actions of spironolactone. The
principal findings were that: i) spironolactone did not induce any detectable changes in the
endogenous metabolite profile, ii) the changes in aortic stiffness were due to a reduction in
ambulatory BP over three months of daily spironolactone treatment and iii) canrenoate may
be responsible for the ambulatory BP-lowering effect but not for the reduction in aortic
stiffness. These findings suggest that spironolactone has a BP-dependent effect on the
attenuation of aortic stiffness, with canrenoate being the major active metabolite.
Spironolactone has been found to be effective in people with heart failure, a condition
associated with advanced cardiac fibrosis.208
Indeed, in the Randomized Aldactone
Evaluation Study (RALES), spironolactone significantly reduced mortality by 30 %, together
with a reduction in cardiac fibrosis (markers of cardiac collagen turnover), compared with
placebo.59, 208
Although the mechanism is not clear, beneficial effects of spironolactone in
these individuals has been attributed to the antagonising effects of aldosterone on cardiac
mineralocorticoid receptors, thus preventing the progression of cardiac fibrosis.59
Recent
studies have also confirmed the presence of mineralocorticoid receptors in vascular smooth
muscle cells, endothelial cells, and fibroblasts.209-211
It has been suggested that, irrespective of
BP control, blocking vascular mineralocorticoid receptors may prevent or attenuate negative
effects of aldosterone on the structure and function of the vascular wall.58, 61, 212
Thus,
spironolactone treatment has been purported to improve vascular function via BP-
independent, antifibrotic mechanisms.58, 212
We used metabolomics to study metabolites in an unbiased, untargeted manner and
investigate whether spironolactone causes metabolic perturbations that might explain arterial
wall effects of spironolactone in individuals with an HRE. Despite using state-of-the-art
analytical platforms, and subject numbers within recommended ranges to achieve sufficient
power,121
systematic changes in endogenous metabolism were not detected. Confidence in the
sensitivity of the methods is provided by identification of known xenobiotic metabolites.
However, it should be noted that our study cohort was reasonably healthy without established
hypertension at rest and, therefore, we cannot exclude the possibility that significant
metabolic effects of spironolactone may have only been detectable in individuals with more
advanced arterial stiffness and sustained hypertension, or those with other (possibly

84
metabolic) co-morbidities. Indeed, under conditions of severe aortic stiffness the effects of
spironolactone may become BP-independent through mineralocorticoid/antifibrotic
mechanisms of action, but this need to be tested in other studies. Although previous studies
report on the possible BP-independent effects of spironolactone within periods less than three
months, it could also be argued that this was an insufficient treatment period in the current
work.
Previous studies60, 61
have reported that the effect of spironolactone in reducing arterial
stiffness was independent of mechanical factors (e.g. decrease in pressure load). Even if one
accepts the possibility that spironolactone has a BP-independent effect on the arterial wall (at
least in individuals with more advanced arterial stiffness, as suggested above), overall BP-
dependent effects of spironolactone on arterial function could have been more thoroughly
estimated by taking into account all measures of BP that spironolactone is known to affect
(i.e. brachial, central and ambulatory BP). For example, treatment with spironolactone for 40
weeks reduced measures of arterial stiffness, which remained significant after correcting for
the reduction in mean office BP, and, thus, interpreted as a BP-independent effect of
spironolactone. 60
However, the authors also reported a significant reduction in ambulatory
BP but this was not statistically accounted for.60
Mahmud et al61
in a yet smaller study
(n=24), reported that the change in aortic PWV after spironolactone treatment was no longer
significant after correcting for resting mean BP, again suggesting a BP-independent effect,
but no account was made for possible changes in ambulatory BP. On the other hand, lack of a
change in aortic PWV observed in hypertensive people after six months of spironolactone
treatment could also be explained by the lack of change in ambulatory BP values.213
Taken all
together, the effect of the change in BP induced by spironolactone treatment on arterial
properties in previous studies might have been underestimated.
Our study supports the notion that the overall BP reduction induced by spironolactone could
have a significant beneficial effect on arterial physiology, producing an effect that is mostly,
if not entirely, BP-dependent. Indeed, we found that spironolactone significantly reduced
aortic PWV, but this reduction was no longer significant when corrected for the reduction in
ambulatory BP, despite the absence of a significant change in resting office brachial or
central BP. Importantly, the change in daytime systolic BP was a significant predictor of the
change in aortic PWV on multiple regression analysis independently of the change in resting
office brachial BP. As spironolactone has a very short half-life once it is absorbed, major

85
effects of spironolactone are mainly attributed to its active metabolites with a longer half-life
(up to 22 hours), such as canrenoate and canrenone.207
Notably, the metabolite canrenoate
independently correlated with the change in ambulatory BP suggesting that this is an active
metabolite of spironolactone with regard to its BP-lowering effect.
In conclusion, spironolactone seems to improve aortic stiffness via BP-dependent effects. In
this current study, we show that in people with an HRE, spironolactone had no significant
metabolic effects, and all improvements in aortic stiffness were related to ambulatory BP
reduction by spironolactone. These findings, together with the association of canrenoate with
ambulatory BP reduction, suggest that the reduction in aortic stiffness by spironolactone was
due to BP-dependent, rather than the BP-independent or antifibrotic, effects of
spironolactone. This new information highlights the importance of using out-of-office BP
measures when assessing the clinical, and so-called BP-independent, effects of
antihypertensive medications such as spironolactone.
5.6 Contribution of chapter 5 to thesis aims
Chapter 5 represents the first application of the metabolomics analysis in people with an
HRE. This study was primarily used to develop a methodology regarding metabolomics
analysis, but it was also a convenient sample to explore the metabolic actions of the
aldosterone antagonist spironolactone on exercise BP and aortic stiffness in people with an
HRE. Utilising the metabolomics technique, this study showed that spironolactone did not
have any significant endogenous metabolic effects in people with an HRE, but reduced the
exercise BP, as well as aortic stiffness, by BP-lowering effects. Importantly, Chapter 5
further supports the results from Chapter 4 that vascular haemodynamic factors, such as
increased aortic stiffness, are less relevant to exercise BP than what is widely thought, given
the lack of a significant relationship between the reductions in aortic stiffness and exercise
BP by spironolactone treatment. Whilst this study itself represents an important contribution
to knowledge surrounding treatment strategies to improve an HRE, this study also
demonstrates how the application of metabolomics combined with haemodynamic measures
could be a powerful method to characterise metabolic pathways associated with CV diseases.
Once the technique was developed, metabolomics analysis was used to explore the metabolic
factors that might be contributing to an HRE in a population with the high prevalence of an
HRE, such as those with type 2 diabetes mellitus (presented in Chapter 6).

86
Chapter 6. Serum Metabolic Profile Predicts Adverse
Central Haemodynamics in Patients with Type 2 Diabetes
Mellitus
At the time of thesis submission, this chapter is under peer review in Acta Diabetologica.
Sonja B. Nikolic, Lindsay M. Edwards, Yuliya V. Karpievitch, Richard Wilson, James
Horne, Murray J. Adams, James E. Sharman
This chapter reports on possible metabolic factors that may be contributing to a hypertensive
response to exercise at moderate intensity in participants with type 2 diabetes mellitus (a
population with the high prevalence of a hypertensive response to exercise). This was
achieved by exploring metabolic perturbations (utilising untargeted metabolomics analysis)
that were related to both peripheral and central haemodynamic variables recorded during
resting, as well as exercise conditions.

87
6.1 Abstract
Background. People with type 2 diabetes mellitus (T2DM) have abnormal peripheral and
central haemodynamics at rest and during exercise, probably due to metabolic perturbations,
but mechanisms are unknown. We used untargeted metabolomics to determine the
relationships between metabolic perturbations and haemodynamics (peripheral and central)
measured at rest and during exercise.
Methods. Serum samples from 39 participants with T2DM (62 ± 9 years; 46% male) and 39
controls (52 ± 10 years; 51% male) were analysed by liquid chromatography-mass
spectrometry, nuclear magnetic resonance spectroscopy and principal component analysis.
Scores on principal components (PC) were used to assess relationships with haemodynamics
including peripheral and central BP, central augmentation index (AIx) and central
augmentation pressure (AP).
Results. Participants with T2DM had higher resting and exercise haemodynamics (peripheral
and central BP, central AIx and central AP) compared to controls (p < 0.05). PC comprised of
a signature metabolic pattern of disordered carbohydrate metabolism in T2DM was
independently associated with resting and exercise central AIx and central AP (p < 0.05).
Glucose alone independently predicted central BP, rest and exercise central AIx and exercise
AP (p < 0.05).
Conclusion. Serum metabolic profile was associated with resting and exercise central, but
not peripheral, haemodynamics in T2DM participants, suggesting that metabolic irregularities
may explain abnormal central haemodynamics in T2DM patients.

88
6.2 Introduction
Type 2 diabetes mellitus (T2DM) is associated with increased risk of cardiovascular (CV)
morbidity and mortality.214
High brachial blood pressure (BP) is common in T2DM, affecting
up to 40% of newly diagnosed T2DM patients and significantly contributing to CV
complications.162
T2DM is also associated with premature vascular aging and arterial
structural remodelling, leading to increased arterial stiffness.92
However, T2DM has a greater
impact on central arterial stiffness - and central BP indices - than the stiffness of peripheral
arterial segments (measured by pulse wave velocity, PWV).215
This is an important
observation, as central arterial stiffness (or aortic PWV) and central BP indices such as
augmentation index (AIx) are significant independent predictors of CV risk.12
Interestingly, increased central BP (including central systolic BP and AIx) are independent
predictors of the onset of T2DM, even after correcting for mean BP and baseline glucose
concentrations.216
However, these early CV changes are not always apparent when subjects
are tested under resting conditions. Indeed, the stress of exercise may reveal BP abnormalities
that fail to be detected by conventional BP screening.6 People with T2DM who are
normotensive at rest have a higher prevalence of exercise hypertension both peripherally and
centrally (also referred as a hypertensive response to exercise [HRE]) than age-matched
controls.11
An HRE at moderate intensity has been associated with an increased risk of CV
events and mortality when compared to those having a normotensive BP response to
exercise.5 The pathophysiological mechanisms underlying abnormal peripheral and central
haemodynamics at rest and during exercise in T2DM are yet to be elucidated.
The pathogenesis of T2DM is complex, involving genetic, environmental and lifestyle factors
such as diet, lack of physical activity and obesity. Together, these lead to progressive decline
in metabolic control and ultimately diabetes.163
These metabolic disturbances may also
adversely impact on central arterial haemodynamics and contribute to CV complications,87
but the exact mechanisms are unclear. Metabolomics (the comprehensive analysis of low-
molecular weight molecules in biological systems) has been increasingly used to evaluate
perturbations associated with T2DM and have revealed alterations in the metabolism of
carbohydrates, lipids, amino acids and bile acids.164
Understanding how modification of the
metabolic profile may influence peripheral or central haemodynamics (at rest and during
exercise) could provide mechanistic insights of disease progression in people with T2DM.

89
In this study, we used untargeted metabolomics analysis and pattern recognition (principal
component analysis; PCA) with the aim of identifying metabolic perturbations in people with
T2DM compared with healthy non-diabetics. We aimed to determine the relationships
between metabolic patterns (principal components; PC) and both peripheral and central
haemodynamics recorded during resting and exercise conditions. Given the central
haemodynamic disturbances in patients with T2DM, and also that exercise provides a means
to reveal haemodynamic irregularity that may be obscured at rest, we hypothesised that
metabolomic profiles would be more closely associated with central haemodynamics (and
exercise) than with peripheral haemodynamics.
6.3 Methods
6.3.1 Study participants
Forty participants with T2DM and 40 sex-matched non-diabetic controls were recruited for
this study through local community advertisements. Participants were excluded if they were
below 18 years of age, pregnant or had a clinical history of cardiovascular complications
including myocardial infarction, stroke or sustained arrhythmia. Of 80 participants, two
participants were additionally excluded due to a missing serum sample (control group) and
haemodynamic data (diabetic group). T2DM was diagnosed by the participants’ physician
according to the accepted clinical criteria for hyperglycemia (fasting or two hours post
glucose load).217
The study was approved by the Human Research Ethics Committee of the
University of Tasmania. All procedures were performed in accordance with the Declaration
of Helsinki and all participants provided informed consent.
6.3.2 Study protocol
Resting serum blood samples were acquired in the morning after over-night fasting for
metabolomics analysis and clinical chemistry measures, and participants were fitted with an
ambulatory BP device to measure 24 hour BP. On another occasion scheduled within seven
days (also in the morning), participants were examined for peripheral and central
haemodynamics at rest and during exercise in a quiet and temperature-controlled room.
Participants refrained from consuming heavy meals and caffeine or smoking for at least three
hours prior to examination and avoided exercise on the day of examination. Brachial BP was
measured after 10 minutes of rest on a bed in semi-recumbent position, followed by

90
measurements of central BP, AIx, augmentation pressure (AP), aortic stiffness and systemic
vascular resistance index (SVRi). When resting measures were completed, participants were
asked to perform moderate intensity semi-recumbent cycling exercise (60% of age predicted
maximal heart rate) on a bicycle ergometer positioned on the bed (Rehab Trainer 881,
MONARK Exercise110 AB, Vansbro, Sweden), and all measures were repeated during
exercise, as previously described.188
6.3.3 Clinical chemistry
Serum samples were analysed using standard laboratory procedures to determine glucose,
glycated haemoglobin (HbA1C), insulin, triglycerides, total, low-density lipoprotein (LDL)
and high-density lipoprotein (HDL).
6.3.4 Haemodynamic variables
Peripheral haemodynamics. Brachial BP was measured in duplicate by a trained non
clinician using a validated semi-automated device (Omron HEM-907; OMRON Europe B.V.
(OMCE), Hoofddorp, The Netherlands),183
in accordance with guidelines.4 Pulse pressure
(PP) was defined as the difference between systolic and diastolic BP defined Brachial BP
during exercise was acquired in duplicate using a validated mercury-free sphygmomanometer
(UM-101B, A&D Medical, Thebarton, South Australia).184
An HRE was defined as exercise
peripheral systolic BP ≥ 170 mmHg for men and ≥ 160 mmHg for women (or the highest
tertile of the study population, as previously described).199
Ambulatory BP was measured
every 20 minutes during the day and every 30 minutes during the night using a TM-2430
monitor (A&D Medical, Sydney, Australia). Cardioimpedance was used to measure SVRi
(Physio Flow; Manatec Biomedical; Macheren, France).193
Central haemodynamics.
Duplicate measures of central BP were recorded at rest and during exercise using validated
and reproducible radial applanation tonometry (SphygmoCor 8.1, AtCor Medical, Sydney,
NSW).47, 48
The pressure waveforms were calibrated using the brachial systolic and diastolic
BP values measured prior to applanation tonometry. AP was calculated as the difference
between the second and first systolic peak of the central pressure waveform, and expressed as
a percentage of the PP for definition of AIx (also normalised to heart rate of 75 bpm). Resting
and exercise aortic stiffness was measured by pulse wave velocity (PWV) and applanation
tonometry (SphygmoCor 8.1, AtCor Medical, Sydney, NSW).177

91
6.3.5 Metabolomics analysis
Liquid chromatography-mass spectrometry (LC-MS) - Collected blood samples for
metabolomics analysis were allowed to clot at room temperature for 30 minutes before being
centrifuged at 3000 rpm for 15 minutes. Serum was transferred into aliquot tubes and stored
at -80°C until analysis. Samples were thawed and a 100 µL aliquot of each sample was mixed
with 300 µL of ice-cold methanol, incubated at 4°C for 20 minutes and centrifuged at 13200
g for 10 minutes. The supernatant was lyophilized in a vacuum centrifuge (Labconco, Kansas
City, USA) and re-stored at -80°C. The dried samples were reconstituted in 100 µL of HPLC-
grade water prior to LC-MS analysis. Samples were vortexed and centrifuged for 15 minutes,
and supernatant was transferred to vials.10
Quality control (QC) samples were prepared by
mixing 10 µL aliquots taken from each study sample and analysed throughout the LC-MS
runs to ensure analytical consistency and correct for systematic drifts (four study samples
were bracketed by two QCs). Samples from participants with T2DM were matched with
samples from non-diabetic participants by age, sex, and anthropometric measures and were
analysed together to protect against systematic bias. An LTQ-OrbitrapXL mass spectrometer
(ThermoFisher Scientific, Bremen, Germany) controlled by XCalibur v2 software
(ThermoFisher Scientific) was used for sample analysis. Chromatographic separation was
performed on a Waters Nova-Pak 4.0 µm C18 column (3.91x150 mm) with an injection
volume of 10 µL. The mobile phases used for the sample elution were A) 0.1% formic acid in
water and B) 0.1% formic acid in methanol, with a flow rate of 0.8 mL/minute. Both positive
(PIMS) and negative (NIMS) ionization modes were used for data acquisition. XCMS
software running in R (R 2.14; http://cran.r-project.org/) was used for data processing - peak
finding, grouping and retention time alignment. The parameters for deconvolution were:
method='centWave', ppm=3, peakwidth=5-30, snthresh=6, mzdiff=0.01; and for retention
time correction: method="obiwarp" and profStep=0.1. A singular value decomposition-based
method (EigenMS) was used for data normalisation.
Proton nuclear magnetic resonance (1H NMR) spectroscopy – A 500 µL aliquot of serum
was mixed with 1 mL of methanol (2:1 v/v with original sample), incubated in a -20°C
freezer for 20 minutes and centrifuged for 10 minutes at 13,200 g. Supernatants were dried in
a vacuum centrifuge overnight (Labconco, Kansas City, USA), re-suspended in 700 µL NMR
buffer (2 mM 3-(trimethylsilyl)-1-propanesulfonic acid sodium salt in D2O) and stored at -
80°C until the analysis. 1H NMR spectra were acquired using an Agilent/Varian Inova

92
400 MHz wide bore spectrometer (Varian Medical Systems, Palo Alto, CA, USA), in a 5mm
ID-PFG probe, as described previously.218
Briefly, spectra were acquired with 90° pulse
excitation, sweep width of 4,299 ppm and relaxation delay of 2 seconds at 25°C. A total of
128 transients were collected into 32000 complex data points. The water resonance was set to
the centre of the sweep width on the transmitter offset and attenuated using a pre-saturation
pulse of 2 seconds during the relaxation delay and the mixing time (100 ms) of the NOESY
pulse sequence. Data were Fourier-transformed, probalistic-quotient normalised and ‘binned’
using an adaptive-intelligent algorithm described elsewhere.112
6.3.6 Data analysis, statistics and feature annotation
The 1H NMR and LC-MS data were mean-centred and Pareto-scaled before using PCA to
dimensionally reduce the data using PLS Toolbox 6.5 (Eigenvector Research Inc.,
Wenatchee, US). Visual inspection of a ‘scree’ plot of captured variance versus number of
components was used to identify the number of PCs comprising each model (prior to any
further analysis). Plots of scores on each PC were visually inspected. Those that appeared to
separate the groups were compared using an independent t-test. Loading coefficients were
used to identify metabolites that significantly contributed to discriminatory PCs. In addition,
individual metabolites were compared across groups by independent t-test with significance
cut-off p = 0.05 after Benjamini-Hochberg multiple testing adjustment.195
The LC-MS data
were checked for artefacts, de-isotoped and putatively annotated using online databases and
the Taverna workflows.196
Unambiguous identification of LC-MS metabolites was confirmed
by tandem mass spectrometry (MS/MS), 1H NMR spectroscopy and online databases. All
identified metabolites listed in results are accompanied by the METLIN identification (MID)
number.
The rest of the standard statistical analyses were conducted using SPSS 20.0 (IBM SPSS
Statistics for Windows, Armonk, NY: IBM Corp). Clinical characteristics of study
participants were presented as mean and standard deviation. Comparisons between
participants with T2DM and non-diabetic controls were performed by independent t-tests,
whereas comparisons between categorical variables were assessed by chi-squared tests.
Analysis of covariance was used to explore the difference in aortic PWV between groups
while adjusting for resting peripheral BP. Associations between PCs, individual identified
metabolites and physiological variables were assessed by Pearson correlations. Multiple
linear regression was used to assess the independent associations between PCs and

93
haemodynamic variables, while correcting for age, sex, body mass index, the use of
antihypertensive medications and statins. A p-value of 0.05 was used as a significance cut-
off.
6.4 Results
6.4.1 Clinical characteristics
Table 6.1 represents the clinical characteristics of study participants. There were no
differences in sex between groups, but participants with T2DM were older, had higher waist-
to-hip ratio, body mass index, and were taking more medications (statins and
antihypertensives) compared to non-diabetic controls. As expected, T2DM participants had
significantly higher fasting serum glucose, HbA1C, triglycerides and insulin concentrations
than controls. However, total cholesterol, HDL and LDL cholesterol were significantly lower
in participants with T2DM, probably due to lipid lowering medications.
Table 6.1 Clinical characteristics of study participants
Characteristics Control
(n = 39)
T2DM
(n = 39)
p value
Age (years) 52 ± 10 62 ± 9 <0.001
Sex, male (%) 46 51 0.821
Body mass index (kg/m2) 24.7 ± 3.1 31.1 ± 5.5 <0.001
Antihypertensive medications (%) 0 61 <0.001
Statins (%) 0 64 <0.001
Diabetic medications (%) 0 67 <0.001
Glucose (mmol/L) 4.7 ± 0.4 7.6 ± 1.8 <0.001
HbA1C (%) 5.5 ± 0.4 7.2 ± 0.8 <0.001
Insulin (mU/L) 2.4 ± 4.6 10.3 ± 8.8 <0.001
Triglycerides (mmol/L) 1.0 ± 0.5 1.5 ± 0.7 <0.001
Total cholesterol (mmol/L) 5.4 ± 1.0 4.4 ± 1.0 <0.001
HDL cholesterol (mmol/L) 1.7± 0.4 1.3 ± 0.4 <0.001
LDL cholesterol (mmol/L) 3.3 ± 0.9 2.7 ± 0.8 <0.001
Glycated haemoglobin HDL, high density lipoprotein; LDL, low density lipoprotein.
6.4.2 Haemodynamic variables
Table 6.2 summarises the peripheral and central haemodynamic variables measured at rest
and during exercise.

94
Table 6.2 Peripheral and central haemodynamic variables measured at rest and during
exercise in participants with type 2 diabetes mellitus compared with non-diabetic controls
Characteristics Control (n = 39) T2DM (n = 39) p value
Peripheral haemodynamics
Brachial systolic BP (mmHg) 114 ± 9 125 ± 13 <0.001
Brachial pulse pressure (mmHg) 49 ± 4 56 ± 11 <0.001
Brachial diastolic BP (mmHg) 65 ± 6 69 ± 8 0.011
SVRi (dyne/s/cm5) 2780 ± 361 2750 ± 471 0.754
Ex brachial systolic BP (mmHg) 135 ± 14 156 ± 17 <0.001
Ex brachial pulse pressure (mmHg) 62 ± 11 79 ± 15 <0.001
Ex brachial diastolic BP (mmHg) 73 ± 8 78 ± 8 0.017
Ex SVRi (dyne/s/cm5) 1843 ± 323 2028 ± 352 0.019
24h systolic BP (mmHg) 130 ± 12 135 ± 13 0.095
24h pulse pressure (mmHg) 51 ± 12 59 ± 10 <0.001
Daytime systolic BP (mmHg) 136 ± 13 139 ± 15 0.331
Daytime pulse pressure (mmHg) 52 ± 8 61 ± 10 <0.001
Night systolic BP (mmHg) 113 ± 11 121 ± 13 0.002
Night pulse pressure (mmHg) 47 ± 7 54 ± 10 <0.001
Central haemodynamics
Central systolic BP (mmHg) 102 ± 9 115 ± 12 <0.001
Central pulse pressure (mmHg) 36 ± 5 45 ± 9 <0.001
Central diastolic BP (mmHg) 66 ± 6 70 ± 8 0.013
Augmentation pressure (mmHg) 8 ± 5 13 ± 5 <0.001
Augmentation index (%) 13 ± 11 23 ± 6 <0.001
Aortic pulse wave velocity (m/s) 6.4 ± 1.4 8.0 ± 2.1 <0.001
Ex central systolic BP (mmHg) 114 ± 12 133 ± 14 <0.001
Ex central pulse pressure (mmHg) 39 ± 7 53 ± 12 <0.001
Ex central diastolic BP (mmHg) 75 ± 9 79 ± 9 0.010
Ex augmentation pressure (mmHg) 8 ± 5 13 ± 5 <0.001
Ex augmentation index (%) 13 ± 13 25 ± 8 <0.001
Ex aortic pulse wave velocity (m/s) 7.1 ± 1.4 9.6 ± 2.0 <0.001
BP, blood pressure; SVRi, systemic vascular resistance index; ex, exercise.

95
Peripheral haemodynamics. Patients with T2DM had higher resting and exercise brachial BP
compared to non-diabetic controls (p < 0.001). The prevalence of an HRE in T2DM group
was 31%, and in non-diabetic controls 5%. There were no significant differences in SVRi
between groups at rest, but during exercise, SVRi was significantly higher in participants
with T2DM. Ambulatory BP variables were also significantly higher in participants with
T2DM, except for 24 hour systolic BP and daytime systolic BP. Central haemodynamics.
Patients with T2DM had higher resting and exercise central BP, AP and AIx compared to
non-diabetic controls. Resting aortic PWV was also significantly increased, even after
correcting for the brachial systolic BP (p = 0.029). The change in brachial systolic BP from
rest to exercise was significantly higher in participants with T2DM compared to non-diabetic
controls (31 ± 13 mmHg vs. 21 ± 13 mmHg; p = 0.001), and similar for the change in central
systolic BP (18 ± 12 mmHg vs. 12 ± 11 mmHg; p = 0.026).
6.4.3 Metabolomics analysis
The metabolic profiles of participants with T2DM acquired by LC-MS were compared to
those of non-diabetic controls. PCA models were built for both NIMS and PIMS data. For the
NIMS, a six-component PCA model accounted for 62% of the total variance. NIMS PC1
(27% of variance explained; Figure 6.1) and NIMS PC3 (8% of variance explained) gave
good discrimination between groups (p < 0.001 and p < 0.002, respectively). Examination of
the loading coefficients revealed metabolites that significantly contributed to NIMS PC1 and
included glucose (MID 133), fructose (MID 135), lactate (MID 63094), α-N-phenylacetyl-L-
glutamine (MID 58397), glycochenodeoxycholic acid 3-glucuronide and 2-hydroxy-3-(4-
methoxyethylphenoxy)-propanoic acid (MID 1255). The most significant contributor to
NIMS PC3 was inosine (MID 84), and the relative difference of inosine in T2DM
participants relative to non-diabetic controls is presented in Figure 6.2. Also, there were no
significant differences in inosine levels between T2DM participants that were taking
antihypertensive medications and/or statins compared to those that were not using the
medications (p > 0.05). For the PIMS data, a three-component PCA model was selected and
accounted for 79% of the total variance in the data. PIMS PC1 (64% of total variance) gave
good separation between groups (p < 0.001). Loading coefficients showed that amino acids
including tyrosine (MID 34), proline (MID 29) and leucine (MID 24) were the significant
contributors to PIMS PC1. The 1H NMR metabolic profiles showed metabolic patterns that
were similar and complementary to the metabolic profiles acquired using LC-MS. For the 1H

96
NMR data, a three-component PCA accounted for 65% of the total variance. NMR PC1 (33%
of variance explained) and NMR PC2 (21% of variance explained) produced good
discrimination between groups (p < 0.001 for both). Major NMR PC1 contributors were
again glucose (MID 133), fructose (MID 135) and lactate (MID 63094), whereas significant
contributors to NMR PC2 were creatinine (MID 8) and 3-hydroxybutyric acid (MID 85159).
All metabolites presented were increased in T2DM participants, except for inosine and
creatinine that were decreased. Identified metabolites were summarised in Table 6.3.
Figure 6.1 Score plot
The score plot from the principal component analysis of negative ion mass spectrometry
spectra of serum from participants with type 2 diabetes mellitus (T2DM) and non-diabetic
controls; groups are different on PC1 (p < 0.001). Metabolites that significantly contributed
to negative ion mass spectrometry spectra principal component 1 included glucose, fructose,
lactate, α-N-phenylacetyl-L-glutamine, glycochenodeoxycholic acid 3-glucuronide and 2-
hydroxy-3-(4-methoxyethylphenoxy)-propanoic acid.

97
Figure 6.2 Difference in inosine in participants with type 2 diabetes mellitus (T2DM)
relative to non-diabetic controls, measured in arbitrary units (a.u.).
Table 6.3 Summary of identified serum metabolites with significantly different
concentrations in participants with type 2 diabetes mellitus versus non-diabetic controls
Metabolite Formula Platform *p
Glucose C6H12O6 NIMS/NMR 3×10-13
Fructose C6H12O6 NIMS/NMR 4×10⁻⁷
Lactate C3H6O3 NIMS/NMR 4×10⁻⁵
α-N-Phenylacetyl-L-glutamine C13H16N2O4 NIMS 8×10⁻⁴
Glycochenodeoxycholic acid 3-glucuronide C32H51NO11 NIMS 2×10⁻⁶
2-Hydroxy-3-(4-methoxyethylphenoxy)-propanoic
acid
C12H16O5 NIMS 4×10⁻⁴
Inosine C10H12N4O5 NIMS 4×10⁻³
Tyrosine C9H11NO3 PIMS 1×10⁻⁴
Proline C5H9NO2 PIMS 3×10⁻⁴
Leucine C6H13NO2 PIMS 8×10⁻⁶
Creatinine C4N7H3O NMR 1×10⁻⁴
3-Hydroxybutyric acid C4H8O3 NMR 1×10⁻²
NIMS, negative ion mass spectrometry; NMR, nuclear magnetic resonance; PIMS, positive
ion mass spectrometry; *p value after Benjamini and Hochberg correction. Inosine and
creatinine were decreased, whereas all other metabolites were increased in participants with
T2DM compared to non-diabetic controls

98
6.4.4 Associations between metabolomics principal components and haemodynamic
variables.
Figure 6.3 illustrates the correlations between PCs (Pearson’s r coefficient, absolute values),
identified metabolites and peripheral and central haemodynamic variables. Among all PCs,
NIMS PC1 was the strongest correlate of peripheral and central haemodynamics being the
highest for rest and exercise central systolic BP, AP and AIx, as well as for exercise brachial
systolic BP, 24 hour and daytime PP (all r > 0.400). Also, mean univariable correlations of
NIMS PC1 were highest for exercise central haemodynamics (r = 0.457), followed by rest
central haemodynamics (r = 0.405), exercise peripheral haemodynamics (r = 0.395), and the
lowest were for rest peripheral haemodynamics (r = 0.225). Table 6.4 shows the associations
of NIMS PC1 on multiple regression analysis with individual peripheral and central
haemodynamics after adjusting for age, sex and body mass index, the use of antihypertensive
medications and statins. NIMS PC1was significantly associated with exercise SVRi, 24 hour
and daytime PP. Among central haemodynamics, NIMS PC1 was significantly associated
with central rest and exercise AP and AIx. When the same regression models were
constructed with the addition of statins, the results did not change significantly.
NIMS PC3 was significantly inversely associated with brachial resting (β = -0.231, p = 0.032)
and exercise (β = -0.212, p = 0.033) systolic BP, even after correcting for age, sex, body mass
index, the use of antihypertensive medications and statins. NMR PC2 scores were
significantly, inversely associated with exercise brachial systolic BP and PP, 24 hour and
daytime PP. Among central haemodynamics, NMR PC2 scores were negatively associated
with central both resting and exercise BP, exercise central PP, and resting AP and AIx (Table
6.5) after correction for age, sex, body mass index, the use of antihypertensive medications
and statins.
Among individual metabolites, glucose was the strongest independent predictor of central rest
systolic BP (β = 0.274, p = 0.032), exercise AP (β = 0.233, p = 0.016) and rest and exercise
AIx (β = 0.254, p = 0.019 and β = 0.272, p = 0.007; respectively) after correcting for age, sex,
body mass index, the use of antihypertensive medications and statins.

99
Figure 6.3 Heat plot
Correlations (Pearson’s r coefficient, absolute values) between principal components,
identified metabolites and peripheral and central haemodynamic variables measured at rest
and during exercise. PC, principal component; NIMS, negative ion mass spectrometry; PIMS,
positive ion mass spectrometry; NMR, nuclear magnetic resonance; BP, blood pressure; PP,
pulse pressure, AP, augmentation pressure; AIx, augmentation index; PWV, pulse wave
velocity. Among all PCs, NIMS PC1 was the strongest correlate of peripheral and central
haemodynamics (highlighted by rectangular box) being the highest for rest and exercise
central systolic BP, AP and AIx, as well as for exercise brachial systolic BP, 24 hour and
daytime PP (all r > 0.400).

100
Table 6.4 Multiple regression analysis assessing the associations of negative ion mass
spectrometry principal component 1 (NIMS PC1) with peripheral and central haemodynamic
variables
Dependent variable Standardized β p value Adjusted R2
Peripheral haemodynamics
Brachial systolic BP 0.118 0.399 0.202
Brachial pulse pressure 0.056 0.677 0.270
SVRi 0.110 0.490 0.067
Ex brachial systolic BP 0.102 0.430 0.313
Ex brachial pulse pressure 0.019 0.875 0.402
Ex SVRi 0.303 0.041 0.140
24h pulse pressure 0.389 0.009 0.156
Daytime pulse pressure 0.401 0.007 0.140
Central haemodynamics
Central systolic BP 0.241 0.085 0.210
Central pulse pressure 0.108 0.392 0.350
Augmentation pressure 0.276 0.022 0.428
Augmentation index 0.275 0.020 0.462
Aortic pulse wave velocity 0.085 0.524 0.294
Ex central systolic BP 0.158 0.218 0.335
Ex central pulse pressure 0.085 0.470 0.434
Ex augmentation pressure 0.243 0.029 0.510
Ex augmentation index 0.270 0.015 0.535
BP, blood pressure; SVRi, systemic vascular resistance index; ex, exercise; Adjusted for age,
sex, body mass index, the use of antihypertensive medications and statins
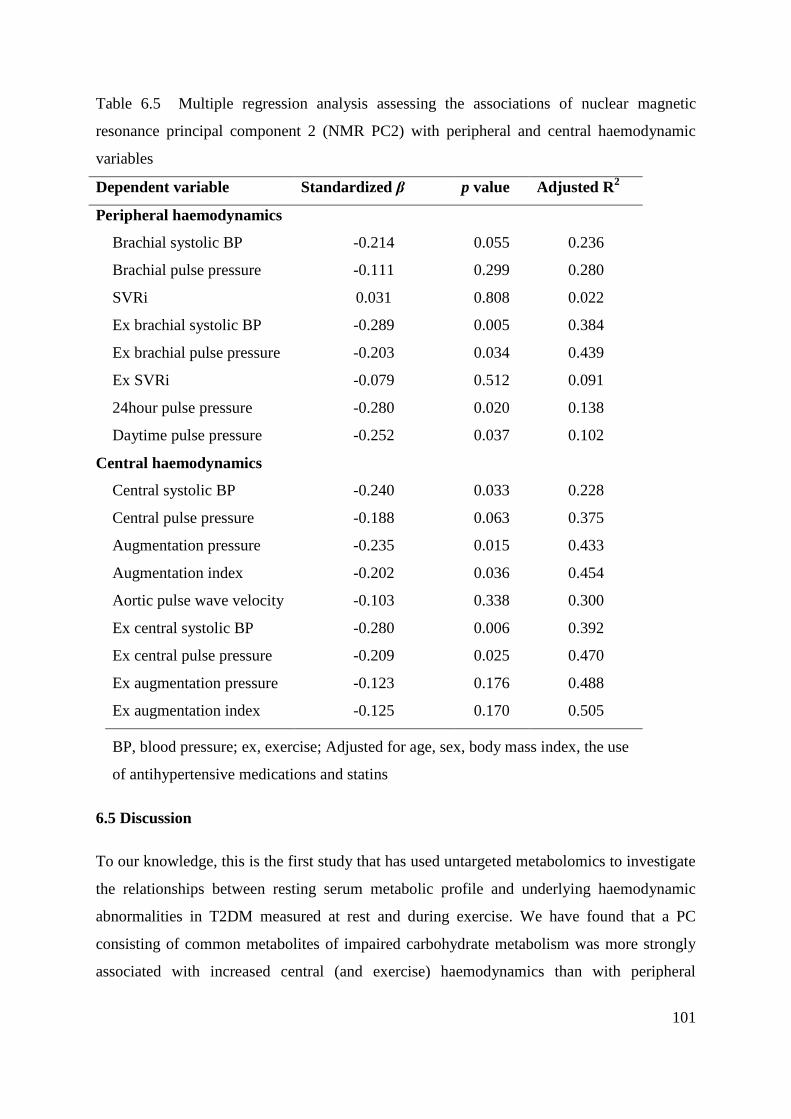
101
Table 6.5 Multiple regression analysis assessing the associations of nuclear magnetic
resonance principal component 2 (NMR PC2) with peripheral and central haemodynamic
variables
Dependent variable Standardized β p value Adjusted R2
Peripheral haemodynamics
Brachial systolic BP -0.214 0.055 0.236
Brachial pulse pressure -0.111 0.299 0.280
SVRi 0.031 0.808 0.022
Ex brachial systolic BP -0.289 0.005 0.384
Ex brachial pulse pressure -0.203 0.034 0.439
Ex SVRi -0.079 0.512 0.091
24hour pulse pressure -0.280 0.020 0.138
Daytime pulse pressure -0.252 0.037 0.102
Central haemodynamics
Central systolic BP -0.240 0.033 0.228
Central pulse pressure -0.188 0.063 0.375
Augmentation pressure -0.235 0.015 0.433
Augmentation index -0.202 0.036 0.454
Aortic pulse wave velocity -0.103 0.338 0.300
Ex central systolic BP -0.280 0.006 0.392
Ex central pulse pressure -0.209 0.025 0.470
Ex augmentation pressure -0.123 0.176 0.488
Ex augmentation index -0.125 0.170 0.505
BP, blood pressure; ex, exercise; Adjusted for age, sex, body mass index, the use
of antihypertensive medications and statins
6.5 Discussion
To our knowledge, this is the first study that has used untargeted metabolomics to investigate
the relationships between resting serum metabolic profile and underlying haemodynamic
abnormalities in T2DM measured at rest and during exercise. We have found that a PC
consisting of common metabolites of impaired carbohydrate metabolism was more strongly
associated with increased central (and exercise) haemodynamics than with peripheral
102
haemodynamics, suggesting that the metabolic irregularities in glucose metabolism, the
hallmark of T2DM, may be mechanistically involved in abnormal central haemodynamics.
Furthermore, inosine was decreased in T2DM participants (implicated as an anti-
inflammatory agent), and inversely associated with the increased BP values (rest and
exercise), this finding suggests a possible role of inflammation as a contributing factor in
hypertension development and exaggerated exercise BP.
The PCA of NIMS data (PC1) identified major contributors to the separation between T2DM
participants and non-diabetic controls including expected markers of dysfunctional
carbohydrate metabolism. Increased lactate, as a variable within this PC, suggests not only
‘overflow metabolism’ but may also signify a systemic decrease in oxidative capacity in
insulin-resistant skeletal muscle219
or adipose tissue.220
This signature metabolic pattern
underlying T2DM was significantly associated with central BP indices (rest and exercise AP
and AIx; markers of left ventricular [LV] afterload). Also, glucose levels alone independently
predicted rest central systolic BP, exercise AP and rest and exercise AIx. These observations
suggest that disordered carbohydrate metabolism may be directly involved in haemodynamic
abnormalities in diabetics. The underlying mechanisms for closer association with central
haemodynamics may be due to formation of advanced glycation end-products by non-
enzymatic crosslinks between sugars and amino acids. This occurs preferentially in central
elastic arterial walls compared to more muscular peripheral arteries, causing alterations in
elastin and collagen fibres, and increased large artery stiffness. Indeed, high concentrations of
advanced glycation end-products have been found in post-mortem aorta samples from
diabetic patients compared to non-diabetic controls and were significantly correlated with the
aortic stiffness.94
Central BP is pathophysiologically more important than brachial BP
because it closely represents the pressure to which the vital organs (heart, brain and kidneys)
are exposed. Hence central BP more strongly relates to CV events than brachial BP.12
However, the present study was cross-sectional in nature and we cannot demonstrate
causality. Also, we cannot exclude the possibility that the metabolic triad of glucose, fructose
and lactate is simply a surrogate for disease severity with which central haemodynamic
dysfunction and other pathogenic variables may correlate. NIMS PC1was also significantly
associated with exercise (but not resting) SVRi, which was significantly increased in T2DM
participants, suggesting that the changes of peripheral vasculature may be evident during
physiological stress, such as exercise.
103
We observed decreased levels of inosine (a major contributor of NIMS PC3) in participants
with T2DM. Inosine is a naturally occurring purine formed from the conversion of adenosine
by adenosine deaminase and it has been shown to be an anti-inflammatory agent.221
Treatment with inosine had a protective effect against the development of diabetes in two
murine models of diabetes (streptozotocin-induced diabetes and spontaneous non-obese
diabetic mouse model) by decreasing pancreatic leukocyte infiltration and oxidative stress.222
Since inosine was decreased in T2DM participants in our study, and inversely associated with
the increased rest and exercise BP values, this finding suggests a possible role of
inflammation as a contributing factor in hypertension development and exaggerated exercise
BP. Indeed, C-reactive protein (a sensitive marker of inflammation) was independently
associated with insulin sensitivity and systolic BP in a large, population-based study,223
as
well as with exercise systolic BP during moderate intensity cycling in healthy men and
women.224
Inflammation may be a triggering factor for insulin resistance leading to T2DM,
but also the cause of vascular endothelial dysfunction (altered vasodilator/vasoconstrictor
balance) and consequent BP regulation.168
Further studies are warranted to establish whether
inosine supplementation exerts anti-inflammatory effects with benefit to vascular function
and BP control.
Consistent with previous studies which reported increased amino acid levels in T2DM
individuals,35, 36
the PCA of PIMS in the current study also revealed higher levels of amino
acids including leucine, tyrosine and proline that discriminated T2DM participants from non-
diabetic controls. However, increased levels of amino acids, and in particular branched-chain
amino acids (identified as modulators of insulin secretion),225
may promote insulin resistance
even in non-diabetic individuals most likely via disturbance of skeletal muscle insulin
signalling.226
A recent metabolomics study in the Framingham Offspring cohort has showed
that the amino acids isoleucine, leucine, valine, tyrosine and phenylalanine were increased 12
years before the onset of T2DM and were significantly associated with the future incidence of
T2DM.165
Importantly, increased levels of three amino acids (isoleucine, tyrosine and
phenylalanine) were also significantly associated with the future development of CV disease,
independently of standard CV disease and diabetes risk factors (including measures of insulin
resistance), suggesting that disturbed amino acid metabolism may represent a novel link
between CV disease development and T2DM. A cross-sectional analysis in individuals free
of CV disease reported that each increase in the score of the same three amino acids was
104
associated with higher risk of having subclinical carotid atherosclerosis, as well as with
approximately 80% increased risk of exercise-induced myocardial ischemia in individuals
referred for diagnostic exercise stress testing.166
Also, amino acids levels were significantly
associated with the presence of coronary artery disease in individuals undergoing
catheterization.227
Overall, these findings may suggest that the association between amino
acids and the development of CV disease may be mediated by irregularities in vascular
function, although further studies are required to investigate causal mechanisms.
Although lipid metabolism may also play a significant role in the development of
haemodynamic abnormalities, metabolomics analysis in this study failed to detect any lipid-
related metabolites, as many study participants were on lipid-lowering medications as part of
their standard BP management. Therefore, future studies including people with newly
diagnosed T2DM that are still free from lipid-lowering medications may provide additional
information regarding metabolic disorders and their connections to abnormal haemodynamic
variables. Also, resting and exercise BP were measured by different devices; however, both
devices have been validated according to the standard criteria for BP measurements and
shown to be highly reproducible. The use of different devices might have affected the study
results, including the noticed increase in diastolic BP during exercise.183, 184
In conclusion, our findings show that a signature metabolic pattern of disordered
carbohydrate metabolism was independently associated with central haemodynamics in
patients with T2DM under resting and exercise conditions. Furthermore, decreased inosine
levels in subjects with T2DM and inverse correlation with BP values (rest and exercise)
suggest that inflammation may contribute to haemodynamic abnormalities in T2DM and
potentially offer a novel therapeutic route.
6.6 Contribution of chapter 6 to thesis aims
People with T2DM have a higher prevalence of an HRE compared to those without T2DM,
but the underlying mechanisms are unknown. Chapter 6 represents the first study that used
the combination of untargeted metabolomics analysis, along with the haemodynamic
measures, to help explaining possible metabolic factors that may be contributing to an HRE
at moderate intensity in people with T2DM. This study showed that a signature metabolic
pattern of disordered carbohydrate metabolism in T2DM (including increased levels of
glucose, fructose and lactate) was independently associated with the exercise central BP

105
haemodynamic indices, suggesting that impaired carbohydrate metabolism may be a possible
metabolic mechanism explaining central (but not peripheral) exercise hypertension. These
findings are aligned with the observations from previous studies reporting that T2DM has a
greater impact on central, rather than peripheral, arterial segments. Given the independent
prognostic value of central BP measures and their higher pathophysiological significance
compared to peripheral BP variables, these findings have clinical relevance. On the other
hand, utilisation of exploratory metabolomics analysis has provided some evidence for the
role of inflammation as a contributing factor of abnormal peripheral BP and an HRE in
people with T2DM.

106
Chapter 7. Summary and Future Directions

107
Hypertension is a leading risk factor for global disease burden,3 affecting approximately one
billion individuals worldwide, with this number expected to rise.15
Resting office blood
pressure (BP) is used for the diagnosis of hypertension;4 however, despite apparently normal
BP at rest, some individuals experience a hypertensive response to exercise (HRE). An HRE
at moderate intensity (akin to the condition experienced during normal daily life activities) is
associated with an increased risk for adverse cardiovascular (CV) events.5 It may provide
better representation of an individual’s true BP when compared to their resting office BP,6
but, little is known about the underlying pathophysiological contributors of an HRE.
Therefore, this research program represented the first comprehensive CV examination of
people with an HRE at moderate intensity and broad exploration of haemodynamic and
biochemical (haemostatic and metabolic) correlates of an HRE.
Chapter 4 makes an important contribution to the understanding of haemodynamic and
haemostatic correlates of an HRE at moderate intensity in people with apparently normal
resting office BP. This study demonstrated that a haemostatic marker, von Willebrand factor
(vWf),79
was significantly increased in people with an HRE and positively associated with
moderate intensity exercise systolic BP. Although endothelial dysfunction was not estimated
with standard measures in this study (e.g. flow-mediated vasodilation), an increased vWf
(also a marker of endothelial dysfunction) may provide some indications that endothelial
dysfunction may be present in people with an HRE and may be a contributing factor of an
HRE. Indeed, the association between vWf and moderate intensity exercise systolic BP may
be a reflection of the relationship between endothelial dysfunction and high exercise BP, due
to the altered capacity of the endothelium to appropriately dilate in order to mitigate pressure
rises (particularly during exercise) and maintain normal vascular tone. Future studies may
direct attention towards establishing the role of endothelial in an HRE at moderate intensity.
Despite being a marker of endothelial dysfunction, vWf is also a haemostatic contributor to
blood coagulation, thrombosis and possible CV events, which may possibly explain the link
between an increased CV risk and an HRE. Indeed, increased shear pressure (or in the case of
an HRE, a greater ambulatory cyclic BP load over time) would have a pronounced effects on
vascular breakdown and increased pro-coagulation capacity, leading to the initiation of the
coagulation cascade and an increase in thrombin generation. However, in this study
population, a vWF was increased in the absence of a significant rise in other haemostatic
(pro-coagulant) markers, which included tissue factor, thrombin-antithrombin complex and

108
fibrinogen. These findings suggest that apparently healthy people with an HRE experience a
low grade (rather than exaggerated) activation of the coagulation system. Nevertheless, this
finding has potential clinical significance, especially in those who also have other CV risk
factors that could possibly act as promoters of blood coagulation.
Interestingly, people with an HRE had a significantly different response in vWf following
moderate intensity exercise compared with those with a normal BP response (having lower
vWf levels compared to baseline), despite having elevated exercise BP levels. Although a
limited number of studies have examined the influence of moderate intensity exercise (in
contrast to strenuous exercise) on haemostatic markers, our study is in agreement with the
study of Wang et al201
who also demonstrated that moderate intensity exercise suppresses
platelet activation and coagulation in sedentary men (sedentary behaviour significantly
associated with increased CV risk).228
It appears that moderate intensity exercise in HRE
subjects could potentially have beneficial effects that may be more pronounced in those with
excessive initial vWf levels and potently decrease the risk for, at least pro-thrombotic, CV
events. However, future studies should investigate these potential beneficial effects of
moderate intensity exercise in this population.
This study also included the collection of serum samples for exploring metabolic correlates of
an HRE at moderate intensity, as an HRE is also found to be associated with various
metabolic CV risk factors including increased total cholesterol and triglyceride levels.
Therefore, future steps will include the metabolomics analysis of these serum samples
(collected at rest and following the exercise) in people with an HRE and their matched
controls to investigate the metabolic correlates of an HRE, as well as their changes induced
by moderate intensity exercise. Due to the complexity of the metabolomics analysis, this
study will be pursued following the completion of this thesis.
Current beliefs ascribe abnormalities in haemodynamic components, in particular aortic
stiffness, to play a significant role in an HRE, as increased aortic stiffness may fail to buffer
the rise in BP occurring with increased cardiac output and blood flow during exercise.50
However, the results of this study outlined a less crucial role of aortic stiffness in the
development of an HRE. Indeed, although aortic stiffness was increased in people with an
HRE, an independent relationship with exercise systolic BP at moderate intensity was not
observed. The lack of an independent association between arterial stiffness and an HRE may
suggest that the endothelial dysfunction may play a key role in an HRE, given that arterial
109
stiffness is closely regulated by the endothelial function and nitric oxide bioavailability.66-69
Therefore, future studies should explore whether therapeutic intervention targeting
endothelial dysfunction and nitric oxide bioavailability may potentially prove to have benefits
to vascular function and BP control in an HRE population.
It should be noted, however, that this study included reasonably healthy subjects with an
HRE at moderate intensity without an established hypertension at rest, compared to previous
studies that included mostly hypertensive individuals.51
Therefore, the possibility that more
advanced arterial stiffness (noticed in people with already established essential hypertension)
may have a greater influence on exercise hypertension cannot be excluded. Also, the findings
were limited to a small population of people with an HRE, and further verification of these
results in a larger sample cohort is needed. Furthermore, the findings of this study also lend
some support that physiological stress, such as exercise, may represent a useful tool to reveal
underlying CV abnormalities that are not evident at rest. This is evidenced by finding that
systemic vascular resistance was increased in people with an HRE only when measured
during exercise conditions, but not at rest.
Chapter 5 represents the first study that used the metabolomics analysis, along with
haemodynamic measures, in people with an HRE, primarily for developing metabolomics
analysis, as well as to explore metabolic actions of spironolactone on exercise BP and aortic
stiffness. The results of Chapter 5 further supported that aortic stiffness may not be as
relevant to an HRE as is widely believed. Indeed, spironolactone reduced exercise systolic
BP and aortic stiffness by purely BP-dependent effects, and there was a lack of a significant
relationship between the reduction in exercise BP and the decrease in aortic stiffness by
spironolactone treatment. Another important observation of this study was that the reduction
in exercise systolic BP by spironolactone treatment was not independent of the use of statins,
angiotensin converting enzyme inhibitors and other CV risk factors, suggesting that other
metabolic mechanisms (possibly those involved with the statins or angiotensin converting
enzyme inhibitors treatment) may be involved in the development of an HRE. Thus, future
studies exploring the metabolic effects of statins and/or angiotensin converting enzyme
inhibitors treatment in people with an HRE using metabolomics techniques would represent a
significant advancement to the understanding of possible underlying mechanisms associated
with an HRE. Nevertheless, this study itself represents an important scientific contribution, as
it shows for the first time how metabolomics analysis when combined with extensive

110
haemodynamic examination (including aortic stiffness and exercise BP measures) could help
uncover important mechanistic insights of different conditions (including an HRE) and
discovering possible treatment strategies.
Investigations of the metabolic correlates of an HRE at moderate intensity (including
peripheral and central) were investigated in Chapter 6 in people with a high prevalence of an
HRE, such as those with type 2 diabetes mellitus (T2DM).11
Using a combination of the
metabolomics and haemodynamic analysis, the results suggested that metabolites associated
with the disordered carbohydrate metabolism in T2DM, might have a greater impact on
central (rather than peripheral) exercise BP and an HRE. Although this study cannot
demonstrate causality due to its cross-sectional nature, this closer association with central BP
may potentially be due to the formation of advanced glycation end-products preferably in the
central elastic arterial walls compared to the more muscular peripheral arteries, causing
alterations in elastin and collagen fibres. Also, altered carbohydrate metabolism may also
cause an increased production of oxidative reactive species that may lead to further damage
of vascular structure and function.
The findings that metabolic impairments underlying T2DM have a greater impact on the
preferably central arterial system may be clinically significant, given that central BP indices
(including the augmentation index [AIx]) more strongly relate to CV events than peripheral,12
and that the central BP reflects the pressure to which the vital organs (heart, kidneys and
brain) are directly exposed. These findings may further highlight the importance of including
central BP measurements (resting and ambulatory) when evaluating someone’s BP control,
especially in those with T2DM. However, central BP is still not established in routine clinical
practise, but given that central BP cannot be truly represented by conventional BP measured
at the periphery (brachial artery),36
and ‘true’ BP treatment may not be guided from
peripheral BP measurements, there is a need for standardization of central BP measurement
techniques and introducing the measurement of central BP into clinical practise.
The pathophysiology of an HRE seems to be multifactorial, where inflammatory factors may
also contribute to its development and associated complications. Indeed, the utilisation of
exploratory metabolomics analysis found that the metabolic pattern with the decreased
inosine levels (identified as anti-inflammatory metabolite)221
in T2DM participants were
inversely and independently associated with peripheral exercise BP. Inflammation may
possibly cause a vasodilator/vasoconstrictor imbalance in the vascular endothelial, leading to

111
endothelial dysfunction and BP deregulation.168
Further studies are needed to establish the
role of inosine and inflammation in people with an HRE, and whether inosine
supplementation exerts anti-inflammatory effects with benefits to vascular function and an
HRE. Although lipid metabolism may also play a significant role in the development of an
HRE, it is worth noting that metabolomics analysis in this study population (people with
advanced T2DM) failed to detect any lipid-related metabolites and their associations with an
HRE, as many study participants were on lipid-lowering medications as part of their standard
BP management. Therefore, future studies including people with newly diagnosed T2DM
that are still free from lipid-lowering medications may provide additional information
regarding metabolic disorders and their connections to an HRE. However, an additional
metabolomics analysis of serum samples from Chapter 4 should provide more evidence for
the role of lipid metabolism in non-diabetic people with an HRE.
Chapter 2 – Review of Literature - Part II represents the first comprehensive review of the
literature explaining the clinical application of metabolomics analysis in hypertension
research, as well as the basic principles and challenges of metabolomics. This review article
will especially help the non-experts in this field to better understand and interpret studies
utilising metabolomics techniques. In addition, the research program contained in this thesis
demonstrates how metabolomics analysis could be used for exploring new insights into the
underlying pathophysiological processes associated with high BP. In the future, methodology
regarding the metabolomics analysis developed in these studies (including the normalisation
method presented in Appendix 2) could be applied to further understand the
pathophysiological mechanisms, not only in people with an HRE, but also in other diseases.
Also, the findings in Appendix 1 reporting the clinical significance of measuring BP a few
minutes after the recommended five minutes of rest,4 may have relevance to an appropriate
diagnosis of hypertension and the design of future clinical trials.
Overall, this research further supported evidence that an HRE at moderate intensity,
irrespective of normal resting BP, represents a clinically important entity. Vascular
abnormalities were present in people with an HRE, reflected by an increased aortic stiffness,
but these do not explain an HRE independent of resting BP and other CV risk factors.
Importantly, abnormal blood biochemistry including haemostatic irregularities (also
reflecting endothelial dysfunction), increased metabolic markers related to carbohydrate
metabolism and inflammation in T2DM, explain an HRE independent of resting BP and other

112
CV risk factors. Taken altogether, this thesis provides novel information, and represents a
significant advancement to the understanding of the pathophysiology of an HRE at moderate
intensity.
113
Appendix 1
Waiting a Few Extra Minutes Before Measuring Blood Pressure
Has Potentially Important Clinical and Research Ramifications
This thesis section has been previously published:
Nikolic SB, Abhayaratna WP, Leano R, Stowasser M, Sharman JE. Waiting a few extra
minutes before measuring blood pressure has potentially important clinical and research
ramifications. Journal of human hypertension. 2014;28:56-61
In Appendix 1, a retrospective analysis of data was conducted to define the appropriate timing
(protocol) for resting blood pressure measurements used in all studies that comprise this
thesis. Importantly, the findings of this study have also relevance for the appropriate
diagnosis of hypertension, as well as the design of research studies in which resting office
blood pressure is measured.

114
A1.1 Abstract
Background. Office blood pressure (BP) is recommended to be measured after five minutes
of seated rest, but it may decrease for 10 minutes. This study aimed to determine the change
(and its clinical relevance) in brachial and central BP from five to 10 minutes of seated rest.
Methods. Office brachial and central BP (measured after five and 10 minutes), left
ventricular (LV) mass index, seven-day home and ambulatory BP were measured in 250
participants with treated hypertension.
Results. Office brachial and central BP were significantly lower at 10 compared with five
minutes BP (p < 0.001). Seven-day home systolic BP was significantly lower than office
systolic BP measured at five minutes (p < 0.001), but was similar to office systolic BP at 10
minutes (p = 0.511). From five to 10 minutes, the percentage of participants with controlled
BP increased and the percentage of participants with high central pulse pressure (PP)
decreased (p < 0.001). Moreover, brachial and central PP were significantly correlated with
LV mass index measured at 10 (r = 0.171, p = 0.006 and r = 0.139, p = 0.027, respectively),
but not at five minutes (r = 0.115, p = 0.068 and r = 0.084, p = 0.185, respectively).
Conclusion. Blood pressure recorded after 10 minutes is more representative of true BP
control. These findings have relevance to appropriate diagnosis of hypertension and design of
clinical trials.

115
A1.2 Introduction
Current guidelines for the management of hypertension recommend that office brachial blood
pressure (BP) should be optimally measured after five minutes of seated rest.4, 198
However,
brachial BP may decrease for up to 10 minutes of seated rest, after which reaching a plateau
level.185, 186
Furthermore, office brachial BP averaged over 10 minutes seated rest in the
absence of an observer has been shown to closely relate to out-of-office BP (daytime
ambulatory BP).229
This is an important finding because out-of-office BP measures (e.g.
seven-day home BP and daytime ambulatory BP) have been shown to be stronger predictors
of cardiovascular (CV) risk when compared with office BP values.230, 231
Consequently,
office brachial BP measured after the recommended five minutes rest period may not be a
good representative of true BP, and using this as the sole method to assess BP control may
result in misclassification or inappropriate management of some individuals.232
The first aim
of this study was to determine the change in seated brachial BP when measured after five and
10 minutes of seated rest. This study also sought to determine the clinical relevance of the
change in brachial BP over time by assessing: 1) the change in BP classification; 2) the
comparison with out-of-office BP and; 3) associations with BP-related end-organ damage
(left ventricular [LV] mass).
Central BP may be significantly different from the brachial BP measured at the same time.39
However, central BP is pathophysiologically more important than brachial BP with respect to
CV disease and has a stronger relation to LV mass than brachial BP.233
In recent years, large
longitudinal studies have indicated that central BP has more power for predicting future CV
events and mortality when compared with brachial BP.12
Furthermore, central BP may also
change differently from brachial BP in response to physiological stimuli (e.g. posture,
medications and exercise).44, 234
To our knowledge, there have been no studies examining
how central BP acutely changes over five compared with 10 minutes, and this was an
additional aim of this study. As with the change in brachial BP over time, we also sought to
determine the clinical relevance of central BP changes after five compared with 10 minutes of
seated rest.
A1.3 Methods
A1.3.1 Study population

116
Data was analysed from baseline examination of 250 participants, aged 18 to 75 years, with
treated essential hypertension who were enrolled in the BP GUIDE study
(http://www.anzctr.org.au; ACTRN12608000041358). See Table A1.1 for participant
characteristics. Exclusion criteria included taking more than three antihypertensive
medications or office BP > 180/100 mmHg, a history of coronary artery or renal disease,
secondary hypertension, aortic valve stenosis or obstructive atherosclerosis at the upper limb
(difference of > 20 mmHg in systolic BP between both arms), severe LV hypertrophy (LV
mass index, indexed to height2.7
, in women ≥ 59g/m2.7
and men ≥ 64 g/m2.7
measured by
echocardiography) and pregnant females. The study was approved by the local Human
Research Ethics Committees of attending study sites. All participants gave informed consent
and all the procedures were performed in accordance with the Declaration of Helsinki (2000).
Table A1.1 Characteristics of study participants
Variable Mean ± SD or %
Age (years) 64 ± 8
Gender (% male) 52
Body mass index (kg/m2) 29.3 ± 4.8
Waist-to-hip ratio 0.94 ± 0.51
Left ventricular mass index (g/m2.7
) 32.7 ± 8.9
Heart rate (bpm) 68 ± 10
Diabetes (%) 7.6
Glucose (mmol/L) 5.9 ± 6.1
Total cholesterol (mmol/L) 5.13 ± 1.02
Low density lipoprotein (mmol/L) 3.04 ± 0.94
High density lipoprotein (mmol/L) 1.39 ± 0.47
Triglycerides (mmol/L) 1.65 ± 1.11
Medications
Angiotensin converting enzyme inhibitors (%) 30
Angiotensin receptor inhibitors (%) 63
Beta blockers (%) 9
Statins (%) 30
Diuretics (%) 36

117
A1.3.2 Protocol
Study participants attended the research clinic at only one occasion in the morning where all
measurements were acquired. Participants were asked to avoid exercise on the day of
examination, as well as caffeine-containing beverages, heavy meals and smoking at least
three hours prior to the visit. All BP measures were recorded by a trained (non-clinician)
research technician in a quiet, temperature-controlled room. Brachial BP was recorded as the
average of duplicate measures taken one minute apart after five minutes of seated rest, as per
recommendations. Duplicate measures of central BP were then recorded and calibrated to the
averaged brachial BP obtained previously (approximately five minutes of seated rest).
Tonometric measures took approximately two to four minutes. Following this, two measures
of brachial BP recorded one minute apart were acquired again, and the average values were
used to recalibrate the central BP (approximately 10 minutes of seated rest). After acquiring
the BP measures, a blood sample was collected for standard clinical biochemistry and two-
dimensional echocardiography measures of LV mass were recorded. At the end of the clinic
visit, each participant was fitted with a 24 hour ambulatory BP device. They were also
provided with a BP device for seven-day home BP monitoring together with instructions on
how to measure this, commencing on the day after the clinical visit.
A1.3.3 Office brachial BP
Upper arm BP was recorded using a validated semi-automated oscillometric device (Omron
HEM-907; OMRON Europe B.V. (OMCE), Hoofddorp, The Netherlands).183
Blood pressure
was measured in accordance with guidelines, using an appropriately sized cuff with the arm
supported at heart level.4, 198
Participants were seated quietly in a chair with feet flat on the
floor and back supported.4, 198
Uncontrolled BP was defined as ≥ 140/90 mmHg as per
accepted criteria.198
Brachial pulse pressure (PP) was calculated as the difference between
brachial systolic and diastolic BP.
A1.3.4 Office central BP
Seated central BP was measured by radial applanation tonometry using validated and highly
reproducible generalized transfer function (SphygmoCor 8.1; AtCor Medical, Sydney,
Australia).47, 48
Central BP was calibrated by two methods: calibration 1) with the brachial
systolic and diastolic BP; and calibration 2) with mean (1/3 PP + diastolic BP) and diastolic
BP; and both were used for the analysis. Central PP was calculated as the difference between

118
central systolic and diastolic BP. The Strong Heart Study 235
showed that central
PP ≥ 50 mmHg independently predicted adverse CV outcomes. Accordingly, for the purpose
of this study, we defined high central PP as ≥ 50 mmHg.
A1.3.5 Home BP
Seven-day home BP was self-measured using a validated oscillometric device (UA-767,
A&D Mercury, A&D Medical, Thebarton, South Australia).190
Participants were instructed to
take BP measures in a warm and quite room after at least five minutes of seated rest in a chair
enabling back support, with feet flat on the ground and the arm with the cuff supported at
heart level. Home BP was measured in duplicate in the morning (between 6am and 10am),
midday and evening (between 6pm and 10pm). The first of two BP measurements was
discarded and the second BP was recorded and used for analysis. Home BP was compared
with office BP values to identify individuals with white coat hypertension (increased office
and normal home BP) and masked hypertension (normal office and increased home BP).
Raised home BP was defined as ≥ 135/85 mmHg.191
A1.3.6 24 hour ambulatory BP
A validated device (TM-2430, A&D Mercury, A&D Medical, Thebarton, South Australia)189
was used for ambulatory BP monitoring. Participants were advised to maintain routine daily
life activities and the device was set to record BP every 30 minutes during the day (6am to
10pm) and every hour during the night (10pm to 6am).23
Daytime BP was also compared
with office BP values to identify individuals with white coat and masked hypertension.
Raised daytime BP was defined as ≥ 135/85 mmHg.23
A1.3.7 Echocardiography
LV mass was measured by two-dimensional echocardiography (Vivid 7; GE Medical
Systems, Milwaukee, WI), calculated by method of Devereux236
and indexed to height 2.7
(LV
mass index).
A1.3.8 Blood biochemistry
A fasted or non-fasted blood sample was drawn to determine total, low-density and high-
density lipoprotein cholesterol, glucose and triglycerides. Blood was analysed as per standard
hospital pathology laboratory procedures.
A1.3.9 Statistical analysis

119
Statistical analyses were performed using SPSS for windows software version 17.0 (SPSS
Inc., Chicago, Illinois, USA). Comparison of BP variables measured at five and 10 minutes
were determined by independent t-tests. Between-group categorical variables were assessed
by the chi-squared test. Correlations between continuous variables were assessed by
Pearson’s correlation. Difference in the strengths of associations between central and brachial
PP with LV mass index were compared by calculation of Z statistic scores. Multiple
regression was used to identify predictors of the change in brachial systolic BP from five to
10 minutes seated rest. A value of p < 0.05 was taken as statistically significant.
A1.4 Results
A1.4.1 BP changes over time
There were no significant differences in central BP values when calibrated using brachial
systolic and diastolic BP compared with calibration using mean and diastolic BP. As shown
in Table A1.2, both brachial and central BPs measured at 10 minutes were significantly lower
than the BP values recorded at five minutes. Brachial PP was also significantly lower after 10
minutes compared with five minutes of seated rest. Central PP also declined over time, but
this was of borderline significance.
Table A1.2 Blood pressure values measured at five and 10 minutes of seated rest
BP variable (mmHg) 5 minutes 10 minutes Change p value
Brachial SBP 131.3 ± 14.0 127.1 ± 13.5 -4.2 ± 6.3 <0.001
Brachial DBP 77.1 ± 9.7 75.4 ± 9.6 -1.8 ± 4.2 0.041
Brachial PP 54.2 ± 11.3 51.7 ± 11.2 -2.5 ± 5.8 0.015
Central SBP (calibration 1) 119.1±13.7 115.5 ± 13.1 -3.7 ± 5.4 0.002
Central DBP (calibration 1) 78.1 ± 9.8 76.3 ± 9.7 -1.8 ± 4.1 0.035
Central PP (calibration 1) 41.0 ± 10.7 39.2 ± 10.4 -1.8 ± 4.4 0.054
Central SBP (calibration 2) 118.8 ± 13.1 115.2 ± 12.6 -3.6 ± 5.5 0.003
Central PP (calibration 2) 40.7 ± 10.7 38.9 ± 10.7 -1.7 ± 4.5 0.080
SBP, systolic blood pressure; DBP, diastolic BP; Calibration 1 – calibration by systolic
and diastolic BP; calibration 2 – calibration by mean and diastolic BP

120
A1.4.2 Clinical relevance of the change in BP
Figure A1.1 shows the change in the distribution of participants with uncontrolled BP after
five and 10 minutes of seated rest. There was a significant decrease over time in the number
of participants regarded as having uncontrolled BP (from n = 72 to n = 49; p < 0.001). Also,
when seven-day home BP was used to identify participants with white coat or masked
hypertension, in the time period from five to 10 minutes of seated rest, there were 6%
(n = 15) fewer participants classified as having white coat hypertension and 4% (n = 10)
more participants classified as having masked hypertension (Figure A1.2). Furthermore,
when we used daytime BP to identify these individuals, there were 4% (n = 10) less
participants classified as having white coat hypertension and 8% (n = 19) more participants
classified as having masked hypertension.
The change in the percentage of participants with high central PP after five and 10 minutes of
seated rest is presented in Figure A1.3. There was a significant decrease of 6.4% (n=16) in
the number of participants with high central PP (p < 0.001) at 10 minutes compared with five
minutes BP classification. When central PP calibrated with mean and diastolic BP was used,
a significant decrease of 4.9% (n = 13) in the number of participants with high central PP
(p < 0.001) was noticed.
Figure A1.1 Percentage of study participants with uncontrolled blood pressure when
measured after five minutes and 10 minutes of seated rest; *p < 0.001 and n = 250. From five
to 10 minutes, there was a significant decrease in the percentage of individuals regarded as
having uncontrolled blood pressure.

121
Figure A1.2 Percentage of study participants with white coat hypertension and masked
hypertension when home BP was compared with five and 10 minutes brachial BP. From five
to 10 minutes, there was a significant decrease (39 vs. 24; p < 0.001) in the number of
participants who were classified as having white coat hypertension and a significant increase
(35 vs. 45; p < 0.001) in the number of participants who were identified as having masked
hypertension.
Figure A1.3 Percentage of study participants with high central pulse pressure when measured
after five and 10 minutes of seated rest; *p < 0.001 and n = 250. Note a significant decrease
in the percentage of participants with high central PP at 10 minutes compared with five
minutes.
122
Table A1.3 shows the correspondence between out-of-office BPs and the BPs recorded at
different times. Brachial systolic BP values measured after five and 10 minutes rest were
significantly lower than daytime ambulatory systolic BP. However, the brachial systolic BP
at 10 minutes was similar to seven-day home systolic BP. On the other hand, brachial systolic
BP measured at five minutes was significantly higher than seven-day home systolic BP. The
average number of blood pressure readings taken over the 24 hour period for the study
population was 41.7. From these, 1.5 readings (on average) were excluded due to
measurement error, leaving 96.4% valid readings.
Table A1.4 shows the correlations between LV mass index and PP values. Brachial PP
measured at 10 minutes seated rest was significantly correlated with LV mass index, whereas
brachial PP measured at five minutes did not correlate with LV mass index. Similarly, ten
minutes central PP (calibrated by both methods) was significantly correlated with LV mass
index, whereas there was no significant correlation between five minutes central PP and LV
mass index. The correlations between central systolic BP and PP with LV mass index (at both
times) were slightly improved when calibration 2 was used and compared with calibration 1
method, but the difference in slopes were not of statistical significance (p > 0.05 for all).
Similarly, the slope of relationships between central PP and brachial PP (at 10 minutes) with
the LV mass index were not significantly different (calibration 1 central PP vs. brachial PP,
Z = 0.520, p = 0.607 and calibration 2 central PP vs. brachial PP, Z = 0.340, p = 0.734).
Neither brachial nor central systolic BPs were correlated with LV mass index at either time
points, whereas brachial and central diastolic BPs were significantly correlated only when
measured at 10 minutes (r = -0.173, p = 0.006 and r = -0.171, p = 0.006), similar to PP. On
the other hand, LV mass index was significantly correlated with seven-day home systolic BP
(r = 0.140, p = 0.027), seven-day home PP (r = 0.145, p = 0.022), mean 24 hour systolic BP
(r = 0.175, p = 0.005) and mean 24 hour PP (r = 0.259, p < 0.001).
The change in brachial systolic BP from five to 10 minutes was significantly correlated with
the use of angiotensin converting enzyme inhibitors (ACEi; r = 0.212, p < 0.001), brachial
systolic BP at five minutes (r = 0.302, p < 0.001), brachial PP at five minutes (r = 0.282,
p < 0.001), central systolic BP at five minutes (r = 0.279, p < 0.001) and central PP at five
minutes (r = 0.260, p < 0.001). Due to significant collinearity between BP variables, only the
use of ACEi and brachial systolic BP at five minutes were entered into a multiple regression
model as independent predictors of the change in brachial systolic BP over time. The use of

123
ACEi (β = 0.161, p = 0.008) and brachial systolic BP at five minutes (β = 0.273, p < 0.001)
were significant predictors of the change in brachial BP, but this was not a strong model
(Adjusted R2
= 0.109, p < 0.001).
Table A1.3 Daytime ambulatory and home systolic blood pressure and their differences from
office blood pressure measured after five and 10 minutes of seated rest
BP variable BP
(mmHg)
Mean difference
from 5 mins BP
p value Mean difference
from 10 mins BP
p value
Daytime SBP 135.3 ± 11.7 -3.9 ± 14.1 < 0.001 -8.2 ± 13.5 < 0.001
Home SBP 127.7 ± 12.3 3.7 ± 14.6 < 0.001 -0.6 ± 13.7 0.511
Data are mean ± standard deviation. BP, blood pressure; SBP, systolic blood pressure
Table A1.4 The correlation coefficients of left ventricular mass index with brachial and
central BP values at five and 10 minutes of seated rest
5 minutes 10 minutes
BP variable r value p value r value p value
Brachial SBP 0.012 0.851 0.020 0.752
Brachial DBP -0.118 0.061 -0.172 0.006
Brachial PP 0.115 0.068 0.171 0.006
Central SBP (calibration 1) 0.017 0.789 0.016 0.803
Central PP (calibration 1) 0.084 0.185 0.139 0.027
Central SBP (calibration 2) 0.011 0.862 0.012 0.876
Central PP (calibration 2) 0.120 0.057 0.165 0.009
SBP, systolic blood pressure; DBP, diastolic BP; PP, pulse pressure; calibration 1
– calibration by systolic and diastolic BP; calibration 2 – calibration by mean and
diastolic BP

124
Discussion
Office brachial BP is recommended to be measured after five minutes of seated rest.198
The
principal findings of this study were, firstly, that significant falls in office brachial and central
BP were observed in the time period from five to 10 minutes of seated rest. Secondly, this
drop in BP over time would have resulted in significant reclassification of BP control, and
this was evident for both brachial and central BP values. Thirdly, we observed similar values
for out-of-office systolic BP and the brachial systolic BP recorded after 10 minutes, but not
after the recommended five minutes of seated rest. Finally, evidence of end-organ damage
was correlated with the BP (brachial and central) values recorded after 10 minutes, but not
five minutes of seated rest. Thus, waiting a few minutes longer than the recommended five
minutes before measuring BP appears to provide a better representation of true BP. These
findings have relevance to appropriate diagnosis of hypertension as well as the design of
clinical trials in which brachial and central BP are measured.
Office brachial BP changes over time. Numerous studies have reported a time-dependent
decrease in seated brachial BP.185, 186, 229, 237-240
The exact mechanisms of this BP drop are yet
to be elucidated, but may be explained by a gradual decrease in systemic vascular resistance
caused by hemodynamic modifications to the seated position.185
Relaxation of the patient and
sympathetic withdrawal over time may also be a potential cause of BP reduction.185
The
magnitude of the brachial BP change over time has been consistently described in the
literature. A large population study in 5999 participants reported a significant decrease
(10.3 mmHg in men and 10.4 mmHg in women) in brachial systolic BP (but no change in
diastolic BP) over 25 minutes of seated rest.237
This change resulted in a decrease in the
prevalence of isolated systolic hypertension. Sala et al185
reported a similar decrease in
systolic BP (10.7 ± 1.0 mmHg) and also a decrease in diastolic BP (3.4 ± 0.6 mmHg) in the
period from two to 16 minutes of seated rest. These investigators also estimated that the bulk
of the fall in systolic BP (75.3%) and diastolic BP (71.7%) occurred in the initial 10 minutes
of seated rest. This finding has been repeated in a recent study by van der Wel et al.,186
who
also showed that the plateau level of the systolic BP decline occurred after about 10 minutes
of seated rest. Our findings are in agreement with these previous studies but have also
focused on the potential clinical impact of the change in BP from five to 10 minutes of seated
rest. Taken together, these studies suggest that five minutes is not a long enough period to
wait before office BP measurements are acquired.

125
Clinical implications of BP changes over time. The change in brachial BP over time has
potential clinical relevance as it may affect the evaluation and diagnosis of hypertension. Our
study showed that if only the BP after five minutes rest was considered, more participants
would be classified as having uncontrolled BP compared with the BP at 10 minutes. Indeed,
9.2% (n = 23) were reclassified from uncontrolled office BP to controlled office BP when the
BP at 10 minutes was taken into account. In the clinical environment, this differential
diagnosis could conceivably result in different (and possibly inappropriate) management of
some individuals. A possible reason contributing to this change in classification could be
related to a ‘white coat effect’20
given that this was 6% more likely if only the BP at five
minutes was considered. Our finding on the reclassification regarding prevalence of masked
hypertension is also of potential clinical relevance.241
An argument may be raised that it
would be better to overestimate BP in these patients, as this may increase the chances for
more appropriate diagnosis and treatment. Even though only a small number of participants
were reclassified to having masked hypertension according to the 10 minute BP level (4 to
8% depending on whether home or 24 hour ambulatory BP was used to determine out-of-
office BP), this finding provides additional support for routinely undertaking out-of-office BP
to diagnose hypertension,231
which may be particularly relevant in patients with type 2
diabetes.22
Out-of-office BP recordings (home and daytime ambulatory BP) have been shown to be
stronger predictors of CV risk than office brachial BP.230, 231
The lower prognostic value of
office BP compared with out-of-office BP readings could potentially be attributed to
inadequate time allowed before taking office BP recordings. Importantly, Myers et al229
have
showed that office brachial BP, recorded by an automated device and averaged over 10
minutes with the patient resting alone in a clinic room, was more similar with ambulatory
daytime BP compared with standard five minutes BP measurements taken by either physician
or technician.229
Although the 10 minutes automated office BP was more similar to
ambulatory daytime BP, the automated BP was significantly lower even after correction for
multiple comparisons.229
While the additional amount of time spent waiting may have
contributed to the lower automated office BP readings at 10 minutes, the absence of the
observer in itself may independently contribute to lower automated office BP readings. Our
study is in agreement with the study of Myers et al,229
as we have also found that our 10
minutes office BP was lower than daytime ambulatory BP. Although the difference between

126
these two BP measurements is greater in our study, this could be explained by different
settings in which BP measurements were taken (patient’s physician referred ambulatory BP
unit versus research setting) and different study population (hypertensive participants with
nearly half untreated versus all treated hypertensive participants) and this may have
contributed to our lower office BP values. Furthermore, we have also showed that brachial
BP measured at 10 minutes (but not five minutes) were more similar to the average of seven-
day resting home BP readings than BP measurements taken during daytime ambulatory
condition. Thus, waiting for extra time, taking more readings and bringing the office BP
closer to out-of-office BP values may potentially improve the utility of office BP
measurements.229
Central BP indices have been shown to independently correlate with severe CV events and
mortality.12, 233
While yet to be incorporated into general medicine, the consideration of
central BP may improve identification and management of patients with hypertension or
increased CV risk.12, 38, 39, 242
Indeed, two individuals with similar brachial systolic BP may
have significantly different central systolic BP and, accordingly, may be classified into
different risk groups related to BP.39
Furthermore, different BP-lowering drugs can
differentially affect central BP compared with brachial BP and, looking to the future, this
should be taken into account when assessing and deciding appropriate treatment options.234,
243, 244 In our study, we have showed for the first time that central BP decreased over time,
similarly to brachial BP. Our data indicates the potential for overestimating risk related to BP
when based on five minutes central PP readings, since 6.4% less individuals would have been
identified with high central PP on the basis of the 10 minute readings.235
Limitations. Our study represents a cross-sectional analysis of data from patients with treated
hypertension, and the findings may not be generalizable to other populations. Different
oscillometric devices were used to measure office and home BP. Although both devices have
been validated,183, 190
the use of separate machines might have affected study results. Central
BP was measured by radial applanation tonometry using a generalized transfer function.
Although this method has been validated and shown to be highly reproducible,47, 48
calibration of the waveform using brachial BP may have resulted in error of central BP
estimation.245
Furthermore, radial pressure waveforms were acquired only at one time point
(after the BP measurements at five minutes) and the BP recorded at approximately 10
minutes was used to recalibrate the radial pressure waveforms. Since another tonometry

127
reading was not acquired after 10 minutes, we may expect an under-estimation of the change
in central BP from five to 10 minutes of seated rest, but this need to be tested in another
study. In contrast to some previous studies,246
the home BP values in our study were lower
than ambulatory BP measurements. This might be explained by the protocol used for home
BP measurements, whereby the first BP reading was discarded from each duplicate reading.
This is not entirely in keeping with European guidelines;191
however, the reason for this
approach was based on the evidence that the first reading (morning and evening) has been
shown to be persistently higher than any subsequent BP measurement, and the average of
later measurements is a stronger correlate of ambulatory BP.238
In conclusion, our study showed that both brachial and central BP decreased significantly
when measured a few minutes after the recommended five minutes of seated rest in
individuals treated for hypertension. This change in BP over time may have significant
implications when assessing the BP-related risk and managing patients with hypertension.
Given the increasing body of evidence indicating the superiority of out-of-office BP values in
predicting CV risk and total mortality,230, 231
any advances that enable measurement of an
office BP value that is closer to out-of-office BPs would be a valuable advancement in the
clinical assessment of BP control. Although studies will be required to confirm, our finding
that 10 minutes office BP was similar to seven-day home BP measurements may suggest that
office BP measured after 10 minutes may provide better prognostic information about CV
risk than the conventional five minutes wait period before measuring BP. In any case, this
current study tends to support the work by Myers et al229
that multiple, automated office BP
measurements with the patient sitting alone in a quiet examining room could be the most
appropriate method to measure office BP.

128
Appendix 2
Metabolomics Data Normalisation with EigenMS
At the time of thesis submission, this section is under resubmission in PLoS ONE
Yuliya V Karpievitch1, Sonja B Nikolic
2, Richard Wilson
3, James E Sharman
3 and Lindsay
M Edwards4
Appendix 2 represents a separate study conducted in the same study population as in
Chapter 6 to investigate a novel method for the normalisation of metabolomics data, which is
a crucial step in metabolomics analysis. As this method proved useful, this normalisation
method was used for metabolomics data normalisation in Chapter 6, with the details
explained in this chapter. The primary analysis was conducted by Dr Karpievitch, but a
significant input in regard to haemodynamic measures, study conception/design and data
collection was provided by the author of this thesis.

129
A2.1 Abstract
Background. Liquid chromatography mass spectrometry (LC-MS) has become one of the
analytical platforms of choice for metabolomics studies. However, LC-MS metabolomics
data can suffer from the effects of various systematic biases. These include batch effects, day-
to-day variations in instrument performance, signal intensity loss due to time-dependent
effects of the LC column performance, accumulation of the contaminants in the MS ion
source and MS sensitivity among others. We therefore propose the use of a singular value
decomposition-based normalisation method (EigenMS) for metabolomics data.
Methods. We analyzed a clinical human dataset where LC-MS serum metabolomics data and
physiological measurements were collected from forty healthy subjects and forty with overt
type 2 diabetes and applied EigenMS to detect and correct for any systematic bias. EigenMS
works in several stages. First, it preserves the treatment group differences in the
metabolomics data by estimating treatment effects with an ANOVA model (multiple fixed
effects can be estimated and preserved). Singular value decomposition of the residuals matrix
then determines the bias trends in the data. The number of bias trends is estimated via a
permutation test and the effects of the bias trends are eliminated.
Results. EigenMS removed bias of unknown complexity from the LC-MS metabolomics
data, allowing for increased sensitivity in differential analysis. Moreover, normalised samples
better correlated with both other normalised samples and corresponding physiological data.
Conclusion. We thus advocate the use of singular value decomposition-based normalisation
for metabolomics data.

130
A2.2 Introduction
Along with nuclear magnetic resonance, liquid chromatography coupled to mass
spectrometry (LC-MS) has become one of the most common analytical platforms for
studying cell, tissue or body fluid metabolomes.247-253
Advantages of the method include high
sensitivity and the ability to discriminate thousands of features in a single experiment
(particularly when using a high mass resolution instrument such as the ThermoFisher
Orbitrap). Yet, as with any high-throughput technology, systematic biases are often observed
in LC-MS metabolomics data.254
As the number of samples in the dataset increases so does
the possibility of a time-dependent variation in the resulting metabolite data. Time-dependent
trends in LC-MS metabolomics datasets typically result from analyte retention time drift due
to changes in LC column performance or variations in signal intensity caused by fluctuations
in MS sensitivity. While these issues can be addressed in part by careful experimental design
and the use of quality control samples, there remains a need for robust post-acquisition data
normalisation. Normalisation methods need to be flexible enough to capture biases of
arbitrary complexity, while avoiding overfitting that would invalidate downstream statistical
inference. Careful normalisation of metabolite peak intensities enables greater accuracy in
quantitative comparisons between disease groups as well as better correlation of metabolite
signals to any physiological or phenotypic data collected in tandem. We report here the
application of a singular value decomposition-based method (SVD), called EigenMS, to
remove systematic biases from metabolomics data in the presence of missing observations.255
This normalisation method, previously shown to be effective in normalising LC-MS
proteomics data,255
improved downstream differential analysis and increased correlation of
the metabolite peak intensities with corresponding physiological measurements of what we
call clinical biochemistry.
A2.3 Methods
To demonstrate the utility of our approach, we used a recently-acquired metabolomic dataset
examining the serum of patients with type 2 diabetes (n = 40) and control subjects without
diabetes (n = 39). Biological sample preparation and data acquisition followed the same
protocol as reported in Nikolic et al.10
LC-MS data were acquired using an Orbitrap XL mass
spectrometer (ThermoFisher Scientific) with XCalibur v2 software. Chromatographic
separation was carried out using C18 reverse-phase HPLC.
131
We generated a pooled quality control (QC) sample in order to monitor LC and MS
performance across sample runs by combining small aliquots (10 uL) of every sample in the
study, as recommended by Sangster et al.256
This pooled QC sample was then used
throughout the experiment as a process control as shown in. Because all QC injections
originated from the same mixture and thus should be chemically identical, QC samples allow
one to detect variations in the observed intensities that may affect downstream statistical
analyses.
We monitored system performance using blocks of four experimental samples flanked by the
QC samples between MS source and inlet cleaning. Thus our basic experimental running
order included a cleanup of the ion spray cone and exterior surface of the ion transfer
capillary with 50:50 methanol and water mixture between each block. At the end of each day
of operation we used a more extensive cleaning protocol using 50:50 methanol and water to
flush the sample transfer tube and atmospheric pressure ionization probe, according to the
guidelines for daily operation of LTQ XL specified by the manufacturer. Mass spectral peak
deconvolution and retention time correction were carried out in R using XCMS. The
parameters for deconvolution were: method='centWave', ppm=3, peakwidth=5-30,
snthresh=6, mzdiff=0.01; and for RT correction: method="obiwarp" and profStep=0.1,
yielding ~7000 peaks.
EigenMS uses a combination of ANOVA and singular value decomposition to capture and
remove biases from LC-MS metabolomic peak intensity measurements while preserving the
variation of interest. ANOVA is used first to capture and preserve the variation attributable to
the treatment effect(s) under study. SVD is then applied to a matrix of residuals to find any
systematic trends attributable to bias. The number of bias trends is determined by a
permutation test and the effects of the bias trends are then removed from the data. EigenMS
is based on the surrogate variable analysis of Leek and Storey,257
with modifications
including analysis of data with missing values that are typical in LC-MS experiments and an
approach to prevent overfitting such that EigenMS could be integrated into any existing
omics analysis pipeline. EigenMS is available as a stand-alone set of two functions
implemented in R.
132
A2.4 Results and discussion
A characteristic of biofluid metabolite analysis via LC-MS is progressive signal intensity loss
due to the accumulation of contaminants within the MS ion source, sample transfer lines and
the heated ion transfer capillary.258
We designed our experiment based on the guidelines
outlined in Lai et al258
as well as based on in-house experimentation to establish the number
of samples that could be run without large signal intensity loss on our instrumentation. We
conditioned the LC column by running several QC samples as suggested by Want et al and
others prior to running any experimental samples to avoid high signal variation during the
first few runs.254, 256
Within each block different treatment groups were matched and run order randomized.
However, even using frequent cleaning, some signal loss was observed as is evident from the
declining abundance profile within each day (Figure A2.1). These data were acquired on the
instrument operating in positive ion mode. We did not observe similar intensity loss
throughout the data when the instrument was operating in the negative ion mode. However,
we still observed variation that we could not easily explain. While careful experimental
design (within-block treatment group matching) alleviated the influence of some of the biases
and signal intensity loss that we and others have observed, we suggest that normalisation is
needed to correct for any remaining intensity loss as well as any other known and unknown
systematic biases. Further, if one wishes to identify relationships between LC-MS
metabolomics data and other variables, normalisation becomes essential.
Sample intensity loss makes comparisons between experimental groups more difficult, it also
leads to an increased number of missing values in subsequent samples. Thus careful
experimental design and sample run order randomization are required to minimize the
introduction of systematic biases and any possible confounding of the results. Our experience
leads us to strongly endorse others’ recommendation of QC samples to monitor the
performance of an LC-MS instrument.
We normalised the data with EigenMS. EigenMS identified 12 systematic bias trends and
eliminated their effects from the data. Figure A2.2 shows boxplots of the intensities for the
disease and control groups before (top panel) and after (bottom panel) normalisation for the
same date as in Figure A2.1. Samples in Figure A2.2 are grouped by disease group (red vs.
green) and within each group they appear in the run order on the instrument, such that the

133
first sample in red was run right next to the first sample in green and so on. Even with
regular cleaning of the inlet we encountered some signal loss as evident from the downward
trend in the means (middle bars) of the boxplots. Figure A2.2 bottom panel shows that
normalisation successfully adjusted for the signal loss and any other systematic biases and
placed the means of each sample almost on a straight line.
Figure A2.1. Boxplots of sample intensities.
Boxplots of sample intensities in run order on the instrument for positive ion mode. Each box
represents a sample. Each of five days is presented in different color.

134
Figure A2.2 Boxplots of the raw and normalised intensities
Boxplots of the intensities before (top panel) and after (bottom panel) normalisation. Each
box represents a sample. Samples are grouped by disease group (red vs. green) and are in
chronological run order on the instrument within each group.

135
Figure A2.3 shows SVD trends in raw (left 3 panels) and normalised (right 3 panels) diabetes
data. Samples are ordered by group and appear in chronological run order within each group
in the same way as Figure A2.2. Trends are ordered from top to bottom by the decreasing
amount of variation explained by each trend. Due to the nature of SVD, each trend is
orthogonal to every other. Notably, 20 percent of the variation in the raw data is attributable
to the signal loss that appears as the top trend. Note that SVD trends can be rotated around
the x-axis, thus the top trend in the raw data represents signal intensity loss. The top trend
also shows a jump in each group which occurred between days 3 and 4 of the experiment. All
the processing was done following the same protocol, but we still observed a variation due to
the day effect where samples run on days 4 and 5 were affected differently than samples run
on days 1-3. The rest of the trends in the raw data are not easily interpretable and are
attributed to unknown systematic biases. Figure A2.3 (right panel) shows the normalised
data. The top trend is representative of the differences between the disease and control
groups. Only 3.7% of variation is attributable to the differences between the disease groups,
but nonetheless this trend is a major trend in the normalised data as compared to the signal
intensity loss trend in the raw data. Most importantly we were able to report 2578
discriminatory metabolite peaks in the normalised (p < 0.05) data as compared to only 1840
metabolite signals in the raw data (compared using an unpaired t-test; p < 0.05 with after
Benjamini-Hochberg multiple testing adjustment).259
We saw an improvement in correlations of normalised metabolite intensities to the
physiology variables we measured for each subject. We selected 1100 peaks that we found to
be significantly different between two groups with p-value below 0.001 in normalised data.
We correlated these 1100 peaks to clinical measurements we obtained for each subject, such
as: blood glucose level, glycated haemoglobin (HbA1c), exercise central augmentation
pressure normalised to heart rate of 75, and total cholesterol. The first four of these are
usually elevated in diabetics while cholesterol is typically higher in controls. If EigenMS
works well we expect to see increased correlation between normalised metabolites and
physiological variables, providing an easy test of EigenMS’ performance.
Figure A2.4 shows correlations of raw (x-axis) and normalised (y-axis) metabolite intensities
to glucose (top left), HbA1c (top right), exercise central augmentation pressure (bottom left)
and cholesterol (bottom right). The blue lines show correlations of zero. The red lines
indicate no difference between correlations obtained from normalised and raw data. The

136
scatter plots show that we obtained higher correlations of normalised metabolite peak
intensities to the variables measured in the laboratory. For glucose, for example, correlations
for most of the positively correlated peaks increased as is evident from the dots falling above
the diagonal line. For negatively correlated metabolites most of the correlations fall near the
diagonal line still producing more scatter below the diagonal line indicating increased
correlations. Similar patterns are observed for the rest of the physiological variables.
Figure A2.3 SVD trends in raw and normalised data
SVD trends in raw (left panel) and normalised (right panel) clinical study data. Percentage at
the top of each subplot shows the percent of the variation in the data explained by each trend.

137
Figure A2.4 Correlations to physiology data
Correlations of raw (x-axis) and normalised (y-axis) metabolite intensities to physiology data.
Blue lines represent correlation of zero. Red diagonal line shows the line on which all dots
would fall if there was not difference between correlations of raw and normalised data.
Observed counter-clockwise shift of points indicates better correlation with physiological
data.
138
A2.5 Conclusions
Normalisation is an important step in MS data analysis, but it is complicated by the high
complexity of biases. EigenMS has been shown to remove biases of arbitrary complexity
from proteomics data.255
Here we show that it works equally well for metabolomics data. By
extension, we believe that the method should work equally well for any omics data where the
variation of interest can be preserved via the fixed effects in an ANOVA model and the
matrix of residuals analyzed for the presence of bias trends. The ability of EigenMS to
capture complex biases and eliminate them preserves the validity of any downstream
statistical analysis. The software is implemented in R and is freely available from the authors’
website and SourceForge.

139
Appendix 3
Additional analysis for Chapter 5
Appendix 3 provides information and data analysis that was not included in the final
published version of the study contained in Chapter 5. Data analysis involves the exploration
of the effects of the aldosterone antagonist spironolactone on exercise blood pressure in
people with a hypertensive response to exercise.

140
A3.1 Background
The exact mechanisms of the effects of spironolactone on exercise blood pressure (BP) in
people with a hypertensive response to exercise (HRE) are unclear, but there are two possible
pathways: a) by a direct BP-dependent effect of spironolactone on exercise BP or b) by BP-
independent effects of spironolactone to reduce aortic stiffness (widely proposed contributor
of an HRE),58-60
and consequently decrease the exercise BP. However, the underlying
mechanisms are unknown, and this was the additional aim of the study presented in
Chapter 5 of this thesis.
A3.2 Methods
Exercise BP. Brachial exercise BP was measured every 1-2 minutes during the treadmill
exercise stress testing using electrocardiographic monitoring (CASE 14; GE Medical
Systems). Maximal exercise BP was recorded at the moment of maximal exhaustion.
A3.3 Results
A3.3.1 Exercise BP variables
There were no statistically significant differences in exercise BP variables between placebo
and spironolactone groups at either baseline or after three months of treatment (Table A3.1).
However, the group that received spironolactone had a significant reduction in exercise
systolic BP compared to the group that receive placebo.
Table A3.1 Blood pressure variables in placebo compared to spironolactone group at baseline
and at follow-up (after three months of treatment)
BP variable (mmHg) Placebo
(n = 43)
Spironolactone
(n = 49)
p value
Baseline exercise systolic BP 216 ± 17 222 ± 17 0.113
Baseline exercise diastolic BP 94 ± 12 93 ± 13 0.589
Follow-up exercise diastolic BP 215 ± 17 216 ± 17 0.805
Follow-up exercise diastolic BP 91 ± 13 91 ± 13 0.965
Δ systolic BP -1 ± 11 -6 ± 11 0.029
Δ diastolic BP -3 ± 8 -1 ± 12 0.522
BP, blood pressure; Δ, change

141
A3.3.2 Univariable correlates of the reduction in exercise BP after three months of
treatment
Changes in exercise BP were correlated with the post-spironolactone signal intensity for each
of the metabolomic features of interest. There were no significant correlations between the
change in exercise systolic BP and any metabolic features, including canrenoate and
canrenone (p > 0.05 for all). Also, there were no significant associations between the
reduction in exercise systolic BP and the decrease in aortic stiffness after three months of
treatment with spironolactone. However, the change in exercise systolic BP was significantly
associated with the reduction in 24 hour systolic BP (Figure A3.1).
Figure A3.1 Correlations with the change in exercise systolic BP; LEFT: the change in aortic
stiffness; RIGHT: the change in 24 hour systolic BP, both after three months of
spironolactone treatment (n = 49).
A3.3.3 Multiple regression analysis
A multiple regression model for predictors of the change in exercise systolic BP was
constructed, with the age, sex, body mass index, the use of statins and angiotensin converting
enzyme inhibitors, canrenoate and the change in 24 hour systolic BP entered as independent
variables. There were no significant independent predictors of the change in exercise systolic
BP (Adjusted R2
= 0.139, p = 0.093).
142
A3.4 Conclusion
Three months of spironolactone treatment reduced the exercise systolic BP most likely due to
a BP-dependent effect on the reduction in ambulatory 24 hour BP; however, this reduction in
exercise systolic BP was not independent of other cardiovascular risk factors and the use of
statins and angiotensin converting enzyme inhibitors. This may suggest that other metabolic
mechanisms (involved with the statins or angiotensin converting enzyme inhibitors treatment)
may be contributing to an HRE, and future studies should explore the metabolic effects of
other medications on exercise BP in more details. Importantly, the reduction of exercise
systolic BP was not associated with the decrease in aortic stiffness, giving support to aortic
stiffness not being as relevant to exercise hypertension as is widely believed.

143
References
1. Psaty BM, Furberg CD, Kuller LH, Cushman M, Savage PJ, Levine D, O'Leary DH,
Bryan RN, Anderson M, Lumley T. Association between blood pressure level and the
risk of myocardial infarction, stroke, and total mortality: The cardiovascular health
study. Arch Intern Med. 2001;161:1183-1192
2. Lewington S, Clarke R, Qizilbash N, Peto R, Collins R. Age-specific relevance of
usual blood pressure to vascular mortality: A meta-analysis of individual data for one
million adults in 61 prospective studies. Lancet. 2002;360:1903-1913
3. Lim SS, Vos T, Flaxman AD, Danaei G, Shibuya K, Adair-Rohani H, Amann M, et
al. A comparative risk assessment of burden of disease and injury attributable to 67
risk factors and risk factor clusters in 21 regions, 1990-2010: A systematic analysis
for the global burden of disease study 2010. Lancet. 2012;380:2224-2260
4. Pickering TG, Hall JE, Appel LJ, Falkner BE, Graves J, Hill MN, Jones DW, Kurtz T,
Sheps SG, Roccella EJ. Recommendations for blood pressure measurement in humans
and experimental animals: Part 1: Blood pressure measurement in humans: A
statement for professionals from the subcommittee of professional and public
education of the american heart association council on high blood pressure research.
Circulation. 2005;111:697-716
5. Schultz MG, Otahal P, Cleland VJ, Blizzard L, Marwick TH, Sharman JE. Exercise-
induced hypertension, cardiovascular events, and mortality in patients undergoing
exercise stress testing: A systematic review and meta-analysis. Am J Hypertens.
2013;26:357-366
6. Schultz MG, Hare JL, Marwick TH, Stowasser M, Sharman JE. Masked hypertension
is "unmasked" by low-intensity exercise blood pressure. Blood pressure.
2011;20:284-289
7. Nikolic SB, Sharman JE, Adams MJ, Edwards LM. Metabolomics in hypertension. J
Hypertens. 2014;32:1159-1169
8. Blann AD, Naqvi T, Waite M, McCollum CN. Von willebrand factor and endothelial
damage in essential hypertension. Journal of human hypertension. 1993;7:107-111

144
9. Hare JL, Sharman JE, Leano R, Jenkins C, Wright L, Marwick TH. Impact of
spironolactone on vascular, myocardial, and functional parameters in untreated
patients with a hypertensive response to exercise. American Journal of Hypertension.
2013;[Epub ahead of print]
10. Nikolic SB, Wilson R, Hare JL, Adams MJ, Edwards LM, Sharman JE.
Spironolactone reduces aortic stiffness via blood pressure-dependent effects of
canrenoate. Metabolomics. 2014;10:105-113
11. Scott JA, Coombes JS, Prins JB, Leano RL, Marwick TH, Sharman JE. Patients with
type 2 diabetes have exaggerated brachial and central exercise blood pressure:
Relation to left ventricular relative wall thickness. Am J Hypertens. 2008;21:715-721
12. Vlachopoulos C, Aznaouridis K, O'Rourke MF, Safar ME, Baou K, Stefanadis C.
Prediction of cardiovascular events and all-cause mortality with central
haemodynamics: A systematic review and meta-analysis. Eur Heart J. 2010
13. Nikolic SB, Abhayaratna WP, Leano R, Stowasser M, Sharman JE. Waiting a few
extra minutes before measuring blood pressure has potentially important clinical and
research ramifications. Journal of human hypertension. 2014;28:56-61
14. Karpievitch YV, Taverner T, Adkins JN, Callister SJ, Anderson GA, Smith RD,
Dabney AR. Normalization of peak intensities in bottom-up ms-based proteomics
using singular value decomposition. Bioinformatics (Oxford, England).
2009;25:2573-2580
15. Whitworth JA. 2003 world health organization (who)/international society of
hypertension (ish) statement on management of hypertension. J Hypertens.
2003;21:1983-1992
16. Briganti EM, Shaw JE, Chadban SJ, Zimmet PZ, Welborn TA, McNeil JJ, Atkins RC,
Australian Diabetes O, Lifestyle S. Untreated hypertension among australian adults:
The 1999-2000 australian diabetes, obesity and lifestyle study (ausdiab). The Medical
journal of Australia. 2003;179:135-139
17. Kearney PM, Whelton M, Reynolds K, Muntner P, Whelton PK, He J. Global burden
of hypertension: Analysis of worldwide data. Lancet. 2005;365:217-223

145
18. Carretero OA, Oparil S. Essential hypertension. Part i: Definition and etiology.
Circulation. 2000;101:329-335
19. Pickering TG, Coats A, Mallion JM, Mancia G, Verdecchia P. Blood pressure
monitoring. Task force v: White-coat hypertension. Blood pressure monitoring.
1999;4:333-341
20. Pickering TG, Gerin W, Schwartz JE, Spruill TM, Davidson KW. Franz volhard
lecture: Should doctors still measure blood pressure? The missing patients with
masked hypertension. J Hypertens. 2008;26:2259-2267
21. Bobrie G, Chatellier G, Genes N, Clerson P, Vaur L, Vaisse B, Menard J, Mallion
JM. Cardiovascular prognosis of "masked hypertension" detected by blood pressure
self-measurement in elderly treated hypertensive patients. JAMA. 2004;291:1342-
1349
22. Franklin SS, Thijs L, Li Y, Hansen TW, Boggia J, Liu Y, Asayama K, Bjorklund-
Bodegard K, Ohkubo T, Jeppesen J, Torp-Pedersen C, Dolan E, Kuznetsova T,
Stolarz-Skrzypek K, Tikhonoff V, Malyutina S, Casiglia E, Nikitin Y, Lind L,
Sandoya E, Kawecka-Jaszcz K, Filipovsky J, Imai Y, Wang J, Ibsen H, O'Brien E,
Staessen JA, on behalf of the International Database on Ambulatory blood pressure in
relation to Cardiovascular Outcomes I. Masked hypertension in diabetes mellitus:
Treatment implications for clinical practice. Hypertension. 2013
23. Head GA, McGrath BP, Mihailidou AS, Nelson MR, Schlaich MP, Stowasser M,
Mangoni AA, Cowley D, Brown MA, Ruta LA, Wilson A. Ambulatory blood
pressure monitoring in australia: 2011 consensus position statement. J Hypertens.
2012;30:253-266
24. Allison TG, Cordeiro MA, Miller TD, Daida H, Squires RW, Gau GT. Prognostic
significance of exercise-induced systemic hypertension in healthy subjects. The
American journal of cardiology. 1999;83:371-375
25. Mottram PM, Haluska B, Yuda S, Leano R, Marwick TH. Patients with a
hypertensive response to exercise have impaired systolic function without diastolic
dysfunction or left ventricular hypertrophy. Journal of the American College of
Cardiology. 2004;43:848-853

146
26. Lauer MS, Pashkow FJ, Harvey SA, Marwick TH, Thomas JD. Angiographic and
prognostic implications of an exaggerated exercise systolic blood pressure response
and rest systolic blood pressure in adults undergoing evaluation for suspected
coronary artery disease. Journal of the American College of Cardiology.
1995;26:1630-1636
27. Le VV, Mitiku T, Sungar G, Myers J, Froelicher V. The blood pressure response to
dynamic exercise testing: A systematic review. Progress in cardiovascular diseases.
2008;51:135-160
28. Campbell L, Marwick TH, Pashkow FJ, Snader CE, Lauer MS. Usefulness of an
exaggerated systolic blood pressure response to exercise in predicting myocardial
perfusion defects in known or suspected coronary artery disease. The American
journal of cardiology. 1999;84:1304-1310
29. Sharman JE, Hare JL, Thomas S, Davies JE, Leano R, Jenkins C, Marwick TH.
Association of masked hypertension and left ventricular remodeling with the
hypertensive response to exercise. Am J Hypertens. 2011;24:898-903
30. Mundal R, Kjeldsen SE, Sandvik L, Erikssen G, Thaulow E, Erikssen J. Exercise
blood pressure predicts cardiovascular mortality in middle-aged men. Hypertension.
1994;24:56-62
31. Kohl HW, 3rd, Nichaman MZ, Frankowski RF, Blair SN. Maximal exercise
hemodynamics and risk of mortality in apparently healthy men and women. Medicine
and science in sports and exercise. 1996;28:601-609
32. Filipovsky J, Ducimetiere P, Safar ME. Prognostic significance of exercise blood
pressure and heart rate in middle-aged men. Hypertension. 1992;20:333-339
33. Laukkanen JA, Kurl S, Rauramaa R, Lakka TA, Venalainen JM, Salonen JT. Systolic
blood pressure response to exercise testing is related to the risk of acute myocardial
infarction in middle-aged men. European journal of cardiovascular prevention and
rehabilitation : official journal of the European Society of Cardiology, Working
Groups on Epidemiology & Prevention and Cardiac Rehabilitation and Exercise
Physiology. 2006;13:421-428

147
34. Weiss SA, Blumenthal RS, Sharrett AR, Redberg RF, Mora S. Exercise blood
pressure and future cardiovascular death in asymptomatic individuals. Circulation.
2010;121:2109-2116
35. Kjeldsen SE, Mundal R, Sandvik L, Erikssen G, Thaulow E, Erikssen J. Supine and
exercise systolic blood pressure predict cardiovascular death in middle-aged men. J
Hypertens. 2001;19:1343-1348
36. McEniery CM, Cockcroft JR, Roman MJ, Franklin SS, Wilkinson IB. Central blood
pressure: Current evidence and clinical importance. Eur Heart J. 2014
37. Nichols WW, O'Rourke MF. Mcdonald's blood flow in arteries: Theoretical,
experimental and clinical principles. London: Hodder Arnold; 2005.
38. Schultz MG, Gilroy D, Wright L, Bishop WL, Abhayaratna WP, Stowasser M,
Sharman JE. Out-of-office and central blood pressure for risk stratification: A cross-
sectional study in patients treated for hypertension. European journal of clinical
investigation. 2012;42:393-401
39. Sharman J, Stowasser M, Fassett R, Marwick T, Franklin S. Central blood pressure
measurement may improve risk stratification. Journal of human hypertension.
2008;22:838-844
40. McEniery CM, Yasmin, McDonnell B, Munnery M, Wallace SM, Rowe CV,
Cockcroft JR, Wilkinson IB, Anglo-Cardiff Collaborative Trial I. Central pressure:
Variability and impact of cardiovascular risk factors: The anglo-cardiff collaborative
trial ii. Hypertension. 2008;51:1476-1482
41. McEniery CM, Yasmin, Hall IR, Qasem A, Wilkinson IB, Cockcroft JR. Normal
vascular aging: Differential effects on wave reflection and aortic pulse wave velocity:
The anglo-cardiff collaborative trial (acct). Journal of the American College of
Cardiology. 2005;46:1753-1760
42. Kroeker EJ, Wood EH. Comparison of simultaneously recorded central and peripheral
arterial pressure pulses during rest, exercise and tilted position in man. Circulation
research. 1955;3:623-632

148
43. Rowell LB, Brengelmann GL, Blackmon JR, Bruce RA, Murray JA. Disparities
between aortic and peripheral pulse pressures induced by upright exercise and
vasomotor changes in man. Circulation. 1968;37:954-964
44. Sharman JE, McEniery CM, Campbell RI, Coombes JS, Wilkinson IB, Cockcroft JR.
The effect of exercise on large artery haemodynamics in healthy young men.
European journal of clinical investigation. 2005;35:738-744
45. Sharman JE, McEniery CM, Dhakam ZR, Coombes JS, Wilkinson IB, Cockcroft JR.
Pulse pressure amplification during exercise is significantly reduced with age and
hypercholesterolemia. J Hypertens. 2007;25:1249-1254
46. Chen CH, Nevo E, Fetics B, Pak PH, Yin FC, Maughan WL, Kass DA. Estimation of
central aortic pressure waveform by mathematical transformation of radial tonometry
pressure. Validation of generalized transfer function. Circulation. 1997;95:1827-1836
47. Holland DJ, Sacre JW, McFarlane SJ, Coombes JS, Sharman JE. Pulse wave analysis
is a reproducible technique for measuring central blood pressure during hemodynamic
perturbations induced by exercise. Am J Hypertens. 2008;21:1100-1106
48. Sharman JE, Lim R, Qasem AM, Coombes JS, Burgess MI, Franco J, Garrahy P,
Wilkinson IB, Marwick TH. Validation of a generalized transfer function to
noninvasively derive central blood pressure during exercise. Hypertension.
2006;47:1203-1208
49. Wilkinson IB, Fuchs SA, Jansen IM, Spratt JC, Murray GD, Cockcroft JR, Webb DJ.
Reproducibility of pulse wave velocity and augmentation index measured by pulse
wave analysis. J Hypertens. 1998;16:2079-2084
50. Thanassoulis G, Lyass A, Benjamin EJ, Larson MG, Vita JA, Levy D, Hamburg NM,
Widlansky ME, O'Donnell CJ, Mitchell GF, Vasan RS. Relations of exercise blood
pressure response to cardiovascular risk factors and vascular function in the
framingham heart study. Circulation. 2012;125:2836-2843
51. Tsioufis C, Dimitriadis K, Thomopoulos C, Tsiachris D, Selima M, Stefanadi E,
Tousoulis D, Kallikazaros I, Stefanadis C. Exercise blood pressure response,
albuminuria, and arterial stiffness in hypertension. The American journal of medicine.
2008;121:894-902

149
52. Lauer MS, Levy D, Anderson KM, Plehn JF. Is there a relationship between exercise
systolic blood pressure response and left ventricular mass? The framingham heart
study. Annals of internal medicine. 1992;116:203-210
53. Vlachopoulos C, Aznaouridis K, Stefanadis C. Prediction of cardiovascular events
and all-cause mortality with arterial stiffness: A systematic review and meta-analysis.
Journal of the American College of Cardiology. 2010;55:1318-1327
54. O'Rourke MF, Hashimoto J. Mechanical factors in arterial aging: A clinical
perspective. Journal of the American College of Cardiology. 2007;50:1-13
55. Greenwald SE. Ageing of the conduit arteries. J Pathol. 2007;211:157-172
56. Cecelja M, Chowienczyk P. Dissociation of aortic pulse wave velocity with risk
factors for cardiovascular disease other than hypertension: A systematic review.
Hypertension. 2009;54:1328-1336
57. Magni P, Motta M. Aldosterone receptor antagonists: Biology and novel therapeutic
applications. Current hypertension reports. 2005;7:206-211
58. Lacolley P, Safar ME, Lucet B, Ledudal K, Labat C, Benetos A. Prevention of aortic
and cardiac fibrosis by spironolactone in old normotensive rats. Journal of the
American College of Cardiology. 2001;37:662-667
59. Zannad F, Alla F, Dousset B, Perez A, Pitt B. Limitation of excessive extracellular
matrix turnover may contribute to survival benefit of spironolactone therapy in
patients with congestive heart failure: Insights from the randomized aldactone
evaluation study (rales). Rales investigators. Circulation. 2000;102:2700-2706
60. Edwards NC, Steeds RP, Stewart PM, Ferro CJ, Townend JN. Effect of
spironolactone on left ventricular mass and aortic stiffness in early-stage chronic
kidney disease: A randomized controlled trial. Journal of the American College of
Cardiology. 2009;54:505-512
61. Mahmud A, Feely J. Aldosterone-to-renin ratio, arterial stiffness, and the response to
aldosterone antagonism in essential hypertension. Am J Hypertens. 2005;18:50-55
62. Hare JL, Sharman JE, Leano R, Jenkins C, Wright L, Marwick TH. Impact of
spironolactone on vascular, myocardial, and functional parameters in untreated
patients with a hypertensive response to exercise. Am J Hypertens. 2013

150
63. Stewart KJ, Sung J, Silber HA, Fleg JL, Kelemen MD, Turner KL, Bacher AC,
Dobrosielski DA, DeRegis JR, Shapiro EP, Ouyang P. Exaggerated exercise blood
pressure is related to impaired endothelial vasodilator function. Am J Hypertens.
2004;17:314-320
64. Tzemos N, Lim PO, MacDonald TM. Exercise blood pressure and endothelial
dysfunction in hypertension. International journal of clinical practice. 2009;63:202-
206
65. Wilson MF, Sung BH, Pincomb GA, Lovallo WR. Exaggerated pressure response to
exercise in men at risk for systemic hypertension. The American journal of
cardiology. 1990;66:731-736
66. Bank AJ, Kaiser DR, Rajala S, Cheng A. In vivo human brachial artery elastic
mechanics: Effects of smooth muscle relaxation. Circulation. 1999;100:41-47
67. Wilkinson IB, Qasem A, McEniery CM, Webb DJ, Avolio AP, Cockcroft JR. Nitric
oxide regulates local arterial distensibility in vivo. Circulation. 2002;105:213-217
68. Wilkinson IB, Hall IR, MacCallum H, Mackenzie IS, McEniery CM, van der Arend
BJ, Shu YE, MacKay LS, Webb DJ, Cockcroft JR. Pulse-wave analysis: Clinical
evaluation of a noninvasive, widely applicable method for assessing endothelial
function. Arteriosclerosis, thrombosis, and vascular biology. 2002;22:147-152
69. Joannides R, Richard V, Haefeli WE, Benoist A, Linder L, Luscher TF, Thuillez C.
Role of nitric oxide in the regulation of the mechanical properties of peripheral
conduit arteries in humans. Hypertension. 1997;30:1465-1470
70. Gow BS. The influence of vascular smooth muscle on the viscoelastic properties of
blood vessels. In: Bergel DH, ed. Cardiovascular Fluid Dynamics. London, UK:
Academic Press. 1972:66 –97
71. Wilcox JN, Smith KM, Schwartz SM, Gordon D. Localization of tissue factor in the
normal vessel wall and in the atherosclerotic plaque. Proceedings of the National
Academy of Sciences of the United States of America. 1989;86:2839-2843
72. Kakar P, Lip GY. Hypertension: Endothelial dysfunction, the prothrombotic state and
antithrombotic therapy. Expert review of cardiovascular therapy. 2007;5:441-450

151
73. Vaclavik J, Sedlak R, Plachy M, Navratil K, Plasek J, Jarkovsky J, Vaclavik T, Husar
R, Kocianova E, Taborsky M. Addition of spironolactone in patients with resistant
arterial hypertension (aspirant): A randomized, double-blind, placebo-controlled trial.
Hypertension. 2011;57:1069-1075
74. Gomez R, Nunez L, Caballero R, Vaquero M, Tamargo J, Delpon E. Spironolactone
and its main metabolite canrenoic acid block hkv1.5, kv4.3 and kv7.1 + mink
channels. British journal of pharmacology. 2005;146:146-161
75. Steffel J, Luscher TF, Tanner FC. Tissue factor in cardiovascular diseases: Molecular
mechanisms and clinical implications. Circulation. 2006;113:722-731
76. Poli KA, Tofler GH, Larson MG, Evans JC, Sutherland PA, Lipinska I, Mittleman
MA, Muller JE, D'Agostino RB, Wilson PW, Levy D. Association of blood pressure
with fibrinolytic potential in the framingham offspring population. Circulation.
2000;101:264-269
77. Blann AD, Waite MA. Von willebrand factor and soluble e-selectin in hypertension:
Influence of treatment and value in predicting the progression of atherosclerosis.
Coronary artery disease. 1996;7:143-147
78. Sharman JE, Brown J, Holland DJ, Macdonald G, Kostner K, Marwick TH. Influence
of altered blood rheology on ventricular-vascular response to exercise. Hypertension.
2009;54:1092-1098
79. Blann A. Von willebrand factor and the endothelium in vascular disease. BR J Biomed
Sci. 1993;50:125-134
80. Spieker LE, Noll G, Ruschitzka FT, Maier W, Luscher TF. Working under pressure:
The vascular endothelium in arterial hypertension. Journal of human hypertension.
2000;14:617-630
81. Willeit P, Thompson A, Aspelund T, Rumley A, Eiriksdottir G, Lowe G, Gudnason
V, Di Angelantonio E. Hemostatic factors and risk of coronary heart disease in
general populations: New prospective study and updated meta-analyses. PloS one.
2013;8:e55175
82. Thompson SG, Kienast J, Pyke SD, Haverkate F, van de Loo JC. Hemostatic factors
and the risk of myocardial infarction or sudden death in patients with angina pectoris.

152
European concerted action on thrombosis and disabilities angina pectoris study group.
N Engl J Med. 1995;332:635-641
83. Lee KW, Blann AD, Lip GY. High pulse pressure and nondipping circadian blood
pressure in patients with coronary artery disease: Relationship to thrombogenesis and
endothelial damage/dysfunction. Am J Hypertens. 2005;18:104-115
84. Spencer CG, Martin SC, Felmeden DC, Blann AD, Beevers GD, Lip GY.
Relationship of homocysteine to markers of platelet and endothelial activation in
"high risk" hypertensives: A substudy of the anglo-scandinavian cardiac outcomes
trial. International journal of cardiology. 2004;94:293-300
85. Sechi LA, Zingaro L, Catena C, Casaccio D, De Marchi S. Relationship of fibrinogen
levels and hemostatic abnormalities with organ damage in hypertension.
Hypertension. 2000;36:978-985
86. Stone MC, Thorp JM. Plasma fibrinogen--a major coronary risk factor. The Journal of
the Royal College of General Practitioners. 1985;35:565-569
87. Wilkinson I, Cockcroft JR. Cholesterol, lipids and arterial stiffness. Advances in
cardiology. 2007;44:261-277
88. Chowienczyk PJ, Watts GF, Cockcroft JR, Ritter JM. Impaired endothelium-
dependent vasodilation of forearm resistance vessels in hypercholesterolaemia.
Lancet. 1992;340:1430-1432
89. Lewis TV, Dart AM, Chin-Dusting JP. Endothelium-dependent relaxation by
acetylcholine is impaired in hypertriglyceridemic humans with normal levels of
plasma ldl cholesterol. Journal of the American College of Cardiology. 1999;33:805-
812
90. Park S, Shim J, Kim JB, Ko YG, Choi D, Ha JW, Rim SJ, Jang Y, Chung N. Insulin
resistance is associated with hypertensive response to exercise in non-diabetic
hypertensive patients. Diabetes research and clinical practice. 2006;73:65-69
91. Steinberg HO, Brechtel G, Johnson A, Fineberg N, Baron AD. Insulin-mediated
skeletal muscle vasodilation is nitric oxide dependent. A novel action of insulin to
increase nitric oxide release. The Journal of clinical investigation. 1994;94:1172-1179

153
92. Henry RM, Kostense PJ, Spijkerman AM, Dekker JM, Nijpels G, Heine RJ, Kamp O,
Westerhof N, Bouter LM, Stehouwer CD, Hoorn S. Arterial stiffness increases with
deteriorating glucose tolerance status: The hoorn study. Circulation. 2003;107:2089-
2095
93. Cameron JD, Bulpitt CJ, Pinto ES, Rajkumar C. The aging of elastic and muscular
arteries: A comparison of diabetic and nondiabetic subjects. Diabetes care.
2003;26:2133-2138
94. Sims TJ, Rasmussen LM, Oxlund H, Bailey AJ. The role of glycation cross-links in
diabetic vascular stiffening. Diabetologia. 1996;39:946-951
95. Yan LJ. Pathogenesis of chronic hyperglycemia: From reductive stress to oxidative
stress. Journal of diabetes research. 2014;2014:137919
96. Dunn WB, Bailey NJ, Johnson HE. Measuring the metabolome: Current analytical
technologies. Analyst. 2005;130:606-625
97. Mancia G, De Backer G, Dominiczak A, Cifkova R, Fagard R, Germano G, et al 2007
guidelines for the management of arterial hypertension: The task force for the
management of arterial hypertension of the european society of hypertension (esh)
and of the european society of cardiology (esc). J Hypertens. 2007;25:1105-1187
98. Pannier BM, Cambillau MS, Vellaud V, Atger V, Moatti N, Safar ME. Abnormalities
of lipid metabolism and arterial rigidity in young subjects with borderline
hypertension. Clinical and investigative medicine. Medecine clinique et
experimentale. 1994;17:42-51
99. Griffin JL. The cinderella story of metabolic profiling: Does metabolomics get to go
to the functional genomics ball? Philosophical transactions of the Royal Society of
London. Series B, Biological sciences. 2006;361:147-161
100. Nicholson JK, O'Flynn MP, Sadler PJ, Macleod AF, Juul SM, Sonksen PH. Proton-
nuclear-magnetic-resonance studies of serum, plasma and urine from fasting normal
and diabetic subjects. The Biochemical journal. 1984;217:365-375
101. Sauer U, Heinemann M, Zamboni N. Genetics. Getting closer to the whole picture.
Science (New York, N.Y.). 2007;316:550-551

154
102. Jones GL, Sang E, Goddard C, Mortishire-Smith RJ, Sweatman BC, Haselden JN,
Davies K, Grace AA, Clarke K, Griffin JL. A functional analysis of mouse models of
cardiac disease through metabolic profiling. The Journal of biological chemistry.
2005;280:7530-7539
103. Sreekumar A, Poisson LM, Rajendiran TM, Khan AP, Cao Q, Yu J, Laxman B,
Mehra R, Lonigro RJ, Li Y, Nyati MK, Ahsan A, Kalyana-Sundaram S, Han B, Cao
X, Byun J, Omenn GS, Ghosh D, Pennathur S, Alexander DC, Berger A, Shuster JR,
Wei JT, Varambally S, Beecher C, Chinnaiyan AM. Metabolomic profiles delineate
potential role for sarcosine in prostate cancer progression. Nature. 2009;457:910-914
104. Coen M, Holmes E, Lindon JC, Nicholson JK. Nmr-based metabolic profiling and
metabonomic approaches to problems in molecular toxicology. Chemical research in
toxicology. 2008;21:9-27
105. Akira K, Masu S, Imachi M, Mitome H, Hashimoto M, Hashimoto T. 1h nmr-based
metabonomic analysis of urine from young spontaneously hypertensive rats. J Pharm
Biomed Anal. 2008;46:550-556
106. Fujiwara M, Arifuku K, Ando I, Nemoto T. Pattern recognition analysis for
classification of hypertensive model rats and diurnal variation using 1h-nmr
spectroscopy of urine. Analytical sciences : the international journal of the Japan
Society for Analytical Chemistry. 2005;21:1259-1262
107. Akira K, Imachi M, Hashimoto T. Investigations into biochemical changes of genetic
hypertensive rats using 1h nuclear magnetic resonance-based metabonomics.
Hypertension research : official journal of the Japanese Society of Hypertension.
2005;28:425-430
108. Aa JY, Wang GJ, Hao HP, Huang Q, Lu YH, Yan B, Zha WB, Liu LS, Kang A.
Differential regulations of blood pressure and perturbed metabolism by total
ginsenosides and conventional antihypertensive agents in spontaneously hypertensive
rats. Acta pharmacologica Sinica. 2010;31:930-937
109. Lu Y, A J, Wang G, Hao H, Huang Q, Yan B, Zha W, Gu S, Ren H, Zhang Y, Fan X,
Zhang M, Hao K. Gas chromatography/time-of-flight mass spectrometry based
metabonomic approach to differentiating hypertension- and age-related metabolic

155
variation in spontaneously hypertensive rats. Rapid communications in mass
spectrometry : RCM. 2008;22:2882-2888
110. Brindle JT, Nicholson JK, Schofield PM, Grainger DJ, Holmes E. Application of
chemometrics to 1h nmr spectroscopic data to investigate a relationship between
human serum metabolic profiles and hypertension. Analyst. 2003;128:32-36
111. Liu Y, Chen T, Qiu Y, Cheng Y, Cao Y, Zhao A, Jia W. An ultrasonication-assisted
extraction and derivatization protocol for gc/tofms-based metabolite profiling.
Analytical and bioanalytical chemistry. 2011;400:1405-1417
112. De Meyer T, Sinnaeve D, Van Gasse B, Tsiporkova E, Rietzschel ER, De Buyzere
ML, Gillebert TC, Bekaert S, Martins JC, Van Criekinge W. Nmr-based
characterization of metabolic alterations in hypertension using an adaptive, intelligent
binning algorithm. Anal Chem. 2008;80:3783-3790
113. Holmes E, Loo RL, Stamler J, Bictash M, Yap IK, Chan Q, Ebbels T, De Iorio M,
Brown IJ, Veselkov KA, Daviglus ML, Kesteloot H, Ueshima H, Zhao L, Nicholson
JK, Elliott P. Human metabolic phenotype diversity and its association with diet and
blood pressure. Nature. 2008;453:396-400
114. Zheng Y, Yu B, Alexander D, Mosley TH, Heiss G, Nettleton JA, Boerwinkle E.
Metabolomics and incident hypertension among blacks: The atherosclerosis risk in
communities study. Hypertension. 2013
115. Psychogios N, Hau DD, Peng J, Guo AC, Mandal R, Bouatra S, Sinelnikov I,
Krishnamurthy R, Eisner R, Gautam B, Young N, Xia J, Knox C, Dong E, Huang P,
Hollander Z, Pedersen TL, Smith SR, Bamforth F, Greiner R, McManus B, Newman
JW, Goodfriend T, Wishart DS. The human serum metabolome. PLoS ONE.
2011;6:e16957
116. Wishart DS, Jewison T, Guo AC, Wilson M, Knox C, Liu Y, Djoumbou Y, Mandal
R, Aziat F, Dong E, Bouatra S, Sinelnikov I, Arndt D, Xia J, Liu P, Yallou F,
Bjorndahl T, Perez-Pineiro R, Eisner R, Allen F, Neveu V, Greiner R, Scalbert A.
Hmdb 3.0--the human metabolome database in 2013. Nucleic Acids Res.
2013;41:D801-807

156
117. Wishart DS, Tzur D, Knox C, Eisner R, Guo AC, Young N, et al. Hmdb: The human
metabolome database. Nucleic Acids Res. 2007;35:D521-526
118. Lenz EM, Wilson ID. Analytical strategies in metabonomics. Journal of proteome
research. 2007;6:443-458
119. Atherton HJ, Gulston MK, Bailey NJ, Cheng KK, Zhang W, Clarke K, Griffin JL.
Metabolomics of the interaction between ppar-alpha and age in the ppar-alpha-null
mouse. Molecular systems biology. 2009;5:259
120. Bothwell JH, Griffin JL. An introduction to biological nuclear magnetic resonance
spectroscopy. Biological reviews of the Cambridge Philosophical Society.
2011;86:493-510
121. Dunn WB, Broadhurst DI, Atherton HJ, Goodacre R, Griffin JL. Systems level
studies of mammalian metabolomes: The roles of mass spectrometry and nuclear
magnetic resonance spectroscopy. Chemical Society reviews. 2011;40:387-426
122. Nordstrom A, Want E, Northen T, Lehtio J, Siuzdak G. Multiple ionization mass
spectrometry strategy used to reveal the complexity of metabolomics. Anal Chem.
2008;80:421-429
123. Wishart DS. Advances in metabolite identification. Bioanalysis. 2011;3:1769-1782
124. Dunn WB, Broadhurst D, Begley P, Zelena E, Francis-McIntyre S, Anderson N,
Brown M, Knowles JD, Halsall A, Haselden JN, Nicholls AW, Wilson ID, Kell DB,
Goodacre R, Human Serum Metabolome C. Procedures for large-scale metabolic
profiling of serum and plasma using gas chromatography and liquid chromatography
coupled to mass spectrometry. Nature protocols. 2011;6:1060-1083
125. Paglia G, Hrafnsdottir S, Magnusdottir M, Fleming RM, Thorlacius S, Palsson BO,
Thiele I. Monitoring metabolites consumption and secretion in cultured cells using
ultra-performance liquid chromatography quadrupole-time of flight mass
spectrometry (uplc-q-tof-ms). Anal Bioanal Chem. 2012;402:1183-1198
126. Theodoridis G, Gika HG, Wilson ID. Mass spectrometry-based holistic analytical
approaches for metabolite profiling in systems biology studies. Mass spectrometry
reviews. 2011
157
127. Kell DB, Brown M, Davey HM, Dunn WB, Spasic I, Oliver SG. Metabolic
footprinting and systems biology: The medium is the message. Nature reviews.
Microbiology. 2005;3:557-565
128. Bader M. Tissue renin-angiotensin-aldosterone systems: Targets for pharmacological
therapy. Annual review of pharmacology and toxicology. 2010;50:439-465
129. Wu H, Southam AD, Hines A, Viant MR. High-throughput tissue extraction protocol
for nmr- and ms-based metabolomics. Analytical biochemistry. 2008;372:204-212
130. Musgrove RE, Horne J, Wilson R, King AE, Edwards LM, Dickson TC. The
metabolomics of alpha-synuclein (snca) gene deletion and mutation in mouse brain.
Metabolomics. June 2013
131. Grouzmann E, Cavadas C, Grand D, Moratel M, Aubert JF, Brunner HR, Mazzolai L.
Blood sampling methodology is crucial for precise measurement of plasma
catecholamines concentrations in mice. Pflugers Archiv : European journal of
physiology. 2003;447:254-258
132. Walsh MC, Brennan L, Malthouse JP, Roche HM, Gibney MJ. Effect of acute dietary
standardization on the urinary, plasma, and salivary metabolomic profiles of healthy
humans. The American journal of clinical nutrition. 2006;84:531-539
133. Barton RH, Waterman D, Bonner FW, Holmes E, Clarke R, Procardis C, Nicholson
JK, Lindon JC. The influence of edta and citrate anticoagulant addition to human
plasma on information recovery from nmr-based metabolic profiling studies.
Molecular bioSystems. 2010;6:215-224
134. Drake SK, Bowen RA, Remaley AT, Hortin GL. Potential interferences from blood
collection tubes in mass spectrometric analyses of serum polypeptides. Clinical
chemistry. 2004;50:2398-2401
135. Deprez S, Sweatman BC, Connor SC, Haselden JN, Waterfield CJ. Optimisation of
collection, storage and preparation of rat plasma for 1h nmr spectroscopic analysis in
toxicology studies to determine inherent variation in biochemical profiles. J Pharm
Biomed Anal. 2002;30:1297-1310

158
136. Brinc D, Chan MK, Venner AA, Pasic MD, Colantonio D, Kyriakopolou L, Adeli K.
Long-term stability of biochemical markers in pediatric serum specimens stored at -80
degrees c: A caliper substudy. Clinical biochemistry. 2012;45:816-826
137. Trabi M, Keller MD, Johnsson NN. Nmr-based metabonomics of bovine blood: An
investigation into the effects of long term storage on plasma samples. Metabolomics.
2013;9:1041-1047
138. Teahan O, Gamble S, Holmes E, Waxman J, Nicholson JK, Bevan C, Keun HC.
Impact of analytical bias in metabonomic studies of human blood serum and plasma.
Anal Chem. 2006;78:4307-4318
139. Moka D, Vorreuther R, Schicha H, Spraul M, Humpfer E, Lipinski M, Foxall PJ,
Nicholson JK, Lindon JC. Biochemical classification of kidney carcinoma biopsy
samples using magic-angle-spinning 1h nuclear magnetic resonance spectroscopy. J
Pharm Biomed Anal. 1998;17:125-132
140. Kell DB, Oliver SG. Here is the evidence, now what is the hypothesis? The
complementary roles of inductive and hypothesis-driven science in the post-genomic
era. BioEssays : news and reviews in molecular, cellular and developmental biology.
2004;26:99-105
141. Broadhurst DI, Kell DB. Statistical strategies for avoiding false discoveries in
metabolomics and related experiments. Metabolomics. 2006;2:171-196
142. Ebbels TM, Holmes E, Lindon JC, Nicholson JK. Evaluation of metabolic variation in
normal rat strains from a statistical analysis of 1h nmr spectra of urine. J Pharm
Biomed Anal. 2004;36:823-833
143. Solanky KS, Bailey NJ, Beckwith-Hall BM, Davis A, Bingham S, Holmes E,
Nicholson JK, Cassidy A. Application of biofluid 1h nuclear magnetic resonance-
based metabonomic techniques for the analysis of the biochemical effects of dietary
isoflavones on human plasma profile. Analytical biochemistry. 2003;323:197-204
144. Kirschenlohr HL, Griffin JL, Clarke SC, Rhydwen R, Grace AA, Schofield PM,
Brindle KM, Metcalfe JC. Proton nmr analysis of plasma is a weak predictor of
coronary artery disease. Nat Med. 2006;12:705-710

159
145. Freedman DS, Otvos JD, Jeyarajah EJ, Shalaurova I, Cupples LA, Parise H,
D'Agostino RB, Wilson PW, Schaefer EJ. Sex and age differences in lipoprotein
subclasses measured by nuclear magnetic resonance spectroscopy: The framingham
study. Clinical chemistry. 2004;50:1189-1200
146. Bittner V. Lipoprotein abnormalities related to women's health. The American journal
of cardiology. 2002;90:77i-84i
147. Randomised trial of cholesterol lowering in 4444 patients with coronary heart disease:
The scandinavian simvastatin survival study (4s). Lancet. 1994;344:1383-1389
148. Brindle JT, Antti H, Holmes E, Tranter G, Nicholson JK, Bethell HW, Clarke S,
Schofield PM, McKilligin E, Mosedale DE, Grainger DJ. Rapid and noninvasive
diagnosis of the presence and severity of coronary heart disease using 1h-nmr-based
metabonomics. Nat Med. 2002;8:1439-1444
149. Qi S, Ouyang X, Wang L, Peng W, Wen J, Dai Y. A pilot metabolic profiling study in
serum of patients with chronic kidney disease based on (1) h-nmr-spectroscopy.
Clinical and translational science. 2012;5:379-385
150. Pinto YM, Paul M, Ganten D. Lessons from rat models of hypertension: From
goldblatt to genetic engineering. Cardiovascular research. 1998;39:77-88
151. Vargas SL, Toma I, Kang JJ, Meer EJ, Peti-Peterdi J. Activation of the succinate
receptor gpr91 in macula densa cells causes renin release. Journal of the American
Society of Nephrology : JASN. 2009;20:1002-1011
152. He W, Miao FJ, Lin DC, Schwandner RT, Wang Z, Gao J, Chen JL, Tian H, Ling L.
Citric acid cycle intermediates as ligands for orphan g-protein-coupled receptors.
Nature. 2004;429:188-193
153. Militante JD, Lombardini JB. Treatment of hypertension with oral taurine:
Experimental and clinical studies. Amino acids. 2002;23:381-393
154. Fujita T, Ando K, Noda H, Ito Y, Sato Y. Effects of increased adrenomedullary
activity and taurine in young patients with borderline hypertension. Circulation.
1987;75:525-532
155. Nara Y, Yamori Y, Lovenberg W. Effect of dietary taurine on blood pressure in
spontaneously hypertensive rats. Biochemical pharmacology. 1978;27:2689-2692

160
156. Muratani H, Ferrario CM, Averill DB. Ventrolateral medulla in spontaneously
hypertensive rats: Role of angiotensin ii. The American journal of physiology.
1993;264:R388-395
157. Akira K, Mitome H, Imachi M, Shida Y, Miyaoka H, Hashimoto T. Lc-nmr
identification of a novel taurine-related metabolite observed in (1)h nmr-based
metabonomics of genetically hypertensive rats. J Pharm Biomed Anal. 2010;51:1091-
1096
158. Egan BM SK. Evidence linking fatty fat acids, the risk factor cluster, and vascular
pathophysiology. Implications for the diabetic hypertensive patient. Endocrinology of
the Vasculature, Contemporary Endocrinology. 1996;1:157-172
159. Ordway RW, Singer JJ, Walsh JV, Jr. Direct regulation of ion channels by fatty acids.
Trends in neurosciences. 1991;14:96-100
160. Fagot-Campagna A, Balkau B, Simon D, Warnet JM, Claude JR, Ducimetiere P,
Eschwege E. High free fatty acid concentration: An independent risk factor for
hypertension in the paris prospective study. International journal of epidemiology.
1998;27:808-813
161. Tugrul A, Guldiken S, Ugur-Altun B, Arikan E. An evaluation of glucose tolerance in
essential hypertension. Yonsei medical journal. 2009;50:195-199
162. Turner RC, Holman RR, Matthews DR, Bassett PA, Coster R, Stratton IM, et al.
Hypertension in diabetes study (hds) .1. Prevalence of hypertension in newly
presenting type-2 diabetic-patients and the association with risk-factors for
cardiovascular and diabetic complications. J. Hypertens. 1993;11:309-317
163. Friedrich N. Metabolomics in diabetes research. J Endocrinol. 2012;215:29-42
164. Lu J, Xie G Fau - Jia W, Jia W Fau - Jia W, Jia W. Metabolomics in human type 2
diabetes research. Front Med. 2013;7:4-13
165. Wang TJ, Larson MG, Vasan RS, Cheng S, Rhee EP, McCabe E, Lewis GD, Fox CS,
Jacques PF, Fernandez C, O'Donnell CJ, Carr SA, Mootha VK, Florez JC, Souza A,
Melander O, Clish CB, Gerszten RE. Metabolite profiles and the risk of developing
diabetes. Nat Med. 2011;17:448-453

161
166. Magnusson M, Lewis GD, Ericson U, Orho-Melander M, Hedblad B, Engstrom G,
Ostling G, Clish C, Wang TJ, Gerszten RE, Melander O. A diabetes-predictive amino
acid score and future cardiovascular disease. Eur Heart J. 2013;34:1982-1989
167. Ha CY, Kim JY, Paik JK, Kim OY, Paik YH, Lee EJ, Lee JH. The association of
specific metabolites of lipid metabolism with markers of oxidative stress,
inflammation and arterial stiffness in men with newly diagnosed type 2 diabetes.
Clinical endocrinology. 2012;76:674-682
168. Boos CJ, Lip GY. Is hypertension an inflammatory process? Curr Pharm Des.
2006;12:1623-1635
169. Kenny LC, Broadhurst DI, Dunn W, Brown M, North RA, McCowan L, Roberts C,
Cooper GJ, Kell DB, Baker PN, Screening for Pregnancy Endpoints C. Robust early
pregnancy prediction of later preeclampsia using metabolomic biomarkers.
Hypertension. 2010;56:741-749
170. Odibo AO, Goetzinger KR, Odibo L, Cahill AG, Macones GA, Nelson DM, Dietzen
DJ. First-trimester prediction of preeclampsia using metabolomic biomarkers: A
discovery phase study. Prenatal diagnosis. 2011;31:990-994
171. Bahado-Singh RO, Akolekar R, Mandal R, Dong E, Xia J, Kruger M, Wishart DS,
Nicolaides K. Metabolomics and first-trimester prediction of early-onset
preeclampsia. The journal of maternal-fetal & neonatal medicine : the official journal
of the European Association of Perinatal Medicine, the Federation of Asia and
Oceania Perinatal Societies, the International Society of Perinatal Obstet.
2012;25:1840-1847
172. Bahado-Singh RO, Akolekar R, Mandal R, Dong E, Xia J, Kruger M, Wishart DS,
Nicolaides K. First-trimester metabolomic detection of late-onset preeclampsia.
American journal of obstetrics and gynecology. 2013;208:58 e51-57
173. Report of the national high blood pressure education program working group on high
blood pressure in pregnancy. American journal of obstetrics and gynecology.
2000;183:S1-S22
174. Martin CA, McGrath BP. White-coat hypertension. Clinical and experimental
pharmacology & physiology. 2013

162
175. Vaughan M, Berger JE, Steinberg D. Hormone-sensitive lipase and monoglyceride
lipase activities in adipose tissue. The Journal of biological chemistry. 1964;239:401-
409
176. Liao D, Arnett DK, Tyroler HA, Riley WA, Chambless LE, Szklo M, Heiss G.
Arterial stiffness and the development of hypertension. The aric study. Hypertension.
1999;34:201-206
177. Laurent S, Cockcroft J, Van Bortel L, Boutouyrie P, Giannattasio C, Hayoz D,
Pannier B, Vlachopoulos C, Wilkinson I, Struijker-Boudier H. Expert consensus
document on arterial stiffness: Methodological issues and clinical applications. Eur
Heart J. 2006;27:2588-2605
178. Mamas M, Dunn WB, Neyses L, Goodacre R. The role of metabolites and
metabolomics in clinically applicable biomarkers of disease. Archives of toxicology.
2011;85:5-17
179. Feng Z, Prentice R, Srivastava S. Research issues and strategies for genomic and
proteomic biomarker discovery and validation: A statistical perspective.
Pharmacogenomics. 2004;5:709-719
180. Nicholson JK, Everett JR, Lindon JC. Longitudinal pharmacometabonomics for
predicting patient responses to therapy: Drug metabolism, toxicity and efficacy.
Expert opinion on drug metabolism & toxicology. 2012;8:135-139
181. Corona G, Rizzolio F, Giordano A, Toffoli G. Pharmaco-metabolomics: An emerging
"omics" tool for the personalization of anticancer treatments and identification of new
valuable therapeutic targets. Journal of cellular physiology. 2012;227:2827-2831
182. Clayton TA, Lindon JC, Cloarec O, Antti H, Charuel C, Hanton G, Provost JP, Le Net
JL, Baker D, Walley RJ, Everett JR, Nicholson JK. Pharmaco-metabonomic
phenotyping and personalized drug treatment. Nature. 2006;440:1073-1077
183. El Assaad MA, Topouchian JA, Darne BM, Asmar RG. Validation of the omron hem-
907 device for blood pressure measurement. Blood pressure monitoring. 2002;7:237-
241

163
184. Stergiou GS, Giovas PP, Gkinos CP, Tzamouranis DG. Validation of the a&d um-101
professional hybrid device for office blood pressure measurement according to the
international protocol. Blood pressure monitoring. 2008;13:37-42
185. Sala C, Santin E, Rescaldani M, Magrini F. How long shall the patient rest before
clinic blood pressure measurement? Am J Hypertens. 2006;19:713-717
186. van der Wel MC, Buunk IE, van Weel C, Thien TA, Bakx JC. A novel approach to
office blood pressure measurement: 30-minute office blood pressure vs daytime
ambulatory blood pressure. Ann Fam Med. 2011;9:128-135
187. Cameron JD, Stevenson I, Reed E, McGrath BP, Dart AM, Kingwell BA. Accuracy
of automated auscultatory blood pressure measurement during supine exercise and
treadmill stress electrocardiogram-testing. Blood pressure monitoring. 2004;9:269-
275
188. Keith LJ, Rattigan S, Keske MA, Jose M, Sharman JE. Exercise aortic stiffness:
Reproducibility and relation to end-organ damage in men. Journal of human
hypertension. 2013;27:516-522
189. Palatini P, Frigo G, Bertolo O, Roman E, Da Corta R, Winnicki M. Validation of the
a&d tm-2430 device for ambulatory blood pressure monitoring and evaluation of
performance according to subjects' characteristics. Blood pressure monitoring.
1998;3:255-260
190. Rogoza AN, Pavlova TS, Sergeeva MV. Validation of a&d ua-767 device for the self-
measurement of blood pressure. Blood pressure monitoring. 2000;5:227-231
191. Parati G, Stergiou GS, Asmar R, Bilo G, de Leeuw P, Imai Y, Kario K, Lurbe E,
Manolis A, Mengden T, O'Brien E, Ohkubo T, Padfield P, Palatini P, Pickering T,
Redon J, Revera M, Ruilope LM, Shennan A, Staessen JA, Tisler A, Waeber B,
Zanchetti A, Mancia G, Monitoring ESHWGoBP. European society of hypertension
guidelines for blood pressure monitoring at home: A summary report of the second
international consensus conference on home blood pressure monitoring. J Hypertens.
2008;26:1505-1526
192. Charloux A, Lonsdorfer-Wolf E, Richard R, Lampert E, Oswald-Mammosser M,
Mettauer B, Geny B, Lonsdorfer J. A new impedance cardiograph device for the non-

164
invasive evaluation of cardiac output at rest and during exercise: Comparison with the
"direct" fick method. Eur J Appl Physiol. 2000;82:313-320
193. Schultz MG, Climie RE, Nikolic SB, Ahuja KD, Sharman JE. Reproducibility of
cardiac output derived by impedance cardiography during postural changes and
exercise. . Artery Res. 2012:78-84
194. Edwards LM, Lawler NG, Nikolic SB, Peters JM, Horne J, Wilson R, Davies NW,
Sharman JE. Metabolomics reveals increased isoleukotoxin diol (12,13-dhome) in
human plasma after acute intralipid infusion. J Lipid Res. 2012
195. Benjamini Y, Hochberg Y. Controlling the false discovery rate: A practical and
powerful approach to multiple testing. Journal of the Royal Statistical Society.
1995;57:289-300
196. Brown M, Wedge DC, Goodacre R, Kell DB, Baker PN, Kenny LC, Mamas MA,
Neyses L, Dunn WB. Automated workflows for accurate mass-based putative
metabolite identification in lc/ms-derived metabolomic datasets. Bioinformatics
(Oxford, England). 2011;27:1108-1112
197. Dieterle F, Ross A, Schlotterbeck G, Senn H. Probabilistic quotient normalization as
robust method to account for dilution of complex biological mixtures. Application in
1h nmr metabonomics. Anal Chem. 2006;78:4281-4290
198. Chobanian AV, Bakris GL, Black HR, Cushman WC, Green LA, Izzo JL, Jr., Jones
DW, Materson BJ, Oparil S, Wright JT, Jr., Roccella EJ. The seventh report of the
joint national committee on prevention, detection, evaluation, and treatment of high
blood pressure: The jnc 7 report. JAMA. 2003;289:2560-2572
199. Daida H, Allison TG, Squires RW, Miller TD, Gau GT. Peak exercise blood pressure
stratified by age and gender in apparently healthy subjects. Mayo Clinic proceedings.
1996;71:445-452
200. Lip GY, Blann AD. Von willebrand factor and its relevance to cardiovascular
disorders. British heart journal. 1995;74:580-583
201. Wang JS, Liao CH. Moderate-intensity exercise suppresses platelet activation and
polymorphonuclear leukocyte interaction with surface-adherent platelets under shear
flow in men. Thrombosis and haemostasis. 2004;91:587-594

165
202. Jilma B, Dirnberger E, Eichler HG, Matulla B, Schmetterer L, Kapiotis S, Speiser W,
Wagner OF. Partial blockade of nitric oxide synthase blunts the exercise-induced
increase of von willebrand factor antigen and of factor viii in man. Thrombosis and
haemostasis. 1997;78:1268-1271
203. Fagard RH, Pardaens K, Staessen JA, Thijs L. Prognostic value of invasive
hemodynamic measurements at rest and during exercise in hypertensive men.
Hypertension. 1996;28:31-36
204. Tanaka H, Monahan KD, Seals DR. Age-predicted maximal heart rate revisited.
Journal of the American College of Cardiology. 2001;37:153-156
205. Wehling M. Effects of aldosterone and mineralocorticoid receptor blockade on
intracellular electrolytes. Heart failure reviews. 2005;10:39-46
206. Wishart DS. Applications of metabolomics in drug discovery and development. Drugs
in R&D. 2008;9:307-322
207. Overdiek HW, Merkus FW. The metabolism and biopharmaceutics of spironolactone
in man. Reviews on drug metabolism and drug interactions. 1987;5:273-302
208. Pitt B, Zannad F, Remme WJ, Cody R, Castaigne A, Perez A, Palensky J, Wittes J.
The effect of spironolactone on morbidity and mortality in patients with severe heart
failure. Randomized aldactone evaluation study investigators. N Engl J Med.
1999;341:709-717
209. Funder JW, Pearce PT, Smith R, Campbell J. Vascular type i aldosterone binding sites
are physiological mineralocorticoid receptors. Endocrinology. 1989;125:2224-2226
210. Hatakeyama H, Miyamori I, Fujita T, Takeda Y, Takeda R, Yamamoto H. Vascular
aldosterone. Biosynthesis and a link to angiotensin ii-induced hypertrophy of vascular
smooth muscle cells. The Journal of biological chemistry. 1994;269:24316-24320
211. Lombes M, Oblin ME, Gasc JM, Baulieu EE, Farman N, Bonvalet JP.
Immunohistochemical and biochemical evidence for a cardiovascular
mineralocorticoid receptor. Circulation research. 1992;71:503-510
212. Benetos A, Lacolley P, Safar ME. Prevention of aortic fibrosis by spironolactone in
spontaneously hypertensive rats. Arteriosclerosis, thrombosis, and vascular biology.
1997;17:1152-1156
166
213. Mottram PM, Haluska B, Leano R, Cowley D, Stowasser M, Marwick TH. Effect of
aldosterone antagonism on myocardial dysfunction in hypertensive patients with
diastolic heart failure. Circulation. 2004;110:558-565
214. de Vegt F, Dekker JM, Ruhe HG, Stehouwer CD, Nijpels G, Bouter LM, Heine RJ.
Hyperglycaemia is associated with all-cause and cardiovascular mortality in the hoorn
population: The hoorn study. Diabetologia. 1999;42:926-931
215. Kimoto E, Shoji T, Shinohara K, Inaba M, Okuno Y, Miki T, Koyama H, Emoto M,
Nishizawa Y. Preferential stiffening of central over peripheral arteries in type 2
diabetes. Diabetes. 2003;52:448-452
216. Chen JY, Chou Ch Fau - Lee YL, Lee Yl Fau - Tsai W-C, Tsai Wc Fau - Lin C-C, Lin
Cc Fau - Huang Y-Y, Huang Yy Fau - Chen J-H, Chen JH. Association of central
aortic pressures indexes with development of diabetes mellitus in essential
hypertension. Am J Hypertens. 2010;23:1069-1073
217. Welborn T, De Courten M. Case detection and diagnosis expert working group:
National evidence based guidelines for the management of type 2 diabetes mellitus;
part 3 case detection and diagnosis of type 2 diabetes. National Health and Medical
Research Council. 2001
218. Edwards LM, Lawler NG, Nikolic SB, Peters JM, Horne J, Wilson R, Davies NW,
Sharman JE. Metabolomics reveals increased isoleukotoxin diol (12,13-dhome) in
human plasma after acute intralipid infusion. J Lipid Res. 2012;53:1979-1986
219. Robinson BH. Lactic acidemia and mitochondrial disease. Molecular genetics and
metabolism. 2006;89:3-13
220. DiGirolamo M, Newby FD, Lovejoy J. Lactate production in adipose tissue: A
regulated function with extra-adipose implications. FASEB journal : official
publication of the Federation of American Societies for Experimental Biology.
1992;6:2405-2412
221. Mabley JG, Pacher P, Liaudet L, Soriano FG, Hasko G, Marton A, Szabo C, Salzman
AL. Inosine reduces inflammation and improves survival in a murine model of colitis.
American journal of physiology. Gastrointestinal and liver physiology.
2003;284:G138-144

167
222. Mabley JG, Rabinovitch A, Suarez-Pinzon W, Hasko G, Pacher P, Power R, Southan
G, Salzman A, Szabo C. Inosine protects against the development of diabetes in
multiple-low-dose streptozotocin and nonobese diabetic mouse models of type 1
diabetes. Molecular medicine (Cambridge, Mass.). 2003;9:96-104
223. Festa A, D'Agostino R, Jr., Howard G, Mykkanen L, Tracy RP, Haffner SM. Chronic
subclinical inflammation as part of the insulin resistance syndrome: The insulin
resistance atherosclerosis study (iras). Circulation. 2000;102:42-47
224. Hamer M, Steptoe A. Vascular inflammation and blood pressure response to acute
exercise. Eur J Appl Physiol. 2012;112:2375-2379
225. Floyd JC, Jr., Fajans SS, Conn JW, Knopf RF, Rull J. Stimulation of insulin secretion
by amino acids. The Journal of clinical investigation. 1966;45:1487-1502
226. Krebs M, Krssak M, Bernroider E, Anderwald C, Brehm A, Meyerspeer M, Nowotny
P, Roth E, Waldhausl W, Roden M. Mechanism of amino acid-induced skeletal
muscle insulin resistance in humans. Diabetes. 2002;51:599-605
227. Shah SH, Bain JR, Muehlbauer MJ, Stevens RD, Crosslin DR, Haynes C, Dungan J,
Newby LK, Hauser ER, Ginsburg GS, Newgard CB, Kraus WE. Association of a
peripheral blood metabolic profile with coronary artery disease and risk of subsequent
cardiovascular events. Circulation. Cardiovascular genetics. 2010;3:207-214
228. Kim Y, Wilkens LR, Park SY, Goodman MT, Monroe KR, Kolonel LN. Association
between various sedentary behaviours and all-cause, cardiovascular disease and
cancer mortality: The multiethnic cohort study. International journal of epidemiology.
2013;42:1040-1056
229. Myers MG, Valdivieso M, Kiss A. Use of automated office blood pressure
measurement to reduce the white coat response. J Hypertens. 2009;27:280-286
230. Niiranen TJ, Hanninen MR, Johansson J, Reunanen A, Jula AM. Home-measured
blood pressure is a stronger predictor of cardiovascular risk than office blood
pressure: The finn-home study. Hypertension. 2010;55:1346-1351
231. Hansen TW, Kikuya M, Thijs L, Bjorklund-Bodegard K, Kuznetsova T, Ohkubo T,
Richart T, Torp-Pedersen C, Lind L, Jeppesen J, Ibsen H, Imai Y, Staessen JA.
Prognostic superiority of daytime ambulatory over conventional blood pressure in
168
four populations: A meta-analysis of 7,030 individuals. J Hypertens. 2007;25:1554-
1564
232. Verberk WJ, Kroon AA, Lenders JW, Kessels AG, van Montfrans GA, Smit AJ, van
der Kuy PH, Nelemans PJ, Rennenberg RJ, Grobbee DE, Beltman FW, Joore MA,
Brunenberg DE, Dirksen C, Thien T, de Leeuw PW, Home Versus Office
Measurement RoUTSI. Self-measurement of blood pressure at home reduces the need
for antihypertensive drugs: A randomized, controlled trial. Hypertension.
2007;50:1019-1025
233. Sharman JE, Fang ZY, Haluska B, Stowasser M, Prins JB, Marwick TH. Left
ventricular mass in patients with type 2 diabetes is independently associated with
central but not peripheral pulse pressure. Diabetes care. 2005;28:937-939
234. Williams B, Lacy PS, Thom SM, Cruickshank K, Stanton A, Collier D, Hughes AD,
Thurston H, O'Rourke M. Differential impact of blood pressure-lowering drugs on
central aortic pressure and clinical outcomes: Principal results of the conduit artery
function evaluation (cafe) study. Circulation. 2006;113:1213-1225
235. Roman MJ, Devereux RB, Kizer JR, Okin PM, Lee ET, Wang W, Umans JG,
Calhoun D, Howard BV. High central pulse pressure is independently associated with
adverse cardiovascular outcome the strong heart study. Journal of the American
College of Cardiology. 2009;54:1730-1734
236. Devereux RB, Reichek N. Echocardiographic determination of left ventricular mass in
man. Anatomic validation of the method. Circulation. 1977;55:613-618
237. van Loo JM, Peer PG, Thien TA. Twenty-five minutes between blood pressure
readings: The influence on prevalence rates of isolated systolic hypertension. J
Hypertens. 1986;4:631-635
238. Verberk WJ, Kroon AA, Kessels AG, Lenders JW, Thien T, van Montfrans GA, Smit
AJ, de Leeuw PW. The optimal scheme of self blood pressure measurement as
determined from ambulatory blood pressure recordings. J Hypertens. 2006;24:1541-
1548
239. Myers MG, Godwin M, Dawes M, Kiss A, Tobe SW, Grant FC, Kaczorowski J.
Conventional versus automated measurement of blood pressure in primary care
169
patients with systolic hypertension: Randomised parallel design controlled trial. BMJ.
2011;342:d286
240. Mancia G, Bertinieri G, Grassi G, Parati G, Pomidossi G, Ferrari A, Gregorini L,
Zanchetti A. Effects of blood-pressure measurement by the doctor on patient's blood
pressure and heart rate. Lancet. 1983;2:695-698
241. Ohkubo T, Kikuya M, Metoki H, Asayama K, Obara T, Hashimoto J, Totsune K,
Hoshi H, Satoh H, Imai Y. Prognosis of "masked" hypertension and "white-coat"
hypertension detected by 24-h ambulatory blood pressure monitoring 10-year follow-
up from the ohasama study. Journal of the American College of Cardiology.
2005;46:508-515
242. Wang KL, Cheng HM, Chuang SY, Spurgeon HA, Ting CT, Lakatta EG, Yin FC,
Chou P, Chen CH. Central or peripheral systolic or pulse pressure: Which best relates
to target organs and future mortality? J Hypertens. 2009;27:461-467
243. Hirata K, Vlachopoulos C, Adji A, O'Rourke MF. Benefits from angiotensin-
converting enzyme inhibitor 'beyond blood pressure lowering': Beyond blood pressure
or beyond the brachial artery? J Hypertens. 2005;23:551-556
244. Morgan T, Lauri J, Bertram D, Anderson A. Effect of different antihypertensive drug
classes on central aortic pressure. Am J Hypertens. 2004;17:118-123
245. Hope SA, Meredith IT, Cameron JD. Effect of non-invasive calibration of radial
waveforms on error in transfer-function-derived central aortic waveform
characteristics. Clinical science (London, England : 1979). 2004;107:205-211
246. Saladini F, Benetti E, Malipiero G, Casiglia E, Palatini P. Does home blood pressure
allow for a better assessment of the white-coat effect than ambulatory blood pressure?
J Hypertens. 2012;30:2118-2124
247. Zelena E, Dunn WB, Broadhurst D, Francis-McIntyre S, Carroll KM, Begley P,
O'Hagan S, Knowles JD, Halsall A, Consortium H, Wilson ID, Kell DB.
Development of a robust and repeatable uplc-ms method for the long-term
metabolomic study of human serum. Anal Chem. 2009;81:1357-1364
248. Gika HG, Theodoridis GA, Wilson ID. Liquid chromatography and ultra-performance
liquid chromatography-mass spectrometry fingerprinting of human urine: Sample
170
stability under different handling and storage conditions for metabonomics studies.
Journal of chromatography. A. 2008;1189:314-322
249. Guy PA, Tavazzi I, Bruce SJ, Ramadan Z, Kochhar S. Global metabolic profiling
analysis on human urine by uplc-tofms: Issues and method validation in nutritional
metabolomics. Journal of chromatography. B, Analytical technologies in the
biomedical and life sciences. 2008;871:253-260
250. Bordbar A, Mo ML, Nakayasu ES, Schrimpe-Rutledge AC, Kim YM, Metz TO,
Jones MB, Frank BC, Smith RD, Peterson SN, Hyduke DR, Adkins JN, Palsson BO.
Model-driven multi-omic data analysis elucidates metabolic immunomodulators of
macrophage activation. Molecular systems biology. 2012;8:558
251. Deatherage Kaiser BL, Li J, Sanford JA, Kim YM, Kronewitter SR, Jones MB,
Peterson CT, Peterson SN, Frank BC, Purvine SO, Brown JN, Metz TO, Smith RD,
Heffron F, Adkins JN. A multi-omic view of host-pathogen-commensal interplay in -
mediated intestinal infection. PloS one. 2013;8:e67155
252. Kim YM, Schmidt BJ, Kidwai AS, Jones MB, Deatherage Kaiser BL, Brewer HM,
Mitchell HD, Palsson BO, McDermott JE, Heffron F, Smith RD, Peterson SN,
Ansong C, Hyduke DR, Metz TO, Adkins JN. Salmonella modulates metabolism
during growth under conditions that induce expression of virulence genes. Molecular
bioSystems. 2013;9:1522-1534
253. Metz TO, Page JS, Baker ES, Tang K, Ding J, Shen Y, Smith RD. High resolution
separations and improved ion production and transmission in metabolomics. Trends in
analytical chemistry : TRAC. 2008;27:205-214
254. Want EJ, Wilson ID, Gika H, Theodoridis G, Plumb RS, Shockcor J, Holmes E,
Nicholson JK. Global metabolic profiling procedures for urine using uplc–ms. Nature
Protocols. 2010;5:1005-1018
255. Karpievitch YV, Taverner T, Adkins JN, Callister SJ, Anderson GA, Smith RD,
Dabney AR. Normalization of peak intensities in bottom-up ms-based proteomics
using singular value decomposition. Bioinformatics. 2009
gcoleman
Typewritten Text

171
256. Sangster T, Major H, Plumb R, Wilson AJ, D. WI. A pragmatic and readily
implemented quality control strategy for hplc-ms and gc-ms-based metabonomic
analysis. The Analyst. 2006;131:1075-1078
257. Leek JT, Storey JD. Capturing heterogeneity in gene expression studies by surrogate
variable analysis. PLoS Genetics. 2007;3
258. Lai L, Michopoulos F, Gika H, Theodoridis G, Wilkinson RW, Odedra R, Wingate J,
Bonner R, Tate S, Wilson ID. Methodological considerations in the development of
hplc-ms methods for the analysis of rodent plasma for metabonomic studies.
Molecular bioSystems. 2010;6:108-120
259. Benjamini Y, Hochberg Y. Controlling the false discovery rate: A practical and
powerful approach to multiple testing. Journal of the Royal Statistical Society.
1995;57:289-300

172
Publications Arising From This Thesis

These articles have been removed for
copyright or proprietary reasons.
gcoleman
Typewritten Text
Nikolic SB, Sharman JE, Adams MJ, Edwards LM. Metabolomics in hypertension. J Hypertens. 2014; 32:1159-1169 Nikolic SB, Wilson R, Hare JL, Adams MJ, Edwards LM, Sharman JE. Spironolactone reduces aortic stiffness via blood pressure-dependent effects of canrenoate. Metabolomics. 2014;10:105-113 Nikolic SB, Abhayaratna WP, Leano R, Stowasser M, Sharman JE. Waiting a few extra minutes before measuring blood pressure has potentially important clinical and research ramifications. Journal of human hypertension. 2014;28:56-61
gcoleman
Typewritten Text