GLOBAL CLOTHING B2C E-COMMERCE MARKET … is the standing of this category relative to other...
18
1 GLOBAL CLOTHING B2C E-COMMERCE MARKET 2016 PUBLICATION DATE: AUGUST 2016 PAGE 2 GENERAL INFORMATION I PAGE 3 KEY FINDINGS I PAGE 4 - 10 TABLE OF CONTENTS I PAGE 11 REPORT-SPECIFIC SAMPLE CHARTS I PAGE 12 METHODOLOGY I PAGE 13 RELATED REPORTS I PAGE 14 CLIENTS I PAGE 15-16 FREQUENTLY ASKED QUESTIONS PAGE 17 ORDER FORM I PAGE 18 TERMS AND CONDITIONS
Transcript of GLOBAL CLOTHING B2C E-COMMERCE MARKET … is the standing of this category relative to other...
1
GLOBAL CLOTHING B2C E-COMMERCE MARKET 2016 PUBLICATION DATE: AUGUST 2016
PAGE 2 GENERAL INFORMATION I PAGE 3 KEY FINDINGS I PAGE 4 - 10 TABLE OF CONTENTS I PAGE 11 REPORT-SPECIFIC SAMPLE
CHARTS I PAGE 12 METHODOLOGY I PAGE 13 RELATED REPORTS I PAGE 14 CLIENTS I PAGE 15-16 FREQUENTLY ASKED QUESTIONS
PAGE 17 ORDER FORM I PAGE 18 TERMS AND CONDITIONS

2
2
PRODUCT DETAILS Title:
Type of Product:
Category:
Covered Regions:
Covered Countries:
Language:
Formats:
Number of Charts:
Global Clothing B2C E-Commerce Market 2016
Market Report
B2C E-Commerce
Global
Japan, South Korea, Australia, China, India, Indonesia, Thailand, UK,
Germany, France, Spain, Italy, Russia, Poland, Turkey, USA, Canada,
Brazil, Mexico, Argentina, Colombia, Chile, Peru, UAE, Saudi Arabia,
Iran, Israel, Qatar, South Africa, Nigeria, Egypt, Morocco
English
PDF & PowerPoint
144
PRICES* Single User License:
Site License:
Global Site License:
€ 2950 (exc. VAT)
€ 4425 (exc. VAT)
€ 5900 (exc. VAT)
QUESTIONS
ANSWERED
IN THIS REPORT
How is the clothing B2C E-Commerce market developing around the world?
What is the standing of this category relative to other products in online retail?
How large are the B2C E-Commerce sales of fashion products in some of the world’s major
markets?
What important trends are forming in clothing B2C E-Commerce?
Which online shopping websites for clothing are leading in various countries?
SECONDARY MARKET
RESEARCH
Our reports are exclusively based on secondary market research. Our researchers derive
information and data from a variety of reliable published sources and compile the data into
understandable and easy-to-use formats.
ADVANTAGES Maximum Objectivity
Reliable Sources
Up-To-Date Analysis
Boardroom-Ready PowerPoint Presentations
Guidance For Strategic Company Decisions
GLOBAL CLOTHING B2C E-COMMERCE MARKET 2016

3
CLOTHING IS THE LEADING PRODUCT CATEGORY IN ONLINE SHOPPERS’
SHARE WORLDWIDE
Fashion products were purchased by over one half of online shoppers worldwide in
2015, according to a survey cited in the yStats.com report. It is the number one product
category in terms of online shoppers’ share in countries such as China, the USA, Brazil,
Saudi Arabia, the UK, Russia and many others. In terms of online retail sales, however, it is
often surpassed by categories with a higher value per item, such as electronics.
Mobile commerce is an important contributor to the rise of fashion online retail.
Worldwide, a combined share of more than 10% of online shoppers preferred mobile
channels (phones and tablets) for buying apparel and footwear. Furthermore, the
yStats.com research shows that clothing is popular with cross-border online shoppers
around the world. Another important trend highlighted in the report is omnichannel
commerce, as customers combine online, mobile and in-store channels on their way to a
purchase of clothing.
Online clothing stores such as HM.com, Asos.com and Zara.com were most popular
with global Internet users, as of July 2016. Furthermore, online mass merchants and
marketplaces are also active in this product segment, with Amazon projected to become the
largest apparel seller in the USA by 2017, according to a forecast cited in the new report by
yStats.com.
GLOBAL CLOTHING B2C E-COMMERCE MARKET 2016

4
MANAGEMENT SUMMARY
GLOBAL DEVELOPEMENTS
Product Categories Purchased Online, incl. “Fashion-Related Products”, in % of Online Shoppers, Q4 2015
Product Categories Most Purchased Online, by Generation, incl. “Apparel”, in % of Online Shoppers, November
2015
Product Categories Purchased Cross-Border, incl. “Clothing and Footwear”, in % Cross-Border Online Shoppers,
September 2015
Breakdown of Preferred Channels of Buying “Clothing and Footwear”, in % of Online Shoppers, September 2015
Top 20 Clothing E-Commerce Websites, by Website Rank, incl. Website Visits, in millions, Average Visit Duration, in
minutes, Bounce Rate, in %, and Top 5 Countries by Share of Visits, in %, July 2016
ASIA-PACIFIC
3.1 ADVANCED MARKETS
3.1.1 JAPAND
Overview of Clothing B2C E-Commerce Market and Players, June 2016
B2C E-Commerce Sales of “Clothing”, in JPY billion, 2013 – 2015
B2C E-Commerce Share of Total Retail Sales of “Clothing”, in %, 2013 - 2015
Share of Online Shoppers Buying “Clothes and Fashion-Related Products” Online, in %, 2015
Top 10 Clothing E-Commerce Websites, by Website Rank, incl. Total Website Visits, in millions, Average Visit
Duration, in minutes, Bounce Rate, in %, and Japan’s Share of Total Visits, in %, July 2016
3.1.2 SOUTH KOREA
E-Commerce Sales of “Clothing”, in KRW billion, 2014 & 2015
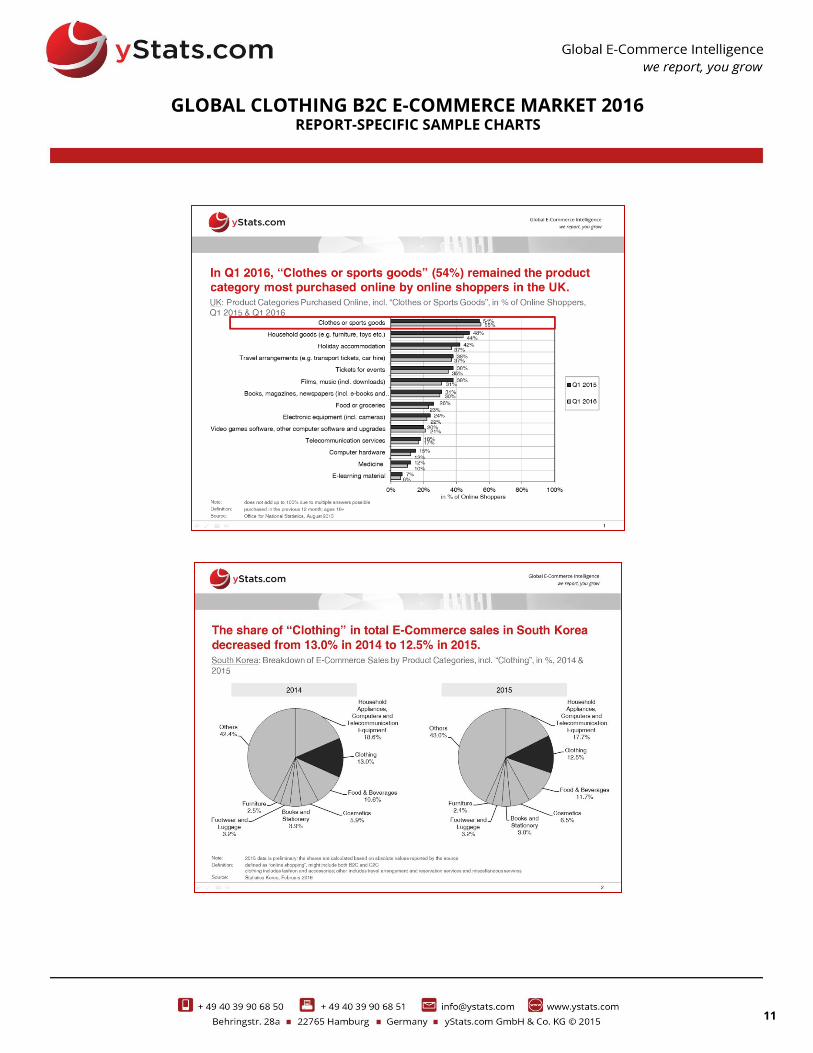
Breakdown of E-Commerce Sales by Product Categories, incl. “Clothing”, in %, 2014 & 2015
E-Commerce Share of Retail Sales, by Product Category, incl. “Clothing”, in %, 2014 & 2015
Product Categories Purchased Online, incl. “General Apparel Merchandise”, by PC and Mobile, in % of Online
Shoppers, October 2015
Product Categories Purchased Cross-Border Online, incl. “General Apparel Merchandise”, in % of Cross-Border
Online Shoppers, October 2015
3.1.3 AUSTRALIA
Breakdown of Online Spending by Sector, incl. “Fashion”, in %, 2015
Breakdown of Online Clothing Spending, by Domestic and Overseas, by Spending by Men and Spending by
Women, in AUD million, 2015
Top Product Categories Purchased Online, in % of Online Shoppers, 2014 & 2015
GLOBAL CLOTHING B2C E-COMMERCE MARKET 2016
1
2
TABLE OF CONTENTS (1 OF 7)
3
5
5
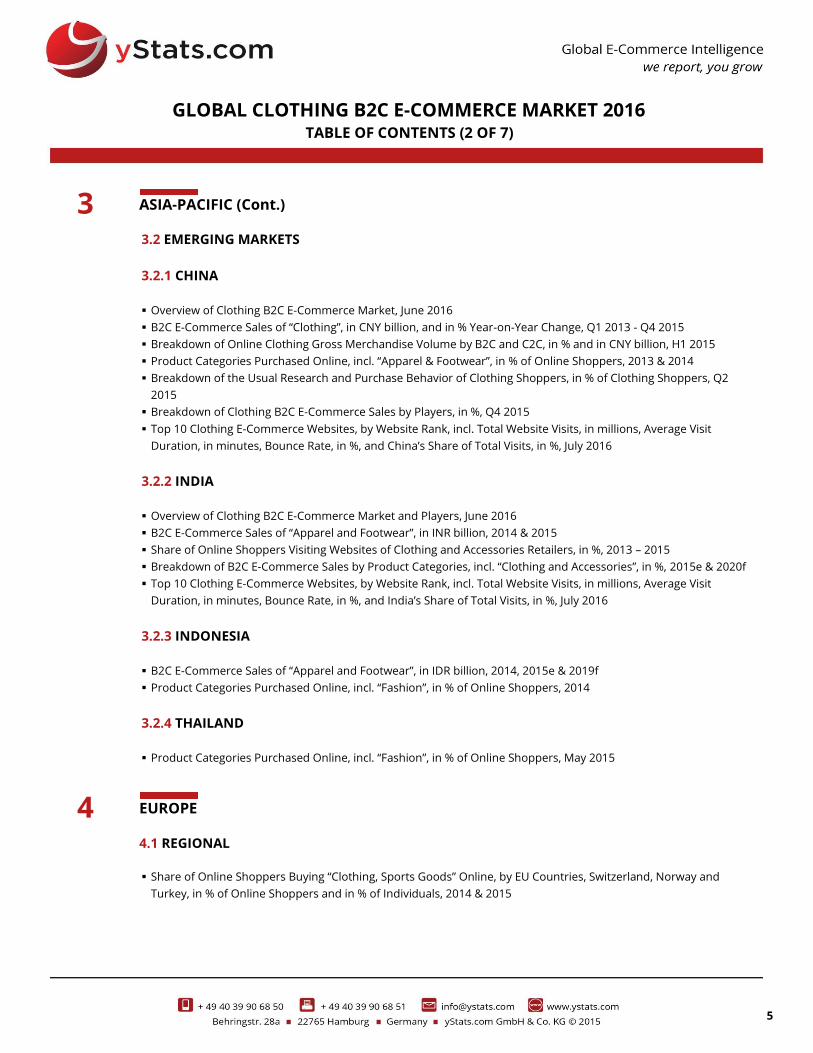
ASIA-PACIFIC (Cont.)
3.2 EMERGING MARKETS
3.2.1 CHINA
Overview of Clothing B2C E-Commerce Market, June 2016
B2C E-Commerce Sales of “Clothing”, in CNY billion, and in % Year-on-Year Change, Q1 2013 - Q4 2015
Breakdown of Online Clothing Gross Merchandise Volume by B2C and C2C, in % and in CNY billion, H1 2015
Product Categories Purchased Online, incl. “Apparel & Footwear”, in % of Online Shoppers, 2013 & 2014
Breakdown of the Usual Research and Purchase Behavior of Clothing Shoppers, in % of Clothing Shoppers, Q2
2015
Breakdown of Clothing B2C E-Commerce Sales by Players, in %, Q4 2015
Top 10 Clothing E-Commerce Websites, by Website Rank, incl. Total Website Visits, in millions, Average Visit
Duration, in minutes, Bounce Rate, in %, and China’s Share of Total Visits, in %, July 2016
3.2.2 INDIA
Overview of Clothing B2C E-Commerce Market and Players, June 2016
B2C E-Commerce Sales of “Apparel and Footwear”, in INR billion, 2014 & 2015
Share of Online Shoppers Visiting Websites of Clothing and Accessories Retailers, in %, 2013 – 2015
Breakdown of B2C E-Commerce Sales by Product Categories, incl. “Clothing and Accessories”, in %, 2015e & 2020f
Top 10 Clothing E-Commerce Websites, by Website Rank, incl. Total Website Visits, in millions, Average Visit
Duration, in minutes, Bounce Rate, in %, and India’s Share of Total Visits, in %, July 2016
3.2.3 INDONESIA
B2C E-Commerce Sales of “Apparel and Footwear”, in IDR billion, 2014, 2015e & 2019f
Product Categories Purchased Online, incl. “Fashion”, in % of Online Shoppers, 2014
3.2.4 THAILAND
Product Categories Purchased Online, incl. “Fashion”, in % of Online Shoppers, May 2015
EUROPE
4.1 REGIONAL
Share of Online Shoppers Buying “Clothing, Sports Goods” Online, by EU Countries, Switzerland, Norway and
Turkey, in % of Online Shoppers and in % of Individuals, 2014 & 2015
GLOBAL CLOTHING B2C E-COMMERCE MARKET 2016
TABLE OF CONTENTS (2 OF 7)
3
4

6
6
EUROPE (Cont.)
4.2 ADVANCED MARKETS
4.2.1 UK
Overview of Clothing B2C E-Commerce Market, August 2016
B2C E-Commerce Sales of Clothing and Footwear, in GBP billion, B2C E-Commerce Share of Total Retail Sales of
Clothing and Footwear, in %, and B2C E-Commerce Share of Total Retail Sales of Clothing, in %, 2015 & 2020f
B2C E-Commerce Share of Total Retail Sales of Textile, Clothing and Footwear Retailers, Compared to B2C E-
Commerce Share of Total Retail Sales, in %, 2011-2015 & Q1-Q2 2016
Product Categories Purchased Online, incl. “Clothes or Sports Goods”, in % of Online Shoppers, Q1 2015 & Q1 2016
Top 10 Clothing E-Commerce Websites, by Website Rank, incl. Total Website Visits, in millions, Average Visit
Duration, in minutes, Bounce Rate, in %, and UK’s Share of Total Visits, in %, July 2016
4.2.2 GERMANY
Overview of Clothing B2C E-Commerce Market and Players, August 2016
B2C E-Commerce Sales of Clothing, in EUR billion, and Year-on-Year Change, in %, 2011 – 2015
B2C E-Commerce Share of Total Retail Sales of Clothing, Shoes and Accessories, in %, 2015 & 2025f
Product Categories Purchased Online, incl. “Clothing and Sports Goods”, in % of Online Shoppers, Q1 2015
Top 5 Online Shops and Marketplaces to Purchase Clothing and Shoes, in % of Clothing Online Shoppers, October
2015
4.2.3 FRANCE
B2C E-Commerce Sales, by Product Category, in EUR billion, and Share of Total Retail Sales in the Respective
Category, in %, incl. “Clothing”, 2015
B2C E-Commerce Sales of Clothing, Shoes and Home Textile, in EUR billion, 2014 & 2015
Product Categories Purchased Online, in % of Online Shoppers, 2015
Product Categories Purchased Online via Desktop and Smartphone, incl. “Clothing’, in % of Internet Users and in %
of Mobile Internet Users, H1 2016
Breakdown of B2C E-Commerce Sales of Clothing by Retailer Types, in %, 12 Months to June 2015
4.2.4 SPAIN
Breakdown of B2C E-Commerce Sales of Fashion by Sub-Categories, in % and in EUR million, 2015
B2C E-Commerce Share of Total Retail Sales of Clothing, Footwear, Accessories and Home Textiles, in Q1 2014 – Q2
2016
Products Purchased Online, incl. “Fashion”, in % of Online Shoppers, 12 Months to November 2015
GLOBAL CLOTHING B2C E-COMMERCE MARKET 2016
TABLE OF CONTENTS (3 OF 7)
4

7
7
EUROPE (Cont.)
4.2 ADVANCED MARKETS (Cont.)
4.2.5 ITALY
B2C E-Commerce Sales of Clothing and Accessories, in EUR billion, 2015 & 2016f
B2C E-Commerce Exports of Clothing and Accessories, in EUR billion, 2015 & 2016f
B2C E-Commerce Share of Total Retail Sales of Clothing and Accessories, in %, 2015 & 2016f
4.3 EMERGING MARKETS
4.3.1 RUSSIA
B2C E-Commerce Sales of Clothing and Shoes, in RUB billion, 2014 & 2020f
B2C E-Commerce Sales by Product Categories, incl. “Clothing, Shoes”, in RUB billion, 2013 & 2014
Product Categories Purchased Online, in % of Online Shoppers, incl. “Clothing, Shoes, Sports Goods”, 2014 & 2015
Breakdown of Cross-Border E-Commerce Imports by Product Categories, incl. “Clothing and Shoes”, in %, 2015
Top 10 Online Shops Specialized in Clothing, Shoes an Accessories, incl. E-Commerce Sales, in RUB million, Number
of Orders, in thousands, and Average Check, in RUB, 2015
4.3.2 POLAND
Product Categories Purchased Online, incl. “Clothes, Sports Goods”, in % of Online Shoppers, 2014 & 2015
Average Monthly Online Spending per Shopper, by Selected Product Categories, incl. “Clothing and Accessories”, in
PLN, April 2015
Most Known E-Commerce Websites for Buying Clothing Online, in % of Internet Users, April 2016
4.3.3 TURKEY
B2C E-Commerce Sales of Clothing and Footwear, in USD million, 2015 & 2020f
Product Categories Purchased Online, incl. “Clothes, Sports Goods”, in % of Online Shoppers, by Gender, 12 Months
to March 2015
NORTH AMERICA
5.1 USA
Overview of Clothing B2C E-Commerce Market, August 2016
B2C E-Commerce Sales of Apparel and Accessories, in USD billion, 2014 & 2015e
B2C E-Commerce Share of Total Retail Sales of Clothing, in %, 2014 & 2015
Top 3 Product Categories Purchased Online, in % of Online Shoppers, July 2015
GLOBAL CLOTHING B2C E-COMMERCE MARKET 2016
TABLE OF CONTENTS (4 OF 7)
4
5
8
8
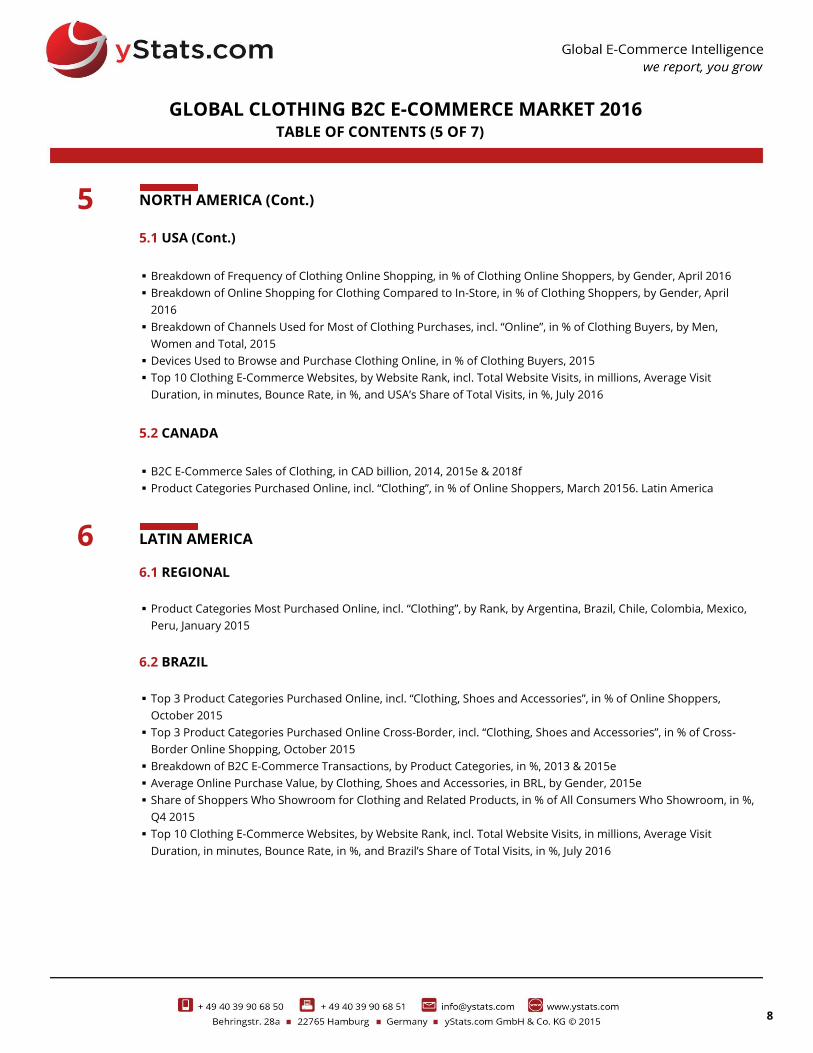
NORTH AMERICA (Cont.)
5.1 USA (Cont.)
Breakdown of Frequency of Clothing Online Shopping, in % of Clothing Online Shoppers, by Gender, April 2016
Breakdown of Online Shopping for Clothing Compared to In-Store, in % of Clothing Shoppers, by Gender, April
2016
Breakdown of Channels Used for Most of Clothing Purchases, incl. “Online”, in % of Clothing Buyers, by Men,
Women and Total, 2015
Devices Used to Browse and Purchase Clothing Online, in % of Clothing Buyers, 2015
Top 10 Clothing E-Commerce Websites, by Website Rank, incl. Total Website Visits, in millions, Average Visit
Duration, in minutes, Bounce Rate, in %, and USA’s Share of Total Visits, in %, July 2016
5.2 CANADA
B2C E-Commerce Sales of Clothing, in CAD billion, 2014, 2015e & 2018f
Product Categories Purchased Online, incl. “Clothing”, in % of Online Shoppers, March 20156. Latin America
LATIN AMERICA
6.1 REGIONAL
Product Categories Most Purchased Online, incl. “Clothing”, by Rank, by Argentina, Brazil, Chile, Colombia, Mexico,
Peru, January 2015
6.2 BRAZIL
Top 3 Product Categories Purchased Online, incl. “Clothing, Shoes and Accessories”, in % of Online Shoppers,
October 2015
Top 3 Product Categories Purchased Online Cross-Border, incl. “Clothing, Shoes and Accessories”, in % of Cross-
Border Online Shopping, October 2015
Breakdown of B2C E-Commerce Transactions, by Product Categories, in %, 2013 & 2015e
Average Online Purchase Value, by Clothing, Shoes and Accessories, in BRL, by Gender, 2015e
Share of Shoppers Who Showroom for Clothing and Related Products, in % of All Consumers Who Showroom, in %,
Q4 2015
Top 10 Clothing E-Commerce Websites, by Website Rank, incl. Total Website Visits, in millions, Average Visit
Duration, in minutes, Bounce Rate, in %, and Brazil’s Share of Total Visits, in %, July 2016
GLOBAL CLOTHING B2C E-COMMERCE MARKET 2016
TABLE OF CONTENTS (5 OF 7)
5
6
9
9
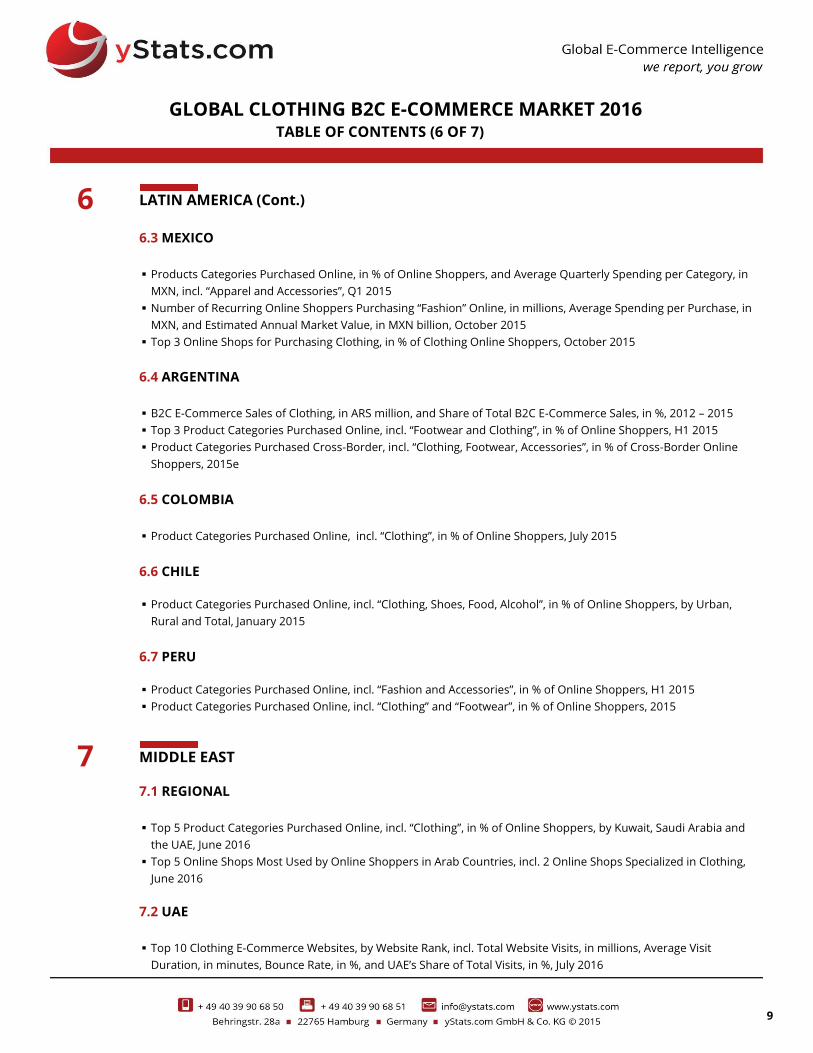
LATIN AMERICA (Cont.)
6.3 MEXICO
Products Categories Purchased Online, in % of Online Shoppers, and Average Quarterly Spending per Category, in
MXN, incl. “Apparel and Accessories”, Q1 2015
Number of Recurring Online Shoppers Purchasing “Fashion” Online, in millions, Average Spending per Purchase, in
MXN, and Estimated Annual Market Value, in MXN billion, October 2015
Top 3 Online Shops for Purchasing Clothing, in % of Clothing Online Shoppers, October 2015
6.4 ARGENTINA
B2C E-Commerce Sales of Clothing, in ARS million, and Share of Total B2C E-Commerce Sales, in %, 2012 – 2015
Top 3 Product Categories Purchased Online, incl. “Footwear and Clothing”, in % of Online Shoppers, H1 2015
Product Categories Purchased Cross-Border, incl. “Clothing, Footwear, Accessories”, in % of Cross-Border Online
Shoppers, 2015e
6.5 COLOMBIA
Product Categories Purchased Online, incl. “Clothing”, in % of Online Shoppers, July 2015
6.6 CHILE
Product Categories Purchased Online, incl. “Clothing, Shoes, Food, Alcohol”, in % of Online Shoppers, by Urban,
Rural and Total, January 2015
6.7 PERU
Product Categories Purchased Online, incl. “Fashion and Accessories”, in % of Online Shoppers, H1 2015
Product Categories Purchased Online, incl. “Clothing” and “Footwear”, in % of Online Shoppers, 2015
MIDDLE EAST
7.1 REGIONAL
Top 5 Product Categories Purchased Online, incl. “Clothing”, in % of Online Shoppers, by Kuwait, Saudi Arabia and
the UAE, June 2016
Top 5 Online Shops Most Used by Online Shoppers in Arab Countries, incl. 2 Online Shops Specialized in Clothing,
June 2016
7.2 UAE
Top 10 Clothing E-Commerce Websites, by Website Rank, incl. Total Website Visits, in millions, Average Visit
Duration, in minutes, Bounce Rate, in %, and UAE’s Share of Total Visits, in %, July 2016
GLOBAL CLOTHING B2C E-COMMERCE MARKET 2016
TABLE OF CONTENTS (6 OF 7)
6
7
10
10
MIDDLE EAST (Cont.)
7.3 SAUDI ARABIA
Product Categories Most Purchased Online Cross-Border, incl. “Clothing, Accessories and Footwear”, in % of Cross-
Border Online Shoppers, April 2015
7.4 IRAN
Product Categories Purchased Online, incl. “Clothing”, in % of Online Shoppers, 2012 & 2015
Top 5 Product Categories that Online Shoppers in Iran Expect to Have a Greater Access to in the Next Six Months,
incl. “Clothing”, in % of Online Shoppers, January 2016
7.5 ISRAEL
Product Categories Purchased Online, incl. “Clothes”, in % of Online Shoppers, July 2015
7.6 QATAR
Breakdown of B2C E-Commerce Sales, by Product Category, incl. “Fashion and Lifestyle”, in %, 2014
AFRICA
8.1 SOUTH AFRICA
B2C E-Commerce Sales of Apparel and Footwear, in USD million, 2014 & 2019f
Product Categories Purchased Online, incl. “Clothes and Accessories”, in % of Online Shoppers, October 2015
Top 10 Clothing E-Commerce Websites, by Website Rank, incl. Total Website Visits, in millions, Average Visit
Duration, in minutes, Bounce Rate, in %, and South Africa’s Share of Total Visits, in %, July 2016
8.2 NIGERIA
B2C E-Commerce Sales of Apparel and Footwear, in USD million, 2014 & 2019f
Top 3 Product Categories Purchased Online, in % of Online Shoppers, October 2015
8.3 EGYPT
Top 5 Product Categories Purchased Online, incl. “Clothes”, in % of Online Shoppers, June 2016
8.4 MOROCCO
Product Categories Purchased Online, “Clothing, Beauty Products”, in % of Online Shoppers, February 2016
GLOBAL CLOTHING B2C E-COMMERCE MARKET 2016
TABLE OF CONTENTS (7 OF 7)
7
8
11
11
GLOBAL CLOTHING B2C E-COMMERCE MARKET 2016
REPORT-SPECIFIC SAMPLE CHARTS
12
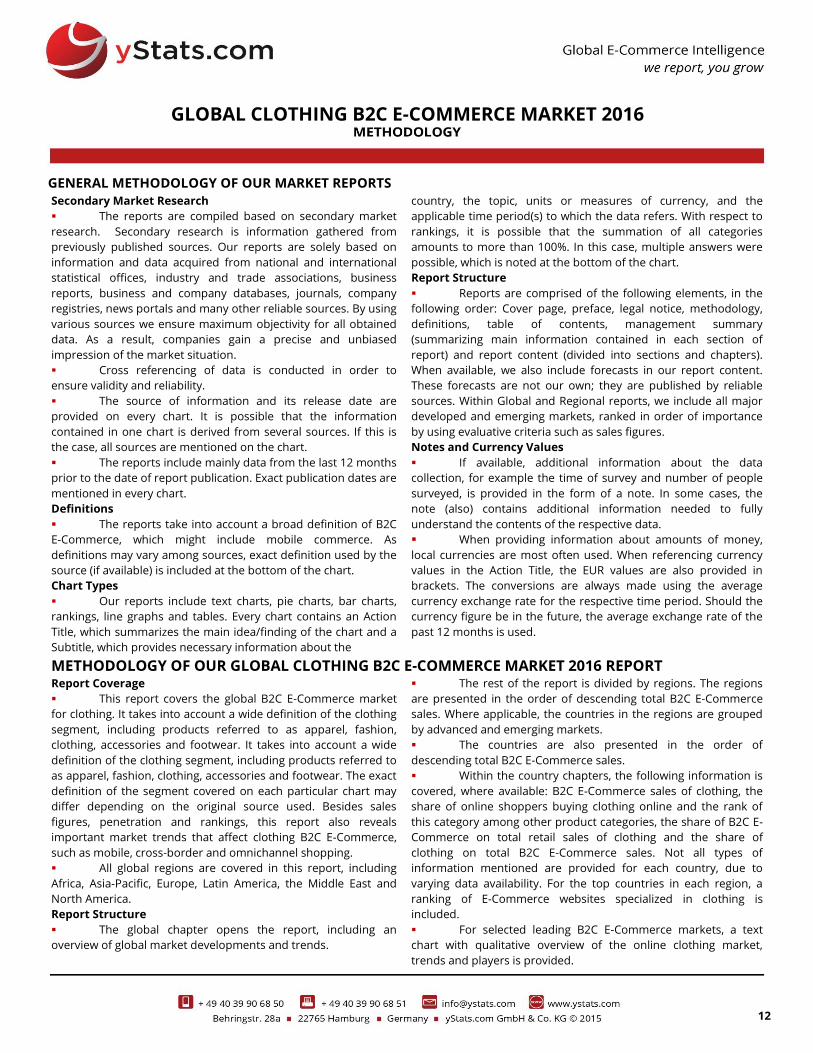
GENERAL METHODOLOGY OF OUR MARKET REPORTS
Secondary Market Research
The reports are compiled based on secondary market
research. Secondary research is information gathered from
previously published sources. Our reports are solely based on
information and data acquired from national and international
statistical offices, industry and trade associations, business
reports, business and company databases, journals, company
registries, news portals and many other reliable sources. By using
various sources we ensure maximum objectivity for all obtained
data. As a result, companies gain a precise and unbiased
impression of the market situation.
Cross referencing of data is conducted in order to
ensure validity and reliability.
The source of information and its release date are
provided on every chart. It is possible that the information
contained in one chart is derived from several sources. If this is
the case, all sources are mentioned on the chart.
The reports include mainly data from the last 12 months
prior to the date of report publication. Exact publication dates are
mentioned in every chart.
Definitions
The reports take into account a broad definition of B2C
E-Commerce, which might include mobile commerce. As
definitions may vary among sources, exact definition used by the
source (if available) is included at the bottom of the chart.
Chart Types
Our reports include text charts, pie charts, bar charts,
rankings, line graphs and tables. Every chart contains an Action
Title, which summarizes the main idea/finding of the chart and a
Subtitle, which provides necessary information about the
country, the topic, units or measures of currency, and the
applicable time period(s) to which the data refers. With respect to
rankings, it is possible that the summation of all categories
amounts to more than 100%. In this case, multiple answers were
possible, which is noted at the bottom of the chart.
Report Structure
Reports are comprised of the following elements, in the
following order: Cover page, preface, legal notice, methodology,
definitions, table of contents, management summary
(summarizing main information contained in each section of
report) and report content (divided into sections and chapters).
When available, we also include forecasts in our report content.
These forecasts are not our own; they are published by reliable
sources. Within Global and Regional reports, we include all major
developed and emerging markets, ranked in order of importance
by using evaluative criteria such as sales figures.
Notes and Currency Values
If available, additional information about the data
collection, for example the time of survey and number of people
surveyed, is provided in the form of a note. In some cases, the
note (also) contains additional information needed to fully
understand the contents of the respective data.
When providing information about amounts of money,
local currencies are most often used. When referencing currency
values in the Action Title, the EUR values are also provided in
brackets. The conversions are always made using the average
currency exchange rate for the respective time period. Should the
currency figure be in the future, the average exchange rate of the
past 12 months is used.
METHODOLOGY OF OUR GLOBAL CLOTHING B2C E-COMMERCE MARKET 2016 REPORT Report Coverage
This report covers the global B2C E-Commerce market
for clothing. It takes into account a wide definition of the clothing
segment, including products referred to as apparel, fashion,
clothing, accessories and footwear. It takes into account a wide
definition of the clothing segment, including products referred to
as apparel, fashion, clothing, accessories and footwear. The exact
definition of the segment covered on each particular chart may
differ depending on the original source used. Besides sales
figures, penetration and rankings, this report also reveals
important market trends that affect clothing B2C E-Commerce,
such as mobile, cross-border and omnichannel shopping.
All global regions are covered in this report, including
Africa, Asia-Pacific, Europe, Latin America, the Middle East and
North America.
Report Structure
The global chapter opens the report, including an
overview of global market developments and trends.
The rest of the report is divided by regions. The regions
are presented in the order of descending total B2C E-Commerce
sales. Where applicable, the countries in the regions are grouped
by advanced and emerging markets.
The countries are also presented in the order of
descending total B2C E-Commerce sales.
Within the country chapters, the following information is
covered, where available: B2C E-Commerce sales of clothing, the
share of online shoppers buying clothing online and the rank of
this category among other product categories, the share of B2C E-
Commerce on total retail sales of clothing and the share of
clothing on total B2C E-Commerce sales. Not all types of
information mentioned are provided for each country, due to
varying data availability. For the top countries in each region, a
ranking of E-Commerce websites specialized in clothing is
included.
For selected leading B2C E-Commerce markets, a text
chart with qualitative overview of the online clothing market,
trends and players is provided.
GLOBAL CLOTHING B2C E-COMMERCE MARKET 2016

13
UPCOMING RELATED REPORTS
Europe Clothing B2C E-Commerce Market 2016 August 2016 € 950
Asia-Pacific Clothing B2C E-Commerce Market 2016 July 2016 € 950
Top Players in Global B2C E-Commerce Market 2016 July 2016 € 950
Trends in Worldwide Internet Retail 2016 July 2016 € 1,450
Online Retail in Emerging Markets 2016 June 2016 € 3,450
Global B2C E-Commerce Market 2016 June 2016 € 4,950
Global Online Payment Methods: Full Year 2015 February 2016 € 2,950
Global Delivery B2C E-Commerce Market 2015 October 2015 € 2,950
Global Cross-Border B2C E-Commerce Market 2015 August 2015 € 2,950
Africa B2C E-Commerce Market 2016 May 2016 € 1,950
Middle-East B2C E-Commerce Market 2016 May 2016 € 1,950
Latin America B2C E-Commerce Market 2016 March 2016 € 1,950
Europe B2C E-Commerce Market 2016 February 2016 € 2,950
Western Europe B2C E-Commerce Market 2016 February 2016 € 1,950
Eastern Europe B2C E-Commerce Market 2016 January 2016 € 1,950
Central Asia and Caucasus B2C E-Commerce Market 2015 November 2015 € 1,450
North America B2C E-Commerce Market 2015 November 2015 € 950
Asia-Pacific B2C E-Commerce Market 2015 October 2015 € 3,450
Southeast Asia B2C E-Commerce Market 2015 September 2015 € 1,950
REPORT
PUBLICATION
DATE
PRICE*
Global Online Payment Methods: First Half 2016 September 2016 € 1,950
Global Cross-Border B2C E-Commerce 2016 Quarter 4 2016 € 2,950
GLOBAL CLOTHING B2C E-COMMERCE MARKET 2016

14
15
16
17
18