FY2005 OPERATING BUDGET -...
111
SAN FRANCISCO MUNICIPAL TRANSPORTATION AGENCY MUNICIPAL RAILWAY DEPARTMENT FY2005 OPERATING BUDGET SAN FRANCISCO MUNICIPAL RAILWAY DEPARTMENT REVENUES & APPROPRIATIONS
-
Upload
nguyenxuyen -
Category
Documents
-
view
217 -
download
1
Transcript of FY2005 OPERATING BUDGET -...

SAN FRANCISCO MUNICIPAL TRANSPORTATION AGENCY
MUNICIPAL RAILWAY DEPARTMENT
FY2005 OPERATING BUDGET
SAN FRANCISCO MUNICIPAL RAILWAY DEPARTMENT REVENUES & APPROPRIATIONS

MUNICIPAL TRANSPORTATION AGENCY, BOARD OF DIRECTORS
Cleopatra Vaughns, Chair Shirley Breyer Black
Wil Din Michael Kasolas, Vice Chair
Reverend Doctor James McCray, Jr. Peter Mezey
MUNICIPAL TRANSPORTATION AGENCY STAFF
Michael T. Burns Executive Director
SAN FRANCISCO MUNICIPAL RAILWAY FINANCE STAFF
Virginia Harrington Deputy General Manager, Finance and Administration
Alicia Fletcher
Budget Manager
Budget Document Producers BJ Dix
Elias Girma Stella Ong
Bose Onyemem

MUNI’S MISSION Working together effectively, we serve our community. We provide safe, reliable, clean, accessible, and convenient transportation to any destination in the City. We are dedicated to creating the most satisfying experience possible for our employees and our riders. By placing people first, Muni strives to offer the maximum opportunity for employees to contribute their best and achieve career growth. We are building a model urban transit organization, internationally recognized for excellence. We treat each other with respect; develop trust; encourage mutual understanding; and value our diversity. We promote accountability and take pride in our work. Above all, we are committed to living this Mission daily in our relationships with each and everyone in our community.

MUNICIPAL TRANSPORTATION AGENCY FY2005 GOALS 1. Advance Muni’s and DPT’s Missions at all levels and divisions within the organization by
focused communication, involvement and recognition. 2. Cultivate security awareness and preparedness through drills, training and improved
coordination with transit and government agencies. 3. Improve safety for employees, passengers, pedestrians and motorists by training; increased
awareness; and improved equipment, facilities and traffic control. 4. Achieve service standards and performance measures, including:
• On-time performance • Service availability • System reliability • System performance • Staffing performance • Customer service
5. Improve movement of people and goods throughout San Francisco by close communication
and coordination between the Municipal Railway and the Department of Parking and Traffic. 6. Promote professional growth and development for all employees through available training
opportunities. 7. Progress the Third Street Project in accordance with the FY05 baseline schedule and budget,
including: ongoing construction of line segments and Metro East, continuing preliminary engineering work for Phase II, the Central Subway, and securing funding and community support for the project.
8. Maintain a balanced budget and build a foundation for long-term financial stability through
aggressive pursuit of all revenue sources and improved management of resources. 9. Improve customer service by increasing access to timely and accurate information about all
MTA services and by speedy resolution of complaints and issues. 10. Increase the use of all alternative modes of travel and reduce travel time without increasing
congestion. 11. Finish implementation of the Transit Preferential Streets treatments for Inner Geary, and
continue planning and design for transit improvements on Geary, Van Ness, and other corridors, in accordance with the Vision Plan.
12. Continue implementation of the TransLink universal fare card system.

MaintenanceMike Hursh
Deputy General Manager
ConstructionVincent Harris
Deputy General Manager
Human ResourcesLarry Williams
Deputy General Manager
Finance & AdministrationVacant
Deputy General Manager
Capital Planning &External Affairs
VacantDeputy General Manager
TransportationWilson Johnson, Jr
Deputy General Manager
Deputy Executive DirectorStuart Sunshine
Executive DirectorMichael T. Burns
General ManagerFred Stephens
General Manager
Executive Office
Municipal Transportation AgencyBoard of Directors
Municipal Railway Department

BUDGET INFORMATION, PROCESS, GUIDELINES AND TIMELINE The operating budget of the Municipal Transportation Agency – Municipal Railway Department (Muni), is proposed by the Executive Director and approved by the Municipal Transportation Agency (MTA) Board of Directors and the San Francisco Board of Supervisors. The Executive Director and the MTA Board certify that the budget is adequate in all respects to allow the department to make substantial progress toward meeting the goals, objectives, and performance standards established pursuant to Section 8A.103 of the San Francisco City Charter. The FY2005 approved operating budget was created in the context of continued economic difficulties. FY2005 represents the fourth consecutive year of economic downturn. Beginning in FY2002, Muni’s revenue sources began to decline, as they are sensitive to economic conditions and factors such as employment levels and tourism levels. At the same time, the fixed costs associated with Muni’s core services have continued to rise, such as salary expenditures and fuel costs. Over the past four years, Muni has made every effort to reduce its expenditures in order to balance its budget. In addition, in FY2004, with rider satisfaction levels increasing and continued progress towards meeting Muni’s service standards, the agency looked to both revenue and expenditure solutions in order to balance its budget, adopting a fare increase as well as increases to parking fines, fees, and rates. In FY2005, after implementing expenditure and revenue measures over the previous years and facing a $32 million deficit, Muni had few viable options remaining to balance its budget. As a result, the FY2005 budget includes difficult measures such as personnel reductions, service adjustments, and the use of capital funds. While Muni has made progress in increasing its efficiency and maximizing its revenues in recent years, both of these strategies will need to be sustained in order for Muni to operate effectively going forward. In addition, it is important to recognize that a baseline level of resources is necessary in order to sustain service levels. Looking forward, it will be critical to align resources with service provision. Process The San Francisco Charter, as amended through Proposition E, approved by the voters in 1999, establishes the Municipal Transportation Agency (MTA) as an enterprise fund department of the City and County of San Francisco. Overseen by the MTA Board of Directors, Muni and the Department of Parking & Traffic make up the MTA and each also functions as an enterprise fund department. In establishing the MTA as an enterprise fund, a stated goal was to achieve a transportation system that is comparable to the best urban transit systems in the world’s major cities. The structure is designed to provide the transportation system with the resources, independence, and focus necessary to achieve this goal. Specifically, the Charter amendment intended to strengthen Muni’s authority to manage its employees, establish efficient and economical work rules and work practices that maximize Muni’s responsiveness to public needs, and protect the right of Muni to

manage its employees. In addition, the amendment helps to provide for a predictable and stable level of funding. Muni receives a yearly transfer or support from the General Fund, as specified by formula in Prop. E. The transfer amount is based upon the amount given in a base year, plus the percentage change in discretionary revenues for the General Fund. Muni’s budget process is also established in the Charter. After an internal review process, the Executive Director presents the proposed annual operating budget to the MTA Board and the Citizen’s Advisory Council (CAC) for review and comment. A public hearing is also held. The MTA Board must approve the budget and forward it to the Mayor and the Board of Supervisors by March 1. As long as Muni stays within the revenue formulas outlined in the Charter, and does not ask for additional General Fund resources or support, the Mayor must forward the budget to the Board of Supervisors as submitted. The Controller’s Office is charged with certifying the revenues as presented by Muni. Once received from the Mayor, the Board of Supervisors has three options with Muni’s budget. It may approve or reject the budget, but not modify it. Rejecting the budget requires a two-thirds vote. Or, if the Board takes no action by August 1, the budget is deemed approved. Operating Budget The budget approved by the MTA Board and the Board of Supervisors is Muni’s annual operating budget. With a few exceptions, it does not include capital projects. Capital projects are detailed in the Short Range Transit Plan, which is developed every other year. In addition, the operating budget also details positions funded through grant dollars. USING THE DOCUMENT The operating budget is a spending management plan for the use of Muni’s resources. Through the use of these resources, Muni provides public transportation services within the City and County of San Francisco. In addition, the budget is the vehicle by which Muni recommends allocation of resources to meet Muni’s goals and service standards. An accrual basis of accounting is used to develop Muni’s budget. Document Organization Muni’s budget is divided into 16 separate books, offered through electronic media. The first book is a department-level look at Muni’s budget, including an overview of its revenues and appropriations (expenditures), and positions. In addition, there are 15 division-level books that give a more detailed picture of each division, by unit. Independent of the operating budget is Muni’s capital budget, which is contained in the Short Range Transit Plan (SRTP). The SRTP is published every two years and is subject to approval by the MTA Board of Directors, and to appropriation approval by the Board of Supervisors.

Budget Organization Index Codes/Object/Subobject Codes As required by the San Francisco Charter, Muni’s budget is developed as a line item budget. As such it is organized into index codes, which indicate where in the department the funds are allocated, and object and subobject codes, which indicate what type of expenditure is included. This level of detail can be found in the reports that follow the budget narrative. Positions COLAs/Labor Agreements/Equity Adjustments As codified in the San Francisco Charter, the approved budget must contain in it funding to pay for all anticipated or estimated salary adjustments provided in employee Memoranda of Understanding (MOUs), cost of living adjustments (COLAs), and any other pay equity adjustments. (For the rest of the City, that money is added to departmental budgets after approval of employee MOUs.) Annualization of Existing Positions Positions that were added in the previous year’s budget (FY2004 operating budget), must be annualized to a full 1.0 full time equivalent (FTE) position from the previously budgeted 0.75 FTE position. The incremental costs associated with these positions must also be budgeted. Because no new positions were added in FY2004, there are no position annualization costs in the FY2005 budget. New Positions New positions are pro-rated to reflect the portion of the year the position will be on payroll. The default is to budget new positions at 0.75 of a full position, as the recruitment process takes an average of three months. No new positions were added to the FY2005 budget. Attrition Savings It is anticipated that normal departmental attrition results in savings. Attrition savings appear in the budget as a negative position count, which is netted against the total positions in the budget. Thus, the total position count for the department reflects the net funded positions for the department, adjusted for attrition savings. Other Adjustments Other salary adjustments included in budgeted position expenditures are those to compensate for a year that has 260, 261 or 262 workdays, for automatic step adjustments, and to adjust for positions not at the top salary step. In addition, salary annualization costs represent the cost of wage adjustments that took place during the prior year.

Fringe Benefits Fringe benefits include health care for active and retired employees, social security and Medicare contributions, City retirement contribution, City-paid employee retirement contribution (City pick-up), and other benefits provided in employee MOUs. Organization Charts Organization charts are included in each budget book. These charts reflect the positions and organizational structure of the agency at the time the FY2005 budget was developed. Terms Platform The term “platform” refers to the 9163 Transit Operator classification. Miscellaneous When used in reference to employees, the term “miscellaneous” applies to all non-Transit Operator classifications.

OVERVIEW

Municipal Transportation AgencySan Francisco Municipal Railway
FY2005 Operating BudgetFund Summary
FY2004 FY2005Approved Approved Variance
RevenueUnrestricted RevenueFares 117,053,755$ 121,927,059$ 4,873,304$ Parking 132,073,321 132,349,556 276,235Local and Regional Taxes 76,018,844 81,554,815 5,535,971Miscellaneous 11,352,074 4,492,154 (6,859,920)General Fund Contribution 95,414,850 98,859,258 3,444,408Appropriated Fund Balance 100,000 13,620,000 13,520,000Interdepartmental Recoveries 5,269,246 5,173,734 (95,512)Total Unrestricted Revenue 437,282,090 457,976,576 20,694,486
Restricted Revenue & Fund TransfersParatransit 15,270,406$ 15,543,328$ 272,922$ Special Revenue Funds 10,979,752 13,097,686 2,117,934Fund Transfers 992,000 - (992,000)Total Restricted & Fund Transfers 27,242,158 28,641,014 1,398,856
Revenue 464,524,248$ 486,617,590$ 22,093,342$
AppropriationsSalaries 261,141,730$ 249,089,575$ (12,052,155)$ Mandatory Fringe Benefits 71,388,040 93,364,555 21,976,515Non Personal Services 83,947,072 84,860,460 913,388Materials & Supplies 30,522,836 29,112,922 (1,409,914)Capital Outlay 1,324,952 1,959,525 634,573Capital Projects 600,000 6,205,683 5,605,683Facilities Maintenance 175,000 1,175,000 1,000,000.00 Allocated Charges (7,212,706) (6,175,798) 1,036,908Services Of Other Departments 22,637,324 24,437,622 1,800,298Operating Transfers Out 0 2,588,046 2,588,046Appropriations 464,524,248$ 486,617,590$ 22,093,342$

BUDGET OVERVIEW Muni’s FY2005 approved operating budget is $486,617,590. This is $22,093,342 more than the FY2004 approved operating budget of $464,524,248, or an increase of 4.8 percent. The growth in Muni’s budget is a result of continued growth in the costs associated with providing transit service, including both labor and non-salary costs. The continued economic downturn also impacted Muni’s FY2005 budget, in the form of lower or flat revenues in a variety of sources. In order to meet cost growth in the fourth consecutive year of economic downturn, Muni’s FY2005 budget includes difficult measures such as service adjustments, personnel reductions, and the use of capital funds to maintain the operation. While Muni has made progress in increasing its efficiency and maximizing its revenues in recent years, both of these strategies will need to be sustained in order for Muni to operate effectively going forward. In addition, it is important to recognize that a baseline level of resources is necessary in order to sustain service levels. Looking forward, it will be critical to align resources with service provision. A detailed discussion of revenues and appropriations follows this section. Revenues Muni’s FY2005 approved revenues are $486,617,590, an increase of $22,093,342 or 4.8 percent compared to the FY2004 approved budget of $464,524,248. Of this $22.1 million increase, a significant portion is in appropriated fund balance, which increased by $13.5 million, or 135 percent. This results from the use of one-time capital funds to support operating costs ($7.3 million) and from the introduction of funding for capital projects in the FY2005 operating budget ($5.2 million). Other significant increases were in intergovernmental revenue, which grew 7 percent, or by $5.5 million, and in fare revenues, which grew by $4.9 million, or 4 percent. Intergovernmental revenue increased largely due to the agency’s decision to use additional capital funds for operating purposes in FY2005. Fare revenues increased as a result of the annualization of the fare increase implemented in FY2004. In addition, the General Fund contribution grew by $3.4 million, or 4 percent, in part due to tax measures on the November 2004 ballot which would generate additional discretionary revenue to the City. Offsetting these increases is a significant reduction to miscellaneous revenues, driven by reduced advertising revenues resulting from a re-bidding of the advertising contract. The new contract stipulates much lower revenue guarantees, reflecting the impact of the economic downturn on the advertising industry. Miscellaneous revenues were reduced by $6.9 million, or 60 percent. Restricted revenues grew compared to the FY2004 approved budget, as a result of funding for capital projects appropriated through the FY2005 operating budget. This accounted for an increase of $2 million, which was offset by the elimination of a $1 million transfer to Muni from the Department of Parking & Traffic. Total restricted revenues increased by $1.4 million, or five percent.

Appropriations Muni’s FY2005 approved appropriations are $486,617,590, an increase of $22,093,342, or 4.8 percent, compared to the FY2004 approved budget of $464,524,248. This increase reflects a $22 million increase, or 31 percent, to fringe benefits, driven largely by increases to retirement and health care costs. These are offset by a reduction in the number of budgeted positions in FY2005, which reduced the size of the fringe benefit increase and brought salary costs down. Salaries were reduced by $12.1 million compared to the FY2005 budget, reflecting both the reduction in budgeted positions and service adjustments contemplated for FY2005. Major increases to the FY2004 non-salary appropriations budget include a $5.6 million, or 934 percent, increase in capital projects and the introduction of a $2.6 million transfer out to the Department of Parking & Traffic. Funding for capital projects was appropriated from one-time sources in the FY2005 budget, and also led to an increase of $1 million in facilities maintenance (571 percent). In addition, the budget for the services of other departments increased by $1.8 million, or 8 percent, due to the passage of Proposition C, which requires that departments fund an audit function in the Controller’s Office. Increases were also seen in allocated charges, which increased by $1 million, or 14 percent, and non personal services, which increased by 1 percent or $0.9 million in order to fund increasing workers’ compensation costs. Capital outlay also increased by $0.6 million (48 percent), resulting from a reallocation from materials and supplies. Offsetting these increases was a $1.4 million, or 5 percent, decrease in materials and supplies funding, due to the reallocation of these funds to categories providing greater purchasing flexibility. Position Changes In the operating budget, the total number of positions decreased by 124.7, from 4,135.5 to 4,010.8. The decrease results from 92.7 position deletions due to workforce reductions and the deletion of 20 vacant positions. In addition, 12 operating positions were transferred into the grant-funded budget, further reducing the number of operating positions overall. It should be noted that, late in the budget development process, Muni was able to rescind a few layoffs. However, because of time constraints, those positions were not reintroduced into the FY2005 budget. The employees occupying those positions have been reassigned to other funded positions and the appropriate positions will be restored to the FY2006 budget. In addition, the grant-funded position count was reduced by 20.69 positions in FY2005, from 299.75 to 279.06. This is the result of 21.69 layoffs, the elimination of 11 vacant positions, and the net reassignment of 12 positions from the operating fund in FY2005.

REVENUES

FY03 FY04 FY05 Change fromActual Approved Approved FY04 Approved
Unrestricted RevenueFares $97,368,625 $117,053,755 $121,927,059 $4,873,304 Parking $113,094,363 $132,073,321 $132,349,556 $276,235 Local and Regional Taxes (Intergov'tal) $84,324,001 $76,018,844 $81,554,815 $5,535,971 Miscellaneous $12,744,761 $11,352,074 $4,492,154 ($6,859,920)General Fund Contribution $100,792,000 $95,414,850 $98,859,258 $3,444,408 Appropriated Fund Balance $3,898,644 $100,000 $13,620,000 $13,520,000 Interdepartmental Recoveries $764,732 $5,269,246 $5,173,734 ($95,512)
Total Unrestricted Revenue $412,987,126 $437,282,090 $457,976,576 $20,694,486
Restricted Revenue & Fund TransfersParatransit $15,162,483 $15,270,406 $15,543,328 $272,922 Special Revenue Funds $10,894,907 $10,979,752 $13,097,686 $2,117,934 Fund Transfers $0 $992,000 $0 ($992,000)
Total Restricted & Fund Transfers $26,057,390 $27,242,158 $28,641,014 $1,398,856
GROSS REVENUE $439,044,516 $464,524,248 $486,617,590 $22,093,342
MUNICIPAL TRANSPORTATION AGENCYSAN FRANCISCO MUNICIPAL RAILWAY
FY2005 Approved Revenues

BUDGET DETAIL: REVENUES What follows is a more detailed look at Muni’s budgeted revenues, with explanations for each major category and underlying assumptions. The baseline against which the FY2005 budget is being measured is the FY2004 approved budget. Further explanation and detail may be found in the following revenue tables. Fares Fare revenue increased by $4.9 million (4.2 percent) from $117.1 million to $121.9 million. The increase is due primarily to the annualization of the fare increase which went into effect in September 2003. The fare increase was in effect for ten months in FY2004, and is in effect for the full year in FY2005. This results in approximately $3.3 million in additional revenue. A Paratransit fare increase effective September 2004 contributes $0.2 million to the growth in revenues over FY2004. The Paratransit fare increase raises group van and lift van fares, providing greater equity in the Paratransit fare structure. In addition, some growth in baseline fare revenues is assumed, based on a slight improvement in the economy. Parking Revenue Parking revenue increased by $0.3 million, or 0.2 percent, from $132.1 million to $132.4 million. The increase derives from a small increase in parking garage revenues, offset by a slight decline in parking tax revenues. The changes to the budgeted amounts for garage and parking tax revenues bring both in line with FY2004 actual receipts and assume a small amount of growth over FY2004. FY2005 parking fine revenues remain at the FY2004 budgeted amount, which again assumes some growth over FY2004 actual receipts. Intergovernmental Revenue (Non-Paratransit) Intergovernmental revenue (non-Paratransit) increased by $5.5 million (7.3 percent) from $76 million to $81.6 million. This increase is due to a $5.9 million increase in Federal Transit Operating Assistance (also called 5307 funds) and a small increase in county sales tax, offset by reductions in state sales tax revenues. In FY2005 Muni increased its utilization of Federal Transit Operating Assistance, to $15.9 million in FY2005 from $10 million in FY2004. Under federal guidelines, a transit property may accept operating assistance for preventive maintenance, provided that the transit property identify an equivalent value in its capital program and agree to either fund that program through alternative sources or defer that program while 5307 funds are being used for preventive maintenance. The result is that an additional $5.9 million in capital projects will be deferred in FY2005. In addition, the increased FY2005 allocation of 5307 funds means a reduced allocation in FY2006, the last year of a three-year program in which federal funds were made available for operating purposes.

The increase in county sales tax in FY2005 is in anticipation of a slow Bay Area economic recovery. The Bay Area has lagged behind the rest of the state of California in terms of economic growth in the past few years. While San Francisco expects to see that growth in FY2005, the state has lowered its overall growth forecast, with state sales tax revenues falling compared to the FY2004 budget. Miscellaneous Revenue Miscellaneous revenue decreased by $6.9 million (60.4 percent), to $4.5 million. This is largely due to a $6.9 million reduction in transit advertising revenues resulting from a re-bidding of the transit advertising contract. As in prior years, FY2005 features a minimum annual guarantee in the transit advertising contract. However, the downturn in the economy has brought significantly lower advertising revenues, which in turn means lower contractually-obligated minimum annual guarantees. Slightly offsetting this reduction is an increase in property rental revenue in FY2005. FY2005 represents the first year in which Muni will receive lease payments into the operating fund from the agency’s joint development project at Mission/Steuart. These result in an additional $0.1 million in FY2005. General Fund Contribution The General Fund contribution increased by $3.4 million (3.6 percent), to $98.9 million. The increase assumes that Citywide revenue measures on the November ballot are approved by the voters. In addition, the increase results in part from the reversal of a one-time negative adjustment to the FY2004 General Fund contribution to account for the movement of the CalTrain Peninsula Joint Powers Board expense to Muni’s budget. Somewhat offsetting these increases is a reduction to City discretionary revenues resulting from the transfer to the State of certain local property tax revenues. As outlined in the City Charter, the General Fund transfer was adjusted by the percentage increase or decrease in aggregate City and County discretionary revenues. Appropriated Fund Balance Appropriated Fund Balance increased by 13,520 percent, from $0.1 million to $13.6 million. This is largely a result of the use of Breda lease/leaseback transaction revenues in the FY2005 budget. These revenues are budgeted as fund balance, and resulted from the leveraged lease of the Breda light rail vehicles. As one-time revenues, these funds are appropriately used to support one-time capital projects, and in FY2005, approximately $5.2 million in Breda fund balance is appropriated through the operating budget to fund capital projects. An additional $7.3 million in Breda funds are appropriated in FY2005 to cover ongoing operating expenses. These funds are to be repaid from operating funds over the subsequent seven fiscal years. Interdepartmental Recoveries Interdepartmental recovery revenue decreased by 1.8 percent, to $5.2 million from $5.3 million. This results from reduced recoveries from grants, driven in turn by lower FY2005 grant-funded expenditures, and from the elimination of funding from the Public

Utilities Commission for one-time staff work related to the preservation of historic photographs. Paratransit Revenue (Restricted) Paratransit revenue increased by 1.8%, to $15.5 million in FY2005. This is the result of a $0.2 million increase in Federal Transit Operating Assistance revenues and a $0.09 million increase in State Transit Assistance revenues. Transit Impact Development Fee (TIDF) (Restricted) TIDF revenues remained at $10.2 million in FY2005, as no changes to service impacting the TIDF formula are anticipated in FY2005. TIDF revenues fund incremental costs associated with the provision of peak-period service to a geographical area defined in the TIDF ordinance. Transit Shelter Program (Restricted) Transit shelter advertising revenues decreased by $18,000 (8.1 percent) in FY2005, due to a corresponding reduction in program costs. Capital Reserve Fund (Restricted) Capital Reserve Fund revenues were eliminated in FY2005. In FY2004, $0.6 million was appropriated from the Capital Reserve Fund to support the Vehicle Scheduling System. These funds were used in FY2002 and unanticipated savings in the fund allowed for their use again in FY2004. No projects are anticipated to be funded from this source in FY2005. Capital Project Fund (Restricted) Capital Project Fund revenues are anticipated at $2.7 million in FY2005. No funds from this source were appropriated in the FY2004 budget. In FY2005, funding from the Mission/Steuart joint development project is appropriated as Capital Project Fund revenue. This funding is allocated to capital costs of the Mission/Steuart project. Fund Transfers In FY2004, $1 million was transferred from the Department of Parking and Traffic to Muni, in order to balance the Municipal Transportation Agency’s General Fund transfer. As this was a one-time arrangement, this revenue source was eliminated in the FY2005 budget.

FY03 FY04 FY05 Growth/ %Revenues and General Fund Support Actual Approved Approved (Decline) Change
Unrestricted Revenue
FARE REVENUEPassenger Fares $93,821,359 $113,531,671 $117,797,033 $4,265,362 3.76%
Paratransit Revenue $1,071,099 $1,283,634 $1,778,288 $494,654 38.54%
Paratransit revenues are those received from Paratransit users and are comprised of four categories: Lift Van, Group Van, ADA Access, and Taxi Service. Taxicab scrip is purchased by Paratransit users at a discounted price from Muni's Paratransit Broker. Paratransit revenues are projected to increase by 39% in FY05. A little more than half of this increase is due to annualization of the FY04 fare increase for Paratransit services provided by taxis, and to continued service demand increases. The remainder, approximately $220,000, results from an increase in the Lift Van and Group Van Paratransit fares, effective September 2004. The fare increase comes at the recommendation of the Paratransit Coordinating Council and is anticipated to provide greater equity within the Paratransit fare structure.
SAN FRANCISCO MUNICIPAL RAILWAY FY2005 Approved Revenues
Passenger fare revenues include all passenger fares, proof-of-payment fines, and revenues from special service. Revenues received from passengers include cash fares, adult fast passes, senior, youth, and disabled discount passes, weekly passes, passports, BART/Muni transfers, tokens, and the Class Pass program.
Muni's passenger fare revenue has been affected by the continuing economic downturn, with FY03 revenues coming in 3.9% below the FY03 budget and 0.6% below FY02 actuals. However, in FY04, actual passenger fares received were only 1.5% below the FY04 budget, an increase of 19.2% over FY03 actuals. Contributing to this increase in fare revenues is the fare increase Muni implemented in FY04, which took effect in September 2003 and was anticipated to generate approximately $15 million in additional revenues. In FY05, base fare revenue is projected to be 2.6 percent above FY04 actuals. The budgeted amount also includes an increase of approximately $3 million above the FY04 budget amount to take into account a full year of the September 2003 fare increase.

FY03 FY04 FY05 Growth/ %Revenues and General Fund Support Actual Approved Approved (Decline) Change
SAN FRANCISCO MUNICIPAL RAILWAY FY2005 Approved Revenues
Unrestricted Revenue
Muni Feeder Service to BART Stations $2,476,167 $2,238,450 $2,351,738 $113,288 5.06%
Total Fare Revenue $97,368,625 $117,053,755 $121,927,059 $4,873,304 4.16%
PARKING REVENUE Parking Tax $19,810,040 $21,525,000 $21,420,000 ($105,000) -0.49%
Since 1986, BART has made annual payments to Muni to recognize the feeder service that Muni provides to BART stations. The original payment was determined by the Regional Financial Plan and is adjusted each year based on the percentage change in BART sales tax revenue. In FY04, Muni will receive $2,399,733 based on the reimbursement formula, a 3% reduction from the FY03 amount. The FY05 budget amount estimates a 2.0% decline in sales tax receipts to BART, driven by the prolonged economic downturn. Although the FY05 payment is projected to be 2% less than the FY04 actual, the budgeted amount is still higher than that in FY04.
Parking Tax revenue comes from a 25% tax on parking facilities, of which Muni receives 40% of the revenue generated, the General Fund receives 40% of the revenue generated, and a special senior citizens fund receives the remaining 20% of the revenue generated. In other words, Muni receives 10%, the General Fund receives 10%, and the special fund receives 5%. FY04 parking tax receipts have been impacted by the economic downturn and a corresponding decline in garage usage and shorter stays. While this has been offset somewhat by increased garage fees, actual revenues were 0.9% under budget in FY04. In FY05, parking tax revenues are assumed to remain at FY04 actual levels.

FY03 FY04 FY05 Growth/ %Revenues and General Fund Support Actual Approved Approved (Decline) Change
SAN FRANCISCO MUNICIPAL RAILWAY FY2005 Approved Revenues
Unrestricted Revenue
Traffic Fines - Parking $70,115,971 $85,648,147 $85,648,147 $0 0.00%
Parking Meter Collections $7,600,000 $7,600,000 $7,600,000 $0 0.00%
Parking Garages $15,568,352 $17,300,174 $17,681,409 $381,235 2.20%
Total Parking Revenue $113,094,363 $132,073,321 $132,349,556 $276,235 0.21%
Under a 1996 amendment to Section 213 of the San Francisco Traffic code, Muni receives the first $7,600,000 in revenues generated from parking meters. In FY04 and FY05, parking meter receipts are anticipated to exceed $7.6 million.
In accordance with Proposition M passed in 1993, Muni receives dedicated revenues from seven parking garages. In FY04, actual garage revenues were 4.5% above the FY04 budgeted amount, due to less-than-anticipated capital obligations at one garage. In FY05, after adjusting for the one-time benefit of the reduced capital obligation, garage revenues are anticipated to grow slightly over FY04 actuals.
Under Proposition M, passed in 1993, Muni receives dedicated revenue from parking citations, except for citations issued on Parks and Recreation and Port Authority properties. (Legislation from the Board of Supervisors allows these two departments to keep their parking fine revenue.) In FY04, parking fine revenues were anticipated to grow due to a series of fine and fee increases. The FY04 budget amount is $15.5 million or 22% above FY03 actuals. While significant growth has occurred, actual FY04 parking fine revenues were slightly under the budgeted amount. In FY05, parking fine revenues are projected to grow 1.5% from FY04 actuals.

FY03 FY04 FY05 Growth/ %Revenues and General Fund Support Actual Approved Approved (Decline) Change
SAN FRANCISCO MUNICIPAL RAILWAY FY2005 Approved Revenues
Unrestricted Revenue
INTERGOVERNMENTAL REVENUE (non-Paratransit)Federal Transit Operating Assistance $14,016,000 $10,000,000 $15,890,000 $5,890,000 58.90%
State Sales Tax (AB1107) $32,409,694 $28,253,812 $27,750,000 ($503,812) -1.78%
TDA Sales Tax - Operating $22,947,191 $25,330,399 $26,049,812 $719,413 2.84%
Assembly Bill 1107 funds are generated by a half-cent sales tax in San Francisco, Alameda and Contra Costa Counties. The tax is allocated within the region by the Metropolitan Transportation Commission (the regional funding agency that allocates sales tax, bridge toll, and other revenues among transit properties in the Bay Area) to BART, Muni and AC Transit. The allocation to Muni is based on Metropolitan Transportation Commission (MTC) estimates of sales tax receipts within the three counties. The FY05 projection assumes a small decrease in sales tax revenues in the three counties, driven primarily by continued economic weakness in the Bay Area.
TDA sales tax funding comes from the Transit Development Act (TDA) sales tax collected within San Francisco County (1/4 of 1% of the total 8.5% County Sales Tax, effective on January 1, 2002). The TDA revenue allocation is based on an estimate of sales tax revenues provided by the City Controller. In FY04, TDA revenues were slightly above FY04 budgeted levels. In FY05, TDA revenues are assumed at a little less than the FY04 projected actual amount, due to anticipated continued sales tax weakness in San Francisco.
Federal Transit Operating Assistance was first allocated to the FY03 budget under a program in which federal funds for capital projects are reprogrammed to preventive maintenance, an operating cost. This program has been proposed for continued use by all transit properties in the region in FY05. Muni's FY05 allocation to preventive maintenance under this program is $15,890,000. Muni's capital funding will be reduced correspondingly. In addition, funding for this item in FY06 will be reduced from $10,000,000 to $4,110,000.

FY03 FY04 FY05 Growth/ %Revenues and General Fund Support Actual Approved Approved (Decline) Change
SAN FRANCISCO MUNICIPAL RAILWAY FY2005 Approved Revenues
Unrestricted Revenue
State Transit Assistance - Operating $14,951,116 $12,434,633 $11,865,003 ($569,630) -4.58%
Total Intergovernmental Revenue $84,324,001 $76,018,844 $81,554,815 $5,535,971 7.28%
MISCELLANEOUS REVENUE Property Rentals $159,550 $63,154 $138,154 $75,000 118.76%
State Transit Assistance (STA) revenue-based operating assistance comes from a state sales tax on diesel fuel. The FY05 budgeted amount reflects the impact on sales taxes of the continued economic downturn, as well as fluctuations in the price of diesel fuel. In addition, FY05 represents the first year in the past few years of economic downturn in which additional funding from STA fund balance is not available.
Muni receives $40,000 annually in rent from the Cable Car Museum. In addition, Muni is projecting to receive $9,187 in rent from newspaper stands and $13,967 from telephone booths on Muni property in FY05. The increase in this item of $75,000 in FY05 represents revenue from the Mission/Steuart joint development project. Towards the end of FY05, the development project will begin monthly lease payments to Muni's operating fund. The first year is anticipated to bring in $300,000 in total lease payments. However, the lease year and the fiscal year are on different cycles; thus, the FY05 anticipated amount is $75,000.

FY03 FY04 FY05 Growth/ %Revenues and General Fund Support Actual Approved Approved (Decline) Change
SAN FRANCISCO MUNICIPAL RAILWAY FY2005 Approved Revenues
Unrestricted Revenue
Transit Advertising $10,393,562 $11,268,920 $4,334,000 ($6,934,920) -61.54%
Gain on Sale of Building & Structures $624,658 $0 $0 $0 0.00%
Miscellaneous Transit Operating Revenues $1,566,991 $20,000 $20,000 $0 0.00%
Total Miscellaneous Revenues $12,744,761 $11,352,074 $4,492,154 ($6,859,920) -60.43%
Under its contract with Viacom, Muni receives a minimum annual guarantee (MAG) for vehicle advertising and may receive additional revenues based on actual billings and a Consumer Price Index (CPI) increase. The advertising contract expired in FY04 and Muni rebid the contract. The FY05 amount reflects a significantly reduced MAG, which in turn results from the economy's impact on the advertising industry. In addition, Muni receives a share of revenue from poster advertising in the subway stations shared with BART, which has a contract with Viacom for poster advertising in all BART stations. The FY05 estimate for advertising revenue from joint BART-Muni stations is held at the FY04 budgeted level of $374,000.
Muni received revenues from the sale of its Turk Street property in FY03. As this was a one-time revenue, this item was eliminated in FY04.
Miscellaneous Transit Operating Revenues consist of a variety of small revenue sources. In FY03, revenues in this category were adjusted for a one-time recognition of token revenues held in reserve. The FY05 projection is based on anticipated FY04 actual receipts.

FY03 FY04 FY05 Growth/ %Revenues and General Fund Support Actual Approved Approved (Decline) Change
SAN FRANCISCO MUNICIPAL RAILWAY FY2005 Approved Revenues
Unrestricted Revenue
GENERAL FUND SUPPORTGeneral Fund $100,792,000 $95,414,850 $98,859,258 $3,444,408 3.61%
APPROPRIATED FUND BALANCEAppropriated Fund Balance, Operating Fund $3,898,644 $100,000 $1,100,000 $1,000,000 1000.00%
Appropriated Fund Balance is derived from funds available at the end of prior fiscal years. With the Controller's approval, departments may appropriate remaining funds as a revenue source in future fiscal years. Muni appropriated $0.1 million in fund balance in FY04. Muni's recent expenditure reduction strategies have resulted in sufficient fund balance to allow for a $1.1m allocation in FY05.
The General Fund contribution is the City's contribution to Muni operations from general City revenues. Under Proposition E passed in 1999, the General Fund transfer to Muni is based upon a formula. A base year amount was established which is then adjusted every fiscal year after FY01 by the percentage increase or decrease in aggregate City and County discretionary revenues. While the City is projecting declining discretionary revenues in FY05, Muni's General Fund transfer is anticipated to increase in FY05 to reverse a one-time negative adjustment to the FY04 transfer amount to account for the movement of the CalTrain Peninsula Corridor Joint Powers Board (JPB) expense to Muni's budget. Somewhat offsetting that increase is a projected decrease to the General Fund transfer as a result of changes to the State budget. The transfer to the State of approximately $55 million in local property tax revenues decreases the City's discretionary revenues, which in turn impacts Muni's General Fund transfer.

FY03 FY04 FY05 Growth/ %Revenues and General Fund Support Actual Approved Approved (Decline) Change
SAN FRANCISCO MUNICIPAL RAILWAY FY2005 Approved Revenues
Appropriated Fund Balance, Breda Lease/Leaseback Fund $0 $0 $12,520,000 $12,520,000 -
Total Appropriated Fund Balance $3,898,644 $100,000 $13,620,000 $13,520,000 13520.00%
INTERDEPARTMENTAL RECOVERIESRecovery from Grants unavailable $4,511,427 $4,465,915 ($45,512) -1.01%
In FY03 and FY04, Muni completed two lease/leaseback transactions pertaining to the Breda Light Rail Vehicles (LRVs). These transactions transferred the asset depreciation value of the LRVs to a private entity. In exchange, the lessors paid Muni approximately $40.2 million. These funds were then placed in a restricted Lease/Leaseback Project Fund and are primarily committed to fund capital projects and other one-time items, and $5.2 million in funding for capital projects is appropriated from this source in FY05. In addition, $7.3 million of these funds are appropriated into the operating budget in FY05 as a means to balance Muni's FY05 budget. These funds are anticipated to be restored to the Lease/Leaseback Project Fund over the course of the next few years.
In order to provide appropriation authority, non-salary costs not associated with a specific capital project but funded through grants are budgeted in Muni's annual operating budget. The revenues comprising Recovery from Grants are the federal, state and/or local grant funds used to support these non-salary costs. In FY05, grant-funded non-salary costs are anticipated to decrease slightly, resulting in a corresponding decrease in Recovery from Grants revenues.

FY03 FY04 FY05 Growth/ %Revenues and General Fund Support Actual Approved Approved (Decline) Change
SAN FRANCISCO MUNICIPAL RAILWAY FY2005 Approved Revenues
Unrestricted Revenue
Recovery from Adult and Aging Services $673,042 $707,819 $707,819 $0 0.00%
Recovery from Other Departments $91,690 $50,000 $0 ($50,000) -100.00%
Total Interdepartmental Recoveries $764,732 $5,269,246 $5,173,734 ($95,512) -1.81%
Total Unrestricted Operating Revenue $412,987,126 $437,282,090 $457,976,576 $20,694,486 4.73%
This item captures funds directed to Muni from other City agencies requesting services from Muni in a given fiscal year. In FY04, the Public Utilties Commission allocated $50,000 to Muni to fund Muni staff time directed towards archiving and preservation of historic photographs. This project is one-time in nature, and funding is eliminated in FY05.
The Department of Adult and Aging Services (AGE) provides Paratransit services to its clients through an agreement with Muni's Paratransit provider. The Recovery funds from AGE cover the full costs to Muni of providing this service. In FY05, the Department of Adult and Aging Services is projected to request the same service levels as those provided in FY04.

FY03 FY04 FY05 Growth/ %Revenues and General Fund Support Actual Approved Approved (Decline) Change
SAN FRANCISCO MUNICIPAL RAILWAY FY2005 Approved Revenues
Restricted Revenue and Fund TransfersOperating
PARATRANSIT REVENUEFederal Transit Operating Assistance (5307) $3,510,819 $3,581,036 $3,754,078 $173,042 4.83%
Sales Tax (SFCTA) Paratransit $9,661,000 $9,661,456 $9,670,000 $8,544 0.09%
BART ADA $1,282,498 $1,393,883 $1,395,643 $1,760 0.13%
State Transit Assistance - Paratransit $708,166 $634,031 $723,607 $89,576 14.13%
Total Restricted Paratransit Revenues $15,162,483 $15,270,406 $15,543,328 $272,922 1.79%
Total Restricted and Unrestricted Operating Revenue $428,149,609 $452,552,496 $473,519,904 $20,967,408 4.63%
State Transit Assistance - Population Based funding comes from state fuel taxes allocated to the Bay Area counties by the MTC for the provision of Paratransit services. The FY05 allocation is projected to increase slightly above FY04 levels due to higher than normal fuel prices.
Federal Transit Operating Assistance is allocated by the MTC. These funds were established by the 1999 Federal Transportation Equity Act.
In 2003, San Francisco voters approved Proposition K, which reauthorized a one-half cent sales tax within the City to fund transportation capital improvements and certain operating expenses, including Paratransit. The San Francisco County Transportation Authority (SFCTA) Board is comprised of the members of the San Francisco Board of Supervisors and approves all expenditures of Proposition K funds. FY05 SFCTA Paratransit revenues are anticipated to remain at FY04 levels.
BART reimburses Muni for Paratransit services Muni provides in the BART corridor. As determined under the Americans with Disabilities Act (ADA), BART's reimbursement to Muni is equal to 8.8% of actual Paratransit contract expenditures, less Paratransit fare revenues and state funding.

FY03 FY04 FY05 Growth/ %Revenues and General Fund Support Actual Approved Approved (Decline) Change
SAN FRANCISCO MUNICIPAL RAILWAY FY2005 Approved Revenues
Restricted Revenue and Fund TransfersSpecial Revenue Funds
TRANSIT IMPACT DEVELOPMENT FEE FUNDMiscellaneous Transit Operating Revenues $10,737,000 $10,160,399 $10,160,399 $0 0.00%
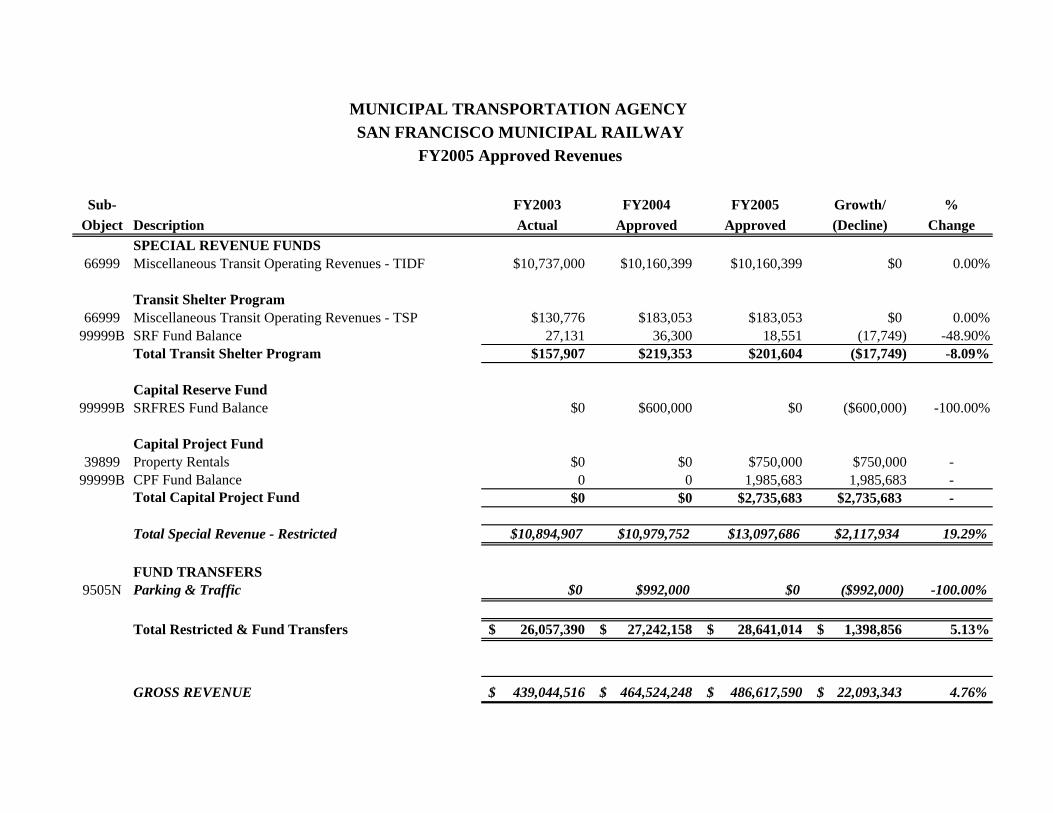
TRANSIT SHELTER PROGRAMMiscellaneous Transit Operating Revenues $130,776 $183,053 $183,053 $0 0.00%SRF Fund Balance $27,131 $36,300 $18,551 ($17,749) -48.90%Total Transit Shelter Program $157,907 $219,353 $201,604 ($17,749) -8.09%
CAPITAL RESERVE FUNDSRFRES Fund Balance $0 $600,000 $0 ($600,000) 100.00%
The 1981 TIDF Ordinance (San Francisco Administrative Code Chapter 38) authorizes Muni to collect impact fees from developers of new office space in an ordinance-defined geographical area incorporating the downtown, South of Market, and China Basin areas of San Francisco. The fee was established to pay for the incremental operating costs associated with additional peak-period service required by the new office occupation. The FY05 TIDF transfer is projected to remain at FY04 budget levels.
Under an agreement between the City and Viacom Outdoor, transit passenger shelters are constructed throughout the City. Viacom Outdoor pays the City a fee for each shelter (increased by a CPI-adjusted inflation factor) to administer the program. In FY05, the total cost of this program is anticipated to decrease. As a result, fund balance necessary to support program costs has also been decreased.
In 1983, a Capital Reserve Fund was established to fund Muni's capital programs. In FY04, revenue from this Fund was allocated to support the Vehicle Scheduling System. No projects are anticipated to be funded from this source in FY05.

FY03 FY04 FY05 Growth/ %Revenues and General Fund Support Actual Approved Approved (Decline) Change
SAN FRANCISCO MUNICIPAL RAILWAY FY2005 Approved Revenues
Restricted Revenue and Fund TransfersSpecial Revenue Funds
CAPITAL PROJECT FUNDSProperty Rentals $0 $0 $750,000 $750,000 -CPF Fund Balance $0 $0 $1,985,683 $1,985,683 -Total Capital Project Funds $0 $0 $2,735,683 $2,735,683 -
Total Special Revenue Funds, Restricted $10,894,907 $10,979,752 $13,097,686 $2,117,934 19.29%
Restricted Revenue and Fund TransfersFund Transfers
Parking & Traffic $0 $992,000 $0 ($992,000) 100.00%
Total Fund Transfers $0 $992,000 $0 ($992,000) -100.00%
GROSS REVENUE $439,044,516 $464,524,248 $486,617,590 $22,093,342 4.76%
In order to balance the total General Fund support to the Municipal Transportation Agency in FY04, a portion of the Department of Parking and Traffic's revenues were transferred to Muni. In FY05, the General Fund support is anticipated to be balanced through its departmental allocations.
Capital Project Funds include fund balance available in the Mission/Steuart development project, Disposition and Development Agreement fees paid under the Mission/Steuart project, and funds paid under a settlement agreement. These monies are allocated to capital projects in the FY05 budget.
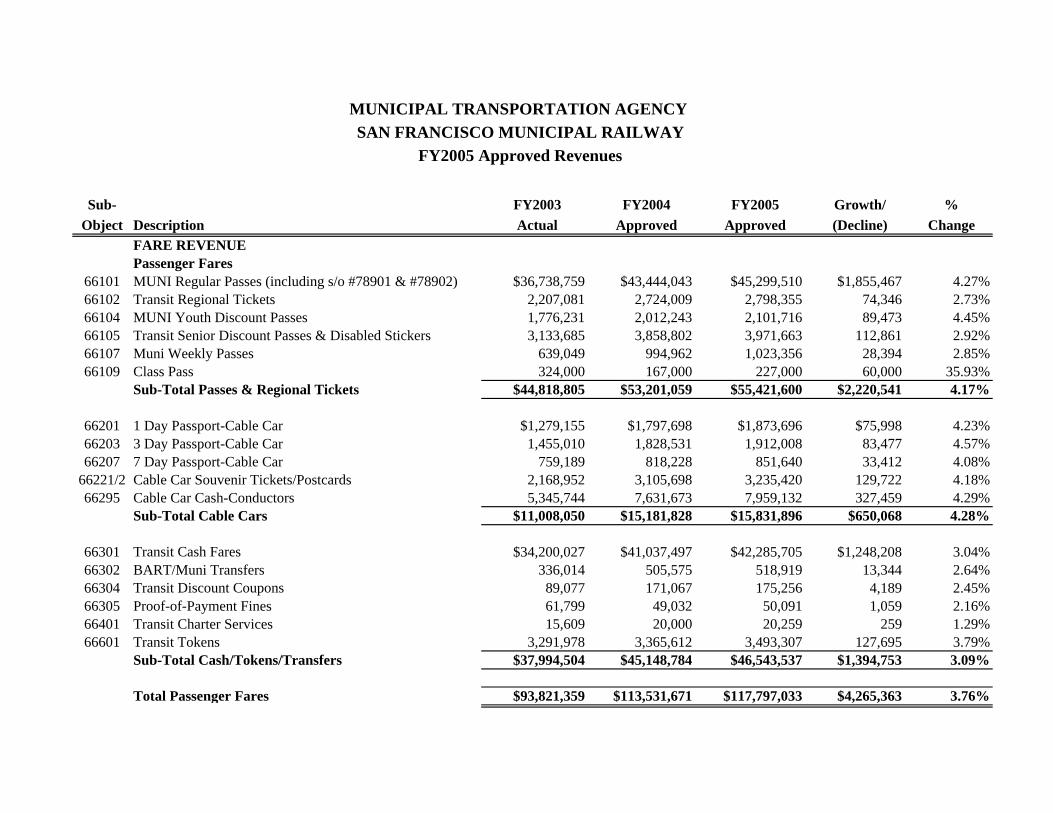
Sub- FY2003 FY2004 FY2005 Growth/ %Object Description Actual Approved Approved (Decline) Change
FARE REVENUEPassenger Fares
66101 MUNI Regular Passes (including s/o #78901 & #78902) $36,738,759 $43,444,043 $45,299,510 $1,855,467 4.27%66102 Transit Regional Tickets 2,207,081 2,724,009 2,798,355 74,346 2.73%66104 MUNI Youth Discount Passes 1,776,231 2,012,243 2,101,716 89,473 4.45%66105 Transit Senior Discount Passes & Disabled Stickers 3,133,685 3,858,802 3,971,663 112,861 2.92%66107 Muni Weekly Passes 639,049 994,962 1,023,356 28,394 2.85%66109 Class Pass 324,000 167,000 227,000 60,000 35.93%
Sub-Total Passes & Regional Tickets $44,818,805 $53,201,059 $55,421,600 $2,220,541 4.17%
66201 1 Day Passport-Cable Car $1,279,155 $1,797,698 $1,873,696 $75,998 4.23%66203 3 Day Passport-Cable Car 1,455,010 1,828,531 1,912,008 83,477 4.57%66207 7 Day Passport-Cable Car 759,189 818,228 851,640 33,412 4.08%
66221/2 Cable Car Souvenir Tickets/Postcards 2,168,952 3,105,698 3,235,420 129,722 4.18%66295 Cable Car Cash-Conductors 5,345,744 7,631,673 7,959,132 327,459 4.29%
Sub-Total Cable Cars $11,008,050 $15,181,828 $15,831,896 $650,068 4.28%
66301 Transit Cash Fares $34,200,027 $41,037,497 $42,285,705 $1,248,208 3.04%66302 BART/Muni Transfers 336,014 505,575 518,919 13,344 2.64%66304 Transit Discount Coupons 89,077 171,067 175,256 4,189 2.45%66305 Proof-of-Payment Fines 61,799 49,032 50,091 1,059 2.16%66401 Transit Charter Services 15,609 20,000 20,259 259 1.29%66601 Transit Tokens 3,291,978 3,365,612 3,493,307 127,695 3.79%
Sub-Total Cash/Tokens/Transfers $37,994,504 $45,148,784 $46,543,537 $1,394,753 3.09%
Total Passenger Fares $93,821,359 $113,531,671 $117,797,033 $4,265,363 3.76%
MUNICIPAL TRANSPORTATION AGENCY SAN FRANCISCO MUNICIPAL RAILWAY
FY2005 Approved Revenues

Sub- FY2003 FY2004 FY2005 Growth/ %Object Description Actual Approved Approved (Decline) Change
MUNICIPAL TRANSPORTATION AGENCY SAN FRANCISCO MUNICIPAL RAILWAY
FY2005 Approved Revenues
66701 Paratransit Revenues $1,071,099 $1,283,634 $1,778,288 $494,654 38.54%
66103 Muni Feeder Service to BART Stations $2,476,167 $2,238,450 $2,351,738 $113,288 5.06%
Total Fare Revenue $97,368,625 $117,053,755 $121,927,059 $4,873,305 4.16%
PARKING REVENUE12410 Parking Tax $19,810,040 $21,525,000 $21,420,000 ($105,000) -0.49%
25120 Traffic Fines-Parking $70,115,971 $85,648,147 $85,648,147 $0 0.00%
35110 Parking Meter Collections $7,600,000 $7,600,000 $7,600,000 $0 0.00%
Parking Garages35211 Golden Gateway Garage $3,461,256 $3,772,777 $3,500,000 ($272,777) -7.23%35213 Mission Bartlett Garage 72,694 70,681 80,000 9,319 13.18%35214 Moscone Center Garage 1,216,623 1,455,590 1,250,000 (205,590) -14.12%35223 Sutter-Stockton Garage Uptown 5,734,955 6,018,427 6,150,000 131,573 2.19%35241 Moscone Garage Commercial 93,280 90,588 76,409 (14,179) -15.65%35282 5th & Mission Garage 4,650,735 5,602,111 6,000,000 397,889 7.10%35283 Ellis-O'Farrell Garage 338,809 290,000 625,000 335,000 115.52%
Sub-Total Garage Revenue $15,568,352 $17,300,174 $17,681,409 $381,235 2.20%
Total Parking Revenue $113,094,363 $132,073,321 $132,349,556 $276,235 0.21%

Sub- FY2003 FY2004 FY2005 Growth/ %Object Description Actual Approved Approved (Decline) Change
MUNICIPAL TRANSPORTATION AGENCY SAN FRANCISCO MUNICIPAL RAILWAY
FY2005 Approved Revenues
INTERGOVERNMENTAL REVENUENon-Paratransit
41101 Federal Transit Operating Assistance (5307) $14,016,000 $10,000,000 $15,890,000 $5,890,000 58.90%47101 State Sales Tax (AB1107) 32,409,694 28,253,812 27,750,000 (503,812) -1.78%49101 TDA Sales Tax - Operating 22,947,191 25,330,399 26,049,812 719,413 2.84%49105 State Transit Assistance - Operating 14,951,116 12,434,633 11,865,003 (569,630) -4.58%
Total Intergovernmental Revenue $84,324,001 $76,018,844 $81,554,815 $5,535,971 7.28%
MISCELLANEOUS REVENUE39899 Property Rentals $159,550 $63,154 $138,154 $75,000 118.76%66501 Transit Advertising 10,393,562 11,268,920 4,334,000 (6,934,920) -61.54%76123 Gain on Sale of Buildings & Structures 624,658 0 0 0 0.00%66999 Miscellaneous Transit Operating Revenues 1,566,991 20,000 20,000 0 0.00%
Total Miscellaneous Revenue $12,744,761 $11,352,074 $4,492,154 ($6,859,920) -60.43%
GFS GENERAL FUND CONTRIBUTION $100,792,000 $95,414,850 $98,859,258 $3,444,408 3.61%
99999B APPROPRIATED FUND BALANCEFrom Operating Fund $3,898,644 $100,000 $1,100,000 $1,000,000 1000.00%From Breda Lease/Leaseback Fund 0 0 12,520,000 12,520,000 -
$3,898,644 $100,000 $13,620,000 $13,520,000 13520.00%

Sub- FY2003 FY2004 FY2005 Growth/ %Object Description Actual Approved Approved (Decline) Change
MUNICIPAL TRANSPORTATION AGENCY SAN FRANCISCO MUNICIPAL RAILWAY
FY2005 Approved Revenues
INTERDEPARTMENTAL RECOVERIES08799 Recovery from Grants $0 $4,511,427 $4,465,915 ($45,512) -1.01%08699 Recovery from Adult & Aging Services 673,042 707,819 707,819 0 0.00%086UC Recovery from Public Utilities Commission 91,690 50,000 0 (50,000) -100.00%
Total Interdepartmental Recoveries $764,732 $5,269,246 $5,173,734 ($95,512) -1.81%
Total Unrestricted Operating Revenue $412,987,126 $437,282,090 $457,976,576 $20,694,487 4.73%
PARATRANSIT41101 Federal Transit Operating Assistance (5307) $3,510,819 $3,581,036 $3,754,078 $173,042 4.83%49102 Sales Tax (SFCTA) Paratransit 9,661,000 9,661,456 9,670,000 8,544 0.09%49103 BART ADA 1,282,498 1,393,883 1,395,643 1,760 0.13%49106 State Transit Assistance - Paratransit 708,166 634,031 723,607 89,576 14.13%
Total Restricted Paratransit Revenue $15,162,483 $15,270,406 $15,543,328 $272,922 1.79%
Sub- FY2003 FY2004 FY2005 Growth/ %Object Description Actual Approved Approved (Decline) Change
MUNICIPAL TRANSPORTATION AGENCY SAN FRANCISCO MUNICIPAL RAILWAY
FY2005 Approved Revenues
SPECIAL REVENUE FUNDS66999 Miscellaneous Transit Operating Revenues - TIDF $10,737,000 $10,160,399 $10,160,399 $0 0.00%
Transit Shelter Program66999 Miscellaneous Transit Operating Revenues - TSP $130,776 $183,053 $183,053 $0 0.00%
99999B SRF Fund Balance 27,131 36,300 18,551 (17,749) -48.90%Total Transit Shelter Program $157,907 $219,353 $201,604 ($17,749) -8.09%
Capital Reserve Fund99999B SRFRES Fund Balance $0 $600,000 $0 ($600,000) -100.00%
Capital Project Fund39899 Property Rentals $0 $0 $750,000 $750,000 -
99999B CPF Fund Balance 0 0 1,985,683 1,985,683 -Total Capital Project Fund $0 $0 $2,735,683 $2,735,683 -
Total Special Revenue - Restricted $10,894,907 $10,979,752 $13,097,686 $2,117,934 19.29%
FUND TRANSFERS9505N Parking & Traffic $0 $992,000 $0 ($992,000) -100.00%
Total Restricted & Fund Transfers 26,057,390$ 27,242,158$ 28,641,014$ 1,398,856$ 5.13%
GROSS REVENUE 439,044,516$ 464,524,248$ 486,617,590$ 22,093,343$ 4.76%

City and County of San FranciscoBPREP Report: rev_dp
Revenues - Department Level
DPT MTA - MUNICIPAL RAILWAY:Department
Subobject TitleSub
Object
Budget Year 2004-2005
2004-2005 Board Adopted
Municipal Transportation Agency
MUNI-OPERATING-NON-PROJ-CONTROLLED FDSub-Fund : 5MAAAAAA
086AG EXP REC FR COMMISSION ON AGING (AAO) 707,81912410 PARKING TAX 21,420,00025120 TRAFFIC FINES - PARKING 85,648,14735110 PARKING METER COLLECTIONS 7,600,00035211 GOLDEN GATEWAY GARAGE 3,500,00035213 MISSION BARTLETT GARAGE 80,00035214 MOSCONE CENTER GARAGE 1,250,00035223 SUTTER-STOCKTON GARAGE-UPTOWN PKG. 6,150,00035241 MOSCONE GARAGE COMMERCIAL 76,40935282 5TH & MISSION GARAGE 6,000,00035283 ELLIS-O'FARRELL GARAGE 625,00039899 OTHER CITY PROPERTY RENTALS 138,15441101 TRANSIT OPERATING ASSISTANCE(FEDERAL) 19,644,07847101 STATE SALES TAX(AB1107) 27,750,00049101 TDA SALES TAX-OPERATING 26,049,81249102 SF TRANSPORTATION AUTHORITY 9,670,00049103 BART ADA 1,395,64349105 STA-OPERATING 11,865,00349106 STA-PARATRANSIT 723,60766101 MUNI REGULAR PASSES 45,299,51066102 TRANSIT REGIONAL TICKETS 2,798,35566103 MUNI FEEDER SERVICE TO BART STATIONS 2,351,73866104 MUNI DISCOUNT PASSES 2,101,71666105 TRANSIT SENIOR DISCOUNT PASS 3,971,66366107 MUNI WEEKLY PASSES 1,023,35666109 CLASS PASS 227,00066201 1 DAY PASSPORT-CABLE CAR 1,873,69666203 3 DAY PASSPORT-CABLE CAR 1,912,00866207 7 DAY PASSPORT-CABLE CAR 851,64066222 CABLE CAR SOUVENIR TICKETS 3,235,42066295 CABLE CAR CASH - CONDUCTORS 7,959,13266301 TRANSIT CASH FARES 42,285,70566302 BART/MUNI TRANSFERS 518,91966304 TRANSIT DISCOUNT COUPONS 175,25666305 PROOF OF PAYMENT FINES 50,09166401 TRANSIT CHARTER SERVICES 20,25966501 TRANSIT ADVERTISING 4,334,00066601 TRANSIT TOKENS 3,493,30766701 PARATRANSIT REVENUE 1,778,28866999 MISC TRANSIT OPERATING REVENUES 20,0009201G CTI FROM 1G-GENERAL FUND 98,859,25899999B FUND BALANCE BUDGET BASIS-BEGINNING 1,100,000
Subtotals 456,533,989Sub-Fund : 5MAAAAAA
City and County of San FranciscoBPREP Report: rev_dp
Revenues - Department Level
DPT MTA - MUNICIPAL RAILWAY:Department
Subobject TitleSub
Object
Budget Year 2004-2005
2004-2005 Board Adopted
Municipal Transportation Agency
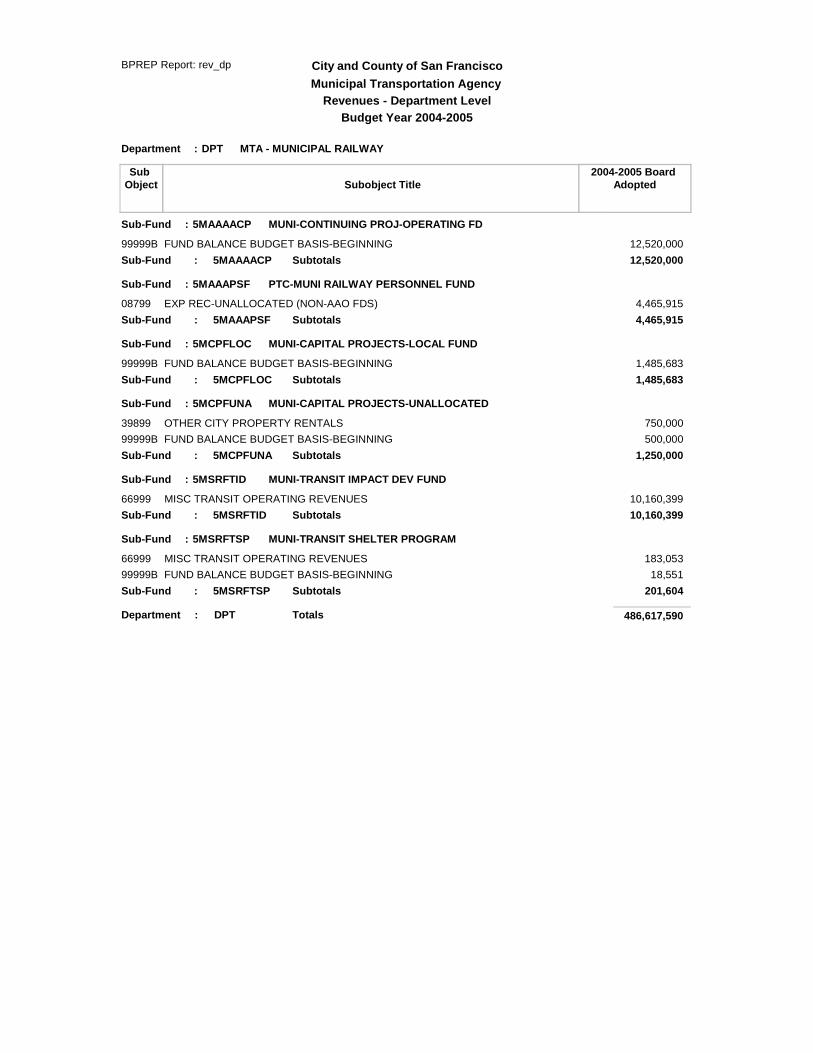
MUNI-CONTINUING PROJ-OPERATING FDSub-Fund : 5MAAAACP
99999B FUND BALANCE BUDGET BASIS-BEGINNING 12,520,000Subtotals 12,520,000Sub-Fund : 5MAAAACP
PTC-MUNI RAILWAY PERSONNEL FUNDSub-Fund : 5MAAAPSF
08799 EXP REC-UNALLOCATED (NON-AAO FDS) 4,465,915Subtotals 4,465,915Sub-Fund : 5MAAAPSF
MUNI-CAPITAL PROJECTS-LOCAL FUNDSub-Fund : 5MCPFLOC
99999B FUND BALANCE BUDGET BASIS-BEGINNING 1,485,683Subtotals 1,485,683Sub-Fund : 5MCPFLOC
MUNI-CAPITAL PROJECTS-UNALLOCATEDSub-Fund : 5MCPFUNA
39899 OTHER CITY PROPERTY RENTALS 750,00099999B FUND BALANCE BUDGET BASIS-BEGINNING 500,000
Subtotals 1,250,000Sub-Fund : 5MCPFUNA
MUNI-TRANSIT IMPACT DEV FUNDSub-Fund : 5MSRFTID
66999 MISC TRANSIT OPERATING REVENUES 10,160,399Subtotals 10,160,399Sub-Fund : 5MSRFTID
MUNI-TRANSIT SHELTER PROGRAMSub-Fund : 5MSRFTSP
66999 MISC TRANSIT OPERATING REVENUES 183,05399999B FUND BALANCE BUDGET BASIS-BEGINNING 18,551
Subtotals 201,604Sub-Fund : 5MSRFTSP
486,617,590DPTDepartment : Totals

APPROPRIATIONS

Object Title
City and County of San FranciscoBPREP Report:rpt_exp_spl
Major Expenditure Categories Change From Prior Year
DPT MTA - MUNICIPAL RAILWAYDepartment
Object
Budget Year 2004-2005
Municipal Transportation Agency
:
2004-2005 Board Adopted
2003-2004 Board Adopted
FY 2005 Adopted Increase (Decrease) over
FY2004 Adopted
SALARIESCharacter : 001
PERMANENT SALARIES-MISC001 113,661,317 (6,792,521)120,453,838 -5.6%PERMANENT SALARIES-PLATFORM003 122,065,824 (5,084,491)127,150,315 -4.0%TEMP SALARIES-MISC005 1,138,299 (166,288)1,304,587 -12.7%PREMIUM PAY009 5,489,310 4,9715,484,339 0.1%ONE-TIME SALARY PAYMENTS010 2,077,000 (179,877)2,256,877 -8.0%OVERTIME011 2,159,119 (11,569)2,170,688 -0.5%HOLIDAY PAY012 2,498,706 177,6202,321,086 7.7%
001Character : Subtotals 249,089,575 (12,052,155)261,141,730 -4.6%
MANDATORY FRINGE BENEFITSCharacter : 013
RETIREMENT013 18,853,571 11,902,1886,951,383 171.2%SOCIAL SECURITY014 18,868,668 (980,779)19,849,447 -4.9%HEALTH SERVICE015 43,690,025 4,594,28139,095,744 11.8%DENTAL COVERAGE016 5,150,310 392,1174,758,193 8.2%UNEMPLOYMENT INSURANCE017 546,161 546,1610 0.0%OTHER FRINGE BENEFITS019 6,255,820 5,522,547733,273 753.1%
013Character : Subtotals 93,364,555 21,976,51571,388,040 30.8%
NON PERSONAL SERVICESCharacter : 021
TRAVEL021 69,000 (412)69,412 -0.6%TRAINING022 883,811 (135,170)1,018,981 -13.3%EMPLOYEE FIELD EXPENSE023 8,657 (68)8,725 -0.8%MEMBERSHIP FEES024 63,250 063,250 0.0%PROFESSIONAL & SPECIALIZED SERVIC027 5,551,825 551,5235,000,302 11.0%MAINTENANCE SVCS-BUILDING & STRU028 2,882,090 250,0002,632,090 9.5%MAINTENANCE SVCS-EQUIPMENT029 2,722,926 107,3802,615,546 4.1%RENTS & LEASES-BUILDINGS & STRUCT030 4,337,337 (65,607)4,402,944 -1.5%RENTS & LEASES-EQUIPMENT031 1,483,792 (93,870)1,577,662 -5.9%SUBSISTANCE034 1,590 01,590 0.0%OTHER CURRENT EXPENSES035 22,855,121 (827,534)23,682,655 -3.5%INSURANCE051 20,500,000 1,887,31818,612,682 10.1%TAXES, LICENSES & PERMITS052 16,008,073 (1,635,572)17,643,645 -9.3%JUDGEMENTS & CLAIMS053 7,486,988 890,0006,596,988 13.5%OTHER FIXED CHARGES054 6,000 (14,600)20,600 -70.9%
021Character : Subtotals 84,860,460 913,38883,947,072 1.1%
MATERIALS & SUPPLIESCharacter : 040
BUILDING & CONSTRUCTION SUPPLIES042 1,647,156 225,0001,422,156 15.8%EQUIPMENT MAINTENANCE SUPPLIES043 17,250,234 (1,390,360)18,640,594 -7.5%SAFETY045 1,135,756 01,135,756 0.0%FOOD046 8,000 8,0000 0.0%FUELS AND LUBRICANTS047 6,492,670 (278,081)6,770,751 -4.1%OTHER MATERIALS & SUPPLIES049 2,446,606 (44,473)2,491,079 -1.8%SMALL EQUIPMENT ITEMS04A 132,500 70,00062,500 112.0%
040Character : Subtotals 29,112,922 (1,409,914)30,522,836 -4.6%

Object Title
City and County of San FranciscoBPREP Report:rpt_exp_spl
Major Expenditure Categories Change From Prior Year
DPT MTA - MUNICIPAL RAILWAYDepartment
Object
Budget Year 2004-2005
Municipal Transportation Agency
:
2004-2005 Board Adopted
2003-2004 Board Adopted
FY 2005 Adopted Increase (Decrease) over
FY2004 Adopted
CAPITAL OUTLAYCharacter : 060
EQUIPMENT PURCHASE060 1,703,361 690,0001,013,361 68.1%EQT LEASE/PURCH - RENEWAL062 175,000 25,000150,000 16.7%EQT LEASE/PURCH - FIN AGY RENEWAL064 81,164 (80,427)161,591 -49.8%
060Character : Subtotals 1,959,525 634,5731,324,952 47.9%
CAPITAL PROJECTS (CIP)Character : 067
BLDS,STRUCTURES & IMPROVEMENTS067 6,205,683 5,605,683600,000 934.3%067Character : Subtotals 6,205,683 5,605,683600,000 934.3%
FACILITIES MAINTENANCECharacter : 06F
FACILITIES MAINTENANCE PROJECTS-B06F 1,175,000 1,000,000175,000 571.4%06FCharacter : Subtotals 1,175,000 1,000,000175,000 571.4%
ALLOCATED CHARGESCharacter : 079
ALLOCATED CHARGES079 (6,175,798) 1,036,908(7,212,706) -14.4%079Character : Subtotals (6,175,798) 1,036,908(7,212,706) -14.4%
SERVICES OF OTHER DEPTS (AAO FUNDCharacter : 081
SERVICES OF OTHER DEPTS (AAO FUN081 24,437,622 1,800,29822,637,324 8.0%081Character : Subtotals 24,437,622 1,800,29822,637,324 8.0%
OPERATING TRANSFERS OUTCharacter : 091
OTHER OPERATING TRANSFERS OUT093 2,588,046 2,588,0460 0.0%091Character : Subtotals 2,588,046 2,588,0460 0.0%DPT Totals:Department 486,617,590 22,093,342464,524,248 4.8%

BUDGET DETAIL: APPROPRIATIONS What follows is a more detailed look at Muni’s budgeted expenditures, with explanations for each major category and underlying assumptions. The baseline against which the FY2005 budget is being measured is the FY2004 budget. More detailed figures may be found in the division level reports. Miscellaneous Salaries Miscellaneous salaries, which includes all salary expenses except for platform salaries, decreased by $7 million (5 percent), from $134 million to $127 million. This decrease is primarily the result of savings associated with the deletion of 112.7 FTE due to workforce reductions. Contributing to the decrease are reductions to overtime and temporary salaries funding, as well as a decline in funding for employee incentive payments in FY2005. Somewhat offsetting these decreases are adjustments to account for standard employee wage progression, the cost of some position substitutions, and an increase in Holiday Pay costs in FY2005. Platform Salaries Platform salaries decreased by $5.1 million (4.0 percent), from $127.2 million to $122.1 million. The decrease represents savings derived from service adjustments and run-cutting efficiencies. Somewhat offsetting these savings is the cost of wage increases that took effect in FY2004. Mandatory Fringe Benefits Mandatory fringe benefits increased by $22 million (30.8 percent), from $71.4 million to $93.4 million, due to continued significant increases in health care costs for active and retired employees and their dependents, and to new retirement costs. For the first time since 1997, the City is required to provide an employer contribution to the retirement fund in FY2005, equal to 4.5 percent of payroll, to keep the fund in balance. In addition, in FY2005 Muni is required to fund the 7.5 percent employee contribution to retirement for both the transit operators and employees in the Transport Workers’ Union Local 200. In FY2004, Muni only funded the retirement costs for transit operators. Also contributing to the increase in mandatory fringe benefits is the reallocation of funding for the Operator Trust Fund from non personal services to this line item. Somewhat offsetting these increases are savings associated with workforce reductions and decreased platform salary costs. Non Personal Services Non personal services increased by $0.9 million (1.0 percent), from $84 million to $84.9 million. The majority of the increase is due to large cost increases in workers’ compensation, with costs increasing by $2.3 million. In addition, the non personal services increase incorporates growth in Fast Pass use on BART costs, as well as additional funding for claims and judgments. Together, these items account for $1.5 million of the total increase. Significantly offsetting these increases is the reallocation of funding for the Operator Trust Fund from non personal services to mandatory fringe

benefits, a reduction in funding for the CalTrain Peninsula Joint Powers Board, and a number of expenditure reductions resulting from Muni’s cost containment strategy. Materials and Supplies Materials and supplies decreased by $1.4 million (4.6 percent), from $30.5 million to $29.1 million. The decrease is due primarily to reallocating funds to various other categories, such as capital outlay for the purchase of vehicles, the work order with Central Shops for fueling services and the training line item for Maintenance Training programs. In addition, funding for fuel was reduced in conjunction with service reductions planned for FY2005. Capital Outlay Capital outlay increased by 47.9 percent, from $1.3 million to $2 million, due to the transfer of $1 million from materials and supplies to the capital outlay category to fund vehicle purchase. This increase was offset by a reduction in funding allocated for the Muni-wide server replacement program, and reduced costs for Muni’s debt service. Capital Projects Funding for capital projects increased by 934 percent from $0.6 million to $6.2 million in FY2005. The increase reflects the introduction of capital project funding into the operating budget. Capital funds from the Breda leveraged lease transaction and from the Mission/Steuart hotel project were appropriated in the FY2005 budget and were allocated to specific projects. This funding was offset by the elimination of funding for the Scheduling System. Facilities Maintenance Facilities Maintenance increased by $1 million, or 571 percent. As with the capital projects category, capital funds were appropriated in the FY2005 budget and allocated to facilities maintenance. In addition, funding for ongoing facilities and track roadbed maintenance costs that are not eligible for grant funding continues at FY2004 levels. Allocated Charges Allocated charges, which represents cost recoveries, decreased by $1.0 million (14.4 percent), from $7.2 million to $6.2 million, primarily due to changes in the recovery ratio for grant overhead. Additionally contributing to the decrease is the expiration of a grant that had supported Muni service to Treasure Island in prior years. Services of Other Departments Services of other departments increased by $1.8 million (8 percent) from $22.6 million to $24.4 million. A large part of this increase is due to the passage of Proposition C in November 2003. The Proposition established the Controller’s Office as the City Services Auditor and requires that each department allocate 0.2 percent of its budget to fund this function. For Muni, this item costs almost $1.0 million in operating funds in FY2005. Additional cost increases include telecommunications, natural gas, legal fees, rent, and social services, totaling approximately $1.0 million. These are offset by projected

decreases to Muni’s work orders with the Police Department, the Department of Human Resources, and the Public Utilities Commission. Operating Transfers Out This line item reflects a transfer from Muni to the Department of Parking and Traffic of $2.6 million. This item is new in FY2005 and is intended to appropriately balance the General Fund allocation to the Municipal Transportation Agency.

Subobject Title
City and County of San FranciscoBPREP Report:rpt_exp_dp_subobj
Department Appropriation
Subobject
Budget Year 2004-2005
Municipal Transportation Agency
DPT MTA - MUNICIPAL RAILWAYDepartment :
2004-2005 Board Adopted
MUNI-OPERATING-NON-PROJ-CONTROLLED FD
001 SALARIESCharacter :MISC-REGULAR00101 113,455,531PLATFORM-REGULAR00301 103,722,527PLATFORM-ONE TIME PAYMENTS00308 874,750PLATFORM-PREMIUM PAY00309 3,558,362PLATFORM-UNSCHEDULED OVERTIME00311 1,000,000PLATFORM-SCHEDULED OVERTIME00313 12,910,185TEMP-REGULAR-MISC00501 1,131,369PREMIUM PAY - MISC00901 5,489,310INCENTIVE PAY - MISC01005 1,412,000RET PAYOFF-SP & VAC-MISC01021 665,000OVERTIME - MISC01101 2,159,119HOLIDAY PAY - MISC01201 2,498,706
TOTAL SALARIES 248,876,859
013 MANDATORY FRINGE BENEFITSCharacter :RETIRE CITY MISC01301 9,691,674RETIREMENT PICK UP01371 9,152,678SOCIAL SECURITY (OASDI)01401 15,256,094SOCIAL SECURITY - MEDICARE (HI ONLY)01402 3,596,467HEALTH SERVICE - BUDGET01500 2,265,788HEALTH SERVICE-CITY MATCH01501 14,764,485HEALTH SERVICE-ADMIN COST01551 698,060HEALTH SERVICE-SUBSIDY01561 13,681,723DEPENDENT COVERAGE-MISCELLANEOUS01571 12,263,664DENTAL COVERAGE - BUDGET01600 506,728DENTAL COVERAGE01601 4,640,567UNEMPLOYMENT INSURANCE01701 545,694FRINGE ADJUSTMENTS-BUDGET01901 5,877,349FLEXIBLE BENEFIT PACKAGE01911 131,227LONG TERM DISABILITY INSURANCE01912 245,433
TOTAL MANDATORY FRINGE BENEFITS 93,317,631
021 NON PERSONAL SERVICESCharacter :TRAVEL COSTS PAID TO EMPLOYEES02101 20,500TRAINING - BUDGET02200 35,000TRAINING COSTS PAID TO EMPLOYEES02201 469,731TRAINING COSTS PAID TO VENDORS02202 197,530AUTO MILEAGE02301 217LOCAL FIELD EXP02302 3,440MEMBERSHIP FEES02401 63,250PROFESSIONAL & SPECIALIZED SVCS-BUDGET02700 134,000ENGINEERING SERVICES02702 50,000TRANSPORTATION SERVICES02703 178,893AUDITING & ACCOUNTING02721 286,440

Subobject Title
City and County of San FranciscoBPREP Report:rpt_exp_dp_subobj
Department Appropriation
Subobject
Budget Year 2004-2005
Municipal Transportation Agency
DPT MTA - MUNICIPAL RAILWAYDepartment :
2004-2005 Board Adopted
MUNI-OPERATING-NON-PROJ-CONTROLLED FD
021 NON PERSONAL SERVICESCharacter :LEGAL SERVICES02731 25,000SYSTEMS CONSULTING SERVICES02761 355,000OTHER MEDICAL SERVICES02789 222,000OTHER PROFESSIONAL SERVICES02799 3,999,500PEST CONTROL02803 25,600SECURITY02811 1,922,401OTHER BLDG MAINT SVCS02899 934,089MAINT SVCS-EQUIPMENT-BUDGET02900 192,500DP/WP EQUIPMENT MAINT02911 176,060VEHICLE MAINT (NON CENTRAL SHOPS)02921 1,080,399OFFICE EQUIP MAINT02931 13,779OTHER EQUIP MAINT02999 1,235,188PROPERTY RENT03011 1,914,472GARAGE RENT03021 11,160MISCELLANEOUS FACILITIES RENTAL03031 500TIRE RENT03122 1,216,992OFFICE MACHINE RENTAL03131 1,206OTHER EQUIPMENT RENTALS03199 254,594SUBSISTANCE-PERSONS03411 1,590OTHER CURRENT EXPENSES - BUDGET03500 437,848CLEANING LAUNDRY03511 235,125FREIGHT/DELIVERY03521 10,245GRAPHICS03531 2,584COURT REPORTER TRANSCRIPTS SERVICES03542 2,500COPY MACHINE03551 186,830PRINTING03552 78,963POSTAGE03561 7,750SUBSCRIPTIONS03571 14,836ADVERTISING03581 7,500PARATRANSIT CONTRACT EXPENSE03591 20,073,976SOFTWARE LICENSING FEES03596 650,075OTHER CURRENT EXPENSES03599 220,904WORKERS COMP EXPENSE05110 20,373,444INSURANCE EXPENSE05111 126,556TAXES05211 55,000FEES LICENSES PERMITS05221 173,350PAYMENTS TO OTHER GOVT05241 15,774,723JUDGEMENTS - CLAIMS05311 7,486,988OTHER FIXED CHARGES-BUDGET05400 6,000
TOTAL NON PERSONAL SERVICES 80,946,228
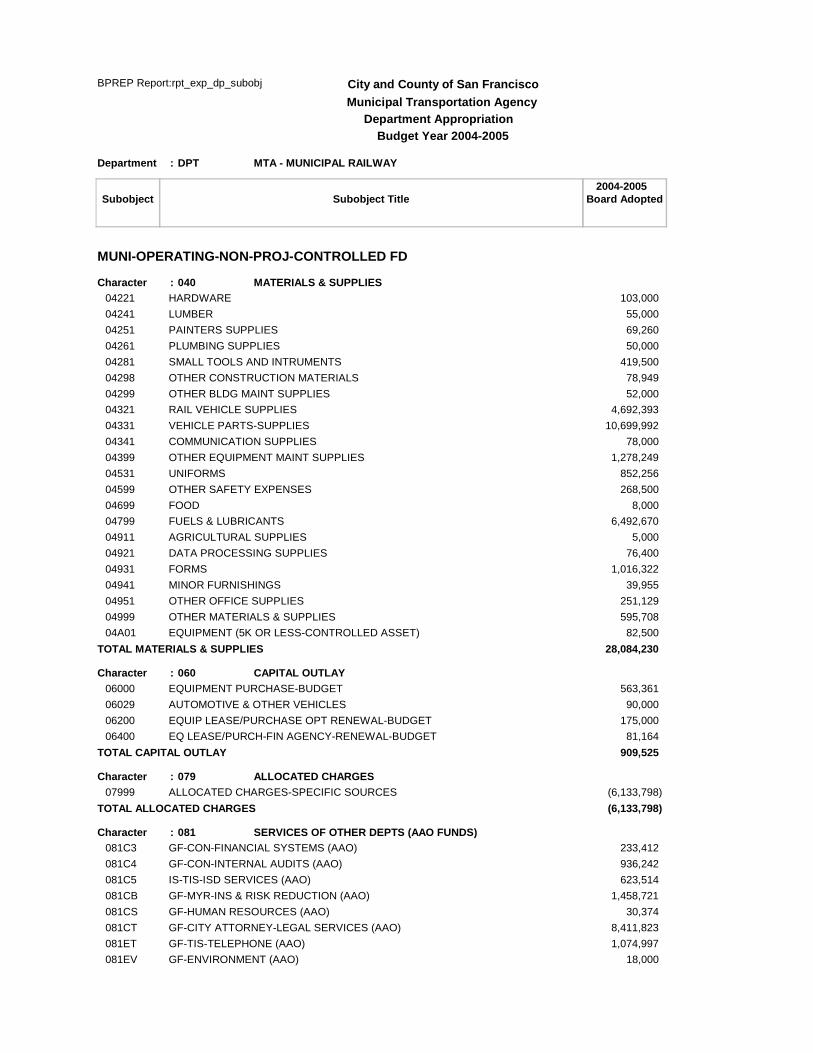
040 MATERIALS & SUPPLIESCharacter :ELECTRICAL04211 819,447
Subobject Title
City and County of San FranciscoBPREP Report:rpt_exp_dp_subobj
Department Appropriation
Subobject
Budget Year 2004-2005
Municipal Transportation Agency
DPT MTA - MUNICIPAL RAILWAYDepartment :
2004-2005 Board Adopted
MUNI-OPERATING-NON-PROJ-CONTROLLED FD
040 MATERIALS & SUPPLIESCharacter :HARDWARE04221 103,000LUMBER04241 55,000PAINTERS SUPPLIES04251 69,260PLUMBING SUPPLIES04261 50,000SMALL TOOLS AND INTRUMENTS04281 419,500OTHER CONSTRUCTION MATERIALS04298 78,949OTHER BLDG MAINT SUPPLIES04299 52,000RAIL VEHICLE SUPPLIES04321 4,692,393VEHICLE PARTS-SUPPLIES04331 10,699,992COMMUNICATION SUPPLIES04341 78,000OTHER EQUIPMENT MAINT SUPPLIES04399 1,278,249UNIFORMS04531 852,256OTHER SAFETY EXPENSES04599 268,500FOOD04699 8,000FUELS & LUBRICANTS04799 6,492,670AGRICULTURAL SUPPLIES04911 5,000DATA PROCESSING SUPPLIES04921 76,400FORMS04931 1,016,322MINOR FURNISHINGS04941 39,955OTHER OFFICE SUPPLIES04951 251,129OTHER MATERIALS & SUPPLIES04999 595,708EQUIPMENT (5K OR LESS-CONTROLLED ASSET)04A01 82,500
TOTAL MATERIALS & SUPPLIES 28,084,230
060 CAPITAL OUTLAYCharacter :EQUIPMENT PURCHASE-BUDGET06000 563,361AUTOMOTIVE & OTHER VEHICLES06029 90,000EQUIP LEASE/PURCHASE OPT RENEWAL-BUDGET06200 175,000EQ LEASE/PURCH-FIN AGENCY-RENEWAL-BUDGET06400 81,164
TOTAL CAPITAL OUTLAY 909,525
079 ALLOCATED CHARGESCharacter :ALLOCATED CHARGES-SPECIFIC SOURCES07999 (6,133,798)
TOTAL ALLOCATED CHARGES (6,133,798)
081 SERVICES OF OTHER DEPTS (AAO FUNDS)Character :GF-CON-FINANCIAL SYSTEMS (AAO)081C3 233,412GF-CON-INTERNAL AUDITS (AAO)081C4 936,242IS-TIS-ISD SERVICES (AAO)081C5 623,514GF-MYR-INS & RISK REDUCTION (AAO)081CB 1,458,721GF-HUMAN RESOURCES (AAO)081CS 30,374GF-CITY ATTORNEY-LEGAL SERVICES (AAO)081CT 8,411,823GF-TIS-TELEPHONE (AAO)081ET 1,074,997GF-ENVIRONMENT (AAO)081EV 18,000
Subobject Title
City and County of San FranciscoBPREP Report:rpt_exp_dp_subobj
Department Appropriation
Subobject
Budget Year 2004-2005
Municipal Transportation Agency
DPT MTA - MUNICIPAL RAILWAYDepartment :
2004-2005 Board Adopted
MUNI-OPERATING-NON-PROJ-CONTROLLED FD
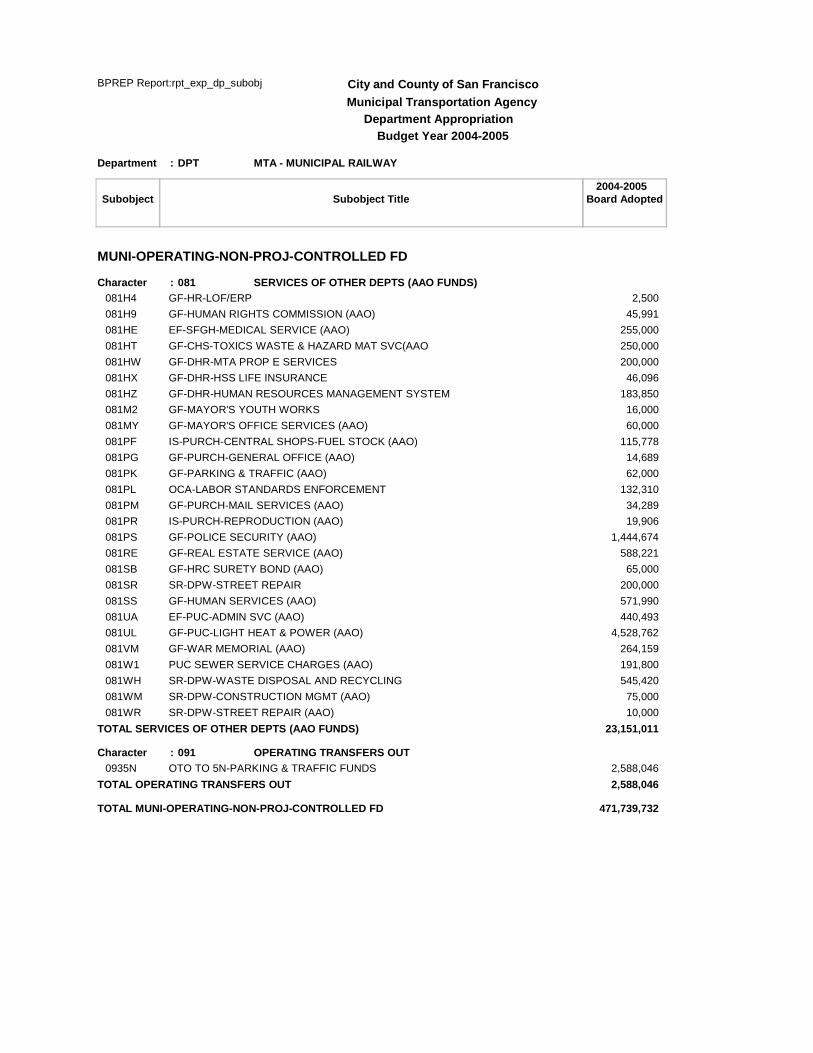
081 SERVICES OF OTHER DEPTS (AAO FUNDS)Character :GF-HR-LOF/ERP081H4 2,500GF-HUMAN RIGHTS COMMISSION (AAO)081H9 45,991EF-SFGH-MEDICAL SERVICE (AAO)081HE 255,000GF-CHS-TOXICS WASTE & HAZARD MAT SVC(AAO081HT 250,000GF-DHR-MTA PROP E SERVICES081HW 200,000GF-DHR-HSS LIFE INSURANCE081HX 46,096GF-DHR-HUMAN RESOURCES MANAGEMENT SYSTEM081HZ 183,850GF-MAYOR'S YOUTH WORKS081M2 16,000GF-MAYOR'S OFFICE SERVICES (AAO)081MY 60,000IS-PURCH-CENTRAL SHOPS-FUEL STOCK (AAO)081PF 115,778GF-PURCH-GENERAL OFFICE (AAO)081PG 14,689GF-PARKING & TRAFFIC (AAO)081PK 62,000OCA-LABOR STANDARDS ENFORCEMENT081PL 132,310GF-PURCH-MAIL SERVICES (AAO)081PM 34,289IS-PURCH-REPRODUCTION (AAO)081PR 19,906GF-POLICE SECURITY (AAO)081PS 1,444,674GF-REAL ESTATE SERVICE (AAO)081RE 588,221GF-HRC SURETY BOND (AAO)081SB 65,000SR-DPW-STREET REPAIR081SR 200,000GF-HUMAN SERVICES (AAO)081SS 571,990EF-PUC-ADMIN SVC (AAO)081UA 440,493GF-PUC-LIGHT HEAT & POWER (AAO)081UL 4,528,762GF-WAR MEMORIAL (AAO)081VM 264,159PUC SEWER SERVICE CHARGES (AAO)081W1 191,800SR-DPW-WASTE DISPOSAL AND RECYCLING081WH 545,420SR-DPW-CONSTRUCTION MGMT (AAO)081WM 75,000SR-DPW-STREET REPAIR (AAO)081WR 10,000
TOTAL SERVICES OF OTHER DEPTS (AAO FUNDS) 23,151,011
091 OPERATING TRANSFERS OUTCharacter :OTO TO 5N-PARKING & TRAFFIC FUNDS0935N 2,588,046
TOTAL OPERATING TRANSFERS OUT 2,588,046
TOTAL MUNI-OPERATING-NON-PROJ-CONTROLLED FD 471,739,732

Subobject Title
City and County of San FranciscoBPREP Report:rpt_exp_dp_subobj
Department Appropriation
Subobject
Budget Year 2004-2005
Municipal Transportation Agency
DPT MTA - MUNICIPAL RAILWAYDepartment :
2004-2005 Board Adopted
MUNI-CONTINUING PROJ-OPERATING FD
021 NON PERSONAL SERVICESCharacter :OTHER MEDICAL SERVICES02789 130,000OTHER PROFESSIONAL SERVICES02799 31,000PROPERTY RENT03011 56,415OTHER CURRENT EXPENSES - BUDGET03500 250,000OTHER CURRENT EXPENSES03599 82,585
TOTAL NON PERSONAL SERVICES 550,000
040 MATERIALS & SUPPLIESCharacter :VEHICLE PARTS-SUPPLIES04331 500,000
TOTAL MATERIALS & SUPPLIES 500,000
060 CAPITAL OUTLAYCharacter :AUTOMOTIVE & OTHER VEHICLES06029 1,000,000
TOTAL CAPITAL OUTLAY 1,000,000
06F FACILITIES MAINTENANCECharacter :FACILITIES MAINTENANCE-BUDGET06F00 1,175,000
TOTAL FACILITIES MAINTENANCE 1,175,000
TOTAL MUNI-CONTINUING PROJ-OPERATING FD 3,225,000

Subobject Title
City and County of San FranciscoBPREP Report:rpt_exp_dp_subobj
Department Appropriation
Subobject
Budget Year 2004-2005
Municipal Transportation Agency
DPT MTA - MUNICIPAL RAILWAYDepartment :
2004-2005 Board Adopted
PTC-MUNI RAILWAY PERSONNEL FUND
021 NON PERSONAL SERVICESCharacter :TRAVEL COSTS PAID TO EMPLOYEES02101 48,500TRAINING COSTS PAID TO EMPLOYEES02201 181,550EMPLOYEE FIELD EXPENSES-BUDGET02300 2,000AUTO MILEAGE02301 1,190LOCAL FIELD EXP02302 1,810ENGINEERING SERVICES02702 27,000AUDITING & ACCOUNTING02721 42,000DP/WP EQUIPMENT MAINT02911 16,100VEHICLE MAINT (NON CENTRAL SHOPS)02921 2,700OFFICE EQUIP MAINT02931 5,000OTHER EQUIP MAINT02999 1,200PROPERTY RENT03011 1,881,646GARAGE RENT03021 26,400MISCELLANEOUS FACILITIES RENTAL03031 446,744OFFICE MACHINE RENTAL03131 11,000FREIGHT/DELIVERY03521 1,000COPY MACHINE03551 30,500PRINTING03552 20,000POSTAGE03561 7,000SUBSCRIPTIONS03571 3,000OTHER CURRENT EXPENSES03599 29,900FEES LICENSES PERMITS05221 5,000
TOTAL NON PERSONAL SERVICES 2,791,240
040 MATERIALS & SUPPLIESCharacter :OTHER EQUIPMENT MAINT SUPPLIES04399 1,600OTHER SAFETY EXPENSES04599 15,000DATA PROCESSING SUPPLIES04921 176,400MINOR DATA PROCESSING EQUIPMENT04925 12,800MINOR FURNISHINGS04941 159,943OTHER OFFICE SUPPLIES04951 92,000OTHER MATERIALS & SUPPLIES04999 2,300EQUIPMENT (5K OR LESS-CONTROLLED ASSET)04A01 50,000
TOTAL MATERIALS & SUPPLIES 510,043
060 CAPITAL OUTLAYCharacter :EQUIPMENT PURCHASE-BUDGET06000 50,000
TOTAL CAPITAL OUTLAY 50,000
079 ALLOCATED CHARGESCharacter :ALLOCATED CHARGES-SPECIFIC SOURCES07999 (42,000)
TOTAL ALLOCATED CHARGES (42,000)
081 SERVICES OF OTHER DEPTS (AAO FUNDS)Character :IS-TIS-ISD SERVICES (AAO)081C5 120,000

Subobject Title
City and County of San FranciscoBPREP Report:rpt_exp_dp_subobj
Department Appropriation
Subobject
Budget Year 2004-2005
Municipal Transportation Agency
DPT MTA - MUNICIPAL RAILWAYDepartment :
2004-2005 Board Adopted
PTC-MUNI RAILWAY PERSONNEL FUND
081 SERVICES OF OTHER DEPTS (AAO FUNDS)Character :GF-CITY ATTORNEY-LEGAL SERVICES (AAO)081CT 713,111GF-TIS-TELEPHONE (AAO)081ET 153,000GF-PURCH-GENERAL OFFICE (AAO)081PG 95,521GF-REAL ESTATE SERVICE (AAO)081RE 25,000SR-DPW-GENERAL ADMINISTRATION (AAO)081WG 50,000
TOTAL SERVICES OF OTHER DEPTS (AAO FUNDS) 1,156,632
TOTAL PTC-MUNI RAILWAY PERSONNEL FUND 4,465,915

Subobject Title
City and County of San FranciscoBPREP Report:rpt_exp_dp_subobj
Department Appropriation
Subobject
Budget Year 2004-2005
Municipal Transportation Agency
DPT MTA - MUNICIPAL RAILWAYDepartment :
2004-2005 Board Adopted
MUNI-CAPITAL PROJECTS-UNALLOCATED
021 NON PERSONAL SERVICESCharacter :OTHER CURRENT EXPENSES - BUDGET03500 500,000
TOTAL NON PERSONAL SERVICES 500,000
067 CAPITAL PROJECTS (CIP)Character :BLDGS,STRUCTURES &IMPRV'T PROJECT-BUDGET06700 6,205,683
TOTAL CAPITAL PROJECTS (CIP) 6,205,683
TOTAL MUNI-CAPITAL PROJECTS-UNALLOCATED 6,705,683

Subobject Title
City and County of San FranciscoBPREP Report:rpt_exp_dp_subobj
Department Appropriation
Subobject
Budget Year 2004-2005
Municipal Transportation Agency
DPT MTA - MUNICIPAL RAILWAYDepartment :
2004-2005 Board Adopted
MUNI-TRANSIT IMPACT DEV FUND
001 SALARIESCharacter :MISC-REGULAR00101 90,567
TOTAL SALARIES 90,567
013 MANDATORY FRINGE BENEFITSCharacter :RETIRE CITY MISC01301 4,057SOCIAL SECURITY (OASDI)01401 5,450SOCIAL SECURITY - MEDICARE (HI ONLY)01402 1,313HEALTH SERVICE-CITY MATCH01501 3,896DEPENDENT COVERAGE-MISCELLANEOUS01571 2,626DENTAL COVERAGE01601 1,206UNEMPLOYMENT INSURANCE01701 199LONG TERM DISABILITY INSURANCE01912 797
TOTAL MANDATORY FRINGE BENEFITS 19,544
021 NON PERSONAL SERVICESCharacter :MANAGEMENT CONSULTING SERVICES02751 70,992
TOTAL NON PERSONAL SERVICES 70,992
081 SERVICES OF OTHER DEPTS (AAO FUNDS)Character :SR-BUILDING INSPECTION (AAO)081BI 30,000GF-CITY ATTORNEY-LEGAL SERVICES (AAO)081CT 68,553
TOTAL SERVICES OF OTHER DEPTS (AAO FUNDS) 98,553
TOTAL MUNI-TRANSIT IMPACT DEV FUND 279,656

Subobject Title
City and County of San FranciscoBPREP Report:rpt_exp_dp_subobj
Department Appropriation
Subobject
Budget Year 2004-2005
Municipal Transportation Agency
DPT MTA - MUNICIPAL RAILWAYDepartment :
2004-2005 Board Adopted
MUNI-TRANSIT SHELTER PROGRAM
001 SALARIESCharacter :MISC-REGULAR00101 115,219TEMP-REGULAR-MISC00501 6,930
TOTAL SALARIES 122,149
013 MANDATORY FRINGE BENEFITSCharacter :RETIRE CITY MISC01301 5,162SOCIAL SECURITY (OASDI)01401 7,574SOCIAL SECURITY - MEDICARE (HI ONLY)01402 1,770HEALTH SERVICE-CITY MATCH01501 5,844DEPENDENT COVERAGE-MISCELLANEOUS01571 3,939DENTAL COVERAGE01601 1,809UNEMPLOYMENT INSURANCE01701 268LONG TERM DISABILITY INSURANCE01912 1,014
TOTAL MANDATORY FRINGE BENEFITS 27,380
021 NON PERSONAL SERVICESCharacter :OTHER CURRENT EXPENSES03599 2,000
TOTAL NON PERSONAL SERVICES 2,000
040 MATERIALS & SUPPLIESCharacter :OTHER MATERIALS & SUPPLIES04999 18,649
TOTAL MATERIALS & SUPPLIES 18,649
081 SERVICES OF OTHER DEPTS (AAO FUNDS)Character :GF-CITY ATTORNEY-LEGAL SERVICES (AAO)081CT 11,426GF-PARKING & TRAFFIC (AAO)081PK 20,000
TOTAL SERVICES OF OTHER DEPTS (AAO FUNDS) 31,426
TOTAL MUNI-TRANSIT SHELTER PROGRAM 201,604
TOTAL MTA - MUNICIPAL RAILWAY 486,617,590

POSITIONS

Maintenance
Operating 1193.57 FTEGrant 58.00 FTE
Construction
Grant 163.54 FTE
Human Resources
Operating 57.19 FTE
Finance & Administration
Operating 140.96 FTEGrant 17.00 FTE
Capital Planning &External Affairs
Operating 10.27 FTE Grant 18.77 FTE
Transportation
Operating 2188.21 FTE Grant 17.25 FTE
Deputy Executive DirectorStuart Sunshine
Executive DirectorMichael T. Burns
General ManagerFred Stephens
General Manager
Operating 281.39 FTE Grant 5.50 FTE
Executive Office
Operating 139.21 FTE
Municipal Transportation AgencyBoard of Directors
San Francisco Municipal Railway
* FTE Counts do not include attrition savings

BUDGET DETAIL: POSITIONS What follows is a more detailed look at Muni’s budgeted positions, with explanations of changes to operating-funded positions and to grant-funded positions. The baseline against which the FY2005 budget is being measured is the FY2004 budget. Further explanation may be found in the tables following this discussion. In addition, further detail can be found in each division-level budget book. Operating Budget The number of positions in the operating budget decreased by 124.7, from 4,135.50 to 4,010.8. This is the result of positions deleted due to workforce reductions, the deletion of some vacant positions, and the transfer of a few formerly operating-funded positions to the grant-funded budget. While Muni worked to limit the impact to service of workforce reductions required to offset deficits brought about by the extended economic downturn, layoffs were necessary in FY2005. It is important to note that while the discussion below describes position deletions in the budget due to workforce reductions, some layoffs were rescinded late in the budget process. Those positions were not restored in the budget; however, those employees are currently holding other budgeted lines and the appropriate positions will be restored in the FY2006 budget. In the FY2005 budget there are minor changes in position counts among the divisions, reflecting reassignment of a few positions between divisions. There are no new positions in the FY2005 budget. The position changes by division are discussed below. Transportation Division Operating positions in the Transportation Division decreased by 12.79 positions as a result of workforce reductions. Two vacant positions were deleted and 10.79 filled positions were eliminated. Detailed information on the number and type of positions deleted may be found in the division level budget book. No reassignments between the Transportation Division and other divisions were implemented in the FY2005 budget. Maintenance Division Operating positions were decreased by 33.43 positions in the Maintenance Division budget. Of these, 13 were operating-funded positions reassigned to the grant fund to recognize additional grant support for Muni’s maintenance activities. In addition, 18.43 positions were deleted as part of Muni’s workforce reductions. Two positions were reassigned to other divisions as they were occupied by personnel whose layoffs had been rescinded in the FY2004 budget process but whose budgeted positions had been eliminated. Those personnel were placed on Maintenance positions temporarily, and those positions were subsequently reassigned to the appropriate division as part of the FY2005 budget. Detailed information on the number and type of deleted positions can be found in the division level budget book. General Manager Division Operating positions in the General Manager Division showed a net decrease of 20.11 positions, as a result of position deletions and the transfer in of positions from other

divisions. Three vacant positions were deleted as part of Muni’s cost containment efforts. In addition, 19.11 filled positions were eliminated. A detailed description of these positions may be found in the division level budget book. Slightly offsetting these reductions was the reassignment of two positions into the General Manager Division. These positions were held by employees working the General Manager Division but budgeted elsewhere. Finance and Administration The Finance and Administration Division’s budgeted operating positions decreased by 13.79 positions. Of these, two were vacant and the remainder was filled. In addition, one positions transferred in to the Finance Division from the Capital Planning & External Affairs Division, and one position was reassigned out of the Finance Division to the Municipal Railway Executive Office Division. Detailed information on the number and type of positions deleted may be found in the division level budget book. Municipal Railway Executive Office Division The Municipal Railway Executive Office Division (MREO) operating position budget decreased by 22.79 positions, mainly due to workforce reductions. Seven vacant positions were eliminated and 17.79 filled positions were deleted. These reductions were offset by the reassignment into the division of one position from the Construction Division and one position from the Finance Division. A more detailed description of the deleted positions may be found in the division level budget book. Human Resources Division The Human Resources Division operating budget shows a decrease of 12.81 positions. This includes five vacant position deletions and the elimination of 7.81 filled positions. There were no reassignments into or out of the Human Resources Division in FY2005. More information on the position deletions may be found in the division level budget book. Capital Planning and External Affairs Division The Capital Planning and External Affairs Division (CPEA) operating position budget decreased by 8.98 positions. This is the result of the transfer of one position to the Finance Division and the deletion of 7.98 positions, two of which were vacant. More detailed information on these position deletions may be found in the division level budget book. Grants Budget In addition to the positions eliminated in the operating budget, the number of grant-funded positions decreased by 20.69 positions, which is the net result of 32.69 position deletions and the transfer of 12 positions from the operating budget to grant funds. These are discussed below. Divisions experiencing no grant-funded position changes are excluded from this discussion. Maintenance Division Twelve positions formerly funded through the operating budget were reassigned to the grants budget, to recognize grant support for maintenance activities.

Construction Division The Construction Division position budget was reduced by 31.46 positions in FY2005. After reviewing its current and future projects, the Division determined that 10 vacant positions were no longer necessary and therefore those have been deleted in the FY2005 budget. In addition, 20.46 positions were deleted as a result of workforce reductions and one position was reassigned to the Municipal Railway Executive Office. Detailed information on the deleted positions may be found in the division level budget book. Capital Planning and External Affairs Division There was a decrease of 2.23 positions in the Capital Planning and External Affairs grant-funded position budget. These positions were deleted as part of Muni’s cost reduction strategy. One of these positions was vacant.

FY2004 FY2005 Change
Div Division TitleBudgeted
FTEDeleted
PositionsReassignments
OutReassignments
InBudgeted
FTEfrom
FY200402 Finance and Administration 171.75 (13.79) (1.00) 1.00 157.96 (13.79)04 Construction 195.00 (30.46) (1.00) 0.00 163.54 (31.46)05 Municipal Railway Executive Office 162.00 (24.79) 0.00 2.00 139.21 (22.79)07 Capital Planning & External Affairs 40.25 (10.21) (1.00) 0.00 29.04 (11.21)11 Human Resources 70.00 (12.81) 0.00 0.00 57.19 (12.81)12 Transportation 2,218.25 (12.79) 0.00 0.00 2,205.46 (12.79)13 Maintenance 1,272.00 (18.43) (2.00) 0.00 1,251.57 (20.43)14 General Manager 307.00 (22.11) 0.00 2.00 286.89 (20.11)
Total 4,436.25 (145.39) (5.00) 5.00 4,290.86 (145.39)
As part of the FY2005 budget process, the Mayor's office instructed departments to eliminate some vacant positions and reverse the corresponding attrition savings in order to reduce the departmental attrition savings rates. Muni deleted 31 vacant positions department-wide in its FY2005 budget. These positions deletions support that request and are anticipated to have minimal impact on direct service provision. Additionally, 114.39 positions were deleted to achieve Muni's cost reduction strategy. In an effort to increase efficiency, five reassignments between divisions were made in the FY2005 budget.
Municipal Transportation AgencySan Francisco Municipal Railway
FY2005 Approved BudgetDivision Position Summary
FY2005 Changes

% of Attrition Savings to Total Operating
Division FTE Amount FTE Amount FTE AmountPositions (excludes transit operators)
Transportation (12.36) (840,115) (9.89) (641,380) 2.47 198,735 11%
Maintenance (73.40) (4,480,185) (82.24) (5,213,783) (8.84) (733,598) 7%
General Manager Division (20.58) (1,381,018) (22.44) (1,475,280) (1.86) (94,262) 8%
Finance & Administration (18.14) (1,184,083) (19.81) (1,318,965) (1.67) (134,882) 14%
Executive Office (MREO) (17.57) (1,140,689) (12.66) (889,838) 4.91 250,851 9%
Capital Planning (3.38) (271,278) (4.82) (298,226) (1.44) (26,948) 47%
Human Resources (9.30) (608,621) (8.54) (598,615) 0.76 10,006 15%
Total (154.73) (9,905,989) (160.40) (10,436,087) (5.67) (530,098) 8%
FY2004 AdoptedAdditional FY2005 Attrition Savings
Budgeted Attrition Savings
FY2005 Adopted

TABLE OF ORGANIZATIONDepartment Level
Job Class Job Class Title FY 2003 FY 2004 FY 2005
FY 2005 Changes
Operating Fund
0922 Manager I 8.00 4.00 6.00 2.00
0923 Manager II 1.00 1.00 0.17 (0.83)
0931 Manager III 5.00 5.00 4.00 (1.00)
0932 Manager IV 2.00 2.00 2.00 0.00
0933 Manager V 3.00 3.00 1.34 (1.66)
0955 Deputy Director V 0.00 1.00 1.00 0.00
1013 Technician-Senior 1.00 1.00 0.17 (0.83)
1021 Administrator I 1.00 1.00 0.17 (0.83)
1022 Administrator II 4.00 4.00 3.17 (0.83)
1023 Administrator III 4.00 4.00 4.00 0.00
1024 Administrator-Supervisor 2.00 1.00 1.00 0.00
1042 Engineer-Journey 1.00 0.00 0.00 0.00
1043 Engineer-Senior 2.00 4.00 4.00 0.00
1044 Engineer-Principal 4.00 4.75 4.75 0.00
1051 Bus Analyst-Assistant 1.00 1.00 1.00 0.00
1052 Business Analyst 1.00 1.00 1.00 0.00
1053 Business Analyst-Senior 5.00 6.00 5.17 (0.83)
1054 Bus Analyst-Principal 1.00 1.00 2.00 1.00
1062 Programmer Analyst 2.00 1.00 0.17 (0.83)
1070 Project Director 1.00 1.00 2.00 1.00
1071 Information Services Manager 3.00 3.00 3.00 0.00
1202 Personnel Clerk 3.00 3.00 1.17 (1.83)
1203 Personnel Technician 2.00 2.00 1.17 (0.83)
1204 Senior Personnel Clerk 3.00 3.00 3.00 0.00
1218 Payroll Supervisor 1.00 1.00 1.00 0.00
1220 Payroll Clerk 9.00 9.00 9.00 0.00
1222 Senior Payroll And Personnel Clerk 3.00 3.00 3.00 0.00
1224 Principal Payroll And Personnel Clerk 1.00 1.00 1.00 0.00
1226 Chief Payroll And Personnel Clerk 1.00 1.00 1.00 0.00
1231 Assoc Affirmative Action Coordinator 1.00 1.00 1.00 0.00
1233 Affirmative Action Specialist 4.00 3.00 3.00 0.00

TABLE OF ORGANIZATIONDepartment Level
Job Class Job Class Title FY 2003 FY 2004 FY 2005
FY 2005 Changes
Operating Fund (Contd.)
1241 Personnel Analyst 6.00 6.00 5.00 (1.00)
1244 Senior Personnel Analyst 12.00 13.00 11.17 (1.83)
1246 Principal Personnel Analyst 1.00 1.00 1.00 0.00
1248 Assistant Division Manager, Personnel 2.00 2.00 2.00 0.00
1270 Departmental Personnel Officer 3.00 2.00 1.00 (1.00)
1272 Senior Departmental Personnel Officer 2.00 3.00 3.00 0.00
1276 Departmental Personnel Director 1.00 1.00 1.00 0.00
1312 Public Information Officer 1.00 0.50 0.50 0.00
1314 Public Relations Officer 3.00 3.00 2.00 (1.00)
1365 Special Assistant VI 1.00 0.00 0.00 0.00
1367 Special Assistant VIII 1.00 0.00 0.00 0.00
1368 Special Assistant IX 1.00 1.00 0.00 (1.00)
1369 Special Assistant X 3.00 1.00 0.00 (1.00)
1370 Special Assistant XI 1.00 0.00 0.00 0.00
1402 Junior Clerk 0.00 0.00 0.17 0.17
1404 Clerk 14.00 14.00 11.17 (2.83)
1406 Senior Clerk 11.00 10.00 8.34 (1.66)
1408 Principal Clerk 3.00 3.00 1.17 (1.83)
1424 Clerk Typist 17.00 16.00 7.02 (8.98)
1426 Senior Clerk Typist 17.00 17.00 14.68 (2.32)
1444 Secretary I 16.00 17.00 8.36 (8.64)
1446 Secretary II 22.00 18.00 13.51 (4.49)
1450 Executive Secretary I 7.00 7.00 5.17 (1.83)
1452 Executive Secretary II 4.00 4.00 3.17 (0.83)
1454 Executive Secretary III 2.00 2.00 2.00 0.00
1630 Account Clerk 4.00 5.00 4.00 (1.00)
1632 Senior Account Clerk 3.00 2.00 2.00 0.00
1634 Principal Account Clerk 4.00 4.00 4.17 0.17
1652 Senior Accountant 5.00 5.00 3.17 (1.83)
1654 Principal Accountant 3.00 3.00 3.00 0.00
1657 Senior Systems Accountant 2.00 2.00 2.00 0.00
1675 Supervising Fiscal Officer 3.00 3.00 4.00 1.00

TABLE OF ORGANIZATIONDepartment Level
Job Class Job Class Title FY 2003 FY 2004 FY 2005
FY 2005 Changes
Operating Fund (Contd.)
1760 Offset Machine Operator 2.00 2.00 1.17 (0.83)
1764 Mail And Reproduction Service Supervisor 1.00 1.00 1.00 0.00
1770 Photographer 1.50 0.75 0.75 0.00
1771 Media Production Specialist 1.00 1.00 0.17 (0.83)
1773 Media Training Specialist 1.00 1.00 0.00 (1.00)
1774 Head Photographer 1.00 1.00 1.00 0.00
1804 Statistician 1.00 0.00 0.00 0.00
1806 Senior Statistician 2.00 0.00 0.00 0.00
1820 Junior Administrative Analyst 1.00 1.00 0.17 (0.83)
1822 Administrative Analyst 1.00 1.00 1.00 0.00
1823 Senior Administrative Analyst 5.00 6.00 5.00 (1.00)
1824 Principal Administrative Analyst . 16.00 16.00 13.34 (2.66)
1827 Administrative Services Manager 6.00 0.00 0.51 0.51
1840 Junior Management Assistant 1.00 1.00 1.00 0.00
1842 Management Assistant 6.00 6.00 3.34 (2.66)
1844 Senior Management Assistant 1.00 1.00 1.00 0.00
1855 Senior Control Clerk, EDP 1.00 0.00 0.00 0.00
1920 Inventory Clerk 5.00 2.00 3.00 1.00
1922 Senior Inventory Clerk 1.00 1.00 1.00 0.00
1926 Senior Materials And Supplies Supervisor 1.00 1.00 1.00 0.00
1929 Parts Storekeeper 30.00 30.00 30.00 0.00
1931 Senior Parts Storekeeper 4.00 4.00 4.00 0.00
1935 Principal Parts Storekeeper 2.00 2.00 2.00 0.00
1937 Supervising Parts Storkeeeper 1.00 1.00 1.00 0.00
1942 Assistant Materials Coordinator 2.00 4.00 4.00 0.00
1944 Materials Coordinator 0.00 1.00 0.00 (1.00)
1948 Coding Supervisor, Purchasing Dept 1.00 1.00 1.00 0.00
1950 Assistant Purchaser 5.00 6.00 6.00 0.00
2708 Custodian 48.00 48.00 48.00 0.00
2716 Custodial Assistant Supervisor 4.00 4.00 4.00 0.00
2719 Janitorial Services Assistant Supervisor 1.00 1.00 1.00 0.00
2720 Janitorial Services Supervisor 1.00 1.00 1.00 0.00
2822 Health Educator 1.00 1.00 0.00 (1.00)

TABLE OF ORGANIZATIONDepartment Level
Job Class Job Class Title FY 2003 FY 2004 FY 2005
FY 2005 Changes
Operating Fund (Contd.)
2978 Contract Compliance Officer II 3.00 3.00 3.00 0.00
2992 Contract Compliance Officer I 2.00 2.00 2.00 0.00
3417 Gardener 3.00 3.00 3.00 0.00
5177 Safety Officer 1.00 0.00 0.00 0.00
5207 Associate Engineer 1.00 0.00 0.00 0.00
5211 Senior Engineer 2.00 2.00 2.00 0.00
5241 Engineer 3.00 3.00 3.00 0.00
5288 Transit Planner II 4.00 4.00 3.17 (0.83)
5289 Transit Planner III 1.00 1.00 0.17 (0.83)
5290 Transit Planner IV 3.00 3.00 2.17 (0.83)
5322 Graphic Artist 1.00 0.00 0.00 0.00
5366 Engineering Associate II 1.00 0.00 0.00 0.00
5504 Project Manager II 1.00 1.00 1.00 0.00
6130 Safety Analyst 5.00 6.00 5.00 (1.00)
6137 Assistant Industrial Hygienist 2.00 2.00 1.00 (1.00)
6138 Industrial Hygienist 1.00 1.00 1.00 0.00
6141 Manager, Office of Health and Safety 0.00 1.00 1.00 0.00
6235 Heat And Ventilation Inspector 1.00 1.00 1.00 0.00
6252 Line Inspector 1.00 1.00 1.00 0.00
6318 Construction Inspector 1.00 1.00 1.00 0.00
7110 Mobile Equipment Assistant Supervisor 1.00 1.00 1.00 0.00
7120 Buildings And Grounds Maintenance Supt 1.00 1.00 1.00 0.00
7126 Mechanical Shop And Equipment Supt 3.00 3.00 3.00 0.00
7205 Chief Stationary Engineer 2.00 2.00 2.00 0.00
7212 Automotive Transit Equipment Supervisor 1.00 0.00 0.00 0.00
7215 General Laborer Supervisor I 3.00 3.00 3.00 0.00
7216 Electrical Transit Shop Supervisor I . 7.00 7.00 7.00 0.00
7219 Maintenance Estimator And Scheduler 9.00 9.00 5.34 (3.66)
7223 Cable Machinery Supervisor 1.00 1.00 1.00 0.00
7225 Transit Paint Shop Supervisor I 1.00 1.00 1.00 0.00
7226 Carpenter Supervisor I 2.00 2.00 2.00 0.00
7228 Automotive Transit Shop Supervisor I 6.00 6.00 7.00 1.00

TABLE OF ORGANIZATIONDepartment Level
Job Class Job Class Title FY 2003 FY 2004 FY 2005
FY 2005 Changes
Operating Fund (Contd.)
7235 Transit Power Line Supervisor I 7.00 8.00 8.00 0.00
7238 Electrician Supervisor I 1.00 1.00 1.00 0.00
7241 Senior Maintenance Controller 2.00 2.00 2.00 0.00
7242 Painter Supervisor I 1.00 1.00 1.00 0.00
7244 Power Plant Supervisor I 1.00 1.00 1.00 0.00
7249 Automotive Mechanic Supervisor I 4.00 4.00 4.00 0.00
7251 Track Maintenance Worker Supervisor I 9.00 9.00 9.00 0.00
7253 Electrical Transit Mechanic Supv I 6.00 7.00 6.00 (1.00)
7254 Automotive Machinist Supervisor I 1.00 1.00 1.00 0.00
7255 Power House Electrician Supervisor I 1.00 1.00 1.00 0.00
7256 Electric Motor Repair Supervisor I 1.00 1.00 1.00 0.00
7258 Maintenance Machinist Supervisor I 3.00 3.00 2.17 (0.83)
7262 Maintenance Planner 9.00 7.00 2.34 (4.66)
7264 Auto Body And Fender Worker Supv I 1.00 1.00 1.00 0.00
7274 Transit Power Line Worker Supv II 2.00 1.00 1.00 0.00
7279 Powerhouse Electrician Supv II 1.00 1.00 1.00 0.00
7283 Track Maintenance Supt, Muni Railway 1.00 1.00 1.00 0.00
7286 Wire Rope Cable Maintenance Supv 1.00 1.00 1.00 0.00
7287 Supervising Electronic Maint Technician 3.00 3.00 2.17 (0.83)
7305 Metal Fabricator 1.00 1.00 1.00 0.00
7306 Automotive Body And Fender Worker 37.00 37.00 37.00 0.00
7308 Cable Splicer 0.00 0.00 1.00 1.00
7309 Car And Auto Painter 15.00 17.00 17.00 0.00
7313 Automotive Machinist 16.00 16.00 16.00 0.00
7318 Electronic Maintenance Technician 94.00 99.00 94.00 (5.00)
7319 Electric Motor Repairer 12.00 11.00 10.17 (0.83)
7322 Auto Body And Fender Worker Asst Supv 1.00 1.00 1.00 0.00
7326 Glazier 5.00 5.00 5.00 0.00
7328 Operating Engineer, Universal 2.00 2.00 2.00 0.00
7329 Electronics Maintenance Tech Asst Supvr. 16.00 15.00 16.00 1.00
7332 Maintenance Machinist 29.00 26.00 26.34 0.34
7333 Apprentice Stationary Engineer 1.00 1.00 1.00 0.00
7334 Stationary Engineer 21.00 21.00 21.00 0.00
7335 Senior Stationary Engineer 7.00 6.00 6.00 0.00
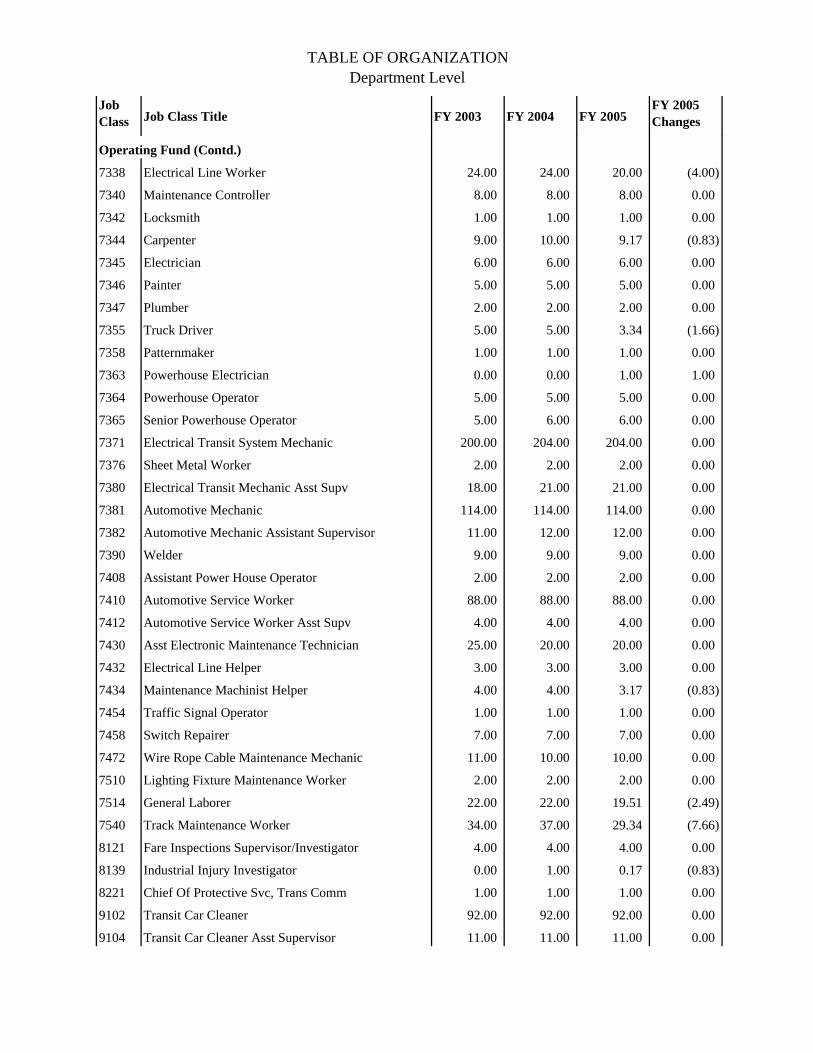
TABLE OF ORGANIZATIONDepartment Level
Job Class Job Class Title FY 2003 FY 2004 FY 2005
FY 2005 Changes
Operating Fund (Contd.)
7338 Electrical Line Worker 24.00 24.00 20.00 (4.00)
7340 Maintenance Controller 8.00 8.00 8.00 0.00
7342 Locksmith 1.00 1.00 1.00 0.00
7344 Carpenter 9.00 10.00 9.17 (0.83)
7345 Electrician 6.00 6.00 6.00 0.00
7346 Painter 5.00 5.00 5.00 0.00
7347 Plumber 2.00 2.00 2.00 0.00
7355 Truck Driver 5.00 5.00 3.34 (1.66)
7358 Patternmaker 1.00 1.00 1.00 0.00
7363 Powerhouse Electrician 0.00 0.00 1.00 1.00
7364 Powerhouse Operator 5.00 5.00 5.00 0.00
7365 Senior Powerhouse Operator 5.00 6.00 6.00 0.00
7371 Electrical Transit System Mechanic 200.00 204.00 204.00 0.00
7376 Sheet Metal Worker 2.00 2.00 2.00 0.00
7380 Electrical Transit Mechanic Asst Supv 18.00 21.00 21.00 0.00
7381 Automotive Mechanic 114.00 114.00 114.00 0.00
7382 Automotive Mechanic Assistant Supervisor 11.00 12.00 12.00 0.00
7390 Welder 9.00 9.00 9.00 0.00
7408 Assistant Power House Operator 2.00 2.00 2.00 0.00
7410 Automotive Service Worker 88.00 88.00 88.00 0.00
7412 Automotive Service Worker Asst Supv 4.00 4.00 4.00 0.00
7430 Asst Electronic Maintenance Technician 25.00 20.00 20.00 0.00
7432 Electrical Line Helper 3.00 3.00 3.00 0.00
7434 Maintenance Machinist Helper 4.00 4.00 3.17 (0.83)
7454 Traffic Signal Operator 1.00 1.00 1.00 0.00
7458 Switch Repairer 7.00 7.00 7.00 0.00
7472 Wire Rope Cable Maintenance Mechanic 11.00 10.00 10.00 0.00
7510 Lighting Fixture Maintenance Worker 2.00 2.00 2.00 0.00
7514 General Laborer 22.00 22.00 19.51 (2.49)
7540 Track Maintenance Worker 34.00 37.00 29.34 (7.66)
8121 Fare Inspections Supervisor/Investigator 4.00 4.00 4.00 0.00
8139 Industrial Injury Investigator 0.00 1.00 0.17 (0.83)
8221 Chief Of Protective Svc, Trans Comm 1.00 1.00 1.00 0.00
9102 Transit Car Cleaner 92.00 92.00 92.00 0.00
9104 Transit Car Cleaner Asst Supervisor 11.00 11.00 11.00 0.00
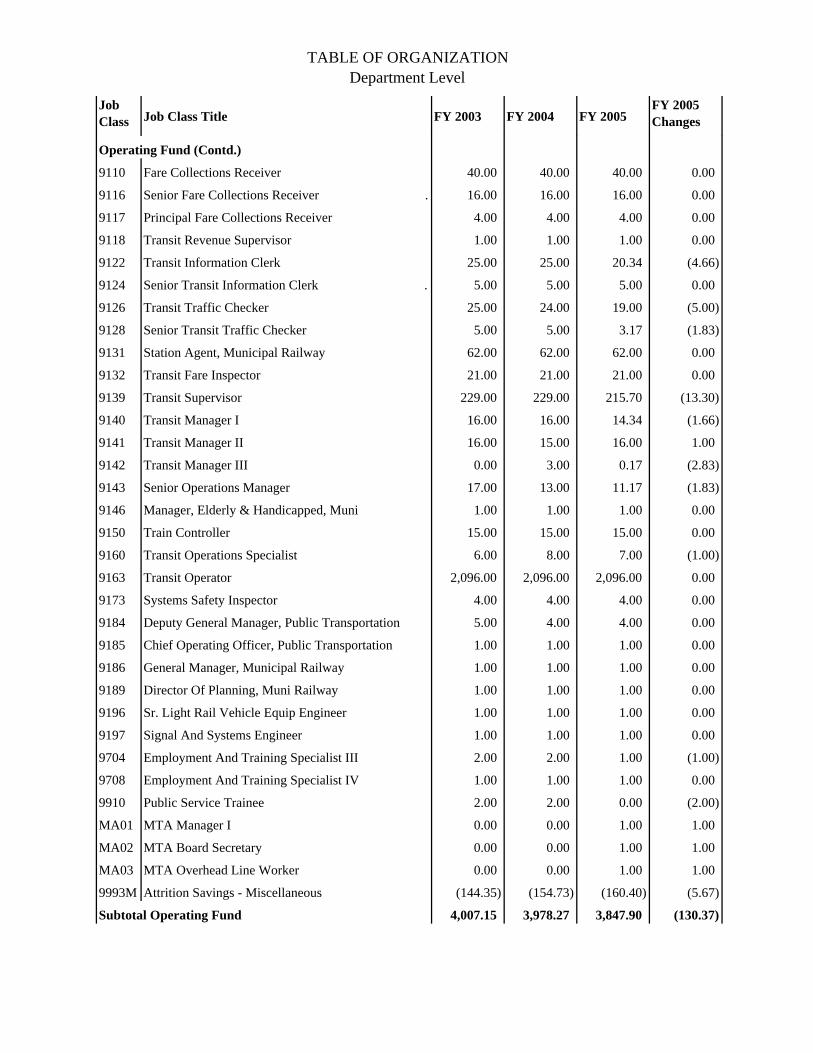
TABLE OF ORGANIZATIONDepartment Level
Job Class Job Class Title FY 2003 FY 2004 FY 2005
FY 2005 Changes
Operating Fund (Contd.)
9110 Fare Collections Receiver 40.00 40.00 40.00 0.00
9116 Senior Fare Collections Receiver . 16.00 16.00 16.00 0.00
9117 Principal Fare Collections Receiver 4.00 4.00 4.00 0.00
9118 Transit Revenue Supervisor 1.00 1.00 1.00 0.00
9122 Transit Information Clerk 25.00 25.00 20.34 (4.66)
9124 Senior Transit Information Clerk . 5.00 5.00 5.00 0.00
9126 Transit Traffic Checker 25.00 24.00 19.00 (5.00)
9128 Senior Transit Traffic Checker 5.00 5.00 3.17 (1.83)
9131 Station Agent, Municipal Railway 62.00 62.00 62.00 0.00
9132 Transit Fare Inspector 21.00 21.00 21.00 0.00
9139 Transit Supervisor 229.00 229.00 215.70 (13.30)
9140 Transit Manager I 16.00 16.00 14.34 (1.66)
9141 Transit Manager II 16.00 15.00 16.00 1.00
9142 Transit Manager III 0.00 3.00 0.17 (2.83)
9143 Senior Operations Manager 17.00 13.00 11.17 (1.83)
9146 Manager, Elderly & Handicapped, Muni 1.00 1.00 1.00 0.00
9150 Train Controller 15.00 15.00 15.00 0.00
9160 Transit Operations Specialist 6.00 8.00 7.00 (1.00)
9163 Transit Operator 2,096.00 2,096.00 2,096.00 0.00
9173 Systems Safety Inspector 4.00 4.00 4.00 0.00
9184 Deputy General Manager, Public Transportation 5.00 4.00 4.00 0.00
9185 Chief Operating Officer, Public Transportation 1.00 1.00 1.00 0.00
9186 General Manager, Municipal Railway 1.00 1.00 1.00 0.00
9189 Director Of Planning, Muni Railway 1.00 1.00 1.00 0.00
9196 Sr. Light Rail Vehicle Equip Engineer 1.00 1.00 1.00 0.00
9197 Signal And Systems Engineer 1.00 1.00 1.00 0.00
9704 Employment And Training Specialist III 2.00 2.00 1.00 (1.00)
9708 Employment And Training Specialist IV 1.00 1.00 1.00 0.00
9910 Public Service Trainee 2.00 2.00 0.00 (2.00)
MA01 MTA Manager I 0.00 0.00 1.00 1.00
MA02 MTA Board Secretary 0.00 0.00 1.00 1.00
MA03 MTA Overhead Line Worker 0.00 0.00 1.00 1.00
9993M Attrition Savings - Miscellaneous (144.35) (154.73) (160.40) (5.67)
Subtotal Operating Fund 4,007.15 3,978.27 3,847.90 (130.37)

TABLE OF ORGANIZATIONDepartment Level
Job Class Job Class Title FY 2003 FY 2004 FY 2005
FY 2005 Changes
Grants Fund
0922 Manager I 0.00 1.00 0.60 (0.40)
0931 Manager III 2.00 1.00 0.00 (1.00)
0932 Manager IV 1.00 2.00 2.00 0.00
0941 Manager VI 2.00 1.00 1.00 0.00
0942 Manager VII 1.00 1.00 1.00 0.00
1004 Operator-Analyst 1.00 1.00 1.00 0.00
1023 Administrator III 1.00 1.00 1.00 0.00
1043 Engineer-Senior 1.00 0.00 0.00 0.00
1052 Business Analyst 1.00 1.00 1.00 0.00
1053 Business Analyst-Senior 1.00 0.00 0.00 0.00
1314 Public Relations Officer 2.00 2.00 1.34 (0.66)
1404 Clerk 3.00 2.00 0.17 (1.83)
1408 Principal Clerk 3.00 2.00 1.00 (1.00)
1410 Chief Clerk 1.00 1.00 1.00 0.00
1424 Clerk Typist 1.00 1.00 1.00 0.00
1426 Senior Clerk Typist 5.00 3.00 1.00 (2.00)
1446 Secretary II 9.00 9.00 7.17 (1.83)
1450 Executive Secretary I 3.00 5.00 3.34 (1.66)
1452 Executive Secretary II 2.00 1.00 1.00 0.00
1632 Senior Account Clerk 1.00 0.00 0.00 0.00
1650 Accountant 3.00 3.00 3.00 0.00
1654 Principal Accountant 2.00 2.00 2.00 0.00
1657 Senior Systems Accountant 1.00 1.00 1.00 0.00
1822 Administrative Analyst 1.00 0.00 0.00 0.00
1823 Senior Administrative Analyst 7.00 7.00 7.00 0.00
1824 Principal Administrative Analyst . 7.00 7.00 6.00 (1.00)
1844 Senior Management Assistant 2.00 2.00 2.00 0.00
5162 Program Manager III 1.00 0.00 0.00 0.00
5174 Administrative Engineer 3.00 3.00 3.00 0.00
5201 Junior Engineer 2.00 1.00 1.00 0.00
5203 Assistant Engineer 54.00 49.00 40.51 (8.49)
5207 Associate Engineer 49.00 27.00 22.84 (4.16)
5211 Senior Engineer 20.00 17.00 16.00 (1.00)
5212 Principal Engineer 3.00 4.00 4.00 0.00

TABLE OF ORGANIZATIONDepartment Level
Job Class Job Class Title FY 2003 FY 2004 FY 2005
FY 2005 Changes
Grants Fund (Contd.)
5241 Engineer 35.00 33.00 33.00 0.00
5288 Transit Planner II 1.00 1.00 0.00 (1.00)
5289 Transit Planner III 4.00 3.00 3.00 0.00
5290 Transit Planner IV 6.00 5.00 4.00 (1.00)
5354 Electrical Engineering Associate I 1.00 0.00 0.00 0.00
5362 Civil Engineering Assistant 10.00 5.00 5.00 0.00
5364 Civil Engineering Associate I 5.00 4.00 2.00 (2.00)
5366 Engineering Associate II 3.00 1.00 0.00 (1.00)
5380 Student Design Trainee I/Architecture 5.00 5.00 5.00 0.00
5502 Project Manager I 3.00 1.00 1.00 0.00
5504 Project Manager II 3.00 3.00 3.00 0.00
5506 Project Manager III 3.00 2.00 2.00 0.00
5508 Project Manager IV 1.00 1.00 1.00 0.00
6318 Construction Inspector 9.00 9.00 7.34 (1.66)
7235 Transit Power Line Supervisor I 1.00 1.00 1.00 0.00
7251 Track Maintenance Worker Supervisor I 1.00 1.00 1.00 0.00
7262 Maintenance Planner 1.00 0.00 1.00 1.00
7318 Electronic Maintenance Technician 5.00 1.00 4.00 3.00
7319 Electric Motor Repairer 2.00 2.00 2.00 0.00
7328 Operating Engineer, Universal 1.00 1.00 1.00 0.00
7329 Electronics Maintenance Tech Asst Supvr. 2.00 2.00 2.00 0.00
7332 Maintenance Machinist 2.00 2.00 2.00 0.00
7338 Electrical Line Worker 2.00 2.00 4.00 2.00
7355 Truck Driver 1.00 1.00 1.00 0.00
7371 Electrical Transit System Mechanic 9.00 9.00 9.00 0.00
7390 Welder 3.00 3.00 3.00 0.00
7458 Switch Repairer 2.00 2.00 2.00 0.00
7514 General Laborer 5.00 5.00 5.00 0.00
7540 Track Maintenance Worker 4.00 2.00 8.00 6.00
9102 Transit Car Cleaner 2.00 2.00 2.00 0.00
9110 Fare Collections Receiver 3.00 3.00 3.00 0.00
9116 Senior Fare Collections Receiver . 2.00 2.00 2.00 0.00
9139 Transit Supervisor 10.50 4.50 4.50 0.00
9140 Transit Manager I 1.00 0.00 0.00 0.00

TABLE OF ORGANIZATIONDepartment Level
Job Class Job Class Title FY 2003 FY 2004 FY 2005
FY 2005 Changes
Grants Fund (Contd.)
9141 Transit Manager II 1.00 1.00 1.00 0.00
9163 Transit Operator 17.25 17.25 17.25 0.00
9184 Deputy General Manager, Dpt 2.00 2.00 2.00 0.00
9195 Light Rail Vehicle Equipment Engineer 1.00 1.00 1.00 0.00
9196 Sr. Light Rail Vehicle Equip Engineer 1.00 1.00 1.00 0.00
9197 Signal And Systems Engineer 1.00 1.00 0.00 (1.00)
Subtotal Grants Fund 367.75 299.75 279.06 (20.69)
Capital Reserve Fund
1070 Project Director 1.00 1.00 1.00 0.00
Transit Impact Development Fund
1824 Principal Administrative Analyst . 1.00 1.00 1.00 0.00
Transit Shelter Program
5289 Transit Planner III 1.50 1.50 1.50 0.00
Total Municipal Railway Department 4,378.40 4,281.52 4,130.46 (151.06)

MAJOR CHANGES BY DIVISION

Finance & Administration Division Summary of Major Changes
FY2004 FY2005 FY2005
Operating Fund Approved Approved VarianceSalaries 9,284,444$ 8,454,385$ (830,059)$ Mandatory Fringe Benefits 1,700,364 1,980,162 279,798 Non Personal Services 1,505,712 1,630,072 124,360 Materials & Supplies 1,123,735 1,148,735 25,000 Capital Outlay 1,113,361 738,361 (375,000) Allocated Charges (352,310) (352,310) - Services of Other Depts 1,979,079 1,850,978 (128,101) Total Operating Fund 16,354,385$ 15,450,383$ (904,002)$
Continuing ProjectsFacilities Maintenance - 1,000,000 1,000,000 Total Continuing Projects -$ 1,000,000$ 1,000,000$
Grants FundSalaries 1,142,475 1,151,192 8,717 Grant Recovery (1,142,475) (1,151,192) (8,717) Non Personal Services 35,000 42,000 7,000 Allocated Charges (35,000) (42,000) (7,000) Total Grants Fund -$ -$ -$
TIDFSalaries 90,927 90,567 (360) Mandatory Fringe Benefits 14,650 19,544 4,894 Non Personal Services 75,526 70,992 (4,534) Services of Other Depts 98,553 98,553 - Intrafund Transfers Out - - - Total TIDF 279,656$ 279,656$ -$
Total 16,634,041$ 16,730,039$ 95,998$
The Finance & Administration Division budget for FY2005 is $16,730,039, an increase of $95,998 compared to the FY2004 budget of $16,634,041. This net increase incorporates a $550,261 decrease to salaries and fringe benefits, driven primarily by reduction in budgeted positions as part of Muni’s cost saving strategy to close the budget deficit. The decrease in salaries and fringe benefits was primarily offset by the following:
� increased funding for salaries due to position substitutions. � increased funding for salaries due to transfer of one formerly grant-funded position to the
operating budget. � increased funding for premiums due to an adjustment to reflect actual premium pay required. � increased funding for holiday pay to reflect adjustments to the Payroll and Revenue units to better
reflect actual scheduled holiday hours worked. � increased funding for retirement due to an increase in the employer contribution to the retirement
system.

� increased funding for unemployment insurance to reflect the State mandated rate. Other major changes in FY2005 include a net increase of $124, 360 for non personal services, due primarily to a 20% increase in auditing fees to reflect anticipated cost increases. The increases were offset by reduced funding for Other Professional Services due to a reallocation of funding from financial services to materials and supplies. The net decrease of $375,000 for capital outlay is due primarily to the elimination of one-time funding for servers and increased funding for a lease/purchase obligation on network equipment which is needed for the expansion and improvement of the communication system. Funding for services of other city departments decreased due to a reduction in the pass-through costs associated with the services of the Department of Telecommunications and a reduced allocation to the PUC, as Muni will move off the BMIS system in FY2005. The decreases were offset by an increase in rent costs associated with the lease of office space at 875 Stevenson street. Increased funding for Facilities Maintenance reflects an allocation from the Breda lease/leaseback transaction to fund an Information Technology project that will provide links between Muni’s many new technology systems.

Construction Division
Grants Fund FY2004 FY2005 Description Approved Approved Variance Non Personal Services $2,433,616 $2,486,065 $52,449 Materials & Supplies 530,300 490,243 (40,057) Capital Outlay 50,000 50,000 0 Services Of Other Depts. 888,754 828,754 (60,0000) Capital Projects 0 5,455,683 5,455,683
Total $3,902,670 $9,310,745 $5,408,075
The FY2005 budget for the Construction Division is $23,894,730, which is $5,408,075, or 16 percent, higher than the FY2004 budget. This budget is fully funded by grants. Of the total budget, $14.1 million, or 60 percent, funds 163.54 positions needed to perform the various activities required to design and implement Muni’s capital improvement projects. The remaining $9,310,745 budget funds the division’s non-salary and capital project expenses. In accordance with the Controller’s budget guidelines, the budget summary table only displays the $9.3 million non-salary and capital project budget. As part of Muni’s FY2005 workforce reductions, 30.46 positions were eliminated from the division’s FY2005 budget. Of these, 18.46 positions were vacant. These workforce reductions are anticipated to have minimal impact on direct service provision.
The division’s Non Personal Services budget shows a $52,449 increase due to a $45,011 increase for the rental of office space and parking used by the Construction Division staff at 1145 Market Street, and an additional $7,438 to fund printing expenses, licensing fees and vehicle maintenance costs. The FY2005 budget for non-fuel materials and supplies was reduced by $40,057 due to reduced demand for minor furnishings. The FY2005 budget for Services of Other Departments shows a $60,000 net reduction due to a $50,000 funding reduction for architectural services, a $30,000 reduction for construction management services and a $20,000 increase for reviewing plans and specifications. The FY2005 budget also includes $5,455,683 to fund various capital improvement projects. Of this, $2,235,683 was generated from the Mission and Steuart hotel lease and development agreement fees and funds the costs associated with the hotel development project. The remaining $3,220,000 was secured from the proceeds of the Breda lease-leaseback transaction. This appropriation funds the implementation of the Third Street Pedestrian Monitoring Program, the purchase of alternative fuel vehicles, metro accessibility improvements and the purchase of Breda light rail vehicles.

Municipal Railway Executive Office Division
Operating Fund
Approved FY2004
Approved FY2005
FY 2005 Variance
Salaries 10,512,558 9,374,967 (1,137,591)Mandatory Fringe Benefits 1,873,160 2,348,217 475,057Non Personal Services 3,005,048 2,958,608 (46,440)Materials & Supplies 114,481 149,481 35,000Allocated Charges (667,927) (624,779) 43,148Services Of Other Depts 2,049,725 2,070,637 20,912 Total $16,887,045 $16,277,131 ($609,914) Continuing Project Operating Fund Non-Personal Services 300,000 550,000 250,000Total $300,000 $550,000 $250,000
Salaries decreased due to the deletion of 24.79 positions and Temporary Salaries decreased by $100,000. These position deletions are part of Muni’s overall strategy to reduce expenditures and close the FY2005 budget gap. Slightly offsetting this reduction was an upward adjustment in holiday pay to reflect actual scheduled hours by Customer Services and the Proof of Payment Program. Mandatory fringe benefits increased in FY2005, chiefly due to the restoration of the City contribution to the retirement fund. The increase in fringe benefits also reflects city pick up the 7.5% employee retirement contribution for positions represented by TWU Local 200. Additionally, there was a small decrease in costs for employer match (FICA) and health benefit costs associated with the workforce reductions. The decrease in Non Personal Services is mainly due to the reallocation of Transportation Training funds to Materials and Supplies. In addition, training funds were decreased as part of Muni’s expenditure reduction strategy. Materials and Supplies increased solely due to the transfer of funds from Non-Personal Services to fund training supplies. Allocated Charges represent the salary and fringe benefit abatement that Contract Compliance receives for work related to Capital Projects. The decrease in allocated charges in FY2005 reflects the reduced fringe benefit costs recovered, as the city does not pay the 7.5% employee retirement contribution in FY2005 for these positions. The budget for Services of Other Departments has increased due to the annual rent increase for the Security offices. Lastly, the FY2005 budget for the Muni Improvement Fund (MIF) was increased as TWU Local 250-A agreed to fund new programs developed by the joint Health, Safety and Accident Prevention Committee.

Capital Planning & External Affairs Division
Summary of Major Changes
F Y 2 0 0 4 F Y 2 0 0 5 F Y 2 0 0 5O pera ting F u n d A pp ro ved A pp ro ved V a ria nceS alaries 9 2 4 ,2 4 6$ 4 1 1 ,9 6 0$ (5 1 2 ,28 6 )$ M and ato ry F ringe B enefits 1 8 8 ,5 8 7 9 3 ,2 4 4 (9 5 ,34 3 ) N on P ersona l S erv ices 9 0 1 ,8 7 2 7 9 1 ,2 2 4 (1 1 0 ,64 8 ) M ateria ls & S up p lies 1 4 ,9 6 8 3 0 ,0 0 5 1 5 ,03 7 A llo cated C harges (2 3 6 ,2 0 3 ) (2 6 4 ,7 2 3) (2 8 ,52 0 ) S erv ices o f O ther D ep ts 7 5 ,5 3 2 7 9 ,9 0 6 4 ,37 4 T o ta l O p era tin g F u n d 1 ,8 6 9 ,0 0 2$ 1 ,1 4 1 ,6 1 6$ (7 2 7 ,38 6 )$
G ra n ts F un dN on P ersona l S erv ices 2 6 1 ,0 7 9$ 2 6 3 ,1 7 5$ 2 ,09 6$ M ateria ls & S up p lies 1 9 ,8 0 0 1 9 ,8 0 0 - S erv ices o f O ther D ep ts 2 3 2 ,3 5 7 2 3 2 ,3 5 7 - T o ta l G ra n ts F u n d 5 1 3 ,2 3 6$ 5 1 5 ,3 3 2$ 2 ,09 6$
T o ta l 2 ,3 8 2 ,2 3 8$ 1 ,6 5 6 ,9 4 8$ (7 2 5 ,29 0 )$
The FY2005 budget for Capital Planning & External Affairs (CPEA) shows a net decrease of ($725,290) due to the deletion of positions, a corresponding reduction in funding for fringe benefits, and reduced funding for non personal services. Slightly offsetting these decreases is an increase in funding for materials and supplies and an increase in allocation for reproduction services. The net decrease of $512,286 in the FY2005 budget for salaries is due primarily to the deletion of 7.98 positions to achieve Muni’s cost-reduction strategy, and the reallocation of a previously operating-funded position to grant funds to reflect the position’s actual responsibilities. The FY2005 decrease of $95,343 in fringe benefits is due to reduced social security, health care and insurance costs resulting from a decrease in salary costs for FY2005. Additionally, the reassignment of a previously operating-funded position to the grant-funded budget resulted in a corresponding decrease to the fringe benefit cost. Non Personal Services decreased by $110,648 due to the following: � reallocation of funding for a quality review audit contract to an interdepartmental work order � reduced rent to reflect a lower rent rate for six months � reduced allocation for Employee Awards to reflect actual costs � reduced allocation for taxes, licenses and permits as funding is no longer required.
Materials and supplies increased by $15,037 due to an appropriation from the Video Fund and the reallocation of funds from Taxes. Allocated charges reflect an increase in the labor cost abatement associated with the Legislative Affairs staff and an increase in the expenditure abatement from the Video Fund. The budget for Services of Other Departments increased due to an increase in funding for reproduction services to reflect the amount required.

In FY2005, the non-salary budget for the grant-funded section of Capital Planning & External Affairs increased slightly to fund potential move costs associated with the renegotiation of the lease for 1145 Market street.

Human Resources Division Summary of Major Changes
Description
FY2004 Board
Adopted
FY2005 Board
Adopted
FY2005 Increase
(Decrease)
Operating Fund Salaries 4,281,939 3,526,238 (755,701) Mandatory Fringe Benefits 757,145 826,582 69,437Non Personal Services 1,034,810 842,068 (192,742) Materials & Supplies 81,502 67,502 (14,000) Services Of Other Departments 502,056 431,374 (70,682) Total 6,657,452 5,693,764 (963,688) The FY2005 adopted budget for the Human Resources Division (HR) is $5,693,764. This is $963,688, or 14.5% less than the FY2004 adopted budget. Reducing the workforce and achieving savings in non-salary expenditures achieved the reduction. The $755,701 net reduction in salaries is due to the elimination of fourteen positions, and funding reductions for overtime, premium pay and temporary salaries. The workforce reduction is part of Muni’s cost saving strategy to address revenue shortfalls resulting from the continued economic downturn. The increase in Mandatory Fringe Benefits is mainly due to a City contribution of 4.48% of permanent salaries to the City retirement system. Because the value of the retirement fund has exceeded its actuarial liability in recent years, the City has not had to contribute to the fund since 1997. The increase in the City’s retirement cost is offset by a decrease in other fringe benefits due to the workforce reduction. The decrease in Non Personal Services, Materials and Supplies and Services of Other Departments is the result of expenditure reductions implemented as part of Muni’s efforts to limit non-essential expenditures in light of the prolonged economic downturn.

Transportation Division
Operating Fund
Approved FY2004
Approved FY2005
FY2005 Variance
Platform Salaries $127,150,315 $122,065,824 ($5,084,491)Miscellaneous Salaries 6,759,976 6,192,387 (567,589)Mandatory Fringe Benefits 34,707,975 42,584,817 7,876,842 Non Personal Services 1,401,375 1,377,367 (24,008)Materials & Supplies 7,061,513 7,039,288 (22,225)Allocated Charges (345,000) (150,000) 195,000 Services Of Other Depts 3,943,587 3,890576 (53,011)Total $180,679,741 $183,000,259 $2,320,518
Transit Operator (Platform) costs decreased in FY2005, reflecting both upward and downward adjustments in the various Platform components. Platform regular pay, premium pay and overtime increased due to the annualization of the FY2004 cost-of-living increases. However, this increase was offset by anticipated salary reductions resulting from proposed service adjustments and efficiencies. These adjustments will better match service with current passenger demand and help close Muni’s FY2005 budget gap. Miscellaneous Salaries decreased due to the deletion of 12.79 positions. The position deletions are part of Muni’s overall strategy to reduce expenditures and close the budget gap. Slightly offsetting this reduction is an increase in holiday pay to better reflect actual work assignments and expenditures. Mandatory fringe benefits funds fringe benefit costs for both Platform and Miscellaneous employees. The FY2005 budget increased chiefly due to the restoration of the City contribution to the retirement fund. This increase also reflects higher costs for employee health benefits and the reallocation of funding for the Operator Trust Fund payment to the Transportation Division. Additionally, there was a small decrease in costs for employer match (FICA) associated with the workforce reductions. The proposed service adjustments are anticipated to achieve savings in both tire rental costs and fuel and lubricant expenditures, resulting in reductions to the Non Personal Services and Materials and Supplies categories accordingly. Changes in Allocated Charges are due to the elimination of an abatement from the Department of Transportation for expanded Treasure Island service. Lastly, Muni’s workorder to PUC for electricity to operate rail and trolley vehicles was decreased in FY2005, based on Muni’s anticipated savings resulting from the proposed service adjustments.

Maintenance Division
Operating Fund FY2004 FY2005 Description Approved Approved Variance Salaries $78,139,799 $75,591,610 ($2,548,189) Mandatory Fringe Benefits 13,985,555 18,347,937 4,362,382 Non Personal Services 3,834,523 4,179,523 345,000 Materials & Supplies 21,262,673 19,421,895 (1,840,778) Other Operating Expenses (195,000) (195,000) 0 Services Of Other Depts. 1,554,051 1,701,184 147,133 Total Operating Fund $118,581,601 $119,242,149 $660,548 Continuing Project Fund Vehicle Parts & Supplies 0 500,000 500,000 Capital Outlay 0 1,000,000 1,000,000 Facilities Maintenance 175,000 175,000 0 Grant Fund Services Of Other Depts. 95,521 95,521 0 Interdepartmental Recovery (95,521) (95,521) 0 Capital Projects Unallocated Non Personal Services 0 500,000 500,000 Capital Projects 0 750,000 750,000
Total $118,852,122 $122,262,670 $3,410,548 The FY2005 budget for the Maintenance Division is $122,262,670, which is $3,410,548, or 3 percent, higher than the FY2004 approved budget. As part of Muni’s overall expenditure reduction strategy designed to create a balanced FY2005 budget, the Maintenance Division reduced costs by eliminating positions that have minimal impact on direct service provision. Some of the reduction was offset by a $1,250,000 capital appropriation secured from the Breda lease/leaseback transaction and from the ETI bus procurement contract settlement funds. These funds will be used to implement the trolley bus warranty administration project and to retrofit 375 Muni diesel buses with equipment designed to reduce air pollution caused by carbon monoxide. The FY2005 salary budget shows a $2.5 million net decrease despite a $135,099 increase required to fund premium and holiday pay expenses. The net salary reduction was achieved by eliminating 18.43 positions, transferring 13 positions from the operating budget to the proposition K operating grant and by increasing attrition savings.

The FY2005 budget for fringe benefits shows a $4,362,382 increase due primarily to an increase in the employee retirement system. In the past, the City has not contributed to the retirement fund because the value of the retirement fund has exceeded its actuarial liability since 1997. However, in FY2005 Muni is projected to contribute $3.9 million to the retirement fund due to changes in actuarial assumptions. Furthermore, Muni employees have agreed to continue paying 7.5% to the retirement system for the duration of FY2005. In addition, workforce reductions in the Maintenance Division resulted in a corresponding decline in fringe benefits costs. Offsetting these savings are increases to health care costs and to the employer match (FICA). The FY2005 budget for Non Personal Services shows a $345,000 increase due to: a) a $250,000 transfer from the Other Equipment Maintenance expenditure category to the elevator and escalator maintenance budget; b) a $25,000 increase to cover cost increases in non-revenue vehicle and escalators; and c) a $70,000 funding increase to pay for cleaning and laundry services. The FY2005 budget for the purchase of materials and supplies used for the maintenance of Muni vehicles and equipment shows a $1,884,922 net reduction due to: 1) a $1,500,000 transfer to the continuing project fund to provide the flexibility required to procure historic PCC Cars, trucks, vehicle parts and supplies; 2) a $275,000 transfer to cover cost increases in non-revenue vehicle maintenance; 3) a $50,000 transfer to Maintenance Training in the Executive Office Division; and 4) a $15,778 transfer to increase the fuel purchase work order with Central Shops. The FY2005 budget for Services of Other Departments shows a $147,133 increase due to: a) a $115,955 increase to pay for Muni’s electricity and gas costs; b) a $15,400 increase in the sewer service charge; and c) a $15,778 increase due to the transfer of funds from the fuel and lubricants expenditure category to increase the work order for the purchase of fuel for non-revenue vehicles from Central Shops. Under the continuing project fund expenditure category, $500,000 is budgeted by transferring funds from the operating fund materials and supplies budget. This was done to provide the flexibility needed in using the funds for procuring critical vehicles, parts, equipment and other items. In addition, the division has budgeted $1,250,000 in capital projects using proceeds from the Breda lease/leaseback transaction and from the ETI bus procurement contract settlement funds. Of this, $500,000 is budgeted under non-personal services to fund the implementation of the trolley bus warranty administration project. The remaining $750,000 is budgeted under the capital projects expenditure category in order to retrofit 375 Muni diesel buses with equipment designed to reduce air pollution caused by carbon monoxide.

General Manager Division
Operating Fund
Approved FY2004
Approved FY2005
FY 2005 Variance
Salaries $20,644,121 $19,385,488 ($1,258,633)Mandatory Fringe Benefits 3,639,218 5,220,641 1,581,423Non Personal Services 1,906,602 1,806,679 (99,923) Materials & Supplies 295,215 227,324 (67,891)Capital Outlay 0 90,000 90,000Allocated Charges (77,105) (140,000) (62,895) Services Of Other Depts 95,793 98,789 2,996Total $26,503,844 $26,688,921 $185,077
Salaries decreased due to the deletion of 22.11 positions. The position deletions are part of Muni’s overall strategy to reduce expenditures and close the FY2005 budget gap. Slightly offsetting this reduction is an increase in holiday pay to better reflect actual work assignments and expenditures. Mandatory fringe benefits increased in FY2005, chiefly due to the restoration of the City contribution to the retirement fund. The increase in fringe benefits also reflects higher costs for employee health benefits and city pick up the 7.5% employee retirement contribution for positions represented by TWU Local 200. Additionally, there was a small decrease in costs for employer match (FICA) associated with the workforce reductions. Decreases in Non Personal Services and Materials and Supplies reflect Muni’s department-wide effort to reduce operating expenditures. The Capital Outlay represents the cost of purchasing two ¾ ton diesel trucks for Street Operations. The increase in Allocated Charges incorporates the source of funding for those trucks as well as a reduction in the expenditure recovery from CalTrain for Traffic Checker activities. Lastly, of the three work orders budgeted in the Services of Other Departments appropriation, only one rose slightly, based on actual expenditures of centralized mail delivery services provided by the Purchasing Department.

General Manager Division
Capital Reserve Fund
Approved FY2004
Approved FY2005
FY 2005 Variance
Capital Projects (CIP) $600,000 $0 ($600,000) Total $600,000 $0 ($600,000)
This appropriation was a one-time expenditure in FY2004 to support implementation of the integrated Vehicle Scheduling System project and is therefore deleted in FY2005. Expenditures from the Capital Reserve Fund are restricted for capital purposes only as provided in the San Francisco Administrative Code.
General Manager Division Transit Shelter Program
Special Revenue Fund
Approved FY2004
Approved FY2005
FY 2005 Variance
Salaries $144,528 $122,149 ($22,379) Mandatory Fringe Benefits 22,750 27,380 4,630 Non Personal Services 2,000 2,000 0 Materials & Supplies 18,649 18,649 0 Services Of Other Depts 31,426 31,426 0 Total $219,353 $201,604 ($17,749)
The Transit Shelter Program manages the installation and maintenance of transit shelters through a contract with Viacom Outdoor. The budget funds one full-time permanent employee and one half-time temporary employee to administer the program. Administrative costs include salaries, fringe benefits, and services of other departments. The decrease to Salaries is due to reduced funding for Temporary Salaries, in anticipation of limited support to this program in FY2005. The increase in Mandatory Fringe Benefits is chiefly due to the restoration of the City contribution to the retirement fund. Slightly offsetting this increase was a small decrease in costs for employer match (FICA) associated with the reduction in Temporary Salaries. The appropriations for Non Personal Services and Materials & Supplies have not changed as expenditures are anticipated to remain constant. Additionally, funding for Services of Other Departments also remains the same, as there is no projected increase in legal services provided by the City Attorney or bus zone painting provided by the Department of Parking and Traffic. The Transit Shelter Program is funded through a Special Revenue Fund. Special Revenue Funds are distinct from General Fund revenues because the source of funding is not derived from taxes or other general revenue sources and, in addition, the proceeds are earmarked for a specific purpose.
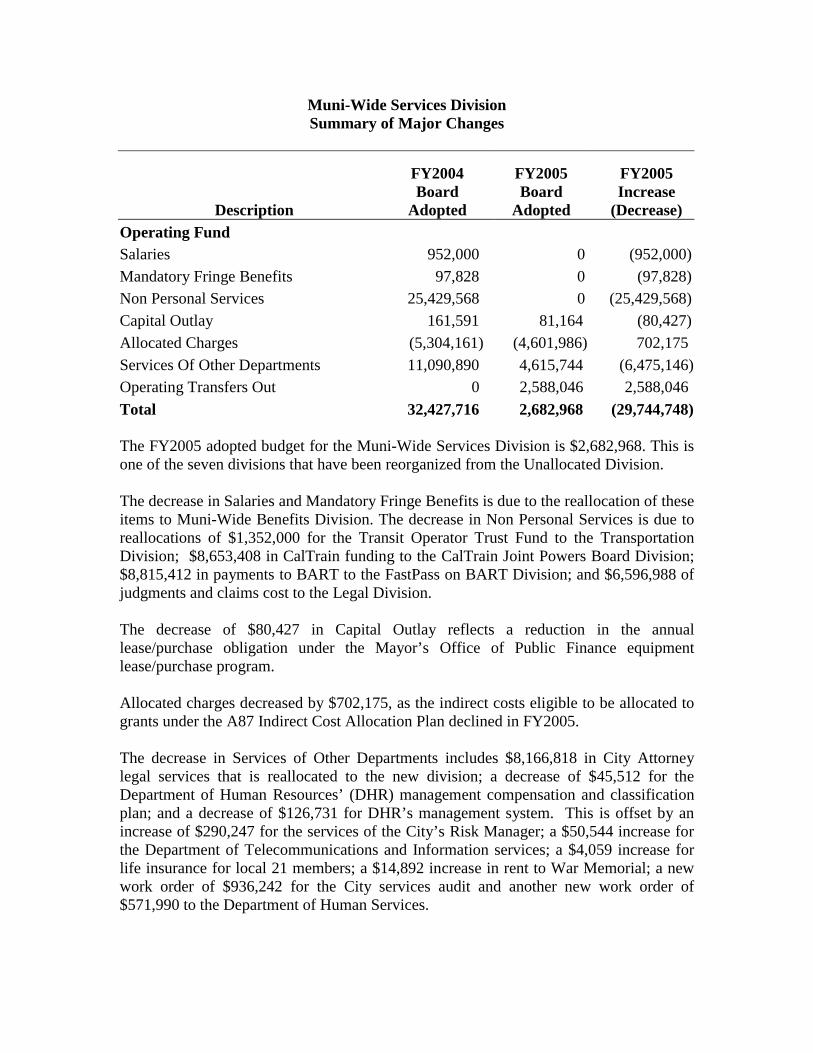
Muni-Wide Services Division Summary of Major Changes
Description
FY2004 Board
Adopted
FY2005 Board
Adopted
FY2005 Increase
(Decrease) Operating Fund Salaries 952,000 0 (952,000) Mandatory Fringe Benefits 97,828 0 (97,828) Non Personal Services 25,429,568 0 (25,429,568) Capital Outlay 161,591 81,164 (80,427) Allocated Charges (5,304,161) (4,601,986) 702,175Services Of Other Departments 11,090,890 4,615,744 (6,475,146) Operating Transfers Out 0 2,588,046 2,588,046Total 32,427,716 2,682,968 (29,744,748) The FY2005 adopted budget for the Muni-Wide Services Division is $2,682,968. This is one of the seven divisions that have been reorganized from the Unallocated Division. The decrease in Salaries and Mandatory Fringe Benefits is due to the reallocation of these items to Muni-Wide Benefits Division. The decrease in Non Personal Services is due to reallocations of $1,352,000 for the Transit Operator Trust Fund to the Transportation Division; $8,653,408 in CalTrain funding to the CalTrain Joint Powers Board Division; $8,815,412 in payments to BART to the FastPass on BART Division; and $6,596,988 of judgments and claims cost to the Legal Division. The decrease of $80,427 in Capital Outlay reflects a reduction in the annual lease/purchase obligation under the Mayor’s Office of Public Finance equipment lease/purchase program. Allocated charges decreased by $702,175, as the indirect costs eligible to be allocated to grants under the A87 Indirect Cost Allocation Plan declined in FY2005. The decrease in Services of Other Departments includes $8,166,818 in City Attorney legal services that is reallocated to the new division; a decrease of $45,512 for the Department of Human Resources’ (DHR) management compensation and classification plan; and a decrease of $126,731 for DHR’s management system. This is offset by an increase of $290,247 for the services of the City’s Risk Manager; a $50,544 increase for the Department of Telecommunications and Information services; a $4,059 increase for life insurance for local 21 members; a $14,892 increase in rent to War Memorial; a new work order of $936,242 for the City services audit and another new work order of $571,990 to the Department of Human Services.

The operating transfers out is one-time fund transfer from Muni’s operating fund to the Department of Parking and Traffic (DPT) to balance the General Fund contribution to the Municipal Transportation Agency.

Workers Compensation Claims Division Summary of Major Changes
Description
FY2004 Board
Adopted
FY2005 Board
Adopted
FY2005 Increase
(Decrease) Operating Fund Non Personal Services 21,746,365 24,025,000 2,278,635 Total 21,746,365 24,025,000 2,278,635 The FY2005 adopted budget for the Workers Compensation Claims Division is $24,025,000, which is $2,278,635 more than the FY2004 adopted budget of $21,746,365. This is one of the seven divisions that have been reorganized from the Unallocated Division. Of the total amount budgeted in non personal services, $20,500,000 is allotted to fund workers’ compensation expenses such as employee medical reimbursements and rehabilitation payments, as well as the State of California Self Insurance and Fraud Assessment Fee. The FY2005 budget for this item has increased by $1,887,318 due to rising workers’ compensation benefits rates. The remaining $3,525,000 funds Muni’s Back First Program and the Workers’ Compensation Third Party Administrator contract. The FY2005 funding for these items has increased by $393,317 due to increased contract costs.

Paratransit Division
Operating Fund
Approved FY2004
Approved FY2005
FY 2005 Variance
Non Personal Services $20,073,976 $20,073,976 $0Interdepartmental Recovery (707,819) (707,819) 0Total $19,366,157 $19,366,157 $0
Expenditures for the Paratransit program are anticipated to remain at FY2004 levels.

Muni-Wide Benefits Division Summary of Major Changes
Description
FY2004 Board
Adopted
FY2005 Board
Adopted
FY2005 Increase
(Decrease) Operating Fund Salaries 2,256,877 3,874,000 1,617,123 Mandatory Fringe Benefits 14,400,808 21,916,031 7,515,223 Total 16,657,685 25,790,031 9,132,346 The FY2005 adopted budget for the Muni-Wide Benefits Division is $25,790,031. The budget funds employee incentive programs, and negotiated labor cost increases, and pays for Charter-mandated health service costs for retirees and their families as well as Muni’s share of the City’s costs for administering this program. Labor cost increases and rising health care costs are the major factors impacting the Muni-Wide Benefits Division’s FY2005 budget. The increase in Salaries includes $845,000 to fund labor cost increases resulting from negotiations and contract re-openers and $952,000 to fund premium pay. These increases are offset by a decrease in funding for incentive payments. The increase in Mandatory Fringe Benefits is due primarily to rising health benefit costs for retirees.

CalTrain JPB Summary of Major Changes
This division is reorganized from the Unallocated Division in FY2005. The appropriation funds payment to the CalTrain Peninsula Joint Powers Board (JPB) as a local subsidy to CalTrain’s FY2005 operating budget. In FY2004, the appropriation included both capital and operating support, with approximately $6.4 million allocated to operating and $2.2 million to capital. The decrease of $2,316,338 in FY2005 compared to the FY2004 budget of $8,653,408 is due to the elimination of the capital support.
FY2004 FY2005 FY2005Description Approved Approved VarianceOperating FundNon Personal Services 8,653,408 6,337,070 (2,316,338) Total 8,653,408$ 6,337,070$ (2,316,338)$

FastPass on BART Division Summary of Major Changes
Description
FY2004 Board
Adopted
FY2005 Board
Adopted
FY2005 Increase
(Decrease) Operating Fund Non Personal Services 0 9,437,653 9,437,653 Total 0 9,437,653 9,437,653 The FY2005 adopted budget for the Fast Pass on BART Division is $9,437,653, which is $622,241 more than the FY2004 adopted budget of $8,815,412. This is one of the seven divisions that have been reorganized from the Unallocated Division. The FY2005 Non Personal Services budget is $9,437,653 compared to a FY2004 budget of $8,815,412. The actual increase in Non Personal Services is $622,241, due to the reallocation of $8,815,412 of payment to BART for use of Muni fast pass from the Muni-Wide Services Division. The increase is due to a negotiated reimbursement rate increase.
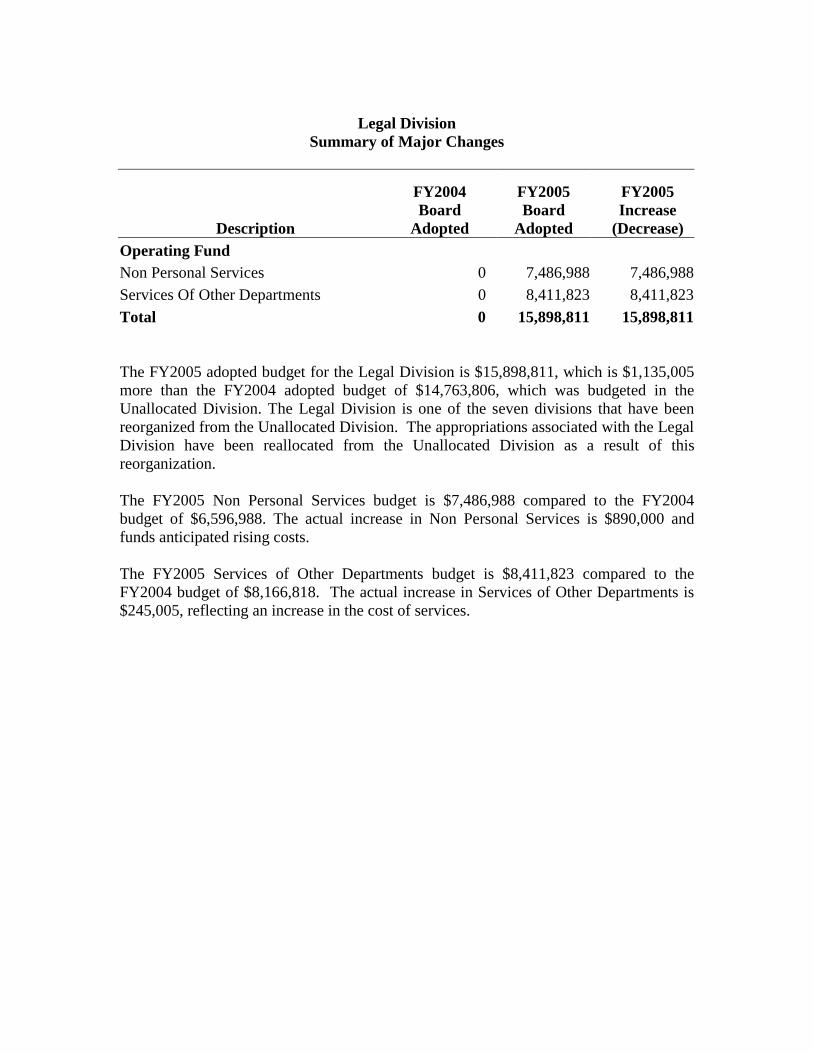
Legal Division
Summary of Major Changes
Description
FY2004 Board
Adopted
FY2005 Board
Adopted
FY2005 Increase
(Decrease) Operating Fund Non Personal Services 0 7,486,988 7,486,988Services Of Other Departments 0 8,411,823 8,411,823 Total 0 15,898,811 15,898,811 The FY2005 adopted budget for the Legal Division is $15,898,811, which is $1,135,005 more than the FY2004 adopted budget of $14,763,806, which was budgeted in the Unallocated Division. The Legal Division is one of the seven divisions that have been reorganized from the Unallocated Division. The appropriations associated with the Legal Division have been reallocated from the Unallocated Division as a result of this reorganization. The FY2005 Non Personal Services budget is $7,486,988 compared to the FY2004 budget of $6,596,988. The actual increase in Non Personal Services is $890,000 and funds anticipated rising costs. The FY2005 Services of Other Departments budget is $8,411,823 compared to the FY2004 budget of $8,166,818. The actual increase in Services of Other Departments is $245,005, reflecting an increase in the cost of services.

SERVICE

Weekday Frequency Guide Frequencies (in minutes)
Route Type First 7-9am 9a-4p 4-6pm Eve. Last Owl PM Powell-Mason Cable Car 6:33am 10 8 8 8 12:33am -- PH Powell-Hyde Cable Car 6:09am 10 8 8 8 12:20am --
C California Street Cable Car 6:23am 6 8 8 12 12:32am --
F Market & Wharves Historic Streetcar 5:47am 6 8 7 15 12:38am --
J Church Metro Streetcar 5:09am 9 10 8 15 12:16am -- K Ingleside Metro Streetcar 5:06am 9 10 9 15 12:16pm L, 91 OwlL Taraval Metro Streetcar owl 7 10 7 15 owl 30
M Ocean View Metro Streetcar 5:42am 9 10 9 15 12:13am -- N Judah Metro Streetcar owl 8 10 8 12 owl 30
S Castro Shuttle, am service Metro Streetcar 7:09am 10 -- -- -- 9:26am -- S Castro Shuttle, pm service Metro Streetcar 3:15pm -- -- 10 -- 6:34pm --
1 California Trolley Bus 5:22am 9 5 8 15 1:25am -- 1 California east of Fillmore Trolley Bus -- 3 5 3 15 -- --
1AX California "A" Express inbound Bus 6:45am 10 -- -- -- 8:25am -- 1AX California "A" Express outbound Bus 4:10pm -- -- 15 -- 6:00pm -- 1BX California "B" Express inbound Bus 6:44am 6 -- -- -- 8:42am -- 1BX California "B" Express outbound Bus 4:15pm -- -- 15 -- 6:05pm --
2 Clement Bus 5:34am 10 20 10 -- 6:55pm -- 3 Jackson Trolley Bus 7:03am 10 20 10 20 1:05am -- 4 Sutter
Trolley Bus 5:28am 10 20 10 -- 5:54pm --

Frequencies (in minutes) Route Type First 7-9am 9a-4p 4-6pm Eve. Last Owl
5 Fulton Trolley Bus 24 hour service 6 8 5 15 24 hour
service 30
6 Parnassus Trolley Bus 6:20am 10 12 10 20 12:22 -- 7 Haight Trolley Bus 6:01am 10 12 10 -- 6:19 --
9 San Bruno Bus 5:35am 8 10 8 15 12:18am 90 Owl 9X San Bruno Express inbound Bus 9:03am -- 12 10 -- 5:55pm -- 9X San Bruno Express outbound Bus 7:07am 12 12 -- -- 6:35pm --
9AX San Bruno "A" Express inbound Bus 6:43am 10 -- -- -- 8:55am -- 9AX San Bruno "A" Express outbound Bus 3:58pm -- -- 10 -- 6:08pm -- 9BX San Bruno "B" Express inbound Bus 6:41am 15 -- -- -- 8:56am -- 9BX San Bruno "B" Express outbound Bus 3:56pm -- -- 10 -- 6:04pm --
10 Townsend Bus 5:47am 15 15 15 20 1:18am -- 12 Folsom-Pacific (Van Ness Ave - 26th
St) Bus 5:54am 10 20 10 20 12:37am --
12 Folsom-Pacific (Van Ness Ave - Mission / Embarcadero) Bus -- 10 10 10 20 -- --
12 Folsom-Pacific (Fillmore-26th St) Bus 5:54am 20 20 20 -- 5:47pm --
14 Mission Trolley Bus 24 hour service 10 6 5 10 24 hour
service 30
14 Mission north of Lowell Trolley Bus 24 hour service 5 6 5 10 24 hour
service 30
14L Mission Limited Bus 8:40am -- 20 -- -- 3:51pm -- 14X Mission Express inbound Bus 6:27am 9 -- -- -- 8:26am -- 14X Mission Express outbound Bus 4:02pm -- -- 10 -- 6:02pm --

Frequencies (in minutes) Route Type First 7-9am 9a-4p 4-6pm Eve. Last Owl
15 Third Street Bus 5:28am 8 10 7 15 11:59am 91 Owl 16AX Noriega "A" Express inbound Bus 6:26am 10 -- -- -- 8:22am -- 16AX Noriega "A" Express outbound Bus 4:02pm -- -- 15 -- 6:10pm -- 16BX Noriega "B" Express inbound Bus 6:30am 10 -- -- -- 8:30am -- 16BX Noriega "B" Express outbound Bus 4:00pm -- -- 15 -- 6:05pm --
17 Parkmerced Bus 6:15am 20 20 20 20 11:44pm -- 18 46th Avenue Bus 5:34am 15 20 15 20 12:21am --
19 Polk Bus 5:21am 10 10-20 10 20 1:27am -- 19 Polk north of Townsend Bus -- 10 10 10 20 -- -- 19 Polk Navy Yard service Bus 5:21am 10 10-20 10 -- 6:34pm --
21 Hayes Trolley Bus 5:36am 8 12 8 20 12:44am --
22 Fillmore Trolley Bus 24 hour service 8 8 6 15 24 hour
service 30
23 Monterey Bus 5:44am 15 20 15 20 12:05am --
24 Divisadero Trolley Bus 24 hour service 8 10 8 15 24 hour
service 30
26 Valencia Bus 6:04am 15 20 15 20 12:32am -- 27 Bryant Bus 5:47am 12 12 12 20 12:57am --
28 19th Avenue Bus 5:23am 11 12 12 20 12:23am 91 Owl 28L 19th Ave Limited to Daly City
BART, am Bus 7:09am 8-15 -- -- -- 8:44am --
28L 19th Ave Limited from Daly City BART, am
Bus 7:20am 10-15 -- -- -- 8:54am --

Frequencies (in minutes) Route Type First 7-9am 9a-4p 4-6pm Eve. Last Owl
28L 19th Ave Limited to Daly City BART, pm Bus 2:07pm -- 8-14 -- -- 3:35pm --
28L 19th Ave Limited from Daly City BART, pm Bus 2:03pm -- 9 -- -- 4:09pm --
29 Sunset south of 25th Ave/California Bus 6:02am 16 15 14 20 12:19am -- 29 Sunset Letterman Complex service Bus 6:44am 30 30 30 -- 5:42pm --
30 Stockton Trolley Bus 5:30am 9 9 9 12 1:09am 91 Owl 30 Stockton east of Van Ness Ave Trolley Bus -- 9 4-5 4-5 12 -- 91 Owl
30X Marina Express inbound Bus 6:05am 5 -- -- -- 9:10am -- 30X Marina Express outbound Bus 3:42pm -- -- 10 -- 6:17pm --

Frequencies (in minutes) Route Type First 7-9am 9a-4p 4-6pm Eve. Last Owl
31 Balboa Trolley Bus 5:21am 10 12 10 15 1am --
31 AX Balboa "A" Express inbound Bus 6:50am 8 -- -- -- 8:08am --
31 AX Balboa "A" Express outbound Bus 4:12pm -- -- 10 -- 6:02pm --
31 BX Balboa "B" Express inbound Bus 6:47am 10 -- -- -- 8:30am --
31 BX Balboa "B" Express outbound Bus 4:12pm -- -- 15 -- 6:05pm --
33 Stanyan Trolley Bus 6:00am 15 15 15 20 12:10am --
35 Eureka Bus 5:27am 15 30 15 30 1:00am -- 36 Teresita Bus 6:30am 20 20 20 30 12:25am -- 37 Corbett Bus 6:15am 15 30 15 30 12:30am --
37 betw. Parkridge Dr & Church St Bus -- 15 15 15 30 --
38 Geary Ft. Miley Bus 5:14am 10 14 12 upon request from 38 Pt.
Lobos 12:07am --
38 Geary Pt. Lobos Bus 5:14am use 38 Limited service 20 12:07am --
38 Geary Ocean Beach Bus 24 hour service 14 14 10 20 24 hour
service 30
38 Geary east of 33rd Ave Bus 24 hour service 7 7 5 10 24 hour
service 30
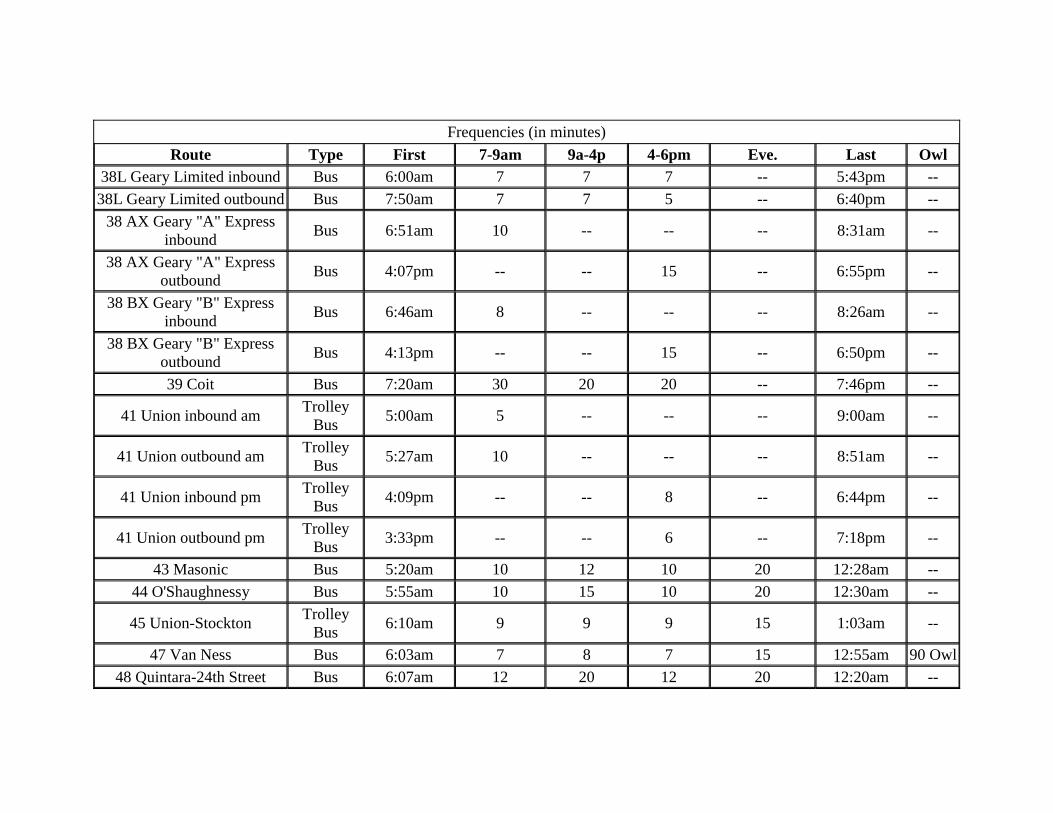
Frequencies (in minutes) Route Type First 7-9am 9a-4p 4-6pm Eve. Last Owl
38L Geary Limited inbound Bus 6:00am 7 7 7 -- 5:43pm -- 38L Geary Limited outbound Bus 7:50am 7 7 5 -- 6:40pm --
38 AX Geary "A" Express inbound Bus 6:51am 10 -- -- -- 8:31am --
38 AX Geary "A" Express outbound Bus 4:07pm -- -- 15 -- 6:55pm --
38 BX Geary "B" Express inbound Bus 6:46am 8 -- -- -- 8:26am --
38 BX Geary "B" Express outbound Bus 4:13pm -- -- 15 -- 6:50pm --
39 Coit Bus 7:20am 30 20 20 -- 7:46pm --
41 Union inbound am Trolley Bus 5:00am 5 -- -- -- 9:00am --
41 Union outbound am Trolley Bus 5:27am 10 -- -- -- 8:51am --
41 Union inbound pm Trolley Bus 4:09pm -- -- 8 -- 6:44pm --
41 Union outbound pm Trolley Bus 3:33pm -- -- 6 -- 7:18pm --
43 Masonic Bus 5:20am 10 12 10 20 12:28am -- 44 O'Shaughnessy Bus 5:55am 10 15 10 20 12:30am --
45 Union-Stockton Trolley Bus 6:10am 9 9 9 15 1:03am --
47 Van Ness Bus 6:03am 7 8 7 15 12:55am 90 Owl48 Quintara-24th Street Bus 6:07am 12 20 12 20 12:20am --

Frequencies (in minutes) Route Type First 7-9am 9a-4p 4-6pm Eve. Last Owl
48 betw. West Portal & Kansas Bus -- 12 10 12 20 -- --
48 betw. West Portal & Great Highway, am Bus 6:51am 12 -- -- -- 9:16am --
48 betw. West Portal & Great Highway, pm Bus 1:50pm -- 12 12 -- 6:45pm --
49 Van Ness- Mission Bus 5:37am 7 8 7 15 1:03am 14 or 90 Owl
52 Excelsior Bus 6:20am 20 20 20 30 12:12am -- 53 Southern Heights Bus 6:45am 30 30 30 -- 7:15pm --
54 Felton Bus 5:53am 22 22 22 22 12:57am -- 56 Rutland Bus 6:37am 40 40 40 40 9:00pm --
66 Quintara, 30th/Vicente- 9th/Judah Bus 6:50am 20 20 20 30 11:42pm --
66 Quintara inbound to Ferry Building Bus 5:42am 24 -- -- -- 7:49am --
66 Quintara outbound from Ferry Building Bus 4:06pm -- -- 24 -- 5:29pm --
67 Bernal Heights Bus 6:10am 20 20 20 20 12:10am -- 71 Haight-Noriega Bus 6:13am 10 12 10 20 12:23am --
71L Haight-Noriega Limited inbound Bus 6:42am 10 -- -- -- 8:06am --
71L Haight-Noriega Limited outbound
Bus 3:58pm -- -- 10 -- 6:11pm --

Frequencies (in minutes) Route Type First 7-9am 9a-4p 4-6pm Eve. Last Owl
80X Gateway Express from Caltrain Bus 7:14am 4 trips meet
Caltrain -- -- -- 9:13am --
81X Caltrain Express from Caltrain Bus 6:51am 4 trips meet
Caltrain -- -- -- 8:41am --
82X Presidio-Caltrain Express from Caltrain Bus 6:19am 6 trips meet
Caltrain -- -- -- 8:43am --
82X Presidio-Caltrain Express to Caltrain Bus 4:10pm -- -- 30 -- 6:10pm --
88 BART Shuttle to BART Bus 6:30am 20 -- -- -- 8:39am -- 88 BART Shuttle from
BART Bus 4:05pm -- -- 10 -- 6:30pm --
89 Laguna Honda Bus 7:04am -- 15 -- -- 3:00pm -- 90 Owl Bus 1:18am -- -- -- -- 4:40am 30 91 Owl Bus 12:55am -- -- -- -- 4:16am 30
108 Treasure Island Bus 24 hour service 15 20 15 20 24 hour
service 45

Saturday Frequency Guide Frequencies (in minutes)
Route Type First 7-10am 10a-6p Eve. Last Owl PM Powell-Mason Cable Car 6:33am 10 8 8 12:33am -- PH Powell-Hyde Cable Car 6:09am 10 8 8 12:20am --
C California Street Cable Car 6:30am 12 10 12 12:38am --
F Market & Wharves Historic Streetcar 6:12am 10 8 15 12:38am --
J Church Metro Streetcar 5:36am 15 16 20 12:16am -- K Ingleside Metro Streetcar 6:10am 12 12 20 12:16am -- L Taraval Metro Streetcar owl 12 10 20 owl 30
M Ocean View Metro Streetcar 5:33am 12 12 20 12:13am -- N Judah Metro Streetcar owl 10 10 20 owl 30
1 California Trolley Bus 5:25am 15 6 20 1:20am -- 2 Clement Bus 5:07am 15 15 -- 7:23pm -- 3 Jackson Trolley Bus 5:22am 15 15 20 1:08am -- 5 Fulton Trolley Bus 24 hour service 12 10 15 24 hour service 30
6 Parnassus Trolley Bus 6:20am 15 12 20 12:20 -- 7 Haight Trolley Bus 9:33am -- 12 -- 6:06pm --
9 San Bruno Bus 6:17am 12 10 15 12:18am 90 Owl 9X San Bruno Express Bus 9:31am -- 15 -- 6:15pm --
10 Townsend Bus 6:00am 20 18 20 1:10am -- 12 Folsom-Pacific (Van Ness -
26th St)
Bus 6:00am 20 20 20 12:31am --

Frequencies (in minutes) Route Type First 7-10am 10a-6p Eve. Last Owl
12 Folsom-Pacific (Van Ness - Mission / Embarcadero) Bus -- 10 10 20 -- --
14 Mission Trolley Bus 24 hour service 8 8 10 24 hour service 30 14L Mission Limited Bus 9:09am -- 15 -- 4:56pm --
15 Third Street Bus 5:28am 10 10 15 11:54pm 91 Owl 17 Parkmerced Bus 6:15am 20 20 20 11:44pm -- 18 46th Avenue Bus 6:20am 20 20 20 12:21am --
19 Polk Bus 5:23am 20 12-24 20 1:27am -- 19 Polk north of Brannan Bus -- 20 12 20 -- --
19 Polk Navy Yard service Bus 5:23am 20 12-24 -- 6:44pm -- 21 Hayes Trolley Bus 5:44am 15 12 20 12:45am --
22 Fillmore Trolley Bus 24 hour service 10 8 15 24 hour service 30 23 Monterey Bus 5:42am 20 20 20 12:05am --
24 Divisadero Trolley Bus 24 hour service 20 15 15 24 hour service 30 (see note)
26 Valencia Bus 6:11am 20 20 20 12:32am -- 27 Bryant Bus 5:47am 20 15 20 12:57am --
28 19th Avenue Bus 5:21am 12 12 20 12:23am 91 Owl 29 Sunset south of 25th Ave/
California Bus 6:00am 15 15 20 11:54pm --
29 Sunset Letterman Complex service Bus 6:50am 30 30 -- 5:43pm --
30 Stockton Trolley Bus 6:00am 10 6 12 1:09am 91 Owl

Frequencies (in minutes) Route Type First 7-10am 10a-6p Eve. Last Owl
30 Stockton east of Van Ness Ave Trolley Bus -- 10 3-6 12 -- 91 Owl
31 Balboa Trolley Bus 5:20am 15 15 15 12:18am -- 33 Stanyan Trolley Bus 6:00am 20 20 20 12:30am -- 35 Eureka Bus 5:42am 30 30 30 1:00am -- 36 Teresita Bus 6:30am 30 30 30 12:25am -- 37 Corbett Bus 6:05am 30 30 30 12:30am --
38 Geary Fort Miley Bus 5:14am 18 14 upon request from 38 Pt.
Lobos 12:44am --
38 Geary Point Lobos Bus 5:14am 15 use 38 Limited 15 12:44am --
38 Geary Ocean Beach Bus 24 hour service 15 14 20 24 hour service 30 38 Geary east of 33rd Ave Bus 24 hour service 5 7 10 24 hour service 30
38L Geary Limited inbound Bus 8:44am -- 7 -- 5:38pm -- 38L Geary Limited outbound Bus 10:01am -- 7 -- 6:04pm --
39 Coit Bus 7:20am 30 20 -- 7:46pm -- 43 Masonic Bus 5:48am 15 15 20 12:27am --
44 O'Shaughnessy Bus 5:55am 15 15 20 12:30am -- 45 Union-Stockton Trolley Bus 6:10am 15 12 15 1:03am --
47 Van Ness Bus 6:00am 12 8 15 12:56am 90 Owl 48 Quintara-24th St. Bus 5:45am 20 15 20 12:20am --
49 Van Ness-Mission Trolley Bus 5:57am 12 8 15 12:54am 14 or 90 Owl

Frequencies (in minutes) Route Type First 7-10am 10a-6p Eve. Last Owl
52 Excelsior Bus 6:20am 20 20 30 12:09am -- 53 Southern Heights Bus 8:30am -- 20 -- 7:15pm --
54 Felton Bus 5:56am 22 22 22 12:57am -- 56 Rutland Bus 6:37am 40 40 40 9:00pm -- 66 Quintara Bus 6:30am 30 30 30 11:42pm --
67 Bernal Heights Bus 6:10am 20 20 20 12:10am -- 71 Haight-Noriega Bus 6:12am 15 12 20 12:22am -- 89 Laguna Honda Bus 9:42am -- 15 -- 2:45pm --
90 Owl Bus 1:18am -- -- -- 4:40am 30 91 Owl Bus 12:55am -- -- -- 4:16am 30
108 Treasure Island Bus 24 hour service 40 20 45 24 hour service 45

Sunday Frequency Guide Frequencies (in minutes)
Route Type First 7-10am 10a-6p Eve. Last Owl PM Powell-Mason Cable Car 6:33am 10 8 8 12:33am -- PH Powell-Hyde Cable Car 6:09am 10 8 8 12:20am --
C California Street Cable Car 6:30am 12 10 12 12:38am --
F Market & Wharves Historic Streetcar 6:12am 10 8 15 12:38am --
J Church Metro Streetcar 5:36am 20 18 20 12:16am -- K Ingleside Metro Streetcar 5:03am 20 15 20 12:16am -- L Taraval Metro Streetcar owl 15 12 20 owl 30
M Ocean View Metro Streetcar 8:12am 20 15 20 12:13am -- N Judah Metro Streetcar owl 15 12 20 owl 30
1 California Trolley Bus 5:25am 15 6 20 1:20am -- 2 Clement Bus 5:07am 15 15 -- 7:23pm -- 3 Jackson Trolley Bus 5:22am 15 15 20 1:08am -- 5 Fulton Trolley Bus 24 hour service 12 9 15 24 hour service 30
6 Parnassus Trolley Bus 6:27am 20 20 20 12:18am -- 7 Haight Trolley Bus 10:19am -- 20 -- 6:14pm --
9 San Bruno Bus 6:15am 12 10 15 12:18am 90 Owl 10 Townsend Bus 6:00am 20 18 20 1:10am --
12 Folsom-Pacific (Van Ness Ave - 26th St) Bus 6:00am 20 20 20 12:31am --
12 Folsom-Pacific (Van Ness Ave - Mission / Embarcadero) Bus -- 10 10 20 -- --
14 Mission Trolley Bus 24 hour service 8 8 10 24 hour service 30 15 Third Street Bus 5:28am 10 10 15 11:54pm 91 Owl

Frequencies (in minutes) Route Type First 7-10am 10a-6p Eve. Last Owl
17 Parkmerced Bus 6:15am 20 20 20 11:44pm -- 18 46th Avenue Bus 6:20am 20 20 20 12:21am --
19 Polk Bus 5:23am 20 12-24 20 1:27am -- 19 Polk north of Townsend Bus -- 20 12 20 -- -- 19 Polk Navy Yard service Bus 5:23am 20 12-24 -- 6:44pm --
21 Hayes Trolley Bus 5:44am 15 12 20 12:45am -- 22 Fillmore Trolley Bus 24 hour service 10 8 15 24 hour service 30 23 Monterey Bus 5:42am 20 20 20 12:05am -- 24 Divisadero Trolley Bus 24 hour service 20 15 15 24 hour service 30 26 Valencia Bus 6:11am 20 20 20 12:32am -- 27 Bryant Bus 5:47am 20 15 20 12:57am --
28 19th Avenue Bus 5:21am 12 12 20 12:23am 91 Owl 29 Sunset south of
25th Ave/ California Bus 6:00am 15 15 20 11:54pm --
29 Sunset Letterman Complex service Bus 6:50am 30 30 -- 5:43pm --
30 Stockton Trolley Bus 6:00am 20 12 12 1:09am 91 Owl 30 Stockton east of Van Ness Ave Trolley Bus -- 20 4-8 12 -- 91 Owl
31 Balboa Trolley Bus 5:20am 15 15 15 12:18am -- 33 Stanyan Trolley Bus 6:00am 20 20 20 12:30am -- 35 Eureka Bus 5:42am 30 30 30 1:00am -- 36 Teresita Bus 6:30am 30 30 30 12:25am -- 37 Corbett Bus 6:05am 30 30 30 12:30am --
38 Geary Ft. Miley Bus 5:14am 20 15
upon request from 38
Pt. Lobos
12:44am --

Frequencies (in minutes) Route Type First 7-10am 10a-6p Eve. Last Owl
38 Geary Pt. Lobos Bus 5:14am 20 15 15 12:44am -- 38 Geary Ocean Beach Bus 24 hour service 20 15 30 24 hour service 30
38 Geary East of 33rd Avenue Bus 24 hour service 7 5 10 24 hour service 30 39 Coit Bus 7:20am 30 20 -- 7:46pm --
43 Masonic Bus 5:48am 15 15 20 12:27am -- 44 O'Shaughnessy Bus 5:55am 15 15 20 12:30am -- 45 Union-Stockton Trolley Bus 6:10am 20 12 12 1:02am --
47 Van Ness Bus 6:00am 12 8 15 12:57am 90 Owl 48 Quintara-24th Street Bus 5:45am 20 15 20 12:20am --
49 Van Ness-Mission Trolley Bus 5:57am 12 8 15 12:54am 14 or 90 Owl
52 Excelsior Bus 6:20am 20 20 30 12:09am -- 53 Southern Heights Bus 8:30am -- 20 -- 7:15pm --
54 Felton Bus 5:56am 22 22 22 12:57am -- 56 Rutland Bus 6:37am 40 40 40 9:00pm -- 66 Quintara Bus 6:30am 30 30 30 11:42pm --
67 Bernal Heights Bus 6:10am 20 20 20 12:10am -- 71 Haight-Noriega Bus 6:23am 15 10 20 12:21am --
76 Marin Headlands to Marin Bus 9:30am -- 60 -- 5:30pm -- 76 Marin Headlands to SF Bus 10:30am -- 60 -- 6:30pm --
89 Laguna Honda Bus 9:42am -- 15 -- 2:45pm -- 90 Owl Bus 1:18am -- -- -- 4:40am 30 91 Owl Bus 12:55am -- -- -- 4:16am 30
108 Treasure Island Bus 24 hour service 40 20 45 24 hour service 45

San Francisco Municipal Railway Department
Summary of FY05 1st Q Service Standards
Page 1 of 4
DEPARTMENT WIDE SERVICE STANDARDS The Executive Director and the Municipal Transportation Agency Board of Directors certify that the budget is adequate in all respects to allow the department to make substantial progress toward meeting the goals, objectives, and performance standards established pursuant to Section 8A.103 of the provisions of the San Francisco Charter. These performance standards are outlined below.
SERVICE STANDARD FY05 Goal
1a. % of Vehicles that run on time according to published schedules (no more than 4 minutes late or 1 minute early) measured at terminals and established intermediate points.
85%
2a. % of Scheduled service hours that are delivered and percentage of scheduled vehicles that begin service at the scheduled time. 98.5%
4a. % of vehicles that pass published time points during measurement periods unable to pick up passengers due to crowding without being followed within 3 minutes or less by another vehicle on the same route with space for all waiting passengers.
Less than 5%
5a. Peak period passenger load factors 85% or less
6a. Actual headways against scheduled headways on all radial express, cross-town, secondary, and feeder lines for peak, base, evening, and late night services.
Operate 85% of time within 30% or 10 minutes of scheduled headway (whichever is less)
7a. % vehicle availability and reliability (mean distance between failure) by mode. 98.5%

San Francisco Municipal Railway Department
Summary of FY05 1st Q Service Standards
Page 2 of 4
SERVICE STANDARD FY05 Goal
8a. Unscheduled absences by operator, mechanical and administrative personnel.
GOAL Maint=6.1%
Admin= 5.0% Ops= 7.0%
Drivers= 9.31%
9a. Miles between roadcalls by mode
Mode FY05 GOAL
Flynn-Artic 2500 Woods-Stand. 2750 Kirkland-Stand. 3100 Potrero Division
Potrero-Artic 700 Potrero-Stand. 1250
Presidio-Stand. 1250 Breda Light Rail 3500 PCC (F-Line) 1250 Cable Car 5500
1b. Passengers carried by mode
219 M Passenger Boardings
2b. Average Fare Per Passenger Achieve $117 M
4b. Fully Allocated Costs Per Hour of Service Report Annually
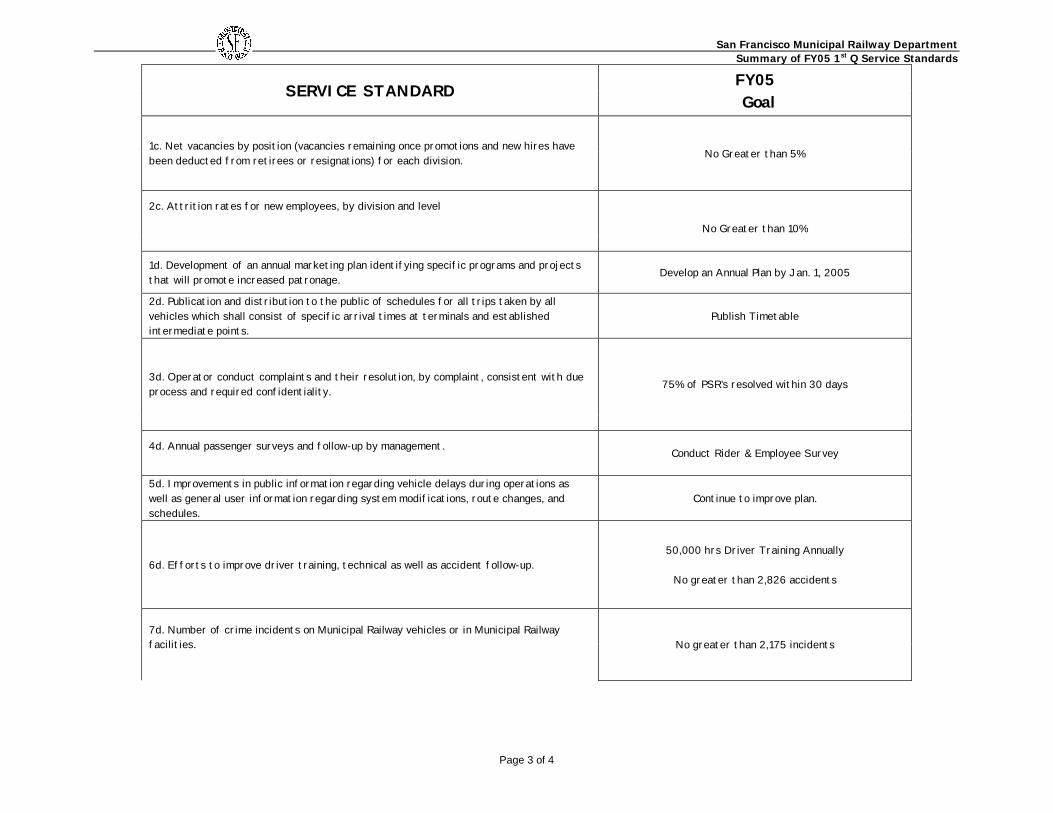
San Francisco Municipal Railway Department
Summary of FY05 1st Q Service Standards
Page 3 of 4
SERVICE STANDARD FY05 Goal
1c. Net vacancies by position (vacancies remaining once promotions and new hires have been deducted from retirees or resignations) for each division.
No Greater than 5%
2c. Attrition rates for new employees, by division and level
No Greater than 10%
1d. Development of an annual marketing plan identifying specific programs and projects that will promote increased patronage. Develop an Annual Plan by Jan. 1, 2005
2d. Publication and distribution to the public of schedules for all trips taken by all vehicles which shall consist of specific arrival times at terminals and established intermediate points.
Publish Timetable
3d. Operator conduct complaints and their resolution, by complaint, consistent with due process and required confidentiality. 75% of PSR’s resolved within 30 days
4d. Annual passenger surveys and follow-up by management.
Conduct Rider & Employee Survey
5d. Improvements in public information regarding vehicle delays during operations as well as general user information regarding system modifications, route changes, and schedules.
Continue to improve plan.
6d. Efforts to improve driver training, technical as well as accident follow-up.
50,000 hrs Driver Training Annually
No greater than 2,826 accidents
7d. Number of crime incidents on Municipal Railway vehicles or in Municipal Railway facilities.
No greater than 2,175 incidents

San Francisco Municipal Railway Department
Summary of FY05 1st Q Service Standards
Page 4 of 4
SERVICE STANDARD FY05 Goal
1e. Number of grievances Report Number of Grievances
2e. Speed of resolution of grievances 75% Resolved within 30 days
3e. Longevity of employment Annual Report
4e. Employee Recognition Annual Achievement
5e. Employee education and training programs 42,620 hours