Second Quarter FY2005 - Sony
13
(1) Sony Corporation Investor Relations FY2005 Second Quarter (Quarter ended September 30, 2005) Consolidated Results Sony Corporation Investor Relations Statements made in this presentation with respect to Sony’s current plans, estimates, strategies and beliefs and other statements that are not historical facts are forward-looking statements about the future performance of Sony. Forward-looking statements include, but are not limited to, those statements using words such as “believe,” “expect,” “plans,” “strategy,” “prospects,” “forecast,” “estimate,” “project,” “anticipate,” “may” or “might” and words of similar meaning in connection with a discussion of future operations, financial performance, events or conditions. From time to time, oral or written forward-looking statements may also be included in other materials released to the public. These statements are based on management’s assumptions and beliefs in light of the information currently available to it. Sony cautions you that a number of important risks and uncertainties could cause actual results to differ materially from those discussed in the forward-looking statements, and therefore you should not place undue reliance on them. You also should not rely on any obligation of Sony to update or revise any forward-looking statements, whether as a result of new information, future events or otherwise. Sony disclaims any such obligation. Risks and uncertainties that might affect Sony include, but are not limited to (i) the global economic environment in which Sony operates, as well as the economic conditions in Sony's markets, particularly levels of consumer spending; (ii) exchange rates, particularly between the yen and the U.S. dollar, the Euro and other currencies in which Sony makes significant sales or in which Sony's assets and liabilities are denominated; (iii) Sony's ability to continue to design and develop and win acceptance of its products and services, which are offered in highly competitive markets characterized by continual new product introductions, rapid development in technology and subjective and changing consumer preferences (particularly in the Electronics, Game and Pictures segments, and music business); (iv) Sony's ability to implement successfully personnel reduction and other business reorganization activities in its Electronics segment and music business; (v) Sony's ability to implement successfully its network strategy for its Electronics, Pictures and Other segments, including the music business, and to develop and implement successful sales and distribution strategies in its Pictures segment and music business in light of the Internet and other technological developments; (vi) Sony's continued ability to devote sufficient resources to research and development and, with respect to capital expenditures, to correctly prioritize investments (particularly in the Electronics segment); (vii) shifts in customer demand for financial services such as life insurance and Sony’s ability to conduct successful Asset Liability Management in the Financial Services segment; and (viii) the success of Sony's joint ventures and alliances. Risks and uncertainties also include the impact of any future events with material unforeseen impacts.
Transcript of Second Quarter FY2005 - Sony

1
(1)Sony Corporation Investor Relations
FY2005Second Quarter
(Quarter ended September 30, 2005)Consolidated Results
Sony Corporation Investor Relations
(2)Sony Corporation Investor Relations
Statements made in this presentation with respect to Sony’s current plans, estimates, strategies and beliefs and other statements that are not historical facts are forward-looking statements about the future performance of Sony. Forward-looking statements include, but are not limited to, those statements using words such as “believe,” “expect,” “plans,”“strategy,” “prospects,” “forecast,” “estimate,” “project,” “anticipate,” “may” or “might” and words of similar meaning in connection with a discussion of future operations, financial performance, events or conditions. From time to time, oral or written forward-looking statements may also be included in other materials released to the public. These statements are based on management’s assumptions and beliefs in light of the information currently available to it. Sony cautions you that a number of important risks and uncertainties could cause actual results to differ materially from those discussed in the forward-looking statements, and therefore you should not place undue reliance on them. You also should not rely on any obligation of Sony to update or revise any forward-looking statements, whether as a result of new information, future events or otherwise. Sony disclaims any such obligation. Risks and uncertainties that might affect Sony include, but are not limited to (i) the global economic environment in which Sony operates, as well as the economic conditions in Sony's markets, particularly levels of consumer spending; (ii) exchange rates, particularly between the yen and the U.S. dollar, the Euro and other currencies in which Sony makes significant sales or in which Sony's assets and liabilities are denominated; (iii) Sony's ability to continue to design and develop and win acceptance of its products and services, which are offered in highly competitive markets characterized by continual new product introductions, rapid development in technology and subjective and changing consumer preferences (particularly in the Electronics, Game and Pictures segments, and music business); (iv) Sony's ability to implement successfully personnel reduction and other business reorganization activities in its Electronics segment and music business; (v) Sony's ability to implement successfully its network strategy for its Electronics, Pictures and Other segments, including the music business, and to develop and implement successful sales and distribution strategies in its Pictures segment and music business in light of the Internet and other technological developments; (vi) Sony's continued ability to devote sufficient resources to research and development and, with respect to capital expenditures, to correctly prioritize investments (particularly in the Electronics segment); (vii) shifts in customer demand for financial services such as life insurance and Sony’s ability to conduct successful Asset Liability Management in the Financial Services segment; and (viii) the success of Sony's joint ventures and alliances. Risks and uncertainties also include the impact of any future events with material unforeseen impacts.
1
Sony Corporation Investor Relations
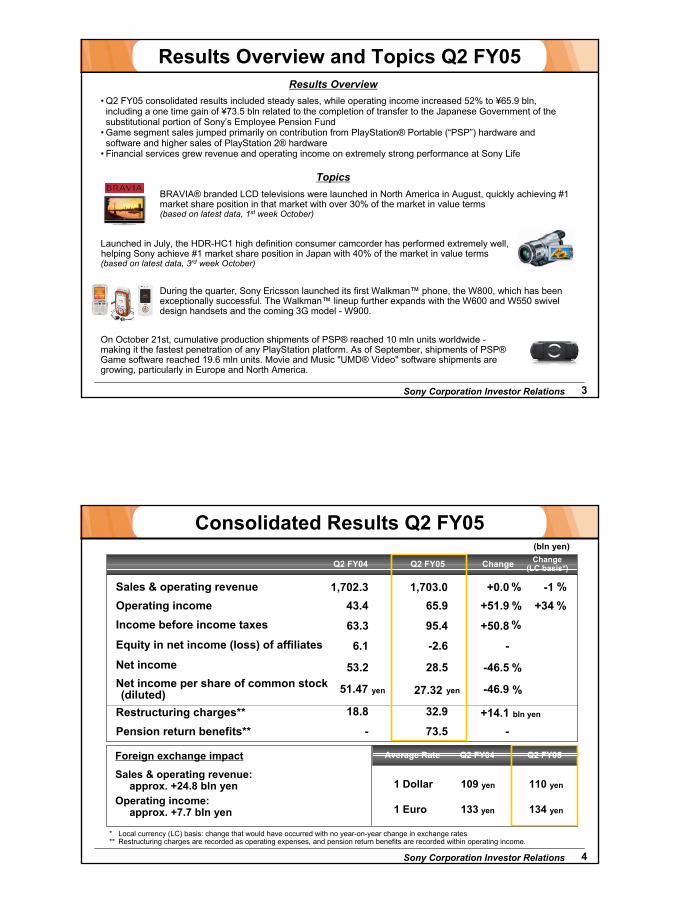
Results Overview and Topics Q2 FY05Results Overview
• Q2 FY05 consolidated results included steady sales, while operating income increased 52% to ¥65.9 bln, including a one time gain of ¥73.5 bln related to the completion of transfer to the Japanese Government of the substitutional portion of Sony’s Employee Pension Fund
• Game segment sales jumped primarily on contribution from PlayStation® Portable (“PSP”) hardware and software and higher sales of PlayStation 2® hardware
• Financial services grew revenue and operating income on extremely strong performance at Sony Life
BRAVIA® branded LCD televisions were launched in North America in August, quickly achieving #1 market share position in that market with over 30% of the market in value terms (based on latest data, 1st week October)
During the quarter, Sony Ericsson launched its first Walkman™ phone, the W800, which has been exceptionally successful. The Walkman™ lineup further expands with the W600 and W550 swivel design handsets and the coming 3G model - W900.
On October 21st, cumulative production shipments of PSP® reached 10 mln units worldwide -making it the fastest penetration of any PlayStation platform. As of September, shipments of PSP®Game software reached 19.6 mln units. Movie and Music "UMD® Video" software shipments are growing, particularly in Europe and North America.
Launched in July, the HDR-HC1 high definition consumer camcorder has performed extremely well, helping Sony achieve #1 market share position in Japan with 40% of the market in value terms(based on latest data, 3rd week October)
Topics
3
Sony Corporation Investor Relations
Net income per share of common stock (diluted)
(bln yen)
bln yen
Operating incomeIncome before income taxes
Net income
Restructuring charges**
Sales & operating revenue
133 yen
109 yen
134 yen
110 yen
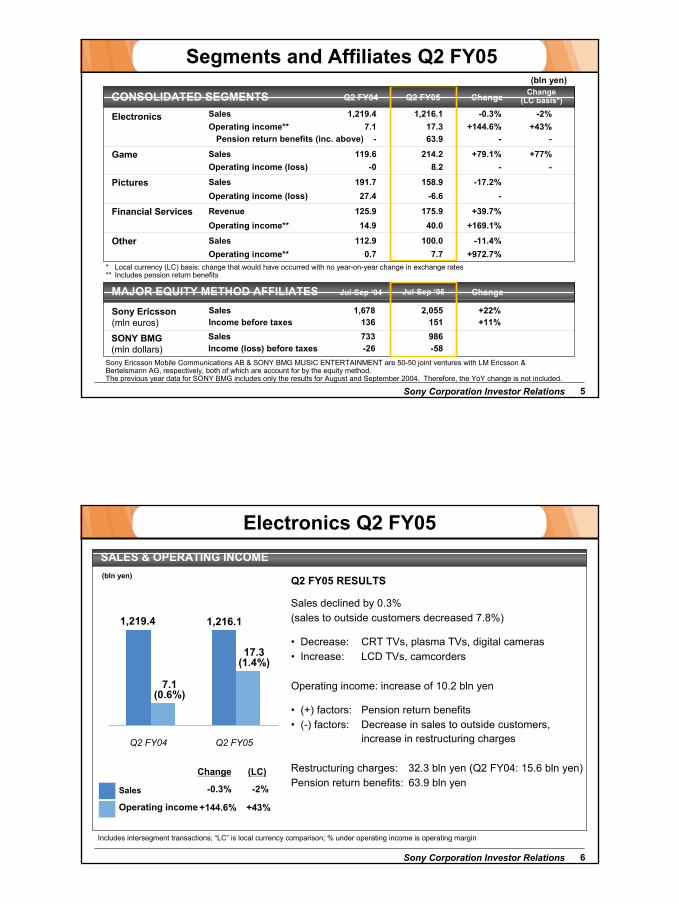
Foreign exchange impact
Sales & operating revenue: approx. +24.8 bln yen
Operating income: approx. +7.7 bln yen
* Local currency (LC) basis: change that would have occurred with no year-on-year change in exchange rates** Restructuring charges are recorded as operating expenses, and pension return benefits are recorded within operating income.
Equity in net income (loss) of affiliates
%
%
Q2 FY04 Change Change(LC basis*)Q2 FY05
1 Dollar
1 Euro
Q2 FY04Average Rate Q2 FY05
%
yen yen
Consolidated Results Q2 FY05
-1+34
1,702.343.4
63.3
53.2
1,703.065.9
95.4
28.5
+0.0+51.9
+50.8
6.1 -2.6
51.47 27.32
18.8 32.9 +14.1
-46.5
-
-46.9
% %
%
%
Pension return benefits** 73.5 --
4
3
Sony Corporation Investor Relations 5
(bln yen)
Electronics
Sony Ericsson Mobile Communications AB & SONY BMG MUSIC ENTERTAINMENT are 50-50 joint ventures with LM Ericsson & Bertelsmann AG, respectively, both of which are account for by the equity method.The previous year data for SONY BMG includes only the results for August and September 2004. Therefore, the YoY change is not included.
Q2 FY04 Change Change(LC basis*)Q2 FY05
SalesOperating income**
Game SalesOperating income (loss)
Pictures SalesOperating income (loss)
Financial Services RevenueOperating income**
Other SalesOperating income**
Sony Ericsson(mln euros)
SalesIncome before taxes
SONY BMG(mln dollars)
SalesIncome (loss) before taxes
CONSOLIDATED SEGMENTS
Jul-Sep ‘04 ChangeJul-Sep ‘05MAJOR EQUITY METHOD AFFILIATES
Segments and Affiliates Q2 FY05
-2%1,219.47.1
1,216.117.3
-0.3%
+77%119.6-0
214.28.2
+79.1%
191.727.4
158.9-6.6
-17.2%-
125.914.9
175.940.0
+39.7%+169.1%
112.9 100.0 -11.4%
1,678136
2,055151
+22%
986-58
+11%
0.7 7.7* Local currency (LC) basis: change that would have occurred with no year-on-year change in exchange rates** Includes pension return benefits
+144.6% +43%
-
+972.7%
-
Pension return benefits (inc. above) - 63.9 - -
733-26
Sony Corporation Investor Relations 6
Q2 FY05 RESULTS
Sales declined by 0.3% (sales to outside customers decreased 7.8%)
• Decrease: CRT TVs, plasma TVs, digital cameras• Increase: LCD TVs, camcorders
Operating income: increase of 10.2 bln yen
• (+) factors: Pension return benefits • (-) factors: Decrease in sales to outside customers,
increase in restructuring charges
Restructuring charges: 32.3 bln yen (Q2 FY04: 15.6 bln yen)Pension return benefits: 63.9 bln yen
(bln yen)
Includes intersegment transactions; “LC” is local currency comparison; % under operating income is operating margin
SALES & OPERATING INCOME
Electronics Q2 FY05
Sales
Change (LC)
Q2 FY04 Q2 FY05
1,219.4 1,216.1
7.1(0.6%)
17.3 (1.4%)
-0.3% -2%
+144.6% +43%Operating income

4
Sony Corporation Investor Relations 7
U.S.: -11% (LC -12%)
Europe: -8% (LC -8%)
Other Areas: +3% (LC -1%)
Japan: -19%
• Sales composition is based on customer location (yen basis)
Electronics Sales by Area Q2 FY05
• Increase: VAIO PCs, HDD and flash memory Walkman
• Decrease: Cellular phones, digital cameras, CRT TVs
• Increase: LCD TVs, LCD rear-projection TVs
• Decrease: VAIO PCs, CRT TVs, plasma TVs, digital cameras
• Increase: LCD TVs, camcorders, HDD and flash memory Walkman
• Decrease: CRT TVs, CD Walkman, digital cameras, plasma TVs
• Increase: Cellular phone camera modules, cellular phones, LCD rear-projection TVs
• Decrease: Optical pickups, CRT TVs, CRT projection TVs
• Sales are to outside customers and exclude operating revenue
Sales to outside customersexcluding operating revenue 1,082.1 bln yen, -8% (LC -10%)
34%
23%
19%
24%
Japan
U.S.Europe
Other
Sony Corporation Investor Relations 8
Electronics Operating Income Q2 FY05
17.37.1
Q2 FY04 Q2 FY05
(bln yen)
-22.5Sales decrease**
+7.1Foreign exchange
rate impact
-9.4Variable cost deterioration*
+8.9Fixed cost reduction* -4.8
Depreciation & amortization increase*
-14.1Others
-2.2
Loss on disposalof PP&E increase(net)
+63.9Pension
return benefits
* The basis for the calculation of fixed costs, variable costs, depreciation, amortization and other related costs excludes the impact of the transfer of disc manufacturing from the Music segment since Q2 FY04.
** Decrease in gross profit from the decrease in sales to outside customers.
-16.7Restructuring cost increase

5
Sony Corporation Investor Relations 9
AV & ITSales: 735.3 bln yen (-8%)Operating loss: 8.4 bln yen(deterioration of 6.0 bln yen)(-) factors: CRT TVs, LCD TVs, (+) factor: Camcorders, VAIO
PCs, broadcast equipment
Semiconductors & ComponentsSales: 381.9 bln yen (+12%)Operating loss: 13.5 bln yen (deterioration of 18.3 bln yen)(-) factors: CCD, low-temp
polysilicon TFT LCD
(bln yen)
Audio
Includes intersegment transactions
Q2 FY04 ChangeQ2 FY05
SalesOperating income (loss)
Video SalesOperating income
TelevisionSalesOperating income (loss)
Info. & Comm.SalesOperating income
SemiconductorsSalesOperating income (loss)
Components SalesOperating income
OtherSalesOperating income
ELECTRONICS CATEGORIES
Electronics by Category Q2 FY05
147.0-1.1
129.8
-1.4
-11.7%
248.61.5
247.921.4
-0.3%
212.2-4.8
171.7-37.7
-19.1%
+58.2%
191.02.0
185.9
9.3
-2.7%
150.20.9
183.8
-19.7
+22.4%
190.43.9
198.1
6.2
172.915.6
266.5
10.1
+1,365.8%
-35.4%
+4.0%
+54.1%
+366.4%
Sony Corporation Investor Relations 10
45444238
484541
3340
Q2FY03
Q3 Q4 Q1FY04
Q2 Q3 Q4 Q1FY05
Q2
Bar graph: Inventory levels (bln yen)Line graph: Inventory turnover (average beginning & ending inventory during the quarter divided by average daily sales in the quarter).FY03 inventory levels have been restated. From FY05, Aiwa inventory have been divided by region.
Electronics Inventory Levels by Area
(bln yen)
(days)
562.1 541.6606.9
496.0
688.5
570.9514.4
• 642.4 bln yen – a 46.1 bln yen decrease from the same period last year, and a 68.8 bln yen increase from the previous quarter.
573.6
Japan
North America
Europe
Other
Aiwa642.4

6
Sony Corporation Investor Relations 11
04 Jul-Sep 05 Jul-Sep
(mln euro)
% under operating income is operating margin
SALES & INCOME BEFORE TAXES
JUL-SEP 2005 RESULTS
EQUITY METHOD AFFILIATE
IMPACT TO SONYJUL-SEP ‘04 JUL-SEP ‘05
Sales
Income before taxes
Change
+17%76Equity in net income recorded by Sony (bln yen)
+16%10490Net income (mln euro)
ChangeJUL-SEP ’05
JUL-SEP ’04
+22%
+11%
1,678
136(8.1%)
2,055
151(7.3%)
• Record quarterly sales and income before taxes
• Hit models included: the K750 2 megapixel auto-focus camera phone, the W800 Walkman phone and K600 series mid-tier UMTS phones
• Unit shipments: 13.8 mln, up 29% YoY from 10.7 mln, with growth outpacing the industry. Share estimated at above 7%.
• Global market continued to grow faster than expected: full year industry forecast revised up to over 760 mln units
• 7 bln yen of equity in net income recorded by Sony
Sony Corporation Investor Relations 12
Q2 FY05 RESULTS
Sales: Significant increases from both hardware & software.
• Hardware: Significant contribution from PSP.PS2 sales increase in Europe and the U.S.
• Software: Contribution from PSP software.
Operating Favorable performance from both the PS2income: and PSP businesses.
Inventory: 114.9 bln yen as of Sept. 30 (+115.2% YoY). Increased to reflect PS2 & PSP demand.
(bln yen)
Includes intersegment transactions; “LC” is local currency comparison
SALES & OPERATING INCOME (LOSS)
Change
UNIT SHIPMENTS
Game Q2 FY05
(LC)
-9-PSP
-11%5056PS2Software(mln units)
-3.75-PSP
+152% 5.011.99PS2Hardware(mln units)
ChangeQ2 FY05Q2 FY04Q2 FY04 Q2 FY05
Sales
119.6
214.2
- 0
8.2(3.8%)
+79.1% +77%Operating income (loss) - -
7
Sony Corporation Investor Relations 13
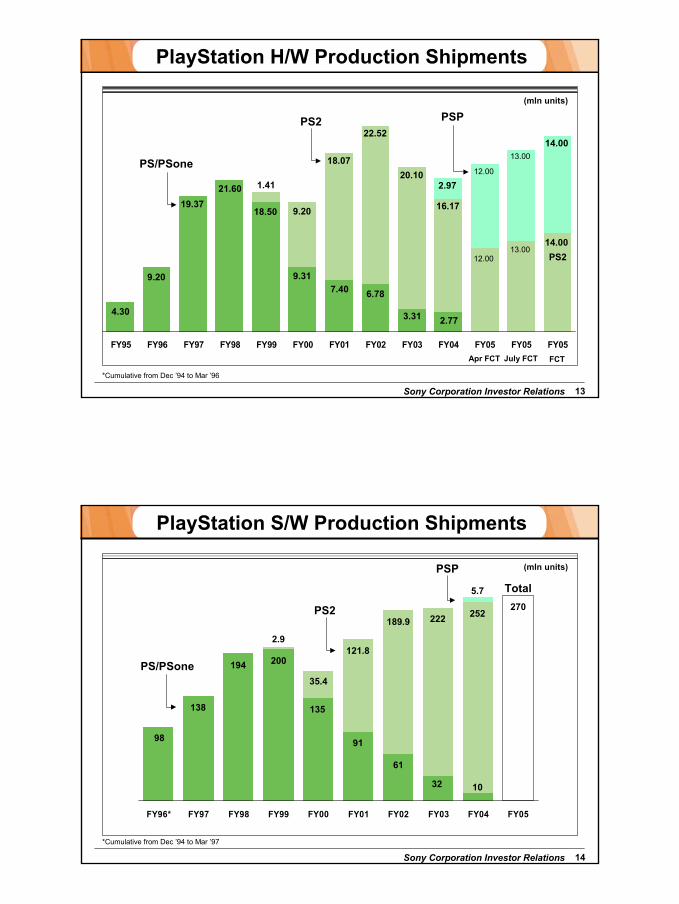
FY95 FY96 FY97 FY98 FY99 FY00 FY01 FY02 FY03 FY04 FY05 FY05 FY05
*Cumulative from Dec ’94 to Mar ’96
PlayStation H/W Production Shipments
PS2
PS/PSone
PSP
4.30 3.31
6.78
20.10
7.40
18.50
1.4121.6019.37
9.20
18.07
22.52
9.31
9.20
12.00
2.77
16.17
12.00
2.97
PS213.00
13.00
14.00
14.00
July FCT FCTApr FCT
(mln units)
Sony Corporation Investor Relations 14
(mln units)
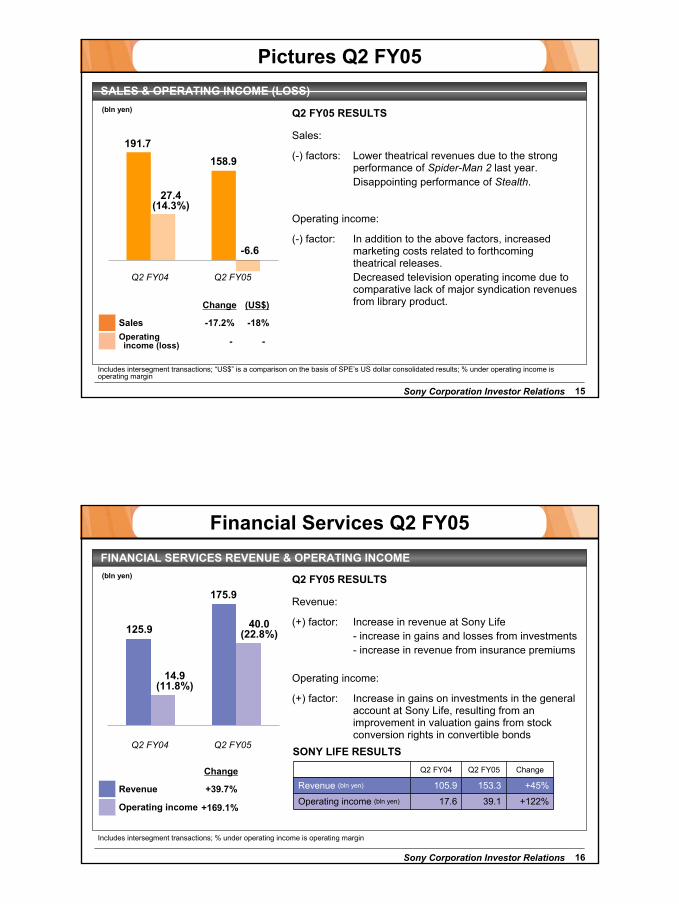
PlayStation S/W Production Shipments
*Cumulative from Dec ’94 to Mar ’97
FY96* FY97 FY98 FY99 FY00 FY01 FY02 FY03 FY04 FY05
10
PS/PSone 194 200
135
189.9
91
61
222
32
252
35.4
2.9
PS2
121.8
138
98
Total270
5.7
PSP
8
Sony Corporation Investor Relations 15
(bln yen)
Includes intersegment transactions; “US$” is a comparison on the basis of SPE’s US dollar consolidated results; % under operating income is operating margin
SALES & OPERATING INCOME (LOSS)
Sales
Change
Pictures Q2 FY05
(US$)
Q2 FY04 Q2 FY05
Q2 FY05 RESULTS
Sales:
(-) factors: Lower theatrical revenues due to the strong performance of Spider-Man 2 last year.Disappointing performance of Stealth.
Operating income:
(-) factor: In addition to the above factors, increased marketing costs related to forthcoming theatrical releases.Decreased television operating income due to comparative lack of major syndication revenues from library product.
191.7158.9
27.4(14.3%)
-6.6
-17.2% -18%
- -Operating income (loss)
Sony Corporation Investor Relations 16
0
200
400
600
800
1000
1200
1400
1600
1800
2004 2005
(bln yen)
Includes intersegment transactions; % under operating income is operating margin
FINANCIAL SERVICES REVENUE & OPERATING INCOME
Revenue
Operating income
Change
SONY LIFE RESULTS
+122%39.117.6Operating income (bln yen)
+45%153.3105.9Revenue (bln yen)
ChangeQ2 FY05Q2 FY04
Financial Services Q2 FY05
Q2 FY04 Q2 FY05
Q2 FY05 RESULTS
Revenue:
(+) factor: Increase in revenue at Sony Life- increase in gains and losses from investments- increase in revenue from insurance premiums
Operating income:
(+) factor: Increase in gains on investments in the general account at Sony Life, resulting from an improvement in valuation gains from stock conversion rights in convertible bonds
125.9
175.9
14.9(11.8%)
40.0(22.8%)
+39.7%
+169.1%

9
Sony Corporation Investor Relations 17
-10
10
30
50
70
90
110
130
150
(bln yen)
Includes intersegment transactions ; % under operating income is operating margin
SALES & OPERATING INCOME
Change
Other Q2 FY05
Sales
Q2 FY05 RESULTS
Includes SMEI’s music publishing business & SMEJ
In the same period last year, in addition to the above, SMEI's recorded music business was included for the month of July, leading to a YoYsales decline
SMEJ sales declined due to the absence of Porno Graffitti’s greatest hits albums, which were successful in the same period last year
Sales:
Improved largely due to pension return benefits recorded at a number of businesses in the segment, including SMEJ
Operating income:
Q2 FY04 Q2 FY05
112.9100.0
7.7(7.7%)
0.7(0.6%)
-11.4%
+972.7%Operating income
Sony Corporation Investor Relations 18
(mln dollars)
EQUITY METHOD AFFILIATE
Equity in net income (loss) recorded by Sony (bln yen)
Jul-Sep ’05
Sales 936
-3.2
Income (loss) before taxes -58
Net income (loss) -60
OPERATING RESULTS & IMPACT TO SONY
Restructuring charges 43
Losses were a result of restructuring charges recorded during the quarter and harsh market conditions in many territories worldwide, most notably in the U.S., Germany, the U.K., Italy, Spain and Australia.
Note: As of August 1, 2004, Sony and Bertelsmann AG combined their recorded music businesses in a joint venture. Sony accounts for SONY BMG MUSIC ENTERTAINMENT, a 50:50 joint venture, by the equity method with 50% of net income (loss) recorded as equity in net income (loss) of affiliates in Sony’s consolidated statements of income.
10
Sony Corporation Investor Relations 19
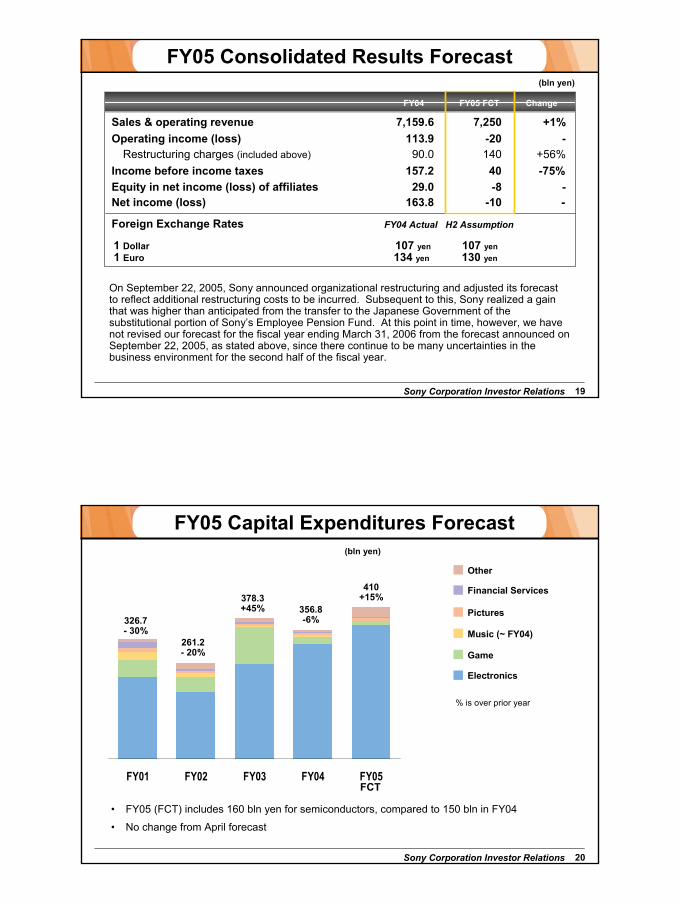
FY05 Consolidated Results Forecast
On September 22, 2005, Sony announced organizational restructuring and adjusted its forecast to reflect additional restructuring costs to be incurred. Subsequent to this, Sony realized a gain that was higher than anticipated from the transfer to the Japanese Government of the substitutional portion of Sony’s Employee Pension Fund. At this point in time, however, we have not revised our forecast for the fiscal year ending March 31, 2006 from the forecast announced on September 22, 2005, as stated above, since there continue to be many uncertainties in the business environment for the second half of the fiscal year.
Income before income taxes 157.2 40Equity in net income (loss) of affiliates 29.0 -8
(bln yen)
H2 AssumptionFY04 ActualForeign Exchange Rates
FY04 FY05 FCT
Net income (loss) 163.8 -10
Change
1 Dollar1 Euro
107 yen 107 yen134 yen 130 yen
Sales & operating revenue 7,159.6 7,250
Restructuring charges (included above) 90.0 140113.9 -20Operating income (loss) -
+1%
--
+56%-75%
Sony Corporation Investor Relations 20
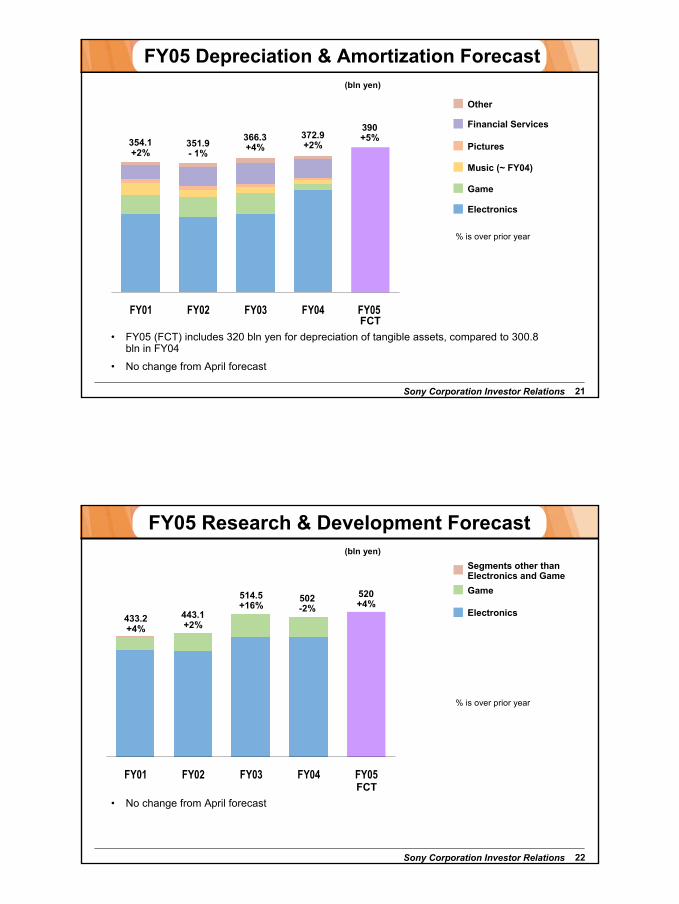
FY01 FY02 FY03 FY04 FY05
FY05 Capital Expenditures Forecast
Electronics
Other
Game
Music (~ FY04)
Pictures
% is over prior year
(bln yen)
326.7- 30%
261.2- 20%
410+15%378.3
+45% 356.8-6%
• FY05 (FCT) includes 160 bln yen for semiconductors, compared to 150 bln in FY04
• No change from April forecast
Financial Services
FCT
11
Sony Corporation Investor Relations 21
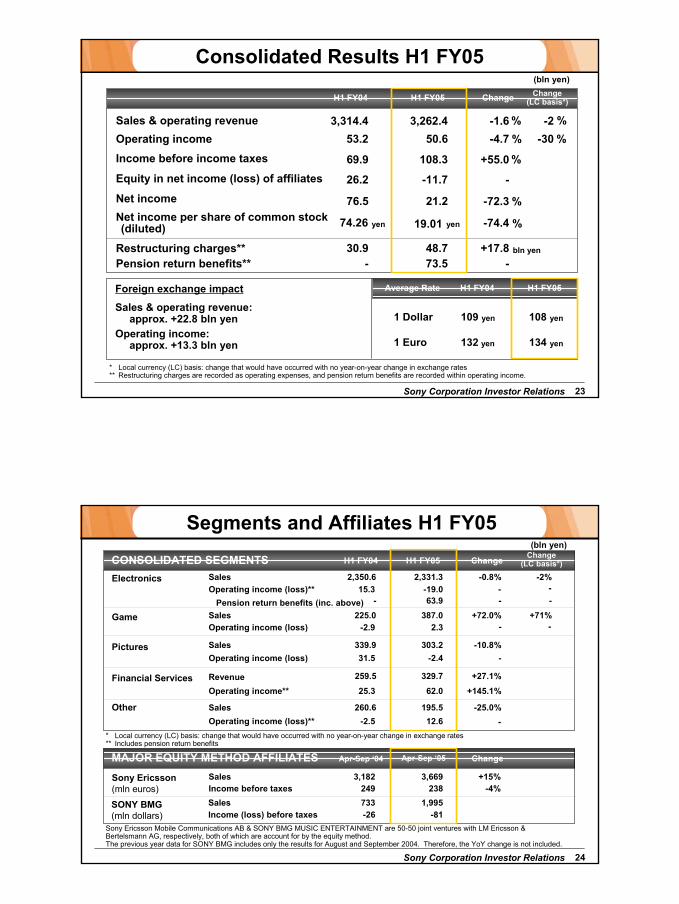
FY01 FY02 FY03 FY04 FY05
FY05 Depreciation & Amortization Forecast
Electronics
Other
Game
Pictures
Financial Services
% is over prior year
(bln yen)
354.1+2%
351.9- 1%
390+5%366.3
+4%372.9+2%
• FY05 (FCT) includes 320 bln yen for depreciation of tangible assets, compared to 300.8 bln in FY04
• No change from April forecast
Music (~ FY04)
FCT
Sony Corporation Investor Relations 22
FY01 FY02 FY03 FY04 FY05
FY05 Research & Development Forecast
% is over prior year
(bln yen)
433.2+4%
443.1+2%
520+4%
514.5+16%
502-2% Electronics
Segments other than Electronics and GameGame
FCT• No change from April forecast
12
Sony Corporation Investor Relations 23
Net income per share of common stock (diluted)
(bln yen)
bln yen
Operating incomeIncome before income taxes
Net income
Restructuring charges**
Sales & operating revenue
132 yen
109 yen
134 yen
108 yen
Foreign exchange impact
Sales & operating revenue: approx. +22.8 bln yen
Operating income: approx. +13.3 bln yen
Equity in net income (loss) of affiliates
%
%
H1 FY04 Change Change(LC basis*)H1 FY05
1 Dollar
1 Euro
H1 FY04Average Rate H1 FY05
%
yen yen
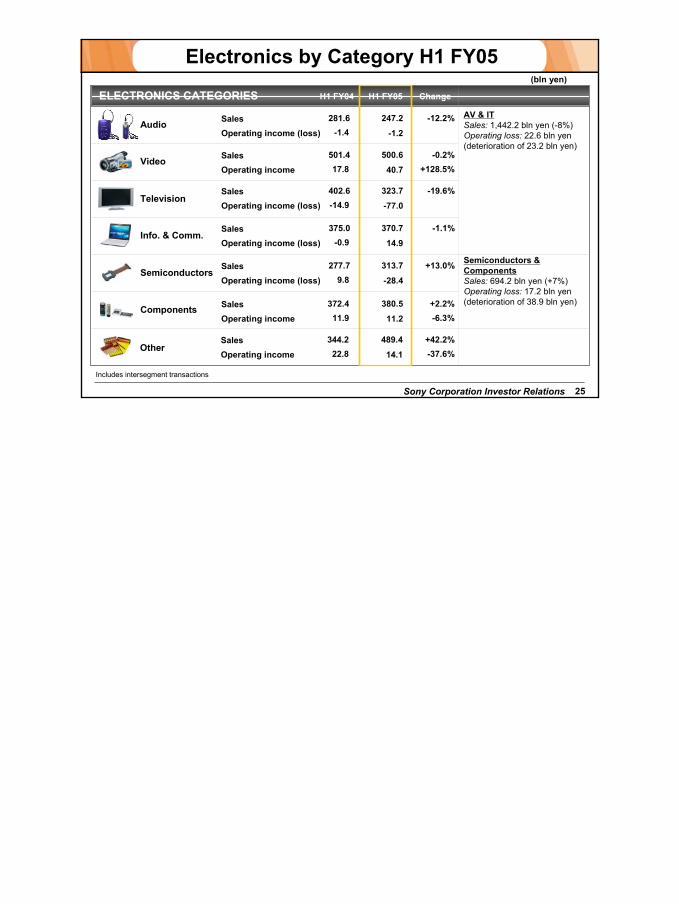
Consolidated Results H1 FY05
-2-30
3,314.453.2
69.9
76.5
3,262.450.6
108.3
21.2
-1.6-4.7
+55.0
26.2 -11.7
74.26 19.01
30.9 48.7 +17.8
-72.3
-
-74.4
% %
%
%
Pension return benefits** 73.5 --
* Local currency (LC) basis: change that would have occurred with no year-on-year change in exchange rates** Restructuring charges are recorded as operating expenses, and pension return benefits are recorded within operating income.
Sony Corporation Investor Relations 24
(bln yen)
Electronics
H1 FY04 Change Change(LC basis*)H1 FY05
SalesOperating income (loss)**
Game SalesOperating income (loss)
Pictures SalesOperating income (loss)
Financial Services RevenueOperating income**
Other SalesOperating income (loss)**
Sony Ericsson(mln euros)
SalesIncome before taxes
SONY BMG(mln dollars)
SalesIncome (loss) before taxes
CONSOLIDATED SEGMENTS
Apr-Sep ‘04 ChangeApr-Sep ‘05MAJOR EQUITY METHOD AFFILIATES
Segments and Affiliates H1 FY05
-2%2,350.615.3
2,331.3-19.0
-0.8%
+71%225.0-2.9
387.02.3
+72.0%
339.931.5
303.2-2.4
-10.8%-
259.525.3
329.762.0
+27.1%+145.1%
260.6 195.5 -25.0%
3,182249
3,669238
+15%
1,995-81
-4%
-2.5 12.6
-
-
-
-
-
- 63.9 - -
733-26
Sony Ericsson Mobile Communications AB & SONY BMG MUSIC ENTERTAINMENT are 50-50 joint ventures with LM Ericsson & Bertelsmann AG, respectively, both of which are account for by the equity method.The previous year data for SONY BMG includes only the results for August and September 2004. Therefore, the YoY change is not included.
Pension return benefits (inc. above)
* Local currency (LC) basis: change that would have occurred with no year-on-year change in exchange rates** Includes pension return benefits
13
Sony Corporation Investor Relations 25
AV & ITSales: 1,442.2 bln yen (-8%)Operating loss: 22.6 bln yen (deterioration of 23.2 bln yen)
Semiconductors & ComponentsSales: 694.2 bln yen (+7%)Operating loss: 17.2 bln yen (deterioration of 38.9 bln yen)
(bln yen)
Audio
Includes intersegment transactions
H1 FY04 H1 FY05
SalesOperating income (loss)
Video SalesOperating income
TelevisionSalesOperating income (loss)
Info. & Comm.SalesOperating income (loss)
SemiconductorsSalesOperating income (loss)
Components SalesOperating income
OtherSalesOperating income
ELECTRONICS CATEGORIES
Electronics by Category H1 FY05
281.6-1.4
247.2
-1.2
501.417.8
500.640.7
402.6-14.9
323.7-77.0
375.0-0.9
370.7
14.9
277.79.8
313.7
-28.4
372.411.9
380.5
11.2
344.222.8
489.4
14.1
Change
-12.2%
-0.2%
-19.6%
-6.3%
-1.1%
+13.0%
+128.5%
-37.6%
+2.2%
+42.2%