Briefing Session on Financial Results for FY2005 … · Briefing Session on Financial Results for...
35
1 © 2006 TBS Tokyo Broadcasting System, Inc. May 23, 2006 Tokyo Broadcasting System, Inc. May 23, 2006 Briefing Session on Financial Results for FY2005 and FY2006 Forecast Briefing Session on Financial Results for FY2005 and FY2006 Forecast © 2006 TBS
Transcript of Briefing Session on Financial Results for FY2005 … · Briefing Session on Financial Results for...

1
© 2006 TBS
Tokyo Broadcasting System, Inc.May 23, 2006
Tokyo Broadcasting System, Inc.May 23, 2006
Briefing Session onFinancial Results for FY2005
and FY2006 Forecast
Briefing Session onFinancial Results for FY2005
and FY2006 Forecast
© 2006 TBS
2
© 2006 TBS
President Hiroshi InoueManaging Director Kazuo HiramotoSenior Managing Director, Tokyo Broadcasting System Television, Inc.
Kenichiro KidokoroChairperson:
Vice President Head of Investor Relations Eiichiro Inai
Attendees of the SessionAttendees of the Session
3
© 2006 TBS
President Hiroshi Inoue
Financial Highlights for FY2005and FY2006 Forecast
Financial Highlights for FY2005and FY2006 Forecast
4
© 2006 TBS
Financial Highlights for FY2005Financial Highlights for FY2005
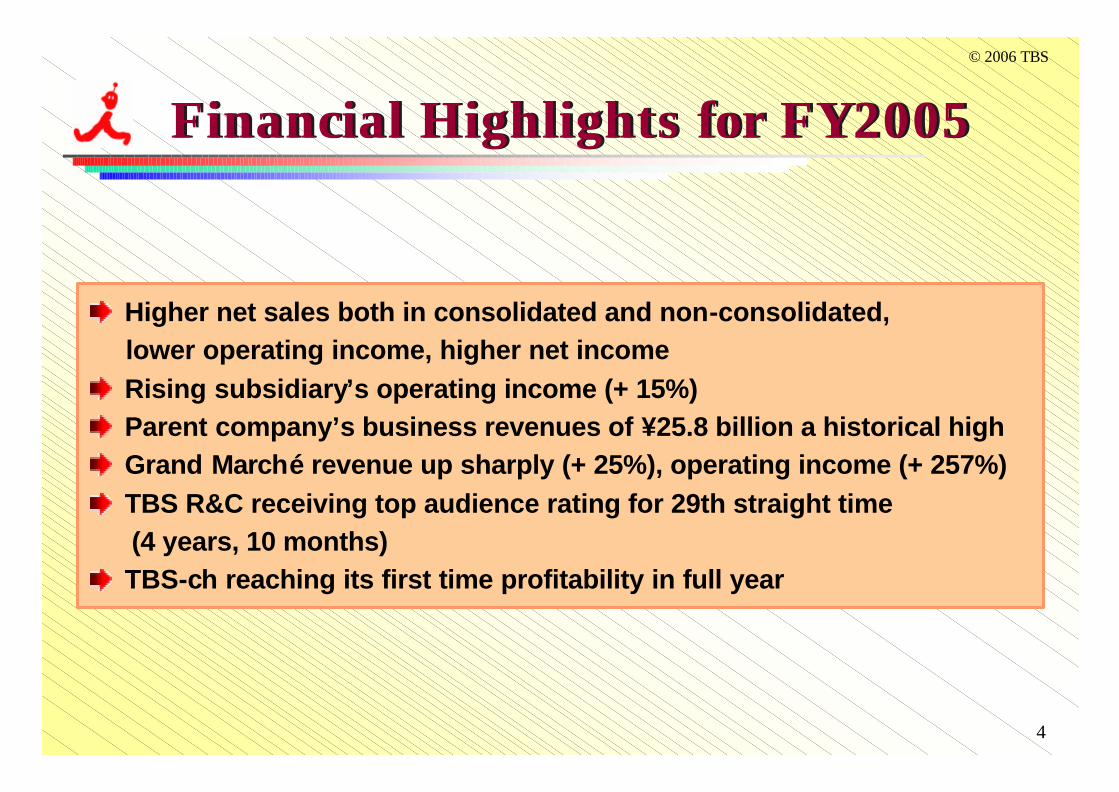
Higher net sales both in consolidated and non-consolidated,lower operating income, higher net incomeRising subsidiary’s operating income (+ 15%) Parent company’s business revenues of ¥25.8 billion a historical highGrand Marché revenue up sharply (+ 25%), operating income (+ 257%) TBS R&C receiving top audience rating for 29th straight time(4 years, 10 months) TBS-ch reaching its first time profitability in full year
5
© 2006 TBS
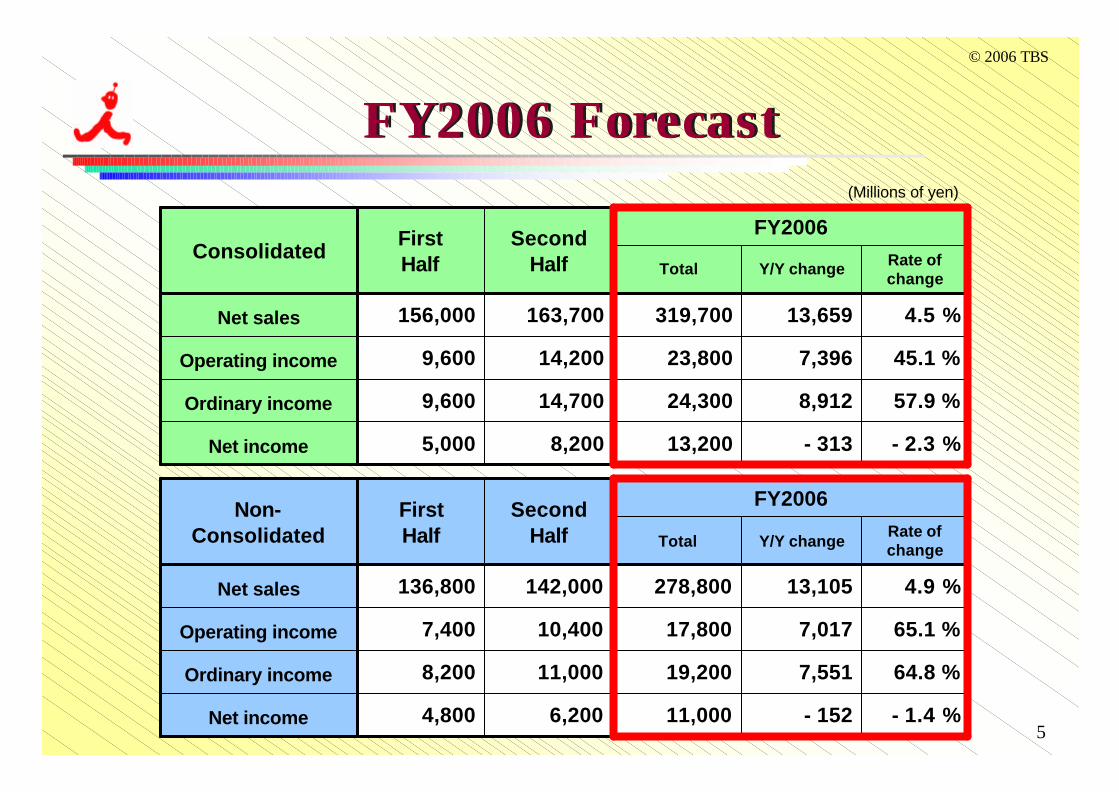
- 2.3 %- 31313,2008,2005,000Net income
57.9 %
45.1 %
4.5 %
Rate of change
8,91224,30014,7009,600Ordinary income
7,39623,80014,2009,600Operating income
13,659319,700163,700156,000Net sales
Y/Y changeTotal
FY2006Second Half
First Half
Consolidated
(Millions of yen)
- 1.4 %- 15211,0006,2004,800Net income
64.8 %
65.1 %
4.9 %
Rate of change
7,55119,20011,0008,200Ordinary income
7,01717,80010,4007,400Operating income
13,105278,800142,000136,800Net sales
Y/Y changeTotal
FY2006Second Half
First Half
Non-Consolidated
FY2006 Forecast FY2006 Forecast
6
© 2006 TBS
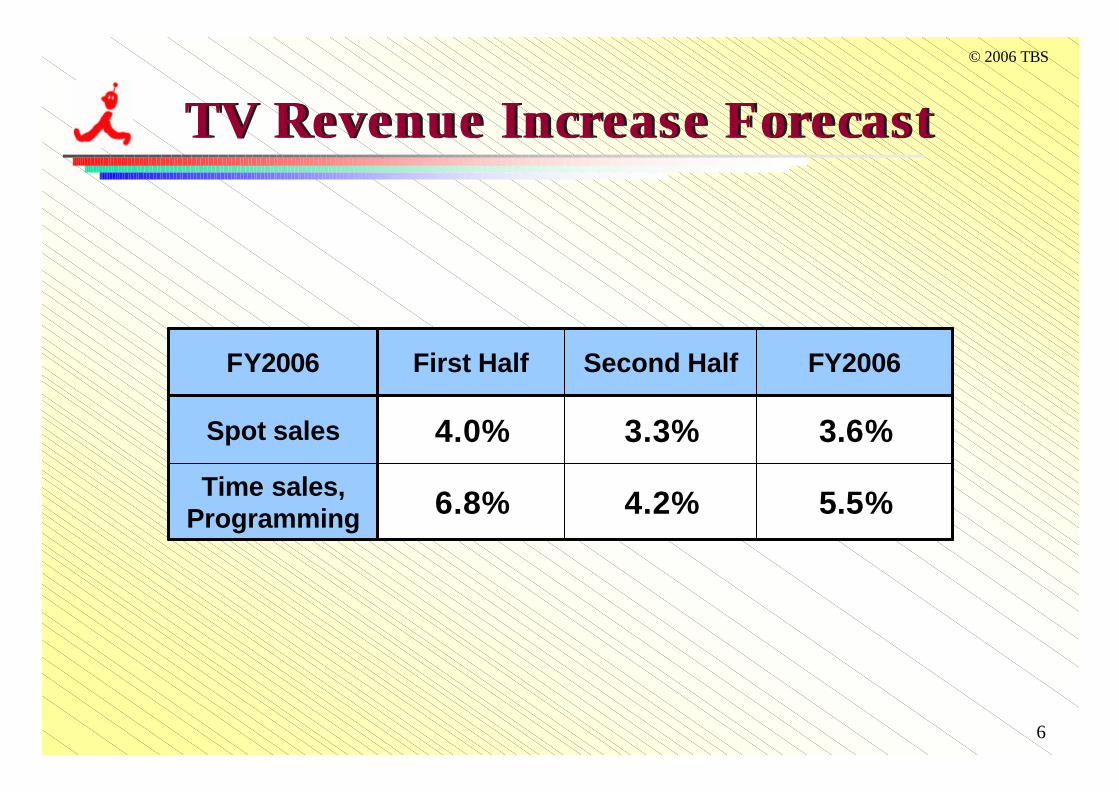
5.5%
3.6%
FY2006
4.2%
3.3%
Second Half
6.8%
4.0%
First Half
Time sales, Programming
Spot sales
FY2006
TV Revenue Increase ForecastTV Revenue Increase Forecast
7
© 2006 TBS
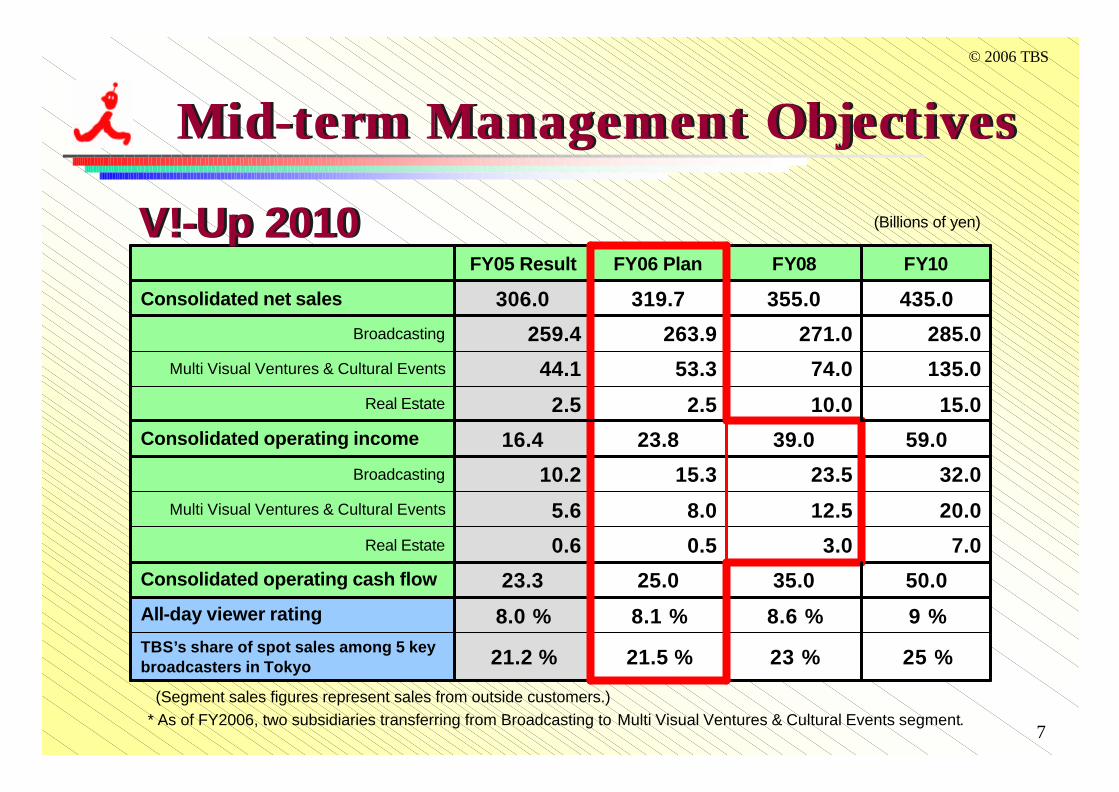
Mid-term Management ObjectivesMid-term Management Objectives
21.5 %
8.1 %
25.0
0.5
8.0
15.3
23.8
2.5
53.3
263.9
319.7
FY06 Plan
32.023.510.2Broadcasting
20.012.55.6Multi Visual Ventures & Cultural Events
7.03.00.6Real Estate
21.2 %
8.0 %
23.3
16.4
2.5
44.1
259.4
306.0
FY05 Result
25 %
9 %
50.0
59.0
15.0
135.0
285.0
435.0
FY10
23 %
8.6 %
35.0
39.0
10.0
74.0
271.0
355.0
FY08
Multi Visual Ventures & Cultural Events
TBS’s share of spot sales among 5 key broadcasters in Tokyo
All-day viewer rating
Consolidated operating cash flow
Consolidated operating income
Real Estate
Broadcasting
Consolidated net sales
(Billions of yen)
(Segment sales figures represent sales from outside customers.)* As of FY2006, two subsidiaries transferring from Broadcasting to Multi Visual Ventures & Cultural Events segment.
V!-Up 2010V!-Up 2010

8
© 2006 TBS
Companywide ThemesCompanywide Themes
●Setting V!-up Goals: Strategies for re-establishing TBS brand and
programming policies for FY2010
●Enhancing professionalism: Forming highly efficient and strongest contents
production team composed of specialists
●Personnel policies: Hiring and training personnel and devising
personnel policies for the new IT era
●Business development: Multi-utilized contents development, new business
development
●Business strategies for digital age: New advertising methods and marketing
development
●TBS Group strategies for digital era: Underlying V!-up support foundations for TBS
Group
Becoming a Professional TBS!Providing powerful contents with V!-up
V!-up 2010V!-up 2010
9
© 2006 TBS
Summary of FY2005 ResultsSummary of FY2005 Results
Managing DirectorManaging Director Kazuo Kazuo HiramotoHiramoto
10
© 2006 TBS
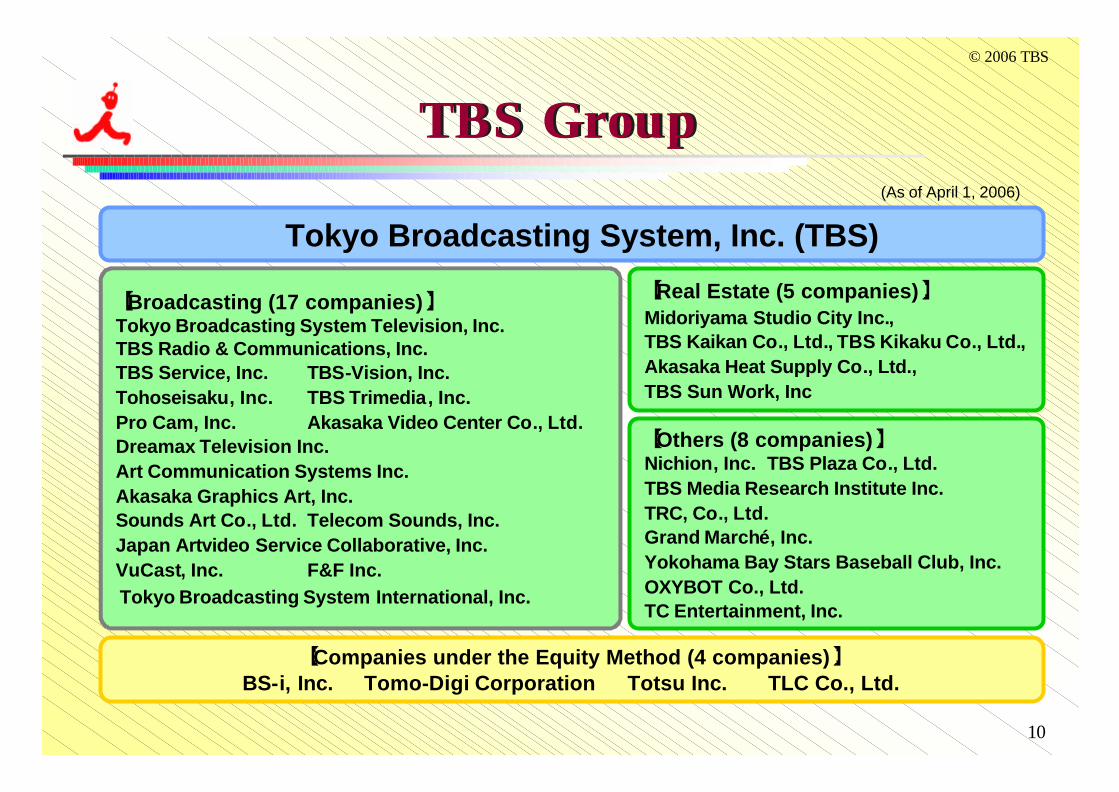
【Broadcasting (17 companies)】Tokyo Broadcasting System Television, Inc.TBS Radio & Communications, Inc.TBS Service, Inc. TBS-Vision, Inc.Tohoseisaku, Inc. TBS Trimedia, Inc.Pro Cam, Inc. Akasaka Video Center Co., Ltd.Dreamax Television Inc.Art Communication Systems Inc.Akasaka Graphics Art, Inc.Sounds Art Co., Ltd. Telecom Sounds, Inc.Japan Artvideo Service Collaborative, Inc.VuCast, Inc. F&F Inc.Tokyo Broadcasting System International, Inc.
【Real Estate (5 companies)】Midoriyama Studio City Inc., TBS Kaikan Co., Ltd., TBS Kikaku Co., Ltd.,Akasaka Heat Supply Co., Ltd.,TBS Sun Work, Inc
【Others (8 companies)】Nichion, Inc. TBS Plaza Co., Ltd.TBS Media Research Institute Inc.TRC, Co., Ltd.Grand Marché, Inc.Yokohama Bay Stars Baseball Club, Inc.OXYBOT Co., Ltd.TC Entertainment, Inc.
Tokyo Broadcasting System, Inc. (TBS)
【Companies under the Equity Method (4 companies)】BS-i, Inc. Tomo-Digi Corporation Totsu Inc. TLC Co., Ltd.
TBS GroupTBS Group(As of April 1, 2006)
11
© 2006 TBS
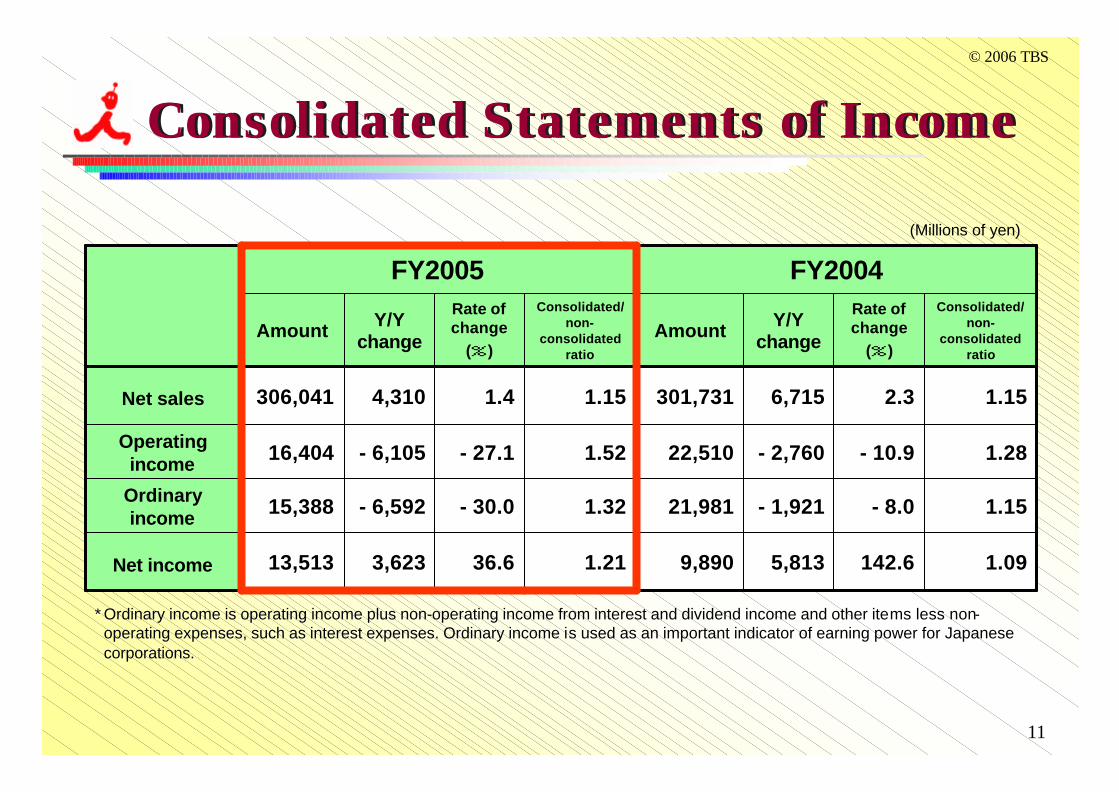
(Millions of yen)
1.09
1.15
1.28
1.15
Consolidated/non-
consolidated ratio
1.21
1.32
1.52
1.15
Consolidated/non-
consolidated ratio
2.36,715301,7311.44,310306,041Net sales
142.6
- 8.0
- 10.9
Rate of change
(%)
36.6
- 30.0
- 27.1
Rate of change
(%)
5,8139,8903,62313,513Net income
- 1,92121,981- 6,59215,388Ordinary income
- 2,76022,510- 6,10516,404Operating income
Y/Y changeAmountY/Y
changeAmount
FY2004FY2005
Consolidated Statements of IncomeConsolidated Statements of Income
** Ordinary income is operating income plus nonOrdinary income is operating income plus non--operating income from interest and dividend income and other iteoperating income from interest and dividend income and other items less nonms less non--operating expenses, such as interest expenses. Ordinary income ioperating expenses, such as interest expenses. Ordinary income is used as an important indicator of earning power for Japanese s used as an important indicator of earning power for Japanese corporations.corporations.

12
© 2006 TBS
(Millions of yen)
Consolidated Segment ResultsConsolidated Segment Results
- 100(0)——- 11(11)——Elimination or total
- 2,760
- 207
187
- 2,639
Y/Y change
- 6,105
-559
- 0
- 5,535
Y/Y change
15,689987258,37410,1531,043259,417Broadcasting
22,510
6,198
623
Operating income
16,404
5,639
623
Operating income
6,715301,7314,310306,041Consolidated
6,08140,8453,23344,078Other businesses
- 3522,512332,545Real estate
Y/Y change
Outside customers
Y/Y change
Outside customers
FY2004FY2005
13
© 2006 TBS
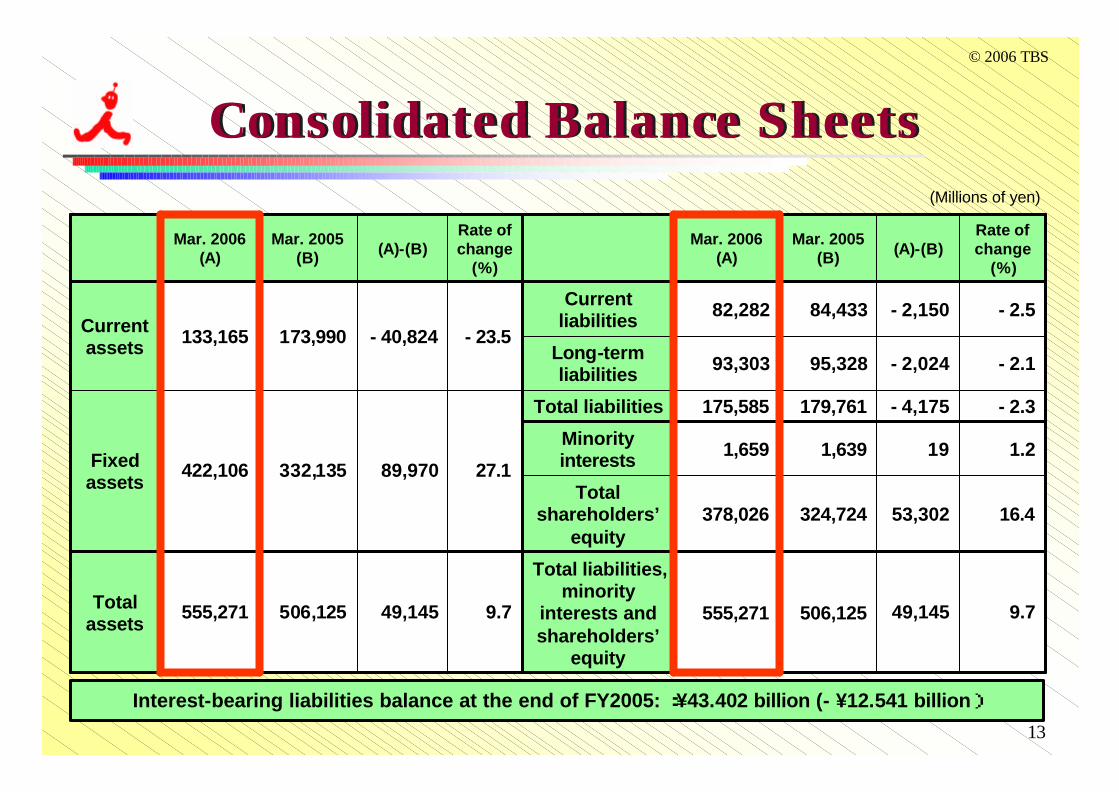
(Millions of yen)
9.749,145555,271 506,125Total assets
9.749,145506,125555,271
Total liabilities, minority
interests and shareholders’
equity
324,724Total
shareholders’equity
16.453,302378,026
1.2191,6391,659Minority interests
- 2.3- 4,175179,761175,585Total liabilities
27.189,970332,135422,106Fixed assets
- 2.1- 2,02495,32893,303Long-term liabilities
- 2.5- 2,15084,43382,282Current liabilities
- 23.5- 40,824173,990133,165Current assets
Rate of change
(%)(A)-(B)
Mar. 2005 (B)
Mar. 2006 (A)
Rate of change
(%)(A)-(B)
Mar. 2005 (B)
Mar. 2006 (A)
Interest-bearing liabilities balance at the end of FY2005: :¥43.402 billion (- ¥12.541 billion)
Consolidated Balance SheetsConsolidated Balance Sheets

14
© 2006 TBS
- 13,845
- 4,917
- 8,928
3,272
- 9,351
- 2,917
Y/Y change
57,53052,612Cash and cash equivalents at beginning of year
52,61238,767Cash and cash equivalents at end of year
(4,917)(13,845)Net increase (decrease) in cash and cash equivalents
9,34612,619Cash flows from financing activities
(40,466)(49,817)Cash flows from investing activities
26,17823,261Cash flows from operating activities
FY2004FY2005
(Millions of yen)
Consolidated Cash Flow ResultsConsolidated Cash Flow Results
15
© 2006 TBS
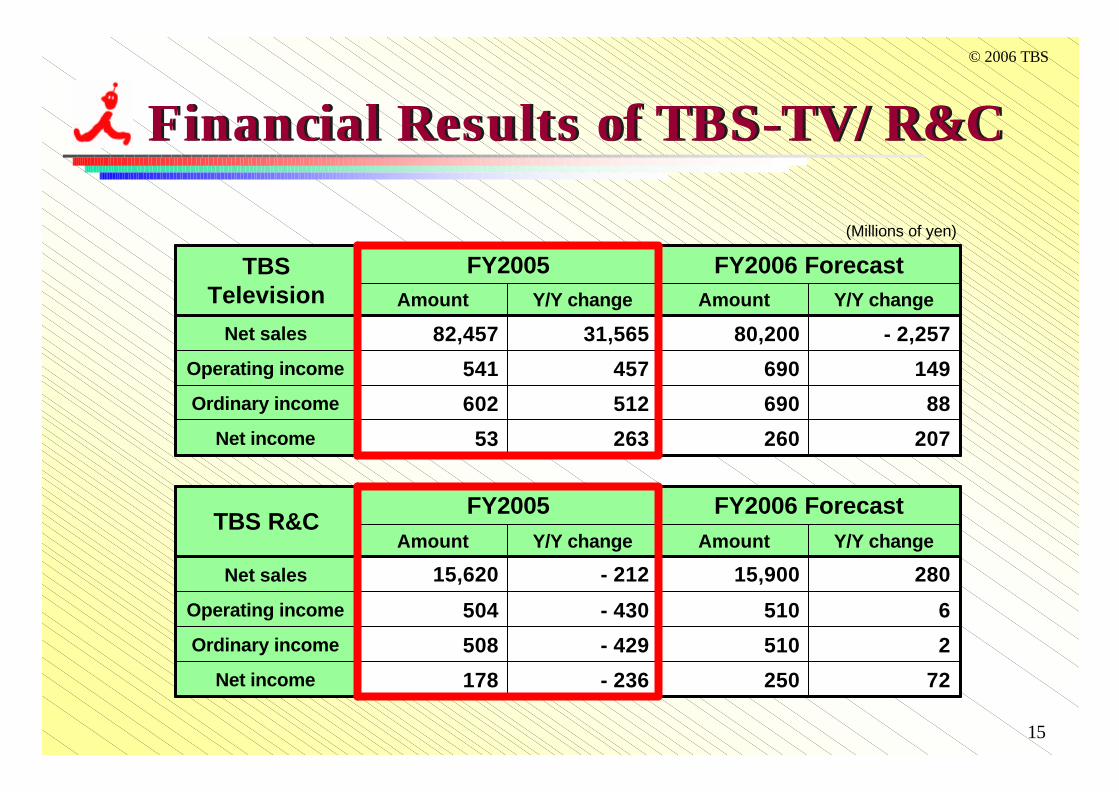
260
690
690
80,200
Amount
FY2006 Forecast
53
602
541
82,457
Amount
FY2005TBS Television
263
512
457
31,565
Y/Y change
207Net income
88Ordinary income
149Operating income
- 2,257Net sales
Y/Y change
(Millions of yen)
Financial Results of TBS-TV/ R&CFinancial Results of TBS-TV/ R&C
250
510
510
15,900
Amount
FY2006 Forecast
178
508
504
15,620
Amount
FY2005TBS R&C
- 236
- 429
- 430
- 212
Y/Y change
72Net income
2Ordinary income
6Operating income
280Net sales
Y/Y change
16
© 2006 TBS
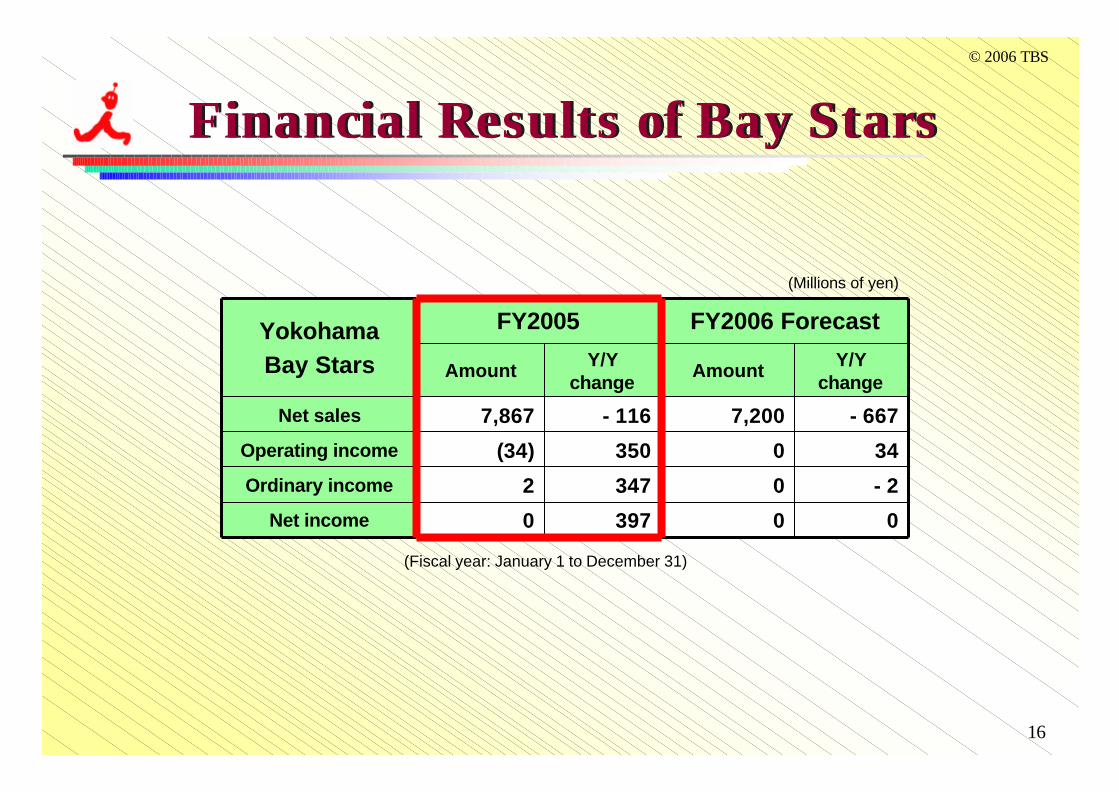
(Fiscal year: January 1 to December 31)
397
347
350
- 116
Y/Y change
0
2
(34)
7,867
Amount
FY2005
0
- 2
34
- 667
Y/Y change
0
0
0
7,200
Amount
FY2006 Forecast
Operating income
Net income
Ordinary income
Net sales
YokohamaBay Stars
(Millions of yen)
Financial Results of Bay StarsFinancial Results of Bay Stars
17
© 2006 TBS
(Millions of yen)
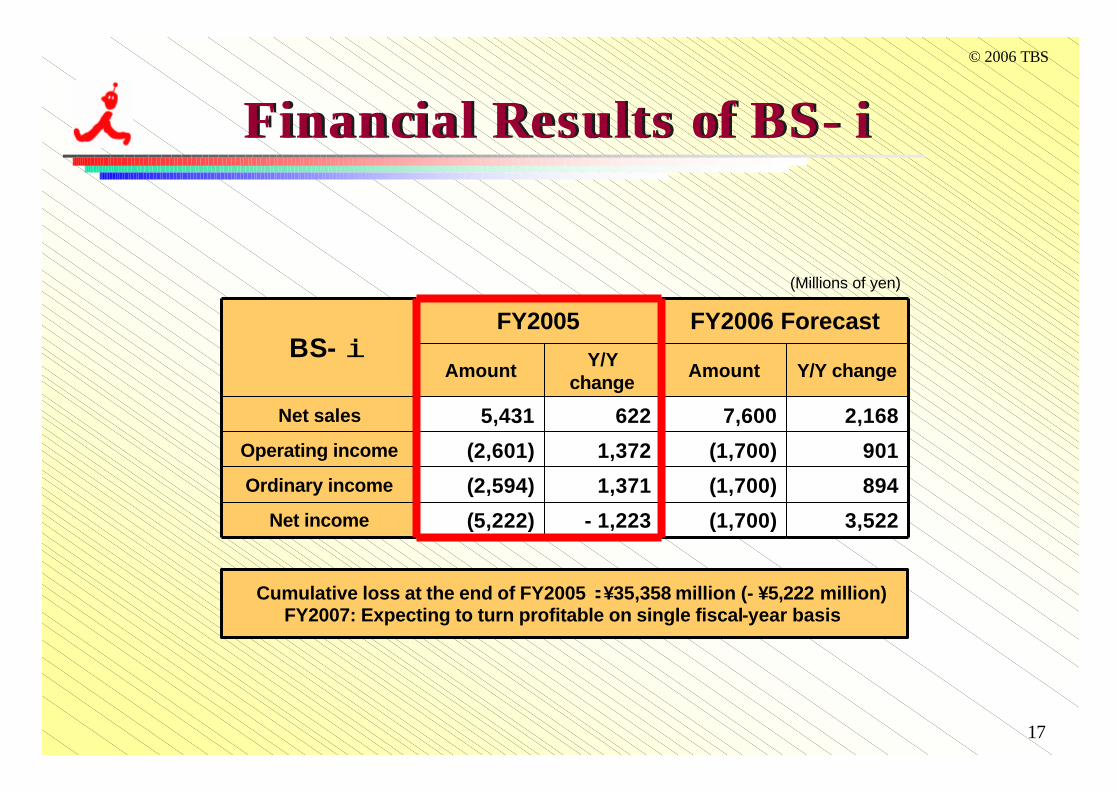
Cumulative loss at the end of FY2005 :¥35,358 million (- ¥5,222 million)FY2007: Expecting to turn profitable on single fiscal-year basis
Financial Results of BS- iFinancial Results of BS- i
- 1,223
1,371
1,372
622
Y/Y change
(5,222)
(2,594)
(2,601)
5,431
Amount
FY2005
3,522
894
901
2,168
Y/Y change
(1,700)
(1,700)
(1,700)
7,600
Amount
FY2006 Forecast
Operating income
Net income
Ordinary income
Net sales
BS- i

18
© 2006 TBS
FY2005 Result
13,530
22,423 5,944Capital investment
1,068Depreciation
Y/Y ChangeConsolidated
(Millions of yen)
Capital Expenditures& DepreciationCapital Expenditures& Depreciation
FY2005 Result
12,712
19,852 5,226Capital investment
1,055Depreciation
Y/Y Change
Non-Consolidated
(Forecasts at present time for FY2006 onward)
11.0
38.0
FY2007
12.2
26.5
FY2006
12.5
24.5
FY2008
12.5
11.0
FY2009
11.0
12.5
FY2010
(Billions of yen)
10.0
35.0
FY2007
11.5
25.5
FY2006
11.5
23.5
FY2008
11.5
9.0
FY2009
10.5
11.5
FY2010
19
© 2006 TBS
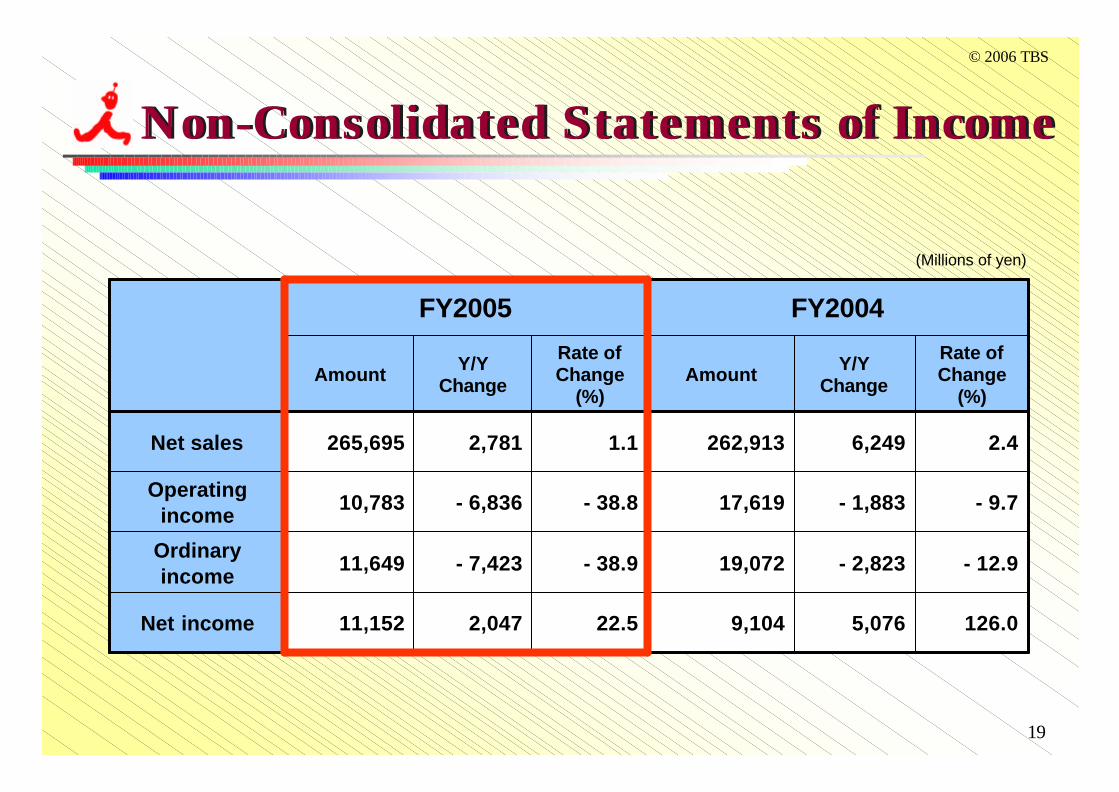
(Millions of yen)
FY2004FY2005
Rate of Change
(%)
Y/Y ChangeAmount
Rate of Change
(%)
Y/Y ChangeAmount
126.0
- 12.9
- 9.7
2.4
22.5
- 38.9
- 38.8
1.1
5,0769,1042,04711,152Net income
- 2,82319,072- 7,42311,649Ordinary income
- 1,88317,619- 6,83610,783Operating
income
6,249262,9132,781265,695Net sales
Non-Consolidated Statements of IncomeNon-Consolidated Statements of Income
20
© 2006 TBS
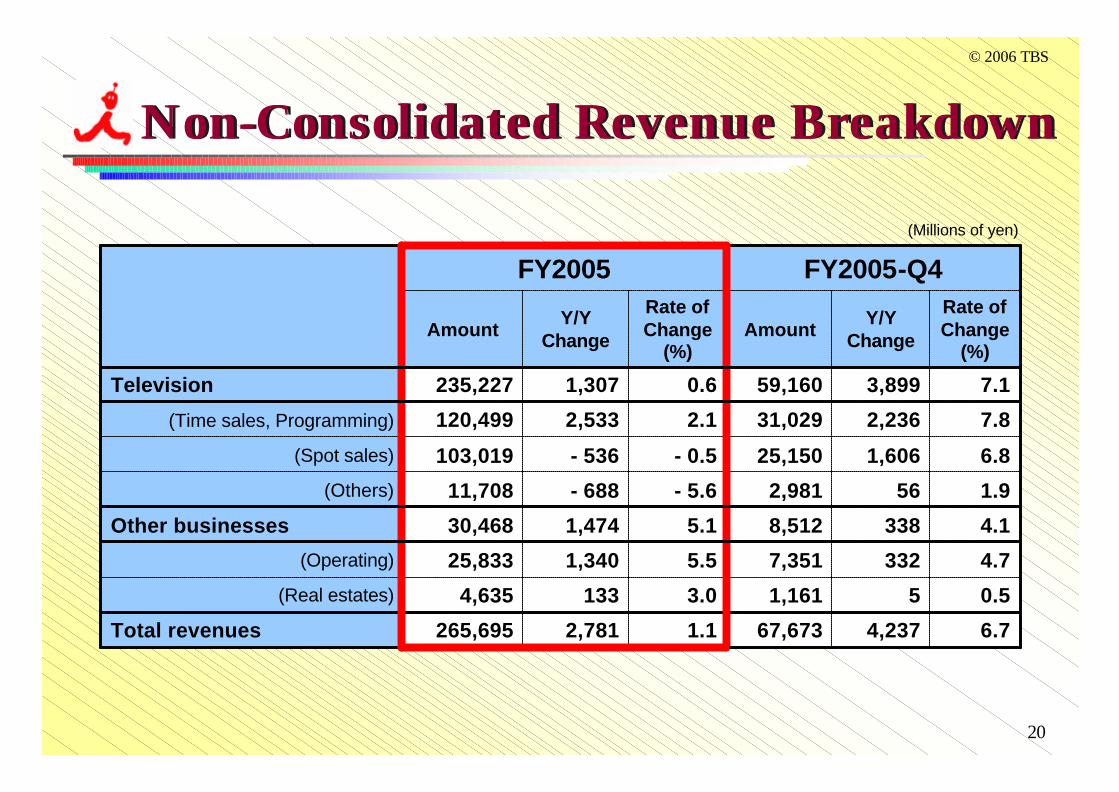
1.1
3.0
5.5
5.1
- 5.6
- 0.5
2.1
0.6
Rate of Change
(%)
2,781
133
1,340
1,474
- 688
- 536
2,533
1,307
Y/Y Change
265,695
4,635
25,833
30,468
11,708
103,019
120,499
235,227
Amount
FY2005Rate of Change
(%)
Y/Y ChangeAmount
67,673
1,161
7,351
8,512
2,981
25,150
31,029
59,160
FY2005-Q4
4,237
5
332
338
56
1,606
2,236
3,899
6.8(Spot sales)
6.7Total revenues
0.5(Real estates)
4.7(Operating)
4.1Other businesses
1.9(Others)
7.8(Time sales, Programming)
7.1Television
(Millions of yen)
Non-Consolidated Revenue BreakdownNon-Consolidated Revenue Breakdown
21
© 2006 TBS
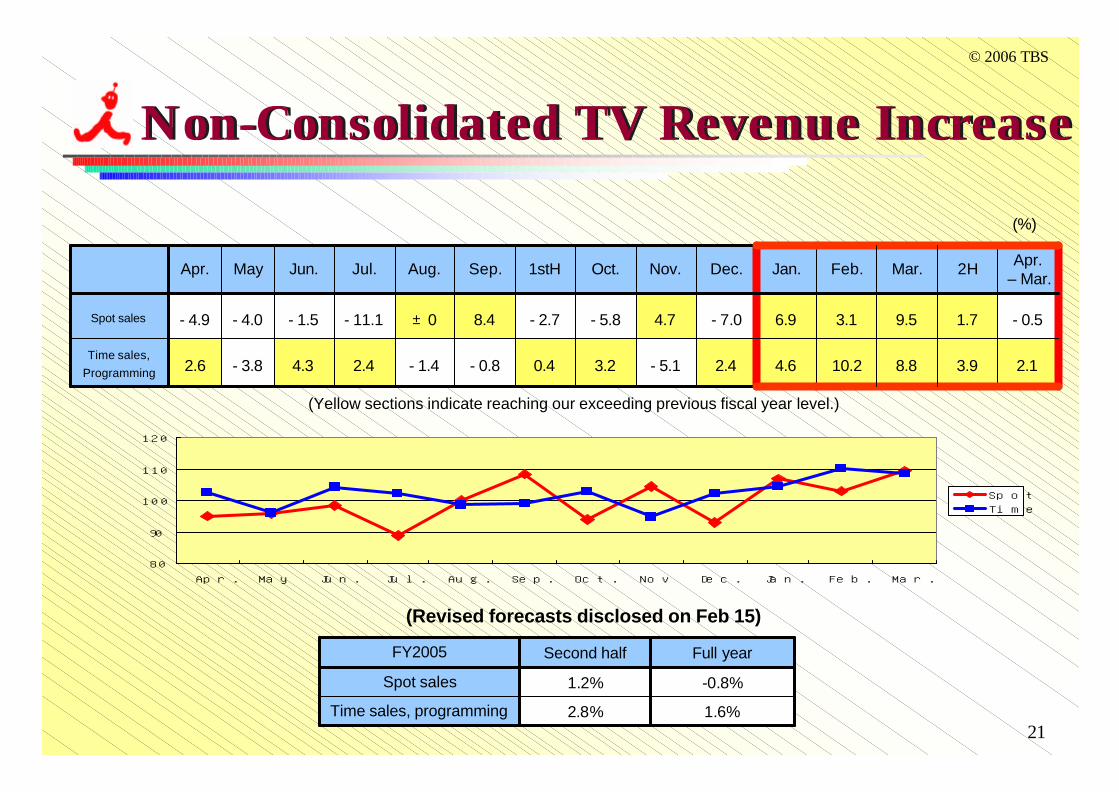
10.2
3.1
Feb.
8.8
9.5
Mar.
4.6
6.9
Jan.
- 0.8
8.4
Sep.
- 5.1
4.7
Nov.
3.2
- 5.8
Oct.
0.4
- 2.7
1stH
- 1.4
±0
Aug.
2.4
- 11.1
Jul.
2.6
- 4.9
Apr.
- 3.8
- 4.0
May
4.3
- 1.5
Jun.
2.13.92.4Time sales,
Programming
- 0.51.7- 7.0Spot sales
Apr. – Mar.
2HDec.
(%)
80
90
100
110
120
Apr. May Jun. Jul. Aug. Sep. Oct. Nov Dec. Jan. Feb. Mar.
SpotTime
Non-Consolidated TV Revenue IncreaseNon-Consolidated TV Revenue Increase
1.6%
-0.8%
Full year
2.8%
1.2%
Second half
Time sales, programming
Spot sales
FY2005
(Revised forecasts disclosed on Feb 15)
(Yellow sections indicate reaching our exceeding previous fiscal year level.)
22
© 2006 TBS
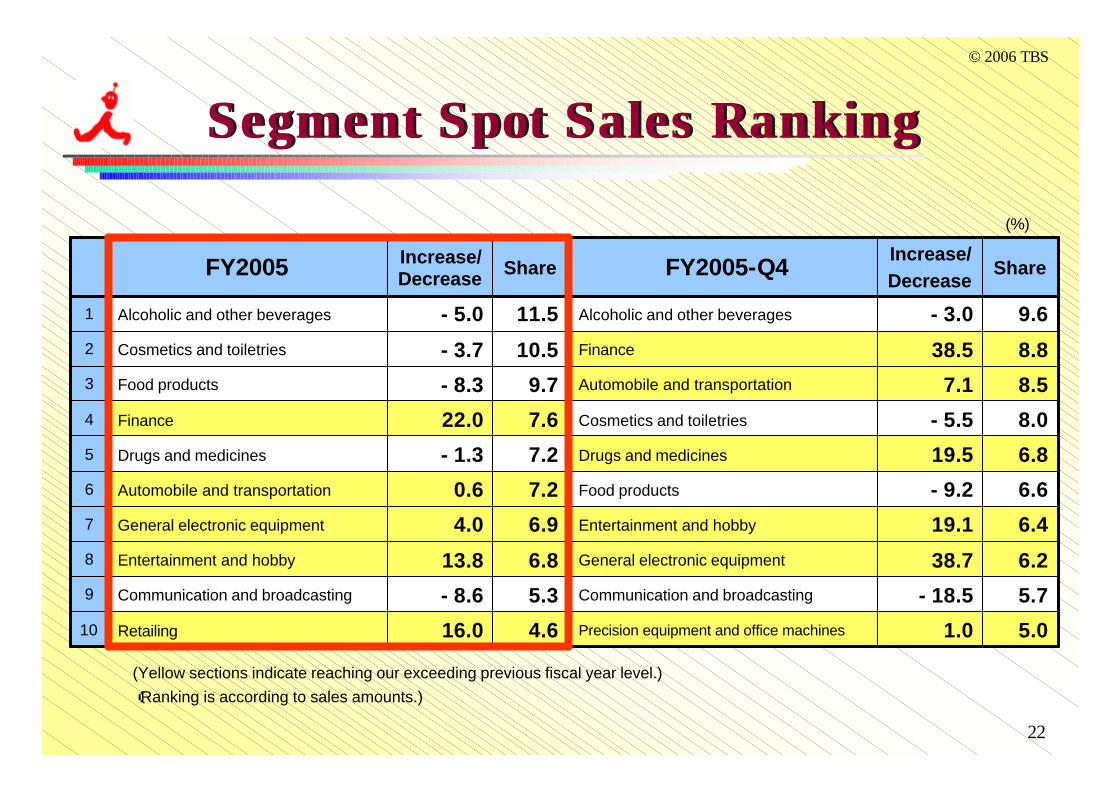
5.0
5.7
6.2
6.4
6.6
6.8
8.0
8.5
8.8
9.6
Share
1.0
- 18.5
38.7
19.1
- 9.2
19.5
- 5.5
7.1
38.5
- 3.0
Increase/Decrease
Precision equipment and office machines
Communication and broadcasting
General electronic equipment
Entertainment and hobby
Food products
Drugs and medicines
Cosmetics and toiletries
Automobile and transportation
Finance
Alcoholic and other beverages
FY2005-Q4
4.6
5.3
6.8
6.9
7.2
7.2
7.6
9.7
10.5
11.5
Share
- 1.3Drugs and medicines5
22.0Finance4
- 8.3Food products3
- 3.7Cosmetics and toiletries2
- 5.0Alcoholic and other beverages1
16.0Retailing10
- 8.6Communication and broadcasting9
13.8Entertainment and hobby8
4.0General electronic equipment7
0.6Automobile and transportation6
Increase/DecreaseFY2005
(Ranking is according to sales amounts.)
(%)
Segment Spot Sales RankingSegment Spot Sales Ranking
(Yellow sections indicate reaching our exceeding previous fiscal year level.)
23
© 2006 TBS
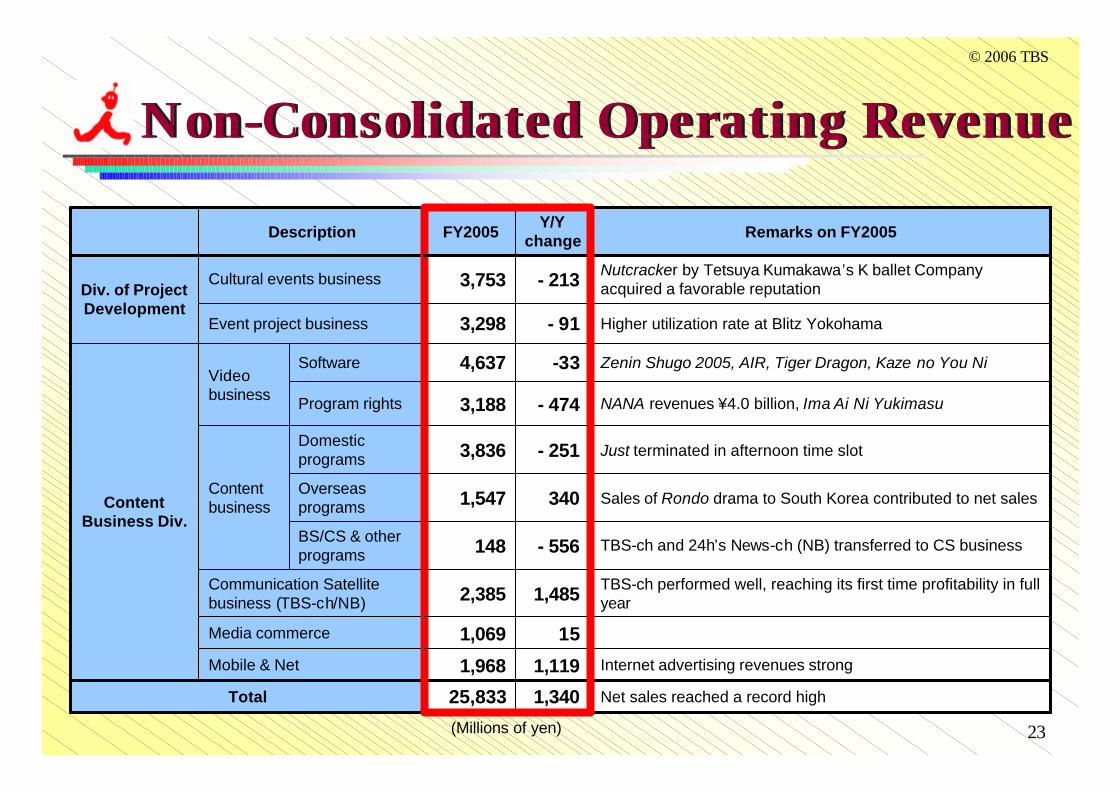
25,833
1,968
1,069
2,385
148
1,547
3,836
3,188
4,637
3,298
3,753
FY2005
BS/CS & other programs
Overseas programs
Domestic programs
Program rights
Software
1,340
1,119
15
1,485
- 556
340
- 251
- 474
-33
- 91
- 213
Y/Y change
Total
Content Business Div.
Div. of Project Development
Mobile & Net
Zenin Shugo 2005, AIR, Tiger Dragon, Kaze no You NiVideo business
Nutcracker by Tetsuya Kumakawa’s K ballet Company acquired a favorable reputation
Cultural events business
Internet advertising revenues strong
TBS-ch and 24h’s News-ch (NB) transferred to CS business
Sales of Rondo drama to South Korea contributed to net sales
NANA revenues ¥4.0 billion, Ima Ai Ni Yukimasu
Net sales reached a record high
Media commerce
TBS-ch performed well, reaching its first time profitability in full year
Communication Satellite business (TBS-ch/NB)
Just terminated in afternoon time slot
Content business
Higher utilization rate at Blitz Yokohama Event project business
Remarks on FY2005Description
(Millions of yen)
Non-Consolidated Operating RevenueNon-Consolidated Operating Revenue
24
© 2006 TBS
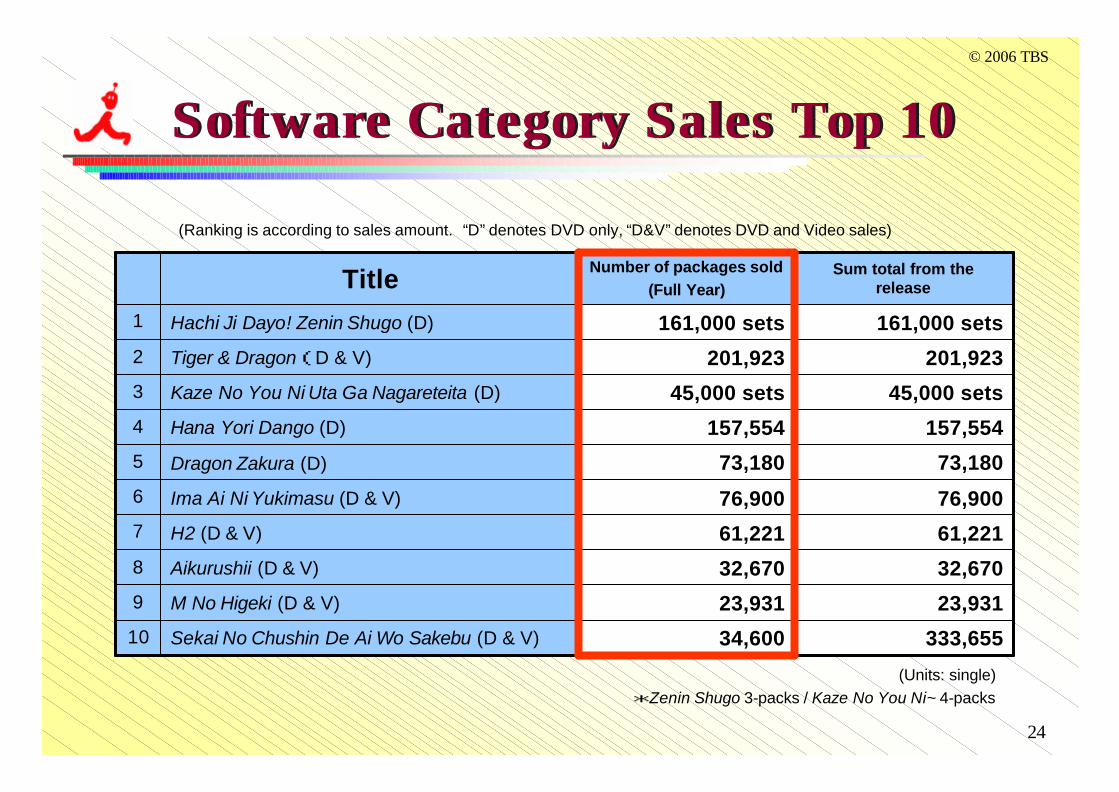
157,554157,554Hana Yori Dango (D)4
34,600
23,931
32,670
61,221
76,900
73,180
45,000 sets
201,923
161,000 sets
Number of packages sold(Full Year)
333,655
23,931
32,670
61,221
76,900
73,180
45,000 sets
201,923
161,000 sets
Sum total from the release
H2 (D & V)7
M No Higeki (D & V)9
Sekai No Chushin De Ai Wo Sakebu (D & V)10
Aikurushii (D & V)8
Ima Ai Ni Yukimasu (D & V)6
Dragon Zakura (D)5
Kaze No You Ni Uta Ga Nagareteita (D)3
Tiger & Dragon(D & V)2
Hachi Ji Dayo! Zenin Shugo (D)1
Title
Software Category Sales Top 10Software Category Sales Top 10
(Ranking is according to sales amount. “D” denotes DVD only, “D&V” denotes DVD and Video sales)
(Units: single) *Zenin Shugo 3-packs / Kaze No You Ni~ 4-packs

25
© 2006 TBS
0.829.930.8Third Quarter
4.0
2.1
1.3
1.9
2.6
- 0.7
Y/Y change
29.330.6Fourth Quarter
61.663.5First half
30.229.5First Quarter
31.334.0Second Quarter
59.361.4Second half
120.9
FY2004
124.9
FY2005
123.5Full year
FY2006Forecast
TV Program (Production) CostTV Program (Production) Cost
(Reference)Main expenses included in the TV program cost
☆ Direct cost: Program production cost, agent commission fee, guarantee, etc.☆ Indirect cost: Personnel expenses, art construction cost, technical fabrication cost,
depreciation, etc.
(Billions of yen)

26
© 2006 TBS
Viewer Ratings in FY2005 & Programming Policies for FY2006
Viewer Ratings in FY2005 & Programming Policies for FY2006
Senior Managing Director, Senior Managing Director, Tokyo Broadcasting System Television, Inc.Tokyo Broadcasting System Television, Inc.
KenichiroKenichiro KidokoroKidokoro
27
© 2006 TBS
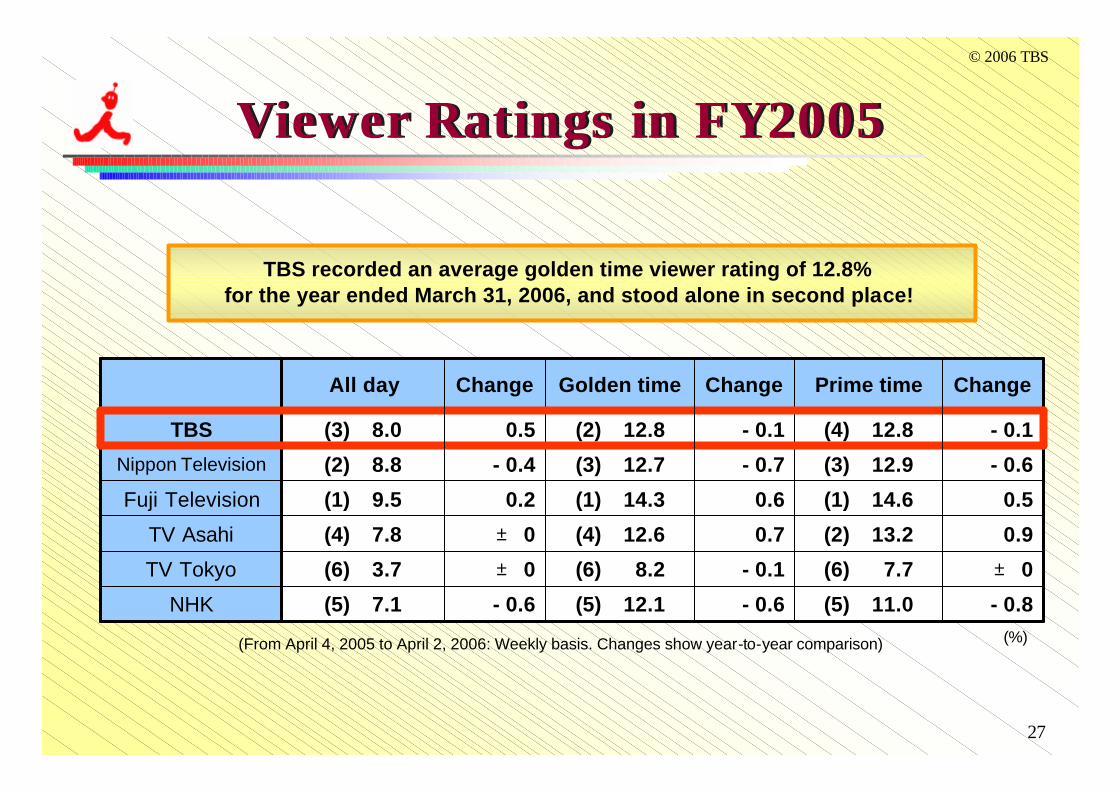
± 0(6) 7.7- 0.1(6) 8.2± 0(6) 3.7TV Tokyo
- 0.8(5) 11.0- 0.6(5) 12.1 - 0.6(5) 7.1NHK
(2) 13.2
(1) 14.6
(3) 12.9
(4) 12.8
Prime time
(4) 12.6
(1) 14.3
(3) 12.7
(2) 12.8
Golden time
(4) 7.8
(1) 9.5
(2) 8.8
(3) 8.0
All day
0.90.7± 0TV Asahi
0.50.60.2Fuji Television
- 0.6- 0.7- 0.4Nippon Television
- 0.1- 0.10.5TBS
ChangeChangeChange
(%)(From April 4, 2005 to April 2, 2006: Weekly basis. Changes show year-to-year comparison)
Viewer Ratings in FY2005Viewer Ratings in FY2005
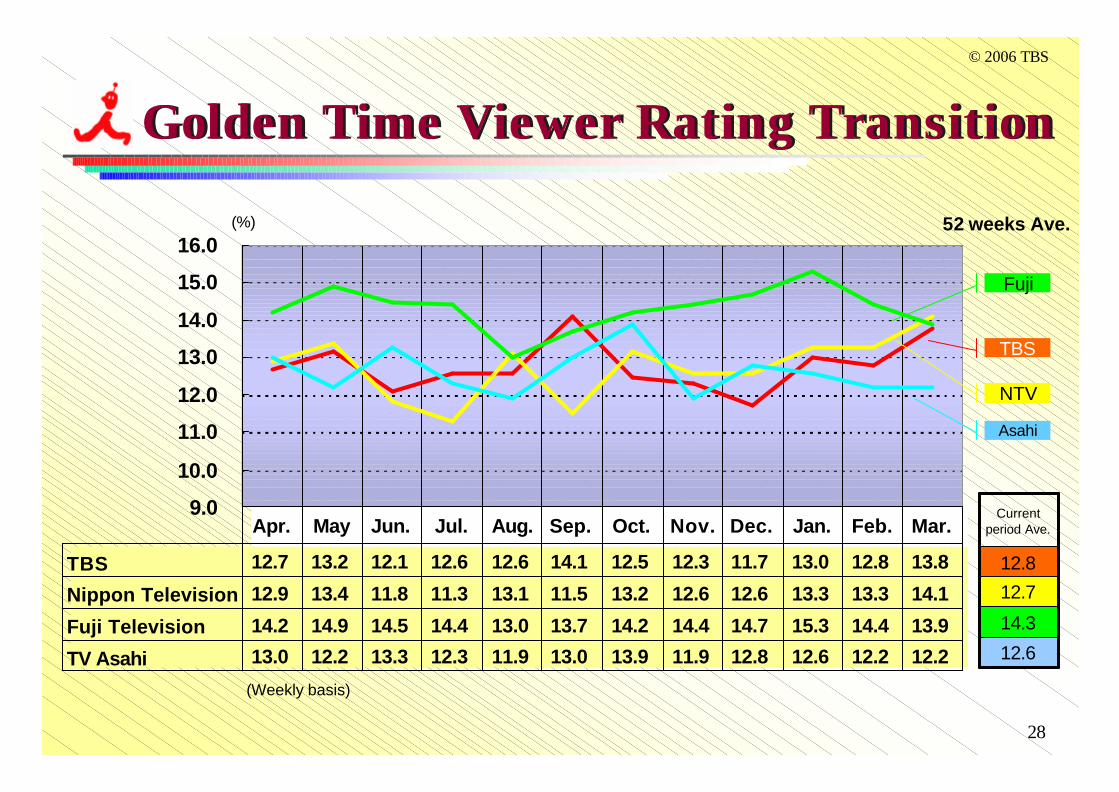
TBS recorded an average golden time viewer rating of 12.8% for the year ended March 31, 2006, and stood alone in second place!
28
© 2006 TBS
(%)
Golden Time Viewer Rating TransitionGolden Time Viewer Rating Transition
(Weekly basis))
12.6
14.3
12.7
12.8
Current period Ave.
52 weeks Ave.
9.0
10.0
11.0
12.0
13.0
14.0
15.0
16.0
TBS 12.7 13.2 12.1 12.6 12.6 14.1 12.5 12.3 11.7 13.0 12.8 13.8
Nippon Television 12.9 13.4 11.8 11.3 13.1 11.5 13.2 12.6 12.6 13.3 13.3 14.1
Fuji Television 14.2 14.9 14.5 14.4 13.0 13.7 14.2 14.4 14.7 15.3 14.4 13.9
TV Asahi 13.0 12.2 13.3 12.3 11.9 13.0 13.9 11.9 12.8 12.6 12.2 12.2
Apr. May Jun. Jul. Aug. Sep. Oct. Nov. Dec. Jan. Feb. Mar.
Fuji
Asahi
NTV
TBS
29
© 2006 TBS
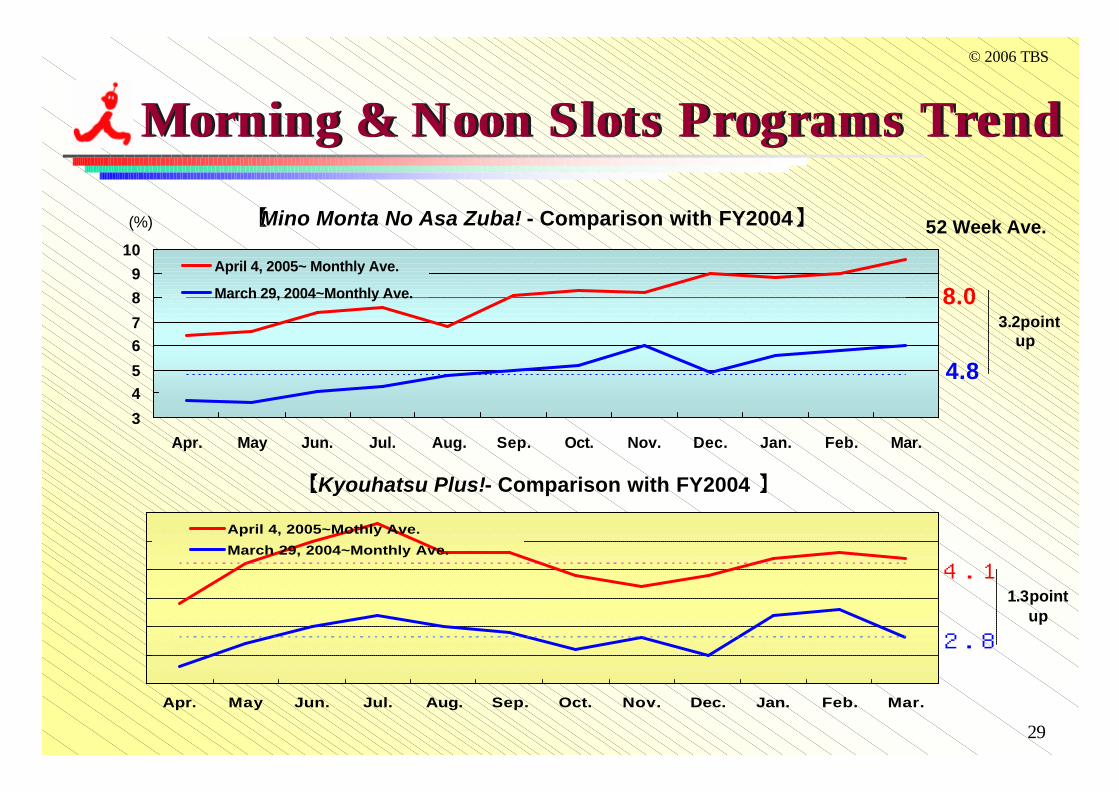
4.8
8.0
3
45
67
8
9
10
Apr. May Jun. Jul. Aug. Sep. Oct. Nov. Dec. Jan. Feb. Mar.
April 4, 2005~ Monthly Ave.
March 29, 2004~Monthly Ave.
(%) 【【MinoMino MontaMonta No No AsaAsa ZubaZuba!! -- Comparison with FY2004Comparison with FY2004】】 52 Week Ave.
3.2pointup
2.8
4.1
Apr. May Jun. Jul. Aug. Sep. Oct. Nov. Dec. Jan. Feb. Mar.
April 4, 2005~Mothly Ave.
March 29, 2004~Monthly Ave.
【【KyouhatsuKyouhatsu Plus!Plus!-- Comparison with FY2004Comparison with FY2004 】】
1.3point up
Morning & Noon Slots Programs TrendMorning & Noon Slots Programs Trend
30
© 2006 TBS
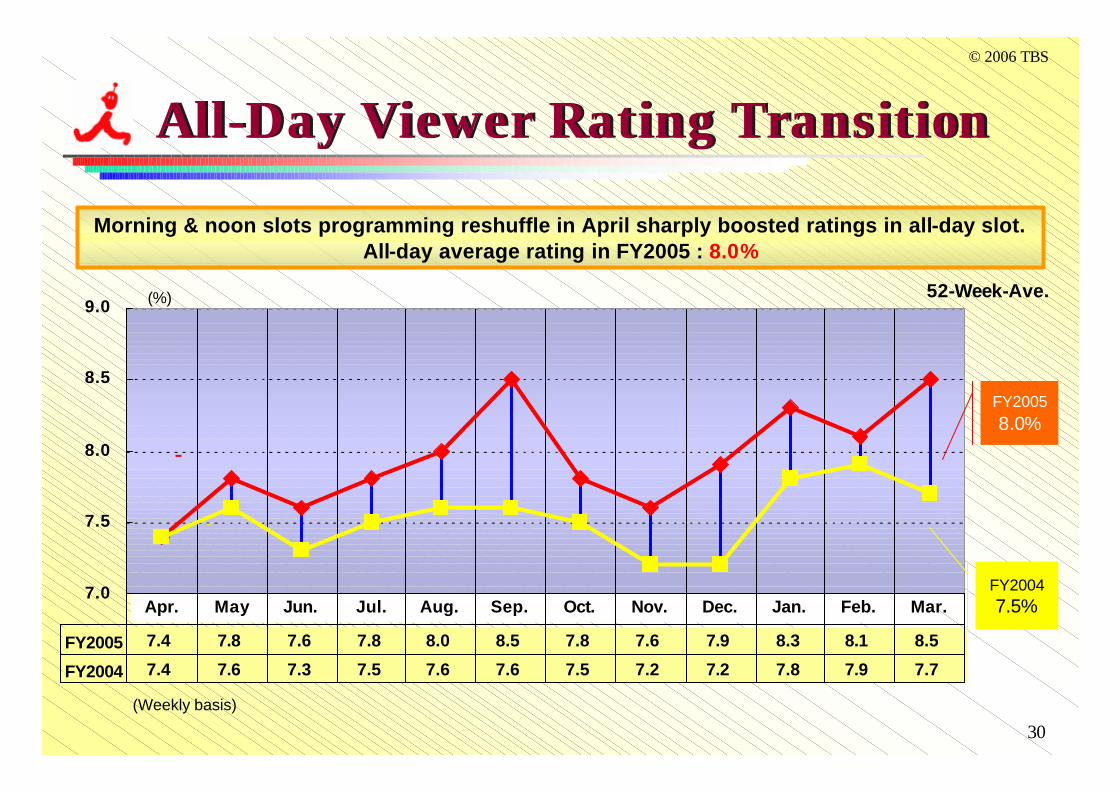
7.0
7.5
8.0
8.5
9.0
FY2005 7.4 7.8 7.6 7.8 8.0 8.5 7.8 7.6 7.9 8.3 8.1 8.5
FY2004 7.4 7.6 7.3 7.5 7.6 7.6 7.5 7.2 7.2 7.8 7.9 7.7
Apr. May Jun. Jul. Aug. Sep. Oct. Nov. Dec. Jan. Feb. Mar.
(%)
All-Day Viewer Rating TransitionAll-Day Viewer Rating Transition
(Weekly basis))
FY20058.0%
FY20047.5%
52-Week-Ave.
Morning & noon slots programming reshuffle in April sharply boosted ratings in all-day slot.All-day average rating in FY2005 : 8.0%
31
© 2006 TBS
(%)
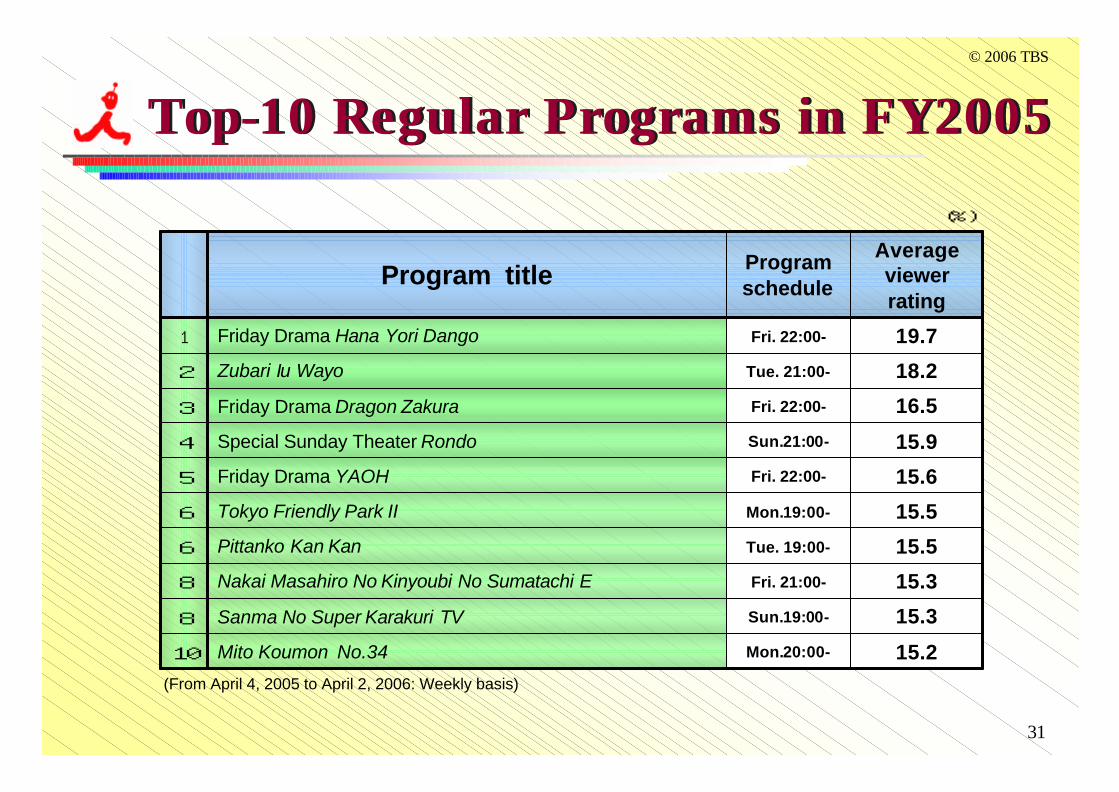
(From April 4, 2005 to April 2, 2006: Weekly basis)
Top-10 Regular Programs in FY2005 Top-10 Regular Programs in FY2005
15.2
15.3
15.3
15.5
15.5
15.6
15.9
16.5
18.2
19.7
Average viewer rating
Fri. 22:00-Friday Drama YAOH5
Sun.21:00-Special Sunday Theater Rondo4
Fri. 22:00-Friday Drama Dragon Zakura3
Tue. 21:00-Zubari Iu Wayo2
Fri. 22:00-Friday Drama Hana Yori Dango1
Mon.20:00-Mito Koumon No.34 10
Sun.19:00-Sanma No Super Karakuri TV8
Fri. 21:00-Nakai Masahiro No Kinyoubi No Sumatachi E8
Tue. 19:00-Pittanko Kan Kan6
Mon.19:00-Tokyo Friendly Park II6
Program scheduleProgram title
32
© 2006 TBS
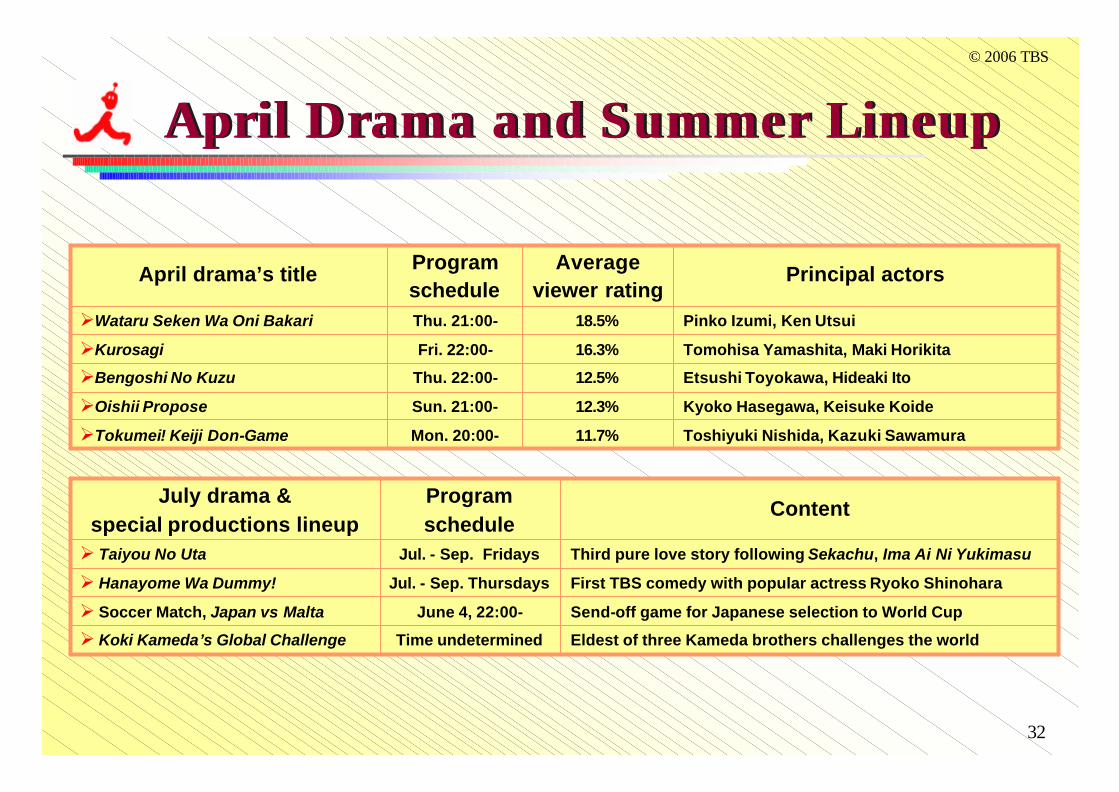
April Drama and Summer LineupApril Drama and Summer Lineup
Pinko Izumi, Ken Utsui18.5%Thu. 21:00-ØWataru Seken Wa Oni Bakari
Tomohisa Yamashita, Maki Horikita16.3%Fri. 22:00-ØKurosagi
Toshiyuki Nishida, Kazuki Sawamura11.7%Mon. 20:00-ØTokumei! Keiji Don-Game
Kyoko Hasegawa, Keisuke Koide12.3%Sun. 21:00-ØOishii Propose
Etsushi Toyokawa, Hideaki Ito12.5%Thu. 22:00-ØBengoshi No Kuzu
Principal actorsAverageviewer rating
Programschedule
April drama’s title
Send-off game for Japanese selection to World CupJune 4, 22:00-Ø Soccer Match, Japan vs Malta
Eldest of three Kameda brothers challenges the world Time undeterminedØ Koki Kameda’s Global Challenge
Third pure love story following Sekachu, Ima Ai Ni YukimasuJul. - Sep. FridaysØ Taiyou No Uta
First TBS comedy with popular actress Ryoko ShinoharaJul. - Sep. ThursdaysØ Hanayome Wa Dummy!
ContentProgramschedule
July drama &special productions lineup
33
© 2006 TBS
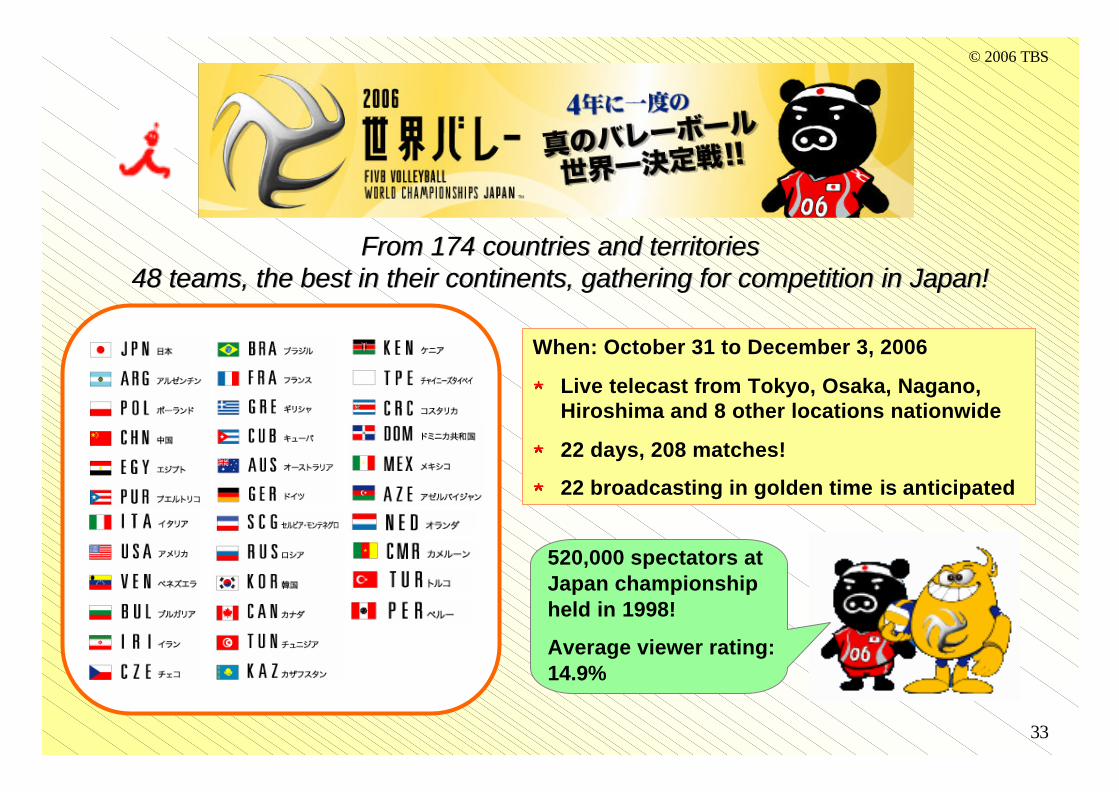
From 174 countries and territories 48 teams, the best in their continents, gathering for competition in Japan!
From 174 countries and territories 48 teams, the best in their continents, gathering for competition in Japan!
520,000 spectators at Japan championship held in 1998!
Average viewer rating: 14.9%
When: October 31 to December 3, 2006 When: October 31 to December 3, 2006
★★ Live telecast from Tokyo, Osaka, Nagano, Hiroshima and 8 other locations nationwide
★★ 22 days, 208 matches!
★★ 22 broadcasting in golden time is is anticipated
34
© 2006 TBS
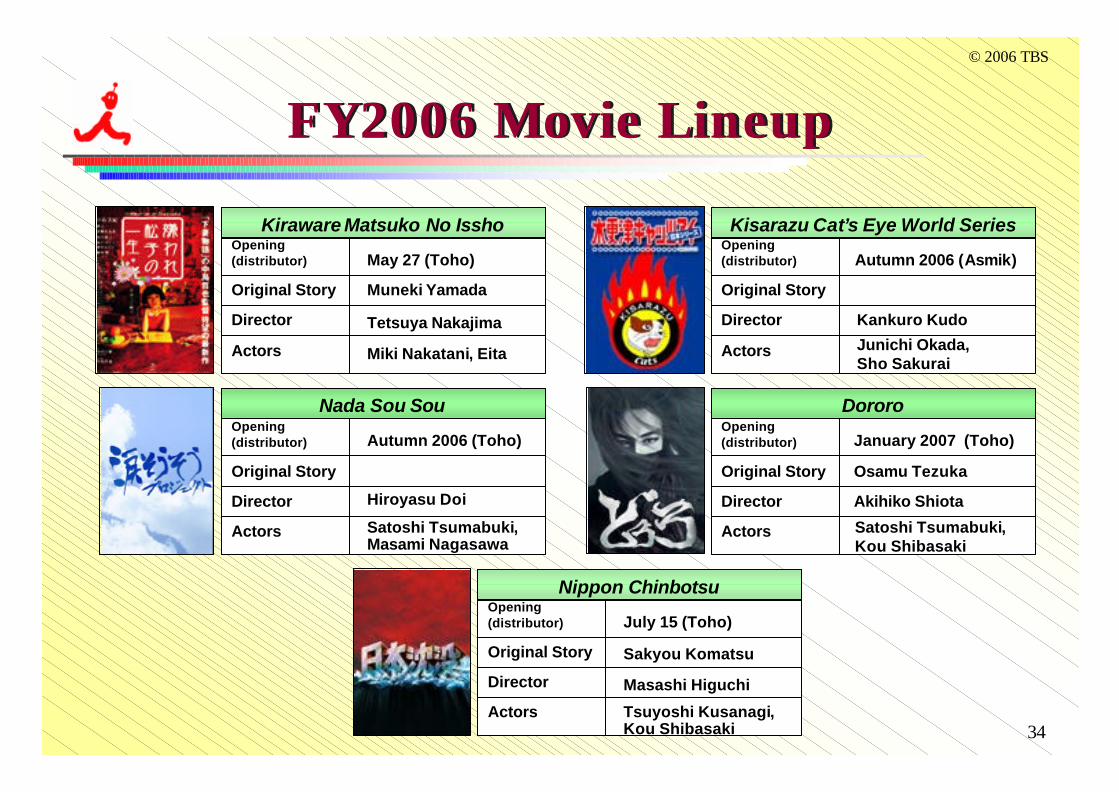
FY2006 Movie LineupFY2006 Movie Lineup
Kisarazu Cat’s Eye World SeriesOpening (distributor)
Original Story
Actors
Director
Junichi Okada, Sho Sakurai
Kankuro Kudo
Autumn 2006 (Asmik)
DororoOpening (distributor)
Original Story
Actors
Director
January 2007 (Toho)
Osamu Tezuka
Satoshi Tsumabuki, Kou Shibasaki
Akihiko Shiota
Kiraware Matsuko No IsshoOpening (distributor)
Original Story
Actors
Director
Muneki Yamada
May 27 (Toho)
Miki Nakatani, Eita
Tetsuya Nakajima
Nada Sou SouOpening (distributor)
Original Story
Actors
Director
Autumn 2006 (Toho)
Satoshi Tsumabuki, Masami Nagasawa
Hiroyasu Doi
Nippon ChinbotsuOpening (distributor)
Original Story
Actors
Director
Sakyou Komatsu
July 15 (Toho)
Tsuyoshi Kusanagi, Kou Shibasaki
Masashi Higuchi
35
© 2006 TBS
All the information presented in this report, including projections of the company’soperating performance, is based on our judgment at the time of preparing this report.Therefore, we do not assure or guarantee the realization of the planned figurespresented, which include some risk and uncertainty. Please note that actual operatingperformance may differ from the stated projections, depending on changes ineconomic climate, market trends, business environment, etc.
Contact for InquiriesContact for Inquiries
Office of Investor RelationsTokyo Broadcasting System, Inc.
5-3-6 Akasaka, Minato-ku, Tokyo 107-8006, Japan
Forward-Looking StatementsForward-Looking Statements