
FINANCIAL RESULTS Consolidated Financial Statements
79
TD BANK GROUP • 2011 CONSOLIDATED FINANCIAL STATEMENTS AND NOTES 1 FINANCIAL RESULTS Consolidated Financial Statements MANAGEMENT’S RESPONSIBILITY FOR FINANCIAL INFORMATION The management of The Toronto-Dominion Bank and its subsidiaries (the “Bank”) is responsible for the integrity, consistency, objectivity and reliability of the Consolidated Financial Statements of the Bank and related financial information as presented. Canadian generally accepted accounting principles as well as the requirements of the Bank Act and related regulations have been applied and management has exercised its judgment and made best estimates where appropriate. The Bank’s accounting system and related internal controls are designed, and supporting procedures maintained, to provide reasonable assurance that financial records are complete and accurate and that assets are safeguarded against loss from unauthorized use or disposition. These supporting procedures include the careful selection and training of qualified staff, the establishment of organizational structures providing a well-defined division of responsibilities and accountability for performance, and the communication of policies and guidelines of business conduct throughout the Bank. Management has assessed the effectiveness of the Bank’s internal control over financial reporting as at October 31, 2011 using the framework found in Internal Control – Integrated Framework issued by the Committee of Sponsoring Organizations of the Treadway Commission. Based upon this assessment, management has concluded that as at October 31, 2011, the Bank’s internal control over financial reporting is effective. The Bank’s Board of Directors, acting through the Audit Committee which is composed entirely of independent directors, oversees management’s responsibilities for financial reporting. The Audit Committee reviews the Consolidated Financial Statements and recommends them to the Board for approval. Other responsibilities of the Audit Committee include monitoring the Bank’s system of internal controls over the financial reporting process and making recommendations to the Board and shareholders regarding the appointment of the external auditor. The Bank’s Chief Auditor, who has full and free access to the Audit Committee, conducts an extensive program of audits. This program supports the system of internal control and is carried out by a professional staff of auditors. The Office of the Superintendent of Financial Institutions, Canada, makes such examination and enquiry into the affairs of the Bank as deemed necessary to ensure that the provisions of the Bank Act, having reference to the safety of the depositors, are being duly observed and that the Bank is in sound financial condition. Ernst & Young LLP, the independent auditors appointed by the shareholders of the Bank, have audited the effectiveness of the Bank’s internal control over financial reporting as at October 31, 2011 in addition to auditing the Bank’s Consolidated Financial Statements as of the same date. Their reports, which expressed an unqualified opinion, can be found on the following pages of the Consolidated Financial Statements. Ernst & Young have full and free access to, and meet periodically with, the Audit Committee to discuss their audit and matters arising there from, such as, comments they may have on the fairness of financial reporting and the adequacy of internal controls. W. Edmund Clark Colleen M. Johnston Group President and Group Head Finance and Chief Executive Officer Chief Financial Officer Toronto, Canada November 30, 2011
Transcript of FINANCIAL RESULTS Consolidated Financial Statements
TD BANK GROUP • 2011 CONSOLIDATED FINANCIAL STATEMENTS AND NOTES 1
FINANCIAL RESULTS
Consolidated Financial Statements
MANAGEMENT’S RESPONSIBILITY FOR FINANCIAL INFORMATION
The management of The Toronto-Dominion Bank and its subsidiaries (the “Bank”) is responsible for the integrity, consistency, objectivity and reliability of the Consolidated Financial Statements of the Bank and related financial information as presented. Canadian generally accepted accounting principles as well as the requirements of the Bank Act and related regulations have been applied and management has exercised its judgment and made best estimates where appropriate. The Bank’s accounting system and related internal controls are designed, and supporting procedures maintained, to provide reasonable assurance that financial records are complete and accurate and that assets are safeguarded against loss from unauthorized use or disposition. These supporting procedures include the careful selection and training of qualified staff, the establishment of organizational structures providing a well-defined division of responsibilities and accountability for performance, and the communication of policies and guidelines of business conduct throughout the Bank. Management has assessed the effectiveness of the Bank’s internal control over financial reporting as at October 31, 2011 using the framework found in Internal Control – Integrated Framework issued by the Committee of Sponsoring Organizations of the Treadway Commission. Based upon this assessment, management has concluded that as at October 31, 2011, the Bank’s internal control over financial reporting is effective. The Bank’s Board of Directors, acting through the Audit Committee which is composed entirely of independent directors, oversees management’s responsibilities for financial reporting. The Audit Committee reviews the Consolidated Financial Statements and recommends them to the Board for approval. Other responsibilities of the Audit Committee include monitoring the Bank’s system of internal controls over the financial reporting process and making recommendations to the Board and shareholders regarding the appointment of the external auditor.
The Bank’s Chief Auditor, who has full and free access to the Audit Committee, conducts an extensive program of audits. This program supports the system of internal control and is carried out by a professional staff of auditors.
The Office of the Superintendent of Financial Institutions, Canada, makes such examination and enquiry into the affairs of the Bank as deemed necessary to ensure that the provisions of the Bank Act, having reference to the safety of the depositors, are being duly observed and that the Bank is in sound financial condition.
Ernst & Young LLP, the independent auditors appointed by the shareholders of the Bank, have audited the effectiveness of the Bank’s internal control over financial reporting as at October 31, 2011 in addition to auditing the Bank’s Consolidated Financial Statements as of the same date. Their reports, which expressed an unqualified opinion, can be found on the following pages of the Consolidated Financial Statements. Ernst & Young have full and free access to, and meet periodically with, the Audit Committee to discuss their audit and matters arising there from, such as, comments they may have on the fairness of financial reporting and the adequacy of internal controls.
W. Edmund Clark Colleen M. Johnston Group President and Group Head Finance and Chief Executive Officer Chief Financial Officer Toronto, Canada November 30, 2011
TD BANK GROUP • 2011 CONSOLIDATED FINANCIAL STATEMENTS AND NOTES 2
INDEPENDENT AUDITORS’ REPORTS OF REGISTERED PUBLIC ACCOUNTING FIRM TO SHAREHOLDERS
Report on Financial Statements
We have audited the accompanying consolidated financial statements of The Toronto-Dominion Bank, which comprise the Consolidated Balance Sheet as at October 31, 2011 and 2010, and the Consolidated Statements of Income, Changes in Shareholders’ Equity, Comprehensive Income and Cash Flows for each of the years in the three-year period ended October 31, 2011, and a summary of significant accounting policies and other explanatory information.
Management’s responsibility for the consolidated financial statements
Management is responsible for the preparation and fair presentation of these consolidated financial statements in accordance with Canadian generally accepted accounting principles, and for such internal control as management determines is necessary to enable the preparation of consolidated financial statements that are free from material misstatement, whether due to fraud or error.
Auditors’ responsibility
Our responsibility is to express an opinion on these consolidated financial statements based on our audits. We conducted our audits in accordance with Canadian generally accepted auditing standards and the standards of the Public Company Accounting Oversight Board (United States). Those standards require that we comply with ethical requirements and plan and perform the audit to obtain reasonable assurance about whether the consolidated financial statements are free from material misstatement.
An audit involves performing procedures to obtain audit evidence about the amounts and disclosures in the consolidated financial statements. The procedures selected depend on the auditors’ judgment, including the assessment of the risks of material misstatement of the consolidated financial statements, whether due to fraud or error. In making those risk assessments, the auditors consider internal control relevant to the entity’s preparation and fair presentation of the consolidated financial statements in order to design audit procedures that are appropriate in the circumstances. An audit also includes examining, on a test basis, evidence supporting the amounts and disclosures in the consolidated financial statements, evaluating the appropriateness of accounting policies used and the reasonableness of accounting estimates made by management, as well as evaluating the overall presentation of the consolidated financial statements.
We believe that the audit evidence we have obtained in our audits is sufficient and appropriate to provide a basis for our audit opinion.
Opinion
In our opinion, the consolidated financial statements present fairly, in all material respects, the financial position of The Toronto-Dominion Bank as at October 31, 2011 and 2010, and the results of its operations and its cash flows for each of the years in the three-year period ended October 31, 2011, in accordance with Canadian generally accepted accounting principles.
Other matter
We have also audited, in accordance with the standards of the Public Company Accounting Oversight Board (United States), The Toronto-Dominion Bank’s internal control over financial reporting as of October 31, 2011, based on the criteria established in Internal Control-Integrated Framework issued by the Committee of Sponsoring Organizations of the Treadway Commission and our report dated November 30, 2011 expressed an unqualified opinion on The Toronto-Dominion Bank’s internal control over financial reporting.
Ernst & Young LLP Chartered Accountants Licensed Public Accountants Toronto, Canada November 30, 2011

TD BANK GROUP • 2011 CONSOLIDATED FINANCIAL STATEMENTS AND NOTES 3
INDEPENDENT AUDITORS’ REPORTS OF REGISTERED PUBLIC ACCOUNTING FIRM TO SHAREHOLDERS
Report on Internal Control under Standards of the Public Company Accounting Oversight Board (United States) We have audited The Toronto-Dominion Bank’s internal control over financial reporting as of October 31, 2011, based on criteria established in Internal Control – Integrated Framework issued by the Committee of Sponsoring Organizations of the Treadway Commission (the “COSO criteria”). The Toronto-Dominion Bank’s management is responsible for maintaining effective internal control over financial reporting, and for its assessment of the effectiveness of internal control over financial reporting included in the accompanying Management’s Report on Internal Control over Financial Reporting contained in the accompanying Management’s Discussion and Analysis. Our responsibility is to express an opinion on The Toronto-Dominion Bank’s internal control over financial reporting based on our audit. We conducted our audit in accordance with the standards of the Public Company Accounting Oversight Board, United States (“PCAOB”). Those standards require that we plan and perform the audit to obtain reasonable assurance about whether effective internal control over financial reporting was maintained in all material respects. Our audit included obtaining an understanding of internal control over financial reporting, assessing the risk that a material weakness exists, testing and evaluating the design and operating effectiveness of internal control based on the assessed risk, and performing such other procedures as we considered necessary in the circumstances. We believe that our audit provides a reasonable basis for our opinion. A company’s internal control over financial reporting is a process designed to provide reasonable assurance regarding the reliability of financial reporting and the preparation of financial statements for external purposes in accordance with generally accepted accounting principles. A company’s internal control over financial reporting includes those policies and procedures that (1) pertain to the maintenance of records that, in reasonable detail, accurately and fairly reflect the transactions and dispositions of the assets of the company; (2) provide reasonable assurance that transactions are recorded as necessary to permit preparation of financial statements in accordance with generally accepted accounting principles, and that receipts and expenditures of the company are being made only in accordance with authorizations of management and directors of the company; and (3) provide reasonable assurance regarding prevention or timely detection of unauthorized acquisition, use, or disposition of the company’s assets that could have a material effect on the financial statements. Because of its inherent limitations, internal control over financial reporting may not prevent or detect misstatements. Also, projections of any evaluation of effectiveness to future periods are subject to the risk that controls may become inadequate because of changes in conditions or that the degree of compliance with the policies or procedures may deteriorate. In our opinion, The Toronto-Dominion Bank maintained, in all material respects, effective internal control over financial reporting as of October 31, 2011, based on the COSO criteria. We also have audited, in accordance with Canadian generally accepted auditing standards and the standards of the PCAOB, the Consolidated Balance Sheet of The Toronto-Dominion Bank as at October 31, 2011 and 2010 and the Consolidated Statements of Income, Changes in Shareholders’ Equity, Comprehensive Income and Cash Flows for each of the years in the three-year period ended October 31, 2011 of The Toronto-Dominion Bank and our report dated November 30, 2011 expressed an unqualified opinion thereon.
Ernst & Young LLP Chartered Accountants Licensed Public Accountants Toronto, Canada November 30, 2011
TD BANK GROUP • 2011 CONSOLIDATED FINANCIAL STATEMENTS AND NOTES 4
Consolidated Balance Sheet
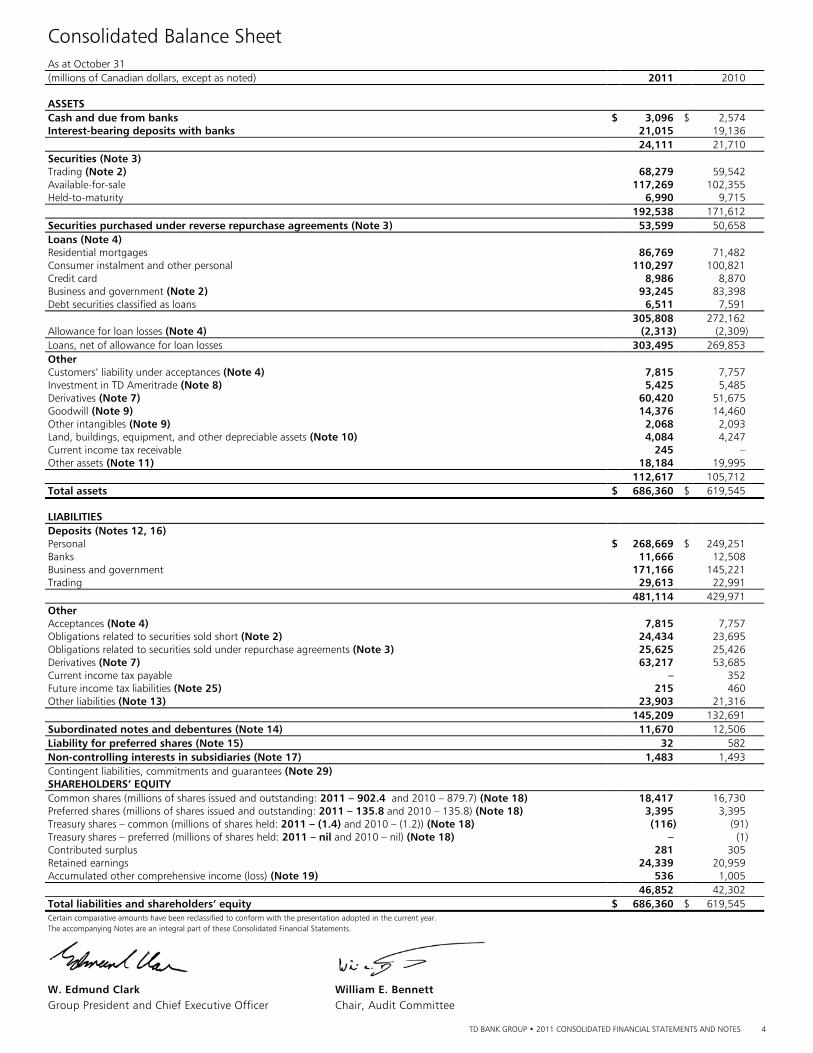
As at October 31 (millions of Canadian dollars, except as noted) 2011 2010 ASSETS Cash and due from banks $ 3,096 $ 2,574 Interest-bearing deposits with banks 21,015 19,136 24,111 21,710 Securities (Note 3) Trading (Note 2) 68,279 59,542 Available-for-sale 117,269 102,355 Held-to-maturity 6,990 9,715 192,538 171,612 Securities purchased under reverse repurchase agreements (Note 3) 53,599 50,658 Loans (Note 4) Residential mortgages 86,769 71,482 Consumer instalment and other personal 110,297 100,821 Credit card 8,986 8,870 Business and government (Note 2) 93,245 83,398 Debt securities classified as loans 6,511 7,591 305,808 272,162 Allowance for loan losses (Note 4) (2,313) (2,309)Loans, net of allowance for loan losses 303,495 269,853 Other Customers’ liability under acceptances (Note 4) 7,815 7,757 Investment in TD Ameritrade (Note 8) 5,425 5,485 Derivatives (Note 7) 60,420 51,675 Goodwill (Note 9) 14,376 14,460 Other intangibles (Note 9) 2,068 2,093 Land, buildings, equipment, and other depreciable assets (Note 10) 4,084 4,247 Current income tax receivable 245 – Other assets (Note 11) 18,184 19,995 112,617 105,712 Total assets $ 686,360 $ 619,545 LIABILITIES Deposits (Notes 12, 16) Personal $ 268,669 $ 249,251 Banks 11,666 12,508 Business and government 171,166 145,221 Trading 29,613 22,991 481,114 429,971 Other Acceptances (Note 4) 7,815 7,757 Obligations related to securities sold short (Note 2) 24,434 23,695 Obligations related to securities sold under repurchase agreements (Note 3) 25,625 25,426 Derivatives (Note 7) 63,217 53,685 Current income tax payable – 352 Future income tax liabilities (Note 25) 215 460 Other liabilities (Note 13) 23,903 21,316 145,209 132,691 Subordinated notes and debentures (Note 14) 11,670 12,506 Liability for preferred shares (Note 15) 32 582 Non-controlling interests in subsidiaries (Note 17) 1,483 1,493 Contingent liabilities, commitments and guarantees (Note 29) SHAREHOLDERS’ EQUITY Common shares (millions of shares issued and outstanding: 2011 – 902.4 and 2010 – 879.7) (Note 18) 18,417 16,730 Preferred shares (millions of shares issued and outstanding: 2011 – 135.8 and 2010 – 135.8) (Note 18) 3,395 3,395 Treasury shares – common (millions of shares held: 2011 – (1.4) and 2010 – (1.2)) (Note 18) (116) (91)Treasury shares – preferred (millions of shares held: 2011 – nil and 2010 – nil) (Note 18) – (1)Contributed surplus 281 305 Retained earnings 24,339 20,959 Accumulated other comprehensive income (loss) (Note 19) 536 1,005 46,852 42,302 Total liabilities and shareholders’ equity $ 686,360 $ 619,545 Certain comparative amounts have been reclassified to conform with the presentation adopted in the current year. The accompanying Notes are an integral part of these Consolidated Financial Statements.
W. Edmund Clark William E. Bennett Group President and Chief Executive Officer Chair, Audit Committee
TD BANK GROUP • 2011 CONSOLIDATED FINANCIAL STATEMENTS AND NOTES 5
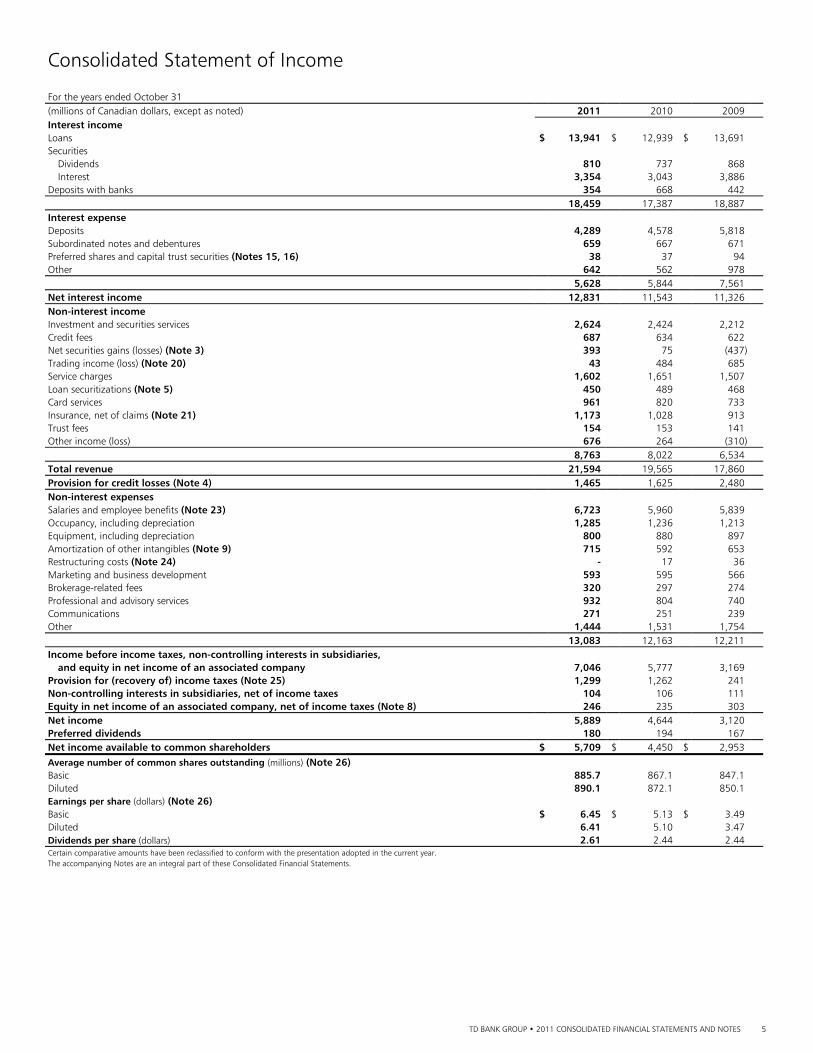
Consolidated Statement of Income For the years ended October 31 (millions of Canadian dollars, except as noted) 2011 2010 2009 Interest income Loans $ 13,941 $ 12,939 $ 13,691 Securities Dividends 810 737 868 Interest 3,354 3,043 3,886 Deposits with banks 354 668 442 18,459 17,387 18,887 Interest expense Deposits 4,289 4,578 5,818 Subordinated notes and debentures 659 667 671 Preferred shares and capital trust securities (Notes 15, 16) 38 37 94 Other 642 562 978 5,628 5,844 7,561 Net interest income 12,831 11,543 11,326 Non-interest income Investment and securities services 2,624 2,424 2,212 Credit fees 687 634 622 Net securities gains (losses) (Note 3) 393 75 (437) Trading income (loss) (Note 20) 43 484 685 Service charges 1,602 1,651 1,507 Loan securitizations (Note 5) 450 489 468 Card services 961 820 733 Insurance, net of claims (Note 21) 1,173 1,028 913 Trust fees 154 153 141 Other income (loss) 676 264 (310) 8,763 8,022 6,534 Total revenue 21,594 19,565 17,860 Provision for credit losses (Note 4) 1,465 1,625 2,480 Non-interest expenses Salaries and employee benefits (Note 23) 6,723 5,960 5,839 Occupancy, including depreciation 1,285 1,236 1,213 Equipment, including depreciation 800 880 897 Amortization of other intangibles (Note 9) 715 592 653 Restructuring costs (Note 24) - 17 36 Marketing and business development 593 595 566 Brokerage-related fees 320 297 274 Professional and advisory services 932 804 740 Communications 271 251 239 Other 1,444 1,531 1,754 13,083 12,163 12,211 Income before income taxes, non-controlling interests in subsidiaries, and equity in net income of an associated company 7,046 5,777 3,169 Provision for (recovery of) income taxes (Note 25) 1,299 1,262 241 Non-controlling interests in subsidiaries, net of income taxes 104 106 111 Equity in net income of an associated company, net of income taxes (Note 8) 246 235 303 Net income 5,889 4,644 3,120 Preferred dividends 180 194 167 Net income available to common shareholders $ 5,709 $ 4,450 $ 2,953
Average number of common shares outstanding (millions) (Note 26) Basic 885.7 867.1 847.1 Diluted 890.1 872.1 850.1 Earnings per share (dollars) (Note 26) Basic $ 6.45 $ 5.13 $ 3.49 Diluted 6.41 5.10 3.47 Dividends per share (dollars) 2.61 2.44 2.44 Certain comparative amounts have been reclassified to conform with the presentation adopted in the current year. The accompanying Notes are an integral part of these Consolidated Financial Statements.
TD BANK GROUP • 2011 CONSOLIDATED FINANCIAL STATEMENTS AND NOTES 6
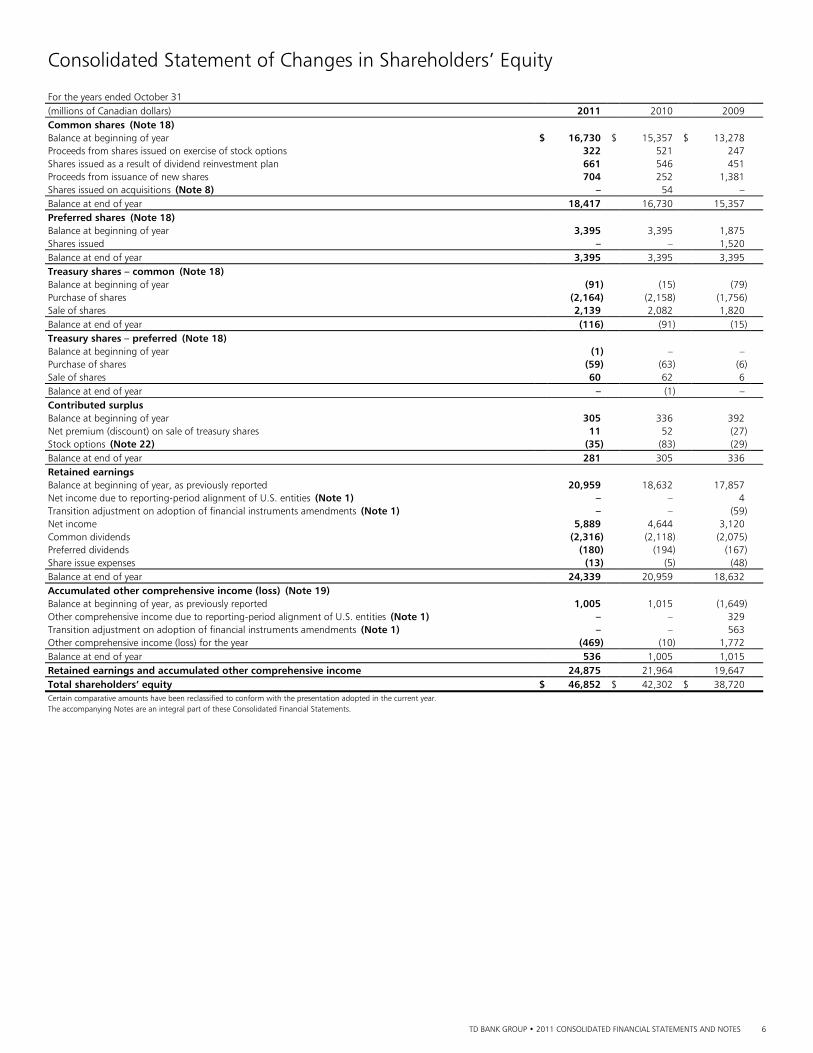
Consolidated Statement of Changes in Shareholders’ Equity For the years ended October 31 (millions of Canadian dollars) 2011 2010 2009 Common shares (Note 18) Balance at beginning of year $ 16,730 $ 15,357 $ 13,278 Proceeds from shares issued on exercise of stock options 322 521 247 Shares issued as a result of dividend reinvestment plan 661 546 451 Proceeds from issuance of new shares 704 252 1,381 Shares issued on acquisitions (Note 8) – 54 – Balance at end of year 18,417 16,730 15,357 Preferred shares (Note 18) Balance at beginning of year 3,395 3,395 1,875 Shares issued – – 1,520 Balance at end of year 3,395 3,395 3,395 Treasury shares – common (Note 18) Balance at beginning of year (91) (15) (79) Purchase of shares (2,164) (2,158) (1,756) Sale of shares 2,139 2,082 1,820 Balance at end of year (116) (91) (15) Treasury shares – preferred (Note 18) Balance at beginning of year (1) – – Purchase of shares (59) (63) (6) Sale of shares 60 62 6 Balance at end of year – (1) – Contributed surplus Balance at beginning of year 305 336 392 Net premium (discount) on sale of treasury shares 11 52 (27) Stock options (Note 22) (35) (83) (29) Balance at end of year 281 305 336 Retained earnings Balance at beginning of year, as previously reported 20,959 18,632 17,857 Net income due to reporting-period alignment of U.S. entities (Note 1) – – 4 Transition adjustment on adoption of financial instruments amendments (Note 1) – – (59) Net income 5,889 4,644 3,120 Common dividends (2,316) (2,118) (2,075) Preferred dividends (180) (194) (167) Share issue expenses (13) (5) (48) Balance at end of year 24,339 20,959 18,632 Accumulated other comprehensive income (loss) (Note 19) Balance at beginning of year, as previously reported 1,005 1,015 (1,649) Other comprehensive income due to reporting-period alignment of U.S. entities (Note 1) – – 329 Transition adjustment on adoption of financial instruments amendments (Note 1) – – 563 Other comprehensive income (loss) for the year (469) (10) 1,772 Balance at end of year 536 1,005 1,015 Retained earnings and accumulated other comprehensive income 24,875 21,964 19,647 Total shareholders’ equity $ 46,852 $ 42,302 $ 38,720 Certain comparative amounts have been reclassified to conform with the presentation adopted in the current year. The accompanying Notes are an integral part of these Consolidated Financial Statements.
TD BANK GROUP • 2011 CONSOLIDATED FINANCIAL STATEMENTS AND NOTES 7
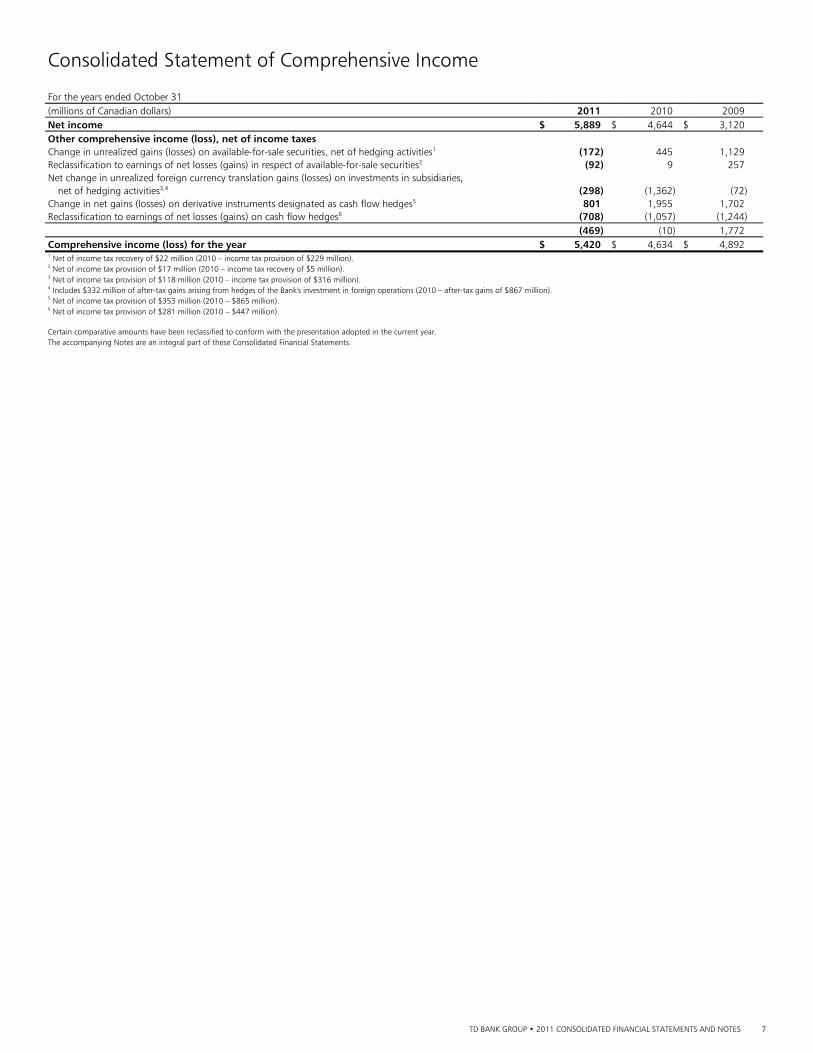
Consolidated Statement of Comprehensive Income For the years ended October 31 (millions of Canadian dollars) 2011 2010 2009 Net income $ 5,889 $ 4,644 $ 3,120 Other comprehensive income (loss), net of income taxes Change in unrealized gains (losses) on available-for-sale securities, net of hedging activities1 (172) 445 1,129 Reclassification to earnings of net losses (gains) in respect of available-for-sale securities2 (92) 9 257 Net change in unrealized foreign currency translation gains (losses) on investments in subsidiaries, net of hedging activities3,4 (298) (1,362) (72) Change in net gains (losses) on derivative instruments designated as cash flow hedges5 801 1,955 1,702 Reclassification to earnings of net losses (gains) on cash flow hedges6 (708) (1,057) (1,244) (469) (10) 1,772 Comprehensive income (loss) for the year $ 5,420 $ 4,634 $ 4,892 1 Net of income tax recovery of $22 million (2010 – income tax provision of $229 million). 2 Net of income tax provision of $17 million (2010 – income tax recovery of $5 million). 3 Net of income tax provision of $118 million (2010 – income tax provision of $316 million). 4 Includes $332 million of after-tax gains arising from hedges of the Bank's investment in foreign operations (2010 – after-tax gains of $867 million). 5 Net of income tax provision of $353 million (2010 – $865 million). 6 Net of income tax provision of $281 million (2010 – $447 million). Certain comparative amounts have been reclassified to conform with the presentation adopted in the current year. The accompanying Notes are an integral part of these Consolidated Financial Statements.
TD BANK GROUP • 2011 CONSOLIDATED FINANCIAL STATEMENTS AND NOTES 8
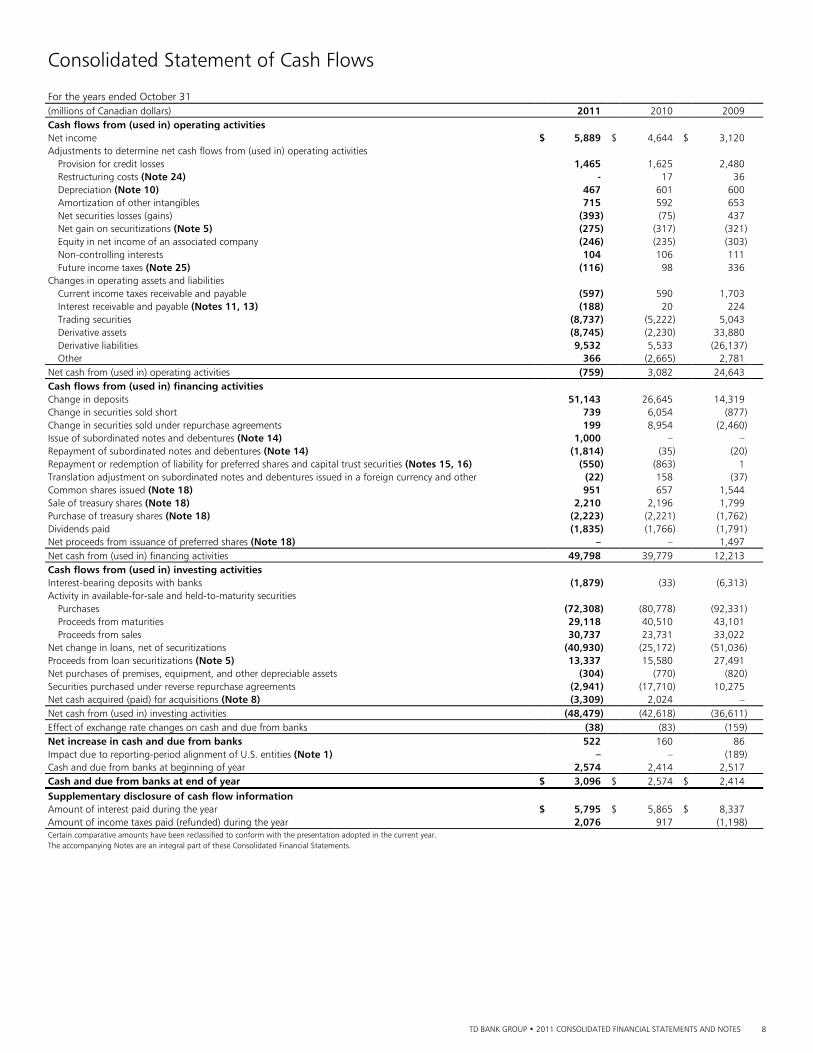
Consolidated Statement of Cash Flows For the years ended October 31 (millions of Canadian dollars) 2011 2010 2009 Cash flows from (used in) operating activities Net income $ 5,889 $ 4,644 $ 3,120 Adjustments to determine net cash flows from (used in) operating activities Provision for credit losses 1,465 1,625 2,480 Restructuring costs (Note 24) - 17 36 Depreciation (Note 10) 467 601 600 Amortization of other intangibles 715 592 653 Net securities losses (gains) (393) (75) 437 Net gain on securitizations (Note 5) (275) (317) (321) Equity in net income of an associated company (246) (235) (303) Non-controlling interests 104 106 111 Future income taxes (Note 25) (116) 98 336 Changes in operating assets and liabilities Current income taxes receivable and payable (597) 590 1,703 Interest receivable and payable (Notes 11, 13) (188) 20 224 Trading securities (8,737) (5,222) 5,043 Derivative assets (8,745) (2,230) 33,880 Derivative liabilities 9,532 5,533 (26,137) Other 366 (2,665) 2,781 Net cash from (used in) operating activities (759) 3,082 24,643 Cash flows from (used in) financing activities Change in deposits 51,143 26,645 14,319 Change in securities sold short 739 6,054 (877) Change in securities sold under repurchase agreements 199 8,954 (2,460) Issue of subordinated notes and debentures (Note 14) 1,000 – – Repayment of subordinated notes and debentures (Note 14) (1,814) (35) (20) Repayment or redemption of liability for preferred shares and capital trust securities (Notes 15, 16) (550) (863) 1 Translation adjustment on subordinated notes and debentures issued in a foreign currency and other (22) 158 (37) Common shares issued (Note 18) 951 657 1,544 Sale of treasury shares (Note 18) 2,210 2,196 1,799 Purchase of treasury shares (Note 18) (2,223) (2,221) (1,762) Dividends paid (1,835) (1,766) (1,791) Net proceeds from issuance of preferred shares (Note 18) – – 1,497 Net cash from (used in) financing activities 49,798 39,779 12,213 Cash flows from (used in) investing activities Interest-bearing deposits with banks (1,879) (33) (6,313) Activity in available-for-sale and held-to-maturity securities Purchases (72,308) (80,778) (92,331) Proceeds from maturities 29,118 40,510 43,101 Proceeds from sales 30,737 23,731 33,022 Net change in loans, net of securitizations (40,930) (25,172) (51,036) Proceeds from loan securitizations (Note 5) 13,337 15,580 27,491 Net purchases of premises, equipment, and other depreciable assets (304) (770) (820) Securities purchased under reverse repurchase agreements (2,941) (17,710) 10,275 Net cash acquired (paid) for acquisitions (Note 8) (3,309) 2,024 – Net cash from (used in) investing activities (48,479) (42,618) (36,611) Effect of exchange rate changes on cash and due from banks (38) (83) (159) Net increase in cash and due from banks 522 160 86 Impact due to reporting-period alignment of U.S. entities (Note 1) – – (189) Cash and due from banks at beginning of year 2,574 2,414 2,517 Cash and due from banks at end of year $ 3,096 $ 2,574 $ 2,414
Supplementary disclosure of cash flow information Amount of interest paid during the year $ 5,795 $ 5,865 $ 8,337 Amount of income taxes paid (refunded) during the year 2,076 917 (1,198) Certain comparative amounts have been reclassified to conform with the presentation adopted in the current year. The accompanying Notes are an integral part of these Consolidated Financial Statements.
TD BANK GROUP • 2011 CONSOLIDATED FINANCIAL STATEMENTS AND NOTES 9
Notes to Consolidated Financial Statements
NOTE 1 SUMMARY OF SIGNIFICANT ACCOUNTING POLICIES
BASIS OF PRESENTATION
The accompanying Consolidated Financial Statements and accounting principles followed by The Toronto-Dominion Bank and its subsidiaries (the Bank), including the accounting requirements of the Office of the Superintendent of Financial Institutions Canada (OSFI), conform with Canadian generally accepted accounting principles (GAAP).
Certain disclosures are included in the Management’s Discussion and Analysis (MD&A) as permitted by GAAP and are discussed in the Managing Risk section of the 2011 MD&A. These disclosures are shaded in the 2011 MD&A and form an integral part of the 2011 Consolidated Financial Statements. The 2011 Consolidated Financial Statements include all adjustments that are, in the opinion of management, necessary for a fair presentation of results for the periods presented. Certain comparative amounts have been reclassified to conform with the presentation adopted in the current year.
The significant accounting policies and practices followed by the Bank are: BASIS OF CONSOLIDATION
The Consolidated Financial Statements include the assets, liabilities, results of operations, and cash flows of the Bank and its subsidiaries and certain variable interest entities (VIEs) after elimination of intercompany transactions and balances. Subsidiaries are corporations or other legal entities controlled by the Bank. VIEs are described in Note 6. The Bank uses the purchase method to account for all business acquisitions.
When the Bank does not own all of the equity of the subsidiary, the minority shareholders’ interest is disclosed in the Consolidated Balance Sheet as non-controlling interest in subsidiaries and the income accruing to the minority interest holders, net of tax, is disclosed as a separate line item in the Consolidated Statement of Income.
The proportionate consolidation method is used to account for investments in which the Bank exercises joint control. Only the Bank’s specific pro-rata share of assets, liabilities, income, and expenses is consolidated.
Entities over which the Bank has significant influence are accounted for using the equity method of accounting. The Bank’s share of earnings, gains and losses realized on disposition, and write-downs to reflect other-than-temporary impairment in the value of such entities is reported in the Consolidated Statement of Income. The Bank’s equity share in TD Ameritrade’s earnings is reported on a one month lag basis. USE OF ESTIMATES IN THE PREPARATION OF FINANCIAL STATEMENTS
The preparation of the Consolidated Financial Statements requires management to make estimates and assumptions based on information available as at the date of the financial statements. Actual results could materially differ from those estimates. Loan losses, fair value of certain financial instruments, consolidation of VIEs, income taxes, securitizations, valuation of goodwill and other intangibles, pensions and post-retirement benefits, and contingent liabilities are areas where management makes significant estimates that are dependent on significant assumptions in determining the amounts to be recorded in the Consolidated Financial Statements. TRANSLATION OF FOREIGN CURRENCIES
Monetary assets and liabilities denominated in foreign currencies are translated at exchange rates prevailing at the balance sheet date and non-monetary assets and liabilities are translated at historical exchange rates. Foreign currency income and expenses are translated at average exchange rates prevailing throughout the year. Unrealized translation gains and losses and all realized gains and losses are included in non-interest income except for available-for-sale securities where unrealized translation gains and losses are recorded in other comprehensive income until the asset is sold or becomes impaired.
For self-sustaining foreign currency denominated operations, all assets and liabilities are translated at exchange rates in effect at the balance sheet date and all income and expenses are translated at average exchange rates for the year. Unrealized translation gains and losses relating to the Bank’s self-sustaining operations, net of any offsetting gains or losses arising from hedges of these positions, and applicable income taxes, are included in other comprehensive income. The accumulated translation gains or losses are included in non-interest income either on disposal of the investments or upon the reduction in the net investment as a result of capital transactions such as dividend distributions. The investment balance of a foreign entity accounted for by the equity method is translated into Canadian dollars, prior to the application of the equity method, with any exchange gains or losses recognized in non-interest income. CASH AND DUE FROM BANKS
Cash and due from banks consist of cash and amounts due from banks which are issued by investment grade financial institutions. These amounts are due on demand or have an original maturity of three months or less.
REVENUE RECOGNITION
Investment and securities services income include asset management fees, administration and commission fees, and investment banking fees. Asset management fees and administration and commission fees include income from investment management and related services, custody and institutional trust services and brokerage services, which are recognized as income over the period in which the related service is rendered. Investment banking fees including advisory fees, are recognized as income when earned, and underwriting fees, net of syndication expenses, are recognized as income when the Bank has rendered all services to the issuer and is entitled to collect the fee.
Card services income including interchange income from credit and debit cards and annual fees, are recognized as earned, except for annual fees, which are recognized over a 12-month period.
Service charges and trust fee income are recognized as earned.
TD BANK GROUP • 2011 CONSOLIDATED FINANCIAL STATEMENTS AND NOTES 10
Revenue recognition policies related to financial instruments and insurance are described in the accounting policies below. SPECIFIC ACCOUNTING POLICIES To facilitate a better understanding of the Bank’s Consolidated Financial Statements, significant accounting policies are disclosed in the notes, where applicable, with related disclosures. A listing of all the notes is as follows:
Note Topic Page 2 Fair Value of Financial Instruments 11 3 Securities 19 4 Loans, Impaired Loans and Allowance for Credit Losses 23 5 Loan Securitizations 29 6 Variable Interest Entities 31 7 Derivatives 32 8 Acquisitions and Other 41 9 Goodwill and Other Intangibles 42 10 Land, Buildings, Equipment, and Other Depreciable Assets 43 11 Other Assets 43 12 Deposits 43 13 Other Liabilities 44 14 Subordinated Notes and Debentures 44 15 Liability for Preferred Shares 45 16 Capital Trust Securities 46 17 Non-Controlling Interests in Subsidiaries 49 18 Share Capital 49 19 Accumulated Other Comprehensive Income (Loss) 52 20 Trading-Related Income 52 21 Insurance 52 22 Stock-Based Compensation 53 23 Employee Future Benefits 54 24 Integration and Restructuring Costs 59 25 Income Taxes 59 26 Earnings Per Share 60 27 Segmented Information 61 28 Related-Party Transactions 63 29 Contingent Liabilities, Commitments, Guarantees, Pledged Assets, and Collateral 64 30 Interest Rate Risk 66 31 Credit Risk 67 32 Regulatory Capital 70 33 Risk Management 71 34 Transition to IFRS 71 35 Subsequent Event 79
CHANGES IN ACCOUNTING POLICIES
Financial Instruments – 2009 Amendments Debt Securities Classified as Loans and Loans Classified as Trading In August 2009, the Accounting Standards Board (AcSB) of the Canadian Institute of Chartered Accountants (CICA) amended CICA Handbook Section 3855, Financial Instruments – Recognition and Measurement and CICA Handbook Section 3025, Impaired Loans (the 2009 Amendments). The 2009 Amendments changed the definition of a loan such that certain debt securities may be classified as loans if they do not have a quoted price in an active market and it is not the Bank’s intent to sell the securities immediately or in the near term. Debt securities classified as loans are assessed for impairment using the incurred credit loss model of CICA Handbook Section 3025. Under this model, the carrying value of a loan is reduced to its estimated realizable amount when it is determined that it is impaired. Loan impairment accounting requirements are also applied to held-to-maturity financial assets as a result of the 2009 Amendments. Debt securities that are classified as available-for-sale continue to be written down to their fair value through the Consolidated Statement of Income when the impairment is considered to be other than temporary; however, the impairment loss can be reversed if the fair value subsequently increases and the increase can be objectively related to an event occurring after the impairment loss was recognized.
As a result of the 2009 Amendments, the Bank reclassified certain debt securities from available-for-sale to loans effective November 1, 2008 at their amortized cost as of that date. To be eligible for reclassification, the debt securities had to meet the amended definition of a loan on November 1, 2008. Prior to the reclassification, the debt securities were accounted for at fair value with changes in fair value recorded in other comprehensive income. After the reclassification, they are accounted for at amortized cost using the effective interest rate method.
In addition, the Bank also reclassified held-to-maturity securities that did not have a quoted price in an active market to loans as required by the 2009 Amendments. The securities were accounted for at amortized cost both before and after the reclassification.

TD BANK GROUP • 2011 CONSOLIDATED FINANCIAL STATEMENTS AND NOTES 11
The following table shows carrying values of the reclassified debt securities as at October 31, 2008 and November 1, 2008. Debt Securities Reclassified to Loans (millions of Canadian dollars) Amount
Available-for-sale debt securities reclassified to loans1 Non-agency collateralized mortgage obligation portfolio $ 8,435 Corporate and other debt 277 8,712 Held-to-maturity debt securities reclassified to loans U.S. federal, state and municipal government and agencies debt 69 Other OECD government-guaranteed debt 459 Other debt securities 1,424 1,952 Total carrying value of debt securities reclassified to loans on October 31, 2008 10,664 Transition adjustment for change in measurement basis, pre tax2 895 Gross amount of debt securities classified as loans on November 1, 2008 11,559 Transition adjustment for recognition of a general allowance, pre tax3 (95)Net carrying value of debt securities classified as loans on November 1, 2008 $ 11,464 1 Prior to the reclassification, the debt securities were accounted for at fair value with changes in fair value recorded in other comprehensive income. After the reclassification, the debt securities are accounted for
at amortized cost. 2 $563 million after tax. 3 $59 million after tax.
In addition, the 2009 Amendments required loans for which the Bank has the intention to sell immediately or in the near term to be classified as
trading. As a result, they are accounted for at fair value, with changes in fair value recorded in the Consolidated Statement of Income. Prior to the
adoption of the 2009 Amendments, these loans were accounted for at amortized cost. These loans are recorded in residential mortgages and
business and government loans on the Consolidated Balance Sheet. This change did not have a material impact on the financial position, cash flows,
or earnings of the Bank. Alignment of Reporting Period of U.S. Entities Effective April 30, 2009, the reporting periods of TD Bank, N.A., which currently operates as TD Bank, America’s Most Convenient Bank, were aligned
with the reporting period of the Bank to eliminate the one month lag in financial reporting. Prior to April 30, 2009, the reporting period of TD Bank,
N.A. was included in the Bank’s financial statements on a one month lag. In accordance with the CICA Handbook Section 1506, Accounting Changes,
this alignment is considered a change in accounting policy. The Bank has assessed that the impact to prior periods is not material and therefore, an
adjustment was made to opening retained earnings of fiscal 2009, to align the reporting period of TD Bank, N.A. to that of the Bank’s reporting
period. Accordingly, the results of TD Bank, N.A. for the twelve months ended October 31, 2011, 2010, and 2009 have been included with the
results of the Bank for the twelve months ended October 31, 2011, 2010, and 2009. The one month impact of aligning the reporting period of U.S.
entities has been included directly in retained earnings and not in the Consolidated Statement of Income.
FUTURE ACCOUNTING AND REPORTING CHANGES Transition to International Financial Reporting Standards The Bank, a publicly accountable entity, is transitioning from Canadian GAAP to International Financial Reporting Standards (IFRS), effective for
interim and annual periods beginning in the first quarter of fiscal 2012. Please refer to Note 34 of the Consolidated Financial Statements for the IFRS
opening Consolidated Balance Sheet as at November 1, 2010 (IFRS opening Consolidated Balance Sheet) and related disclosures including a summary
of the Bank’s first-time adoption transition elections under IFRS 1 and other significant differences between Canadian GAAP and IFRS. These
disclosures form the starting point for the Bank’s financial reporting under IFRS and have been provided to allow a better understanding of the
expected effect on the consolidated financial statements as a result of the adoption of IFRS. The interim and annual fiscal 2012 Consolidated
Financial Statements will also include fiscal 2011 comparatives, related transitional reconciliations and note disclosures.
IFRS uses a conceptual framework similar to Canadian GAAP; however, certain differences exist related to items such as recognition, measurement,
and disclosure; certain of which may have a significant impact on the Bank’s accounting policies.
NOTE 2 FAIR VALUE OF FINANCIAL INSTRUMENTS
Certain financial instruments are carried on the balance sheet at their fair value. These financial instruments include securities and loans held in the
trading portfolio, securities and loans designated as trading under the fair value option, securities classified as available-for-sale, derivative financial
instruments, certain deposits classified as trading, and obligations related to securities sold short.
DETERMINATION OF FAIR VALUE
The fair value of a financial instrument on initial recognition is normally the transaction price, i.e. the fair value of the consideration given or received.
The best evidence of fair value is quoted prices in active markets, and is based on bid prices for financial assets, and offered prices for financial
liabilities. When financial assets and liabilities have offsetting market risks, the Bank uses mid-market prices as a basis for establishing fair values for
the offsetting risk positions and applies the bid or offered price to the net open position, as appropriate. When there is no active market for the

TD BANK GROUP • 2011 CONSOLIDATED FINANCIAL STATEMENTS AND NOTES 12
instrument, the fair value may be based on other observable current market transactions involving the same instrument, without modification or
repackaging, or is based on a valuation technique which maximizes the use of observable market inputs. These techniques include comparisons with
similar instruments where market observable prices exist, discounted cash flow analysis, option pricing models, and other valuation techniques
commonly used by market participants. For certain financial instruments, fair values may be determined in whole or in part by using valuation
techniques, such as internally developed valuation models, which may incorporate non-observable market inputs.
If there is a difference between the value based on a valuation technique which includes inputs from observable markets, and the initial transaction
price, the difference is referred to as inception profit or loss, and is recognized into income upon initial recognition of the instrument. When an
instrument is measured using a valuation technique that utilizes significant non-observable market inputs, it is initially valued at the transaction price,
which is considered the best estimate of fair value. Subsequent to initial recognition, any difference between the transaction price and the value
determined by the valuation technique at initial recognition is recognized into income as non-observable inputs become observable.
If the fair value of a financial asset measured at fair value becomes negative, it is recorded as a financial liability until either its fair value becomes
positive, at which time it is recorded as a financial asset, or until it is extinguished.
VALUATION ADJUSTMENTS
The Bank recognizes various types of valuation adjustments to account for system limitations or measurement uncertainty in determining fair value
when using valuation techniques. Valuation adjustments reflect the Bank’s assessment of factors that market participants would use in pricing the
asset or liability. These include, but are not limited to, the unobservability of inputs used in the pricing model, or assumptions about risk, such as
creditworthiness of each counterparty and risk premiums that market participants would require given the inherent risk in the pricing model.
METHODS AND ASSUMPTIONS The Bank calculates fair values based on the following methods of valuation and assumptions:
Financial Instruments Whose Carrying Value Approximates Fair Value For certain financial assets and financial liabilities that are short term in nature or contain variable rate features, fair value is based on the appropriate
prevailing interest rates and/or credit curves. The fair value of cash and due from banks, interest-bearing deposits with banks, customers’ liability under
acceptances, acceptances, securities purchased under reverse repurchase agreements, and obligations related to securities sold under repurchase agreements,
are considered to approximate carrying value.
Government and Government-related Securities The fair value of Canadian government debt securities is primarily based on quoted prices in active markets, where available. Where quoted prices are not
available, valuation techniques such as discounted cash flow models may be used, which maximize the use of observable inputs such as government yield
curves.
The fair value of U.S. federal and state government, as well as agency debt securities, is determined by reference to recent transaction prices, broker quotes
or third-party vendor prices. Brokers or third-party vendors may use a pool-specific valuation model to value these securities. Observable market inputs to the
model include To Be Announced (TBA) market prices, the applicable indices, and metrics such as the coupon, maturity, and weighted average maturity of the
pool. U.S. municipal government securities are valued using inputs obtained from a widely accepted comprehensive U.S. municipal reference database,
MuniView. Inputs include reported trades, material event notices, and new issuance data. Other inputs used in the valuation model include, but are not
limited to, indexed yield curves and trading spreads.
The fair value of residential mortgage-backed securities is primarily determined using valuation techniques, such as the use of option-adjusted spread (OAS)
models which include inputs such as prepayment rate assumptions related to the underlying collateral. Observable inputs include, but are not limited to,
indexed yield curves, and bid-ask spreads. Other inputs may include volatility assumptions derived using Monte Carlo simulations and take into account
factors such as counterparty credit quality, liquidity and concentration.
Other Debt Securities The fair value of corporate and other debt securities, including debt securities reclassified from trading, is primarily based on broker quotes, third-party vendor
prices, or other valuation techniques, such as discounted cash flow techniques. Market inputs used in the valuation techniques or underlying third-party
vendor prices or broker quotes include benchmark and government yield curves, credit spreads, and trade execution data.
Asset-backed securities are primarily fair valued using third-party vendor prices. The third-party vendor employs a valuation model which maximizes the use
of observable inputs such as benchmark yield curves and bid-ask spreads. The model also takes into account relevant data about the underlying collateral,
such as weighted average terms to maturity and prepayment rate assumptions.
Equity Securities The fair value of equity securities is based on quoted prices in active markets, where available. Where quoted prices in active markets are not readily available,
or there is a wide bid-offer spread, fair value is determined based on quoted market prices for similar securities. If there are trading restrictions on the equity
security held, a valuation adjustment is recorded against available prices to reflect the nature of the restriction.
Retained Interests The methods and assumptions used to determine fair value of retained interests are described in Note 5, Loan Securitizations.
TD BANK GROUP • 2011 CONSOLIDATED FINANCIAL STATEMENTS AND NOTES 13
Loans The estimated fair value of loans carried at amortized cost, other than debt securities classified as loans, reflects changes in market price that have occurred
since the loans were originated or purchased, including changes in the creditworthiness. For fixed-rate performing loans, estimated fair value is determined by
discounting the expected future cash flows related to these loans at current market interest rates for loans with similar credit risks. The fair value of loans is
not adjusted for the value of any credit protection the Bank has purchased to mitigate credit risk. For floating rate performing loans, changes in interest rates
have minimal impact on fair value since loans reprice to market frequently. On that basis, in the absence of deterioration in credit, fair value is assumed to
approximate carrying value.
At initial recognition, debt securities classified as loans do not include debt securities with quoted prices in active markets. Similar to other debt securities
not classified as loans, when quoted market prices are not readily available, fair value is based on quoted market prices of similar securities, other third-party
evidence or by using a valuation technique that maximizes the use of observable market inputs. If quoted prices in active markets subsequently become
available, these are used to determine fair value for debt securities classified as loans.
The fair value of loans carried at fair value, which includes trading loans and loans designated as trading under the fair value option, is determined using
observable market prices, where available. Where the Bank is a market maker for loans traded in the secondary market, fair value is determined using executed
prices, or prices for comparable trades. For those loans where the Bank is not a market maker, the Bank obtains broker quotes from other reputable dealers.
The prices are corroborated as part of the Bank’s independent review process, which may include using valuation techniques or obtaining consensus or
composite prices from pricing services.
Derivative Financial Instruments The fair value of exchange-traded derivative financial instruments is based on quoted market prices. The fair value of over-the-counter (OTC) derivative
financial instruments is estimated using well established valuation techniques, such as discounted cash flow techniques, Black-Scholes model, and Monte
Carlo simulation. The valuation models incorporate prevailing market rates and prices of underlying instruments with similar maturities and characteristics.
Prices derived by using models are recorded net of valuation adjustments. The inputs used in the valuation models depend on the type of derivative and the
nature of the underlying instrument and are specific to the instrument being valued. Inputs can include, but are not limited to, interest rate yield curves,
foreign exchange rates, dividend yield projections, recovery rates, volatilities, spot prices, and correlation.
A credit risk valuation adjustment (CRVA) is recorded against the model value of OTC derivatives to account for the uncertainty that either counterparty in a
derivative transaction may not be able to fulfill its obligations under the transaction. In determining CRVA, the Bank takes into account master netting
agreements and collateral, and considers the creditworthiness of the counterparty and the Bank itself, in assessing potential future amounts owed to, or by
the Bank.
As at October 31, 2011, the CRVA recorded against the model value of OTC derivatives was $183 million (2010 – $178 million).
In the case of defaulted counterparties, a specific provision is established to recognize the estimated realizable value, net of collateral held, based on market
pricing in effect at the time the default is recognized. In these instances, the estimated realizable value is measured by discounting the expected future cash
flows at an appropriate effective interest rate immediately prior to impairment, after adjusting for the value of collateral.
Deposits The estimated fair value of term deposits is determined by discounting the contractual cash flows using interest rates currently offered for deposits with
similar terms.
For deposits with no defined maturities, the Bank considers fair value to equal carrying value, which is equivalent to the amount payable on the balance
sheet date.
For trading deposits, fair value is determined using discounted cash flow valuation techniques which maximize the use of observable market inputs such as
benchmark yield curves and foreign exchange rates. The Bank considers the impact of its own creditworthiness in the valuation of these deposits by reference
to observable market inputs.
Obligations Related to Securities Sold Short The fair value of these obligations is based on the fair value of the underlying securities, which can include equity or debt securities. As these obligations are
fully collateralized, the method used to determine fair value would be the same as that of the relevant underlying equity or debt securities.
Subordinated Notes and Debentures The fair values of subordinated notes and debentures are based on quoted market prices for similar issues or current rates offered to the Bank for debt of
equivalent credit quality and remaining maturity.
Liabilities for Preferred Shares and Capital Trust Securities The fair values for preferred share liabilities and capital trust securities are based on quoted market prices of the same or similar financial instruments.
Management validates that the estimates of fair value are reasonable using a process of obtaining multiple quotes of external market prices and values of
inputs. Management consistently applies valuation models and controls over a period of time in the valuation process. The valuations are also validated by
past experience and through actual cash settlement under the contract terms.
TD BANK GROUP • 2011 CONSOLIDATED FINANCIAL STATEMENTS AND NOTES 14
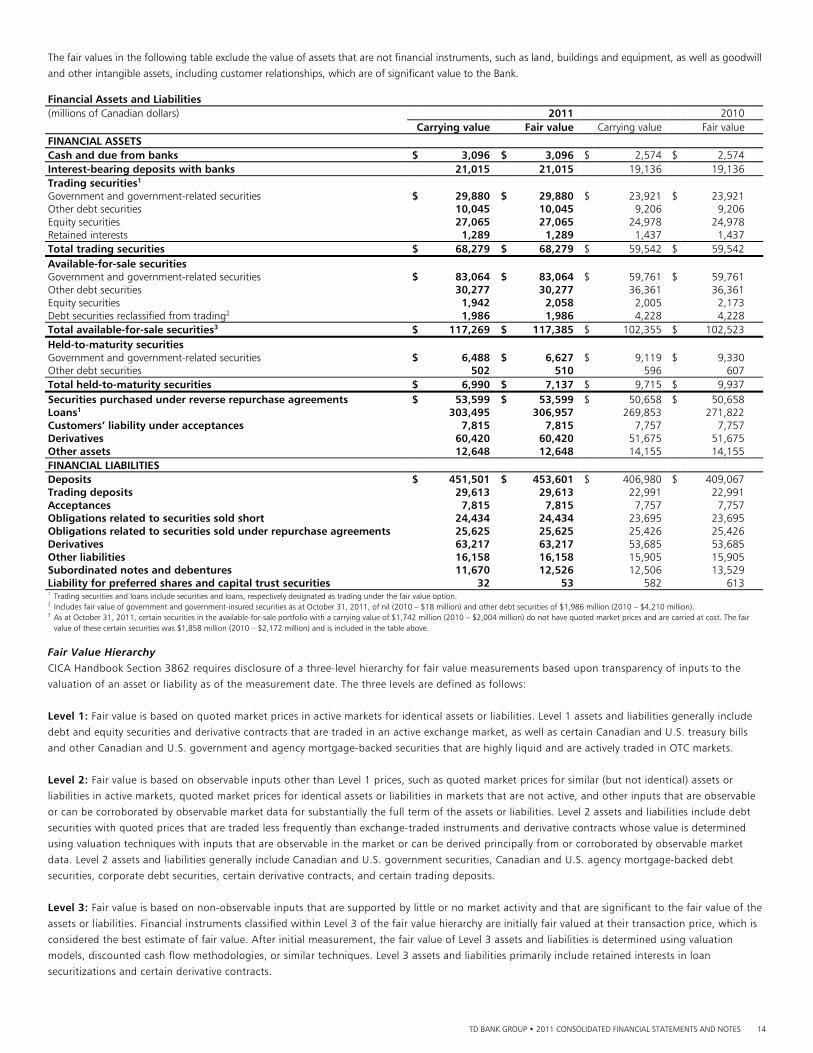
The fair values in the following table exclude the value of assets that are not financial instruments, such as land, buildings and equipment, as well as goodwill
and other intangible assets, including customer relationships, which are of significant value to the Bank. Financial Assets and Liabilities (millions of Canadian dollars) 2011 2010 Carrying value Fair value Carrying value Fair value FINANCIAL ASSETS Cash and due from banks $ 3,096 $ 3,096 $ 2,574 $ 2,574 Interest-bearing deposits with banks 21,015 21,015 19,136 19,136 Trading securities1 Government and government-related securities $ 29,880 $ 29,880 $ 23,921 $ 23,921 Other debt securities 10,045 10,045 9,206 9,206 Equity securities 27,065 27,065 24,978 24,978 Retained interests 1,289 1,289 1,437 1,437 Total trading securities $ 68,279 $ 68,279 $ 59,542 $ 59,542 Available-for-sale securities Government and government-related securities $ 83,064 $ 83,064 $ 59,761 $ 59,761 Other debt securities 30,277 30,277 36,361 36,361 Equity securities 1,942 2,058 2,005 2,173 Debt securities reclassified from trading2 1,986 1,986 4,228 4,228 Total available-for-sale securities3 $ 117,269 $ 117,385 $ 102,355 $ 102,523 Held-to-maturity securities Government and government-related securities $ 6,488 $ 6,627 $ 9,119 $ 9,330 Other debt securities 502 510 596 607 Total held-to-maturity securities $ 6,990 $ 7,137 $ 9,715 $ 9,937 Securities purchased under reverse repurchase agreements $ 53,599 $ 53,599 $ 50,658 $ 50,658 Loans1 303,495 306,957 269,853 271,822 Customers’ liability under acceptances 7,815 7,815 7,757 7,757 Derivatives 60,420 60,420 51,675 51,675 Other assets 12,648 12,648 14,155 14,155 FINANCIAL LIABILITIES Deposits $ 451,501 $ 453,601 $ 406,980 $ 409,067 Trading deposits 29,613 29,613 22,991 22,991 Acceptances 7,815 7,815 7,757 7,757 Obligations related to securities sold short 24,434 24,434 23,695 23,695 Obligations related to securities sold under repurchase agreements 25,625 25,625 25,426 25,426 Derivatives 63,217 63,217 53,685 53,685 Other liabilities 16,158 16,158 15,905 15,905 Subordinated notes and debentures 11,670 12,526 12,506 13,529 Liability for preferred shares and capital trust securities 32 53 582 613 1 Trading securities and loans include securities and loans, respectively designated as trading under the fair value option. 2 Includes fair value of government and government-insured securities as at October 31, 2011, of nil (2010 – $18 million) and other debt securities of $1,986 million (2010 – $4,210 million). 3 As at October 31, 2011, certain securities in the available-for-sale portfolio with a carrying value of $1,742 million (2010 – $2,004 million) do not have quoted market prices and are carried at cost. The fair
value of these certain securities was $1,858 million (2010 – $2,172 million) and is included in the table above.
Fair Value Hierarchy CICA Handbook Section 3862 requires disclosure of a three-level hierarchy for fair value measurements based upon transparency of inputs to the
valuation of an asset or liability as of the measurement date. The three levels are defined as follows:
Level 1: Fair value is based on quoted market prices in active markets for identical assets or liabilities. Level 1 assets and liabilities generally include
debt and equity securities and derivative contracts that are traded in an active exchange market, as well as certain Canadian and U.S. treasury bills
and other Canadian and U.S. government and agency mortgage-backed securities that are highly liquid and are actively traded in OTC markets.
Level 2: Fair value is based on observable inputs other than Level 1 prices, such as quoted market prices for similar (but not identical) assets or
liabilities in active markets, quoted market prices for identical assets or liabilities in markets that are not active, and other inputs that are observable
or can be corroborated by observable market data for substantially the full term of the assets or liabilities. Level 2 assets and liabilities include debt
securities with quoted prices that are traded less frequently than exchange-traded instruments and derivative contracts whose value is determined
using valuation techniques with inputs that are observable in the market or can be derived principally from or corroborated by observable market
data. Level 2 assets and liabilities generally include Canadian and U.S. government securities, Canadian and U.S. agency mortgage-backed debt
securities, corporate debt securities, certain derivative contracts, and certain trading deposits.
Level 3: Fair value is based on non-observable inputs that are supported by little or no market activity and that are significant to the fair value of the
assets or liabilities. Financial instruments classified within Level 3 of the fair value hierarchy are initially fair valued at their transaction price, which is
considered the best estimate of fair value. After initial measurement, the fair value of Level 3 assets and liabilities is determined using valuation
models, discounted cash flow methodologies, or similar techniques. Level 3 assets and liabilities primarily include retained interests in loan
securitizations and certain derivative contracts.
TD BANK GROUP • 2011 CONSOLIDATED FINANCIAL STATEMENTS AND NOTES 15
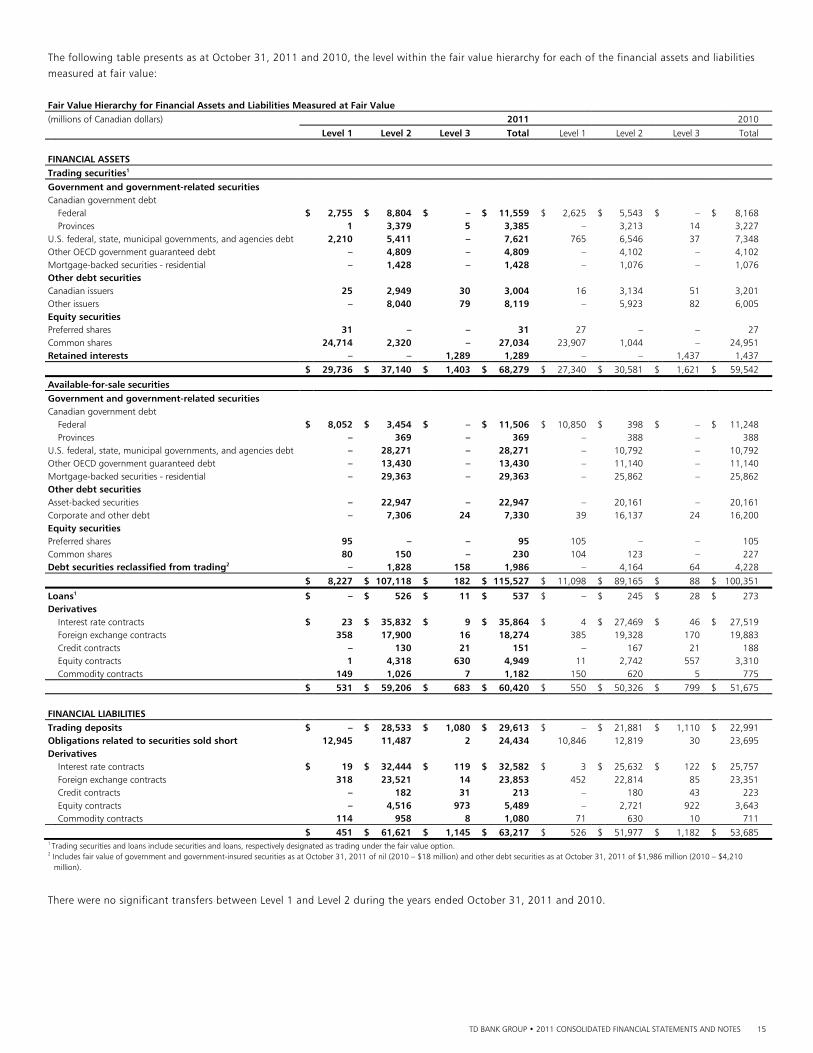
The following table presents as at October 31, 2011 and 2010, the level within the fair value hierarchy for each of the financial assets and liabilities
measured at fair value:
Fair Value Hierarchy for Financial Assets and Liabilities Measured at Fair Value (millions of Canadian dollars) 2011 2010
Level 1 Level 2 Level 3 Total Level 1 Level 2 Level 3 Total FINANCIAL ASSETS Trading securities1
Government and government-related securities Canadian government debt Federal $ 2,755 $ 8,804 $ – $ 11,559 $ 2,625 $ 5,543 $ – $ 8,168 Provinces 1 3,379 5 3,385 – 3,213 14 3,227 U.S. federal, state, municipal governments, and agencies debt 2,210 5,411 – 7,621 765 6,546 37 7,348 Other OECD government guaranteed debt – 4,809 – 4,809 – 4,102 – 4,102 Mortgage-backed securities - residential – 1,428 – 1,428 – 1,076 – 1,076 Other debt securities Canadian issuers 25 2,949 30 3,004 16 3,134 51 3,201 Other issuers – 8,040 79 8,119 – 5,923 82 6,005 Equity securities Preferred shares 31 – – 31 27 – – 27 Common shares 24,714 2,320 – 27,034 23,907 1,044 – 24,951 Retained interests – – 1,289 1,289 – – 1,437 1,437
$ 29,736 $ 37,140 $ 1,403 $ 68,279 $ 27,340 $ 30,581 $ 1,621 $ 59,542
Available-for-sale securities Government and government-related securities Canadian government debt Federal $ 8,052 $ 3,454 $ – $ 11,506 $ 10,850 $ 398 $ – $ 11,248 Provinces – 369 – 369 – 388 – 388 U.S. federal, state, municipal governments, and agencies debt – 28,271 – 28,271 – 10,792 – 10,792 Other OECD government guaranteed debt – 13,430 – 13,430 – 11,140 – 11,140 Mortgage-backed securities - residential – 29,363 – 29,363 – 25,862 – 25,862 Other debt securities Asset-backed securities – 22,947 – 22,947 – 20,161 – 20,161 Corporate and other debt – 7,306 24 7,330 39 16,137 24 16,200 Equity securities Preferred shares 95 – – 95 105 – – 105 Common shares 80 150 – 230 104 123 – 227 Debt securities reclassified from trading2 – 1,828 158 1,986 – 4,164 64 4,228
$ 8,227 $ 107,118 $ 182 $ 115,527 $ 11,098 $ 89,165 $ 88 $ 100,351
Loans1 $ – $ 526 $ 11 $ 537 $ – $ 245 $ 28 $ 273 Derivatives Interest rate contracts $ 23 $ 35,832 $ 9 $ 35,864 $ 4 $ 27,469 $ 46 $ 27,519 Foreign exchange contracts 358 17,900 16 18,274 385 19,328 170 19,883 Credit contracts – 130 21 151 – 167 21 188 Equity contracts 1 4,318 630 4,949 11 2,742 557 3,310 Commodity contracts 149 1,026 7 1,182 150 620 5 775 $ 531 $ 59,206 $ 683 $ 60,420 $ 550 $ 50,326 $ 799 $ 51,675 FINANCIAL LIABILITIES Trading deposits $ – $ 28,533 $ 1,080 $ 29,613 $ – $ 21,881 $ 1,110 $ 22,991 Obligations related to securities sold short 12,945 11,487 2 24,434 10,846 12,819 30 23,695 Derivatives Interest rate contracts $ 19 $ 32,444 $ 119 $ 32,582 $ 3 $ 25,632 $ 122 $ 25,757 Foreign exchange contracts 318 23,521 14 23,853 452 22,814 85 23,351 Credit contracts – 182 31 213 – 180 43 223 Equity contracts – 4,516 973 5,489 – 2,721 922 3,643 Commodity contracts 114 958 8 1,080 71 630 10 711
$ 451 $ 61,621 $ 1,145 $ 63,217 $ 526 $ 51,977 $ 1,182 $ 53,685 1 Trading securities and loans include securities and loans, respectively designated as trading under the fair value option. 2 Includes fair value of government and government-insured securities as at October 31, 2011 of nil (2010 – $18 million) and other debt securities as at October 31, 2011 of $1,986 million (2010 – $4,210
million).
There were no significant transfers between Level 1 and Level 2 during the years ended October 31, 2011 and 2010.
TD BANK GROUP • 2011 CONSOLIDATED FINANCIAL STATEMENTS AND NOTES 16
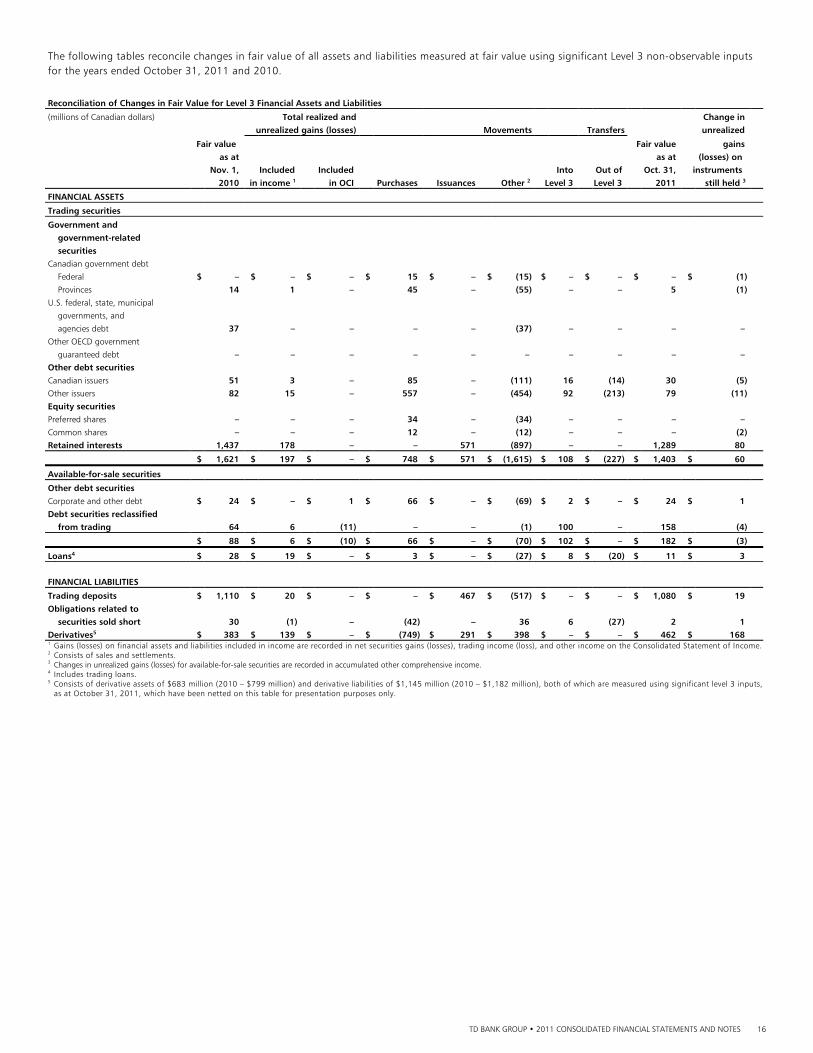
The following tables reconcile changes in fair value of all assets and liabilities measured at fair value using significant Level 3 non-observable inputs for the years ended October 31, 2011 and 2010.
Reconciliation of Changes in Fair Value for Level 3 Financial Assets and Liabilities
(millions of Canadian dollars) Total realized and Change in
unrealized gains (losses) Movements Transfers unrealized
Fair value Fair value gains
as at as at (losses) on Nov. 1, Included Included Into Out of Oct. 31, instruments 2010 in income 1 in OCI Purchases Issuances Other 2 Level 3 Level 3 2011 still held 3
FINANCIAL ASSETS
Trading securities
Government and government-related securities Canadian government debt Federal $ – $ – $ – $ 15 $ – $ (15) $ – $ – $ – $ (1) Provinces 14 1 – 45 – (55) – – 5 (1) U.S. federal, state, municipal
governments, and agencies debt 37 – – – – (37) – – – – Other OECD government
guaranteed debt – – – – – – – – – – Other debt securities Canadian issuers 51 3 – 85 – (111) 16 (14) 30 (5) Other issuers 82 15 – 557 – (454) 92 (213) 79 (11) Equity securities Preferred shares – – – 34 – (34) – – – – Common shares – – – 12 – (12) – – – (2) Retained interests 1,437 178 – – 571 (897) – – 1,289 80
$ 1,621 $ 197 $ – $ 748 $ 571 $ (1,615) $ 108 $ (227) $ 1,403 $ 60
Available-for-sale securities
Other debt securities Corporate and other debt $ 24 $ – $ 1 $ 66 $ – $ (69) $ 2 $ – $ 24 $ 1 Debt securities reclassified
from trading 64 6 (11) – – (1) 100 – 158 (4)
$ 88 $ 6 $ (10) $ 66 $ – $ (70) $ 102 $ – $ 182 $ (3)
Loans4 $ 28 $ 19 $ – $ 3 $ – $ (27) $ 8 $ (20) $ 11 $ 3 FINANCIAL LIABILITIES
Trading deposits $ 1,110 $ 20 $ – $ – $ 467 $ (517) $ – $ – $ 1,080 $ 19 Obligations related to
securities sold short 30 (1) – (42) – 36 6 (27) 2 1 Derivatives5 $ 383 $ 139 $ – $ (749) $ 291 $ 398 $ – $ – $ 462 $ 168 1 Gains (losses) on financial assets and liabilities included in income are recorded in net securities gains (losses), trading income (loss), and other income on the Consolidated Statement of Income.
2 Consists of sales and settlements. 3 Changes in unrealized gains (losses) for available-for-sale securities are recorded in accumulated other comprehensive income. 4 Includes trading loans. 5 Consists of derivative assets of $683 million (2010 – $799 million) and derivative liabilities of $1,145 million (2010 – $1,182 million), both of which are measured using significant level 3 inputs,
as at October 31, 2011, which have been netted on this table for presentation purposes only.
TD BANK GROUP • 2011 CONSOLIDATED FINANCIAL STATEMENTS AND NOTES 17
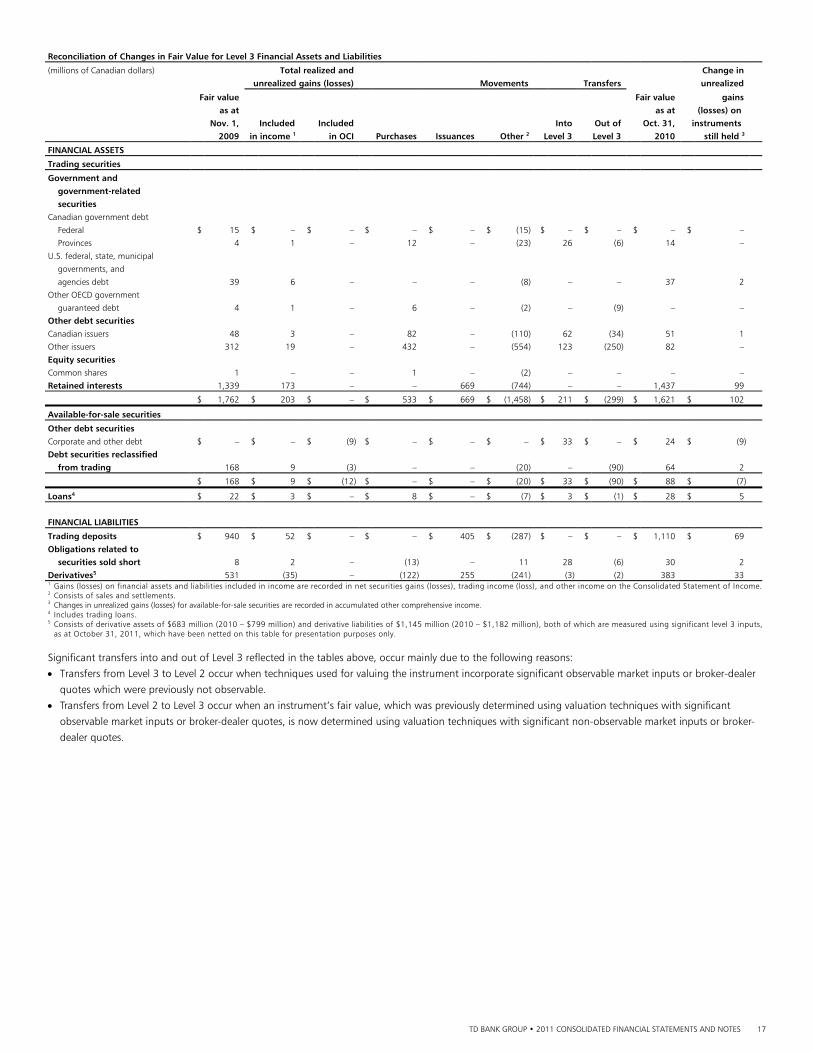
Reconciliation of Changes in Fair Value for Level 3 Financial Assets and Liabilities
(millions of Canadian dollars) Total realized and Change in
unrealized gains (losses) Movements Transfers unrealized
Fair value Fair value gains
as at as at (losses) on Nov. 1, Included Included Into Out of Oct. 31, instruments 2009 in income 1 in OCI Purchases Issuances Other 2 Level 3 Level 3 2010 still held 3
FINANCIAL ASSETS
Trading securities
Government and government-related securities Canadian government debt Federal $ 15 $ – $ – $ – $ – $ (15) $ – $ – $ – $ – Provinces 4 1 – 12 – (23) 26 (6) 14 – U.S. federal, state, municipal
governments, and agencies debt 39 6 – – – (8) – – 37 2 Other OECD government
guaranteed debt 4 1 – 6 – (2) – (9) – – Other debt securities Canadian issuers 48 3 – 82 – (110) 62 (34) 51 1 Other issuers 312 19 – 432 – (554) 123 (250) 82 – Equity securities Common shares 1 – – 1 – (2) – – – – Retained interests 1,339 173 – – 669 (744) – – 1,437 99
$ 1,762 $ 203 $ – $ 533 $ 669 $ (1,458) $ 211 $ (299) $ 1,621 $ 102
Available-for-sale securities
Other debt securities Corporate and other debt $ – $ – $ (9) $ – $ – $ – $ 33 $ – $ 24 $ (9) Debt securities reclassified
from trading 168 9 (3) – – (20) – (90) 64 2
$ 168 $ 9 $ (12) $ – $ – $ (20) $ 33 $ (90) $ 88 $ (7)
Loans4 $ 22 $ 3 $ – $ 8 $ – $ (7) $ 3 $ (1) $ 28 $ 5 FINANCIAL LIABILITIES
Trading deposits $ 940 $ 52 $ – $ – $ 405 $ (287) $ – $ – $ 1,110 $ 69 Obligations related to
securities sold short 8 2 – (13) – 11 28 (6) 30 2 Derivatives5 531 (35) – (122) 255 (241) (3) (2) 383 33 1 Gains (losses) on financial assets and liabilities included in income are recorded in net securities gains (losses), trading income (loss), and other income on the Consolidated Statement of Income.
2 Consists of sales and settlements. 3 Changes in unrealized gains (losses) for available-for-sale securities are recorded in accumulated other comprehensive income. 4 Includes trading loans. 5 Consists of derivative assets of $683 million (2010 – $799 million) and derivative liabilities of $1,145 million (2010 – $1,182 million), both of which are measured using significant level 3 inputs,
as at October 31, 2011, which have been netted on this table for presentation purposes only.
Significant transfers into and out of Level 3 reflected in the tables above, occur mainly due to the following reasons:
Transfers from Level 3 to Level 2 occur when techniques used for valuing the instrument incorporate significant observable market inputs or broker-dealer
quotes which were previously not observable.
Transfers from Level 2 to Level 3 occur when an instrument’s fair value, which was previously determined using valuation techniques with significant
observable market inputs or broker-dealer quotes, is now determined using valuation techniques with significant non-observable market inputs or broker-
dealer quotes.
TD BANK GROUP • 2011 CONSOLIDATED FINANCIAL STATEMENTS AND NOTES 18
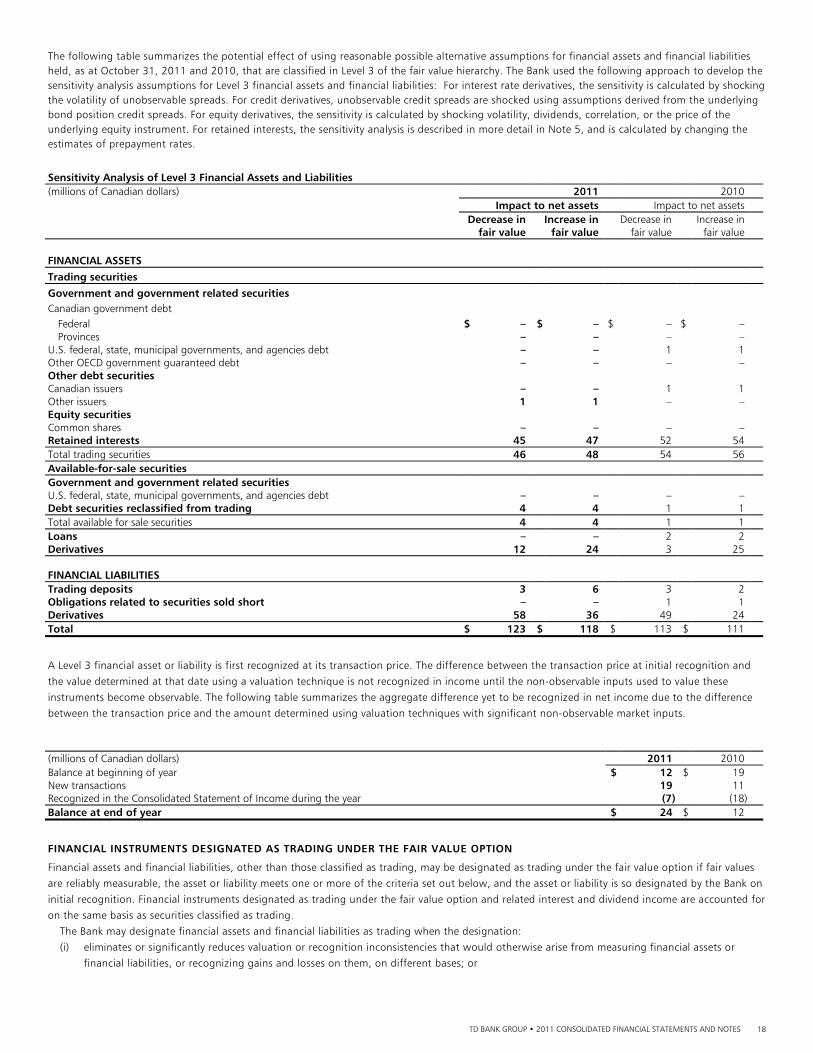
The following table summarizes the potential effect of using reasonable possible alternative assumptions for financial assets and financial liabilities held, as at October 31, 2011 and 2010, that are classified in Level 3 of the fair value hierarchy. The Bank used the following approach to develop the sensitivity analysis assumptions for Level 3 financial assets and financial liabilities: For interest rate derivatives, the sensitivity is calculated by shocking the volatility of unobservable spreads. For credit derivatives, unobservable credit spreads are shocked using assumptions derived from the underlying bond position credit spreads. For equity derivatives, the sensitivity is calculated by shocking volatility, dividends, correlation, or the price of the underlying equity instrument. For retained interests, the sensitivity analysis is described in more detail in Note 5, and is calculated by changing the estimates of prepayment rates.
Sensitivity Analysis of Level 3 Financial Assets and Liabilities (millions of Canadian dollars) 2011 2010 Impact to net assets Impact to net assets Decrease in Increase in Decrease in Increase in fair value fair value fair value fair value FINANCIAL ASSETS Trading securities Government and government related securities Canadian government debt Federal $ – $ – $ – $ – Provinces – – – – U.S. federal, state, municipal governments, and agencies debt – – 1 1 Other OECD government guaranteed debt – – – – Other debt securities Canadian issuers – – 1 1 Other issuers 1 1 – – Equity securities Common shares – – – – Retained interests 45 47 52 54 Total trading securities 46 48 54 56 Available-for-sale securities Government and government related securities U.S. federal, state, municipal governments, and agencies debt – – – – Debt securities reclassified from trading 4 4 1 1 Total available for sale securities 4 4 1 1 Loans – – 2 2 Derivatives 12 24 3 25 FINANCIAL LIABILITIES Trading deposits 3 6 3 2 Obligations related to securities sold short – – 1 1 Derivatives 58 36 49 24 Total $ 123 $ 118 $ 113 $ 111
A Level 3 financial asset or liability is first recognized at its transaction price. The difference between the transaction price at initial recognition and
the value determined at that date using a valuation technique is not recognized in income until the non-observable inputs used to value these
instruments become observable. The following table summarizes the aggregate difference yet to be recognized in net income due to the difference
between the transaction price and the amount determined using valuation techniques with significant non-observable market inputs.
(millions of Canadian dollars) 2011 2010 Balance at beginning of year $ 12 $ 19 New transactions 19 11 Recognized in the Consolidated Statement of Income during the year (7) (18)Balance at end of year $ 24 $ 12
FINANCIAL INSTRUMENTS DESIGNATED AS TRADING UNDER THE FAIR VALUE OPTION
Financial assets and financial liabilities, other than those classified as trading, may be designated as trading under the fair value option if fair values
are reliably measurable, the asset or liability meets one or more of the criteria set out below, and the asset or liability is so designated by the Bank on
initial recognition. Financial instruments designated as trading under the fair value option and related interest and dividend income are accounted for
on the same basis as securities classified as trading.
The Bank may designate financial assets and financial liabilities as trading when the designation:
(i) eliminates or significantly reduces valuation or recognition inconsistencies that would otherwise arise from measuring financial assets or
financial liabilities, or recognizing gains and losses on them, on different bases; or
TD BANK GROUP • 2011 CONSOLIDATED FINANCIAL STATEMENTS AND NOTES 19
(ii) applies to groups of financial assets, financial liabilities or combinations thereof that are managed, and their performance evaluated, on a fair
value basis in accordance with a documented risk management or investment strategy, and where information about the groups of financial
instruments is reported to management on that basis.
SECURITIES DESIGNATED AS TRADING UNDER THE FAIR VALUE OPTION
Certain securities that support insurance reserves within certain of the Bank’s insurance subsidiaries have been designated as trading under the fair
value option. The actuarial valuation of the insurance reserve is based on a discount factor using the market yield of the assets supporting the
insurance reserve. By designating the securities as trading under the fair value option, the unrealized gain or loss on the securities is recognized in the
Consolidated Statement of Income in the same period as the loss or income resulting from changes to the discount rate used to value the insurance
reserves.
In addition, certain government and government insured securities have been combined with derivatives to form economic hedging relationships.
These securities are being held as part of the Bank’s overall interest rate risk management strategy and have been designated as trading under the
fair value option. The derivatives are carried at fair value, with the change in fair value recognized in the Consolidated Statement of Income.
The total fair value of these securities designated as trading under the fair value option was $2,980 million as at October 31, 2011 (2010 – $2,983
million). These securities are recorded in trading securities on the Consolidated Balance Sheet.
BUSINESS AND GOVERNMENT LOANS DESIGNATED AS TRADING UNDER THE FAIR VALUE OPTION
Certain business and government loans held within a trading portfolio or economically hedged with derivatives, are designated as trading under the
fair value option if the criteria described above are met. The method of determining fair value of these loans is described earlier in the Note.
The total fair value of these loans was $14 million as at October 31, 2011 (2010 – $85 million) which represents their maximum credit exposure.
These loans are recorded in business and government loans on the Consolidated Balance Sheet.
These loans are managed as part of a trading portfolio with risk limits that have been approved by the Bank’s risk management group and are
hedged with various financial instruments, including credit derivatives. The Bank also uses other instruments within this trading portfolio to hedge its
total maximum exposure to loss. At October 31, 2011, the cumulative change in fair value of these loans attributable to changes in credit risk was $9
million (2010 – nil), calculated by determining the changes in credit spread implicit in the fair value of the loans.
INCOME (LOSS) FROM FINANCIAL INSTRUMENTS DESIGNATED AS TRADING UNDER THE FAIR VALUE OPTION
During the year ended October 31, 2011, income (loss) representing net changes in the fair value of financial assets designated as trading under the
fair value option was $0.03 million (2010 – $37 million; 2009 – $256 million). Income (loss) from financial instruments designated as trading under
the fair value option is included in other income. This income (loss) is primarily offset by the changes in the fair value of derivatives used to
economically hedge these assets and is recorded in other income (loss).
NOTE 3 SECURITIES
SECURITIES
The Bank classifies securities pursuant to the requirements of CICA Handbook Section 3855 as trading (including those designated as trading under
the fair value option, described in Note 2), available-for-sale, or held-to-maturity. Debt securities classified as loans are discussed in Note 4.
Trading Securities purchased with the intention of generating profits in the near term are recorded on a trade date basis and are classified as trading.
Transaction costs are expensed as incurred. These securities are accounted for at fair value with the change in fair value as well as any gains or losses
realized on disposal recognized in trading income. Dividends are recognized on the ex-dividend date and interest income is recognized on an accrual
basis. Both are included in interest income.
Available-for-Sale Securities classified as available-for-sale are recorded on a trade date basis and are carried at fair value with changes in fair value recorded in other
comprehensive income. Equity securities that are classified as available-for-sale and do not have quoted market prices are recorded at cost. Gains and
losses realized on disposal of available-for-sale securities are calculated on an average cost basis and are recognized in net securities gains (losses) in
non-interest income. Dividends are recognized on the ex-dividend date and interest income is recognized on an accrual basis using the effective
interest rate method. Both are included in interest income.
Held-to-Maturity Securities with a fixed maturity date that the Bank intends and has the ability to hold to maturity are classified as held-to-maturity and accounted for
at amortized cost. Interest income is recognized using the effective interest rate method.
TD BANK GROUP • 2011 CONSOLIDATED FINANCIAL STATEMENTS AND NOTES 20
IMPAIRMENT OF AVAILABLE-FOR-SALE SECURITIES
Available-for-sale securities are written down to fair value through net securities gains (losses) in non-interest income whenever it is necessary to
reflect other-than-temporary impairment. In the case of debt securities classified as available-for-sale, a subsequent increase in the fair value that can
be objectively related to an event that occurred after the impairment was recognized will result in a reversal of the impairment loss.
IMPAIRMENT OF HELD-TO-MATURITY SECURITIES
For held-to-maturity securities, an impairment loss is recognized when there is objective evidence that there has been a deterioration of credit quality
subsequent to the initial recognition of the security to the extent that the Bank no longer has reasonable assurance as to the timely collection of the
full amount of the principal and interest. The impairment loss is measured as the difference between the asset’s carrying amount and the present
value of estimated future cash flows discounted at the asset’s original effective interest rate.
2008 RECLASSIFICATION OF CERTAIN DEBT SECURITIES
During 2008, the Bank changed its trading strategy with respect to certain trading debt securities as a result of deterioration in markets and severe
dislocation in the credit market. These debt securities were previously recorded at fair value with changes in fair value, as well as any gains or losses
realized on disposal, recognized in trading income. Since the Bank no longer intended to actively trade in these debt securities, the Bank reclassified
these debt securities from trading to the available-for-sale category effective August 1, 2008.
On August 1, 2008, the fair value of debt securities reclassified from trading to available-for-sale was $6,979 million. In addition, on the date of
reclassification, these debt securities had a weighted-average effective interest rate of 6.99% with expected recoverable cash flows, on an
undiscounted basis, of $9,732 million. The fair value of the reclassified debt securities was $1,986 million as at October 31, 2011 (October 31, 2010
– $4,228 million). During the year ended October 31, 2011, net interest income of $183 million after tax (2010 – $262 million after tax; 2009 –$378
million after tax) was recorded relating to the reclassified debt securities. The decrease in fair value of these securities during the year ended October
31, 2011 of $229 million after tax (October 31, 2010 – increase of $108 million after tax) was recorded in other comprehensive income. Had the
Bank not reclassified these debt securities, the change in the fair value of these debt securities would have been included as part of trading income,
the impact of which would have resulted in an decrease in net income of $229 million after tax in the year ended October 31, 2011 (2010 – increase
of $108 million after tax; 2009 – increase of $687 million after tax). During the year ended October 31, 2011, reclassified debt securities with a fair
value of $2,162 million (2010 – $1,594 million) were sold or matured, and $69 million after tax (2010 – $22 million after tax; 2009 – ($72) million
after tax) was recorded in securities gains (losses) during the corresponding period.
SECURITIES PURCHASED UNDER REVERSE REPURCHASE AGREEMENTS, SECURITIES SOLD UNDER REPURCHASE AGREEMENTS, SECURITY BORROWING AND LENDING
Securities purchased under reverse repurchase agreements involve the purchase of securities by the Bank under agreements to resell the securities at a
future date. These agreements are treated as collateralized lending transactions whereby the Bank takes possession of the purchased securities,
monitors its market value relative to the amounts due under the reverse repurchase agreements, and when necessary, requires transfer of additional
collateral. In the event of counterparty default, the financing agreement provides the Bank with the right to liquidate collateral held and offset the
proceeds against the amount owing from the counterparty.
Obligations related to securities sold under repurchase agreements involve the sale of securities by the Bank to counterparties under agreements to
repurchase the securities at a future date. These agreements are treated as collateralized borrowing transactions.
Securities purchased under reverse repurchase agreements and obligations related to securities sold under repurchase agreements are carried at
amortized cost and recorded on the Consolidated Balance Sheet at the respective prices at which the securities were originally acquired or sold, plus
accrued interest. Interest earned on reverse repurchase agreements, and interest incurred on repurchase agreements is determined using the effective
interest rate method and is included in interest income and interest expense, respectively, on the Consolidated Statement of Income.
In security lending transactions the Bank lends securities to a counterparty and receives collateral in the form of cash or securities. If cash collateral
is received, the Bank records the cash along with an obligation to return the cash on the Consolidated Balance Sheet as an obligation related to
securities sold under repurchase agreements. If securities are received as collateral, the Bank does not record the collateral on the Consolidated
Balance Sheet.
In securities borrowing transactions the Bank borrows securities from a counterparty and pledges either cash or securities as collateral. If cash is
pledged as collateral, the Bank records the transaction as securities purchased under reverse repurchase agreements on the Consolidated Balance
Sheet. Securities pledged as collateral remain on the Bank’s Consolidated Balance Sheet. Where securities are pledged as collateral, security lending
income and security borrowing fees are recorded in non-interest income in the Consolidated Statement of Income. Where cash is pledged as
collateral, interest incurred or received is determined using the effective interest rate method and is included in interest income and interest expense,
respectively, in the Consolidated Statement of Income.
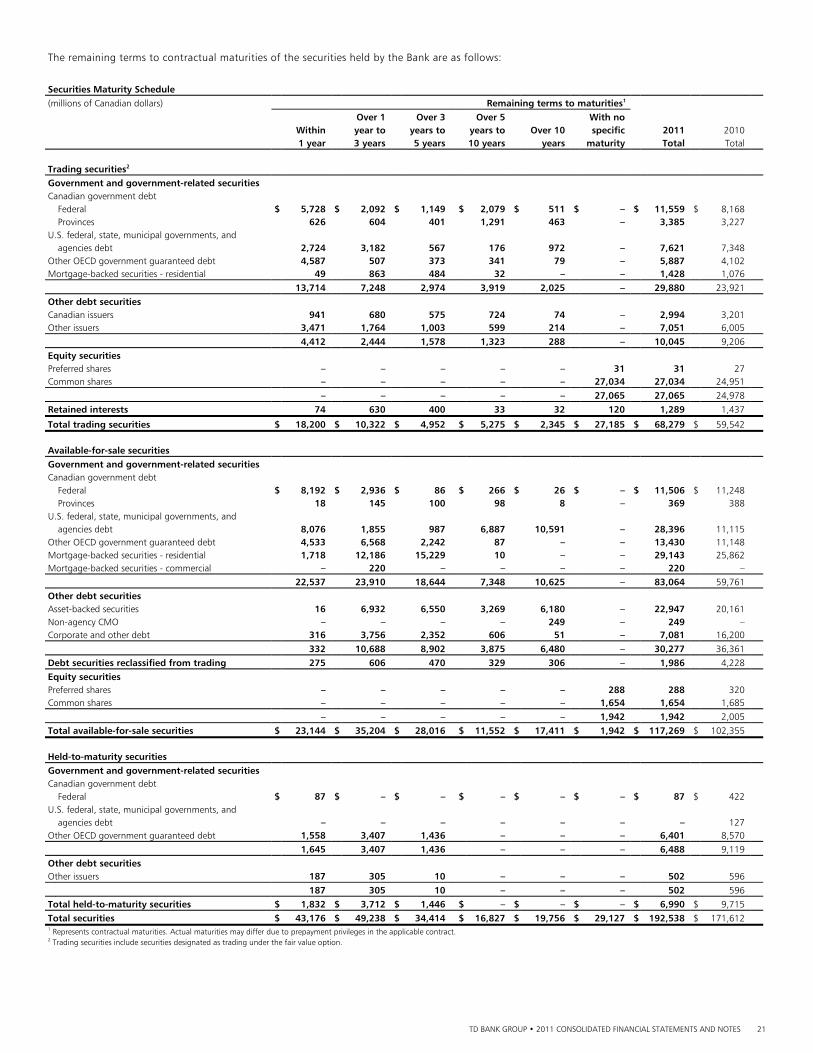
TD BANK GROUP • 2011 CONSOLIDATED FINANCIAL STATEMENTS AND NOTES 21
The remaining terms to contractual maturities of the securities held by the Bank are as follows:
Securities Maturity Schedule
(millions of Canadian dollars) Remaining terms to maturities1
Over 1 Over 3 Over 5 With no Within year to years to years to Over 10 specific 2011 2010 1 year 3 years 5 years 10 years years maturity Total Total Trading securities2 Government and government-related securities Canadian government debt Federal $ 5,728 $ 2,092 $ 1,149 $ 2,079 $ 511 $ – $ 11,559 $ 8,168 Provinces 626 604 401 1,291 463 – 3,385 3,227 U.S. federal, state, municipal governments, and agencies debt 2,724 3,182 567 176 972 – 7,621 7,348 Other OECD government guaranteed debt 4,587 507 373 341 79 – 5,887 4,102 Mortgage-backed securities - residential 49 863 484 32 – – 1,428 1,076
13,714 7,248 2,974 3,919 2,025 – 29,880 23,921
Other debt securities Canadian issuers 941 680 575 724 74 – 2,994 3,201 Other issuers 3,471 1,764 1,003 599 214 – 7,051 6,005
4,412 2,444 1,578 1,323 288 – 10,045 9,206
Equity securities Preferred shares – – – – – 31 31 27 Common shares – – – – – 27,034 27,034 24,951
– – – – – 27,065 27,065 24,978
Retained interests 74 630 400 33 32 120 1,289 1,437
Total trading securities $ 18,200 $ 10,322 $ 4,952 $ 5,275 $ 2,345 $ 27,185 $ 68,279 $ 59,542
Available-for-sale securities Government and government-related securities Canadian government debt Federal $ 8,192 $ 2,936 $ 86 $ 266 $ 26 $ – $ 11,506 $ 11,248 Provinces 18 145 100 98 8 – 369 388 U.S. federal, state, municipal governments, and agencies debt 8,076 1,855 987 6,887 10,591 – 28,396 11,115 Other OECD government guaranteed debt 4,533 6,568 2,242 87 – – 13,430 11,148 Mortgage-backed securities - residential 1,718 12,186 15,229 10 – – 29,143 25,862 Mortgage-backed securities - commercial – 220 – – – – 220 – 22,537 23,910 18,644 7,348 10,625 – 83,064 59,761
Other debt securities Asset-backed securities 16 6,932 6,550 3,269 6,180 – 22,947 20,161 Non-agency CMO – – – – 249 – 249 – Corporate and other debt 316 3,756 2,352 606 51 – 7,081 16,200
332 10,688 8,902 3,875 6,480 – 30,277 36,361
Debt securities reclassified from trading 275 606 470 329 306 – 1,986 4,228
Equity securities Preferred shares – – – – – 288 288 320 Common shares – – – – – 1,654 1,654 1,685
– – – – – 1,942 1,942 2,005
Total available-for-sale securities $ 23,144 $ 35,204 $ 28,016 $ 11,552 $ 17,411 $ 1,942 $ 117,269 $ 102,355 Held-to-maturity securities
Government and government-related securities Canadian government debt Federal $ 87 $ – $ – $ – $ – $ – $ 87 $ 422 U.S. federal, state, municipal governments, and agencies debt – – – – – – – 127 Other OECD government guaranteed debt 1,558 3,407 1,436 – – – 6,401 8,570 1,645 3,407 1,436 – – – 6,488 9,119
Other debt securities Other issuers 187 305 10 – – – 502 596
187 305 10 – – – 502 596
Total held-to-maturity securities $ 1,832 $ 3,712 $ 1,446 $ – $ – $ – $ 6,990 $ 9,715
Total securities $ 43,176 $ 49,238 $ 34,414 $ 16,827 $ 19,756 $ 29,127 $ 192,538 $ 171,612 1 Represents contractual maturities. Actual maturities may differ due to prepayment privileges in the applicable contract. 2 Trading securities include securities designated as trading under the fair value option.
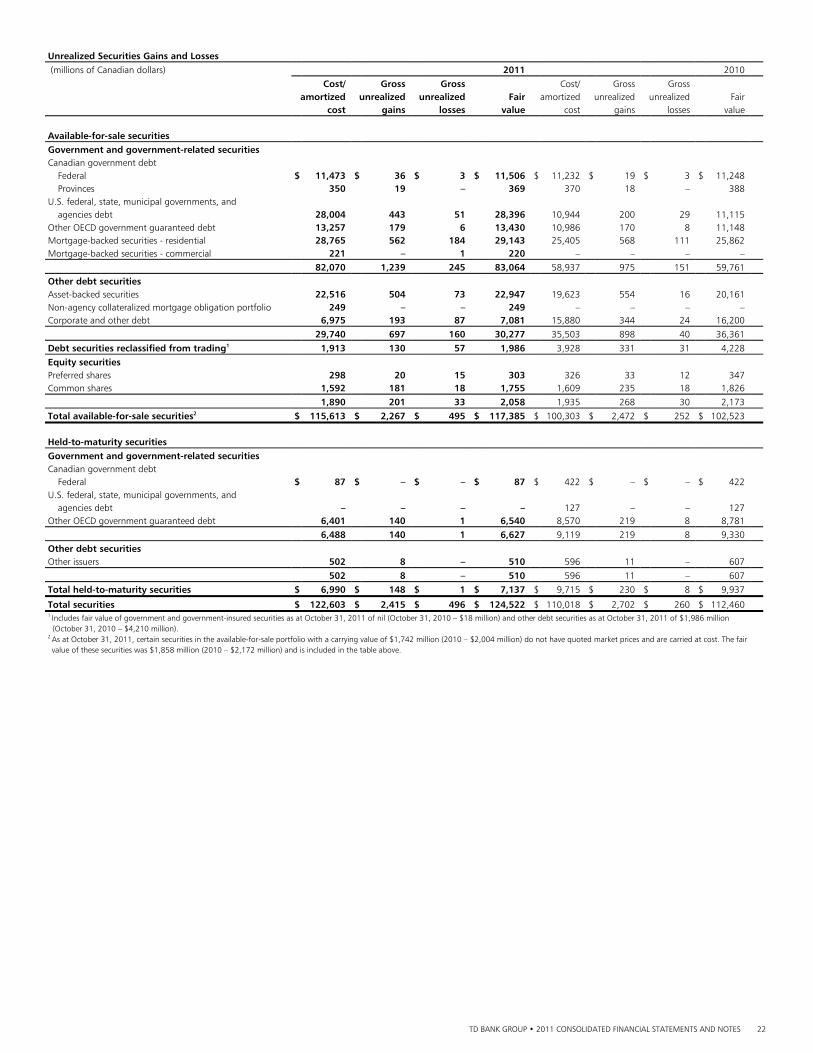
TD BANK GROUP • 2011 CONSOLIDATED FINANCIAL STATEMENTS AND NOTES 22
Unrealized Securities Gains and Losses (millions of Canadian dollars) 2011 2010
Cost/ Gross Gross Cost/ Gross Gross amortized unrealized unrealized Fair amortized unrealized unrealized Fair cost gains losses value cost gains losses value Available-for-sale securities Government and government-related securities Canadian government debt Federal $ 11,473 $ 36 $ 3 $ 11,506 $ 11,232 $ 19 $ 3 $ 11,248 Provinces 350 19 – 369 370 18 – 388 U.S. federal, state, municipal governments, and agencies debt 28,004 443 51 28,396 10,944 200 29 11,115 Other OECD government guaranteed debt 13,257 179 6 13,430 10,986 170 8 11,148 Mortgage-backed securities - residential 28,765 562 184 29,143 25,405 568 111 25,862 Mortgage-backed securities - commercial 221 – 1 220 – – – – 82,070 1,239 245 83,064 58,937 975 151 59,761
Other debt securities Asset-backed securities 22,516 504 73 22,947 19,623 554 16 20,161 Non-agency collateralized mortgage obligation portfolio 249 – – 249 – – – – Corporate and other debt 6,975 193 87 7,081 15,880 344 24 16,200
29,740 697 160 30,277 35,503 898 40 36,361
Debt securities reclassified from trading1 1,913 130 57 1,986 3,928 331 31 4,228
Equity securities Preferred shares 298 20 15 303 326 33 12 347 Common shares 1,592 181 18 1,755 1,609 235 18 1,826
1,890 201 33 2,058 1,935 268 30 2,173
Total available-for-sale securities2 $ 115,613 $ 2,267 $ 495 $ 117,385 $ 100,303 $ 2,472 $ 252 $ 102,523 Held-to-maturity securities
Government and government-related securities Canadian government debt Federal $ 87 $ – $ – $ 87 $ 422 $ – $ – $ 422 U.S. federal, state, municipal governments, and agencies debt – – – – 127 – – 127 Other OECD government guaranteed debt 6,401 140 1 6,540 8,570 219 8 8,781 6,488 140 1 6,627 9,119 219 8 9,330
Other debt securities Other issuers 502 8 – 510 596 11 – 607
502 8 – 510 596 11 – 607
Total held-to-maturity securities $ 6,990 $ 148 $ 1 $ 7,137 $ 9,715 $ 230 $ 8 $ 9,937
Total securities $ 122,603 $ 2,415 $ 496 $ 124,522 $ 110,018 $ 2,702 $ 260 $ 112,460 1 Includes fair value of government and government-insured securities as at October 31, 2011 of nil (October 31, 2010 – $18 million) and other debt securities as at October 31, 2011 of $1,986 million (October 31, 2010 – $4,210 million). 2 As at October 31, 2011, certain securities in the available-for-sale portfolio with a carrying value of $1,742 million (2010 – $2,004 million) do not have quoted market prices and are carried at cost. The fair value of these securities was $1,858 million (2010 – $2,172 million) and is included in the table above.
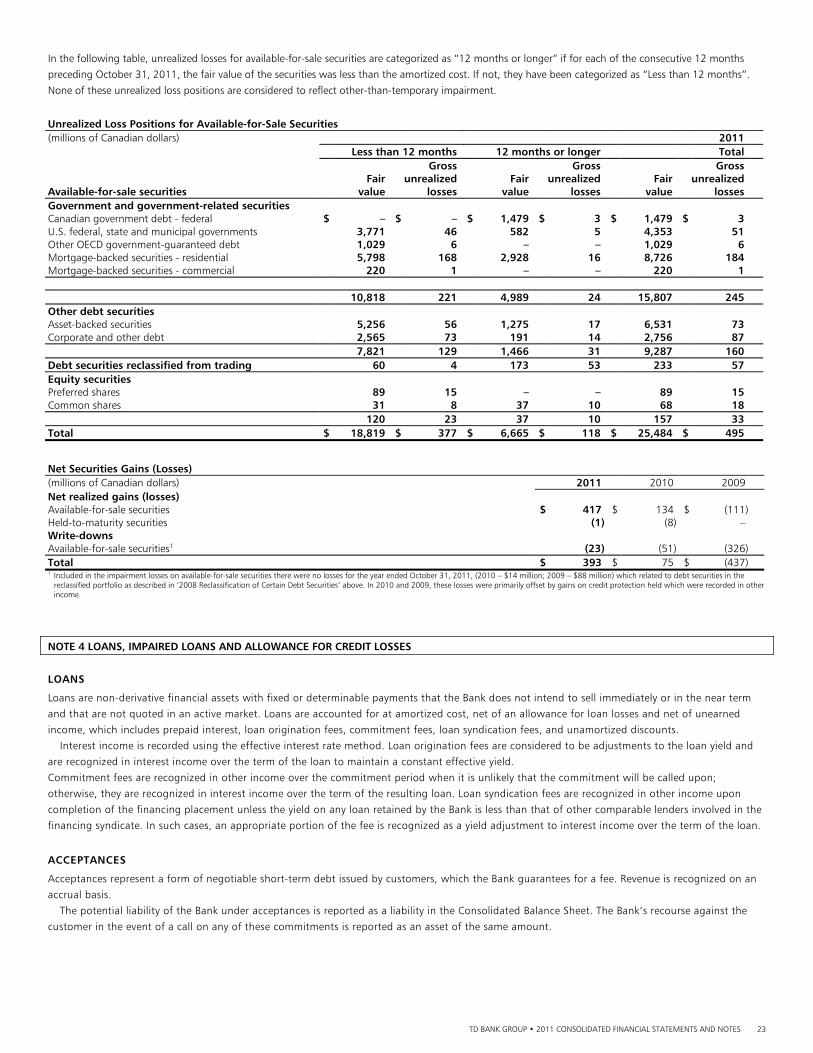
TD BANK GROUP • 2011 CONSOLIDATED FINANCIAL STATEMENTS AND NOTES 23
In the following table, unrealized losses for available-for-sale securities are categorized as “12 months or longer” if for each of the consecutive 12 months
preceding October 31, 2011, the fair value of the securities was less than the amortized cost. If not, they have been categorized as “Less than 12 months”.
None of these unrealized loss positions are considered to reflect other-than-temporary impairment.
Unrealized Loss Positions for Available-for-Sale Securities (millions of Canadian dollars) 2011 Less than 12 months 12 months or longer Total Gross Gross Gross Fair unrealized Fair unrealized Fair unrealized Available-for-sale securities value losses value losses value losses Government and government-related securities Canadian government debt - federal $ – $ – $ 1,479 $ 3 $ 1,479 $ 3 U.S. federal, state and municipal governments 3,771 46 582 5 4,353 51 Other OECD government-guaranteed debt 1,029 6 – – 1,029 6 Mortgage-backed securities - residential 5,798 168 2,928 16 8,726 184 Mortgage-backed securities - commercial 220 1 – – 220 1 10,818 221 4,989 24 15,807 245 Other debt securities Asset-backed securities 5,256 56 1,275 17 6,531 73 Corporate and other debt 2,565 73 191 14 2,756 87 7,821 129 1,466 31 9,287 160 Debt securities reclassified from trading 60 4 173 53 233 57 Equity securities Preferred shares 89 15 – – 89 15 Common shares 31 8 37 10 68 18 120 23 37 10 157 33 Total $ 18,819 $ 377 $ 6,665 $ 118 $ 25,484 $ 495
Net Securities Gains (Losses)
(millions of Canadian dollars) 2011 2010 2009 Net realized gains (losses) Available-for-sale securities $ 417 $ 134 $ (111)Held-to-maturity securities (1) (8) – Write-downs Available-for-sale securities1 (23) (51) (326)Total $ 393 $ 75 $ (437)1 Included in the impairment losses on available-for-sale securities there were no losses for the year ended October 31, 2011, (2010 – $14 million; 2009 – $88 million) which related to debt securities in the
reclassified portfolio as described in ‘2008 Reclassification of Certain Debt Securities’ above. In 2010 and 2009, these losses were primarily offset by gains on credit protection held which were recorded in other income.
NOTE 4 LOANS, IMPAIRED LOANS AND ALLOWANCE FOR CREDIT LOSSES
LOANS
Loans are non-derivative financial assets with fixed or determinable payments that the Bank does not intend to sell immediately or in the near term
and that are not quoted in an active market. Loans are accounted for at amortized cost, net of an allowance for loan losses and net of unearned
income, which includes prepaid interest, loan origination fees, commitment fees, loan syndication fees, and unamortized discounts.
Interest income is recorded using the effective interest rate method. Loan origination fees are considered to be adjustments to the loan yield and
are recognized in interest income over the term of the loan to maintain a constant effective yield.
Commitment fees are recognized in other income over the commitment period when it is unlikely that the commitment will be called upon;
otherwise, they are recognized in interest income over the term of the resulting loan. Loan syndication fees are recognized in other income upon
completion of the financing placement unless the yield on any loan retained by the Bank is less than that of other comparable lenders involved in the
financing syndicate. In such cases, an appropriate portion of the fee is recognized as a yield adjustment to interest income over the term of the loan.
ACCEPTANCES
Acceptances represent a form of negotiable short-term debt issued by customers, which the Bank guarantees for a fee. Revenue is recognized on an
accrual basis.
The potential liability of the Bank under acceptances is reported as a liability in the Consolidated Balance Sheet. The Bank’s recourse against the
customer in the event of a call on any of these commitments is reported as an asset of the same amount.
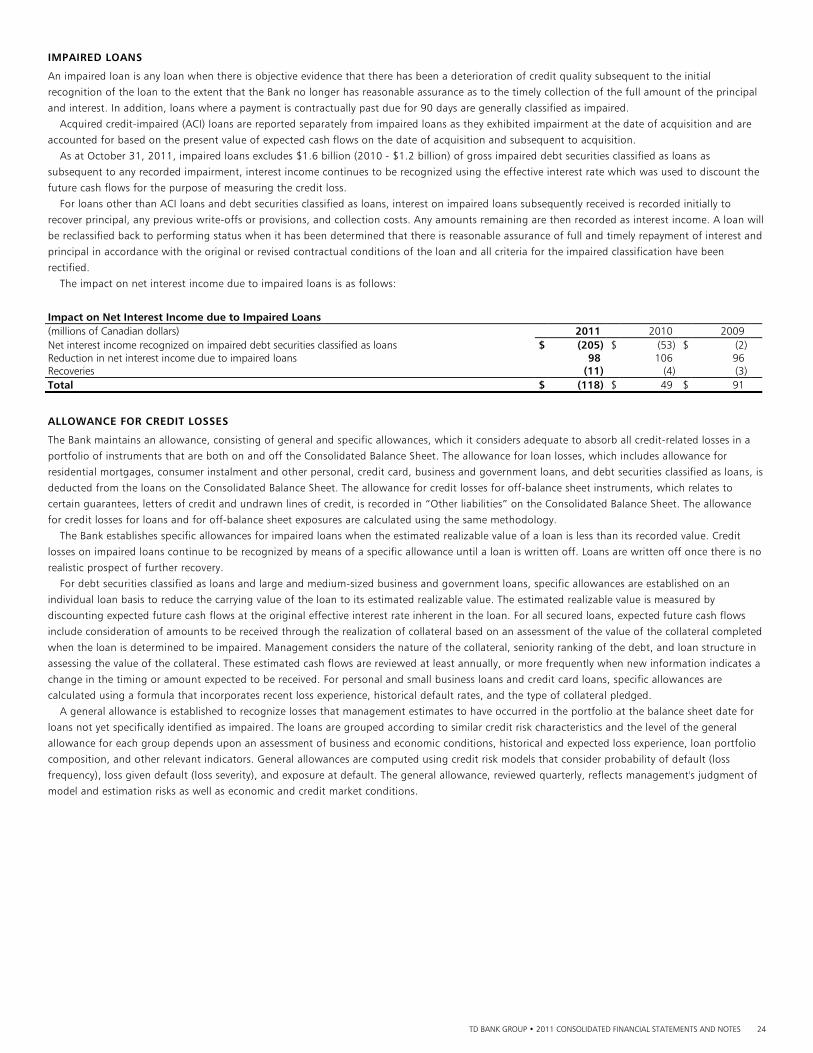
TD BANK GROUP • 2011 CONSOLIDATED FINANCIAL STATEMENTS AND NOTES 24
IMPAIRED LOANS
An impaired loan is any loan when there is objective evidence that there has been a deterioration of credit quality subsequent to the initial
recognition of the loan to the extent that the Bank no longer has reasonable assurance as to the timely collection of the full amount of the principal
and interest. In addition, loans where a payment is contractually past due for 90 days are generally classified as impaired.
Acquired credit-impaired (ACI) loans are reported separately from impaired loans as they exhibited impairment at the date of acquisition and are
accounted for based on the present value of expected cash flows on the date of acquisition and subsequent to acquisition.
As at October 31, 2011, impaired loans excludes $1.6 billion (2010 - $1.2 billion) of gross impaired debt securities classified as loans as
subsequent to any recorded impairment, interest income continues to be recognized using the effective interest rate which was used to discount the
future cash flows for the purpose of measuring the credit loss.
For loans other than ACI loans and debt securities classified as loans, interest on impaired loans subsequently received is recorded initially to
recover principal, any previous write-offs or provisions, and collection costs. Any amounts remaining are then recorded as interest income. A loan will
be reclassified back to performing status when it has been determined that there is reasonable assurance of full and timely repayment of interest and
principal in accordance with the original or revised contractual conditions of the loan and all criteria for the impaired classification have been
rectified.
The impact on net interest income due to impaired loans is as follows:
Impact on Net Interest Income due to Impaired Loans (millions of Canadian dollars) 2011 2010 2009 Net interest income recognized on impaired debt securities classified as loans $ (205) $ (53) $ (2)Reduction in net interest income due to impaired loans 98 106 96 Recoveries (11) (4) (3)Total $ (118) $ 49 $ 91
ALLOWANCE FOR CREDIT LOSSES
The Bank maintains an allowance, consisting of general and specific allowances, which it considers adequate to absorb all credit-related losses in a
portfolio of instruments that are both on and off the Consolidated Balance Sheet. The allowance for loan losses, which includes allowance for
residential mortgages, consumer instalment and other personal, credit card, business and government loans, and debt securities classified as loans, is
deducted from the loans on the Consolidated Balance Sheet. The allowance for credit losses for off-balance sheet instruments, which relates to
certain guarantees, letters of credit and undrawn lines of credit, is recorded in “Other liabilities” on the Consolidated Balance Sheet. The allowance
for credit losses for loans and for off-balance sheet exposures are calculated using the same methodology.
The Bank establishes specific allowances for impaired loans when the estimated realizable value of a loan is less than its recorded value. Credit
losses on impaired loans continue to be recognized by means of a specific allowance until a loan is written off. Loans are written off once there is no
realistic prospect of further recovery.
For debt securities classified as loans and large and medium-sized business and government loans, specific allowances are established on an
individual loan basis to reduce the carrying value of the loan to its estimated realizable value. The estimated realizable value is measured by
discounting expected future cash flows at the original effective interest rate inherent in the loan. For all secured loans, expected future cash flows
include consideration of amounts to be received through the realization of collateral based on an assessment of the value of the collateral completed
when the loan is determined to be impaired. Management considers the nature of the collateral, seniority ranking of the debt, and loan structure in
assessing the value of the collateral. These estimated cash flows are reviewed at least annually, or more frequently when new information indicates a
change in the timing or amount expected to be received. For personal and small business loans and credit card loans, specific allowances are
calculated using a formula that incorporates recent loss experience, historical default rates, and the type of collateral pledged.
A general allowance is established to recognize losses that management estimates to have occurred in the portfolio at the balance sheet date for
loans not yet specifically identified as impaired. The loans are grouped according to similar credit risk characteristics and the level of the general
allowance for each group depends upon an assessment of business and economic conditions, historical and expected loss experience, loan portfolio
composition, and other relevant indicators. General allowances are computed using credit risk models that consider probability of default (loss
frequency), loss given default (loss severity), and exposure at default. The general allowance, reviewed quarterly, reflects management's judgment of
model and estimation risks as well as economic and credit market conditions.
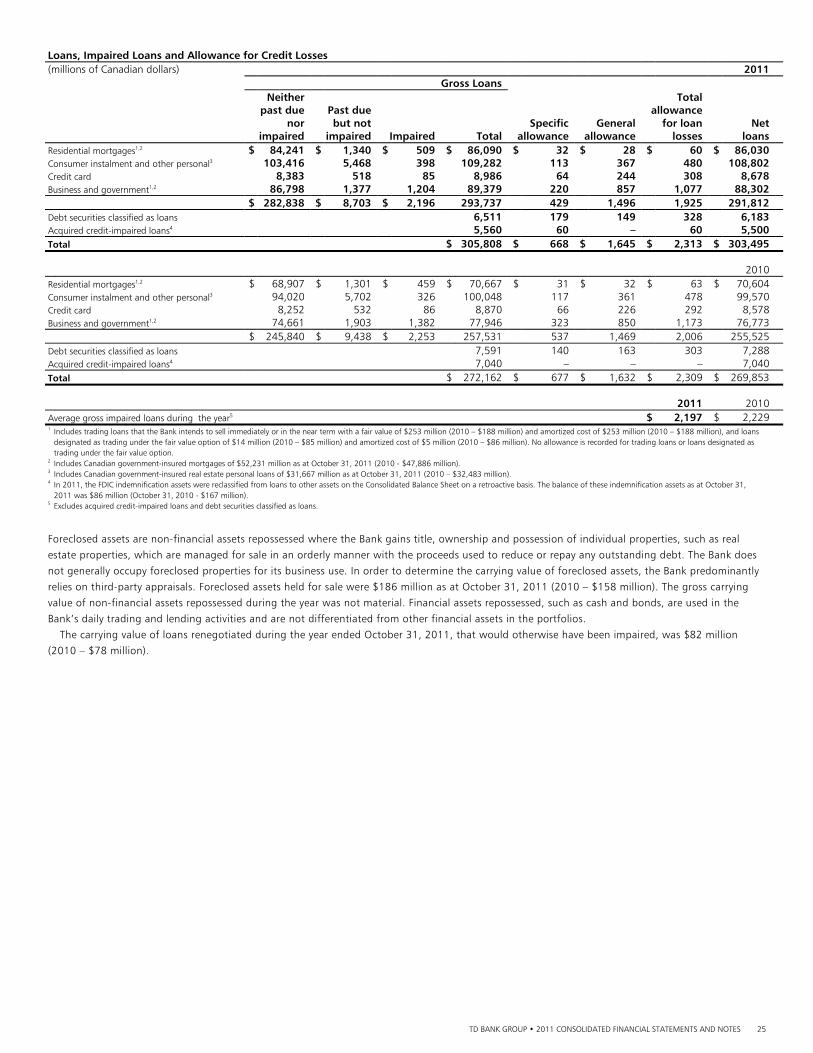
TD BANK GROUP • 2011 CONSOLIDATED FINANCIAL STATEMENTS AND NOTES 25
Loans, Impaired Loans and Allowance for Credit Losses (millions of Canadian dollars) 2011 Gross Loans Neither Total past due Past due allowance nor but not Specific General for loan Net impaired impaired Impaired Total allowance allowance losses loans Residential mortgages1,2 $ 84,241 $ 1,340 $ 509 $ 86,090 $ 32 $ 28 $ 60 $ 86,030 Consumer instalment and other personal3 103,416 5,468 398 109,282 113 367 480 108,802 Credit card 8,383 518 85 8,986 64 244 308 8,678 Business and government1,2 86,798 1,377 1,204 89,379 220 857 1,077 88,302 $ 282,838 $ 8,703 $ 2,196 293,737 429 1,496 1,925 291,812 Debt securities classified as loans 6,511 179 149 328 6,183 Acquired credit-impaired loans4 5,560 60 – 60 5,500 Total $ 305,808 $ 668 $ 1,645 $ 2,313 $ 303,495 2010 Residential mortgages1,2 $ 68,907 $ 1,301 $ 459 $ 70,667 $ 31 $ 32 $ 63 $ 70,604 Consumer instalment and other personal3 94,020 5,702 326 100,048 117 361 478 99,570 Credit card 8,252 532 86 8,870 66 226 292 8,578 Business and government1,2 74,661 1,903 1,382 77,946 323 850 1,173 76,773 $ 245,840 $ 9,438 $ 2,253 257,531 537 1,469 2,006 255,525 Debt securities classified as loans 7,591 140 163 303 7,288 Acquired credit-impaired loans4 7,040 – – – 7,040 Total $ 272,162 $ 677 $ 1,632 $ 2,309 $ 269,853 2011 2010 Average gross impaired loans during the year5 $ 2,197 $ 2,229 1 Includes trading loans that the Bank intends to sell immediately or in the near term with a fair value of $253 million (2010 – $188 million) and amortized cost of $253 million (2010 – $188 million), and loans
designated as trading under the fair value option of $14 million (2010 – $85 million) and amortized cost of $5 million (2010 – $86 million). No allowance is recorded for trading loans or loans designated as trading under the fair value option.
2 Includes Canadian government-insured mortgages of $52,231 million as at October 31, 2011 (2010 - $47,886 million). 3 Includes Canadian government-insured real estate personal loans of $31,667 million as at October 31, 2011 (2010 – $32,483 million). 4 In 2011, the FDIC indemnification assets were reclassified from loans to other assets on the Consolidated Balance Sheet on a retroactive basis. The balance of these indemnification assets as at October 31,
2011 was $86 million (October 31, 2010 - $167 million). 5 Excludes acquired credit-impaired loans and debt securities classified as loans.
Foreclosed assets are non-financial assets repossessed where the Bank gains title, ownership and possession of individual properties, such as real
estate properties, which are managed for sale in an orderly manner with the proceeds used to reduce or repay any outstanding debt. The Bank does
not generally occupy foreclosed properties for its business use. In order to determine the carrying value of foreclosed assets, the Bank predominantly
relies on third-party appraisals. Foreclosed assets held for sale were $186 million as at October 31, 2011 (2010 – $158 million). The gross carrying
value of non-financial assets repossessed during the year was not material. Financial assets repossessed, such as cash and bonds, are used in the
Bank’s daily trading and lending activities and are not differentiated from other financial assets in the portfolios.
The carrying value of loans renegotiated during the year ended October 31, 2011, that would otherwise have been impaired, was $82 million
(2010 – $78 million).
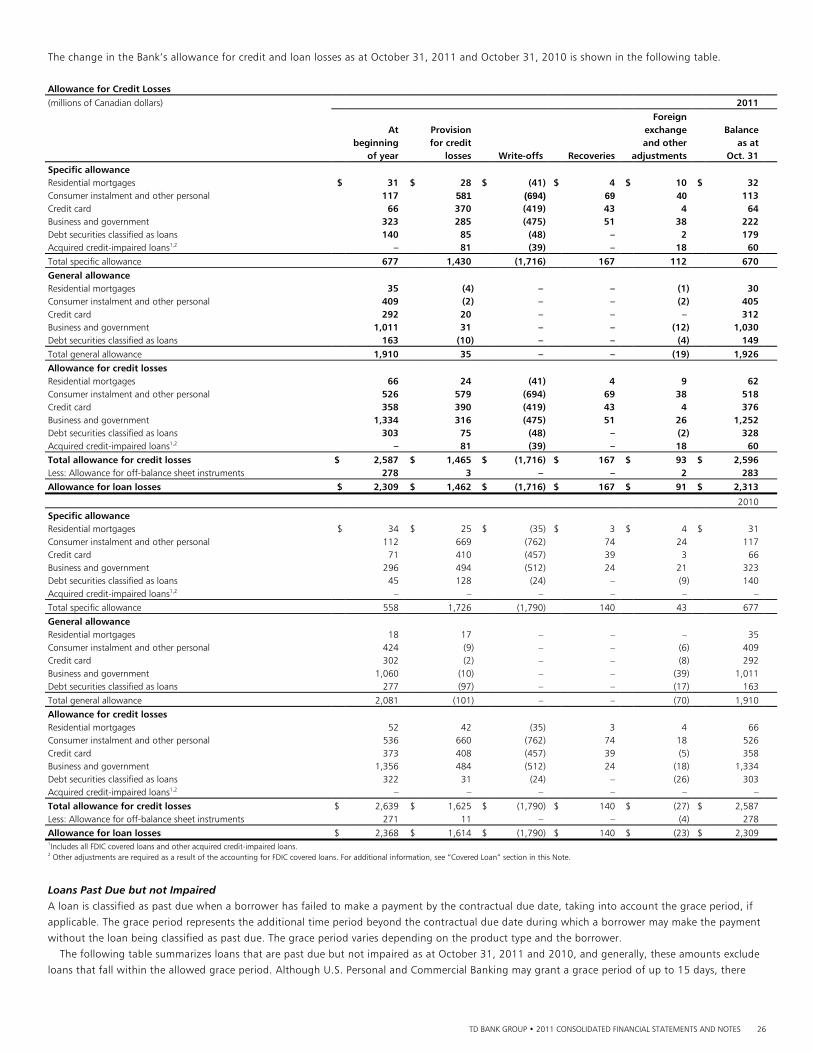
TD BANK GROUP • 2011 CONSOLIDATED FINANCIAL STATEMENTS AND NOTES 26
The change in the Bank’s allowance for credit and loan losses as at October 31, 2011 and October 31, 2010 is shown in the following table.
Allowance for Credit Losses
(millions of Canadian dollars) 2011 Foreign At Provision exchange Balance beginning for credit and other as at of year losses Write-offs Recoveries adjustments Oct. 31 Specific allowance Residential mortgages $ 31 $ 28 $ (41) $ 4 $ 10 $ 32 Consumer instalment and other personal 117 581 (694) 69 40 113 Credit card 66 370 (419) 43 4 64 Business and government 323 285 (475) 51 38 222 Debt securities classified as loans 140 85 (48) – 2 179 Acquired credit-impaired loans1,2 – 81 (39) – 18 60 Total specific allowance 677 1,430 (1,716) 167 112 670 General allowance Residential mortgages 35 (4) – – (1) 30 Consumer instalment and other personal 409 (2) – – (2) 405 Credit card 292 20 – – – 312 Business and government 1,011 31 – – (12) 1,030 Debt securities classified as loans 163 (10) – – (4) 149 Total general allowance 1,910 35 – – (19) 1,926 Allowance for credit losses Residential mortgages 66 24 (41) 4 9 62 Consumer instalment and other personal 526 579 (694) 69 38 518 Credit card 358 390 (419) 43 4 376 Business and government 1,334 316 (475) 51 26 1,252 Debt securities classified as loans 303 75 (48) – (2) 328 Acquired credit-impaired loans1,2 – 81 (39) – 18 60 Total allowance for credit losses $ 2,587 $ 1,465 $ (1,716) $ 167 $ 93 $ 2,596 Less: Allowance for off-balance sheet instruments 278 3 – – 2 283 Allowance for loan losses $ 2,309 $ 1,462 $ (1,716) $ 167 $ 91 $ 2,313
2010 Specific allowance Residential mortgages $ 34 $ 25 $ (35) $ 3 $ 4 $ 31 Consumer instalment and other personal 112 669 (762) 74 24 117 Credit card 71 410 (457) 39 3 66 Business and government 296 494 (512) 24 21 323 Debt securities classified as loans 45 128 (24) – (9) 140 Acquired credit-impaired loans1,2 – – – – – – Total specific allowance 558 1,726 (1,790) 140 43 677
General allowance Residential mortgages 18 17 – – – 35 Consumer instalment and other personal 424 (9) – – (6) 409 Credit card 302 (2) – – (8) 292 Business and government 1,060 (10) – – (39) 1,011 Debt securities classified as loans 277 (97) – – (17) 163
Total general allowance 2,081 (101) – – (70) 1,910
Allowance for credit losses Residential mortgages 52 42 (35) 3 4 66 Consumer instalment and other personal 536 660 (762) 74 18 526 Credit card 373 408 (457) 39 (5) 358 Business and government 1,356 484 (512) 24 (18) 1,334 Debt securities classified as loans 322 31 (24) – (26) 303 Acquired credit-impaired loans1,2 – – – – – –
Total allowance for credit losses $ 2,639 $ 1,625 $ (1,790) $ 140 $ (27) $ 2,587 Less: Allowance for off-balance sheet instruments 271 11 – – (4) 278 Allowance for loan losses $ 2,368 $ 1,614 $ (1,790) $ 140 $ (23) $ 2,309 1Includes all FDIC covered loans and other acquired credit-impaired loans. 2 Other adjustments are required as a result of the accounting for FDIC covered loans. For additional information, see “Covered Loan” section in this Note.
Loans Past Due but not Impaired A loan is classified as past due when a borrower has failed to make a payment by the contractual due date, taking into account the grace period, if
applicable. The grace period represents the additional time period beyond the contractual due date during which a borrower may make the payment
without the loan being classified as past due. The grace period varies depending on the product type and the borrower.
The following table summarizes loans that are past due but not impaired as at October 31, 2011 and 2010, and generally, these amounts exclude
loans that fall within the allowed grace period. Although U.S. Personal and Commercial Banking may grant a grace period of up to 15 days, there

TD BANK GROUP • 2011 CONSOLIDATED FINANCIAL STATEMENTS AND NOTES 27
were $1.3 billion as at October 31, 2011 (2010 – $1.3 billion), of U.S. Personal and Commercial Banking loans that were past due up to 15 days that
are included in the 1-30 days category in the following table.
Loans Past Due but not Impaired1 (millions of Canadian dollars) 2011 2010 1 to 30 31 to 60 61 to 89 1 to 30 31 to 60 61 to 89 days days days Total days days days Total Residential mortgages $ 758 $ 465 $ 117 $ 1,340 $ 830 $ 377 $ 94 $ 1,301 Consumer instalment and other personal 4,583 724 161 5,468 4,753 777 172 5,702 Credit card 395 78 45 518 405 81 46 532 Business and government 1,082 211 84 1,377 1,312 455 136 1,903 Total $ 6,818 $ 1,478 $ 407 $ 8,703 $ 7,300 $ 1,690 $ 448 $ 9,438 1 Excludes all acquired credit-impaired loans.
Collateral As at October 31, 2011, the fair value of financial collateral held against loans that were past due but not impaired was $113 million (2010 – $22
million). In addition, the Bank also holds non-financial collateral as security for loans. The fair value of non-financial collateral is determined at the
origination date of the loan. A revaluation of non-financial collateral is performed if there has been a significant change in the terms and conditions
of the loan and/or the loan is considered impaired. For impaired loans, an assessment of the collateral is taken into consideration when estimating
the net realizable amount of the loan.
ACQUIRED LOANS
All acquired loans are initially measured at their fair value which reflects incurred credit losses estimated at the acquisition date and also reflects
adjustments based on the acquired loan’s interest rate in comparison to then current market rates. As a result, no allowance for credit losses is
recorded on the date of acquisition. When loans are acquired with evidence of incurred credit loss where it is probable at the purchase date that the
Bank will be unable to collect all contractually required principal and interest payments, they are considered to be ACI loans; these loans and their
associated accounting are described in the following section below.
Acquired loans for which incurred loss is not present at the acquisition date, are subsequently accounted for at amortized cost based on their
contractual cash flows and any acquisition related discount or premium is considered to be an adjustment to the loan yield and are recognized in
interest income over the term of the loan using the effective interest rate method. These loans are not presented separate and apart from the Bank’s
originated loan portfolios and are subject to assessment under the Bank’s allowance framework for both general and specific allowances subsequent
to acquisition. Acquired Credit-Impaired Loans ACI are acquired loans with evidence of incurred credit loss where it is probable at the purchase date that the Bank will be unable to collect all
contractually required principal and interest payments. These loans are accounted for based on the present value of expected cash flows as opposed
to their contractual cash flows. ACI loans are comprised of commercial, retail and Federal Deposit Insurance Corporation (“FDIC”) covered loans,
from the South Financial, FDIC-assisted, and Chrysler Financial acquisitions, with outstanding unpaid principal balances of $6.3 billion, $2.1 billion
and $0.9 billion, respectively, at the acquisition date and fair values of $5.6 billion, $1.9 billion and $0.8 billion, respectively.
ACI loans were identified as impaired at acquisition based on specific risk characteristics of the loans, including past due status, performance
history as well as recent borrower credit scores. The Bank then determined the fair value of the ACI loans at the acquisition date by discounting
expected cash flows at a market observable discount rate and where necessary adjusted for factors a market participant would use when determining
fair value. In determining the expected cash flows to be collected, management incorporated assumptions regarding default rates, loss severities and
the amount and timing of prepayments.
With respect to certain individually significant ACI loans, accounting is applied individually at the loan level. Remaining ACI loans are aggregated
into one or more pools provided that they are acquired in the same fiscal quarter and have common risk characteristics. A pool is then accounted for
as a single asset with a single composite interest rate and an aggregate expectation of cash flows.
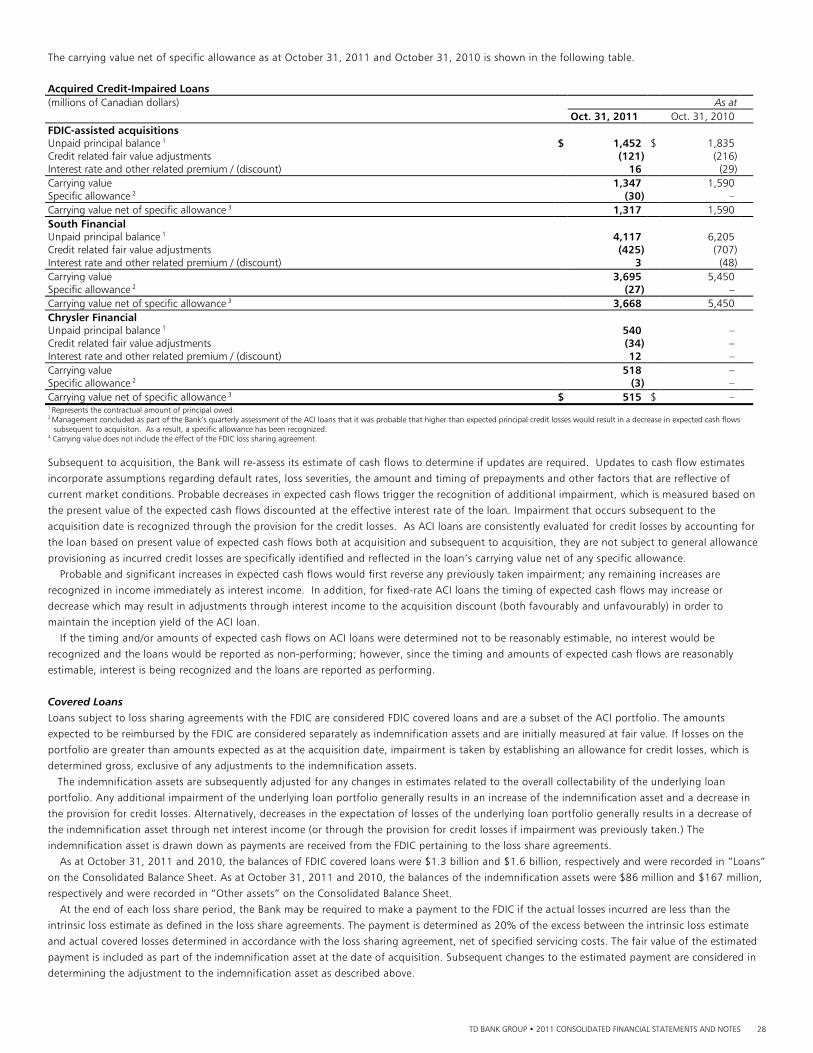
TD BANK GROUP • 2011 CONSOLIDATED FINANCIAL STATEMENTS AND NOTES 28
The carrying value net of specific allowance as at October 31, 2011 and October 31, 2010 is shown in the following table.
Acquired Credit-Impaired Loans
(millions of Canadian dollars) As at
Oct. 31, 2011 Oct. 31, 2010
FDIC-assisted acquisitions Unpaid principal balance 1 $ 1,452 $ 1,835 Credit related fair value adjustments (121) (216) Interest rate and other related premium / (discount) 16 (29)
Carrying value 1,347 1,590 Specific allowance 2 (30) –
Carrying value net of specific allowance 3 1,317 1,590
South Financial Unpaid principal balance 1 4,117 6,205 Credit related fair value adjustments (425) (707) Interest rate and other related premium / (discount) 3 (48)
Carrying value 3,695 5,450 Specific allowance 2 (27) –
Carrying value net of specific allowance 3 3,668 5,450
Chrysler Financial Unpaid principal balance 1 540 – Credit related fair value adjustments (34) – Interest rate and other related premium / (discount) 12 –
Carrying value 518 – Specific allowance 2 (3) –
Carrying value net of specific allowance 3 $ 515 $ – 1 Represents the contractual amount of principal owed. 2 Management concluded as part of the Bank’s quarterly assessment of the ACI loans that it was probable that higher than expected principal credit losses would result in a decrease in expected cash flows
subsequent to acquisiton. As a result, a specific allowance has been recognized. 3 Carrying value does not include the effect of the FDIC loss sharing agreement.
Subsequent to acquisition, the Bank will re-assess its estimate of cash flows to determine if updates are required. Updates to cash flow estimates
incorporate assumptions regarding default rates, loss severities, the amount and timing of prepayments and other factors that are reflective of
current market conditions. Probable decreases in expected cash flows trigger the recognition of additional impairment, which is measured based on
the present value of the expected cash flows discounted at the effective interest rate of the loan. Impairment that occurs subsequent to the
acquisition date is recognized through the provision for the credit losses. As ACI loans are consistently evaluated for credit losses by accounting for
the loan based on present value of expected cash flows both at acquisition and subsequent to acquisition, they are not subject to general allowance
provisioning as incurred credit losses are specifically identified and reflected in the loan’s carrying value net of any specific allowance.
Probable and significant increases in expected cash flows would first reverse any previously taken impairment; any remaining increases are
recognized in income immediately as interest income. In addition, for fixed-rate ACI loans the timing of expected cash flows may increase or
decrease which may result in adjustments through interest income to the acquisition discount (both favourably and unfavourably) in order to
maintain the inception yield of the ACI loan.
If the timing and/or amounts of expected cash flows on ACI loans were determined not to be reasonably estimable, no interest would be
recognized and the loans would be reported as non-performing; however, since the timing and amounts of expected cash flows are reasonably
estimable, interest is being recognized and the loans are reported as performing.
Covered Loans Loans subject to loss sharing agreements with the FDIC are considered FDIC covered loans and are a subset of the ACI portfolio. The amounts
expected to be reimbursed by the FDIC are considered separately as indemnification assets and are initially measured at fair value. If losses on the
portfolio are greater than amounts expected as at the acquisition date, impairment is taken by establishing an allowance for credit losses, which is
determined gross, exclusive of any adjustments to the indemnification assets.
The indemnification assets are subsequently adjusted for any changes in estimates related to the overall collectability of the underlying loan
portfolio. Any additional impairment of the underlying loan portfolio generally results in an increase of the indemnification asset and a decrease in
the provision for credit losses. Alternatively, decreases in the expectation of losses of the underlying loan portfolio generally results in a decrease of
the indemnification asset through net interest income (or through the provision for credit losses if impairment was previously taken.) The
indemnification asset is drawn down as payments are received from the FDIC pertaining to the loss share agreements.
As at October 31, 2011 and 2010, the balances of FDIC covered loans were $1.3 billion and $1.6 billion, respectively and were recorded in “Loans”
on the Consolidated Balance Sheet. As at October 31, 2011 and 2010, the balances of the indemnification assets were $86 million and $167 million,
respectively and were recorded in “Other assets” on the Consolidated Balance Sheet.
At the end of each loss share period, the Bank may be required to make a payment to the FDIC if the actual losses incurred are less than the
intrinsic loss estimate as defined in the loss share agreements. The payment is determined as 20% of the excess between the intrinsic loss estimate
and actual covered losses determined in accordance with the loss sharing agreement, net of specified servicing costs. The fair value of the estimated
payment is included as part of the indemnification asset at the date of acquisition. Subsequent changes to the estimated payment are considered in
determining the adjustment to the indemnification asset as described above.
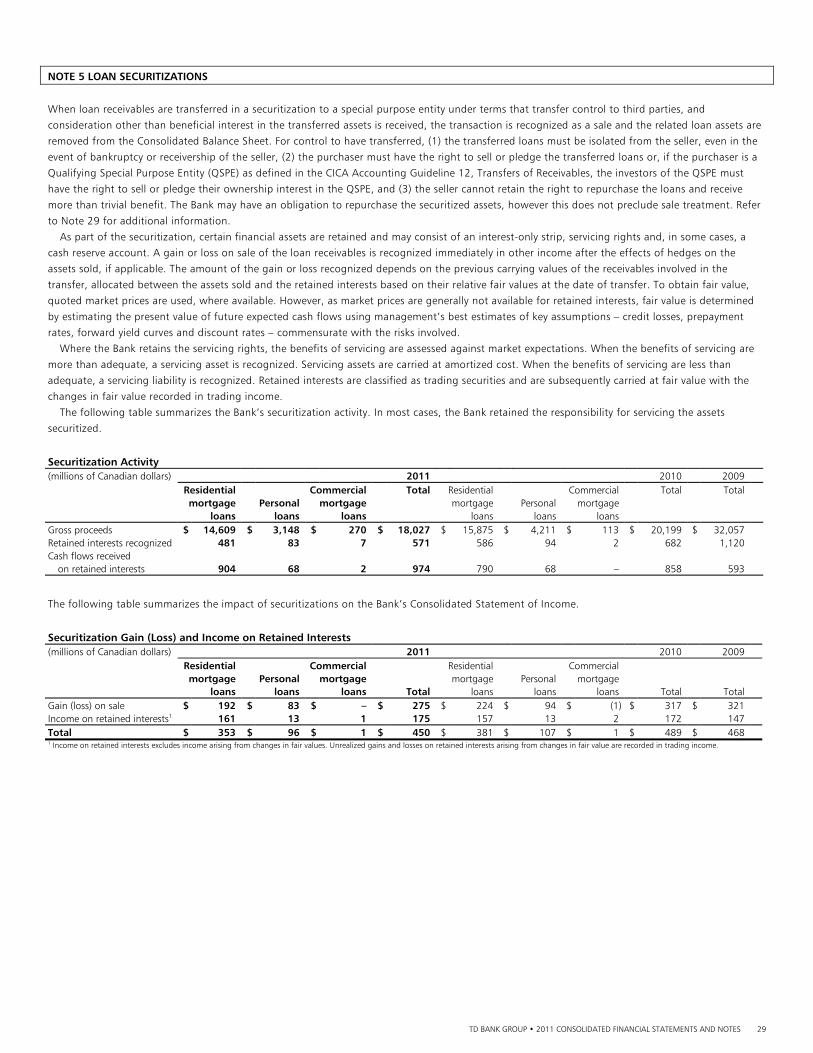
TD BANK GROUP • 2011 CONSOLIDATED FINANCIAL STATEMENTS AND NOTES 29
NOTE 5 LOAN SECURITIZATIONS
When loan receivables are transferred in a securitization to a special purpose entity under terms that transfer control to third parties, and
consideration other than beneficial interest in the transferred assets is received, the transaction is recognized as a sale and the related loan assets are
removed from the Consolidated Balance Sheet. For control to have transferred, (1) the transferred loans must be isolated from the seller, even in the
event of bankruptcy or receivership of the seller, (2) the purchaser must have the right to sell or pledge the transferred loans or, if the purchaser is a
Qualifying Special Purpose Entity (QSPE) as defined in the CICA Accounting Guideline 12, Transfers of Receivables, the investors of the QSPE must
have the right to sell or pledge their ownership interest in the QSPE, and (3) the seller cannot retain the right to repurchase the loans and receive
more than trivial benefit. The Bank may have an obligation to repurchase the securitized assets, however this does not preclude sale treatment. Refer
to Note 29 for additional information.
As part of the securitization, certain financial assets are retained and may consist of an interest-only strip, servicing rights and, in some cases, a
cash reserve account. A gain or loss on sale of the loan receivables is recognized immediately in other income after the effects of hedges on the
assets sold, if applicable. The amount of the gain or loss recognized depends on the previous carrying values of the receivables involved in the
transfer, allocated between the assets sold and the retained interests based on their relative fair values at the date of transfer. To obtain fair value,
quoted market prices are used, where available. However, as market prices are generally not available for retained interests, fair value is determined
by estimating the present value of future expected cash flows using management’s best estimates of key assumptions – credit losses, prepayment
rates, forward yield curves and discount rates – commensurate with the risks involved.
Where the Bank retains the servicing rights, the benefits of servicing are assessed against market expectations. When the benefits of servicing are
more than adequate, a servicing asset is recognized. Servicing assets are carried at amortized cost. When the benefits of servicing are less than
adequate, a servicing liability is recognized. Retained interests are classified as trading securities and are subsequently carried at fair value with the
changes in fair value recorded in trading income.
The following table summarizes the Bank’s securitization activity. In most cases, the Bank retained the responsibility for servicing the assets
securitized. Securitization Activity (millions of Canadian dollars) 2011 2010 2009 Residential Commercial Total Residential Commercial Total Total mortgage Personal mortgage mortgage Personal mortgage loans loans loans loans loans loans Gross proceeds $ 14,609 $ 3,148 $ 270 $ 18,027 $ 15,875 $ 4,211 $ 113 $ 20,199 $ 32,057 Retained interests recognized 481 83 7 571 586 94 2 682 1,120 Cash flows received on retained interests 904 68 2 974 790 68 – 858 593
The following table summarizes the impact of securitizations on the Bank’s Consolidated Statement of Income.
Securitization Gain (Loss) and Income on Retained Interests (millions of Canadian dollars) 2011 2010 2009 Residential Commercial Residential Commercial mortgage Personal mortgage mortgage Personal mortgage loans loans loans Total loans loans loans Total Total Gain (loss) on sale $ 192 $ 83 $ – $ 275 $ 224 $ 94 $ (1) $ 317 $ 321 Income on retained interests1 161 13 1 175 157 13 2 172 147 Total $ 353 $ 96 $ 1 $ 450 $ 381 $ 107 $ 1 $ 489 $ 468 1 Income on retained interests excludes income arising from changes in fair values. Unrealized gains and losses on retained interests arising from changes in fair value are recorded in trading income.
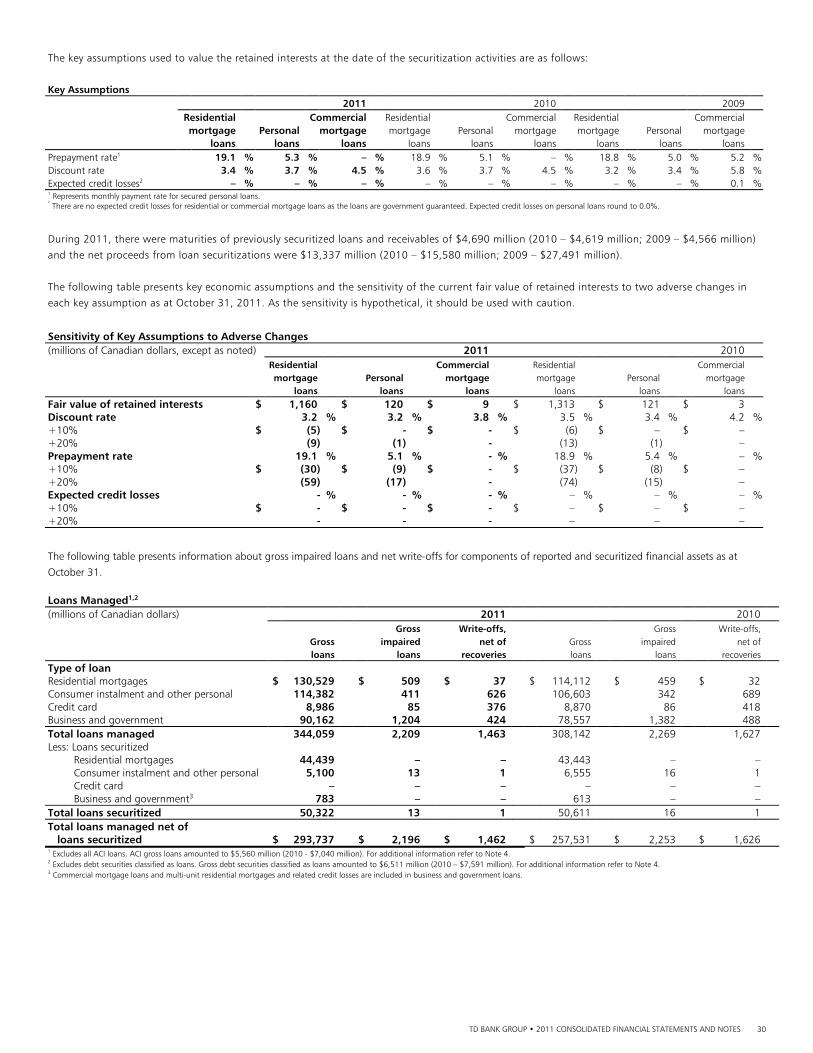
TD BANK GROUP • 2011 CONSOLIDATED FINANCIAL STATEMENTS AND NOTES 30
The key assumptions used to value the retained interests at the date of the securitization activities are as follows:
Key Assumptions 2011 2010 2009 Residential Commercial Residential Commercial Residential Commercial mortgage Personal mortgage mortgage Personal mortgage mortgage Personal mortgage loans loans loans loans loans loans loans loans loans Prepayment rate1 19.1 % 5.3 % – % 18.9 % 5.1 % – % 18.8 % 5.0 % 5.2 %Discount rate 3.4 % 3.7 % 4.5 % 3.6 % 3.7 % 4.5 % 3.2 % 3.4 % 5.8 %Expected credit losses2 – % – % – % – % – % – % – % – % 0.1 %1 Represents monthly payment rate for secured personal loans. 2
There are no expected credit losses for residential or commercial mortgage loans as the loans are government guaranteed. Expected credit losses on personal loans round to 0.0%.
During 2011, there were maturities of previously securitized loans and receivables of $4,690 million (2010 – $4,619 million; 2009 – $4,566 million)
and the net proceeds from loan securitizations were $13,337 million (2010 – $15,580 million; 2009 – $27,491 million).
The following table presents key economic assumptions and the sensitivity of the current fair value of retained interests to two adverse changes in
each key assumption as at October 31, 2011. As the sensitivity is hypothetical, it should be used with caution.
Sensitivity of Key Assumptions to Adverse Changes (millions of Canadian dollars, except as noted) 2011 2010 Residential Commercial Residential Commercial mortgage Personal mortgage mortgage Personal mortgage loans loans loans loans loans loans Fair value of retained interests $ 1,160 $ 120 $ 9 $ 1,313 $ 121 $ 3 Discount rate 3.2 % 3.2 % 3.8 % 3.5 % 3.4 % 4.2 %+10% $ (5) $ - $ - $ (6) $ – $ – +20% (9) (1) - (13) (1) – Prepayment rate 19.1 % 5.1 % - % 18.9 % 5.4 % – %+10% $ (30) $ (9) $ - $ (37) $ (8) $ – +20% (59) (17) - (74) (15) – Expected credit losses - % - % - % – % – % – %+10% $ - $ - $ - $ – $ – $ – +20% - - - – – –
The following table presents information about gross impaired loans and net write-offs for components of reported and securitized financial assets as at
October 31. Loans Managed1,2 (millions of Canadian dollars) 2011 2010 Gross Write-offs, Gross Write-offs, Gross impaired net of Gross impaired net of loans loans recoveries loans loans recoveries Type of loan Residential mortgages $ 130,529 $ 509 $ 37 $ 114,112 $ 459 $ 32 Consumer instalment and other personal 114,382 411 626 106,603 342 689 Credit card 8,986 85 376 8,870 86 418 Business and government 90,162 1,204 424 78,557 1,382 488 Total loans managed 344,059 2,209 1,463 308,142 2,269 1,627 Less: Loans securitized Residential mortgages 44,439 – – 43,443 – – Consumer instalment and other personal 5,100 13 1 6,555 16 1 Credit card – – – – – – Business and government3 783 – – 613 – – Total loans securitized 50,322 13 1 50,611 16 1 Total loans managed net of loans securitized $ 293,737 $ 2,196 $ 1,462 $ 257,531 $ 2,253 $ 1,626 1 Excludes all ACI loans. ACI gross loans amounted to $5,560 million (2010 - $7,040 million). For additional information refer to Note 4. 2 Excludes debt securities classified as loans. Gross debt securities classified as loans amounted to $6,511 million (2010 – $7,591 million). For additional information refer to Note 4. 3 Commercial mortgage loans and multi-unit residential mortgages and related credit losses are included in business and government loans.

TD BANK GROUP • 2011 CONSOLIDATED FINANCIAL STATEMENTS AND NOTES 31
NOTE 6 VARIABLE INTEREST ENTITIES
A variable interest entity (VIE) is an entity in which the total equity investment at risk is not sufficient to permit the entity to finance its activities
without additional subordinated financial support. The Bank identifies VIEs in which it has an interest, determines whether it is the primary
beneficiary of such entities and if so, consolidates them. The primary beneficiary is an entity that is exposed to a majority of the VIE’s expected losses
or entitled to a majority of the VIE’s expected residual returns, or both.
SIGNIFICANT CONSOLIDATED VARIABLE INTEREST ENTITIES
The Bank is the primary beneficiary of two significant VIEs that it consolidates. One of the VIEs is funded by the Bank and purchases senior tranches
of securitized assets from the Bank’s existing customers. As at October 31, 2011, the VIE had $88 million (2010 – $598 million) of assets, which
included credit card loans, automobile loans and leases, and equipment loans and leases. All the assets were originated in Canada. The Bank is not
restricted from accessing the VIE’s assets to the extent of its entitlement under arrangements with the sellers. The Bank’s maximum potential
exposure to loss was $88 million (2010 – $598 million) as at October 31, 2011.
The second VIE was created in 2010 to guarantee principal and interest payments in respect of covered bonds issued by the Bank. The Bank sold
assets originated in Canada to the VIE and provided a loan to the VIE to facilitate the purchase. As at October 31, 2011, this VIE had $14.1 billion
(2010 – $9.5 billion) of assets which are reported as consumer instalment and other personal loans on the Consolidated Balance Sheet. Of this
amount $7.4 billion (2010 – $2.2 billion) were pledged in respect of covered bonds. The Bank is restricted from accessing the VIE’s assets under the
relevant arrangements. The Bank’s maximum potential exposure to loss was $7.4 billion as at October 31, 2011 (2010 – $2.2 billion).
SIGNIFICANT NON-CONSOLIDATED VARIABLE INTEREST ENTITIES
The Bank holds significant variable interests in VIEs where it is not considered the primary beneficiary. The Bank’s variable interests in these non-
consolidated VIEs are discussed as follows.
Multi-Seller Conduits Multi-seller conduits (also referred to as customer securitization vehicles) provide customers with alternate sources of financing through the
securitization of their assets. The customers sell their receivables to the conduit and the conduit funds its purchase of the receivables through
issuance of short-term commercial paper to outside investors. Each seller continues to service its assets and absorb first losses. The Bank has no rights
to the assets as they are owned by the conduit. The Bank administers the conduits and provides liquidity facilities as well as securities distribution
services; it may also provide credit enhancements. The liquidity agreements are structured as loan facilities between the Bank, as the sole liquidity
lender, and the Bank-sponsored trusts. If a trust experiences difficulty rolling over asset-backed commercial paper (“ABCP”), the trust may draw on
the loan facility, and use the proceeds to pay maturing ABCP. The liquidity facilities cannot be drawn if a trust is insolvent or bankrupt, preconditions
that must be satisfied preceding each advance (i.e., draw-down on the facility). Effectively, such preconditions ensure that the Bank does not provide
credit enhancement.
From time to time, the Bank in its capacity as distribution agent may hold commercial paper issued by the conduits. During the years ended
October 31, 2011 and 2010, no amounts of ABCP were purchased pursuant to liquidity agreements. The Bank maintained inventory positions of
ABCP (including those issued by the single-seller conduits as discussed below) as part of its market-making activities in ABCP. As at October 31, 2011
and 2010, the Bank held $1,083 million and $354 million of ABCP inventory, respectively, out of $10.6 billion and $10.5 billion total outstanding
ABCP issued by the conduits as at the same dates. The commercial paper held is classified as trading securities on the Consolidated Balance Sheet.
The Bank earns fees from the conduits which are recognized when earned. The Bank holds variable interests in these multi-seller conduits primarily
through holding their commercial paper, providing liquidity facilities and earning fees; however, the Bank is not the primary beneficiary. The Bank
monitors its ABCP inventory positions as part of the on-going consolidation assessment process, as these purchases are considered reconsideration
events. The inventory positions did not cause any change in consolidation conclusions during the years ended October 31, 2011 and 2010.
The Bank’s maximum potential exposure to loss due to its ownership interest in commercial paper and through the provision of liquidity facilities
for multi-seller conduits was $5.5 billion as at October 31, 2011 (2010 – $5.3 billion). Further, the Bank has committed to an additional $2.1 billion
(2010 – $1.8 billion) in liquidity facilities for ABCP that could potentially be issued by the conduits. As at October 31, 2011, the Bank also provided
deal-specific credit enhancement in the amount of $17 million (2010 – $73 million).
Single-Seller Conduits The Bank uses single-seller conduits to enhance its liquidity position, to diversify its sources of funding, and to optimize management of its
balance sheet.
As at October 31, 2011, the single-seller conduits had $5.1 billion (2010 – $5.1 billion) of commercial paper outstanding. While the probability
of loss is negligible, the Bank’s maximum potential exposure to loss for these conduits through the sole provision of liquidity facilities (similar to
multi-seller conduits mentioned above) was $5.1 billion (2010 – $5.1 billion); $1.1 billion (2010 – $1.1 billion) of the assets held by conduits are
personal loans that are government insured. Additionally, the Bank had retained interests of $120 million (2010 – $121 million) relating to excess
spread.

TD BANK GROUP • 2011 CONSOLIDATED FINANCIAL STATEMENTS AND NOTES 32
Other Financing Transactions In April 2010, the Bank exited certain transactions where it provided cost-efficient financing to U.S. corporate clients through VIEs. The Bank no
longer provides financing to these corporate clients under these arrangements and as at October 31, 2011 and 2010, had no exposure to these VIEs.
NOTE 7 DERIVATIVES
Derivative financial instruments are financial contracts that derive their value from underlying changes in interest rates, foreign exchange rates, credit spreads, commodity prices, equities, or other financial measures. Such instruments include interest rate, foreign exchange, equity, commodity and credit derivative contracts. The Bank uses these instruments for trading purposes and non-trading purposes to manage the risks associated with its funding and investment strategies. DERIVATIVES HELD FOR TRADING PURPOSES
The Bank enters into trading derivative contracts to meet the needs of its customers, to enter into trading positions, and in certain cases, to manage risks related to its trading portfolio. Trading derivatives are recorded at fair value with the resulting realized and unrealized gains or losses recognized immediately in trading income. DERIVATIVES HELD FOR NON-TRADING
When derivatives are held for non-trading purposes and when the transactions meet the requirements of Section 3865, Hedges, they are classified by the Bank as non-trading derivatives and receive hedge accounting treatment, as appropriate. Certain derivative instruments that are held for economic hedging purposes, and do not meet the requirements of Section 3865, are also classified as non-trading derivatives but the change in fair value of these derivatives is recognized in non-interest income. HEDGING RELATIONSHIPS
Hedge Accounting At the inception of a hedging relationship, the Bank documents the relationship between the hedging instrument and the hedged item, its risk management objective and its strategy for undertaking the hedge. The Bank also requires a documented assessment, both at hedge inception and on an ongoing basis, of whether or not the derivatives that are used in hedging transactions are highly effective in offsetting the changes attributable to the hedged risks in the fair values or cash flows of the hedged items. In order to be deemed effective, the hedging instrument and the hedged item must be highly and inversely correlated such that the changes in the fair value of the hedging instrument will substantially offset the effects of the hedged exposure to the Bank throughout the term of the hedging relationship. If a hedging relationship becomes ineffective, it no longer qualifies for hedge accounting and any subsequent change in the fair value of the hedging instrument is recognized in earnings, without any mitigating impact in earnings, where appropriate. The change in fair value relating to the derivative component excluded from the assessment of hedge effectiveness is recognized immediately in the Consolidated Statement of Income. When derivatives are designated as hedges, the Bank classifies them either as: (i) hedges of the change in fair value of recognized assets or liabilities or firm commitments (fair value hedges); (ii) hedges of the variability in highly probable future cash flows attributable to a recognized asset or liability, or a forecasted transaction (cash flow hedges); or (iii) hedges of net investments in a foreign operation (net investment hedges). Fair Value Hedges The Bank’s fair value hedges principally consist of interest rate swaps that are used to protect against changes in the fair value of fixed-rate long-term financial instruments due to movements in market interest rates. Changes in the fair value of derivatives that are designated and qualify as fair value hedging instruments are recorded in the Consolidated Statement of Income, along with changes in the fair value of the assets, liabilities or group thereof that are attributable to the hedged risk. Any change in fair value relating to the ineffective portion of the hedging relationship is recognized immediately in the Consolidated Statement of Income in other income. The cumulative adjustment to the carrying amount of the hedged item (the basis adjustment) is amortized to the Consolidated Statement of Income based on a recalculated effective interest rate over the remaining expected life of the hedged item, with amortization beginning no later than when the hedged item ceases to be adjusted for changes in its fair value attributable to the hedged risk. Where the hedged item has been derecognized, the basis adjustment is immediately released to the Consolidated Statement of Income. Cash Flow Hedges The Bank is exposed to variability in future cash flows that are denominated in foreign currencies, as well as variability in future cash flows of non-trading assets and liabilities that bear interest at variable rates, or are expected to be refunded or reinvested in the future. The amounts and timing of future cash flows are projected for each hedged exposure on the basis of their contractual terms and other relevant factors, including estimates of prepayments and defaults. The aggregate cash flows across all hedged exposures over time form the basis for identifying the effective portion of gains and losses on the derivatives designated as cash flow hedges of forecasted transactions. The effective portion of changes in the fair value of derivatives that are designated and qualify as cash flow hedges is recognized in other comprehensive income. Any change in fair value relating to the ineffective portion is recognized immediately in the Consolidated Statement of Income in other income. Amounts accumulated in other comprehensive income are reclassified to the Consolidated Statement of Income in the period in which the hedged item affects income.
TD BANK GROUP • 2011 CONSOLIDATED FINANCIAL STATEMENTS AND NOTES 33
When a hedging instrument expires or is sold, or when a hedge no longer meets the criteria for hedge accounting, any cumulative gain or loss existing in other comprehensive income at that time remains in other comprehensive income until the forecasted transaction is eventually recognized in the Consolidated Statement of Income. When a forecasted transaction is no longer expected to occur, the cumulative gain or loss that was reported in other comprehensive income is immediately transferred to the Consolidated Statement of Income. Net Investment Hedges Hedges of net investments in foreign operations are accounted for similar to cash flow hedges. Any change in fair value on the hedging instrument relating to the effective portion of the hedge is recognized in other comprehensive income. The change in fair value relating to the ineffective portion is recognized immediately in the Consolidated Statement of Income. Gains and losses accumulated in other comprehensive income are included in the Consolidated Statement of Income upon the repatriation or disposal of the investment in the foreign operation. DERIVATIVE PRODUCT TYPES AND RISK EXPOSURES
The majority of the Bank’s derivative contracts are OTC transactions that are privately negotiated between the Bank and the counterparty to the contract. The remainder are exchange-traded contracts transacted through organized and regulated exchanges and consist primarily of options and futures. Interest Rate Derivatives The Bank uses interest rate derivatives, such as interest rate futures and forwards, swaps, and options in managing interest rate risks. Interest rate risk is the impact that changes in interest rates could have on the Bank’s margins, earnings, and economic value. Changes in interest rate can impact the market value of fixed rate assets and liabilities. Further, certain assets and liabilities repayment rates vary depending on interest rates. Forward rate agreements are OTC contracts that effectively fix a future interest rate for a period of time. A typical forward rate agreement provides that at a pre-determined future date, a cash settlement will be made between the counterparties based upon the difference between a contracted rate and a market rate to be determined in the future, calculated on a specified notional principal amount. No exchange of principal amount takes place. Interest rate swaps are OTC contracts in which two counterparties agree to exchange cash flows over a period of time based on rates applied to a specified notional principal amount. A typical interest rate swap would require one counterparty to pay a fixed market interest rate in exchange for a variable market interest rate determined from time to time, with both calculated on a specified notional principal amount. No exchange of principal amount takes place. Interest rate options are contracts in which one party (the purchaser of an option) acquires from another party (the writer of an option), in exchange for a premium, the right, but not the obligation, either to buy or sell, on a specified future date or series of future dates or within a specified time, a specified financial instrument at a contracted price. The underlying financial instrument will have a market price which varies in response to changes in interest rates. In managing the Bank’s interest rate exposure, the Bank acts as both a writer and purchaser of these options. Options are transacted both OTC and through exchanges. Interest rate futures are standardized contracts transacted on an exchange. They are based upon an agreement to buy or sell a specified quantity of a financial instrument on a specified future date, at a contracted price. These contracts differ from forward rate agreements in that they are in standard amounts with standard settlement dates and are transacted on an exchange. Foreign Exchange Derivatives The Bank uses foreign exchange derivatives, such as futures, forwards and swaps in managing foreign exchange risks. Foreign exchange risk refers to losses that could result from changes in foreign currency exchange rates. Assets and liabilities that are denominated in foreign currencies have foreign exchange risk. The Bank is exposed to non-trading foreign exchange risk from its investments in foreign operations when the Bank’s foreign currency assets are greater or less than the liabilities in that currency; they create a foreign currency open position. Foreign exchange forwards are OTC contracts in which one counterparty contracts with another to exchange a specified amount of one currency for a specified amount of a second currency, at a future date or range of dates. Swap contracts comprise foreign exchange swaps and cross-currency interest rate swaps. Foreign exchange swaps are transactions in which a foreign currency is simultaneously purchased in the spot market and sold in the forward market, or vice-versa. Cross-currency interest rate swaps are transactions in which counterparties exchange principal and interest cash flows in different currencies over a period of time. These contracts are used to manage both currency and interest rate exposures. Foreign exchange futures contracts are similar to foreign exchange forward contracts but differ in that they are in standard currency amounts with standard settlement dates and are transacted on an exchange. Credit Derivatives The Bank uses credit derivatives such as credit default swaps (CDS) and total return swaps in managing risks of the Bank’s corporate loan portfolio and other cash instruments. Credit risk is the risk of loss if a borrower or counterparty in a transaction fails to meet its agreed payment obligations. The Bank uses credit derivatives to mitigate industry concentration and borrower-specific exposure as part of the Bank’s portfolio risk management techniques. The credit, legal, and other risks associated with these transactions are controlled through well established procedures. The Bank’s policy is to enter into these transactions with investment grade financial institutions. Credit risk to these counterparties is managed through the same approval, limit and monitoring processes that is used for all counterparties to which the Bank has credit exposure. Credit derivatives are OTC contracts designed to transfer the credit risk in an underlying financial instrument (usually termed as a reference asset) from one counterparty to another. The most common credit derivatives are CDS (referred to as option contracts) and total return swaps (referred to as swap contracts). In option contracts, an option purchaser acquires credit protection on a reference asset or group of assets from an option writer in exchange for a premium. The option purchaser may pay the agreed premium at inception or over a period of time. The credit protection compensates the option purchaser for any deterioration in value of the reference asset or group of assets upon the occurrence of certain credit events such as bankruptcy or failure to pay. Settlement may be cash based or physical, requiring the delivery of the reference asset to the option writer. In swap contracts, one counterparty agrees to pay or receive from the other cash amounts based on changes in the value of a reference asset or group

TD BANK GROUP • 2011 CONSOLIDATED FINANCIAL STATEMENTS AND NOTES 34
of assets, including any returns such as interest earned on these assets in exchange for amounts that are based on prevailing market funding rates. These cash settlements are made regardless of whether there is a credit event. Other Derivatives The Bank also transacts equity and commodity derivatives in both the exchange and OTC markets. Equity swaps are OTC contracts in which one counterparty agrees to pay, or receive from the other, cash amounts based on changes in the value of a stock index, a basket of stocks or a single stock. These contracts sometimes include a payment in respect of dividends. Equity options give the purchaser of the option, for a premium, the right, but not the obligation, to buy from or sell to the writer of an option, an underlying stock index, basket of stocks or single stock at a contracted price. Options are transacted both OTC and through exchanges. Equity index futures are standardized contracts transacted on an exchange. They are based on an agreement to pay or receive a cash amount based on the difference between the contracted price level of an underlying stock index and its corresponding market price level at a specified future date. There is no actual delivery of stocks that comprise the underlying index. These contracts are in standard amounts with standard settlement dates. Commodity contracts include commodity forwards, futures, swaps and options, such as precious metals and energy-related products in both OTC and exchange markets. The Bank issues certain loan commitments to customers in Canada at a fixed rate. These funding commitments are accounted for as derivatives if there is past practice of selling the loans shortly after funding. These loan commitments are carried at fair value with the resulting realized and unrealized gains or losses recognized immediately in other income.
NOTIONAL AMOUNTS
The notional amounts are not recorded as assets or liabilities as they represent the face amount of the contract to which a rate or price is applied to determine the amount of cash flows to be exchanged. Notional principal amounts do not represent the potential gain or loss associated with market risk and are not indicative of the credit risk associated with derivative financial instruments.
EMBEDDED DERIVATIVES
Derivatives may be embedded in other financial instruments (the host instrument). Embedded derivatives are treated as separate derivatives when their economic characteristics and risks are not clearly and closely related to those of the host instrument, a separate instrument with the same terms as the embedded derivative would meet the definition of a derivative, and the combined contract is not held for trading or designated as trading under the fair value option. These embedded derivatives are measured at fair value with subsequent changes in fair value recognized in trading income. Certain of the Bank’s deposit obligations that vary according to the performance of certain equity levels or indices may be subject to a guaranteed minimum redemption amount and have an embedded derivative. The Bank accounts for the embedded derivative of such variable obligations at fair value with changes in fair value reflected in other income as they arise. The Bank does not expect significant future earnings volatility as the embedded derivatives are effectively hedged economically. The fair value of the embedded derivatives are recorded on the Consolidated Balance Sheet as derivatives.
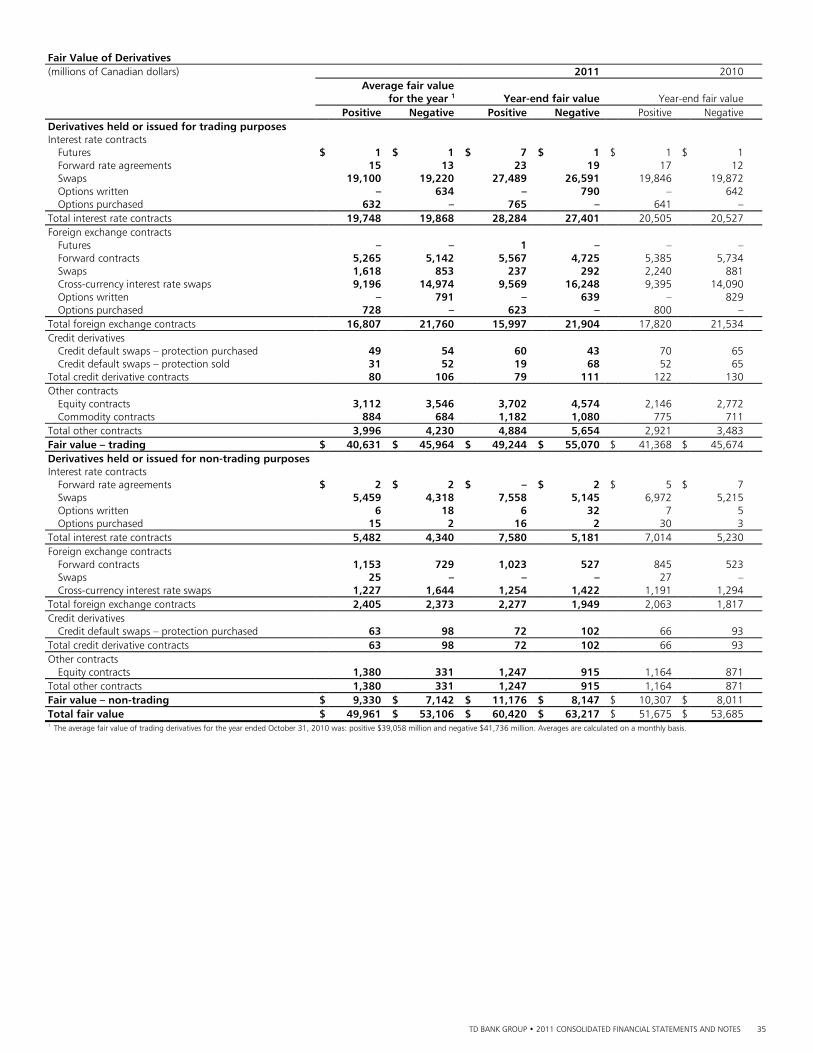
TD BANK GROUP • 2011 CONSOLIDATED FINANCIAL STATEMENTS AND NOTES 35
Fair Value of Derivatives (millions of Canadian dollars) 2011 2010 Average fair value for the year 1 Year-end fair value Year-end fair value Positive Negative Positive Negative Positive Negative Derivatives held or issued for trading purposes Interest rate contracts Futures $ 1 $ 1 $ 7 $ 1 $ 1 $ 1 Forward rate agreements 15 13 23 19 17 12 Swaps 19,100 19,220 27,489 26,591 19,846 19,872 Options written – 634 – 790 – 642 Options purchased 632 – 765 – 641 – Total interest rate contracts 19,748 19,868 28,284 27,401 20,505 20,527 Foreign exchange contracts Futures – – 1 – – – Forward contracts 5,265 5,142 5,567 4,725 5,385 5,734 Swaps 1,618 853 237 292 2,240 881 Cross-currency interest rate swaps 9,196 14,974 9,569 16,248 9,395 14,090 Options written – 791 – 639 – 829 Options purchased 728 – 623 – 800 – Total foreign exchange contracts 16,807 21,760 15,997 21,904 17,820 21,534 Credit derivatives Credit default swaps – protection purchased 49 54 60 43 70 65 Credit default swaps – protection sold 31 52 19 68 52 65 Total credit derivative contracts 80 106 79 111 122 130 Other contracts Equity contracts 3,112 3,546 3,702 4,574 2,146 2,772 Commodity contracts 884 684 1,182 1,080 775 711 Total other contracts 3,996 4,230 4,884 5,654 2,921 3,483 Fair value – trading $ 40,631 $ 45,964 $ 49,244 $ 55,070 $ 41,368 $ 45,674 Derivatives held or issued for non-trading purposes Interest rate contracts Forward rate agreements $ 2 $ 2 $ – $ 2 $ 5 $ 7 Swaps 5,459 4,318 7,558 5,145 6,972 5,215 Options written 6 18 6 32 7 5 Options purchased 15 2 16 2 30 3 Total interest rate contracts 5,482 4,340 7,580 5,181 7,014 5,230 Foreign exchange contracts Forward contracts 1,153 729 1,023 527 845 523 Swaps 25 – – – 27 – Cross-currency interest rate swaps 1,227 1,644 1,254 1,422 1,191 1,294 Total foreign exchange contracts 2,405 2,373 2,277 1,949 2,063 1,817 Credit derivatives Credit default swaps – protection purchased 63 98 72 102 66 93 Total credit derivative contracts 63 98 72 102 66 93 Other contracts Equity contracts 1,380 331 1,247 915 1,164 871 Total other contracts 1,380 331 1,247 915 1,164 871 Fair value – non-trading $ 9,330 $ 7,142 $ 11,176 $ 8,147 $ 10,307 $ 8,011 Total fair value $ 49,961 $ 53,106 $ 60,420 $ 63,217 $ 51,675 $ 53,685 1 The average fair value of trading derivatives for the year ended October 31, 2010 was: positive $39,058 million and negative $41,736 million. Averages are calculated on a monthly basis.
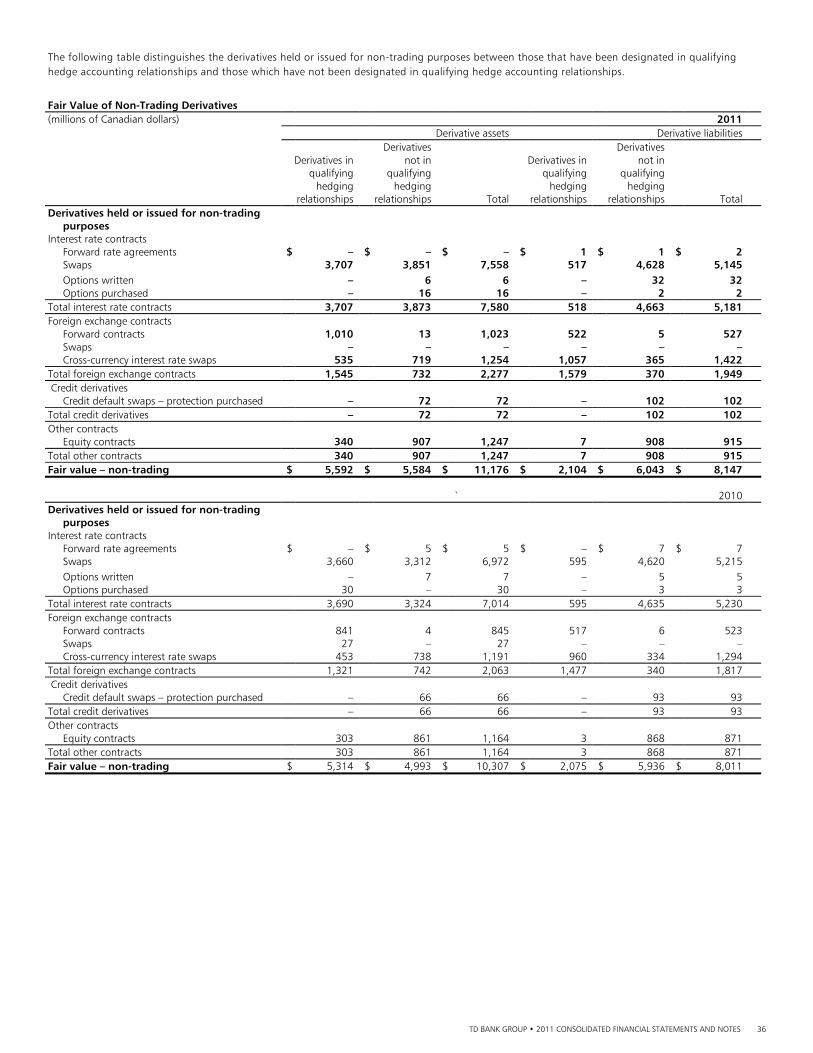
TD BANK GROUP • 2011 CONSOLIDATED FINANCIAL STATEMENTS AND NOTES 36
The following table distinguishes the derivatives held or issued for non-trading purposes between those that have been designated in qualifying hedge accounting relationships and those which have not been designated in qualifying hedge accounting relationships.
Fair Value of Non-Trading Derivatives (millions of Canadian dollars) 2011 Derivative assets Derivative liabilities Derivatives Derivatives Derivatives in not in Derivatives in not in qualifying qualifying qualifying qualifying hedging hedging hedging hedging relationships relationships Total relationships relationships Total Derivatives held or issued for non-trading purposes Interest rate contracts Forward rate agreements $ – $ – $ – $ 1 $ 1 $ 2 Swaps 3,707 3,851 7,558 517 4,628 5,145 Options written – 6 6 – 32 32 Options purchased – 16 16 – 2 2 Total interest rate contracts 3,707 3,873 7,580 518 4,663 5,181 Foreign exchange contracts Forward contracts 1,010 13 1,023 522 5 527 Swaps – – – – – – Cross-currency interest rate swaps 535 719 1,254 1,057 365 1,422 Total foreign exchange contracts 1,545 732 2,277 1,579 370 1,949 Credit derivatives Credit default swaps – protection purchased – 72 72 – 102 102 Total credit derivatives – 72 72 – 102 102 Other contracts Equity contracts 340 907 1,247 7 908 915 Total other contracts 340 907 1,247 7 908 915 Fair value – non-trading $ 5,592 $ 5,584 $ 11,176 $ 2,104 $ 6,043 $ 8,147 ` 2010 Derivatives held or issued for non-trading purposes Interest rate contracts Forward rate agreements $ – $ 5 $ 5 $ – $ 7 $ 7 Swaps 3,660 3,312 6,972 595 4,620 5,215 Options written – 7 7 – 5 5 Options purchased 30 – 30 – 3 3 Total interest rate contracts 3,690 3,324 7,014 595 4,635 5,230 Foreign exchange contracts Forward contracts 841 4 845 517 6 523 Swaps 27 – 27 – – – Cross-currency interest rate swaps 453 738 1,191 960 334 1,294 Total foreign exchange contracts 1,321 742 2,063 1,477 340 1,817 Credit derivatives Credit default swaps – protection purchased – 66 66 – 93 93 Total credit derivatives – 66 66 – 93 93 Other contracts Equity contracts 303 861 1,164 3 868 871 Total other contracts 303 861 1,164 3 868 871 Fair value – non-trading $ 5,314 $ 4,993 $ 10,307 $ 2,075 $ 5,936 $ 8,011
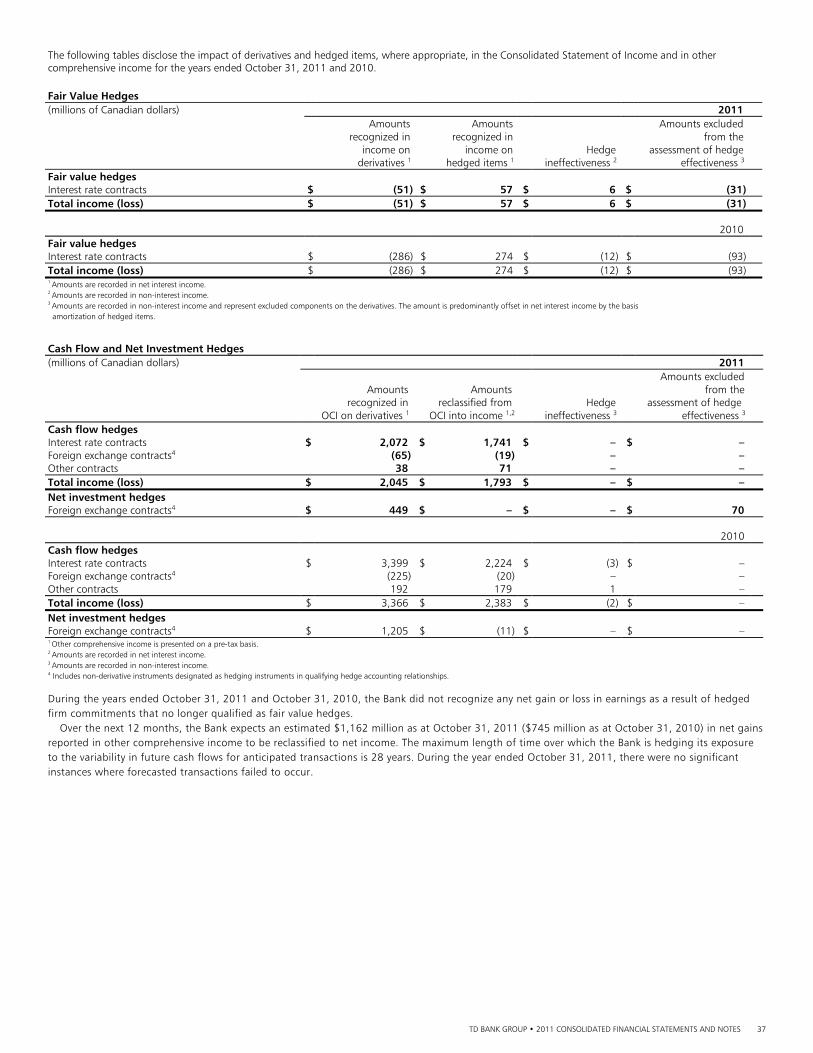
TD BANK GROUP • 2011 CONSOLIDATED FINANCIAL STATEMENTS AND NOTES 37
The following tables disclose the impact of derivatives and hedged items, where appropriate, in the Consolidated Statement of Income and in other comprehensive income for the years ended October 31, 2011 and 2010. Fair Value Hedges
(millions of Canadian dollars) 2011
Amounts Amounts Amounts excluded
recognized in recognized in from the
income on income on Hedge assessment of hedge
derivatives 1 hedged items 1 ineffectiveness 2 effectiveness 3
Fair value hedges Interest rate contracts $ (51) $ 57 $ 6 $ (31)
Total income (loss) $ (51) $ 57 $ 6 $ (31)
2010
Fair value hedges Interest rate contracts $ (286) $ 274 $ (12) $ (93)
Total income (loss) $ (286) $ 274 $ (12) $ (93)
1 Amounts are recorded in net interest income. 2 Amounts are recorded in non-interest income. 3 Amounts are recorded in non-interest income and represent excluded components on the derivatives. The amount is predominantly offset in net interest income by the basis amortization of hedged items.
Cash Flow and Net Investment Hedges
(millions of Canadian dollars) 2011
Amounts excluded
Amounts Amounts from the
recognized in reclassified from Hedge assessment of hedge
OCI on derivatives 1 OCI into income 1,2 ineffectiveness 3 effectiveness 3
Cash flow hedges Interest rate contracts $ 2,072 $ 1,741 $ – $ –
Foreign exchange contracts4 (65) (19) – –
Other contracts 38 71 – –
Total income (loss) $ 2,045 $ 1,793 $ – $ –
Net investment hedges Foreign exchange contracts4 $ 449 $ – $ – $ 70
2010
Cash flow hedges Interest rate contracts $ 3,399 $ 2,224 $ (3) $ –
Foreign exchange contracts4 (225) (20) – –
Other contracts 192 179 1 –
Total income (loss) $ 3,366 $ 2,383 $ (2) $ –
Net investment hedges Foreign exchange contracts4 $ 1,205 $ (11) $ – $ – 1 Other comprehensive income is presented on a pre-tax basis. 2 Amounts are recorded in net interest income. 3 Amounts are recorded in non-interest income. 4 Includes non-derivative instruments designated as hedging instruments in qualifying hedge accounting relationships.
During the years ended October 31, 2011 and October 31, 2010, the Bank did not recognize any net gain or loss in earnings as a result of hedged firm commitments that no longer qualified as fair value hedges. Over the next 12 months, the Bank expects an estimated $1,162 million as at October 31, 2011 ($745 million as at October 31, 2010) in net gains reported in other comprehensive income to be reclassified to net income. The maximum length of time over which the Bank is hedging its exposure to the variability in future cash flows for anticipated transactions is 28 years. During the year ended October 31, 2011, there were no significant instances where forecasted transactions failed to occur.
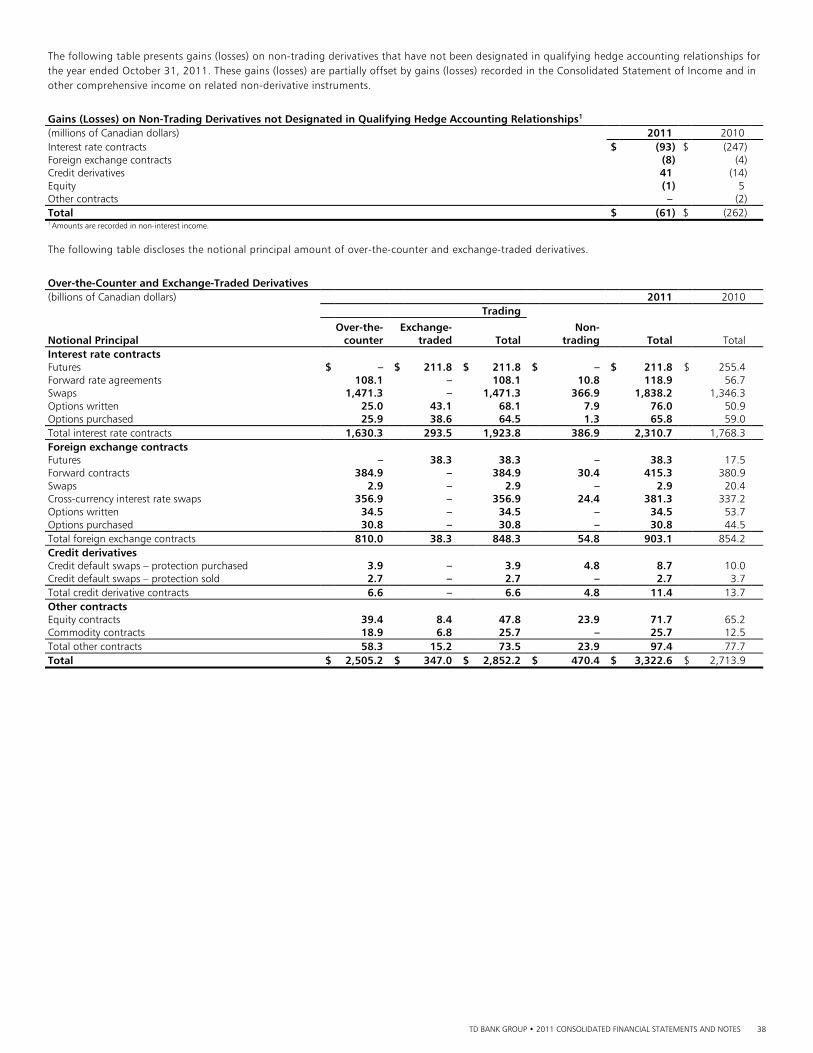
TD BANK GROUP • 2011 CONSOLIDATED FINANCIAL STATEMENTS AND NOTES 38
The following table presents gains (losses) on non-trading derivatives that have not been designated in qualifying hedge accounting relationships for the year ended October 31, 2011. These gains (losses) are partially offset by gains (losses) recorded in the Consolidated Statement of Income and in other comprehensive income on related non-derivative instruments.
Gains (Losses) on Non-Trading Derivatives not Designated in Qualifying Hedge Accounting Relationships1 (millions of Canadian dollars) 2011 2010 Interest rate contracts $ (93) $ (247)Foreign exchange contracts (8) (4)Credit derivatives 41 (14)Equity (1) 5 Other contracts – (2)Total $ (61) $ (262)1 Amounts are recorded in non-interest income.
The following table discloses the notional principal amount of over-the-counter and exchange-traded derivatives.
Over-the-Counter and Exchange-Traded Derivatives
(billions of Canadian dollars) 2011 2010 Trading
Over-the- Exchange- Non-
Notional Principal counter traded Total trading Total Total Interest rate contracts Futures $ – $ 211.8 $ 211.8 $ – $ 211.8 $ 255.4 Forward rate agreements 108.1 – 108.1 10.8 118.9 56.7 Swaps 1,471.3 – 1,471.3 366.9 1,838.2 1,346.3 Options written 25.0 43.1 68.1 7.9 76.0 50.9 Options purchased 25.9 38.6 64.5 1.3 65.8 59.0 Total interest rate contracts 1,630.3 293.5 1,923.8 386.9 2,310.7 1,768.3 Foreign exchange contracts Futures – 38.3 38.3 – 38.3 17.5 Forward contracts 384.9 – 384.9 30.4 415.3 380.9 Swaps 2.9 – 2.9 – 2.9 20.4 Cross-currency interest rate swaps 356.9 – 356.9 24.4 381.3 337.2 Options written 34.5 – 34.5 – 34.5 53.7 Options purchased 30.8 – 30.8 – 30.8 44.5 Total foreign exchange contracts 810.0 38.3 848.3 54.8 903.1 854.2 Credit derivatives Credit default swaps – protection purchased 3.9 – 3.9 4.8 8.7 10.0 Credit default swaps – protection sold 2.7 – 2.7 – 2.7 3.7 Total credit derivative contracts 6.6 – 6.6 4.8 11.4 13.7 Other contracts Equity contracts 39.4 8.4 47.8 23.9 71.7 65.2 Commodity contracts 18.9 6.8 25.7 – 25.7 12.5 Total other contracts 58.3 15.2 73.5 23.9 97.4 77.7 Total $ 2,505.2 $ 347.0 $ 2,852.2 $ 470.4 $ 3,322.6 $ 2,713.9
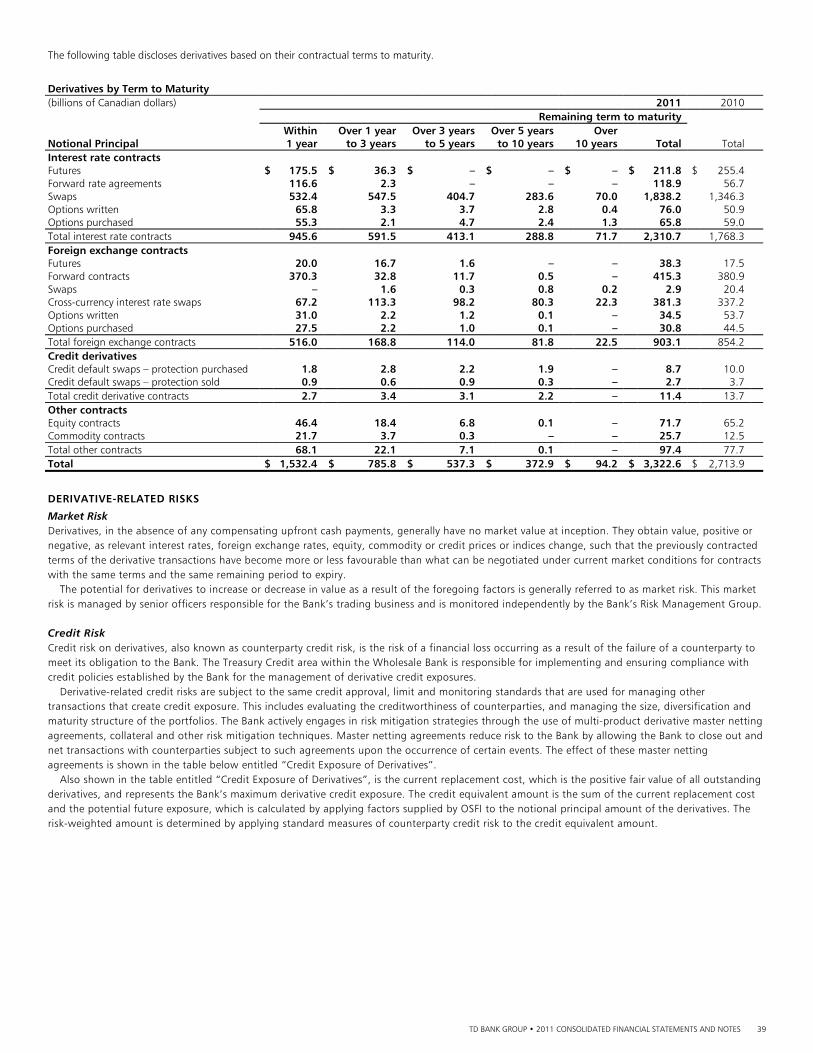
TD BANK GROUP • 2011 CONSOLIDATED FINANCIAL STATEMENTS AND NOTES 39
The following table discloses derivatives based on their contractual terms to maturity. Derivatives by Term to Maturity (billions of Canadian dollars) 2011 2010 Remaining term to maturity Within Over 1 year Over 3 years Over 5 years Over Notional Principal 1 year to 3 years to 5 years to 10 years 10 years Total Total Interest rate contracts Futures $ 175.5 $ 36.3 $ – $ – $ – $ 211.8 $ 255.4 Forward rate agreements 116.6 2.3 – – – 118.9 56.7 Swaps 532.4 547.5 404.7 283.6 70.0 1,838.2 1,346.3 Options written 65.8 3.3 3.7 2.8 0.4 76.0 50.9 Options purchased 55.3 2.1 4.7 2.4 1.3 65.8 59.0 Total interest rate contracts 945.6 591.5 413.1 288.8 71.7 2,310.7 1,768.3 Foreign exchange contracts Futures 20.0 16.7 1.6 – – 38.3 17.5 Forward contracts 370.3 32.8 11.7 0.5 – 415.3 380.9 Swaps – 1.6 0.3 0.8 0.2 2.9 20.4 Cross-currency interest rate swaps 67.2 113.3 98.2 80.3 22.3 381.3 337.2 Options written 31.0 2.2 1.2 0.1 – 34.5 53.7 Options purchased 27.5 2.2 1.0 0.1 – 30.8 44.5 Total foreign exchange contracts 516.0 168.8 114.0 81.8 22.5 903.1 854.2 Credit derivatives Credit default swaps – protection purchased 1.8 2.8 2.2 1.9 – 8.7 10.0 Credit default swaps – protection sold 0.9 0.6 0.9 0.3 – 2.7 3.7 Total credit derivative contracts 2.7 3.4 3.1 2.2 – 11.4 13.7 Other contracts Equity contracts 46.4 18.4 6.8 0.1 – 71.7 65.2 Commodity contracts 21.7 3.7 0.3 – – 25.7 12.5 Total other contracts 68.1 22.1 7.1 0.1 – 97.4 77.7 Total $ 1,532.4 $ 785.8 $ 537.3 $ 372.9 $ 94.2 $ 3,322.6 $ 2,713.9
DERIVATIVE-RELATED RISKS
Market Risk Derivatives, in the absence of any compensating upfront cash payments, generally have no market value at inception. They obtain value, positive or negative, as relevant interest rates, foreign exchange rates, equity, commodity or credit prices or indices change, such that the previously contracted terms of the derivative transactions have become more or less favourable than what can be negotiated under current market conditions for contracts with the same terms and the same remaining period to expiry. The potential for derivatives to increase or decrease in value as a result of the foregoing factors is generally referred to as market risk. This market risk is managed by senior officers responsible for the Bank’s trading business and is monitored independently by the Bank’s Risk Management Group. Credit Risk Credit risk on derivatives, also known as counterparty credit risk, is the risk of a financial loss occurring as a result of the failure of a counterparty to meet its obligation to the Bank. The Treasury Credit area within the Wholesale Bank is responsible for implementing and ensuring compliance with credit policies established by the Bank for the management of derivative credit exposures. Derivative-related credit risks are subject to the same credit approval, limit and monitoring standards that are used for managing other transactions that create credit exposure. This includes evaluating the creditworthiness of counterparties, and managing the size, diversification and maturity structure of the portfolios. The Bank actively engages in risk mitigation strategies through the use of multi-product derivative master netting agreements, collateral and other risk mitigation techniques. Master netting agreements reduce risk to the Bank by allowing the Bank to close out and net transactions with counterparties subject to such agreements upon the occurrence of certain events. The effect of these master netting agreements is shown in the table below entitled “Credit Exposure of Derivatives”. Also shown in the table entitled “Credit Exposure of Derivatives”, is the current replacement cost, which is the positive fair value of all outstanding derivatives, and represents the Bank’s maximum derivative credit exposure. The credit equivalent amount is the sum of the current replacement cost and the potential future exposure, which is calculated by applying factors supplied by OSFI to the notional principal amount of the derivatives. The risk-weighted amount is determined by applying standard measures of counterparty credit risk to the credit equivalent amount.
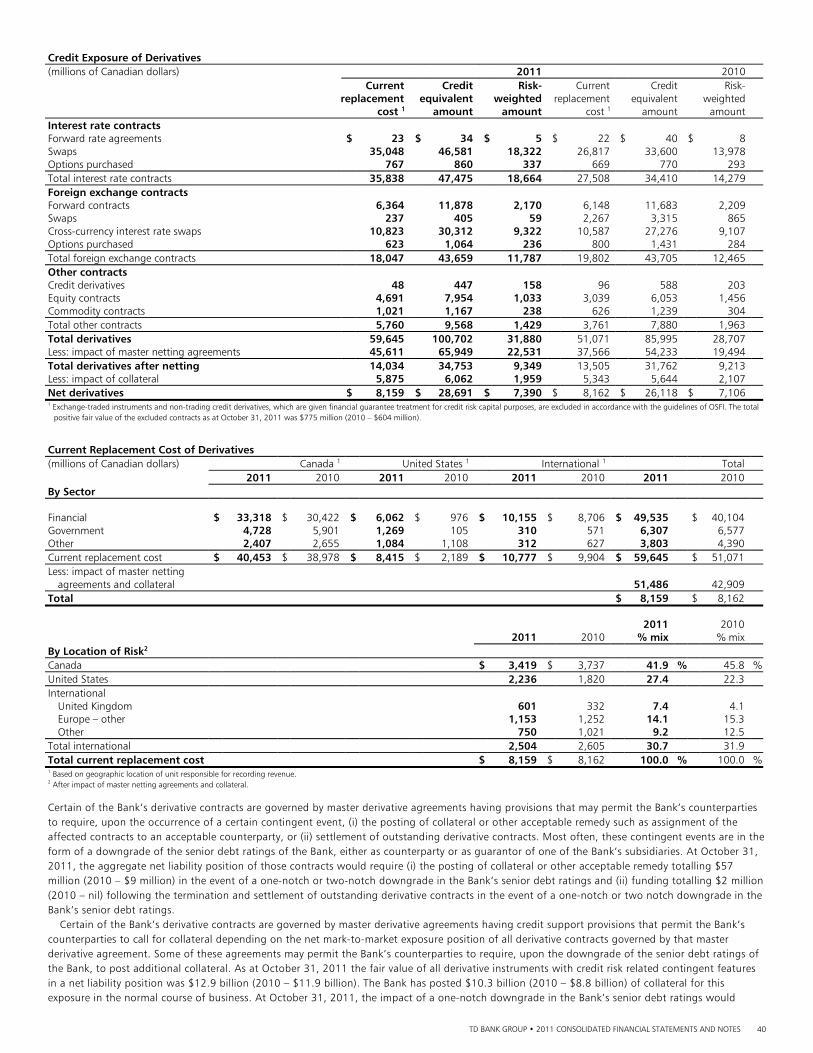
TD BANK GROUP • 2011 CONSOLIDATED FINANCIAL STATEMENTS AND NOTES 40
Credit Exposure of Derivatives (millions of Canadian dollars) 2011 2010 Current Credit Risk- Current Credit Risk-
replacement equivalent weighted replacement equivalent weighted cost 1 amount amount cost 1 amount amount Interest rate contracts Forward rate agreements $ 23 $ 34 $ 5 $ 22 $ 40 $ 8 Swaps 35,048 46,581 18,322 26,817 33,600 13,978 Options purchased 767 860 337 669 770 293 Total interest rate contracts 35,838 47,475 18,664 27,508 34,410 14,279 Foreign exchange contracts Forward contracts 6,364 11,878 2,170 6,148 11,683 2,209 Swaps 237 405 59 2,267 3,315 865 Cross-currency interest rate swaps 10,823 30,312 9,322 10,587 27,276 9,107 Options purchased 623 1,064 236 800 1,431 284 Total foreign exchange contracts 18,047 43,659 11,787 19,802 43,705 12,465 Other contracts Credit derivatives 48 447 158 96 588 203 Equity contracts 4,691 7,954 1,033 3,039 6,053 1,456 Commodity contracts 1,021 1,167 238 626 1,239 304 Total other contracts 5,760 9,568 1,429 3,761 7,880 1,963 Total derivatives 59,645 100,702 31,880 51,071 85,995 28,707 Less: impact of master netting agreements 45,611 65,949 22,531 37,566 54,233 19,494 Total derivatives after netting 14,034 34,753 9,349 13,505 31,762 9,213 Less: impact of collateral 5,875 6,062 1,959 5,343 5,644 2,107 Net derivatives $ 8,159 $ 28,691 $ 7,390 $ 8,162 $ 26,118 $ 7,106 1 Exchange-traded instruments and non-trading credit derivatives, which are given financial guarantee treatment for credit risk capital purposes, are excluded in accordance with the guidelines of OSFI. The total
positive fair value of the excluded contracts as at October 31, 2011 was $775 million (2010 – $604 million).
Current Replacement Cost of Derivatives (millions of Canadian dollars) Canada 1 United States 1 International 1 Total 2011 2010 2011 2010 2011 2010 2011 2010 By Sector Financial $ 33,318 $ 30,422 $ 6,062 $ 976 $ 10,155 $ 8,706 $ 49,535 $ 40,104 Government 4,728 5,901 1,269 105 310 571 6,307 6,577 Other 2,407 2,655 1,084 1,108 312 627 3,803 4,390 Current replacement cost $ 40,453 $ 38,978 $ 8,415 $ 2,189 $ 10,777 $ 9,904 $ 59,645 $ 51,071 Less: impact of master netting agreements and collateral 51,486 42,909 Total $ 8,159 $ 8,162 2011 2010
2011 2010 % mix % mix By Location of Risk2 Canada $ 3,419 $ 3,737 41.9 % 45.8 %United States 2,236 1,820 27.4 22.3 International United Kingdom 601 332 7.4 4.1 Europe – other 1,153 1,252 14.1 15.3 Other 750 1,021 9.2 12.5 Total international 2,504 2,605 30.7 31.9 Total current replacement cost $ 8,159 $ 8,162 100.0 % 100.0 %1 Based on geographic location of unit responsible for recording revenue. 2 After impact of master netting agreements and collateral.
Certain of the Bank’s derivative contracts are governed by master derivative agreements having provisions that may permit the Bank’s counterparties to require, upon the occurrence of a certain contingent event, (i) the posting of collateral or other acceptable remedy such as assignment of the affected contracts to an acceptable counterparty, or (ii) settlement of outstanding derivative contracts. Most often, these contingent events are in the form of a downgrade of the senior debt ratings of the Bank, either as counterparty or as guarantor of one of the Bank’s subsidiaries. At October 31, 2011, the aggregate net liability position of those contracts would require (i) the posting of collateral or other acceptable remedy totalling $57 million (2010 – $9 million) in the event of a one-notch or two-notch downgrade in the Bank’s senior debt ratings and (ii) funding totalling $2 million (2010 – nil) following the termination and settlement of outstanding derivative contracts in the event of a one-notch or two notch downgrade in the Bank’s senior debt ratings. Certain of the Bank’s derivative contracts are governed by master derivative agreements having credit support provisions that permit the Bank’s counterparties to call for collateral depending on the net mark-to-market exposure position of all derivative contracts governed by that master derivative agreement. Some of these agreements may permit the Bank’s counterparties to require, upon the downgrade of the senior debt ratings of the Bank, to post additional collateral. As at October 31, 2011 the fair value of all derivative instruments with credit risk related contingent features in a net liability position was $12.9 billion (2010 – $11.9 billion). The Bank has posted $10.3 billion (2010 – $8.8 billion) of collateral for this exposure in the normal course of business. At October 31, 2011, the impact of a one-notch downgrade in the Bank’s senior debt ratings would

TD BANK GROUP • 2011 CONSOLIDATED FINANCIAL STATEMENTS AND NOTES 41
require the Bank to post an additional $0.5 billion (2010 – $0.6 billion) of collateral to that posted in the normal course of business. A two-notch down grade in the Bank’s senior debt ratings would require the Bank to post an additional $1.6 billion (2010 – 1.7 billion) of collateral to that posted in the normal course of business.
NOTE 8 ACQUISITIONS AND OTHER
a) Acquisition of Chrysler Financial On April 1, 2011, the Bank acquired 100% of the outstanding equity of Chrysler Financial in Canada and the U.S. for cash consideration of approximately
$6,390 million including contingent consideration. As part of the purchase agreement, the Bank is required to pay additional cash consideration in the event
that amounts realized on certain assets exceed a pre-established threshold. Under Canadian GAAP, contingent consideration is recorded as part of the
purchase price, when the amount can be reasonably estimated and the outcome is determinable beyond a reasonable doubt. During September 2011, the
amounts realized on these assets exceeded the threshold and the Bank was required to pay cash consideration of $70 million. The acquisition was accounted
for by the purchase method. The results of Chrysler Financial from the acquisition date to October 31, 2011 have been consolidated with the Bank’s results.
The results of Chrysler Financial in the U.S. are reported in the U.S. Personal and Commercial Banking segment. The results of Chrysler Financial in Canada are
reported in the Canadian Personal and Commercial Banking segment.
During the period from the acquisition date to October 31, 2011, goodwill increased by $73 million to $242 million, primarily due to the recognition of
contingent consideration. The purchase price allocation is subject to refinement as the Bank completes the valuation of the assets acquired and liabilities
assumed.
The following table presents the estimated fair values of the assets and liabilities of Chrysler Financial as of the date of acquisition.
Fair Value of Identifiable Net Assets Acquired (millions of Canadian dollars) Amount Assets acquired Cash and cash equivalents $ 3,081 Loans1 7,322 Other assets 2,235 12,638 Less: Liabilities assumed 6,490 Fair value of identifiable net assets acquired 6,148 Goodwill 242 Total purchase consideration $ 6,390 1The estimated fair value for loans reflects the expected credit losses at the acquisition date.
b) U.S. Personal and Commercial Banking Acquisitions in Fiscal 2010 On April 16, 2010, the Bank acquired certain assets and assumed liabilities of Riverside National Bank of Florida (“Riverside”), First Federal Bank of North
Florida (“First Federal”) and AmericanFirst Bank (“AmericanFirst”) in FDIC-assisted transactions. In addition, the Bank entered into loss sharing agreements with
the FDIC whereby the FDIC shares in the losses on loans and certain real estate assets. Under the terms of the loss sharing agreements, the FDIC reimburses
the Bank for 50% of losses up to a threshold level for each bank ($449 million for Riverside, $59 million for First Federal and $18 million for AmericanFirst)
and 80% of losses thereafter. The term of the loss sharing agreements is ten years from the date of acquisition for single family residential mortgages and five
years (plus three years where only recoveries will be shared) for other loans and real estate assets. At the end of the loss sharing periods, the Bank may be
required to make a payment to the FDIC based on the actual losses incurred in relation to the FDIC Intrinsic Loss Estimate as defined in the loss sharing
agreements.
On September 30, 2010, the Bank acquired 100% of the outstanding common shares of The South Financial Group, Inc. (South Financial) for total
consideration to common shareholders of approximately $64 million paid in cash and common shares in the amount of $11 million and $53 million,
respectively. Each common share of South Financial was exchanged for US $0.28 cash or 0.004 of a Bank common share, resulting in the issuance of
approximately 720 thousand common shares of the Bank. In addition, immediately prior to completion of the transaction, the United States Department of
the Treasury sold the Bank its South Financial preferred stock and the associated warrant acquired under the Treasury’s Capital Purchase Program and
discharged all accrued but unpaid dividends on that stock for total cash consideration of approximately $134 million.
The acquisitions were accounted for by the purchase method. The results from these acquisitions have been consolidated with the Bank’s results for the
years ended October 31, 2011 and 2010. The results are included with TD Bank, N.A. and are reported in the U.S. Personal and Commercial Banking segment.
As at the acquisition dates, the acquisitions contributed $2,184 million of net cash and cash equivalents, $8,457 million of loans, $115 million of identifiable
intangibles, $4,021 million of other assets, $12,298 million of deposits and $2,550 million of other liabilities to the Bank’s Consolidated Balance Sheet.
Included in loans is $2,127 million of covered loans. The estimated fair value for loans reflects the expected credit losses at the acquisition date.
During the period from the acquisition date to October 31, 2011, goodwill decreased by $45 million to $271 million, primarily due to the completion of
the valuation of the loan portfolio. During 2011, the purchase price allocation for Riverside, First Federal, AmericanFirst and South Financial acquisitions were
completed and finalized.
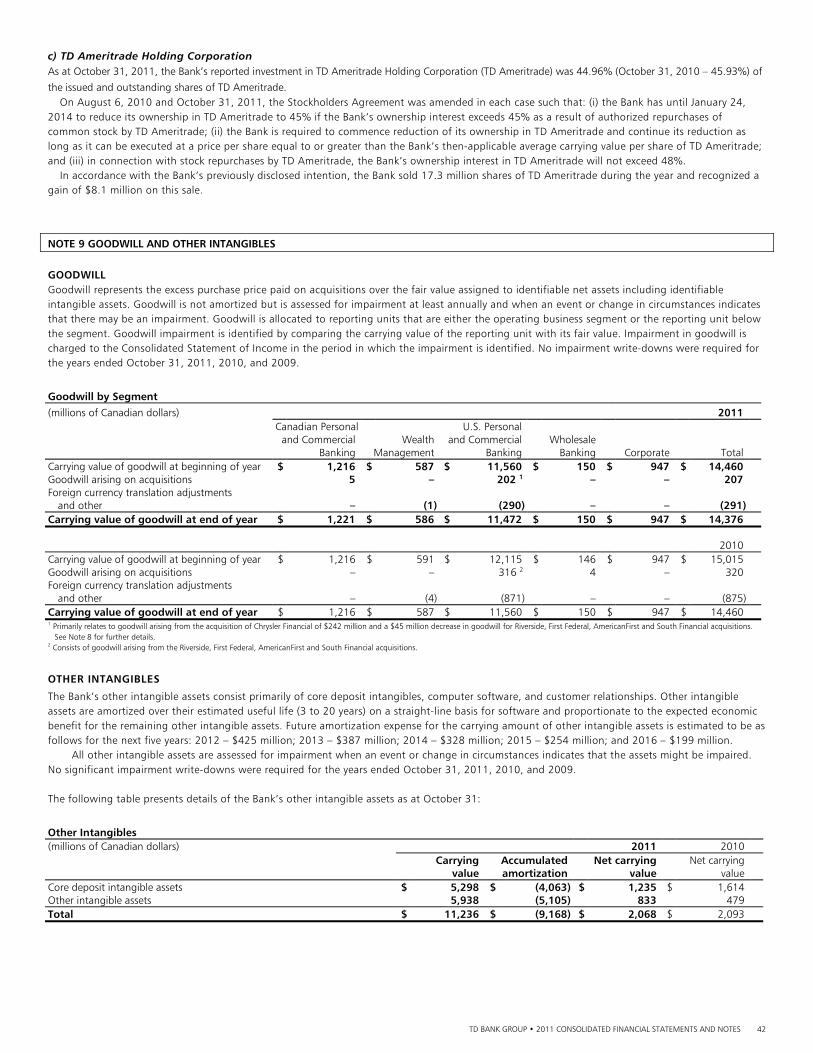
TD BANK GROUP • 2011 CONSOLIDATED FINANCIAL STATEMENTS AND NOTES 42
c) TD Ameritrade Holding Corporation As at October 31, 2011, the Bank’s reported investment in TD Ameritrade Holding Corporation (TD Ameritrade) was 44.96% (October 31, 2010 – 45.93%) of
the issued and outstanding shares of TD Ameritrade. On August 6, 2010 and October 31, 2011, the Stockholders Agreement was amended in each case such that: (i) the Bank has until January 24, 2014 to reduce its ownership in TD Ameritrade to 45% if the Bank’s ownership interest exceeds 45% as a result of authorized repurchases of common stock by TD Ameritrade; (ii) the Bank is required to commence reduction of its ownership in TD Ameritrade and continue its reduction as long as it can be executed at a price per share equal to or greater than the Bank’s then-applicable average carrying value per share of TD Ameritrade; and (iii) in connection with stock repurchases by TD Ameritrade, the Bank’s ownership interest in TD Ameritrade will not exceed 48%. In accordance with the Bank’s previously disclosed intention, the Bank sold 17.3 million shares of TD Ameritrade during the year and recognized a gain of $8.1 million on this sale.
NOTE 9 GOODWILL AND OTHER INTANGIBLES
GOODWILL Goodwill represents the excess purchase price paid on acquisitions over the fair value assigned to identifiable net assets including identifiable intangible assets. Goodwill is not amortized but is assessed for impairment at least annually and when an event or change in circumstances indicates that there may be an impairment. Goodwill is allocated to reporting units that are either the operating business segment or the reporting unit below the segment. Goodwill impairment is identified by comparing the carrying value of the reporting unit with its fair value. Impairment in goodwill is charged to the Consolidated Statement of Income in the period in which the impairment is identified. No impairment write-downs were required for the years ended October 31, 2011, 2010, and 2009.
Goodwill by Segment (millions of Canadian dollars) 2011 Canadian Personal U.S. Personal and Commercial Wealth and Commercial Wholesale Banking Management Banking Banking Corporate Total Carrying value of goodwill at beginning of year $ 1,216 $ 587 $ 11,560 $ 150 $ 947 $ 14,460 Goodwill arising on acquisitions 5 – 202 1 – – 207 Foreign currency translation adjustments and other – (1) (290) – – (291)Carrying value of goodwill at end of year $ 1,221 $ 586 $ 11,472 $ 150 $ 947 $ 14,376
2010 Carrying value of goodwill at beginning of year $ 1,216 $ 591 $ 12,115 $ 146 $ 947 $ 15,015 Goodwill arising on acquisitions – – 316 2 4 – 320 Foreign currency translation adjustments and other – (4) (871) – – (875)Carrying value of goodwill at end of year $ 1,216 $ 587 $ 11,560 $ 150 $ 947 $ 14,460 1 Primarily relates to goodwill arising from the acquisition of Chrysler Financial of $242 million and a $45 million decrease in goodwill for Riverside, First Federal, AmericanFirst and South Financial acquisitions. See Note 8 for further details. 2 Consists of goodwill arising from the Riverside, First Federal, AmericanFirst and South Financial acquisitions.
OTHER INTANGIBLES
The Bank’s other intangible assets consist primarily of core deposit intangibles, computer software, and customer relationships. Other intangible assets are amortized over their estimated useful life (3 to 20 years) on a straight-line basis for software and proportionate to the expected economic benefit for the remaining other intangible assets. Future amortization expense for the carrying amount of other intangible assets is estimated to be as follows for the next five years: 2012 – $425 million; 2013 – $387 million; 2014 – $328 million; 2015 – $254 million; and 2016 – $199 million. All other intangible assets are assessed for impairment when an event or change in circumstances indicates that the assets might be impaired. No significant impairment write-downs were required for the years ended October 31, 2011, 2010, and 2009. The following table presents details of the Bank’s other intangible assets as at October 31:
Other Intangibles (millions of Canadian dollars) 2011 2010 Carrying Accumulated Net carrying Net carrying value amortization value value Core deposit intangible assets $ 5,298 $ (4,063) $ 1,235 $ 1,614 Other intangible assets 5,938 (5,105) 833 479 Total $ 11,236 $ (9,168) $ 2,068 $ 2,093

TD BANK GROUP • 2011 CONSOLIDATED FINANCIAL STATEMENTS AND NOTES 43
NOTE 10 LAND, BUILDINGS, EQUIPMENT, AND OTHER DEPRECIABLE ASSETS
Buildings, computer equipment, furniture and fixtures, other equipment, and leasehold improvements are recognized at cost less accumulated depreciation and provisions for impairment, if any. Land is recognized at cost. Gains and losses on disposal are included in non-interest income in the Consolidated Statement of Income. Properties or other assets leased under a capital lease are capitalized and depreciated on a straight-line basis over the lease term or estimated useful life of the asset.
The Bank records the obligation associated with the retirement of a long-lived asset at fair value in the period in which it is incurred and can be reasonably estimated, and records a corresponding increase to the carrying amount of the asset. The asset is depreciated on a straight-line basis over its remaining useful life while the liability is accreted to reflect the passage of time until the eventual settlement of the obligation.
Depreciation is recognized on a straight-line basis over the useful lives of the assets estimated by asset category, as follows:
Assets Useful lifeBuildings 15 to 40 yearsComputer equipment 3 to 7 yearsFurniture and fixtures 3 to 15 yearsOther equipment 5 to 8 yearsLeasehold improvements Lesser of lease term plus one renewal or 15 years
Net Book Value (millions of Canadian dollars) 2011 2010 Accumulated Net book Net book Cost depreciation value value Land $ 834 $ – $ 834 $ 830 Buildings 2,179 678 1,501 1,367 Computer equipment 608 250 358 680 Furniture, fixtures and other equipment 1,461 750 711 674 Leasehold improvements 1,174 494 680 696 Total $ 6,256 $ 2,172 $ 4,084 $ 4,247
Accumulated depreciation at the end of 2010 was $2,285 million. Depreciation expense amounted to $467 million for 2011 (2010 – $601 million; 2009 – $600 million).
Depreciable assets are assessed for impairment when an event or change in circumstance indicates that the asset might be impaired. Impairment is considered to have occurred if the projected undiscounted cash flows resulting from the use and eventual disposition of an asset is less than its carrying value, at which point the asset would be written down to its net recoverable amount. An impairment loss is recognized in the Consolidated Statement of Income in the period in which the impairment is identified.
NOTE 11 OTHER ASSETS
Other Assets (millions of Canadian dollars) 2011 2010 Amounts receivable from brokers, dealers and clients $ 5,035 $ 8,132 Accounts receivable, prepaid expenses and other items1 6,185 6,032 Prepaid pension expense 1,203 1,223 Insurance-related assets, excluding investments 1,300 1,319 Accrued interest 1,061 1,040 Trading commodities2 3,400 2,249 Total $ 18,184 $ 19,995 1 In 2011, the FDIC indemnification assets were reclassified from loans to other assets on the Consolidated Balance Sheet on a retroactive basis. The balance of these indemnification assets as at October 31, 2011
was $86 million (October 31, 2010 - $167 million). 2 Trading commodities consist of physical precious metals inventory and are carried at fair value less costs to sell, with changes in fair value recorded in Non-interest income – Trading income in the Consolidated
Statement of Income, and are reported for regulatory purposes to OSFI as cash and cash equivalents.
NOTE 12 DEPOSITS
Demand deposits are those for which the Bank does not have the right to require notice prior to withdrawal. These deposits are in general chequing accounts. Notice deposits are those for which the Bank can legally require notice prior to withdrawal. These deposits are in general savings accounts. Term deposits are those payable on a fixed date of maturity purchased by customers to earn interest over a fixed period. The terms are from one day to 10 years. Accrued interest on deposits, calculated using the effective interest rate method, is included in other liabilities on the Consolidated Balance Sheet. The deposits are generally term deposits, guaranteed investment certificates and similar instruments. The aggregate amount of term deposits in denominations of $100,000 or more as at October 31, 2011 was $120 billion (2010 – $100 billion). Certain deposit liabilities are classified as trading and accounted for at fair value with the change in fair value recognized in the Consolidated Statement of Income.
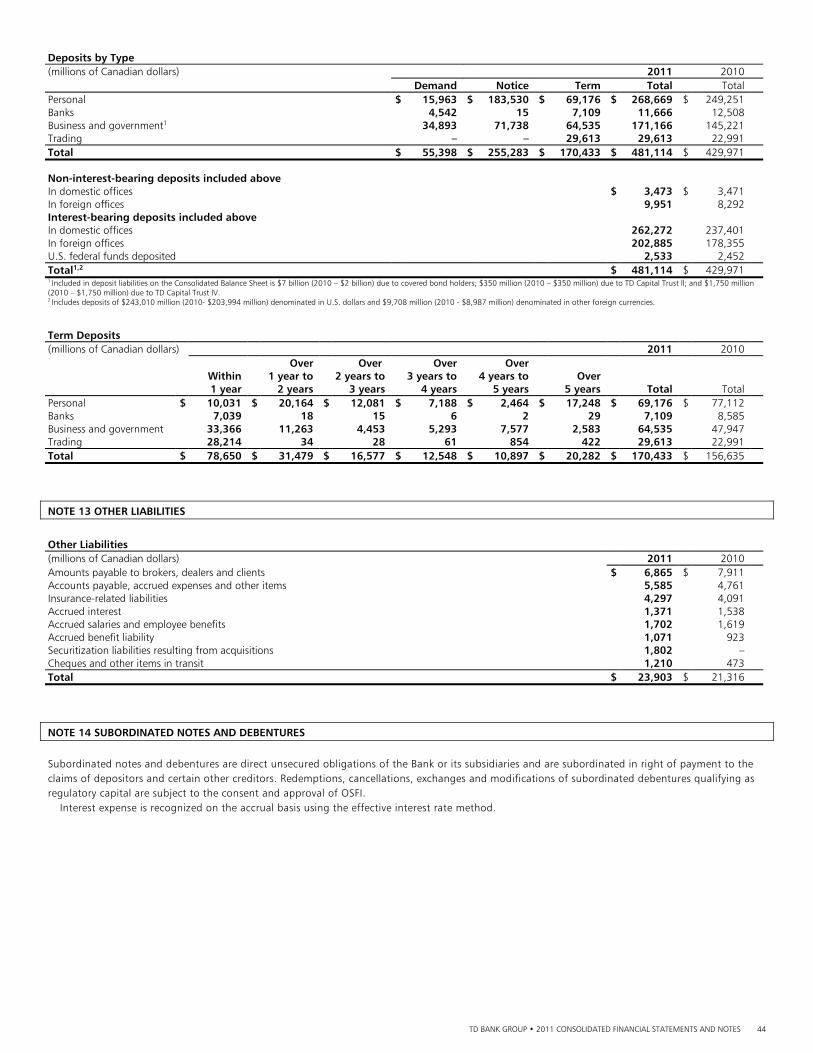
TD BANK GROUP • 2011 CONSOLIDATED FINANCIAL STATEMENTS AND NOTES 44
Deposits by Type (millions of Canadian dollars) 2011 2010 Demand Notice Term Total Total Personal $ 15,963 $ 183,530 $ 69,176 $ 268,669 $ 249,251 Banks 4,542 15 7,109 11,666 12,508 Business and government1 34,893 71,738 64,535 171,166 145,221 Trading – – 29,613 29,613 22,991 Total $ 55,398 $ 255,283 $ 170,433 $ 481,114 $ 429,971 Non-interest-bearing deposits included above In domestic offices $ 3,473 $ 3,471 In foreign offices 9,951 8,292 Interest-bearing deposits included above In domestic offices 262,272 237,401 In foreign offices 202,885 178,355 U.S. federal funds deposited 2,533 2,452 Total1,2 $ 481,114 $ 429,971 1 Included in deposit liabilities on the Consolidated Balance Sheet is $7 billion (2010 – $2 billion) due to covered bond holders; $350 million (2010 – $350 million) due to TD Capital Trust ll; and $1,750 million (2010 – $1,750 million) due to TD Capital Trust lV. 2 Includes deposits of $243,010 million (2010- $203,994 million) denominated in U.S. dollars and $9,708 million (2010 - $8,987 million) denominated in other foreign currencies.
Term Deposits (millions of Canadian dollars) 2011 2010 Over Over Over Over Within 1 year to 2 years to 3 years to 4 years to Over 1 year 2 years 3 years 4 years 5 years 5 years Total Total Personal $ 10,031 $ 20,164 $ 12,081 $ 7,188 $ 2,464 $ 17,248 $ 69,176 $ 77,112 Banks 7,039 18 15 6 2 29 7,109 8,585 Business and government 33,366 11,263 4,453 5,293 7,577 2,583 64,535 47,947 Trading 28,214 34 28 61 854 422 29,613 22,991 Total $ 78,650 $ 31,479 $ 16,577 $ 12,548 $ 10,897 $ 20,282 $ 170,433 $ 156,635
NOTE 13 OTHER LIABILITIES
Other Liabilities (millions of Canadian dollars) 2011 2010 Amounts payable to brokers, dealers and clients $ 6,865 $ 7,911 Accounts payable, accrued expenses and other items 5,585 4,761 Insurance-related liabilities 4,297 4,091 Accrued interest 1,371 1,538 Accrued salaries and employee benefits 1,702 1,619 Accrued benefit liability 1,071 923 Securitization liabilities resulting from acquisitions 1,802 – Cheques and other items in transit 1,210 473 Total $ 23,903 $ 21,316
NOTE 14 SUBORDINATED NOTES AND DEBENTURES
Subordinated notes and debentures are direct unsecured obligations of the Bank or its subsidiaries and are subordinated in right of payment to the claims of depositors and certain other creditors. Redemptions, cancellations, exchanges and modifications of subordinated debentures qualifying as regulatory capital are subject to the consent and approval of OSFI. Interest expense is recognized on the accrual basis using the effective interest rate method.
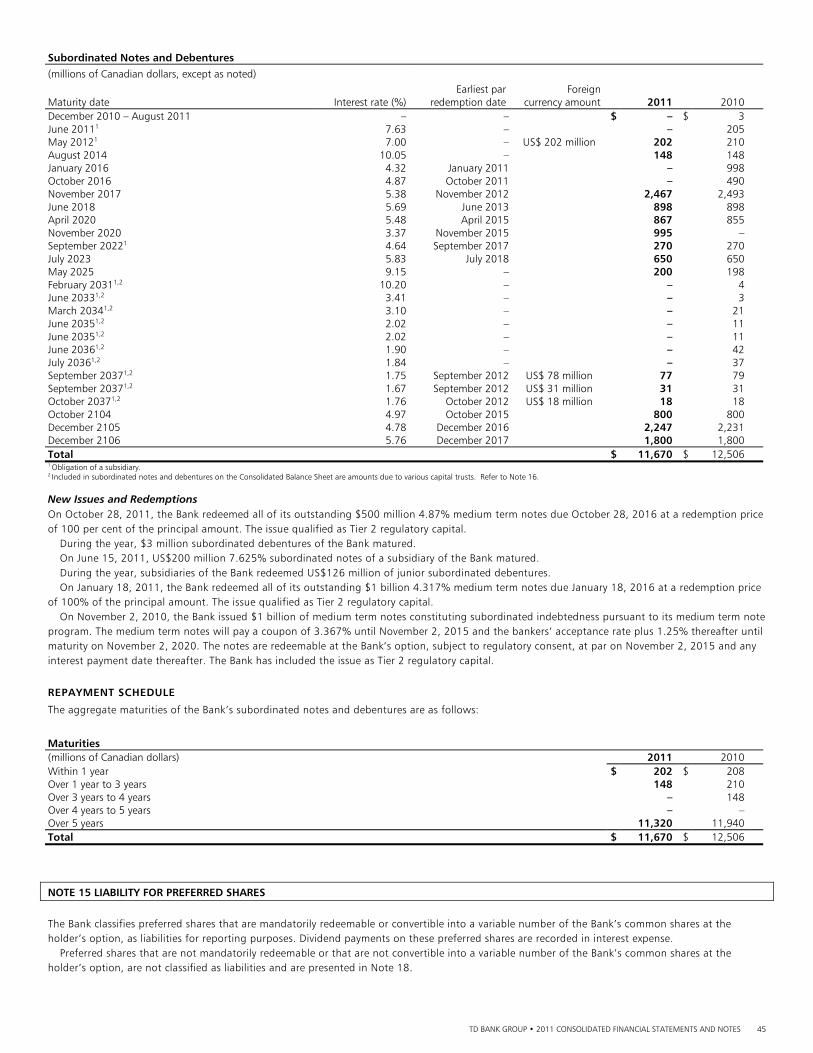
TD BANK GROUP • 2011 CONSOLIDATED FINANCIAL STATEMENTS AND NOTES 45
Subordinated Notes and Debentures (millions of Canadian dollars, except as noted) Earliest par Foreign Maturity date Interest rate (%) redemption date currency amount 2011 2010 December 2010 – August 2011 – – $ – $ 3 June 20111 7.63 – – 205 May 20121 7.00 – US$ 202 million 202 210 August 2014 10.05 – 148 148 January 2016 4.32 January 2011 – 998 October 2016 4.87 October 2011 – 490 November 2017 5.38 November 2012 2,467 2,493 June 2018 5.69 June 2013 898 898 April 2020
5.48 April 2015 867 855
November 2020 3.37 November 2015 995 –
September 20221 4.64 September 2017 270 270 July 2023 5.83 July 2018 650 650 May 2025 9.15 – 200 198 February 20311,2 10.20 – – 4 June 20331,2 3.41 – – 3 March 20341,2 3.10 – – 21 June 20351,2 2.02 – – 11 June 20351,2 2.02 – – 11 June 20361,2 1.90 – – 42 July 20361,2 1.84 – – 37 September 20371,2 1.75 September 2012 US$ 78 million 77 79 September 20371,2 1.67 September 2012 US$ 31 million 31 31 October 20371,2 1.76 October 2012 US$ 18 million 18 18 October 2104 4.97 October 2015 800 800 December 2105 4.78 December 2016 2,247 2,231 December 2106 5.76 December 2017 1,800 1,800 Total $ 11,670 $ 12,506 1 Obligation of a subsidiary. 2 Included in subordinated notes and debentures on the Consolidated Balance Sheet are amounts due to various capital trusts. Refer to Note 16.
New Issues and Redemptions On October 28, 2011, the Bank redeemed all of its outstanding $500 million 4.87% medium term notes due October 28, 2016 at a redemption price of 100 per cent of the principal amount. The issue qualified as Tier 2 regulatory capital. During the year, $3 million subordinated debentures of the Bank matured.
On June 15, 2011, US$200 million 7.625% subordinated notes of a subsidiary of the Bank matured. During the year, subsidiaries of the Bank redeemed US$126 million of junior subordinated debentures. On January 18, 2011, the Bank redeemed all of its outstanding $1 billion 4.317% medium term notes due January 18, 2016 at a redemption price of 100% of the principal amount. The issue qualified as Tier 2 regulatory capital. On November 2, 2010, the Bank issued $1 billion of medium term notes constituting subordinated indebtedness pursuant to its medium term note program. The medium term notes will pay a coupon of 3.367% until November 2, 2015 and the bankers’ acceptance rate plus 1.25% thereafter until maturity on November 2, 2020. The notes are redeemable at the Bank’s option, subject to regulatory consent, at par on November 2, 2015 and any interest payment date thereafter. The Bank has included the issue as Tier 2 regulatory capital.
REPAYMENT SCHEDULE
The aggregate maturities of the Bank’s subordinated notes and debentures are as follows:
Maturities (millions of Canadian dollars) 2011 2010 Within 1 year $ 202 $ 208 Over 1 year to 3 years 148 210 Over 3 years to 4 years – 148 Over 4 years to 5 years – – Over 5 years 11,320 11,940 Total $ 11,670 $ 12,506
NOTE 15 LIABILITY FOR PREFERRED SHARES
The Bank classifies preferred shares that are mandatorily redeemable or convertible into a variable number of the Bank’s common shares at the holder’s option, as liabilities for reporting purposes. Dividend payments on these preferred shares are recorded in interest expense.
Preferred shares that are not mandatorily redeemable or that are not convertible into a variable number of the Bank’s common shares at the holder’s option, are not classified as liabilities and are presented in Note 18.
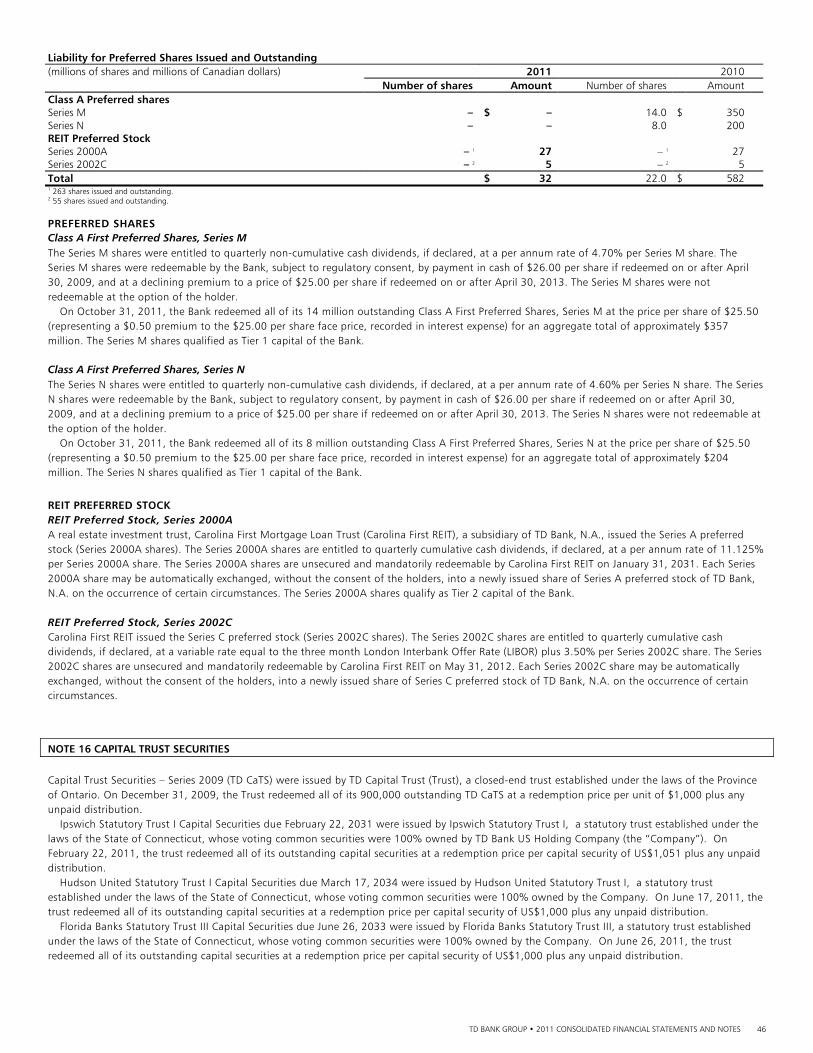
TD BANK GROUP • 2011 CONSOLIDATED FINANCIAL STATEMENTS AND NOTES 46
Liability for Preferred Shares Issued and Outstanding (millions of shares and millions of Canadian dollars) 2011 2010 Number of shares Amount Number of shares Amount Class A Preferred shares Series M – $ – 14.0 $ 350 Series N – – 8.0 200 REIT Preferred Stock Series 2000A – 1 27 – 1 27 Series 2002C – 2 5 – 2 5 Total $ 32 22.0 $ 582 1 263 shares issued and outstanding. 2 55 shares issued and outstanding.
PREFERRED SHARES Class A First Preferred Shares, Series M The Series M shares were entitled to quarterly non-cumulative cash dividends, if declared, at a per annum rate of 4.70% per Series M share. The Series M shares were redeemable by the Bank, subject to regulatory consent, by payment in cash of $26.00 per share if redeemed on or after April 30, 2009, and at a declining premium to a price of $25.00 per share if redeemed on or after April 30, 2013. The Series M shares were not redeemable at the option of the holder.
On October 31, 2011, the Bank redeemed all of its 14 million outstanding Class A First Preferred Shares, Series M at the price per share of $25.50 (representing a $0.50 premium to the $25.00 per share face price, recorded in interest expense) for an aggregate total of approximately $357 million. The Series M shares qualified as Tier 1 capital of the Bank. Class A First Preferred Shares, Series N The Series N shares were entitled to quarterly non-cumulative cash dividends, if declared, at a per annum rate of 4.60% per Series N share. The Series N shares were redeemable by the Bank, subject to regulatory consent, by payment in cash of $26.00 per share if redeemed on or after April 30, 2009, and at a declining premium to a price of $25.00 per share if redeemed on or after April 30, 2013. The Series N shares were not redeemable at the option of the holder.
On October 31, 2011, the Bank redeemed all of its 8 million outstanding Class A First Preferred Shares, Series N at the price per share of $25.50 (representing a $0.50 premium to the $25.00 per share face price, recorded in interest expense) for an aggregate total of approximately $204 million. The Series N shares qualified as Tier 1 capital of the Bank.
REIT PREFERRED STOCK REIT Preferred Stock, Series 2000A A real estate investment trust, Carolina First Mortgage Loan Trust (Carolina First REIT), a subsidiary of TD Bank, N.A., issued the Series A preferred stock (Series 2000A shares). The Series 2000A shares are entitled to quarterly cumulative cash dividends, if declared, at a per annum rate of 11.125% per Series 2000A share. The Series 2000A shares are unsecured and mandatorily redeemable by Carolina First REIT on January 31, 2031. Each Series 2000A share may be automatically exchanged, without the consent of the holders, into a newly issued share of Series A preferred stock of TD Bank, N.A. on the occurrence of certain circumstances. The Series 2000A shares qualify as Tier 2 capital of the Bank. REIT Preferred Stock, Series 2002C Carolina First REIT issued the Series C preferred stock (Series 2002C shares). The Series 2002C shares are entitled to quarterly cumulative cash dividends, if declared, at a variable rate equal to the three month London Interbank Offer Rate (LIBOR) plus 3.50% per Series 2002C share. The Series 2002C shares are unsecured and mandatorily redeemable by Carolina First REIT on May 31, 2012. Each Series 2002C share may be automatically exchanged, without the consent of the holders, into a newly issued share of Series C preferred stock of TD Bank, N.A. on the occurrence of certain circumstances.
NOTE 16 CAPITAL TRUST SECURITIES
Capital Trust Securities – Series 2009 (TD CaTS) were issued by TD Capital Trust (Trust), a closed-end trust established under the laws of the Province of Ontario. On December 31, 2009, the Trust redeemed all of its 900,000 outstanding TD CaTS at a redemption price per unit of $1,000 plus any unpaid distribution.
Ipswich Statutory Trust I Capital Securities due February 22, 2031 were issued by Ipswich Statutory Trust I, a statutory trust established under the laws of the State of Connecticut, whose voting common securities were 100% owned by TD Bank US Holding Company (the “Company”). On February 22, 2011, the trust redeemed all of its outstanding capital securities at a redemption price per capital security of US$1,051 plus any unpaid distribution. Hudson United Statutory Trust I Capital Securities due March 17, 2034 were issued by Hudson United Statutory Trust I, a statutory trust established under the laws of the State of Connecticut, whose voting common securities were 100% owned by the Company. On June 17, 2011, the trust redeemed all of its outstanding capital securities at a redemption price per capital security of US$1,000 plus any unpaid distribution. Florida Banks Statutory Trust III Capital Securities due June 26, 2033 were issued by Florida Banks Statutory Trust III, a statutory trust established under the laws of the State of Connecticut, whose voting common securities were 100% owned by the Company. On June 26, 2011, the trust redeemed all of its outstanding capital securities at a redemption price per capital security of US$1,000 plus any unpaid distribution.
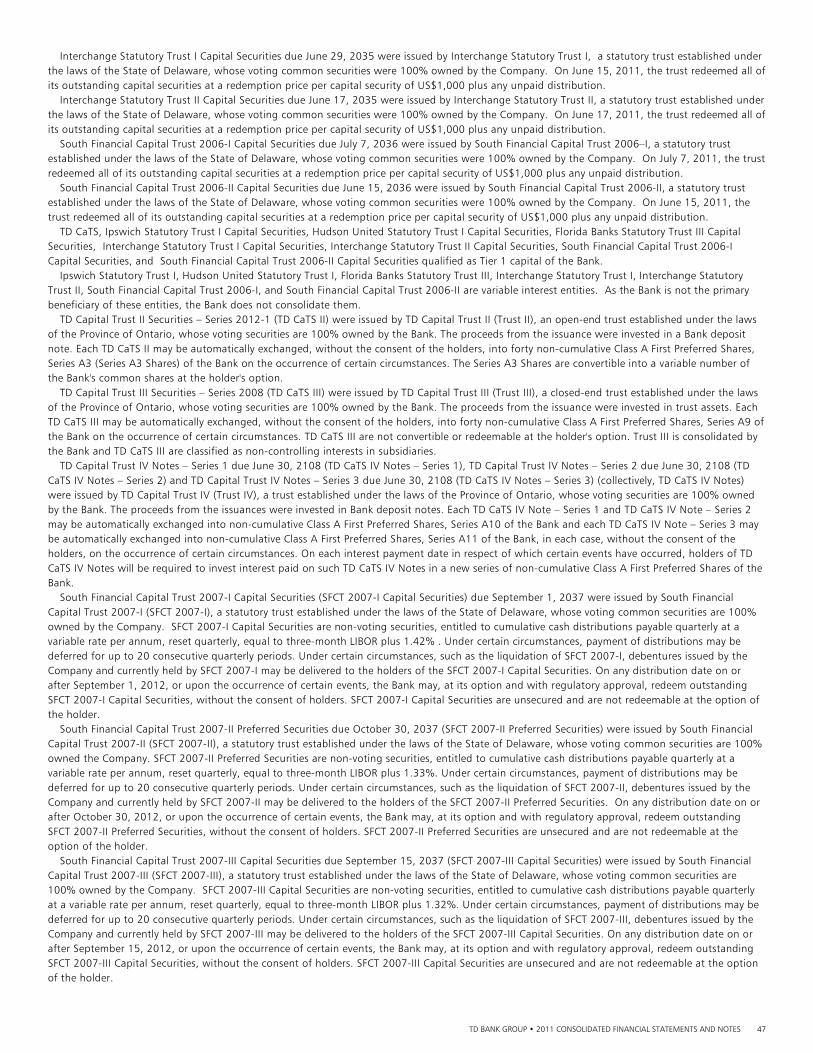
TD BANK GROUP • 2011 CONSOLIDATED FINANCIAL STATEMENTS AND NOTES 47
Interchange Statutory Trust I Capital Securities due June 29, 2035 were issued by Interchange Statutory Trust I, a statutory trust established under the laws of the State of Delaware, whose voting common securities were 100% owned by the Company. On June 15, 2011, the trust redeemed all of its outstanding capital securities at a redemption price per capital security of US$1,000 plus any unpaid distribution. Interchange Statutory Trust II Capital Securities due June 17, 2035 were issued by Interchange Statutory Trust II, a statutory trust established under the laws of the State of Delaware, whose voting common securities were 100% owned by the Company. On June 17, 2011, the trust redeemed all of its outstanding capital securities at a redemption price per capital security of US$1,000 plus any unpaid distribution. South Financial Capital Trust 2006-I Capital Securities due July 7, 2036 were issued by South Financial Capital Trust 2006–I, a statutory trust established under the laws of the State of Delaware, whose voting common securities were 100% owned by the Company. On July 7, 2011, the trust redeemed all of its outstanding capital securities at a redemption price per capital security of US$1,000 plus any unpaid distribution. South Financial Capital Trust 2006-II Capital Securities due June 15, 2036 were issued by South Financial Capital Trust 2006-II, a statutory trust established under the laws of the State of Delaware, whose voting common securities were 100% owned by the Company. On June 15, 2011, the trust redeemed all of its outstanding capital securities at a redemption price per capital security of US$1,000 plus any unpaid distribution. TD CaTS, Ipswich Statutory Trust I Capital Securities, Hudson United Statutory Trust I Capital Securities, Florida Banks Statutory Trust III Capital Securities, Interchange Statutory Trust I Capital Securities, Interchange Statutory Trust II Capital Securities, South Financial Capital Trust 2006-I Capital Securities, and South Financial Capital Trust 2006-II Capital Securities qualified as Tier 1 capital of the Bank. Ipswich Statutory Trust I, Hudson United Statutory Trust I, Florida Banks Statutory Trust III, Interchange Statutory Trust I, Interchange Statutory Trust II, South Financial Capital Trust 2006-I, and South Financial Capital Trust 2006-II are variable interest entities. As the Bank is not the primary beneficiary of these entities, the Bank does not consolidate them.
TD Capital Trust II Securities – Series 2012-1 (TD CaTS II) were issued by TD Capital Trust II (Trust II), an open-end trust established under the laws of the Province of Ontario, whose voting securities are 100% owned by the Bank. The proceeds from the issuance were invested in a Bank deposit note. Each TD CaTS II may be automatically exchanged, without the consent of the holders, into forty non-cumulative Class A First Preferred Shares, Series A3 (Series A3 Shares) of the Bank on the occurrence of certain circumstances. The Series A3 Shares are convertible into a variable number of the Bank's common shares at the holder's option.
TD Capital Trust III Securities – Series 2008 (TD CaTS III) were issued by TD Capital Trust III (Trust III), a closed-end trust established under the laws of the Province of Ontario, whose voting securities are 100% owned by the Bank. The proceeds from the issuance were invested in trust assets. Each TD CaTS III may be automatically exchanged, without the consent of the holders, into forty non-cumulative Class A First Preferred Shares, Series A9 of the Bank on the occurrence of certain circumstances. TD CaTS III are not convertible or redeemable at the holder's option. Trust III is consolidated by the Bank and TD CaTS III are classified as non-controlling interests in subsidiaries.
TD Capital Trust IV Notes – Series 1 due June 30, 2108 (TD CaTS IV Notes – Series 1), TD Capital Trust IV Notes – Series 2 due June 30, 2108 (TD CaTS IV Notes – Series 2) and TD Capital Trust IV Notes – Series 3 due June 30, 2108 (TD CaTS IV Notes – Series 3) (collectively, TD CaTS IV Notes) were issued by TD Capital Trust IV (Trust IV), a trust established under the laws of the Province of Ontario, whose voting securities are 100% owned by the Bank. The proceeds from the issuances were invested in Bank deposit notes. Each TD CaTS IV Note – Series 1 and TD CaTS IV Note – Series 2 may be automatically exchanged into non-cumulative Class A First Preferred Shares, Series A10 of the Bank and each TD CaTS IV Note – Series 3 may be automatically exchanged into non-cumulative Class A First Preferred Shares, Series A11 of the Bank, in each case, without the consent of the holders, on the occurrence of certain circumstances. On each interest payment date in respect of which certain events have occurred, holders of TD CaTS IV Notes will be required to invest interest paid on such TD CaTS IV Notes in a new series of non-cumulative Class A First Preferred Shares of the Bank.
South Financial Capital Trust 2007-I Capital Securities (SFCT 2007-I Capital Securities) due September 1, 2037 were issued by South Financial Capital Trust 2007-I (SFCT 2007-I), a statutory trust established under the laws of the State of Delaware, whose voting common securities are 100% owned by the Company. SFCT 2007-I Capital Securities are non-voting securities, entitled to cumulative cash distributions payable quarterly at a variable rate per annum, reset quarterly, equal to three-month LIBOR plus 1.42% . Under certain circumstances, payment of distributions may be deferred for up to 20 consecutive quarterly periods. Under certain circumstances, such as the liquidation of SFCT 2007-I, debentures issued by the Company and currently held by SFCT 2007-I may be delivered to the holders of the SFCT 2007-I Capital Securities. On any distribution date on or after September 1, 2012, or upon the occurrence of certain events, the Bank may, at its option and with regulatory approval, redeem outstanding SFCT 2007-I Capital Securities, without the consent of holders. SFCT 2007-I Capital Securities are unsecured and are not redeemable at the option of the holder. South Financial Capital Trust 2007-II Preferred Securities due October 30, 2037 (SFCT 2007-II Preferred Securities) were issued by South Financial Capital Trust 2007-II (SFCT 2007-II), a statutory trust established under the laws of the State of Delaware, whose voting common securities are 100% owned the Company. SFCT 2007-II Preferred Securities are non-voting securities, entitled to cumulative cash distributions payable quarterly at a variable rate per annum, reset quarterly, equal to three-month LIBOR plus 1.33%. Under certain circumstances, payment of distributions may be deferred for up to 20 consecutive quarterly periods. Under certain circumstances, such as the liquidation of SFCT 2007-II, debentures issued by the Company and currently held by SFCT 2007-II may be delivered to the holders of the SFCT 2007-II Preferred Securities. On any distribution date on or after October 30, 2012, or upon the occurrence of certain events, the Bank may, at its option and with regulatory approval, redeem outstanding SFCT 2007-II Preferred Securities, without the consent of holders. SFCT 2007-II Preferred Securities are unsecured and are not redeemable at the option of the holder. South Financial Capital Trust 2007-III Capital Securities due September 15, 2037 (SFCT 2007-III Capital Securities) were issued by South Financial Capital Trust 2007-III (SFCT 2007-III), a statutory trust established under the laws of the State of Delaware, whose voting common securities are 100% owned by the Company. SFCT 2007-III Capital Securities are non-voting securities, entitled to cumulative cash distributions payable quarterly at a variable rate per annum, reset quarterly, equal to three-month LIBOR plus 1.32%. Under certain circumstances, payment of distributions may be deferred for up to 20 consecutive quarterly periods. Under certain circumstances, such as the liquidation of SFCT 2007-III, debentures issued by the Company and currently held by SFCT 2007-III may be delivered to the holders of the SFCT 2007-III Capital Securities. On any distribution date on or after September 15, 2012, or upon the occurrence of certain events, the Bank may, at its option and with regulatory approval, redeem outstanding SFCT 2007-III Capital Securities, without the consent of holders. SFCT 2007-III Capital Securities are unsecured and are not redeemable at the option of the holder.
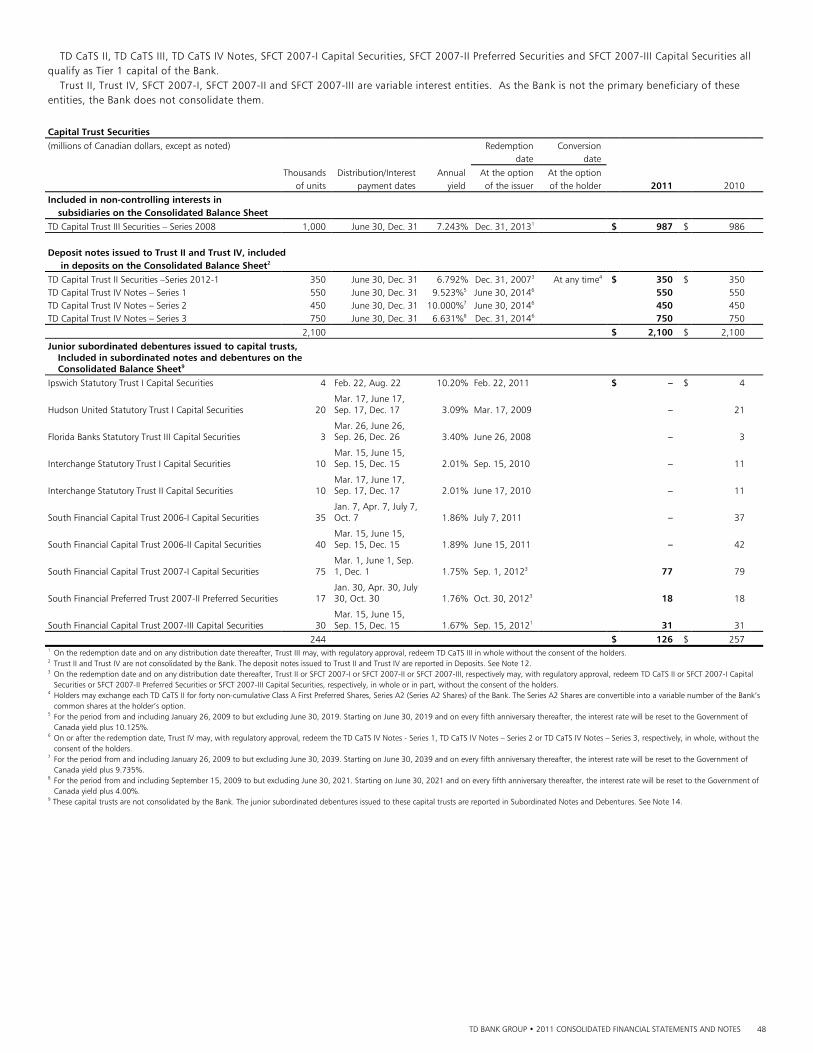
TD BANK GROUP • 2011 CONSOLIDATED FINANCIAL STATEMENTS AND NOTES 48
TD CaTS II, TD CaTS III, TD CaTS IV Notes, SFCT 2007-I Capital Securities, SFCT 2007-II Preferred Securities and SFCT 2007-III Capital Securities all qualify as Tier 1 capital of the Bank. Trust II, Trust IV, SFCT 2007-I, SFCT 2007-II and SFCT 2007-III are variable interest entities. As the Bank is not the primary beneficiary of these entities, the Bank does not consolidate them.
Capital Trust Securities
(millions of Canadian dollars, except as noted) Redemption Conversion date date Thousands Distribution/Interest Annual At the option At the option of units payment dates yield of the issuer of the holder 2011 2010
Included in non-controlling interests in subsidiaries on the Consolidated Balance Sheet TD Capital Trust III Securities – Series 2008 1,000 June 30, Dec. 31 7.243% Dec. 31, 20131 $ 987 $ 986 Deposit notes issued to Trust II and Trust IV, included in deposits on the Consolidated Balance Sheet2
TD Capital Trust II Securities –Series 2012-1 350 June 30, Dec. 31 6.792% Dec. 31, 20073 At any time4 $ 350 $ 350 TD Capital Trust IV Notes – Series 1 550 June 30, Dec. 31 9.523%5 June 30, 20146 550 550 TD Capital Trust IV Notes – Series 2 450 June 30, Dec. 31 10.000%7 June 30, 20146 450 450 TD Capital Trust IV Notes – Series 3 750 June 30, Dec. 31 6.631%8 Dec. 31, 20146 750 750 2,100 $ 2,100 $ 2,100
Junior subordinated debentures issued to capital trusts,
Included in subordinated notes and debentures on the Consolidated Balance Sheet9
Ipswich Statutory Trust I Capital Securities 4 Feb. 22, Aug. 22 10.20% Feb. 22, 2011 $ – $ 4
Hudson United Statutory Trust I Capital Securities 20 Mar. 17, June 17, Sep. 17, Dec. 17 3.09% Mar. 17, 2009 – 21
Florida Banks Statutory Trust III Capital Securities 3 Mar. 26, June 26, Sep. 26, Dec. 26 3.40% June 26, 2008 – 3
Interchange Statutory Trust I Capital Securities 10 Mar. 15, June 15, Sep. 15, Dec. 15 2.01% Sep. 15, 2010 – 11
Interchange Statutory Trust II Capital Securities 10 Mar. 17, June 17, Sep. 17, Dec. 17 2.01% June 17, 2010 – 11
South Financial Capital Trust 2006-I Capital Securities 35 Jan. 7, Apr. 7, July 7, Oct. 7 1.86% July 7, 2011 – 37
South Financial Capital Trust 2006-II Capital Securities 40 Mar. 15, June 15, Sep. 15, Dec. 15 1.89% June 15, 2011 – 42
South Financial Capital Trust 2007-I Capital Securities 75 Mar. 1, June 1, Sep. 1, Dec. 1 1.75%
Sep. 1, 20123 77 79
South Financial Preferred Trust 2007-II Preferred Securities 17 Jan. 30, Apr. 30, July 30, Oct. 30 1.76%
Oct. 30, 20123 18 18
South Financial Capital Trust 2007-III Capital Securities 30 Mar. 15, June 15, Sep. 15, Dec. 15 1.67%
Sep. 15, 20121 31 31
244 $ 126 $ 257 1 On the redemption date and on any distribution date thereafter, Trust III may, with regulatory approval, redeem TD CaTS III in whole without the consent of the holders. 2 Trust II and Trust IV are not consolidated by the Bank. The deposit notes issued to Trust II and Trust IV are reported in Deposits. See Note 12. 3 On the redemption date and on any distribution date thereafter, Trust II or SFCT 2007-I or SFCT 2007-II or SFCT 2007-III, respectively may, with regulatory approval, redeem TD CaTS II or SFCT 2007-I Capital
Securities or SFCT 2007-II Preferred Securities or SFCT 2007-III Capital Securities, respectively, in whole or in part, without the consent of the holders. 4 Holders may exchange each TD CaTS II for forty non-cumulative Class A First Preferred Shares, Series A2 (Series A2 Shares) of the Bank. The Series A2 Shares are convertible into a variable number of the Bank’s
common shares at the holder’s option. 5 For the period from and including January 26, 2009 to but excluding June 30, 2019. Starting on June 30, 2019 and on every fifth anniversary thereafter, the interest rate will be reset to the Government of
Canada yield plus 10.125%. 6 On or after the redemption date, Trust IV may, with regulatory approval, redeem the TD CaTS IV Notes - Series 1, TD CaTS IV Notes – Series 2 or TD CaTS IV Notes – Series 3, respectively, in whole, without the
consent of the holders. 7 For the period from and including January 26, 2009 to but excluding June 30, 2039. Starting on June 30, 2039 and on every fifth anniversary thereafter, the interest rate will be reset to the Government of
Canada yield plus 9.735%. 8 For the period from and including September 15, 2009 to but excluding June 30, 2021. Starting on June 30, 2021 and on every fifth anniversary thereafter, the interest rate will be reset to the Government of
Canada yield plus 4.00%. 9 These capital trusts are not consolidated by the Bank. The junior subordinated debentures issued to these capital trusts are reported in Subordinated Notes and Debentures. See Note 14.
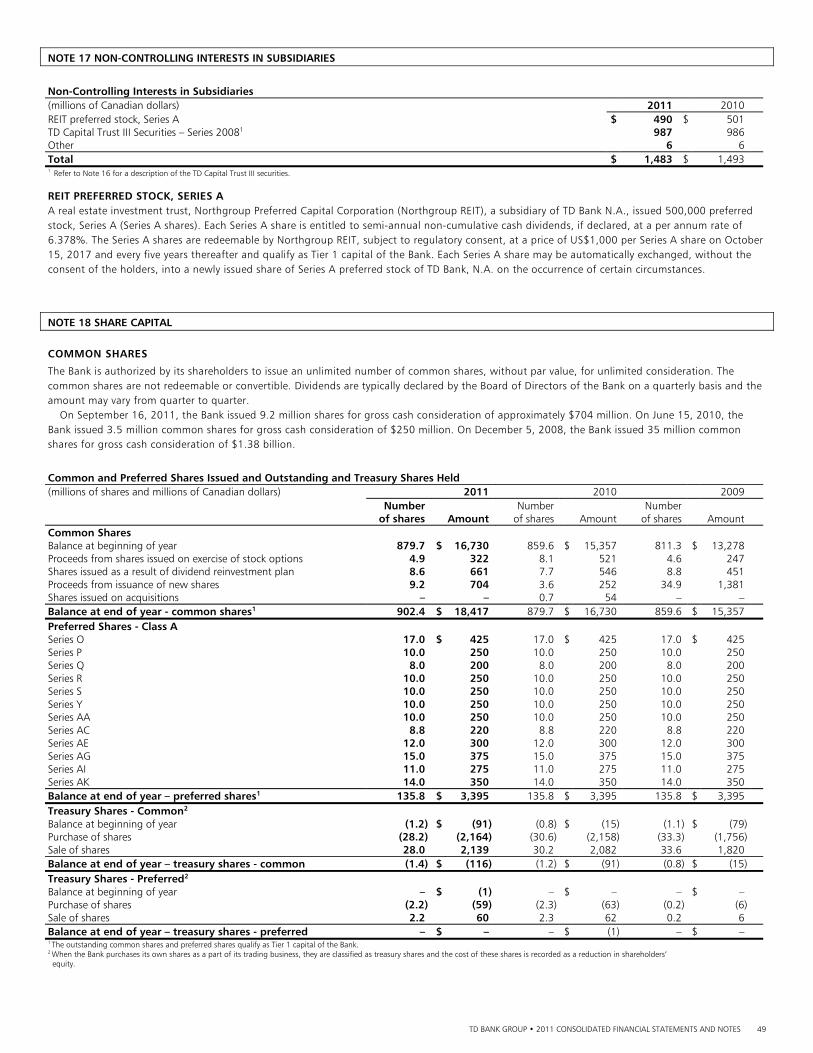
TD BANK GROUP • 2011 CONSOLIDATED FINANCIAL STATEMENTS AND NOTES 49
NOTE 17 NON-CONTROLLING INTERESTS IN SUBSIDIARIES
Non-Controlling Interests in Subsidiaries (millions of Canadian dollars) 2011 2010 REIT preferred stock, Series A $ 490 $ 501 TD Capital Trust III Securities – Series 20081 987 986 Other 6 6 Total $ 1,483 $ 1,493 1 Refer to Note 16 for a description of the TD Capital Trust III securities.
REIT PREFERRED STOCK, SERIES A A real estate investment trust, Northgroup Preferred Capital Corporation (Northgroup REIT), a subsidiary of TD Bank N.A., issued 500,000 preferred stock, Series A (Series A shares). Each Series A share is entitled to semi-annual non-cumulative cash dividends, if declared, at a per annum rate of 6.378%. The Series A shares are redeemable by Northgroup REIT, subject to regulatory consent, at a price of US$1,000 per Series A share on October 15, 2017 and every five years thereafter and qualify as Tier 1 capital of the Bank. Each Series A share may be automatically exchanged, without the consent of the holders, into a newly issued share of Series A preferred stock of TD Bank, N.A. on the occurrence of certain circumstances.
NOTE 18 SHARE CAPITAL
COMMON SHARES
The Bank is authorized by its shareholders to issue an unlimited number of common shares, without par value, for unlimited consideration. The common shares are not redeemable or convertible. Dividends are typically declared by the Board of Directors of the Bank on a quarterly basis and the amount may vary from quarter to quarter.
On September 16, 2011, the Bank issued 9.2 million shares for gross cash consideration of approximately $704 million. On June 15, 2010, the Bank issued 3.5 million common shares for gross cash consideration of $250 million. On December 5, 2008, the Bank issued 35 million common shares for gross cash consideration of $1.38 billion.
Common and Preferred Shares Issued and Outstanding and Treasury Shares Held (millions of shares and millions of Canadian dollars) 2011 2010 2009 Number Number Number of shares Amount of shares Amount of shares Amount Common Shares Balance at beginning of year 879.7 $ 16,730 859.6 $ 15,357 811.3 $ 13,278 Proceeds from shares issued on exercise of stock options 4.9 322 8.1 521 4.6 247 Shares issued as a result of dividend reinvestment plan 8.6 661 7.7 546 8.8 451 Proceeds from issuance of new shares 9.2 704 3.6 252 34.9 1,381 Shares issued on acquisitions – – 0.7 54 – – Balance at end of year - common shares1 902.4 $ 18,417 879.7 $ 16,730 859.6 $ 15,357 Preferred Shares - Class A Series O 17.0 $ 425 17.0 $ 425 17.0 $ 425 Series P 10.0 250 10.0 250 10.0 250 Series Q 8.0 200 8.0 200 8.0 200 Series R 10.0 250 10.0 250 10.0 250 Series S 10.0 250 10.0 250 10.0 250 Series Y 10.0 250 10.0 250 10.0 250 Series AA 10.0 250 10.0 250 10.0 250 Series AC 8.8 220 8.8 220 8.8 220 Series AE 12.0 300 12.0 300 12.0 300 Series AG 15.0 375 15.0 375 15.0 375 Series AI 11.0 275 11.0 275 11.0 275 Series AK 14.0 350 14.0 350 14.0 350 Balance at end of year – preferred shares1 135.8 $ 3,395 135.8 $ 3,395 135.8 $ 3,395 Treasury Shares - Common2 Balance at beginning of year (1.2) $ (91) (0.8) $ (15) (1.1) $ (79)Purchase of shares (28.2) (2,164) (30.6) (2,158) (33.3) (1,756)Sale of shares 28.0 2,139 30.2 2,082 33.6 1,820 Balance at end of year – treasury shares - common (1.4) $ (116) (1.2) $ (91) (0.8) $ (15)Treasury Shares - Preferred2 Balance at beginning of year – $ (1) – $ – – $ – Purchase of shares (2.2) (59) (2.3) (63) (0.2) (6)Sale of shares 2.2 60 2.3 62 0.2 6 Balance at end of year – treasury shares - preferred – $ – – $ (1) – $ – 1 The outstanding common shares and preferred shares qualify as Tier 1 capital of the Bank. 2 When the Bank purchases its own shares as a part of its trading business, they are classified as treasury shares and the cost of these shares is recorded as a reduction in shareholders’ equity.

TD BANK GROUP • 2011 CONSOLIDATED FINANCIAL STATEMENTS AND NOTES 50
PREFERRED SHARES
Class A First Preferred Shares, Series O On November 1, 2005, the Bank issued 17 million Class A First Preferred Shares, Series O for gross cash consideration of $425 million. Quarterly non-cumulative cash dividends, if declared, will be paid at a per annum rate of 4.85% per Series O share. The Series O shares are redeemable by the Bank, subject to regulatory consent, by payment in cash of $26.00 per share if redeemed on or after November 1, 2010 and decreasing by $0.25 each 12-month period thereafter to $25.00 per share if redeemed on or after October 31, 2014. Class A First Preferred Shares, Series P On November 1, 2007, the Bank issued 10 million Class A First Preferred Shares, Series P for gross cash consideration of $250 million. Quarterly non-cumulative cash dividends, if declared, will be paid at a per annum rate of 5.25% per Series P share. The Series P shares are redeemable by the Bank, subject to regulatory consent, by payment in cash of $26.00 per share if redeemed on or after November 1, 2012 and decreasing by $0.25 each 12-month period thereafter to $25.00 per share if redeemed on or after October 31, 2016. Class A First Preferred Shares, Series Q On January 31, 2008, the Bank issued 8 million Class A First Preferred Shares, Series Q for gross cash consideration of $200 million. Quarterly non-cumulative cash dividends, if declared, will be paid at a per annum rate of 5.60% per Series Q share. The Series Q shares are redeemable by the Bank, subject to regulatory consent, by payment in cash of $26.00 per share if redeemed on or after January 31, 2013 and decreasing by $0.25 each 12-month period thereafter to $25.00 per share if redeemed on or after January 31, 2017. Class A First Preferred Shares, Series R On March 12, 2008, the Bank issued 10 million Class A First Preferred Shares, Series R for gross cash consideration of $250 million. Quarterly non-cumulative cash dividends, if declared, will be paid at a per annum rate of 5.60% per Series R share. The Series R shares are redeemable by the Bank, subject to regulatory consent, by payment in cash of $26.00 per share if redeemed on or after April 30, 2013 and decreasing by $0.25 each 12-month period thereafter to $25.00 per share if redeemed on or after April 30, 2017. 5-Year Rate Reset Preferred Shares, Series S On June 11, 2008, the Bank issued 10 million non-cumulative 5-Year Rate Reset Preferred Shares, Series S for gross cash consideration of $250 million. Quarterly non-cumulative cash dividends, if declared, will be paid at a per annum rate of 5.00% for the initial period from and including June 11, 2008 to but excluding July 31, 2013. Thereafter, the dividend rate will reset every five years to equal the then five-year Government of Canada bond yield plus 1.60%. Holders of the Series S shares will have the right to convert all or any part of their shares into non-cumulative Floating Rate Preferred Shares, Series T, subject to certain conditions, on July 31, 2013, and on July 31 every five years thereafter and vice versa. The Series S shares are redeemable by the Bank for cash, subject to regulatory consent, at $25.00 per share on July 31, 2013 and on July 31 every five years thereafter. 5-Year Rate Reset Preferred Shares, Series Y On July 16, 2008, the Bank issued 10 million non-cumulative 5-Year Rate Reset Preferred Shares, Series Y for gross cash consideration of $250 million. Quarterly non-cumulative cash dividends, if declared, will be paid at a per annum rate of 5.10% for the initial period from and including July 16, 2008 to but excluding October 31, 2013. Thereafter, the dividend rate will reset every five years to equal the then five-year Government of Canada bond yield plus 1.68%. Holders of the Series Y shares will have the right to convert their shares into non-cumulative Floating Rate Preferred Shares, Series Z, subject to certain conditions, on October 31, 2013, and on October 31 every five years thereafter and vice versa. The Series Y shares are redeemable by the Bank for cash, subject to regulatory consent, at $25.00 per share on October 31, 2013 and on October 31 every five years thereafter. 5-Year Rate Reset Preferred Shares, Series AA On September 12, 2008, the Bank issued 10 million non-cumulative 5-Year Rate Reset Preferred Shares, Series AA for gross cash consideration of $250 million. Quarterly non-cumulative cash dividends, if declared, will be paid at a per annum rate of 5.00% for the initial period from and including September 12, 2008 to but excluding January 31, 2014. Thereafter, the dividend rate will reset every five years to equal the then five-year Government of Canada bond yield plus 1.96%. Holders of the Series AA shares will have the right to convert their shares into non-cumulative Floating Rate Preferred Shares, Series AB, subject to certain conditions, on January 31, 2014, and on January 31 every five years thereafter and vice versa. The Series AA shares are redeemable by the Bank for cash, subject to regulatory consent, at $25.00 per share on January 31, 2014 and on January 31 every five years thereafter. 5-Year Rate Reset Preferred Shares, Series AC On November 5, 2008, the Bank issued 8.8 million non-cumulative 5-Year Rate Reset Preferred Shares, Series AC for gross cash consideration of $220 million. Quarterly non-cumulative cash dividends, if declared, will be paid at a per annum rate of 5.60% for the initial period from and including November 5, 2008 to but excluding January 31, 2014. Thereafter, the dividend rate will reset every five years to equal the then five year Government of Canada bond yield plus 2.74%. Holders of the Series AC shares will have the right to convert their shares into non-cumulative Floating Rate Preferred Shares, Series AD, subject to certain conditions, on January 31, 2014, and on January 31 every five years thereafter and vice versa. The Series AC shares are redeemable by the Bank for cash, subject to regulatory consent, at $25.00 per share on January 31, 2014 and on January 31 every five years thereafter. 5-Year Rate Reset Preferred Shares, Series AE On January 14, 2009, the Bank issued 12 million non-cumulative 5-Year Rate Reset Preferred Shares, Series AE for gross cash consideration of $300 million. Quarterly non-cumulative cash dividends, if declared, will be paid at a per annum rate of 6.25% for the initial period from and including January 14, 2009 to but excluding April 30, 2014. Thereafter, the dividend rate will reset every five years to equal the then five year Government of Canada bond yield plus 4.37%. Holders of the Series AE shares will have the right to convert their shares into non-cumulative Floating

TD BANK GROUP • 2011 CONSOLIDATED FINANCIAL STATEMENTS AND NOTES 51
Rate Class A Preferred Shares, Series AF, subject to certain conditions, on April 30, 2014, and on April 30 every five years thereafter and vice versa. The Series AE shares are redeemable by the Bank for cash, subject to regulatory consent, at $25.00 per share on April 30, 2014 and on April 30 every five years thereafter. 5-Year Rate Reset Preferred Shares, Series AG On January 30, 2009, the Bank issued 15 million non-cumulative 5-Year Rate Reset Preferred Shares, Series AG for gross cash consideration of $375 million. Quarterly non-cumulative cash dividends, if declared, will be paid at a per annum rate of 6.25% for the initial period from and including January 30, 2009 to but excluding April 30, 2014. Thereafter, the dividend rate will reset every five years to equal the then five year Government of Canada bond yield plus 4.38%. Holders of the Series AG shares will have the right to convert their shares into non-cumulative Floating Rate Class A Preferred Shares, Series AH, subject to certain conditions, on April 30, 2014, and on April 30 every five years thereafter and vice versa. The Series AG shares are redeemable by the Bank for cash, subject to regulatory consent, at $25.00 per share on April 30, 2014 and on April 30 every five years thereafter. 5-Year Rate Reset Preferred Shares, Series AI On March 6, 2009, the Bank issued 11 million non-cumulative 5-Year Rate Reset Preferred Shares, Series AI for gross cash consideration of $275 million. Quarterly non-cumulative cash dividends, if declared, will be paid at a per annum rate of 6.25% for the initial period from and including March 6, 2009 to but excluding July 31, 2014. Thereafter, the dividend rate will reset every five years to equal the then five year Government of Canada bond yield plus 4.15%. Holders of the Series AI shares will have the right to convert their shares into non-cumulative Floating Rate Class A Preferred Shares, Series AJ, subject to certain conditions, on July 31, 2014, and on July 31 every five years thereafter and vice versa. The Series AI shares are redeemable by the Bank for cash, subject to regulatory consent, at $25.00 per share on July 31, 2014 and on July 31 every five years thereafter. 5-Year Rate Reset Preferred Shares, Series AK On April 3, 2009, the Bank issued 14 million non-cumulative 5-Year Rate Reset Preferred Shares, Series AK for gross cash consideration of $350 million. Quarterly non-cumulative cash dividends, if declared, will be paid at a per annum rate of 6.25% for the initial period from and including April 3, 2009 to but excluding July 31, 2014. Thereafter, the dividend rate will reset every five years to equal the then five year Government of Canada bond yield plus 4.33%. Holders of the Series AK shares will have the right to convert their shares into non-cumulative Floating Rate Class A Preferred Shares, Series AL, subject to certain conditions, on July 31, 2014, and on July 31 every five years thereafter and vice versa. The Series AK shares are redeemable by the Bank for cash, subject to regulatory consent, at $25.00 per share on July 31, 2014 and on July 31 every five years thereafter. NORMAL COURSE ISSUER BID The Bank did not have a normal course issuer bid outstanding during fiscal 2011, 2010 or 2009.
DIVIDEND REINVESTMENT PLAN
The Bank offers a dividend reinvestment plan for its common shareholders. Participation in the plan is optional and under the terms of the plan, cash dividends on common shares are used to purchase additional common shares. At the option of the Bank, the common shares may be issued from the Bank’s treasury at an average market price based on the last five trading days before the date of the dividend payment, with a discount of between 0% to 5% at the Bank’s discretion, or from the open market at market price. During the year, a total of 8.6 million common shares were issued from the Bank’s treasury at a discount of 1% (2010 – 7.7 million shares at a discount of 1%; 2009 – 8.8 million shares at a discount of 1%) under the dividend reinvestment plan. DIVIDEND RESTRICTIONS
The Bank is prohibited by the Bank Act from declaring dividends on its preferred or common shares if there are reasonable grounds for believing that the Bank is, or the payment would cause the Bank to be, in contravention of the capital adequacy and liquidity regulations of the Bank Act or directions of OSFI. The Bank does not anticipate that this condition will restrict it from paying dividends in the normal course of business.
The Bank is also restricted from paying dividends in the event that either Trust II, Trust III or Trust IV fails to pay semi-annual distributions or interest in full to holders of their respective trust securities, TD CaTS II, TD CaTS III and TD CaTS IV Notes. In addition, the ability to pay dividends on common shares without the approval of the holders of the outstanding preferred shares is restricted unless all dividends on the preferred shares have been declared and paid or set apart for payment. Currently, these limitations do not restrict the payment of dividends on common shares or preferred shares.
TD Bank US Holding Company is restricted from paying dividends to its parent, TD US P&C Holdings ULC, in the event that either South Financial Capital Trust 2007-I, South Financial Capital Trust 2007-II or South Financial Capital Trust 2007-III fails to pay quarterly distributions or interest in full to holders of their respective trust securities. Further, in the case of South Financial Capital Trust 2007-II and South Financial Capital Trust 2007-III, all subsidiaries of TD Bank US Holding Company would be restricted from paying dividends in such an event.
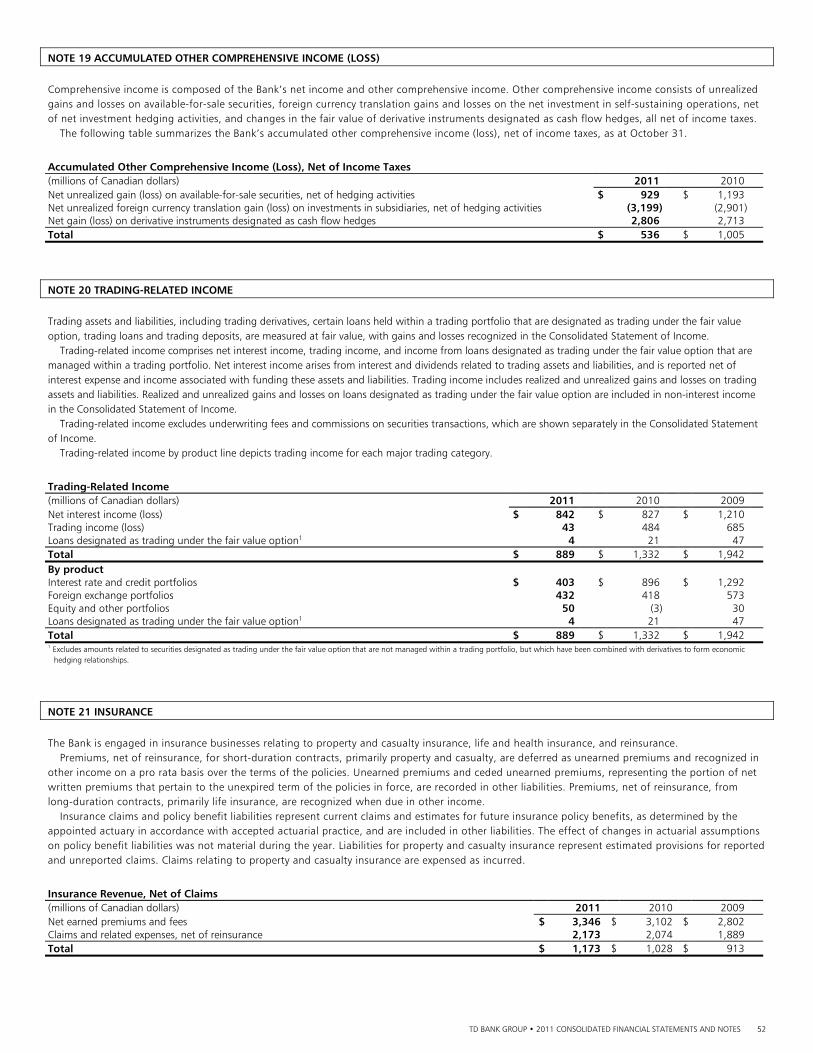
TD BANK GROUP • 2011 CONSOLIDATED FINANCIAL STATEMENTS AND NOTES 52
NOTE 19 ACCUMULATED OTHER COMPREHENSIVE INCOME (LOSS)
Comprehensive income is composed of the Bank’s net income and other comprehensive income. Other comprehensive income consists of unrealized gains and losses on available-for-sale securities, foreign currency translation gains and losses on the net investment in self-sustaining operations, net of net investment hedging activities, and changes in the fair value of derivative instruments designated as cash flow hedges, all net of income taxes. The following table summarizes the Bank’s accumulated other comprehensive income (loss), net of income taxes, as at October 31.
Accumulated Other Comprehensive Income (Loss), Net of Income Taxes (millions of Canadian dollars) 2011 2010 Net unrealized gain (loss) on available-for-sale securities, net of hedging activities $ 929 $ 1,193 Net unrealized foreign currency translation gain (loss) on investments in subsidiaries, net of hedging activities (3,199) (2,901)Net gain (loss) on derivative instruments designated as cash flow hedges 2,806 2,713 Total $ 536 $ 1,005
NOTE 20 TRADING-RELATED INCOME
Trading assets and liabilities, including trading derivatives, certain loans held within a trading portfolio that are designated as trading under the fair value option, trading loans and trading deposits, are measured at fair value, with gains and losses recognized in the Consolidated Statement of Income.
Trading-related income comprises net interest income, trading income, and income from loans designated as trading under the fair value option that are managed within a trading portfolio. Net interest income arises from interest and dividends related to trading assets and liabilities, and is reported net of interest expense and income associated with funding these assets and liabilities. Trading income includes realized and unrealized gains and losses on trading assets and liabilities. Realized and unrealized gains and losses on loans designated as trading under the fair value option are included in non-interest income in the Consolidated Statement of Income.
Trading-related income excludes underwriting fees and commissions on securities transactions, which are shown separately in the Consolidated Statement of Income.
Trading-related income by product line depicts trading income for each major trading category.
Trading-Related Income (millions of Canadian dollars) 2011 2010 2009 Net interest income (loss) $ 842 $ 827 $ 1,210 Trading income (loss) 43 484 685 Loans designated as trading under the fair value option1 4 21 47 Total $ 889 $ 1,332 $ 1,942 By product Interest rate and credit portfolios $ 403 $ 896 $ 1,292 Foreign exchange portfolios 432 418 573 Equity and other portfolios 50 (3) 30 Loans designated as trading under the fair value option1 4 21 47 Total $ 889 $ 1,332 $ 1,942 1 Excludes amounts related to securities designated as trading under the fair value option that are not managed within a trading portfolio, but which have been combined with derivatives to form economic
hedging relationships.
NOTE 21 INSURANCE
The Bank is engaged in insurance businesses relating to property and casualty insurance, life and health insurance, and reinsurance. Premiums, net of reinsurance, for short-duration contracts, primarily property and casualty, are deferred as unearned premiums and recognized in other income on a pro rata basis over the terms of the policies. Unearned premiums and ceded unearned premiums, representing the portion of net written premiums that pertain to the unexpired term of the policies in force, are recorded in other liabilities. Premiums, net of reinsurance, from long-duration contracts, primarily life insurance, are recognized when due in other income. Insurance claims and policy benefit liabilities represent current claims and estimates for future insurance policy benefits, as determined by the appointed actuary in accordance with accepted actuarial practice, and are included in other liabilities. The effect of changes in actuarial assumptions on policy benefit liabilities was not material during the year. Liabilities for property and casualty insurance represent estimated provisions for reported and unreported claims. Claims relating to property and casualty insurance are expensed as incurred.
Insurance Revenue, Net of Claims (millions of Canadian dollars) 2011 2010 2009 Net earned premiums and fees $ 3,346 $ 3,102 $ 2,802 Claims and related expenses, net of reinsurance 2,173 2,074 1,889 Total $ 1,173 $ 1,028 $ 913
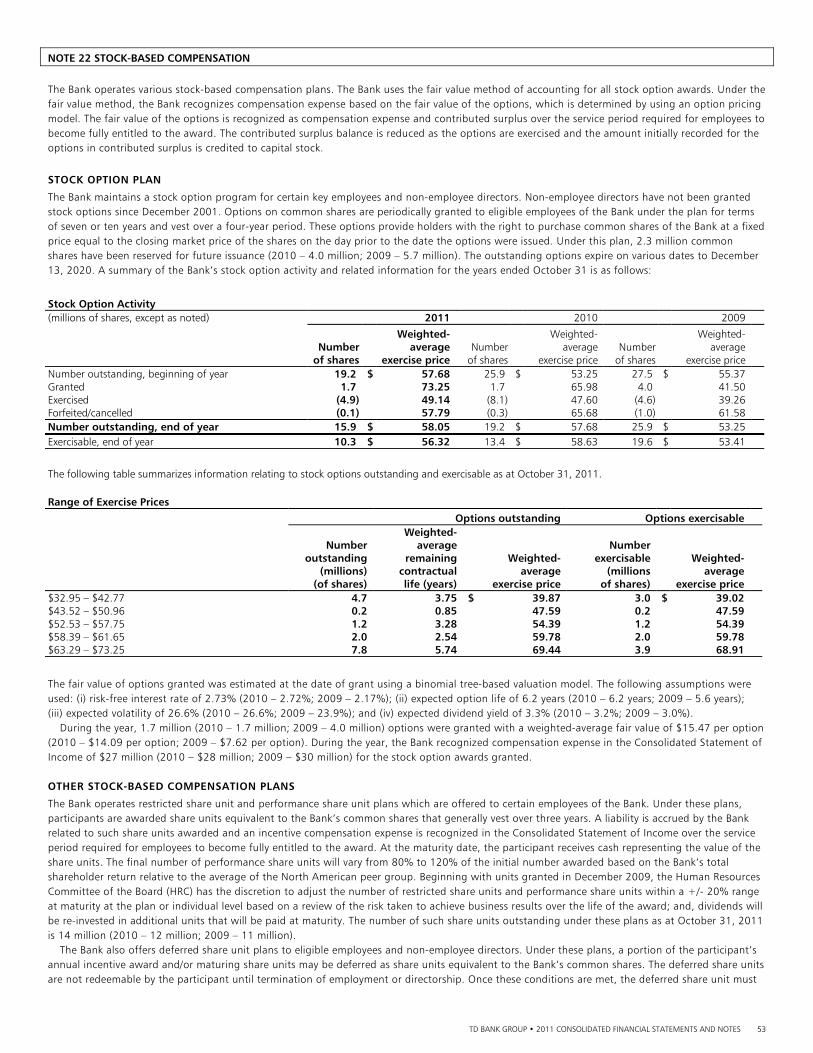
TD BANK GROUP • 2011 CONSOLIDATED FINANCIAL STATEMENTS AND NOTES 53
NOTE 22 STOCK-BASED COMPENSATION
The Bank operates various stock-based compensation plans. The Bank uses the fair value method of accounting for all stock option awards. Under the fair value method, the Bank recognizes compensation expense based on the fair value of the options, which is determined by using an option pricing model. The fair value of the options is recognized as compensation expense and contributed surplus over the service period required for employees to become fully entitled to the award. The contributed surplus balance is reduced as the options are exercised and the amount initially recorded for the options in contributed surplus is credited to capital stock.
STOCK OPTION PLAN
The Bank maintains a stock option program for certain key employees and non-employee directors. Non-employee directors have not been granted stock options since December 2001. Options on common shares are periodically granted to eligible employees of the Bank under the plan for terms of seven or ten years and vest over a four-year period. These options provide holders with the right to purchase common shares of the Bank at a fixed price equal to the closing market price of the shares on the day prior to the date the options were issued. Under this plan, 2.3 million common shares have been reserved for future issuance (2010 – 4.0 million; 2009 – 5.7 million). The outstanding options expire on various dates to December 13, 2020. A summary of the Bank’s stock option activity and related information for the years ended October 31 is as follows:
Stock Option Activity (millions of shares, except as noted) 2011 2010 2009
Weighted- Weighted- Weighted- Number average Number average Number average of shares exercise price of shares exercise price of shares exercise price Number outstanding, beginning of year 19.2 $ 57.68 25.9 $ 53.25 27.5 $ 55.37 Granted 1.7 73.25 1.7 65.98 4.0 41.50 Exercised (4.9) 49.14 (8.1) 47.60 (4.6) 39.26 Forfeited/cancelled (0.1) 57.79 (0.3) 65.68 (1.0) 61.58 Number outstanding, end of year 15.9 $ 58.05 19.2 $ 57.68 25.9 $ 53.25 Exercisable, end of year 10.3 $ 56.32 13.4 $ 58.63 19.6 $ 53.41
The following table summarizes information relating to stock options outstanding and exercisable as at October 31, 2011. Range of Exercise Prices Options outstanding Options exercisable Weighted- Number average Number outstanding remaining Weighted- exercisable Weighted- (millions) contractual average (millions average (of shares) life (years) exercise price of shares) exercise price $32.95 – $42.77 4.7 3.75 $ 39.87 3.0 $ 39.02 $43.52 – $50.96 0.2 0.85 47.59 0.2 47.59 $52.53 – $57.75 1.2 3.28 54.39 1.2 54.39 $58.39 – $61.65 2.0 2.54 59.78 2.0 59.78 $63.29 – $73.25 7.8 5.74 69.44 3.9 68.91
The fair value of options granted was estimated at the date of grant using a binomial tree-based valuation model. The following assumptions were used: (i) risk-free interest rate of 2.73% (2010 – 2.72%; 2009 – 2.17%); (ii) expected option life of 6.2 years (2010 – 6.2 years; 2009 – 5.6 years); (iii) expected volatility of 26.6% (2010 – 26.6%; 2009 – 23.9%); and (iv) expected dividend yield of 3.3% (2010 – 3.2%; 2009 – 3.0%).
During the year, 1.7 million (2010 – 1.7 million; 2009 – 4.0 million) options were granted with a weighted-average fair value of $15.47 per option (2010 – $14.09 per option; 2009 – $7.62 per option). During the year, the Bank recognized compensation expense in the Consolidated Statement of Income of $27 million (2010 – $28 million; 2009 – $30 million) for the stock option awards granted. OTHER STOCK-BASED COMPENSATION PLANS
The Bank operates restricted share unit and performance share unit plans which are offered to certain employees of the Bank. Under these plans, participants are awarded share units equivalent to the Bank’s common shares that generally vest over three years. A liability is accrued by the Bank related to such share units awarded and an incentive compensation expense is recognized in the Consolidated Statement of Income over the service period required for employees to become fully entitled to the award. At the maturity date, the participant receives cash representing the value of the share units. The final number of performance share units will vary from 80% to 120% of the initial number awarded based on the Bank’s total shareholder return relative to the average of the North American peer group. Beginning with units granted in December 2009, the Human Resources Committee of the Board (HRC) has the discretion to adjust the number of restricted share units and performance share units within a +/- 20% range at maturity at the plan or individual level based on a review of the risk taken to achieve business results over the life of the award; and, dividends will be re-invested in additional units that will be paid at maturity. The number of such share units outstanding under these plans as at October 31, 2011 is 14 million (2010 – 12 million; 2009 – 11 million).
The Bank also offers deferred share unit plans to eligible employees and non-employee directors. Under these plans, a portion of the participant’s annual incentive award and/or maturing share units may be deferred as share units equivalent to the Bank’s common shares. The deferred share units are not redeemable by the participant until termination of employment or directorship. Once these conditions are met, the deferred share unit must
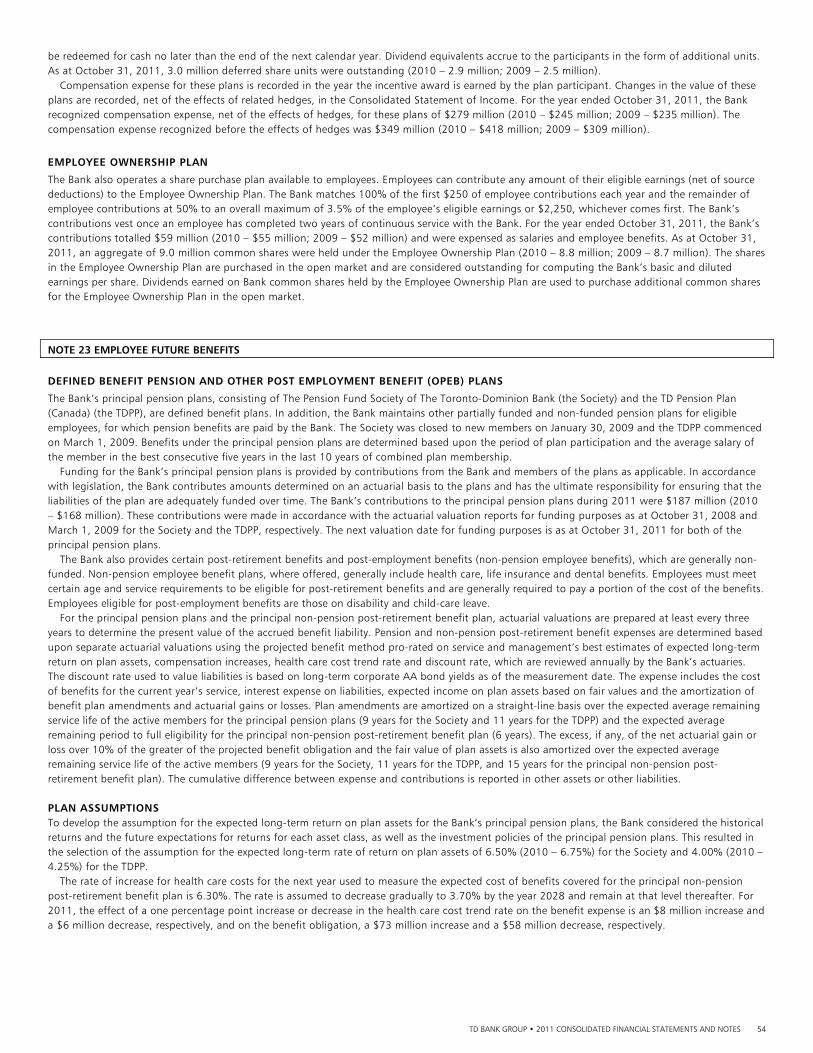
TD BANK GROUP • 2011 CONSOLIDATED FINANCIAL STATEMENTS AND NOTES 54
be redeemed for cash no later than the end of the next calendar year. Dividend equivalents accrue to the participants in the form of additional units. As at October 31, 2011, 3.0 million deferred share units were outstanding (2010 – 2.9 million; 2009 – 2.5 million).
Compensation expense for these plans is recorded in the year the incentive award is earned by the plan participant. Changes in the value of these plans are recorded, net of the effects of related hedges, in the Consolidated Statement of Income. For the year ended October 31, 2011, the Bank recognized compensation expense, net of the effects of hedges, for these plans of $279 million (2010 – $245 million; 2009 – $235 million). The compensation expense recognized before the effects of hedges was $349 million (2010 – $418 million; 2009 – $309 million).
EMPLOYEE OWNERSHIP PLAN
The Bank also operates a share purchase plan available to employees. Employees can contribute any amount of their eligible earnings (net of source deductions) to the Employee Ownership Plan. The Bank matches 100% of the first $250 of employee contributions each year and the remainder of employee contributions at 50% to an overall maximum of 3.5% of the employee’s eligible earnings or $2,250, whichever comes first. The Bank’s contributions vest once an employee has completed two years of continuous service with the Bank. For the year ended October 31, 2011, the Bank’s contributions totalled $59 million (2010 – $55 million; 2009 – $52 million) and were expensed as salaries and employee benefits. As at October 31, 2011, an aggregate of 9.0 million common shares were held under the Employee Ownership Plan (2010 – 8.8 million; 2009 – 8.7 million). The shares in the Employee Ownership Plan are purchased in the open market and are considered outstanding for computing the Bank’s basic and diluted earnings per share. Dividends earned on Bank common shares held by the Employee Ownership Plan are used to purchase additional common shares for the Employee Ownership Plan in the open market.
NOTE 23 EMPLOYEE FUTURE BENEFITS
DEFINED BENEFIT PENSION AND OTHER POST EMPLOYMENT BENEFIT (OPEB) PLANS
The Bank’s principal pension plans, consisting of The Pension Fund Society of The Toronto-Dominion Bank (the Society) and the TD Pension Plan (Canada) (the TDPP), are defined benefit plans. In addition, the Bank maintains other partially funded and non-funded pension plans for eligible employees, for which pension benefits are paid by the Bank. The Society was closed to new members on January 30, 2009 and the TDPP commenced on March 1, 2009. Benefits under the principal pension plans are determined based upon the period of plan participation and the average salary of the member in the best consecutive five years in the last 10 years of combined plan membership. Funding for the Bank’s principal pension plans is provided by contributions from the Bank and members of the plans as applicable. In accordance with legislation, the Bank contributes amounts determined on an actuarial basis to the plans and has the ultimate responsibility for ensuring that the liabilities of the plan are adequately funded over time. The Bank’s contributions to the principal pension plans during 2011 were $187 million (2010 – $168 million). These contributions were made in accordance with the actuarial valuation reports for funding purposes as at October 31, 2008 and March 1, 2009 for the Society and the TDPP, respectively. The next valuation date for funding purposes is as at October 31, 2011 for both of the principal pension plans. The Bank also provides certain post-retirement benefits and post-employment benefits (non-pension employee benefits), which are generally non-funded. Non-pension employee benefit plans, where offered, generally include health care, life insurance and dental benefits. Employees must meet certain age and service requirements to be eligible for post-retirement benefits and are generally required to pay a portion of the cost of the benefits. Employees eligible for post-employment benefits are those on disability and child-care leave. For the principal pension plans and the principal non-pension post-retirement benefit plan, actuarial valuations are prepared at least every three years to determine the present value of the accrued benefit liability. Pension and non-pension post-retirement benefit expenses are determined based upon separate actuarial valuations using the projected benefit method pro-rated on service and management’s best estimates of expected long-term return on plan assets, compensation increases, health care cost trend rate and discount rate, which are reviewed annually by the Bank’s actuaries. The discount rate used to value liabilities is based on long-term corporate AA bond yields as of the measurement date. The expense includes the cost of benefits for the current year’s service, interest expense on liabilities, expected income on plan assets based on fair values and the amortization of benefit plan amendments and actuarial gains or losses. Plan amendments are amortized on a straight-line basis over the expected average remaining service life of the active members for the principal pension plans (9 years for the Society and 11 years for the TDPP) and the expected average remaining period to full eligibility for the principal non-pension post-retirement benefit plan (6 years). The excess, if any, of the net actuarial gain or loss over 10% of the greater of the projected benefit obligation and the fair value of plan assets is also amortized over the expected average remaining service life of the active members (9 years for the Society, 11 years for the TDPP, and 15 years for the principal non-pension post-retirement benefit plan). The cumulative difference between expense and contributions is reported in other assets or other liabilities. PLAN ASSUMPTIONS To develop the assumption for the expected long-term return on plan assets for the Bank’s principal pension plans, the Bank considered the historical returns and the future expectations for returns for each asset class, as well as the investment policies of the principal pension plans. This resulted in the selection of the assumption for the expected long-term rate of return on plan assets of 6.50% (2010 – 6.75%) for the Society and 4.00% (2010 – 4.25%) for the TDPP. The rate of increase for health care costs for the next year used to measure the expected cost of benefits covered for the principal non-pension post-retirement benefit plan is 6.30%. The rate is assumed to decrease gradually to 3.70% by the year 2028 and remain at that level thereafter. For 2011, the effect of a one percentage point increase or decrease in the health care cost trend rate on the benefit expense is an $8 million increase and a $6 million decrease, respectively, and on the benefit obligation, a $73 million increase and a $58 million decrease, respectively.
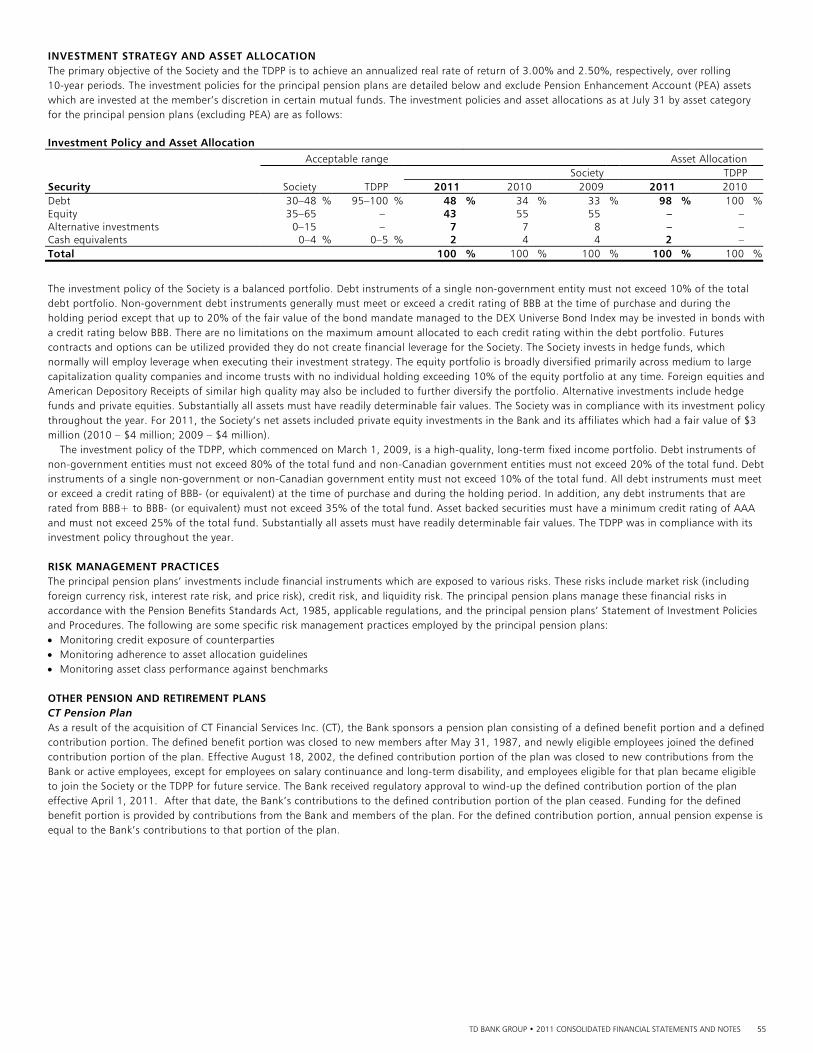
TD BANK GROUP • 2011 CONSOLIDATED FINANCIAL STATEMENTS AND NOTES 55
INVESTMENT STRATEGY AND ASSET ALLOCATION The primary objective of the Society and the TDPP is to achieve an annualized real rate of return of 3.00% and 2.50%, respectively, over rolling 10-year periods. The investment policies for the principal pension plans are detailed below and exclude Pension Enhancement Account (PEA) assets which are invested at the member’s discretion in certain mutual funds. The investment policies and asset allocations as at July 31 by asset category for the principal pension plans (excluding PEA) are as follows: Investment Policy and Asset Allocation Acceptable range Asset Allocation Society TDPPSecurity Society TDPP 2011 2010 2009 2011 2010Debt 30–48 % 95–100 % 48 % 34 % 33 % 98 % 100 %Equity 35–65 – 43 55 55 – – Alternative investments 0–15 – 7 7 8 – – Cash equivalents 0–4 % 0–5 % 2 4 4 2 – Total 100 % 100 % 100 % 100 % 100 %
The investment policy of the Society is a balanced portfolio. Debt instruments of a single non-government entity must not exceed 10% of the total debt portfolio. Non-government debt instruments generally must meet or exceed a credit rating of BBB at the time of purchase and during the holding period except that up to 20% of the fair value of the bond mandate managed to the DEX Universe Bond Index may be invested in bonds with a credit rating below BBB. There are no limitations on the maximum amount allocated to each credit rating within the debt portfolio. Futures contracts and options can be utilized provided they do not create financial leverage for the Society. The Society invests in hedge funds, which normally will employ leverage when executing their investment strategy. The equity portfolio is broadly diversified primarily across medium to large capitalization quality companies and income trusts with no individual holding exceeding 10% of the equity portfolio at any time. Foreign equities and American Depository Receipts of similar high quality may also be included to further diversify the portfolio. Alternative investments include hedge funds and private equities. Substantially all assets must have readily determinable fair values. The Society was in compliance with its investment policy throughout the year. For 2011, the Society’s net assets included private equity investments in the Bank and its affiliates which had a fair value of $3 million (2010 – $4 million; 2009 – $4 million). The investment policy of the TDPP, which commenced on March 1, 2009, is a high-quality, long-term fixed income portfolio. Debt instruments of non-government entities must not exceed 80% of the total fund and non-Canadian government entities must not exceed 20% of the total fund. Debt instruments of a single non-government or non-Canadian government entity must not exceed 10% of the total fund. All debt instruments must meet or exceed a credit rating of BBB- (or equivalent) at the time of purchase and during the holding period. In addition, any debt instruments that are rated from BBB+ to BBB- (or equivalent) must not exceed 35% of the total fund. Asset backed securities must have a minimum credit rating of AAA and must not exceed 25% of the total fund. Substantially all assets must have readily determinable fair values. The TDPP was in compliance with its investment policy throughout the year. RISK MANAGEMENT PRACTICES The principal pension plans’ investments include financial instruments which are exposed to various risks. These risks include market risk (including foreign currency risk, interest rate risk, and price risk), credit risk, and liquidity risk. The principal pension plans manage these financial risks in accordance with the Pension Benefits Standards Act, 1985, applicable regulations, and the principal pension plans’ Statement of Investment Policies and Procedures. The following are some specific risk management practices employed by the principal pension plans: Monitoring credit exposure of counterparties Monitoring adherence to asset allocation guidelines Monitoring asset class performance against benchmarks OTHER PENSION AND RETIREMENT PLANS CT Pension Plan As a result of the acquisition of CT Financial Services Inc. (CT), the Bank sponsors a pension plan consisting of a defined benefit portion and a defined contribution portion. The defined benefit portion was closed to new members after May 31, 1987, and newly eligible employees joined the defined contribution portion of the plan. Effective August 18, 2002, the defined contribution portion of the plan was closed to new contributions from the Bank or active employees, except for employees on salary continuance and long-term disability, and employees eligible for that plan became eligible to join the Society or the TDPP for future service. The Bank received regulatory approval to wind-up the defined contribution portion of the plan effective April 1, 2011. After that date, the Bank’s contributions to the defined contribution portion of the plan ceased. Funding for the defined benefit portion is provided by contributions from the Bank and members of the plan. For the defined contribution portion, annual pension expense is equal to the Bank’s contributions to that portion of the plan.
TD BANK GROUP • 2011 CONSOLIDATED FINANCIAL STATEMENTS AND NOTES 56
TD Bank, N.A. (which includes TD Banknorth and Commerce) Retirement Plans TD Banknorth has a closed non-contributory defined benefit retirement plan covering most permanent employees. Supplemental retirement plans were adopted for certain key officers and limited post-retirement benefit programs provide medical coverage and life insurance benefits to a closed group of employees and directors who meet minimum age and service requirements. Effective December 31, 2008, benefits under the retirement and supplemental retirement plans were frozen. In addition, TD Bank, N.A. and its subsidiaries maintain a defined contribution 401(k) plan covering all employees. Effective January 1, 2009 the plan was amended to include a core contribution from TD Bank, N.A. for all employees and a transition contribution for certain employees. The additional amount contributed to the plan by TD Bank, N.A. for fiscal 2011 was $34 million (2010 – $34 million; 2009 – $31 million). In addition, on an ongoing basis, TD Bank, N.A., makes matching contributions to the 401(k) plan. The amount of the matching contribution for fiscal 2011 was $29 million (2010 – $28 million; 2009 – $18 million). For the defined contribution plan, annual pension expense is equal to the Bank’s contributions to the plan. TD Auto Finance (which includes Chrysler Financial) Retirement Plans TD Auto Finance has both contributory and non-contributory defined benefit retirement plans covering most permanent employees. The non-contributory pension plan provides benefits based on a fixed rate for each year of service. The contributory plan provides benefits to salaried employees based on the employee’s cumulative contributions, years of service during which employee contributions were made, and the employee’s average salary during the consecutive five years in which the employee’s salary was highest in the 15 years preceding retirement. In addition, TD Auto Finance provides limited post-retirement benefit programs, including medical coverage and life insurance benefits to certain employees who meet minimum age and service requirements. As a result of the acquisition of Chrysler Financial on April 1, 2011, obligations assumed and assets acquired related to the Chrysler Financial Services Americas LLC retirement plans are now included in the table below. Supplemental Employee Retirement Plans Supplemental employee retirement plans are partially funded by the Bank for eligible employees.
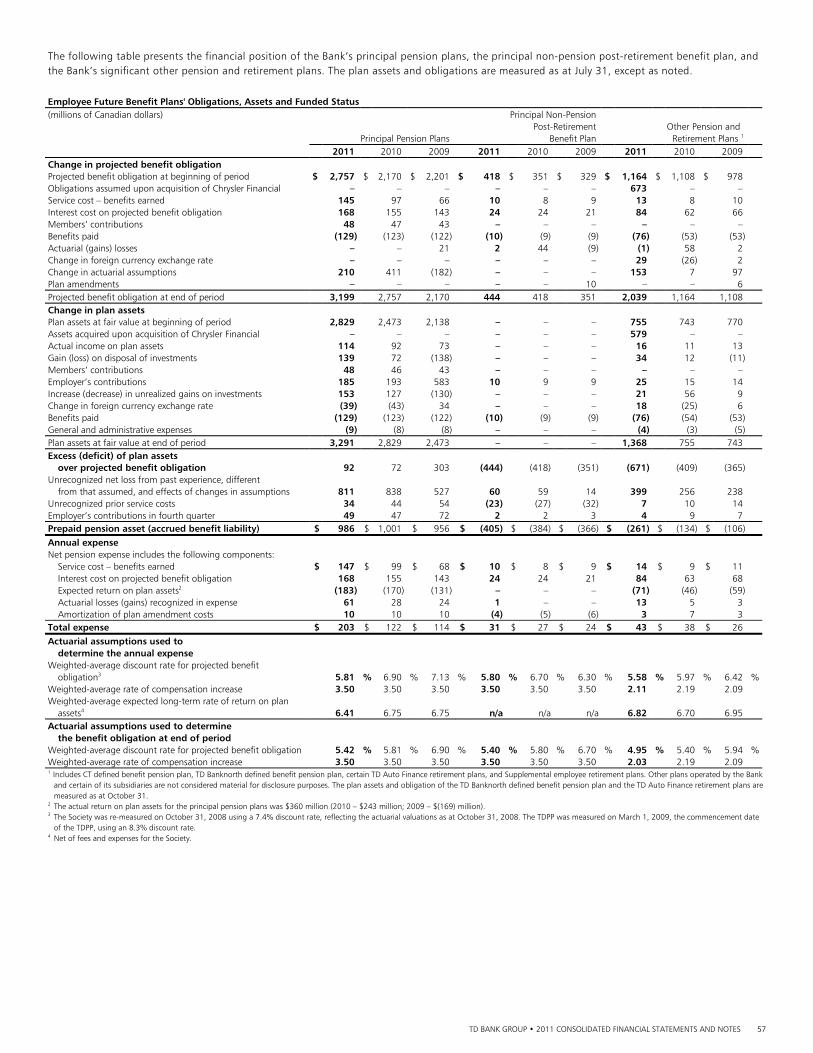
TD BANK GROUP • 2011 CONSOLIDATED FINANCIAL STATEMENTS AND NOTES 57
The following table presents the financial position of the Bank’s principal pension plans, the principal non-pension post-retirement benefit plan, and the Bank’s significant other pension and retirement plans. The plan assets and obligations are measured as at July 31, except as noted.
Employee Future Benefit Plans' Obligations, Assets and Funded Status
(millions of Canadian dollars) Principal Non-Pension
Post-Retirement Other Pension and
Principal Pension Plans Benefit Plan Retirement Plans 1
2011 2010 2009 2011 2010 2009 2011 2010 2009
Change in projected benefit obligation
Projected benefit obligation at beginning of period $ 2,757 $ 2,170 $ 2,201 $ 418 $ 351 $ 329 $ 1,164 $ 1,108 $ 978
Obligations assumed upon acquisition of Chrysler Financial – – – – – – 673 – –
Service cost – benefits earned 145 97 66 10 8 9 13 8 10
Interest cost on projected benefit obligation 168 155 143 24 24 21 84 62 66
Members’ contributions 48 47 43 – – – – – –
Benefits paid (129) (123) (122) (10) (9) (9) (76) (53) (53)
Actuarial (gains) losses – – 21 2 44 (9) (1) 58 2
Change in foreign currency exchange rate – – – – – – 29 (26) 2
Change in actuarial assumptions 210 411 (182) – – – 153 7 97
Plan amendments – – – – – 10 – – 6
Projected benefit obligation at end of period 3,199 2,757 2,170 444 418 351 2,039 1,164 1,108
Change in plan assets
Plan assets at fair value at beginning of period 2,829 2,473 2,138 – – – 755 743 770
Assets acquired upon acquisition of Chrysler Financial – – – – – – 579 – –
Actual income on plan assets 114 92 73 – – – 16 11 13
Gain (loss) on disposal of investments 139 72 (138) – – – 34 12 (11)
Members’ contributions 48 46 43 – – – – – –
Employer’s contributions 185 193 583 10 9 9 25 15 14
Increase (decrease) in unrealized gains on investments 153 127 (130) – – – 21 56 9
Change in foreign currency exchange rate (39) (43) 34 – – – 18 (25) 6
Benefits paid (129) (123) (122) (10) (9) (9) (76) (54) (53)
General and administrative expenses (9) (8) (8) – – – (4) (3) (5)
Plan assets at fair value at end of period 3,291 2,829 2,473 – – – 1,368 755 743
Excess (deficit) of plan assets
over projected benefit obligation 92 72 303 (444) (418) (351) (671) (409) (365)
Unrecognized net loss from past experience, different
from that assumed, and effects of changes in assumptions 811 838 527 60 59 14 399 256 238
Unrecognized prior service costs 34 44 54 (23) (27) (32) 7 10 14
Employer’s contributions in fourth quarter 49 47 72 2 2 3 4 9 7
Prepaid pension asset (accrued benefit liability) $ 986 $ 1,001 $ 956 $ (405) $ (384) $ (366) $ (261) $ (134) $ (106)
Annual expense
Net pension expense includes the following components:
Service cost – benefits earned $ 147 $ 99 $ 68 $ 10 $ 8 $ 9 $ 14 $ 9 $ 11
Interest cost on projected benefit obligation 168 155 143 24 24 21 84 63 68
Expected return on plan assets2 (183) (170) (131) – – – (71) (46) (59)
Actuarial losses (gains) recognized in expense 61 28 24 1 – – 13 5 3
Amortization of plan amendment costs 10 10 10 (4) (5) (6) 3 7 3
Total expense $ 203 $ 122 $ 114 $ 31 $ 27 $ 24 $ 43 $ 38 $ 26
Actuarial assumptions used to
determine the annual expense
Weighted-average discount rate for projected benefit
obligation3 5.81 % 6.90 % 7.13 % 5.80 % 6.70 % 6.30 % 5.58 % 5.97 % 6.42 %
Weighted-average rate of compensation increase 3.50 3.50 3.50 3.50 3.50 3.50 2.11 2.19 2.09
Weighted-average expected long-term rate of return on plan
assets4 6.41 6.75 6.75 n/a n/a n/a 6.82 6.70 6.95
Actuarial assumptions used to determine
the benefit obligation at end of period
Weighted-average discount rate for projected benefit obligation 5.42 % 5.81 % 6.90 % 5.40 % 5.80 % 6.70 % 4.95 % 5.40 % 5.94 %
Weighted-average rate of compensation increase 3.50 3.50 3.50 3.50 3.50 3.50 2.03 2.19 2.09
1 Includes CT defined benefit pension plan, TD Banknorth defined benefit pension plan, certain TD Auto Finance retirement plans, and Supplemental employee retirement plans. Other plans operated by the Bank and certain of its subsidiaries are not considered material for disclosure purposes. The plan assets and obligation of the TD Banknorth defined benefit pension plan and the TD Auto Finance retirement plans are measured as at October 31.
2 The actual return on plan assets for the principal pension plans was $360 million (2010 – $243 million; 2009 – $(169) million). 3 The Society was re-measured on October 31, 2008 using a 7.4% discount rate, reflecting the actuarial valuations as at October 31, 2008. The TDPP was measured on March 1, 2009, the commencement date
of the TDPP, using an 8.3% discount rate. 4 Net of fees and expenses for the Society.
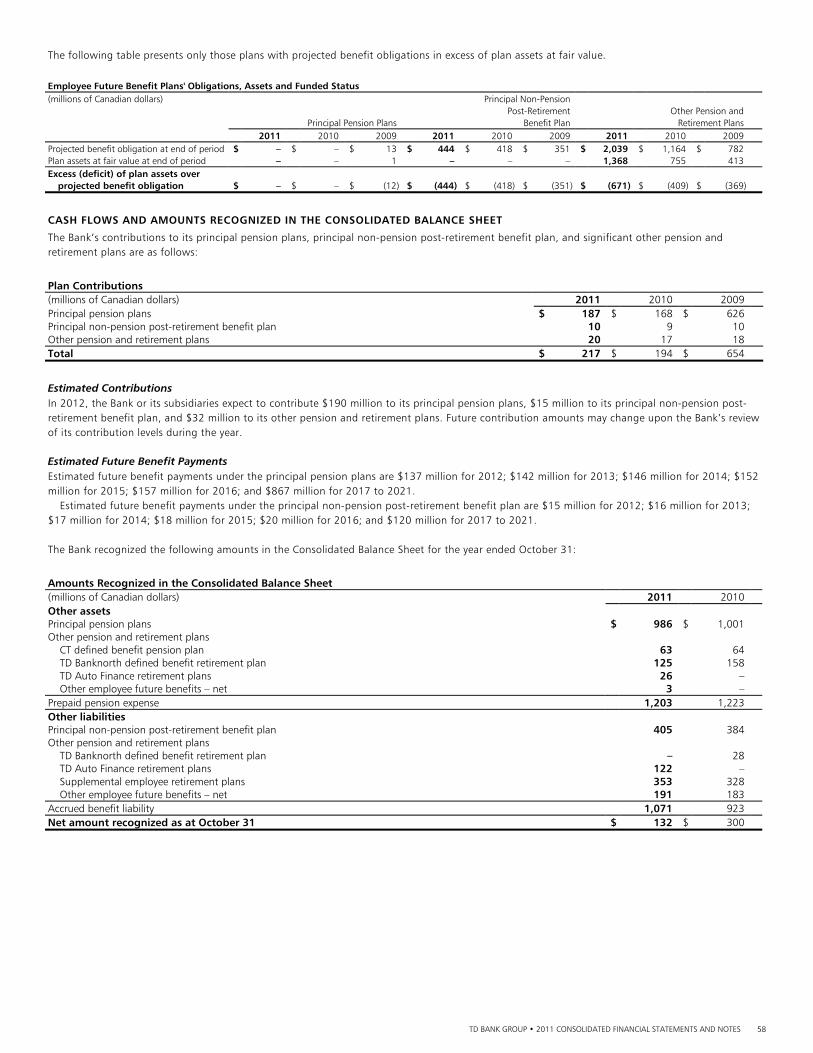
TD BANK GROUP • 2011 CONSOLIDATED FINANCIAL STATEMENTS AND NOTES 58
The following table presents only those plans with projected benefit obligations in excess of plan assets at fair value.
Employee Future Benefit Plans' Obligations, Assets and Funded Status (millions of Canadian dollars) Principal Non-Pension Post-Retirement Other Pension and Principal Pension Plans Benefit Plan Retirement Plans 2011 2010 2009 2011 2010 2009 2011 2010 2009 Projected benefit obligation at end of period $ – $ – $ 13 $ 444 $ 418 $ 351 $ 2,039 $ 1,164 $ 782 Plan assets at fair value at end of period – – 1 – – – 1,368 755 413 Excess (deficit) of plan assets over projected benefit obligation $ – $ – $ (12) $ (444) $ (418) $ (351) $ (671) $ (409) $ (369)
CASH FLOWS AND AMOUNTS RECOGNIZED IN THE CONSOLIDATED BALANCE SHEET
The Bank’s contributions to its principal pension plans, principal non-pension post-retirement benefit plan, and significant other pension and retirement plans are as follows:
Plan Contributions (millions of Canadian dollars) 2011 2010 2009 Principal pension plans $ 187 $ 168 $ 626 Principal non-pension post-retirement benefit plan 10 9 10 Other pension and retirement plans 20 17 18 Total $ 217 $ 194 $ 654
Estimated Contributions In 2012, the Bank or its subsidiaries expect to contribute $190 million to its principal pension plans, $15 million to its principal non-pension post-retirement benefit plan, and $32 million to its other pension and retirement plans. Future contribution amounts may change upon the Bank’s review of its contribution levels during the year. Estimated Future Benefit Payments Estimated future benefit payments under the principal pension plans are $137 million for 2012; $142 million for 2013; $146 million for 2014; $152 million for 2015; $157 million for 2016; and $867 million for 2017 to 2021. Estimated future benefit payments under the principal non-pension post-retirement benefit plan are $15 million for 2012; $16 million for 2013; $17 million for 2014; $18 million for 2015; $20 million for 2016; and $120 million for 2017 to 2021. The Bank recognized the following amounts in the Consolidated Balance Sheet for the year ended October 31:
Amounts Recognized in the Consolidated Balance Sheet (millions of Canadian dollars) 2011 2010 Other assets Principal pension plans $ 986 $ 1,001 Other pension and retirement plans CT defined benefit pension plan 63 64 TD Banknorth defined benefit retirement plan 125 158 TD Auto Finance retirement plans 26 – Other employee future benefits – net 3 – Prepaid pension expense 1,203 1,223 Other liabilities Principal non-pension post-retirement benefit plan 405 384 Other pension and retirement plans TD Banknorth defined benefit retirement plan – 28 TD Auto Finance retirement plans 122 – Supplemental employee retirement plans 353 328 Other employee future benefits – net 191 183 Accrued benefit liability 1,071 923 Net amount recognized as at October 31 $ 132 $ 300
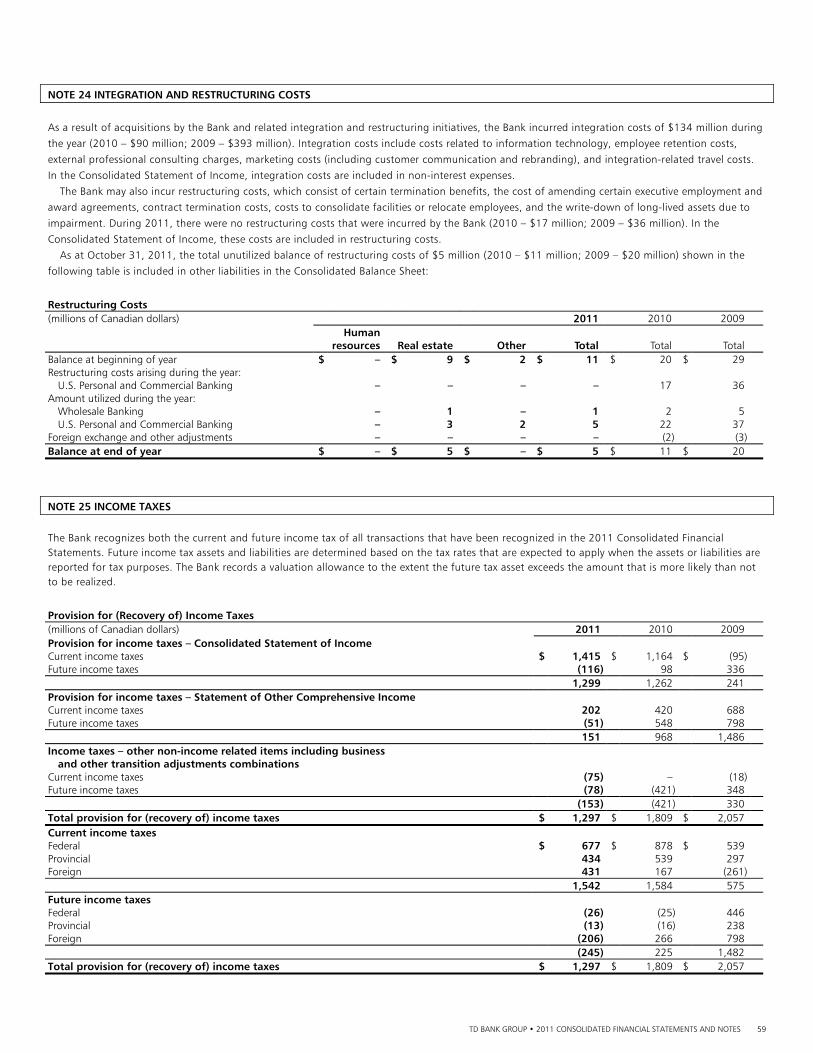
TD BANK GROUP • 2011 CONSOLIDATED FINANCIAL STATEMENTS AND NOTES 59
NOTE 24 INTEGRATION AND RESTRUCTURING COSTS
As a result of acquisitions by the Bank and related integration and restructuring initiatives, the Bank incurred integration costs of $134 million during
the year (2010 – $90 million; 2009 – $393 million). Integration costs include costs related to information technology, employee retention costs,
external professional consulting charges, marketing costs (including customer communication and rebranding), and integration-related travel costs.
In the Consolidated Statement of Income, integration costs are included in non-interest expenses.
The Bank may also incur restructuring costs, which consist of certain termination benefits, the cost of amending certain executive employment and
award agreements, contract termination costs, costs to consolidate facilities or relocate employees, and the write-down of long-lived assets due to
impairment. During 2011, there were no restructuring costs that were incurred by the Bank (2010 – $17 million; 2009 – $36 million). In the
Consolidated Statement of Income, these costs are included in restructuring costs.
As at October 31, 2011, the total unutilized balance of restructuring costs of $5 million (2010 – $11 million; 2009 – $20 million) shown in the
following table is included in other liabilities in the Consolidated Balance Sheet:
Restructuring Costs (millions of Canadian dollars) 2011 2010 2009 Human resources Real estate Other Total Total Total Balance at beginning of year $ – $ 9 $ 2 $ 11 $ 20 $ 29 Restructuring costs arising during the year: U.S. Personal and Commercial Banking – – – – 17 36 Amount utilized during the year: Wholesale Banking – 1 – 1 2 5 U.S. Personal and Commercial Banking – 3 2 5 22 37 Foreign exchange and other adjustments – – – – (2) (3)Balance at end of year $ – $ 5 $ – $ 5 $ 11 $ 20
NOTE 25 INCOME TAXES
The Bank recognizes both the current and future income tax of all transactions that have been recognized in the 2011 Consolidated Financial Statements. Future income tax assets and liabilities are determined based on the tax rates that are expected to apply when the assets or liabilities are reported for tax purposes. The Bank records a valuation allowance to the extent the future tax asset exceeds the amount that is more likely than not to be realized.
Provision for (Recovery of) Income Taxes (millions of Canadian dollars) 2011 2010 2009 Provision for income taxes – Consolidated Statement of Income Current income taxes $ 1,415 $ 1,164 $ (95)Future income taxes (116) 98 336 1,299 1,262 241 Provision for income taxes – Statement of Other Comprehensive Income Current income taxes 202 420 688 Future income taxes (51) 548 798 151 968 1,486 Income taxes – other non-income related items including business and other transition adjustments combinations Current income taxes (75) – (18)Future income taxes (78) (421) 348 (153) (421) 330 Total provision for (recovery of) income taxes $ 1,297 $ 1,809 $ 2,057 Current income taxes Federal $ 677 $ 878 $ 539 Provincial 434 539 297 Foreign 431 167 (261) 1,542 1,584 575 Future income taxes Federal (26) (25) 446 Provincial (13) (16) 238 Foreign (206) 266 798 (245) 225 1,482 Total provision for (recovery of) income taxes $ 1,297 $ 1,809 $ 2,057
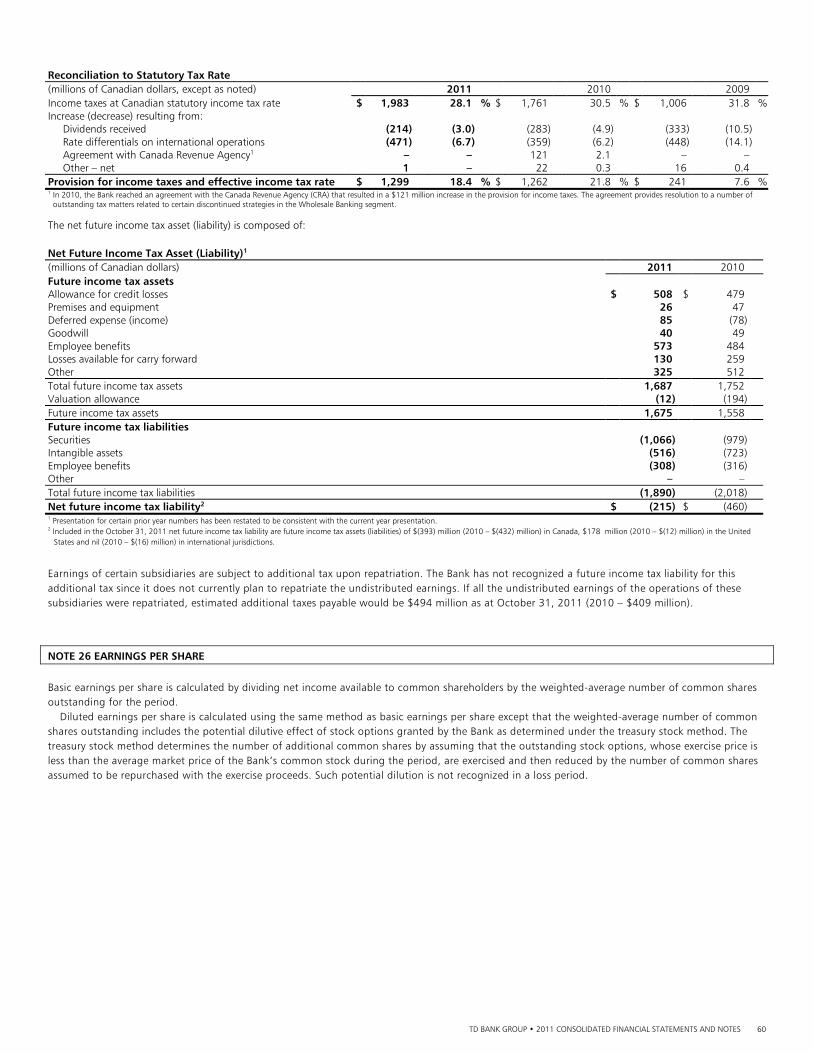
TD BANK GROUP • 2011 CONSOLIDATED FINANCIAL STATEMENTS AND NOTES 60
Reconciliation to Statutory Tax Rate (millions of Canadian dollars, except as noted) 2011 2010 2009 Income taxes at Canadian statutory income tax rate $ 1,983 28.1 % $ 1,761 30.5 % $ 1,006 31.8 %Increase (decrease) resulting from: Dividends received (214) (3.0) (283) (4.9) (333) (10.5) Rate differentials on international operations (471) (6.7) (359) (6.2) (448) (14.1) Agreement with Canada Revenue Agency1 – – 121 2.1 – – Other – net 1 – 22 0.3 16 0.4 Provision for income taxes and effective income tax rate $ 1,299 18.4 % $ 1,262 21.8 % $ 241 7.6 %1 In 2010, the Bank reached an agreement with the Canada Revenue Agency (CRA) that resulted in a $121 million increase in the provision for income taxes. The agreement provides resolution to a number of
outstanding tax matters related to certain discontinued strategies in the Wholesale Banking segment.
The net future income tax asset (liability) is composed of: Net Future Income Tax Asset (Liability)1 (millions of Canadian dollars) 2011 2010 Future income tax assets Allowance for credit losses $ 508 $ 479 Premises and equipment 26 47 Deferred expense (income) 85 (78)Goodwill 40 49 Employee benefits 573 484 Losses available for carry forward 130 259 Other 325 512 Total future income tax assets 1,687 1,752 Valuation allowance (12) (194)Future income tax assets 1,675 1,558 Future income tax liabilities Securities (1,066) (979)Intangible assets (516) (723)Employee benefits (308) (316)Other – – Total future income tax liabilities (1,890) (2,018)Net future income tax liability2 $ (215) $ (460)1 Presentation for certain prior year numbers has been restated to be consistent with the current year presentation.
2 Included in the October 31, 2011 net future income tax liability are future income tax assets (liabilities) of $(393) million (2010 – $(432) million) in Canada, $178 million (2010 – $(12) million) in the United States and nil (2010 – $(16) million) in international jurisdictions.
Earnings of certain subsidiaries are subject to additional tax upon repatriation. The Bank has not recognized a future income tax liability for this additional tax since it does not currently plan to repatriate the undistributed earnings. If all the undistributed earnings of the operations of these subsidiaries were repatriated, estimated additional taxes payable would be $494 million as at October 31, 2011 (2010 – $409 million).
NOTE 26 EARNINGS PER SHARE
Basic earnings per share is calculated by dividing net income available to common shareholders by the weighted-average number of common shares outstanding for the period. Diluted earnings per share is calculated using the same method as basic earnings per share except that the weighted-average number of common shares outstanding includes the potential dilutive effect of stock options granted by the Bank as determined under the treasury stock method. The treasury stock method determines the number of additional common shares by assuming that the outstanding stock options, whose exercise price is less than the average market price of the Bank’s common stock during the period, are exercised and then reduced by the number of common shares assumed to be repurchased with the exercise proceeds. Such potential dilution is not recognized in a loss period.
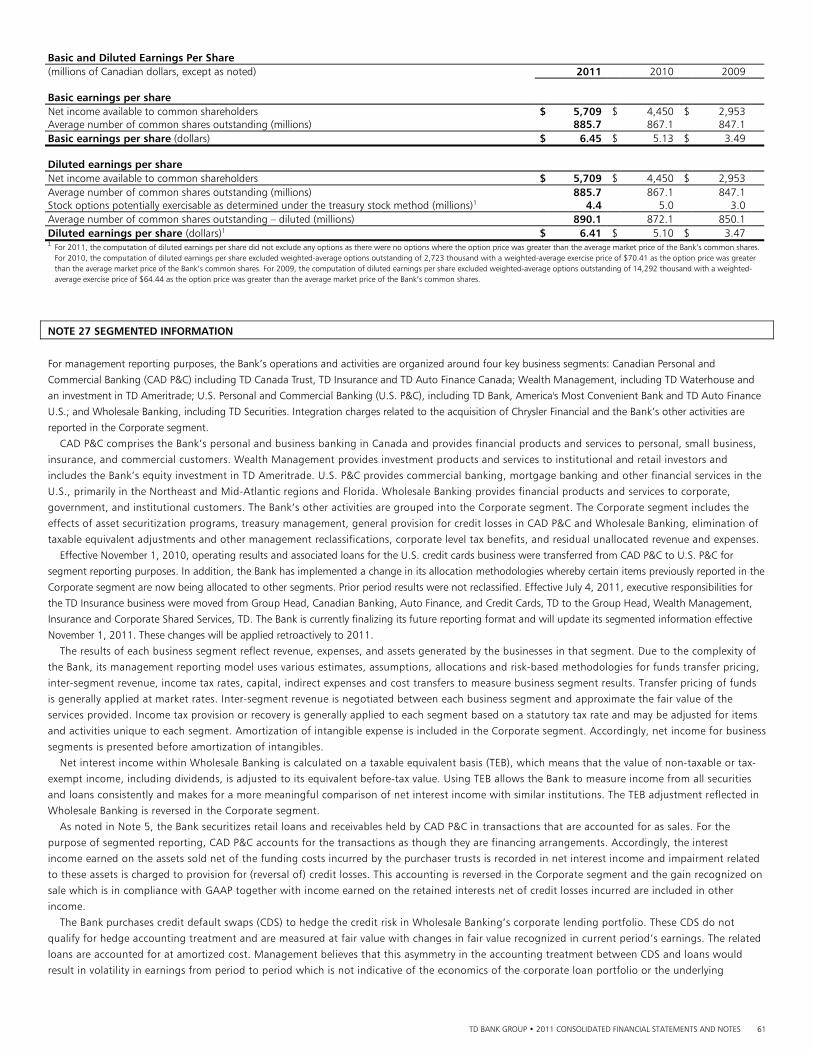
TD BANK GROUP • 2011 CONSOLIDATED FINANCIAL STATEMENTS AND NOTES 61
Basic and Diluted Earnings Per Share (millions of Canadian dollars, except as noted) 2011 2010 2009 Basic earnings per share Net income available to common shareholders $ 5,709 $ 4,450 $ 2,953 Average number of common shares outstanding (millions) 885.7 867.1 847.1 Basic earnings per share (dollars) $ 6.45 $ 5.13 $ 3.49 Diluted earnings per share Net income available to common shareholders $ 5,709 $ 4,450 $ 2,953 Average number of common shares outstanding (millions) 885.7 867.1 847.1 Stock options potentially exercisable as determined under the treasury stock method (millions)1 4.4 5.0 3.0 Average number of common shares outstanding – diluted (millions) 890.1 872.1 850.1 Diluted earnings per share (dollars)1 $ 6.41 $ 5.10 $ 3.47 1 For 2011, the computation of diluted earnings per share did not exclude any options as there were no options where the option price was greater than the average market price of the Bank’s common shares.
For 2010, the computation of diluted earnings per share excluded weighted-average options outstanding of 2,723 thousand with a weighted-average exercise price of $70.41 as the option price was greater than the average market price of the Bank’s common shares. For 2009, the computation of diluted earnings per share excluded weighted-average options outstanding of 14,292 thousand with a weighted-average exercise price of $64.44 as the option price was greater than the average market price of the Bank’s common shares.
NOTE 27 SEGMENTED INFORMATION
For management reporting purposes, the Bank’s operations and activities are organized around four key business segments: Canadian Personal and
Commercial Banking (CAD P&C) including TD Canada Trust, TD Insurance and TD Auto Finance Canada; Wealth Management, including TD Waterhouse and
an investment in TD Ameritrade; U.S. Personal and Commercial Banking (U.S. P&C), including TD Bank, America's Most Convenient Bank and TD Auto Finance
U.S.; and Wholesale Banking, including TD Securities. Integration charges related to the acquisition of Chrysler Financial and the Bank’s other activities are
reported in the Corporate segment.
CAD P&C comprises the Bank’s personal and business banking in Canada and provides financial products and services to personal, small business,
insurance, and commercial customers. Wealth Management provides investment products and services to institutional and retail investors and
includes the Bank’s equity investment in TD Ameritrade. U.S. P&C provides commercial banking, mortgage banking and other financial services in the
U.S., primarily in the Northeast and Mid-Atlantic regions and Florida. Wholesale Banking provides financial products and services to corporate,
government, and institutional customers. The Bank’s other activities are grouped into the Corporate segment. The Corporate segment includes the
effects of asset securitization programs, treasury management, general provision for credit losses in CAD P&C and Wholesale Banking, elimination of
taxable equivalent adjustments and other management reclassifications, corporate level tax benefits, and residual unallocated revenue and expenses.
Effective November 1, 2010, operating results and associated loans for the U.S. credit cards business were transferred from CAD P&C to U.S. P&C for
segment reporting purposes. In addition, the Bank has implemented a change in its allocation methodologies whereby certain items previously reported in the
Corporate segment are now being allocated to other segments. Prior period results were not reclassified. Effective July 4, 2011, executive responsibilities for
the TD Insurance business were moved from Group Head, Canadian Banking, Auto Finance, and Credit Cards, TD to the Group Head, Wealth Management,
Insurance and Corporate Shared Services, TD. The Bank is currently finalizing its future reporting format and will update its segmented information effective
November 1, 2011. These changes will be applied retroactively to 2011.
The results of each business segment reflect revenue, expenses, and assets generated by the businesses in that segment. Due to the complexity of
the Bank, its management reporting model uses various estimates, assumptions, allocations and risk-based methodologies for funds transfer pricing,
inter-segment revenue, income tax rates, capital, indirect expenses and cost transfers to measure business segment results. Transfer pricing of funds
is generally applied at market rates. Inter-segment revenue is negotiated between each business segment and approximate the fair value of the
services provided. Income tax provision or recovery is generally applied to each segment based on a statutory tax rate and may be adjusted for items
and activities unique to each segment. Amortization of intangible expense is included in the Corporate segment. Accordingly, net income for business
segments is presented before amortization of intangibles.
Net interest income within Wholesale Banking is calculated on a taxable equivalent basis (TEB), which means that the value of non-taxable or tax-
exempt income, including dividends, is adjusted to its equivalent before-tax value. Using TEB allows the Bank to measure income from all securities
and loans consistently and makes for a more meaningful comparison of net interest income with similar institutions. The TEB adjustment reflected in
Wholesale Banking is reversed in the Corporate segment.
As noted in Note 5, the Bank securitizes retail loans and receivables held by CAD P&C in transactions that are accounted for as sales. For the
purpose of segmented reporting, CAD P&C accounts for the transactions as though they are financing arrangements. Accordingly, the interest
income earned on the assets sold net of the funding costs incurred by the purchaser trusts is recorded in net interest income and impairment related
to these assets is charged to provision for (reversal of) credit losses. This accounting is reversed in the Corporate segment and the gain recognized on
sale which is in compliance with GAAP together with income earned on the retained interests net of credit losses incurred are included in other
income.
The Bank purchases credit default swaps (CDS) to hedge the credit risk in Wholesale Banking’s corporate lending portfolio. These CDS do not
qualify for hedge accounting treatment and are measured at fair value with changes in fair value recognized in current period’s earnings. The related
loans are accounted for at amortized cost. Management believes that this asymmetry in the accounting treatment between CDS and loans would
result in volatility in earnings from period to period which is not indicative of the economics of the corporate loan portfolio or the underlying
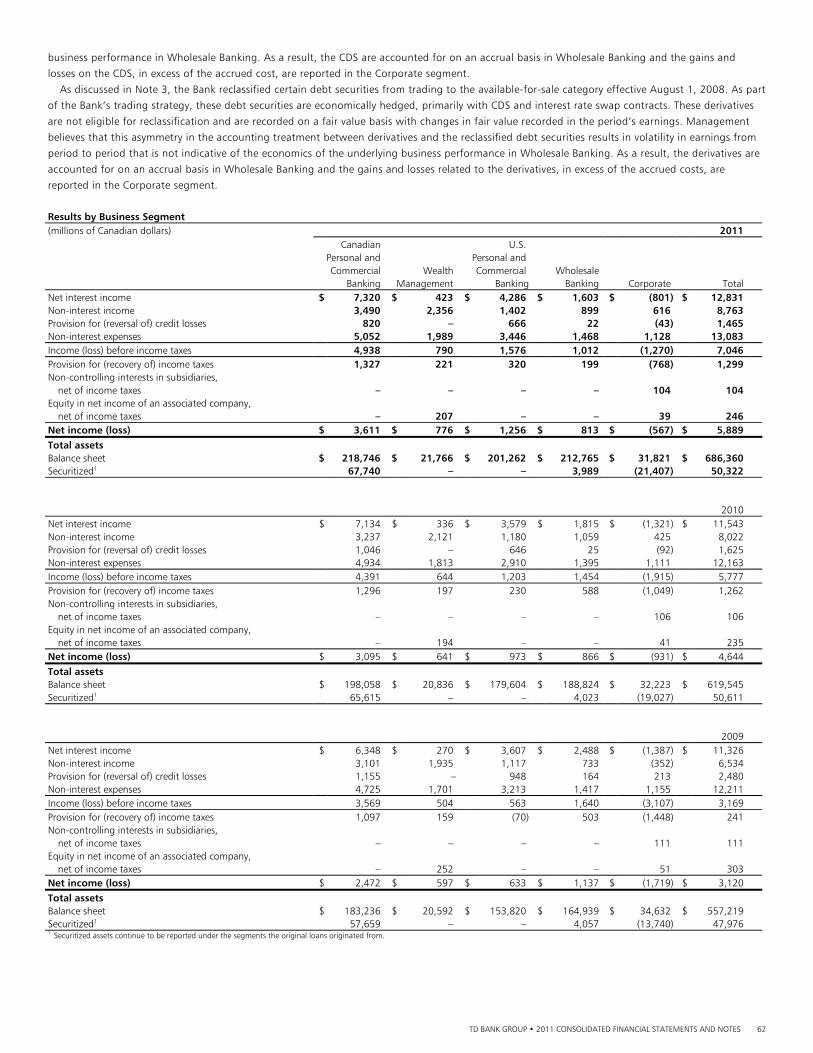
TD BANK GROUP • 2011 CONSOLIDATED FINANCIAL STATEMENTS AND NOTES 62
business performance in Wholesale Banking. As a result, the CDS are accounted for on an accrual basis in Wholesale Banking and the gains and
losses on the CDS, in excess of the accrued cost, are reported in the Corporate segment.
As discussed in Note 3, the Bank reclassified certain debt securities from trading to the available-for-sale category effective August 1, 2008. As part
of the Bank’s trading strategy, these debt securities are economically hedged, primarily with CDS and interest rate swap contracts. These derivatives
are not eligible for reclassification and are recorded on a fair value basis with changes in fair value recorded in the period’s earnings. Management
believes that this asymmetry in the accounting treatment between derivatives and the reclassified debt securities results in volatility in earnings from
period to period that is not indicative of the economics of the underlying business performance in Wholesale Banking. As a result, the derivatives are
accounted for on an accrual basis in Wholesale Banking and the gains and losses related to the derivatives, in excess of the accrued costs, are
reported in the Corporate segment.
Results by Business Segment (millions of Canadian dollars) 2011 Canadian U.S. Personal and Personal and Commercial Wealth Commercial Wholesale Banking Management Banking Banking Corporate Total Net interest income $ 7,320 $ 423 $ 4,286 $ 1,603 $ (801) $ 12,831 Non-interest income 3,490 2,356 1,402 899 616 8,763 Provision for (reversal of) credit losses 820 – 666 22 (43) 1,465 Non-interest expenses 5,052 1,989 3,446 1,468 1,128 13,083 Income (loss) before income taxes 4,938 790 1,576 1,012 (1,270) 7,046 Provision for (recovery of) income taxes 1,327 221 320 199 (768) 1,299 Non-controlling interests in subsidiaries, net of income taxes – – – – 104 104 Equity in net income of an associated company, net of income taxes – 207 – – 39 246 Net income (loss) $ 3,611 $ 776 $ 1,256 $ 813 $ (567) $ 5,889 Total assets Balance sheet $ 218,746 $ 21,766 $ 201,262 $ 212,765 $ 31,821 $ 686,360 Securitized1 67,740 – – 3,989 (21,407) 50,322 2010 Net interest income $ 7,134 $ 336 $ 3,579 $ 1,815 $ (1,321) $ 11,543 Non-interest income 3,237 2,121 1,180 1,059 425 8,022 Provision for (reversal of) credit losses 1,046 – 646 25 (92) 1,625 Non-interest expenses 4,934 1,813 2,910 1,395 1,111 12,163 Income (loss) before income taxes 4,391 644 1,203 1,454 (1,915) 5,777 Provision for (recovery of) income taxes 1,296 197 230 588 (1,049) 1,262 Non-controlling interests in subsidiaries, net of income taxes – – – – 106 106 Equity in net income of an associated company, net of income taxes – 194 – – 41 235 Net income (loss) $ 3,095 $ 641 $ 973 $ 866 $ (931) $ 4,644
Total assets Balance sheet $ 198,058 $ 20,836 $ 179,604 $ 188,824 $ 32,223 $ 619,545 Securitized1 65,615 – – 4,023 (19,027) 50,611 2009 Net interest income $ 6,348 $ 270 $ 3,607 $ 2,488 $ (1,387) $ 11,326 Non-interest income 3,101 1,935 1,117 733 (352) 6,534 Provision for (reversal of) credit losses 1,155 – 948 164 213 2,480 Non-interest expenses 4,725 1,701 3,213 1,417 1,155 12,211 Income (loss) before income taxes 3,569 504 563 1,640 (3,107) 3,169 Provision for (recovery of) income taxes 1,097 159 (70) 503 (1,448) 241 Non-controlling interests in subsidiaries, net of income taxes – – – – 111 111 Equity in net income of an associated company, net of income taxes – 252 – – 51 303 Net income (loss) $ 2,472 $ 597 $ 633 $ 1,137 $ (1,719) $ 3,120
Total assets Balance sheet $ 183,236 $ 20,592 $ 153,820 $ 164,939 $ 34,632 $ 557,219 Securitized1 57,659 – – 4,057 (13,740) 47,976 1 Securitized assets continue to be reported under the segments the original loans originated from.
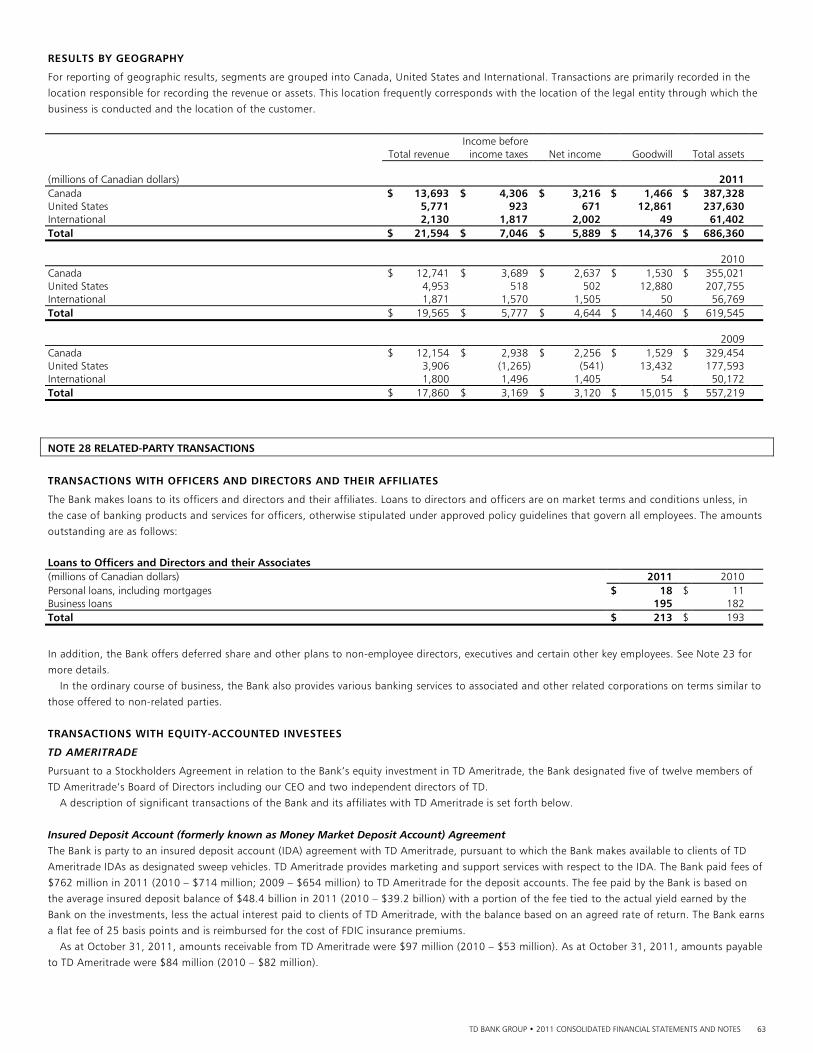
TD BANK GROUP • 2011 CONSOLIDATED FINANCIAL STATEMENTS AND NOTES 63
RESULTS BY GEOGRAPHY
For reporting of geographic results, segments are grouped into Canada, United States and International. Transactions are primarily recorded in the
location responsible for recording the revenue or assets. This location frequently corresponds with the location of the legal entity through which the
business is conducted and the location of the customer.
Income before
Total revenue income taxes Net income Goodwill Total assets (millions of Canadian dollars) 2011 Canada $ 13,693 $ 4,306 $ 3,216 $ 1,466 $ 387,328 United States 5,771 923 671 12,861 237,630 International 2,130 1,817 2,002 49 61,402 Total $ 21,594 $ 7,046 $ 5,889 $ 14,376 $ 686,360 2010 Canada $ 12,741 $ 3,689 $ 2,637 $ 1,530 $ 355,021 United States 4,953 518 502 12,880 207,755 International 1,871 1,570 1,505 50 56,769 Total $ 19,565 $ 5,777 $ 4,644 $ 14,460 $ 619,545 2009 Canada $ 12,154 $ 2,938 $ 2,256 $ 1,529 $ 329,454 United States 3,906 (1,265) (541) 13,432 177,593 International 1,800 1,496 1,405 54 50,172 Total $ 17,860 $ 3,169 $ 3,120 $ 15,015 $ 557,219
NOTE 28 RELATED-PARTY TRANSACTIONS
TRANSACTIONS WITH OFFICERS AND DIRECTORS AND THEIR AFFILIATES
The Bank makes loans to its officers and directors and their affiliates. Loans to directors and officers are on market terms and conditions unless, in
the case of banking products and services for officers, otherwise stipulated under approved policy guidelines that govern all employees. The amounts
outstanding are as follows:
Loans to Officers and Directors and their Associates (millions of Canadian dollars) 2011 2010 Personal loans, including mortgages $ 18 $ 11 Business loans 195 182 Total $ 213 $ 193
In addition, the Bank offers deferred share and other plans to non-employee directors, executives and certain other key employees. See Note 23 for
more details.
In the ordinary course of business, the Bank also provides various banking services to associated and other related corporations on terms similar to
those offered to non-related parties.
TRANSACTIONS WITH EQUITY-ACCOUNTED INVESTEES
TD AMERITRADE
Pursuant to a Stockholders Agreement in relation to the Bank’s equity investment in TD Ameritrade, the Bank designated five of twelve members of
TD Ameritrade’s Board of Directors including our CEO and two independent directors of TD.
A description of significant transactions of the Bank and its affiliates with TD Ameritrade is set forth below.
Insured Deposit Account (formerly known as Money Market Deposit Account) Agreement The Bank is party to an insured deposit account (IDA) agreement with TD Ameritrade, pursuant to which the Bank makes available to clients of TD
Ameritrade IDAs as designated sweep vehicles. TD Ameritrade provides marketing and support services with respect to the IDA. The Bank paid fees of
$762 million in 2011 (2010 – $714 million; 2009 – $654 million) to TD Ameritrade for the deposit accounts. The fee paid by the Bank is based on
the average insured deposit balance of $48.4 billion in 2011 (2010 – $39.2 billion) with a portion of the fee tied to the actual yield earned by the
Bank on the investments, less the actual interest paid to clients of TD Ameritrade, with the balance based on an agreed rate of return. The Bank earns
a flat fee of 25 basis points and is reimbursed for the cost of FDIC insurance premiums.
As at October 31, 2011, amounts receivable from TD Ameritrade were $97 million (2010 – $53 million). As at October 31, 2011, amounts payable
to TD Ameritrade were $84 million (2010 – $82 million).
TD BANK GROUP • 2011 CONSOLIDATED FINANCIAL STATEMENTS AND NOTES 64
SYMCOR
The Bank has a one-third ownership in Symcor Inc. (Symcor), a Canadian provider of business process outsourcing services offering a diverse portfolio
of integrated solutions in item processing, statement processing and production, and cash management services. The Bank accounts for Symcor’s
results using the equity method of accounting. During the year, the Bank paid $139 million (2010 – $135 million; 2009 – $164 million) for these
services. As at October 31, 2011, the amount payable to Symcor was $12 million (2010 – $12 million).
NOTE 29 CONTINGENT LIABILITIES, COMMITMENTS, GUARANTEES, PLEDGED ASSETS, AND COLLATERAL
LITIGATION The Bank and its subsidiaries are involved in various legal actions in the ordinary course of business. Contingent loss accruals are established when it
becomes likely that the Bank will incur an expense and the amount can be reasonably estimated. The Bank may incur losses in addition to the
amounts accrued where the loss is greater than estimated by management, or for matters when an unfavourable outcome is reasonably possible, but
not probable. The Bank believes the estimate of the aggregate range of reasonably possible losses, in excess of contingent loss accruals, for its legal
proceedings where it is possible to make such an estimate, is from nil to approximately $665 million as at October 31, 2011. This estimated
aggregate range of reasonably possible losses is based upon currently available information for those proceedings in which the Bank is involved,
taking into account the Bank’s best estimate of such losses for those cases which an estimate can be made. For certain cases, the Bank does not
believe that an estimate can currently be made as many of them are in preliminary stages and certain cases have no specific amount claimed. The
Bank’s estimate involves significant judgment, given the varying stages of the proceedings and the existence of multiple defendants in many of such
proceedings whose share of liability has yet to be determined. The matters underlying the estimated range will change from time to time, and actual
losses may vary significantly from the current estimate.
In management’s opinion, based on its current knowledge and after consultation with counsel, the Bank believes that the ultimate disposition of
these actions, individually or in the aggregate, will not have a material adverse effect on the consolidated financial condition or the consolidated cash
flows of the Bank. However, in light of the uncertainties involved in such proceedings, some of which are beyond the Bank’s control, it is possible
that the ultimate resolution of those legal actions may be material to the Bank’s consolidated results of operations for any particular reporting
period.
The following is a description of the Bank’s material legal proceedings.
Multidistrict Overdraft Litigation TD Bank, N.A. has been named as a defendant in four putative nationwide class actions in challenging the manner in which it calculates and collects
overdraft fees. The actions have all been transferred to the federal court in the Southern District of Florida for pre-trial proceedings in conjunction
with similar actions pending against other banks. Plaintiffs challenge generally but not exclusively the manner in which debit transactions are batched
and posted, by high to low amount rather than time of transaction. They claim that the posting method and related practices breach an implied
covenant of good faith in the customer agreement, constitute unfair and deceptive acts and practices, cause a conversion of the customers’ property,
and otherwise render the Bank liable for compensatory damages in the amount of all overdraft fees collected as a result of the challenged practices,
punitive damages, injunctive relief terminating the challenged practices, and attorneys fees, costs and interest. The Bank’s motion to dismiss the
actions has been denied, and discovery has commenced.
COMMITMENTS Credit-related Arrangements In the normal course of business, the Bank enters into various commitments and contingent liability contracts. The primary purpose of these contracts
is to make funds available for the financing needs of customers. The Bank’s policy for requiring collateral security with respect to these contracts and
the types of collateral security held is generally the same as for loans made by the Bank.
Financial and performance standby letters of credit represent irrevocable assurances that the Bank will make payments in the event that a customer
cannot meet its obligations to third parties and they carry the same credit risk, recourse and collateral security requirements as loans extended to
customers. See also the Guarantees section below for further details.
Documentary and commercial letters of credit are instruments issued on behalf of a customer authorizing a third party to draw drafts on the Bank up
to a certain amount subject to specific terms and conditions. The Bank is at risk for any drafts drawn that are not ultimately settled by the customer,
and the amounts are collateralized by the assets to which they relate.
Commitments to extend credit represent unutilized portions of authorizations to extend credit in the form of loans and customers’ liability under
acceptances. A discussion on the types of liquidity facilities the Bank provides to its securitization conduits is included in Note 6.
The values of credit instruments reported below represent the maximum amount of additional credit that the Bank could be obligated to extend
should contracts be fully utilized.
TD BANK GROUP • 2011 CONSOLIDATED FINANCIAL STATEMENTS AND NOTES 65
Credit Instruments (millions of Canadian dollars) 2011 2010 Financial and performance standby letters of credit $ 14,604 $ 14,299 Documentary and commercial letters of credit 271 262 Commitments to extend credit1 Original term to maturity of one year or less 28,595 28,206 Original term to maturity of more than one year 45,105 42,734 Total $ 88,575 $ 85,501 1 Commitments to extend credit exclude personal lines of credit and credit card lines, which are unconditionally cancellable at the Bank’s discretion at any time. In addition, the Bank is committed to fund $345 million (2010 - $423 million) of private equity investments. Long-term Commitments or Leases The Bank has obligations under long-term non-cancellable leases for premises and equipment. Future minimum operating lease commitments for premises and for equipment, where the annual rental is in excess of $100 thousand, is estimated at $621 million for 2012; $619 million for 2013; $587 million for 2014; $534 million for 2015, $483 million for 2016, and $2,677 million for 2017 and thereafter.
Future minimum capital lease commitments where the annual payment is in excess of $100 thousand, is estimated at $34 million for 2012; $33 million for 2013; $32 million for 2014; $18 million for 2015, $14 million for 2016, and $18 million for 2017 and thereafter.
The premises and equipment net rental expense, included under non-interest expenses in the Consolidated Statement of Income, for the year ended October 31, 2011 was $876 million (2010 – $786 million; 2009 – $844 million). Pledged Assets, Repurchase Agreements and Collateral In the ordinary course of business, securities and other assets are pledged against liabilities. As at October 31, 2011, securities and other assets with a carrying value of $49 billion (2010 – $46 billion) were pledged in respect of securities sold short or under repurchase agreements. As at October 31, 2011, $7.4 billion (2010 – $2.2 billion) of consumer instalment and other personal loan assets were also pledged in respect of covered bonds issued by the Bank. These assets were sold by the Bank to a VIE which is consolidated by the Bank. In addition, as at October 31, 2011, assets with a carrying value of $18 billion (2010 – $17 billion) were deposited for the purposes of participation in clearing and payment systems and depositories or to have access to the facilities of central banks in foreign jurisdictions, or as security for contract settlements with derivative exchanges or other derivative counterparties. In the ordinary course of business, the Bank enters into security lending arrangements where it agrees to lend unpaid customer securities, or its own securities, to borrowers on a fully collateralized basis. Securities lent as at October 31, 2011 amounted to $16 billion (2010 – $12 billion). In addition, the Bank may accept financial assets as collateral that the Bank is permitted to sell or repledge in the absence of default. These transactions are conducted under terms that are usual and customary to standard lending, and security borrowing and lending activities. As at October 31, 2011, the fair value of financial assets accepted as collateral that the Bank is permitted to sell or repledge in the absence of default is $26.2 billion (2010 – $24.2 billion). The fair value of financial assets accepted as collateral that has been sold or repledged (excluding cash collateral) was $8.6 billion as at October 31, 2011 (2010 – $6.7 billion). Assets Sold with Recourse In connection with its securitization activities, the Bank typically makes customary representations and warranties about the underlying assets in which the Bank may have an obligation to repurchase the assets. The nature of these representations and warranties are for the Bank, as the seller, to represent that the Bank has executed the sale of assets in good faith, and in compliance with relevant laws and contractual requirements. In the event that they do not meet these criteria, the loans may be required to be repurchased by the Bank. A contingent repurchase obligation does not by itself preclude sale treatment if the transferor does not maintain effective control over the specific transferred assets as at the date of transfer.
GUARANTEES
Guarantees issued by the Bank include contracts that require payments to be made to the guaranteed party based on: (i) changes in the underlying economic characteristics relating to an asset or liability of the guaranteed party; (ii) failure of another party to perform under an obligating agreement; or (iii) failure of another third party to pay its indebtedness when due. Guarantees are initially measured and recorded at their fair value. The Bank’s release from risk is recognized over the term of the guarantee using a systematic and rational amortization method. If the guarantee qualifies as a derivative, they are remeasured at fair value at each balance sheet date and reported as derivatives in other assets or other liabilities as appropriate. The following types of transactions represent the principal guarantees that the Bank has entered into. Assets Sold with Contingent Repurchase Obligations The Bank sells mortgage loans to the TD Mortgage Fund (the “Fund”), a mutual fund managed by the Bank. The mortgage loans are fully collateralized by residential properties and are government guaranteed. The Bank continues to service the mortgages. As part of its servicing responsibilities, the Bank has an obligation to repurchase mortgage loans when they default for an amount equal to their carrying amount. Any losses on the repurchased defaulted mortgages are recovered through the government guarantee. In addition, if the Fund experiences a liquidity event such that it does not have sufficient cash to honour unitholder redemptions, it has the option to sell the mortgage loans back to the Bank at their fair value. These contingent repurchase obligations do not preclude sale treatment as the Bank does not maintain effective control over these mortgage loans as at the date of transfer. Generally, the term of these agreements do not exceed five years.
TD BANK GROUP • 2011 CONSOLIDATED FINANCIAL STATEMENTS AND NOTES 66
Credit Enhancements The Bank guarantees payments to counterparties in the event that third party credit enhancements supporting asset pools are insufficient. Generally, the term of these credit facilities do not exceed 13 years. Written Options Written options are agreements under which the Bank grants the buyer the future right, but not the obligation, to sell or buy at or by a specified date, a specific amount of a financial instrument at a price agreed when the option is arranged and which can be physically or cash settled. Written options can be used by the counterparty to hedge foreign exchange, equity, credit, commodity and interest rate risks. The Bank does not track, for accounting purposes, whether its clients enter into these derivative contracts for trading or hedging purposes and has not determined if the guaranteed party has the asset or liability related to the underlying. Accordingly, the Bank cannot ascertain which contracts are guarantees under the definition contained in the accounting guideline for disclosure of guarantees. The Bank employs a risk framework to define risk tolerances and establishes limits designed to ensure that losses do not exceed acceptable, pre-defined limits. Due to the nature of these contracts, the Bank cannot make a reasonable estimate of the potential maximum amount payable to the counterparties. The total notional principal amount of the written options as at October 31, 2011 is $126 billion (2010 – $120 billion). Indemnification Agreements In the normal course of operations, the Bank provides indemnification agreements to various counterparties in transactions such as service agreements, leasing transactions, and agreements relating to acquisitions and dispositions. Under these agreements, the Bank is required to compensate counterparties for costs incurred as a result of various contingencies such as changes in laws and regulations and litigation claims. The nature of certain indemnification agreements prevents the Bank from making a reasonable estimate of the maximum potential amount that the Bank would be required to pay such counterparties. The Bank also indemnifies directors, officers and other persons, to the extent permitted by law, against certain claims that may be made against them as a result of their services to the Bank or, at the Bank’s request, to another entity. The table below summarizes as at October 31, the maximum potential amount of future payments that could be made under guarantees without consideration of possible recoveries under recourse provisions or from collateral held or pledged.
Maximum Potential Amount of Future Payments (millions of Canadian dollars) 2011 2010 Financial and performance standby letters of credit $ 14,428 $ 14,057 Assets sold with contingent repurchase obligations 1,357 1,510 Credit enhancements and other 176 242 Total $ 15,961 $ 15,809
NOTE 30 INTEREST RATE RISK
The Bank earns and pays interest on certain assets and liabilities. To the extent that the assets, liabilities and financial instruments mature or reprice
at different points in time, the Bank is exposed to interest rate risk. The table on the following page details interest-rate sensitive instruments by the
earlier of the maturity or repricing date. Contractual repricing dates may be adjusted according to management’s estimates for prepayments or early
redemptions that are independent of changes in interest rates. Certain assets and liabilities are shown as non-rate sensitive although the profile
assumed for actual management may be different. Derivatives are presented in the floating rate category.
TD BANK GROUP • 2011 CONSOLIDATED FINANCIAL STATEMENTS AND NOTES 67
Interest Rate Risk
(billions of Canadian dollars, except as noted) 2011 Total Over 1 Non- Floating Within 3 3 months within year to Over interest rate months to 1 year 1 year 5 years 5 years sensitive Total Assets Cash resources and other $ 5.2 $ 17.6 $ 0.9 $ 23.7 $ – $ – $ 0.4 $ 24.1 Effective yield 0.2 % 0.9 % – % – % Trading securities $ 0.6 $ 6.3 $ 12.3 $ 19.2 $ 16.6 $ 8.4 $ 24.1 $ 68.3 Effective yield 1.3 % 0.8 % 2.5 % 3.0 % Available-for-sale $ 0.2 $ 58.1 $ 12.5 $ 70.8 $ 32.1 $ 10.0 $ 4.4 $ 117.3 Effective yield 0.4 % 1.4 % 1.6 % 1.0 % Held-to-maturity $ – $ 0.5 $ 1.4 $ 1.9 $ 5.1 $ – $ – $ 7.0 Effective yield 3.4 % 2.4 % 2.6 % – % Securities purchased under reverse repurchase agreements $ 5.3 $ 32.9 $ 12.4 $ 50.6 $ 2.0 $ – $ 1.0 $ 53.6 Effective yield 0.8 % 0.4 % 1.9 % – % Loans $ 8.7 $ 183.7 $ 27.7 $ 220.1 $ 62.7 $ 14.8 $ 5.9 $ 303.5 Effective yield 2.0 % 3.3 % 3.8 % 4.6 % Other $ 68.2 $ – $ – $ 68.2 $ – $ – $ 44.4 $ 112.6 Total assets $ 88.2 $ 299.1 $ 67.2 $ 454.5 $ 118.5 $ 33.2 $ 80.2 $ 686.4 Liabilities and shareholders’ equity Trading deposits $ – $ 20.3 $ 7.9 $ 28.2 $ 0.2 $ 0.4 $ 0.8 $ 29.6 Effective yield 0.4 % 0.6 % 1.1 % 2.1 % Other deposits $ 149.1 $ 57.8 $ 34.7 $ 241.6 $ 52.4 $ 2.2 $ 155.3 $ 451.5 Effective yield 0.8 % 1.4 % 2.4 % 7.8 % Obligations related to securities sold short $ 24.4 $ – $ – $ 24.4 $ – $ – $ – $ 24.4 Obligations related to securities sold under repurchase agreements $ 0.6 $ 25.0 $ – $ 25.6 $ – $ – $ – $ 25.6 Effective yield 0.7 % – % – % – % Subordinated notes and debentures $ – $ 0.1 $ 0.2 $ 0.3 $ 6.2 $ 5.2 $ – $ 11.7 Effective yield 1.7 % 7.0 % 5.2 % 5.4 % Other $ 71.1 $ – $ – $ 71.1 $ – $ – $ 25.6 $ 96.7 Shareholders’ equity $ – $ – $ – $ – $ 3.4 $ – $ 43.5 $ 46.9 Total liabilities and shareholders’ equity $ 245.2 $ 103.2 $ 42.8 $ 391.2 $ 62.2 $ 7.8 $ 225.2 $ 686.4 Net position $ (157.0) $ 195.9 $ 24.4 $ 63.3 $ 56.3 $ 25.4 $ (145.0) $ – 2010 Total assets $ 83.7 $ 264.6 $ 48.3 $ 396.6 $ 118.8 $ 27.8 $ 76.3 $ 619.5 Total liabilities and shareholders' equity 231.1 86.3 48.0 365.4 59.3 3.7 191.1 619.5 Net position $ (147.4) $ 178.3 $ 0.3 $ 31.2 $ 59.5 $ 24.1 $ (114.8) $ –
Interest Rate Risk by Category
(billions of Canadian dollars) 2011 Total Over 1 Non- Floating Within 3 months within year to Over interest rate 3 months to 1 year 1 year 5 years 5 years sensitive Total Canadian currency $ (104.9) $ 141.4 $ 7.0 $ 43.5 $ 21.0 $ 3.4 $ (61.2) $ 6.7 Foreign currency (52.1) 54.5 17.4 19.8 35.3 22.0 (83.8) (6.7) Net position $ (157.0) $ 195.9 $ 24.4 $ 63.3 $ 56.3 $ 25.4 $ (145.0) $ – 2010
Canadian currency $ (91.1) $ 122.5 $ (4.5) $ 26.9 $ 17.0 $ 8.1 $ (60.7) $ (8.7) Foreign currency (56.3) 55.8 4.8 4.3 42.5 16.0 (54.1) 8.7 Net position $ (147.4) $ 178.3 $ 0.3 $ 31.2 $ 59.5 $ 24.1 $ (114.8) $ –
NOTE 31 CREDIT RISK
Concentration of credit risk exists where a number of borrowers or counterparties are engaged in similar activities, are located in the same
geographic area or have comparable economic characteristics. Their ability to meet contractual obligations may be similarly affected by changing
economic, political or other conditions. The Bank’s portfolio could be sensitive to changing conditions in particular geographic regions.
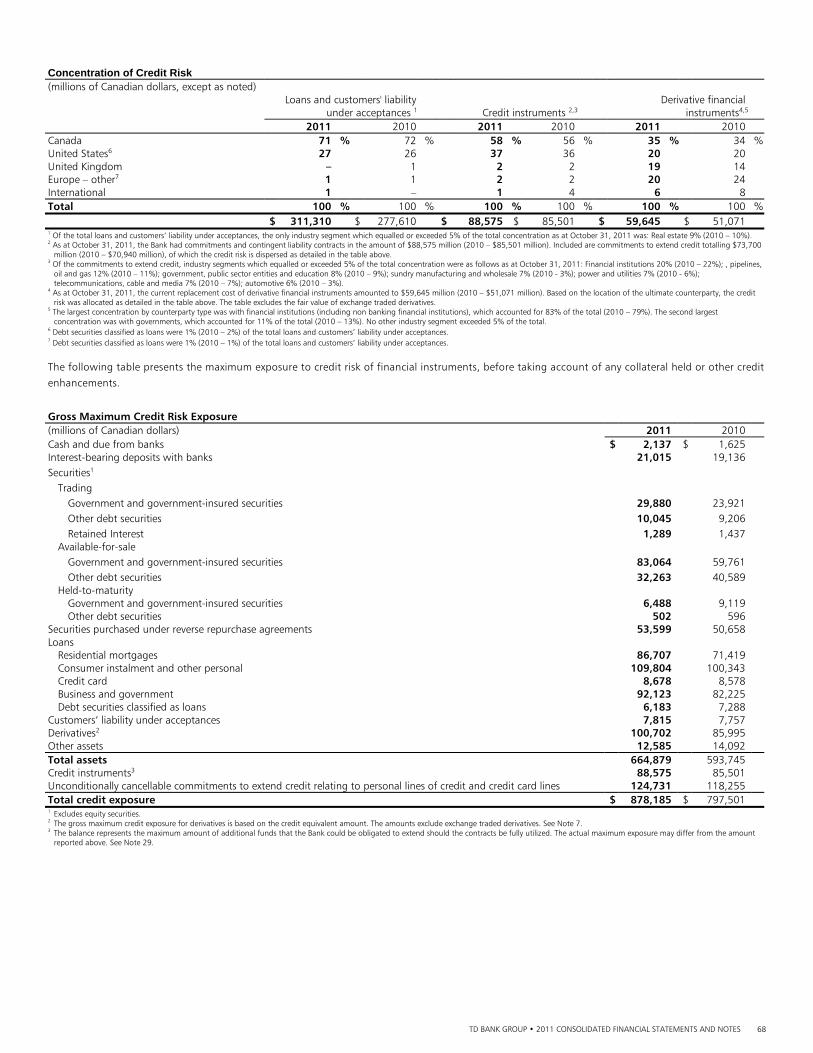
TD BANK GROUP • 2011 CONSOLIDATED FINANCIAL STATEMENTS AND NOTES 68
Concentration of Credit Risk
(millions of Canadian dollars, except as noted) Loans and customers' liability Derivative financial
under acceptances 1 Credit instruments 2,3 instruments4,5
2011 2010 2011 2010 2011 2010
Canada 71 % 72 % 58 % 56 % 35 % 34 %United States6 27 26 37 36 20 20
United Kingdom – 1 2 2 19 14
Europe – other7 1 1 2 2 20 24
International 1 – 1 4 6 8
Total 100 % 100 % 100 % 100 % 100 % 100 % $ 311,310 $ 277,610 $ 88,575 $ 85,501 $ 59,645 $ 51,071 1 Of the total loans and customers’ liability under acceptances, the only industry segment which equalled or exceeded 5% of the total concentration as at October 31, 2011 was: Real estate 9% (2010 – 10%). 2 As at October 31, 2011, the Bank had commitments and contingent liability contracts in the amount of $88,575 million (2010 – $85,501 million). Included are commitments to extend credit totalling $73,700
million (2010 – $70,940 million), of which the credit risk is dispersed as detailed in the table above. 3 Of the commitments to extend credit, industry segments which equalled or exceeded 5% of the total concentration were as follows as at October 31, 2011: Financial institutions 20% (2010 – 22%); , pipelines,
oil and gas 12% (2010 – 11%); government, public sector entities and education 8% (2010 – 9%); sundry manufacturing and wholesale 7% (2010 - 3%); power and utilities 7% (2010 - 6%); telecommunications, cable and media 7% (2010 – 7%); automotive 6% (2010 – 3%).
4 As at October 31, 2011, the current replacement cost of derivative financial instruments amounted to $59,645 million (2010 – $51,071 million). Based on the location of the ultimate counterparty, the credit risk was allocated as detailed in the table above. The table excludes the fair value of exchange traded derivatives.
5 The largest concentration by counterparty type was with financial institutions (including non banking financial institutions), which accounted for 83% of the total (2010 – 79%). The second largest concentration was with governments, which accounted for 11% of the total (2010 – 13%). No other industry segment exceeded 5% of the total.
6 Debt securities classified as loans were 1% (2010 – 2%) of the total loans and customers’ liability under acceptances. 7 Debt securities classified as loans were 1% (2010 – 1%) of the total loans and customers’ liability under acceptances.
The following table presents the maximum exposure to credit risk of financial instruments, before taking account of any collateral held or other credit
enhancements.
Gross Maximum Credit Risk Exposure (millions of Canadian dollars) 2011 2010 Cash and due from banks $ 2,137 $ 1,625 Interest-bearing deposits with banks 21,015 19,136 Securities1 Trading Government and government-insured securities 29,880 23,921 Other debt securities 10,045 9,206 Retained Interest 1,289 1,437 Available-for-sale Government and government-insured securities 83,064 59,761 Other debt securities 32,263 40,589 Held-to-maturity Government and government-insured securities 6,488 9,119 Other debt securities 502 596 Securities purchased under reverse repurchase agreements 53,599 50,658 Loans Residential mortgages 86,707 71,419 Consumer instalment and other personal 109,804 100,343 Credit card 8,678 8,578 Business and government 92,123 82,225 Debt securities classified as loans 6,183 7,288 Customers’ liability under acceptances 7,815 7,757 Derivatives2 100,702 85,995 Other assets 12,585 14,092 Total assets 664,879 593,745 Credit instruments3 88,575 85,501 Unconditionally cancellable commitments to extend credit relating to personal lines of credit and credit card lines 124,731 118,255 Total credit exposure $ 878,185 $ 797,501 1 Excludes equity securities. 2 The gross maximum credit exposure for derivatives is based on the credit equivalent amount. The amounts exclude exchange traded derivatives. See Note 7. 3 The balance represents the maximum amount of additional funds that the Bank could be obligated to extend should the contracts be fully utilized. The actual maximum exposure may differ from the amount
reported above. See Note 29.
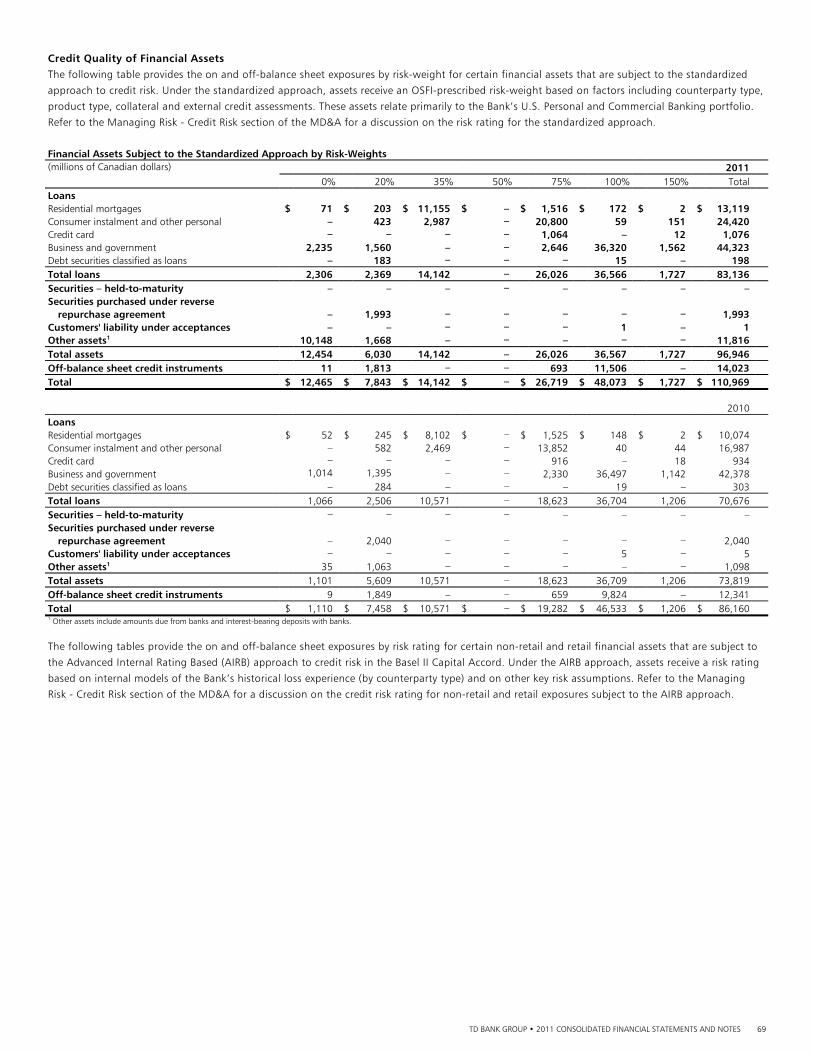
TD BANK GROUP • 2011 CONSOLIDATED FINANCIAL STATEMENTS AND NOTES 69
Credit Quality of Financial Assets The following table provides the on and off-balance sheet exposures by risk-weight for certain financial assets that are subject to the standardized
approach to credit risk. Under the standardized approach, assets receive an OSFI-prescribed risk-weight based on factors including counterparty type,
product type, collateral and external credit assessments. These assets relate primarily to the Bank’s U.S. Personal and Commercial Banking portfolio.
Refer to the Managing Risk - Credit Risk section of the MD&A for a discussion on the risk rating for the standardized approach.
Financial Assets Subject to the Standardized Approach by Risk-Weights (millions of Canadian dollars) 2011 0% 20% 35% 50% 75% 100% 150% Total Loans Residential mortgages $ 71 $ 203 $ 11,155 $ – $ 1,516 $ 172 $ 2 $ 13,119 Consumer instalment and other personal – 423 2,987 – 20,800 59 151 24,420 Credit card – – – – 1,064 – 12 1,076 Business and government 2,235 1,560 – – 2,646 36,320 1,562 44,323 Debt securities classified as loans – 183 – – – 15 – 198 Total loans 2,306 2,369 14,142 – 26,026 36,566 1,727 83,136 Securities – held-to-maturity – – – – – – – – Securities purchased under reverse repurchase agreement – 1,993 – – – – – 1,993 Customers' liability under acceptances – – – – – 1 – 1 Other assets1 10,148 1,668 – – – – – 11,816 Total assets 12,454 6,030 14,142 – 26,026 36,567 1,727 96,946 Off-balance sheet credit instruments 11 1,813 – – 693 11,506 – 14,023 Total $ 12,465 $ 7,843 $ 14,142 $ – $ 26,719 $ 48,073 $ 1,727 $ 110,969 2010
Loans Residential mortgages $ 52 $ 245 $ 8,102 $ – $ 1,525 $ 148 $ 2 $ 10,074 Consumer instalment and other personal – 582 2,469 – 13,852 40 44 16,987 Credit card – – – – 916 – 18 934 Business and government 1,014 1,395 – – 2,330 36,497 1,142 42,378 Debt securities classified as loans – 284 – – – 19 – 303 Total loans 1,066 2,506 10,571 – 18,623 36,704 1,206 70,676 Securities – held-to-maturity – – – – – – – – Securities purchased under reverse repurchase agreement – 2,040 – – – – – 2,040 Customers' liability under acceptances – – – – – 5 – 5 Other assets1 35 1,063 – – – – – 1,098 Total assets 1,101 5,609 10,571 – 18,623 36,709 1,206 73,819 Off-balance sheet credit instruments 9 1,849 – – 659 9,824 – 12,341 Total $ 1,110 $ 7,458 $ 10,571 $ – $ 19,282 $ 46,533 $ 1,206 $ 86,160 1 Other assets include amounts due from banks and interest-bearing deposits with banks. The following tables provide the on and off-balance sheet exposures by risk rating for certain non-retail and retail financial assets that are subject to
the Advanced Internal Rating Based (AIRB) approach to credit risk in the Basel II Capital Accord. Under the AIRB approach, assets receive a risk rating
based on internal models of the Bank’s historical loss experience (by counterparty type) and on other key risk assumptions. Refer to the Managing
Risk - Credit Risk section of the MD&A for a discussion on the credit risk rating for non-retail and retail exposures subject to the AIRB approach.
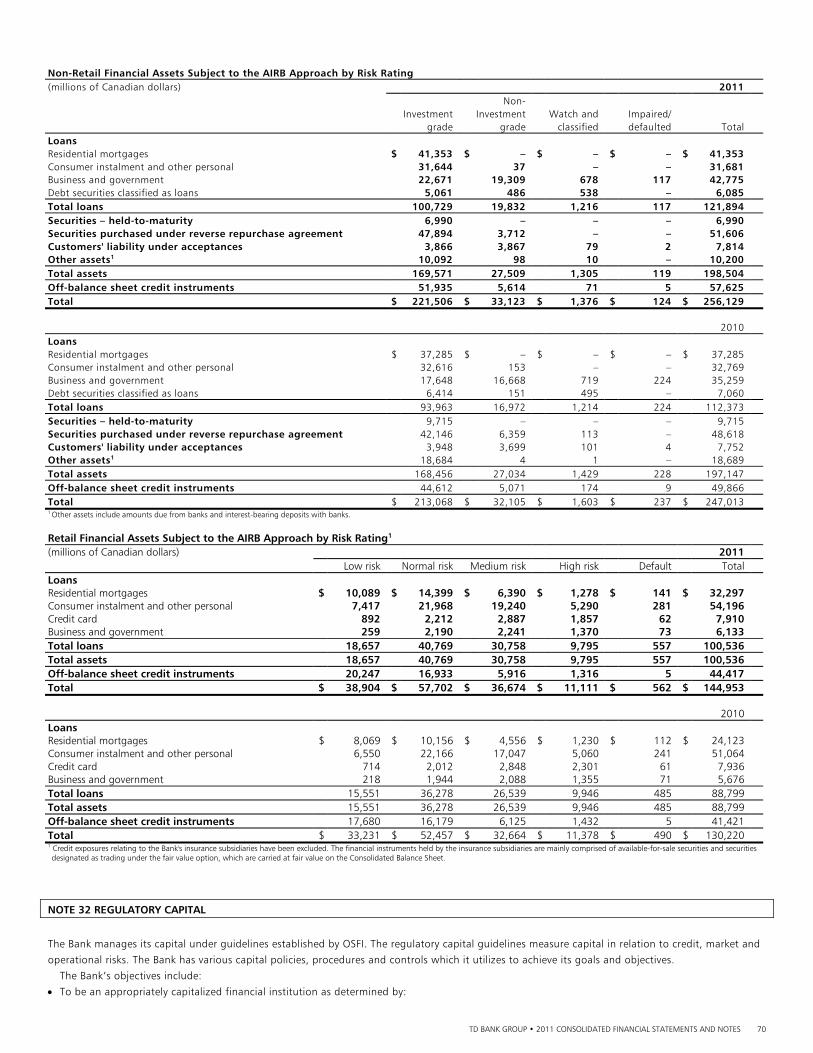
TD BANK GROUP • 2011 CONSOLIDATED FINANCIAL STATEMENTS AND NOTES 70
Non-Retail Financial Assets Subject to the AIRB Approach by Risk Rating (millions of Canadian dollars) 2011 Non- Investment Investment Watch and Impaired/ grade grade classified defaulted Total Loans Residential mortgages $ 41,353 $ – $ – $ – $ 41,353 Consumer instalment and other personal 31,644 37 – – 31,681 Business and government 22,671 19,309 678 117 42,775 Debt securities classified as loans 5,061 486 538 – 6,085 Total loans 100,729 19,832 1,216 117 121,894 Securities – held-to-maturity 6,990 – – – 6,990 Securities purchased under reverse repurchase agreement 47,894 3,712 – – 51,606 Customers' liability under acceptances 3,866 3,867 79 2 7,814 Other assets1 10,092 98 10 – 10,200 Total assets 169,571 27,509 1,305 119 198,504 Off-balance sheet credit instruments 51,935 5,614 71 5 57,625 Total $ 221,506 $ 33,123 $ 1,376 $ 124 $ 256,129 2010 Loans Residential mortgages $ 37,285 $ – $ – $ – $ 37,285 Consumer instalment and other personal 32,616 153 – – 32,769 Business and government 17,648 16,668 719 224 35,259 Debt securities classified as loans 6,414 151 495 – 7,060 Total loans 93,963 16,972 1,214 224 112,373 Securities – held-to-maturity 9,715 – – – 9,715 Securities purchased under reverse repurchase agreement 42,146 6,359 113 – 48,618 Customers' liability under acceptances 3,948 3,699 101 4 7,752 Other assets1 18,684 4 1 – 18,689 Total assets 168,456 27,034 1,429 228 197,147 Off-balance sheet credit instruments 44,612 5,071 174 9 49,866 Total $ 213,068 $ 32,105 $ 1,603 $ 237 $ 247,013 1 Other assets include amounts due from banks and interest-bearing deposits with banks.
Retail Financial Assets Subject to the AIRB Approach by Risk Rating1 (millions of Canadian dollars) 2011 Low risk Normal risk Medium risk High risk Default Total Loans Residential mortgages $ 10,089 $ 14,399 $ 6,390 $ 1,278 $ 141 $ 32,297 Consumer instalment and other personal 7,417 21,968 19,240 5,290 281 54,196 Credit card 892 2,212 2,887 1,857 62 7,910 Business and government 259 2,190 2,241 1,370 73 6,133 Total loans 18,657 40,769 30,758 9,795 557 100,536 Total assets 18,657 40,769 30,758 9,795 557 100,536 Off-balance sheet credit instruments 20,247 16,933 5,916 1,316 5 44,417 Total $ 38,904 $ 57,702 $ 36,674 $ 11,111 $ 562 $ 144,953
2010 Loans Residential mortgages $ 8,069 $ 10,156 $ 4,556 $ 1,230 $ 112 $ 24,123 Consumer instalment and other personal 6,550 22,166 17,047 5,060 241 51,064 Credit card 714 2,012 2,848 2,301 61 7,936 Business and government 218 1,944 2,088 1,355 71 5,676 Total loans 15,551 36,278 26,539 9,946 485 88,799 Total assets 15,551 36,278 26,539 9,946 485 88,799 Off-balance sheet credit instruments 17,680 16,179 6,125 1,432 5 41,421 Total $ 33,231 $ 52,457 $ 32,664 $ 11,378 $ 490 $ 130,220 1 Credit exposures relating to the Bank's insurance subsidiaries have been excluded. The financial instruments held by the insurance subsidiaries are mainly comprised of available-for-sale securities and securities designated as trading under the fair value option, which are carried at fair value on the Consolidated Balance Sheet.
NOTE 32 REGULATORY CAPITAL
The Bank manages its capital under guidelines established by OSFI. The regulatory capital guidelines measure capital in relation to credit, market and
operational risks. The Bank has various capital policies, procedures and controls which it utilizes to achieve its goals and objectives.
The Bank’s objectives include:
To be an appropriately capitalized financial institution as determined by:
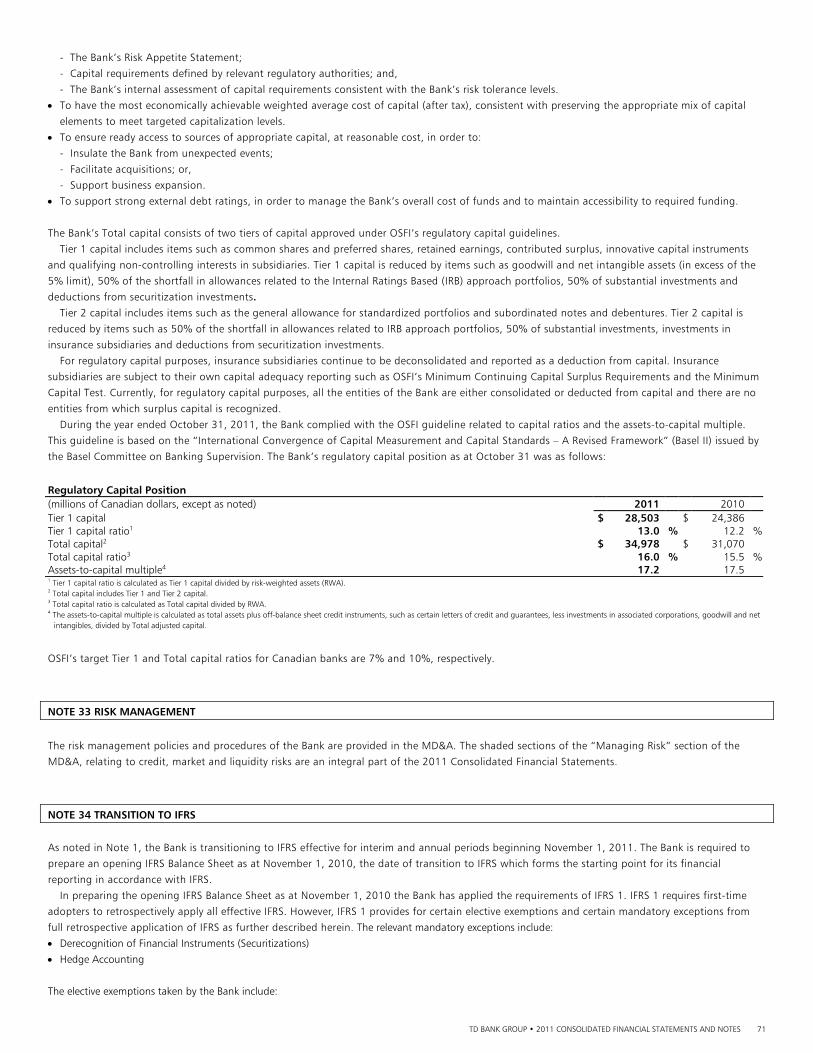
TD BANK GROUP • 2011 CONSOLIDATED FINANCIAL STATEMENTS AND NOTES 71
- The Bank’s Risk Appetite Statement;
- Capital requirements defined by relevant regulatory authorities; and,
- The Bank’s internal assessment of capital requirements consistent with the Bank’s risk tolerance levels.
To have the most economically achievable weighted average cost of capital (after tax), consistent with preserving the appropriate mix of capital
elements to meet targeted capitalization levels.
To ensure ready access to sources of appropriate capital, at reasonable cost, in order to:
- Insulate the Bank from unexpected events;
- Facilitate acquisitions; or,
- Support business expansion.
To support strong external debt ratings, in order to manage the Bank’s overall cost of funds and to maintain accessibility to required funding.
The Bank’s Total capital consists of two tiers of capital approved under OSFI’s regulatory capital guidelines.
Tier 1 capital includes items such as common shares and preferred shares, retained earnings, contributed surplus, innovative capital instruments
and qualifying non-controlling interests in subsidiaries. Tier 1 capital is reduced by items such as goodwill and net intangible assets (in excess of the
5% limit), 50% of the shortfall in allowances related to the Internal Ratings Based (IRB) approach portfolios, 50% of substantial investments and
deductions from securitization investments. Tier 2 capital includes items such as the general allowance for standardized portfolios and subordinated notes and debentures. Tier 2 capital is
reduced by items such as 50% of the shortfall in allowances related to IRB approach portfolios, 50% of substantial investments, investments in
insurance subsidiaries and deductions from securitization investments.
For regulatory capital purposes, insurance subsidiaries continue to be deconsolidated and reported as a deduction from capital. Insurance
subsidiaries are subject to their own capital adequacy reporting such as OSFI’s Minimum Continuing Capital Surplus Requirements and the Minimum
Capital Test. Currently, for regulatory capital purposes, all the entities of the Bank are either consolidated or deducted from capital and there are no
entities from which surplus capital is recognized.
During the year ended October 31, 2011, the Bank complied with the OSFI guideline related to capital ratios and the assets-to-capital multiple.
This guideline is based on the “International Convergence of Capital Measurement and Capital Standards – A Revised Framework” (Basel II) issued by
the Basel Committee on Banking Supervision. The Bank’s regulatory capital position as at October 31 was as follows:
Regulatory Capital Position
(millions of Canadian dollars, except as noted) 2011 2010 Tier 1 capital $ 28,503 $ 24,386 Tier 1 capital ratio1 13.0 % 12.2 %Total capital2 $ 34,978 $ 31,070 Total capital ratio3 16.0 % 15.5 %Assets-to-capital multiple4 17.2 17.5 1 Tier 1 capital ratio is calculated as Tier 1 capital divided by risk-weighted assets (RWA). 2 Total capital includes Tier 1 and Tier 2 capital. 3 Total capital ratio is calculated as Total capital divided by RWA. 4 The assets-to-capital multiple is calculated as total assets plus off-balance sheet credit instruments, such as certain letters of credit and guarantees, less investments in associated corporations, goodwill and net
intangibles, divided by Total adjusted capital.
OSFI’s target Tier 1 and Total capital ratios for Canadian banks are 7% and 10%, respectively.
NOTE 33 RISK MANAGEMENT
The risk management policies and procedures of the Bank are provided in the MD&A. The shaded sections of the “Managing Risk” section of the
MD&A, relating to credit, market and liquidity risks are an integral part of the 2011 Consolidated Financial Statements.
NOTE 34 TRANSITION TO IFRS
As noted in Note 1, the Bank is transitioning to IFRS effective for interim and annual periods beginning November 1, 2011. The Bank is required to
prepare an opening IFRS Balance Sheet as at November 1, 2010, the date of transition to IFRS which forms the starting point for its financial
reporting in accordance with IFRS.
In preparing the opening IFRS Balance Sheet as at November 1, 2010 the Bank has applied the requirements of IFRS 1. IFRS 1 requires first-time
adopters to retrospectively apply all effective IFRS. However, IFRS 1 provides for certain elective exemptions and certain mandatory exceptions from
full retrospective application of IFRS as further described herein. The relevant mandatory exceptions include:
Derecognition of Financial Instruments (Securitizations)
Hedge Accounting
The elective exemptions taken by the Bank include:
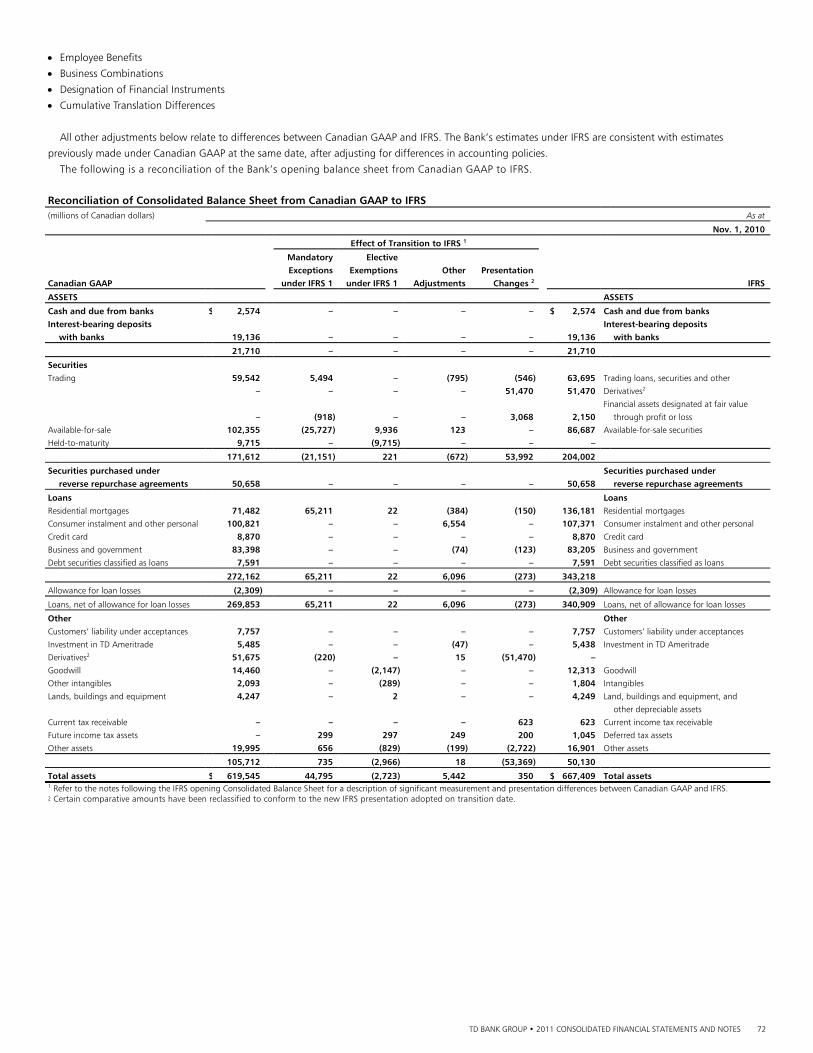
TD BANK GROUP • 2011 CONSOLIDATED FINANCIAL STATEMENTS AND NOTES 72
Employee Benefits
Business Combinations
Designation of Financial Instruments
Cumulative Translation Differences
All other adjustments below relate to differences between Canadian GAAP and IFRS. The Bank’s estimates under IFRS are consistent with estimates
previously made under Canadian GAAP at the same date, after adjusting for differences in accounting policies.
The following is a reconciliation of the Bank’s opening balance sheet from Canadian GAAP to IFRS.
Reconciliation of Consolidated Balance Sheet from Canadian GAAP to IFRS
(millions of Canadian dollars) As at
Nov. 1, 2010
Effect of Transition to IFRS 1
Mandatory Elective Exceptions Exemptions Other Presentation Canadian GAAP under IFRS 1 under IFRS 1 Adjustments Changes 2 IFRS
ASSETS ASSETS
Cash and due from banks $ 2,574 – – – – $ 2,574 Cash and due from banks Interest-bearing deposits Interest-bearing deposits with banks 19,136 – – – – 19,136 with banks
21,710 – – – – 21,710
Securities Trading 59,542 5,494 – (795) (546) 63,695 Trading loans, securities and other – – – – 51,470 51,470 Derivatives2 Financial assets designated at fair value – (918) – – 3,068 2,150 through profit or loss
Available-for-sale 102,355 (25,727) 9,936 123 – 86,687 Available-for-sale securities Held-to-maturity 9,715 – (9,715) – – –
171,612 (21,151) 221 (672) 53,992 204,002
Securities purchased under Securities purchased under reverse repurchase agreements 50,658 – – – – 50,658 reverse repurchase agreements
Loans Loans Residential mortgages 71,482 65,211 22 (384) (150) 136,181 Residential mortgages Consumer instalment and other personal 100,821 – – 6,554 – 107,371 Consumer instalment and other personal Credit card 8,870 – – – – 8,870 Credit card Business and government 83,398 – – (74) (123) 83,205 Business and government Debt securities classified as loans 7,591 – – – – 7,591 Debt securities classified as loans
272,162 65,211 22 6,096 (273) 343,218
Allowance for loan losses (2,309) – – – – (2,309) Allowance for loan losses
Loans, net of allowance for loan losses 269,853 65,211 22 6,096 (273) 340,909 Loans, net of allowance for loan losses
Other Other Customers’ liability under acceptances 7,757 – – – – 7,757 Customers’ liability under acceptances Investment in TD Ameritrade 5,485 – – (47) – 5,438 Investment in TD Ameritrade Derivatives2 51,675 (220) – 15 (51,470) – Goodwill 14,460 – (2,147) – – 12,313 Goodwill Other intangibles 2,093 – (289) – – 1,804 Intangibles Lands, buildings and equipment 4,247 – 2 – – 4,249 Land, buildings and equipment, and other depreciable assets
Current tax receivable – – – – 623 623 Current income tax receivable Future income tax assets – 299 297 249 200 1,045 Deferred tax assets Other assets 19,995 656 (829) (199) (2,722) 16,901 Other assets
105,712 735 (2,966) 18 (53,369) 50,130
Total assets $ 619,545 44,795 (2,723) 5,442 350 $ 667,409 Total assets 1 Refer to the notes following the IFRS opening Consolidated Balance Sheet for a description of significant measurement and presentation differences between Canadian GAAP and IFRS. 2 Certain comparative amounts have been reclassified to conform to the new IFRS presentation adopted on transition date.
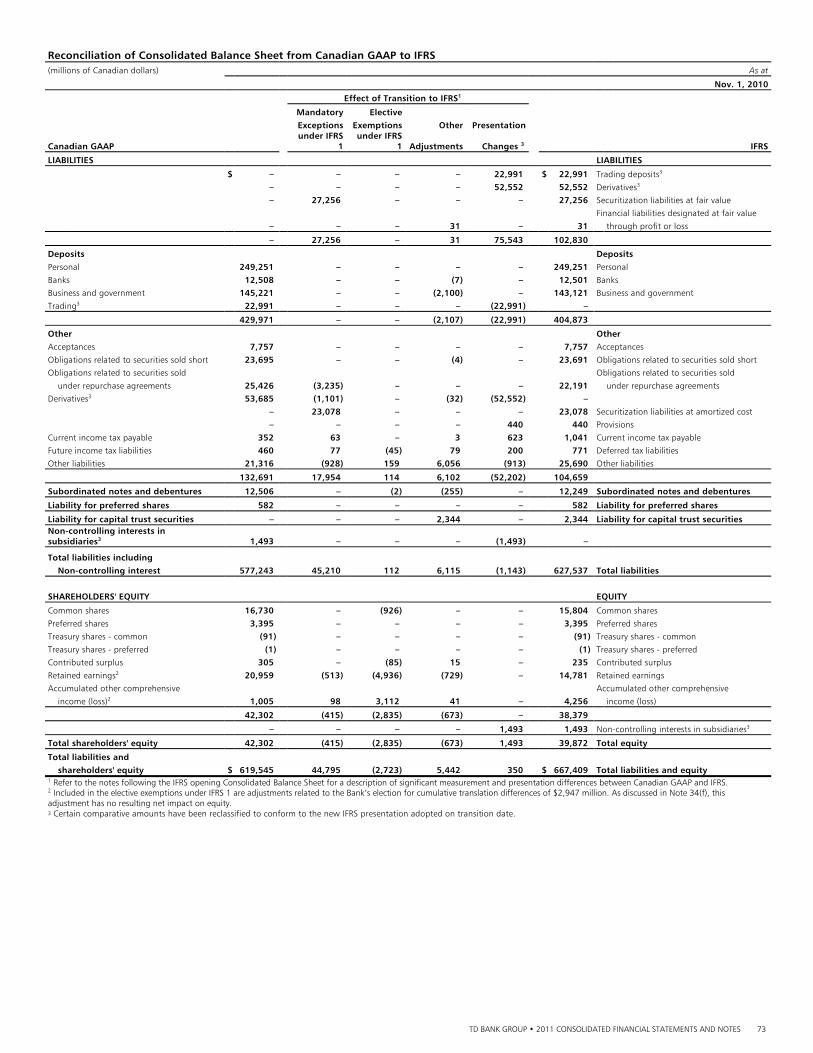
TD BANK GROUP • 2011 CONSOLIDATED FINANCIAL STATEMENTS AND NOTES 73
Reconciliation of Consolidated Balance Sheet from Canadian GAAP to IFRS
(millions of Canadian dollars) As at
Nov. 1, 2010
Effect of Transition to IFRS1
Mandatory Elective Exceptions Exemptions Other Presentation
Canadian GAAP under IFRS
1under IFRS
1 Adjustments Changes 3 IFRS
LIABILITIES LIABILITIES
$ – – – – 22,991 $ 22,991 Trading deposits3 – – – – 52,552 52,552 Derivatives3 – 27,256 – – – 27,256 Securitization liabilities at fair value Financial liabilities designated at fair value – – – 31 – 31 through profit or loss
– 27,256 – 31 75,543 102,830
Deposits Deposits Personal 249,251 – – – – 249,251 Personal Banks 12,508 – – (7) – 12,501 Banks Business and government 145,221 – – (2,100) – 143,121 Business and government Trading3 22,991 – – – (22,991) –
429,971 – – (2,107) (22,991) 404,873
Other Other Acceptances 7,757 – – – – 7,757 Acceptances Obligations related to securities sold short 23,695 – – (4) – 23,691 Obligations related to securities sold short Obligations related to securities sold Obligations related to securities sold under repurchase agreements 25,426 (3,235) – – – 22,191 under repurchase agreements
Derivatives3 53,685 (1,101) – (32) (52,552) – – 23,078 – – – 23,078 Securitization liabilities at amortized cost – – – – 440 440 Provisions Current income tax payable 352 63 – 3 623 1,041 Current income tax payable Future income tax liabilities 460 77 (45) 79 200 771 Deferred tax liabilities Other liabilities 21,316 (928) 159 6,056 (913) 25,690 Other liabilities
132,691 17,954 114 6,102 (52,202) 104,659
Subordinated notes and debentures 12,506 – (2) (255) – 12,249 Subordinated notes and debentures
Liability for preferred shares 582 – – – – 582 Liability for preferred shares
Liability for capital trust securities – – – 2,344 – 2,344 Liability for capital trust securities Non-controlling interests in subsidiaries3 1,493 – – – (1,493) –
Total liabilities including Non-controlling interest 577,243 45,210 112 6,115 (1,143) 627,537 Total liabilities SHAREHOLDERS' EQUITY EQUITY
Common shares 16,730 – (926) – – 15,804 Common shares Preferred shares 3,395 – – – – 3,395 Preferred shares Treasury shares - common (91) – – – – (91) Treasury shares - common Treasury shares - preferred (1) – – – – (1) Treasury shares - preferred Contributed surplus 305 – (85) 15 – 235 Contributed surplus Retained earnings2 20,959 (513) (4,936) (729) – 14,781 Retained earnings Accumulated other comprehensive Accumulated other comprehensive
income (loss)2 1,005 98 3,112 41 – 4,256 income (loss)
42,302 (415) (2,835) (673) – 38,379
– – – – 1,493 1,493 Non-controlling interests in subsidiaries3
Total shareholders' equity 42,302 (415) (2,835) (673) 1,493 39,872 Total equity
Total liabilities and shareholders' equity $ 619,545 44,795 (2,723) 5,442 350 $ 667,409 Total liabilities and equity 1 Refer to the notes following the IFRS opening Consolidated Balance Sheet for a description of significant measurement and presentation differences between Canadian GAAP and IFRS. 2 Included in the elective exemptions under IFRS 1 are adjustments related to the Bank’s election for cumulative translation differences of $2,947 million. As discussed in Note 34(f), this adjustment has no resulting net impact on equity. 3 Certain comparative amounts have been reclassified to conform to the new IFRS presentation adopted on transition date.
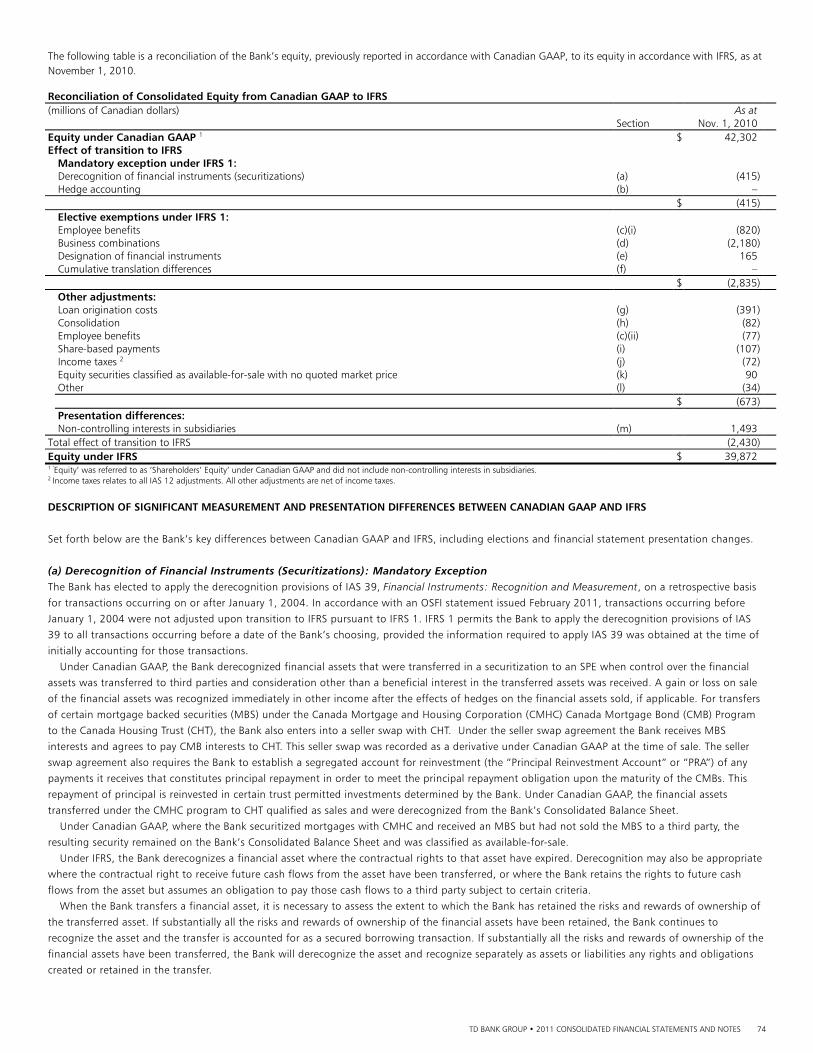
TD BANK GROUP • 2011 CONSOLIDATED FINANCIAL STATEMENTS AND NOTES 74
The following table is a reconciliation of the Bank’s equity, previously reported in accordance with Canadian GAAP, to its equity in accordance with IFRS, as at November 1, 2010. Reconciliation of Consolidated Equity from Canadian GAAP to IFRS
(millions of Canadian dollars) As at Section Nov. 1, 2010 Equity under Canadian GAAP 1 $ 42,302 Effect of transition to IFRS
Mandatory exception under IFRS 1:
Derecognition of financial instruments (securitizations) (a) (415) Hedge accounting (b) – $ (415) Elective exemptions under IFRS 1:
Employee benefits (c)(i) (820) Business combinations (d) (2,180) Designation of financial instruments (e) 165 Cumulative translation differences (f) – $ (2,835) Other adjustments:
Loan origination costs (g) (391) Consolidation (h) (82) Employee benefits (c)(ii) (77) Share-based payments (i) (107) Income taxes 2 (j) (72) Equity securities classified as available-for-sale with no quoted market price (k) 90 Other (l) (34) $ (673) Presentation differences:
Non-controlling interests in subsidiaries (m) 1,493 Total effect of transition to IFRS (2,430) Equity under IFRS $ 39,872 1 ’Equity’ was referred to as ‘Shareholders’ Equity’ under Canadian GAAP and did not include non-controlling interests in subsidiaries. 2 Income taxes relates to all IAS 12 adjustments. All other adjustments are net of income taxes.
DESCRIPTION OF SIGNIFICANT MEASUREMENT AND PRESENTATION DIFFERENCES BETWEEN CANADIAN GAAP AND IFRS
Set forth below are the Bank’s key differences between Canadian GAAP and IFRS, including elections and financial statement presentation changes.
(a) Derecognition of Financial Instruments (Securitizations): Mandatory Exception The Bank has elected to apply the derecognition provisions of IAS 39, Financial Instruments: Recognition and Measurement, on a retrospective basis
for transactions occurring on or after January 1, 2004. In accordance with an OSFI statement issued February 2011, transactions occurring before
January 1, 2004 were not adjusted upon transition to IFRS pursuant to IFRS 1. IFRS 1 permits the Bank to apply the derecognition provisions of IAS
39 to all transactions occurring before a date of the Bank’s choosing, provided the information required to apply IAS 39 was obtained at the time of
initially accounting for those transactions.
Under Canadian GAAP, the Bank derecognized financial assets that were transferred in a securitization to an SPE when control over the financial
assets was transferred to third parties and consideration other than a beneficial interest in the transferred assets was received. A gain or loss on sale
of the financial assets was recognized immediately in other income after the effects of hedges on the financial assets sold, if applicable. For transfers
of certain mortgage backed securities (MBS) under the Canada Mortgage and Housing Corporation (CMHC) Canada Mortgage Bond (CMB) Program
to the Canada Housing Trust (CHT), the Bank also enters into a seller swap with CHT. Under the seller swap agreement the Bank receives MBS
interests and agrees to pay CMB interests to CHT. This seller swap was recorded as a derivative under Canadian GAAP at the time of sale. The seller
swap agreement also requires the Bank to establish a segregated account for reinvestment (the “Principal Reinvestment Account” or “PRA”) of any
payments it receives that constitutes principal repayment in order to meet the principal repayment obligation upon the maturity of the CMBs. This
repayment of principal is reinvested in certain trust permitted investments determined by the Bank. Under Canadian GAAP, the financial assets
transferred under the CMHC program to CHT qualified as sales and were derecognized from the Bank’s Consolidated Balance Sheet.
Under Canadian GAAP, where the Bank securitized mortgages with CMHC and received an MBS but had not sold the MBS to a third party, the
resulting security remained on the Bank’s Consolidated Balance Sheet and was classified as available-for-sale.
Under IFRS, the Bank derecognizes a financial asset where the contractual rights to that asset have expired. Derecognition may also be appropriate
where the contractual right to receive future cash flows from the asset have been transferred, or where the Bank retains the rights to future cash
flows from the asset but assumes an obligation to pay those cash flows to a third party subject to certain criteria.
When the Bank transfers a financial asset, it is necessary to assess the extent to which the Bank has retained the risks and rewards of ownership of
the transferred asset. If substantially all the risks and rewards of ownership of the financial assets have been retained, the Bank continues to
recognize the asset and the transfer is accounted for as a secured borrowing transaction. If substantially all the risks and rewards of ownership of the
financial assets have been transferred, the Bank will derecognize the asset and recognize separately as assets or liabilities any rights and obligations
created or retained in the transfer.
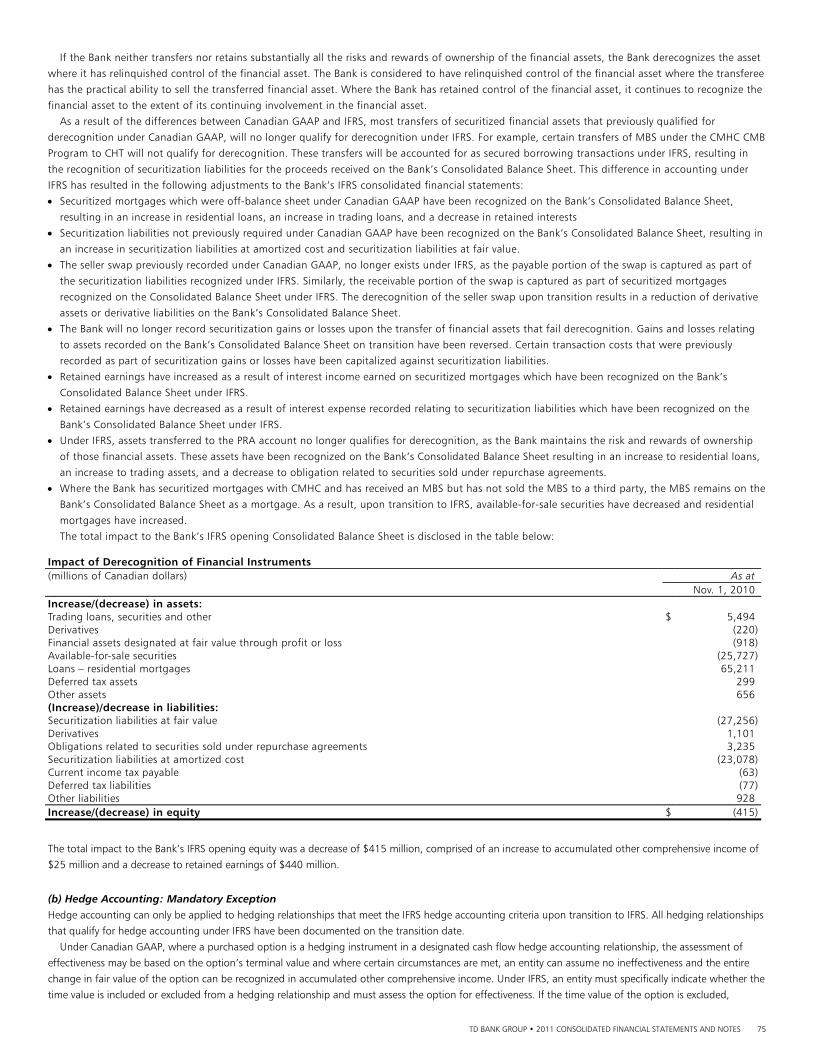
TD BANK GROUP • 2011 CONSOLIDATED FINANCIAL STATEMENTS AND NOTES 75
If the Bank neither transfers nor retains substantially all the risks and rewards of ownership of the financial assets, the Bank derecognizes the asset
where it has relinquished control of the financial asset. The Bank is considered to have relinquished control of the financial asset where the transferee
has the practical ability to sell the transferred financial asset. Where the Bank has retained control of the financial asset, it continues to recognize the
financial asset to the extent of its continuing involvement in the financial asset.
As a result of the differences between Canadian GAAP and IFRS, most transfers of securitized financial assets that previously qualified for
derecognition under Canadian GAAP, will no longer qualify for derecognition under IFRS. For example, certain transfers of MBS under the CMHC CMB
Program to CHT will not qualify for derecognition. These transfers will be accounted for as secured borrowing transactions under IFRS, resulting in
the recognition of securitization liabilities for the proceeds received on the Bank’s Consolidated Balance Sheet. This difference in accounting under
IFRS has resulted in the following adjustments to the Bank’s IFRS consolidated financial statements:
Securitized mortgages which were off-balance sheet under Canadian GAAP have been recognized on the Bank’s Consolidated Balance Sheet,
resulting in an increase in residential loans, an increase in trading loans, and a decrease in retained interests
Securitization liabilities not previously required under Canadian GAAP have been recognized on the Bank’s Consolidated Balance Sheet, resulting in
an increase in securitization liabilities at amortized cost and securitization liabilities at fair value.
The seller swap previously recorded under Canadian GAAP, no longer exists under IFRS, as the payable portion of the swap is captured as part of
the securitization liabilities recognized under IFRS. Similarly, the receivable portion of the swap is captured as part of securitized mortgages
recognized on the Consolidated Balance Sheet under IFRS. The derecognition of the seller swap upon transition results in a reduction of derivative
assets or derivative liabilities on the Bank’s Consolidated Balance Sheet.
The Bank will no longer record securitization gains or losses upon the transfer of financial assets that fail derecognition. Gains and losses relating
to assets recorded on the Bank’s Consolidated Balance Sheet on transition have been reversed. Certain transaction costs that were previously
recorded as part of securitization gains or losses have been capitalized against securitization liabilities.
Retained earnings have increased as a result of interest income earned on securitized mortgages which have been recognized on the Bank’s
Consolidated Balance Sheet under IFRS.
Retained earnings have decreased as a result of interest expense recorded relating to securitization liabilities which have been recognized on the
Bank’s Consolidated Balance Sheet under IFRS.
Under IFRS, assets transferred to the PRA account no longer qualifies for derecognition, as the Bank maintains the risk and rewards of ownership
of those financial assets. These assets have been recognized on the Bank’s Consolidated Balance Sheet resulting in an increase to residential loans,
an increase to trading assets, and a decrease to obligation related to securities sold under repurchase agreements.
Where the Bank has securitized mortgages with CMHC and has received an MBS but has not sold the MBS to a third party, the MBS remains on the
Bank’s Consolidated Balance Sheet as a mortgage. As a result, upon transition to IFRS, available-for-sale securities have decreased and residential
mortgages have increased.
The total impact to the Bank’s IFRS opening Consolidated Balance Sheet is disclosed in the table below: Impact of Derecognition of Financial Instruments (millions of Canadian dollars) As at Nov. 1, 2010 Increase/(decrease) in assets: Trading loans, securities and other $ 5,494 Derivatives (220)Financial assets designated at fair value through profit or loss (918)Available-for-sale securities (25,727)Loans – residential mortgages 65,211 Deferred tax assets 299 Other assets 656 (Increase)/decrease in liabilities: Securitization liabilities at fair value (27,256)Derivatives 1,101 Obligations related to securities sold under repurchase agreements 3,235 Securitization liabilities at amortized cost (23,078)Current income tax payable (63)Deferred tax liabilities (77)Other liabilities 928 Increase/(decrease) in equity $ (415)
The total impact to the Bank’s IFRS opening equity was a decrease of $415 million, comprised of an increase to accumulated other comprehensive income of
$25 million and a decrease to retained earnings of $440 million.
(b) Hedge Accounting: Mandatory Exception Hedge accounting can only be applied to hedging relationships that meet the IFRS hedge accounting criteria upon transition to IFRS. All hedging relationships
that qualify for hedge accounting under IFRS have been documented on the transition date.
Under Canadian GAAP, where a purchased option is a hedging instrument in a designated cash flow hedge accounting relationship, the assessment of
effectiveness may be based on the option’s terminal value and where certain circumstances are met, an entity can assume no ineffectiveness and the entire
change in fair value of the option can be recognized in accumulated other comprehensive income. Under IFRS, an entity must specifically indicate whether the
time value is included or excluded from a hedging relationship and must assess the option for effectiveness. If the time value of the option is excluded,
TD BANK GROUP • 2011 CONSOLIDATED FINANCIAL STATEMENTS AND NOTES 76
changes in the options fair value due to time value are recognized directly in earnings. At transition date, where options were designated in cash flow hedge
accounting relationships, the Bank excluded the changes in fair value of the option due to time value from the hedging relationship. The impact to the Bank’s
IFRS opening Consolidated Balance Sheet as at November 1, 2010 was an increase to accumulated other comprehensive income of $73 million, and a
decrease to opening retained earnings of $73 million.
(c) Employee Benefits i) Employee Benefits: Elective Exemption The Bank has elected to recognize unamortized actuarial gains or losses in its IFRS opening retained earnings. The impact of this election to the Bank’s IFRS
opening Consolidated Balance Sheet as at November 1, 2010 was a decrease to other assets of $933 million, an increase to deferred tax assets of $309
million, an increase to other liabilities of $196 million, and a decrease to opening retained earnings of $820 million.
ii) Employee Benefits: Other Differences between Canadian GAAP and IFRS Measurement Date Under Canadian GAAP, the defined benefit obligation and plan assets may be measured up to three months prior to the date of the financial statements
as long as the measurement date is applied consistently. Under Canadian GAAP, the Bank measured the obligation and assets of its principal pension and
non-pension post-retirement benefit plans as at July 31.
IFRS requires that valuations be performed with sufficient regularity such that the amounts recognized in the financial statements do not differ
materially from amounts that would be determined at the end of the reporting period. Under IFRS, the Bank will measure the assets and obligations of
all defined benefit plans as at October 31.
Defined Benefit Plans – Past Service Costs Canadian GAAP does not differentiate between accounting for the vested and unvested cost of plan amendments, deferring and amortizing both over
the expected average remaining service life of active plan members.
Under IFRS, the cost of plan amendments is recognized immediately in income if it relates to vested benefits; otherwise, they are recognized over the
remaining vesting period.
Defined Benefit Plans – Asset Ceiling Test Under Canadian GAAP, when a defined benefit plan gives rise to a prepaid pension asset, a valuation allowance is recognized for any excess of the
prepaid pension asset over the expected future benefits expected to be realized by the Bank.
Under IFRS, the prepaid pension asset is subject to a ceiling which limits the asset recognized on the Consolidated Balance Sheet to the amount that
is recoverable through refunds of contributions or future contribution holidays.
In addition, under Canadian GAAP, the Bank was not required to recognize regulatory funding deficits. Under IFRS, the Bank is required to record a
liability equal to the present value of all future cash payments required to eliminate any regulatory funding deficits related to its employee benefit plans.
Defined Benefit Plans - Attributing Benefits to Periods of Service Under Canadian GAAP, for a defined benefit plan other than a pension plan, the obligation for employee future benefits should be attributed on a straight-line basis to each year of service in the attribution period unless the plan formula attributes a significantly higher level of benefits to employees’ early years of service. Under those circumstances, the obligation should be attributed based on the plan’s benefit formula.
IFRS requires that benefits be attributed to periods of service either under the plan benefit formula or on a straight-line basis from the date when service first leads to benefits to the date when further service will lead to no material amount of further benefits, other than from further salary increases. For the Bank’s principal non-pension post-retirement plan, benefits are not earned until certain criteria are met. As a result, the attribution period will be shorter under IFRS, resulting in a reduction in the accrued benefit liability on transition to IFRS.
The impact of these other employee benefit differences between Canadian GAAP and IFRS to the Bank’s IFRS opening Consolidated Balance Sheet as at
November 1, 2010 was a decrease to other assets of $95 million, an increase to deferred tax assets of $26 million, an increase to other liabilities of $8
million, and a decrease to opening retained earnings of $77 million.
(d) Business Combinations: Elective Exemption As permitted under IFRS transition rules, the Bank has applied IFRS 3, Business Combinations (IFRS 3) to all business combinations occurring on or after
January 1, 2007. Certain differences exist between IFRS and Canadian GAAP in the determination of the purchase price allocation. The most significant
differences are described below.
Under Canadian GAAP, an investment in a subsidiary which is acquired through two or more purchases is commonly referred to as a “step acquisition”.
Each transaction is accounted for as a step-by-step purchase, and is recognized at the fair value of the net assets acquired at each step. Under IFRS, the
accounting for step acquisitions differs depending on whether a change in control occurs. If change in control occurs, the acquirer remeasures any previously
held equity investment at its acquisition-date fair value and recognizes any resulting gain or loss in the Consolidated Statement of Income. Any transactions
subsequent to obtaining control are recognized as equity transactions.
Under Canadian GAAP, shares issued as consideration are measured at the market price over a reasonable time period before and after the date the terms
of the business combination are agreed upon and announced. Under IFRS, shares issued as consideration are measured at their market price on the closing
date of the acquisition.
TD BANK GROUP • 2011 CONSOLIDATED FINANCIAL STATEMENTS AND NOTES 77
Under Canadian GAAP, an acquirer’s restructuring costs to exit an activity or to involuntarily terminate or relocate employees are recognized as a liability in
the purchase price allocation. Under IFRS, these costs are generally expensed as incurred and not included in the purchase price allocation.
Under Canadian GAAP, costs directly related to the acquisition (i.e., finder fees, advisory, legal, etc.) are included in the purchase price allocation, while
under IFRS these costs are expensed as incurred and not included in the purchase price allocation.
Under Canadian GAAP, contingent consideration is recorded when the amount can be reasonably estimated at the date of acquisition and the outcome is
determinable beyond reasonable doubt, while under IFRS contingent consideration is recognized immediately in the purchase price equation at fair value and
marked to market as events and circumstances change in the Consolidated Statement of Income.
The impact of the differences between Canadian GAAP and IFRS to the Bank’s IFRS opening Consolidated Balance Sheet is disclosed in the table below.
Business Combinations: Elective Exemption (millions of Canadian dollars) As at
Nov. 1, 2010
Increase/(decrease) in assets: Available-for-sale securities $ (1)Goodwill (2,147)Loans – residential mortgages 22 Loans – consumer instalment and other personal – Loans – business and government – Intangibles (289)Land, buildings and equipment and other depreciable assets 2 Deferred tax assets (12)Other assets 104 (Increase)/decrease in liabilities: Deferred tax liabilities 102 Other liabilities 37 Subordinated notes and debentures 2
Increase/(decrease) in equity $ (2,180)
The total impact of business combination elections to the Bank’s IFRS opening equity was a decrease of $2,180 million, comprised of a decrease to common
shares of $926 million, a decrease to contributed surplus of $85 million and a decrease to retained earnings of $1,169 million.
(e) Designation of Financial Instruments: Elective Exemption Under IAS 39, Financial Instruments: Recognition and Measurement, entities are permitted to make certain designations only upon initial recognition. IFRS 1 provides entities with an opportunity to make these designations on the date of transition to IFRS provided the asset or liability meets certain criteria specified under IFRS at that date. The Bank has designated certain held-to-maturity financial assets to available-for-sale financial assets. The impact of this designation on the Bank’s IFRS opening Consolidated Balance Sheet as at November 1, 2010 was an increase to available-for-sale securities of $9,937 million, a decrease to held-to-maturity securities of $9,715 million, an increase to deferred tax liabilities of $57 million, and an increase to opening equity of $165 million. The total impact to the Bank’s opening equity comprised of an increase to accumulated other comprehensive income of $165 million and no impact to retained earnings. (f) Cumulative Translation Differences: Elective Exemption The Bank has elected to reclassify all cumulative translation differences on its foreign operations net of hedging activities which were recorded in accumulated other comprehensive income, to retained earnings on transition. As a result, the Bank has reclassified the entire balance of cumulative translation losses at transition date of $2,947 million from accumulated other comprehensive income into retained earnings, with no resulting net impact on equity. (g) Loan Origination Costs: Other Differences between Canadian GAAP and IFRS Under Canadian GAAP, costs that are directly attributable to the origination of a loan, which include commitment costs, were deferred and recognized as an adjustment to the loan yield over the expected life of the loan using the effective interest rate method. Under IFRS, loan origination costs must be both directly attributable and incremental to the loan origination in order to be deferred and amortized and recognized as a yield adjustment over the expected life of the loan. On transition to IFRS certain costs that were previously permitted to be deferred under Canadian GAAP have been expensed into opening retained earnings as they are not considered to be incremental to the loan origination. The impact of this difference to the Bank’s IFRS opening Consolidated Balance Sheet as at November 1, 2010 was a decrease to loans of $458 million and other assets of $88 million, an increase to deferred tax assets of $155 million, and a decrease to opening retained earnings of $391 million. (h) Consolidation: Other Differences between Canadian GAAP and IFRS The control and consolidation of an entity is evaluated under Canadian GAAP using two different models. The variable interest model applies when an entity holds a variable interest in a variable interest entity (VIE). If an entity is not a VIE, consolidation is assessed under the voting interest model, where voting rights or governance provisions will determine which party consolidates the entity. In addition, entities that are structured to meet specific characteristics such as Qualifying Special Purpose Entities (QSPE) are exempt from the consolidation guidance. IFRS guidance on consolidation is based on the principles of control. Control is defined as the power to govern the financial and operating policies of an entity so as to obtain benefits from its activities. The power of control can be obvious, for example, through the holding of a majority of voting rights. When control is not apparent, such as when the entity is a SPE, consolidation is based on an overall assessment of all the relevant facts, including an assessment of
TD BANK GROUP • 2011 CONSOLIDATED FINANCIAL STATEMENTS AND NOTES 78
risks and rewards. Typically, the party with the majority of rewards or exposure to the residual risk must consolidate the entity. In contrast to Canadian GAAP, there is no such concept as a QSPE. Under IFRS, the Bank must consolidate certain entities that are not consolidated under Canadian GAAP, including certain former QSPEs and various capital structures. Consolidation of any previously unconsolidated entities have resulted in increased assets, liabilities, and non-controlling interest, as disclosed in the table below.
Consolidation: Other Adjustments (millions of Canadian dollars) As at
Nov. 1, 2010
Increase/(decrease) in assets: Trading loans, securities and other $ (795)Derivatives 15 Available-for-sale securities (5)Loans - consumer instalment and other personal 6,554 Deferred tax assets 21 Other assets (9)(Increase)/decrease in liabilities: Derivatives 1 Deposits - banks 7 Deposits - business and government 2,100 Obligations related to securities sold short 4 Current tax payable 3 Other liabilities (5,889)Subordinated notes and debentures 255 Liability for capital trust securities (2,344)
Increase/(decrease) in equity $ (82)
As noted in the table above, the total impact to the Bank’s opening equity was a decrease of $82 million, comprised of a decrease to contributed surplus of
$1 million and a decrease to retained earnings of $81 million.
(i) Share-based Payments: Other Differences between Canadian GAAP and IFRS Under Canadian GAAP, the cost of share-based payments was recognized from the date awards were granted over the service period required for employees to become fully entitled to the award. Under IFRS, the cost of share-based payments is recognized over the period that an employee provides the service to earn the award. This includes a period prior to the grant date where employees are considered to have provided service in respect of the awards during that period. Under Canadian GAAP, the Bank did not recognize an expense prior to the grant date. The impact of this difference to the Bank’s IFRS opening Consolidated Balance Sheet as at November 1, 2010 was an increase to deferred tax assets of $44 million, an increase to other liabilities of $151 million, and a decrease to opening equity of $107 million. The total impact to the Bank’s opening equity comprised of an increase to contributed surplus of $16 million, a decrease to accumulated other comprehensive income of $10 million and a decrease to retained earnings of $113 million. Under IFRS, a first-time adopter is encouraged but not required to apply IFRS 2, Share-based Payment, to liabilities arising from share-based payment transactions that were settled before the transition date and to equity instruments that were unvested at transition. The Bank has taken this exemption and has not applied IFRS 2, to liabilities settled prior to the transition date or to equity instruments which were vested at November 1, 2010. (j) Income Taxes: Other Differences between Canadian GAAP and IFRS Income tax related adjustments result from differences in accounting for income taxes between Canadian GAAP and IFRS income tax accounting standards as well as the tax impact of all other transitional adjustments.
i) Adjustments Related to Income Tax Accounting Standard Differences Under Canadian GAAP, the deferred tax liability related to the Bank’s investments in associates is calculated based on the presumption that temporary
differences will reverse through disposition unless there is persuasive evidence that it will be reversed through the receipt of dividends.
Under IFRS, unless there is evidence that the investment will be disposed of in the foreseeable future, the deferred tax liability on such temporary
differences is calculated on the basis that it will be recovered through the receipt of dividends.
The impact of all income tax accounting standard differences to the Bank’s Consolidated Balance Sheet as at November 1, 2010 was an increase to
deferred tax assets of $1 million, an increase to deferred tax liabilities of $73 million, and a decrease to opening equity of $72 million. The total impact to
the Bank’s equity comprised of an increase to accumulated other comprehensive income of $6 million and a decrease to retained earnings of $78 million. ii) Income Tax Effect of Other Adjustments between Canadian GAAP and IFRS Differences for income taxes include the effect of recording, where applicable, the deferred tax effect on transition adjustments between Canadian GAAP and IFRS. The impact to the Bank’s Consolidated Balance Sheet is disclosed with the related IFRS difference throughout this note.

TD BANK GROUP • 2011 CONSOLIDATED FINANCIAL STATEMENTS AND NOTES 79
(k) Securities Classified as Available-for-Sale: Other Differences between Canadian GAAP and IFRS Under Canadian GAAP, equity securities that are classified as available-for-sale and do not have a quoted market price are recorded at cost. Under IFRS, these equity securities are recorded at fair value when there is a reliable fair value. The impact of this difference to the Bank’s IFRS opening Consolidated Balance Sheet as at November 1, 2010 was an increase to the available-for-sale securities of $128 million, an increase to deferred tax liabilities of $38 million, and an increase to opening equity of $90 million. The total impact to the Bank’s opening equity comprised of an increase to accumulated other comprehensive income of $90 million and no impact to retained earnings. (l) Other: Other Differences between Canadian GAAP and IFRS Other IFRS differences relate primarily to the accounting of foreign exchange for equity method investments and for AFS securities. The total impact to the Bank’s opening IFRS equity was a decrease of $34 million, comprised of an increase to retained earnings of $11 million, and a decrease to accumulated other comprehensive income of $45 million. (m) Summary of Key Financial Statement Presentation Differences between Canadian GAAP and IFRS Reclassification of Non-controlling Interests in Subsidiaries Under Canadian GAAP, non-controlling interests in subsidiaries was presented above shareholders’ equity. Under IFRS, non-controlling interests in subsidiaries is classified as a component of equity, but is presented separately from the Bank’s shareholder’s equity.
The impact of this presentation change to the Bank’s Consolidated Balance Sheet as at November 1, 2010 was a decrease to non-controlling interests in subsidiaries of $1,493 million and an increase to equity – non-controlling interests in subsidiaries of $1,493 million. Reclassification of Provisions Under Canadian GAAP, provisions related to contingent liabilities were recognized within other liabilities within the Bank’ s Canadian GAAP Consoldiated Balance Sheet. Under IFRS, provisions related to contingent liabilities have been reclassified to a separate line within the Bank’s opening IFRS Consolidated Balance Sheet.
NOTE 35 SUBSEQUENT EVENT
Acquisition of Credit Card Portfolio of MBNA Canada On or about December 1, 2011, the Bank is expected to complete the acquisition of substantially all of the credit card portfolio of MBNA Canada, a wholly-
owned subsidiary of Bank of America Corporation, as well as certain other assets and liabilities. At closing, the Bank will pay a premium of approximately $75
million on the portfolio, which is expected to total approximately $7.8 billion at December 1, 2011. The acquisition will be accounted for by the purchase
method.