Fundamentals of Radiometry & Photometry -...
37
Fundamentals of Radiometry & Photometry Optical Engineering Prof. Elias N. Glytsis School of Electrical & Computer Engineering National Technical University of Athens 15/03/2018
Transcript of Fundamentals of Radiometry & Photometry -...

Fundamentals of Radiometry & Photometry
Optical Engineering Prof. Elias N. Glytsis
School of Electrical & Computer Engineering National Technical University of Athens
15/03/2018

Radiometric and Photometric Quantities
2 Prof. Elias N. Glytsis, School of ECE, NTUA

Prof. Elias N. Glytsis, School of ECE, NTUA 3
Radiance and Luminance
From “Introduction of Radiometry and Photometry”, McCluney Artech House 1994
A
R
Ω
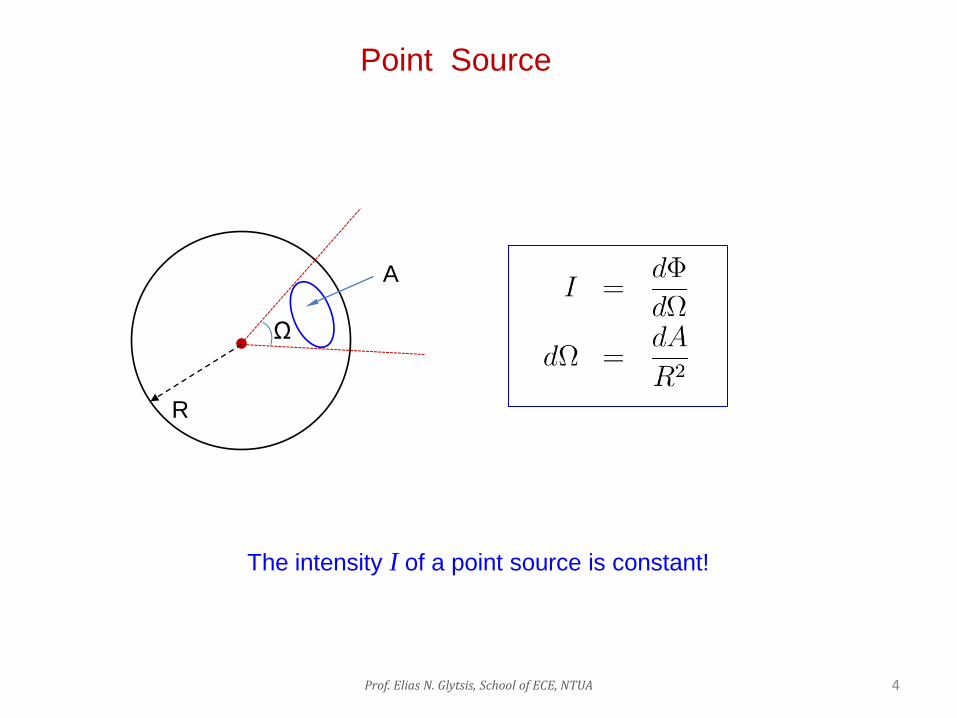
Point Source
The intensity I of a point source is constant!
4 Prof. Elias N. Glytsis, School of ECE, NTUA

Point Source (continue)
R
R΄
dA
dA’
θ
dΩ’
dΩ
dA
5 Prof. Elias N. Glytsis, School of ECE, NTUA

Lambertian Source
Intensity and Radiance
Lambert’s Law
As θ
Extended Source
6 Prof. Elias N. Glytsis, School of ECE, NTUA
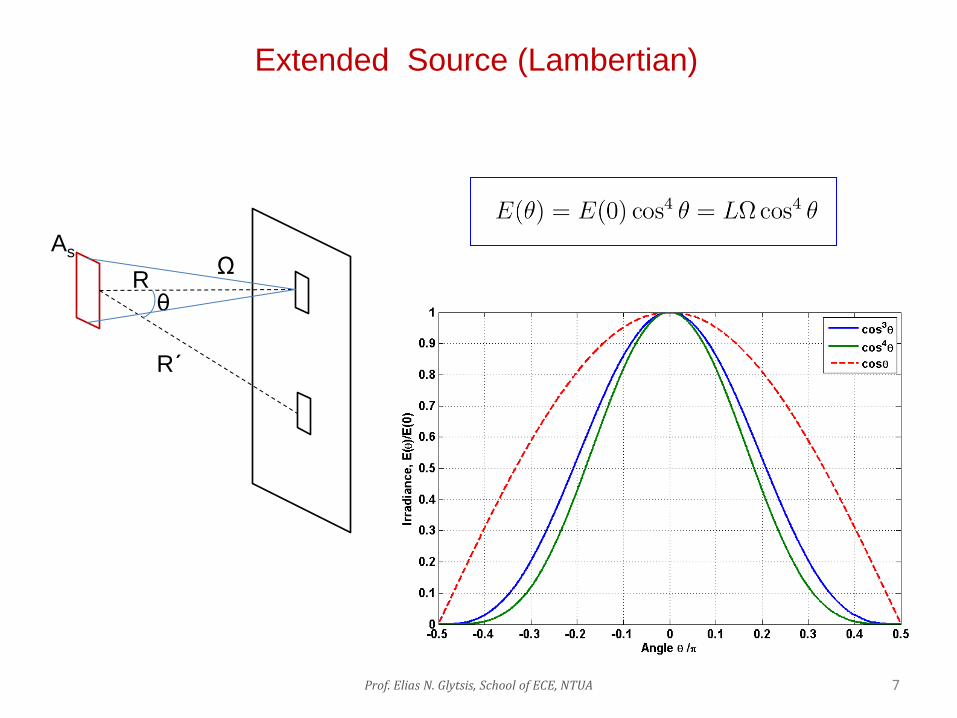
Extended Source (Lambertian)
As
R
R΄
θ Ω
7 Prof. Elias N. Glytsis, School of ECE, NTUA

Human Eye – Cones and Rods Photoreceptors
http://webvision.med.utah.edu/imageswv/Ostergr.jpeg
8 Prof. Elias N. Glytsis, School of ECE, NTUA
Prof. Elias N. Glytsis, School of ECE, NTUA 9
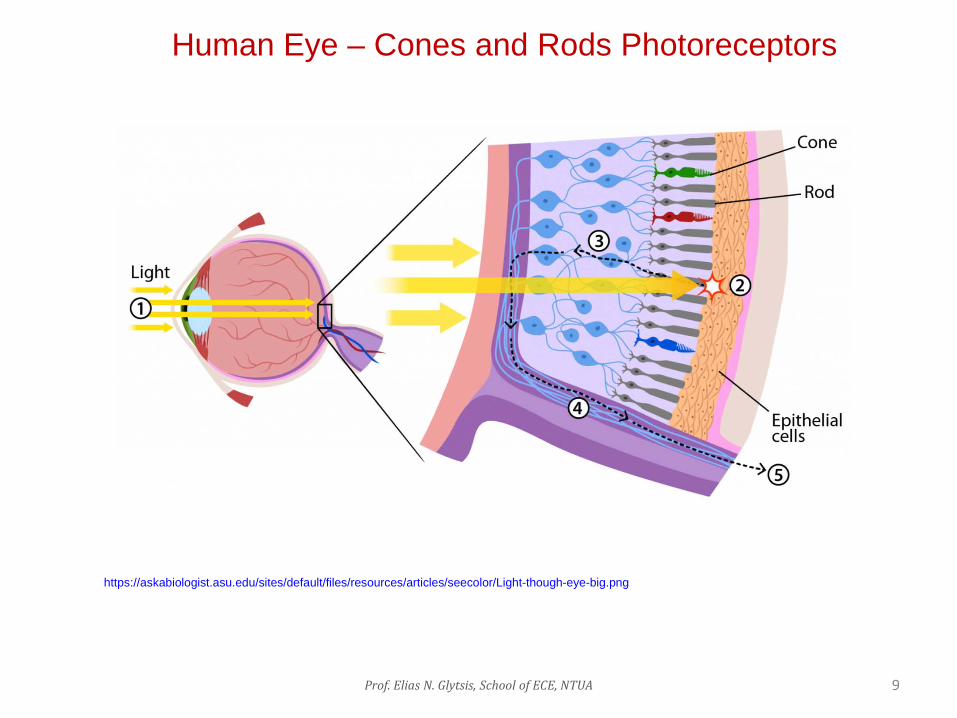
Human Eye – Cones and Rods Photoreceptors
https://askabiologist.asu.edu/sites/default/files/resources/articles/seecolor/Light-though-eye-big.png

Human Eye – Cones and Rods Photoreceptors
E. F. Schubert, Light Emitting Diodes, 2nd Ed., Cambridge University Press, 2006
10 Prof. Elias N. Glytsis, School of ECE, NTUA

Human Eye – Cones and Rods Photoreceptors
Rod and Cone photoreceptors in mammalian retina. A) A human retinal section showing three neuronal cell layers: outer nuclear layer (ONL) containing the nucleus of rods and cones; inner nuclear layer (INL) containing the nucleus of bipolar, horizontal and amacrine and Muller glial cells; gonglion cell layer (GCL). B) Diagram of rod and cone structure. C) Scan EM showing the outer segments
http://vrcore.wustl.edu/portals/chen_shiming/Chen_S_Photo4.jpg
11 Prof. Elias N. Glytsis, School of ECE, NTUA

Because no neuroepithelial cell is present in the portion of the retina where the optic nerve penetrates, this portion cannot sense light and is called the blind spot. The blind spot is located at an angle of 15° from the line of sight (optical axis) and is about 5° wide. This can be confirmed readily by a visual experiment using Figure 1.7. If the observer fixates his/her right eye on the cross while closing his/her left eye and adjusting the distance between the eye and the cross to about 20 cm, the solid circle disappears from sight. This occurs because the solid circle is imaged on the blind spot.
N. Ohta and A. R. Robertson, “Colorimetry”, J. Wiley & Sons, 2005
Detection of the Blind Spot
12 Prof. Elias N. Glytsis, School of ECE, NTUA
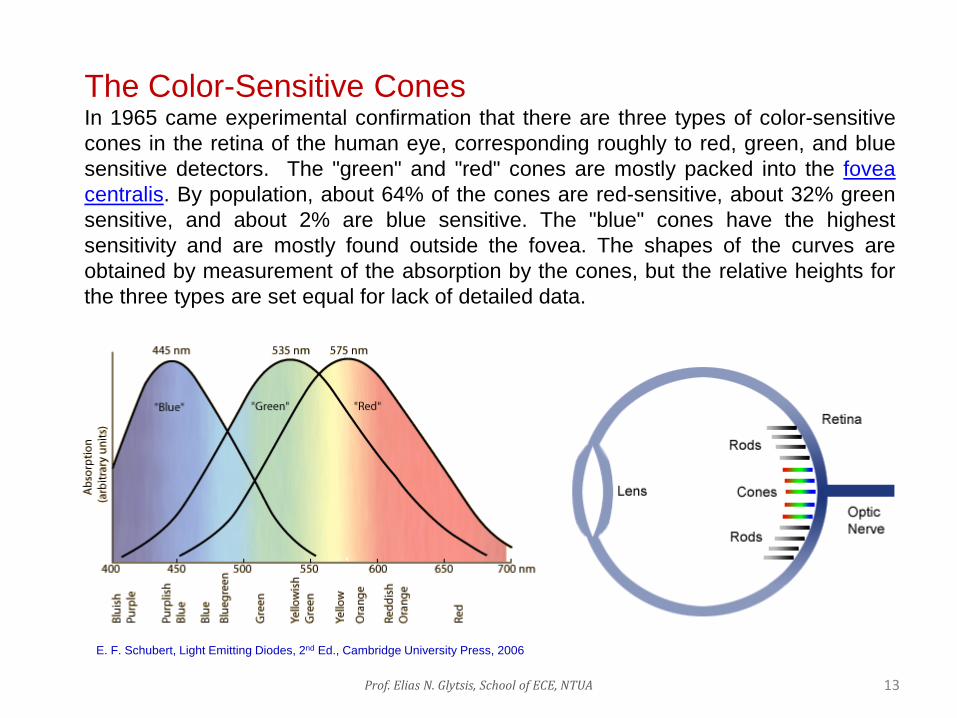
The Color-Sensitive Cones In 1965 came experimental confirmation that there are three types of color-sensitive cones in the retina of the human eye, corresponding roughly to red, green, and blue sensitive detectors. The "green" and "red" cones are mostly packed into the fovea centralis. By population, about 64% of the cones are red-sensitive, about 32% green sensitive, and about 2% are blue sensitive. The "blue" cones have the highest sensitivity and are mostly found outside the fovea. The shapes of the curves are obtained by measurement of the absorption by the cones, but the relative heights for the three types are set equal for lack of detailed data.
E. F. Schubert, Light Emitting Diodes, 2nd Ed., Cambridge University Press, 2006
13 Prof. Elias N. Glytsis, School of ECE, NTUA

The Color-Sensitive of Cones and Rods
E. F. Schubert, Light Emitting Diodes, 2nd Ed., Cambridge University Press, 2006
14 Prof. Elias N. Glytsis, School of ECE, NTUA
Number of Cones: 6-7 millions, 12:6:1 to 40:20:1/R-G-B Number of Rods: 120 millions
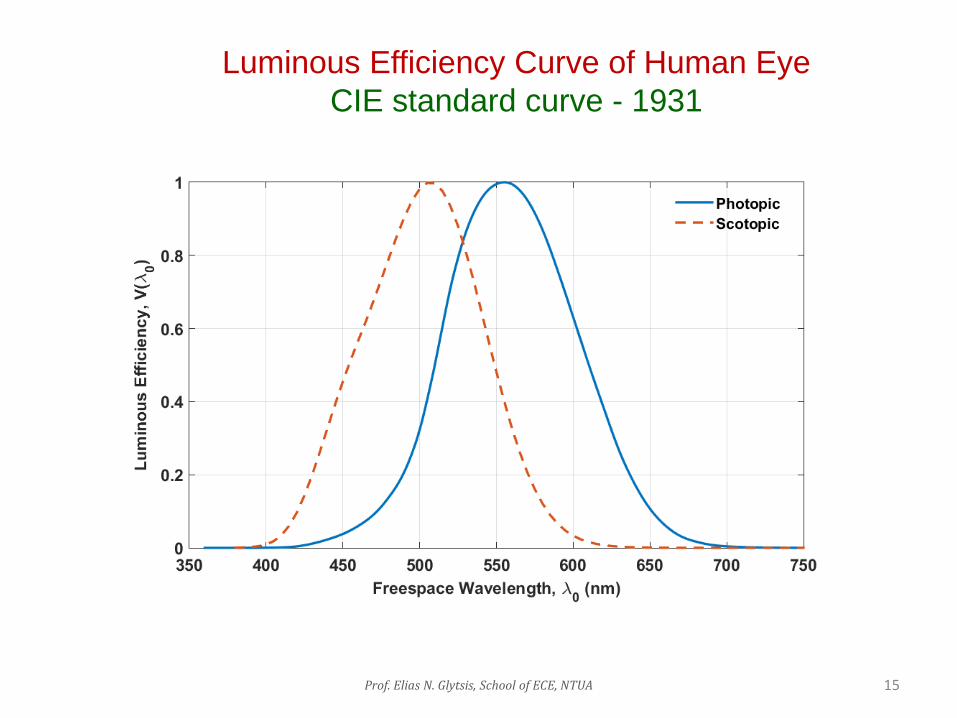
Luminous Efficiency Curve of Human Eye CIE standard curve - 1931
15 Prof. Elias N. Glytsis, School of ECE, NTUA

Vision Regimes
Scotopic Vision Regime < 0.003 cd/m2
0.003 cd/m2 < Mesopic Vision Regime < 3 cd/m2
3 cd/m2 < Photopic Vision Regime
16 Prof. Elias N. Glytsis, School of ECE, NTUA

History of Photometric Units
E. F. Schubert, Light Emitting Diodes, 2nd Ed., Cambridge University Press, 2006
• First definition (now obsolete): The luminous intensity of a standardized candle is 1 cd. • Second definition (now obsolete): 1 cm2 of platinum (Pt) at 2042°K (temperature of solidification) has a luminous intensity of 20.17 cd.
• Third definition (current): A monochromatic light source emitting an optical power of (1/683) Watt at 555 nm into the solid angle of 1 steradian (sr) has a luminous intensity of 1 cd.
17 Prof. Elias N. Glytsis, School of ECE, NTUA

Luminous Flux and Efficiency
E. F. Schubert, Light Emitting Diodes, 2nd Ed., Cambridge University Press, 2006
18 Prof. Elias N. Glytsis, School of ECE, NTUA

Category
Type
Overall luminous efficacy
(lm/W)
Overall luminous efficiency
Combustion candle 0.3 0.04% gas mantle 1–2 0.15–0.3%
Incandescent 100–200 W tungsten incandescent (220 V) 13.8–15.2 2.0–2.2%
100–200–500 W tungsten glass halogen (220 V) 16.7 – 17.6 –19.8 2.4–2.6–2.9%
5–40–100 W tungsten incandescent (120 V) 5–12.6–17.5 0.7–1.8–2.6%
2.6 W tungsten glass halogen (5.2 V) 19.2 2.8%
tungsten quartz halogen (12–24 V) 24 3.5%
photographic and projection lamps 35 5.1%
Light-emitting diode white LED (raw, without power supply) 4.5–150 0.66–22.0%
4.1 W LED screw base lamp (120 V) 58.5–82.9 8.6–12.1%
6.9 W LED screw base lamp (120 V) 55.1–81.9 8.1–12.0%
7 W LED PAR20 (120 V) 28.6 4.2%
8.7 W LED screw base lamp (120 V) 69.0–93.1 10.1–13.6%
Arc lamp xenon arc lamp 30–50 4.4–7.3% mercury-xenon arc lamp 50–55 7.3–8.0%
Fluorescent T12 tube with magnetic ballast 60 9%
9–32 W compact fluorescent 46–75 8–11.45%
T8 tube with electronic ballast 80–100 12–15% T5 tube 70–104.2 10–15.63%
Gas discharge 1400 W sulfur lamp 100 15% metal halide lamp 65–115 9.5–17% high pressure sodium lamp 85–150 12–22% low pressure sodium lamp 100–200 15–29%
Ideal sources Truncated 5800 K blackbody 251 37%
Green light at 555 nm (maximum possible LER) 683.002 100%
https://en.wikipedia.org/wiki/Luminous_efficacy 19 Prof. Elias N. Glytsis, School of ECE, NTUA

TYPICAL VALUES OF ILLUMINANCE
ILLUMINANCE (footcandles) ILLUMINATION SITUATION
0.02 Full moonlight
50 Artificial Illuminated Interiors
100 Sunlight (dull day)
5000-10000 Sunlight (bright day)
RECOMMENDED VALUES OF ILLUMINANCE
ILLUMINANCE (footcandles) ILLUMINATION SITUATION
5-10 Halls, aisles, auto parking areas
10-20 Stairways, storage rooms, dining rooms, bedrooms, auditoriums
20-50 Rough assembly, materials wrapping, average workshop, reading usual
prints
50-100 Medium assembly work, kitchens, reading fine print, sewing, writing,
workbench, barber shops
100-200 Drafting rooms, severe visual work, extra fine grading and sorting,
difficult inspection
200-500 Fine bench and machine work, very difficult inspection
1 footcandle = 1 lumen/ft2 = 10.7639 lumen/m2 = 10.7639 lux
ILLUMINATION VALUES (from I.E.S. Lighting Hndbook)
20 Prof. Elias N. Glytsis, School of ECE, NTUA

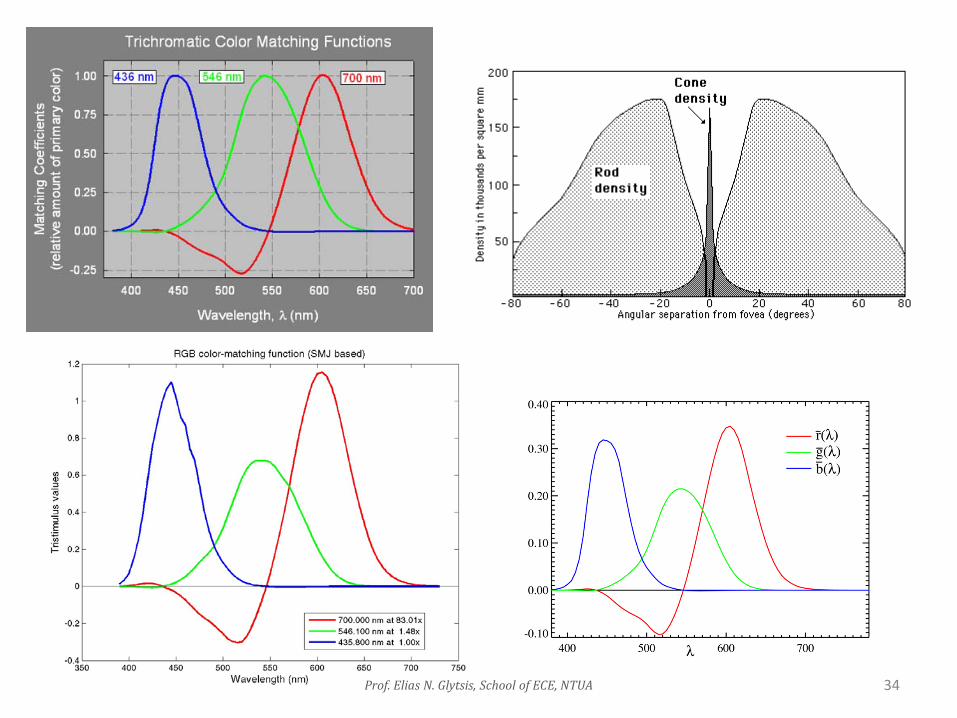
Color Matching Functions Experiment
Primaries Used (1931) Red: 700nm Green: 546.1nm Blue: 435.8nm (Mercury discharge lamp)
21 Prof. Elias N. Glytsis, School of ECE, NTUA
N. Ohta and A. R. Robertson, Colorimetry: Fundamentals and Applications, J. Wiley & Sons, 2005

RGB Color Matching Functions
RGB color matching functions Stiles-Burch 10° color matching functions averaged across 37 observers (adapted from Wyszecki & Stiles, 1982)
Tristimulus Values Chromaticity Coordinates
22 Prof. Elias N. Glytsis, School of ECE, NTUA

Color Matching Functions
23 Prof. Elias N. Glytsis, School of ECE, NTUA

Color Matching Functions and Chromaticity
E. F. Schubert, Light Emitting Diodes, 2nd Ed., Cambridge University Press, 2006
Transformation between XYZ and RGB
N. Ohta and A. R. Robertson, Colorimetry: Fundamentals and Applications, J. Wiley & Sons, 2005
24 Prof. Elias N. Glytsis, School of ECE, NTUA

CIE 1931 – x,y Chromaticity Diagram
25 Prof. Elias N. Glytsis, School of ECE, NTUA

CIE 1931 – x,y Chromaticity Diagram
26 Prof. Elias N. Glytsis, School of ECE, NTUA
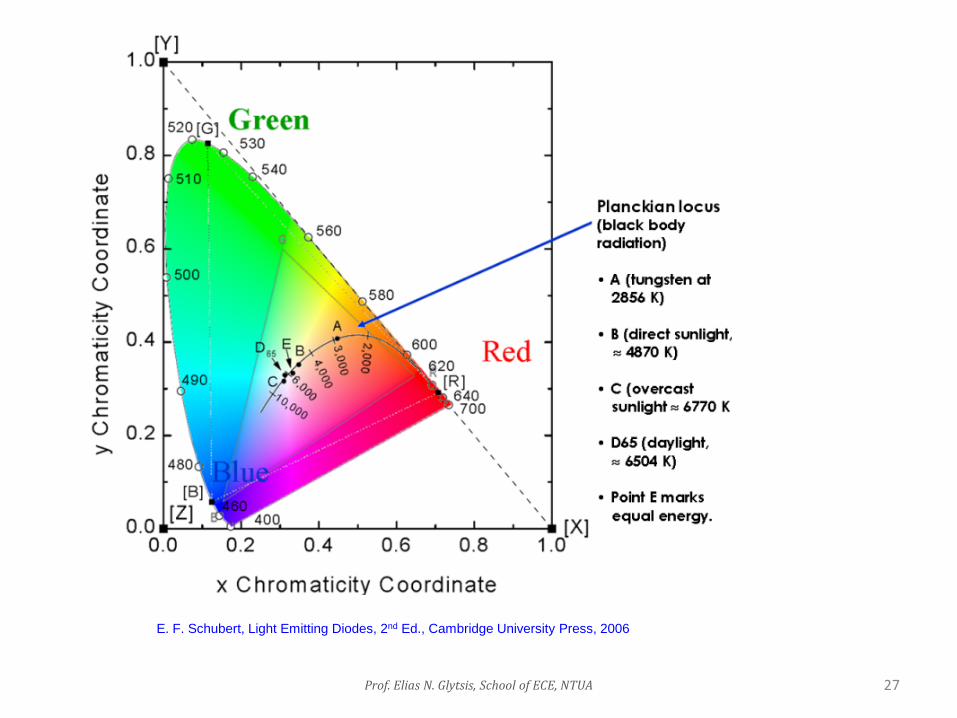
E. F. Schubert, Light Emitting Diodes, 2nd Ed., Cambridge University Press, 2006
27 Prof. Elias N. Glytsis, School of ECE, NTUA

Color Mixing
E. F. Schubert, Light Emitting Diodes, 2nd Ed., Cambridge University Press, 2006
28 Prof. Elias N. Glytsis, School of ECE, NTUA

Additive Colors and Color Mixing Colored lights are mixed using additive color properties. Light colors are combining two or more additive colors together which creates a lighter color that is closer to white. Examples of additive color sources include computers and televisions.
The additive primary colors are red, green and blue (RGB). Combining one of these additive primary colors with equal amounts of another one results in the additive secondary colors of cyan, magenta and yellow. Combining all three additive primary colors in equal amounts will produce the color white. Remember combing additive colors creates lighter colors, so adding all three primary colors results in a color so "light" it's actually seen as white. Although that may seem strange, if you think of the absence of all light equaling black, it begins to make sense that adding different colors creates white.
http://www.colorbasics.com/AdditiveSubtractiveColors/
Additive Colors Combined in Equal Parts
Blue + Green = Cyan
Red + Blue = Magenta
Green + Red = Yellow
Red + Green + Blue = White
29 Prof. Elias N. Glytsis, School of ECE, NTUA
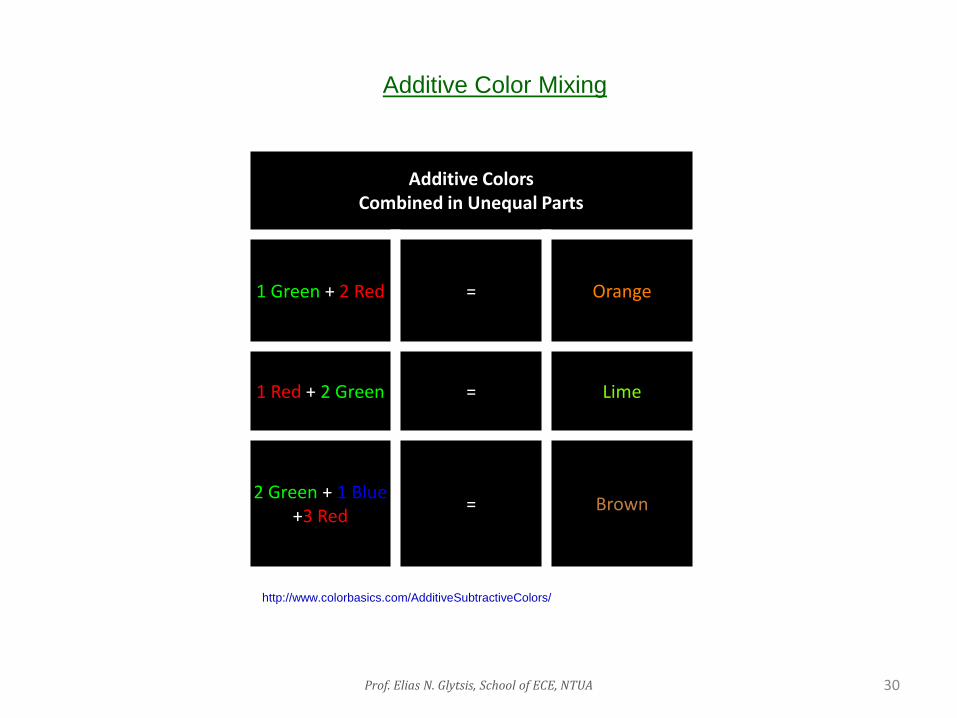
Additive Colors Combined in Unequal Parts
1 Green + 2 Red = Orange
1 Red + 2 Green = Lime
2 Green + 1 Blue +3 Red = Brown
Additive Color Mixing
http://www.colorbasics.com/AdditiveSubtractiveColors/
30 Prof. Elias N. Glytsis, School of ECE, NTUA
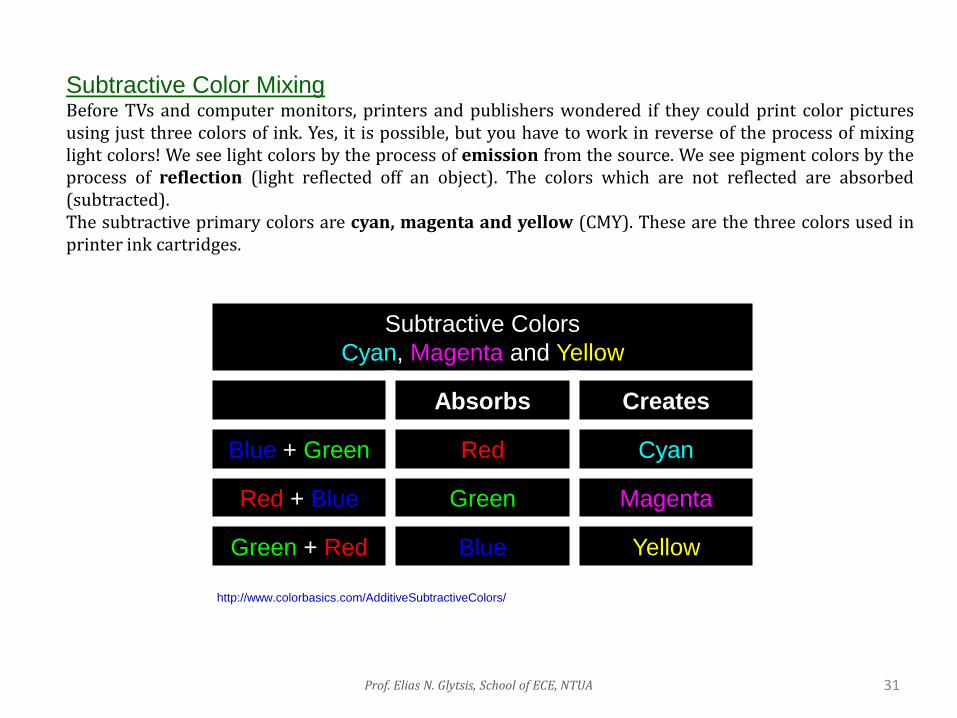
Subtractive Color Mixing Before TVs and computer monitors, printers and publishers wondered if they could print color pictures using just three colors of ink. Yes, it is possible, but you have to work in reverse of the process of mixing light colors! We see light colors by the process of emission from the source. We see pigment colors by the process of reflection (light reflected off an object). The colors which are not reflected are absorbed (subtracted). The subtractive primary colors are cyan, magenta and yellow (CMY). These are the three colors used in printer ink cartridges.
Subtractive Colors Cyan, Magenta and Yellow
Absorbs Creates
Blue + Green Red Cyan
Red + Blue Green Magenta
Green + Red Blue Yellow
http://www.colorbasics.com/AdditiveSubtractiveColors/
31 Prof. Elias N. Glytsis, School of ECE, NTUA

Subtractive Colors Mixing
Combine Absorbs Leaves
Cyan + Magenta Red + Green Blue
Cyan + Yellow Red + Blue Green
Magenta + Yellow Green + Blue Red
Cyan + Magenta + Yellow
Red + Green + Blue Black
Subtractive Color Mixing
http://www.colorbasics.com/AdditiveSubtractiveColors/
32 Prof. Elias N. Glytsis, School of ECE, NTUA
Prof. Elias N. Glytsis, School of ECE, NTUA 33
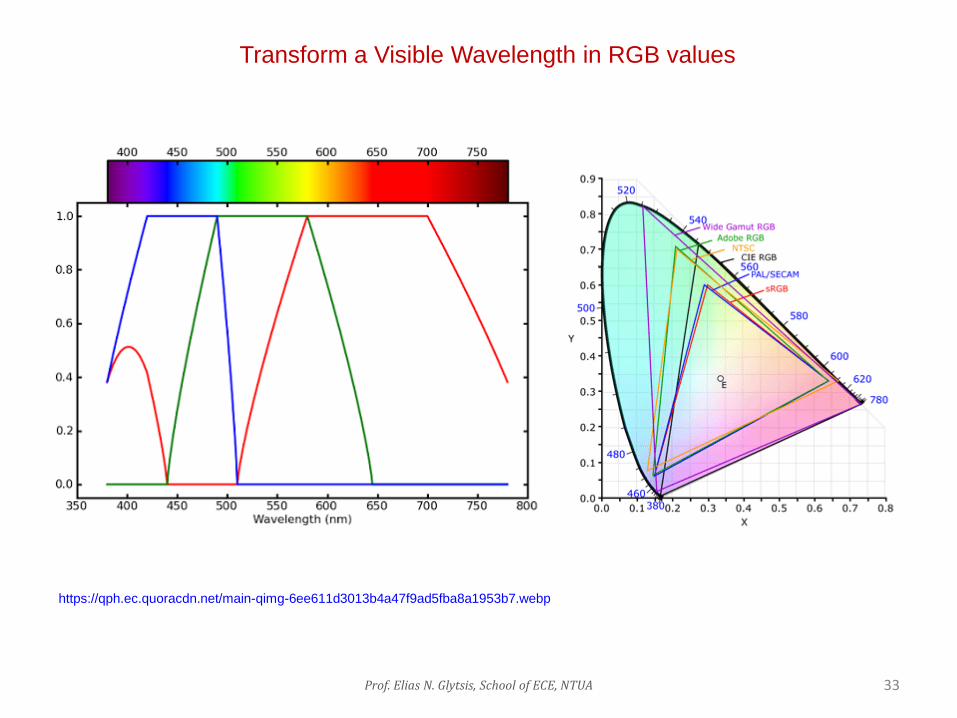
Transform a Visible Wavelength in RGB values
https://qph.ec.quoracdn.net/main-qimg-6ee611d3013b4a47f9ad5fba8a1953b7.webp
34 Prof. Elias N. Glytsis, School of ECE, NTUA

https://briankoberlein.com/2015/04/08/blinded-by-the-light/
35 Prof. Elias N. Glytsis, School of ECE, NTUA

Prof. Elias N. Glytsis, School of ECE, NTUA 36
https://www.dial.de/en/blog/article/efficiency-of-ledsthe-highest-luminous-efficacy-of-a-white-led/

Prof. Elias N. Glytsis, School of ECE, NTUA 37