
For personal use only - ASX · The Group's functional and presentation currency is Australian...
72
Optiscan Imaging Limited ABN 81 077 771 987 Annual Financial Report for the year ended 30 June 2012 For personal use only
Transcript of For personal use only - ASX · The Group's functional and presentation currency is Australian...

Optiscan Imaging Limited ABN 81 077 771 987
Annual Financial Report
for the year ended 30 June 2012
For
per
sona
l use
onl
y

Optiscan Imaging Limited Annual Report 2012
Page | 2
Contents
CORPORATE INFORMATION .......................................................................................................................... 3 DIRECTORS’ REPORT ..................................................................................................................................... 4 AUDITOR INDEPENDENCE AND NON-AUDIT SERVICES .......................................................................... 15 CORPORATE GOVERNANCE STATEMENT ................................................................................................ 16 STATEMENT OF FINANCIAL POSITION ....................................................................................................... 18 STATEMENT OF COMPREHENSIVE INCOME ............................................................................................. 19 STATEMENT OF CHANGES IN EQUITY ....................................................................................................... 20 STATEMENT OF CASH FLOWS .................................................................................................................... 21 NOTES TO THE FINANCIAL STATEMENTS ................................................................................................. 22 1 CORPORATE INFORMATION .............................................................................................................. 22
2 SUMMARY OF SIGNIFICANT ACCOUNTING POLICIES .................................................................... 22
3 FINANCIAL RISK MANAGEMENT OBJECTIVES AND POLICIES ...................................................... 39 4 SIGNIFICANT ACCOUNTING JUDGEMENTS, ESTIMATES AND ASSUMPTIONS .......................... 43
5 SEGMENT INFORMATION ................................................................................................................... 44
6 REVENUES AND EXPENSES .............................................................................................................. 47
7 INCOME TAX ......................................................................................................................................... 48
8 EARNINGS (LOSS) PER SHARE ......................................................................................................... 50 9 CASH AND CASH EQUIVALENTS ....................................................................................................... 51
10 TRADE AND OTHER RECEIVABLES .................................................................................................. 52
11 INVENTORIES ...................................................................................................................................... 53
12 PREPAYMENTS ..................................................................................................................................... 53
13 PLANT AND EQUIPMENT ..................................................................................................................... 53
14 TRADE AND OTHER PAYABLES ......................................................................................................... 54 15 INTEREST BEARING LOANS AND BORROWINGS ............................................................................ 55
16 FINANCING FACILITIES ....................................................................................................................... 56
17 PROVISIONS ......................................................................................................................................... 57
18 CONTRIBUTED EQUITY AND RESERVES ......................................................................................... 58
19 PARENT ENTITY INFORMATION ........................................................................................................ 60
20 RELATED PARTY DISCLOSURE ......................................................................................................... 60 21 KEY MANAGEMENT PERSONNEL ...................................................................................................... 61
22 SHARE-BASED PAYMENT PLANS ..................................................................................................... 64
23 DERIVATIVES AND HEDGING ............................................................................................................. 66
24 COMMITMENTS AND CONTINGENCIES ............................................................................................ 66
25 EVENTS AFTER THE BALANCE SHEET DATE .................................................................................. 67
26 AUDITORS’ REMUNERATION ............................................................................................................. 67 DIRECTORS’ DECLARATION ........................................................................................................................ 68
INDEPENDENT AUDIT REPORT TO MEMBERS OF OPTISCAN IMAGING LIMITED ................................ 69 PATENT INFORMATION ................................................................................................................................ 71 Summary of Key Optiscan Patents .................................................................................................................. 71 ASX ADDITIONAL INFORMATION ................................................................................................................. 72
For
per
sona
l use
onl
y

Optiscan Imaging Limited Annual Report 2012
Page | 3
Corporate Information
ABN 81 077 771 987 This annual report covers both Optiscan Imaging Limited as an individual entity and the consolidated entity comprising Optiscan Imaging Limited and its subsidiaries. The Group's functional and presentation currency is Australian Dollars AUD ($). A description of the Group's operations and of its principal activities is included in the review of operations and activities in the directors' report on pages 4 to 15. The directors' report is not part of the financial report. Directors
A. M. Holt (Chairman) P. M. Delaney B.R. Andrew Company Secretary
B.R. Andrew Registered office
15-17 Normanby Road Notting Hill Vic 3168 Australia Principal place of business 15-17 Normanby Road Notting Hill Vic 3168 Australia T 61 3 9538 3333 F 61 3 9562 7742 www.optiscan.com Share Register
Computershare Registry Services Yarra Falls 452 Johnston Street Abbotsford Vic 3067 Australia T 61 3 9415 5000 Solicitors
HWL Ebsworth Lawyers 6530 Collins Street Melbourne VIC 3000 Auditors
Ernst & Young Melbourne Bankers
ANZ Banking Group National Australia Bank F
or p
erso
nal u
se o
nly

Optiscan Imaging Limited Annual Report 2012
Page | 4
Directors’ Report
The Board of Directors of Optiscan Imaging Limited has pleasure in submitting its report in respect of the financial year ended 30 June 2012. Directors The names of the directors in office during or since the end of the financial year and up to the date of this report are: Mr Angus Holt, Director, Executive Chairman Mr Peter Delaney, Director of Technology Mr Bruce Andrew, Chief Financial Officer Details of the qualifications and experience of the directors in office during the financial year and until the date of this report are as follows: Angus M. Holt B Com Age 41
Mr Holt has a Commerce degree from the University of Melbourne and has over 15 years experience in funds management, private equity and early stage biotech ventures. Mr Holt was a director of Equity Life during the 90’s, at the time Australia’s leading provider of regulated short term annuity investments. Mr Holt was Investment Director at Equity Life overseeing in excess of $200m invested in a range of hybrid securities, smaller companies and the leaders. Following the sale of Equity Life to Challenger International in 1997 Mr Holt has focussed on private equity opportunities funded by a few select individuals. Those opportunities have been dominated by smaller companies (<$500m) across many fields ranging from toll roads, mezzanine infrastructure debt, waste to energy, plumbing supplies and biotechs, including in imaging, surgery navigation and immunology. Mr Holt has lived in the US where he established the local operations for a surgical navigation start up. Mr Holt has 13 years experience as a public company director in Australia and was appointed to the Board of Optiscan in February 2009 and later Chairman in May 2009. Mr Holt assumed the role of Executive Chairman in January 2010. Mr Holt held no other directorships of public companies during the past three years.
Peter M. Delaney BSc(Pharm) (Hons.) Age 44
Peter Delaney, Director of Technology, completed a science degree with honours in Pharmacology at Monash University in 1989. He has played a major role in the refinement of the fibre optic approach to produce a commercial instrument which received an R&D 100 Award in 1991. In 1993, Mr Delaney received the Victorian Young Achiever Award (Science and Technology) for his development of the company strategy and infrastructure. Mr Delaney was appointed a director of Optiscan Pty Ltd in March 1994, and was Managing Director until December 2002, at which time he assumed the role of Director of Technology. In April 2007, Peter Delaney was awarded a prestigious ATSE Clunies Ross award for excellence in the innovation and commercialisation of scientific endeavours.
Mr Delaney held no other directorships of public companies during the past three years.
For
per
sona
l use
onl
y

Optiscan Imaging Limited Annual Report 2012
Page | 5
Directors’ Report (continued)
Directors (continued) Bruce R. Andrew B Bus, CPA Age 58
Mr Andrew is an accountant with extensive corporate experience in both listed and unlisted entities. Mr Andrew was appointed Company Secretary when Optiscan listed in 1997. After several years in a part time role, Mr Andrew was appointed Chief Financial Officer in 2001, and has been a member of the executive management team since that time. Mr Andrew was appointed to the board in January 2010.During the past three years, Mr Andrew served as a director of Orpheus Energy Limited
All directors held their position as director throughout the entire financial year and up to the date of this report. Directors’ Interests Relevant interests of the directors in the shares, options or other instruments of the company at the date of this report are: Director Shares Options Angus Holt 13,883,729 1,500,000 Peter Delaney 3,501,349 - Bruce Andrew 90,000 -
Other Interests of Directors Peter Delaney Related parties to Peter Delaney hold a combined total of 270,090 ordinary shares (2011: 270,090 ordinary shares). Angus Holt Related parties to Angus Holt hold a combined total of 10,710,070 ordinary shares (2011: 6,132,000 ordinary shares) and 1,500,000 options (2011: Nil).
For
per
sona
l use
onl
y

Optiscan Imaging Limited Annual Report 2012
Page | 6
Directors’ Report (continued)
Directors’ Meetings The company held seven (7) Directors’ meetings during the year. The attendances of the directors at meetings of the Board were:
Board of Directors
Director Attended Held Angus Holt
7
7
Peter Delaney 7 7 Bruce Andrew 7 7
As at the date of this report, the board comprised three directors, all of whom are executive directors. As a consequence, the operation of committees of the board has been temporarily suspended until the board is expanded to a larger group in the future. All matters previously considered by the Audit Committee, Remuneration Committee and Nomination committee are now dealt with by the board. Principal Activities The principal activity of the consolidated entity during the year was the development and commercialisation of confocal microscopes. There was no change in the nature of this activity during the year.
Corporate Structure Optiscan Imaging Limited is a company limited by shares that is incorporated and domiciled in Australia.
Trading Results The consolidated loss of the consolidated entity for the financial year was $2,502,450 ( 2011, profit 14,405) after income tax.
For
per
sona
l use
onl
y

Optiscan Imaging Limited Annual Report 2012
Page | 7
Directors’ Report (continued)
Review of Operations Operational Highlights The 2012 financial year was significant for Optiscan in a manner that is not reflected in the Company’s financial statements. Major events in the evolution of Optiscan over the past year include:
• The approval of three category 1 CPT codes regarding the use of optical endomicroscopy in the gastrointestinal tract, with those codes scheduled for implementation in January 2013. CPT codes are the most widely accepted nomenclature used to report medical procedures and services under US private and public health insurance programs, often referred to as reimbursement. (field – flexible endomicroscopy)
• The completion of the International Multi Centre Trial and delivery of the study findings around the use of Optiscan’s technology into the detection of Barrett’s Esophagus Neoplasia. Findings highlight the demonstrable patient, clinician and healthcare system benefits of Optiscan’s technology for earlier and better disease detection. (field - flexible endomicroscopy)
• The delivery of the first flexible endomicroscopy system incorporating Optiscan’s second generation technology. (field - flexible endomicroscopy).
• The first purchase order from Carl Zeiss for pre-production models of Optiscan’s neurosurgery systems. (field - rigid endomicroscopy)
• The further development of our probe-based systems and successful imaging leading to the potential for a stand-alone Optiscan system within gastroenterology. (field - flexible endomicroscopy)
• Continued R&D into further proprietary miniaturisation and image enhancement and delivery of future generations of Optiscan technology in live micro imaging.
Capital Raising Optiscan is delighted to announce it has today successfully closed a $1 million placement to professional and sophisticated investors. The placement has been well supported by a number of the Company’s long term shareholders, with allotment and quotation expected to take place within days. Details of the placement are as follows:
• 13,333,333 new fully paid ordinary shares to rank pari passu with existing shares • Issue price of 7.5 cents per share
The proceeds from this capital raising, together with other near term income anticipated from sales, milestones and grants will place the company on a sound commercial footing, which will provide the platform to:
• enhance the Company’s operational efficiency by virtue of the stronger balance sheet and simplified cash flow management;
• invest more heavily in regulatory resources in order to facilitate the near term (2014) sale of commercial product in both the rigid and flexible endoscopy markets;
• invest in appropriate levels of stock and related commitments to allow delivery into future orders on time and in volume; and
• take advantage of the significant technology and market developments that have taken place over the past 18 months as mentioned above.
For
per
sona
l use
onl
y

Optiscan Imaging Limited Annual Report 2012
Page | 8
Directors’ Report (continued)
Review of Operations (continued)
The improved financial status of the Company has also allowed the repositioning of the Company’s funding facility with Bergen Global Opportunity Fund, announced to the market on 30 March 2012. The Company and Bergen have terminated the facility by mutual consent. In order to maximise the benefit of the Company’s improved cash position and cash flow profile, Bergen’s outstanding convertible security with the face value of $200,000 has been increased to $250,000 in consideration of Bergen agreeing to certain conditions around the sale of the shares that would be received by Bergen in conversion of the convertible security. Importantly, Bergen has agreed not to sell any such shares for two months and to certain limits on any subsequent sale of such shares.
In March, Optiscan and Bergen came together in a funding arrangement that allowed Optiscan to significantly reduce the risk associated with its cash flow profile at the time and consequently to continue its efforts to move to commercial product with Zeiss, in the first instance. Bergen’s contribution has been invaluable and has facilitated the development of the Company to its now considerably more robust stature. The Company acknowledges Bergen’s flexibility in winding down the facility before the end of its contractual term.
Financial Results
The net loss for 2012 was $2,502,450 compared to a profit of $14,405 in 2011.
It is a common characteristic of companies in the medical device development industry, and in the stage of development we currently experience, that revenue, expenses and cash flow can be lumpy and uneven. As a consequence, year on year comparison of financial results requires detailed analysis of a range of issues to identify the underlying operational trends and directions.
In the current year, sales revenue declined 25% to $381,791, mainly due to fewer sales of the Five 1 research instrument. This reflects, in some respects, the emergence of Optiscan’s second generation platform and the interest of research customers in the latest available technology.
Other income, including grants and design and development income decreased by 76% to $456,350 as 2011 included large one off milestone payments of $1,267,918, not repeated in 2012.
Total expenses increased 50%, from $2,152,934 to $3,238,912.The primary factors were costs associated with funding facilities (including share based payments of $475,717), increased investment in R&D, and professional fees associated with the strategic review process.
These movements, together with the year on year decline in income from design and development are the major causes of the change in reported results.
Outlook
With an improved financial outlook and the numerous important developments over the past 18 months, Optiscan is well placed to independently move to commercial sales in the 2014 financial year and to gain financial independence. Initial clinical commercial sales are likely to commence via the neurosurgery system to Carl Zeiss.
In flexible endoscopy, with the ability to offer either an integrated or stand alone system the Company has a range of modalities to consider around its re-entry to this very large market. We are many months into the investigation of various means of re-entry to flexible endoscopy and will move on the appropriate opportunity at the appropriate time.
For
per
sona
l use
onl
y

Optiscan Imaging Limited Annual Report 2012
Page | 9
Directors’ Report (continued)
Dividends No dividends have been paid or declared since the beginning of the financial year by the Company (2011, Nil). Significant Changes in the State of Affairs There have been no significant changes to the state of affairs of the consolidated entity during the year. Significant Events After Balance Date No matters or circumstances have arisen since the end of the financial year which significantly affected or may significantly affect the operations of the consolidated entity, the expected results of those operations in future years, or the state of affairs of the consolidated entity in future financial years, other than:
• Convertible notes with a face value of $100,000 have been converted to equity by the holder • A placement of 13,333,333 shares on 31 August 2012 to raise $1 million for working capital • Following completion of the placement the parties to the Bergen financing facility reached mutual
agreement to terminate the facility Likely Developments and Future Results The Directors have excluded from this report any information on likely developments in the operations of the consolidated entity and the expected results of those operations in future financial years, since, in the opinion of the directors, it may prejudice the interests of the group if this information were included. Environmental Regulations The Group is not subject to significant environmental regulations. Share Options Details of movements in share options are set out in Note 22 in the financial statements Since the end of the financial year, and up to the date of this report, no new shares have been issued as a consequence of the exercise of employee options which were on issue at year end. Since the end of the financial year, and up to the date of this report, no new options have been issued, and no options have expired. The total number of options outstanding at the date of this report is 7,050,000.
Indemnification and Insurance During the financial year ended 30 June 2012, the company indemnified its directors, the company secretary and executive officers in respect of any acts or omissions giving rise to a liability to another person (other than the company or a related party) unless the liability arose out of conduct involving a lack of good faith. In addition, the company indemnified the directors, the company secretary and executive officers against any liability incurred by them in their capacity as directors, company secretary or executive officers in successfully defending civil or criminal proceedings in relation to the company. No monetary restriction was placed on this indemnity. The Company has insured its directors, the company secretary and executive officers for the financial year ended 30 June 2012. Under the company’s Directors’ and Officers’ Liabilities Insurance Policy, the Company shall not release to any third party or otherwise publish details of the nature of the liabilities insured by the policy or the amount of the premium. Accordingly, the company relies on section 300(9) of the Corporations Act 2001 to exempt it from the requirement to disclose the nature of the liability insured against and the premium amount of the relevant policy.
For
per
sona
l use
onl
y
Optiscan Imaging Limited Annual Report 2012
Page | 10
Directors’ Report (continued)
Remuneration Report (Audited) This remuneration report outlines the director and executive remuneration arrangements of the group in accordance with the requirements of the Corporations Act 2001 and its regulations. For the purposes of this report, Key Management Personnel (KMP) of the group are defined as those persons having authority and responsibility for planning, directing and controlling the major activities of the group, directly or indirectly, including any director (whether executive or otherwise) of the parent company. For the purposes of this report, the Executive Management team encompasses the board of directors, as all executives are members of the parent entity board. Details of Key Management Personnel in office during the year A. Holt Executive Chairman, Director P. Delaney Director of Technology, Director B. Andrew Chief Financial Officer, Director Remuneration Philosophy The quality and performance of directors, executives and staff is critical to achieving business success. Optiscan must foster a remuneration policy that attracts, motivates and retains personnel of the highest calibre. In formulating a framework for remuneration policies and practices, the board takes account of the following factors:
• Capacity to pay. • Employment market conditions. • Company performance. • Identification of appropriate performance benchmarks. • Individual performance levels.
Objective of Remuneration Policy The overall objective of the remuneration policy is to ensure maximum stakeholder benefit from the retention of a high quality board, management and staff at a cost which is commercially realistic and acceptable to shareholders. This objective seeks to:
• Reward employees for individual performance against appropriate benchmarks. • Align the interests of management and staff with those of shareholders. • Provide a link between rewards and the achievement of strategic targets, performance outcomes
and share price. • Ensure remuneration is competitive by market standards.
Non-executive Director Remuneration The Constitution of the company and the ASX Listing Rules establish an aggregate or maximum level of remuneration available to non-executive directors, to be divided amongst the directors as agreed. The aggregate amount approved by shareholders to be available for remuneration of non-executive directors is $400,000 per annum. This amount was approved at a general meeting of the company held on 12 August 2008.
For
per
sona
l use
onl
y
Optiscan Imaging Limited Annual Report 2012
Page | 11
Directors’ Report (continued)
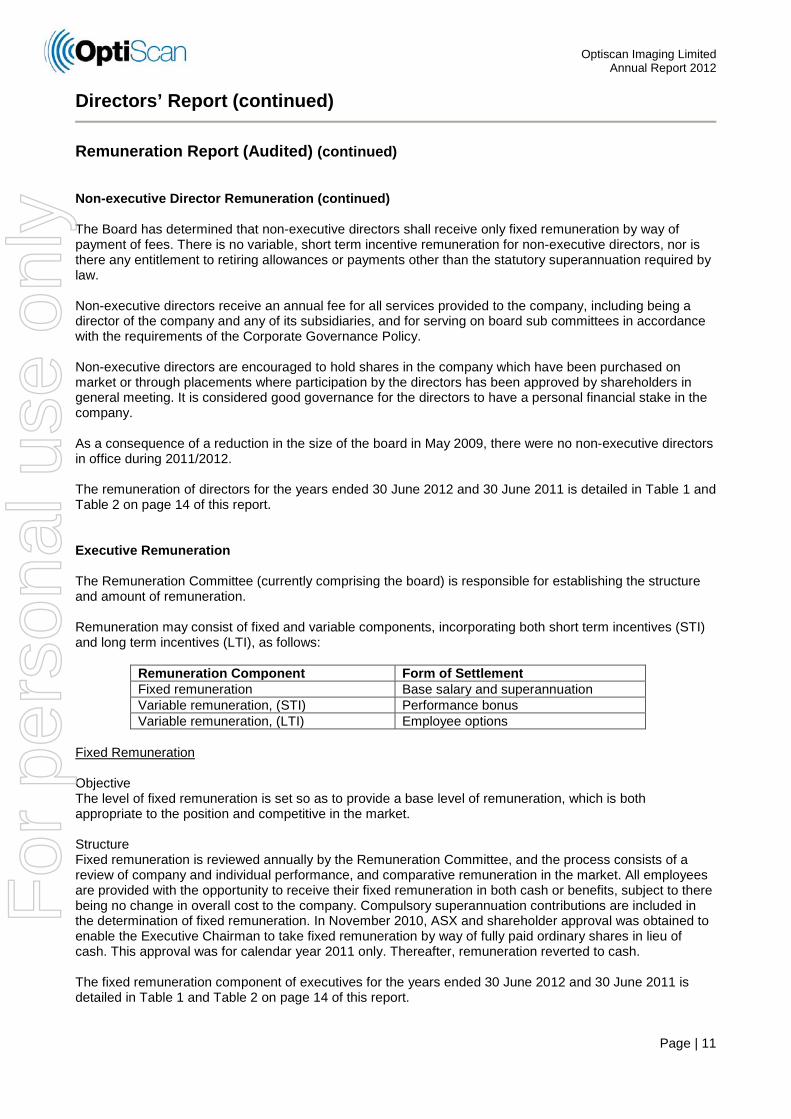
Remuneration Report (Audited) (continued) Non-executive Director Remuneration (continued) The Board has determined that non-executive directors shall receive only fixed remuneration by way of payment of fees. There is no variable, short term incentive remuneration for non-executive directors, nor is there any entitlement to retiring allowances or payments other than the statutory superannuation required by law. Non-executive directors receive an annual fee for all services provided to the company, including being a director of the company and any of its subsidiaries, and for serving on board sub committees in accordance with the requirements of the Corporate Governance Policy. Non-executive directors are encouraged to hold shares in the company which have been purchased on market or through placements where participation by the directors has been approved by shareholders in general meeting. It is considered good governance for the directors to have a personal financial stake in the company. As a consequence of a reduction in the size of the board in May 2009, there were no non-executive directors in office during 2011/2012. The remuneration of directors for the years ended 30 June 2012 and 30 June 2011 is detailed in Table 1 and Table 2 on page 14 of this report. Executive Remuneration The Remuneration Committee (currently comprising the board) is responsible for establishing the structure and amount of remuneration. Remuneration may consist of fixed and variable components, incorporating both short term incentives (STI) and long term incentives (LTI), as follows:
Remuneration Component Form of Settlement Fixed remuneration Base salary and superannuation Variable remuneration, (STI) Performance bonus Variable remuneration, (LTI) Employee options
Fixed Remuneration Objective The level of fixed remuneration is set so as to provide a base level of remuneration, which is both appropriate to the position and competitive in the market. Structure Fixed remuneration is reviewed annually by the Remuneration Committee, and the process consists of a review of company and individual performance, and comparative remuneration in the market. All employees are provided with the opportunity to receive their fixed remuneration in both cash or benefits, subject to there being no change in overall cost to the company. Compulsory superannuation contributions are included in the determination of fixed remuneration. In November 2010, ASX and shareholder approval was obtained to enable the Executive Chairman to take fixed remuneration by way of fully paid ordinary shares in lieu of cash. This approval was for calendar year 2011 only. Thereafter, remuneration reverted to cash. The fixed remuneration component of executives for the years ended 30 June 2012 and 30 June 2011 is detailed in Table 1 and Table 2 on page 14 of this report.
For
per
sona
l use
onl
y

Optiscan Imaging Limited Annual Report 2012
Page | 12
Directors’ Report (continued)
Remuneration Report (Audited) (continued) Executive Remuneration (continued) Variable Remuneration - Short Term Incentive (STI) Objective The objective of the STI program is to link the achievement of the group’s operational targets with the remuneration received by the executives with prime responsibility for meeting those targets. The total potential STI available is set at a level so as to provide sufficient incentive to the executive managers to achieve the operational targets and such that the cost to the company is reasonable in the circumstances. Structure Actual STI payments granted to each executive manager depend on the extent to which specific operating targets set at the beginning of the financial year are met. The operational targets consist of a number of Key Performance Indicators (KPI’s) covering both financial and non-financial measures of performance. Typically included are such measures as achievement of budgeted financial outcomes and key milestones, for example, demonstrating clinical efficacy, achieving quality accreditation, obtaining regulatory clearance or measures such as control of expenditure or achievement of sales targets. The Remuneration Committee establishes clear performance benchmarks, which must be met in order to trigger payments under the short term incentive scheme. The aggregate amount of annual STI payments available for executives is subject to the approval of the Remuneration Committee. Payments made are usually delivered as a cash bonus. STI Arrangements The board suspended STI arrangements for all staff during 2009/2010 due to the difficult economic circumstances confronting the Group. No STI entitlements were accrued and no payments were made to staff during 2011/2012. Variable Remuneration - Long Term Incentive (LTI) Long term incentives are delivered to executives and employees by way of grant of options under the Employee Share Option Plan. Objective The objective of the long term incentive plan is to reward executives and employees in a manner which aligns this element of remuneration with the creation of shareholder wealth. Structure LTI grants to employees, including executives, are delivered in the form of options. The Remuneration Committee is responsible for the allocation of options, and determines the quantum of grants by reference to group and individual performance against targets. LTI Arrangements in 2011/2012 The board suspended LTI arrangements during 2009/2010 due to the difficult economic circumstances confronting the Group. No LTI entitlements were granted and no issues were made to staff during 2011/2012.
For
per
sona
l use
onl
y

Optiscan Imaging Limited Annual Report 2012
Page | 13
Directors’ Report (continued)
Remuneration Report (Audited) (continued) Incentives and Company Performance The link between incentive structure and company performance is an important aspect of remuneration philosophy. The purpose of the remuneration policies of the Group is to create an effective and transparent link between the incentives provided and the performance of the Group. The group is in the process of transition from a business predominantly engaged in research and development (“R&D”) to one increasingly focussed on commercialisation of its technology. Whilst substantial progress has been made, the transition from loss making R&D activities to profit making trading has not yet been completed. As a consequence, performance to date cannot appropriately be determined with conventional financial measurement tools. As the group has expensed all R&D expenditure incurred to date, losses have been reported so conventional earnings measures such as profit growth, EPS or dividend yield and payout are not applicable. In view of the limited relevance of financial measurement tools, the Board of Directors has determined that the performance of the group is best reviewed in the context of achievement of key milestones. Incentive Payments and Performance Conditions 2011/2012 During the year ended 30 June 2012, no short or long term incentive payments were made to staff. Employment Contracts All staff including executives are engaged under rolling employment agreements. The contracts continue indefinitely subject to satisfactory performance, and provide one months notice. Under the terms of the agreements:
• The company may terminate the employment agreement by providing the requisite period of written notice or by providing payment in lieu of notice, based on the fixed component of remuneration. Any unvested options at the expiry of the notice period will be forfeited.
• On resignation, all unvested options are forfeited. • The company may terminate the agreement at any time without notice if serious misconduct has
occurred, in which case the executive is only entitled to that portion of remuneration that is fixed, and only up to the date of termination.
For
per
sona
l use
onl
y
Optiscan Imaging Limited Annual Report 2012
Page | 14
Directors’ Report (continued)
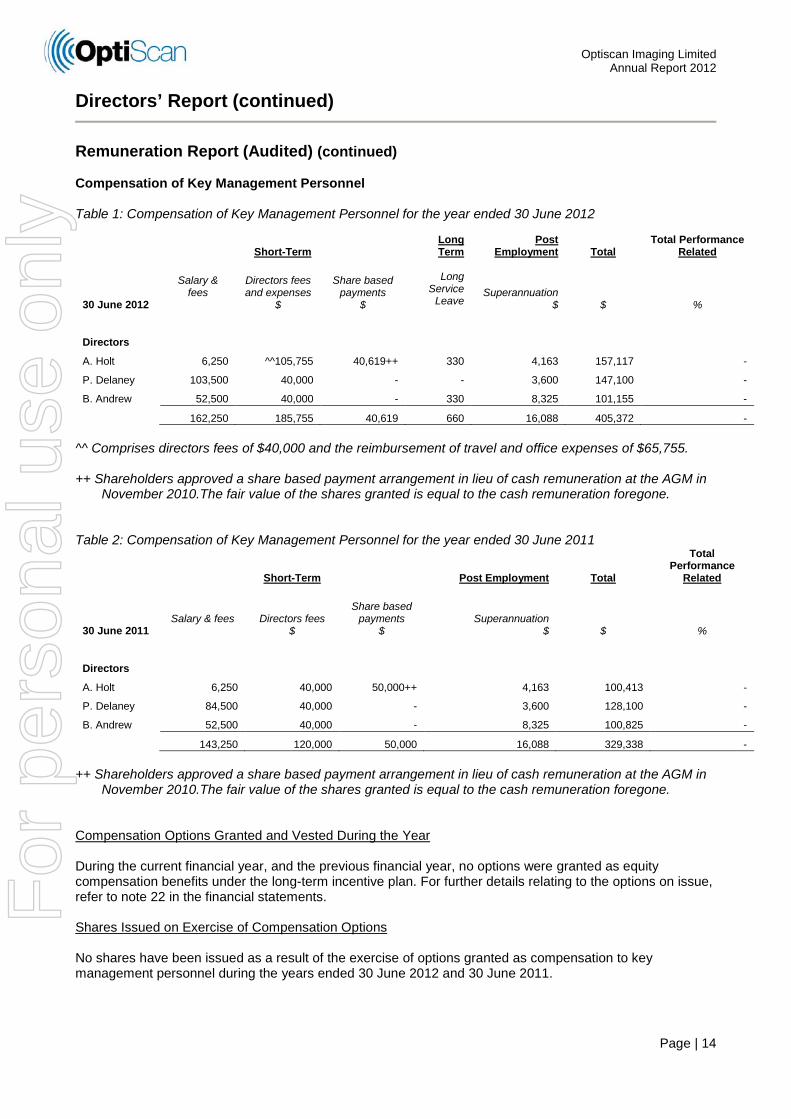
Remuneration Report (Audited) (continued) Compensation of Key Management Personnel
Table 1: Compensation of Key Management Personnel for the year ended 30 June 2012
Short-Term
Long Term
Post Employment Total
Total Performance Related
30 June 2012
Salary & fees
Directors fees and expenses
$
Share based payments
$
Long
Service Leave
Superannuation
$ $ %
Directors
A. Holt 6,250 ^^105,755 40,619++ 330 4,163 157,117 -
P. Delaney 103,500 40,000 - - 3,600 147,100 -
B. Andrew 52,500 40,000 - 330 8,325 101,155 -
162,250 185,755 40,619 660 16,088 405,372 - ^^ Comprises directors fees of $40,000 and the reimbursement of travel and office expenses of $65,755. ++ Shareholders approved a share based payment arrangement in lieu of cash remuneration at the AGM in
November 2010.The fair value of the shares granted is equal to the cash remuneration foregone. Table 2: Compensation of Key Management Personnel for the year ended 30 June 2011
Short-Term Post Employment Total
Total Performance
Related
30 June 2011 Salary & fees
Directors fees
$
Share based payments
$
Superannuation
$ $ %
Directors
A. Holt 6,250 40,000 50,000++ 4,163 100,413 -
P. Delaney 84,500 40,000 - 3,600 128,100 -
B. Andrew 52,500 40,000 - 8,325 100,825 -
143,250 120,000 50,000 16,088 329,338 -
++ Shareholders approved a share based payment arrangement in lieu of cash remuneration at the AGM in November 2010.The fair value of the shares granted is equal to the cash remuneration foregone.
Compensation Options Granted and Vested During the Year During the current financial year, and the previous financial year, no options were granted as equity compensation benefits under the long-term incentive plan. For further details relating to the options on issue, refer to note 22 in the financial statements. Shares Issued on Exercise of Compensation Options No shares have been issued as a result of the exercise of options granted as compensation to key management personnel during the years ended 30 June 2012 and 30 June 2011.
For
per
sona
l use
onl
y

Optiscan Imaging Limited Annual Report 2012
Page | 15
Directors’ Report (continued)
AUDITOR INDEPENDENCE AND NON-AUDIT SERVICES Non-Audit Services The following non-audit services were provided by Ernst & Young. The directors are satisfied that the provision of non-audit services is compatible with the general standard of independence for auditors imposed by the Corporations Act 2001. The nature and scope of non-audit services provided means that auditor independence was not compromised. Ernst & Young received the following amount for the provision of non-audit services: R&D tax services $9,900 Auditor Independence The directors received the following declaration from the auditor of Optiscan Imaging Limited.
This report has been made in accordance with a resolution of directors.
BRUCE ANDREW, Director Melbourne, 31 August, 2012
For
per
sona
l use
onl
y

Optiscan Imaging Limited Annual Report 2012
Page | 16
Corporate Governance Statement
Optiscan is committed to ensuring that its policies and practices reflect good corporate governance. This statement reports against the key governance principles as outlined in the Australian Stock Exchange Corporate Governance Council’s “Principles of Good Corporate Governance and Best Practice Recommendations”. In accordance with the Council’s recommendations, and for full details on corporate governance policies adopted by Optiscan Imaging Limited, please refer to our Corporate Governance Statement a copy of which can be found on our website at www.optiscan.com Also available on the website is a copy of the Board Charter and the Code of Conduct. The Board of Directors of Optiscan Imaging Limited is responsible for the corporate governance of the consolidated entity. The Board guides and monitors the business and affairs of Optiscan Imaging Limited on behalf of the shareholders by whom they are elected and to whom they are accountable. Details of the directors, current at the time of this report, and their term in office are: Director Status Term in office Angus M Holt (Chairman) Executive 3.5 years Peter M Delaney Executive 15 years Bruce R Andrew Executive 2.5 years
The skills, experience and expertise of each director is included in the Directors’ Report. Directors of Optiscan Imaging Limited are considered to be independent when they are independent of management and free from any business or other relationship that could materially interfere with, or could reasonably be perceived to materially interfere with, the exercise of their independent judgement . The Board does not have a majority of directors who are independent. During the 2008-2009 financial year, the board was reduced from five members to the minimum level of three as part of the overall downsizing of Optiscan that followed the global financial crisis. The Board considers that its current composition and size is sufficient to adequately discharge its duties and responsibilities at this time. The directors will monitor the issues of the board composition, skills, diversity and independence over the next 12 months. The policy and procedure for nomination, selection and appointment of new directors and the re-election of incumbents is detailed in the Corporate Governance Statement. The process for evaluating the Board is also set out in the Corporate Governance Statement. An evaluation of the Board did not take place during the period. The functions reserved to the Board, and those delegated to senior executives are clearly distinguished and set out in the Corporate Governance Statement. The process for evaluating the performance of senior executives is also set out in the Corporate Governance Statement. An evaluation of senior executives did not take place during the year due to the restructuring within the Group. Members of the Board are entitled to obtain such independent advice as is deemed necessary at the expense of the Group, subject to the prior consent of the Chairman. Optiscan has established a share trading policy for directors, senior executives and employees, details of which are set out in the Code of Conduct.
For
per
sona
l use
onl
y

Optiscan Imaging Limited Annual Report 2012
Page | 17
Corporate Governance Statement (continued)
With the reduction in the size of the Board in 2009, there is no Nomination Committee or Audit Committee. In both cases the Board has assumed the responsibilities of the committees. A statement as to the procedures for the selection appointment and rotation of external audit engagement partners forms part of the Group’s Corporate Governance Statement. The Group has an established continuous disclosure policy, a communications policy and a risk management policy. All of these policies form part of the Corporate Governance Statement which can be found on the Group’s website. Remuneration The Board is responsible for determining and reviewing compensation arrangements for the directors, management and staff. The objective of the Group’s remuneration policy is to provide maximum stakeholder benefit from the retention of a high quality Board and executive team. This is achieved by remunerating directors and key executives fairly and appropriately with reference to relevant employment market conditions. The Board links the nature and amount of executive directors’ and officers’ emoluments to the Group’s financial and operational performance. This is intended to achieve the retention and motivation of management and key staff. Similarly, in relation to the payment of bonuses and the issue of options, discretion is exercised by the Board, having regard to the overall performance of the Group and the performance of the individual during the period. There is no scheme to provide retirement benefits, other than statutory superannuation, to non-executive directors. Full details of the remuneration of key management personnel, and all directors are included in the Directors’ Report.
For
per
sona
l use
onl
y

Optiscan Imaging Limited Annual Report 2012
Page | 18
Statement of Financial Position AS AT 30 JUNE 2012
Notes CONSOLIDATED 2012 2011 $ $ ASSETS
Current Assets
Cash and cash equivalents 9 578,900 1,078,694
Trade and other receivables 10 162,687 835,191
Inventories 11 153,075 197,100
Prepayments 12 143,391 50,112 Total Current Assets 1,038,053 2,161,097
Non-current Assets
Prepayments 12 101,401 -
Plant and equipment 13 41,217 38,553 Total Non-current Assets 142,618 38,553 TOTAL ASSETS 1,180,671 2,199,650
LIABILITIES
Current Liabilities
Trade and other payables 14 469,175 180,397
Interest bearing loans and borrowings 15 210,414 484,485
Provisions 17 174,201 179,958 Total Current Liabilities 853,790 844,840
Non-current Liabilities
Trade and other payables 14 - 2,575
Provisions 17 13,571 9,521 Total Non-current Liabilities 13,571 12,096 TOTAL LIABILITIES 867,361 856,936 NET ASSETS 313,310 1,342,714
EQUITY
Contributed equity 18 45,710,667 45,016,281
Accumulated losses 18 (46,893,271) (44,390,821)
Reserves 18 1,495,914 717,254 TOTAL EQUITY
313,310 1,342,714
The above statement of financial position should be read in conjunction with the accompanying notes.
For
per
sona
l use
onl
y

Optiscan Imaging Limited Annual Report 2012
Page | 19
Statement of Comprehensive Income FOR THE YEAR ENDED 30 JUNE 2012
Notes CONSOLIDATED 2012 2011 $ $ Sale of goods 381,791 509,036 Other revenue 6(a) 43,380 41,985 Revenue
425,171 551,021
Cost of sales
(145,059) (287,600)
Gross Profit 280,112 263,421 Other income 6(b) 456,350 1,903,918 Research & development expenses (1,193,643) (1,022,883) Administrative expenses (1,870,318) (1,117,563) Other expenses (174,951) (12,488) Loss before income tax (2,502,450) 14,405 Income tax expense 7 - - Net profit (loss) for the year (2,502,450) 14,405
Other comprehensive income Foreign currency translation of net investment in foreign subsidiary 60 1,474 Total comprehensive profit (loss) for the period (2,502,390) 15,879 Earnings (loss) per share (cents per share) 8 - basic earnings (loss) per share for the year (0.19) 0.01 - diluted earnings (loss) per share for the year (0.19) 0.01
The above statement of comprehensive income should be read in conjunction with the accompanying notes.
For
per
sona
l use
onl
y

Optiscan Imaging Limited Annual Report 2012
Page | 20
Statement of Changes in Equity FOR THE YEAR ENDED 30 JUNE 2012
CONSOLIDATED
Ordinary shares
Accumulated Losses
Share Based
Payments
Foreign Currency
Translation Reserve
$ $ $ $ $
At 1 July 2011 45,016,281 (44,390,821) 707,061 10,193 1,342,714
Loss for the year - (2,502,450) - - (2,502,450)
Other comprehensive income - - - 60 60
Total comprehensive income (loss) for the year - (2,502,450) - 60 (2,502,390)
Transactions with owners in their capacity as owners:
Shares issued on conversion of notes 629,298 - - - 629,298
Equity component of convertible notes 65,088 - - - 65,0886
Share based payments - - 778,600 - 778,600
At 30 June 2012 45,710,667 (46,893,271) 1,485,661 10,253 313,310
At 1 July 2010 45,016,281 (44,405,226) 680,488 8,719 1,300,262
Profit for the year - 14,405 - - 14,405
Other comprehensive income - - - 1,474 1,474
Total comprehensive income for the year - 14,405 - 1,474 15,879
Transactions with owners in their capacity as owners:
Share based payments - - 26,573 - 26,573
At 30 June 2011 45,016,281 (44,390,821) 707,061 10,193 1,342,714
The above statement of changes in equity should be read in conjunction with the accompanying notes.
For
per
sona
l use
onl
y

Optiscan Imaging Limited Annual Report 2012
Page | 21
Statement of Cash Flows FOR THE YEAR ENDED 30 JUNE 2012
Notes CONSOLIDATED
2012 2011 $ $
Cash flows from operating activities
Receipts from customers 711,729 1,692,450
Payments to suppliers and employees (2,594,254) (2,197,288)
Royalties received 1,509 5,167
Interest received 42,519 37,250
Receipt of government grants 1,092,350 -
Interest paid (47,398) (6,158)
Net cash used in operating activities 9 (793,545) (468,579)
Cash flows from investing activities
Cash placed on deposit 10 (67,000) -
Purchase of plant and equipment 13 (28,776) (19,140)
Net cash used in investing activities (95,776) (19,140)
Cash flows from financing activities
Proceeds from issue of convertible notes, net of transaction costs 15 398,000 -
Net cash flows from financing activities 398,000 -
Net decrease in cash and cash equivalents (491,321) (487,719)
Net foreign exchange differences (8,473) 11,012
Cash and cash equivalents at beginning of period 1,078,694 1,555,401 Cash and cash equivalents at end of period
9 578,900 1,078,694
The above statement of cash flows should be read in conjunction with the accompanying notes.
For
per
sona
l use
onl
y

Optiscan Imaging Limited Annual Report 2012
Page | 22
Notes to the Financial Statements FOR THE YEAR ENDED 30 JUNE 2012
1 CORPORATE INFORMATION
The financial report of Optiscan Imaging Limited (the Company) for the year ended 30 June 2012 was authorised for issue in accordance with a resolution of the directors on 31 August 2012. Optiscan Imaging Limited is a company limited by shares incorporated in Australia whose shares are publicly traded on the Australian Stock Exchange. The nature of the operations and principal activities of the Group are described in note 5, Segment Information.
2 SUMMARY OF SIGNIFICANT ACCOUNTING POLICIES
Table of contents a) Basis of preparation b) New accounting standards and interpretations c) Basis of consolidation d) Revenue recognition e) Government grants f) Leases g) Cash and cash equivalents h) Trade and other receivables i) Inventories j) Derivative financial instruments and hedging k) Foreign currency translation l) Income tax m) Other taxes n) Plant and equipment o) Investments and other financial assets p) Intangible assets q) Trade and other payables r) Interest bearing loans and borrowings s) Provisions and employee leave benefits t) Share-based payment transactions u) Contributed equity v) Earnings (Loss) per share w) Segment reporting
a) Basis of preparation
The financial report is a general-purpose financial report, which has been prepared in accordance with the requirements of the Corporations Act 2001, Australian Accounting Standards and other authoritative pronouncements of the Australian Accounting Standards Board. The financial report is presented in Australian dollars and has been prepared on a historical cost basis, except for derivative financial instruments which have been measured at fair value. Optiscan Imaging Limited is, for the purposes of preparing these financial statements, a for-profit entity. Compliance with IFRS The financial report complies with Australian Accounting Standards and International Financial Reporting Standards (IFRS) as issued by the International Accounting Standards Board.
For
per
sona
l use
onl
y

Optiscan Imaging Limited Annual Report 2012
Page | 23
Notes to the Financial Statements (continued) FOR THE YEAR ENDED 30 JUNE 2012
a) Basis of preparation (continued)
Going Concern (Significant Uncertainty as at 30 June 2012) In common with many entities in the biotechnology sector, the company’s operations are subject to considerable risk due to the nature of the development and commercialisation being undertaken. A part of this risk relates to funding of the Company’s activities, and related issues including the conditions prevailing in local and international financial markets. In the context of this operating environment, it is likely that the company will need to raise additional capital in order to execute its near term and medium term plans for expansion of its product portfolio. As at 30 June 2012, the financial position of the consolidated entity as disclosed in the financial statements reflects a net asset position of $313,310 (2011: $1,342,714). This balance has been determined after a consolidated net loss for the year of $2,502,450 (2011: profit $14,405), and a net cash outflow from operations of $793,545 (2011: $468,579). The accounts have been prepared on a going concern basis, which includes the presumption that sufficient funds will be available to finance the operations of the consolidated entity. In adopting this position, the directors have had regard to:
• Cash on hand at 30 June 2012 is $578,900 (2011: $1,078,694) • Additional cashflow is expected to be received in the 2013 financial year under the agreement
with Carl Zeiss • The Company has established a $2 million convertible note funding facility • The directors believe the Company has the ability to raise additional capital from existing and
new investors • The Company has a successful track record in raising capital to fund its operations • The Company may have the ability to raise additional income, or accelerate forecast cash flows
if required The directors cannot be certain of the Company’s ability to achieve success in its activities, as these are dependent on future events. Thus, should these activities result in a position where there are insufficient funds to allow continuation of current activities, the directors will consider scaling back activities until further funding is obtained, or undertake a reassessment of the company’s activities. The strategy for any potential future capital raising and its timing will be determined by the directors based upon an assessment of the financial and operational circumstances of the consolidated entity at the time. The directors plan to continue the Company and the consolidated entity’s operations on the basis outlined above, and believe there will be sufficient funds for the Group to conduct its affairs for at least twelve months from the date of this report. To the extent that future arrangements may not be concluded on a timely basis, and in the absence of new capital or additional income, there is significant uncertainty whether the Group will continue as a going concern, and therefore, whether the Group will realise its assets and extinguish its liabilities in the normal course of business and at the amounts stated in the financial report. The financial statements take no account of the consequences, if any, of the effects of unsuccessful product development, commercialisation or capital raising, nor the ability of the company to continue as a going concern. Hence, the financial report does not include adjustments relating to the recoverability and classification of recorded asset amounts or to the amounts and classification of liabilities that might be necessary should the Company and consolidated entity not continue as going concerns.
For
per
sona
l use
onl
y

Optiscan Imaging Limited Annual Report 2012
Page | 24
Notes to the Financial Statements (continued) FOR THE YEAR ENDED 30 JUNE 2012
2 SUMMARY OF SIGNIFICANT ACCOUNTING POLICIES (continued)
b) New accounting standards and interpretations
(i) Accounting standards and interpretations issued but not yet effective Australian Accounting Standards and Interpretations that have recently been issued or amended but are not yet effective have not been adopted by the Group for the annual reporting period ending 30 June 2012. These are outlined in the table below.
Reference Title Summary Application
date of standard*
Impact on Group financial report
Application date for Group*
AASB 2011-9
Amendments to Australian Accounting Standards – Presentation of Other Comprehensive Income
This Standard requires entities to group items presented in other comprehensive income on the basis of whether they might be reclassified subsequently to profit or loss and those that will not.
1 July 2012 The Group has considered the impact of this amendment and determined that there will be no impact on the Group’s financial report
1 July 2012
AASB 10 Consolidated Financial Statements
AASB 10 establishes a new control model that applies to all entities. It replaces parts of AASB 127 Consolidated and Separate Financial Statements dealing with the accounting for consolidated financial statements and UIG-112 Consolidation – Special Purpose Entities. The new control model broadens the situations when an entity is considered to be controlled by another entity and includes new guidance for applying the model to specific situations, including when acting as a manager may give control, the impact of potential voting rights and when holding less than a majority voting rights may give control. Consequential amendments were also made to other standards via AASB 2011-7.
1 January 2013
The Group has not yet considered the impact of the standard on its financial report
1 July 2013
For
per
sona
l use
onl
y

Optiscan Imaging Limited Annual Report 2012
Page | 25
Notes to the Financial Statements (continued) FOR THE YEAR ENDED 30 JUNE 2012
2 SUMMARY OF SIGNIFICANT ACCOUNTING POLICIES (continued) b) New accounting standards and interpretations
(i) Accounting standards and interpretations issued but not yet effective
Reference Title Summary Application
date of standard*
Impact on Group financial report
Application date for Group*
AASB 11 Joint Arrangements AASB 11 replaces AASB 131 Interests in Joint Ventures and UIG-113 Jointly- controlled Entities – Non-monetary Contributions by Ventures. AASB 11 uses the principle of control in AASB 10 to define joint control, and therefore the determination of whether joint control exists may change. In addition it removes the option to account for jointly controlled entities (JCEs) using proportionate consolidation. Instead, accounting for a joint arrangement is dependent on the nature of the rights and obligations arising from the arrangement. Joint operations that give the venturers a right to the underlying assets and obligations themselves is accounted for by recognising the share of those assets and obligations. Joint ventures that give the venturers a right to the net assets is accounted for using the equity method. Consequential amendments were also made to other standards via AASB 2011-7 and amendments to AASB 128.
1 January 2013
The Group has not yet considered the impact of the standard on its financial report
1 July 2013
AASB 12 Disclosure of Interests in Other Entities
AASB 12 includes all disclosures relating to an entity’s interests in subsidiaries, joint arrangements, associates and structures entities. New disclosures have been introduced about the judgments made by management to determine whether control exists, and to require summarised information about joint arrangements, associates and structured entities and subsidiaries with non-controlling interests.
1 January 2013
The Group has not yet considered the impact of the standard on its financial report
1 July 2013
AASB 13 Fair Value Measurement
AASB 13 establishes a single source of guidance for determining the fair value of assets and liabilities. AASB 13 does not change when an entity is required to use fair value, but rather, provides guidance on how to determine fair value when fair value is required or permitted. Application of this definition may result in different fair values being determined for the relevant assets. AASB 13 also expands the disclosure requirements for all assets or liabilities carried at fair value. This includes information about the assumptions made and the qualitative impact of those assumptions on the fair value determined. Consequential amendments were also made to other standards via AASB 2011-8.
1 January 2013
The Group has not yet considered the impact of the standard on its financial report
1 July 2013
For
per
sona
l use
onl
y

Optiscan Imaging Limited Annual Report 2012
Page | 26
Notes to the Financial Statements (continued) FOR THE YEAR ENDED 30 JUNE 2012
2 SUMMARY OF SIGNIFICANT ACCOUNTING POLICIES (continued) b) New accounting standards and interpretations (i) Accounting standards and interpretations issued but not yet effective
Reference Title Summary Application
date of standard*
Impact on Group financial report
Application date for Group*
AASB 119 Employee Benefits The main change introduced by this standard is to revise the accounting for defined benefit plans. The amendment removes the options for accounting for the liability, and requires that the liabilities arising from such plans is recognized in full with actuarial gains and losses being recognized in other comprehensive income. It also revised the method of calculating the return on plan assets. The revised standard changes the definition of short-term employee benefits. The distinction between short-term and other long-term employee benefits is now based on whether the benefits are expected to be settled wholly within 12 months after the reporting date. Consequential amendments were also made to other standards via AASB 2011-10.
1 January 2013
The Group has considered the impact of this amendment and determined that there will be no impact on the Group’s financial report
1 July 2013
For
per
sona
l use
onl
y

Optiscan Imaging Limited Annual Report 2012
Page | 27
Notes to the Financial Statements (continued) FOR THE YEAR ENDED 30 JUNE 2012
2 SUMMARY OF SIGNIFICANT ACCOUNTING POLICIES (continued) b) New accounting standards and interpretations (i) Accounting standards and interpretations issued but not yet effective
Reference Title Summary Application
date of standard*
Impact on Group financial report
Application date for Group*
Annual Improvements 2009–2011 Cycle ****
Annual Improvements to IFRSs 2009–2011 Cycle
This standard sets out amendments to International Financial Reporting Standards (IFRSs) and the related bases for conclusions and guidance made during the International Accounting Standards Board’s Annual Improvements process. These amendments have not yet been adopted by the AASB. The following items are addressed by this standard: IFRS 1 First-time Adoption of International Financial Reporting Standards
• Repeated application of IFRS 1
• Borrowing costs
IAS 1 Presentation of Financial Statements
• Clarification of the requirements for comparative information
IAS 16 Property, Plant and Equipment
• Classification of servicing equipment
IAS 32 Financial Instruments: Presentation
• Tax effect of distribution to holders of equity instruments
IAS 34 Interim Financial Reporting
• Interim financial reporting and segment information for total assets and liabilities
1 January 2013
The Group has not yet considered the impact of the standard on its financial report
1 July 2013
AASB 2011-4
Amendments to Australian Accounting Standards to Remove Individual Key Management Personnel Disclosure Requirements [AASB 124]
This Amendment deletes from AASB 124 individual key management personnel disclosure requirements for disclosing entities that are not companies.
1 July 2013 The Group has not yet considered the impact of the standard on its financial report
1 July 2013
For
per
sona
l use
onl
y

Optiscan Imaging Limited Annual Report 2012
Page | 28
Notes to the Financial Statements (continued) FOR THE YEAR ENDED 30 JUNE 2012
2 SUMMARY OF SIGNIFICANT ACCOUNTING POLICIES (continued) b) New accounting standards and interpretations (i) Accounting standards and interpretations issued but not yet effective
Reference Title Summary Application
date of standard*
Impact on Group financial report
Application date for Group*
AASB 1053
Application of Tiers of Australian Accounting Standards
This Standard establishes a differential financial reporting framework consisting of two Tiers of reporting requirements for preparing general purpose financial statements: (a) Tier 1: Australian Accounting Standards (b) Tier 2: Australian Accounting Standards –
Reduced Disclosure Requirements Tier 2 comprises the recognition, measurement and presentation requirements of Tier 1 and substantially reduced disclosures corresponding to those requirements. The following entities apply Tier 1 requirements in preparing general purpose financial statements: (a) For-profit entities in the private sector that
have public accountability (as defined in this Standard)
(b) The Australian Government and State, Territory and Local Governments
The following entities apply either Tier 2 or Tier 1 requirements in preparing general purpose financial statements: (a) For-profit private sector entities that do not
have public accountability (b) All not-for-profit private sector entities (c) Public sector entities other than the
Australian Government and State, Territory and Local Governments.
Consequential amendments to other standards to implement the regime were introduced by AASB 2010-2, 2011-2, 2011-6, 2011-11 and 2012-1.
1 July 2013 The Group has considered the impact of this amendment and determined that there will be no impact on the Group’s financial report
1 July 2013
AASB 2012-2
Amendments to Australian Accounting Standards – Disclosures – Offsetting Financial Assets and Financial Liabilities
AASB 2012-2 principally amends AASB 7 Financial Instruments: Disclosures to require disclosure of information that will enable users of an entity’s financial statements to evaluate the effect or potential effect of netting arrangements, including rights of set-off associated with the entity’s recognised financial assets and recognised financial liabilities, on the entity’s financial position.
1 January 2013
The Group has not yet considered the impact of the standard on its financial report
1 July 2013
For
per
sona
l use
onl
y

Optiscan Imaging Limited Annual Report 2012
Page | 29
Notes to the Financial Statements (continued) FOR THE YEAR ENDED 30 JUNE 2012
2 SUMMARY OF SIGNIFICANT ACCOUNTING POLICIES (continued) b) New accounting standards and interpretations (i) Accounting standards and interpretations issued but not yet effective
Reference Title Summary Application
date of standard*
Impact on Group financial report
Application date for Group*
AASB 2012-4
Amendments to Australian Accounting Standards – Government Loans
AASB 2012-4 adds an exception to the retrospective application of Australian Accounting Standards under AASB 1 First-time Adoption of Australian Accounting Standards to require that first-time adopters apply the requirements in AASB 139 Financial Instruments: Recognition and Measurement (or AASB 9 Financial Instruments) and AASB 120 Accounting for Government Grants and Disclosure of Government Assistance prospectively to government loans (including those at a below-market rate of interest) existing at the date of transition to Australian Accounting Standards.
1 January 2013
The Group has not yet considered the impact of the standard on its financial report
1 July 2013
AASB 2012-5
Amendments to Australian Accounting Standards arising from Annual Improvements 2009–2011 Cycle; and
AASB 2012-5 makes amendments resulting from the 2009-2011 Annual Improvements Cycle. The Standard addresses a range of improvements, including the following: • repeat application of AASB 1 is permitted (AASB 1); and • clarification of the comparative information requirements when an entity provides a third balance sheet (AASB 101 Presentation of Financial Statements).
1 January 2013
The Group has not yet considered the impact of the standard on its financial report
1 July 2013
AASB 2012-3
Amendments to Australian Accounting Standards – Offsetting Financial Assets and Financial Liabilities;
AASB 2012-3 adds application guidance to AASB 132 Financial Instruments: Presentation to address inconsistencies identified in applying some of the offsetting criteria of AASB 132, including clarifying the meaning of “currently has a legally enforceable right of set-off” and that some gross settlement systems may be considered equivalent to net settlement.
1 January 2014
The Group has not yet considered the impact of the standard on its financial report
1 July 2015
For
per
sona
l use
onl
y

Optiscan Imaging Limited Annual Report 2012
Page | 30
Notes to the Financial Statements (continued) FOR THE YEAR ENDED 30 JUNE 2012
2 SUMMARY OF SIGNIFICANT ACCOUNTING POLICIES (continued) b) New accounting standards and interpretations (i) Accounting standards and interpretations issued but not yet effective
Reference Title Summary Application
date of standard*
Impact on Group financial report
Application date for Group*
AASB 9 Financial Instruments
AASB 9 includes requirements for the classification and measurement of financial assets. It was further amended by AASB 2010-7 to reflect amendments to the accounting for financial liabilities. These requirements improve and simplify the approach for classification and measurement of financial assets compared with the requirements of AASB 139. The main changes are described below. (a) Financial assets that are debt instruments
will be classified based on (1) the objective of the entity’s business model for managing the financial assets; (2) the characteristics of the contractual cash flows.
(b) Allows an irrevocable election on initial recognition to present gains and losses on investments in equity instruments that are not held for trading in other comprehensive income. Dividends in respect of these investments that are a return on investment can be recognised in profit or loss and there is no impairment or recycling on disposal of the instrument.
(c) Financial assets can be designated and measured at fair value through profit or loss at initial recognition if doing so eliminates or significantly reduces a measurement or recognition inconsistency that would arise from measuring assets or liabilities, or recognising the gains and losses on them, on different bases.
(d) Where the fair value option is used for financial liabilities the change in fair value is to be accounted for as follows: ► The change attributable to changes in
credit risk are presented in other comprehensive income (OCI)
► The remaining change is presented in profit or loss
If this approach creates or enlarges an accounting mismatch in the profit or loss, the effect of the changes in credit risk are also presented in profit or loss. Consequential amendments were also made to other standards as a result of AASB 9, introduced by AASB 2009-11 and superseded by AASB 2010-7 and 2010-10.
1 January 2015***
The Group has not yet considered the impact of the standard on its financial report
1 July 2015
For
per
sona
l use
onl
y

Optiscan Imaging Limited Annual Report 2012
Page | 31
Notes to the Financial Statements (continued) FOR THE YEAR ENDED 30 JUNE 2012
2 SUMMARY OF SIGNIFICANT ACCOUNTING POLICIES (continued) c) Basis of consolidation
The consolidated financial statements comprise the financial statements of Optiscan Imaging Limited and its subsidiaries as at 30 June each year (the Group). Subsidiaries are all those entities over which the Group has the power to govern the financial and operating policies so as to obtain benefits from their activities. The financial statements of the subsidiaries are prepared for the same reporting period as the parent company, using consistent accounting policies. In preparing the consolidated financial statements, all intercompany balances and transactions, income and expenses and profit and losses resulting from intra-group transactions have been eliminated in full. Subsidiaries are fully consolidated from the date on which control is obtained by the Group and cease to be consolidated from the date on which control is transferred out of the Group.
d) Revenue recognition Revenue is recognised to the extent that it is probable that the economic benefits will flow to the Group and the revenue can be reliably measured. The following specific recognition criteria must also be met before revenue is recognised: (i) Sale of goods Revenue is recognised when the significant risks and rewards of ownership of the goods have passed to the buyer and the costs incurred or to be incurred in respect of the transaction can be measured reliably. Risks and rewards of ownership are considered passed to the buyer at the time of delivery of the goods to the customer.
(ii) Rendering of services Revenue from service and product support activities is recognised by reference to the stage of completion of a contract. Stage of completion is measured by reference to labour hours incurred to date as a percentage of total estimated labour hours for each contract. When the contract outcome cannot be estimated reliably, revenue is recognised only to the extent of the expenses recognised that are recoverable. (iii) Royalty revenue Royalty revenue is recognised on an accrual basis in accordance with the substance of the relevant licensing agreement. (iv) Interest revenue Interest revenue is recognised as interest accrues using the effective interest method. This is a method of calculating the amortised cost of a financial asset and allocating the interest income over the relevant period using the effective interest rate, which is the rate that exactly discounts estimated future cash receipts through the expected life of the financial asset to the net carrying amount of the financial asset.
e) Government grants
Government grants are recognised in the statement of financial position as a liability when there is reasonable assurance that the grant will be received and all attaching conditions will be complied with. When the grant relates to an expense item, it is recognised as income over the periods necessary to match the grant on a systematic basis to the costs that it is intended to compensate. Where expenditure has been incurred that gives rise to an entitlement under a grant agreement, the grant income is accrued.
For
per
sona
l use
onl
y
Optiscan Imaging Limited Annual Report 2012
Page | 32
Notes to the Financial Statements (continued) FOR THE YEAR ENDED 30 JUNE 2012
2 SUMMARY OF SIGNIFICANT ACCOUNTING POLICIES (continued)
f) Leases
The determination of whether an arrangement is or contains a lease is based on the substance of the arrangement and requires an assessment of whether the fulfillment of the arrangement is dependent on the use of a specific asset or assets and the arrangement conveys a right to use the asset. (i) Group as lessor Leases in which the Group retains substantially all the risks and benefits of ownership are classified as operating leases. Rental income is recognised in profit or loss in accordance with the term of the lease. (ii) Group as lessee Operating lease payments are recognised as an expense in profit or loss on a straight-line basis over the lease term.
g) Cash and cash equivalents Cash and short-term deposits in the Statement of Financial Position comprise cash at bank and in hand and short term deposits with an original maturity of three months or less that are readily convertible to known amounts of cash and which are subject to an insignificant risk of changes in value. Cash and short term deposits are stated at nominal values.
For the purposes of the Statement of Cash Flows, cash and cash equivalents consist of cash and cash equivalents as defined above.
h) Trade and other receivables
Trade receivables and other receivables, both of which generally have 30 to 60 day terms, are non interest bearing and are recognised and carried at original invoice amount less an allowance for any uncollectible amounts. Impairment of receivables is assessed by reference to ageing of receivables and the Group’s knowledge of the profile and status of the debtors. An allowance for doubtful debts is made when there is objective evidence that the Group will not be able to collect the debts. Bad debts are written off when identified.
i) Inventories
Inventories are valued at the lower of cost and net realisable value. Costs incurred in bringing each product to its present location and condition are accounted for as follows: - Raw materials – purchase cost on a first-in, first-out basis; cost comprises the purchase price,
import duties and other taxes (other than those subsequently recoverable by the entity from the taxing authorities), and transport, handling and other costs directly attributable to acquisition
- Finished goods and work-in-progress – cost of direct materials and labour and a proportion of manufacturing overheads based on normal operating capacity.
Net realisable value is the estimated selling price in the ordinary course of business, less estimated costs of completion and the estimated costs necessary to make the sale.
For
per
sona
l use
onl
y

Optiscan Imaging Limited Annual Report 2012
Page | 33
Notes to the Financial Statements (continued) FOR THE YEAR ENDED 30 JUNE 2012
2 SUMMARY OF SIGNIFICANT ACCOUNTING POLICIES (continued)
j) Derivative financial instruments and hedging The Group sometimes uses derivative financial instruments in the form of forward currency contracts to economically hedge its risks associated with foreign currency fluctuations. Such derivative financial instruments are initially recognised at fair value on the date on which a derivative contract is entered into and are subsequently remeasured to fair value. Derivatives are carried as assets when their fair value is positive and as liabilities when their fair value is negative. The fair value of forward currency contracts is calculated by reference to current forward exchange rates for contracts with similar maturity profiles. As the Group economically hedges but does not meet the strict criteria for hedge accounting under AASB 139 Financial Instruments: Recognition and Measurement, any gains or losses arising from changes in the fair value of derivatives are taken directly to profit or loss for the year. For information on the Group's financial risk management objectives and policies with respect to its economic hedging program, refer to Note 3.
k) Foreign currency translation Both the functional and presentation currency of Optiscan Imaging Limited and its Australian subsidiary is Australian dollars ($). Each entity in the Group determines its own functional currency and items included in the financial statements of each entity are measured using that functional currency. Transactions in foreign currencies are initially recorded in the functional currency by applying the exchange rates ruling at the date of the transaction. Monetary assets and liabilities denominated in foreign currencies are retranslated at the rate of exchange ruling at balance date. All transactional exchange differences are recognised in profit or loss. Exchange variations arising on consolidation from the translation of the net investment in foreign subsidiaries, including loans forming part of the net investment, are recognised in the foreign currency translation reserve in equity.
l) Income tax Current tax assets and liabilities for the current and prior periods are measured at the amount expected to be recovered from or paid to the taxation authorities. The tax rates and tax laws used to compute the amount are those that are enacted or substantively enacted by balance date. Deferred income tax is provided on all temporary differences between the tax bases of assets and liabilities and their carrying amounts for financial reporting purposes at balance date. Deferred income tax liabilities are recognised for all taxable temporary differences except: • when the deferred income tax liability arises from the initial recognition of goodwill or of an asset or
liability in a transaction that is not a business combination and that, at the time of the transaction, affects neither the accounting profit nor taxable profit or loss; or
• when the taxable temporary difference is associated with investments in subsidiaries, associates or
interests in joint ventures, and the timing of the reversal of the temporary difference can be controlled and it is probable that the temporary difference will not reverse in the foreseeable future.
For
per
sona
l use
onl
y

Optiscan Imaging Limited Annual Report 2012
Page | 34
Notes to the Financial Statements (continued) FOR THE YEAR ENDED 30 JUNE 2012
2 SUMMARY OF SIGNIFICANT ACCOUNTING POLICIES (continued)
l) Income tax (continued)
Deferred income tax assets are recognised for all deductible temporary differences, carry-forward of unused tax credits and unused tax losses, to the extent that it is probable that taxable profit will be available against which the deductible temporary differences and the carry-forward of unused tax credits and unused tax losses can be utilised. Exceptions to this position arise:
• when the deferred income tax asset relating to the deductible temporary difference arises from the
initial recognition of an asset or liability in a transaction that is not a business combination and, at the time of the transaction, affects neither the accounting profit nor taxable profit or loss; or
• when the deductible temporary difference is associated with investments in subsidiaries, associates
or interests in joint ventures, in which case a deferred tax asset is only recognised to the extent that it is probable that the temporary difference will reverse in the foreseeable future and taxable profit will be available against which the temporary difference can be utilised.
The carrying amount of deferred income tax assets is reviewed at each balance date to determine whether it is probable that sufficient taxable profit will be available to allow all or part of the deferred income tax asset to be utilised. The carrying amount of deferred tax assets is reduced to the extent that it is not probable that sufficient taxable profit will be available to allow all or part of the deferred income tax asset to be utilised. Unrecognised deferred income tax assets are reassessed at each balance date and are recognised to the extent that it has become probable that future taxable profit will allow the deferred tax asset to be recovered. Deferred income tax assets and liabilities are measured at the tax rates that are expected to apply to the year when the asset is realised or the liability is settled, based on tax rates (and tax laws) that have been enacted or substantively enacted at balance date.
Income taxes relating to items recognised directly in equity are recognised in equity and not in profit or loss.
If deferred tax assets and deferred tax liabilities are recorded in the accounts, they are offset only if a legally enforceable right exists to set off current tax assets against current tax liabilities and the deferred tax assets and liabilities relate to the same taxable entity and the same taxation authority. Tax consolidation Optiscan Imaging Limited and its 100% owned Australian resident subsidiary have elected not to form a tax consolidated group.
m) Other taxes Revenues, expenses and assets are recognised net of the amount of GST except: • when the GST incurred on a purchase of goods and services is not recoverable from the taxation
authority, in which case the GST is recognised as part of the cost of acquisition of the asset or as part of the expense item as applicable; and
• receivables and payables, which are stated with the amount of GST included. The net amount of GST recoverable from, or payable to, the taxation authority is included as part of receivables or payables in the Statement of Financial Position.
For
per
sona
l use
onl
y

Optiscan Imaging Limited Annual Report 2012
Page | 35
Notes to the Financial Statements (continued) FOR THE YEAR ENDED 30 JUNE 2012
2 SUMMARY OF SIGNIFICANT ACCOUNTING POLICIES (continued)
m) Other taxes (continued) Cash flows are included in the Statement of Cash Flows on a gross basis and the GST component of cash flows arising from investing and financing activities, which is recoverable from, or payable to, the taxation authority are classified as operating cash flows. Commitments and contingencies are disclosed net of the amount of GST recoverable from, or payable to, the taxation authority.
n) Plant and equipment
Plant and equipment is stated at cost less accumulated depreciation and any accumulated impairment losses. Depreciation is calculated on a straight-line basis over the estimated useful life of the assets. The depreciation rates applied to the main classes of plant and equipment are:
Class of plant and equipment Depreciation rate Office furniture & equipment 20% - 40% Production equipment 20% R&D equipment 30% - 40%
The assets' residual values, useful lives and amortisation methods are reviewed, and adjusted if appropriate, at each financial year end.
Disposal An item of plant and equipment is derecognised upon disposal or when no further future economic benefits are expected from its use or disposal. Any gain or loss arising on derecognition of the asset (calculated as the difference between the net disposal proceeds and the carrying amount of the asset) is included in profit or loss in the year the asset is derecognised.
o) Investments and other financial assets
Other financial assets consist of investments in controlled entities, which are carried at cost less any impairment in the parent company's financial statements. The carrying values of investments in controlled entities are reviewed for impairment at each reporting date. The recoverable amount of investments in and loans to controlled entities is the higher of estimated fair value less costs to sell and value in use.
p) Intangible assets The only intangible assets recognised by the group are software assets. The amounts capitalised represent the acquisition cost of software used in the design, development and administrative activities of the group. These amounts are amortised over a period of no more than three years, and are assessed for impairment on an annual basis. At present intangible software assets are fully written down, with zero carrying value.
For
per
sona
l use
onl
y

Optiscan Imaging Limited Annual Report 2012
Page | 36
Notes to the Financial Statements (continued) FOR THE YEAR ENDED 30 JUNE 2012
2 SUMMARY OF SIGNIFICANT ACCOUNTING POLICIES (continued)
p) Intangible assets (continued)
Research and development costs Research costs are expensed as incurred. An intangible asset arising from development expenditure on an internal project is recognised only when the Group can demonstrate the technical feasibility of completing the intangible asset so that it will be available for use or sale, its intention to complete and its ability to use or sell the asset, how the asset will generate future economic benefits, the availability of resources to complete the development and the ability to measure reliably the expenditure attributable to the intangible asset during its development. Following the initial recognition of the development expenditure, a review of activity will be conducted on a project by project basis, and the cost model will be applied, requiring the development asset to be carried at cost less any accumulated amortisation and accumulated impairment losses. Any expenditure so capitalised is to be amortised over the period of expected benefits from the related project. No such expenditure has yet been capitalised by the Group.
q) Trade and other payables Trade payables and other payables are non interest bearing and are carried at amortised cost. They represent liabilities for goods and services provided to the Group prior to the end of the financial year that are unpaid and arise when the Group becomes obliged to make future payments in respect of the purchase of these goods and services. The amounts are unsecured and are generally paid on 30 day terms.
r) Interest bearing loans and borrowings All loans and borrowings are initially recognised at the fair value of the consideration received less directly attributable transaction costs. After initial recognition, interest bearing loans and borrowings are subsequently measured at amortised cost using the effective interest method. Any fees paid on the establishment of loan facilities that are yield related are included as part of the carrying amount of the loans and borrowings. Costs of borrowing facilities are treated as prepayments and allocated over the term of the facility. Borrowings are classified as current liabilities unless the Group has an unconditional right to defer settlement of the liability for at least 12 months after balance date. The consideration received from the issue of convertible notes is allocated between equity and liabilities. The equity component is that part of the consideration that relates to the value of the option to convert to equity. The balance of the consideration received is the fair value of the convertible note liability.
s) Provisions and employee leave benefits Provisions Provisions are recognised when the Group has a present obligation (legal or constructive) as a result of a past event, it is probable that an outflow of resources embodying economic benefits will be required to settle the obligation and a reliable estimate can be made of the amount of the obligation. When the Group expects some or all of a provision to be reimbursed, for example under an insurance contract, the reimbursement is recognised as a separate asset but only when the reimbursement is virtually certain. The expense relating to any provision is presented in profit or loss net of any reimbursement.
For
per
sona
l use
onl
y

Optiscan Imaging Limited Annual Report 2012
Page | 37
Notes to the Financial Statements (continued) FOR THE YEAR ENDED 30 JUNE 2012
2 SUMMARY OF SIGNIFICANT ACCOUNTING POLICIES (continued)
s) Provisions and employee benefits (continued)
Provisions (continued) Provisions are measured at the present value of management’s best estimate of the expenditure required to settle the present obligation at balance date using a discounted cashflow methodology. If the effect of the time value of money is material, provisions are discounted using a current pre-tax rate that reflects the time value of money and the risks specific to the liability. Employee leave benefits (i) Wages, salaries, superannuation, and annual leave Liabilities for wages and salaries, including non-monetary benefits, superannuation and annual leave expected to be settled within 12 months of the reporting dates are recognised in respect of employees' services up to the reporting date. They are measured at the amounts expected to be paid when the liabilities are settled. Expenses for non-accumulating sick leave are recognised when the leave is taken and are measured at the rates paid or payable. (ii) Long service leave The liability for long service leave is recognised in the provision for employee benefits and measured as the present value of expected future payments to be made in respect of services provided by employees up to the reporting date. Consideration is given to expected future wage and salary levels, experience of employee departures, and periods of service. Expected future payments are discounted using market yields at the reporting date on national government bonds with terms to maturity and currencies that match, as closely as possible, the estimated future cash outflows.
t) Share-based payment transactions
(i) Equity settled transactions with employees
The Group provides benefits to employees (including key management personnel) in the form of share-based payments, whereby employees render services in exchange for shares or rights over shares (equity-settled transactions). There is an Employee Share Option Plan (ESOP) in place, which provides benefits to employees. The cost of these equity-settled transactions with employees is measured by reference to the fair value of the equity instruments at the date at which they are granted. The fair value is determined using a Black Scholes valuation model, further details of which are provided in note 22. In November 2010, ASX and shareholder approval was obtained to enable the Executive Chairman to take fixed remuneration by way of fully paid ordinary shares in lieu of cash. This approval was for calendar year 2011 only, and thereafter, fixed remuneration reverted to cash. In valuing equity-settled transactions, no account is taken of any performance conditions, other than conditions linked to the price of the shares of Optiscan Imaging Limited (market conditions) if applicable. The cost of equity-settled transactions is recognised, together with a corresponding increase in equity, over the period in which the performance and/or service conditions are fulfilled (the vesting period), ending on the date on which the relevant employees become fully entitled to the award (the vesting date).At each reporting date until vesting the cumulative charge to profit or loss is the product of (i) the grant date fair value of the award; (ii) the current best estimate of the number of equity instruments that will ultimately vest, taking into account such factors as the likelihood of employee turnover during the vesting period, and the likelihood of non market performance conditions being met, and (iii) the expired portion of the vesting period. The charge to profit or loss for the period is the cumulative amount as calculated above less the amounts already charged in previous periods. There is a corresponding entry to equity.
For
per
sona
l use
onl
y

Optiscan Imaging Limited Annual Report 2012
Page | 38
Notes to the Financial Statements (continued) FOR THE YEAR ENDED 30 JUNE 2012
2 SUMMARY OF SIGNIFICANT ACCOUNTING POLICIES (continued) t) Share-based payment transactions (continued)
Until an award has vested, any amounts recorded are contingent and will be adjusted if more or fewer awards vest than were originally anticipated to do so. Any award subject to a market condition is considered to vest irrespective of whether or not that market condition is fulfilled, provided all other conditions are satisfied. If the terms of an equity-settled award are modified, as a minimum an expense is recognised as if the terms had not been modified. An additional expense is recognised for any modification that increases the total fair value of the share-based payment arrangement, or is otherwise beneficial to the employee, as measured at the date of modification. If an equity-settled award is cancelled, it is treated as if it had vested on the date of cancellation, and any expense not yet recognised for the award is recognised immediately. However, if a new award is substituted for the cancelled award and designated as a replacement award on the date that it is granted, the cancelled and new award are treated as if they were a modification of the original award, as described in the previous paragraph. (ii) Equity settled transactions with parties other than employees
The Group may from time to time enter into arrangements with parties other than employees which involve consideration in the form of equity-settled transactions by way of allotment of shares and or options. The cost of equity-settled transactions is recognised, together with a corresponding increase in equity, over the period in which the service is provided. The dilutive effect, if any, of outstanding options is reflected as additional share dilution in the computation of earnings / (loss) per share (see note 8).
u) Contributed equity
Ordinary shares are classified as equity. Incremental costs directly attributable to the issue of new shares or options are shown in equity as a deduction from the proceeds (net of tax). The consideration received from the issue of convertible notes is allocated between equity and liabilities. The equity component is that part of the consideration that relates to the value of the option to convert to equity.
v) Earnings (Loss) per share
Basic earnings (loss) per share is calculated as net profit (loss) attributable to members of the parent, adjusted to exclude any costs of servicing equity (other than dividends) divided by the weighted average number of ordinary shares. Diluted earnings (loss) per share is calculated as net profit (loss) attributable to members of the parent, adjusted for:
• costs of servicing equity (other than dividends) and interest associated with dilutive potential ordinary shares that have been recognised as expenses; and
• other non-discretionary changes in revenues or expenses during the period that would result from the dilution of potential ordinary shares;
divided by the weighted average number of ordinary shares and dilutive potential ordinary shares.
For
per
sona
l use
onl
y

Optiscan Imaging Limited Annual Report 2012
Page | 39
Notes to the Financial Statements (continued) FOR THE YEAR ENDED 30 JUNE 2012
2 SUMMARY OF SIGNIFICANT ACCOUNTING POLICIES (continued) w) Segment reporting
An operating segment is a component of an entity that engages in business activities from which it may earn revenues and incur expenses (including revenues and expenses relating to transactions with other components of the same entity), whose operating results are regularly reviewed by the entity's chief operating decision maker to make decisions about resources to be allocated to the segment and assess its performance and for which discrete financial information is available. Operating segments have been identified based on the information provided to the chief operating decision makers, being the board of directors.
3 FINANCIAL RISK MANAGEMENT OBJECTIVES AND POLICIES
The Group's principal financial instruments comprise receivables, payables, cash and short-term deposits, convertible notes and, from time to time, derivatives. In the context of the Group’s overall risk profile, financial instruments do not represent the most significant exposure. Commercial risk associated with our business partnerships, technology risk around future development and market risk relating to adoption of the technology will have considerably more impact on our risk profile than the risks relating to financial instruments. The Group monitors its exposure to key financial risks, principally currency and liquidity risk, with the objective of achieving the Group's financial targets whilst protecting future financial security. The Group enters into derivative transactions from time to time, mainly forward currency contracts. The purpose is to manage the currency risks arising from the Group's operations. These derivatives provide economic hedges, but do not qualify for hedge accounting and are based on limits set by the Board. It is, and has been throughout the period under review, the Group’s policy that no trading in financial instruments shall be undertaken. The main risks arising from the Group's financial instruments are foreign currency risk, liquidity risk, interest rate risk and credit risk. The Group uses different methods to measure and manage different types of risks to which it is exposed. These include monitoring levels of exposure to interest rate and foreign exchange risk and assessments of market forecasts for interest and foreign exchange rates. Liquidity risk is monitored through the development of future rolling cash flow forecasts and regular internal reporting. There is a lesser degree of risk management in relation to interest rate risk and credit risk, as these are considered to have less capacity to materially impact the Group’s financial position at the present time. The Board reviews and agrees policies for managing each of these risks as summarised below. Primary responsibility for identification and control of financial risks rests with the Board. It reviews and agrees policies for managing each of the risks, including the use of derivatives, hedging cover of foreign currency, credit allowances, and future cash flow forecast projections. Details of the significant accounting policies and methods adopted, including the criteria for recognition, the basis of measurement and the basis on which income and expenses are recognised, in respect of each class of financial asset, financial liability and equity instrument are disclosed in note 2 to the financial statements.
For
per
sona
l use
onl
y

Optiscan Imaging Limited Annual Report 2012
Page | 40
Notes to the Financial Statements (continued) FOR THE YEAR ENDED 30 JUNE 2012
3 FINANCIAL RISK MANAGEMENT OBJECTIVES AND POLICIES (continued)
Risk Exposures and Responses Interest rate risk The Group's exposure to market interest rates relates primarily to the Group's cash and cash equivalents. As cash on deposit is expected to exceed the amount of interest bearing liabilities, if any, a climate of increasing interest rates will increase net income and conversely, falling rates will reduce income. However, the impact of movements in interest rates is not material in the context of the Group’s operations or trading results. At balance date, the Group had the following financial assets exposed to Australian variable interest rate risk that are not designated in cash flow hedges:
Consolidated 2012 2011 Financial Assets $ $ Cash and cash equivalents * 551,014 1,076,768 Other receivables 67,000 - Financial Liabilities Convertible notes (210,414) (500,000) Accrued note interest - (30,914) Net exposure
407,600
545,854
*These amounts differ from the balance sheet due to non- interest bearing cash on hand and foreign currency balances.
The following sensitivity analysis is based on the interest rate risk exposures in existence at balance date: At 30 June 2012, if interest rates had moved throughout the year, as illustrated in the table below, with all other variables held constant, post tax loss and equity would have been affected as follows:
Judgements of reasonably possible movements in interest rates:
Net Profit Higher (Lower)
Other Comprehensive Income
Higher (Lower)
2012 2011 2012 2011 $ $ $ $ Consolidated +0.25% (25 basis points) 495 1,748 - - -0.75% (75 basis points) (1,484) (5,243) - -
Interest rates were generally stable during 2011/2012, with official rates moving shifting downwards. The global economic outlook remained subdued, with sentiment biased toward downward movement in rates rather than further upward pressure. On this basis, a possible movement in rates from +0.25% to -0.75% has been adopted as a reasonably possible movement in rates. The movements in net profit are due to higher and lower amounts of interest received from interest bearing cash balances. There is no movement in other comprehensive income as there are no derivative instruments designated as cash flow hedges.
For
per
sona
l use
onl
y
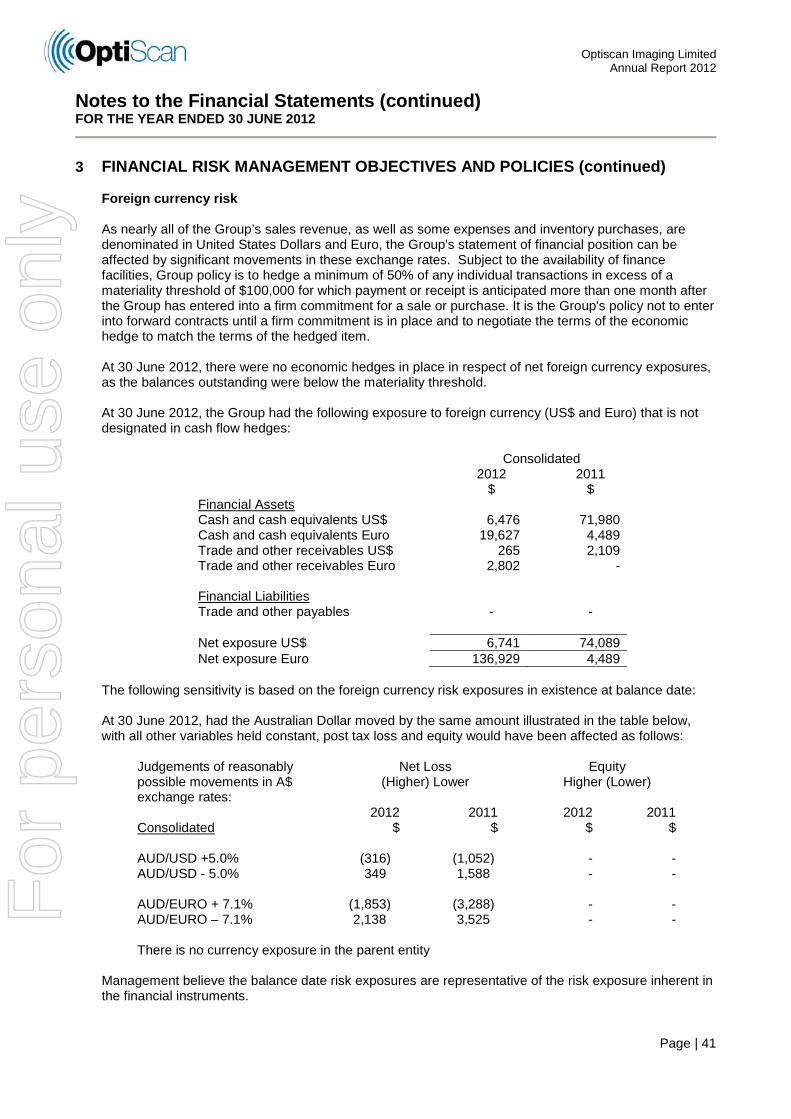
Optiscan Imaging Limited Annual Report 2012
Page | 41
Notes to the Financial Statements (continued) FOR THE YEAR ENDED 30 JUNE 2012
3 FINANCIAL RISK MANAGEMENT OBJECTIVES AND POLICIES (continued)
Foreign currency risk As nearly all of the Group’s sales revenue, as well as some expenses and inventory purchases, are denominated in United States Dollars and Euro, the Group's statement of financial position can be affected by significant movements in these exchange rates. Subject to the availability of finance facilities, Group policy is to hedge a minimum of 50% of any individual transactions in excess of a materiality threshold of $100,000 for which payment or receipt is anticipated more than one month after the Group has entered into a firm commitment for a sale or purchase. It is the Group's policy not to enter into forward contracts until a firm commitment is in place and to negotiate the terms of the economic hedge to match the terms of the hedged item. At 30 June 2012, there were no economic hedges in place in respect of net foreign currency exposures, as the balances outstanding were below the materiality threshold. At 30 June 2012, the Group had the following exposure to foreign currency (US$ and Euro) that is not designated in cash flow hedges:
Consolidated 2012 2011 $ $
Financial Assets Cash and cash equivalents US$ 6,476 71,980 Cash and cash equivalents Euro 19,627 4,489 Trade and other receivables US$ 265 2,109 Trade and other receivables Euro 2,802 - Financial Liabilities Trade and other payables - - Net exposure US$ 6,741 74,089 Net exposure Euro 136,929 4,489
The following sensitivity is based on the foreign currency risk exposures in existence at balance date: At 30 June 2012, had the Australian Dollar moved by the same amount illustrated in the table below, with all other variables held constant, post tax loss and equity would have been affected as follows:
Judgements of reasonably possible movements in A$ exchange rates:
Net Loss (Higher) Lower
Equity Higher (Lower)
2012 2011 2012 2011 Consolidated $ $ $ $ AUD/USD +5.0% (316) (1,052) - - AUD/USD - 5.0% 349 1,588 - - AUD/EURO + 7.1% (1,853) (3,288) - - AUD/EURO – 7.1% 2,138 3,525 - - There is no currency exposure in the parent entity
Management believe the balance date risk exposures are representative of the risk exposure inherent in the financial instruments.
For
per
sona
l use
onl
y

Optiscan Imaging Limited Annual Report 2012
Page | 42
Notes to the Financial Statements (continued) FOR THE YEAR ENDED 30 JUNE 2012
3 FINANCIAL RISK MANAGEMENT OBJECTIVES AND POLICIES (continued)
Credit risk Credit risk arises from the financial assets of the Group, which comprise cash and cash equivalents, trade and other receivables and derivative instruments. The Group's exposure to credit risk arises from potential default of the counter party, with a maximum exposure equal to the carrying amount of these instruments. Exposure at balance date is addressed in each applicable note. The Group does not hold any credit derivatives to offset its credit exposure. The Group trades only with recognised, creditworthy third parties, and as such collateral is not requested nor is it the Group's policy to securitise its trade and other receivables. It is the Group's policy that all customers who wish to trade on credit terms are subject to credit verification procedures including an assessment of their independent credit rating, financial position, past experience and industry reputation. Risk limits are set for each individual customer, and are regularly monitored. In addition, receivable balances are monitored on an ongoing basis with the result that the Group's exposure to bad debts is not significant. There is no significant concentration of credit risk in the Group’s current trading position. With respect to credit risk arising from the other financial assets of the Group, which comprise cash and cash equivalents, the Group’s exposure to credit risk arises from the possibility of default of the counter party. This is considered unlikely as the Group places cash and cash equivalents only with recognised Australian trading banks. Liquidity risk and capital management The Group's objective is to maintain adequate funding of its activities. Prior to May 2009, all capital financing has been derived from issues of equity. In May 2009, and in March 2012, the Group issued convertible notes, introducing debt finance to the funding mix. Capital management is a process of monitoring cash reserves and forecast cash requirements, and there are no externally imposed capital requirements. The table below reflects all contractually fixed pay-offs and receivables for settlement from recognised financial assets and liabilities, as of 30 June 2012. Cash flows for financial assets and liabilities without fixed amount or timing are based on the conditions existing at 30 June 2012.
Consolidated <6 months 1-5 years Total
Year ended 30 June 2012 Liquid financial assets Cash and cash equivalents 578,900 - 578,900 Trade and other receivables 162,687 - 162,687 Financial liabilities Trade and other payables 266,490 - 266,490 Convertible notes 300,000 - 300,000 Net maturity 175,097 - 175,097
Year ended 30 June 2011 Liquid financial assets Cash and cash equivalents 1,078,694 - 1,078,694 Trade and other receivables 835,191 - 835,191 Financial liabilities Trade and other payables 180,397 - 180,397 Convertible notes 500,000 - 500,000 Net maturity 1,233,488 - 1,233,488
For
per
sona
l use
onl
y

Optiscan Imaging Limited Annual Report 2012
Page | 43
Notes to the Financial Statements (continued) FOR THE YEAR ENDED 30 JUNE 2012
3 FINANCIAL RISK MANAGEMENT OBJECTIVES AND POLICIES (continued)
Liquidity risk and capital management (continued) The contractual maturities of the Group's and parent entity's financial assets and liabilities set out in the table are equivalent to the maturity analysis of financial assets and liability based on management's expectation. The risk implied from the values in the table reflects a balanced view of cash inflows and outflows. Trade payables and other financial liabilities mainly originate from investments in working capital, principally inventories and trade receivables. These assets are considered in the Group's overall liquidity risk, which is monitored through review of forecasts of liquidity reserves on the basis of expected cash flow. The cash and cash equivalent balance classified as being capable of settlement within 90 days includes term deposits which are secured by the bank (refer note 16). These amounts could be released within six months upon cancellation of the underlying bank facilities, or upon a re-negotiation of the security arrangements, for example, by providing a charge over assets other than cash. The Group’s activities are funded from its cash reserves and convertible notes. There are no unused credit facilities. Bank facilities are non credit lines, details of which are disclosed in note 16. Fair value The methods for estimating fair value are outlined in the relevant notes to the financial statements, and unless specifically stated, carrying value approximates fair value for all financial instruments.
4 SIGNIFICANT ACCOUNTING JUDGEMENTS, ESTIMATES AND ASSUMPTIONS
In applying the Group’s accounting policies, management continually evaluates judgements, estimates and assumptions based on historical experience and other factors, including expectations of future events that may have an impact on the Group. All judgements, estimates and assumptions made are believed to be reasonable based on the most current set of circumstances available to management. Actual results may differ from the judgements, estimates and assumptions. The more significant judgements, estimates and assumptions made by management in the preparation of these financial statements are outlined below: Net realisable value of inventory Some of the inventory held by the Group is the first generation confocal imaging platform, relating to FIVE 1 products and accessories, and the balance is prototype second generation processors. The rate of future sales, and the usage of parts for service and support are uncertain, and as a consequence the Group’s ability to realise the carrying value of inventory is similarly uncertain. Long service leave provision The liability for long service leave is recognised and measured at the present value of the estimated future cash flows to be made in respect of services provided by all employees up to balance date. In determining the present value of the liability, years of service, attrition rates, future pay increases and inflation have been taken into account. Expected future payments are discounted using market yields at the reporting date on government bonds with terms to maturity that match, as closely as practicable, the estimated future cash outflows. Share based payment valuation The valuation of share based payments requires calculations, judgments and estimations of share price volatility, expected exercise periods and other factors. The assumptions are detailed in Note 22.
For
per
sona
l use
onl
y

Optiscan Imaging Limited Annual Report 2012
Page | 44
Notes to the Financial Statements (continued) FOR THE YEAR ENDED 30 JUNE 2012
4 SIGNIFICANT ACCOUNTING JUDGEMENTS, ESTIMATES AND ASSUMPTIONS (cont) Warranty provision A provision for warranty at the rate of 3% of sales has been provided since the commencement of product sales in March 2006. The incidence of warranty claims is modest and is monitored by management on an ongoing basis to assess the adequacy of the provision. Capitalisation of research and development expenditure The group expenses all research and development expenditure (refer note 2(q)). The group’s development activities are at a stage where there is not yet adequate probability that the tests for capitalisation can be met. The matter is kept under regular review. Recognition of deferred tax assets The carrying amount of deferred tax assets is dependent upon a judgement as to whether it is probable that sufficient taxable profit will be available to allow all or part of the deferred tax asset to be utilised. In the light of the continuing expenditure on R&D there is not yet adequate probability of taxable profit in the future that will enable the utilisation of these deductible temporary differences, which include tax losses (refer note 2 (l)). Useful lives of assets The estimation of the useful lives of assets has been based on historical experience and management judgement. In addition, the condition of assets is assessed annually and considered in the context of remaining useful life, and adjustments to useful life are made where necessary. Depreciation charges are disclosed in note 6(c). Details of useful lives by major asset category are included in note 2(n). Impairment of loans to, and investment in, subsidiaries Where a subsidiary entity incurs a loss, the parent entity assesses the recoverability of any loans due from, or investments in, any subsidiary. Where required, the parent entity will then record an impairment loss against the value of its loans to, or investment in, the subsidiary.
5 SEGMENT INFORMATION
The Group has identified its operating segments based on the internal reports that are reviewed and used by management and the board (the chief decision makers) in assessing performance and in determining the allocation of resources. The operating segments are identified by management based on the activities undertaken. Financial information about each of these operating activities is reported to management on a monthly basis. The group has two separate business segments, being product realisation (trading), where activities comprise manufacturing and sales of confocal imaging products, and research and development, where activities include design and development of new products and technologies, including related income from customers. Unallocated amounts relate mainly to central costs and overheads, and include unallocated revenues and other income.
The accounting policies used by the group in reporting segments internally are the same as those contained in note 2 to the accounts and in the prior period. Major customers There is no significant concentration of customers in the Group’s trading activities. The major customer in research and development is Carl Zeiss, where income is received under the terms of a collaboration agreement.
For
per
sona
l use
onl
y

Optiscan Imaging Limited Annual Report 2012
Page | 45
Notes to the Financial Statements (continued) FOR THE YEAR ENDED 30 JUNE 2012
5 SEGMENT INFORMATION (continued)
Trading R&D Unallocated Total $ $ $ $ Year ended 30 June 2012 Revenue Sales to external customers 381,791 - - 381,791 Inter segment revenue - - - - Total segment revenue 381,791 - - 381,791 Other revenues - - 43,380 43,380 Total consolidated revenue 381,791 - 43,380 425,171 Result Net profit (loss) for year by segment 236,732 (737,293) - (500,561) Unallocated items - - (2,001,889) (2,001,889) Consolidated net profit (loss) 236,732 (737,293) (2,001,889) (2,502,450) Assets and liabilities Segment assets * 232,589 1,319 946,763 1,180,671 Segment liabilities (38,250) (76,538) (752,573) (867,361) Segment net assets 194,339 (75,219) 194,190 313,310 Cash flow Segment net cash flow from operating
activities 390,249 (116,292) (1,067,502) (793,545) Investing cash flows - - (28,776) (28,776) Financing cash flows - - 331,000 331,000 Net cash flow for year 390,249 (116,292) (765,278) (491,321) Other Segment information Non cash expenses Depreciation and amortisation 9,019 1,400 15,693 26,112 Share based payments - - 778,600 778,600 Amortised cost adjustment of convertible notes - - 22,314 22,314 Impairment of inventory 148,330 - - 148,330 Foreign exchange differences - - 8,533 8,533 Revenue by geographic segment (location of customer) Asia 86,015 - - 86,015 Australia 203,833 - 43,380 247,213 Europe 88,373 - - 88,373 USA & Canada 3,570 - - 3,570 Total 381,791 - 43,380 425,171
* Unallocated segment assets include cash balances unrelated to the operating segments F
or p
erso
nal u
se o
nly

Optiscan Imaging Limited Annual Report 2012
Page | 46
Notes to the Financial Statements (continued) FOR THE YEAR ENDED 30 JUNE 2012
5 SEGMENT INFORMATION (continued)
Trading R&D Unallocated Total $ $ $ $ Year ended 30 June 2011 Revenue Sales to external customers 509,036 - - 509,036 Inter segment revenue - - - - Total segment revenue 509,036 - - 509,036 Other revenues - - 41,986 41,986 Total consolidated revenue 509,036 - 41,986 551,022 Result Net profit (loss) for year by segment 164,764 975,231 - 1,139,995 Unallocated items - - (1,125,590) (1,125,590) Consolidated net profit (loss) 164,764 975,231 (1,125,590) 14,405 Assets and liabilities Segment assets * 394,275 638,719 1,166,656 2,199,650 Segment liabilities (76,699) (105,091) (675,286) (856,936) Segment net assets 317,716 533,628 491,370 1,342,714 Cash flow Segment net cash flow from operating
activities 201,347 393,859 (1,063,784) (468,579) Investing cash flows - (3,110) (16,030) (19,140) Financing cash flows - - - - Net cash flow for year 201,347 390,749 (1,047,754) (487,719) Other Segment information Non cash expenses Depreciation and amortisation 25,809 39,592 18,103 83,504 Share based payments - - 26,573 26,573 Amortised cost adjustment of convertible notes - - 12,025 12,025 Impairment of inventory 89,911 - - 89,911 Foreign exchange differences - - (9,539) (9,539) Revenue by geographic segment (location of customer) Asia 87,704 - - 87,704 Australia 278,242 - 36,818 315,060 Europe 123,919 - - 123,919 USA & Canada 19,171 - 5,168 24,339 Total 509,036 - 41,986 551,022
* Unallocated segment assets include cash balances unrelated to the operating segments
For
per
sona
l use
onl
y

Optiscan Imaging Limited Annual Report 2012
Page | 47
Notes to the Financial Statements (continued) FOR THE YEAR ENDED 30 JUNE 2012
6 REVENUES AND EXPENSES
CONSOLIDATED
2012
$ 2011
$ (a) Other revenue Royalty revenue 1,509 5,167 Finance revenue – bank interest received 41,871 36,818
Total Other revenue 43,380 41,985
(b) Other income Design and development income - 1,267,918 Government grants – R&D Tax incentive 456,350 636,000
Total Other income 456,350 1,903,918
(c) Depreciation and amortisation -Depreciation included in cost of sales 9,019 25,809 - Depreciation included in R&D expenses 1,400 39,592 - Depreciation included in administration expenses 15,693 18,103 26,112 83,504 (d) Employee benefits expense Wages and salaries 778,742 788,781 Workers’ compensation costs 7,930 1,664 Defined contribution plan expense 69,939 68,106 Annual leave expense 11,125 26,221 Long service leave expense 12,435 2,912 Share-based payments expense - employees 41,280 51,573 921,451 939,257 (e) Cost of inventories recognised as an expense Consumed in production – cost of goods sold 71,550 85,094 Consumed in R&D - 77,749 Write down inventory to net realisable value 148,330 89,911 219,880 252,754 (f) Finance costs Interest on convertible notes 37,706 44,606 Amortised cost adjustment of convertible notes 22,314 12,025 (g) Share based payment expense Share-based payments expense - employees 41,280 51,573 Share-based payments expense – non-employees – funding facility costs 23,619 - – options issued 452,098 - 516,997 51,573
For
per
sona
l use
onl
y

Optiscan Imaging Limited Annual Report 2012
Page | 48
Notes to the Financial Statements (continued) FOR THE YEAR ENDED 30 JUNE 2012
7 INCOME TAX
CONSOLIDATED
2012
$ 2011
$
The components of income tax expense are:
Income Statement
Current income tax Current income tax charge - - Adjustments in respect of current income tax of previous
year: - - Withholding tax deducted from royalty revenue - - Deferred income tax Relating to origination and reversal of temporary
differences - - Income tax (expense) benefit reported in the income
statement - -
Tax Losses The Group has unconfirmed, unrecouped tax losses in Australia of $40,086,601 (2011: $39,329,282) which have not been brought to account. The ability to be able to recognise a deferred tax asset in respect of these tax losses will be dependent upon the probability that future taxable profit will be available against which the unused tax losses can be utilised and the conditions for deductibility imposed by Australian tax authorities will be complied with. Withholding tax A total of $52,288, (2011, $338,020) has been deducted from remittances of royalties to the group in accordance with the withholding tax obligations of the payers. These deductions represent foreign tax credits which may be available to reduce Australian income tax payable in future years. The ability to be able to recognise a deferred tax asset in respect of these tax losses will be dependent upon the extent it is probable that future taxable profit will be available against which the unused tax losses can be utilised and the conditions for deductibility imposed by Australian tax authorities will be complied with. Tax Consolidation Optiscan Imaging Limited and its 100% owned Australian resident subsidiary have elected not to form a tax consolidated group.
For
per
sona
l use
onl
y

Optiscan Imaging Limited Annual Report 2012
Page | 49
Notes to the Financial Statements (continued) FOR THE YEAR ENDED 30 JUNE 2012
7 INCOME TAX (continued) CONSOLIDATED
2012
$ 2011
$ A reconciliation between tax expense and the product
of accounting loss before income tax multiplied by the Group’s applicable income tax rate is as follows:
Accounting profit (loss) before income tax (2,502,450) 14,405 Prima facie income tax (benefit) at the Parent entity’s
statutory income tax rate of 30% (2011: 30%) (750,735) 4,322 Adjustments in respect of current income tax of
previous years - (536) Non assessable gains (136,905) (200,645) Share based payments not deductible 155,100 15,472 R&D Tax Concession deductions foregone for tax
offset 402,888 376,478 Expenditure not allowable for income tax purposes 55,290 3,695 Deferred tax assets (recognised) / not recognised 265,509 (198,786)
Income tax expense - -
Statement of financial position
Statement of comprehensive income
2012 $
2011 $
2012 $
2011 $
Deferred income tax - not brought to account Deferred income tax at 30 June relates to the
following items and has not been brought to account (Refer note 2(l):
CONSOLIDATED
Deferred tax assets Undeducted patent costs 175,514 166,763 8,752 27,745 Employee benefit & warranty provisions 56,331 56,844 (513) (4,950) Expenses not yet deductible 9.888 21,416 (11,528) (10,701) Inventory impairment provision 424,683 380,184 44,499 40,349 Deferred deductible equity issue costs 8,238 11,136 (2,898) (8,216) Tax Losses available 12,025,980 11,798,785 227,195 (243,013) Foreign tax credits 52,288 338,020 - - Gross deferred income tax assets 12,752,922 12,773,148 Less amounts not recognised in accounts (12,752,922) (12,773,148) Gross deferred income tax assets - - Deferred tax income/ (expense) incurred 265,507 (198,786) Less deferred income tax not recognised in accounts (265,507) (198,736) Deferred tax income/ (expense) - -
For
per
sona
l use
onl
y

Optiscan Imaging Limited Annual Report 2012
Page | 50
Notes to the Financial Statements (continued) FOR THE YEAR ENDED 30 JUNE 2012
8 EARNINGS (LOSS) PER SHARE
The following reflects the income and share data used in the basic and diluted earnings (loss) per share computations:
CONSOLIDATED 2012 2011 $ $ Net profit (loss) (2,502,450) 14,405
2012 2011 Number Number Weighted average number of ordinary shares for basic earnings per share 132,121,706 129,711,705 Effects of dilution: Share options - - Weighted average number of ordinary shares adjusted for the effect of dilution 132,121,706 129,711,705 Weighted average number of converted, lapsed or cancelled potential ordinary shares included in diluted earnings per share - - Options on issue have been determined to be not dilutive, as the exercise prices exceed current market price, making the prospect of exercise highly unlikely. There have been no other transactions involving ordinary shares or potential ordinary shares between the reporting date and the date of completion of these financial statements, other than:
• the issue of shares upon conversion of convertible notes with a face value of $100,000 (refer note 15).
• A placement of 13,333,333 shares on 31 August 2012 to raise $1 million for working capital
For
per
sona
l use
onl
y

Optiscan Imaging Limited Annual Report 2012
Page | 51
Notes to the Financial Statements (continued) FOR THE YEAR ENDED 30 JUNE 2012
9 CASH AND CASH EQUIVALENTS
Cash at bank earns interest at floating rates based on daily bank deposit rates. Short-term deposits are made for varying periods of between one day and six months, depending on the immediate cash requirements of the Group, and earn interest at the respective short-term deposit rates. At balance date the bank balance interest rate is 3.25% (2011: 2.89%), and the balances are at call. The fair value of cash at bank approximates the carrying amount. Reconciliation to Statement of Cash Flows For the purposes of the Statement of Cash Flows, cash and cash equivalents comprise the following at 30 June:
CONSOLIDATED
2012
$ 2011
$ Cash at bank and in hand 578,900 878,069 Short-term deposits - 200,625 578,900 1,078,694
Reconciliation of net profit (loss) after tax to net cash flows from operations
Net profit (loss) (2,502,450) 14,405
Adjustments for: Depreciation and amortisation 26,112 83,504 Amortised cost adjustment of convertible notes 22,314 12,025 Impairment of assets 148,330 89,911 Net exchange differences 8,473 (11,015) Shares based payments expensed 778,600 26,573 Exchange differences recognised in equity 60 1,474 Changes in assets and liabilities (Increase)/decrease in trade and other receivables 739,503 (705,827) (Increase)/decrease in inventories (104,305) 80,064 (Increase)/decrease in prepayments (194,680) (12,466) (Decrease)/increase in trade and other payables 103,853 1,111 (Decrease)/increase in deferred revenue 182,352 (31,839) (Decrease)/increase in provisions (1,707) (16,500) Net cash used in operating activities (793,545) (468,579)
Disclosure of financing facilities - Refer to note 16.
For
per
sona
l use
onl
y

Optiscan Imaging Limited Annual Report 2012
Page | 52
Notes to the Financial Statements (continued) FOR THE YEAR ENDED 30 JUNE 2012
10 TRADE AND OTHER RECEIVABLES
CONSOLIDATED
2012
$ 2011
$ CURRENT Trade receivables 77,635 186,276 GST refund receivable 15,492 3,073 Interest receivable 514 1,162 R&D Tax incentive grant receivable - 636,000 Cash on term deposit 67,000 - Other receivables 2,046 8,680 Net carrying amount 162,687 835,191
At balance date the term deposit interest rate is 4.0%, and the weighted average term to maturity is 84 days. The fair value of cash deposit approximates the carrying amount, in view of the short term to maturity. Term deposits amounting to $67,000 are subject to a charge which secure banking facilities made available to the group (refer note 16).
Ageing Analysis of Receivables
Total 0-30 Days
31-60 Days
61-90 Days PDNI*
90+ Days PDNI*
Consolidated – 2012 162,687 87,448 3,526
67,514
4,199
Consolidated – 2011 835,191 825,511 260
-
9,420
* Past due not impaired (“PDNI”)
(i) All receivables shown as past due are the subject of follow up action by the company. (ii) Trade receivables are non-interest bearing and are generally on 30-60 day terms. An allowance for doubtful debts will be made if there is objective evidence that a trade receivable is impaired. No such allowance has yet been made. Receivables other than cash on term deposit are also non-interest bearing. (iii) The fair value of receivables approximates the carrying amount, in view of the short term nature of the trading terms. (iv) The maximum exposure to credit risk is the fair value of receivables. Collateral is not held as security, nor is it the Group’s policy to transfer or on sell receivables to special purpose vehicles.
(v) Details regarding foreign exchange risk exposure of current receivables are disclosed in note 3.
For
per
sona
l use
onl
y

Optiscan Imaging Limited Annual Report 2012
Page | 53
Notes to the Financial Statements (continued) FOR THE YEAR ENDED 30 JUNE 2012
11 INVENTORIES
CONSOLIDATED
2012
$ 2011
$ Raw materials (at net realisable value) - 17,402 Work in progress (at net realisable value) 87,430 90,798 Finished goods (at cost) 65,645 88,900 Total inventories at the lower of cost and net realisable value 153,075 197,100 Write down to net realisable value (refer note 6) 148,330 89,911
12 PREPAYMENTS
Current Finance facility costs 135,201 - Other prepaid expenses 8,190 50,112 143,391 - Non-current Finance facility costs 101,401 -
Total prepayments
244,792 50,112
13 PLANT AND EQUIPMENT
YEAR ENDED 30 JUNE 2012
Office Furniture & Equipment
2012 $
Production Equipment
2012 $
R&D Equipment
2012 $
Total Plant & Equipment
2012 $
Opening balance, net of accumulated depreciation and impairment 24,935 10,899 2,719 38,553 Additions 28,776 - - 28,776 Disposals - - - - Depreciation charge for the year (15,693) (9,019) (1,400) (26,112) At 30 June 2012, net of accumulated depreciation and impairment 38,018 1,880 1,319 41,217 At 1 July 2012 Cost 654,352 258,483 364,905 1,277,740 Accumulated depreciation and impairment (616,334) (256,603) (363,586) (1,236,523) Net carrying amount 38,018 1,880 1,319 41,217 At 1 July 2011 Cost 548,693 258,483 413,461 1,220,637 Accumulated depreciation and impairment (523,758) (247,584) (410,742) (1,181,814) Net carrying amount 24,935 10,899 2,719 38,553
For
per
sona
l use
onl
y

Optiscan Imaging Limited Annual Report 2012
Page | 54
Notes to the Financial Statements (continued) FOR THE YEAR ENDED 30 JUNE 2012
13 PLANT AND EQUIPMENT (continued)
YEAR ENDED 30 JUNE 2011
Office Furniture & Equipment
2011 $
Production Equipment
2011 $
R&D Equipment
2011 $
Total Plant & Equipment
2011 $
Opening balance, net of accumulated depreciation and impairment 27,008 36,708 39,201 102,917 Additions 16,030 - 3,110 19,140 Disposals - - - - Depreciation charge for the year (18,103) (25,809) (39,592) (83,504)
At 30 June 2011, net of accumulated depreciation and impairment 24,935 10,899 2,719 38,553 At 1 July 2010 Cost 532,663 258,483 410,351 1,201,497 Accumulated depreciation and impairment (505,655) (221,775) (371,150) (1,098,580) Net carrying amount 27,008 36,708 39,201 102,917 At 30 June 2011 Cost 548,693 258,483 413,461 1,220,637 Accumulated depreciation and impairment (523,758) (247,584) (410,742) (1,181,814) Net carrying amount 24,935 10,899 2,719 38,553
14 TRADE AND OTHER PAYABLES
CONSOLIDATED
2012
$ 2011
$ Current Trade payables (i) 117,056 43,146 Accrued expenses 149,434 119,493 Deferred revenue 202,685 17,758 469,175 180,397
Non current Deferred revenue - 2,575
(i) Trade payables are non-interest bearing and are normally settled on 30-day terms. The fair value of trade
payables approximates the carrying amount due to the short term nature of the trading terms.
For
per
sona
l use
onl
y

Optiscan Imaging Limited Annual Report 2012
Page | 55
Notes to the Financial Statements (continued) FOR THE YEAR ENDED 30 JUNE 2012
15 INTEREST BEARING LOANS AND BORROWINGS
CONSOLIDATED
2012
$ 2011
$ Current Convertible notes 210,414 484,485 Movement in convertible note liabilities Notes issued May 2009 Opening balance 484,485 472,460 Amortised cost adjustment of convertible notes 15,515 12,025 Convertible notes converted to equity by noteholders (500,000) -
Closing balance -
484,485 Notes issued 2012 Opening balance - - New convertible notes issued at face value 470,000 - Transaction costs (72,000) - Equity component of new convertible notes (65,088) - Amortised cost adjustment of convertible notes 6,800 - Convertible notes converted to equity by noteholders (129,298) - Closing balance 210,414 -
(a) Fair value The carrying amount approximates the fair value of the convertible notes.(Refer Note 2(r)).
(b) Interest rate
Details regarding interest rate and liquidity risk are detailed in Note 3.
(c) Assets pledged as security The amounts payable under the convertible notes deed are secured by a charge over the assets of Optiscan Pty Ltd.
(d) Terms and conditions of convertible notes
At balance date, the parent entity has on issue two convertible notes with a total face value of $300,000. The book value after allocation of the equity component and adjustment to amortised cost amounts to $210,414. The notes have a 2 year term and are convertible at the option of the holder, at 90% of the five consecutive daily volume-weighted average share price of the Group’s shares. No interest is payable on the notes on issue. Since balance date, the holder has converted notes with a face value of $100,000.
(e) Potential Dilution In the event that the notes are converted to ordinary shares, and in a circumstance where the Group generates a net profit, there will be potential dilution of earnings per share from the increased number of shares on issue as a consequence of the conversion of notes.
For
per
sona
l use
onl
y

Optiscan Imaging Limited Annual Report 2012
Page | 56
Notes to the Financial Statements (continued) FOR THE YEAR ENDED 30 JUNE 2012
16 FINANCING FACILITIES
CONSOLIDATED
2012
$ 2011
$ Bank Facilities - credit cards 20,000 20,000 - bank guarantees and indemnities 45,500 91,500 - electronic transaction facility - 50,000 65,500 161,500 Facilities used at reporting date: - credit cards 4,984 8,987 - bank guarantees and indemnities 45,500 45,500 - electronic transaction facility - 50,000 50,484 104,487 Facilities unused at reporting date: - credit cards 15,016 11,013 - bank guarantees and indemnities - 46,000 15,016 57,013 Total bank facilities 65,500 161,500 Facilities used at reporting date 50,484 104,487 Facilities unused at reporting date 15,016 57,013 Assets pledged as security The bank facilities are secured by charges over specific term deposits 67,000 181,500
Convertible Note Funding Facility^ Total facility 2,000,000 - Facilities used at reporting date 470,000 - Facilities unused at reporting date* 1,530,000 - *Drawings under the facility are interest free but subject to a discount on activation, so the future net funding available will be reduced by the amount of the discount determined at the time of drawdown. ^After balance date, and completion of a placement, this facility was terminated by mutual agreement between the parties. Assets pledged as security The convertible note funding facility is secured by a floating charge over the unsecured assets of the Group.
For
per
sona
l use
onl
y

Optiscan Imaging Limited Annual Report 2012
Page | 57
Notes to the Financial Statements (continued) FOR THE YEAR ENDED 30 JUNE 2012
17 PROVISIONS
Annual Leave Provision The annual leave provision is for the unused entitlements to annual leave for employees. Staff are encouraged to take leave when due or entitled, but workflow considerations sometimes prevent all entitlements being utilised. Long Service Leave Long service leave provision provides for the future entitlements of employees to long service leave or, where sanctioned by legislation, entitlement to pro rata payment upon termination. Some employees have reached entitlement to pro rata payment upon termination. No employees have yet reached entitlement to long service leave. Warranty A provision for warranty at the rate of 3% of sales has been provided and the incidence of warranty claims is monitored on an ongoing basis to assess adequacy of the provision.
Annual Leave
$
Long Service Leave
$ Warranty
$ Total
$
At 30 June 2011 76,200 92,804 20,475 189,479 Arising during the year 11,125 12,435 11,302 34,862 Utilised (8,257) (15,459) (12,853) (36,569) At 30 June 2012 79,068 89,780 18,924 187,772 Current 2012 79,068 76,209 18,924 174,201 Non-current 2012 - 13,571 - 13,571 79,068 89,780 18,924 187,772 Current 2011 76,200 83,283 20,475 179,958 Non-current 2011 - 9,521 - 9,521 76,200 92,804 20,475 189,479
For
per
sona
l use
onl
y
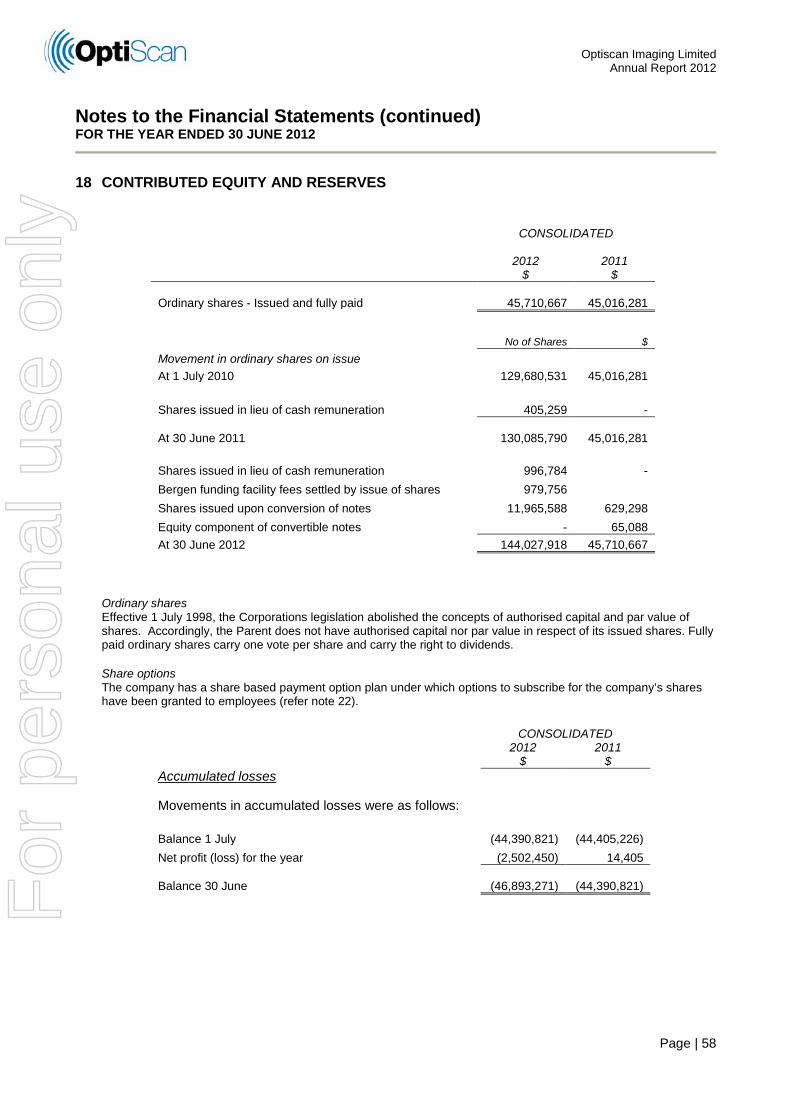
Optiscan Imaging Limited Annual Report 2012
Page | 58
Notes to the Financial Statements (continued) FOR THE YEAR ENDED 30 JUNE 2012
18 CONTRIBUTED EQUITY AND RESERVES
CONSOLIDATED
2012
$ 2011
$ Ordinary shares - Issued and fully paid 45,710,667 45,016,281
No of Shares $ Movement in ordinary shares on issue At 1 July 2010 129,680,531 45,016,281 Shares issued in lieu of cash remuneration 405,259 - At 30 June 2011 130,085,790
45,016,281
Shares issued in lieu of cash remuneration 996,784 - Bergen funding facility fees settled by issue of shares 979,756 Shares issued upon conversion of notes 11,965,588 629,298 Equity component of convertible notes - 65,088 At 30 June 2012 144,027,918 45,710,667
Ordinary shares Effective 1 July 1998, the Corporations legislation abolished the concepts of authorised capital and par value of shares. Accordingly, the Parent does not have authorised capital nor par value in respect of its issued shares. Fully paid ordinary shares carry one vote per share and carry the right to dividends. Share options The company has a share based payment option plan under which options to subscribe for the company’s shares have been granted to employees (refer note 22).
CONSOLIDATED
2012
$ 2011
$ Accumulated losses Movements in accumulated losses were as follows: Balance 1 July (44,390,821) (44,405,226) Net profit (loss) for the year (2,502,450) 14,405 Balance 30 June (46,893,271) (44,390,821)
For
per
sona
l use
onl
y

Optiscan Imaging Limited Annual Report 2012
Page | 59
Notes to the Financial Statements (continued) FOR THE YEAR ENDED 30 JUNE 2012
18 CONTRIBUTED EQUITY AND RESERVES (continued)
CONSOLIDATED
2012
$ 2011
$ Reserves Movements in reserves were as follows: Share Based Payments Reserve Balance 1 July 707,061 680,488 Share based payments: Employee benefits in lieu of cash remuneration 65,620 26,573 Options issued in consideration for mandatory conversion of convertible notes 433,100 - Share and options issued in respect of Bergen funding facility 279,219 - Employee share option plan 661 - Balance 30 June 1,485,661 707,061 Foreign Currency Translation Reserve Balance 1 July 10,193 8,719 Foreign currency translation difference 60 1,474 Balance 30 June 10,253 10,193 Total reserves 1,495,914 717,254
Nature and purpose of reserves Share based payments reserve This reserve is used to record the value of equity benefits provided to employees and other parties in consideration for services rendered. Refer to note 22 for further details of the employee share option plan and other share based payments. Foreign currency translation reserve This reserve is used for foreign currency translation differences arising on the consolidation of the USA subsidiary, Optiscan Inc.
For
per
sona
l use
onl
y
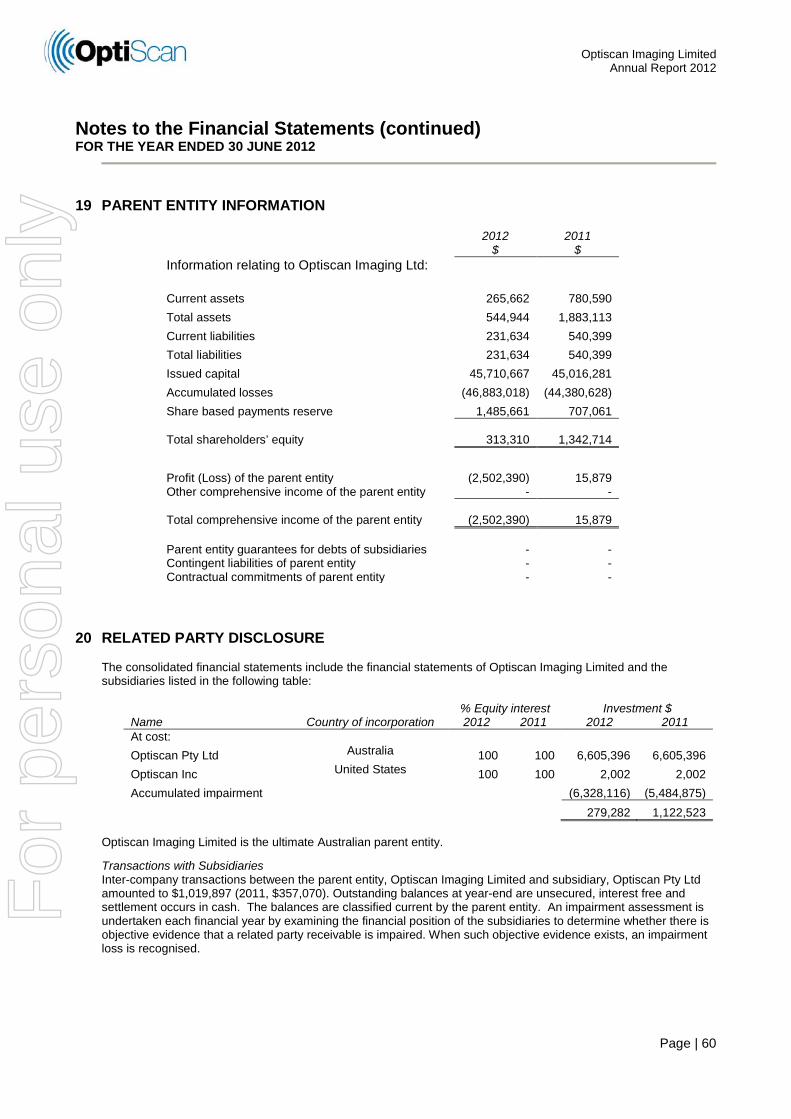
Optiscan Imaging Limited Annual Report 2012
Page | 60
Notes to the Financial Statements (continued) FOR THE YEAR ENDED 30 JUNE 2012
19 PARENT ENTITY INFORMATION
2012
$ 2011
$ Information relating to Optiscan Imaging Ltd: Current assets 265,662 780,590 Total assets 544,944 1,883,113 Current liabilities 231,634 540,399 Total liabilities 231,634 540,399 Issued capital 45,710,667 45,016,281 Accumulated losses (46,883,018) (44,380,628) Share based payments reserve 1,485,661 707,061 Total shareholders’ equity 313,310 1,342,714
Profit (Loss) of the parent entity (2,502,390) 15,879 Other comprehensive income of the parent entity - - Total comprehensive income of the parent entity (2,502,390) 15,879 Parent entity guarantees for debts of subsidiaries - - Contingent liabilities of parent entity - - Contractual commitments of parent entity - -
20 RELATED PARTY DISCLOSURE The consolidated financial statements include the financial statements of Optiscan Imaging Limited and the subsidiaries listed in the following table:
% Equity interest Investment $ Name Country of incorporation 2012 2011 2012 2011 At cost: Optiscan Pty Ltd Australia 100 100 6,605,396 6,605,396 Optiscan Inc United States 100 100 2,002 2,002 Accumulated impairment (6,328,116) (5,484,875) 279,282 1,122,523
Optiscan Imaging Limited is the ultimate Australian parent entity.
Transactions with Subsidiaries Inter-company transactions between the parent entity, Optiscan Imaging Limited and subsidiary, Optiscan Pty Ltd amounted to $1,019,897 (2011, $357,070). Outstanding balances at year-end are unsecured, interest free and settlement occurs in cash. The balances are classified current by the parent entity. An impairment assessment is undertaken each financial year by examining the financial position of the subsidiaries to determine whether there is objective evidence that a related party receivable is impaired. When such objective evidence exists, an impairment loss is recognised.
For
per
sona
l use
onl
y

Optiscan Imaging Limited Annual Report 2012
Page | 61
Notes to the Financial Statements (continued) FOR THE YEAR ENDED 30 JUNE 2012
21 KEY MANAGEMENT PERSONNEL Details of Key Management Personnel (i) Board of Directors Executive Directors A. Holt Chairman (Appointed to board 12 February 2009, Executive Chairman 14 May 2009) P. Delaney Director of Technology B. Andrew Chief Financial Officer (Appointed to board 20 January 2010) There were no changes of key management personnel after reporting date and the date the financial report was authorised for issue.
Compensation of Key Management Personnel
Table 1: Compensation of Key Management Personnel for the year ended 30 June 2012
CONSOLIDATED
2012
$ 2011
$ Short term employee benefits 282,250 263,250 Post Employment benefits 16,088 16,088 Office and travel expenses reimbursed 65,755 - Other long term benefits 660 - Share-based payment 40,619 50,000 405,372 329,338
There were no other transactions and balances with Key Management Personnel
For
per
sona
l use
onl
y

Optiscan Imaging Limited Annual Report 2012
Page | 62
Notes to the Financial Statements (continued) FOR THE YEAR ENDED 30 JUNE 2012
21 KEY MANAGEMENT PERSONNEL (continued)
Option holdings of Key Management Personnel Options holdings of Key Management Personnel for the year ended 30 June 2012
Vested at 30 June 2012
30 June 2012
Balance at
beginning of period 01-Jul-11
Held at date of
appointment Options
Exercised
Options Expired Forfeited
Balance at end of period
30-Jun-12 Total
Vested Exercisable Not
Exercisable Directors A. Holt - - - - - - - -
P. Delaney - - - - - - - -
B. Andrew - - - - - - - - Total - - - - - - -
-
No options were issued to, or exercised by key management personnel during the year ended 30 June 2012. Options holdings of Key Management Personnel for the year ended 30 June 2011
Vested at 30 June 2011
30 June 2011
Balance at
beginning of period 01-Jul-10
Granted as Remuneration
Options Exercised
Options Expired Forfeited
Balance at end of period
30-Jun-11 Total
Vested Exercisable Not
Exercisable Directors A. Holt - - - - - - - -
P. Delaney 450,000 - - 450,000 - - - -
B. Andrew - - - - - - - - Total 450,000 - - 450,000 - - -
-
No options were issued to, or exercised by key management personnel during the year ended 30 June 2011.
For
per
sona
l use
onl
y

Optiscan Imaging Limited Annual Report 2012
Page | 63
Notes to the Financial Statements (continued) FOR THE YEAR ENDED 30 JUNE 2012
21 KEY MANAGEMENT PERSONNEL (continued)
Shareholdings of Key Management Personnel Shares held in Optiscan Imaging Limited for the year ended 30 June 2012 (number)
30 June 2012
Balance at beginning of period
01-Jul-11 Purchased In lieu of cash remuneration
Holding at Date of Appointment / Resignation
Balance at end of period
30-Jun-12 Directors A. Holt -direct 2,176,875 - 996,784 - 3,173,659 -indirect 6,247,375 - - - 6,247,375 P. Delaney -direct 3,231,259 - - - 3,231,259 -indirect 270,090 - - - 270,090 B. Andrew -indirect 90,000 - - - 90,000 Total
12,015,599
-
996,784
-
13,012,383
Shares held in Optiscan Imaging Limited for the year ended 30 June 2011 (number)
30 June 2011
Balance at beginning of
period 01-Jul-10 Purchased In lieu of cash remuneration
Holding at Date of Appointment / Resignation
Balance at end of period
30-Jun-11
Directors A. Holt -direct 1,431,816 339,800 405,259 - 2,176,875 -indirect 6,247,375 - - - 6,247,375 P. Delaney -direct 3,231,259 - - - 3,231,259 -indirect 270,090 - - - 270,090 B. Andrew -indirect 90,000 - - - 90,000 Total
11,270,540
339,800
405,259
-
12,015,599
All equity transactions with Key Management Personnel other than those arising from the exercise of remuneration options have been entered into under terms and conditions no more favourable than those the Group would have adopted if dealing at arm’s length.
For
per
sona
l use
onl
y

Optiscan Imaging Limited Annual Report 2012
Page | 64
Notes to the Financial Statements (continued) FOR THE YEAR ENDED 30 JUNE 2012
22 SHARE-BASED PAYMENT PLANS
Types of share based payments (i) Employee Share Option Plan
Share options are granted to all employees including senior executives with more than 12 months service at the discretion of the board. The exercise price of the options is calculated as the weighted average market price of the shares in the two weeks prior to the date of grant, increased by a minimum of 10%. Options vest in gradual amounts over two to four years and no options can be exercised within two years of the date of grant. The contractual life of each option granted is five years. There are no cash settlement alternatives. The expense recognised in profit or loss in relation to share-based payments is disclosed in note 6(d). There have been no issues of options to employees under the plan since January 2008.
The following table illustrates the number (No.) and weighted average exercise prices (WAEP) of, and movements in, share options on issued under the Employee Share option Plan:
Employee Share Option Plan No. Options WAEP No. Options WAEP 2012 2012 2011 2011 Outstanding at the beginning of the year 361,200 0.44 877,075 0.36 Granted during the year - - - - Forfeited during the year - - (149,000) 0.37 Exercised during the year - - - - Expired during the year (211,200) 0.50 (366,875) 0.32 Outstanding at the end of the year 150,000 0.31 361,200 0.42
Exercisable at the end of the year 150,000 0.31 311,200 0.44
The outstanding balance as at 30 June 2012 is represented by:
Options expiring in the year : No Options WAEP $ - 2012/2013 150,000 0.31
The weighted average remaining contractual life for the share options outstanding as at 30 June 2012 is 6 months. No options were granted during the year. The fair value of the equity-settled share options granted under the option plan is estimated as at the date of grant using a Black Scholes valuation model taking into account the terms and conditions upon which the options were granted. The expected life of the options is based on historical data and is not necessarily indicative of exercise patterns that may occur. The expected volatility reflects the assumption that the historical volatility is indicative of future trends, which may also not necessarily be the actual outcome. No other features of options granted were incorporated into the measurement of fair value.
For
per
sona
l use
onl
y

Optiscan Imaging Limited Annual Report 2012
Page | 65
Notes to the Financial Statements (continued) FOR THE YEAR ENDED 30 JUNE 2012
22 SHARE BASED PAYMENT PLANS (continued)
(ii) Issue of shares and options to parties other than employees
Issue of options in consideration for mandatory conversion of convertible notes (Tranche 1) In May 2009, the Company issued 10,000,000 convertible notes at a price of $0.05 each, expiring on 12 May 2012. In February 2012, the noteholders’ agreed to the mandatory conversion of the notes upon maturity. In consideration for this agreement, the company issued 5,000,000 options exercisable at $0.10 each and expiring on 31 March 2014. Issue of shares and options in relation to Convertible Note Facility (Tranche 2) In March 2012, the Company announced the establishment of a $2 million funding agreement with Bergen Global Opportunity Fund, LP. The agreement included the issue of 1,900,000 options at an exercise price of 120% of the volume weighted average share price of Optiscan’s shares for the 20 day period prior to the date of the agreement. The options have a term of 30 months. The agreement also provided for the payment of fees and costs associated with the facility by share based payment, resulting in the allotment of 979,756 shares as disclosed in Note 17. Details of options issues to parties other than employees during 2011/2012 The following table illustrates the number and weighted average exercise prices (WAEP) of, and movements in, share options issued to parties other than employees during the year:
Options issued to parties other than employees No. Options WAEP No. Options WAEP 2012 2012 2011 2011 Outstanding at the beginning of the year - - - Granted during the year 6,900,000 0.118 - - Exercised during the year - - - - Outstanding at the end of the year 6,900,000 0.118 - -
Exercisable at the end of the year 6,900,000 0.118 - -
The fair value of the equity-settled share options during the year is estimated as at the date of grant using a Black Scholes valuation model taking into account the terms and conditions upon which the options were granted. The following tables list the inputs to the model used for option issues during the year ended 30 June 2012:
Tranche 1 Tranche 2 Number of options
5,000,000
1,900,000
Dividend yield (%) - - Expected volatility (%) 110.00 110.00 Risk-free interest rate (%) 3.25 3.25 Expected life of option (years) 2.0 2.5 Option exercise price ($) 0.10 0.166 Share price at grant date ($) 0.135 0.135
The expected life of the options is based on historical data and is not necessarily indicative of exercise patterns that may occur. The expected volatility reflects the assumption that the historical volatility is indicative of future trends, which may also not necessarily be the actual outcome. No other features of options granted were incorporated into the measurement of fair value.
For
per
sona
l use
onl
y

Optiscan Imaging Limited Annual Report 2012
Page | 66
Notes to the Financial Statements (continued) FOR THE YEAR ENDED 30 JUNE 2012
22 SHARE BASED PAYMENT PLANS (continued)
(ii) Issue of shares and options to parties other than employees (continued)
The weighted average term to maturity for share options issued to other parties outstanding at 30 June 2012 is 22.6 months. The outstanding balance as at 30 June 2012 is represented by:
Options expiring in the year : No Options WAEP $ - 2013/2014 5,000,000 0.10 - 2014/2015 1,900,000 0.166
6,900,000 0.118 (iii) Issue of shares in lieu of cash remuneration
In October 2010, following application by the parent entity, ASX issued a waiver from listing rules 10.13.3 and 10.13.5 to enable Executive Chairman, Angus Holt to be remunerated by issue of shares in lieu of cash that would otherwise be payable in respect of calendar year 2011. At the Annual General Meeting of shareholders in November 2010, approval was granted to implement this arrangement. In accordance with the terms of the ASX waiver, the number of shares issued in respect of any quarter in 2011 is calculated by dividing the amount owed to the Chairman in respect of director’s fees by the volume weighted average trading price of the Company’s shares on ASX in the 3 month period preceding the end of each quarter. In April 2011, an allotment of 405,259 shares representing 0.31% of issued capital was made in respect of the March quarter 2011. During 2012, 996,784 shares were allotted in respect of the June, September and December quarters. The arrangement concluded at December 2011.
23 DERIVATIVES AND HEDGING
Economic hedging activities At 30 June 2012 and 30 June 2011, there were no currency option contracts or forward exchange contracts in existence.
24 COMMITMENTS AND CONTINGENCIES Operating lease commitments – Group as lessee The previous property lease over the premises occupied by the Group expired in September 2007. The Group currently occupies the premises on a monthly tenancy. There are no future minimum rentals payable under non-cancellable operating leases as at 30 June 2012.
Capital commitments
At 30 June 2012 there were no material capital commitments outstanding (2011: Nil). Contingent Liabilities The group has contingent liabilities in relation to bank guarantees on issue at balance date amounting to $45,500 (2011: $45,500).
For
per
sona
l use
onl
y
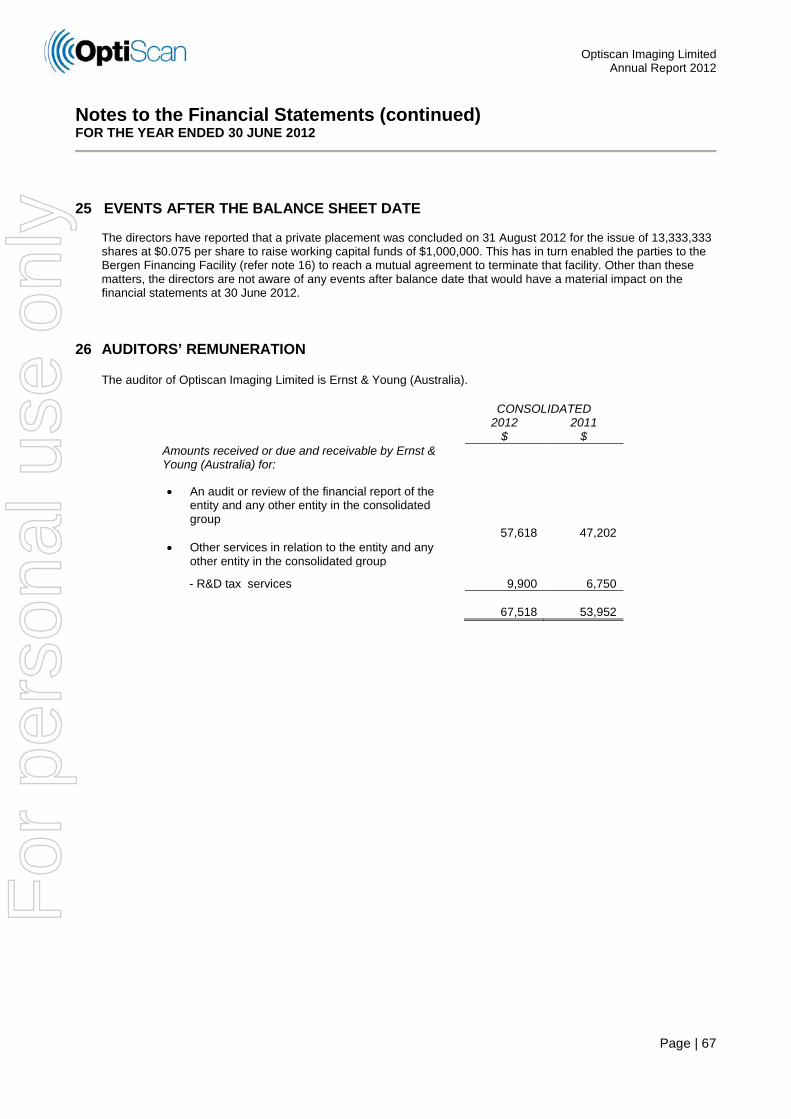
Optiscan Imaging Limited Annual Report 2012
Page | 67
Notes to the Financial Statements (continued) FOR THE YEAR ENDED 30 JUNE 2012
25 EVENTS AFTER THE BALANCE SHEET DATE
The directors have reported that a private placement was concluded on 31 August 2012 for the issue of 13,333,333 shares at $0.075 per share to raise working capital funds of $1,000,000. This has in turn enabled the parties to the Bergen Financing Facility (refer note 16) to reach a mutual agreement to terminate that facility. Other than these matters, the directors are not aware of any events after balance date that would have a material impact on the financial statements at 30 June 2012.
26 AUDITORS’ REMUNERATION The auditor of Optiscan Imaging Limited is Ernst & Young (Australia).
CONSOLIDATED
2012
$ 2011
$ Amounts received or due and receivable by Ernst & Young (Australia) for: • An audit or review of the financial report of the
entity and any other entity in the consolidated group
57,618 47,202 • Other services in relation to the entity and any
other entity in the consolidated group
- R&D tax services 9,900 6,750 67,518 53,952
For
per
sona
l use
onl
y

Optiscan Imaging Limited Annual Report 2012
Page | 68
Directors’ Declaration
In accordance with a resolution of the directors of Optiscan Imaging Limited, I state that: 1 In the opinion of the directors:
(a) the financial report, and remuneration report included in the directors’ report of the company and of the group are in accordance with the Corporations Act 2001, including:
i giving a true and fair view of the company's and group's financial position as at 30 June 2012 and of their
performance for the year ended on that date; and ii complying with Australian Accounting Standards and Corporations Regulations 2001 and International
Financial Reporting Standards (IFRS) as disclosed in note 2(a) of the financial statements; and
(b) there are reasonable grounds to believe that the company will be able to pay its debts as and when they become due and payable.
2 This declaration has been made after receiving the declarations required to be made to the directors in
accordance with sections 295A of the Corporations Act 2001 for the financial year ended 30 June 2012. On behalf of the Board
BRUCE ANDREW Director Melbourne, 31 August 2012
For
per
sona
l use
onl
y

For
per
sona
l use
onl
y

For
per
sona
l use
onl
y

Optiscan Imaging Limited Annual Report 2012
Page | 71
Patent Information
Summary of Key Optiscan Patents
Patent Title Countries Applied Countries Granted
Expiry Date
Scanning Microscope with Miniature Head
Germany 19882512.9
UK 2340332 USA 6967772
15 Jul 2018 16 Jul 2018
Compact Confocal Endoscope and Endomicroscope
Germany 19940421.6 USA 11/142449
UK 2341943 25 Aug 2019
Electrically Operated Tuning Fork
Australia 759742 USA 7010978 France 1192497 UK 1192497 Italy 1192497 Germany 60040223.1 Japan 4171597
8 Jun 2020
Z Sharpening for Fibre Confocal Microscope
UK 2363025 USA 6567585
3 Apr 2021
Objective Lens Unit – For Endoscope
USA 7695431
Scanning Method & Apparatus Germany 10393608.4 Japan P2004-547279
UK 2411071 USA 7123790 Japan 4718184
29 Oct 2023
Light Scanning Device * Germany 103924426 USA 7248390 10 Jun 2023 Condensing Optical System, Confocal Optical System and Scanning Type Confocal System *
USA 2005/0052753 Japan 4475912 17 Oct 2023
Laser Scanning Confocal Microscope with Fibre Bundle Return
USA 7330305 15 Jan 2024
Method & Apparatus for Providing Depth Control for Z Actuation *
Germany 102004018110.1 Japan P2004-118579
USA 7294102 13 Apr 2024
Tuning Fork-Type Scanning Apparatus with a Counterweight
Germany 11200500322.2 USA 7532375 23 Sep 2025
Optical Fibre Scanning Apparatus Japan 2007-238297 Hong Kong 11108509.4
USA 7920312 17 Nov 2028
Fibre Bundle Confocal Endomicroscope
USA 11/795421 Germany 06704775.3
20 Jan 2026
Optical Connector * Germany 102004024396.4
USA 7401984 Japan 4603816
23 Mar 2026 14 May 2024
Objective Lens Unit * Japan 4320184 Germany 05804562.6
USA 7695431 13 April 2024
Confocal Optical Systems * Japan P2003-314204 Japan P2003-357896 Germany 102004043049.7
USA 7338439 11 Feb 2030
Actuation Control Switch * Japan P2005-182150 USA 60/462324
Endoscope USA 11/753506 Germany 05804562.6 Japan 2007-541585
Endoscope * Japan 2007-541585 USA 11/753506 Germany 102004006541.1
24 Nov 2025
Scanning Apparatus PCT/AU20050/01466 * Indicates patents that have been filed in the joint names of Optiscan Pty Ltd and Pentax Corporation. Patent applications that are in earlier stages of filing or where the specifications have not been published have not been included in the above list.
For
per
sona
l use
onl
y

Optiscan Imaging Limited Annual Report 2012
Page | 72
ASX Additional Information
Additional information required by the Australian Securities Exchange Ltd and not shown elsewhere in this report is as follows. The information is current as at 25 September 2012. (a) Distribution of equity securities 158,913,815 fully paid ordinary shares are held by 3,608 individual shareholders. All issued ordinary shares carry one vote per share and carry the rights to dividends. The number of shareholders, by size of holding, in each class are:
F Total Holders No of Fully paid ordinary shares 1 – 1,000 823 496,051 1,001 – 5,000 1,229 3,548,936 5,001 – 10,000 446 3,723,201 10,001 – 100,000 912 30,896,581 100,001 – and over 198 120,249,046
3,608
158,913,815
Holding less than a marketable parcel
1,871 3,139,987 Option (b) Substantial shareholders aid O
Name Number Percentage Ibsen Pty Ltd <Narula Family Set No3 A/> 9,626,667 6.06 Circadian Technologies Limited 8,285,151 5.21
(c) Twenty largest holders of quoted equity securities
Ordinary shareholders Fully Paid Number Percentage 1. Ibsen Pty Ltd <Narula Family Set No3 A/> 9,626,667 6.06 2. Circadian Technologies Limited 8,285,151 5.21 3. CGS Holdings Pty Ltd 7,000,000 4.40 4. Gralaw Pty Ltd 5,976,000 3.76 5. Dixson Trust Pty Limited 4,476,020 2.82 6. Ixohoxi Pty Ltd 4,081,277 2.57 7. Mr Alfred Winkelmeier & Mrs Christine Winkelmeier <Winkelmeier Super Fund a/c> 3,600,000 2.27 8. Carlisle Lavelle Pty Ltd 3,442,695 2.17 9. Asahi Optical Company Limited 3,330,000 2.10
10. Mr Peter Maxwell Delaney 3,231,259 2.03 11. Mr Angus Matthew Holt 3,173,659 2.00 12. Harech Pty Ltd <Porter Super Fund A/c> 2,233,334 1.41 13. Semblance Pty Ltd <Graeme Mutton Retirement Super Fund> 2,000,000 1.26 14. Mr Vaughan Corps 1,750,571 1.10 15. Mr Chris Graham <Graham Family Super Fund A/c> 1,700,000 1.07 16. Syngene Ltd 1,640,438 1.03 17. Portorose Pty Ltd <R J Porter Family Fund A/c> 1,600,000 1.01 18. Eryri Pty Ltd 1,341,000 0.84 19. Project Management Pty Ltd <D&K Corps Family S/F A/c> 1,260,000 0.79 20. Cullymurra Pty Ltd 1,142,482 0.72
70,890,553 44.61
For
per
sona
l use
onl
y