Fnf lebanon presentation v1
25
Did the Arab Spring Benefit Economic Freedom in Jordan? Dr. Yusuf Mansur Economic Freedom of the Arab World Conference October 20-21 2011
-
Upload
yusuf-mansur -
Category
Economy & Finance
-
view
77 -
download
1
Transcript of Fnf lebanon presentation v1

Did the Arab Spring BenefitEconomic Freedom in Jordan?
Dr. Yusuf Mansur
Economic Freedom of the Arab World ConferenceOctober 20-21 2011

Table of Contents
1. Rankings
– Global Competitiveness Report
– Doing Business Report
– World Competitiveness Yearbook
– Economic Freedom Index, Heritage Foundation
– Economic Freedom of the World Index, Fraser Institute
2. Economic Developments
– Remittances
– Foreign Direct Investment
– Foreign Aid
– External and Domestic Debt
– Budget Deficit
– Trade Deficit
– Stock Market
– Unemployment
– Tourism
3. Events and Government Actions
4. Recommendations and Conclusions
Jordan in International Reports & Rankings
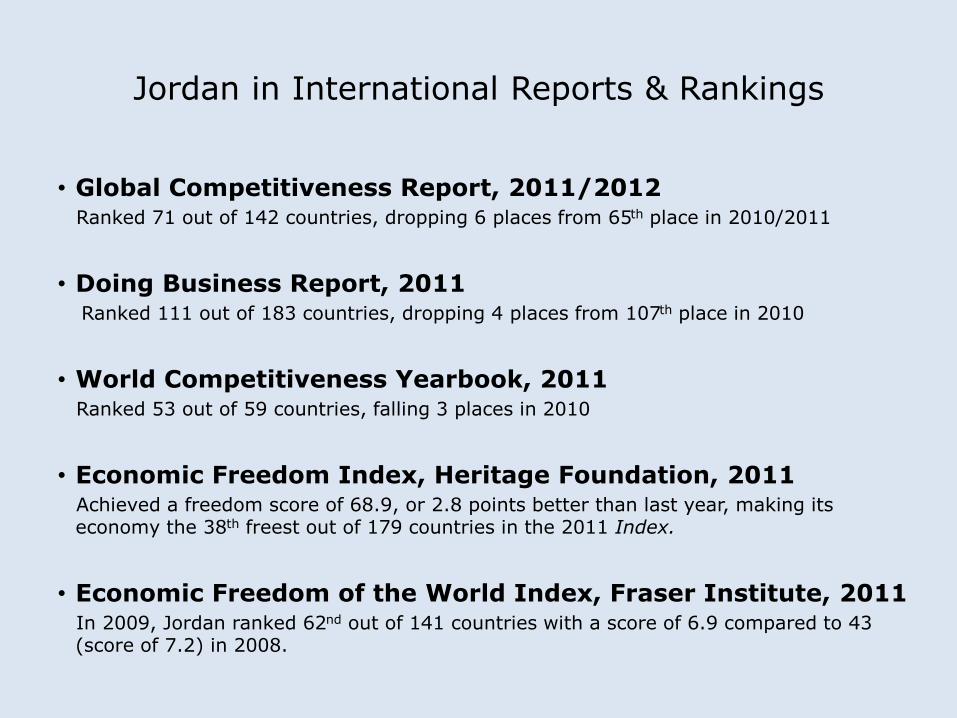
• Global Competitiveness Report, 2011/2012Ranked 71 out of 142 countries, dropping 6 places from 65th place in 2010/2011
• Doing Business Report, 2011Ranked 111 out of 183 countries, dropping 4 places from 107th place in 2010
• World Competitiveness Yearbook, 2011Ranked 53 out of 59 countries, falling 3 places in 2010
• Economic Freedom Index, Heritage Foundation, 2011Achieved a freedom score of 68.9, or 2.8 points better than last year, making its economy the 38th freest out of 179 countries in the 2011 Index.
• Economic Freedom of the World Index, Fraser Institute, 2011In 2009, Jordan ranked 62nd out of 141 countries with a score of 6.9 compared to 43 (score of 7.2) in 2008.

Global Competitiveness Indicators, 2011/2012
Major Indicators
Rank
Performance
Difference
2009-
20102010-2011 2011-2012
(133
Countries) (139 Countries) (142 Countries)
Basic Requirement 46 57 61 4
Institutions 25 41 45 4
Infrastructure 42 61 59 2
Macroeconomic Environment 105 103 97 6
Health and Basic Education 57 65 72 7
Efficiency Enhancers 66 73 78 5
Higher Education and Training 42 57 59 2
Market Efficiency 43 46 54 8
Labor Market Efficiency 106 112 107 5
Financial Market Development 52 54 65 11
Technological Readiness 61 62 59 3
Market Size 82 84 88 4
Innovation & Sophistication Factors 51 65 70 5Business Environment
Development49 66 68 2
Innovation 59 68 77 9Source: Global Competitiveness Report, 2011/2012, World Economic Forum

Global Competitiveness Index, Ranking per Nation, 2009/2010 to 2011/2012
• Jordan, Egypt, Algeria and Libya have each recorded significant drops in their rankings, over theprevious year, while Qatar, Saudi Arabia, Tunisia, Oman and Kuwait have shown improvements in theirperformances.
• Most of the nations that have shown improvements in their performances are oil producing nations,while the non-oil producing Arab nations have shown weaker competitiveness levels.
0
20
40
60
80
100
120
Qatar SaudiArabia
UAE Tunisia Oman Kuwait Bahrain Jordan Iran Egypt Algeria Lebanon Libya
Ran
kin
g
2009/2010
2010/2011
2011/2012
Source: Global Competitiveness Report, 2011/2012, World Economic Forum

Doing Business Rankings, per Indicator, 2005-2011
• The Doing Business Report, 2010/2011 measures the impediments and facilitators of businesses, in anation. This produces a time series of such factors as the guarantee of property rights, and theintrusiveness of business regulations, over a time series.
• The ten factors analyzed in the Doing Business Report are detailed in the table below.
Source: Doing Business Report, 2011, World Bank Group
2005 2006 2007 2008 2009 2010 2011
Ease of Doing Business 73 74 78 80 101 100 111
Starting a Business 127 133 133 133 119 125 127
Dealing with
Construction Permits 68 71 70 71 116 92 92
Employing Workers 30 45 30 45 48 51 N/A
Registering Property 110 106 110 109 105 106 106
Getting Credit 76 80 83 84 125 127 128
Protecting Investors 114 105 118 107 114 119 120
Paying Taxes 16 19 18 19 22 26 29
Trading Across Borders 85 51 78 59 77 71 77
Enforcing Contracts 72 128 75 128 129 124 129
Closing a Business 79 84 84 87 96 96 98
Participating Countries 135 155 175 178 181 183 183

Doing Business Ranking, per Nation, 2011
• As shown in the table below, Jordan is in the middle range of in terms of, Doing Business vis the Arabregion. However, when all the oil-producing countries are excluded, Jordan is considered advanced.
Source: Doing Business Report, 2011, World Bank Group
Doing Business Ranks, 2011
Jordan 111
Oman 57
Qatar 50
UAE 40
Bahrain 28
Saudi Arabia 11
Kuwait 74
Egypt 94
Yemen 105
Syria 144
Lebanon 113
Iran 129
Algeria 136
Iraq 166

World Competitiveness Yearbook, Rankings per Primary Indicators, Jordan, 2011
• The World Competitiveness Yearbook assesses the capacity of nations in terms ofdeveloping and upholding an environment that is conducive to free enterprise, in 59nations.
• The Yearbook measures economic growth, infrastructure levels, enterprise efficiency,and public sector performance, over 331 sub-issues. Jordan’s rank has dropped from37th place in 2007, to 53rd place in 2011.
Source: World Competitiveness Yearbook, 2011, IMD Foundation
2007 2008 2009 2010 2011
Overall Competitiveness 37 34 41 50 53
Economic Performance 44 51 53 45 55
Government Efficiency 32 25 32 39 31
Business Efficiency 31 21 44 46 52
Infrastructure 36 34 40 52 52

World Competitiveness Yearbook, Rankings per Sub-Indicator, Jordan, 2011
• Jordan’s ranking has dropped, in most indicators relating to theWorld Competitiveness Yearbook.
Source: World Competitiveness Yearbook, 2011, IMD Foundation
2009 Ranking 2011 Ranking
Domestic Economy 39 55
International Trade 6 31
International Investment 35 52
Employment 56 48
Prices 44 40
Public Finance 41 38
Fiscal Policy 21 15
Institutional Framework 32 37
Business Legislation 24 35
Societal Framework 38 43
Productivity and Efficiency 46 59
Labor Market 56 49
Finance 28 41
Management Practices 44 52
Attitudes and Values 39 39
Basic Infrastructure 51 59
Technological Infrastructure 39 49
Scientific Infrastructure 26 49
Health and Environment 46 46
Education 35 46
Economic Freedom Index, Heritage Foundation, Jordan Rankings per Indicator, 2011
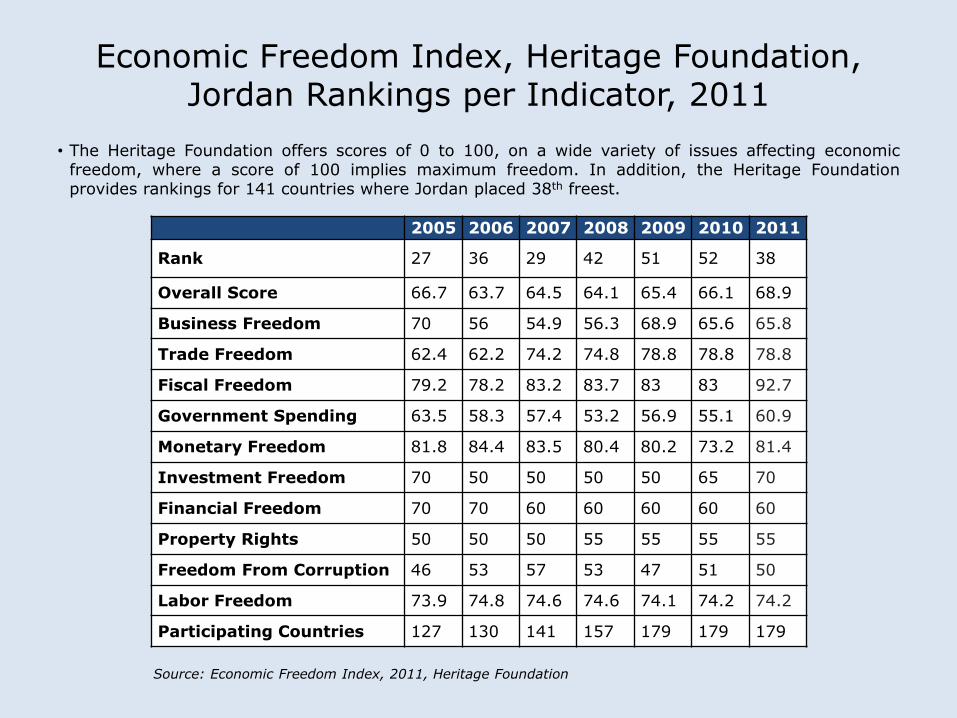
• The Heritage Foundation offers scores of 0 to 100, on a wide variety of issues affecting economicfreedom, where a score of 100 implies maximum freedom. In addition, the Heritage Foundationprovides rankings for 141 countries where Jordan placed 38th freest.
Source: Economic Freedom Index, 2011, Heritage Foundation
2005 2006 2007 2008 2009 2010 2011
Rank 27 36 29 42 51 52 38
Overall Score 66.7 63.7 64.5 64.1 65.4 66.1 68.9
Business Freedom 70 56 54.9 56.3 68.9 65.6 65.8
Trade Freedom 62.4 62.2 74.2 74.8 78.8 78.8 78.8
Fiscal Freedom 79.2 78.2 83.2 83.7 83 83 92.7
Government Spending 63.5 58.3 57.4 53.2 56.9 55.1 60.9
Monetary Freedom 81.8 84.4 83.5 80.4 80.2 73.2 81.4
Investment Freedom 70 50 50 50 50 65 70
Financial Freedom 70 70 60 60 60 60 60
Property Rights 50 50 50 55 55 55 55
Freedom From Corruption 46 53 57 53 47 51 50
Labor Freedom 73.9 74.8 74.6 74.6 74.1 74.2 74.2
Participating Countries 127 130 141 157 179 179 179

Economic Freedom of the World Index, 1980-2009• The Economic Freedom of the World Index of 2011 relies on 2009 data. Jordan achieved a score of
6.84 in 2009 (where a score of 10 indicates perfect freedom), and a rank of 55 (a drop of twenty nineplaces from 2005). Overall, Jordan has most freedom: access to sound money; freedom to trade
Source: Economic Freedom of the World Index (Fraser), Jordan, 2011
Rating &
RankGov Size
Legal
Structure &
Security of
Property
Rights
Access to Sound
Money
Freedom to
Trade
Regulation of
Credit, Labor &
Business
1980Rating 5.5 5.33 2.54 6.82 6.52 6.08
Rank 54 44 76 32 33 30
1985Rating 5.84 5.14 3.86 7.74 6.32 6.01
Rank 40 54 79 30 36 35
1990Rating 6.05 7.27 4.37 6.2 6.56 5.98
Rank 42 14 74 69 37 40
1995Rating 6.42 6.38 5.95 7.15 6.47 6.24
Rank 48 48 45 53 70 39
2000Rating 7.24 6.08 7.22 9.67 7.02 6.22
Rank 30 67 27 7 63 53
2005Rating 7.38 6.27 6.31 9.21 7.74 7.35
Rank 26 76 50 37 20 29
2008Rating 7.14 5.64 6.56 8.35 7.67 7.45
Rank 40 87 35 58 22 24
2009Rating 6.84 4.37 6.31 9.27 7.18 7.04
Rank 55 109 45 35 34 39
Population, Corruption and Freedom Indicators
Country Population
(Million)
Population
under 25
GDP per capita,
000 at PPP
Democracy Corruption Freedom Index of 100
= most
unstable
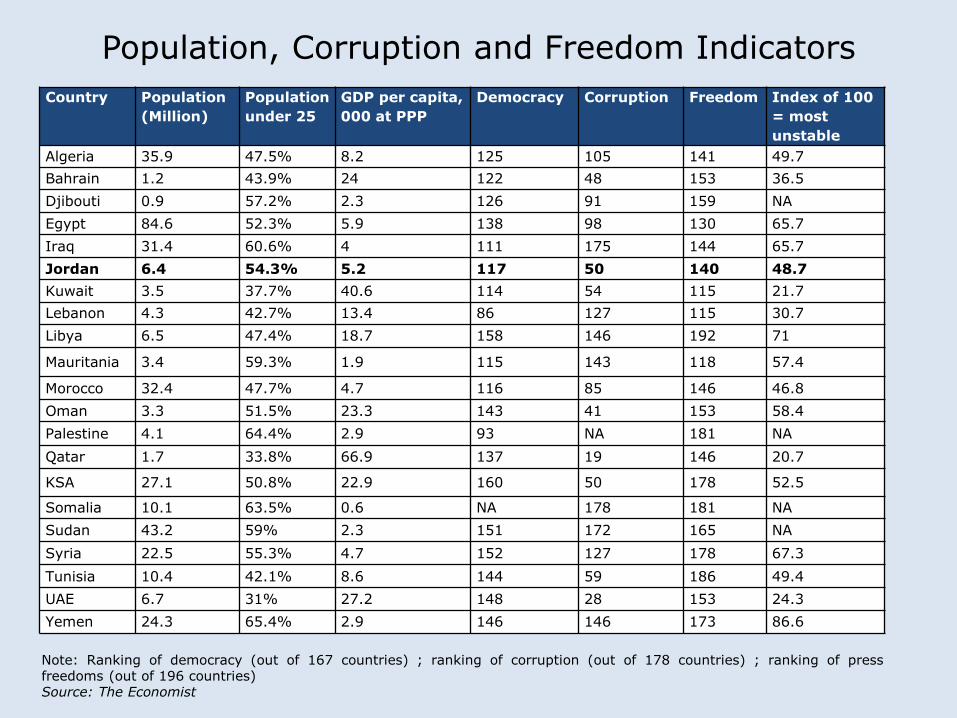
Algeria 35.9 47.5% 8.2 125 105 141 49.7
Bahrain 1.2 43.9% 24 122 48 153 36.5
Djibouti 0.9 57.2% 2.3 126 91 159 NA
Egypt 84.6 52.3% 5.9 138 98 130 65.7
Iraq 31.4 60.6% 4 111 175 144 65.7
Jordan 6.4 54.3% 5.2 117 50 140 48.7
Kuwait 3.5 37.7% 40.6 114 54 115 21.7
Lebanon 4.3 42.7% 13.4 86 127 115 30.7
Libya 6.5 47.4% 18.7 158 146 192 71
Mauritania 3.4 59.3% 1.9 115 143 118 57.4
Morocco 32.4 47.7% 4.7 116 85 146 46.8
Oman 3.3 51.5% 23.3 143 41 153 58.4
Palestine 4.1 64.4% 2.9 93 NA 181 NA
Qatar 1.7 33.8% 66.9 137 19 146 20.7
KSA 27.1 50.8% 22.9 160 50 178 52.5
Somalia 10.1 63.5% 0.6 NA 178 181 NA
Sudan 43.2 59% 2.3 151 172 165 NA
Syria 22.5 55.3% 4.7 152 127 178 67.3
Tunisia 10.4 42.1% 8.6 144 59 186 49.4
UAE 6.7 31% 27.2 148 28 153 24.3
Yemen 24.3 65.4% 2.9 146 146 173 86.6
Note: Ranking of democracy (out of 167 countries) ; ranking of corruption (out of 178 countries) ; ranking of press freedoms (out of 196 countries)Source: The Economist
Economic Developments – Remittances
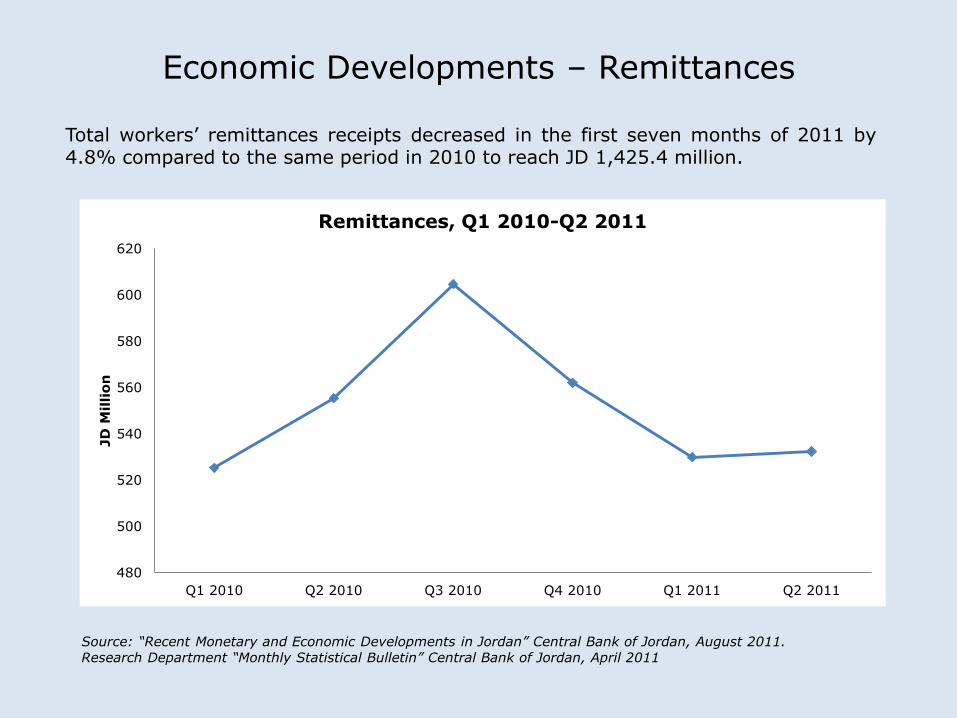
Source: “Recent Monetary and Economic Developments in Jordan” Central Bank of Jordan, August 2011.Research Department “Monthly Statistical Bulletin” Central Bank of Jordan, April 2011
Total workers’ remittances receipts decreased in the first seven months of 2011 by4.8% compared to the same period in 2010 to reach JD 1,425.4 million.
480
500
520
540
560
580
600
620
Q1 2010 Q2 2010 Q3 2010 Q4 2010 Q1 2011 Q2 2011
JD
Millio
n
Remittances, Q1 2010-Q2 2011

Economic Developments – Foreign Direct Investment
Year FDI (JD Million)
2006 2,512.7
2007 1,859.1
2008 2,005.7
2009 1,722.9
2010 1,208
2011 (Q1) 249.7
2011 (Q2) 311.2
Source: Research Department “Monthly Statistical Bulletin” Central Bank of Jordan, April 2011
Foreign Direct investmentdecreased in the first twoquarters of 2011 by 15% fromJD 655 million of the sameperiod in 2010 to JD 561million.

Economic Developments – Foreign Aid
• Comparing Jan-July 2010 to Jan-July2011, it is clear that the value offoreign grants in Jordan has nearlyquadrupled (or 392%), amounting toJD 1.028 billion at the end of theperiod.
• Saudi Arabia granted Jordan some$1.45 bn to help reduce its budgetdeficit.
• In addition, Jordan and the US signedfive grant agreements worth $359.3million. Note that the table to the leftexcludes this aid. Making the grantstotal US$1.81 bn.
Source: “Jordan, U.S. sign $359 Grant Deals”, Ministry ofPlanning and International Cooperation, October 2011http://www.mop.gov.jo/pages.php?menu_id=115&local_type=1&local_id=551&local_details=1&local_details1=
Year MonthForeign Grants
(JD Million)
2010 Jan 35.500
2010 Feb 17.900
2010 Mar 14.800
2010 Apr 35.400
2010 May 25.400
2010 Jun 28.800
2010 Jul 50.000
2010 Aug 40.800
2010 Sep 30.000
2010 Oct 10.000
2010 Nov -
2010 Dec 113.100
2011 Jan 17.800
2011 Feb -
2011 Mar -
2011 Apr -
2011 May 297.200
2011 Jun -
2011 Jul 709.000
Foreign Grants, Jan 2010 – Jul 2011
Source:"Jordan Receives $1 Billion Grant From Saudi Arabia" AmmonNews, 2011 <http://en.ammonnews.net/article.aspx?articleNO=13030>

Economic Developments – External Debt and Domestic Debt
3,000
3,500
4,000
4,500
5,000
5,500
6,000
6,500
7,000
7,500
Jul…
Aug
Sep
Oct
Nov
Dec
Jan…
Feb
Mar
Apr
May
Jun
Jul
JD
Millio
n
External Debt
Domestic Debt
Source: Research Department “Monthly Statistical Bulletin” Central Bank of Jordan, April 2011
• Domestic debt increased by 5%or 349 million between July2010 to July 2011
• External Debt increased by557.2 million or 13.6% acrossthe same period
• Public Debt now stands at57.4% of GDP compared to61.4% of GDP at the end of2010.

Economic Developments – Budget Deficit
Deficit/Surplus
Monthly
JD MillionsDec-10 Jan Feb Mar Apr May June July Total
Including
Grants-243.4 9 -195.2 -53.6 91.2 106.8 -218.3 590.6 87.1
Excluding
Grants-356.5 -8.8 -195.2 -53.6 91.2 -190.4 -218.3 -118.4 -1050
Source: Research Department “Monthly Statistical Bulletin” Central Bank of Jordan, April 2011
The impact of the Saudi grant can be clearly seen in the table above. The deficit,excluding grants, stood at JD1050 million at the end of July 2011, while thatincluding grants reached a surplus of JD 87.1 million for the same period.
Current Account Deficit: The current account deficit now stands at JD -1151.4million for the first two quarters of 2011. This is an increase of 52.3% or JD 602.1million over that of the same period of last year.

Economic Developments – Trade Deficit
Source: Research Department “Monthly Statistical Bulletin” Central Bank of Jordan, April 2011
• Compared to July 2010, Jordan’s trade deficit rose 15.4% to reach nearly JD 562.6million in July 2011.
• The value of imports amounted to JD 1.030 m compared to JD 897.1 m or an increaseof 13% for the same period.
• Meanwhile, the value of exports reached JD 467.8 m compared to JD 409.8 m, anincrease of 12.4%.
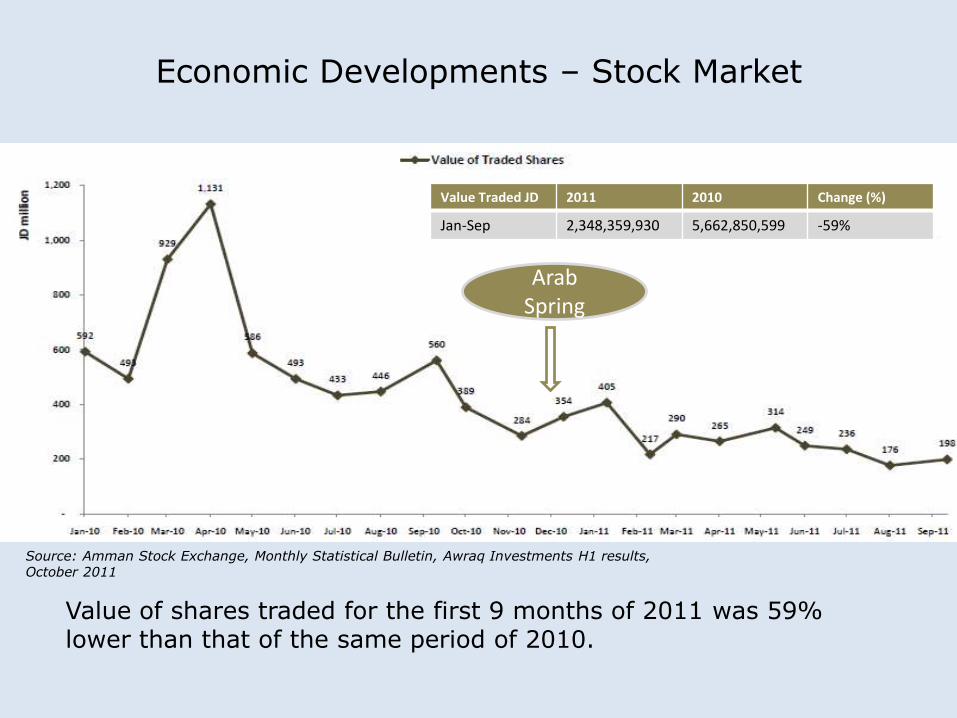
Economic Developments – Stock Market
Source: Amman Stock Exchange, Monthly Statistical Bulletin, Awraq Investments H1 results, October 2011
Start of Arab
Spring
Value of shares traded for the first 9 months of 2011 was 59% lower than that of the same period of 2010.
Value Traded JD 2011 2010 Change (%)
Jan-Sep 2,348,359,930 5,662,850,599 -59%

Economic Developments – Unemployment
12.412.2
13.5
11.8
13.113.2
13.1
10.5
11
11.5
12
12.5
13
13.5
14
Q1 2010 Q2 2010 Q3 2010 Q4 2010 Q1 2011 Q2 2011 Q3 2011
Unemployment
Source: “Quarterly Unemployment Rates for 2009 and the Third Quarter of 2011” Department of Statistics, Jordan, 2011
• Between Q4 2010 and Q3 2011, the unemployment rate rose by 1.3%• Unemployment in Jordan fluctuated between the first quarter of 2010 and
the third quarter of 2011, recording a low of 11.8% in the Q4 2010 and ahigh of 13.5% in Q3 2010.

Economic Developments – Tourism
• The number of visitors to the Kingdom dropped by 13% in the first nine months of the yearcompared to the same period in 2010, according to official statistics from the Ministry ofTourism & Antiquities.
• According to the Ministry of Tourism’s monthly report, 5,097,368 tourists visited thecountry between January and September 2011, while the figure stood at 5,878,373 in thesame period last year.
• The report also showed a 31% drop in the number of Jordanian expatriates who visited thecountry in the same period. Approximately 662,625 Jordanian expatriates visited theKingdom in the first nine months of the year, compared to 965,227 in the same period of2010.
• The report attributed the drop in the total number of visitors and the number of Jordanianexpatriates to the current unrest in the region.
• The number of tourists from the Gulf states, however, rose by 28% in the period to958,635 tourists, compared to 751,385 in the first nine months of 2010, according to thereport.

Timeline of Protests and Government Actions
Jan Oct
14/01/2011Protests led by tradeunionist and leftistparties took placecalling for the removalof Samir Rifaigovernment due to theirinability to rein in pricesand poverty.
Event
Govern
ment
Action
18/01/2011Samir Rifaigovernmentreversed a risein fuel price.
21/1/2011Despite Rifai’s efforts toalleviate Jordan’seconomic misery, 5,000people protested inAmman and other cities.
26/01/2011King speech promisespolitical and economicreform andConstitutionamendments.
01/02/2011King Abdullah IIdismissed Rifai’sgovernment andordered Marouf Al-Bakhit to form the newcabinet, pledgingenhanced freedoms,economic reform andpolitical reforms. Also,a $500m package ofprice cuts in fuel andessential goods, wasannounced, along withsalary increases forcivil servants and themilitary.
25/02/2011The protests reached apeak of around 10thousand people at Al-Husaini mosquedemanding political andeconomical reform.Local police separatedanti-governmentprotesters and pro-regime supporters.
15/03/2011The King appointed a53-member committeewith governmentofficials and oppositionleaders to draft newlaws for parliamentaryelections and politicalparties, setting athree-month deadline.However, the MuslimBrotherhood refusedto participate until thedissolution ofparliament with a newprime minister electedfrom a parliamentarymajority.
25/03/2011Clashes occurred betweenpro-government supportersand more than 2,000protesters at Gamal AbdelNasser Circle.On the same day, 35thousand gathered in Al-Hussein Gardens west ofAmman to express loyaltyand allegiance to the King.
28/03/2011Following the clashes,King Abdullah II calledfor national unity,stating that economicand political reformswere on their way.The Parliamentrejected calls toreduce the king'spower. And thegovernment decided toban its supportersfrom demonstrating inthe capital, while theopposition was allowedto demonstrate inspecially designatedareas in Amman.Government appointsa new committee toengage in nationaldialogue.
15/04/20112,000 protestersdemanded greaterpoliticalrepresentation, withhalf of themdemonstrating inAmman. Also, a crowdof a few hundredIslamists clashed withthe gendarmerie inZarqa.
12/06/2011Commemorating 12years on the throne,the King said he willrelinquish his right toappoint primeministers andcabinets, insteadleaving it to theelected parliamentarymajority to form futurecabinets.He also said that morereforms would beannounced in thefuture, including newelection and politicalparty laws.
07/10/2011After a lull inAugust andSeptember, formerprime ministerAhmed Obeidat ledover 2,000 peoplein a march inAmman to pushtheir demand forthe downfall of Al-Bakhit’sgovernment sayingit had failed to dealwith corruption andadopt politicalreform.

Current Government Status Quo
Budget Annex Purpose
66% To maintain subsidies on bread,barley and gas
16% Outstanding government procurement and construction payments
14% The Royal Decree granted JD 100 to all retired and active security, government military personnel
4% Regional Development Fund for Governorates
In addition, the government issued international Euro bonds last year, which have declined 10% in value, making it difficult for the government to issue new bonds
When was it approved???
The table below illustrates the distribution of the Budget Annex:

Conclusions
Economic Indicator Effect
Remittances 13.5% July 2011 – July 2010
Foreign Direct Investment
15% first two quarters of 2010 vs. first two quarters of 2011
Foreign Aid 329% comparing Jan-July 2010 to Jan-July 2011, amounting to JD 1.024 b.
External and Domestic Debt
Domestic debt increased by 5% or 349 m between July 2010 to July 2011; External debt increased by 557.2 m or 13.6%
Budget Deficit Current account deficit stands at JD -1151.4 m for the first two quarters of 2011, which is a52.3% or JD 602.1 m increase on the same period of last year
Trade Deficit Rose by 15.4% between July 2010–July 2011
Stock Market Value traded at Amman Stock Exchange [ASE] declined by 50.3% since December of 2010.
The ASE general index decreased by 17.1% for the same period.
Unemployment Between Q4 2010 and Q3 2011, the unemployment rate rose by 11.1%
Tourism Number of visitors dropped by 13% from Jan-Sept in 2011 compared to the same period in 2010

Thank You!
So, Did the Arab Spring Enhance Economic Freedom?