Final Technical Report: Award number: DE FC36 Project Period: (January 2004 June 2012 ... ·...
41
1 Final Technical Report: Task 2.1: Melting Efficiency in Die Casting Operations Award number: DE‐FC36‐04GO14230 Project Period: (January 2004 – June 2012) David Schwam, PI (216) 368-6499 [email protected] Department of Materials Science and Engineering 10900 Euclid Ave. Cleveland, OH 44106 Contributor: Jessada Wannasin, Research Associate December 15, 2012
Transcript of Final Technical Report: Award number: DE FC36 Project Period: (January 2004 June 2012 ... ·...
1
Final Technical Report:
Task 2.1: Melting Efficiency in Die Casting Operations
Award number: DE‐FC36‐04GO14230
Project Period: (January 2004 – June 2012)
David Schwam, PI
(216) 368-6499
Department of Materials Science and Engineering
10900 Euclid Ave.
Cleveland, OH 44106
Contributor:
Jessada Wannasin, Research Associate
December 15, 2012

2
ACKNOWLEDGMENTS
Acknowledgement: This report is based upon work supported by the U S. Department of Energy
under Award No. DOE award DE‐FC36‐04GO14230.
Disclaimer: Any opinions, findings, and conclusions or recommendations expressed in this
material are those of the author and do not necessarily reflect the views of the Department of
Energy.
Proprietary Data Notice: This report does not contain any proprietary data.
Document Availability: Reports are available free via the U.S. Department of Energy (DOE)
Information Bridge Website: http://www.osti.gov/bridge
Reports are available to DOE employees, DOE contractors, Energy Technology Data Exchange
(ETDE) representatives, and Informational Nuclear Information System (INIS) representatives
from the following source:
Office of Scientific and Technical Information
P.O. Box 62
Oak Ridge, TN 37831
Tel: (865) 576‐8401
FAX: (865) 576‐5728
E‐mail: [email protected]
Website: http://www.osti.gov/contract.html

3
TABLE OF CONTENTS
ACKNOWLEDGMENTS .............................................................................................................. 2
TABLE OF CONTENTS ................................................................................................................ 3
LIST OF FIGURES ........................................................................................................................ 4
LIST OF TABLES .......................................................................................................................... 5
EXECUTIVE SUMMARY ............................................................................................................ 6
1. INTRODUCTION AND BACKGROUND ........................................................................ 7
2. EVALUATION METHODS ............................................................................................. 12
3. RESULTS AND DISCUSSION ........................................................................................ 17
4. BENEFITS ASSESMENT................................................................................................. 38
5. COMMERCIALIZATION ................................................................................................ 38
6. ACCOMPLISHMENTS .................................................................................................... 39
7. CONCLUSIONS................................................................................................................ 40
8. RECOMMENDATIONS ................................................................................................... 41
9. BIBLIOGRAPHY .............................................................................................................. 41

4
LIST OF FIGURES
Figure 1 Three of the large Benchmarked Melting Furnaces: left to right reverberatory, stack and
induction. ........................................................................................................................................ 6 Figure 2 Energy used in die casting operations .............................................................................. 8
Figure 3 Covered 75kW furnace (L) and Uncovered 75kW furnace (R) ..................................... 12 Figure 4 IF Image covered (L) and IF Image Uncovered (R) ....................................................... 12 Figure 5 Measurement equipment for transfer ladle evaluation (L) data acquisition (R)
thermocouple................................................................................................................................. 13 Figure 6 Schematic of ladle insulation (L) and Mounting of data acquisition (R) ....................... 14
Figure 7 Degassing (L) and Tapping Metal (R)............................................................................ 14 Figure 8 Covered Ladle (L) and Infrared Camera (R) .................................................................. 15 Figure 9 Illustrations of the evaluation methods (a) the K-mold, (b) the test bar mold, (c) the
PoDFA [Courtesy of ABB] ........................................................................................................... 16
Figure 10 Tower aluminum melting furnace at Spartan Light Metal ........................................... 17 Figure 11 Schematic of the Aluminum Tower Melting Furnace (courtesy of StrikoDynarad) .... 18
Figure 12 Heat content Cp of aluminum alloy 380....................................................................... 19 Figure 13 Reverberatory melting and holding furnace at Spartan Light Metal Products ............. 19
Figure 14 Vibrating chute for charging cold scrap into the well (right side) ............................... 20 Figure 15 Charging ingots/skimming through the front door of a gas reverberatory furnace. ..... 20 Figure 16 Tapping out molten metal by pressurizing a side chamber with air ............................. 21
Figure 17 Coreless induction furnaces at Mercury Marine .......................................................... 22 Figure 18 The total amount of dross removed from (a) the tower melting furnace and (b) the
reverberatory furnace .................................................................................................................... 23 Figure 19 Histogram of PoDFA results from a coreless induction furnace and a reference. Major
inclusions are oxide films, gamma alumina dispersed, grain refiner, and reacted refractory....... 24
Figure 20 The Nikkan dual-crucible tower aluminum melting and holding furnace at Pressure
Cast Products in Oakland, California ............................................................................................ 25 Figure 21 Schematic of Nikkan Dual-Crucible Aluminum Tower Melting Furnace ................... 25 Figure 22 Die casting cell with ingot loader ................................................................................. 27
Figure 23 Inductotherm Acutrak DEH induction aluminum melting furnace .............................. 28 Figure 24 Ampco DM-II Pro power analyzer ............................................................................... 28
Figure 25 Inductotherm Accutrak – Energy consumption (kWH) ............................................... 29 Figure 26 (a) Top of the Acutrak furnace - ingot being loaded (b) Thermal image ..................... 30
Figure 27 Power use during the benchmarking experiment of the Acutrak furnace. ................... 30 Figure 28 Holding energy (Covered)(L) and Holding Energy per hour (R)................................. 31 Figure 29 Holding energy (uncovered) (L) and Holding energy per hour (uncovered) (R) ......... 31 Figure 30 Covered vs. Uncovered (L) and Covered vs. Uncovered (R) ....................................... 32 Figure 31 Consecutive molten metal temperature cycles for the "insulated" ladle. ..................... 33
Figure 32 Two cycles of heating/cooling in “standard” ladle ....................................................... 34 Figure 33 Effect of insulation and cover lid on molten metal cooling in a transfer ladle ............ 35
Figure 34 Infrared images of ladle during cooling ....................................................................... 36 Figure 35 Fractured surfaces and K-value of (a) the Virgin, (b) Type I Scrap, (c) Die Casting and
(d) the Concentrated Scrap. ........................................................................................................... 36 Figure 36 UTS and elongation of the baseline samples and the Die Casting sample. .................. 37 Figure 37 PoDFA results of the baseline samples and the Die Casting sample ........................... 37 Figure 38 Historic NYMEX price of natural gas 1984-2012. ...................................................... 39

5
LIST OF TABLES
Table 1 Typical Melting Efficiency and Melt Losses for the Benchmarked Furnaces .................. 6 Table 2 Melting Efficiency of Different Melting Processes (according to the Office of Industrial
Technologies) ................................................................................................................................ 10
Table 3 Types and conditions of the samples ............................................................................... 17 Table 4 Experimental results of Acutrak benchmarking .............................................................. 29

6
EXECUTIVE SUMMARY
This project addressed multiple aspects of the aluminum melting and handling in die casting
operations, with the objective of increasing the energy efficiency while improving the quality of
the molten metal. The efficiency of melting has always played an important role in the
profitability of aluminum die casting operations. Consequently, die casters need to make careful
choices in selecting and operating melting equipment and procedures. The capital cost of new
melting equipment with higher efficiency can sometimes be recovered relatively fast when it
replaces old melting equipment with lower efficiency. Upgrades designed to improve energy
efficiency of existing equipment may be well justified. Energy efficiency is however not the only
factor in optimizing melting operations. Melt losses and metal quality are also very important.
Selection of melting equipment has to take into consideration the specific conditions at the die
casting shop such as availability of floor space, average quantity of metal used as well as the
ability to supply more metal during peaks in demand. In all these cases, it is essential to make
informed decisions based on the best available data.
Benchmarking of Melting Efficiency and Melt Losses
Case Western Reserve University (CWRU) worked with many die casters to benchmark the
energy efficiency of a wide range of aluminum melting furnaces: Spartan Light Metal, Sparta IL;
Mercury Marine, Fond du Lac WI; Empire Die Casting, Macedonia OH, Ryobi Die Casting,
Shelbyville, IN, Honeywell, San Diego CA, Pressure Cast Products, Oakland CA, Eck
Industries, Manitowoc WI, General Die Casters, Peninsula OH and Gibbs Die Casting in
Henderson, KY. Shown below in Figure 1 (from left to right) are three of the large benchmarked
melting furnaces: reverberatory, stack and induction.
Figure 1 Three of the large Benchmarked Melting Furnaces: left to right reverberatory, stack and induction.
The typical melting efficiency and melt losses for these furnaces are shown in the following
table:
Table 1 Typical Melting Efficiency and Melt Losses for the Benchmarked Furnaces
The energy efficiency of small melting furnaces was measured. In a 700 pounds stack dual-
crucible gas furnace the energy efficiency was measured as 20.5% when melting at a rate of 220
lbs/hour (50% of the maximum melting rate). The energy efficiency of a Direct Energy

7
Heating furnace was measured as 51% when melting with the lid open, at a rate of 319 lbs/hr.
When operated at full power with the lid closed, this crucible furnace has an efficiency of 84.4%.
Holding furnaces are using up to 22% of the total energy consumption in die casting plants. Most
die casters use manual or robotic ladles to feed molten metals from the holding furnace to the
shot sleeve. Ladling requires access to the molten metal, therefore holding furnaces are often
left fully or partially uncovered. This study measured the heat losses from electrical furnaces
with and without cover, at holding temperatures between 1,100°F and 1,400°F. In this manner,
the heat losses to the atmosphere could be separated from the total energy losses of the furnace.
The heat losses were two to three times larger when the cover was removed due to increased
radiation and convection. Expressed in kilowatt hours, the losses in the uncovered furnace
ranged from 5.0 at 1,100°F, to 8.0 at 1,400°F. The exposed metal surface was about three
square feet. Significant heat losses are also encountered in large transfer ladles used to move
molten metal from the melting to the holding furnaces. The heat loss from three types of
insulated ladle configurations was measured: standard castable refractory, castable refractory
paired with an embedded micro-porous blanket, and the later with a cover. An improved
insulation with the micro-porous blanket combined with a cover can cut the cooling rate almost in
half compared to the standard castable-lined ladle. Use of the improved insulation with micro-
porous blanket without a cover produces intermediate cooling rates. This configuration offers a
reasonable compromise when ease of handling is factored in. The results also show that
uninterrupted use of ladles is an economic way to reduce heat loss in the transfer process.
Interrupted operation allows the ladles to cool and absorb excessive heat from the molten metal
when returned to use.
The study also evaluated molten metal cleanliness assessment methods. In the K-Mold method a
test plate bar is cast in a permanent mold, broken, and inclusions on the fractured surfaces are
counted visually. Mechanical testing using an ASTM standard tensile test bar configuration is
another option. Finally, PoDFA in which molten metal is filtered and the inclusions trapped on
top of the filter are quantified by image analysis. The reported study highlights the characteristics
of each method and determines the correlation between the cleanliness level and the test results
of each cleanliness evaluation method. The differences in test results obtained with virgin metal and
type I scrap were relatively small. This finding supports a common industrial practice of using a
50% ratio of virgin to Type I scrap in the melting charge.
Presentations and Workshops for Technology Transfer
Based on the detailed benchmarking work, a number of papers were presented at the annual
Metalcasting Congresses. Also, workshops were conducted on Melting Efficiency under North
American Die Casting Association (NADCA) oversight. On average, around fifty people
attended each workshop at: Empire Die Casting, Macedonia OH, Edelbrock, Hemet CA, Nemak
Die Casting, Syslacauga AL, Ryoby Die Casting, Shelbyville IN and Mercury Marine, Fond du
Lac WI.
1. INTRODUCTION AND BACKGROUND
The casting industry is a very energy intensive industry. According to the North American Die
Casting Association (NADCA), 55% of the energy in die casting operation is used in melting,
22% in holding molten metal, 11% in die casting, 3% in trimming castings and 9% in other than
processing areas (Figure 2).

8
Figure 2 Energy used in die casting operations
The efficiency of melting has always played an important role in the profitability of aluminum
die casting operations. During times of rising energy cost it becomes an even more important
factor. Consequently, die casters need to make careful choices in selecting and operating melting
equipment and procedures. The capital cost of new melting equipment with higher efficiency can
sometimes be recovered relatively fast when it replaces old melting equipment with lower
efficiency. Upgrades designed to improve energy efficiency of existing equipment may be well
justified. Energy efficiency is however not the only factor in optimizing melting operations. Melt
losses and metal quality are also very important. Selection of melting equipment has to take into
consideration the specific conditions at the die casting shop such as availability of floor space,
average quantity of metal used as well as the ability to supply more metal during peaks in
demand. In all these cases, it is essential to make informed decisions based on the best available
data.
The largest amount of energy is needed to melt the aluminum. After the metal is melted it has to
be treated by degassing and skimming. In some cases degassing is combined with fluxing to
remove oxides. The molten metal is then transferred to the holding furnace were it waits until it
is ready to be used. Ideally, the molten metal should lose a minimal amount of heat while
proceeding through all of these steps. In reality, large amounts of heat are lost in these
processes. If the aluminum is not at the optimum casting temperature, the metal will not flow
properly, causing cold shuts and other defects in the finished part. Accordingly, a specific
temperature range must be maintained. While holding furnaces are able to heat up the metal,
they are normally limited in the power they have. If a substantial amount of heat is lost during
the transfer process, the metal will have to be brought back up to temperature for casting. The
reheat of molten metal is often inefficient, can take a long time and require significant amounts
of energy.
The heat is lost in holding furnaces by three mechanisms: conduction, radiations, and convection.
Conductions take place in the refractory lining or the walls of the crucible that contains the
molten metal. The heat lost by conduction is normally less than the heat lost by radiation and
convection to the atmosphere. By using a refractory lining with low thermal conductivity the
heat lost due to conduction can be reduced even further. The selection of the refractory material
has to take into consideration a few factors. Low thermal conductivity is the main criterion. The
material also has to withstand thermal expansion and hydrostatic pressure from the molten metal.
The inner refractory material has to withstand contact with molten aluminum and be resistant to

9
the impact and wear of the oxide skimming operations. This is especially true for the "belt
line"- where the surface of the metal meets the furnace walls. In this area, tenacious corundum
deposits are usually formed, requiring fluxing and aggressive mechanical removal. A compromise
can be made by layering different refractory materials to achieve optimum life and efficiency of
the lining. Refractory material comes in many forms such as bricks, boards, castable linings, and
fabrics. A typical lining will comprise anywhere between two and six or more of these refractory
materials.
In addition to conduction to the furnace walls most of the heat is lost through radiation and
convection into the atmosphere. This loss can be prevented or minimized by blocking the heat
loss source, i.e. using a lid to cover the exposed area. Best even is the use of pumping the metal
into the shot sleeve. Dosing furnaces can pump time after time, a pre-determined, accurate and
reproducible amount of metal into the shot sleeve. They are fully enclosed thus completely
eliminating the radiation and convection losses. This delivery method also provides a cleaner
metal with fewer oxide films.
In many die casting operations molten aluminum is transferred from the melting furnaces to
smaller holding furnaces with refractory-lined ladles moved by forklifts. While flexible and
convenient, transfer of molten aluminum by ladles increases the energy consumption of die
casting plants. Heat losses during molten metal transfer with ladles occur in different ways:
conduction through the side walls and radiation into the atmosphere. Since the molten aluminum
is in direct contact with the air, heat is also transferred from the aluminum into the air through
convection. The magnitude of the heat losses depends on the exposed surface area of the metal
and the temperature of the air around it. Decreasing the surface area directly exposed to the air
will reduce the amount of heat lost by convection and radiation. Depending on the thermal
conductivity of the lining material, the thickness of the material, and the surface area in contact
with the metal the heat transfer into the walls of the ladle can be calculated. Different
materials and combinations of materials can reduce the amount of heat lost due to
conduction. Time also plays a factor in the heat lost from the metal. If the metal spends more
time in the transfer process, more heat will be lost. Route configuration and management could
allow for faster and more efficient transfer. Improved material selection for linings in the
transfer ladles, partial lid design and route management are some of the solutions to address
heat loss during transfer. By collecting data on the actual temperature drop during the
transfer process better informed decisions can be made on whether or not improvements on
transfer or holding methods will offset the time and energy costs of reheating the metal.
TYPES OF MELTING AND HOLDING FURNACES USED IN DIE CASTING
CRUCIBLE FURNACES
Crucible furnaces are available in several types, including gas, electrical resistance, and
induction. They are suitable for melting most ferrous and non-ferrous alloys. In aluminum die
casting, they are primarily used as holding furnaces at the die-cast stations. Crucible furnaces are
the least expensive to purchase and are popular when the requirement is for melting small to
medium volumes of metal [Kennedy, 2001].
GAS REVERBERATORY FURNACE
The basic design of a gas reverberatory furnace includes a rectangular steel box lined with
refractory, burners which are mounted in the roof or in the sidewalls, a charge door and a charge
10
well on one or both ends of the furnace. Melting is accomplished by heat that “reverberates” or
“re-radiates” from the hot refractory heated by the burners [Lange, 1994]. High velocity or
radiant roof burners are typically used. With the increasing energy costs, regenerative or
recuperative burners are becoming more common. Gas reverberatory furnaces are the most
commonly used furnaces in large casting foundries [Kennedy, 2001].
GAS STACK MELTER
The typical gas stack melter consists of preheating, melting, and holding areas. The furnace is
charged from the top of the shaft. Some parts of the charge materials that slide down the shaft
and reach to the melting zone are melted by the burners in the melting zone. After the metal is
melted, it flows to the holding area. The hot exhaust gases from the melting zone flow through
the charge in the shaft to preheat the incoming charge. The preheated charge materials gradually
slide down into the melting zone. The process results in continuous melting of metal [Lange,
1994]. Melting efficiency of the gas stack melter is normally higher than gas crucible and gas
reverberatory furnaces. In recent years, due to higher energy costs stack furnaces are receiving
more attention.
CORELESS INDUCTION FURNACE
Coreless induction furnaces use electricity to melt metals by inducing electro-magnetic currents
in the charge. In addition to heating the metal, the electro-magnetic field also creates convection
in the melt, promoting temperature and alloy uniformity. The holding and tapping temperature
can be accurately controlled. Coreless induction furnaces are used in both small jobbing
foundries and the large re-melt shops. These are considered as the most efficient furnaces for
melting fine scarp such as chips, turnings, or foil. New development of air-cooled coreless
induction furnaces is targeting the die casting industry by offering fast and energy efficient
melting of aluminum.
IMPACT OF MELTING EQUIPMENT
ON MELTING EFFICIENCY
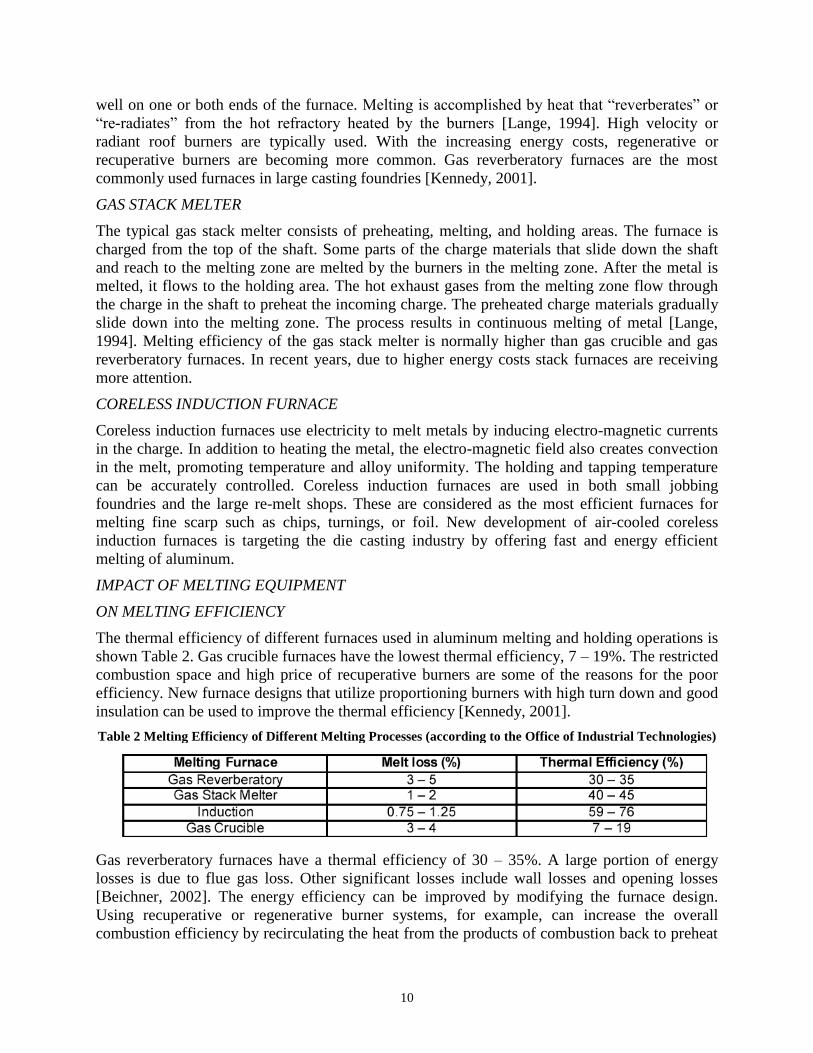
The thermal efficiency of different furnaces used in aluminum melting and holding operations is
shown Table 2. Gas crucible furnaces have the lowest thermal efficiency, 7 – 19%. The restricted
combustion space and high price of recuperative burners are some of the reasons for the poor
efficiency. New furnace designs that utilize proportioning burners with high turn down and good
insulation can be used to improve the thermal efficiency [Kennedy, 2001].
Table 2 Melting Efficiency of Different Melting Processes (according to the Office of Industrial Technologies)
Gas reverberatory furnaces have a thermal efficiency of 30 – 35%. A large portion of energy
losses is due to flue gas loss. Other significant losses include wall losses and opening losses
[Beichner, 2002]. The energy efficiency can be improved by modifying the furnace design.
Using recuperative or regenerative burner systems, for example, can increase the overall
combustion efficiency by recirculating the heat from the products of combustion back to preheat

11
the combustion air [Beichner, 2002]. Advanced insulation materials have been recently
introduced to further improve the energy efficiency.
Gas stack melters have the highest thermal efficiency among gas furnaces, 40– 45%. The design
of the furnace allows all the incoming metal to be charged through the exhaust stack. The heat,
otherwise wasted, is used to preheat the charge prior to melting. This results in significant
improvements of energy efficiency. The stack design also reduces the heat loss from door
opening and charging compared with gas reverberatory furnaces [Kennedy, 2001].
Induction furnaces are the most thermal efficient type of furnaces, 59 – 76%. However, it must
be noted that the furnace uses electricity, which is usually more expensive than gas.
ON MELT LOSS
When clean metal gets entrapped with oxidized metal in the dross or slag layer, it results in melt
loss. Melt loss is an important factor in melting and holding processes as it adds to production
costs and waste energy. Table 2 shows melt loss of different melting processes. It shows gas
crucible and reverberatory furnaces yield the highest melt losses, in the range of 3 – 5%. These
gas-fired furnaces are subject to higher melt losses because of several reasons. In these furnaces,
a larger melt surface area is exposed to the furnace atmosphere and combustion products. The
longer retention times of the metal in these furnaces causes more metal oxidation. In addition,
the furnaces are operated at a higher temperature in the melting chamber [Krohn, 1984]. Gas
stack melters are reported to have lower melt losses, in the 1 – 2% range. In these furnaces the
charge materials are preheated, thus oxidation products due to moisture and organics from the
charge materials are reduced or eliminated. The melt surface area in the melting and holding
zones is smaller. In addition, the retention times of the metal in the furnace are shorter [Krohn,
1984].
Induction furnaces have the lowest melt losses of 0.75 – 1.25%. The absence of combustion
products CO, CO2, and H2O from the furnace atmosphere greatly reduces metal oxidation and
melt losses. In addition, when fine scraps are melted, the stirring action from the electro-
magnetic force helps to pull the charge into the melt and avoid oxidation therefore reduces the
melt losses.
ON MELT QUALITY
In melting and holding operations, reaction products and contaminants can affect the melt
quality, and thus the mechanical properties of the cast components. These reaction products and
contaminants enter the melt as inclusions in the form of dispersed particles or films. Sources of
inclusions include thermal oxidation of the charge in the melting furnace, thermal oxidation
during scrap pretreatment, corrosion products, anodized surfaces of charge materials, oxidation
of the melt surface, and reaction between moisture and charge materials [Smith, 1986]. The main
types of inclusions are aluminum oxide (Al2O3), aluminum carbide (Al4C3), magnesium oxide
(MgO), spinel (MgAl2O4), titanium diboride (TiB2), aluminum boride (AlB), and titanium
aluminide (TiAl3) [Liu and Samuel, 1997].
Since metal oxidation is the main source of inclusions, the effect of melting processes on melt
quality is expected to follow the same trend as melt loss, discussed above. Induction furnaces
should therefore yield a higher melt quality than gas-fired furnaces. Also, gas stack melters
should yield higher melt quality than gas reverberatory furnaces.

12
2. EVALUATION METHODS
MELTING EFFICIENCY
To obtain the melting efficiency of a furnace, the furnace is monitored for a period of time. The
total weight of the metal charged into the furnace is recorded as well as the total gas and/or
power consumption. An average energy required is obtained by dividing the total energy
consumption for the time period by the total weight of aluminum melted during this time. The
melting efficiency is obtained by dividing the theoretical energy required to heat and melt one
pound of an aluminum alloy up to the tapping temperature without any heat losses by the actual
average energy required of the furnace.
HOLDING EFFICIENCY
This study employed a 75 kW Lindberg electric furnace to hold 500 pounds of aluminum at
various set point temperatures. A 600 pound capacity silicon carbide crucible was used to
contain the molten metal. Two furnace configurations were used for the experiments: covered
and uncovered (Figure 3). A thermal camera was used to take infrared images of the furnace
with the cover and without it. The thermal image of the covered furnace shows an overall cooler
furnace than the uncovered furnace (Figure 4). The cover in Figure 4 reached a temperature that
ranged from 180F° to a maximum of 550F°. The uncovered furnace, Figure 4, had an exposed
molten metal surface with a maximum temperature above 1,150F°. The aluminum bath internal
temperature was at 1,300F°.
Figure 3 Covered 75kW furnace (L) and Uncovered 75kW furnace (R)
Figure 4 IF Image covered (L) and IF Image Uncovered (R)

13
During the experiment, the power was monitored using an Amprobe DM-II Pro power meter and
the temperature was logged using an Extech dual thermocouple data logger. A thermocouple,
submerged into the metal bath, was used to measure the metal bath temperature.
COVERED FURNACE
Data was initially collected from a covered furnace. The temperature was set to 1,100 degrees
Fahrenheit and monitored over ten hours. The power meter was used to measure and record the
energy and the power used by the furnace. The metal was allowed to reach steady state with the
temperature of the bath set to 1,100°F. The elements temperature was set to 1,115°F. The metal
slowly heated up and eventually stabilized at approximately 1,100°F. The metal sat over night
at the 1,100°F holding temperature. The power analyzer collected power data for ten hours at 15
seconds intervals. Subsequently, the data from the power analyzer was entered into a spreadsheet
for later analysis. In subsequent tests the temperature was increased successively at 100°F intervals.
The furnace was held for ten hours at 1,200, 1,300, and 1,400°F respectively, while recording the
temperature along with the energy required for holding. A thermocouple, submerged in the
molten metal was used to log the bath temperature for the ten hours, at 1.5 minute time interval.
The ambient temperature was also logged.
UNCOVERED FURNACE
The experiments were repeated with an uncovered furnace. Four sessions starting at 1,100°F
with 100°F increments were conducted. In these experiments, the element temperature was set
100°F higher than the bath temperature. Since the heat losses in the uncovered furnace are
higher, we anticipated the temperature would drop faster. In order to keep the temperature
within 20 degrees of the actual temperature the element temperature had to be increased. When
the temperature in the bath drops below the set point temperature, the heating elements begin to
heat up faster to compensate for the extra heat that is lost due to the open lid. Both the
thermometer and power data analyzers were hooked up to the furnace and left to run overnight.
The power analyzer took data every 15 seconds and the temperature analyzer took the temperature
every 1.5 minutes.
MOLTEN METAL TRANSFER
The first phase of the experiment required mounting data loggers and thermocouples on two
ladles (Figure 5).
Figure 5 Measurement equipment for transfer ladle evaluation (L) data acquisition (R) thermocouple

14
The first, designated "insulated" has a Thermal Ceramics BTU-Block'" flexible liner, a
microporous insulation composite, between the steel shell and the castable refractory. The other
without this liner is designated "standard" (Figure 6). The data loggers were mounted with
special brackets (Figure 6), to hold the instrument off of the ladle wall thus reducing the risk of
overheating and also allowing for easy removal of the data loggers for data transfer.
Figure 6 Schematic of ladle insulation (L) and Mounting of data acquisition (R)
After mounting, the data loggers were wrapped with Fiberfrax insulation to protect them from
external heat sources and impact. The thermocouples were placed into their brackets and secured
with set screws. A Fiberfrax ceramic coating was applied on the thermocouples to protect them
from the molten aluminum. The brackets were then fitted and welded onto the side of the ladle
and the thermocouples were connected to the data logger. The coated thermocouples were
positioned in the ladle, a couple of inches from the ladle floor. The data loggers were started and
the ladles returned to normal operation. The metal temperature was measured and recorded every
30 seconds. The data loggers had a second thermocouple placed between the logger and the
mounting bracket in order to monitor the temperatures the data loggers were exposed to.
The data loggers were programmed to record temperatures through the normal transfer cycle.
During the normal route of the ladle transfer, the operator first stops to tap-in molten aluminum
from the reverb furnace. Next the operator places the ladle under the degasser for five minutes
(Figure 7). After degassing, the aluminum is skimmed to remove dross and then is carried off to
the various holding furnaces located near the die casting machines (Figure 7). The operator then
returns either to the reverb to refill the ladle or to a parking area to leave the ladle until needed
again. The data loggers were removed periodically to download data to a laptop for further
analysis.
Figure 7 Degassing (L) and Tapping Metal (R)

15
The experiment involved measuring the cooling rate of molten aluminum in three different ladle
setups. One ladle "insulated", with the BTU-BlockTm and the other, "standard" was not. The
third ladle was a variation of the "insulated" ladle with a Fiberfrax ceramic blanket draped over
the top to simulate a ladle with a removable cover (Figure 8). Each ladle was fitted with a
thermocouple and data logger as described in the first phase. The three ladles were preheated and
filled with molten aluminum and allowed to sit for an extended time until the metal temperature
dropped to 1,150°F so it could be returned to the reverb before solidifying. The data loggers were
set to record the temperature every 30 seconds. The outside wall temperature of the ladle was
recorded every 10 minutes with an infrared pyrometer. At the same time, a thermal camera
(Figure 8) was used to take pictures of each ladle from a side view and a top view. The thermal
pictures provide a color scale representation of the temperature distribution, and which ladle is
averaging the greatest heat loss. The time pictures were taken was recorded so they can be
coupled with the cooling curves to provide a visual representation.
Figure 8 Covered Ladle (L) and Infrared Camera (R)
MELT LOSSES
Melt losses can be obtained by taking the difference in weight between the metal charged into
the furnace and the metal tapped out from it [Smith, 1986]. A more practical approach is to
weigh the slag and dross removed from the furnace and divide it by the total weight of metal
charged (or tapped out). None of these methods is ideal, as will be discussed.
MELT QUALITY
Several tests are used in foundries to determine the melt quality and cleanliness. Three tests that
are commonly used are discussed:
Reduced Pressure Test
In this test, a small amount of molten metal is collected and allowed to solidify under reduced
pressure. Specific gravity measurements of the sample can provide a semi -quantitative measure
of dissolved hydrogen gas content.
This test can also provide the overall melt cleanliness since inclusions act as nucleation sites for
hydrogen gas. Thus, an exaggerated visualization of pores will be observed in sectioned surfaces
if the melt contains inclusions [Neff, 2001]. The results can be compared with a baseline sample
or any rating charts. The reduced pressure test is the most common method used in foundries
today [Neff, 2001].

16
K-Mold
The molten metals were cast into a notched bar permanent mold, shown in Figure 9a. The
fractured surfaces were visually examined for any macro defects. The number of all inclusions
was counted, and the cleanliness of the melt was quantified using the K-value, which is defined
as [2.1]:
n
SK (2.1)
where S is the number of inclusions found in n pieces of the small sample.
Mechanical Testing
The molten metals were cast into a test bar mold preheated to about 200˚C, see Figure 9b. Ten
test bars per each metal sample were obtained. The ultimate tensile strength (UTS) and the
elongation data were determined.
PoDFA (Porous Disc Filtration Apparatus)
Approximately 1.5 kg of the molten metals were poured into a preheated crucible which had a
fine-grade test filter at the bottom, see Figure 9c. A vacuum was applied to cause to the molten
metal to flow through the filter. Any inclusions in the melt were then collected on the surface of
the test filter. The metal cleanliness was then determined by metallographic examinations of the
“cake” area. The total inclusion is given as [3]:
22 mean measured residue area (mm ) inclusion area fractionmmTotal Inclusion ( )
kg filtered metal mass (kg)
(2.2)
Figure 9 Illustrations of the evaluation methods (a) the K-mold, (b) the test bar mold, (c) the PoDFA
[Courtesy of ABB]
The Assessment Procedures
Three metal samples with known cleanliness conditions were first used to establish the baseline
levels for metal cleanliness. These samples include (1) the Virgin ingots, (2) Type I Scrap
metals, and (3) the Concentrated Scrap metals. In these assessment tests, approximately 100 kg
of the metals were melted and heated to 700˚C in an induction furnace. The molten metals were
skimmed well and then assessed using the three methods.
After establishing the baseline levels, the methods were then used to assess the metal cleanliness
in a commercial die casting operation. The assessments were performed at a 10,000-kg barrel
(a) (b) (c)
17
furnace, which was used to melt and provide A380 alloy for several die casting machines. Brief
descriptions of the samples are given in Table 3.
Table 3 Types and conditions of the samples
Sample ID Description Quality Level Virgin Primary ingots “Clean”
Type I Scrap Scrap metals: thick runners and gates “Intermediate”
Concentrated Scrap Scrap metals: re-used several times “Dirty” and
Unacceptable
Die Casting From a barrel furnace at a die casting plant “Production”
3. RESULTS AND DISCUSSION
LARGE MELTING FURNACES
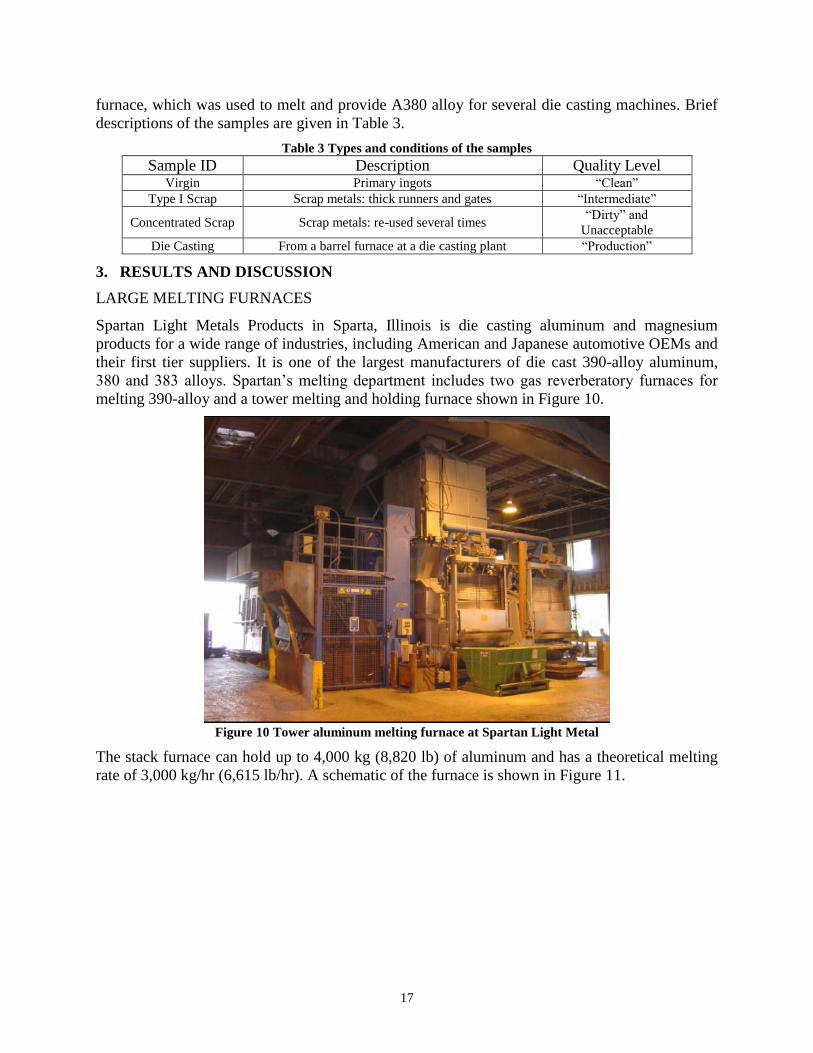
Spartan Light Metals Products in Sparta, Illinois is die casting aluminum and magnesium
products for a wide range of industries, including American and Japanese automotive OEMs and
their first tier suppliers. It is one of the largest manufacturers of die cast 390-alloy aluminum,
380 and 383 alloys. Spartan’s melting department includes two gas reverberatory furnaces for
melting 390-alloy and a tower melting and holding furnace shown in Figure 10.
Figure 10 Tower aluminum melting furnace at Spartan Light Metal
The stack furnace can hold up to 4,000 kg (8,820 lb) of aluminum and has a theoretical melting
rate of 3,000 kg/hr (6,615 lb/hr). A schematic of the furnace is shown in Figure 11.

18
Figure 11 Schematic of the Aluminum Tower Melting Furnace (courtesy of StrikoDynarad)
Cold aluminum scrap and ingots are charged into the furnace through the charging door (2) at the
top. As the hot gas from the melting burners makes its way up the stack it comes in contact with
the charge, drying and preheating it. This use of waste heat contributes to significantly increase
the efficiency of the melting operation. When it reaches zone (5) the metal is melted by three
burners and flows into the holding chamber (6). Tapping out is accomplished by tilting the entire
furnace with a hydraulic piston.
The efficiency of the tower melting furnace at Spartan Light Metal Products was evaluated over
a forty-eight hours period. Prior to charging into the furnace, all the Type 1 die casting scrap and
the virgin 383 alloy ingots were carefully weight on a calibrated electronic scale. The molten
metal tapped out of the furnace was also weighed.
Readings of the gas meter on the furnace were taken at the beginning and the end of the
evaluation. Additional readings were taken at regular intervals to identify potential variation in
energy use with time.
An average value of 1,113 BTU/lb was obtained by dividing the total gas consumption for the
forty-eight hours by the total weight of aluminum melted during this time. It should be noted the
quantity of molten metal in the holding furnace was the same at the beginning and the end of this
period. The “theoretical” energy required to heat and melt one pound of aluminum alloy 380 up
to 1,310 degrees Fahrenheit (710 degrees Celsius) without any heat losses has been calculated as
498.6 BTU/lb. This value was obtained by integrating the area under the heat content-Cp curve
vs. temperature curve of alloy 380 shown in Figure 12 for the temperature range of 90-1,310
degrees Fahrenheit (32-710 degrees Celsius) and adding the latent heat of fusion. The theoretical
value, 498.6 BTU/lb was then divided by the actual melting energy of 1,113 BTU/lb (includes
heat losses) to obtain the energy efficiency of 44.8%.

19
Figure 12 Heat content Cp of aluminum alloy 380.
The same procedure described for the stack furnace was used to determine the melting efficiency
of the reverberatory furnace shown in Figure 13, used to melt 390 alloy. This reverberatory
furnace can hold 54,000 pounds of 390 aluminum alloy and has a melting rate of 6,000 lb/hr.
Figure 13 Reverberatory melting and holding furnace at Spartan Light Metal Products

20
Cold 390 aluminum alloy scrap is charged into the furnace by a vibratory chute through an open
area back end, as shown in Figure 14. Ingots are charged into the furnace through the front door.
Slag is also removed from this side as shown in Figure 15. The metal is melted by six vertical
burners. Tapping out is accomplished by pressurizing the metal in a side chamber with air as
shown in Figure 16. This chamber fills back through openings in the wall connecting it to the
main chamber. This operation is repeated until the necessary metal has been tapped out.
Figure 14 Vibrating chute for charging cold scrap into the well (right side)
Figure 15 Charging ingots/skimming through the front door of a gas reverberatory furnace.

21
Figure 16 Tapping out molten metal by pressurizing a side chamber with air
The efficiency of the reverberatory melting furnace at Spartan Light Metal Products was
evaluated over a forty-eight hours period. An average value of 2,102 BTU/lb was obtained by
dividing the total gas consumption for the forty eight hours by the total weight of aluminum
melted during this time. It should be noted the quantity of molten metal in the holding furnace
was #4,700 less at the end of this period than at the beginning. The “theoretical” energy required
to heat and melt one pound of aluminum alloy 390 from room temperature to 1,475 degrees
Fahrenheit (802 degrees Celsius) without any heat losses has been calculated as 587 BTU/lb.
This value was obtained by integrating the area under the heat content-Cp curve vs. temperature
curve of alloy 390 for the temperature range of 90-1,475 degrees Fahrenheit (32-802 degrees
Celsius) and adding the latent heat of fusion. Since the scrap is charged cold into the furnace,
only the volume fraction of scrap used during the 48 hour was factored in this value.
The ingot on the other hand is pre-heated and charged while at about 700 degrees Fahrenheit
(371 degrees Celsius).
The “theoretical” energy required to heat and melt one pound of aluminum alloy 390 from 700
degrees Fahrenheit (371 degrees Celsius) to 1,475 degrees Fahrenheit (802 degrees Celsius)
without any heat losses has been calculated as 423 BTU/lb. For a 53% ratio of scrap to ingot
measured during the 48 hours of this experiment the weighed average energy to melt one pound
of 390 alloy is therefore 0.53*587+0.47*423=510 BTU/lb. This theoretical value, 510 BTU/lb
was then divided by the actual melting energy of 2,102 BTU/lb (includes heat losses) to obtain
the energy efficiency of 24.3%. According to the manufacturer of the furnace, when operated
near the design melting capacity of 6,000 lb/hour, this furnace should ideally use about 1,500
BTU to melt one pound of aluminum alloy. During this benchmarking experiment the average
melting rate was only 3,035 lb/hour, or 50.6% of the design melting capacity. This highlights one
of the issues encountered during evaluation of energy efficiency of melting equipment, i.e.
design vs. actual melting rate. Every melting furnace is designed to melt a certain amount of
metal per hour. The highest energy efficiency is attained when the furnace is operated at or near

22
the design melting rate. Consequently, the further away operating conditions are from the design
value, the less energy efficiency the melting becomes. The melting efficiency of coreless
induction furnaces was also determined. These 900 kW 60 Hz furnaces shown in Figure 17 have
a capacity of 6,800 pounds each
Figure 17 Coreless induction furnaces at Mercury Marine
Three such units are used at Mercury Marine Castings in Fond du Lac, Wisconsin as the primary
melting furnaces. From the induction melters, each molten aluminum alloy is transferred to a
designated gas reverberatory furnace for holding and treating, before delivery to the die casting
machines. The average melting efficiency was determined as 854 BTU/lb (64.8%) by monitoring
three separate runs of 356 alloy.
METAL LOSSES IN LARGE MELTING FURNACES
The metal losses of the tower furnace were measured during the forty-eight hours of the
experiment by weighing dross removed by the Melting Department personnel after the regular
fluxing operations of the molten bath in the furnace. These losses are representative of the
practices used in this die casting shop, for this specific furnace at the time of the experiment. The
total losses measured over the forty-eight hours of the experiment were 1.6%. By and large,
fluxing and skimming take place once every shift; in this case seven sessions. The total amount
of dross removed from the tower furnace in each skimming session is shown in Figure 18a. Also
shown in this chart is the distribution of the losses between the melting and the holding chambers
of the furnace. As expected, the losses are higher in the melting chamber. Most of the oxides
from the surface of the scrap and ingot charge are retained and later removed from this chamber.
The charge entering the melting chamber is also exposed to more intense flames from multiple
melting burners. A single burner operating intermittently keeps the cleaner metal arriving into
the holding chamber at set-point temperature thus producing less dross. Due to the relatively
small size of the melting and holding chambers, manual skimming and sludging can be
performed with good results. Despite a fairly constant melting rate during the experiment, some

23
variation in the metal losses was observed between shifts, as illustrated in Figure 18a. Such
variation can be attributed in part to the nature of the charge materials. Scrap with large surface
to volume ratio produces more oxide losses than virgin ingot, or bulky scrap. Most of the
variation is however operator related.
Due to the much larger size of the reverberatory furnace, skimming is performed with a forklift.
The weight of dross removed in each fluxing and skimming session during the forty-eight hours
of the experiment is shown in Figure 18b. The total loss during this time was 1.7%. These losses
do not include sludge, which is removed at longer time intervals than covered by this
experiment. In this case the variation in losses between shifts was also caused by variations in
the demand for metal.
Figure 18 The total amount of dross removed from (a) the tower melting furnace and (b) the reverberatory
furnace
It should be noted that dross removed from both the tower and reverb furnaces has a high metal
content and is sent to a recycling facility for recovery. It is therefore important to realize that
metal losses reported for this experiment could be further reduced by subtracting the weight of
metal recovered from the dross. Such a value would be more representative of the performance
of the furnaces. The losses reported herein are more inclusive, in that they lump all the
contributions, including fluxing, skimming and sludging methods practiced in the plant.
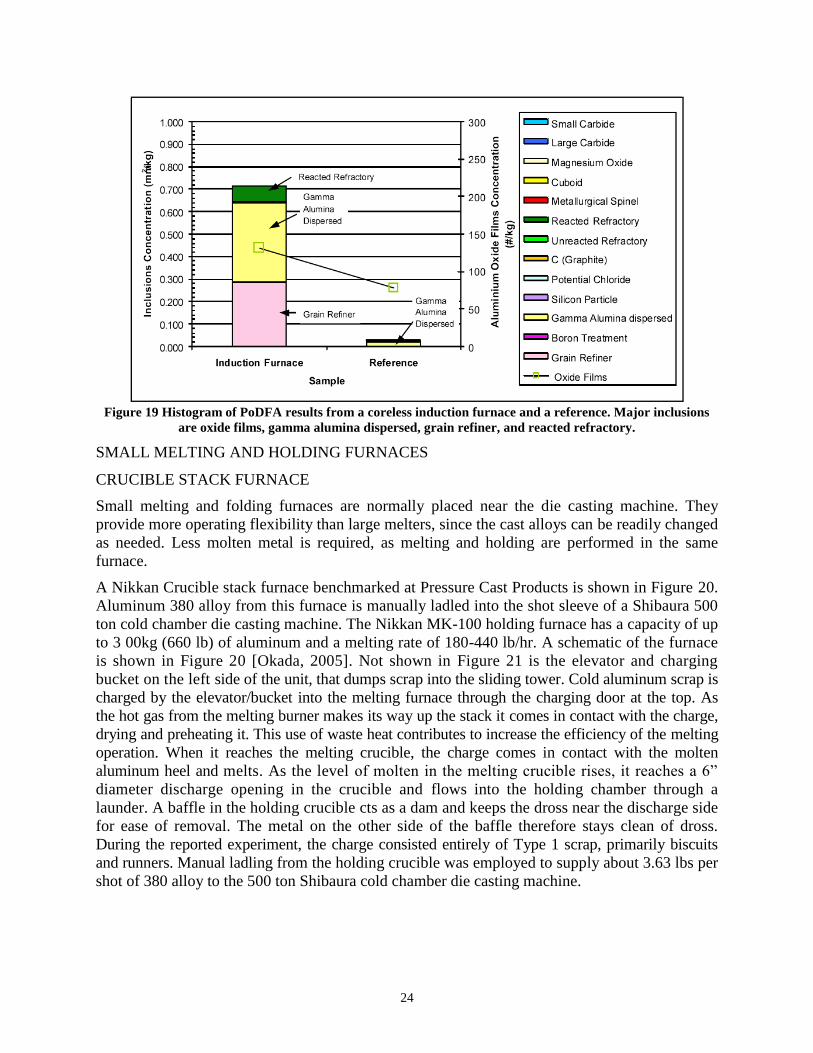
The melt quality of these furnaces was analyzed using the PoDFA technique. A typical melt
quality report of a sample taken from the coreless induction furnace is shown in Figure 19 for
illustration purpose only. After melting in the induction furnace the molten metal is transferred to
a holding reverberatory furnace where it undergoes further cleaning by fluxing, filtering,
degassing and skimming. In this plot, the quality of the melt in the induction furnace before
being tapped out is given along with the melt quality of a reference sample, a primary A356
ingot melted gently in an electrical resistance furnace. The major inclusions in the metal melted
by this induction furnace are alumina oxide films, gamma alumina dispersed, grain refiner, and
reacted refractory. The comparison of the melt quality obtained by the PoDFA technique from
different types of furnaces is of interest and will be continued in the future.
24
Figure 19 Histogram of PoDFA results from a coreless induction furnace and a reference. Major inclusions
are oxide films, gamma alumina dispersed, grain refiner, and reacted refractory.
SMALL MELTING AND HOLDING FURNACES
CRUCIBLE STACK FURNACE
Small melting and folding furnaces are normally placed near the die casting machine. They
provide more operating flexibility than large melters, since the cast alloys can be readily changed
as needed. Less molten metal is required, as melting and holding are performed in the same
furnace.
A Nikkan Crucible stack furnace benchmarked at Pressure Cast Products is shown in Figure 20.
Aluminum 380 alloy from this furnace is manually ladled into the shot sleeve of a Shibaura 500
ton cold chamber die casting machine. The Nikkan MK-100 holding furnace has a capacity of up
to 3 00kg (660 lb) of aluminum and a melting rate of 180-440 lb/hr. A schematic of the furnace
is shown in Figure 20 [Okada, 2005]. Not shown in Figure 21 is the elevator and charging
bucket on the left side of the unit, that dumps scrap into the sliding tower. Cold aluminum scrap is
charged by the elevator/bucket into the melting furnace through the charging door at the top. As
the hot gas from the melting burner makes its way up the stack it comes in contact with the charge,
drying and preheating it. This use of waste heat contributes to increase the efficiency of the melting
operation. When it reaches the melting crucible, the charge comes in contact with the molten
aluminum heel and melts. As the level of molten in the melting crucible rises, it reaches a 6”
diameter discharge opening in the crucible and flows into the holding chamber through a
launder. A baffle in the holding crucible cts as a dam and keeps the dross near the discharge side
for ease of removal. The metal on the other side of the baffle therefore stays clean of dross.
During the reported experiment, the charge consisted entirely of Type 1 scrap, primarily biscuits
and runners. Manual ladling from the holding crucible was employed to supply about 3.63 lbs per
shot of 380 alloy to the 500 ton Shibaura cold chamber die casting machine.

25
Figure 20 The Nikkan dual-crucible tower aluminum melting and holding furnace at Pressure Cast Products
in Oakland, California
Figure 21 Schematic of Nikkan Dual-Crucible Aluminum Tower Melting Furnace
The efficiency of the Nikkan MK- 100 dual-crucible aluminum tower melting furnace was
evaluated over a one shift, nine hours period. Prior to charging into the furnace, all Type 1 die
casting scrap was carefully weighed on a calibrated Toledo Model 4182 scale with a +/-0.5
26
pound accuracy. A total number of 511 casting were made during this period as recorded by the
counter of the die casting machine. Readings of the gas meter on the furnace were taken at the
beginning and the end of the evaluation. Additional readings were taken at half hour intervals to
identify potential variation in energy use with time. The metal in both the holding and the
melting crucibles was at the same level at the beginning and the end of the experiment.
The level of the molten metal in the melting crucible is controlled by the discharge opening in
the melting crucible. In the holding crucible this level is monitored continuously by a level
sensor. When the level drops below the set point, a signal from the control unit triggers the
charging mechanism and the charging bucket dumps a new charge into the stack.
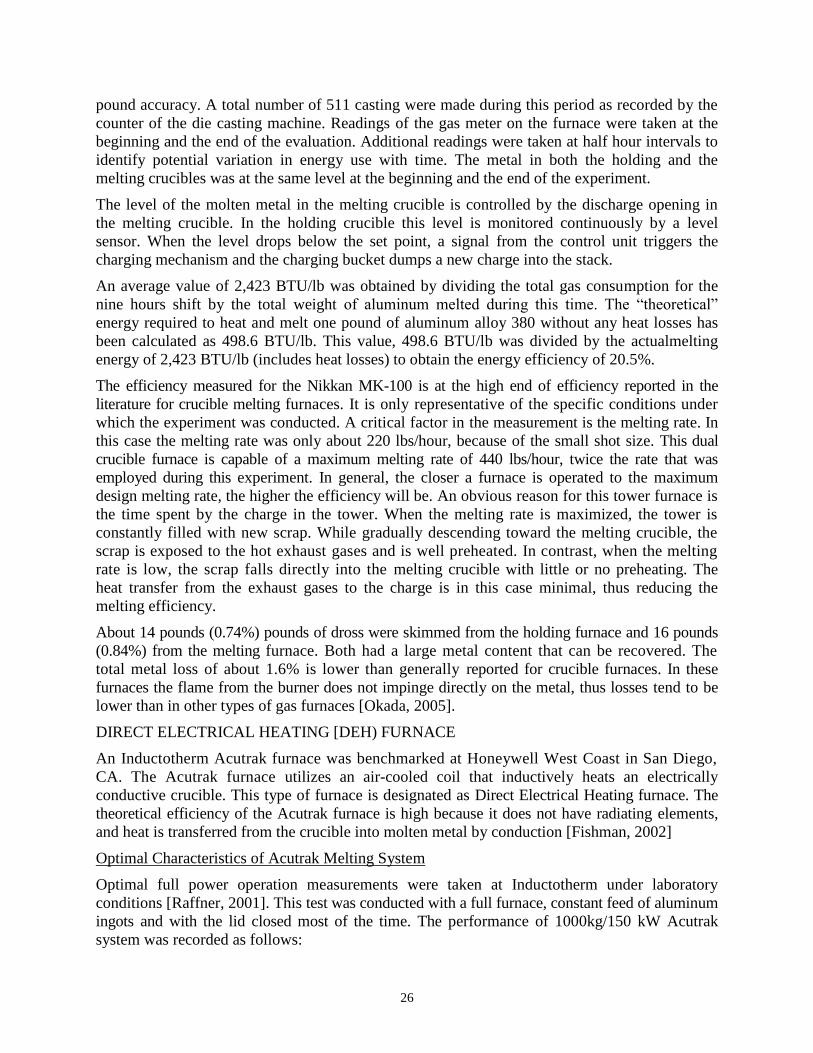
An average value of 2,423 BTU/lb was obtained by dividing the total gas consumption for the
nine hours shift by the total weight of aluminum melted during this time. The “theoretical”
energy required to heat and melt one pound of aluminum alloy 380 without any heat losses has
been calculated as 498.6 BTU/lb. This value, 498.6 BTU/lb was divided by the actualmelting
energy of 2,423 BTU/lb (includes heat losses) to obtain the energy efficiency of 20.5%.
The efficiency measured for the Nikkan MK-100 is at the high end of efficiency reported in the
literature for crucible melting furnaces. It is only representative of the specific conditions under
which the experiment was conducted. A critical factor in the measurement is the melting rate. In
this case the melting rate was only about 220 lbs/hour, because of the small shot size. This dual
crucible furnace is capable of a maximum melting rate of 440 lbs/hour, twice the rate that was
employed during this experiment. In general, the closer a furnace is operated to the maximum
design melting rate, the higher the efficiency will be. An obvious reason for this tower furnace is
the time spent by the charge in the tower. When the melting rate is maximized, the tower is
constantly filled with new scrap. While gradually descending toward the melting crucible, the
scrap is exposed to the hot exhaust gases and is well preheated. In contrast, when the melting
rate is low, the scrap falls directly into the melting crucible with little or no preheating. The
heat transfer from the exhaust gases to the charge is in this case minimal, thus reducing the
melting efficiency.
About 14 pounds (0.74%) pounds of dross were skimmed from the holding furnace and 16 pounds
(0.84%) from the melting furnace. Both had a large metal content that can be recovered. The
total metal loss of about 1.6% is lower than generally reported for crucible furnaces. In these
furnaces the flame from the burner does not impinge directly on the metal, thus losses tend to be
lower than in other types of gas furnaces [Okada, 2005].
DIRECT ELECTRICAL HEATING [DEH) FURNACE
An Inductotherm Acutrak furnace was benchmarked at Honeywell West Coast in San Diego,
CA. The Acutrak furnace utilizes an air-cooled coil that inductively heats an electrically
conductive crucible. This type of furnace is designated as Direct Electrical Heating furnace. The
theoretical efficiency of the Acutrak furnace is high because it does not have radiating elements,
and heat is transferred from the crucible into molten metal by conduction [Fishman, 2002]
Optimal Characteristics of Acutrak Melting System
Optimal full power operation measurements were taken at Inductotherm under laboratory
conditions [Raffner, 2001]. This test was conducted with a full furnace, constant feed of aluminum
ingots and with the lid closed most of the time. The performance of 1000kg/150 kW Acutrak
system was recorded as follows:

27
1. Energy consumption (melt to 1,450°F): E = 388 kWh/T or .173 kWh/lb or 602.
BTU/lb
2. Efficiency = 84.44%
3. Superheat rate Rt = 7.6°F/min (4.2°C/min)
Actual performance in die-cast shop
Inductotherm Acutrak induction melting furnaces are used to deliver molten metal to 700 ton
Buheler die casting machines as illustrated in Figure 22. Ingot feeders are used to charge 17 lbs
ingots into the furnaces. During this experiment the metal was ladled from the furnace every 45
seconds, which required the furnace lid to be opened, therefore losing energy by radiation from
the molten surface. The cycles of the die casting machine, furnace loader and the melting furnace
are synchronized for steady state operation. This production cell also includes a trimming station
and two robots, one for die lubrication and another for part extraction. The efficiency of the
Inductotherm Acutrak DEH aluminum melting furnace shown in Figure 23 was evaluated in the
shop operation situation. The Amprobe AMII Pro Power Analyzer shown in Figure 24 was used
to measure and record the power and energy in kWh.
Figure 22 Die casting cell with ingot loader

28
Figure 23 Inductotherm Acutrak DEH induction aluminum melting furnace
Figure 24 Ampco DM-II Pro power analyzer
The weight of the melted aluminum was monitored by counting the ingots charged, and
multiplying this value by the average weight of the ingots. The energy consumed by the Acutrak
induction furnace as a function of weight of melted aluminum is plotted in Figure 25. The insert
shows the part being cast, weighing 6.6 lbs. It should be noted the plot is fairly linear,
indicating a steady state operation. The experimental results are summarized in Table 4. The
induction furnace used 980BTU/lb at a melting rate of 319 lbs/hour.

29
Figure 25 Inductotherm Accutrak – Energy consumption (kWH)
Table 4 Experimental results of Acutrak benchmarking
Variable Induction Data Collection Time (hrs) 3.2 Total Energy Use (kWh) 288 Total Energy Use (BTU) 983232 Total Al Melted (lbs) 1020 Average Melting Rate (lbs/hr) 319 Average Energy (BTU/hr) 980* # of Shots 149 Energy Efficiency (%) 50.9*
*- w/open lid and 60% rated power
The theoretical energy required to heat and melt one pound of aluminum alloy 380 up to 1,240
degrees Fahrenheit without any heat losses has been calculated as 499.2 BTU/lb. (321.7
KWh/T). This value was obtained by integrating the area under the heat content-Cp vs.
temperature curve of alloy 380 for the temperature range of 60-1,240 degrees Fahrenheit and
adding the latent heat of fusion. The theoretical value, 499.2 BTU/lb was then divided by the actual
melting energies (including heat losses) to obtain the respective energy efficiency of 50.94% for
the induction furnace. Table 2 shows the typical range of thermal efficiency and melt loss for
various melting furnaces. Aluminum induction melting furnaces show the highest efficiency
range of 59-76% and lowest melt losses 0.75-1.25%. DEH furnace is not shown in Table 2. It has
melt loss equal to the induction furnaces, 0.75-1.25% and maximum melting efficiency of 84%.
The melting efficiency obtained in this experiment for the Acutrak furnace at Honeywell is lower
because of two reasons:
1. The furnace was operated without a cover. The open top allows for easy access to the crucible
for both ladling of molten metal and charging of ingots. However, the 33 inches diameter
opening causes convection and radiation losses that affect the efficiency. The thermal image
shown in Figure 26 illustrates the high temperature of the exposed crucible walls and the
molten metal. Use of a lid that would not interfere with the operation of the ladle or ingot loader
would further increase efficiency. Recent measurements conducted by Case Western
30
Reserve University have shown the energy required to hold molten aluminum at 1,300oF in
an open furnace to be double the energy required when the lid was closed. While these
measurements are representative for that specific furnace, they are indicative of the high
losses caused by an open furnace.
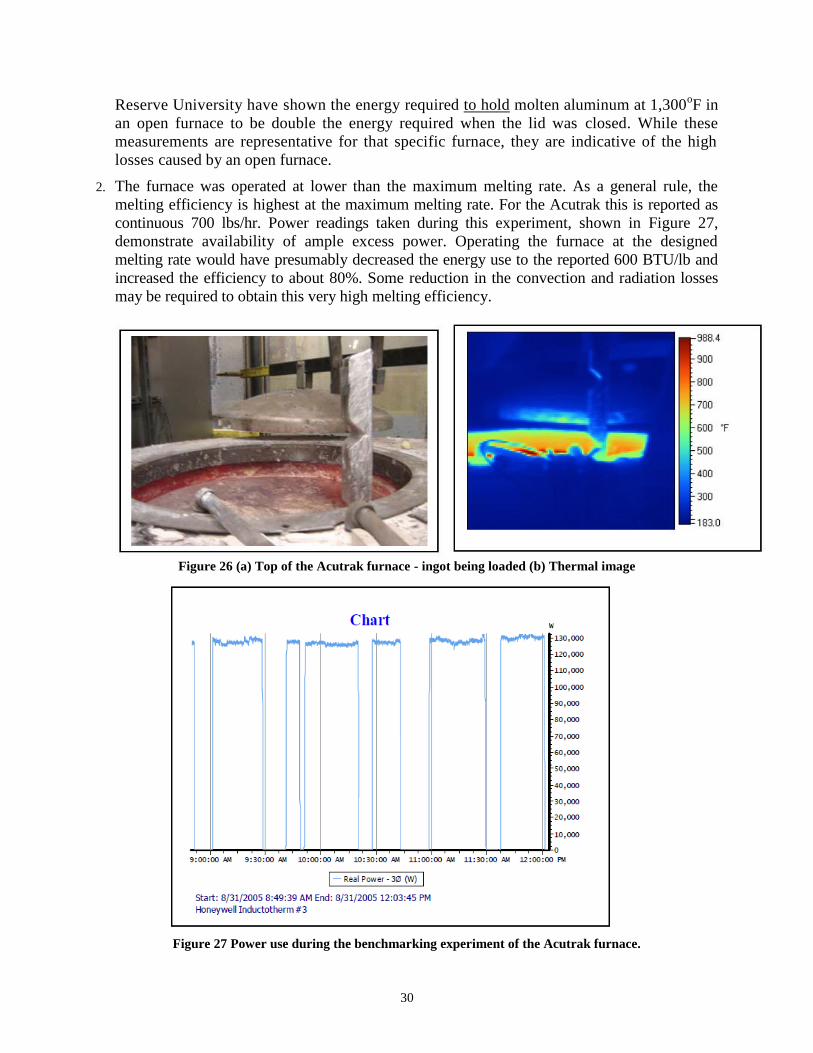
2. The furnace was operated at lower than the maximum melting rate. As a general rule, the
melting efficiency is highest at the maximum melting rate. For the Acutrak this is reported as
continuous 700 lbs/hr. Power readings taken during this experiment, shown in Figure 27,
demonstrate availability of ample excess power. Operating the furnace at the designed
melting rate would have presumably decreased the energy use to the reported 600 BTU/lb and
increased the efficiency to about 80%. Some reduction in the convection and radiation losses
may be required to obtain this very high melting efficiency.
Figure 26 (a) Top of the Acutrak furnace - ingot being loaded (b) Thermal image
Figure 27 Power use during the benchmarking experiment of the Acutrak furnace.

31
HOLDING FURNACES
Data for the 1,100 – 1,400°F holding temperatures was collected and analyzed. The data includes
power ratio, apparent power, real power, reactive power, and the time at which the data was taken.
The temperature spreadsheet contained the bath temperature, ambient temperature, and the time at
which each data point was taken.
COVERED FURNACE
The energy curves for all of the different temperatures are displayed in Figures28. As the holding
temperature increases, more energy is required to keep the metal at the set point.
Figure 28 Holding energy (Covered)(L) and Holding Energy per hour (R)
UNCOVERED FURNACE
The power and energy increased as the holding temperature was raised. The energy curves for
the different temperatures are displayed in Figure 29.
Figure 29 Holding energy (uncovered) (L) and Holding energy per hour (uncovered) (R)

32
COMPARISON — COVERED FURNACE VS. UNCOVERED FURNACE
As anticipated, the uncovered furnace used more energy than the covered furnace to hold
molten metal at the same set point temperature as illustrated in Figure 29. In the 1,100°F
experiment the covered furnace used 55.33 kilowatt hours of electricity. The uncovered
furnace used 142.8 kilowatt hours or 158.1% more energy to hold the same quantity of
molten metal at the same temperature. The 1,200°F covered experiment used a total of 67.1
kilowatt hours over ten hours. The uncovered furnace at 1,200°F used 171.0 kilowatts, or 155.0
% more energy. In the 1,300°F experiment the covered furnace used 83.34 kilowatt hours of
energy. The uncovered furnace used 158.1% more energy, i.e. 215.1 kilowatt hours. In the
1,400°F experiment the covered furnace used 94.39 kilowatt hours of energy. The
uncovered furnace used 182.1% more energy, i.e. 266.3 kilowatt hours as illustrated in Figure
30.
Figure 30 Covered vs. Uncovered (L) and Covered vs. Uncovered (R)
METAL TRANSFER
PHASE I: OPERATING TEMPERATURE CYCLES
While there are many variables in the metal transfer process, this experiment focused on the role
of ladle insulation in reducing heat loss. The difference between using a ladle consecutively
versus allowing it to sit for extended periods of time was also examined. The main goal is to
preserve the highest possible temperature in the molten metal when tapped out into a holding
furnace. This production performance can be captured by the rate of the molten metal
temperature drop during transfer. In other words, the slope of the cooling curve measured in
the molten metal during transfer. The slopes were averaged as best fit lines using starting points
when the ladle was filled and ending at when the ladle was emptied.
The plot in Figure 31 illustrates three consecutive cycles using the "insulated" ladle. This
example clearly demonstrates the tap-in temperature increases as the ladle is used consecutively.
As a result, the tap-out temperature of the metal when poured from the ladles into the holding
furnaces is also hotter. As seen in the graph, the "insulated" ladle preserved heat better than the

33
"standard" ladle as indicated by the decrease in the slopes with each consecutive cycle. The colder
ladle on the first trip caused the aluminum to lose 1.9 degrees per minute more than the third trip
where the ladle had warmed up. The average cycle time between tap-ins from the reverbs is 15
to 20 minutes. That means the metal is between 28.9°F and 38.5°F colder when it is poured into
the holding furnace using a cold ladle instead of one that is warmed by continuous use or
equivalent preheating. In Figure 32 the "standard" ladle sat idle for a minimum of 100 minutes,
where it was allowed to cool, then, the aluminum was tapped into it from the reverb furnace. Next,
it went through the degassing stage, then the dross was skimmed off of the surface. Finally, the
ladle was transported to the holding furnaces where it was tapped out. This cycle was repeated
once more immediately after. In the first cycle the temperature experiences a sharp decrease for
the first two minutes that the aluminum is poured into the cold ladle. The slope for the first two
minutes of filling the ladle was 47.6°F/min showing a 95.2°F drop. This analysis is further
backed by the in temperature before the ladle even finished filling. After the two minute mark,
the temperature drop is slower due to the ladle's heating up. The slope of the curve, between the first
two minutes and emptying, averages 12.50°F/min. During this first transfer cycle the ladle lost a
total of 221.3°F over an 11 minute time frame. The second transfer cycle came immediately after
the first and showed a lower temperature loss rate of -10.67°F/min and a total temperature loss of
117.4°F which is nearly half of the heat loss acquired by transferring molten aluminum in a cold
ladle.
Figure 31 Consecutive molten metal temperature cycles for the "insulated" ladle.

34
Figure 32 Two cycles of heating/cooling in “standard” ladle
A main focus of the experiment was to analyze the effects of the BTU-BlockTm
flexible
insulating layer on the temperature maintaining capability of the ladle. In the comparison
between the "standard" and "insulated" ladles we compared two transfer cycle curves, one
from each ladle to see how much heat was lost comparatively. We chose cycle curves that started
at nearly the same temperature and had nearly identical cycle times of thirteen minutes. The
"standard" ladle averaged a loss of 10.1°F/min while the "insulated" ladle lost only 7.31°F/min.
Over the entire transfer cycle, from reverb to holding furnace, the "insulated" ladle lost 103.1°F
and the "standard" ladle lost 122.4°F. For the total transfer cycle the "standard" ladle was only
84.2% as effective as the "insulated" one in preserving heat. This is also one of the shorter cycle
times collected by the data logger. A larger gap between the effectiveness of the "standard" and
insulated ladles is expected for longer cycle times.
LADLE COOLING EXPERIMENTS
The second phase of the experiment involved measuring the cooling rate of molten aluminum in
three different ladle setups. One ladle "insulated", with the BTU-BlockTm
and the other,
"standard" was not, as shown in Figure 32. The third ladle was a variation of the "insulated" ladle
which had a Fiberfrax ceramic blanket draped over the top to simulate a ladle with a removable
cover (Figure 8).
Each ladle was fitted with a thermocouple and data logger as described in the first phase. The
three ladles were preheated and filled with molten aluminum and allowed to sit for an extended
time until the metal temperature dropped to:1,150°F. The cooling curves provide information on
the heat loss experienced by each ladle configuration. As expected, Figure 33 shows that
increasing the level of insulation decreases heat loss.

35
Figure 33 Effect of insulation and cover lid on molten metal cooling in a transfer ladle
The typical transfer time for one load of molten aluminum is usually around twenty minutes. The
temperature drop after this time frame is therefore most pertinent. During the first twenty minutes
the insulated ladle with the lid has a temperature loss rate of 2.7°F per minute. Comparatively, it
is seen that taking the lid off the insulated ladle will increase the temperature loss by
approximately 1°F/min to 3.7°F/min. The "standard" un-insulated ladle showed an average
temperature loss of 5.2°F/min. Monitoring the temperature losses over the next 40 and 60
minutes showed a decrease in the rate but the trends still continued. The "insulated" and covered
ladle showed loss rates of 2.3 and 2.1°F/min over the first 40 and 60 minutes respectively. Taking
the cover off the insulated ladle showed loss rates of 3.201 and 2.818 over first 40 and 60 minutes
respectively. The "standard", un-insulated ladle lost the most heat during the first 40 and 60
minutes with loss rates at 4.5 and 4.0°F/min respectively. The overall temperature losses are
detailed in Figure 33. Since the cooling curves are examples of exponential decay an overall
average was taken using the 20, 40, 60, and total rates. For the insulated ladle with lid the
average was 2.3 °F/min. Slightly higher than that is the insulated ladle without the lid, which had
an average of 3.0 °F/min. Finally, the uninsulated, uncovered ladle had nearly double the loss rate
of the covered, insulated ladle with a loss rate of 4.4°F/min. Similar differences can be observed
by the thermal imaging (Figure 34). The side view of the insulated ladle with the lid shows a
maximum temperature of z: 300 °F and an overall darker hue of blue than that of the uninsulated
ladle. The "standard" uninsulated ladle has an outer shell maximum temperature of z: 600°F and
an overall lighter blue hue signifying an overall higher shell temperature. It is apparent that the

36
"standard" uninsulated ladle allows more heat to penetrate into the walls of the ladle while the
"insulated" with cover ladle allowed for less heat transfer into the shell.
Figure 34 Infrared images of ladle during cooling
METAL CLEANLINESS EVALUATION
K-Mold
Representative fractured surfaces and the K-values of the baseline samples are reported in Figure
35. The Virgin, Type I Scrap, and Concentrated Scrap samples have the K-value of 0.15, 0.20,
and 2.0, respectively. Several large inclusions can be obviously observed in the Concentrated
Scrap samples, Figure 35d, but not in the other samples, Figure 35a-c.
Figure 35 Fractured surfaces and K-value of (a) the Virgin, (b) Type I Scrap, (c) Die Casting and (d) the
Concentrated Scrap.
In practice, the molten metal with the K-value below 0.5 may be considered “clean” and
acceptable in most applications, and with the K-value over 0.5, metal treatments to clean the melt
are required before casting [Kitaoka, 2001]. Using this criterion, the results show that both the
Virgin and Type I Scrap samples are acceptably clean. It is, however, important to point out that
the K-values only report the large inclusions, which can be clearly identified by naked eyes. The
K-values tend to exclude the finer inclusions.
(b)
(a)
K=0.15 K=0.20
(c)
K=0.20
(d)
K=2.0
37
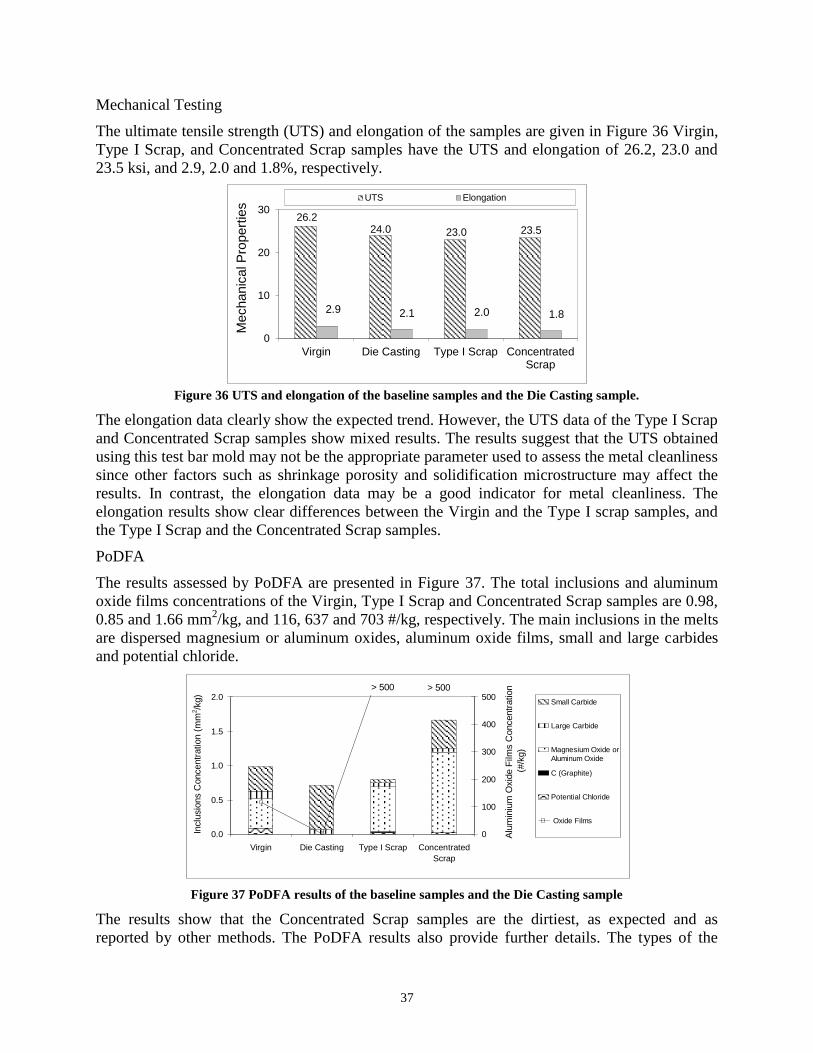
Mechanical Testing
The ultimate tensile strength (UTS) and elongation of the samples are given in Figure 36 Virgin,
Type I Scrap, and Concentrated Scrap samples have the UTS and elongation of 26.2, 23.0 and
23.5 ksi, and 2.9, 2.0 and 1.8%, respectively.
Figure 36 UTS and elongation of the baseline samples and the Die Casting sample.
The elongation data clearly show the expected trend. However, the UTS data of the Type I Scrap
and Concentrated Scrap samples show mixed results. The results suggest that the UTS obtained
using this test bar mold may not be the appropriate parameter used to assess the metal cleanliness
since other factors such as shrinkage porosity and solidification microstructure may affect the
results. In contrast, the elongation data may be a good indicator for metal cleanliness. The
elongation results show clear differences between the Virgin and the Type I scrap samples, and
the Type I Scrap and the Concentrated Scrap samples.
PoDFA
The results assessed by PoDFA are presented in Figure 37. The total inclusions and aluminum
oxide films concentrations of the Virgin, Type I Scrap and Concentrated Scrap samples are 0.98,
0.85 and 1.66 mm2/kg, and 116, 637 and 703 #/kg, respectively. The main inclusions in the melts
are dispersed magnesium or aluminum oxides, aluminum oxide films, small and large carbides
and potential chloride.
Figure 37 PoDFA results of the baseline samples and the Die Casting sample
The results show that the Concentrated Scrap samples are the dirtiest, as expected and as
reported by other methods. The PoDFA results also provide further details. The types of the
26.2 24.0 23.0 23.5
2.9 2.1 2.0 1.8
0
10
20
30
Virgin Die Casting Type I Scrap ConcentratedScrap
Mechanic
al P
ropert
ies UTS Elongation
0.0
0.5
1.0
1.5
2.0
Virgin Die Casting Type I Scrap Concentrated
Scrap
Inclu
sio
ns C
oncentr
ation (
mm
2/k
g)
0
100
200
300
400
500
Alu
min
ium
Oxid
e F
ilms C
oncentr
ation
(#/k
g)
Small Carbide
Large Carbide
Magnesium Oxide or
Aluminum Oxide
C (Graphite)
Potential Chloride
Oxide Films
> 500 > 500

38
inclusions are given quantitatively. This information is useful in determining the major sources
of inclusions, which will allow appropriate actions to be done to resolve the problems. In this
case, the oxide films may be the major sources that cause low UTS and elongation in the Type I
Scrap and Concentrated Scrap metals.
Application of the Methods in a Die Casting Plant
The K-value, the UTS, and the elongation of the Die Casting samples are 0.20, 24.0 ksi, and
2.1%, respectively, Figure 36. The K-value is comparable with that of the Virgin and Type I
Scrap samples. Based on this K-mold method, the results show that metal used in this die casting
plant is considered clean.
The UTS and elongation of the Die Casting sample are as one would expect. Since in this die
casting operation some scrap metals are mixed with virgin ingots, the UTS and elongation values
of the metal are in between the values of the Virgin and Type I Scrap samples.
The PoDFA results, Figure 37, indicate that the metal is quite clean, with the lowest inclusions
concentration and the lowest aluminum oxide films concentration. However, the PoDFA results
of the Die Casting sample should not be compared directly with those from the baseline
laboratory experiments since the assessment procedures are different. There are several factors
that contribute to the differences. One is the fact that the Die Casting sample was obtained from a
very large pool of metal (10,000 kg), instead of 100-kg melt. The amounts of oxide skins in the
baseline samples are expected to be higher. Modifications of the PoDFA laboratory testing are
needed before a direct comparison can be made [Cannulo, 2003].
4. BENEFITS ASSESMENT
The results of this research will produce energy savings through the improved process and
handling of the aluminum melt used in the die casting process. In addition, this work focused on
improving the quality of the melt. The results of this work were predicted to bring about an
average energy savings of 4.4 trillion BTU’s/year over a 10 year period. Current (2012) annual
energy saving estimates, based on commercial introduction in 2009, a market penetration of 90%
by 2022 is 4.25 trillion BTU’s/year.
Along with these energy savings, a reduction of the environmental emissions associated with the
melting and pouring of aluminum will be saved as a result of this effort. The average annual
estimate of CO2 reduction per year through 2022 is 0.084 Million Metric Tons of Carbon
Equivalent (MM TCE).
5. COMMERCIALIZATION
This project had a very applied focus. It had to be carried out by definition at die casting plants.
CWRU worked with many die casters to benchmark the energy efficiency of a wide range of
aluminum melting and holding furnaces: Spartan Light Metal, Sparta IL; Mercury Marine, Fond
du Lac WI; Empire Die Casting, Macedonia OH, Ryobi Die Casting, Shelbyville, IN,
Honeywell, San Diego CA, Pressure Cast Products, Oakland CA, Eck Industries, Manitowoc WI,
General Die Casters, Peninsula OH and Gibbs Die Casting in Henderson, KY.
During the project period, the price of natural gas spiked to $15/thousand cubic feet as illustrated
in Figure 38. At this price level, the interest in the project was very high. Many companies
contemplated efficiency upgrades in melting and holding furnaces as well as molten metal
transfer. In order to make intelligent decision, these companies needed data on the energy

39
efficiency and melt losses of various furnaces. The study benchmarked melting and holding
equipment and was well position to provide this kind of information.
Figure 38 Historic NYMEX price of natural gas 1984-2012.
The trends in energy production and the cost of natural gas tend to vary widely, but the benefits
of improving energy efficiency will always be there. It is therefore important to continue
educating the die casters on methods for increasing energy efficiency of the melting and holding
operation.
6. ACCOMPLISHMENTS
The project was successful in benchmarking various melting, holding and molten metal transfer
types of equipment. It also collected information on melt losses of these furnaces.
It established good collaborations among furnace suppliers, Case Western Reserve University
and NADCA. In effort to bring as much information as possible to the die casters, the project
initiated a series of Workshops under NADCA sponsorship. These one-day Workshops traveled
to various die casting plants and were very well attended, with an average of 40-50 participants.
Among the Workshop sites were:
Empire Die Casting – Macedonia, OH
Mercury Marine – Fond du Lac, WI
Nemak – Sylacauga, Al
Ryobi Die Casting, Shelbyville, IN
Edelbrock, Hemet, CA
The education and technology transfer facilitated by these Workshop provided good value, as
documented in surveys completed by the participants.
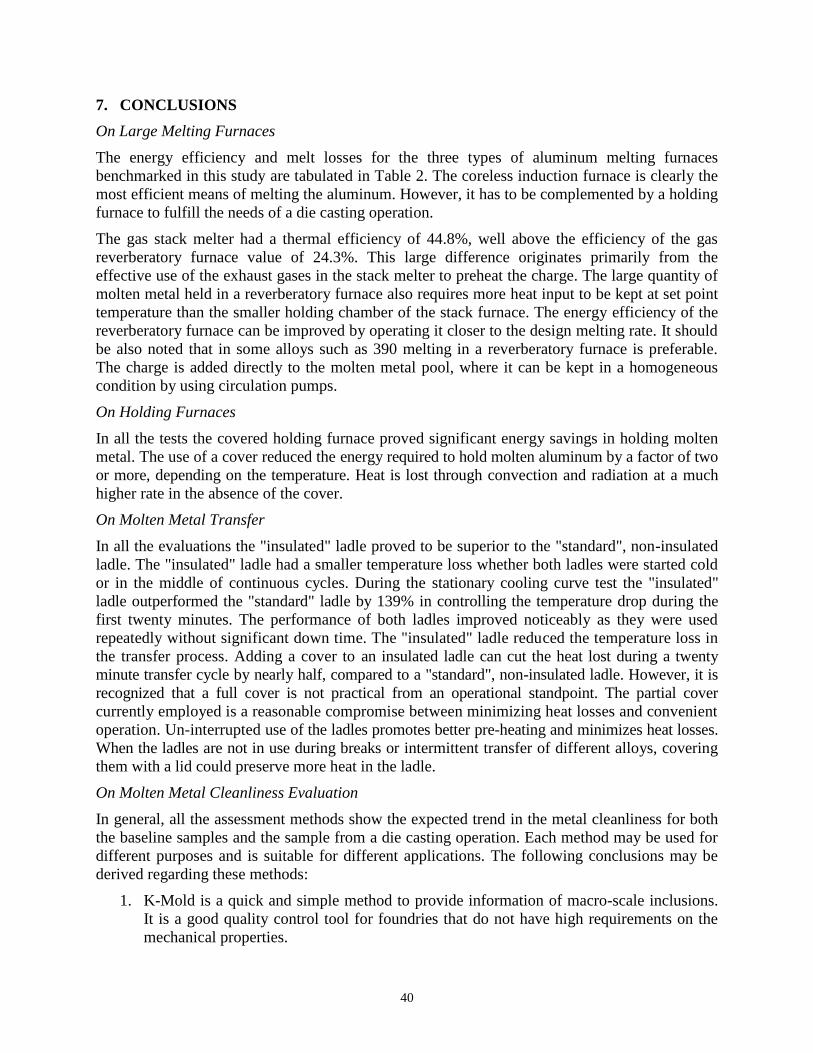
40
7. CONCLUSIONS
On Large Melting Furnaces
The energy efficiency and melt losses for the three types of aluminum melting furnaces
benchmarked in this study are tabulated in Table 2. The coreless induction furnace is clearly the
most efficient means of melting the aluminum. However, it has to be complemented by a holding
furnace to fulfill the needs of a die casting operation.
The gas stack melter had a thermal efficiency of 44.8%, well above the efficiency of the gas
reverberatory furnace value of 24.3%. This large difference originates primarily from the
effective use of the exhaust gases in the stack melter to preheat the charge. The large quantity of
molten metal held in a reverberatory furnace also requires more heat input to be kept at set point
temperature than the smaller holding chamber of the stack furnace. The energy efficiency of the
reverberatory furnace can be improved by operating it closer to the design melting rate. It should
be also noted that in some alloys such as 390 melting in a reverberatory furnace is preferable.
The charge is added directly to the molten metal pool, where it can be kept in a homogeneous
condition by using circulation pumps.
On Holding Furnaces
In all the tests the covered holding furnace proved significant energy savings in holding molten
metal. The use of a cover reduced the energy required to hold molten aluminum by a factor of two
or more, depending on the temperature. Heat is lost through convection and radiation at a much
higher rate in the absence of the cover.
On Molten Metal Transfer
In all the evaluations the "insulated" ladle proved to be superior to the "standard", non-insulated
ladle. The "insulated" ladle had a smaller temperature loss whether both ladles were started cold
or in the middle of continuous cycles. During the stationary cooling curve test the "insulated"
ladle outperformed the "standard" ladle by 139% in controlling the temperature drop during the
first twenty minutes. The performance of both ladles improved noticeably as they were used
repeatedly without significant down time. The "insulated" ladle reduced the temperature loss in
the transfer process. Adding a cover to an insulated ladle can cut the heat lost during a twenty
minute transfer cycle by nearly half, compared to a "standard", non-insulated ladle. However, it is
recognized that a full cover is not practical from an operational standpoint. The partial cover
currently employed is a reasonable compromise between minimizing heat losses and convenient
operation. Un-interrupted use of the ladles promotes better pre-heating and minimizes heat losses.
When the ladles are not in use during breaks or intermittent transfer of different alloys, covering
them with a lid could preserve more heat in the ladle.
On Molten Metal Cleanliness Evaluation
In general, all the assessment methods show the expected trend in the metal cleanliness for both
the baseline samples and the sample from a die casting operation. Each method may be used for
different purposes and is suitable for different applications. The following conclusions may be
derived regarding these methods:
1. K-Mold is a quick and simple method to provide information of macro-scale inclusions.
It is a good quality control tool for foundries that do not have high requirements on the
mechanical properties.

41
2. Mechanical testing can provide both qualitative and quantitative information of the metal
cleanliness. The results suggest that the elongation data is a more appropriate parameter.
Modifications of the mold to minimize shrinkage porosity, the effects of solidification
microstructure, and the other factors on the properties are recommended.
3. PoDFA is a good tool for identifying the major types of inclusions. Modifications of the
testing procedures are needed if it is to be used with different sample sizes.
8. RECOMMENDATIONS
While the energy efficiency of the furnace is of paramount importance to the profitability of the
die casting operation, the cost associated with melt losses can take an even larger toll. At this
time there is no standard for evaluating the melt losses of various furnaces. Such a standard
would go a long way in facilitating better decisions in purchasing and operating melting
equipment and should be developed. This recommendation is based on many inputs from die
casters and equipment manufacturers who participated in the study.
9. BIBLIOGRAPHY
Beichner, F. L., “Efficiency Evaluation of Melting Aluminum Furnaces,” Light Metals (2002)
Canullo, M.V., Jaitman Labaton, M.F., and Acuna Laje, R., “Cleanliness of Primary A356 Alloy:
Interpretation and Standardization of PoDFA Laboratory Measurements,” Aluminum Cast House
Technology – Eight Australian Conference (2003)
Kennedy, S., “Aluminum Melting and Metal Quality Processing Technology for Continuous High Quality
Castings,” Sixth International AFS Conference: Molten Aluminum Processing, Orlando, FL (2001)
Kitaoka, S., “Evaluation of the Melt Cleanliness by K-Mold Test,” Light Metals 2001 Metaux Legers
(2001)
Krohn, B. R., “Melting Aluminum, Part 1: Economics,” Modern Casting, vol 74, pp 44 (1984)
Lange, E., “Stack Melter or Reverb…Choosing a New Central Melter,” Die Casting Engineer, July –
August (1994)
Liu, L. and Samuel, F. H., “Assessment of melt cleanliness in A356.2 aluminum casting alloy using the
porous disc filtration apparatus technique. Part I: Inclusion Measurements,” Journal of Materials Science,
vol 32 (1997).
Neff, D.V., “Principles of Molten Metal Processing for Improving Die Cast Quality,” Trans. of the 16th
International Die Casting Congress and Exposition, Detroit (1991).
Neff, D. V., “Methodologies for Evaluating Filtering Efficiency in Aluminum Casting Processes,”
SixthInternational AFS Conference: Molten Aluminum Processing, Orlando, FL (2001)
Smith, L., “The Recovery of Aluminum Process Scrap by Coreless Induction Melting,” Aluminum
Technology (1986)
[1] Neff, D.V., “Principles of Molten Metal Processing for Improving Die Cast Quality,” Trans. of the
16th International Die Casting Congress and Exposition, Detroit (1991).
[2] Kitaoka, S., “Evaluation of the Melt Cleanliness by K-Mold Test,” Light Metals Metaux Legers
(2001).
[3] Liu, L. and Samuel, F. H., “Assessment of melt cleanliness in A356.2 aluminum casting alloy using
the porous disc filtration apparatus technique. Part I: Inclusion Measurements,” Journal of Materials
Science, Vol. 32 (1997).
[4] Canullo, M.V., Jaitman Labaton, M.F., and Acuna Laje, R., “Cleanliness of Primary A356 Alloy:
Interpretation and Standardization of PoDFA Laboratory Measurements,” Aluminum Cast House
Technology – Eight Australian Conference (2003).