FINAL PROGRAMMATIC REPORT- JOLIET ARSENAL PRAIRIE (IL ...
37
0 FINALPROGRAMMATICREPORT - JOLIETARSENALPRAIRIE(IL) PROJECT April1, 1995 - September30,1998 ThefollowingreportsummarizesallprogrammaticactivitiesfortheJolietArsenalPrairie(IL) Project(#95-123)forthefullprojectperiod,April1,1995throughSeptember30,1998 . OBJECTIVES 1)Establishbaselinedataforgrasslandbirdpopulationsatthemajorstudyareas . 2)Establishbaselinenestsuccessratesforgrasslandbirdpopulationsatthemajorstudyareas . 3)Comparethesuitabilityofnativeprairie,restoredprairie,andnon-prairiegrasslandsforgrasslandbird conservationefforts . 4)Evaluateimpactsofcommongrasslandmanagementpracticesongrasslandbirdabundanceand productivity (e .g ., burning,mowing,grazing,idle) . 5)Assesstheeffectsofwoodyvegetationongrasslandbirdabundanceandproductivity . 6)Evaluatetheimpactsofedgesongrasslandbirdabundanceandproductivity . 7)Evaluatetheinfluenceoflandscapeattributesongrasslandbirdproductivity . STUDYAREAS Researchwasconductedatfivemajorstudyareaswhichcontainedawiderangeofgrasslandtypes includinghighqualitynativeprairie,degradednativeprairie,restoredprairieandnon-nativecool-season grassfields .Grasslandsinthemajorstudyareasweresubjectedtoavarietyofmanagementregimes includingprescribedburning,grazingandmowingduringthestudyperiod .Therewasalsoawiderange ofdegreeofwoodyencroachmentonvariouspartsofthesestudyareas,rangingfromopenareasthat haveundergoneextensivebrushcuttingandburningtoareasthatweremoderatelytoseverelyovergrown withinvadingwoodyvegetation . Inadditiontothefivemajorstudyareas,limitedcensuringwasconductedatthreesatelliteareasin 1995 .Nestsearchingwasconductedatonesatellitestudyarea(CollinsStationPrairie)in1995 .All satelliteareaswerenativeprairieand/orsavannahabitats .Amapshowingtheapproximatelocationof studyareasisshowninFig .1 . MajorStudyAreas (1)GooseLakePrairie(GLP),GrundyCounty ;ApproximateSize :1000ha . (2)DesPlainesConservationArea(DPCA),WillCounty ;ApproximateSize :1300ha . (3)MidewinNationalTallgrassPrairie(MIDW)(formerlytheJolietArsenalandAmmunition Plant),WillCounty ;ApproximateSize9500ha(roughly2500hapresentlyingrassland habitat) . (4)JolietTrainingArea(JTA),WillCounty ;ApproximateSize1400ha . (5)NachusaGrasslands(NACH),LeeCounty ;ApproximateSize405ha . SatelliteStudyAreas (1)BraidwoodDunesandSavanna(BDS),ApproximateSize :110ha. (2)CollinsStationPrairie(CSP),ApproximateSize :260ha. (3)SandRidgeSavanna(SRS),ApproximateSize :95ha. FIELDMETHODS BirdCensusing Birdpopulationsatallsiteswerecensusedusingpointcounts .Countsfollowednationally establishedpointcountprocedures(Ralphetal .1992,1993) .Countswereconductedateachpointfor fiveminutes,withsubtotalstabulatedforthefirstthree,andsecondtwominutesseparately(Ralphetal . 1992,1993) .Pointcountstabulatedallbirdsrecordedwithin100mofthepointseparatelyfrombirds recordedfromgreaterdistances .Pointsweredistributedamongstudyareassoastosampleallavailable 1
Transcript of FINAL PROGRAMMATIC REPORT- JOLIET ARSENAL PRAIRIE (IL ...

0 FINAL PROGRAMMATIC REPORT - JOLIET ARSENAL PRAIRIE (IL) PROJECTApril 1, 1995 - September 30, 1998
The following report summarizes all programmatic activities for the Joliet Arsenal Prairie (IL)Project (#95-123) for the full project period, April 1, 1995 through September 30, 1998 .
OBJECTIVES1) Establish baseline data for grassland bird populations at the major study areas .2) Establish baseline nest success rates for grassland bird populations at the major study areas .3) Compare the suitability of native prairie, restored prairie, and non-prairie grasslands for grassland bird
conservation efforts .4) Evaluate impacts of common grassland management practices on grassland bird abundance and
productivity (e.g ., burning, mowing, grazing, idle) .5) Assess the effects of woody vegetation on grassland bird abundance and productivity .6) Evaluate the impacts of edges on grassland bird abundance and productivity .7) Evaluate the influence of landscape attributes on grassland bird productivity .
STUDY AREASResearch was conducted at five major study areas which contained a wide range of grassland types
including high quality native prairie, degraded native prairie, restored prairie and non-native cool-seasongrass fields. Grasslands in the major study areas were subjected to a variety of management regimesincluding prescribed burning, grazing and mowing during the study period . There was also a wide rangeof degree of woody encroachment on various parts of these study areas, ranging from open areas thathave undergone extensive brush cutting and burning to areas that were moderately to severely overgrownwith invading woody vegetation .
In addition to the five major study areas, limited censuring was conducted at three satellite areas in1995. Nest searching was conducted at one satellite study area (Collins Station Prairie) in 1995 . Allsatellite areas were native prairie and/or savanna habitats . A map showing the approximate location ofstudy areas is shown in Fig . 1 .Major Study Areas
(1) Goose Lake Prairie (GLP), Grundy County ; Approximate Size: 1000 ha .(2) Des Plaines Conservation Area (DPCA), Will County; Approximate Size : 1300 ha .(3) Midewin National Tallgrass Prairie (MIDW) (formerly the Joliet Arsenal and Ammunition
Plant), Will County; Approximate Size 9500 ha (roughly 2500 ha presently in grasslandhabitat) .
(4) Joliet Training Area (JTA), Will County ; Approximate Size 1400 ha .(5) Nachusa Grasslands (NACH), Lee County ; Approximate Size 405 ha .
Satellite Study Areas(1) Braidwood Dunes and Savanna (BDS), Approximate Size : 110 ha.(2) Collins Station Prairie (CSP), Approximate Size : 260 ha.(3) Sand Ridge Savanna (SRS), Approximate Size : 95 ha.
FIELD METHODSBird Censusing
Bird populations at all sites were censused using point counts . Counts followed nationallyestablished point count procedures (Ralph et al . 1992, 1993) . Counts were conducted at each point forfive minutes, with subtotals tabulated for the first three, and second two minutes separately (Ralph et al .1992, 1993). Point counts tabulated all birds recorded within 100 m of the point separately from birdsrecorded from greater distances . Points were distributed among study areas so as to sample all available
1

habitats. Points were not placed in areas where two or more habitats adjoined, and were at least 250 mfrom one another (Ralph et al . 1992, 1993) . Points were usually visited twice per season . The first visitbetween May 10-June 10, and the second visit between June 11- July 10. Between 120 - 254 censuspoints were established annually in the major and satellite study areas 1995-1997 (Table 1) . In 1997, theeffects of roads on bird distributions were assessed using 3-ha strip transects . Transects 150 m in lengthand 200 m in width (100 m on either side of the center line) were run perpendicular to roads . All birdsencountered were plotted and summaries were calculated for each 25-m interval along the transect .
Nest MonitoringNest searches began in May and continued until early August . Nests were located by intensive
surveys using rope-dragging, walking searches and behavioral observations. Once nests were located, thecontents were checked every three days until the nest fledged, was depredated, or was abandoned . Weused the Mayfield (1975) index to estimate daily predation rates for the incubation and nestling periodscombined . For each species, we used all nests over all years to obtain baseline nest parasitism levels (%of nests parasitized) and daily predation rates (% of nest contents eaten by predators per day) for eachsite .
Vegetation SamplingFive vegetation variables were recorded at most point count stations . The five vegetation variables
were :(1) Grass Composition: estimate of the predominant grass cover type within the 100 m radius circle
centered on the census point . Major categories were Native Prairie, Restored Prairie, Non-prairieconservation grasslands, and agricultural grasslands (pastures and hayfield).
(2) Management Status : the management status recorded as either burned (burned since the end of thelast breeding season), mowed (mowed within the last 12 months), grazed (grazed immediately priorto or during the current breeding season), or idle (undisturbed for at least 12 months prior to the startof the breeding season, 1 May) .
(3) Vegetation Height/Density : estimates of vegetation height/density were collected by obtaining VisualObstruction Readings (VOR) as measured with a Robel Pole (Robel et al . 1970) .
(4) Litter Depth : measured in cm by meter stick at random locations surrounding the census point .(5) Shrub Density : the density (number of stems) of woody vegetation i2 m in height within 100 m of
the census point.
Landscape AttributesThree measures of landscape composition were included in analyses of landscape effects on
grassland bird productivity . Landscape parameters were calculated at the field level using GIS and theIllinois Land Cover data base developed by the Illinois Natural History Survey (IDNR 1996) .(1) Percent Cover of Grasslands (1, 3, and 5 km), amount of grassland habitat within one, three and five
km radii of the center of the field .(2) Percent Cover Woody Habitat (1, 3, and 5 km), amount of woody habitat (shrubland and woodland)
within one, three, and five km radii of the center of the field .(3) Percent Cover Agricultural Row Crops (1, 3, and 5 km), amount of row crops (corn, beans, and small
grains) within one, three, and five km radii of the center of the field .
Analytical MethodsAnalyses of census data included only data from the study areas listed in Table 1, except for the
analyses focused on the effects of roads on bird distribution patterns which included data collected in1997 at the Savanna Army Depot (Carroll and Jo Daviess counties) . Only birds encountered within 100m of the census point were included in census summaries and analysis .
2

Baseline nest data included data only from the study areas listed in Table 1 . Analyses of edge andlandscape effects include nest data collected in 1997 at Green River Conservation Area (Lee County) andthe Savanna Army Depot. The edge analyses included data for grassland passerines whose nests werelocated either on the ground or within a half meter of the ground . All Dickcissel nests were also includedin these analyses regardless of height.
RESULTS AND DISCUSSIONOBJECTIVE #1 :Establish baseline data for grassland bird populations at the major study areas .
Ninety-nine species of birds were recorded at point counts during the study . A complete listing ofbirds recorded at census points within each area is included in Table 2 . Red-winged blackbirds were themost widespread species occurring at 78% of all point count stations . Other commonly encounteredspecies, in decreasing order of abundance, were Eastern Meadowlarks (74% of all point count stations),Song Sparrows (64%), Grasshopper Sparrows (62%), Field Sparrows (59%), Common Yellowthroats(52%), American Goldfinches (46%), Bobolinks (39%), Dickcissels (38%), and Eastern Kingbirds(37%). Only six species (Red-winged Blackbird, American Goldfinch, Field Sparrow, Song Sparrow,Common Yellowthroat, and Brown Thrasher) were recorded at all five major and three satellite sites .Twenty-eight species were recorded at just one site (Table 2) .
Overall, bird communities at these sites differed from one another by a considerable degree . Birdcommunity similarities among major study areas ranged from 35 - 71%. Pair wise bird communitysimilarities among major study areas were Des Plaines Conservation Area-Goose Lake Prairie 60%, DesPlaines Conservation Area-Midewin National Tallgrass Prairie 53%, Des Plaines Conservation Area-Joliet Training Area 47%, Des Plaines Conservation Area-Nachusa Grasslands 71%, Goose Lake Prairie-Midewin National Tallgrass Prairie 50%, Goose Lake Prairie-Joliet Training Area 65%, Goose LakePrairie-Nachusa Grasslands 51%, Midewin National Tallgrass Prairie-Joliet Training Area 35%,Midewin National Tallgrass Prairie-Nachusa Grasslands 56%, Joliet Training Area-Nachusa Grasslands52%.
Bird species densities also differed significantly among sites (Table 3). Estimated densities ofUpland Sandpipers, Bobolinks, Eastern Meadowlarks, Savannah Sparrows, Grasshopper Sparrows, andDickcissels were highest at Midewin National Tallgrass Prairie . Des Plaines Conservation Areacontained the highest estimated densities of Eastern Kingbirds, Orchard Orioles, Common Grackles,Henslow's Sparrows, Field Sparrows, Indigo Buntings, Brown Thrashers, House Wrens, and AmericanRobins . Sedge Wrens were most abundant at Goose Lake Prairie . Nachusa Grasslands supported thehighest densities of Ring-Necked Pheasants, Yellow Warblers, and Gray Catbirds . Estimated densities ofWillow Flycatchers, Brown-headed Cowbirds, Red-winged Blackbirds, American Goldfinches, SongSparrows, Common Yellowthroats, and House Wrens were greatest at the Joliet Training Area .
OBJECTIVE #2:Establish baseline nest success rates for grassland bird populations at the major studyareas .Predation was the leading cause of nest failure accounting for 89 .5% of all nest losses . Other causes
of nest loss included, abandonment 6 .3%, trampling by livestock 2.1%, mowing <1%, and weather <1% .Daily predation rates were considerably higher on grassland nesting species than on shrubland nestingspecies within project grasslands (F = 21 .4, 1,105 df, P < 0.0001 ; Table 4) . Adjusted daily predation ratesfor shrubland species within project grasslands was 4 .8% compared to 7 .6% for grassland species .
Daily predation rates for individual species within project grasslands are shown in Table 4 .c
Predation rates were marginally different among study areas (F = 2 .66, 3,102 df, P = 0 .051). Adjusteddaily predation rates were highest at Goose Lake Prairie/Collins Station Prairie (7.2%), and lowest atMidewin National Tallgrass Prairie (5 .1%). Des Plaines Conservation Area (6 .2%) and NachusaGrasslands (6 .3%) had adjusted daily predation rates that were intermediate between Goose LakePrairie/Collins Station Prairie and Midewin National Tallgrass Prairie .
3

0
Cowbird parasitism rates among species ranged from 0% for three species (Gray Catbird, SavannahSparrow, Vesper Sparrow) to a high of 54% for Bell's Vireos (Table 5) . Cowbird parasitism ratesdiffered significantly among project areas (x2 = 45 .98, 3 df, P < 0 .001). Overall nest parasitism rateswere highest at Nachusa Grasslands and lowest at Midewin National Tallgrass Prairie (Table 5) .
OBJECTIVE #3 :Compare the suitability of native prairie, restored prairie, and non-prairie grasslandsfor grassland bird conservation efforts .Twenty-one of the 25 most commonly encountered species were significantly influenced by
grassland cover types (Table 6). Upland Sandpipers, Bobolinks, Eastern Meadowlarks, SavannahSparrows, Grasshopper Sparrows, and Dickcissels were all most abundant in agricultural grasslands(pastures and hayfields) within project areas . Grasslands dominated by native warm-season grassescontained the highest average densities of Ring-necked Pheasants, Willow Flycatchers, Brown-headedCowbirds, Red-winged Blackbirds, Common Grackles, Song Sparrows, Common Yellowthroats, andSedge Wrens. Orchard Orioles American Goldfinches, Henslow's Sparrows, Field Sparrows, IndigoBuntings, Yellow Warblers, Gray Catbirds, Brown Thrashers, House Wrens, and American Robinsattained their highest average densities in field dominated by non-native cool-season grasses .
Twelve species had densities that differed significantly among native and restored warm-seasongrass fields (Table 7) . Eastern Kingbirds, Willow Flycatchers, Bobolinks, Red-winged Blackbirds,Eastern Meadowlarks, Field Sparrows, Yellow Warblers, Gray Catbirds, and Sedge Wrens weresignificantly more abundant in native warm-season grasslands than in restored warm-season grass fields .Only three species (Ring-necked Pheasant, Grasshopper Sparrow and Savannah Sparrow) weresignificantly more abundant in restored warm-season grass plantings than they were in native warm-season grasslands .
OBJECTIVE#4: Evaluate impacts of common grassland management practices on grassland birdabundance and productivity (e .g., burning, mowing, grazing, idle) .Management also had a significant effect on birds within project grasslands . Twenty of the twenty-
five most commonly encountered species were significantly influenced by grassland management (Table8). Thirteen of these 20 species were most numerous in idle grasslands (grasslands not disturbed bymanagement within the previous 12 months) . Upland Sandpipers, Eastern Kingbirds, EasternMeadowlarks, Savannah Sparrows, and Grasshopper Sparrows were most abundant in grazed grasslands .Mowed grasslands contained the highest average densities of Bobolinks and Dickcissels . Ring-neckedPheasants and Willow Flycatchers were most abundant in grasslands that had been recently burned(Table 8) .
OBJECTIVE #5: Assess the effects of woody vegetation on grassland bird abundance and productivity .A. Grassland Bird Abundance
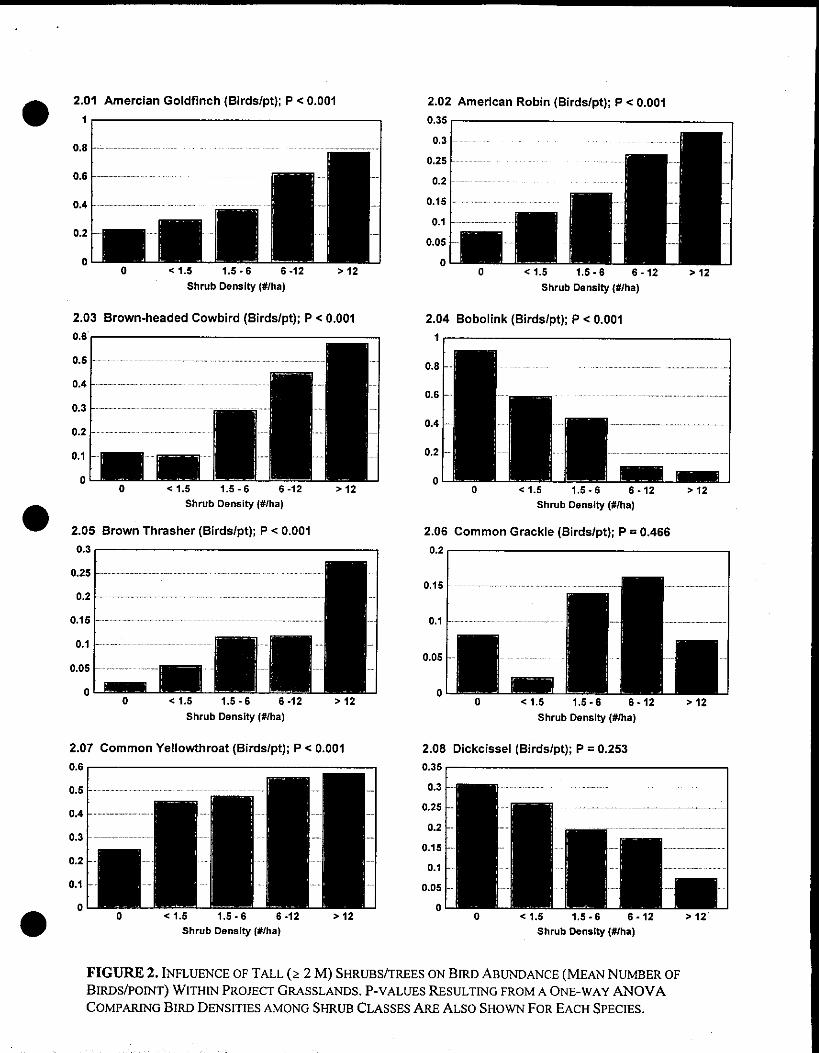
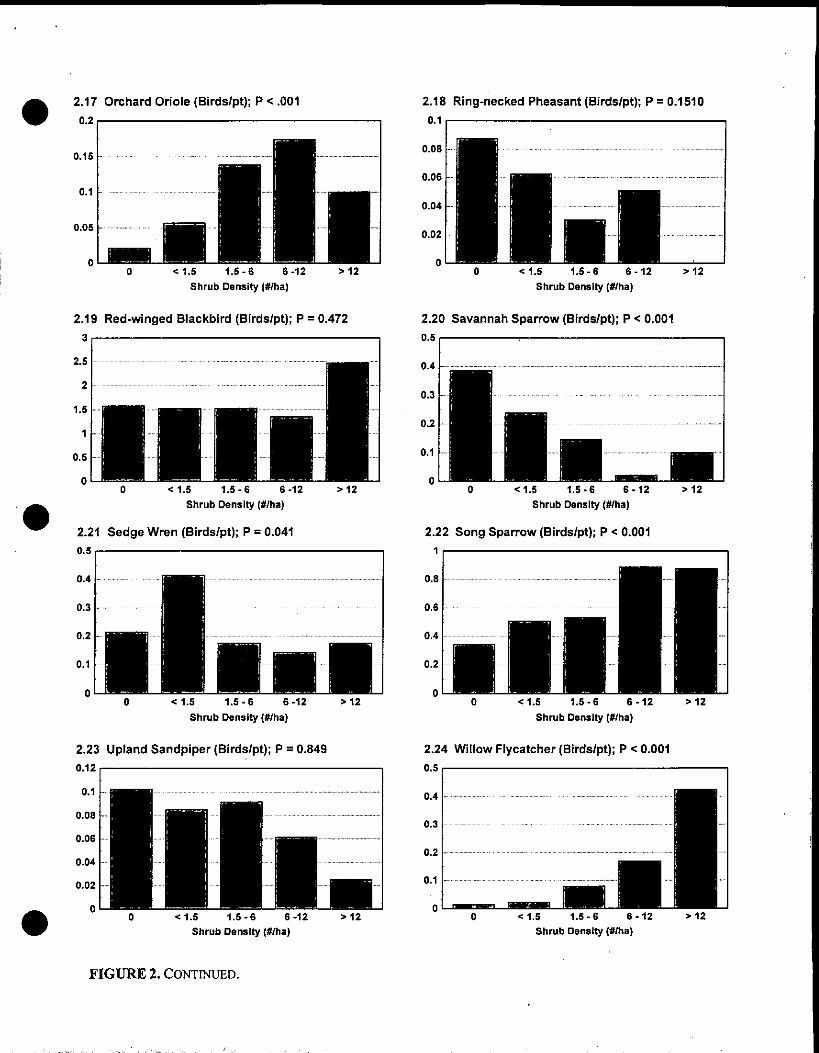
The abundance of woody vegetation (shrubs and trees z2 m tall) significantly affected theabundance of 17 of the 25 most commonly encountered species (Figure 2) . In general estimated densitiesof grassland birds decreased with increasing shrub/tree density and estimated densities of shrubland andwoodland birds increased . Species that increased significantly with increasing shrub/tree densityincluded : American Goldfinch, American Robin, Brown-headed Cowbird, Brown Thrasher, CommonYellowthroat, Eastern Kingbird, Field Sparrow, Gray Catbird, Indigo Bunting, Orchard Oriole, SongSparrow, Willow Flycatcher, and Yellow Warbler . Species that avoided trees/shrubs and whose densitieswere significantly greater in areas with no or few shrubs/trees included : Bobolink, Grasshopper Sparrow,Savannah Sparrow, and Sedge Wren .B. Grassland Bird Productivity
Grassland bird nests located within 100 m of tall woody vegetation (shrubs or trees z 2 m tall)tended to have higher daily predation rates than nests located farther from such features (Table 9) .
4

Estimates of daily nest predation were higher for nests located within 100 m of tall woody vegetation for6 of the7 species with sample sizes adequate for analyses (Table 9) . Overall, predation rates were 16%higher within 100 m of a tall shrub/tree than they were for nests located greater than 100 m from tallshrubs/trees (Table 9) .
Proximity to tall woody vegetation (shrubs or trees i 2 m tall) also significantly influenced nestparasitism rates . Overall, nearly 80% of all nest parasitism events occurred in nests located within 50 mof a tall shrub/tree (Table 10). Six species had 100% of their nest parasitism events occur in nestslocated within 50 m of a tall shrub/tree (Table 10). Only three species (Dickcissel, Field Sparrow, andRed-winged Blackbird) experienced any nest parasitism in nests located more than 100 m from a tallshrub or tree (Table 9) .
OBJECTIVE #6 : Evaluate the impacts of edges on grassland bird abundance and productivity .A. Woodland Edge
Because of the small number of nests found within 50-m of a woodland edge (N = 17) comparisonsof nest predation rates for nests located near and far from a woodland edge were conducted at the 100-mrange. Additionally, because of the relatively small sample of nests found even within the 100-m edgedistance, nests from all species were combined for this analysis . Nests that were located within 100-m ofa woodland edge were predated more frequently (daily predation rate 7 .47%; N = 47 nests) than werenests which were located more than 100-m from a woodland edge and other types of woody vegetation(daily predation rate 6 .48% ; N = 494 nests) . This difference, however, was not statistically significant (x2= 0.495, 1 df, P = 0 .481) .B. Road Edge
The distribution of Grasshopper Sparrows and Dickcissels were unaffected by roads (Fig . 3) .Eastern Meadowlarks tended to avoid being very close (within 25 m) to roads and Bobolinks hadsignificantly reduced densities up to 75 m from road edges (Fig . 3). Proximity to roads did not appear toinfluence nest success for meadowlarks (eastern and western combined), Field Sparrows, Dickcissels,Bobolinks, Grasshopper Sparrows, or Red-winged Blackbirds (Table 11) .
OBJECTIVE #7 : Evaluate the influence of landscape attributes on grassland bird productivity .Landscape variables significantly influenced individual parasitism rates for Dickcissels, Field
Sparrows, Grasshopper Sparrows, meadowlarks (eastern and western combined), and Red-wingedBlackbirds (Table 12) . Parasitism rates were significantly higher in areas with more row-crop agriculturefor Dickcissels (within 1, 3, and 5 km) and Grasshopper Sparrows (1 and 3 km) . Most other field nestingspecies (American Goldfinch, Field Sparrow, meadowlark, and Red-winged Blackbird) also tended tohave higher nest parasitism levels in areas with high amounts of row-crops (Table 12) . The amount offorest cover also significantly influenced parasitism rates for Dickcissels (I and 3 km), Field Sparrows (3km), Grasshopper Sparrows (1 and 3 km), and Red-winged Blackbirds (5 km) with all of these speciesexperiencing higher rates of nest parasitism in fields with more forest in the surrounding landscape . Theamount of grassland in the surrounding landscape significantly influenced nest parasitism levels forDickcissels (1, 3, and 5 km), Grasshopper Sparrows (1, 3 and 5 km), meadowlarks (3 and 5 km), andRed-winged Blackbirds (1, 3, and 5 km) (Table 12) . Nest parasitism rates for all four of these specieswere lowest in areas with more grassland in the surrounding landscape .
Landscape composition also significantly influenced nest predation rates (Table 12) . Daily nestpredation rates were higher in areas with more row-crop agriculture for meadowlarks (1 km) and Red-winged Blackbirds (1, 3, and 5 km) . Nest Predation rates also increased with increasing forest cover forAmerican Goldfinches (5 km), Brown Thrashers (1 km), and Red-winged Blackbirds (1 km) . However,nest predation rates for red-winged blackbirds at 5 km were negatively correlated with forest cover . Theamount of grassland in the landscape also influenced nest predation rates . Nest predation rates on BrownThrashers (1 and 3 km), meadowlarks (5 km), and Red-winged Blackbirds (3 and 5 km) were all
significantly lower in areas with more grassland in the surrounding landscape . The tendency for nestpredation rates to be lower in areas with more grassland in the surrounding landscape was a veryconsistent trend, with eight of the nine species showing a negative correlation between nest predationrates and grassland cover at all three landscape scales (1, 3 and 5 km) .
SPECIES SPECIFIC DISCUSSIONThe following section discusses species specific results for species identified as Migratory
Nongame Birds of Management Concern by the U .S. Fish and Wildlife Service (USFWS 1995) .Northern Harrier
Northern Harriers were rare within project grasslands . Harriers were encountered at Goose LakePrairie (in 1995), Joliet Training Area (1995), and Nachusa Grasslands (1995 and 1997) . No harrierswere encountered in 1996. No harrier nests were located during this study .Upland Sandpiper
Among project grasslands Upland Sandpipers were nearly restricted to Midewin National TallgrassPrairie, where they were recorded at nearly one-third of all census points (Table 2) . Small numbers weredetected at Nachusa Grasslands (4% of all census points) and Des Plaines Conservation Area (2%) . TheDes Plaines Conservation Area birds may have been vagrants from the adjacent Midewin NationalTallgrass Prairie population . Upland Sandpipers preferred areas with shallow litter (< 2 cm ; Fig . 4 .23)and height-density between 10-30 cm (Fig . 5 .23). Upland Sandpiper nest success appeared to berelatively high, with an estimated daily predation rate of 1 .6% . The daily predation rate for UplandSandpipers was substantially lower than other grassland species within these areas (Table 4) . Upland .Sandpiper distribution within areas was strongly influenced by both grassland cover type andmanagement . Upland Sandpipers were essentially restricted to agricultural grasslands (Table 6),especially grazed grasslands (Table 8) and were very rare in other cover types and management regimes .Upland Sandpipers appeared to be dependent on grazing for the creation of suitable habitat . A reductionin grazing within the project grasslands would very likely result in a reduction in the present UplandSandpiper population .Red-headed Woodpecker
Red-headed Woodpeckers were recorded at five areas, Collins Station Prairie, Des PlainesConservation Area, Midewin National Tallgrass Prairie, Nachusa Grasslands, and Sand Ridge Savanna .Because censusing was focused primarily on grassland habitats within these areas, our census dataprobably do not adequately estimate the distribution and abundance of Red-headed Woodpeckers withinproject grasslands . No Red-headed Woodpecker nests were found .Sedge Wren
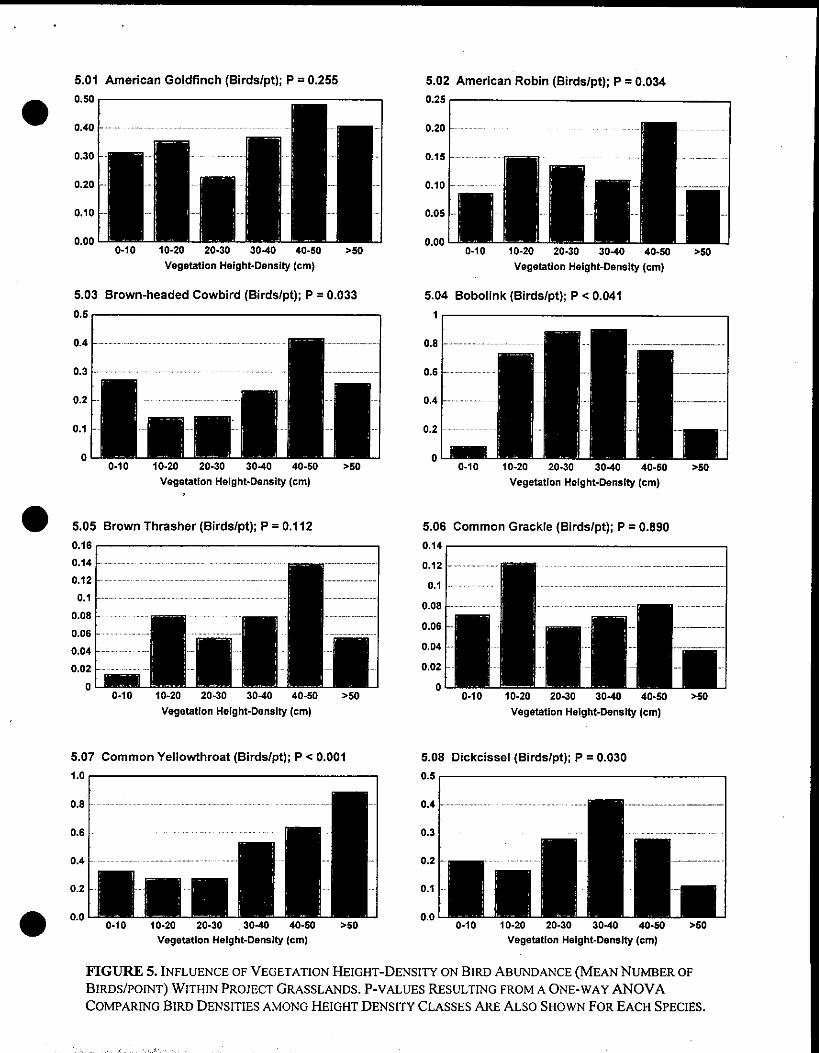
Sedge Wrens were encountered at most study areas. They were most frequently encountered andoccurred at higher densities at Goose Lake Prairie than at any other site (Tables 2 and 3) . Sedge numbersincreased as the season progressed, and July densities were typically considerably higher than Junenumbers. Occasionally high numbers were encountered in late May (such as was the case at JolietTraining Area in 1995) . Many of these late May birds appeared to be migrants, since few birds wererecorded at Joliet Training Area during the June census . Too few Sedge Wren nests were found toestimate nest success for this species within project grasslands . Sedge Wren distribution within projectgrasslands was significantly influenced by both grassland cover type and management . Sedge Wrenswere significantly more common in tall, dense grasslands (Fig. 5) with well-developed litter (Fig . 4),such as fields dominated by warm-season grasses (Table 6) . Within warm-season grass fields, SedgeWrens were significantly more common in native grasslands than in restored warm-season grass fields(Table 7). As expected due to their preference for tall, dense vegetation, Sedge Wren densities weresignificantly reduced by burning, mowing, and grazing (Table 8) .Loggerhead Shrike
Loggerhead Shrikes were only encountered at Midewin National Tallgrass Prairie, all observations
6

were in grazed areas. Surveys by the IDNR indicate a population of 12-15 pairs annually at MidewinNational Tallgrass Prairie . Few nests were found during this study, but data from the IDNR show dailynest predation rates for Loggerhead Shrikes at Midewin to be low (2 .1%/day) based on 31 nests foundand monitored between 1994-1997 . This rate is comparable to other shrub nesting species at this site(Table 4) .Bell's Vireo
Bell's Vireos were encountered at five areas, Collins Station Prairie, Des Plaines ConservationArea, Goose Lake Prairie, Midewin National Tallgrass Prairie, and Nachusa Grasslands . Becausecensusing was focused primarily on grassland habitats within these areas, our census data (Table 2)probably underestimated the abundance of Bell's Vireos within project grasslands . Only 11 Bell's Vireonests were found within project grasslands (Table 5) . Nest success for Bell's Vireos appeared to berelatively high, with an overall 1 .5% daily predation rate (Table 4). This translates into an estimated nestsuccess rate of 66% for a 25 .5 day nest cycle. Nest parasitism of Bell's Vireos within project grasslandswas relatively high (Table 5) .Dickcissel
Dickcissels were the ninth most common species within project grasslands . They were mostfrequently encountered and occurred at higher densities at Midewin National Tallgrass Prairie andNachusa Grasslands than other project grasslands (Tables 2 and 3) . Daily predation rates for Dickcisselswithin project grasslands ranged from roughly 6 - 9% (Table 4) . This translated into an estimated nestsuccess rate of between 13-26% (for a 22-day nest cycle) . Dickcissel nest success tended to be higher inareas with little forest cover and more grassland cover in the surrounding landscape (Table 12) . Nestparasitism rates for Dickcissels were among the highest for the widely distributed grassland birds in thisstudy (Table 5) . Parasitism rates were significantly higher for nests located in landscapes with abundantrow-crops and forests and little grassland (Table 12) . Dickcissels were most commonly encountered inagricultural grasslands and least common in conservation areas dominated by cool-season grasses (Table6). They were also significantly influenced by management (Table 8), being most common in mowedgrasslands and least common in idle grassland areas .Field Sparrow
Field Sparrows were the fifth most common species within project grasslands (Table 2), and weremost abundant at Des Plaines Conservation Area and Nachusa Grasslands (Table 3) . They were mostcommon in areas with high shrub densities (Fig . 2 .11), and high litter depth (Fig . 4 .11). Daily predationrates were lowest at Nachusa Grasslands and highest at Des Plaines Conservation Area and Goose LakePrairie/Collins Station Prairie and ranged from 6-8 .5% (Table 4) . Estimated nest success for FieldSparrows within project grasslands ranged from 18-30% (for a 19 .5 day nest cycle) . Parasitism rateswere significantly higher for nests located with 50 m of a tall (Z2 m) tree/shrub (TablelO) and for nestslocated in landscapes with abundant forest (3 km) in the surrounding landscape (Table 12) . FieldSparrows were most common in conservation areas dominated by cool-season grasses and least commonin agricultural grasslands (Table 6) . Field Sparrows were more common in native prairie grasslands thanthey were in restored prairies (Table 7). Field Sparrows were most common in idle grasslands and leastcommon in grasslands that had been mowed (Table 8) .Grasshopper Sparrow
Grasshopper Sparrows were the fourth most commonly encountered species within projectgrasslands (Table 2) and were most abundant at Midewin National Tallgrass Prairie and NachusaGrasslands (Table 3). Grasshopper Sparrows were significantly more abundant in areas with no or fewshrubs (Fig . 2 .13), shallow litter (Fig . 4 .13), and vegetation height-density less than 30 cm (Fig . 5 .13) .Daily predation rates for Grasshopper Sparrows were lowest at Midewin National Tallgrass Prairie andhighest at Goose Lake Prairie/Collins Station Prairie and ranged from 5 .4-16.4% (equivalent to 2-31%nest success based on a 21-day nest cycle). Nest success tended to be higher in areas with abundant grassin the surrounding landscape (especially within 3 and 5 km) . Nest parasitism rates on Grasshopper
7
i
Sparrows were generally low (Table 5), but were significantly higher in areas with little grass (1, 3, and 5km), more forest (I and 3 km), and more row-crop agriculture (1 km) (Table 12) . Grasshopper Sparrowswere strongly influenced by grassland cover type and were nearly twice as abundant in agriculturalgrasslands as they were in conservation areas (Table 6) . Within warm-season grass fields, GrasshopperSparrows were significantly more common in restored grasslands than in native warm-season grass fields(Table 7). Grasshopper Sparrows were also strongly influenced by grassland management, being mostcommon in grazed grasslands (Table 8) .Henslow's Sparrow
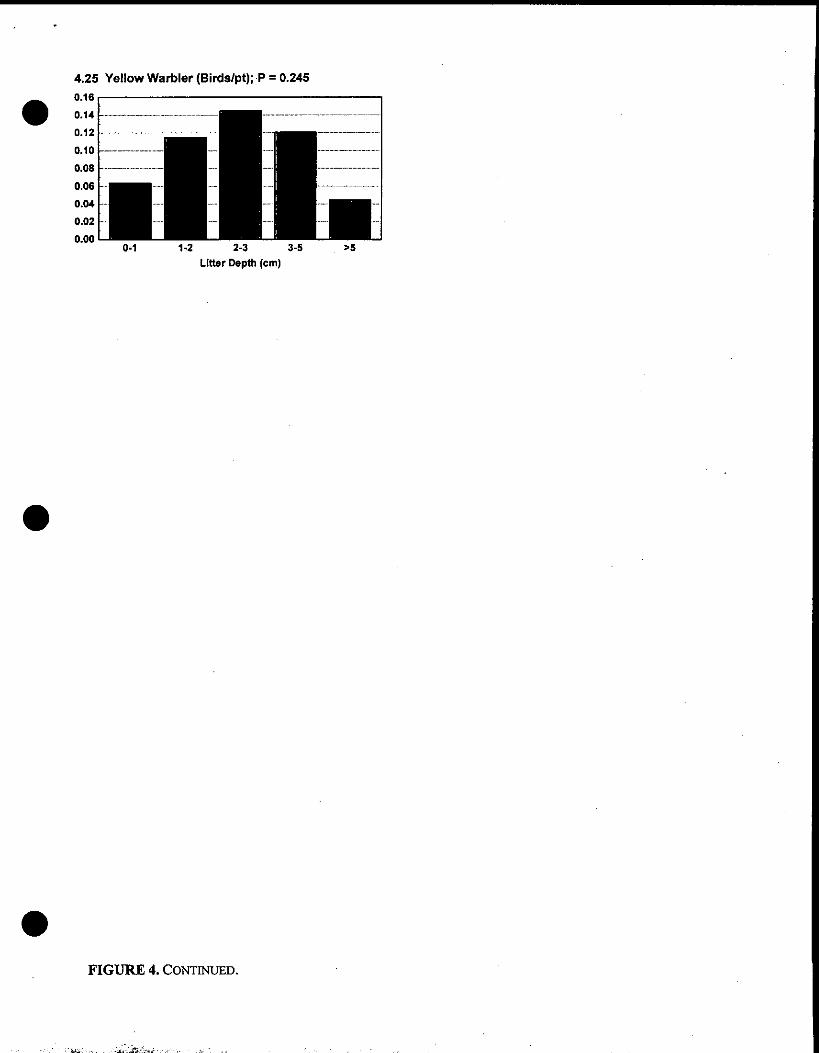
Henslow's Sparrows were most commonly encountered and attainted their highest average densitiesat Goose Lake Prairie and Des Plaines Conservation Area (Tables 2 and 3) . Henslow's Sparrows weremost abundant in areas with moderate to high litter depth (2-5 cm ; Fig 4 .14), and height-density tallerthan 50 cm (Fig. 5 .14). Too few Henslow's Sparrow nests were found to estimate either nest success ornest parasitism rates within project grasslands . Henslow's sparrow average densities were highest inconservation areas dominated by cool-season grasses and lowest in agricultural grasslands (Table 6) .Within warm-season grass fields, Henslow's Sparrows tended (P = 0 .06) to be more common in nativegrasslands than in restored warm-season grass fields, but burning had a much stronger influenced on thedistribution of this species within these areas (Table 7) . Henslow's Sparrows were also stronglyinfluenced by grassland management (Table 8) . They were most common in idle grasslands (Table 8) .Among managed grasslands, they were never encountered in grazed grasslands and were most frequentlyencountered in mowed grasslands where their densities were roughly one-third that of idle grasslands(Table 8) .Bobolink
Bobolinks were the eighth most commonly encountered species occurring at all five major and noneof the three satellite areas (Table 2) . Bobolink density was highest at Midewin National Tallgrass Prairie(Table 3). Bobolinks preferred grasslands with no or few shrubs (Fig. 2 .04), intermediate (1-2 cm) litter(Fig. 4.04), and intermediate (20-40 cm) height-density (Fig . 5 .04). Estimated nest predation rates onBobolink nests was the highest for all species (Table 4) . Bobolink nests were rarely parasitized bycowbirds (Table 5) . The influence of landscape features on bobolink nests could not be analyzed becauseof the limited number of fields in which bobolinks occurred . However, Bobolinks did appear to avoidroads (Fig . 3). Bobolinks were very strongly influenced by grassland cover type (Table 6) . Bobolinkswere nearly six times as abundant in agricultural grasslands as they were in conservation areasdominated by either cool- or warm-season grasses. Within warm-season grass fields, Bobolinks weresignificantly more common in native grasslands than in restored warm-season grass fields (Table 7), andthey were also significantly more common in burned than idle warm-season grass fields (Table 7) .Management also strongly influenced bobolink distributions within project grasslands (Table 8) .Bobolinks were most common in mowed grasslands (hayfields) and about half as common in grazedareas as they were in mowed areas (Table 8). Bobolinks were relatively rare in idle grasslands areas(Table 8) .Eastern Meadowlark
Eastern Meadowlarks were the second most commonly encountered species during this study (Table2) with average densities being highest at Midewin National Tallgrass Prairie and Des PlainesConservation Area (Table 3) . Eastern Meadowlarks preferred areas with intermediate litter depth (1-2cm; Fig . 4.10) and vegetation heigh-density (20-30 cm ; Fig . 5 .10). Eastern Meadowlark nest predationrates varied between 6.8-11 .4%, being lowest at Midewin National Tallgrass Prairie (Table 4). Estimatednest success ranged from 5-17%. Meadowlark (eastern and westein combined) nest success wassignificantly higher in areas with more grassland (within 5 km) in the surrounding landscape (Table 12) .Parasitism rates on eastern meadowlarks were low (Table 5) . However, meadowlark (eastern and westerncombined) nests located in areas with high amounts of row-crop agriculture (within I km) and littlegrassland (within 5 km) experienced significantly higher rates of nest parasitism (Table 12) . Eastern
8
0
Meadowlarks were most common in agricultural grasslands and conservation areas dominated by cool-season grasses (Table 6). Within warm-season grass fields, Eastern Meadowlarks were significantlymore common in native grasslands than in restored warm-season grass fields (Table 7) . Managementalso significantly influenced meadowlark distribution within areas (Table 8). Eastern Meadowlarks weremost common in grazed and least common in burned grasslands (Table 8) .
REFERENCESMayfield, H . 1975. Suggestions for calculating nest success . Wilson Bulletin 87 :456-466 .Ralph, C.J., S. Droege, and J .R. Sauer. 1992. Managing and monitoring birds using point counts :
standards and applications . Draft Report, 13 pp .Ralph, C .J ., G.R. Geupel, P. Pyle, T.E. Martin and D .F. DeSante. 1993. Handbook of field methods for
monitoring landbirds . General Technical Report, PSW-GTR-144 . Albany, CA : Pacific SouthwestResearch Station, Forest Service, U .S. Department of Agriculture, 41 pp .
Robe], R.J ., J.N. Briggs, A.D. Dayton, and L.C. Hulbert. 1970. Relationship between visual obstructionmeasurements and weight of grassland vegetation . Journal of Range Management 23 :295-298 .
U.S. Fish and Wildlife Service . 1995. Migratory nongame birds on management concern in the UnitedStates : The 1995 list. Office of Migratory Bird Management, USFWS, Washington D .C .
9

• TABLE 1 . DISTRIBUTION OF CENSUS POINTS AMONG STUDY AREAS, 1995-1997 .
Study Area Size (ha)# Points1995
# Points1996
# Points1997
Total# Points
Maior Study AreasMidewin National Tallgrass Prairie 2500 93 97 28 218Joliet Training Area 1400 31 0 0 31Des Plaines Conservation Area 1300 37 31 17 85Goose Lake Prairie 1000 41 38 36 115Nachusa Grasslands 405 40 44 39 123
Satellite Study AreasCollins Station Prairie 260 8 0 0 8Braidwood Dunes & Savanna 110 1 0 0 1
Sand Ridge Savanna 95 3 0 0 3
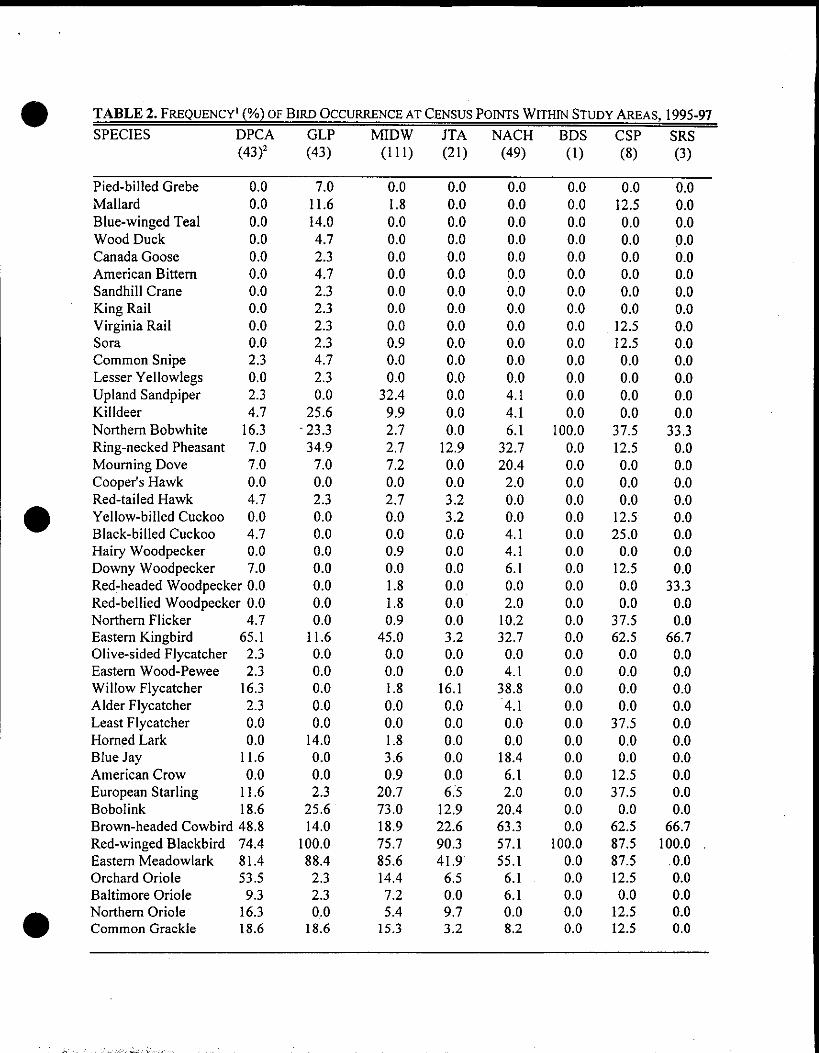
TABLE 2. FREQUENCY' (%) OF BIRD OCCURRENCE AT CENSUS POINTS WITHIN STUDY AREAS, 1995-97
SPECIES
DPCA GLP(43)
MIDW(111)
JTA(21)
NACH(49)
BDS(1)
CSP(8)
SRS(3)(43) 2
Pied-billed Grebe 0.0 7.0 0.0 0.0 0.0 0.0 0.0 0.0Mallard 0.0 11 .6 1 .8 0.0 0.0 0.0 12.5 0.0Blue-winged Teal 0.0 14.0 0.0 0.0 0.0 0.0 0.0 0.0Wood Duck 0.0 4.7 0.0 0.0 0 .0 0.0 0.0 0.0Canada Goose 0.0 2 .3 0.0 0.0 0.0 0.0 0.0 0.0American Bittern 0.0 4 .7 0.0 0.0 0.0 0.0 0.0 0.0Sandhill Crane 0.0 2 .3 0.0 0.0 0.0 0.0 0.0 0.0King Rail 0.0 2 .3 0.0 0.0 0.0 0.0 0 .0 0.0Virginia Rail 0.0 2 .3 0.0 0.0 0.0 0.0 12 .5 0.0Sora 0.0 2 .3 0.9 0.0 0.0 0.0 12 .5 0.0Common Snipe 2 .3 4 .7 0.0 0 .0 0.0 0.0 0 .0 0.0Lesser Yellowlegs 0.0 2 .3 0 .0 0 .0 0.0 0.0 0 .0 0.0Upland Sandpiper 2.3 0.0 32 .4 0 .0 4 .1 0 .0 0.0 0.0Killdeer 4.7 25.6 9 .9 0 .0 4 .1 0 .0 0.0 0.0Northern Bobwhite 16.3 - 23 .3 2 .7 0 .0 6 .1 100 .0 37.5 33 .3Ring-necked Pheasant 7.0 34.9 2 .7 12 .9 32 .7 0 .0 12.5 0.0Mourning Dove 7.0 7.0 7.2 0.0 20 .4 0 .0 0.0 0.0Cooper's Hawk 0.0 0.0 0.0 0.0 2.0 0.0 0.0 0.0Red-tailed Hawk 4.7 2 .3 2.7 3 .2 0.0 0.0 0.0 0.0Yellow-billed Cuckoo 0.0 0.0 0.0 3 .2 0.0 0.0 12 .5 0 .0Black-billed Cuckoo 4.7 0.0 0.0 0.0 4.1 0.0 25 .0 0 .0Hairy Woodpecker 0.0 0.0 0.9 0.0 4.1 0.0 0.0 0 .0Downy Woodpecker 7.0 0.0 0.0 0.0 6.1 0.0 12.5 0 .0Red-headed Woodpecker 0.0 0.0 1 .8 0.0 0.0 0.0 0.0 33 .3Red-bellied Woodpecker 0 .0 0.0 1 .8 0.0 2 .0 0.0 0.0 0 .0Northern Flicker 4.7 0.0 0.9 0.0 10.2 0.0 37.5 0.0Eastern Kingbird 65.1 11 .6 45.0 3.2 32 .7 0 .0 62.5 66.7Olive-sided Flycatcher 2.3 0.0 0.0 0.0 0.0 0.0 0.0 0.0Eastern Wood-Pewee 2.3 0.0 0.0 0.0 4.1 0.0 0.0 0.0Willow Flycatcher 16.3 0.0 1 .8 16.1 38.8 0.0 0.0 0.0Alder Flycatcher 2.3 0.0 0.0 0.0 4.1 0.0 0.0 0.0Least Flycatcher 0.0 0.0 0.0 0.0 0.0 0.0 37.5 0.0Horned Lark 0.0 14.0 1 .8 0.0 0.0 0.0 0.0 0.0Blue Jay 11 .6 0.0 3 .6 0.0 18.4 0.0 0.0 0.0American Crow 0.0 0.0 0.9 0.0 6.1 0.0 12.5 0.0European Starling 11 .6 2 .3 20.7 6.5 2.0 0.0 37.5 0.0Bobolink 18.6 25 .6 73 .0 12.9 20.4 0.0 0.0 0.0Brown-headed Cowbird 48.8 14 .0 18.9 22.6 63 .3 0.0 62.5 66.7Red-winged Blackbird 74.4 100.0 75 .7 90.3 57.1 100.0 87.5 100.0Eastern Meadowlark 81 .4 88.4 85 .6 41 .9 55.1 0.0 87.5 .0.0Orchard Oriole 53 .5 2.3 14.4 6.5 6.1 0.0 12 .5 0.0Baltimore Oriole 9.3 2.3 7.2 0.0 6.1 0.0 0.0 0.0Northern Oriole 16.3 0.0 5 .4 9.7 0.0 0.0 12 .5 0.0Common Grackle 18 .6 18.6 15 .3 3 .2 8.2 0.0 12 .5 0.0

TABLE 2. CONTINUED .
SPECIES
DPCA GLP MIDW JTA NACH BDS CSP SRS
American Goldfinch 67 .4 46.5 24.3 41 .9 69.4 100.0 87 .5 100.0Vesper Sparrow 0 .0 2.3 1 .8 0.0 22.4 0.0 0 .0 0.0Savannah Sparrow 4 .7 27.9 57.7 3 .2 24.5 0.0 0 .0 0.0Grasshopper Sparrow 62 .8 72 .1 77.5 0.0 71 .4 0.0 12 .5 0.0Henslow's Sparrow 37 .2 53 .5 7.2 0.0 4.1 0.0 0.0 0.0Lark Sparrow 0 .0 0 .0 0 .0 0.0 10.2 0.0 0.0 0.0Chipping Sparrow 0 .0 0 .0 4.5 0.0 14.3 0 .0 0.0 0.0Field Sparrow 90 .7 60.5 46.8 19.4 73 .5 100 .0 100.0 66.7Song Sparrow 62 .8 58.1 45.9 93 .5 81 .6 100 .0 100.0 100.0Lincoln's Sparrow 2.3 0.0 0.0 0.0 0 .0 0 .0 12.5 0.0Swamp Sparrow 0.0 7.0 0.0 0.0 8 .2 0 .0 12.5 0.0Rufous-sided Towhee 25.6 0.0 0.9 0 .0 8 .2 0 .0 25 .0 0.0Northern Cardinal 16.3 0.0 3 .6 6 .5 42 .9 0.0 12 .5 333Rose-breasted Grosbeak 9.3 0.0 1 .8 3 .2 6.1 0.0 0.0 0.0Indigo Bunting 44.2 7.0 5 .4 12 .9 28.6 0.0 37 .5 66.7Dickcissel 20.9 23 .3 55 .0 22 .6 46.9 0.0 0 .0 0.0Barn Swallow 0.0 4.7 0 .9 0 .0 0.0 0.0 0.0 0.0Tree Swallow 2 .3 2 .3 6 .3 0 .0 6.1 0.0 0.0 0.0Northern Rough-winged
Swallow 0 .0 0 .0 0 .9 0.0 0.0 0.0 0.0 0.0Cedar Waxwing 18.6 0 .0 8 .1 0.0 10.2 0.0 0.0 0.0Loggerhead Shrike 0.0 0 .0 1 .8 0.0 0.0 0.0 0.0 0.0Red-eyed Vireo 2.3 0.0 0 .0 0.0 2 .0 0.0 0.0 333Philadelphia Vireo 0.0 0.0 0.0 0.0 0.0 0.0 0.0 333Warbling Vireo 23.3 0.0 4.5 3 .2 6 .1 0.0 12.5 0.0Yellow-throated Vireo 2.3 0.0 0.9 0.0 2.0 0.0 0.0 0.0Bell's Vireo 7.0 0.0 0.9 0.0 14.3 0.0 25 .0 0.0Golden-winged Warbler 0.0 0.0 0.0 0 .0 0.0 0.0 12.5 0.0Nashville Warbler . 0.0 0.0 0.0 0.0 0.0 0.0 12.5 0.0Yellow Warbler 30.2 0.0 9.0 19 .4 42.9 0.0 25 .0 66.7Magnolia Warbler 0.0 0.0 0.0 0.0 0.0 0.0 0.0 333Bay-breasted Warbler 0.0 0.0 0.0 0.0 0.0 0.0 12.5 0.0Blackpoll Warbler 0.0 0.0 0.0 0.0 0.0 0.0 12.5 66.7Blackburnian Warbler 0.0 0.0 0.0 0.0 0.0 0.0 12 .5 0 .0Northern Waterthrush 0.0 0.0 0.0 0.0 0.0 0.0 25 .0 0 .0Connecticut Warbler 0.0 0.0 0.0 0.0 0.0 100.0 0.0 0 .0Mourning Warbler 0.0 0.0 0.0 0.0 0.0 100.0 0.0 0 .0Common Yellowthroat 76.7 81 .4 9.9 77.4 69.4 100.0 100.0 100 .0Yellow-breasted Chat 2.3 0.0 0.0 0.0 4.1 0.0 0.0 0.0Wilson's Warbler 0.0 0.0 0.0 0.0 0.0 0.0 25 .0 0.0Canada Warbler 0.0 0.0 0.0 0.0 0.0 100.0 12 .5 333American Redstart 0.0 0.0 0.0 0.0 0.0 0.0 37.5 333House Sparrow 0.0 0.0 1 .8 0.0 4.1 0.0 0.0 0 .0Northern Mockingbird 2 .3 0.0 12 .6 0.0 0.0 0.0 0.0 0.0

' Frequency = Percent of Census Points at Which the Species Was Encountered at Least Once Within100 M, 1995-1997Z Number of Point Count Stations at Each Site
TABLE 2. CONTINUED.
SPECIES
DPCA GLP MIDW JTA NACH BDS CSP SRS
Gray Catbird 48.8 4.7 4.5 0.0 42.9 0.0 25 .0 66.7Brown Thrasher 37.2 4.7 18.9 3 .2 38.8 100 .0 37.5 66.7House Wren 25 .6 4.7 8.1 22 .6 22.4 100.0 62.5 0.0Sedge Wren 37.2 51 .2 19.8 41 .9 12.2 0.0 25.0 66.7Marsh Wren 0.0 16.3 0.0 0 .0 0.0 0.0 0.0 0.0White-breasted Nuthatch 0 .0 0.0 0.0 0.0 2.0 0.0 0.0 0.0Black-capped Chickadee 18 .6 0.0 1 .8 3.2 10.2 0.0 12.5 33 .3Blue-gray Gnatcatcher 4 .7 0.0 0.0 0.0 2.0 0.0 0.0 0.0Wood Thrush 0 .0 0.0 0 .0 0.0 2.0 0.0 0.0 0.0Gray-cheeked Thrush 0.0 0.0 0.0 0.0 0.0 0.0 12.5 0.0American Robin 58.1 23 .3 25.2 6.5 42.9 0.0 50.0 0.0Eastern Bluebird 2.3 0.0 3.6 0.0 10.2 0.0 12.5 0.0
TABLE 3. COMPARISON OF DENSITY (MEANNUMBER OF BIRDS/CENSUS POINT)AMONG MAJOR STUDY SITESFOR THE 25 MOST COMMONLY ENCOUNTERED SPECIES, 1995-1997 .
SPECIES
upland sandpiperring-necked pheasanteastern kingbirdwillow flycatcherbobolinkbrown-headed cowbird
red-winged blackbirdeastern meadowlarkorchard oriolecommon grackleAmerican goldfinchsavannah sparrowgrasshopper sparrowHenslow's sparrow
field sparrowsong sparrowindigo buntingdickcissel
common yellowthroatyellow warbler
gray catbirdbrown thrasherhouse wrensedge wrenAmerican robin
DPCA GLP MIDW NACH JTA
0.01 0.00 0.20 0 .02 0.000.02 0.08 0.01 0.17 0.140.30 0.03 0.26 0.11 0.050.06 0.00 0.01 0.23 0.330.11 0.06 1 .60 0.08 0.570.27 0.08 0.10 0.52 0.641 .03 2.90 1 .48 1 .17 4.831 .02 0.89 1 .41 0.36 0.570.28 0.00 0.04 0.02 0.070 .15 0.08 0.06 0.06 0.050.52 0.32 0.13 0.56 0.590.01 0.10 0.56 0.17 0.020.67 0.77 1 .66 1 .29 0.000.35 0.34 0.04 0.01 0.00
0.96 0.22 0.35 0.71 0.160.46 0.22 0.28 0.83 3 .140.17 0.01 0.04 0.10 0.140.07 0.08 0.63 0.36 0.24
0.50 0.61 0.05 0.47 1 .350.16 0.00 0.04 0.26 0.26
0 .18 0.01 0.02 0.19 0.000 .15 0.01 0.06 0.11 0.020 .10 0.01 0.04 0.07 0.300 .17 0 .50 0.13 0.10 0.250 .25 0 .07 0.13 0.17 0.07
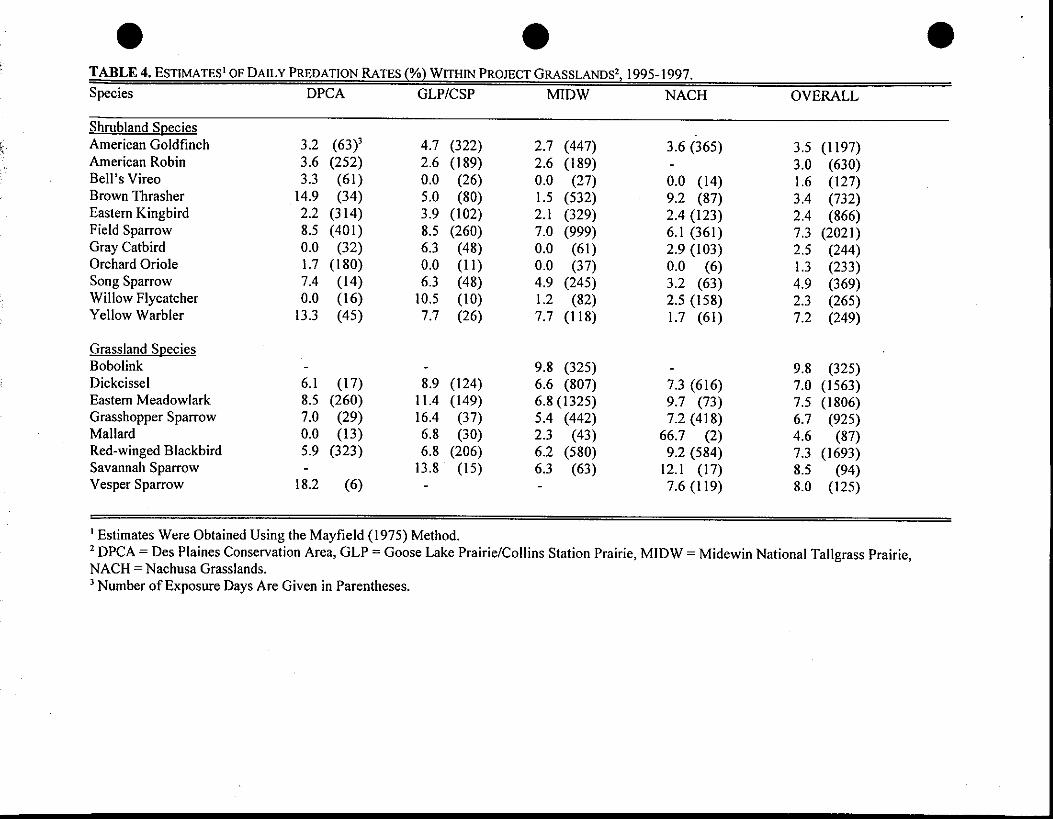
TABLE 4 . ESTIMATES OF DAILY PREDATION RATES (%) WITHIN PROJECT GRASSLANDS', 1995-1997 .
'Estimates Were Obtained Using the Mayfield (1975) Method .' DPCA = Des Plaines Conservation Area, GLP = Goose Lake Prairie/Collins Station Prairie, MIDW = Midewin National Tallgrass Prairie,NACH = Nachusa Grasslands .'Number of Exposure Days Are Given in Parentheses .
Species DPCA GLP/CSP MIDW NACH OVERALL
Shrubland SpeciesAmerican Goldfinch 3 .2 (63)' 4.7 (322) 2.7 (447) 3 .6 (365) 3 .5 (1197)American Robin 3 .6 (252) 2.6 (189) 2.6 (189) 3.0 (630)Bell's Vireo 3 .3 (61) 0.0 (26) 0.0 (27) 0.0 (14) 1 .6 (127)Brown Thrasher 14.9 (34) 5.0 (80) 1 .5 (532) 9.2 (87) 3 .4 (732)Eastern Kingbird 2.2 (314) 3.9 (102) 2.1 (329) 2.4 (123) 2 .4 (866)Field Sparrow 8.5 (401) 8.5 (260) 7.0 (999) 6.1 (361) 7 .3 (2021)Gray Catbird 0.0 (32) 6.3 (48) 0.0 (61) 2.9 (103) 2 .5 (244)Orchard Oriole 1 .7 (180) 0.0 (11) 0.0 (37) 0.0 (6) 1 .3 (233)Song Sparrow 7.4 (14) 6.3 (48) 4.9 (245) 3 .2 (63) 4.9 (369)Willow Flycatcher 0.0 (16) 10.5 (10) 1 .2 (82) 2.5 (158) 2.3 (265)Yellow Warbler 13 .3 (45) 7.7 (26) 7.7 (118) 1 .7 (61) 7.2 (249)
Grassland SpeciesBobolink - 9.8 (325) 9.8 (325)Dickcissel 6.1 (17) 8.9 (124) 6.6 (807) 7.3 (616) 7.0 (1563)Eastern Meadowlark 8.5 (260) 11 .4 (149) 6.8 (1325) 9.7 (73) 7.5 (1806)Grasshopper Sparrow 7.0 (29) 16.4 (37) 5 .4 (442) 7.2 (418) 6.7 (925)Mallard 0.0 (13) 6.8 (30) 2.3 (43) 66.7 (2) 4.6 (87)Red-winged Blackbird 5 .9 (323) 6.8 (206) 6.2 (580) 9.2 (584) 7.3 (1693)Savannah Sparrow - 13.8 (15) 6.3 (63) 12.1 (17) 8.5 (94)Vesper Sparrow 18.2 (6) 7.6 (119) 8.0 (125)

TABLE5. ESTIMATESOF NEST PARASITISMRATES (% OF ALLNESTS PARASITZED)WITHIN PROJECTGRASSLANDS',1995-1997 .Species
DPCA
GLP/CSP
MIDW
NACH
OVERALL
' DPCA = Des Plaines Conservation Area, GLP/CSP = Goose Lake Prairie/Collins Station Prairie, MIDW = Midewin National Tallgrass Prairie,NACH = Nachusa Grasslands.'Number of Nests .
Shrubland SpeciesAmerican Goldfinch 0.0 (4) 2 0.0 (23) 3.0 (33) 11 .1 (27) 4.6 (87)American Robin 0.0 (19) 0.0 (15) 0.0 (15) - 0.0 (49)Bell's Vireo 60.0 (5) 0.0 (1) 0.0 (2) 100.0 (3) 54.5 (11)Brown Thrasher 0.0 (6) 0.0 (8) 5 .1 (39) 0.0 (11) 3.1 (64)Eastern Kingbird 0.0 (15) 0.0 (15) 10 .0 (20) 0.0 (6) 4.2 (48)Field Sparrow 10.9 (55) 10.3 (39) 8 .3 (121) 17.0 (47) 10.7 (262)Gray Catbird 0.0 (3) 0.0 (5) 0 .0 (4) 0.0 (7) 0.0 (19)Orchard Oriole 45.5 (11) 0.0 (1) 25 .0 (4) 100.0 (1) 41 .2 (17)Song Sparrow 0.0 (1) 50.0 (4) 30 .4 (23) 10 .0 (10) 26.3 (38)Willow Flycatcher 100.0 (1) 0.0 (1) 25.0 (4) 16.7 (12) 22.2 (18)Yellow Warbler 33 .3 (6) 0.0 (2) 7.1 (14) 50.0 (6) 21 .4 (28)
Grassland SpeciesBobolink - 1 .9 (53) - 1 .9 (53)Dickcissel 0.0 (3) 0.0 (3) 3 .2 (93) 24 .6 (69) 11 .1 (180)Eastern Meadowlark 0.0 (28) 4.5 (22) 1 .5 (137) 11 .1 (9) 2.0 (196)Grasshopper Sparrow 0.0 (4) 0.0 (11) 0 .0 (62) 5 .0 (60) 2.2 (137)Red-winged Blackbird 3 .1 (32) 16.0 (25) 0.0 (55) 15.9 (69) 8.8 (181)Savannah Sparrow 0.0 (2) 0.0 (10) 0 .0 (2) 0.0 (14)Vesper Sparrow 0.0 (2) - 0.0 (12) 0.0 (14)

TABLE 6. COMPARISON OF BIRD ABUNDANCE (MEAN NUMBER OF BIRDS/CENSUS POINT) WITHINGRASSLAND COVER TYPES' .SPECIES
upland sandpiper'ring-necked pheasanteastern kingbirdwillow flycatcherbobolinkbrown-headed cowbirdred-winged blackbirdeastern meadowlarkorchard oriolecommon grackleAmerican goldfinchsavannah sparrowgrasshopper sparrowHenslow's sparrowfield sparrowsong sparrowindigo buntingdickcisselcommon yellowthroatyellow warblergray catbirdbrown thrasherhouse wrensedge wrenAmerican robin' cs-ag = Agricultural Grasslands ; cs-cons = Cool-Season Conservation Grasslands ; ws-cons = Warm-Season Conservation Grasslands .2 F-statistic from a One-way ANOVA Comparing Densities among Cover Types .'Significance Based on One-way ANOVA .' Means with the Same Superscript Are Not Significantly (P > 0 .05) Different from One Another .
cs-ag cs-cons ws-cons F(anova)' P(anova) 3
0.20' 0 .01" 0.01 6 24.32 <0.00010.01 6 0.04 6 0.11' 16.52 <0.00010.26' . 0.26' 0.11 6 9 .04 0.00020.01 6 0.07ab 0.11' 9 .93 0.00011 .603 0.276 0.06 6 79 .24 <0.00010.106 0.166 0.38 8 13 .91 <0.00011 .486 0.746 2 .06' 10 .38 0.00101 .41' 1 .10' 0.63 6 36.78 <0 .00010.046 0.29' 0.02 6 43 .37 <0 .00010.06 0.03 0.11 1 .03 0 .35820.13 6 0 .51 a 0.48' 16.16 <0 .00010.56' 0 .05 6 0.126 55 .00 <0 .00011 .66 3 0.82 6 0.93 6 25 .59 <0 .00010 .04 c 0.39' 0.166 20.19 <0 .00010.35 c 0.82' 0.586 14.57 <0.00010.28 6 0.43e' 0.58' 12 .34 <0.00010.04 6 0.16' 0.08 6 6.19 0.00240.63 3 0.05 6 0.21 6 25.92 <0.00010.056 0.48' 0.59' 50.81 <0.00010.046 0.168 0 .14 3 6.04 0.00270.026 0.16' 0.12 8 11 .04 <0.00010.06 0.11 0.09 1 .32 0.26610.04 0.10 0.05 2.19 0.11040.13 6 0.17eb 0.31 8 5 .76 0.00350.13 0.19 0.15 0.89 0.4157
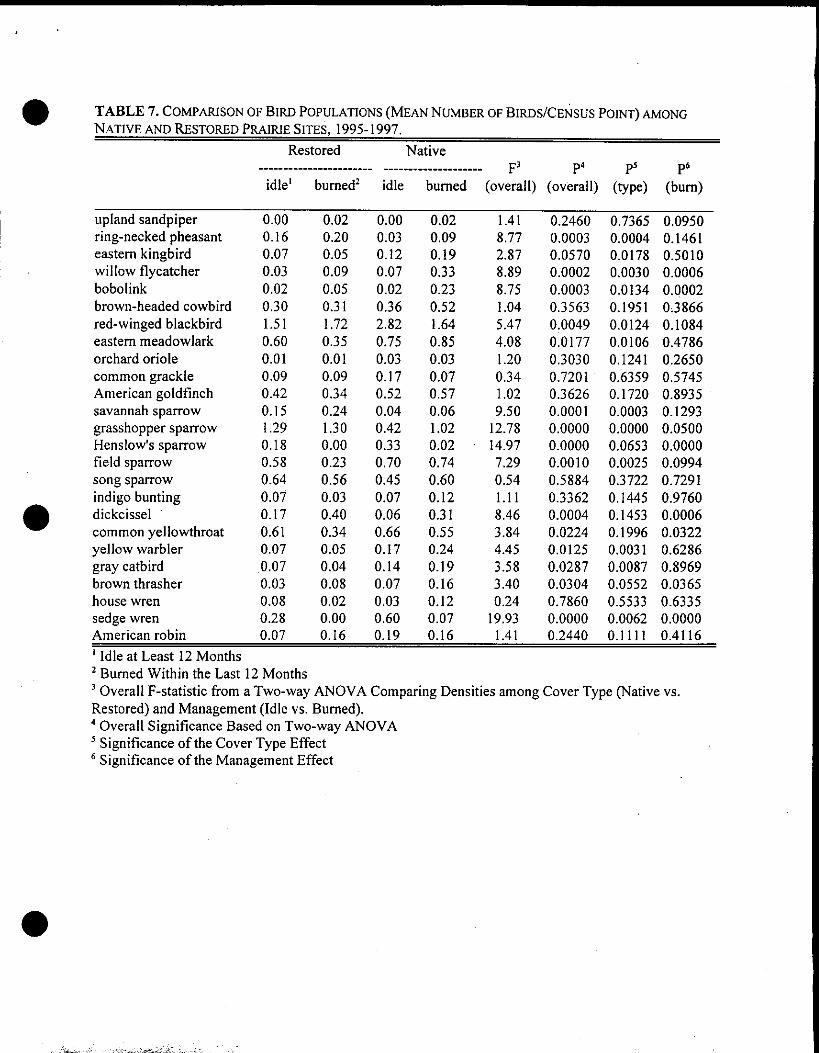
TABLE 7. COMPARISON OF BIRD POPULATIONS (MEAN NUMBER OF BIRDS/CENSUS POINT) AMONGNATIVE AND RESTORED PRAIRIE SITES, 1995-1997 .
upland sandpiperring-necked pheasanteastern kingbirdwillow flycatcherbobolinkbrown-headed cowbirdred-winged blackbirdeastern meadowlarkorchard oriolecommon grackleAmerican goldfinchsavannah sparrowgrasshopper sparrowHenslow's sparrowfield sparrowsong sparrowindigo buntingdickcisselcommon yellowthroatyellow warblergray catbirdbrown thrasherhouse wrensedge wrenAmerican robin
Restored
Native
Idle at Least 12 MonthsZ Burned Within the Last 12 MonthsOverall F-statistic from a Two-way ANOVA Comparing Densities among Cover Type (Native vs .
Restored) and Management (Idle vs . Burned) .'Overall Significance Based on Two-way ANOVA5 Significance of the Cover Type Effect6 Significance of the Management Effect
-----------------------F3
p4
P sidle
burned (overall) (overall) (type)P`
(burn)idle' burned2
0 .00 0.02 0.00 0.02 1 .41 0.2460 0.7365 0.09500 .16 0.20 0.03 0.09 8.77 0.0003 0.0004 0.14610.07 0.05 0.12 0.19 2.87 0.0570 0.0178 0.50100.03 0 .09 0.07 0.33 8.89 0.0002 0 .0030 0 .00060.02 0.05 0.02 0.23 8.75 0.0003 0 .0134 0.00020.30 0.31 0.36 0.52 1 .04 0.3563 0.1951 038661 .51 1 .72 2.82 1 .64 5 .47 0.0049 0.0124 0.10840.60 0.35 0.75 0.85 4.08 0.0177 0.0106 0.47860.01 0.01 0.03 0.03 1 .20 0.3030 0.1241 0.26500 .09 0.09 0.17 0.07 0.34 0.7201 0.6359 0.57450 .42 0.34 0 .52 0.57 1 .02 0.3626 0.1720 0.89350 .15 0 .24 0.04 0 .06 9.50 0 .0001 0.0003 0.12931 .29 1 .30 0.42 1 .02 12.78 0 .0000 0 .0000 0.05000.18 0 .00 0.33 0 .02 14.97 0 .0000 0 .0653 0.00000.58 0 .23 0.70 0 .74 7.29 0 .0010 0 .0025 0 .09940.64 0 .56 0.45 0 .60 0.54 0 .5884 0 .3722 0 .72910.07 0.03 0.07 0.12 1 .11 0.3362 0 .1445 0 .97600.17 0.40 0.06 0.31 8 .46 0.0004 0.1453 0 .00060.61 0.34 0 .66 0.55 3 .84 0.0224 0.1996 0.03220.07 0.05 0 .17 0.24 4 .45 0.0125 0.0031 0.62860 .07 0.04 0 .14 0.19 3 .58 0.0287 0.0087 0.89690.03 0.08 0 .07 0.16 3 .40 0.0304 0.0552 0.03650.08 0.02 0 .03 0.12 0 .24 0.7860 0.5533 0.63350.28 0.00 0 .60 0 .07 19 .93 0.0000 0.0062 0.00000.07 0.16 0.19 0.16 1 .41 0 .2440 0.1111 0.4116
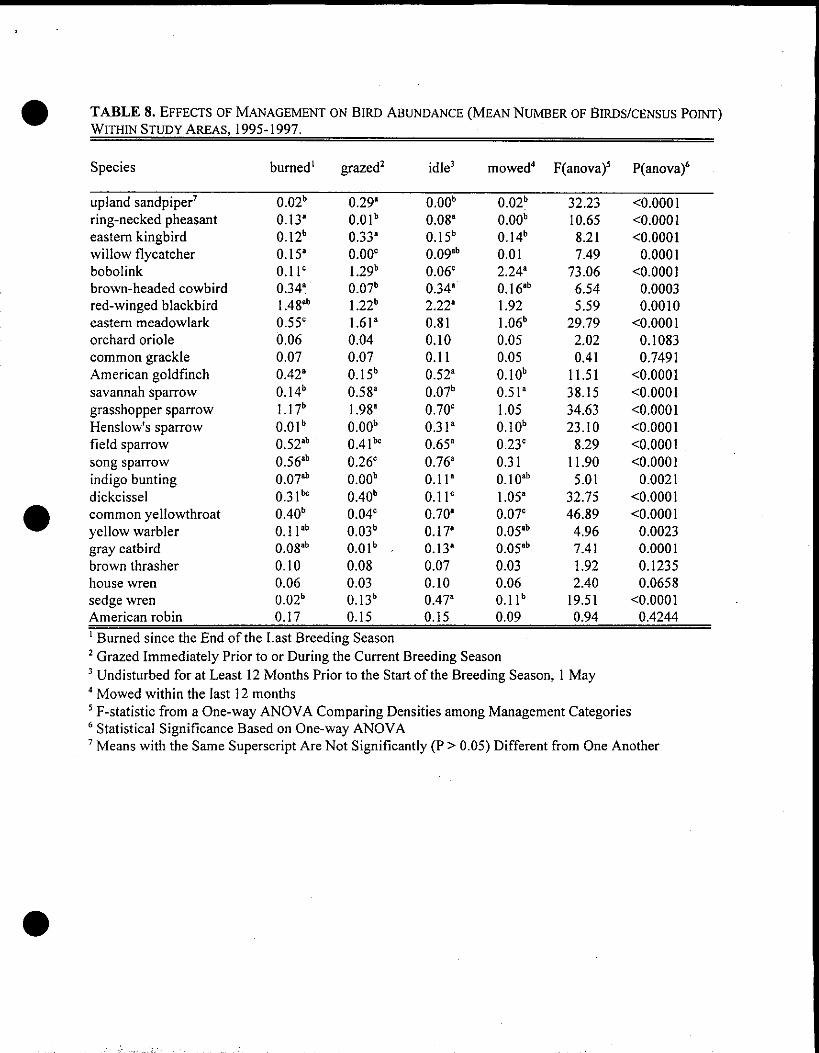
TABLE 8. EFFECTS OF MANAGEMENT ON BIRD ABUNDANCE (MEAN NUMBER OF BIRDS/CENSUS POINT)WITHIN STUDY AREAS, 1995-1997 .
Species
upland sandpiper'ring-necked pheasanteastern kingbirdwillow flycatcherbobolinkbrown-headed cowbirdred-winged blackbirdeastern meadowlarkorchard oriolecommon grackleAmerican goldfinchsavannah sparrowgrasshopper sparrowHenslow's sparrowfield sparrowsong sparrowindigo buntingdickcisselcommon yellowthroatyellow warblergray catbirdbrown thrasherhouse wrensedge wrenAmerican robinBurned since the End of the Last Breeding Season
' Grazed Immediately Prior to or During the Current Breeding Season' Undisturbed for at Least 12 Months Prior to the Start of the Breeding Season, 1 May° Mowed within the last 12 months5 F-statistic from a One-way ANOVA Comparing Densities among Management Categories6 Statistical Significance Based on One-way ANOVAMeans with the Same Superscript Are Not Significantly (P > 0 .05) Different from One Another
burned' grazed' idle' mowed' F(anova) 5 P(anova)`
0.02" 0.29' 0.006 0.02" 32 .23 <0.00010.13' 0.01 6 0.08' 0.00" 10.65 <0.00010.12 6 0.33' 0.15 6 0.14" 8.21 <0.00010.15' 0.000 0.098" 0.01 7.49 0.00010.11` 1 .29 6 0.06` 2.24' 73.06 <0.00010.34' 0.07" 0.34' 0.16'" 6.54 0.00031 .48"' 1 .22 6 2.22' 1 .92 5.59 0.00100.55` 1 .61' 0.81 1 .06" 29.79 <0.00010 .06 0.04 0.10 0 .05 2.02 0.10830.07 0.07 0.11 0 .05 0.41 0.74910.42' 0.15 6 0.52' 0.10" 11 .51 <0.00010.14" 0.58' 0 .07 6 0.51' 38 .15 <0.00011 .17 6 1 .98' 0 .70` 1 .05 34.63 <0.00010.01" 0.00" 0 .3 la 0.10" 23 .10 <0.00010.52"' 0.41" 0 0.65' 0.23` 8.29 <0.00010.56a' 0.260 0.76' 0.31 11 .90 <0.00010.07ab 0.00" 0.11" 0.10"" 5.01 0.00210.31" 0 0.40" 0.11 0 1 .05' 32.75 <0.00010.40" 0.040 0.70' 0.07° 46.89 <0.00010.1 la" 0.03" 0.17" 0.05'" 4.96 0 .00230.08"6 0.01" 0.13' 0.05e6 7.41 0.00010.10 0.08 0.07 0.03 1 .92 0.12350.06 0.03 0.10 0.06 2.40 0.06580 .02" 0.13 6 0.47' 0.11" 19.51 <0.00010 .17 0.15 0.15 0.09 0.94 0.4244
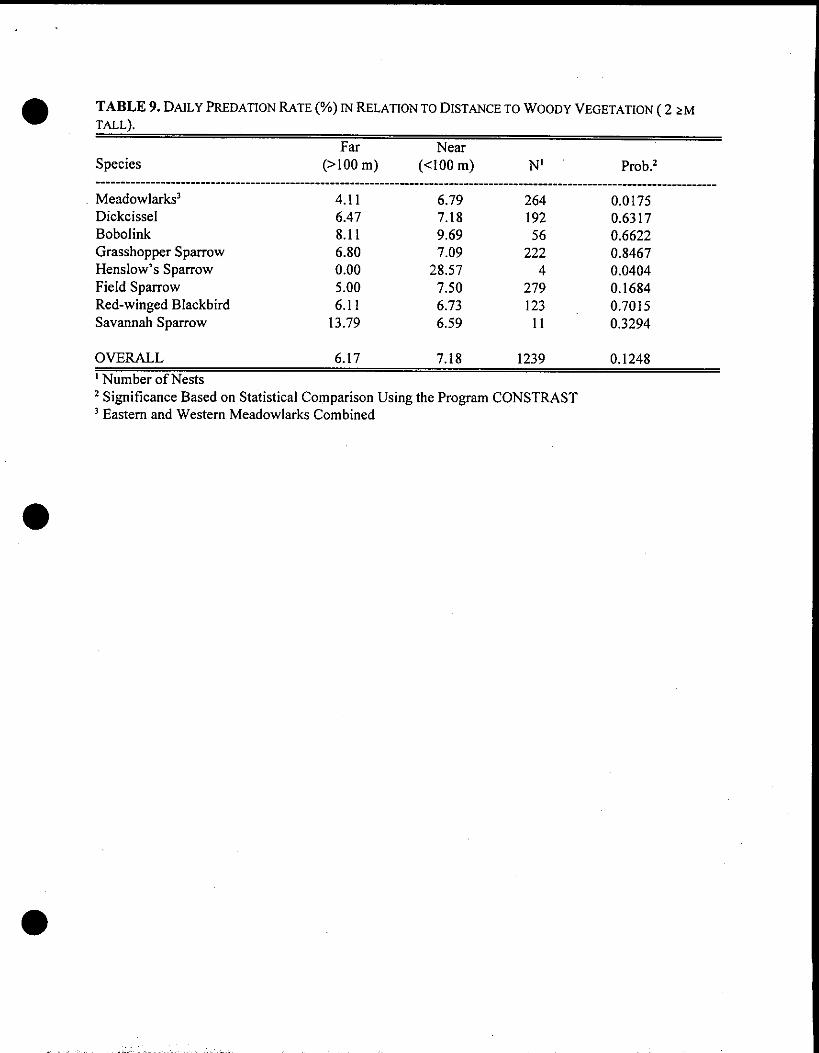
TABLE 9. DAILY PREDATION RATE (%) IN RELATION TO DISTANCE TO WOODY VEGETATION (2 2MTALL).
Far
NearSpecies
(>100 m)
(<100 M)
N'
Prob.'----------------------------------------------------------------------------------------------------------------------------
2 Significance Based on Statistical Comparison Using the Program CONSTRAST3 Eastern and Western Meadowlarks Combined
Meadowlarks' 4.11 6.79 264 0.0175Dickcissel 6.47 7.18 192 0.6317Bobolink 8.11 9.69 56 0.6622Grasshopper Sparrow 6.80 7.09 222 0.8467Henslow's Sparrow 0.00 28.57 4 0.0404Field Sparrow 5 .00 7.50 279 0.1684Red-winged Blackbird 6.11 6.73 123 0.7015Savannah Sparrow 13 .79 6.59 11 0.3294
OVERALL 6.17 7.18 1239 0.1248
'Number of Nests

TABLE 10 . BREAKDOWN OF PARASITIZED NESTS WITHIN PROJECT GRASSLANDS IN RELATION TODISTANCE FROM TALL (z 2M) WOODY VEGETATION .
' The Number of Parasitized Nests among Various Distance Categories . Distance Categories Are NestsLocated More than 100 M from All Tall Woody Vegetation (> 100 M), Nests Located 50 to 100 M fromTall Woody Vegetation (50-100 M), and Nests Located Within 50 M of Tall Woody Vegetation (< 50
M).'Unknown species of meadowlark
SpeciesTotal #Nests
# Parasitized
Nests
# Parasitized Nests'
<50 m 50-100 m >100 m
Bobolink 56 1 1 0 0Common Yellowthroat 4 3 2 1 0Dickcissel 192 28 16 4 8Eastern Meadowlark 207 4 4 0 0Field Sparrow 279 35 33 1 1Grasshopper Sparrow 222 6 4 2 0Henslow's Sparrow 4 0 0 0 0Lark Sparrow 29 7 7 0 0Red-winged Blackbird 123 7 3 3 1
Savannah Sparrow 11 2 2 0 0Song Sparrow 33 9 9 0 0Vesper Sparrow 37 2 1 1 0Western Meadowlark 27 1 1 0 0Meadowlark' 8 0 0 0 0
TOTAL 1232 105 83 12 10
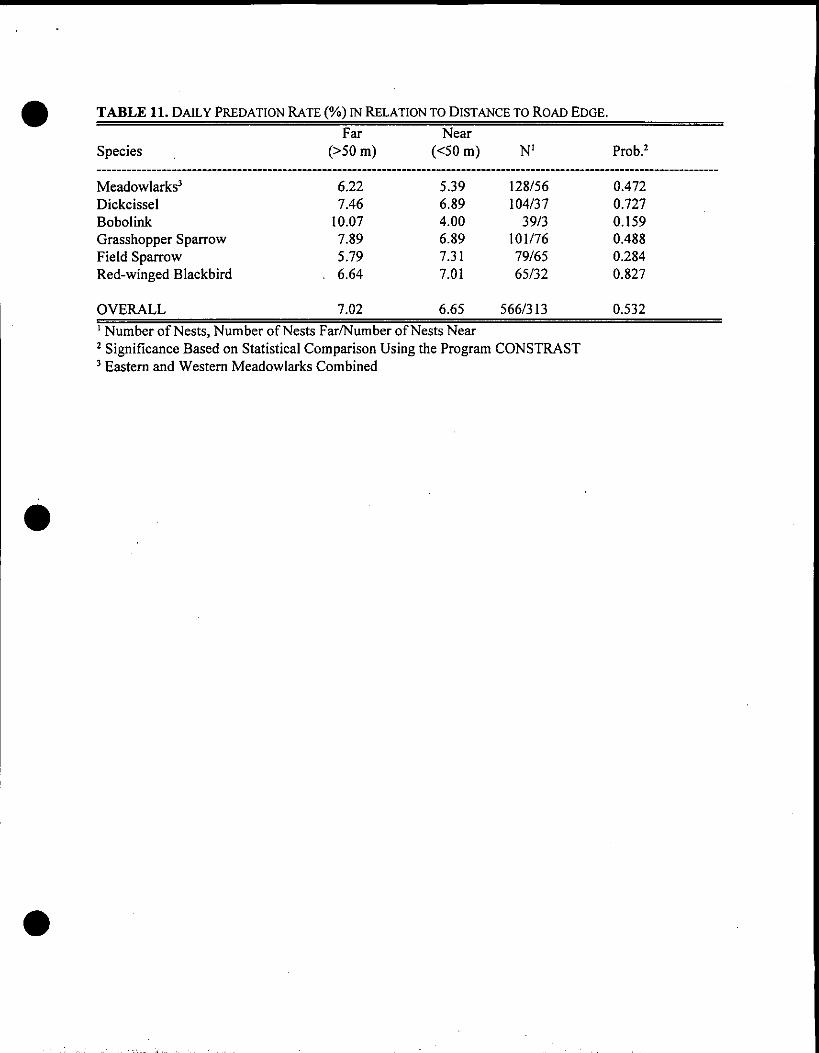
TABLE 11. DAILY PREDATION RATE (%) IN RELATION TO DISTANCE TO ROAD EDGE .Far
NearSpecies
(>50 m)
(<50 m)
N'
Prob.'-----------------------------------------------------------------------------------------------------------------------------
'Number of Nests, Number of Nests Far/Number of Nests Near2 Significance Based on Statistical Comparison Using the Program CONSTRAST' Eastern and Western Meadowlarks Combined
Meadowlarks' 6.22 5.39 128/56 0.472Dickcissel 7.46 6.89 104/37 0.727Bobolink 10.07 4.00 39/3 0.159Grasshopper Sparrow 7.89 6.89 101/76 0.488Field Sparrow 5 .79 7.31 79/65 0.284Red-winged Blackbird
. 6.64 7.01 65/32 0.827
OVERALL 7.02 6.65 566/313 0.532

TABLE 12. CORRELATIONS BETWEEN LANDSCAPE ATTRIBUTES AND NEST PARASITISM AND DAILY NEST PREDATION RATES WITHIN ILLINOISGRASSLANDS
*=P<0.10,**=P<0.05,***=P0.01AGRC = Agricultural Row-crops (corn, beans, small grains) ; Forest= Woodlands; Grass = Grasslands .
Z Pearson correlations between field-level nest parasitism rates (percent of nests with at least one cowbird egg) and landscape attributes of the field,weighted by the number of nests per field .' Pearson correlations between field-level estimates of daily nest predation and landscape attributes of the field, weighted by the number of exposuredays for all nests combined in each field .Number of fields included in the analyses for each species .
LandscapeAttribute'
AmericanGoldfinch
BrownThrasher Dickcissel
EasternKingbird
FieldSparrow
GrasshopperSparrow Meadowlark
Red-wingedBlackbird
SongSparrow
Nest ParasitismAGRC-IK 0.311 -0.248 0.842*** -0 .069 0.078 0.399* 0.160 0.268 -0.312AGRC-3K 0.234 -0.159 0.902*** -0 .070 0.090 0.386* 0.316 0.216 -0.128AGRC-5K 0.235 -0.119 0.864*** -0 .028 0.037 0.178 0.320 0.204 -0.086FOREST-1K 0.230 -0.063 0.907*** -0 .290 0.265 0.412* 0.085 0.244 -0.324FOREST-3K 0.276 -0.027 0.641** 0.162 0.370* 0.649*** -0.249 0.222 -0.371FOREST-5K -0.258 0.060 -0.464 -0 .220 0.242 0.271 0.067 0.369* 0 .073GRASS-1K -0.284 0.255 -0.887*** 0.306 -0.196 -0.395* -0.285 -0.387* 0 .192GRASS-3K -0.175 0.275 -0.862*** 0.242 -0.286 -0.654*** -0.448*** -0.510** 0 .172GRASS-5K -0.061 0.148 -0.849*** 0.280 -0.225 -0.604*** -0.521*** -0.422* 0 .137
Nest Predation'AGRC-1 K 0.173 0 .298 0.035 -0 .053 0.036 0.100 0.372* 0.639*** -0 .035AGRC-3K -0.080 0.360 -0.067 -0.146 0.002 0.046 0.195 0.487** 0 .001AGRC-5K -0.054 0 .352 -0.029 -0.181 -0.052 -0.017 0.195 0.534** 0.040FOREST-1 K 0.082 0 .677*** -0.059 -0.210 -0.035 0.072 0.100 0.487** -0 .049FOREST-3K 0.233 0 .092 -0.232 -0.297 0.059 0.185 -0.271 0.308 0 .027FOREST-5K 0.537* -0.322 0.147 0.230 0.026 0.104 -0.129 -0.434** 0 .000GRASS-1K -0.078 -0.415* -0.158 -0.004 -0.058 -0.090 -0.255 -0.201 0.019GRASS-3K -0.318 -0.428* -0.125 0.112 -0.082 -0.336 -0.140 -0.381* -0 .097GRASS-5K -0.357 -0.323 -0.025 -0.002 0.035 -0.289 -0.349* -0.466** -0 .143
N4 12 18 12 14 26 22 24 22 15

DPCA
FIGURE 1 . LOCATION OF STUDY AREAS . SOLID CIRCLES REPRESENT MAJOR STUDY AREAS . HOLLOWCIRCLES REPRESENT SATELLITE STUDY AREAS . TRIANGLES REPRESENT STUDY AREAS USED TO GAINSUPPLEMENTARY NESTING DATA. CSP = COLLINS STATION PRAIRIE, GLP = GOOSE LAKE PRAIRIE, JTA= JOLIET TRAINING AREA, MIDW = MIDEWIN NATIONAL TALLGRASS PRAIRIE (FORMERLY THE JOLIETARMY AMMUNITION PLANT), SRS = SAND RIDGE SAVANNA, BDS = BRAID WOOD DUNES AND SAVANNA,SAD = SAVANNA ARMY DEPOT, NACH = NACHUSA GRASSLANDS, GRCA = GREEN RIVERCONSERVATION AREA.
1
0.8
0.6
0.4
0.2
<1.5
1 .5-6
6-12•
Shrub Density (#Iha)
2.05 Brown Thrasher (Birds/pt) ; P < 0 .0010.3
0.25
0.2
0.15
0 .1
0 .05
0
0 .5
0 .4
0 .3
0 .2
0 .1
00
0
<1 .5
1 .5-6
6-12Shrub Density (#/ha)
> 12
2.03 Brown-headed Cowbird (Birds/pt) ; P < 0 .0010.6
0 .5
0 .4
0.3
0 .2
0 .1
0> 12
0 < 1 .5
1 .5-6
6-12Shrub Density (#/ha)
2.07 Common Yellowthroat (Birds/pt) ; P < 0.001
0.6
0 < 1 .5
1 .5-6
6-12Shrub Density (#/ha)
> 12
> 12
2.02 American Robin (Birds/pt) ; P < 0 .0010.35
0 .3
0.25
0.2
0 .15
0.1
0 .05
0
0.8
0 .6
0 .4
0 .2
00
0 <1.5
1.5-6
6-12Shrub Density (#/ha)
2.04 Bobolink (Birds/pt) ; P < 0.0011
<1 .5
1 .5-6
6-12Shrub Density (#/ha)
2.06 Common Grackle (Birds/pt) ; P = 0 .4660 .2
0.15
0 .1
0 .05
00 <1 .5
1 .5-6
6-12Shrub Density (#/ha)
2.08 Dickcissel (Birds/pt) ; P = 0 .2530.35
0 .3
0 .25
0 .2
0 .15
0 .1
0.05
00 <1.5
1.5-6
6-12Shrub Density (#/ha)
FIGURE 2 . INFLUENCE OF TALL (2 2 M) SHRUBS/TREES ON BIRD ABUNDANCE (MEAN NUMBER OFBIRDS/POINT) WITHIN PROJECT GRASSLANDS. P-VALUES RESULTING FROM A ONE-WAY ANOVACOMPARING BIRD DENSITIES AMONG SHRUB CLASSES ARE ALSO SHOWN FOR EACH SPECIES .
> 12
> 12
> 12
•
2.01 Amercian Goldfinch (Birds/pt) ; P < 0.001
> 12

0.35
0 .3
0.25
0 .2
0.15
0 .1
0 .05
0
101
2.11 Field Sparrow (Birds/pt); P < 0 .0011 .6
1 .4
1 .2
1
0.8
0 .6
0 .4
0 .2
00
0
0
0
<1.5
1 .5-6
6-12Shrub Density (#/ha)
< 1 .5
1 .5-6
6 .12Shrub Density (#Iha)
2.13 Grasshopper Sparrow (Birds/pt) ; P < 0 .0012
1 .5
1
0 .5
0< 1 .5
1 .5-6
6-12
Shrub Density (#Iha)
2.15 House Wren (Birds/pt) ; P=0.2430.14
0.12
0 .1
0 .08
0.06
0.04
0.02
0
FIGURE 2 . CONTINUED .
<1 .5
1.5-6
6-12Shrub Density (#/ha)
> 12
> 12
> 12
> 12-
2.10 Eastern Meadowlark (Birds/pt); P = .4991 .2
1
0 .8
0 .6
0 .4
0 .2
0
2.12 Gray Catbird (Birds/pt) ; P < 0 .0010 .4
0.3
0 .2
0 .1
0
2 .14 Henslow's Sparrow (Birds/pt) ; P = 0 .0770.3
0 .25
0.2
0 .15
0 .1
0 .05
0
0
0
0
2.16 Indigo Bunting (Birds/pt) ; P = 0 .0010.16
0 .14
0 .12
0 .1
0 .08
0.06
0.04
0.02
00
<1.5
1.5-6
6-12Shrub Density (#/he)
<1.5
1.5-6
6-12Shrub Density (#/ha)
<1.5
1.5-6
6-12
Shrub Density (#/ha)
< 1 .5
1.5-6
6-12Shrub Density (#Iha)
> 12
> 12
> 12
• 2.09 Eastern Kingbird (Birds/pt) ; P < 0 .001
>12
•
2.17 Orchard Oriole (Birds/pt) ; P < .001
2.18 Ring-necked Pheasant (Birds/pt) ; P = 0 .1510
0 .2
0.1
0.15
0 .1
0 .05
0
2.19 Red-winged Blackbird (Birdslpt) ; P = 0 .472
0
0 <1.5
1.5-6
6-12Shrub Density (#Iha)
<1.5
1.5-6
6-12Shrub Density (#/ha)
2.21 Sedge Wren (Birds/pt) ; P = 0 .041
> 12
> 12
0
Shrub Density (#/ha)
2.23 Upland Sandpiper (Birds/pt) ; P = 0 .849
FIGURE 2. CONTINUED .
<1.5
1 .5-6
6-12Shrub Density (#/ha)
> 12
0.08
0.06
0.04
0.02
0
2.20 Savannah Sparrow (Birds/pt) ; P < 0 .001
0 .1
0
0
0
0
0
<1.5
1.5-6
6-12Shrub Density (#/ha)
<1.5
1.5-6
6-12Shrub Density (#/ha)
2.22 Song Sparrow (Birds/pt); P < 0.001
<1.5
1.5-6
6-12Shrub Density (#/ha)
2.24 Willow Flycatcher (Birds/pt) ; P < 0 .001
0.4
0 .3
0.2
< 1 .5
1 .5-6
6-12Shrub Density (#/he)
> 12
> 12
> 12
>12

0 .7
0 .6
0 .5
0 .4
0 .3
0 .2
0 .1
00 <1.5
1 .5-6
6-12Shrub Density (tma)
FIGURE 2. CONTINUED .
•
2.25 Yellow Warbler (Birds/pt) ; p < 0.001
>12

0d 4aE•
2Z
0
8
0
3.1 Grasshopper Sparrow
0-24
0-24
25-49
50-74
75-99
100-124Distance from Road (m)
125-150
25-49
50-74
75-99
100-124 125-150Distance from Road (m)
3.2 Eastern Meadowlark
25-49
50-74
75-99
100-124Distance from Road (m)
3.4 Dickcissel
0-24 125-150
0-24
25-49
50-74
75-99
100-124 125-150Distance from Road (m)
•
6
FIGURE 3. INFLUENCE OF ROADS ON BIRD ABUNDANCE WITHIN PROJECT GRASSLANDS . ASTERISKS DENOTE A SIGNIFICANT DEPARTURE FROMEXPECTED ABUNDANCE FOR PARTICULAR DISTANCE CLASSES .
10
NA3 8a
v 6Cw0 4daM 2
Z
0
2.5
NR 20
1 .5C
Oi. 1mM
E0 .5
Z
0

4.01 American Goldfinch (Birds/pt) ; P = 0 .018
0 .50
0 .40
0.30
0.20
0.10
0.00
4.03 Brown-headed Cowbird (Birds/pt) ; P=0.479
0 .3
0.25
0.2
0 .15
0.1
0 .05
0
4.05 Brown Thrasher (Birds/pt) ; P = 0 .159
0.14
0.12
0.1
0.08
0.06
0.04
0.02
0
4.07 Common Yellowthroat (Birds/pt) ; P < 0 .001
1 .0
0 .8
0.6
0.4
0.2
•
0.0
0-1
0-1
0-1
0-1
1-2
2-3
3-5Litter Depth (cm)
1-2
2-3
3-5Litter Depth (cm)
1-2
2-3
3.5Litter Depth (cm)
1 .2
2-3
3-5Litter Depth (cm)
>5
>5
>5
>5
4.02 American Robin (Birds/pt) ; P = 0 .037
020
0.15
0.10
0.05
0.00
0 .15
0.1
0.05
0 .3
0 .2
0 .1
0 .0
0
0-1
4.04 Bobolink (Birds/pt) ; P < 0.0011 .4
1 .2
1
0 .8
0 .6
0 .4
0 .2
00-1
4.06 Common Grackle (Birds/pt) ; P = 0 .269
0.2
0-1
1-2
2-3
3-5Litter Depth (cm)
1-2
2-3
3.5Litter Depth (cm)
1-2
2-3
3-5Litter Depth (cm)
4.08 Dickcissel (Birds/pt) ; P = 0 .0370.4
0-1 1-2
2-3
3-5Litter Depth (cm)
FIGURE 4 . INFLUENCE OF LITTER DEPTH ON BIRD ABUNDANCE (MEAN NUMBER OF BIRDS/POINT)WITHIN PROJECT GRASSLANDS . P-VALUES RESULTING FROM A ONE-WAY ANOVA COMPARING BIRDDENSITIES AMONG LITTER DEPTH CLASSES ARE ALSO SHOWN FOR EACH SPECIES .
>5
>5
>5
>5

4.09 Eastern Kingbird (Birds/pt) ; P = 0 .015
0 .30
0 .25
0.20
0.15
0.10
0.05
0.00
4.11 Field Sparrow (Birds/pt) ; P = 0 .261
0.7
0.6
0 .5
0 .4
0 .3
0 .2
0 .1
0
4.13 Grasshopper Sparrow (Birds/pt) ; P < 0.001
1 .61 .4
1 .2
1
0 .8
0 .6
0 .4
0 .2
0
4.15 House Wren (Birds/pt) ; P = 0 .210
0 .1
0 .1
0 .1
0
0
0 .0
0-1
0-1
0-1
0-1
1-2
2-3
3-5Litter Depth (cm)
1-2
2-3
3-5Litter Depth (cm)
1-2
2-3
3-5Litter Depth (cm)
FIGURE 4. CONTINUED .
1-2
2-3
3-5Litter Depth (cm)
>5
>5
>5
>5
4.10 Eastern Meadowlark (Birds/pt) ; P < 0.0011 .40
1 .20
1 .00
0.80
0.60
0.40
0.20
0.00
4.12 Gray Catbird (Birds/pt) ; P < 0.001
0 .2
0.15
0 .1
0.05
0 .1
0 .4
0.3
0.2
0.1
0
0 .1
0 .1
0
0
0 .0
00-1
4.14 Henslow's Sparrow (Birds/pt) ; P < 0 .001
0.5
0-1
4.16 Indigo Bunting (Birds/pt) ; P = 0.0740 .1
0-1
0-1 1-2
2-3
3-5Litter Depth (cm)
1-2
2-3
3-5Litter Depth (cm)
1-2
2-3
3.5Litter Depth (cm)
1-2
2-3
3-5Litter Depth (cm)
>5
>5
>6
>5

4.17 Orchard Oriole (Birds/pt) ; P < 0 .001
0.20
0.16
0.10
0.05
0.00
4.19 Red-winged Blackbird (Birds/pt) ; P = 0 .1392 .5
2
1 .5
1
0.5
0
•
4.21 Sedge Wren (Birds/pt) ; P < 0 .0010.5
0 .4
0 .3
0.2
0 .1
0
0 .2
0.1
0 .1
0 .0
0-1
0-1
0-1
1-2
2-3
3-5Litter Depth (em)
1-2
2-3
3-5Litter Depth (cm)
>5
>5
1-2
2-3
3-5Litter Depth (cm)
4.23 Upland Sandpiper (Birds/pt); P = 0 .0010 .2
>5
0.1 1-2
2-3
3-5Litter Depth (cm)
FIGURE 4. CONTINUED .
>5
4.18 Ring-necked Pheasant (Birds/pt) ; P = 0.2240.20
0.15
0 .10
0.05
0.00
0 .4
0 .3
0 .2
0 .1
0
0-1
0-1
1-2
2-3
3-5Litter Depth (cm)
4.20 Savannah Sparrow (Birds/pt) ; P < 0 .0010 .5
1-2
2-3
3-5Litter Depth (cm)
4.22 Song Sparrow (Birds/pt) ; P = 0 .0500.7
0.6
0.5
0 .4
0 .3
0 .2
0 .1
00-1 1-2
2-3
3-5Litter Depth (cm)
4.24 Willow Flycatcher (Birds/pt) ; P = 0 .8310 .1
0 .1
0 .1
0 .1
0
0
0.0
>5
>5
>5
4.25 Yellow Warbler (Birds/pt) ; P = 0 .245
0.16
0.14
0.120.10
0.080.060.04
0.020.00
0-1
FIGURE 4. CONTINUED .
1-2
2-3
3-5Litter Depth (cm)
>5
5.01 American Goldfinch (Birds/pt) ; P = 0.255
5.02 American Robin (Birds/pt) ; P = 0.0340 .50
0.25
0.40
0 .30
0 .20
0.10
0 .00
5.03 Brown-headed Cowbird (Birds/pt) ; P = 0 .033
0 .5
0.4
0.3
0.2
0 .1
0
•
5.05 Brown Thrasher (Birds/pt) ; P = 0.112
0.160 .140 .12
0 .10 .080 .06
0.040.02
0
5.07 Common Yellowthroat (Birds/pt) ; P < 0 .0011 .0
0-10 10-20
20-30
30-40
40-50Vegetation Height-Density (cm)
0-10
0-10
10-20
20-30
30-40
40-50Vegetation Height-Density (cm)
10-20
20-30
30-40
40-50Vegetation Height-Density (em)
10-20
20-30
30-40
40-50Vegetation Height-Density (cm)
>50
>50
>50
>50
0.20
0.15
0 .10
0 .05
0.000-10
5.04 Bobolink (Birds/pt) ; P < 0 .041
I
5.06 Common Grackle (Birds/pt) ; P = 0 .8900.14
0.12
0 .1
0.08
0.08
0.04
0.02
00-10
5.08 Dickcissel (Birds/pt) ; P = 0 .030
0.5
0 .4
0 .3
0 .2
0 .1
0 .00-10
10-20
20-30
30-40
40-50Vegetation Height-Density (cm)
10-20
20-30
30-40
40-50Vegetation Height-Density (cm)
10-20
20-30
3040
40.50Vegetation Height-Density (cm)
10-20
20-30
30-40
40.50Vegetation Height-Density (cm)
>50
>50
>50
>50
FIGURE 5. INFLUENCE OF VEGETATION HEIGHT-DENSITY ON BIRD ABUNDANCE (MEAN NUMBER OFBIRDS/POINT) WITHIN PROJECT GRASSLANDS. P-VALUES RESULTING FROM A ONE-WAY ANOVACOMPARING BIRD DENSITIES AMONG HEIGHT DENSITY CLASSES ARE ALSO SHOWN FOR EACH SPECIES .

5.09 Eastern Kingbird (Birds/pt) ; P = 0 .0450.30
0.25
0.20
0.16
0.10
0.05
0.00
5.11 Field Sparrow (Birds/pt) ; P = 0 .2820 .7
0 .6
0 .5
0 .4
0 .3
0.2
0.1
0
0-10 10-20
20-30'
3040
40.50Vegetation Height-Density (cm)
0-10 10-20
20-30 - 30-40
40-50Vegetation Height-Density (cm)
5.13 Grasshopper Sparrow (Birds/pt) ; P < 0.0012
10-20
20-30
30-40
40-50Vegetation Height-Density (cm)
5.15 House Wren (Birds/pt) ; P = 0 .2440 .1
0 .1
0 .1
0 .1
0
0
•
0.0
>60
>50
>50
0-10 10-20
20.30
30-40
40-50Vegetation Height-Density (cm)
FIGURE 5. CONTINUED .
>50
5.10 Eastern Meadowlark (Birds/pt) ; P < 0.0011 .40
1 .20
1 .00
0.80
0 .60
0.40
0.20
0.000-10 10-20
20-30
30-40
40-50Vegetation Height-Density (cm)
5.12 Gray Catbird (Birds/pt) ; P = 0.0040 .2
0.15
0.1
0.05
0
>50
0-10 10-20
20-30
30-40
40.50Vegetation Height-Density (cm)
5.14 Henslow's Sparrow (Birdslpt) ; P < 0.0010 .8
0 .6
0 .4
0.2
00-10
5.16 Indigo Bunting (Birds/pt) ; P = 0 .056
0.5
0 .4
0 .3
0.2
0.1
0.00-10
10-20
20-30
30-40
40-50Vegetation Height-Density (cm)
10-20
20-30
30-40
40-50Vegetation Height-Density (cm)
>50
>50
>50

0.10
0.08
0.06
0.04
0.02
0.00
5.17 Orchard Oriole (Birds/pt) ; P = 0 .3990.12
0-10
0-10
0-10
10-20
20-30
30-40
40-50
Vegetation Height-Density (cm)
5.19 Red-winged Blackbird (Birds/pt) ; P < 0 .001
10-20
20-30
30-40
40.50Vegetation Height-Density (cm)
•
5.21 Sedge Wren (Birds/pt) ; P < 0 .001
10-20
20-30
30-40
40-50
Vegetation Height-Density (cm)
5.23 Upland Sandpiper (Birds/pt) ; P = 0 .001
10-20
20-30
30-40
40-50Vegetation Height-Density (cm)
FIGURE 5. CONTINUED .
>50
>60
>50
>50
5.18 Ring-necked Pheasant (Birds/pt) ; P = 0 .6280.10
0.08
0 .06
0.04
0.02
0 .00
5.20 Savannah Sparrow (Birds/pt) ; P < 0 .001
0.1
0-10
5.22 Song Sparrow (Birds/pt) ; P = 0 .012
5.24 Willow Flycatcher (Birds/pt) ; P = 0 .006
0 .0
0-10
0-10
0.10
0-10
10-20
20-30
30-40
40-50
Vegetation Height-Density (cm)
10-20
20-30
30-40
40-50
Vegetation Height-Density (cm)
>50
>50
10-20
20-30
30-40
40-50Vegetation Height-Density (cm)
10-20
20-30
30-40
40-50Vegetation Height-Density (cm)
>50
>50
0.8
0 .6
0 .4
0.2
0

w5.25 Yellow Warbler (Birds/pt) ; P = 0 .032
0.30
0.25
0.20
0.15
0.10
0.05
0.000.10 10-20
20.30
30-40
40-50Vegetation Height-Density (cm)
FIGURE 5. CONTINUED.
>50