FALCOM PETROCHEMICALS ETF...FALCOM Financial Services, a Shariah complaint Saudi Investment bank,...
23
Transcript of FALCOM PETROCHEMICALS ETF...FALCOM Financial Services, a Shariah complaint Saudi Investment bank,...

1

2
FALCOM PETROCHEMICAL ETF WELCOMES International Investors to the Kingdom of SAUDI ARABIA. TADAWUL (THE SAUDI BOURSE) is about to list the second FALCOM ETF ushering in a new era in invest-ments. FALCOM Financial Services, a Shariah complaint Saudi Investment bank, took the lead in the MENA region by providing clients with a flavor of the first ETF , the FALCOM F3O thus opening the gateway to international investors who were not very happy with the SWAP route provided earlier. ETF( exchange traded funds ) are new to the region . FALCOM has been working closely with the regulator and capital market authorities for the last two years to engineer the environment that supports the introduction of a sophisticated investment vehicle such as an ETF. The Petrochemicals ETF comes from one the most recognized investment bank in Saudi Arabia.The Middle East alone produces 11% of the world’s petrochemicals. It is expected that this ratio will rise to be 16% in 2015.It is using its financial reserves to develop its infrastructure and manufacturing bases. The ETF launch itself is a big push. International investors are serious. Today there are over 3000 ETFs and it has grown to become a trillion dollar industry. The country’s vision of becoming competitive in all sectors of the economy can only be realized by a open capital market that facilitates local and international investors the second ETF is a step in opening the country’s door to investors who wishes to ride the engine that drives the world.

3
Fund Investment StrategyThe Fund invests at least 95% of its assets in equities of petrochemical sector that are Shariah-compliant, listed and traded on Tadawul in the Kingdom of Saudi Arabia.
The Fund will passively invest in the components of FSPI Falcom Saudi Petrochemical Index, the Benchmark Index, however Fund rebalancing activities will be undertaken periodically (at least once a quarter) to ensure proper tracking of performance of the benchmark index and keeping of adequate cash in the Fund. Unlike many mutual funds, the Falcom Saudi Petrochemical.ETF does not try to “beat” the Benchmark and does not seek temporary defensive investments when the market declines or appears overvalued. The Fund seeks to replicate the performance of the Benchmark Index.
The Fund manager will assess appropriateness of the Benchmark Index at least on an annual basis in order to ensure that the overall Fund objectives of long-term growth and capital appreciation are appropriately .The Fund invests in the investment universe of the Benchmark Index, FSPI Falcom Saudi Petrochemical Index, which consists of Sharia’h compliant shares of all companies in the Petrochemical sector of Saudi Stock Ex-change (“Tadawul”).
“Innovation is the key, said the CEO of FALCOM FINANCIAL SERVICES “with the ETF we had to invent as well as invest in a whole new risk management tool, as classical models fell short as derivatives and other hedging instruments are not allowed under the shariah law neither is shorting allowed”.
He added “This template was invented in our kitchen so to speak as innovation is embedded as a core value within the organization. We laid the foundations and the financial capability that provide our clients with the very best here in the local market. We also innovated with our services by providing our clients with six de-livery channels to trade. “ On the investor empowerment front, our information portal FALCOMWATCH.com went through a comprehensive upgrade and this enhanced the site traffic. We are in the forefront of index development, with first licensed index by the Saudi stock market.
Now you can see our investment empowerment and decision making technologies helping our clients in the region as we provide the platforms for Oman. ETFWATCH is also serving our client’s needs to check the INAV instantaneously.
At home we are experiencing an evolution with positive moves by the Capital market authorities in spear-heading the liberalization process said the CEO as his closing remarks on the listing PETROCHEMICALS ETF , we have shown the region that we walk the talk and deliver. With the launch of the Petrochemicals ETF the investment bank is clearly way ahead of all banks in the region when it comes to new product development whilst focusing on the needs of investors. The bank has won 17 international wards within a short span of 3 years and is considered on the best in the region.

1
FALCOM A
FALExec
The globoom fcoincidiproductlevels a
Howeveand easfacilitiepetroch
Althougit only petroch31.25%geograpavailabipast. Tchain tooil and
Petrochmarket.represeconstrufree floa
ETF is acountryfunds ainvestoallocatiofrom thsome safford tbelieve
DilshanDilshan.p+966(1)
Asset Manage
LCOMcutive su
obal petrochfrom 2005-2ing with thets. Most of
and some ev
er, the positstern count
es, being clohemical sect
gh, Saudi Arhas an a
hemical prod% of Japane
phical locatility of fundThe plans ao produce sppetrochemi
hemical sec. Although
entative as uction stageat basis and
a new vehicy’s first ETF as far as thrs. Furtheron. Since S
he market, Eigns of recoto miss the that FALCO
n Punchihewpunchihewa@2118452
ement
Petroummary
hemical sect2008. The e industry ovthe petroch
ven have shu
tion with Mer parts. Tser to the m
tor an attrac
rabia accounapproximateducers are cese Naphthation, stableding have hre underwapecialty checal giants to
tor accounth the petromost of th. Sabic acco
d is trading a
cle in the Sin March 20
he cost, fler, fund manSaudi StockETF is an idovery in a lopportunity
OM Petroche
For I
chemy
tor is once aworst ever
ver capacityhemical playut down the
Middle EasteThe feed stomarket and active investm
nts for neare 7% of charged onlya prices for e economichelped to boay not only emicals. Theo set up larg
t for nearlyochemical ise companieounts for neat around 18
Saudi invest010. ETF is
exibility, divnagers couldk market is sdeal proxy folong term py of the gro
emical ETF w
sa
nternal Circul
ical ET
again at ther global ecoy resulted inyers are opeeir plants, m
ern producerock cost advavailability oment story.
rly 25% of wthe world’sy $0.75/mmpropane by
c and politoost the capto expand e unique adge facilities
y 35% of s trading aes are yet tearly 46% o8x PER leve
tment arenas better posversificationd effective ustill closed for this. Asperspective,owing and p
would best s
lation Only
TF
e tail end ofonomic cris
n lower demrating at beostly in the
rs is quite dvantage, loof funding fo
world oil ress petroche
mbtu for ethy Saudi Aramtical systempacities andthe capacit
dvantages hin Saudi Ara
the marketat a currentto operate
of the markeels despite it
a with FALCsitioned com and transuse ETFs asfor foreignthe global
, a global/rprofitable S
serve this pu
f the down csis after the
mand and prielow average
western he
different to wer energyor the expa
serves and smicals mar
hane gas andmco. In ad
m, infrastrud profitabilities but alsoave attracteabia as joint
t capitalizatt PER of nat full pote
et capitalizats expected
COM succesmpared to th
parency ares a low costinvestors topetrochemi
regional funSaudi petrocurpose.
Jun 30,
cycle after ie great depces of petroe capacity u
emisphere.
that of they cost, infransion have
sizable gasrket. Furtd given a diddition, the ucture facility during tho to go up ted most of tt ventures.
tion of Sauearly 19x, ential or st
ation of the capacity ad
ssfully launche traditionae concernedt strategy fo buy stockical cycle is
nd managerchemical sec
2010
its recent preciation ochemical utilization
e western astructure made the
reserves, ther, the scount ofstrategic
ities and he recent the value the world
udi Stock it is not
till at the sector on
dditions.
ching the al mutual d for the for sector
ks directly s showing
may not ctor. We

2
FALCOM Asset Management For Internal Circulation Only Jun 30, 2010
Report on FALCOM Petrochemical ETF 2
Global Petrochemical Industry
Cyclical industry to obscure planning
Petrochemical industry moves in cycles with periods of under capacity resulting in expansions leading to overcapacity. Therefore, prices and margins fluctuate accordingly and make business planning more difficult. For an industry with a high fixed cost structure, customers can impose pressure on margins and therefore the customers are at an advantages position over petrochemical producers. Exerting pressure in times of fluctuating feedstock prices would prevent producers passing on the total adverse variance of prices to customers. On the other hand, in times of under supply, producers could enjoy higher margins by passing the higher prices to customers to some extent and the bargaining power of customers would be low.
Typical petrochemical industry cycle Industry is at the tail end of the down cycle
Source : CMAI
Current State of the Global Industry Market Fundamental Status What it is telling is Demand Better in Asia – Others weak to
moderateStimulus and re-stocking as play; some signs of return to real demand curve
Supply Plentiful – Except where operating problems exist
Market remains disciplined. Solving operating problems will solve supply issues
Capacity Very poor commissioning results; more units coming
New Mid-East & China units have had limited impact – this will soon change!
Pricing Higher incremental costs create a higher floor price
Closures adequate this far; successfully balancing supply with demand
Margins Non-existent to better-than-expected (operating issues)
Region and value chain specific. Integration benefits very obvious
Source; CMAI

3
FALCOM Asset Management For Internal Circulation Only Jun 30, 2010
Report on FALCOM Petrochemical ETF 3
Global recession affected the petrochemicalindustry
As the global recession resulted in the global economy to contract 4% for three quarters, the demand for the chemical sector also affected badly. There were permanent facility shutdowns announced at several sites in the US and Europe. Nova Chemicals’ acquisition by IPIC and LyondellBasell in Chapter 11 Bankruptcy were some examples.
As the developed economies were struggling with the financial crisis, stimulus packages restarted demand growth in China which is cascading to other developing countries. Middle East was active in building up the capacity as the higher persistent oil prices have helped to fund most of the projects.
Promising world outlook despite the set back in 2008-09
The rebound of the global demand for basic chemicals and plastics was led by the developing world as depicted below. The growth in local consumption especially in China and India was behind the recovery. As the growth in petrochemical sector would average around 1.5 times of world GDP, it is expected that the economic recovery to have similar effect on world petrochemical demand. North America being a mature market suffered mostly in the refinery related sector. Western Europe also faced similar situations with lower and declining average annual growth rates.
Demand for Basic Chemicals & Plastics
Source: CMAI
Middle East supply gap in the short term
In the basic chemical & plastic industry, capacity expansion is expected to peak in 2010 with over 50 million tons, of which nearly 30% would come from the middle east and 42% would come from China. Although, Asia alone can not absorb the low-cost new capacities of the Middle East in the long run, the challenges faced by middle eastern producers in commissioning and operating new units would benefit the other producers in the short run.

4
FALCOM Asset Management For Internal Circulation Only Jun 30, 2010
Report on FALCOM Petrochemical ETF 4
China imports in light of Middle East production potential
Source : CMAI
Volatile margins to take a “U” turn from 2011
The industry is expected to have the worst supply overhang since early 1980s. Thus the industry margins would witness a slow recovery until 2011. However, the delays in commissioning the Middle Eastern plants would create a supply bottle neck and this could have limited down ward pressure on petrochemical prices despite the volatile oil prices. A sharp recovery of the margins is expected from 2013 onwards.
Basic Chemicals & Plastic EBIT comparison (Volume WA basis)
Source: CMAI

5
FALCOM Asset Management For Internal Circulation Only Jun 30, 2010
Report on FALCOM Petrochemical ETF 5
Middle Eastern & Saudi Petrochemical Industry
Abundant oil and gas reserves to support
The Middle East and North Africa (MENA) region, which is blessed with huge oil and gas reserves, has been in a major expansion drive of its petrochemical industry. It is estimated that, the increase in capacity from 2007 – 2010 equals the total capacity accumulated in the past six decades in the region’s petrochemical industry. In the case of Saudi Arabia, the crude oil reserves are around 264 billion barrels, one forth of world reserves and, gas reserves amount to 243 Tcf, ranked number four in the world as per the government estimates. At the current production levels, the proven reserves will last for approximately 80-100 years. In addition, the exploration activities are in high gear to add new reserves.
Oil price and excess demand would increase the feedstock prices
High fossil fuel prices motivate improvements in exploration and extraction technology. SRI Consulting Inc projects that adequate feedstock will be available for petrochemical production from 2007 to 2015. Feedstock requirement will continue to grow faster at approximately 1.5 times the rate of supply. Since petrochemical feedstock accounts for only a fraction of supply, feedstock should be available without resorting to extraordinary processing steps. However, the growing supply imbalance in feedstock and fuel demand (e.g., gasoline) among regions is projected to increase, resulting in increasing import and export of feedstock, with naphtha from Africa and the Middle East.
Diversify from oil Although Saudi Arabia accounts for nearly 25% of the global oil reserves and sizable gas reserves, it has only 7-8% share in the petrochemical market. In order to take advantage of the low feedstock prices, energy cost, being closer to the market, Saudi Arabia has been in a major expansion drive of the petrochemical sector to have a 15% global share in the future. This would enable the country to diversify from its oil dominated products. Further, the high persistent oil prices have given them a financial muscle to support the infrastructure base for the petrochemical and plastic industries.
Oil revenue and Ethylene capacities of selected ME Countries
Source: CMAI
6
FALCOM Asset Management For Internal Circulation Only Jun 30, 2010
Report on FALCOM Petrochemical ETF 6
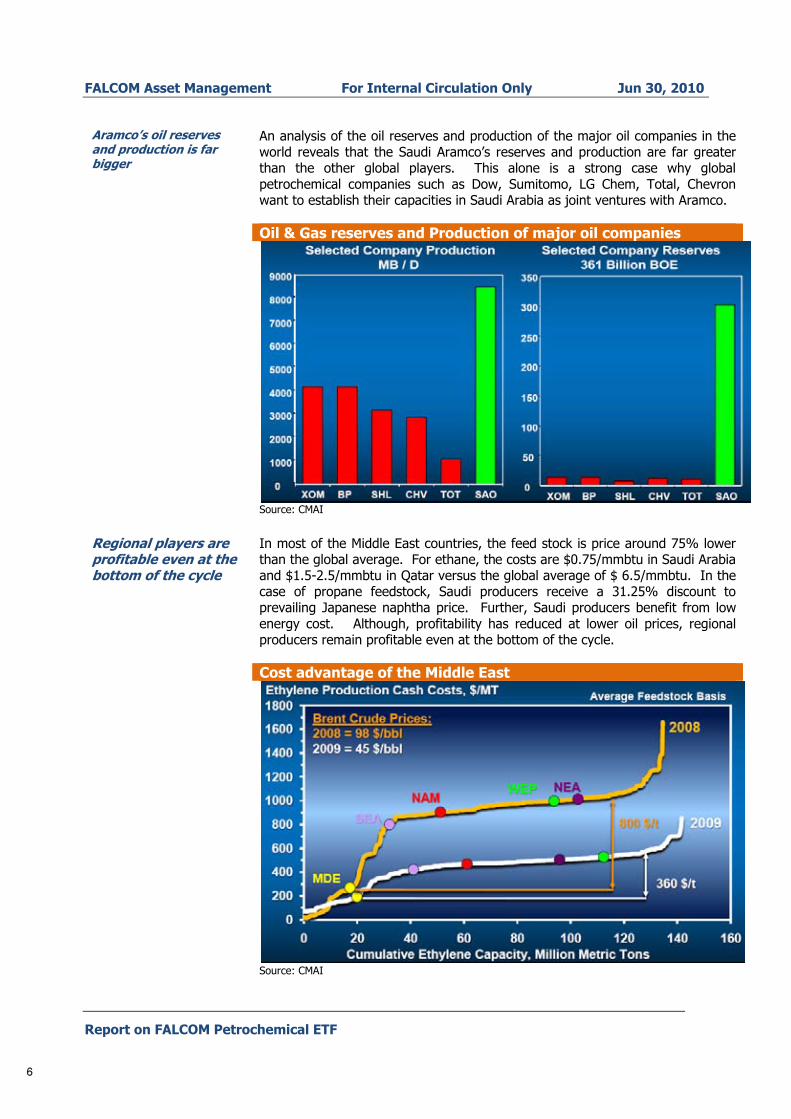
Aramco’s oil reserves and production is far bigger
An analysis of the oil reserves and production of the major oil companies in the world reveals that the Saudi Aramco’s reserves and production are far greater than the other global players. This alone is a strong case why global petrochemical companies such as Dow, Sumitomo, LG Chem, Total, Chevron want to establish their capacities in Saudi Arabia as joint ventures with Aramco.
Oil & Gas reserves and Production of major oil companies
Source: CMAI
Regional players are profitable even at the bottom of the cycle
In most of the Middle East countries, the feed stock is price around 75% lower than the global average. For ethane, the costs are $0.75/mmbtu in Saudi Arabia and $1.5-2.5/mmbtu in Qatar versus the global average of $ 6.5/mmbtu. In the case of propane feedstock, Saudi producers receive a 31.25% discount to prevailing Japanese naphtha price. Further, Saudi producers benefit from low energy cost. Although, profitability has reduced at lower oil prices, regional producers remain profitable even at the bottom of the cycle.
Cost advantage of the Middle East
Source: CMAI

7
FALCOM Asset Management For Internal Circulation Only Jun 30, 2010
Report on FALCOM Petrochemical ETF 7
Dependence on ethane will be lower
However, Saudi Arabia could face a capacity constraints in the supply of ethane as it is derived from associated gas of oil production. Thus, other feed stocks would increase its share in the long run. This could affect the average feed stock prices in Saudi Arabia to an extent. However, the profitability may not be affected due to the availability of by products and value added products. Prices of ethane based products usually face high volatility and the margins could squeeze with the added capacities in the long run.
Changing composition of Saudi feedstock
Source: CMAI
Capacity expansion amidst the turbulence
Although the recent global economic crisis hit the petrochemical industry, its impact on Saudi Arabia’s petrochemical industry was minimal as it operates at reasonable cash margin. Although, the capacity enhancements and the new projects flow had a long pause, the availability of funding, the supply of feedstock and the aggressive foreign investment in the sector managed to have a strong recovery. Further, the sharp drop in steel and commodity prices, engineering and capital costs of petrochemical industry was a blessing in disguise.
Going up the value chain
Another development in Saudi petrochemical industry is going up the value chain to produce specialized and value added products which have a lower price volatility compared to basic petrochemicals. Some examples are as follows.
SABICSaudi Kayan Polycarbonate ExxonMobil C4’s Joint venture ABS capacity in Jubail
Saudi Aramco PO, MMA,PMMA at PetroRabigh Derivatives at Dow Ras Tanura
Other projects Nylon, TDI, PO derivatives PE & PP downstream investments

8
FALCOM Asset Management For Internal Circulation Only Jun 30, 2010
Report on FALCOM Petrochemical ETF 8
ME producers to be acquisitive
Saudi Arabia has a track record of large acquisitions during the recent past amidst the global economic crisis hitting the streets. Despite some acquisitions were done at comparatively higher prices at the uptrend of the cycle, successful entry to the new markets would benefit them in the long run.
Sabic – DSM/GE Plastics/ Huntsman Olefins IPIC – Borealis/OMV/Nova Tasnee – Millennium TiO
Sabic’s business portfolio position is graphically shown below and its products segments such as ethylene, polycarbonate, propylene, polypropylene, LLDPE, HDPE and LDPE are well positioned in the matrix.
SABIC Business Portfolio – Global*
Source: CMAI
New projects to double the ethylene capacity by 2014
Total ethylene capacity in Saudi Arabia is expected to double by 2014 with the expected capacity addition of nearly 8.5 million tons. The ethylene cracker projects announced so far are as follows.
‘000 tpa Eastern Petrochemicals (Sharq) National Chevron Phillips PetroRabigh Ras Tanura Integrated Petrochemical Co SEPC Saido Kayan Yansab
1,300 1,200 1,250 1,200 1,010 1,350 1,300

9
FALCOM Asset Management For Internal Circulation Only Jun 30, 2010
Report on FALCOM Petrochemical ETF 9
Saudi Stock market
TASI has outperformed DJIA from 1994 to date
For the last 15 years, a comparison of stock indices reveals that oil has out performed the DJIA (Dow Johns Industrial Average) from 2005. Further, TASI has out performed DJIA from 2004. Although, TASI peaked in 2006, the bubble burst within a year with a major correction, commonly seen in evolving markets.
A Comparison of Stock Indices and Oil (1994-2010)
Source : Falcom Database
Oil & petrochemicals highly correlated
Petrochemical sector has outperformed TASI most of the time from 2007 to June 2010. Further, petrochemical sector exhibits a strong correlation with oil prices than with TASI. It is also notable that TASI moved in line with the changes in DJIA from the time financial/economic crisis hitting the markets in 3Q2008.
A Comparison of Stock/Sector Indices and Oil (2007-2010)
Source : Falcom Database
0
200
400
600
800
1,000
1,200
Jan94
Jul9
4
Jan95
Jul9
5
Jan96
Jul9
6
Jan97
Jul9
7
Jan98
Jul9
8
Jan99
Jul9
9
Jan00
Jul0
0
Jan01
Jul0
1
Jan02
Jul0
2
Jan03
Jul0
3
Jan04
Jul0
4
Jan05
Jul0
5
Jan06
Jul0
6
Jan07
Jul0
7
Jan08
Jul0
8
Jan09
Jul0
9
Jan10
TASI
Oil (Brent)
DJIA
0
50
100
150
200
250
300
Dec
06
Feb07
Apr
07
Jun07
Aug
07
Oct
07
Dec
07
Feb08
Apr
08
Jun08
Aug
08
Oct
08
Dec
08
Feb09
Apr
09
Jun09
Aug
09
Oct
09
Dec
09
Feb10
Apr
10
Jun10
TASI
Petrochemical
DJIA
Oil (Brent)

10
FALCOM Asset Management For Internal Circulation Only Jun 30, 2010
Report on FALCOM Petrochemical ETF 10
Sabic dominates the sector
Although, Sabic accounts for nearly 2/3 of the petrochemical sector market capitalization, on a free float basis it accounts for less than 1/2 (46%). However, Sabic’s size is somewhat over weighted as Safco and Yansab are subsidiaries of Sabic. Further, most petrochemical companies are yet to commence commercial production or not operating at their full potential. Thus, we expect the high skewness towards Sabic to diminish over a longer period.
Market Capitalization weighting of Petrochemical stocks
Source : Falcom Database
Steady profit growth except in 4Q2008
Petrochemical sector has been contributing around 40% of the net profit of all Saudi stocks over the period. The steady growth of profits was witnessed in the market except in 4Q2008, when the global economic crisis hit the market and Kingdom Holdings recorded a net loss of nearly SR 31 billion due to the write down of investments.
Profitability of Saudi Stocks (from 1Q1994 to 1Q2010)
Source : Falcom Database
0%
10%
20%
30%
40%
50%
60%
70%Market Weighting
Free Float Weighting
(30)
(20)
(10)
10
20
30
1Q94
3Q94
1Q95
3Q95
1Q96
3Q96
1Q97
3Q97
1Q98
3Q98
1Q99
3Q99
1Q00
3Q00
1Q01
3Q01
1Q02
3Q02
1Q03
3Q03
1Q04
3Q04
1Q05
3Q05
1Q06
3Q06
1Q07
3Q07
1Q08
3Q08
1Q09
3Q09
1Q10
SR bn
Other
Petrochemical

11
FALCOM Asset Management For Internal Circulation Only Jun 30, 2010
Report on FALCOM Petrochemical ETF 11
Sabic dominates the profits as well
Here again Sabic, being the well established and the largest producer in the Saudi petrochemical market takes the lion share of profit in the sector. Although, the sector exhibited a healthy profit growth, the global economic crisis hit the industry with lower petrochemical prices, low margins and write downs of goodwill, investments and inventories in late 2008 to early 2009.
Profitability of the Petrochemical stocks (From 1Q1994 to 1Q2010)
Source : Falcom Data base
Sector potential is yet to realize
A summary of investment ratios and the relative performance of the stocks are given in the table below. Accordingly, petrochemical sector accounts for nearly 35% of the total market capitalization. Year to date performance of the sector is almost neutral although the individual stock performance ranges from -17% to 24%. Sector BETA of nearly 1.5 explains the relative risk and return of the sector. Since most of the companies are yet to realize its full potential, PER multiple does not reflect an accurate picture.
Source : Falcom Data base
(2)
2
4
6
8
10
1Q94
3Q94
1Q95
3Q95
1Q96
3Q96
1Q97
3Q97
1Q98
3Q98
1Q99
3Q99
1Q00
3Q00
1Q01
3Q01
1Q02
3Q02
1Q03
3Q03
1Q04
3Q04
1Q05
3Q05
1Q06
3Q06
1Q07
3Q07
1Q08
3Q08
1Q09
3Q09
1Q10
SR bn
Petro Rabigh Kayan
APPC SIPCHEM
Yansab Sahara
SIIG Nama
Alujain NIC
Safco Sabic
Petrochem Methanol
Code Name Price BETA Average Daily Issued shares Market Cap. Market Free 2008 2009 2010YTD 1Year P / E P / B Dvd. Yld. Volume (m) (million) (SR m) Weighting Float
2001 Methanol 14.45 -3% 38% -6% 1.21 nm 1.23 0.0% 1.92 120.60 1,743 0% 50%2002 Petrochem 15.80 na 56% 2% 1.44 nm 1.61 0.0% 7.57 480.00 7,584 1% 17%2010 SABIC 91.50 -69% 60% 11% 1.74 17.75 2.41 3.3% 7.57 3,000.00 274,500 22% 23%2020 SAFCO 132.50 -43% 35% 10% 0.58 16.41 5.51 9.8% 0.24 250.00 33,125 3% 37%2060 NIC 26.30 -69% 115% 3% 1.37 15.07 1.63 3.5% 1.82 506.75 13,328 1% 81%2170 Alujain 14.10 -77% 59% -18% 1.22 nm 1.91 0.0% 1.33 69.20 976 0% 85%2210 Nama 9.75 -68% 26% -10% 1.14 nm 0.79 0.0% 2.79 128.52 1,253 0% 100%2250 SIIG 19.45 -74% 116% -11% 1.50 18.32 1.55 0.0% 0.88 450.00 8,753 1% 89%2260 Sahara 21.10 -72% 116% 0% 1.56 29.79 1.77 0.0% 2.86 292.53 6,172 0% 90%2290 YANSAB 41.40 -72% 126% 24% 1.53 nm 3.93 0.0% 4.32 562.50 23,288 2% 40%2310 SIPCHEM 22.20 -65% 54% -7% 1.30 38.36 1.32 4.5% 1.36 333.33 7,400 1% 82%2330 APPC 21.65 -68% 62% -13% 1.40 22.37 1.85 0.0% 2.20 141.38 3,061 0% 96%2350 Kayan 18.95 -63% 87% 4% 1.50 nm 1.84 0.0% 23.59 1,500.00 28,425 2% 41%2380 PetroRabigh 29.40 -64% 128% -17% 1.39 nm 3.18 0.0% 3.48 876.00 25,754 2% 17%
-67% 70% 5% 1.49 18.96 2.41 3.0% 435,361 35% 31%
Shares Performance Ratios

12
FALCOM Asset Management For Internal Circulation Only Jun 30, 2010
Report on FALCOM Petrochemical ETF 12
FALCOM Petrochemical ETF
The evolution of ETFs
Global asset base of ETFs surpassed $ 1 trillion in 2009
Exchange traded fund are listed index funds that combine the diversification benefits of investment funds with the tradability of listed securities in one product. Despite its short history, the ETFs assets hit $ 1 trillion by the end of 2009 according to BlackRock. ETFs have become popular and widely used investment vehicles to active investment strategies including;
To gain diversified exposure to a market For core/satellite investing For buy and hold investing For active trader s who wish to take advantage of market movements
Thus, we observe that both the institutional investors and retail investors are making great use of ETFs. Further, active fund managers make use of ETFs to reduce the costs of active portfolio management strategies.
ETFs – Lower fees and higher market growth
Source : BCG, DB Research
Saudi ETFs offer unique advantages
ETFs in Saudi Arabia have unique advantage for the foreigner investors to have direct access to the Saudi stock market with minimal costs since the market is not yet open to foreign investors. However, they also could invest through mutual funds and Swap agreements which are costlier than ETFs and are less transparent, liquid and flexible than ETFs.
Falcom introduced the first ETF in KSA
FALCOM Financial Services was the first to introduce ETFs to the Saudi stock market with its launch in March 2010. The initial investor response was encouraging as the investor awareness will be developed over a longer period. Since Saudi Riyal is pegged to the US Dollar and economic & political stability of Saudi Arabia would attract foreigners which bodes well for the ETF market.

13
FALCOM Asset Management For Internal Circulation Only Jun 30, 2010
Report on FALCOM Petrochemical ETF 13
Salient features of FALCOM Petrochemical ETF
Investment Objectives FALCOM Saudi Petrochemical ETF aims to provide investors with long-term capital appreciation and growth by way of passively investing in the listed equities of Petrochemical sector of Saudi Stock Exchange (“Tadawul”). The Fund seeks to achieve the results that correspond to the performance, before fees and expenses, of the Benchmark Index.
Investment Strategy The Fund is passively managed by way of fully investing, barring a small cash portion, into the components of Benchmark Index in the same weightings with the aim of replicating the performance of the Index.
Benchmark Index Falcom Saudi Petrochemical Index
Risk Factors Investment Risk Equity Risk Concentration Risk Passive Management Risk Risk of Low Correlation Non Diversified Fund Risk Shariah Compliance Risk Liquidity Risk Risk of Under-Pricing Suspension of Trading of Underlying stocks
Basket of Securities
Source: Falcom

14
FALCOM
Report o
Initial
Source: Fa
ETF Tra
Source: Fa
PortSR 5
N25
Asset Mana
on FALCOM P
Creation of
alcom
ansaction P
alcom
tfolio Va500,000
o of Uni5,000
Par valuSR 20
agement
Petrochemic
f Units
Process
lue
its
ue / unit
For I
cal ETF
t
Internal Circ
Sipche4%
PRa
culation On
Kayan8%
NIC7%
Yansab7%
SIIG6%
mSahara4%
etroabigh3%
APPC2%
ly
Nama1%
PetroChem1%Alujain
1%
Jun 30, 2
Sabic46%
Safco9%
n Methanol1%
2010
14

15
FALCOM Asset Management For Internal Circulation Only Jun 30, 2010
Report on FALCOM Petrochemical ETF 15
Why invest in FALCOM Petrochemical ETF
Exposure to Petrochemical is vital as the industry is in the lower end of the down cycle in a global perspective Saudi Arabia has 25% of global oil reserves but has only produces 7% of global petrochemicals Saudi petrochemicals players are the cost leaders due to its low feed stock price, energy costs and other infrastructure costs. Most of the petrochemical companies are listed in Tadawul and listing is one of the requirement for the feed stock allocation Although the stock market is restricted to foreigners for buying and selling securities directly, there are several options in investing in the market such as through mutual funds, swap agreements or ETFs. ETFs are the best vehicle for an international investor due to the lower cost, better transparency and liquidity over the other forms of investing. FALCOM pioneered the ETFs in Saudi Arabia with its first F30 ETF in March 2010.FALCOM has geared to introduce the Petrochemical ETF as the petrochemical is the best investment story in Saudi Arabia for both local and foreign investors in the long run.
16
FALCOM Asset Management For Internal Circulation Only Jun 30, 2010
Report on FALCOM Petrochemical ETF 16
Appendices
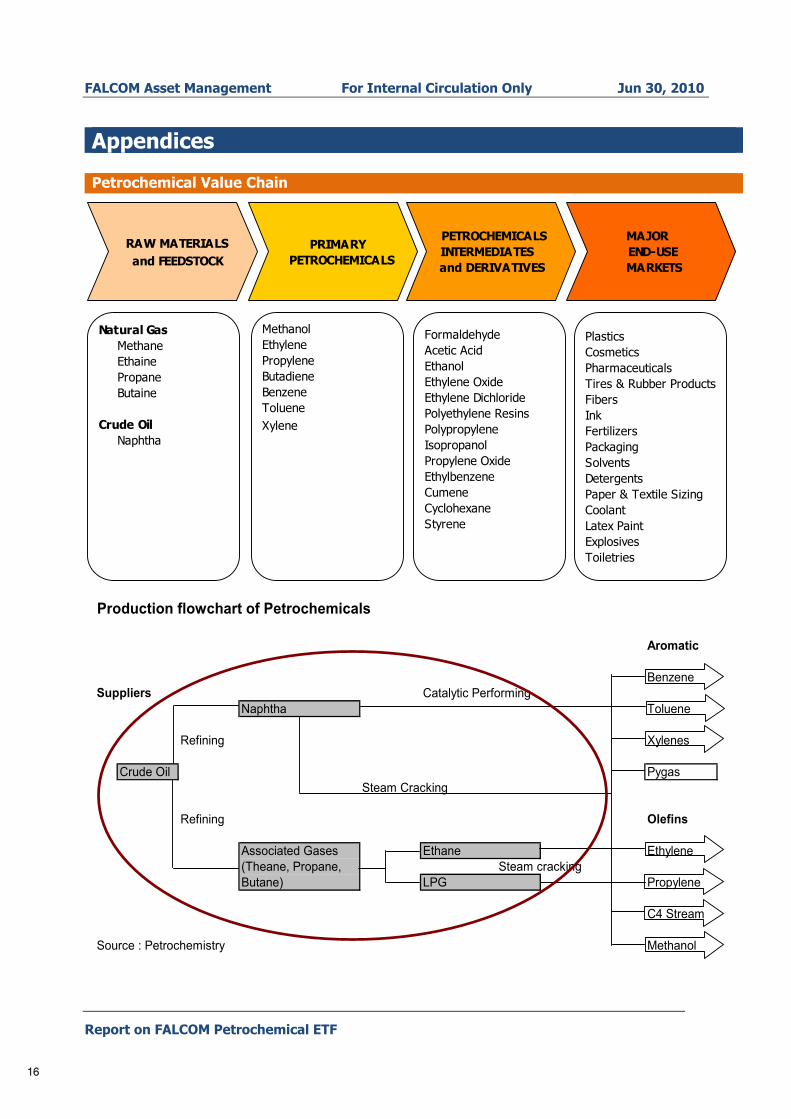
Petrochemical Value Chain
Production flowchart of Petrochemicals
Aromatic
BenzeneSuppliers Catalytic Performing
Naphtha Toluene
Refining Xylenes
Crude Oil PygasSteam Cracking
Refining Olefins
Ethane EthyleneSteam cracking
LPG Propylene
C4 Stream
Source : Petrochemistry Methanol
Associated Gases (Theane, Propane, Butane)
RAW MATERIALS and FEEDSTOCK
PRIMARY PETROCHEMICALS
PETROCHEMICALSINTERMEDIATES
and DERIVATIVES
MAJOR END-USE
MARKETS
PlasticsCosmeticsPharmaceuticalsTires & Rubber ProductsFibersInkFertilizersPackagingSolventsDetergentsPaper & Textile SizingCoolantLatex PaintExplosivesToiletries
FormaldehydeAcetic AcidEthanolEthylene OxideEthylene DichloridePolyethylene ResinsPolypropyleneIsopropanolPropylene OxideEthylbenzeneCumeneCyclohexaneStyrene
Natural Gas Methane
Ethaine Propane Butaine
Crude Oil Naphtha
MethanolEthylenePropyleneButadieneBenzeneTolueneXylene

17
FALCOM Asset Management For Internal Circulation Only Jun 30, 2010
Report on FALCOM Petrochemical ETF 17
Petrochemical Products/Process
Consumer Products
Styrene Polystrene Food PackagingStyrene Synthetic Rubbers Tyres
Plastics Computer housingBenzene Cyclohexane Nylon Sports Equipment
Polycarbonates CDsCumene/Phenol Phenolic Resins Furniture
PharmaceuticalsAlkybenzene Surfactants Detergents
Toluene Sovents PaintsTolune Disocynate Polyurethane Sport shoes
Xylenes Paraxylene Ployester TextileOrthoxylene Plasticisers Flexible PVC
Plastic bagsEthylbenzene Styrene Polystyrene Consumer Electronics
ABS, SAN LiggageSBR TyresUnsaturated Polyesters Glass reinforced plastics
Ethylene Oxide (Mono) Ethylene Glycol Polyesters PET bottlesEthanolamines MEA Detergents
DEA Agro ChemicalsGlycolethers TEA Detergents
Ethylene Ethylene Dichloride Vinyl Cloride Monomer PVC Medical EquipmentEthyl Alcohol Solvents Pharmaceuticals
Ethyl Acrylate Acrylate Elastomers Synthetic rubberGlycol Etheres Solvents Pharmaceuticals
Ethylamines PaperEthylacetate Solvents for Paints
Acetaldehyde Acetic Acid Vinyl Acetate Monomer PlasticsPolypropylene Automotives
Acrylic Acid Polyacrylate Superabsorbents NappiesAcrylonitrile ABS Sporting Helmets
SAN Electrical AppliancesNBR Automotives
Propylene Acrylic Fibres TextileCumene Phenol Phenolic Resins Furniture
Bisphenola Polycarbonated plasticsAcetone MMA Acrylic sheets/PMMA
Propylene Oxide Propylene Clycol Solvents PharmaceuticalsAnti - Freeze
Polyols Polyurethanes Roller Blade WheelsIsopropanol Acetone MMA PMMAButyraldehyde 2 Ethyl Henxanol Plasticisers Plastics
N-butanol Acrylates Acrylic PaintsC4 Stream Butadiene NBR (Synthetic rubber) Tyres
SBR (Synthetic rubber) HosesMTBE Fuel Oxygenate FuelChemical Intermediates
Methanol Formaldehyde Phenolic Resins Thermal InsulationPolyurethanes Foam
Polymethyl Methacrylate Building & Construction
Source : Petrochemistry
Methyl Methacrylate
Basic Products
Intermediate Products
Specialised Products
Polyesthylenes, LDPE, HDPE, LLDPE

18
FALCOM Asset Management For Internal Circulation Only Jun 30, 2010
Report on FALCOM Petrochemical ETF 18
Porter’s five forces analysis of Global and Regional Petrochemical Industry
NB: Global in black and regional in blue
CUSTOMERS (Medium) High concentration of sales to a limited number of customers mainly amongst first generation petrochemical producers. During under supply times, customers would have to bear the burden of higher prices transferred because it is the industry norm.Net importers have been concentrated to China and India Since the Middle Eastern producers are cost leaders, they are price competitive, thus the bargaining power of customers is low.
THREAT OF NEW ENTRANTS (Low) High capital outlay and 2-3 years lead time, access to reliable and competitive feedstock deter new entrants. Forward integration by suppliers of feedstock is seen with the operational platform and asset specificity. E.g. Aramco Asia and Middle East have cost advantage over Europe and USA, and the new demand forecasts would be an incentive to enter into these regions. Almost all the new capacities being installed in Asia and Middle East are by the existing players.
EXISTING RIVALRY (High) The industry’s high capital intensive stricture, cyclicality, high fixed cost structure and fluctuating feedstock prices increases rivalry. Thus some companies use inventory planning and spot trading to counter the market volatility. Western players enter into join ventures with the oil producers to take over some up stream margins and to reduce risks. (E.g. Dow) Some players vertically integrate for the same reason. The low cost Middle Eastern producers strive to enter into join ventures with Indian and Chinese producers for marketing reasons and to reduce risk. Nevertheless, rivalry among Middle Eastern producers is very low and the industrial harmony would further improve with the Middle Eastern petrochemical association.
SUBSTITUTES (Low) Bio-energy the new frontier could be used as a substitute for almost all of the products. However, its high cost compared to petrochemicals and little knowledge and research done in this area has resulted in a very slow transformation into bio-energy. Nevertheless, high persistent oil prices could allocate more resources to the alternative sources in the long term. However, environmental costs in relation to spilling, emissions and waste disposals are making the substitutes more attractive.
SUPPLIERS (High) The industry is characterized by big petroleum producers integrating forward to downstream production due to asset specificity. Usually in the West, higher feedstock prices are passed onto petrochemical producers and resulting in low margin for producers. In the middle-east region, the feedstock prices are fixed at a long term low prices which is around 20% of the European prices. Thus for Middle Eastern producers’ bargaining power is low.The Saudi Arabian PC producers are charged $0.75 per mmbtu of natural gas compared to that of the Europe’s average of $5

19
FALCOM Asset Management For Internal Circulation Only Jun 30, 2010
Report on FALCOM Petrochemical ETF 19
Regional Petrochemical Strategies
Saudi Petrochemical Strategies

20
FALCOM Asset Management For Internal Circulation Only Jun 30, 2010
Report on FALCOM Petrochemical ETF 20
Industry snapshot The petrochemical industry produces chemicals and materials from oil and natural gas. Oil refineries and natural gas processing plants break down the crude oil and natural gas into hydrocarbon molecules of which they composed. Thereafter, petrochemicals go through intermediary and finished products which are consumed by many industries.
Petrochemical products are traded among regional economic groups such as intra trade within each group such as NAFTA,EU and ASEAN or inter regional trade. Petrochemical trade faces two types of trade barriers; tariff and non tariff barriers. The current trend of lower tariffs reflects the free trade philosophy of WTO. Anti dumping practices on petrochemical products are rampaging.
Major consuming industries of petrochemical products Transportation TextilesElectronics Cosmetics and pharmaceuticals Agriculture
Petrochemical prices are determined internationally and increase in demand has made product prices shot up significantly. Heavier feed stocks are becoming more competitive largely because of the propylene co-products that result from naphtha cracking. Competitive advantage lies in quality, price, brand recognition, location and vertical integration. The trading structure of the petrochemical products is determined by two forces. They are market forces and institutional factors. The market forces in general mean the comparative cost advantage while the institutional factor implies rules and regulations governing the trade of the products. Major producers should invest globally to be competitive and survive in today’s world market. They would have to consolidate their operational and marketing activities, restructure and search for competitive advantages. Petrochemical manufacturers depend on adequate supplies of natural gas and oil at predictable prices to produce many essential products used every day. Currently, natural gas and oil supplies are tight because supply has not kept pace with demand.
Disclaimer “All rights reserved. This research document is prepared for the use of clients of FALCOM Financial Services and may not be redistributed, retransmitted or disclosed, in whole or in part, or in any form or manner, without the express written consent of FALCOM Financial Services. Any unauthorized use or disclosure is prohibited. Receipt and review of this research report constitutes your agreement not to redistribute, retransmit, or disclose to others the contents, opinions, conclusion, or information contained in this report (including any investment recommendations, estimates or price targets) prior to FALCOM Financial Services public disclosure of such information. The information herein (other than disclosure information relating to FALCOM Financial Services and its affiliates) was obtained from various sources and we do not guarantee its accuracy. FALCOM Financial Services makes no representations or warranties whatsoever as to the data and information provided in any third party referenced source and shall have no liability or responsibility arising out of or in connection with any such referenced website. This research report provides general information only. Neither the information nor any opinion expressed constitutes an offer or an invitation to make an offer, to buy or sell any securities or other investment products related to such securities or investments. It is not intended to provide personal investment advice and it does not take into account the specific investment objectives, financial situation and the particular needs of any specific person who may receive this report. Investors should seek financial advice regarding theappropriateness of investing in any securities, other investment or investment strategies discussed or recommended in this report and should understand that statements regarding future prospects may not be realized. Investors should note that income from such securities or other investments, if any, may fluctuate and that price or value of such securities and investments may rise or fall.Accordingly, investors may receive back less than originally invested. Any investment action based on the contents of this document is entirely the responsibility of the investor. Officers of FALCOM Financial Services or one or more of its affiliates (including research analysts) may have a financial interest in securities of the issuer(s) or in related investments. Our Research documents and reports are produced on a regular basis as necessary to keep the investment recommendation current and are subject to change without notice.”