Faculty of Economics and Business - ir.unimas.my MIX LEVEL OF... · 2.7.3 Consumer Attitude on...
24
PROMOTION MIX: LEVEL OF AWARENESS AND PURCHASE LIKELIHOOD Anne Wong Ling Ling (22975) Degree of Bachelor of Business Administration with Honours (Marketing) 2011 U N I V E R S I T I M A L A Y S I A S A R A W A K U N I M A S Faculty of Economics and Business
Transcript of Faculty of Economics and Business - ir.unimas.my MIX LEVEL OF... · 2.7.3 Consumer Attitude on...

PROMOTION MIX: LEVEL OF AWARENESS AND PURCHASE
LIKELIHOOD
Anne Wong Ling Ling (22975)
Degree of Bachelor of
Business Administration with Honours
(Marketing)
2011
Faculty of Economics and Business
UN
IVE
RS
IT
IMALAYSIA
SA
RA
WA
K
U N I M AS
Faculty of Economics and Business

PROMOTION MIX: LEVEL OF AWARENESS AND PURCHASE
LIKELIHOOD
ANNE WONG LING LING
This project is submitted in partial fulfillment of the requirements for the
degree of Bachelor of Business Administration with Honours
(Marketing)
Faculty of Economics and Business
UNIVERSITI MALAYSIA SARAWAK
2011

Statement of Originality
The work described in this Final Year Project, entitled
“Promotion Mix: Level of Awareness and Purchase Likelihood”
is to the best of the author’s knowledge that of the author except
where due reference is made.
__________________ ___________________
(Date Submitted) (Student’ signature)
Anne Wong Ling Ling
22975

vi
ACKNOWLEDGEMENT
First of all, I would like to take this opportunity to express my thankful to my
supervisor, Dr. Rabaah Tudin for her guidance and direction throughout the course of
this Final Year Project. She had kindly providing me knowledge and idea from the
starting of this research until end of the research. She also gave me valuable information
and advices during the process of this research. Besides, when I was faced problems, she
was able provided detail solution to me to solve the problem.
Secondly, I would like special thanks to Associate Professor Shazali Abu Mansor (Dean
of Faculty of Economics and Business), Professor Madya Dr Ahmad Shuib (Final Year
Project coordinator of Faculty of Economics and Business), and also the staff of Faculty
Economics and Business.
Next, my thanks go to my family. I would like to thank my father, Wong Sii Kiew and
my mother, Ling Leng Hung, for their support and encouragement either in financial or
moral to me to complete this research. Furthermore, my thanks also go to my sister,
Irene Wong Hui Hui, my youngest brother, Philip Wong Ha Ing and my youngest sister,
Agnes Wong Tin Tin where suggested some idea or information to me when I am
blanked of idea.

vii
Lastly, thanks go to my course mates and friends who cheered up me when I am stress
and encourage me to continue finish this research. Apart from that, they were suggested
valuable ideas and explanations for me to complete the Final Year Project.

viii
TABLE OF CONTENTS
LIST OF TABLES xiii
LIST OF FIGURES xvi
LIST OF CHART xvii
CHAPTER ONE: INTRODUCTION
1.1 Introduction 1
1.2 Theory 5
1.3 Problem Statement 6
1.4 Research Objectives 8
1.5 Rationale of the Study 8
1.7 Scope of the Research 10
CHAPTER TWO: LITERATURE REVIEW
2.1 Introduction 11
2.2 Marketing 11
2.3 Marketing mix 12
2.4 Promotion in Marketing mix 13
2.4.1 Advertising 14
2.4.2 Personal Selling 15
2.4.3 Sales Promotion 16
2.4.4 Public Relations 17
ix
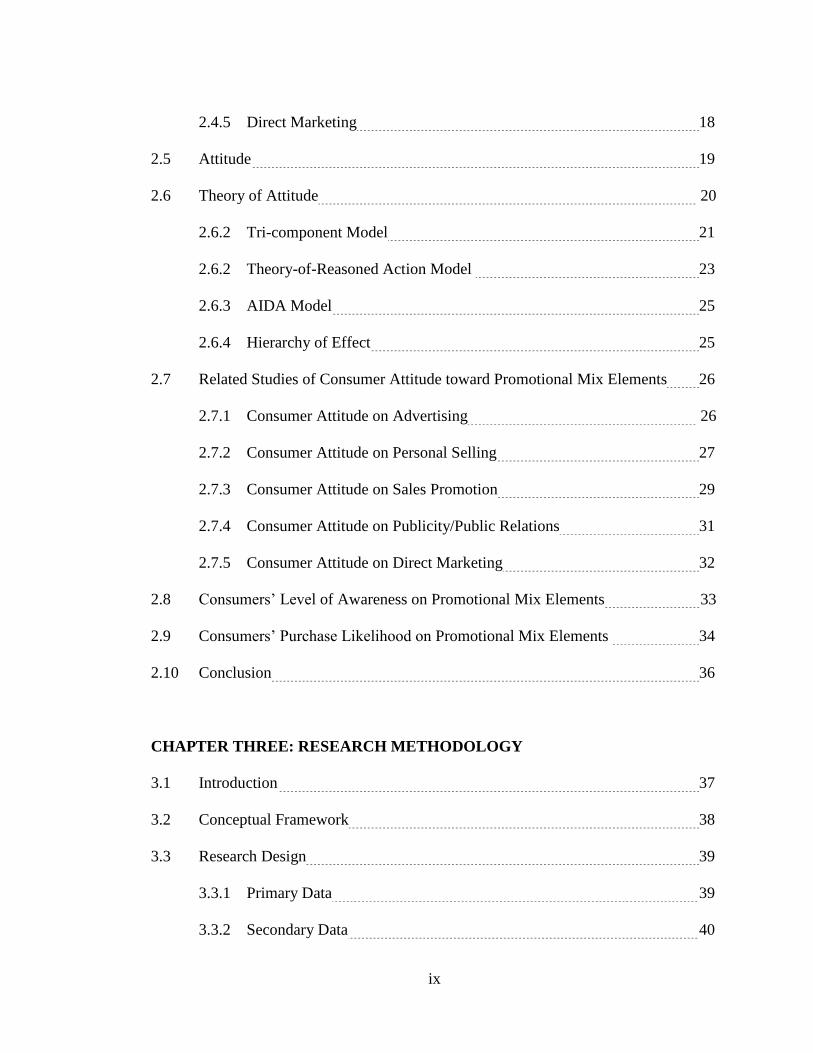
2.4.5 Direct Marketing 18
2.5 Attitude 19
2.6 Theory of Attitude 20
2.6.2 Tri-component Model 21
2.6.2 Theory-of-Reasoned Action Model 23
2.6.3 AIDA Model 25
2.6.4 Hierarchy of Effect 25
2.7 Related Studies of Consumer Attitude toward Promotional Mix Elements 26
2.7.1 Consumer Attitude on Advertising 26
2.7.2 Consumer Attitude on Personal Selling 27
2.7.3 Consumer Attitude on Sales Promotion 29
2.7.4 Consumer Attitude on Publicity/Public Relations 31
2.7.5 Consumer Attitude on Direct Marketing 32
2.8 Consumers’ Level of Awareness on Promotional Mix Elements 33
2.9 Consumers’ Purchase Likelihood on Promotional Mix Elements 34
2.10 Conclusion 36
CHAPTER THREE: RESEARCH METHODOLOGY
3.1 Introduction 37
3.2 Conceptual Framework 38
3.3 Research Design 39
3.3.1 Primary Data 39
3.3.2 Secondary Data 40

x
3.4 Population 40
3.5 Sample 41
3.5.1 Sample Method 42
3.5.2 Sample Size 42
3.5.3 Data Collection 43
3.5.4 Instrument Development 43
3.5.5 Data Collection Procedure 45
3.6 Pilot Test 47
3.7 Data Analysis 48
3.7.1 Descriptive Statistics 48
3.7.2 Factor Analysis 49
3.7.3 Reliability Analysis 49
3.7.4 Factor Independence Analysis 50
3.7.4.1 Q-Q plot 50
3.7.4.2 Pearson’s Correlations Analysis 50
3.7.4.3 Linear Regression Analysis 51
3.8 Hypothesis 52
3.10 Summary 52
CHAPTER FOUR: RESEARCH FINDINGS
4.1 Introduction 54
4.2 Respondents’ Profile Analysis 54
4.3 Reliability of the Survey Instrument 57

xi
4.4 Factor Analysis 57
4.5 Frequency 63
4.5.1 Level of Awareness of Consumer on Promotional Mix Elements 66
4.5.2 Recall of Consumer on Promotional Mix Elements 68
4.5.3 Attitude on Promotional Mix Elements 70
4.5.4 Purchase Likelihood of Consumers on Promotional Mix Elements 75
4.6 Mean and Standard Deviation 80
4.6.1 Level of Awareness of Consumer on Promotional Mix Element 80
4.6.2 Recall of Consumer on Promotional Mix Elements 83
4.6.3 Attitude on Promotional Mix Elements 84
4.6.4 Purchase Likelihood of Consumers on Promotional Mix Elements 88
4.7 Pearson Correlation Analysis 90
4.8 Linear Regression Analysis 94
4.9 Conclusion 96
CHAPTER FIVE: DISCUSSIONS OF FINDINGS
5.1 Introduction 99
5.2 Respondents’ Demographic Profile 99
5.3 Hypothesis Testing 100
5.3.1 Hypothesis 1 100
5.3.2 Hypothesis 2 103
5.3.3 Hypothesis 3 107
5.4 Conclusion 108
xii
CHAPTER SIX: CONCLUSIONS, LIMITATION AND FUTURE RESEARCH
6.1 Introduction 109
6.2 Conclusion 109
6.3 Managerial Implication 111
6.4 Recommendation for Future Research 113
6.5 Limitation 115
REFERENCES 117
APPENDIX A: Questionnaire

xiii
LIST OF TABLES
Table 4.1: Respondent’s Characteristics 56
Table 4.2: Reliability Analysis Results for the 30 Statements 57
Table 4.3: Appropriateness of Factor Analysis 58
Table 4.4: Rotated Component Matrixa of Consumers’ Level of Awareness on
Promotional Mix Elements 59
Table 4.5: Rotated Component Matrixa of Consumers’ Recall on Promotional Mix
Elements 60
Table 4.6: Rotated Component Matrixa of Consumers’ Attitude on Promotional Mix
Elements 61
Table 4.7: Rotated Component Matrixa of Consumers’ Purchase Likelihood on
Promotional Mix Elements 62
Table 4.8: Level of awareness of Consumers on Promotional Mix Element
64
Table 4.9: Frequency of Level of Awareness on Promotional Mix Elements 66
Table 4.10: Frequency of Recall of Consumer on Promotional Mix Elements 68
Table 4.11: Frequency of Attitude of Consumers on Advertising 70
Table 4.12: Frequency of Attitude of Consumers on Personal Selling 71
Table 4.13: Frequency of Attitude of Consumers on Sales Promotion 72

xiv
Table 4.14: Frequency of Attitude of Consumers on Publicity 73
Table 4.15: Frequency of Attitude of Consumers on Direct Marketing 74
Table 4.16: Purchase Likelihood of Consumers on Promotional Mix Elements
76
Table 4.17: Frequency Purchase Likelihood of Consumers on Promotional Mix
Elements 78
Table 4.18: Promotional Mix Elements Rank based on the Level of Awareness of
Consumer 80
Table 4.19: Level of Awareness of Consumer on Promotional Mix Elements 82
Table 4.20: Recall of Consumer on Promotional Mix Elements 83
Table 4.21: Mean and Standard Deviation of Attitude of Consumer on Advertising
84
Table 4.22: Mean and Standard Deviation of Attitude of Consumer on Personal
Selling 85
Table 4.23: Mean and Standard Deviation of Attitude of Consumer on Sales
Promotion 85
Table 4.24: Mean and Standard Deviation of Consumers’ Attitude on
Publicity/Public Relations 86
Table 4.25: Mean and Standard Deviation of Consumers’ Attitude on Direct
Marketing 87
Table 4.26: Promotional Mix Elements Rank based on the Purchase Likelihood of
Consumer 88
Table 4.27: Purchase Likelihood of Consumer on Promotional Mix Elements 89

xv
Table 4.28: Q-Q Plot 90
Table 4.29: Pearson Correlation 92
Table 4.30: Regression of the Impact of Consumers’ Attitude toward Promotional
Mix Elements on Purchase Likelihood 94
Table 5.1: Reliability, Factor Analysis, Mean and Standard Deviation 101
Table 5.2: Correlation between Level of Awareness and Promotional Mix Elements
102
Table 5.3: Reliability, Factor Analysis, Mean and Standard Deviation 104
Table 5.4: Standard Regression between Consumers’ Attitude on Promotional Mix
Elements with Purchase Likelihood 104
Table 5.5: Standard Regression between Consumers’ Attitude on Promotional Mix
Elements toward Purchase Likelihood 107

xvi
LIST OF FIGURES
Figure 1: Tri-component Model 23
Figure 2: Model of Consumer’s Attitude toward Promotional Mix Elements and
The Impact of the Attitude to The Purchase Likelihood and Level of
Awareness 38

xvii
LIST OF CHART
Chart 1: Share of Advertising Expenditure of Malaysia (2010) 4

ABSTRACT
PROMOTION MIX: LEVEL OF AWARENESS AND PURCHASE
LIKELIHOOD
By
Anne Wong Ling Ling
Promotion strategies were used by many companies to promote their products to the
consumers. This paper examines the consumer’ attitude on promotional mix elements
which are advertising, personal selling, sales promotion, publicity/public relation and
direct marketing and the impact of these attitude toward consumers’ level of awareness
and purchase likelihood, without focusing on any specific products in Kuala Lumpur,
Malaysia. The theoretical frameworks used in this research were Marketing Theory and
Theory of Reasoned Action (TRA). Primary data were collected by using questionnaire.
400 questionnaires were collected and analyzed using Correlation and Regression.
Hypothesis 1 stated that there is a significant positive relationship between consumers’
attitude on sales promotion and publicity and level of awareness and this hypothesis was
accepted. Hypothesis 2 stated that consumers’ attitude on advertising, personal selling,
sales promotion and publicity/public relations will influence their purchase likelihood of
products and it also was accepted. Hypothesis 3 stated that consumers’ attitude on direct
marketing influences the purchase likelihood of products and it was rejected. One of the
reasons was consumer less intention to purchase the products after go through the direct
marketing (Alnawas, 2010).

ABSTRAK
ELEMEN PROMOSI: TAHAP KESEDARAN DAN KEBARANGKALIAN
PEMBELIAN
Oleh
Anne Wong Ling Ling
Penyelidikan ini menyelidik sikap pelanggan terhadap elemen promosi seperti
pengiklan, jualan peribadi, promosi jualan, publisiti dan pemasaran langsung. Selain itu,
tahap kesedaran dan kebarangkalian pembelian juga dikaji dalam penyelidikan ini.
Penyelidikan ini tidak menumpukan pada produk yang khusus di Kuala Lumpur,
Malaysia. Teori yang digunakan dalam penyelikan ini adalah Teori Aksi Beralasan di
mana digunakan untuk mengukur sikap pelanggan terhadap elemen promosi dan
kesannya terhadap tahap kesedaran dan kebarangkalian pembelian sesuatu produk. Data
dikumpulkan menggunakan soal selidik melaui tinjauan. Data yang dikumpul dianalisis
menggunakan “Correlation” dan “Regression” analisis. Penemuan menunjukkan bahawa
sikap pelanggan terhadap promosi jualan dan publisiti mempunyai perkaitan yang positif
dengan tahap kesedaran pelanggan. Selain itu, penemuan juga menunjukkan sikap
pelanggan terhadap pengiklanan, jualan peribadi, promosi jualan dan publisiti
menpunyai kesan pada kebarangkalian pembelian sesuatu produk. Perbincangan
implikasi dan keterbatasan disediakan dalam tesis ini.

1
CHAPTER 1
INTRODUCTION
1.1 Introduction
The evolution of technologies changes every day and bring a lot of new and advance
thing for the people. Thus, technologies advancement encourages people to improve
themselves in this field. Beside, technologies advancement also creates a new flow of
evolution in the marketing field. For example, there have many new advance things
appear because of the changes of the technologies such as online buying, online
advertising, E-magazine, mobile advertising and so forth.
Technology is one of the external environments which will influence marketing
activities of a company. Hence, companies should be alert to the changes in the external
environment so they can always improve themselves and compete with the competitors.
One of the marketing activities that might be influenced by the changes of technology is
promotional tools. Traditionally, marketers used more promotional media such as
newspaper, magazines, brochures and so on to promote products or services. Due to the
changing of technology, marketers now prefer using internet to promote products and
services. The reasons is internet is easy and widely to spread news to everyone. Hence,
consumer’s daily activities also change because of the technology. According to the
latest Nielsen Advertising Information Services report, Malaysia advertising market

2
rebounded from a decline in the first half of last year to record a total spending of
RM3.5 billion in the first half of 2010. The highest growth was driven by internet which
increase 55% compare with the Quarter 1, 2009 (Yun, 2010). It seems that marketers
acknowledge consumers trend using internet as their prefereable media to apply these
changes in their promotional mix elements. Now, marketers used more internet to
promote products and services. Hence, it might a new and additional promotional tool to
marketers for create awareness and influence consumer to purchase the products and
services.
Spending more in advertising also can increase the economy of Malaysia. According to
Nielsen Advertising Information Services (Anonymous, 2010), the result shows that
newspaper is the highest expenses of advertising which is 52.9%, followed by television
(35.7%) and Radio (5.6%) as shown in Chart 1. The marketer still frequently used the
traditional media to promote products and services to create awareness and persuade
consumer to purchase.
The Global Consumer Confidence, Concerns and Spending Survey (Quarter 1, 2010) by
Nielsen Company developed consumers’ confidence in the job market, status of their
personal finances and readiness to spend throughout Asia Pacific, Europe, Latin
America, the Middle East and North. The result states that Asian consumer ready to
spend. Asian consumer plans to spend more in out-of-home entertainment, new
technology, holidays and new clothes if compared with six months ago. It shows that

3
power of spending of Asian consumer start to grow. Based on the Global Consumer
Confidence & Spending Survey (Quarter 2, 2010) by Nielsen Company, forty-seven
percent of 27,000 respondents, Vietnam (Asia) would spend excess cash on new
technology products which is the higher percentage in Asia. From the result, it shows
that new technology products are the highest segment for Asian consumer to spend. It
means Asian consumer influence by the trend of the society in their lifestyle. Asian
consumer spends more money in the new technology products because of the changing
of external environment and directly influence consumer attitude. Consumers feel that
latest technology products important to them. Thus, they have the desire to try the latest
technology products although sometimes the new technology products not necessary
important to them. Besides that, it also causes the changing of the consumer behaviors
from high-involvement to low-involvement of the expensive product. It is because
usually high technology products are quite expensive so that the consumer needs to
know the detail of product before they buy the product. Technology advancement
influence consumers to buy the new technology products in a short time without
searching for much information.

4
Chart 1: Share of Advertising Expenditure of Malaysia (2010)
Source: Nielsen Advertising Information Services (AIS)

5
1.2 Theory
Theories applied to this project are marketing theory and Theory of Reasoned Action.
According to the Armstrong and Kolter (2009), “marketing is the activity, set of
institutions, and processes for creating, communicating, delivering, and exchanging
offerings that have value for customers, clients, partners and society at large.” It means
that the activities usually perform by marketing department of the company is creating,
sending, communicating and exchanging the value of the products to the consumers.
One of the major concepts of marketing is marketing mix. Marketing mix is a
combination of tactical marketing tools which are controllable by the firm and to
produce the wants in the target market (Armstrong & Kolter, 2009). The tactical
marketing tools consist of product, price, promotion and place which known as the “four
Ps” (Armstrong & Kolter, 2009).
This research, it focuses on the promotion element. Promotion defines as “activities that
communicate the merits of the products and persuade target customers to buy it”
(Armstrong & Kolter, 2009). The purpose of promotion is to ensure consumers are
aware of the products (Rowley, 1998). There is one concept of promotion which is
promotion mix or marketing communications mix. The definition of promotion mix or
marketing communications mix is specific blend of advertising, public relations,
personal selling, sales promotion, and direct marketing tools that the company uses to
persuasively communicate customer values and build customer relationships (Armstrong

6
& Kolter, 2009). Hence, promotion element is one of the important marketing mixes in
company to bring profit to the company. Without promotion element, the products of the
company will not know by public no matter how good of the company’s products and
directly did not bring profit to the company.
This paper examines the consumer’ attitude on promotional mix elements which are
advertising, personal selling, sales promotion, publicity/public relation and direct
marketing and the impact of these attitude toward consumers’ level of awareness and
purchase likelihood, without focusing on any specific products in Kuala Lumpur,
Malaysia. Theory used to measure the attitude of consumer is Theory of Reasoned
Action as proposed by Azjen and Fishbein (1980). The theory represents a
comprehensive integration of attitude lead to intention and behavior. Theory of
Reasoned Action similar with the tri-component attitude model which incorporate
cognitive, affective and conative component. The model suggests that the best predictor
of behavior in the intention to act and attitude is the factors led to intention and behavior.
1.3 Problem Statement
In Malaysia, there still not much research done about the awareness, attitude and
purchase likelihood of consumer through promotional mix elements. In Malaysia, there
are a lot of marketing activities through promotional mix elements, used by companies
to communicate with consumers such as advertising, personal selling, sales promotion,

7
publicity/public relations and direct marketing. According to Fill (1999), each
promotion mix elements has different capacities to communicate and to achieve
objectives of companies. But, companies did not recognize which type of promotional
mix elements will create awareness of consumer, form the consumer attitude and
influence purchase likelihood of consumer toward their company’s products. Hence, the
companies invest a lot of money in promotional mix elements to promote their product
although the promotional mix elements are not very effective to consumer or not
suitable for their products. The effectiveness of each tool can be measure by the
purchase decision whether to buy products or not at the end. Promotional mix elements
influence from unawareness of consumer to attitude and link to consumers’ purchase
likelihood.
Through identify the promotional mix elements which create awareness, form
consumer’s attitude and influence consumers’ purchase likelihood for their products,
company can gain profit and lower the waste of investment.