Evaluation of the contribution of tropical cyclone seeds ...
17
RESEARCH ARTICLE Open Access Evaluation of the contribution of tropical cyclone seeds to changes in tropical cyclone frequency due to global warming in high-resolution multi-model ensemble simulations Yohei Yamada 1* , Chihiro Kodama 1 , Masaki Satoh 2 , Masato Sugi 3 , Malcolm J. Roberts 4 , Ryo Mizuta 3 , Akira T. Noda 1 , Tomoe Nasuno 1 , Masuo Nakano 1 and Pier Luigi Vidale 5 Abstract Previous projections of the frequency of tropical cyclone genesis due to global warming, even in terms of sign of the change, depends on the chosen model simulation. Here, we systematically examine projected changes in tropical cyclones using six global atmospheric models with medium-to-high horizontal resolutions included in the sixth phase of the Coupled Model Intercomparison Project/High-Resolution Model Intercomparison Project. Changes in the frequency of tropical cyclone genesis could be broken down into the contributions from (i) the tropical cyclone seed, a depression having a closed contour of sea level pressure with a warm core and (ii) the survival rate, the ratio of the frequency of tropical cyclone genesis to that of tropical cyclone seeds. The multi- model ensemble mean indicates that tropical cyclone genesis frequencies are significantly decreased during the period 1990–2049, which is attributable to changes in tropical cyclone seeds. Analysis of the individual models shows that although most models project a more or less decreasing trend in tropical cyclone genesis frequencies and seeds, the survival rate also contributes to the result in some models. The present study indicates the usefulness of decomposition into the frequency of the tropical cyclone seeds and the survival rate to understand the cause of uncertainty in projected frequencies of tropical cyclone genesis. Keywords: Global warming, Tropical cyclone, Tropical cyclone seed, Survival rate, High-Resolution Model Intercomparison Project 1 Introduction Many previous studies have examined changes in trop- ical cyclone (TC) activity, such as TC genesis frequency, TC intensity, and precipitation associated with TCs, due to global warming; these have been summarized by Knutson et al. (2010, 2019, 2020). However, the topic is still controversial. Focusing on TC genesis frequency, most high-resolution atmospheric general circulation models project a decrease in the frequency of the global TC genesis due to global warming (Murakami et al. 2012, 2014; Oouchi et al. 2006; Roberts et al. 2015; Satoh et al. 2015; Sugi et al. 2009, 2017; Sugi and Yoshimura 2012; Wehner et al. 2015; Yamada et al. 2010, 2017; Yamada and Satoh 2013; Yoshida et al. 2017; Zhao et al. 2009). However, Bhatia et al. (2018) showed an increase in TC genesis frequency using a high-resolution atmos- phere–ocean coupled general circulation model. Under- standing the reasons for these discrepancies is necessary © The Author(s). 2021 Open Access This article is licensed under a Creative Commons Attribution 4.0 International License, which permits use, sharing, adaptation, distribution and reproduction in any medium or format, as long as you give appropriate credit to the original author(s) and the source, provide a link to the Creative Commons licence, and indicate if changes were made. The images or other third party material in this article are included in the article's Creative Commons licence, unless indicated otherwise in a credit line to the material. If material is not included in the article's Creative Commons licence and your intended use is not permitted by statutory regulation or exceeds the permitted use, you will need to obtain permission directly from the copyright holder. To view a copy of this licence, visit http://creativecommons.org/licenses/by/4.0/. * Correspondence: [email protected] 1 Japan Agency for Marine-Earth Science and Technology, 3173-25 Showa-machi, Yokohama, Kanagawa 236-0001, Japan Full list of author information is available at the end of the article Progress in Earth and Planetary Science Yamada et al. Progress in Earth and Planetary Science (2021) 8:11 https://doi.org/10.1186/s40645-020-00397-1
Transcript of Evaluation of the contribution of tropical cyclone seeds ...

RESEARCH ARTICLE Open Access
Evaluation of the contribution of tropicalcyclone seeds to changes in tropicalcyclone frequency due to global warmingin high-resolution multi-model ensemblesimulationsYohei Yamada1* , Chihiro Kodama1, Masaki Satoh2, Masato Sugi3, Malcolm J. Roberts4, Ryo Mizuta3,Akira T. Noda1, Tomoe Nasuno1, Masuo Nakano1 and Pier Luigi Vidale5
Abstract
Previous projections of the frequency of tropical cyclone genesis due to global warming, even in terms of sign ofthe change, depends on the chosen model simulation. Here, we systematically examine projected changes intropical cyclones using six global atmospheric models with medium-to-high horizontal resolutions included in thesixth phase of the Coupled Model Intercomparison Project/High-Resolution Model Intercomparison Project.Changes in the frequency of tropical cyclone genesis could be broken down into the contributions from (i) thetropical cyclone seed, a depression having a closed contour of sea level pressure with a warm core and (ii) thesurvival rate, the ratio of the frequency of tropical cyclone genesis to that of tropical cyclone seeds. The multi-model ensemble mean indicates that tropical cyclone genesis frequencies are significantly decreased during theperiod 1990–2049, which is attributable to changes in tropical cyclone seeds. Analysis of the individual modelsshows that although most models project a more or less decreasing trend in tropical cyclone genesis frequenciesand seeds, the survival rate also contributes to the result in some models. The present study indicates theusefulness of decomposition into the frequency of the tropical cyclone seeds and the survival rate to understandthe cause of uncertainty in projected frequencies of tropical cyclone genesis.
Keywords: Global warming, Tropical cyclone, Tropical cyclone seed, Survival rate, High-Resolution ModelIntercomparison Project
1 IntroductionMany previous studies have examined changes in trop-ical cyclone (TC) activity, such as TC genesis frequency,TC intensity, and precipitation associated with TCs, dueto global warming; these have been summarized byKnutson et al. (2010, 2019, 2020). However, the topic isstill controversial. Focusing on TC genesis frequency,
most high-resolution atmospheric general circulationmodels project a decrease in the frequency of the globalTC genesis due to global warming (Murakami et al.2012, 2014; Oouchi et al. 2006; Roberts et al. 2015; Satohet al. 2015; Sugi et al. 2009, 2017; Sugi and Yoshimura2012; Wehner et al. 2015; Yamada et al. 2010, 2017;Yamada and Satoh 2013; Yoshida et al. 2017; Zhao et al.2009). However, Bhatia et al. (2018) showed an increasein TC genesis frequency using a high-resolution atmos-phere–ocean coupled general circulation model. Under-standing the reasons for these discrepancies is necessary
© The Author(s). 2021 Open Access This article is licensed under a Creative Commons Attribution 4.0 International License,which permits use, sharing, adaptation, distribution and reproduction in any medium or format, as long as you giveappropriate credit to the original author(s) and the source, provide a link to the Creative Commons licence, and indicate ifchanges were made. The images or other third party material in this article are included in the article's Creative Commonslicence, unless indicated otherwise in a credit line to the material. If material is not included in the article's Creative Commonslicence and your intended use is not permitted by statutory regulation or exceeds the permitted use, you will need to obtainpermission directly from the copyright holder. To view a copy of this licence, visit http://creativecommons.org/licenses/by/4.0/.
* Correspondence: [email protected] Agency for Marine-Earth Science and Technology, 3173-25Showa-machi, Yokohama, Kanagawa 236-0001, JapanFull list of author information is available at the end of the article
Progress in Earth and Planetary Science
Yamada et al. Progress in Earth and Planetary Science (2021) 8:11 https://doi.org/10.1186/s40645-020-00397-1
in order to gain reliable future projections of TCfrequency.Recently, some studies have noted the response of TC
seeds (incipient vortices of TCs) to global warming andits relation to TC genesis frequency (Lee et al. 2020; Sugiet al. 2020; Vecchi et al. 2019). Vecchi et al. (2019) inves-tigated the reasons for the increase in TC genesis underthe warmer climate conditions projected by Bhatia et al.(2018). Using the same model as Bhatia et al. (2018), i.e.,with nudged sea surface temperature (SST) experimentsand three horizontal resolutions (~ 200 km, ~ 50 km,and ~ 25 km), they showed that global TC frequency re-sponds to both an increase in TC seeds due to warmingand the less efficient development of these seeds intoTCs (survival rate; SR). In addition, the highest reso-lution model (~ 25 km) projected a more significant in-crease in TC seeds than the lower-resolution models.Sugi et al. (2020) examined future change in TC seedfrequency using two high-resolution models: the 20-kmmesh of the Meteorological Research Institute/JapanMeteorological Agency Atmospheric General CirculationModel (MRI-AGCM3; Mizuta et al. 2012; Murakamiet al. 2012) and the 14-km mesh of the NonhydrostaticICosahedral Atmospheric Model (NICAM; Satoh et al.2008, 2014; Tomita and Satoh 2004; Kodama et al.2015). Contrary to Vecchi et al. (2019), they showed aclear reduction in TC seed frequency, which contributesto a decrease in the relatively weak TC frequency. Al-though changes in TC and TC seed frequencies showedopposite signs between Vecchi et al. (2019) and Sugiet al. (2020), both studies indicated that changes in TCseed frequency under warmer climates possibly influencechanges in TC frequency. This discrepancy may be a re-sult of the differing models, definitions of TC seeds,and/or experimental designs between the two studies.Variability in the response of TC seed frequency due toglobal warming provides potential clues as to discrepan-cies in future TC frequency projections among (i)models and (ii) horizontal resolutions, helping to reduceuncertainties.In order to evaluate differences in the response of TC
seed frequency and its relation to TC frequency acrossdifferent models and horizontal resolutions, it is neces-sary to examine the response of TC seed frequency toglobal warming by utilizing the outputs of models with acommon setting and a specific definition of TC seed.Haarsma et al. (2016) proposed the High-ResolutionModel Intercomparison Project (HighResMIP) under thesixth phase of the Coupled Model Intercomparison Pro-ject (CMIP6; Eyring et al. 2016). Eighteen models withmore than two types of horizontal resolution were in-cluded in HighResMIP (see Table A1 of Haarsma et al.2016). Camargo (2013) examined TC activity using theCMIP5 dataset, showing that although resolution is not
the only contributor that determines model TC activity,the models with the highest horizontal resolution repro-duced the highest levels of global TC activity. UsingHighResMIP models, Roberts et al. (2019b) showed (i)increases in TC frequency and seasonal accumulatedcyclone energy and (ii) improvement in the representa-tion of TC intensity and TC track with finer resolutionmodels. These findings indicate the advantage of High-ResMIP for use in TC studies.Using the HighResMIP dataset, we can examine the
differences in the response of TC seed frequency and SRbetween models under a common experimental proto-col. The impact of horizontal resolution can also beassessed. In addition, we can discuss the contribution ofchanges in TC seed frequency and SR for each modeldue to global warming. We used six models, which aredescribed in Section 2. TCs and TC seeds were detectedwith an objective tracking algorithm named TempestEx-tremes (Ullrich and Zarzycki 2017; Zarzycki and Ullrich2017). In Section 2, we briefly describe the models, thetracking algorithm, and the definitions of TC seed andSR that were used in this study. We examine the trendsin three parameters (TC genesis frequency, TC seed fre-quency, and SR) in relation to (i) global warming and (ii)each other (Section 3). In Section 4, we discuss (i) thecontributions of TC seeds and SR to TC frequency and(ii) the impact of horizontal resolution on TC frequency,TC seed frequency, and SR. The summary and conclud-ing remarks are given in Section 5.
2 Methods/experimental2.1 Models and experimental designIn the present study, we used the six models included inCMIP6 HighResMIP: Centre National de RecherchesMeteorologiques and Cerfacs for CMIP6 (CNRM-CM6;Voldoire et al. 2019); EC-Earth3P (Haarsma et al. 2020);the Hadley Centre Global Environment Model 3-GlobalCoupled version 3.1 (HadGEM3-GC3.1; Roberts et al.2019a); the Max Planck Institute for Meteorology EarthSystem Model (MPI-ESM1.2; Gutjahr et al. 2019); MRI-AGCM3 (Mizuta et al. 2012); and the latest stable ver-sion of NICAM modified for CMIP6 (NICAM16-S;Kodama et al. 2020). We abbreviated them by combiningthe model name and horizontal grid interval. For in-stance, CNRM156 means CNRM-CM6 with a horizontalgrid interval of 156 km. Other abbreviations and resolu-tions are listed in Table 1.Haarsma et al. (2016) described the experimental de-
sign of the HighResMIP simulation, which consisted oftier 1, 2, and 3 simulations. Tiers 1 and 3 were atmos-phere only simulations, whereas tier 2 was a coupledocean–atmosphere simulation. Vecchi et al. (2019)showed the increase in TC seed due to the rise in SST(see their Fig. 14). Therefore, it is expected that a change
Yamada et al. Progress in Earth and Planetary Science (2021) 8:11 Page 2 of 17
in TC seed frequency is related to that of SST (Vecchiet al. 2019). We used the outputs of the tier 1 and 3 simu-lations but not tier 2 simulation which may complicatecomparison due to difference in SST response betweenmodels. The tier 1 simulation spanned from 1950 to 2014,in which SST and sea ice forcing were based on HadleyCentre Sea Ice and SST data sets (HadISST2; Titchnerand Rayner 2014). The tier 3 simulation spanned from2015 to 2050, in which the change rate of SST and sea iceforcing were derived from the ensemble mean of theCoupled Model Intercomparison Project Phase 5 Repre-sentative Concentration Pathways 8.5 scenario. The inter-annual variability was derived from the observed historic1950 to 2014 period (Haarsma et al. 2016). The method-ology broadly followed that of Mizuta et al. (2008).An exception to the simulation period was utilized for
NCM014. NCM014 is composed of three 11-year simu-lation periods: 1950–1960, 2000–2010, and 2040–2050.Hence, we excluded NCM014 from the trend analysisand took precautions when comparing between resultsof NCM14 and the other models. Although somemodels such as HadGEM3-GC3.1 have multiple ensem-ble members, we used a single ensemble member foreach model (r1i1p1f1) in the present study.
2.2 Tropical cyclone detection methodTo detect TCs in each model, we used TempestExtremes(Ullrich and Zarzycki 2017; Zarzycki and Ullrich 2017).TempestExtremes uses two steps to detect TCs: in thefirst step, the algorithm gathers TC candidates for eachtime step; in the second step, these candidates are con-nected between sequential time steps. In these steps, wecan flexibly select variables and their criteria. In thepresent study, we followed the configuration of Roberts
(2019) and Roberts et al. (2019b, 2020), in which the fea-tured tracking variable is sea level pressure (SLP) on thenative analysis grid.At the first step, the algorithm identifies candidates
based on local SLP minima with a warm core, which is de-fined as the geopotential height difference (250–500 hPa).Simultaneously, these candidates must satisfy four criteria:(i) these candidates must have a closed contour of SLPwithin 5.5° of each candidate, (ii) the SLP of a candidatenode must be 2 hPa lower than that on its closed contour,(iii) the candidate must have a closed contour of geopo-tential height difference (250–500 hPa) within 6.5° of thecandidate, and (iv) the geopotential height difference max-imum within 1° of the candidate should be 6 m larger thanthe geopotential height difference on the closed circle.At the next step, TempestExtremes forms the paths of
the candidates at different time steps. These paths mustinclude at least ten candidates while permitting a max-imum gap size of three, which is the number of time stepswhere no identification occurred. The TC lifetime mustbe more than 60 h. In addition, the TC must form be-tween 10° S–40° S or 10° N–40° N and must travel at least8°. The distance between candidates must be less than 8°.The criterion of topography excludes the path in whichcandidates exist (i) more than ten timesteps over the topo-graphic height of 1500 m and (ii) more than four timesteps over the topographic height over 10 m. These pathsare considered a storm trajectory. The first point in eachtrajectory is defined as the genesis of TC.
2.3 Definition of tropical cyclone seedIn the present study, we define the candidates that Tem-pestExtremes detected at the first step as TC seeds. Thisalso includes TCs. The SR is defined as
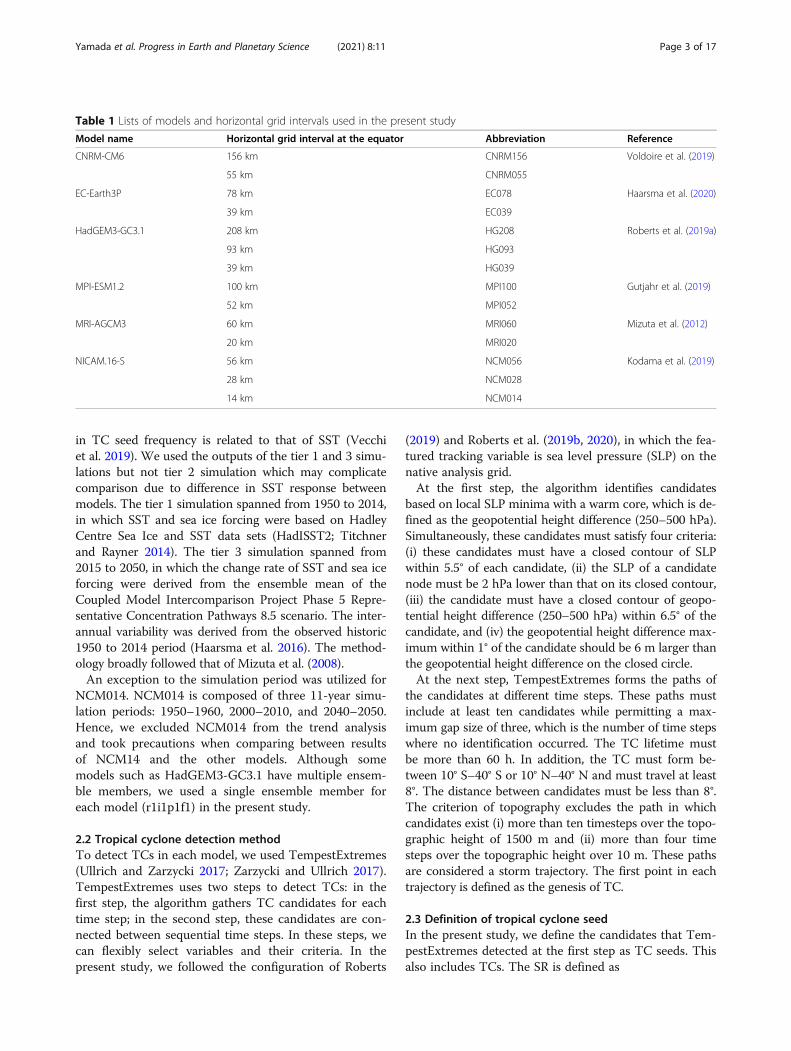
Table 1 Lists of models and horizontal grid intervals used in the present study
Model name Horizontal grid interval at the equator Abbreviation Reference
CNRM-CM6 156 km CNRM156 Voldoire et al. (2019)
55 km CNRM055
EC-Earth3P 78 km EC078 Haarsma et al. (2020)
39 km EC039
HadGEM3-GC3.1 208 km HG208 Roberts et al. (2019a)
93 km HG093
39 km HG039
MPI-ESM1.2 100 km MPI100 Gutjahr et al. (2019)
52 km MPI052
MRI-AGCM3 60 km MRI060 Mizuta et al. (2012)
20 km MRI020
NICAM.16-S 56 km NCM056 Kodama et al. (2019)
28 km NCM028
14 km NCM014
Yamada et al. Progress in Earth and Planetary Science (2021) 8:11 Page 3 of 17
SR ≡NTC
N seed; ð1Þ
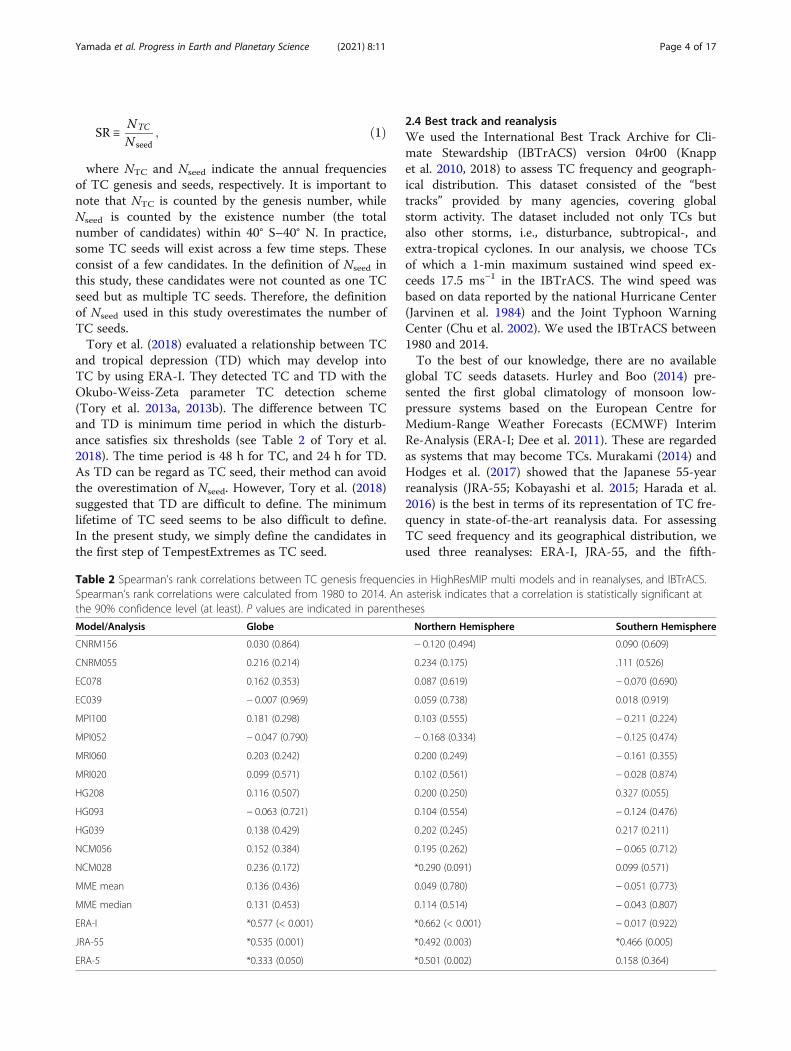
where NTC and Nseed indicate the annual frequenciesof TC genesis and seeds, respectively. It is important tonote that NTC is counted by the genesis number, whileNseed is counted by the existence number (the totalnumber of candidates) within 40° S–40° N. In practice,some TC seeds will exist across a few time steps. Theseconsist of a few candidates. In the definition of Nseed inthis study, these candidates were not counted as one TCseed but as multiple TC seeds. Therefore, the definitionof Nseed used in this study overestimates the number ofTC seeds.Tory et al. (2018) evaluated a relationship between TC
and tropical depression (TD) which may develop intoTC by using ERA-I. They detected TC and TD with theOkubo-Weiss-Zeta parameter TC detection scheme(Tory et al. 2013a, 2013b). The difference between TCand TD is minimum time period in which the disturb-ance satisfies six thresholds (see Table 2 of Tory et al.2018). The time period is 48 h for TC, and 24 h for TD.As TD can be regard as TC seed, their method can avoidthe overestimation of Nseed. However, Tory et al. (2018)suggested that TD are difficult to define. The minimumlifetime of TC seed seems to be also difficult to define.In the present study, we simply define the candidates inthe first step of TempestExtremes as TC seed.
2.4 Best track and reanalysisWe used the International Best Track Archive for Cli-mate Stewardship (IBTrACS) version 04r00 (Knappet al. 2010, 2018) to assess TC frequency and geograph-ical distribution. This dataset consisted of the “besttracks” provided by many agencies, covering globalstorm activity. The dataset included not only TCs butalso other storms, i.e., disturbance, subtropical-, andextra-tropical cyclones. In our analysis, we choose TCsof which a 1-min maximum sustained wind speed ex-ceeds 17.5 ms−1 in the IBTrACS. The wind speed wasbased on data reported by the national Hurricane Center(Jarvinen et al. 1984) and the Joint Typhoon WarningCenter (Chu et al. 2002). We used the IBTrACS between1980 and 2014.To the best of our knowledge, there are no available
global TC seeds datasets. Hurley and Boo (2014) pre-sented the first global climatology of monsoon low-pressure systems based on the European Centre forMedium-Range Weather Forecasts (ECMWF) InterimRe-Analysis (ERA-I; Dee et al. 2011). These are regardedas systems that may become TCs. Murakami (2014) andHodges et al. (2017) showed that the Japanese 55-yearreanalysis (JRA-55; Kobayashi et al. 2015; Harada et al.2016) is the best in terms of its representation of TC fre-quency in state-of-the-art reanalysis data. For assessingTC seed frequency and its geographical distribution, weused three reanalyses: ERA-I, JRA-55, and the fifth-
Table 2 Spearman’s rank correlations between TC genesis frequencies in HighResMIP multi models and in reanalyses, and IBTrACS.Spearman’s rank correlations were calculated from 1980 to 2014. An asterisk indicates that a correlation is statistically significant atthe 90% confidence level (at least). P values are indicated in parentheses
Model/Analysis Globe Northern Hemisphere Southern Hemisphere
CNRM156 0.030 (0.864) − 0.120 (0.494) 0.090 (0.609)
CNRM055 0.216 (0.214) 0.234 (0.175) .111 (0.526)
EC078 0.162 (0.353) 0.087 (0.619) − 0.070 (0.690)
EC039 − 0.007 (0.969) 0.059 (0.738) 0.018 (0.919)
MPI100 0.181 (0.298) 0.103 (0.555) − 0.211 (0.224)
MPI052 − 0.047 (0.790) − 0.168 (0.334) − 0.125 (0.474)
MRI060 0.203 (0.242) 0.200 (0.249) − 0.161 (0.355)
MRI020 0.099 (0.571) 0.102 (0.561) − 0.028 (0.874)
HG208 0.116 (0.507) 0.200 (0.250) 0.327 (0.055)
HG093 − 0.063 (0.721) 0.104 (0.554) − 0.124 (0.476)
HG039 0.138 (0.429) 0.202 (0.245) 0.217 (0.211)
NCM056 0.152 (0.384) 0.195 (0.262) − 0.065 (0.712)
NCM028 0.236 (0.172) *0.290 (0.091) 0.099 (0.571)
MME mean 0.136 (0.436) 0.049 (0.780) − 0.051 (0.773)
MME median 0.131 (0.453) 0.114 (0.514) − 0.043 (0.807)
ERA-I *0.577 (< 0.001) *0.662 (< 0.001) − 0.017 (0.922)
JRA-55 *0.535 (0.001) *0.492 (0.003) *0.466 (0.005)
ERA-5 *0.333 (0.050) *0.501 (0.002) 0.158 (0.364)
Yamada et al. Progress in Earth and Planetary Science (2021) 8:11 Page 4 of 17

generation ECMWF reanalysis (ERA-5: Copernicus Cli-mate Change Service 2017). We applied TempestEx-tremes to ERA-I, JRA-55, and ERA-5 to count TC seedsin the same manner as that for the HighResMIP simula-tion output.
2.5 Statistical analysisWe employed the nonparametric Mann–Kendall test fordetecting time series trends in TC genesis frequency,seed frequency, and SR. Spearman’s rank correlationswere calculated between TC genesis frequencies in theHighResMIP simulations and IBTrACS, and between TCseed frequencies in the HighResMIP simulations andJRA-55. We also calculated Spearman’s rank correlationsbetween three parameters: TC genesis frequency, seedfrequency, and SR. The responses of the three parame-ters to global warming were assessed with the Wilcoxonrank-sum test. These statistical analyses were performedusing Python libraries (Oliphant, 2007; Millman andAivazis 2011; Hussain and Mahmud 2019).
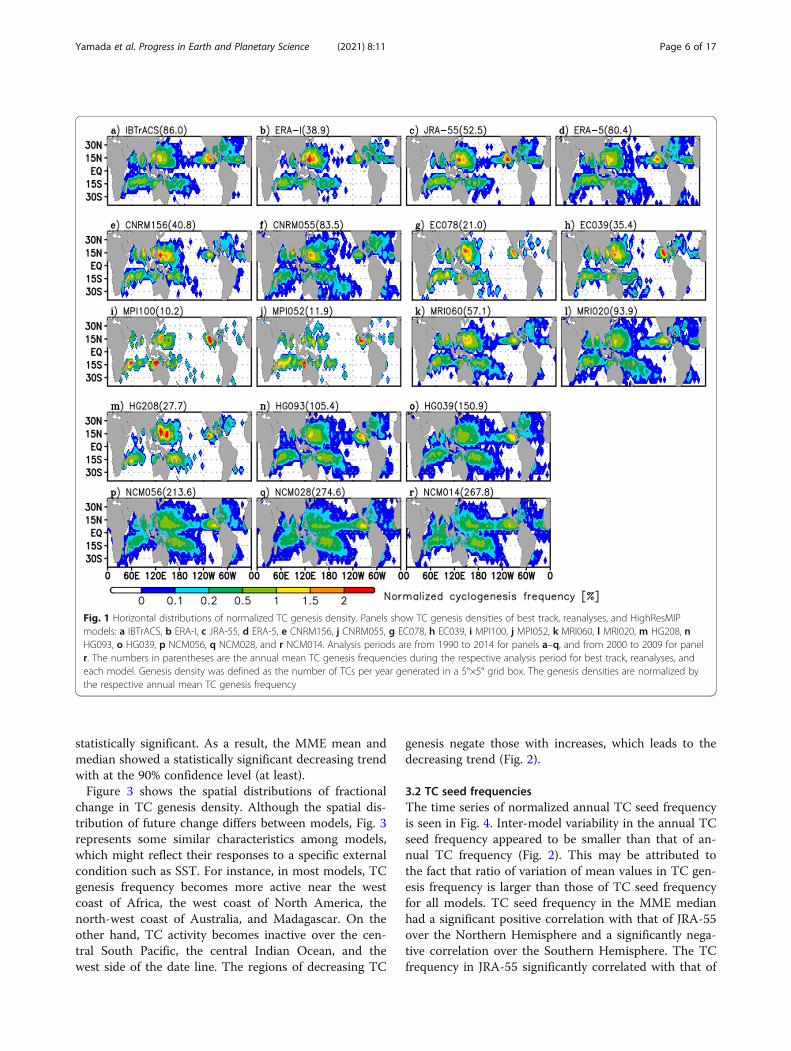
3 Results3.1 Tropical cyclone frequenciesFigure 1 shows the horizontal distributions of normalizedTC genesis density for IBTrACS, ERA-I, JRA-55, ERA-5,and each model (non-normalized TC genesis densities areseen in Supplemental Fig. 1). Except in NCM014, this dens-ity was defined as the number of TCs per year generated ina 5° × 5° grid box between 1990 and 2014. In NCM014, theperiod spanned from 2000 to 2009. Each model representeda broadly realistic geographical distribution compared withIBTrACS (Fig. 1a), although most models showed fewer ormore annual TC genesis frequencies than that of the besttrack. With the exception of NCM056 (Fig. 1p), the lowestresolution version of each model underestimated global an-nual mean TC genesis frequency (Fig. 1e, g, i, k, and m). Ingeneral, the frequencies in the higher-resolution versionswere increased (Fig. 1f, h, j, l, n, o, q, and r) compared withthe lower-resolution versions (Fig. 1e, g, i, k, m, and p),which is consistent with the results of Roberts et al.(2019b). With the settings used in this study, TempestEx-tremes showed little discrepancy in global annual meangenesis frequency between CNRM055 and IBTrACS. Thismay leave room for improvement in terms of tuning theTempestExtremes criteria to the other models, but thiswould complicate inter-model comparison and is outsidethe scope of the present study.Figure 2 shows the interannual variability of the nor-
malized annual TC genesis frequency for IBTrACS,ERA-I, JRA-55, ERA-5, and multi-models (except forNCM014). Since global annual TC genesis frequenciessubstantially varied between the models and their hori-zontal resolutions (Fig. 1), we normalized the annual TCgenesis frequencies of the models, ERA-I, JRA-55, ERA-
5, and IBTrACS based on their mean values from 1990to 2014 for the respective data. Table 2 shows the Spear-man’s rank correlation of each model and reanalyseswith IBTrACS during the period in which availableperiod of IBTrACS overlapped tier 1 period; i.e., 1980–2014. There were no significant positive correlations be-tween the multi-model ensemble (MME) and IBTrACSfor TC genesis frequency in either hemisphere or the en-tire globe.As for the individual models, some models showed
weak or moderate correlations, which appeared to in-crease with decreasing horizontal grid interval in somemodels (especially in the North Atlantic; Supplementaltable 1). However, we should not regard this impact ofhorizontal resolution as an improvement. Roberts et al.(2019b) noted that a single member of a model is insuffi-cient for evaluating the impact of horizontal resolutionon interannual variability. They suggested that at leastsix members are required for robust basin-scalecorrelations.JRA-55 showed a statistically significant correlation
with IBTrACS for the globe (correlation coefficient:00.54, p value: 0.001), for the Northern Hemisphere(correlation coefficient: 0.49, p value: 0.003), and for theSouthern Hemisphere (correlation coefficient: 0.47, pvalue: 0.005). ERA-I and ERA-5 also showed a statisti-cally significant correlation with IBTrACS for the globeand the Northern Hemisphere except for the SouthernHemisphere. Supplemental table 1 lists correlation coef-ficients for individual ocean basins. JRA-55 has statisti-cally significant correlation in all ocean basins except theSouth Atlantic, which are higher than those of the otherreanalyses except for the North Atlantic. JRA-55 wellcaptures the interannual variability of the observed TCgenesis frequency. As Murakami (2014) suggested, JRA-55 properly represents the interannual variation of TCfrequency, which encourages the use of JRA-55 in thepresent study.As for future changes in TC genesis frequency due to
global warming, after 2039, approximately 75% of themodels projected a decrease in the global TC genesisfrequency compared with their mean value between1990 and 2014 (Fig. 2a). Consistent with Roberts et al.(2020), the decreasing trend was clear in the SouthernHemisphere (Fig. 2c), whereas the trend in the NorthernHemisphere was unclear (Fig. 2b).Table 3 summarizes the trends in TC genesis fre-
quency from 1990 to 2049 for the individual models. Ex-cept for MPI100, MPI052, and HG039, the modelsprojected a decreasing trend in global TC frequency.These decreasing trends were statistically significant atthe 90% confidence level (at least) for CNRM055,MRI060, MRI020, NCM056, and NCM028. The increas-ing trends in MPI100, MPI052, and HG039 were not
Yamada et al. Progress in Earth and Planetary Science (2021) 8:11 Page 5 of 17
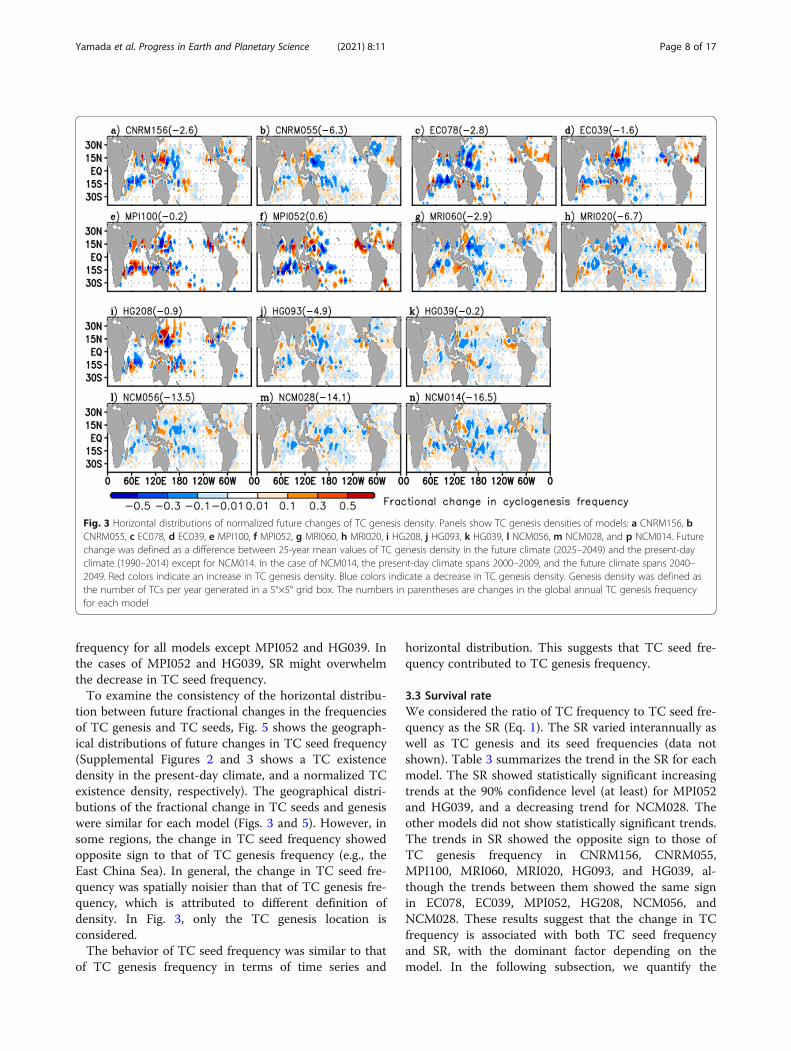
statistically significant. As a result, the MME mean andmedian showed a statistically significant decreasing trendwith at the 90% confidence level (at least).Figure 3 shows the spatial distributions of fractional
change in TC genesis density. Although the spatial dis-tribution of future change differs between models, Fig. 3represents some similar characteristics among models,which might reflect their responses to a specific externalcondition such as SST. For instance, in most models, TCgenesis frequency becomes more active near the westcoast of Africa, the west coast of North America, thenorth-west coast of Australia, and Madagascar. On theother hand, TC activity becomes inactive over the cen-tral South Pacific, the central Indian Ocean, and thewest side of the date line. The regions of decreasing TC
genesis negate those with increases, which leads to thedecreasing trend (Fig. 2).
3.2 TC seed frequenciesThe time series of normalized annual TC seed frequencyis seen in Fig. 4. Inter-model variability in the annual TCseed frequency appeared to be smaller than that of an-nual TC frequency (Fig. 2). This may be attributed tothe fact that ratio of variation of mean values in TC gen-esis frequency is larger than those of TC seed frequencyfor all models. TC seed frequency in the MME medianhad a significant positive correlation with that of JRA-55over the Northern Hemisphere and a significantly nega-tive correlation over the Southern Hemisphere. The TCfrequency in JRA-55 significantly correlated with that of
Fig. 1 Horizontal distributions of normalized TC genesis density. Panels show TC genesis densities of best track, reanalyses, and HighResMIPmodels: a IBTrACS, b ERA-I, c JRA-55, d ERA-5, e CNRM156, j CNRM055, g EC078, h EC039, i MPI100, j MPI052, k MRI060, l MRI020, m HG208, nHG093, o HG039, p NCM056, q NCM028, and r NCM014. Analysis periods are from 1990 to 2014 for panels a–q, and from 2000 to 2009 for panelr. The numbers in parentheses are the annual mean TC genesis frequencies during the respective analysis period for best track, reanalyses, andeach model. Genesis density was defined as the number of TCs per year generated in a 5°×5° grid box. The genesis densities are normalized bythe respective annual mean TC genesis frequency
Yamada et al. Progress in Earth and Planetary Science (2021) 8:11 Page 6 of 17

IBTrACS in the globe and both hemisphere (see Table 2).Therefore, we calculated the correlation coefficients be-tween each model and JRA-55 (Table 4). The annualglobal TC seed frequencies of the MME median andmean did not correlate with those of JRA-55 as well asdid TC genesis frequency.As for the individual models, correlation coefficients
between each model and JRA-55 are listed in Table 4.NCM028 showed a moderate positive correlation withJRA-55 across the globe (0.49) and in the NorthernHemisphere (0.46), whereas CNRM055, MRI060, andNCM056 did so only in the Northern Hemisphere (0.35,0.31, and 0.38, respectively). MPI100, MPI052, andHG093 showed moderate negative correlations in theSouthern Hemisphere (− 0.46, − 0.51, and − 0.33, re-spectively). MPI100 also showed a moderate negativecorrelation across the globe (− 0.38).As for the trend in TC seed frequency, the mean and
median values of MME showed statistically significantdecreasing trends at the 90% level (at least) across theglobe (Table 3). These decreasing trends were seen inboth hemispheres (Fig. 4). The decreasing trend in glo-bal TC seed frequency was consistent with that of TCgenesis frequency; i.e., the sign of the trends in TCs andseeds coincided with each other. As for the individualmodels, trends were consistent between TC and seed
Fig. 2 Time series of normalized annual TC genesis frequency. Annual TC genesis frequency was normalized based on the mean value from 1990to 2014 for respective data. Panels show time series of normalized annual TC genesis frequency for a the globe, b the Northern Hemisphere, andc the Southern Hemisphere, respectively. Black solid line indicates IBTrACS. Blue solid line shows the median value of models without NCM014.Blue dotted line shows eleven years running mean of the median value of the models. Light blue colored area indicates a range between 5 and95 percentile values of the models. Deep blue colored area indicates a range between 25 and 75 percentile values of the models. Magenta line isa result from ERA-I. Orange line indicates JRA-55. Red line indicates ERA-5
Table 3 Trends in TC genesis, TC seed frequency, and survivalrate (SR). Trends were calculated from 1990 to 2049. An asteriskindicates that a trend is statistically significant at the 90%confidence level (at least) with the nonparametric Mann–Kendaltest. P values are indicated in parentheses
Model TC genesis Seed SR
CNRM156 − 0.09 (0.298) *− 0.22 (0.014) 0.08 (0.342)
CNRM055 *− 0.21 (0.016) *− 0.32 (< 0.001) 0.10 (0.241)
EC078 − 0.11 (0.234) − 0.09 (0.287) − 0.07 (0.403)
EC039 − 0.10 (0.280) − 0.11 (0.207) − 0.04 (0.660)
MPI100 0.01 (0.913) 0.12 (0.170) − 0.05 (0.583)
MPI052 0.08 (0.397) − 0.10 (0.246) *0.19 (0.030)
MRI060 *− 0.18 (0.045) *− 0.18 (0.046) 0.04 (0.619)
MRI020 *− 0.19 (0.030) *− 0.32 (< 0.001) 0.14 (0.104)
HG208 − 0.03 (0.725) − 0.02 (0.818) − 0.04 (0.642)
HG093 − 0.14 (0.115) *− 0.18 (0.042) 0.01 (0.914)
HG039 0.04 (0.687) − 0.11 (0.235) *0.16 (0.065)
NCM056 *− 0.27 (0.003) *− 0.28 (0.001) − 0.08 (0.355)
NCM028 *− 0.28 (0.001) *− 0.26 (0.003) *− 0.24 (0.006)
MME mean *− 0.15 (0.093) *− 0.23 (0.010) 0.01 (0.944)
MME median *− 0.19 (0.034) *− 0.27 (0.003) 0.06 (0.536)
Yamada et al. Progress in Earth and Planetary Science (2021) 8:11 Page 7 of 17
frequency for all models except MPI052 and HG039. Inthe cases of MPI052 and HG039, SR might overwhelmthe decrease in TC seed frequency.To examine the consistency of the horizontal distribu-
tion between future fractional changes in the frequenciesof TC genesis and TC seeds, Fig. 5 shows the geograph-ical distributions of future changes in TC seed frequency(Supplemental Figures 2 and 3 shows a TC existencedensity in the present-day climate, and a normalized TCexistence density, respectively). The geographical distri-butions of the fractional change in TC seeds and genesiswere similar for each model (Figs. 3 and 5). However, insome regions, the change in TC seed frequency showedopposite sign to that of TC genesis frequency (e.g., theEast China Sea). In general, the change in TC seed fre-quency was spatially noisier than that of TC genesis fre-quency, which is attributed to different definition ofdensity. In Fig. 3, only the TC genesis location isconsidered.The behavior of TC seed frequency was similar to that
of TC genesis frequency in terms of time series and
horizontal distribution. This suggests that TC seed fre-quency contributed to TC genesis frequency.
3.3 Survival rateWe considered the ratio of TC frequency to TC seed fre-quency as the SR (Eq. 1). The SR varied interannually aswell as TC genesis and its seed frequencies (data notshown). Table 3 summarizes the trend in the SR for eachmodel. The SR showed statistically significant increasingtrends at the 90% confidence level (at least) for MPI052and HG039, and a decreasing trend for NCM028. Theother models did not show statistically significant trends.The trends in SR showed the opposite sign to those ofTC genesis frequency in CNRM156, CNRM055,MPI100, MRI060, MRI020, HG093, and HG039, al-though the trends between them showed the same signin EC078, EC039, MPI052, HG208, NCM056, andNCM028. These results suggest that the change in TCfrequency is associated with both TC seed frequencyand SR, with the dominant factor depending on themodel. In the following subsection, we quantify the
Fig. 3 Horizontal distributions of normalized future changes of TC genesis density. Panels show TC genesis densities of models: a CNRM156, bCNRM055, c EC078, d EC039, e MPI100, f MPI052, g MRI060, h MRI020, i HG208, j HG093, k HG039, l NCM056, m NCM028, and p NCM014. Futurechange was defined as a difference between 25-year mean values of TC genesis density in the future climate (2025–2049) and the present-dayclimate (1990–2014) except for NCM014. In the case of NCM014, the present-day climate spans 2000–2009, and the future climate spans 2040–2049. Red colors indicate an increase in TC genesis density. Blue colors indicate a decrease in TC genesis density. Genesis density was defined asthe number of TCs per year generated in a 5°×5° grid box. The numbers in parentheses are changes in the global annual TC genesis frequencyfor each model
Yamada et al. Progress in Earth and Planetary Science (2021) 8:11 Page 8 of 17
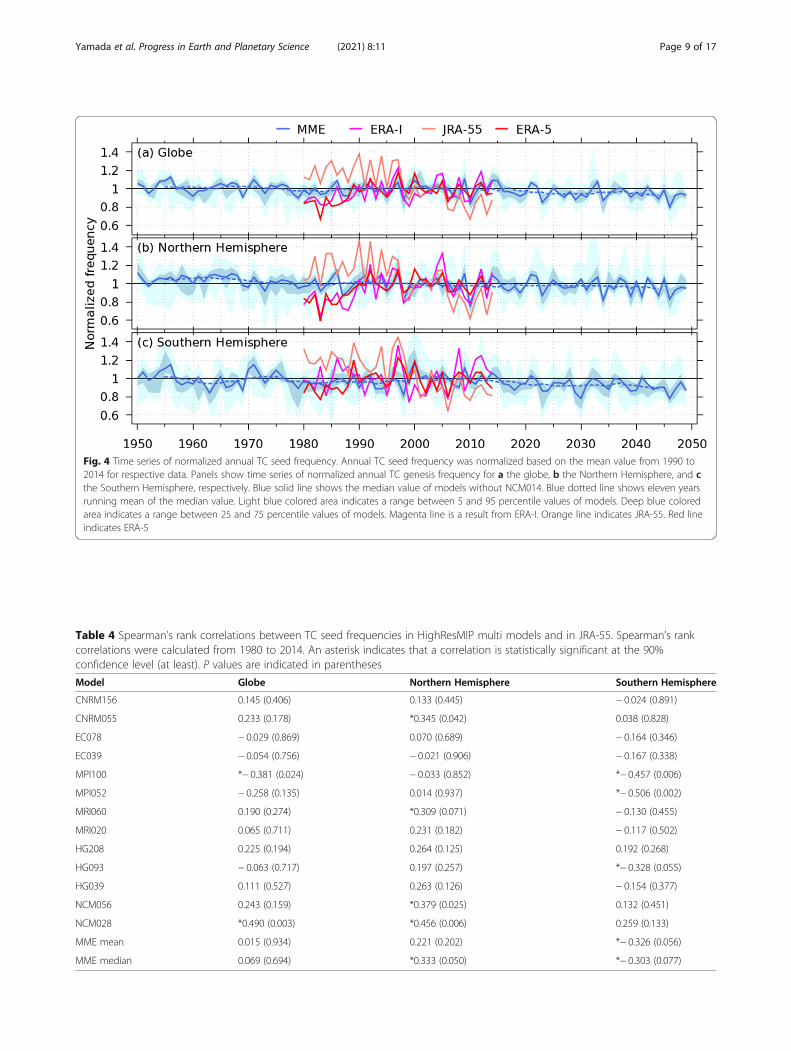
Fig. 4 Time series of normalized annual TC seed frequency. Annual TC seed frequency was normalized based on the mean value from 1990 to2014 for respective data. Panels show time series of normalized annual TC genesis frequency for a the globe, b the Northern Hemisphere, and cthe Southern Hemisphere, respectively. Blue solid line shows the median value of models without NCM014. Blue dotted line shows eleven yearsrunning mean of the median value. Light blue colored area indicates a range between 5 and 95 percentile values of models. Deep blue coloredarea indicates a range between 25 and 75 percentile values of models. Magenta line is a result from ERA-I. Orange line indicates JRA-55. Red lineindicates ERA-5
Table 4 Spearman’s rank correlations between TC seed frequencies in HighResMIP multi models and in JRA-55. Spearman’s rankcorrelations were calculated from 1980 to 2014. An asterisk indicates that a correlation is statistically significant at the 90%confidence level (at least). P values are indicated in parentheses
Model Globe Northern Hemisphere Southern Hemisphere
CNRM156 0.145 (0.406) 0.133 (0.445) − 0.024 (0.891)
CNRM055 0.233 (0.178) *0.345 (0.042) 0.038 (0.828)
EC078 − 0.029 (0.869) 0.070 (0.689) − 0.164 (0.346)
EC039 − 0.054 (0.756) − 0.021 (0.906) − 0.167 (0.338)
MPI100 *− 0.381 (0.024) − 0.033 (0.852) *− 0.457 (0.006)
MPI052 − 0.258 (0.135) 0.014 (0.937) *− 0.506 (0.002)
MRI060 0.190 (0.274) *0.309 (0.071) − 0.130 (0.455)
MRI020 0.065 (0.711) 0.231 (0.182) − 0.117 (0.502)
HG208 0.225 (0.194) 0.264 (0.125) 0.192 (0.268)
HG093 − 0.063 (0.717) 0.197 (0.257) *− 0.328 (0.055)
HG039 0.111 (0.527) 0.263 (0.126) − 0.154 (0.377)
NCM056 0.243 (0.159) *0.379 (0.025) 0.132 (0.451)
NCM028 *0.490 (0.003) *0.456 (0.006) 0.259 (0.133)
MME mean 0.015 (0.934) 0.221 (0.202) *− 0.326 (0.056)
MME median 0.069 (0.694) *0.333 (0.050) *− 0.303 (0.077)
Yamada et al. Progress in Earth and Planetary Science (2021) 8:11 Page 9 of 17

relationships between TC genesis frequency, TC seedfrequency, and SR.
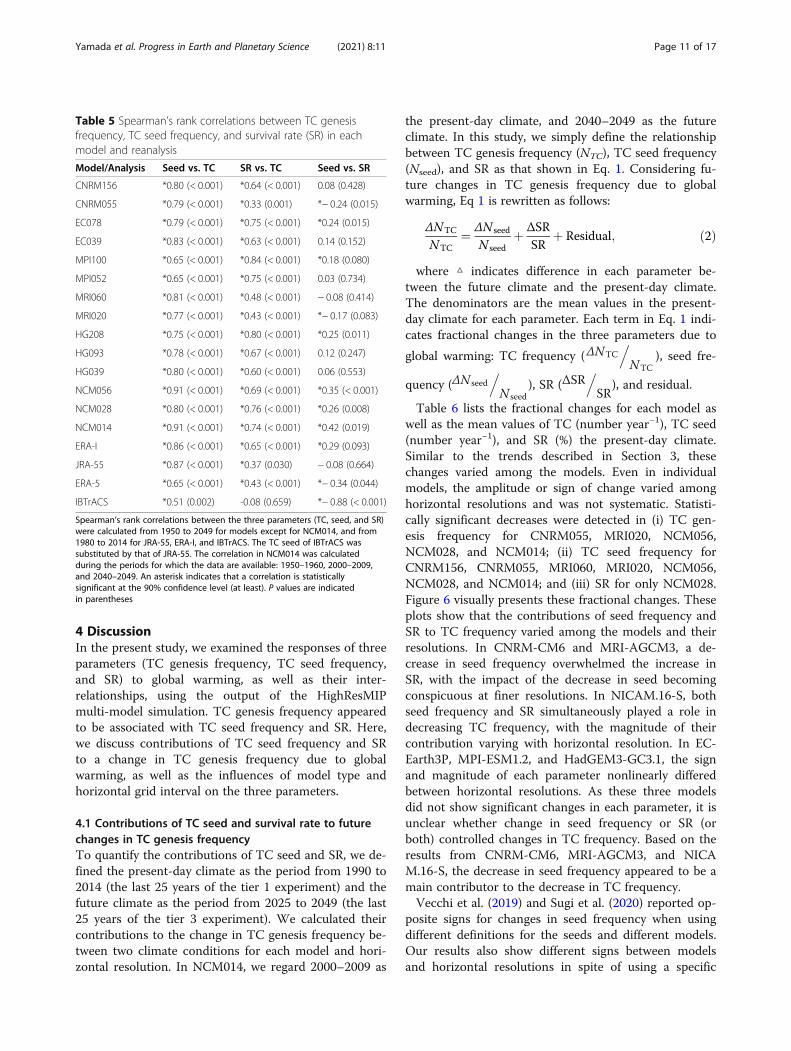
3.4 Relationships between each parameterTo quantify the relationships between annual TC genesisfrequency, seed frequency, and SR, Table 5 lists the cor-relation coefficients between these three parametersfrom 1950 to 2049. As for TC genesis and its seed fre-quency, CNRM-CM6, EC-Earth3P, MRI-AGCM3,HadGEM3-GC3.1, and NICAM.16-S showed strong, sta-tistically significant correlations (greater than 0.7) at the99.9% confidence level, whereas MPI-ESM1.2 showedonly a moderate correlation (0.65). Correlations for sin-gle models were almost unchanged for different horizon-tal resolutions. In the reanalyses, the correlationcoefficients were strong (0.87 for JRA-55 and 0.86 forERA-I), and moderate (0.65 for ERA-I). In addition, TCgenesis frequency in IBTrACS showed a moderate cor-relation with TC seed frequency which is substitutionfrom JRA-55. These findings suggest that TC seed fre-quency strongly affects TC genesis frequency.
In terms of TC genesis frequency and SR, EC078,MPI-ESM1.2, HG208, NCM028, and NCM014 showedstrong, statistically significant correlations (greaterthan 0.7) at the 99.9% confidence level. CNRM156,EC039, MRI-AGCM3, HG093, HG039, and NICAM056 showed moderate correlations (0.4–0.7) at the99.0% confidence level (at least). CNRM055 showed aweak correlation (0.33). Differing from TC seed, thecorrelation of SR with TC frequency in CNRM-CM6varied substantially between horizontal resolutions. Inthe reanalyses, JRA-55 showed a weak correlation(0.37), whereas ERA-I and ERA-5 showed a moderatecorrelation (0.65 and 0.43). In IBTrACS, there was amoderate correlation (0.47). Most models and reanaly-ses showed that TC seed frequency exhibited a stron-ger relation to TC genesis than to SR (except forMPI-ESM1.2 and HG208).On the other hand, TC seed frequency and SR show
generally weaker correlations compared with other pairsof parameters. This indicates that SR may be independ-ent of TC seed frequency.
Fig. 5 Horizontal distributions of future change in TC seed existence density. Existence density was defined as the number of TC seeds per yearexisted in a 5°×5° grid box. Future change was defined as a difference between 25-year mean values of TC genesis density in the future climate(2025–2049) and the present-day climate (1990–2014). Red colors indicate an increase in TC seed existence density due to global warming. Bluecolors indicate a decrease in TC seed existence density. Panels show future changes in TC seed existence density of HighResMIP models: aCNRM156, b CNRM055, c EC078, d EC039, e MPI100, f MPI052, g MRI060, h MRI020, i NICAM056, and j NICAM028. The numbers in parenthesesare changes in the global annual TC seed frequency for each model
Yamada et al. Progress in Earth and Planetary Science (2021) 8:11 Page 10 of 17
4 DiscussionIn the present study, we examined the responses of threeparameters (TC genesis frequency, TC seed frequency,and SR) to global warming, as well as their inter-relationships, using the output of the HighResMIPmulti-model simulation. TC genesis frequency appearedto be associated with TC seed frequency and SR. Here,we discuss contributions of TC seed frequency and SRto a change in TC genesis frequency due to globalwarming, as well as the influences of model type andhorizontal grid interval on the three parameters.
4.1 Contributions of TC seed and survival rate to futurechanges in TC genesis frequencyTo quantify the contributions of TC seed and SR, we de-fined the present-day climate as the period from 1990 to2014 (the last 25 years of the tier 1 experiment) and thefuture climate as the period from 2025 to 2049 (the last25 years of the tier 3 experiment). We calculated theircontributions to the change in TC genesis frequency be-tween two climate conditions for each model and hori-zontal resolution. In NCM014, we regard 2000–2009 as
the present-day climate, and 2040–2049 as the futureclimate. In this study, we simply define the relationshipbetween TC genesis frequency (NTC), TC seed frequency(Nseed), and SR as that shown in Eq. 1. Considering fu-ture changes in TC genesis frequency due to globalwarming, Eq 1 is rewritten as follows:
ΔNTC
NTC¼ ΔN seed
N seedþ ΔSR
SRþ Residual; ð2Þ
where △ indicates difference in each parameter be-tween the future climate and the present-day climate.The denominators are the mean values in the present-day climate for each parameter. Each term in Eq. 1 indi-cates fractional changes in the three parameters due to
global warming: TC frequency (ΔNTC.NTC
), seed fre-
quency (ΔN seed.N seed
), SR (ΔSR.SR
), and residual.
Table 6 lists the fractional changes for each model aswell as the mean values of TC (number year−1), TC seed(number year−1), and SR (%) the present-day climate.Similar to the trends described in Section 3, thesechanges varied among the models. Even in individualmodels, the amplitude or sign of change varied amonghorizontal resolutions and was not systematic. Statisti-cally significant decreases were detected in (i) TC gen-esis frequency for CNRM055, MRI020, NCM056,NCM028, and NCM014; (ii) TC seed frequency forCNRM156, CNRM055, MRI060, MRI020, NCM056,NCM028, and NCM014; and (iii) SR for only NCM028.Figure 6 visually presents these fractional changes. Theseplots show that the contributions of seed frequency andSR to TC frequency varied among the models and theirresolutions. In CNRM-CM6 and MRI-AGCM3, a de-crease in seed frequency overwhelmed the increase inSR, with the impact of the decrease in seed becomingconspicuous at finer resolutions. In NICAM.16-S, bothseed frequency and SR simultaneously played a role indecreasing TC frequency, with the magnitude of theircontribution varying with horizontal resolution. In EC-Earth3P, MPI-ESM1.2, and HadGEM3-GC3.1, the signand magnitude of each parameter nonlinearly differedbetween horizontal resolutions. As these three modelsdid not show significant changes in each parameter, it isunclear whether change in seed frequency or SR (orboth) controlled changes in TC frequency. Based on theresults from CNRM-CM6, MRI-AGCM3, and NICAM.16-S, the decrease in seed frequency appeared to be amain contributor to the decrease in TC frequency.Vecchi et al. (2019) and Sugi et al. (2020) reported op-
posite signs for changes in seed frequency when usingdifferent definitions for the seeds and different models.Our results also show different signs between modelsand horizontal resolutions in spite of using a specific
Table 5 Spearman’s rank correlations between TC genesisfrequency, TC seed frequency, and survival rate (SR) in eachmodel and reanalysis
Model/Analysis Seed vs. TC SR vs. TC Seed vs. SR
CNRM156 *0.80 (< 0.001) *0.64 (< 0.001) 0.08 (0.428)
CNRM055 *0.79 (< 0.001) *0.33 (0.001) *− 0.24 (0.015)
EC078 *0.79 (< 0.001) *0.75 (< 0.001) *0.24 (0.015)
EC039 *0.83 (< 0.001) *0.63 (< 0.001) 0.14 (0.152)
MPI100 *0.65 (< 0.001) *0.84 (< 0.001) *0.18 (0.080)
MPI052 *0.65 (< 0.001) *0.75 (< 0.001) 0.03 (0.734)
MRI060 *0.81 (< 0.001) *0.48 (< 0.001) − 0.08 (0.414)
MRI020 *0.77 (< 0.001) *0.43 (< 0.001) *− 0.17 (0.083)
HG208 *0.75 (< 0.001) *0.80 (< 0.001) *0.25 (0.011)
HG093 *0.78 (< 0.001) *0.67 (< 0.001) 0.12 (0.247)
HG039 *0.80 (< 0.001) *0.60 (< 0.001) 0.06 (0.553)
NCM056 *0.91 (< 0.001) *0.69 (< 0.001) *0.35 (< 0.001)
NCM028 *0.80 (< 0.001) *0.76 (< 0.001) *0.26 (0.008)
NCM014 *0.91 (< 0.001) *0.74 (< 0.001) *0.42 (0.019)
ERA-I *0.86 (< 0.001) *0.65 (< 0.001) *0.29 (0.093)
JRA-55 *0.87 (< 0.001) *0.37 (0.030) − 0.08 (0.664)
ERA-5 *0.65 (< 0.001) *0.43 (< 0.001) *− 0.34 (0.044)
IBTrACS *0.51 (0.002) -0.08 (0.659) *− 0.88 (< 0.001)
Spearman’s rank correlations between the three parameters (TC, seed, and SR)were calculated from 1950 to 2049 for models except for NCM014, and from1980 to 2014 for JRA-55, ERA-I, and IBTrACS. The TC seed of IBTrACS wassubstituted by that of JRA-55. The correlation in NCM014 was calculatedduring the periods for which the data are available: 1950–1960, 2000–2009,and 2040–2049. An asterisk indicates that a correlation is statisticallysignificant at the 90% confidence level (at least). P values are indicatedin parentheses
Yamada et al. Progress in Earth and Planetary Science (2021) 8:11 Page 11 of 17

Table 6 Fractional changes in TC genesis frequency, TC seed frequency, and SR
Model TC Seed SR Resi
△ [%] Pmean △[%] Pmean △[%] Pmean △[%]
CNRM156 − 6.27 40.8 *− 8.44 1034.7 2.16 3.9 − 0.01
CNRM055 − 7.57 83.5 *− 9.66 2725.5 2.08 3.1 − 0.01
EC078 − 13.12 21.0 − 8.10 394.7 − 5.00 5.3 0.02
EC039 − 4.52 35.4 − 5.41 575.0 1.41 6.1 0.52
MPI100 − 1.57 10.2 3.68 519.9 − 4.81 1.9 0.45
MPI052 5.05 11.9 − 5.15 756.6 9.40 1.6 − 0.80
MRI060 − 5.11 57.1 *− 5.99 2192.5 0.73 2.6 − 0.15
MRI020 *− 7.12 93.9 *− 10.04 4238.5 3.16 2.2 0.23
HG208 − 3.32 27.7 0.40 1062.5 − 4.65 2.6 − 0.93
HG093 − 4.67 105.4 − 4.45 4242.6 − 0.40 2.5 − 0.19
HG039 − 0.13 150.9 − 1.47 6409.1 1.44 2.4 0.11
NCM056 *− 6.33 213.6 *− 5.08 10108.6 − 1.37 2.1 − 0.12
NCM028 *− 5.13 274.6 *− 2.29 15982.6 *− 2.91 1.7 − 0.08
NCM14 *− 6.16 267.8 *− 4.37 16598.2 − 1.80 1.6 − 0.01
MME mean *− 4.72 *− 4.56 0.04 − 0.20
MME median *− 5.32 *− 4.12 0.20 − 1.40
Fractional changes (△ [%]) were calculated based on the ratio of differences between mean values of the future climate (2025–2049) and the present-day climate(1990–2014) to the mean value of the present-day climate (Pmean). In NCM014, we regard 2000–2009 as the present-day climate, and 2040–2049 as the futureclimate. Residual (Resi) was calculated based on Eq. 2. MME mean and median indicates change ratio of TC genesis frequency, TC seed frequency, and survivalrate calculated from the multi models except NCM014, which were normalized based on the mean value from 1990 to 2014. Positive values indicate an increasein the respective variable due to global warming, whereas negative values denote a decrease. Statistical significance of future changes was determined with theWilcoxon rank-sum test. An asterisk indicates that a future change is statistically significant at the 90% confidence level (at least)
Fig. 6 Change ratio of TC genesis frequency, TC seed frequency, and survival rate. Horizontal axis indicates models. Change ratio was calculatedbased on the ratio of differences between mean values of the future climate (2025–2049) and the present-day climate (1990–2014) to the meanvalue of the present-day climate. In NCM014, we regard 2000–2009 as the present-day climate, and 2040–2049 as the future climate. Residual(Resi) was calculated based on Eq. 2. MME mean and median indicates change ratio of TC genesis frequency, TC seed frequency, and survival ratecalculated from the multi models except NCM014, which were normalized based on the mean value from 1990 to 2014. Deep colored boxesindicate that its change is statistically significant at least 90% level with the Wilcoxon rank-sum test
Yamada et al. Progress in Earth and Planetary Science (2021) 8:11 Page 12 of 17
definition of the seed. Although the most models (12models) showed a decrease in seed frequency, two low-resolution models (MPI100 and HG208) showed an in-crease. Inter-model differences in TC seed change mightplay a key role in understanding variability in future TCprojections among models.
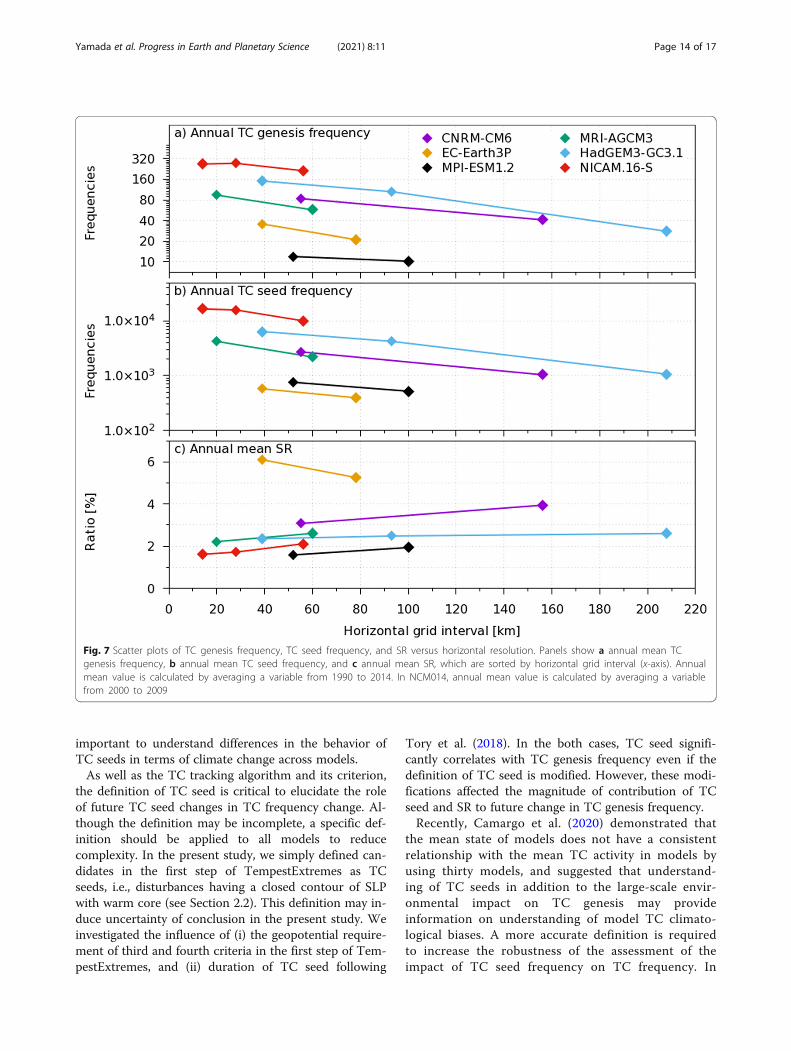
4.2 Dependency on model and its resolutionAs seen in the previous subsection, our results showedlittle systematic change in the response of TC frequency,seed frequency, and SR to global warming in relation tohorizontal resolution. This may be associated with theimpact of horizontal resolution on the interannual vari-ability of TC frequency, as shown in Roberts et al.(2019b). However, Roberts et al. (2019b) showed thatTC frequency is substantially increased even for a singlemodel with a reduced horizontal grid interval. Similarly,Fig. 1 and Table 6 show systematic increases in TC fre-quency for a single model with finer horizontal reso-lution. We discuss the dependencies of the threeparameters on model type and horizontal resolution.In Fig. 7, each panel shows the 25-year mean TC gen-
esis frequency, seed frequency, and SR in the present-day climate (1990–2014), which are sorted by the hori-zontal resolution of each model. In NCM014, the periodis from 2000 to 2009. The horizontal grid interval ap-pears to be contributing to the difference in TC genesisfrequency between resolutions for each model, but notto the difference between models (Fig. 7a). For instance,the higher-resolution version of EC-Earth3P (EC039)shows larger TC frequency than does its lower-resolution version (EC078). However, the TC genesisfrequency of EC039 is less than those of HG093,MRI060, NCM056, and CNRM055, in which the hori-zontal grid intervals are larger than that of EC039.A similar characteristic was seen in the TC seed fre-
quency for inter-model differences and inter-horizontalresolutions for each model (Fig. 7b). On the other hand,the SR was higher in the lower-resolution versions of themodels than it was in the higher-resolution versions (ex-cept for EC-Earth3P (Fig. 6c)). The three parameterslinearly depended on the model’s horizontal resolution.TC genesis frequency and TC seed frequency were in-creased with finer resolution for all the models, whereasSR showed a decreasing tendency (except for in EC-Earth3P).Summarizing Fig. 7, we can see the systematic increase
in TC seeds for a single model with finer horizontalresolution. Models in which more seeds occur generatemore TC. Inter-model differences in TC seeds might berelated to model configuration, dynamical core, andphysical process such as cumulus convection (Murakamiet al. 2012; Reed et al. 2015; Zhao et al. 2012). For in-stance, Zhao et al. (2012) investigated the impact of
damping of the divergent component of horizontal flow,showing a continuous increase in global TC frequencywith increasing strength of the divergence damping.
5 Summary and concluding remarksIn the present study, we investigated future changes inTC seed frequency and its relation to TC frequencyusing a HighResMIP multi-model simulation. Tempes-tExtremes was utilized for detecting TCs and TC seedsin each model. We estimated the SR, which defined theratio of TC genesis frequency to TC seed frequency.The MME showed a statistically significant decreasing
trend in TC genesis frequency and TC seed frequencyfrom 1990 to 2049. The SR did not show a significanttrend. As for the individual models, models with a sig-nificant decreasing trend in TC frequency also showedsignificant decreasing trends in TC seed frequency(Table 3). Annual TC and seed frequency in the modelsand three reanalyses strongly correlated with each other(except for MPI-ESM1.2 and ERA-5) (Table 5). Inaddition, TC genesis frequency in IBTrACS was moder-ately correlated with the TC seeds detected in JRA-55(0.41). The correlation coefficients between annual TCfrequency and SR were significant and were weaker thanthose between TC and seed frequencies, except for MPI-ESM1.2. The horizontal distributions of change in TCgenesis frequency were similar to those in seed fre-quency for each model (Figs. 3 and 5). These results in-dicate that TC frequency is possibly constrained by TCseed, SR, and their balance. This is broadly consistentwith the findings of Vecchi et al. (2019).We compared the contributions of changes in TC seed
frequency and SR to changes in TC genesis frequencybetween models and their horizontal resolutions (Fig. 6and Table 6). In CNRM-CM6, MRI-AGCM3, and NICAM.16-S, the signs of the contributions of both parame-ters differed between models but were unchanged be-tween horizontal resolutions. In CNRM-CM6 and MRI-AGCM3, the decrease in TC seed overwhelmed the in-crease in SR, contributing to the decrease in TC fre-quency. In NICAM.16-S, the decreases in both factorscontributed to the decrease in TC frequency. In EC-Earth3P, MPI-ESM1.2, and HadGEM3-GC3.1, the signsof the contributions differed between not only themodels but also their horizontal resolutions. Thesemodels did not show significant changes in TC fre-quency, seed frequency, and SR between the present-dayand future climates (Fig. 6 and Table 6). Although thecontributions of changes in TC seed and SR differed be-tween models and their horizontal resolutions, the re-sponse of TC frequency to global warming is attributedto the response of TC seed and SR. These differencespossibly induced the differences in the future projectionof TC frequency across previous studies. Therefore, it is
Yamada et al. Progress in Earth and Planetary Science (2021) 8:11 Page 13 of 17
important to understand differences in the behavior ofTC seeds in terms of climate change across models.As well as the TC tracking algorithm and its criterion,
the definition of TC seed is critical to elucidate the roleof future TC seed changes in TC frequency change. Al-though the definition may be incomplete, a specific def-inition should be applied to all models to reducecomplexity. In the present study, we simply defined can-didates in the first step of TempestExtremes as TCseeds, i.e., disturbances having a closed contour of SLPwith warm core (see Section 2.2). This definition may in-duce uncertainty of conclusion in the present study. Weinvestigated the influence of (i) the geopotential require-ment of third and fourth criteria in the first step of Tem-pestExtremes, and (ii) duration of TC seed following
Tory et al. (2018). In the both cases, TC seed signifi-cantly correlates with TC genesis frequency even if thedefinition of TC seed is modified. However, these modi-fications affected the magnitude of contribution of TCseed and SR to future change in TC genesis frequency.Recently, Camargo et al. (2020) demonstrated that
the mean state of models does not have a consistentrelationship with the mean TC activity in models byusing thirty models, and suggested that understand-ing of TC seeds in addition to the large-scale envir-onmental impact on TC genesis may provideinformation on understanding of model TC climato-logical biases. A more accurate definition is requiredto increase the robustness of the assessment of theimpact of TC seed frequency on TC frequency. In
Fig. 7 Scatter plots of TC genesis frequency, TC seed frequency, and SR versus horizontal resolution. Panels show a annual mean TCgenesis frequency, b annual mean TC seed frequency, and c annual mean SR, which are sorted by horizontal grid interval (x-axis). Annualmean value is calculated by averaging a variable from 1990 to 2014. In NCM014, annual mean value is calculated by averaging a variablefrom 2000 to 2009
Yamada et al. Progress in Earth and Planetary Science (2021) 8:11 Page 14 of 17

addition, we did not discover any reason for why TCseed frequency changes with global warming, whichmight be related to the responses of the Madden–Ju-lian Oscillation, easterly wave, and monsoon troughto global warming. These topics are candidates forfuture work.
6 Supplementary InformationThe online version contains supplementary material available at https://doi.org/10.1186/s40645-020-00397-1.
Additional file 1: Supplemental Figure 1. Horizontal distributions ofannual TC genesis density. Panels show TC genesis densities of best track,reanalyses, and HighResMIP models: (a) IBTrACS, (b) ERA-I, (c) JRA-55, (d)ERA-5, (e) CNRM156, (f) CNRM055, (g) EC078, (h) EC039, (i) MPI100, (j)MPI052, (k) MRI060, (l) MRI020, (m) HG208, (n) HG093, (o) HG039, (p)NCM056, (q) NCM028, and (r) NCM014. Analysis periods are from 1990 to2014 for panels a–q, and from 2000 to 2009 for panel r. The numbers inparentheses are the annual mean TC genesis frequencies during the re-spective analysis period for best track, reanalyses and each model. Gen-esis density was defined as the number of TCs per year generated in a5°×5° grid box.
Additional file 2: Supplemental Figure 2. Horizontal distributions ofNormalized TC seed existence density. Panels show TC genesis densitiesof reanalyses and HighResMIP models: (a) ERA-I, (b) JRA-55, (c) ERA-5, (d)CNRM156, (e) CNRM055, (f) EC078, (g) EC039, (h) MPI100, (i) MPI052, (j)MRI060, (k) MRI020, (l) HG208, (m) HG093, (n) HG039, (o) NCM056, (p)NCM028, and (q) NCM014. Analysis periods are from 1990 to 2014 forpanels a–p, and from 2000 to 2009 for panel q. The numbers in paren-theses are the annual mean TC seed existence frequencies during the re-spective analysis period for reanalyses and each model. Existence densitywas defined as the number of TC seeds per year existed in a 5°×5° gridbox. The existence densities are normalized by the respective annualmean TC seed existence frequency.
Additional file 3: Supplemental Figure 3. Horizontal distributions ofAnnual TC seed existence density. Panels show TC genesis densities ofreanalyses and HighResMIP models: (a) ERA-I, (b) JRA-55, (c) ERA-5, (d)CNRM156, (e) CNRM055, (f) EC078, (g) EC039, (h) MPI100, (i) MPI052, (j)MRI060, (k) MRI020, (l) HG208, (m) HG093, (n) HG039, (o) NCM056, (p)NCM028, and (q) NCM014. Analysis periods are from 1990 to 2014 forpanels a–p, and from 2000 to 2009 for panel q. The numbers in paren-theses are the annual mean TC seed existence frequencies during the re-spective analysis period for reanalyses and each model. Existence densitywas defined as the number of TC seeds per year existed in a 5°×5° gridbox.
Additional file 4.
AbbreviationsCMIP6: The sixth phase of the Coupled Model Intercomparison Project;CNRM-CM6: Centre National de Recherches Meteorologiques and Cerfacs forCMIP6; CNRM055: CNRM-CM6 with a horizontal grid interval of 55 km;CNRM156: CNRM-CM6 with a horizontal grid interval of 156 km; EC039: EC-Earth3P with a horizontal grid interval of 78 km; EC078: EC-Earth3P with ahorizontal grid interval of 78 km; ECMWF: The European Centre for Medium-Range Weather Forecasts; ERA-I: The ECMWF Interim Re-Analysis; ERA-5: Thefifth-generation ECMWF reanalysis; HighResMIP: High Resolution ModelIntercomparison Project; IBTrACS: International Best Track Archive for ClimateStewardship; JRA55: Japanese 55-year Reanalysis; MME: Multi modelensemble; MPI-ESM1.2: Max Planck Institute for Meteorology Earth SystemModel; MPI052: MPI-ESM1.2 with a horizontal grid interval of 52 km;MPI100: MPI-ESM1.2 with a horizontal grid interval of 100 km; MRI-AGCM3: Meteorological Research Institute/Japan Meteorological AgencyAtmospheric General Circulation Model; MRI020: MRI-AGCM3 with ahorizontal grid interval of 20 km; MRI060: MRI-AGCM3 with a horizontal gridinterval of 60 km; NICAM: Nonhydrostatic ICosahedral Atmospheric Model;NICAM.16-S: The latest stable version of NICAM modified for CMIP6;NCM014: NICAM with a horizontal grid interval of 14 km; NCM028: NICAM
with a horizontal grid interval of 28 km; NCM056: NICAM with a horizontalgrid interval of 56 km; SLP: Sea level pressure; SR: Survival rate; SST: Seasurface temperature; TC: Tropical cyclone; TD: Tropical depression
AcknowledgmentsJRA-55 data from the JMA, and ERA-5 and ERA-I data from the ECMWF. TheHighResMIP simulations of NICAM.16-S and MRI-AGCM3 were performed onthe Earth Simulator at the Japan Agency for Marine-Earth Science and Tech-nology (JAMSTEC), and some of them on the K computer (proposal numberhp150287, hp160230, hp170234, hp180182, and hp190152). The authors ac-knowledge Dr. Ishi and anonymous reviewers for their constructive com-ments, and Editorial office for their supports. We used Gnuplot and GrADSfor drawing figures and python for statistical analysis. YY thanks Enago forthe English language review.
Authors’ contributionsYY analyzed the simulations and drafted the manuscript. CK, MSa, MSu, MJR,RM, ATN, TN, MN, and PLV helped in the interpretation and collaboratedwith the corresponding author in the construction of the manuscript. All co-authors participated in discussions of the results and commented on the ori-ginal manuscript. MJR led CMIP6 HighResMIP and conducted HadGEM3-GC3.1. CK conducted the simulations of NICAM.16-S. RM conducted the sim-ulations of MRI-AGCM3. All authors read and approved the final manuscript.
FundingThis study was supported by the Environment Research and TechnologyDevelopment Fund (2RF-1701) of the Environmental Restoration andConservation Agency of Japan (ERCA); the Integrated Research Program forAdvancing Climate Models (TOUGOU program: JPMXD0717935457,JPMXD0717935561), and the FLAGSHIP2020 project within the priority study4(proposal number hp150287, hp160230, hp170234, hp180182, andhp190152), of the Ministry of Education, Culture, Sports, Science andTechnology (MEXT) of Japan; and the PRIMAVERA project, funded by theEuropean Union's Horizon 2020 program under Grant Agreement no.641727.
Availability of data and materialsThe HighResMIP datasets analyzed during the current study are (and will be)available in the Earth System Grid Federation repository, [https://esgf-node.llnl.gov/search/cmip6/]. Tropical cyclone tracks as calculated by theTempestExtremes algorithm are (and will be) available in the Centre forEnvironmental Data Analysis repository, [https://catalogue.ceda.ac.uk/uuid/438268b75fed4f27988dc02f8a1d756d].
Competing interestsThe authors declare that they have no competing interests.
Author details1Japan Agency for Marine-Earth Science and Technology, 3173-25Showa-machi, Yokohama, Kanagawa 236-0001, Japan. 2Atmosphere andOcean Research Institute, The University of Tokyo, 5-1-5 Kashiwanoha,Kashiwa, Chiba 277-8564, Japan. 3Meteorological Research Institute, JapanMeteorological Agency, 1-1 Nagamine, Tsukuba, Ibaraki 305-0052, Japan.4Met Office, Exeter EX1 3PB, UK. 5National Centre for Atmospheric Science,Department of Meteorology, University of Reading, Reading RG6 6BB, UK.
Received: 31 March 2020 Accepted: 2 December 2020
ReferencesBhatia K, Vecchi G, Murakami H, Underwood S, Kossin J (2018) Projected response
of tropical cyclone intensity and intensification in a global climate model. JClimate 31:8281–8303. https://doi.org/10.1175/JCLI-D-17-0898.1
Camargo SJ (2013) Global and regional aspects of tropical cyclone activity in theCMIP5 models. J Climate 26:9880–9902. https://doi.org/10.1175/JCLI-D-12-00549.1
Camargo SJ, Giulivi CF, Sobel AH, Wing AA, Kim D, Moon Y, Strong JD, Del GenioAD, Kelley M, Murakami H, Reed KA, Scoccimarro E, Vecchi GA, Wehner MF,Zarzycki C, Zhao M (2020) Characteristics of model tropical cycloneclimatology and the large-scale environment. J Climate 33:4463–4487.https://doi.org/10.1175/JCLI-D-19-0500.1
Yamada et al. Progress in Earth and Planetary Science (2021) 8:11 Page 15 of 17

Chu JH, Sampson CR, Levine AS, Fukada E, (2002) The joint typhoon warming centertropical cyclone best-tracks. NRL Tech. Rep. 1945–2000, NRL/MR/7540-02-16, http://www.usno.navy.mil/NOOC/nmfc-ph/RSS/jtwc/best_tracks/TC_bt_report.html.
Copernicus Climate Change Service (2017)ERA5: fifth generation of ECMWFatmospheric reanalyses of the global climate. Copernicus Climate ChangeService Climate Data Store (CDS),
Dee DP, Uppala SM, Simmons AJ, Berrisford P, Poli P, Kobayashi S, Andrae U,Balmaseda MA, Balsamo G, Bauer P, Bechtold P, Beljaars ACM, van de Berg L,Bidlot J, Bormann N, Delsol C, Dragani R, Fuentes M, Geer AJ, Haimberger L,Healy SB, Hersbach H, Holm EV, Isaksen L, Kallberg P, Kohler M, Matricardi M,McNally AP, Monge-Sanz BM, Morcrette J-J, Park B-K, Peubey C, de Rosnay P,Tavolato C, Thepaut J-N, Vitart F (2011) The ERA-Interim reanalysis:configuration and performance of the data assimilation system. Q J RoyalMeteorol Soc 137:553–597. https://doi.org/10.1002/qj.828
Eyring V, Bony S, Meehl GA, Senior C, Stevens B, Stouffer RJ, Taylor KE (2016)Overview of the coupled model intercomparison project phase 6 (CMIP6)experimental design and organization. Geosci Model Dev 9:1937–1958.https://doi.org/10.5194/gmd-9-1937-2016
Gutjahr O, Putrasahan D, Lohmann K, Jungclaus JH, von Storch JS, Brüggemann N,Haak H, Stössel A (2019) Max Planck Institute Earth System Model (MPI-ESM1.2)for the High-Resolution Model Intercomparison Project (HighResMIP). GeosciModel Dev 12:3241–3281. https://doi.org/10.5194/gmd-12-3241-2019
Haarsma R, Acosta M, Bakhshi R, Bretonnière PB, Caron LP, Castrillo M, Corti S, DaviniP, Exarchou E, Fabiano F, Fladrich U, Fuentes Franco R, García-Serrano J, vonHardenberg J, Koenigk T, Levine X, Meccia V, van Noije T, van den Oord G,Palmeiro FM, Rodrigo M, Ruprich-Robert Y, Le Sager P, Tourigny É, Wang S, vanWeele M, Wyser K (2020) HighResMIP versions of EC-Earth: EC-Earth3P and EC-Earth3P-HR. Description, model performance, data handling and validation.Geosci Model Dev Discuss. https://doi.org/10.5194/gmd-2019-350
Haarsma RJ, Roberts MJ, Vidale PL, Senior CA, Bellucci A, Bao Q, Chang P, Corti S,Fuˇckar NS, Guemas V, von Hardenberg J, Hazeleger W, Kodama C, KoenigkT, Leung LR, Lu J, Luo JJ, Mao J, Mizielinski MS, Mizuta R, Nobre P, Satoh M,Scoccimarro E, Semmler T, Small J, von Storch JS (2016) High resolutionmodel intercomparison project (HighResMIP v1.0) for CMIP6. Geosci ModelDev 9:4185–4208. https://doi.org/10.5194/gmd-9-4185-2016
Harada Y, Kamahori H, Kobayashi C, Endo H, Kobayashi S, Ota Y, Onoda H, OnogiK, Miyaoka K, Takahashi K (2016) The JRA-55 reanalysis: representation ofatmospheric circulation and climate variability. J Meteorol Soc Japan 94:269–302. https://doi.org/10.2151/jmsj.2016-015
Hodges K, Cobb A, Vidale PL (2017) How well are tropical cyclone represented inreanalysis datasets. J Climate 30:5243–5264. https://doi.org/10.1175/JCLI-D-16-0557.1
Hurley JV, Boo WR (2014) A global climatology of monsoon low-pressure systems. QJ Royal Meteorol Soc 141:1049–1064. https://doi.org/10.1002/qj.2447
Hussain MM, Mahmud I (2019) pyMannKendall: a python package for nonparametric Mann Kendall family of trend tests. J Open Source Software 4:1556. https://doi.org/10.21105/joss.01556
Jarvinen BR, Neumann CJ, Davis MAS (1984) A tropical cyclone data tape for theNorth Atlantic basin, 1886–1983: contents, limitations, and uses. NOAA Tech.Memo NWS NHC 22:21. http://www.nhc.noaa.gov/pdf/NWSNHC-1988-22.pdf
Knapp KR, Diamond HJ, Kossin JP, Kruk MC, Schreck CJ (2018) International BestTrack Archive for Climate Stewardship (IBTrACS) Project, Version 4. NOAANational Centers for Environmental Information. non-gonvernment domain.https://doi.org/10.25921/82ty-9e16. Accessed 30 Aug 2020.
Knapp KR, Kruk MC, Levinson DH, Diamond HJ, Neumann CJ (2010) TheInternational Best Track Archive for Climate Stewardship (IBTrACS) Unifyingtropical cyclone data. Bull Am Meteorol Soc 91:363–376. https://doi.org/10.1175/2009BAMS2755.1
Knutson T, Camargo SJ, Chan JCL, Emanuel K, Ho C, Kossin J, Mohapatra M, SatohM, Sugi M, Walsh K, Wu L (2019): Tropical cyclones and climate changeassessment: Part I: detection and attribution. Bull Am Meteorol Soc 100:1987–2007. https://doi.org/10.1175/BAMS-D-18-0189.1
Kobayashi S, Ota Y, Harada Y, Ebita A, Moriya M, Onoda H, Onogi K, Kamahori H,Kobayashi C, Endo H, Miyaoka K, Takahashi K (2015) The JRA-55 reanalysis:general specifications and basic characteristics. J Meteorol Soc Japan 93:5–48.https://doi.org/10.2151/jmsj.2015-001
Kodama C, Ohno T, Seiki T, Yashiro H, Noda AT, Nakano M, Yamada Y, Woosub R,Satoh M, Nitta T, Goto D, Miura H, Nasuno T, Miyakawa T, Chen YW, Sugi M(2020) The non-hydrostatic global atmospheric model for CMIP6 HighResMIPsimulations (NICAM16-S): Experimental design, model description, andsensitivity experiments. Geosci Model Dev Discuss. https://doi.org/10.5194/gmd-2019-369 (Accepted)
Kodama C, Yamada Y, Noda AT, Kikuchi K, Kajikawa Y, Nasuno T, Tomita T,Yamaura T, Takahashi HG, Hara M, Kawatani Y, Satoh M, Sugi M (2015) A 20-year climatology of a NICAM AMIP-Type simulation. J Meteorol Soc Japan 93:393–424. https://doi.org/10.2151/jmsj.2015-024
Lee C-Y, Camargo SJ, Sobel AH, Tippett MK (2020) Statistical-dynamicaldownscaling projections of tropical cyclone activity in a warming climate:Two diverging genesis scenarios. J Climate 33:4815–4834. https://doi.org/10.1175/JCLI-D-19-0452.1
Millman KJ, Aivazis M (2011) Python for Scientists and Engineers. Comput Sci Eng13:9–12. https://doi.org/10.1109/MCSE.2011.36
Mizuta R, Adachi Y, Yukimoto S, Kusunoki S (2008) Estimation of the future distribution ofsea surface temperature and sea ice using the CMIP3 multi-model ensemble mean.Tech Rep Meteorol Res Inst 56:28. https://doi.org/10.11483/mritechrepo.56
Mizuta R, Yoshimura H, Murakami H, Matsueda M, Endo H, Ose T, Kamiguchi K,Hosaka M, Sugi M, Yukimoto S, Kusunoki S, Kitoh A (2012) Climatesimulations using MRI-AGCM3.2 with 20-km grid. J Meteorol Soc Japan 90A:233–258. https://doi.org/10.2151/jmsj.2012-A12
Murakami H (2014) Tropical cyclone in reanalysis data sets. Geophys Res Lett 41:2133–2141. https://doi.org/10.1002/2014GL059519
Murakami H, Hsu P, Arakawa O, Li T (2014) Influence of model biases onprojected future changes in tropical cyclone frequency of occurrence. JClimate 27:2159–2181. https://doi.org/10.1175/JCLI-D-13-00436.1
Murakami H, Wang Y, Yoshimura H, Mizuta R, Sugi M, Shindo E, Adachi Y,Yukimoto S, Hosaka M, Kusunoki S, Ose T, Kitoh A (2012) Future changes intropical cyclone activity projected by the new high-resolution MRI-AGCM. JClimate 25:3237–3260. https://doi.org/10.1175/JCLI-D-11-00415.1
Oliphant TE (2007) Python for Scientific Computing. Comput Sci Eng 9:10–20.https://doi.org/10.1109/MCSE.2007.58
Oouchi K, Yoshimura J, Yoshimura H, Mizuta R, Kusunoki S, Noda A (2006)Tropical cyclone climatology in a global warming climate as simulated in a20 km-mesh global atmospheric model: Frequency and wind intensityanalysis. J Meteorol Soc Japan 84:259–276. https://doi.org/10.2151/jmsj.84.259
Reed KA, Bacmeister JT, Rosenbloom NA, Wehner MF, Bates SC, Lauritzen PH,Truesdale JE, Hannay C (2015) Impact of the dynamical core on the directsimulation of tropical cyclones in a high-resolution global model. GeophysRes Lett 42. https://doi.org/10.1002/2015GL063974
Roberts MJ (2019) CMIP6 HighResMIP: Tropical storm tracks as calculated by theTempestExtremes algorithm. Centre for Environmental Data Analysis. https://catalogue.ceda.ac.uk/uuid/438268b75fed4f27988dc02f8a1d756d. Accessed 25Feb 2019.
Roberts MJ, Baker A, Blockley EW, Calvert D, Coward A, Hewitt HT, Jackson LC,Kuhlbrodt T, Mathiot P, Roberts CD, Schiemann R, Seddon J, Vannière B,Vidale PL (2019a) Description of the resolution hierarchy of the globalcoupled HadGEM3-GC3.1 model as used in CMIP6 HighResMIP experiments.Geosci Model Dev 12:4999–5028. https://doi.org/10.5194/gmd-12-4999-2019
Roberts MJ, Camp J, Seddon J, Vidale PL, Hodges K, Vanniere B, Mecking J,Haarsma R, Bellucci A, Scoccimarro E, Caron LP, Chauvin F, Terray L, Valcke S,Moine MP, Putrasahan D, Roberts C, Senan R, Zarzycki C, Ullrich P (2019b)Impact of model resolution on tropical cyclone simulation using theHighResMIP-PRIMAVERA multi-model ensemble. J Climate 33:2557–2583.https://doi.org/10.1175/JCLI-D-19-0639.1
Roberts MJ, Camp J, Seddon J, Vidale PL, Hodges K, Vanniere B, Mecking J,Haarsma R, Bellucci A, Scoccimarro E, Caron LP, Chauvin F, Terray L, Valcke S,Moine MP, Putrasahan D, Roberts CD, Senan R, Zarzycki C, Ullrich P, YamadaY, Mizuta R, Kodama C, Fu D, Zhang Q, Danabasoglu G, Rosenbloom N,Wang H, Wu L (2020) Projected future changes in tropical cyclones using theCMIP6 HighResMIP multi-model ensemble. Geophys Res Lett 47:e2020GL088662. https://doi.org/10.1029/2020GL088662
Roberts MJ, Vidale PL, Mizielinski MS, Strachan J, Hodges K, Bell R, Camp J (2015)Tropical cyclone in the UPSCALE ensemble of high resolution global climatemodels. J Climate 28:574–596. https://doi.org/10.1175/JCLI-D-14-00131.1
Satoh M, Matsuno T, Tomita H, Miura H, Nasuno T, Iga S (2008) Nonhydrostaticicosahedral atmospheric model (NICAM) for global cloud resolving simulations.J Comput Physics 227:3486–3514. https://doi.org/10.1016/j.jcp.2007.02.006
Satoh M, Tomita H, Yashiro H, Miura H, Kodama C, Seiki T, Noda AT, Yamada Y, Goto D,Sawada M, Miyoshi T, Niwa Y, Hara M, Ohno T, Iga S-I, Arakawa T, Inoue T, KubokawaH (2014) The Non-hydrostatic Icosahedral Atmospheric Model: description anddevelopment. Prog Earth Planet Sci 1:18. https://doi.org/10.1186/s40645-014-0018-1
Satoh M, Yamada Y, Sugi M, Kodama C, Noda AT (2015) Constraint on futurechange in global frequency of tropical cyclones due to global warming. JMeteorol Soc Japan 93:489–500. https://doi.org/10.2151/jmsj.2015-025
Yamada et al. Progress in Earth and Planetary Science (2021) 8:11 Page 16 of 17

Sugi M, Murakami H, Yoshida K (2017) Projection of future changes in thefrequency of intense tropical cyclones. Climate Dynamics 49:619–632. https://doi.org/10.1007/s00382-016-3361-7
Sugi M, Murakami H, Yoshimura J (2009) A reduction in global tropical cyclonefrequency due to global warming. Sci Online Lett Atmosphere 5:164–167.https://doi.org/10.2151/sola.2009-042
Sugi M, Yamada Y, Yoshida K, Mizuta R, Nakano M, Kodama C, Satoh M (2020)Future changes in the global frequency of tropical cyclone seeds. Sci OnlineLett Atmosphere (in press)
Sugi M, Yoshimura J (2012) Decreasing trend of tropical cyclone frequency in228-year high-resolution AGCM simulations. Geophys Res Lett. 39:L19805.https://doi.org/10.1029/2012GL053360
Thomas R. Knutson, John L. McBride, Johnny Chan, Kerry Emanuel, Greg Holland,Chris Landsea, Isaac Held, James P. Kossin, A. K. Srivastava, Masato Sugi,(2010) Tropical cyclones and climate change. Nature Geoscience 3 (3):157-163
Thomas Knutson, Suzana J. Camargo, Johnny C. L. Chan, Kerry Emanuel, Chang-Hoi Ho, James Kossin, Mrutyunjay Mohapatra, Masaki Satoh, Masato Sugi,Kevin Walsh, Liguang Wu, (2020) Tropical Cyclones and Climate ChangeAssessment: Part II: Projected Response to Anthropogenic Warming. Bulletinof the American Meteorological Society 101 (3):E303-E322
Titchner HA, Rayner NA (2014) The Met Office Hadley Centre sea ice and seasurface temperature data set, version 2: 1. Sea ice concentrations. J GeophysRes Atmosphere 119:2864–2889. https://doi.org/10.1002/2013JD020316
Tomita H, Satoh M (2004) A new dynamical framework of nonhydrostatic globalmodel using the icosahedral grid. Fluid Dynamics Res 34:357–400. https://doi.org/10.1016/j.fluiddyn.2004.03.003
Tory KJ, Chand SS, Dare RA, McBride JL (2013a) The development and assessment ofa model-, grid-, and basin-independent tropical cyclone detection scheme. JClimate 26:5493–5507. https://doi.org/10.1175/JCLI-D-12-00510.1
Tory KJ, Ye H, Chand SS, Dare RA, McBride JL (2013b) An assessment of a model-,grid-, and basin-independent tropical cyclone detection scheme in selectedCMIP3 global climate models. J Climate 26:5508–5522. https://doi.org/10.1175/JCLI-D-12-0511.1
Tory KJ, Ye H, Dare RA (2018) Understanding the geographic distribution oftropical cyclone formation for applications in climate models. ClimateDynamics 50:2489–2512. https://doi.org/10.1007/s00382-017-3752-4
Ullrich PA, Zarzycki CM (2017) TempestExtremes: a framework for scale-insensitivepointwise feature tracking on unstructured grids. Geosci Model Dev 10:1069–1090. https://doi.org/10.5194/gmd-10-1069-2017
Vecchi GA, Delworth TL, Murakami H, Underwood SD, Wittenberg AT, Zeng F,Zhang W, Baldwin JW, Bhatia KT, Cooke W, He J, Kapnick SB, Knutson TR,Villarini G, van der Wiel K, Anderson W, Balaji V, Chen JH, Dixon KW, GudgelR, Harris LM, Jia L, Johnson NC, Lin SJ, Liu M, Ng CHJ, Rosati A, Smith JA,Yang X (2019) Tropical cyclone sensitivities to CO2 doubling: roles ofatmospheric resolution, synoptic variability and background climate changes.Climate Dynamics 53:5999–6033. https://doi.org/10.1007/s00382-019-04913-y
Voldoire A, Saint-Martin D, Sénési S, Decharme B, Alias A, Chevallier M, Colin J,Guérémy JF, Michou M, Moine MP, Nabat P, Roehrig R, Salas y Mélia D,Séférian R, Valcke S, Beau I, Belamari S, Berthet S, Cassou C, Cattiaux J,Deshayes J, Douville H, Ethé C, Franchistéguy L, Geoffroy O, Lévy C, Madec G,Meurdesoif Y, Msadek R, Ribes A, Sanchez-Gomez E, Terray L, Waldman R(2019) Evaluation of CMIP6 DECK experiments with CNRM-CM6-1. J AdvModel Earth Syst, 11:2177–2213. https://doi.org/10.1029/2019MS001683
Wehner M, Prabhat RKA, Stone D, Collins WD, Bacmeister J (2015) Resolutiondependence of future tropical cyclone projections of CAM5.1 in the US CLIVAR Hurricane Working Group idealized configurations. J Climate 28:3905–3925. https://doi.org/10.1175/JCLI-D-14-00311.1
Yamada Y, Oouchi K, Satoh M, Tomita H, Yanase W (2010) Projection of changesin tropical cyclone activity and cloud height due to greenhouse warming:global cloud-system-resolving approach. Geophys Res Lett 37. https://doi.org/10.1029/2010GL042518
Yamada Y, Satoh M (2013) Response of ice and liquid water paths of tropicalcyclones to global warming simulated by a global nonhydrostatic modelwith explicit cloud microphysics. J Climate 26:9931–9945. https://doi.org/10.1175/JCLI-D-13-00182.1
Yamada Y, Satoh M, Sugi M, Kodama C, Noda AT, Nakano M, Nasuno T (2017)Response of tropical cyclone activity and structure to global warming in ahigh-resolution global nonhydrostatic model. 30:9703–9724, doi:https://doi.org/10.1175/JCLI-D-17-0068.1
Yoshida K, Sugi M, Mizuta R, Murakami H, Ishii M (2017) Future changes intropical cyclone activity in high-resolution large-ensemble simulations.Geophys Res Lett 44:9910–9917. https://doi.org/10.1002/2017/GL07058
Zarzycki CM, Ullrich PA (2017) Assessing sensitivities in algorithmic detection oftropical cyclones in climate data. Geophysical Research Letters 44:1141–1149.https://doi.org/10.1002/2016GL071606
Zhao M, Held IM, Lin S-J (2012) Some counterintuitive dependencies of tropicalcyclone frequency on parameters in a GCM. J Atmospheric Sci 69:2272–2283.https://doi.org/10.1175/JAS-D-11-0238.1
Zhao M, Held IM, Lin SJ, Vecchi GA (2009) Simulations of global hurricaneclimatology, interannual variability, and response to global warming using a50-km resolution GCM. Journal of Climate 22:6653–6678. https://doi.org/10.1175/2009JCLI3049.1
Publisher’s NoteSpringer Nature remains neutral with regard to jurisdictional claims inpublished maps and institutional affiliations.
Yamada et al. Progress in Earth and Planetary Science (2021) 8:11 Page 17 of 17