EU-MIDIS Technical Report
104
Technical Report: Methodology, Sampling and Fieldwork EU-MIDIS European Union Minorities and Discrimination Survey English 20 09 EU-MIDIS Technical Report Methodology, Sampling and Fieldwork European Union Agency for Fundamental Rights
Transcript of EU-MIDIS Technical Report

Technical Report: Methodology, Sampling and Fieldwork
�
EU-MIDISEuropean Union Minorities and Discrimination SurveyEnglish
2009
EU-MIDIS Technical Report Methodology, Sampling and Fieldwork
European Union Agency for Fundamental Rights


EU-MIDIS Technical Report Methodology, Sampling and Fieldwork
European Union Agency for Fundamental Rights

EU-MIDIS
�
TablE of ConTEnTS
Introduction 6
1. Survey duration 7
2. EU-MIDIS Sampling 8 2.� Geographical coverage 8 2.2 Target groups 9 2.3 Target persons �0 2.� Sampling approach �� 2.5 Sampling methods applied in the various
Member States �8 2.5.1 Proportionsofinterviewsby
samplingmethod 20 2.6 Sampling specifics 2� 2.7 Sample size 2� 2.8 Google map support of PSU designation 22 2.9 Majority sub-survey 23
3. Survey delivery 24 3.� The questionnaire 2� 3.2 Circumstances of delivery 25 3.3 Language of delivery 26
4. Weighting 27
5. Quality control 28
6. Interviewer selection and training 29 6.� Interviewer selection 29 6.2 Training activities 29
7. fall-back solutions adopted 31 7.� Malta 3� 7.2 The United Kingdom 3� 7.3 Sweden 32 7.� Ireland 33 7.5 The Netherlands 3�
8. fieldwork outcomes, overall 35 8.� Response/cooperation rates in specific groups 35 8.2 Screening efficiency 37
9. fieldwork outcomes, by country 38 9.� AUSTRIA 38 9.1.1 HH-levelresponserates 38 9.1.2 Respondentlevelresponserates 39 9.1.3 Recalls 40 9.1.4 Postinterviewsection 40 9.2 BELGIUM �� 9.2.1 HH-levelresponserates 41 9.2.2 Respondentlevelresponserates 42 9.2.3 Recalls 42 9.2.4 Postinterviewsection 42 9.3 BULGARIA �3 9.3.1 HH-levelresponserates 43 9.3.2 Respondentlevelresponserates 44 9.3.3 Recalls 45 9.3.4 Postinterviewsection 45 9.� CZECH REPUBLIC �6 9.4.1 HH-levelresponserates 46 9.4.2 Respondentlevelresponserates 47 9.4.3 Recalls 47 9.4.4 Postinterviewsection 47 9.5 CYPRUS �8 9.5.1 HH-levelresponserates 48 9.5.2 Respondentlevelresponserates 49 9.5.3 Recalls 49 9.5.4 Postinterviewsection 50 9.6 DENMARK 50 9.6.1 HH-levelresponserates 51 9.6.2 Respondentlevelresponserates 51 9.6.3 Recalls 52 9.6.4 Postinterviewsection 52 9.7 ESTONIA 53 9.7.1 HH-levelresponserates 53 9.7.2 Respondentlevelresponserates 54 9.7.3 Recalls 55 9.7.4 Postinterviewsection 55 9.8 FINLAND 55 9.8.1 HH-levelresponserates 56 9.8.2 Respondentlevelresponserates 56 9.8.3 Recalls 57 9.8.4 Postinterviewsection 57 9.9 FRANCE 58 9.9.1 HH-levelresponserates 58 9.9.2 Respondentlevelresponserates 59 9.9.3 Recalls 60 9.9.4 Postinterviewsection 60

Technical Report: Methodology, Sampling and Fieldwork
5
9.�0 GERMANY 6� 9.10.1 HH-levelresponserates 61 9.10.2 Respondentlevelresponserates 62 9.10.3 Recalls 63 9.10.4 Postinterviewsection 63 9.�� GREECE 6� 9.11.1 HH-levelresponserates 64 9.11.2 Respondentlevelresponserates 65 9.11.3 Recalls 65 9.11.4 Postinterviewsection 65 9.�2 HUNGARY 66 9.12.1 HH-levelresponserates 66 9.12.2 Respondentlevelresponserates 67 9.12.3 Recalls 68 9.12.4 Postinterviewsection 68 9.�3 IRELAND 68 9.13.1 HH-levelresponserates 69 9.13.2 Respondentlevelresponserates 69 9.13.3 Recalls 69 9.13.4 Postinterviewsection 69 9.�� ITALY 70 9.14.1 HH-levelresponserates 70 9.14.2 Respondentlevelresponserates 71 9.14.3 Recalls 71 9.14.4 Postinterviewsection 72 9.�5 LATVIA 73 9.15.1 HH-levelresponserates 73 9.15.2 Respondentlevelresponserates 74 9.15.3 Recalls 74 9.15.4 Postinterviewsection 74 9.�6 LITHUANIA 75 9.16.1 HH-levelresponserates 75 9.16.2 Respondentlevelresponserates 76 9.16.3 Recalls 77 9.16.4 Postinterviewsection 77 9.�7 LUXEMBOURG 78 9.17.1 HH-levelresponserates 78 9.17.2 Respondentlevelresponserates 79 9.17.3 Recalls 79 9.17.4 Postinterviewsection 79 9.�8 THE NETHERLANDS 80 9.18.1 HH-levelresponserates 80 9.18.2 Respondentlevelresponserates 81 9.18.3 Recalls 82 9.18.4 Postinterviewsection 82
9.�9 MALTA 83 9.19.1 HH-levelresponserates 83 9.19.2 Respondentlevelresponserates 83 9.19.3 Recalls 83 9.19.4 Postinterviewsection 83 9.20 POLAND 8� 9.20.1 HH-levelresponserates 84 9.20.2 Respondentlevelresponserates 85 9.20.3 Recalls 86 9.20.4 Postinterviewsection 86 9.2� PORTUGAL 87 9.21.1 HH-levelresponserates 87 9.21.2 Respondentlevelresponserates 88 9.21.3 Recalls 88 9.21.4 Postinterviewsection 88 9.22 ROMANIA 89 9.22.1 HH-levelresponserates 89 9.22.2 Respondentlevelresponserates 90 9.22.3 Recalls 90 9.22.4 Postinterviewsection 91 9.23 SLOVAKIA 9� 9.23.1 HH-levelresponserates 91 9.23.2 Respondentlevelresponserates 92 9.23.3 Recalls 93 9.23.4 Postinterviewsection 93 9.2� SLOVENIA 9� 9.24.1 HH-levelresponserates 94 9.24.2 Respondentlevelresponserates 95 9.24.3 Recalls 95 9.24.4 Postinterviewsection 95 9.25 SPAIN 96 9.25.1 HH-levelresponserates 96 9.25.2 Respondentlevelresponserates 97 9.25.3 Recalls 98 9.25.4 Postinterviewsection 98 9.26 SWEDEN 99 9.26.1 HH-levelresponserates 99 9.26.2 Respondentlevelresponserates 99 9.26.3 Recalls 99 9.26.4 Postinterviewsection 100 9.27 UNITED KINGDOM �0� 9.27.1 HH-levelresponserates 101 9.27.2 Respondentlevelresponserates 101 9.27.3 Recalls 101 9.27.4 Postinterviewsection 101

EU-MIDIS
6
InTroDUCTIon
EU-MIDIS is the first systematic large-scale attempt to survey selected immigrant, ethnic minority and national minority groups in all 27 EU Member States about their experiences of discrimination and victimisation. As such, the survey faced a number of technical challenges that had to be addressed from the outset, and which are related in detail in this report in order to communicate how the survey met the various demands for successfully conducting high quality and robust research on ‘difficult to survey’ groups.
Given that a survey of this kind has never been undertaken in Europe, the FRA commissioned a pilot study in six Member States in 2007 to test the validity, reliability and quality of different sampling and methodological approaches, as well as the content and application of the survey questionnaire. The pilot was undertaken by Gallup Europe in Austria, Belgium, Italy, Slovakia, Bulgaria and Romania. The results of the pilot confirmed the appropriate sampling and methodological applications for the full-scale survey, and served to refocus the content of the finalised questionnaire.
The FRA joined forces with Gallup Europe, who were selected as the main contractor after a tendering procedure, to carry out the full-scale survey throughout the EU during 2008. The survey was given the acronym ‘EU-MIDIS’ – European Union Minorities and Discrimination Survey.
The development of the full-scale survey was supported by input from a number of experts in the field of international comparative survey research, including experts in sampling and surveying ‘difficult to survey’ groups. � In addition, the Agency was assisted by members of its RAXEN (Racism and Xenophobia) network, which consists of a consortium of experts in the field of racism and xenophobia who are contracted to provide the Agency with national annual reports on the situation of racism and xenophobia in each Member State, together with other information. Members of the Agency’s Scientific Committee, which met for the first time in July 2008, some of whom have particular expertise in international survey research and statistics, were also asked to comment on different approaches adopted by EU-MIDIS to data analysis.
Reflecting the experience it has developed through the EU-MIDIS project, the FRA has contributed to the United Nations forthcoming ‘Manual on Victimization Surveys’, which has been developed by the United Nations Office on Drugs and Crime (UNODC) and the United Nations Economic Commission for Europe (UNECE). In addition, the Agency has contributed to the work of EUROSTAT in the area of survey research, and has also worked with other key actors that are looking at developing new approaches in surveying groups such as immigrants; including the US Census Bureau’s newly formed Suitland Working Group on the use of household surveys, and alternative instruments, for the measurement of migration and the size, distribution and characteristics of migrant populations. To this end it is hoped that EU-MIDIS will serve not only as a source of valuable data, but also as a reference point for surveying ‘difficult to survey’ groups that have, traditionally, not been systematically surveyed in a number of EU Member States.
This technical report and the survey questionnaire, which the agency has also made available through its website, are intended for reference and to encourage further survey development and implementation by interested parties.
The results from the survey are being released as a series of short ‘Data in Focus’ reports that highlight specific findings from the survey. The first in this series is on the Roma, and is accompanied with an introductory report about the survey entitled ‘EU-MIDIS at a glance’.
� Experts who attended meetings at the Agency and contributed advice to the development of the full-scale survey include, amongst others: Anna Alvazzi del Frate, UN Office on Drugs and Crime (UNODC); Jan van Dijk, Professor at the International Victimology Institute (INTERVICT), Tilburg Univesity; George Groenewold, Senior Researcher at the Netherlands Interdisciplinary Demographic Institute; Markku Heiskanen, Senior Researcher at the European Institute for Crime Prevention and Control affiliated with the United Nations (HEUNI); Eberhard Kohler, former Director of the European Foundation for Living and Working Conditions (EUROFOUND); Peter Lynn, Professor of Survey Methodology at the Institute for Social and Economic Research (ISER) at the University of Essex.
Technical Report: Methodology, Sampling and Fieldwork
7
1. SUrvEy DUraTIon
EU-MIDIS is a standardised survey with selected immigrants, ethnic minorities and national minorities, mostly in European urban areas, or geographic areas with medium or high concentrations of minority populations (for details on the selection of medium and high concentration areas see section 2.5).
As referred to above, the Agency developed the survey in the light of a pilot exercise in 2007. Preparatory activities for the EU-wide EU-MIDIS project started in January 2008, and the fieldwork was launched in most Member States during May 2008. The survey’s rigorous and systematic field sampling of minority populations, which was based on the principle of random-sampling and a two-recall design (that is, after the first initial attempt to contact a household two further attempts were made to establish contact), resulted in an extended fieldwork period. Due to some challenges in the field, which can be expected in any survey of this scale and innovative nature (as discussed in section 7. ‘Fall-back solutions adopted’), in some Member States the fieldwork had to be extended until the beginning of November (with a summer break between 22nd of July and 25th of August when fieldwork activities were effectively suspended). As a result, the average fieldwork period across the 27 Member States was approximately 9 weeks.
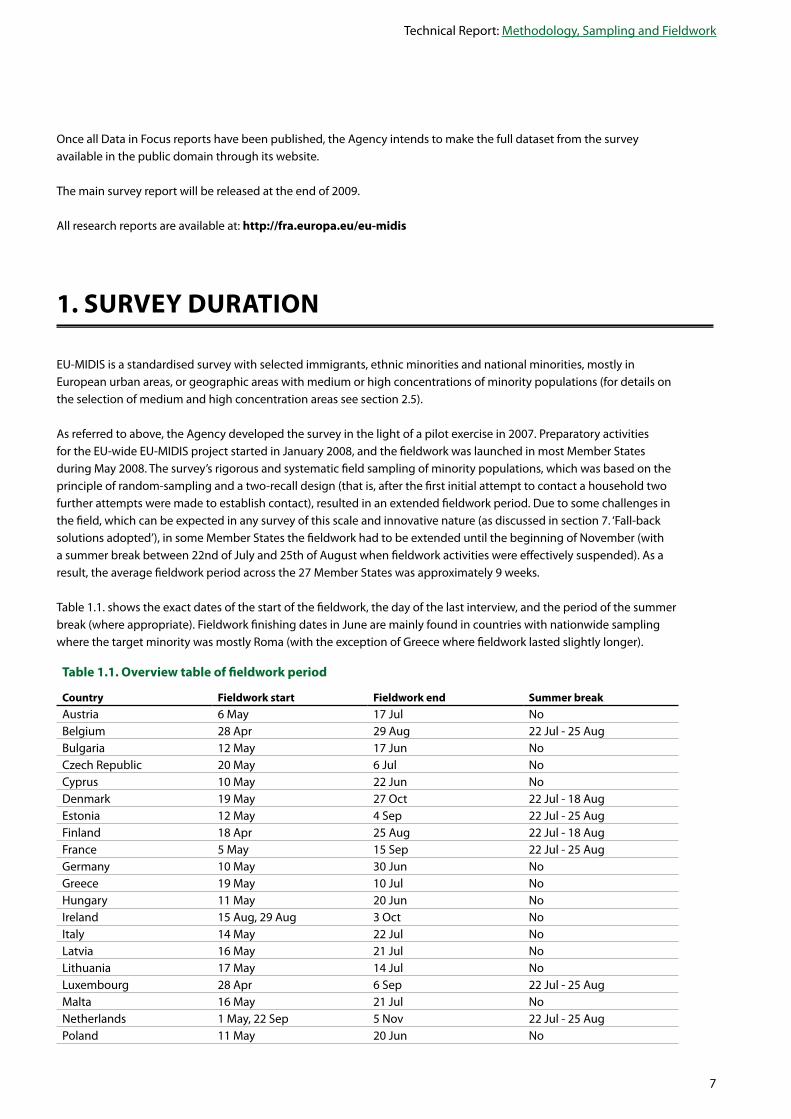
Table �.�. shows the exact dates of the start of the fieldwork, the day of the last interview, and the period of the summer break (where appropriate). Fieldwork finishing dates in June are mainly found in countries with nationwide sampling where the target minority was mostly Roma (with the exception of Greece where fieldwork lasted slightly longer).
Table 1.1. overview table of fieldwork period
Country fieldwork start fieldwork end Summer breakAustria 6 May �7 Jul NoBelgium 28 Apr 29 Aug 22 Jul - 25 AugBulgaria �2 May �7 Jun NoCzech Republic 20 May 6 Jul NoCyprus �0 May 22 Jun NoDenmark �9 May 27 Oct 22 Jul - �8 AugEstonia �2 May � Sep 22 Jul - 25 AugFinland �8 Apr 25 Aug 22 Jul - �8 AugFrance 5 May �5 Sep 22 Jul - 25 AugGermany �0 May 30 Jun NoGreece �9 May �0 Jul NoHungary �� May 20 Jun NoIreland �5 Aug, 29 Aug 3 Oct NoItaly �� May 22 Jul NoLatvia �6 May 2� Jul NoLithuania �7 May �� Jul NoLuxembourg 28 Apr 6 Sep 22 Jul - 25 AugMalta �6 May 2� Jul NoNetherlands � May, 22 Sep 5 Nov 22 Jul - 25 AugPoland �� May 20 Jun No
Once all Data in Focus reports have been published, the Agency intends to make the full dataset from the survey available in the public domain through its website.
The main survey report will be released at the end of 2009.
All research reports are available at: http://fra.europa.eu/eu-midis

EU-MIDIS
8
2. EU-MIDIS SaMplIng
The sampling design for the survey was laid out in the proposal and the contract, and was finalised in the inception report that concluded the agreements reached at the inception meeting. The aim was to arrive at a sample design that is random, and provides a reasonably good coverage of the sample population given the available time and resources.
2.1 geographical coverage
From the outset, EU-MIDIS was planned with a limited remit to conduct research on groups in urban/semi-urban areas, focusing on capital cities and one or two key urban centres with a medium or high concentration of the immigrant or ethnic minority groups chosen for surveying in each Member State. However, this model was not appropriate for predominantly rural indigenous communities, and, therefore, EU-MIDIS adopted a dual strategy: to cover major cities, including capitals, where immigrant groups for surveying are located, and to adopt an “on-location” approach for Member States where relevant minorities are primarily non-urban, or there are no real distinct urban centres (e.g. in the smallest Member States). Sites for EU-MIDIS were designated by the FRA at the inception stage of the survey, and were chosen on the basis of available population data and with the advice of members of the Agency’s RAXEN network (see Table 2.�.).
Table 2.1. EU-MIDIS Coverage area
austria Vienna latvia Riga belgium Brussels Daugavpils
Antwerp lithuania Vilnius bulgaria [nationwide2] VisaginasCzech rep. [nationwide] luxembourg [nationwide]Cyprus [nationwide] Malta [nationwide]Denmark Copenhagen netherlands Amsterdam Odense Rotterdam germany Berlin The Hague Frankfurt Utrecht Munich poland [nationwide]greece Athens portugal Lisbon metro area Thessaloniki Setubal Estonia Tallinn romania [nationwide]finland Helsinki metro area Slovakia [nationwide]
Country fieldwork start fieldwork end Summer breakPortugal �5 May 2� Jul NoRomania �7 May 25 Jun NoSlovakia 3 May 30 Jun NoSlovenia �6 May 30 Sep 22 Jul - 25 AugSpain � May 22 Jul NoSweden 3 May 2� Sep 22 Jul - �8 AugUnited Kingdom 7 May �3 Sep 22 Jul - 25 Aug
In this report, we provide a detailed description of the survey process in order to transparently provide information on what was undertaken for the research, and to allow other interested parties to explore the feasibility of surveying difficult-to-survey minority populations at Member State or European level.
2 Corresponding to the location of relevant target groups

Technical Report: Methodology, Sampling and Fieldwork
9
france Paris metro area Slovenia Ljubljana Marseille Jesenice Lyon Spain Madrid Hungary Budapest Barcelona Miskolc Sweden Stockholm Ireland Dublin metro area MalmöItaly Rome UK London Milan Bari
2.2 Target groups
EU-MIDIS set out to produce information on the extent and nature of discrimination and crime, including ‘racist’ crime, as experienced by minority groups that are considered to be vulnerable to victimisation and discrimination; namely, immigrants, ethnic minorities and national minorities. Other groups besides these, such as irregular immigrants and asylum seekers, are also particularly vulnerable to discrimination and victimisation, but were not included as target groups in the survey because they present even greater challenges for surveying and would be best served and captured through a different survey instrument. In this regard, the groups for sampling were broadly selected under the headings of ‘immigrants’, ‘ethnic minorities’ and ‘national minorities’, and were chosen to reflect the particular situation in each Member State with respect to its history of past and recent immigration and settlement, and the degree to which certain groups are considered to be vulnerable to victimisation and discrimination.
The FRA’s selection of groups to take part in the research was based on the following specific considerations:
- In consideration of groups which are vulnerable to or at risk of discriminatory treatment and criminal victimisation, including also potentially ‘racially’, ‘ethnically’ or ‘religiously’ motivated discrimination and victimisation. In this regard, the research did not focus on groups that can be considered as not particularly vulnerable or at risk; for example, British immigrants in Spain or the Hungarian minority in Austria.
- In consideration of available population data on the largest immigrant or ethnic minority groups in each Member State;
- In consideration of a minimum overall size of the community sufficient for sampling, in interaction with identifiable areas where the groups reside in a minimum sufficient density (e.g. 5%)
- When identifying groups, stress was placed on some common shared characteristics; namely - their socially, economically and/or politically marginalised status when compared with the majority population.
The target sample size per vulnerable group was 500, with �3 countries having 2 target groups, �� countries having � group and 3 countries having 3 groups for surveying (refer to section 2.7 for details about the achieved sample size per target group).
In �0 countries an additional sample of a minimum of 500 majority persons (from the same areas where minority respondents lived) were also interviewed, to provide reference information for police stop-and-search practices (see section 2.9 Majority sub-survey). In total 5,068 interviews were achieved with respondents from the majority population.
EU-MIDIS
�0
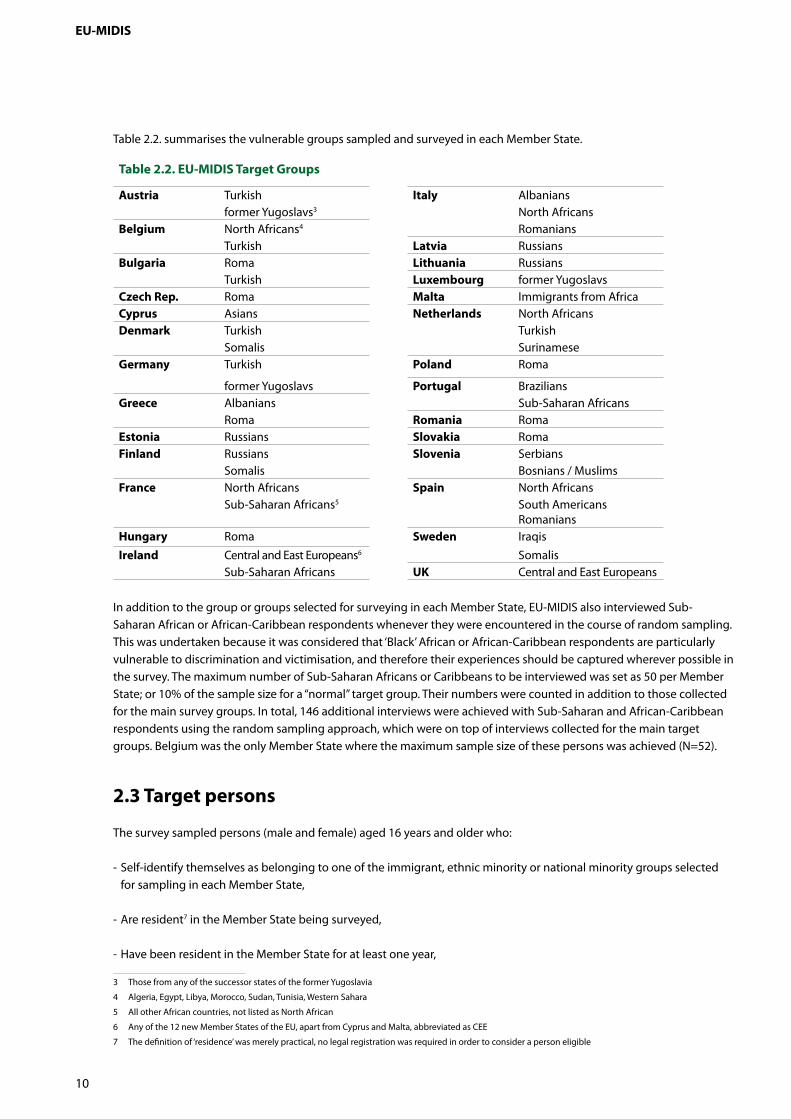
Table 2.2. summarises the vulnerable groups sampled and surveyed in each Member State.
Table 2.2. EU-MIDIS Target groups
austria Turkish Italy Albanians former Yugoslavs3 North Africansbelgium North Africans� Romanians Turkish latvia Russiansbulgaria Roma lithuania Russians Turkish luxembourg former YugoslavsCzech rep. Roma Malta Immigrants from AfricaCyprus Asians netherlands North AfricansDenmark Turkish Turkish Somalis Surinamesegermany Turkish poland Roma
former Yugoslavs portugal Braziliansgreece Albanians Sub-Saharan Africans Roma romania RomaEstonia Russians Slovakia Romafinland Russians Slovenia Serbians
Somalis Bosnians / Muslimsfrance North Africans Spain North Africans Sub-Saharan Africans5 South Americans
RomaniansHungary Roma Sweden IraqisIreland Central and East Europeans6 Somalis
Sub-Saharan Africans UK Central and East Europeans
In addition to the group or groups selected for surveying in each Member State, EU-MIDIS also interviewed Sub-Saharan African or African-Caribbean respondents whenever they were encountered in the course of random sampling. This was undertaken because it was considered that ‘Black’ African or African-Caribbean respondents are particularly vulnerable to discrimination and victimisation, and therefore their experiences should be captured wherever possible in the survey. The maximum number of Sub-Saharan Africans or Caribbeans to be interviewed was set as 50 per Member State; or �0% of the sample size for a “normal” target group. Their numbers were counted in addition to those collected for the main survey groups. In total, ��6 additional interviews were achieved with Sub-Saharan and African-Caribbean respondents using the random sampling approach, which were on top of interviews collected for the main target groups. Belgium was the only Member State where the maximum sample size of these persons was achieved (N=52).
2.3 Target persons
The survey sampled persons (male and female) aged �6 years and older who:
- Self-identify themselves as belonging to one of the immigrant, ethnic minority or national minority groups selected for sampling in each Member State,
- Are resident7 in the Member State being surveyed,
- Have been resident in the Member State for at least one year,
3 Those from any of the successor states of the former Yugoslavia
� Algeria, Egypt, Libya, Morocco, Sudan, Tunisia, Western Sahara
5 All other African countries, not listed as North African
6 Any of the �2 new Member States of the EU, apart from Cyprus and Malta, abbreviated as CEE
7 The definition of ‘residence’ was merely practical, no legal registration was required in order to consider a person eligible

Technical Report: Methodology, Sampling and Fieldwork
��
- Have sufficient command of (one of the) the national language(s) of the Member State being surveyed to lead a simple conversation with the interviewer8.
In each household that contained persons from the designated target groups, up to three eligible persons were invited to take part in the survey. Where necessary, persons within households were sampled randomly, using a Kish grid.
2.4 Sampling approach
The complex target population and coverage area definition was reflected in a similarly complex sample design, utilising four different approaches (Table 2.5. in section 2.5.� shows the specific type adopted in each Member State).
at the heart of the general EU-MIDIS sampling approach are two basic methods, which are grounded in principles of random sampling: (1) random route sampling (2) focussed enumeration
STanDarD ranDoM roUTE SaMplIng
As a default sampling approach, a standard random route (RR) procedure was used to sample households, and is one of the most likely to capture the whole universe in each city or relevant area sampled. The pilot study showed that random route sampling produced the best response rates, and provides easier ‘one-step’ access to members of minority groups. In comparison, the pilot also tested a two-step process involving a CATI (computer assisted telephone interviewing) screener to identify potential eligible respondents over the phone, which was then followed up with in-person interviews once an eligible interviewee was identified over the phone.
The face-to-face standard random route approach was also deemed to be a success because the personal presence of interviewers facilitated the execution of Focused Enumeration (see below), which was used in the field to ‘boost’ the survey’s potential to identify eligible respondents, while, at the same time, remaining within the bounds of random sampling principles .
For the RR samples, in each of the selected primary sampling units (pSUs9; concentrated in the medium and high density areas where targeted minorities lived in high concentration, e.g. above 8%), one starting address was drawn at random.
prIMary SaMplIng UnITS (pSUs)
PSUs are essentially a cluster of interviews that are conducted from the same starting point. In each given PSU a certain number of interviews need to be conducted with eligible respondents. The number of interviews per PSU is allocated in advance.
That starting address served as the starting point of a cluster. The eligible addresses of the cluster were to be selected as every 5th address from the specified starting point, using a standard random route procedure from the initial address. Cluster sizes were not pre-defined for any sampling point (instead a “desired” size was specified, based on available statistical data); usually cluster sizes in medium density areas were larger than those in high density areas. ‘Stopping rules’ were in place to prevent ineffective random route sampling. This meant that a new route was initiated in cases where the first 5 completed screener interviews where contact was made were unable to identify an eligible minority respondent
8 Where available, interviewers capable of interviewing in the usual language of the target group were used.
9 PSU is the smallest geographical area for which population data on the number of minorities was available for the purpose of allocating the interviews. This can typically be, for example, a census area or a city district.
EU-MIDIS
�2
© gallup Europe (not to be used without explicit permission)
HoW InTErvIEWErS WErE InSTrUCTED To UnDErTaKE ranDoM roUTE
The following text is an extract taken from the gallup Interviewer Training Manual and illustrates how random route was applied in the field:
The random route procedure
Step onE: Identify your starting point, the proper side of the street & the direction to go
Case a) An exact address is provided (3�th Sun Street)
In this case you only need to find out which way to go. Stand on the street at your starting address facing towards the end of the street (�. Sun Street is the beginning, and 200. Sun Street is the end). You will choose then the side of the street that is to your right, and you will walk towards the end of the street. By doing this you have defined your starting point, correct direction, and the correct side of the street.
Case b) A street is provided (Sun Street)
In this case you go and find �. Sun Street, this will be your starting point. Stand on the street at this starting point facing towards the end of the street (�. Sun Street is the beginning, and 200. Sun Street is the end). You will choose then the side of the street that is to your right, and you will walk towards the end of the street. By doing this you have defined your starting point, correct direction, and the correct side of the street.
Case c) A point on the map, a crossing provided (crossing of Sun Street and Moon Street)
In this case you first have to choose the street you need. This is easy, always choose the street which is behind in the alphabet, that is: you will choose Bird Street and not Almond Street, Donut Street and not Coconut Square, and in this case Sun Street instead of Moon Street. Then stand at the crossing facing towards the end of the selected – Sun – street (�. Sun Street is the beginning, and 200. Sun Street is the end). You will choose then the side of the street that is to your right, and you will walk towards the end of the street. By doing this you have defined your starting point, correct direction, and the correct side of the street.
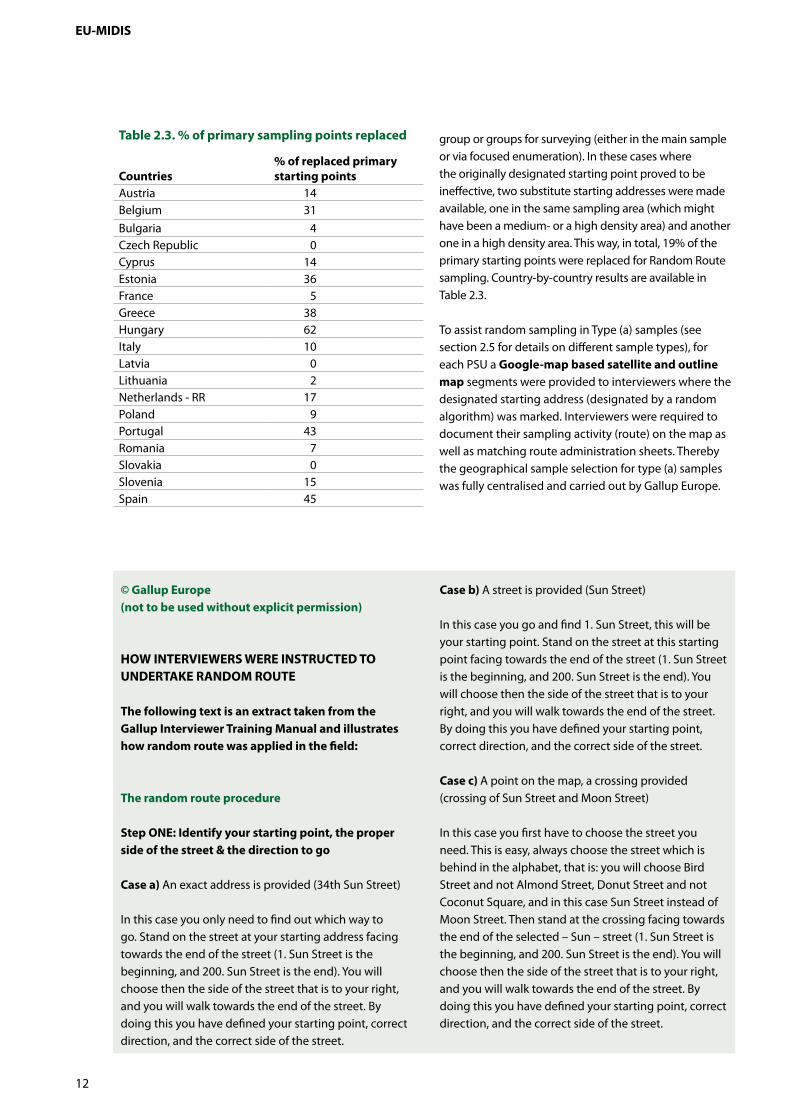
group or groups for surveying (either in the main sample or via focused enumeration). In these cases where the originally designated starting point proved to be ineffective, two substitute starting addresses were made available, one in the same sampling area (which might have been a medium- or a high density area) and another one in a high density area. This way, in total, �9% of the primary starting points were replaced for Random Route sampling. Country-by-country results are available in Table 2.3.
To assist random sampling in Type (a) samples (see section 2.5 for details on different sample types), for each PSU a google-map based satellite and outline map segments were provided to interviewers where the designated starting address (designated by a random algorithm) was marked. Interviewers were required to document their sampling activity (route) on the map as well as matching route administration sheets. Thereby the geographical sample selection for type (a) samples was fully centralised and carried out by Gallup Europe.
Table 2.3. % of primary sampling points replaced
Countries% of replaced primary starting points
Austria ��Belgium 3�Bulgaria �Czech Republic 0Cyprus ��Estonia 36France 5Greece 38Hungary 62Italy �0Latvia 0Lithuania 2Netherlands - RR �7Poland 9Portugal �3Romania 7Slovakia 0Slovenia �5Spain �5

Technical Report: Methodology, Sampling and Fieldwork
�3
Step TWo: find the first door to ring
Now, you know where you have to be, which side of the street you have to be, and which direction you go. The task is to find out which door you ring. For this purpose you will need a number, called a sampling interval: and this number is five (5), it will play a key role in the process. Now go ahead and walk in the direction you have and find the fifth door opening to the street on the right hand side.
What you will look for are dwelling units. Now let‘s define a dwelling unit. By dwelling unit we mean living quarters, whether it is a single house, half a duplex, a basement or attic apartment in a multiple family house, an apartment over a garage or store, or an apartment in a high-rise building. To qualify, dwelling units must have separate kitchen facilities. Institutions or other group quarters (e.g. dormitories, hospitals, prisons, etc.) do NOT qualify as dwelling units, because the occupants do not have their own kitchen facilities. Watch for the mailbox or doorbell (this usually indicates a separate dwelling unit) and attempt a contact at every single fifth potential contact point.
There are several possible options here, where we use similar, but slightly different rules:
Case a) rural, or one-storey building area (family houses, twin apartments, other one-storey buildings)
In most of the cases there is only one dwelling unit in this type of house, that is, you will find one doorbell you can ring. Ring it!
Still, it’s possible that more than one dwelling unit shares the same house, living in separate households. In this case you may find more bells or more mailboxes at the front door. If this is the case, always choose the uppermost bell or mailbox on the right hand side of any display panel – this will be your first bell to ring.
Case b) apartment building area (blockhouses, apartment buildings, larger residential complexes)
An apartment house is a collection of households and you should systematically contact apartments just as you would private households on a street of one family dwelling. Each apartment should be considered as one household or dwelling unit. Therefore, you may interview in as many apartments in any one apartment building as you may need to fulfil your assignment
requirements, as long as you adhere to the ‘every fifth door’ rule (except for any households identified through focussed enumeration).
This is how you find your starting door: Go to the top floor of the building. Approach the apartment nearest the place that you enter the floor (door of elevator, exit of the stairway). You have to move in a clockwise direction, that is, you need to go to the right until you get back to your starting point. On your route you will have to attempt to make a contact at the fifth apartment as you move, clockwise, around the floor.
If there are two apartments equally close to your place of entry, choose the one on the right hand side. If the floor is exhausted (i.e. you have passed each door on it) move on to the floor below and continue your route there (i.e. if the top floor has only three apartments, your first apartment to contact will be on the floor below the top floor, the second apartment on your route). If you exhaust an apartment building, just proceed to the street and continue with the next one to your right.
once an eligible household has been identified, there are random sampling procedures to apply to identify individuals within the household.
Step THrEE: How to proceed With The Walk – Selection of further Dwelling Units
The general idea is the right-hand rule and the every-fifth dwelling selection. In a classic case you will do the following, after identifying your starting address:
You start from the point on the map. Then you find the fifth door in your proper direction, where the fat

EU-MIDIS
��
arrow points. Then you will walk along the pavement on the right hand side of the street/road and attempt to contact every fifth dwelling unit you encounter. If you arrive at a crossing, you will turn to the right, stay on the right-hand side and continue the search. It is possible that there are very few dwelling units in the block which was primarily assigned to you; in that case – as the dashed arrows show – you will go further along Moon Street after you arrived back to your starting point. And so on. It’s very unlikely, but can occur, that you went every possible way from the starting point and still have not completed your quota. In this case, contact your supervisor for another starting point.
Never turn left, or walk on the left hand side of the street. Even if there are no houses on your side and many houses on the other - YOU MUST NOT CROSS TO THE OTHER SIDE OF THE STREET. That side of the street will be covered when you walk around THAT block on the right hand side in a clockwise direction.
There is however one exception: these are dead-end streets (by dead-end streets we also mean streets leading out of town, or out of a residential area). If there is a dead end street within the block assigned, you start at the designated starting point and go to the dead end street on the right hand side of the street in the direction of the arrow.
Then walk to the end of the dead end street on the right hand side, cross the street, and walk back on the opposite side of the dead end street. Then turn right and continue on the right hand side of the street on which you were originally.
This is the standard you are to apply, but it only really works in its pure form in rural neighbourhoods. In urban neighbourhoods you will walk less.
If you find an apartment building on your way, try to make an entry. Once that is achieved, you will climb to the top floor (It can be – in certain cases – even the first floor if the building has no more floors). Then – as described before – you identify the ‘beginning’ of that floor, that is, you identify the closest apartment to the stairway or the elevators on the right hand side. From that one, walking clockwise, you continue counting off the fifth dwelling unit you want to approach. And so on. If you completed the whole floor, you will proceed to the one below. This should be applied until you do not finish the building or you do not complete your quota. If the house is finished without completing the quota go to the next house and find the next dwelling unit.
foCUSSED EnUMEraTIon
focused enumeration (FE) was applied in order to boost the efficacy of the random route approach. FE relies on interviewers ‘screening’ addresses adjacent to the core issued address, e.g. the one that is identified via the RR procedure. During FE, any contact person at the RR address is asked to “map” the immediate neighbours to find additional households where target minority persons might live. This is a method that keeps a random rule for respondent selection, but through proxy information, it provides better access to rare populations. Focused enumeration may cover any of the following dwelling units: any flats/houses one and two doors to the right and one and two doors to the left of the source RR address, and (if in a multi-story building) those DIRECTLY above and DIRECTLY under the flat where the interview took place.
The aim was that interviewers could elicit information to screen out addresses containing majority or non-vulnerable minority households or persons through proxy information gained from a single address.

Technical Report: Methodology, Sampling and Fieldwork
�5
© gallup Europe (not to be used without explicit permission)
HoW InTErvIEWErS WErE InSTrUCTED To UnDErTaKE foCUSSED EnUMEraTIon
The following text is an extract taken from the gallup Interviewer Training Manual and illustrates how random route was applied in the field:
focussed enumeration (fE)
This survey is capitalising on an inclusive recruitment and screening practice, where we inquire about whether respondents’ immediate neighbours belong to any of the target groups for interviewing.
In order to more effectively recruit persons belonging to our target group, we implement a technique called “focussed enumeration”, by which we ask contact persons in the main sample (i.e. those identified via random route procedure, as described above) to “map” the immediate neighbours to find additional households where target minority persons might live. This is a method that keeps a random rule for respondent selection, but through proxy information, it provides better access to rare populations.
It is very important that focussed enumeration is only done with those respondents who were directly recruited in the random route screening phase. You should not continue focussed enumeration in a household that was found as result of focussed enumeration. In other words, focussed enumeration can only be done for those households that are found through random route.
During the process you go through the following steps:
- Determining the potential dwelling units that focussed enumeration may cover: ask respondents if there are
any flats/houses one and two doors to the right and one and two doors to the left of where you are (or less if there aren’t as many), and (if in a multi-story building) DIRECTLY above and DIRECTLY under the flat where you are doing your interview. Please record only the inhabited dwelling units in the count.
- Then, for each of these six possibilities – if the dwelling units exist – go ahead and ask if any of these are inhabited by people belonging to any of the target groups relevant in your country. Please note that even one person counts, even if this person lives in a family that is dominantly not from the target groups. If the flat is uninhabited, or people from other backgrounds live in it, please code accordingly.
You do not have to be strict, even if the respondent only assumes that the persons living there might belong to an eligible minority, please take it as granted, and code minority group or groups accordingly.
- If yes, please record the immigrant / minority group with the name (as told by the respondent, or if he or she is not able to say, please check and record as shown on the doorbell) and the address. If the respondent is not able to provide the exact address or is not sure, please check/verify yourself after the interview.
- You should attempt to conduct interviews in the households indicated by the respondent through focussed enumeration, but no further use of focussed enumeration should be made in those houses where focussed enumeration was already used to identify the household where you are conducting an interview.
- On the routing slip, please use the proper code that identifies the enumerated household with the main address where it was referred from. E.g. if the main address had an ID of ����, the ID for the recruited HH will have to be ����_FE� – ����_FE6, according to the example on the table below.
The FE approach is, in effect, a minority ‘booster sample’. Because the focused enumeration booster sample was drawn from all sample PSUs - and because a fixed number of addresses is „sampled“ around each core sample address - the sample of addresses issued for screening by focused enumeration was representative of the coverage area (this assumes that the rules used by interviewers to identify the focused enumeration booster sample addresses were unbiased – which is a reasonable assumption for practical purposes).
As a general rule, all sampling activities were face to face, and each identified address was recalled (visited) twice after the initial attempt to establish contact, thus – in total three attempts were made before ‘dropping’ the address.

EU-MIDIS
�6
It is very important that focussed enumeration can be done only with those respondents who were directly recruited in the random route screening phase. you should not continue focussed enumera-tion in a household that was found as result of focussed enumeration.
While doing Focussed Enumeration please fill in the following table with the fullest available information. Please remember that it might happen that some other interviewer will visit the address you collect. Therefore you need to record it in a way that this other interviewer and your supervisor are able to find and check the address. So please write clearly.
Please assure the respondent contacted through random route, with whom you fill in the focussed enumeration table, which you will not disclose that the contact information was obtained from her / him.
foCUSSED EnUMEraTIon TablE
ID fE1. ExistsfE2. Immigrant/Minority? fE4a. name f4b. full address
����_FE� a) First house/door to the right
�-yes 2-no
�-yes, GROUP� 2-yes, GROUP2 3-yes, GROUP3 �-yes, GROUP� 5-no 9-DK
����_FE2 b) Second house/door to the right
�-yes 2-no
�-yes, GROUP� 2-yes, GROUP2 3-yes, GROUP3 �-yes, GROUP� 5-no 9-DK
����_FE3 c) First house/door to the left
�-yes 2-no
�-yes, GROUP� 2-yes, GROUP2 3-yes, GROUP3 �-yes, GROUP� 5-no 9-DK
����_FE� d) Second house/door to the left
�-yes 2-no
�-yes, GROUP� 2-yes, GROUP2 3-yes, GROUP3 �-yes, GROUP� 5-no 9-DK
����_FE5 e) The flat above �-yes 2-no
�-yes, GROUP� 2-yes, GROUP2 3-yes, GROUP3 �-yes, GROUP� 5-no 9-DK
����_FE6 f ) The flat below �-yes 2-no
�-yes, GROUP� 2-yes, GROUP2 3-yes, GROUP3 �-yes, GROUP� 5-no 9-DK
© gallup Europe (not to be used without explicit permission)
THE SCrEEnIng proCESS, onCE a HoUSEHolD IS IDEnTIfIED
The following text is an extract taken from the gallup Interviewer Training Manual and illustrates
how households were screened for eligible respondents:
This is the point where you determine if the person you talk to represents a household that contains people of eligible minority backgrounds or not. If not, you will have to proceed to focussed enumeration (and the majority interview, where applicable), where the following screener will again be applied.

Technical Report: Methodology, Sampling and Fieldwork
�7
If the first respondent who opens the door does indicate that potentially eligible minorities for surveying are present, then you will continue with the following screener.
First - determine the household size. Please remember the definition of the household (sharing eating and cooking) when enumerating the members.
HH1a-HH1b. The number of HH members, children below 16 and above, must be counted separately
Those who already celebrated their �6th birthday should be accounted for in HH�B, any anybody who did not reach that age yet should come in HH�A.
After you have determined the number of persons in the HH, you are to fill in the “HH grid” table, with a couple of characteristics for each member who is above �6. The number of persons in the table should match the number of HH members in HH�B. All questions below – apart from the sex of the person you are talking to – should be asked for each member of the HH.
HH2. Sex
Straightforward – Do not ask of person you are talking to, but ask for others if unclear from name.
HH3. age
Please, if you can, record the completed age (i.e. if someone is 25 years and �� months) code as 25. Accept approximations, if respondent is not sure. Try to make sure if the age limit of �6 is reached or not.
HH4. Minority background
Mark the appropriate code. If respondent is not sure about some other person’s ethnic background, allow her or him to clarify, or accept her or his best approximation.
HH4. Stay in country
Please record since when the person has lived in the country (that is, typically resides here, or spends at least half of the year in the current country). Again, accept
approximation, but try to establish at least if the person has been in the country for at least one full year (which can be multiple times half years, or a few months over a long period of time).
HH6. Internal relation
Straightforward – relationship to person you are talking to (family membership/friendship/co-worker etc).
IMporTanT: Record the details of each household member in the grid. For the respondent record hh� to hh5 and for other members of the household hh� to hh6 starting with the oldest household member through to the youngest. If informant is not sure about any detail, allow him or her to ask around. recording the first name or initials is mandatory, as you will see, for the selection of the sample.
a MaXIMUM of THrEE pErSonS pEr HoUSEHolD Can bE InTErvIEWED!
If there are three persons at the age of �6 or older, belonging to any of the relevant minorities, and having spent at least a year in the country, all of them are eligible to be interviewed, and you will proceed to the household contact form at this point. Please mark them all with an X in the last row of the HH Grid (“SAMPLED”), and proceed to the contact form.
However, if there are more than three eligible people in the HH, you will have to select three people at random, as follows.
Here is what you do: write down the first names or initials of the eligible persons in alphabetic order (if there are identical names, list the younger ahead of the older) on a sheet of paper, or on the screener questionnaire, as you wish.
Insert a selection number for eligible members in the order of their listing, based on the list in alphabetical order, the first on the list being “�”, the second “2”, and so forth. This selection number will have to be inserted in the selection grid, in the row called “selection number” (SEL�, SEL2, SEL3). Such selection numbers are shown in parenthesis.

EU-MIDIS
�8
Ahmed (�) Ali (jr.) (2) Ali (sr.) (3) Alina (�) Tabitha (5)
SElECTIon grID
Number of persons eligible:
� 5 6 7 8 9 �0 +
SEL�: 3 � � 6 � � �SEL2: 2 3 2 � 5 9 5SEL3: � 2 6 5 2 5 �
Then, use the selection grid (there is one on the screener questionnaire such as the one above) to choose the sampled three persons. If there are 5 eligible persons in the HH, use column “5”, which tells you that the �st, 3rd, and 2nd from the list are to be selected (the number below heading “5”).
It means that in the above example, Ahmed, and the two Alis will be the sampled persons. Please note that the person whom you are in contact with at this point might not be selected to be interviewed with the main interview.
Mark those who are sampled with an X in the last row of the HH Grid (“Sampled”), then write the anonymous respondent ID of all sampled persons in the household contact form found on the next page of the Screener questionnaire, along with their initials.
Once you have established who your potential interviewees are, you will have to try to establish contact with them either to immediately conduct an interview, or to set up an appointment. If you can talk to any of the sampled persons other than your primary informant, do not forget to introduce the survey once again.
To record the outcome of this activity, we have a table, called Household Contact Form. Before proceeding, please make sure that the proper IDs and initials / first names are put in the top row. The table records the following information for each of the sampled persons:
HH9. availability
�-the person is normally available
CONTINUE WITH HH�0
2-the person is permanently away
CODE 3 IN HH�� TERMINATE WITH THE PERSON, FINAL STATUS.
3-the person is ill, incapable of the interview till the end of the fieldwork
CODE 3 IN HH��, TERMINATE WITH THE PERSON, FINAL STATUS.
�-the person does not speak the interview language
CODE 3 IN HH��, TERMINATE WITH THE PERSON, FINAL STATUS.
Code�- if the person is at home and immediately available for interviewing.
IMporTanT! Only two interviews can be carried out within a sampled household on the same day. However, interviews cannot be conducted at the same time, and must be undertaken one after the other so that the first interviewee is not in a position to influence the second. Where two interviews cannot be scheduled consecutively there must be a break of at least ten days.
IMporTanT! THErE IS no SUbSTITUTIon WITHIn THE HoUSEHolD. If any of the sampled persons are not available or refuse to be interviewed no replacement can be drawn from the same household.
2.5 Sampling methods applied in the various Member States
After reviewing different sampling approaches based on the results of the pilot survey, EU-MIDIS adopted four distinct sampling approaches; with two of them capitalising on RR and FE, and the other two utilising alternatives to this method. Only one primary sampling approach was used within a Member State (also in cases where respondents from two or three different target groups were interviewed).
The four types were:
(a) CITy/METropolITan: random route sampling (rr) with focused enumeration (fE): the survey’s standard sampling method in most Member States, where the random route PSUs are allocated in the selected cities / metropolitan area, disproportionally distributed across sections, stratified by density (where reliable density information for each strata could be obtained).

Technical Report: Methodology, Sampling and Fieldwork
�9
A joint effort by the FRA and Gallup was targeted towards obtaining detailed statistics concerning the concentration of eligible minority groups by city section (e.g. ward, parish, census unit, or equivalent) level. Where statistical information was available, samples were allocated in a way that 80% of the issued PSUs were located in sections with at least �5% combined density of eligible minorities, where more than one minority group was surveyed, and 20% in sections with a combined density between 8 and ��.99%. In the standard design, sections with a density of 7.99% or less were not sampled. In several locations the effort to obtain section level density information proved to be impossible, or the obtained figures were deemed unoperational (e.g. outdated, or not sufficiently detailed, which was the case in Estonia, Greece, Italy and Slovenia). In these cities, PSUs were designated by expert choice (e.g. after consulting with minority organisations, academic experts, municipal offices, and including advice from the FRA’s RAXEN network in the Member States concerned) with a view to replicating the usual 80/20 design in allocation of PSUs to high and medium density areas.
(b) rEgISTry-baSED aDDrESS SaMplE: Wherever it was possible, EU-MIDIS capitalised on available individual-level samples provided by population registry offices or their equivalent, which identified potential respondents according to their immigrant or national status (e.g. country of birth or parents’ country of birth and/or mother tongue). In most Member States it was legally not possible to obtain samples with sensitive information related to ethnic background. However in those cases where this was possible, EU-MIDIS utilised this approach as an ideal method for sampling low incidence or dispersed ethnic minorities. In these countries, a random sample was drawn from a sufficiently accurate population list (national registries or equivalent) and the selected individuals (and their household members) were contacted directly by interviewers. These samples were not clustered and were drawn at random in the designated cities (in Germany, Denmark and Finland) or nationwide (in Luxembourg).
(c) naTIonWIDE random route with fE: the method to cover ethnic minorities that are not (only) concentrated in the largest urban centres, whereby the random route PSUs are allocated in territories anywhere in the country where the targeted minority predominantly lives, distributed in city sections, towns and villages, based on known densities of the target population (either from national statistics or large scale specific studies).
(d) nETWorK sampling (nS): This was adopted as a contingency method for the above three truly random sampling approaches. In this scenario, starting from an initial number of contacts, the network of identified eligible persons was to be sampled. Unfortunately, this method proved to be largely unsuccessful as persons who were recruited for the interview were extremely reluctant to provide information on their network for subsequent sampling. Overall, only 390 effective addresses or telephone numbers could be collected from countries where type (a) sampling was foreseen (for countries where type (b) and type (c) sampling was used, the survey did not initiate network mapping, with the anticipation that these samples did not require a supplementary sample). In the absence of such contacts, the type (d) approach turned to sampling relevant minorities at their gathering places, where typically there was a very limited possibility to follow up people’s ‘networks’. Such a sampling approach was adopted from the outset in Malta, where interviews took place among the population of so called ‘Open Detention Centres’, where interviewers were not allowed to enter, but could intercept those immigrants who left or entered these institutions.
Table 2.4. network mapping failure in numbers
In countries where type d) approach had to be adopted as a fall-backTotal number of effective contacts made available
Ireland �9Netherlands �2Slovenia �8Sweden 37UK ��
EU-MIDIS
20
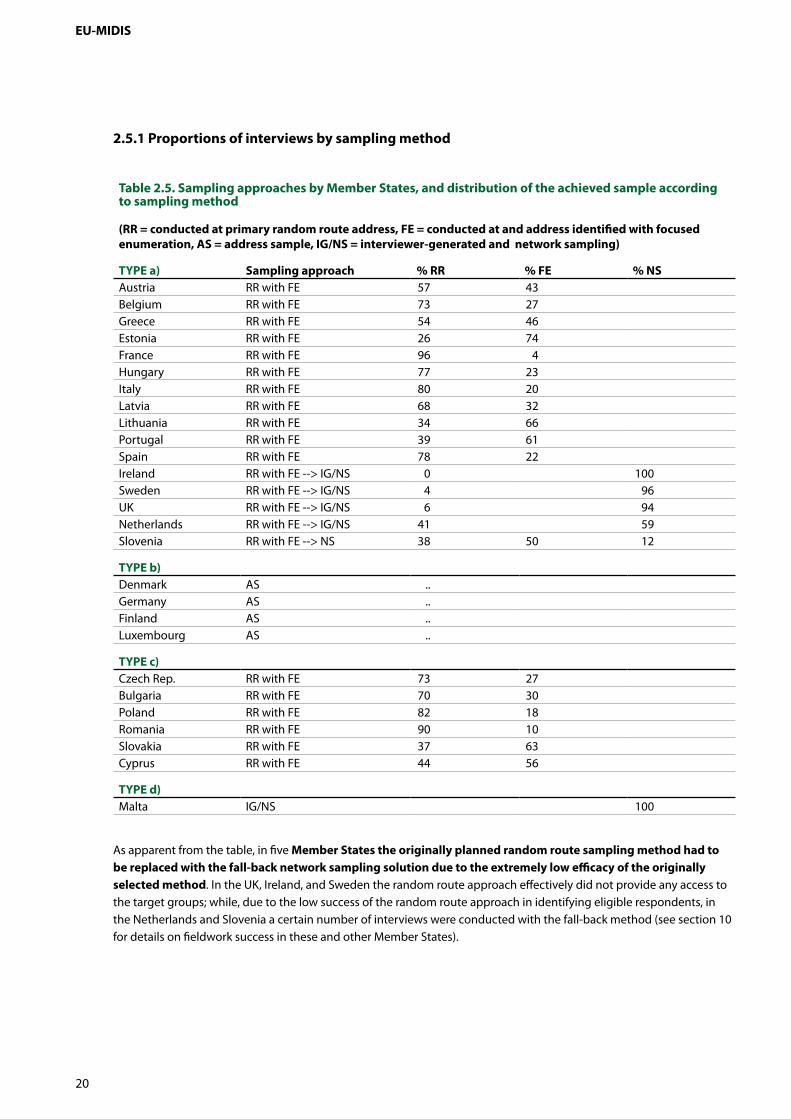
2.5.1 proportions of interviews by sampling method
Table 2.5. Sampling approaches by Member States, and distribution of the achieved sample according to sampling method
(rr = conducted at primary random route address, fE = conducted at and address identified with focused enumeration, aS = address sample, Ig/nS = interviewer-generated and network sampling)
TypE a) Sampling approach % rr % fE % nSAustria RR with FE 57 �3 Belgium RR with FE 73 27 Greece RR with FE 5� �6 Estonia RR with FE 26 7� France RR with FE 96 � Hungary RR with FE 77 23 Italy RR with FE 80 20 Latvia RR with FE 68 32 Lithuania RR with FE 3� 66 Portugal RR with FE 39 6� Spain RR with FE 78 22 Ireland RR with FE --> IG/NS 0 �00Sweden RR with FE --> IG/NS � 96UK RR with FE --> IG/NS 6 9�Netherlands RR with FE --> IG/NS �� 59Slovenia RR with FE --> NS 38 50 �2
TypE b) Denmark AS .. Germany AS .. Finland AS .. Luxembourg AS ..
TypE c) Czech Rep. RR with FE 73 27 Bulgaria RR with FE 70 30 Poland RR with FE 82 �8 Romania RR with FE 90 �0 Slovakia RR with FE 37 63 Cyprus RR with FE �� 56
TypE d) Malta IG/NS �00
As apparent from the table, in five Member States the originally planned random route sampling method had to be replaced with the fall-back network sampling solution due to the extremely low efficacy of the originally selected method. In the UK, Ireland, and Sweden the random route approach effectively did not provide any access to the target groups; while, due to the low success of the random route approach in identifying eligible respondents, in the Netherlands and Slovenia a certain number of interviews were conducted with the fall-back method (see section �0 for details on fieldwork success in these and other Member States).

Technical Report: Methodology, Sampling and Fieldwork
2�
2.6 Sampling specifics
Regardless of the sampling method, the following requirements were set out for EU-MIDIS:
- Replacement of enumerated dwelling units / households was possible, provided that two recalls after the initial contact has been carried out, or the unit explicitly refused participation
- In each enumerated eligible household (with at least one member fulfilling the eligibility criteria set out under 2.2.�) up to three persons could be interviewed, chosen randomly from household members should there be more than three eligible respondents (using a Kish grid selection).
- The primary mode of contact is face to face. In order to (re)contact identified minority households, other means were accepted too. Interviewers might use the telephone number obtained by the interviewer at a first visit (or otherwise), to follow up and schedule / reschedule appointments for a second/third follow-up.
For random route samples, pSU replacement rules were established for the cases when in high, but especially in medium density areas, the randomly chosen starting point was assigned to a micro-area where no minorities were available (e.g. because they live elsewhere in the same geographic segment). In order to minimize the harm that such random assignment does to the fieldwork efficiency, such PSUs were replaced if the first five completed screener interviews did not result in any minority lead; that is, if at the first five completed screeners the contacted respondents were all from the majority population and couldn’t identify any of their neighbours as being from the minority groups for surveying, then that PSU/starting point was replaced with its pre-assigned replacement. Replacements were designed to have a second starting point in the same PSU, while the second replacement was in a high density area, regardless of the density characteristics of the original PSU.
2.7 Sample size
The target sample size per specific minority groups was 500. Table 2.6. shows the net sample size achieved for the various groups.
Table 2.6. EU-MIDIS Target groups
n= n=austria Turkish 53� latvia Russians 500 former
Yugoslavs593 lithuania Russians 5�5
belgium North Africans 500 luxembourg former Yugoslavs
�97
Turkish 532 Malta Immigrants from Africa
500
bulgaria Roma 500 netherlands North Africans �59 Turkish 500 Turkish ��3Czech rep. Roma 505 Surinamese �7�Cyprus Asians 500 poland Roma 500Denmark Turkish 553 portugal Brazilians 505 Somalis 56� Sub-Saharan
Africans5�0
germany Turkish 503 romania Roma 500 former
Yugoslavs500 Slovakia Roma 500
greece Albanians 503 Slovenia Serbians �73 Roma 505 Bosniaks /
Muslims528

EU-MIDIS
22
n= n=Estonia Russians 500 Spain North Africans 5��finland Russians 562 South
Americans50�
Somalis �8� Romanians 508france North Africans 53� Sweden Iraqis �9� Sub-Saharan
Africans�66 Somalis 506
Hungary Roma 500 UK Central and Eastern
�0�2
Ireland Central and Eastern Europeans
609 Europeans
EU level Other Black Africans
��6
Sub-Saharan Africans
503
Italy Albanians 500 ToTal: 23565 North Africans 50� Romanians 502
The survey exceeded its overall target sample size (23,000) by 565 cases. Most countries achieved more interviews, with the exception of the Netherlands.
On target group level we have a considerable positive deviation among Polish respondents in Ireland, Ex-Yugoslavians in Austria, Somalis in Denmark and Russians in Finland. In the Netherlands, on the other hand, we have a smaller-than-targeted achieved overall sample size (�,373 cases instead of �,500), for the reasons detailed in section 7.
In France, the number of Sub-Saharan Africans lags behind the targeted amount (though the higher number of North Africans levels off the quota). The same is true for Serbians living in Slovenia (where the number of Bosnians helped to achieve the country target sample), and for Somalis in Finland (where Russians make up for the loss on country level).
In total, ��6 interviews were conducted with ‘other’ Sub-Saharan Africans/Caribbeans, where they were not a target group for surveying in a Member State, in addition to interviews with specific target groups.
2.8 google map support of pSU designation
As indicated, in some Member States EU-MIDIS used a Google Map based application for defining sampling areas and associated starting points randomly. These sampling areas and points were either generated automatically or facilitated by expert advice in the absence of available population statistics.
Countries where such maps were used are listed on Table 2.7.
In these countries national fieldwork teams received a link with all PSUs with starting points and their replacements. These starting points were printable in the required zoom level. The printouts had the PSU ID (e.g. 0�5-�), and the actual address of the sampling point chosen, as well as the desired number of interviews to be completed in the actual PSU (which was not a mandatory quota), for each target group (see example below).
Table 2.7. pSUs
Countries Issued pSUsAustria 50Belgium �00Estonia 50France �50Greece 83Hungary 50Latvia 50Lithuania 50Portugal �00Slovenia 7�Spain �00

Technical Report: Methodology, Sampling and Fieldwork
23
Where random starting points were assigned, national fieldwork teams were able to review and reject certain random starting points (e.g. rejecting those outside of residential areas), by generating another random starting point located in the same geographical area.
The maps served multiple purposes:
- to be used for documenting fieldwork, in terms of starting points that define PSUs and their replacements,
- to be used as a tool for interviewers to hand-draw their own route on printed maps, and
- they could be used as a verification of the fieldwork activity as well.
2.9 Majority sub-survey
In ten Member States EU-MIDIS collected auxiliary information from majority respondents about police stop and search activities in general and contact with customs/border control (along with basic details on personal background), in the areas surveyed. The FRA identified �0 countries (Belgium, Bulgaria, France, Germany, Greece, Hungary, Italy, Romania, Slovakia and Spain) where a geographically ‘matching’ sample of the majority population was interviewed, with the same sample size as an eligible minority group (N=500). The total number of majority interviews achieved was 5,068.
In most countries, majority respondents were recruited along the random routes that produced the minority sample: a randomly selected member from households where only majority people lived was invited to participate by answering a very short questionnaire. No more than one interview was completed per household and the respondent was selected using the ‘last birthday‘ method.
Where, upon completion of the minority study, the majority sub-sample size did not reach the desired 500 cases, additional telephone interviews were conducted to complement those collected face-to-face, using a random sample of directory-listed telephone numbers from the same streets where minority interviews were completed.
In Germany, due to the list-based sampling method, all majority interviews were carried out in the framework of a telephone follow-up survey.
The figure on the right provides an overview of the number of achieved interviews among the majority population, by sampling mode.
In Hungary, where the minority part of the survey was completed within a relatively short time period (3.5 weeks), the majority subsample could not be fully achieved during the time available and using the random
Figure II.�. Majority interviews
Random Route CATI
belgium162 365
bulgaria500
france503
germany504
greece506
Hungary171 337
Italy502
romania500
Slovakia500
Spain518
0 100 200 300 400 500 600

EU-MIDIS
2�
route sampling method. This was partly because very compact Roma communities were targeted (especially in Miskolc) with no “in-between” households containing majority respondents; in addition, there was a high refusal rate among majority people (especially in Budapest). Therefore, both in Belgium and Hungary phone interviews took place to reach the desired number of majority interviews.
In Romania there were only � PSUs where the Roma community was isolated from the rest of the settlement being surveyed. In these cases, for the recruitment of majority respondents, another starting point was designated in the same locality in streets adjacent to the compact Roma area.
In Slovakia, where the Roma communities were similarly concentrated, the fieldwork provider assigned new routes for the majority component by selecting starting points at the closest possible perimeter, e.g. the next street to the “Roma streets”.
In Spain, a voluntary rule of having a quota of 2-3 majority people per completed PSU was applied.
3. SUrvEy DElIvEry
EU-MIDIS interviews were carried out face-to-face, predominantly in respondents’ homes (unless otherwise requested by sampled respondents).
3.1 The questionnaire
The EU-MIDIS questionnaire was developed by the FRA, and was supported in this with valuable input from experts working in the area of comparable international survey research. In many cases the content of the survey sought to capitalise on previously existing survey instruments. In addition, questions were taken, where possible, from established international surveys, such as Eurobarometer and the International Crime Victimisation Survey (ICVS), in order to ensure, as far as possible, comparability with existing information from international general population surveys.
Questionnaires were paper-and-pencil based in each country. Some question in the questionnaire involved the use of show cards to help respondents select the relevant option(s).
The whole survey instrument consisted of the following modules and forms:
- sampling administration sheets: Routing Slips (for sample types a) and c)), Contact Sheets (for sample types b) and d)) – to be filled in for any attempted contact
Table 3.1. Interview duration
Country
Main questionnaire duration (average, minutes)
Austria 25Belgium 29Bulgaria 32Czech Republic �7Cyprus 3�Denmark 3�Estonia 27Finland 35France* 33Germany 33Greece 25Hungary 36Ireland 2�Italy 33Latvia 35Lithuania 26Luxembourg 5�Malta 28Netherlands 27Poland 35Portugal 2�Romania 33Slovakia �7Slovenia 2�Spain 27Sweden 37United Kingdom 29
Technical Report: Methodology, Sampling and Fieldwork
25
- screener questionnaire: (to be filled in for every (majority or minority household) contacted (for type d) samples only the household table was to be filled in))
- main questionnaire (for all sample types)
- majority questionnaire (for matched majority samples, see 2.9 Majority sub-survey)
On average, the EU-MIDIS main questionnaire was 32 minutes long. This came on top of a 5-minute average duration screener questionnaire.
The actual length varied according to experiences of victimisation/discrimination, respondents’ talkativeness, language capability, and different interviewing styles.
The shortest interview took only 9 minutes, while we registered cases of ��5 minutes duration. The typical length of the interview was between 25 and 35 minutes. The EU-MIDIS questionnaire is available for reference at: http://fra.europa.eu/eu-midis.
In order to facilitate the fieldwork, a gallup notification letter (created and signed by Gallup and its national partners) together with a letter from the fra (with the signature of FRA senior officials) served as a ‘leave-behind’ information pack to inform respondents about the study. This information was either handed over prior to or after an interview, given to hesitant contacts before a recall attempt was made, or left behind in mail boxes for potential respondents who were not at home.
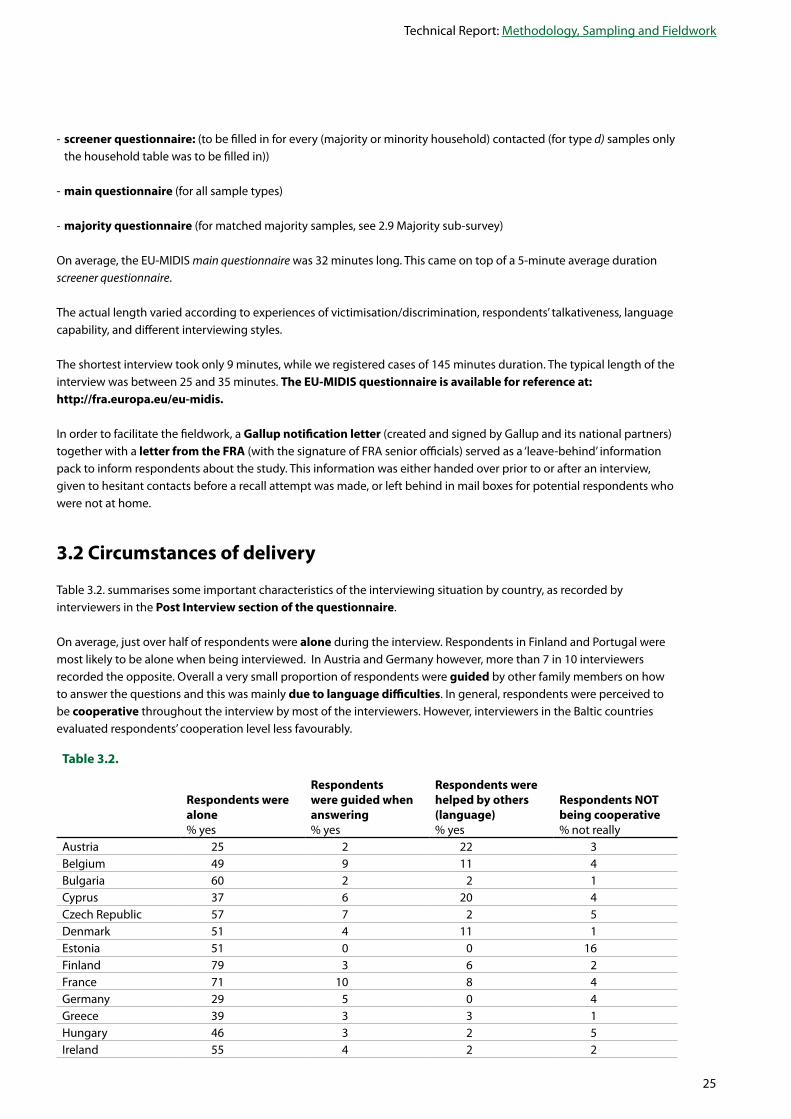
3.2 Circumstances of delivery
Table 3.2. summarises some important characteristics of the interviewing situation by country, as recorded by interviewers in the post Interview section of the questionnaire.
On average, just over half of respondents were alone during the interview. Respondents in Finland and Portugal were most likely to be alone when being interviewed. In Austria and Germany however, more than 7 in �0 interviewers recorded the opposite. Overall a very small proportion of respondents were guided by other family members on how to answer the questions and this was mainly due to language difficulties. In general, respondents were perceived to be cooperative throughout the interview by most of the interviewers. However, interviewers in the Baltic countries evaluated respondents’ cooperation level less favourably.
Table 3.2.
respondents were alone % yes
respondents were guided when answering % yes
respondents were helped by others (language) % yes
respondents noT being cooperative % not really
Austria 25 2 22 3Belgium �9 9 �� �Bulgaria 60 2 2 �Cyprus 37 6 20 �Czech Republic 57 7 2 5Denmark 5� � �� �Estonia 5� 0 0 �6Finland 79 3 6 2France 7� �0 8 �Germany 29 5 0 �Greece 39 3 3 �Hungary �6 3 2 5Ireland 55 � 2 2

EU-MIDIS
26
respondents were alone % yes
respondents were guided when answering % yes
respondents were helped by others (language) % yes
respondents noT being cooperative % not really
Italy 33 6 7 9Latvia 73 � 0 ��Lithuania 33 3 2 ��Luxembourg 6� � �� 2Malta �9 23 36 �0Netherlands 72 3 2 �Poland 5� 3 �0 �Portugal 73 0 � 0Romania 63 3 � 2Slovakia 63 7 5 �Slovenia 5� � � �Spain 67 2 3 3Sweden 67 9 9 8UK 58 3 �3 �0
3.3 language of delivery
EU-MIDIS questionnaires were predominantly delivered in the national language(s) of the country where the interview took place.
To compensate for some respondents’ potentially inferior knowledge of the national language(s), interviewers carried questionnaires in the relevant native language(s) of the groups surveyed as an aid for the respondent who could than look up and read problematic questions in his or her native language as well.
Persons who did not speak a national language sufficiently enough to lead a simple conversation with the interviewer were not included in the sample.
The source EU-MIDIS questionnaire was finalised around mid-March in English. Translations were carried out into the local main and proxy languages (‘proxy’ meaning non-EU languages spoken by certain minority groups). Forward and back-translations were made to the following main languages, indicated below. Translations were distributed to the FRA’s RAXEN National Focal Points (NFPs) for a final expert review. Effort was placed on making the language used in the translated questionnaire as accessible as possible for the populations it was targeted at; for example, a slightly different German translation was used in Germany and Austria to reflect differences in the use of German in these two countries.
Bulgarian Italian Czech Latvian Danish Lithuanian Dutch Polish Estonian Portuguese Finnish Romanian French Slovak German Slovene Greek Spanish Hungarian Swedish
Translations were also made into the following proxy languages: Albanian Serbian Arabic Somali Filippino Turkish Russian
Technical Report: Methodology, Sampling and Fieldwork
27
4. WEIgHTIng
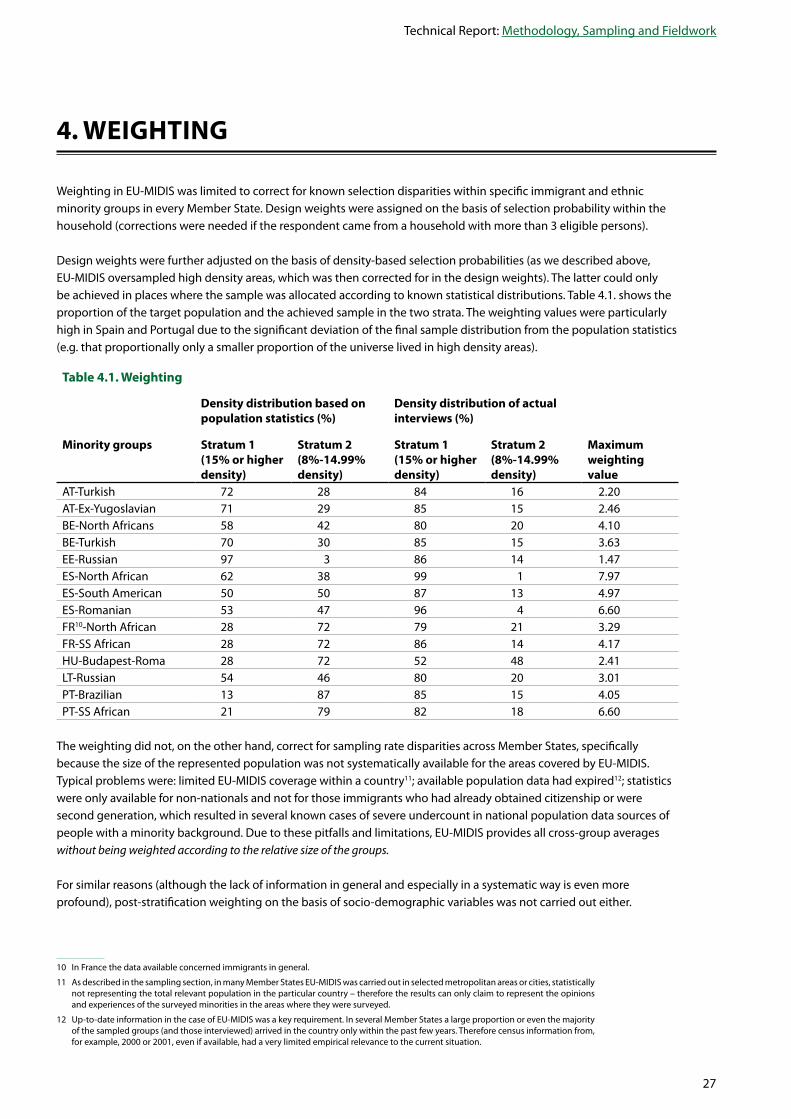
Weighting in EU-MIDIS was limited to correct for known selection disparities within specific immigrant and ethnic minority groups in every Member State. Design weights were assigned on the basis of selection probability within the household (corrections were needed if the respondent came from a household with more than 3 eligible persons).
Design weights were further adjusted on the basis of density-based selection probabilities (as we described above, EU-MIDIS oversampled high density areas, which was then corrected for in the design weights). The latter could only be achieved in places where the sample was allocated according to known statistical distributions. Table �.�. shows the proportion of the target population and the achieved sample in the two strata. The weighting values were particularly high in Spain and Portugal due to the significant deviation of the final sample distribution from the population statistics (e.g. that proportionally only a smaller proportion of the universe lived in high density areas).
Table 4.1. Weighting
Density distribution based on population statistics (%)
Density distribution of actual interviews (%)
Minority groups Stratum 1 (15% or higher density)
Stratum 2 (8%-14.99% density)
Stratum 1 (15% or higher density)
Stratum 2 (8%-14.99% density)
Maximum weighting value
AT-Turkish 72 28 8� �6 2.20AT-Ex-Yugoslavian 7� 29 85 �5 2.�6BE-North Africans 58 �2 80 20 �.�0BE-Turkish 70 30 85 �5 3.63EE-Russian 97 3 86 �� �.�7ES-North African 62 38 99 � 7.97ES-South American 50 50 87 �3 �.97ES-Romanian 53 �7 96 � 6.60FR�0-North African 28 72 79 2� 3.29FR-SS African 28 72 86 �� �.�7HU-Budapest-Roma 28 72 52 �8 2.��LT-Russian 5� �6 80 20 3.0�PT-Brazilian �3 87 85 �5 �.05PT-SS African 2� 79 82 �8 6.60
The weighting did not, on the other hand, correct for sampling rate disparities across Member States, specifically because the size of the represented population was not systematically available for the areas covered by EU-MIDIS. Typical problems were: limited EU-MIDIS coverage within a country��; available population data had expired�2; statistics were only available for non-nationals and not for those immigrants who had already obtained citizenship or were second generation, which resulted in several known cases of severe undercount in national population data sources of people with a minority background. Due to these pitfalls and limitations, EU-MIDIS provides all cross-group averages without being weighted according to the relative size of the groups.
For similar reasons (although the lack of information in general and especially in a systematic way is even more profound), post-stratification weighting on the basis of socio-demographic variables was not carried out either.
�0 In France the data available concerned immigrants in general.
�� As described in the sampling section, in many Member States EU-MIDIS was carried out in selected metropolitan areas or cities, statistically not representing the total relevant population in the particular country – therefore the results can only claim to represent the opinions and experiences of the surveyed minorities in the areas where they were surveyed.
�2 Up-to-date information in the case of EU-MIDIS was a key requirement. In several Member States a large proportion or even the majority of the sampled groups (and those interviewed) arrived in the country only within the past few years. Therefore census information from, for example, 2000 or 200�, even if available, had a very limited empirical relevance to the current situation.

EU-MIDIS
28
5. QUalITy ConTrol
The survey had a quality control scheme matching to general ESOMAR guidelines and the general practice across most members of the network. As a minimum, a random �0% of all conducted ROUTES and INTERVIEWS were verified.
route verification: Supervisors followed up at least �0% of all random routes and marked the accuracy of random route rule application with the following scores: (�) full conformity, (2) slight departures from the rules, but generally following guidelines, and (3) random route rules not kept. If a route received a mark of (3), interviews resulting from this route were rejected and a replacement PSU was issued to another interviewer to conduct the necessary number of interviews. Route verification went parallel with the fieldwork, mainly to avoid the need for massive replacements, as the supervisor could give immediate feedback for interviewers if conformity issues were discovered (the country-by-country summaries provide more details on how this exercise was carried out in the particular Member States).
Interview verification: Similarly, a minimum �0% of interviews was selected at random and verified, over the telephone. Here the primary aim was to confirm the validity of the interview (that is, it indeed took place). If a fake interview was identified, it had to be replaced and all interviews belonging to the same interviewer had to be verified – where possible.
Coding, entry: Besides metadata (an SPSS datafile), Gallup provided SPSS syntax files that are created to uncover coding inconsistencies (e.g. logical verifications, and in some cases interval checks – e.g., for age, income, etc.) both for the survey datafile (main study and screening) and the routing slip data. National teams were requested to run those scripts and correct / explain any discrepancies discovered.
Obviously, proper briefing of the interviewers was essential in order to avoid future problems with correction of mistakes that would have required much more effort (see section 6. Interviewer selection and training).
In sum, EU-MIDIS quality control involved the following core activities: ‚
- A double translation and back-translation of the survey instrument was carried out by the contractor (double-checked and verified by the FRA RAXEN NFPs).
- Central and on-location in-person briefings were held for participating national fieldwork providers (by Gallup), and extensive in-person training was mandatory for any interviewer involved in the survey execution.
- Detailed written instructions (management manuals, sampling manuals and interviewer manuals) were drafted and provided for all participants involved, and were translated into national languages where it was necessary.
- During fieldwork execution, a full review of interviews was carried out by local supervisors and at least �0% of the interviews were actually verified with the respondents.
- Representatives from the FRA as well as Gallup visited national teams and attended some of the trainings and actual interviews; the memos and debriefings from such visits served as important feedback for the national institutes to improve their fieldwork operations.
- Proper quality control measures for data entry (e.g. partial double entry) were in place, to ensure the accuracy of data capture.
- An extensive data editing effort served the harmonisation of the national datafiles and the elimination of inconsistencies found in the submitted raw dataset.

Technical Report: Methodology, Sampling and Fieldwork
29
6. InTErvIEWEr SElECTIon anD TraInIng
6.1 Interviewer selection
Fieldwork teams were specifically instructed to use an experienced workforce for this survey. Interviewers with extensive former door-to-door sampling experience, preferably females, and where possible from the minority/immigrant peer groups for interviewing in the Member States, were selected. Each interviewer attended an in-person training where the survey was specifically introduced to them, based on the training manual provided.
Recruitment of interviewers was based on a selection procedure and criteria defined by Gallup’s professional standards. The most important requirements were: communicative skills, responsibility, and professional ethics.
The majority of interviewers were skilled, long term professional interviewers having great experience in conducting face-to-face interviews. In order to increase potential respondents’ willingness to take part in the survey, most of the countries hired some interviewers with a background matching the target minorities too. In fact, some of the countries did confirm that these interviewers proved to be more accepted by the interviewed communities vs. their majority counterparts.
In case new interviewers were not experienced, which applied often to interviewers selected from minority populations, they went through a general training session on how to conduct interviews covering how to communicate with respondents, what their responsibilities are, how to ask questions in a correct manner, who they represent when performing the job, etc. If they passed this initial training in a satisfactory way they were invited to participate in the specific EU-MIDIS training.
When selecting interviewers, the national fieldwork teams have further considered the knowledge of any language spoken by the target minorities.
As the fieldwork progressed, quite a few countries (particularly the Scandinavian and Benelux countries) reported problems related to motivation of the interviewers. The main reasons were difficulties in gaining access to the potential respondents’ houses, persuading them to take part in the survey due to general mistrust, and underestimation of the time and effort face-to-face interviews cost.
There were countries (Portugal, the UK) in which some of the interviewers declined to participate in the survey because of safety concerns. In order to minimize (any possible) risks which could have affected interviewers’ security, the interviewers in these countries worked in pairs.
6.2 Training activities
Table 6.�. provides a summary of the training activities that were carried out for EU-MIDIS.
Table 6.1. overview table of training activities
CountryTraining period (all 2008)
number of trainings held
Interviewers trained
Interviewers finished the survey
Austria 6 May � 6 6Belgium 25 Apr - �8 Jun �9 72 �2Bulgaria �0 - �� May 7 �0� 90Czech Republic* �5 - 29 May 8 63 62Cyprus 7 - 9 May 3 �7 �7Denmark �3 May - 29 Sep 8 �� ��Estonia �2 - 26 May 6 �� 9Finland �7 Apr - �0 Jul �2 �6 3�

EU-MIDIS
30
CountryTraining period (all 2008)
number of trainings held
Interviewers trained
Interviewers finished the survey
France* 2� Apr - �8 Jul �� �9 38Germany 9 - �7 May 3 50 37Greece 7 - �3 May 5 �5 26Hungary* 9 - �5 May 5 22 2�Ireland�3 �5 Aug - 2� Sep 8 26 23Italy �� May � 37 37Latvia �2 - �5 May 6 29 ��Lithuania �3 - 3� May 6 25 �7Luxembourg �5 Apr - 29 May 7 6� 22Malta �6 May 2 �3 8Netherlands 8 Apr - �2 Jun, 7 �38 2�
�8 - 22 Sep 3 �6 27Poland* 9 - �3 May 3 25 23Portugal 28 Apr - �6 Jun 5 26 �6Romania* �5 - �7 May 3 69 67Slovakia* 29 Apr - 30 May �0 50 �8Slovenia �5 May - �0 Jun �� ��2 6�Spain �2 May - �� Jun 9 65 28Sweden 2� Apr - 22 May 3 29 �7United Kingdom 6 May - �6 Jul 3 �6 �8* countries where train-the-trainers sessions were held, local interviewers were trained by supervisors who
had been trained in the first phase.
The core Gallup survey team met with survey teams in the following Member States to clarify approaches to training and the material in the Handbook prior to the initiation of training: Belgium, France, Netherlands, Austria, Portugal, Finland, Sweden and the UK/Ireland (at their respective locations).
Training followed two models:
All interviewers and fieldwork supervisors were trained using the uniform instructions provided by Gallup. This approach was more feasible logistically in countries where interviewing was concentrated in a city or a few cities.
A cascading training scheme was applied, where the central team trained supervisors who, in turn, trained interviewers in their respective locations for surveying.
All EU-MIDIS training was face-to-face, and included role-play on different ‘in the field’ scenarios alongside the actual questionnaire.
Interviewer Training Manual The survey training manual is available for reference at http://fra.europa.eu/eu-midis The manual provides detailed information about how interviewers were trained and how random route and focused enumeration were applied in the field.
National teams were requested to submit qualitative feedback about their training experiences, which resulted, in some cases, in adjustments being made to improve on-going and future fieldwork instructions and training.
�3 A decision was made to change the fieldwork provider in Ireland during the data collection period. These details refer to the sessions held by the second fieldwork team.

Technical Report: Methodology, Sampling and Fieldwork
3�
7. fall-baCK SolUTIonS aDopTED
In a number of Member States, EU-MIDIS experienced difficulties during the fieldwork period and, therefore, had to overcome various barriers. Problems, however, could be handled in most countries within the framework of the original sampling proposal and during the fieldwork implementation period.
There were, however, four countries (Ireland, the netherlands, Sweden, and the UK) where problems with the original sampling approach and implementation plan necessitated the adoption of the standard fall back sampling approach instead of the original survey design14.
In these countries the sampling method had to be changed, from type (a) sampling to type (d), either at some stage of the implementation, or essentially at the beginning – after a significant period of unsuccessful attempts to implement type (a) sampling. In Malta, due to specific circumstances (see below) a type (d) sampling approach was designated from the outset.
The survey framework applied in EU-MIDIS was prepared for such situations, wherein network sampling – sample type (d) – was used as the standard fall-back approach in cases of primary sampling method failure; see section 2.5 ‘Sampling methods applied in the various Member States’. What EU-MIDIS was ill-prepared for is that the subjects interviewed would be absolutely unwilling to share information on their immediate network of fellow nationals with the interviewers (see Section 2.5 ‘Sampling methods applied in the various Member States’).
The following paragraphs illustrate the particular problems that were faced, and how they were addressed, with respect to the problematic cases of Malta, the UK, Sweden and Ireland.
7.1 Malta
After consulting with the national fieldwork team and the FRA’s RAXEN National Focal Point for Malta, a decision was made, prior to fieldwork launching, that random route sampling would not be used in Malta. This was due to the nature of the living conditions of the target group: most Africans (who were especially Sub-Saharan Africans) live in closed or semi-open detention centres, where random route sampling is inappropriate. Instead, a targeted recruitment of these people at their respective places of gathering was used (at Open Centres especially for Sub-Saharan Africans and at the Mosque to sample North Africans). After initial success the cooperation rate at the Mosque dropped to almost zero and thus, most interviews were made at the courtyards of Semi-Open Detention centres, where the residents are allowed to leave and to look for work in Malta. Closed centres remained inaccessible to EU-MIDIS interviewers.
7.2 The United Kingdom
In the UK (more specifically in London), problems started with the unavailability of relevant detailed official population statistics about the presence and residential location of Central and East European (CEE) migrants from other EU Member States. Only general estimates of CEE populations were available at borough level, which is insufficiently detailed for a type (a) sampling approach where compact high density neighbourhoods have to be identifiable in order to efficiently utilise random route sampling.
Thus, expert advice was utilised, including input from the Agency’s RAXEN National Focal Point, in designating specific areas where the fieldwork team was instructed to carry out random route sampling in an effort to locate eligible
�� Slovenia as well, had to resort to type d) sampling in order to reach the targeted number of interviews, but the extent of this addition is rather minimal (this affected �2% of the completed interviews, which can be eliminated from any analyses should this be desired without significantly compromising the precision of the results), therefore we do not discuss the Slovenian case in this section. The section about fieldwork outcomes has details on the extremely low response rate associated with extremely low screening efficiency that the fieldwork faced in Slovenia.

EU-MIDIS
32
respondents. Specific wards were designated in the London boroughs of Hammersmith and Fulham, Hackney, Islington, Ealing, Brent, Wandsworth, Waltham Forest, Haringey, Hounslow and Newham.
80% of the starting addresses were issued in wards in Hammersmith and Fulham, as designated wards in this borough were assumed to be high density neighbourhoods; while the rest of the sampling points were allocated randomly in the remaining wards. Due to sampling issues, fieldwork was only able to start in week 22.
After two weeks of fieldwork activities (with only one interview achieved), grave issues with the type (a) approach were reported by the UK national fieldwork team, including a very high non-contact rate; that is, people were not opening their doors to interviewers, and interviewers were unable to use Focused Enumeration at all (the reasons for which remained unclear, but probably the problem of CEE migrants’ visual similarity with the majority population meant that neighbours were unable to identify them as separate from the majority population). Also, interviewers were very concerned about safety issues when working in some of the designated areas; however, no actual incidents were reported. Concerns about safety could also have impacted on people’s willingness to open their doors to interviewers, which resulted in the failure of random route as a sampling approach.
As of week 2�, a new approach was adopted - called “smart PSUs” - to try and pinpoint areas more densely inhabited by CEE migrants. In short, this meant that with an initial set of CEE persons recruited at typical places of gathering – ‘convenience sampling’ - within the wards originally assigned, PSUs were allocated around the place of residence of persons identified for interviewing through convenience sampling, e.g. that their house or apartment would become effective starting points for random route recruitment. The smart PSU method, however, did not resolve the fundamental problem of non-contact; that is, interviewers’ attempts to make contact with households for screening were unsuccessful, with interviewers reporting that people were not answering their doors even if they were evidently at home. With this method 626 attempts were made and only �� interviews achieved (by week 25).
As of week 25 the FRA agreed to completely abandon random route recruitment, and revert to the network-based approach. However, a further problem was that respondents who were successfully interviewed were very reluctant to share contact information about people from the same migrant community as themselves. In sum - during the entire fieldwork, involving over �,000 respondents, only �� effective contacts were provided to interviewers (e.g. contacts with full addresses or telephone numbers – In some cases respondents gave only the name, age and minority group, but refused to reveal the full address (giving instead just a street, or district) of the potential contact). In response, the sampling turned to interviewer-driven sampling at different locations where the target groups were known to gather (who in fact were predominantly Polish, as they were found by far in the greatest numbers). Interviewers visited several locations where CEE migrants were known to be, these included: cultural centres, community centres, cafés, and churches. To supplement this approach, the fieldwork team talked to community leaders, priests etc., to ask for their support in identify places where potential respondents could be contacted.
Whilst every attempt was made to interview people at home, once they had been contacted through a typical place of gathering and had agreed to an interview, many people remained reluctant to do so. In the end, two thirds of interviews were conducted outside the home (but in sufficient privacy, e.g. in a café, or similar) and one third in people’s homes.
7.3 Sweden
From the outset, the national fieldwork team expressed severe concerns about using random route sampling in Sweden. After four weeks of fieldwork, these concerns were confirmed by the extremely low number of completed interviews and almost zero progress in the fieldwork. As a result, the survey adopted the fall-back solution of type (d) sampling. Thus, this method remained the primary approach for surveying in Sweden.
The main issue in Sweden related to the problem of gaining access to apartment blocks for door to door sampling. Lack of doorbells and security entry systems at apartment blocks prevented access in many cases. Although interviewers were instructed to wait for a few minutes at blocks to see if they could gain entry via someone leaving or entering a block, this approach proved unsuccessful. Even when interviewers did come into contact with target minorities,

Technical Report: Methodology, Sampling and Fieldwork
33
respondents refused to take part in the survey due to fear about registration of their names and contact information – although interviewers attempted to reassure them that the survey’s results would be completely anonymous.
After the initial random route method failed, two alternatives were tested:
- Telephone screening based on name-screened fixed-line telephone numbers with a 5 recall design (which resulted in � interview out of 300 attempts)
- Network sampling for which initial informants/respondents were recruited at public locations that are geographically dispersed and vary in type. This latter approach proved to be more successful, providing �� interviews among the Somali respondent group among whom this method was initially tested.
As a result of the above, the Swedish fieldwork team agreed to change its approach to network-based sampling in week 26. Eventually the vast majority of the interviews were completed via interviewer-driven sampling in public locations such as libraries, cafés and restaurants, as respondents refused to reveal the contact details of their relatives or friends for network mapping purposes.
7.4 Ireland
The Irish statistical information necessary for sampling was only made available to the fieldwork team in May 2008. This delayed the fieldwork from the outset.
The same fieldwork team as in the UK was contracted to carry out the fieldwork in Ireland. In addition this caused some logistical problems and thus the fieldwork was only able to start in week 25.
According to reports from interviewers in the first few days of fieldwork, the Random Route approach was not going to deliver the number of interviews required in Ireland. The failure of random route was related to the following issues:
- PSUs were issued in areas with a low density of target minorities (however PSUs were allocated in a similar manner as in any other normal type (a) sampling scenario);
- Safety concerns of interviewers in locations where they were required to carry out random route sampling;
- Language difficulties experienced when approaching the minority groups for surveying;
- For the above reasons, retention of interviewers became a serious issue in Ireland.
In week 28 Gallup requested another full week of random route interviewing while ensuring the following conditions:
- Available PSUs were carefully screened to ensure that they were in proper residential areas away from any known ‘danger spots’ (no PSUs were reselected using Google Maps);
- Interviewers left various letters to inform and engage respondents about the objectives of the study in English, Lithuanian and Polish at ‚no contact‘ addresses;
- Fieldwork was focused on evening hours in an effort to capture people when they returned from work.
As a result of these renewed efforts, only 7 interviews were achieved with CEE respondents during �00 interviewing hours; hence the continuing lack of enthusiasm by interviewers to take part in the fieldwork, as, on average, the fieldwork approach had only resulted in a successful interview ‘hit rate’ of � interview for every ��.3 hours in the field.
EU-MIDIS
3�
With a strong commitment to maintain original sampling plans, an experienced supervisor from Gallup Poland (who participated in the Polish EU-MIDIS) was sent to observe the Irish interviewers in action. After spending two full days with various interviewers, she confirmed that interviewing using the random route approach was ineffective.
However given the serious time constraints, in week 3� Gallup – in agreement with the FRA – changed the fieldwork setup considerably:
- Acknowledging that type (a) sampling was not feasible, the sampling approach reverted to type (d) – again, due to the reluctance on the part of interviewees to share contact information about their networks, sampling became interviewer-driven ‘convenience sampling’ at locations typically frequented by target group members.
- Acknowledging that the UK fieldwork team was facing severe challenges in Ireland, and was perhaps over-stretched given it was also managing fieldwork in the UK, a decision was made to replace the UK team.
The decision was to (a) deploy English speaking interviewers from Poland to interview respondents from the CEE groups in Ireland (who were predominantly Polish), and to include interviewers who had taken part in the Polish part of EU-MIDIS, which was already completed at the time of the Irish fieldwork, and (b) to hire a local fieldwork company to complete the survey among Sub-Saharan Africans.
As a precaution, the Polish interviewers were authorised to start interviewing from mid August, given that there were concerns that the fieldwork might not be completed on time. In turn, the Polish interviewers made spectacular progress and finished fieldwork in a period of only 3 weeks. The last Sub-Saharan African interview was made on the 3rd of October.
7.5 The netherlands
Gallup initially sought to use type (a) sampling in the Netherlands. However, early fieldwork reports showed a very slow progress rate for each of the three target groups, which resulted in a significant interviewer attrition rate. Concerns about interviewer safety in some of the allocated PSUs were also an issue.
As the above listed problems did not differ too much from concerns expressed in some other countries where random route and focused enumeration proved to be successful in the long term, Gallup and the FRA requested another few weeks of interviewing using the random route approach while ensuring the following:
- Interviewers worked in pairs with a supervisor being constantly in their neighbourhood.
- In addition new PSUs were issued in higher density areas (25%+ minority density) to facilitate progress, in the hope that the low success rate was at least partly due to PSU placement problems.
Despite the implementation of these agreed actions and the newly issued PSUs, fieldwork did not progress, and it was clear that the interviewers did face particular difficulties with the random route approach.
With the agreement of the FRA, Gallup contracted another team to conduct the remainder of the fieldwork in the Netherlands. Due to timing concerns, the fieldwork was started in parallel in two sampling modes: one complying with type (a) and simultaneously a type (d) plus interviewer-generated sampling mode. By the final deadline for fieldwork completion of 5th October, a large number of interviews were successfully completed using both methods (again confirming the very low success rates with type (a)). However, there was a shortfall in the desired target of �,500 interviews for the Netherlands, with the final number being �,373.
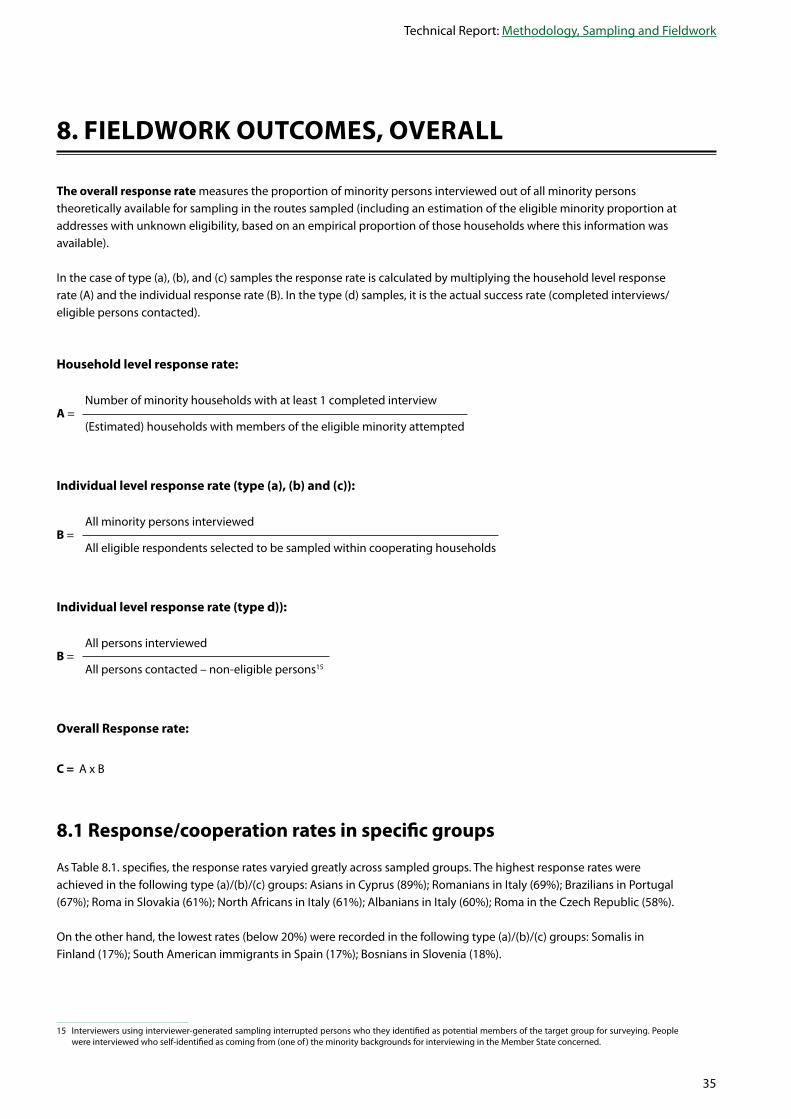
Technical Report: Methodology, Sampling and Fieldwork
35
8. fIElDWorK oUTCoMES, ovErall
The overall response rate measures the proportion of minority persons interviewed out of all minority persons theoretically available for sampling in the routes sampled (including an estimation of the eligible minority proportion at addresses with unknown eligibility, based on an empirical proportion of those households where this information was available).
In the case of type (a), (b), and (c) samples the response rate is calculated by multiplying the household level response rate (A) and the individual response rate (B). In the type (d) samples, it is the actual success rate (completed interviews/eligible persons contacted).
Household level response rate:
a =Number of minority households with at least � completed interview
(Estimated) households with members of the eligible minority attempted
Individual level response rate (type (a), (b) and (c)):
b =All minority persons interviewed
All eligible respondents selected to be sampled within cooperating households
Individual level response rate (type d)):
b =All persons interviewed
All persons contacted – non-eligible persons�5
overall response rate:
C = A x B
8.1 response/cooperation rates in specific groups
As Table 8.�. specifies, the response rates varyied greatly across sampled groups. The highest response rates were achieved in the following type (a)/(b)/(c) groups: Asians in Cyprus (89%); Romanians in Italy (69%); Brazilians in Portugal (67%); Roma in Slovakia (6�%); North Africans in Italy (6�%); Albanians in Italy (60%); Roma in the Czech Republic (58%).
On the other hand, the lowest rates (below 20%) were recorded in the following type (a)/(b)/(c) groups: Somalis in Finland (�7%); South American immigrants in Spain (�7%); Bosnians in Slovenia (�8%).
�5 Interviewers using interviewer-generated sampling interrupted persons who they identified as potential members of the target group for surveying. People were interviewed who self-identified as coming from (one of ) the minority backgrounds for interviewing in the Member State concerned.

EU-MIDIS
36
Table 8.1. response rates
Minority group
response rate on HH level (a)
response rate on Individual level (b)
overall response rate (C) = (a) X (b)
Type a) (0.49) (0.76) (0.38)AT Ex-Yugoslavia 0.53 0.86 0.�6AT Turkish 0.53 0.83 0.��BE North Africans 0.32 0.79 0.25BE Turkish 0.�5 0.8� 0.38EE Russian 0.57 0.89 0.5�EL Albanian 0.50 0.70 0.35EL Roma 0.56 0.6� 0.3�ES North African 0.�� 0.59 0.26ES Romanian 0.�0 0.58 0.23ES S-American 0.30 0.57 0.�7FR North African 0.36 0.70 0.25FR SS-African 0.39 0.67 0.26HU Roma 0.�2 0.8� 0.3�IT Albanian 0.67 0.89 0.60IT North African 0.7� 0.86 0.6�IT Romanian 0.76 0.9� 0.69LT Russian 0.6� 0.90 0.58LV Russian 0.60 0.86 0.52NL North African RR 0.28 0.79 0.22NL Surinamese RR 0.28 0.75 0.2�NL Turkish RR 0.27 0.77 0.2�PT Brazilian 0.79 0.85 0.67PT SS-African 0.78 0.62 0.�9SI Bosnian 0.28 0.65 0.�8SI Serbian 0.33 0.63 0.2�
Type b) (0.41) (0.74) (0.31)DE Ex-Yugoslavia 0.�8 0.78 0.38DE Turkish 0.�6 0.8� 0.37DK Somali 0.�� 0.73 0.30DK Turkish 0.�3 0.70 0.30FI Russian 0.33 0.7� 0.2�FI Somali 0.27 0.6� 0.�7LU Ex-Yugoslavia 0.5� 0.78 0.�0
Type c) (0.72) (0.81) (0.58)BG Roma 0.80 0.69 0.55BG Turkish 0.7� 0.68 0.�8CY Asians 0.90 0.99 0.89CZ Roma 0.62 0.9� 0.58PL Roma 0.60 0.86 0.5�RO Roma 0.73 0.6� 0.�6SK Roma 0.69 0.89 0.6�

Technical Report: Methodology, Sampling and Fieldwork
37
Minority group
response rate on HH level (a)
response rate on Individual level (b)
overall response rate (C) = (a) X (b)
Type d) (0.54) (0.54)IE CEE 0.59 0.59IE SS-African 0.59 0.59MT Africans 0.32 0.32NL North African NS 0.85 0.85NL Surinamese NS 0.87 0.87NL Turkish NS 0.86 0.86SE Iraqi 0.26 0.26SE Somali 0.23 0.23UK CEE 0.27 0.27
In order to gain a better insight into sampling efficiency, response rates were calculated for each of the sample types (a) – (d) (see the averages in blue on Table 8.�.).
The best response rates were recorded in type (c) samples (58%), when nationwide random route sampling was used in areas with a high density of mostly indigenous (predominantly Roma) minorities (in Bulgaria and in Poland fieldwork facilitators – e.g. community leaders, other trusted persons – were also used in order to gain access to potential participant groups).
There was no significant difference on average in response rates between national registry based (type b) urban samples (3�%) and focused enumeration-assisted random route urban samples (38%).
Samples obtained in interviewer-generated situations produced the second highest response rate overall – type (d): 5�%. As respondents in type (d) were sampled in selected locations, the basis of the response rate calculation was limited to the number of eligible people approached in these locations versus the number of interviews completed.
8.2 Screening efficiency
As indicated, type (a) and type (c) samples have response rates in close range to one another. The difference lies in the work which was necessary to identify households with eligible minority residents. Such screening efficacy is detailed in Table 8.2. Please note that attempts include the number of households / dwelling units that were contacted at least once (not including the recalls which were necessary).
Table 8.2. Screening efficiency, by country
attempts interviews attempts per interviewSlovenia 7��� �003 7.�Sweden 602� �00� 6.0Spain 8�85 �536 5.5United Kingdom �903 �0�2 �.7Greece ��30 �033 �.0Portugal 389� �0�5 3.8Finland 3�62 �05� 3.3France 3268 �023 3.2Malta �55� 500 3.�Italy 3973 �5�5 2.6Ireland 27�� ���2 2.5Austria 2597 ��27 2.3Belgium 233� �08� 2.2Netherlands 2889 �377 2.�

EU-MIDIS
38
attempts interviews attempts per interviewRomania �0�2 500 2.�Cyprus �032 505 2.0Hungary 968 500 �.9Denmark �970 ���7 �.8Slovakia 863 500 �.7Estonia 825 500 �.7Bulgaria �533 �000 �.5Lithuania 7�6 5�5 �.�Luxembourg 7�� 500 �.�Latvia 707 500 �.�Germany �2�2 �00� �.2Poland �38 500 0.9Czech Republic �28 505 0.8
The most attempts per successful interview were required in Slovenia (7.�). Generally these figures were rather high across all countries where type (a) sampling was adopted (these rates were significantly higher if we consider households identified, as in the same household up to three interviews could be made – hence rates below � in some countries at the bottom of the ranking).
9. fIElDWorK oUTCoMES, by CoUnTry
Below we provide summaries for each participating country, giving quantitative assessments concerning the fieldwork.
9.1 aUSTrIa
9.1.1 HH-level response rates
In total 2,597 door addresses were visited by the interviewers. Interviewers did not manage to contact households at 35% of these addresses.
Out of all the contacted households, interviewers were able to carry out at least � full interview at each of 667 households (39%).
TargET groUpS: TURKISH, EX-YUGOSLAV fieldwork period: 6 May - �7 July Coverage: Vienna
Targeted sample size1000
actual sample size1127
by minority534 593
Turkish Ex-Yugoslav

Technical Report: Methodology, Sampling and Fieldwork
39
Table 9.1.1 final status code
freq. %Wrong address/no follow up 208 8Address is not residential �30 5Address is not occupied (empty, second home, etc) 35 �Address abandoned due to PSU replacement � 0Address already visited 0 0Other problems that prevent interviewing at the address �2 2no contact with household 691 27Unsuccessful attempt to get inside the building, contact the household �57 6Nobody at home 53� 2�Contact with the HH, but recontact not possible 149 6Hard refusal by household 66 3HH permanently ill � 0HH in an institution 0 0Language barrier 25 �HH is not capable (mentally or physically disabled) 0 0HH is not available till the end of the fieldwork 53 2HH unavailable, for other reasons � 0recontact possible, but no successful screener 1 0Soft refusal by household � 0HH is not available at the moment 0 0HH wants to verify project 0 0Contact with the HH, successful pre-screener 881 34Minority, but not eligible 57 2Applicable for majority population survey 698 27Out of quota �26 5Contact with HH resulted in successful interview(s) 667 26Total 2597 100
9.1.2 respondent level response rates
In total, �,328 persons from 667 households were found to be eligible for interviewing on the basis of their minority background. Once selected for interviewing, 85% of potential interviewees agreed to be interviewed. Most of those not interviewed were ill and incapable of being interviewed.
Table 9.1.2 final status code of eligible respondents in 667 householdsTotal Turkish Ex-yUfreq. % freq. % freq. %
Unsuccessful interviews 201 15 106 17 95 14The person is permanently away 20 2 �3 2 7 �The person is ill, incapable of the interview till the end of fieldwork
��6 �� 70 �� 76 ��
The person does not speak the interview language �9 � �3 2 6 �Respondent refuses co-operation �5 � 9 � 6 �Unable to conduct interview due to language difficulties � 0 � 0 0 0respondents agreed to be interviewed 1127 85 534 83 593 86Total 1328 100 640 100 688 100
The average number of interviews carried out per household was �.7

EU-MIDIS
�0
9.1.3 recalls
In total �,097 visits were made by the interviewers, out of which �,500 (37%) were revisits.
Table 9.1.3 number of contacts
freq. %�st visit 2597 632nd visit 792 �93rd visit 708 �7Total number 4097 100
9.1.4 post interview section
Table 9.1.4 Type of neighbourhood
predominantly immigrant predominantly poorneighbourhood freq. % freq. %Yes 39� 35 ��3 �3No �66 �5 ��7 37Mixed 570 5� 567 50Total 1127 100 1127 100
Respondent had any difficulty when answering questions:
Table 9.1.5 Difficulty when answering
Total Turkish Ex-yugofreq. % freq. % freq. %
no 645 57 243 46 402 68Yes-language 339 30 2�6 �0 �23 2�Yes-nature of questions 28� 25 �70 32 ��� �9Yes-other reasons 22 2 �3 2 9 2base 1127 114* 534 120* 593 109** Multiple answers were possible
Need for using the minority language questionnaires (Turkish and Serbian):
Turkish (534) Ex-yugoslavian (593)
yes 20%
no 80%
yes 7%
no 93%

Technical Report: Methodology, Sampling and Fieldwork
��
9.2 bElgIUM
9.2.1 HH-level response rates
In total 2,33� door addresses were visited by the interviewers. Interviewers did not manage to contact households at 29% of these addresses.
Out of all the contacted households, interviewers were able to carry out at least � full interview at each of 629 households (38%).
Table 9.2.1 final status code
freq. %Wrong address/no follow up 277 12Address is not residential 222 �0Address is not occupied (empty, second home, etc) �� 2Address abandoned due to PSU replacement 0 0Address already visited � 0Other problems that prevent interviewing at the address �0 0no contact with household 406 17Unsuccessful attempt to get inside the building, contact the household 6 0Nobody at home �00 �7Contact with the HH, but recontact not possible 579 25Hard refusal by household ��5 �8HH permanently ill 6 0HH in an institution 39 2Language barrier 7� 3HH is not capable (mentally or physically disabled) � 0HH is not available till the end of the fieldwork 3� �HH unavailable, for other reasons �3 �recontact possible, but no successful screener 114 5Soft refusal by household 75 3HH is not available at the moment 35 2HH wants to verify project � 0Contact with the HH, successful pre-screener 321 14Minority, but not eligible �3 2Applicable for majority population survey �62 7Out of quota ��6 5Missed appointment 5 0Contact with HH resulted in successful interview(s) 629 27Total 2331 100
TargET groUpS: NORTH AFRICAN, TURKISH fieldwork period: 28 April – 29 August Summer break: 22 July – 25 August Coverage: Brussels, Antwerp, Liege
Targeted sample size1000
actual sample size1032
by minority500 532
North African Turkish
other Sub-Saharan african/black-Caribbean interviews: 52 Majority interviews: 527

EU-MIDIS
�2
9.2.2 respondent level response rates
In total, �,265 persons from 629 households were found to be eligible for interviewing on the basis of their minority background. Once selected for interviewing, 8�% of potential interviewees agreed to be interviewed. Most of those not interviewed refused co-operation.
Table 9.2.2 final status code of eligible respondents in 629 households
Total north african Turkishfreq. % freq. % freq. %
Unsuccessful interviews 249 19 132 21 101 16The person is permanently away 55 � 25 � 28 �The person is ill, incapable of the interview till the end of fieldwork
7 � � � 3 0
The person does not speak the interview language 2� 2 �2 2 �2 2Respondent is not at home �7 � 2� � �7 3Respondent is at home, but prefers to be interviewed later 7 � 6 � � 0Respondent is temporarily not able to answer (sick, etc.) 2 0 0 0 � 0Respondent refuses co-operation 9� 7 53 8 3� 5Respondent does not consider him/herself as having an immigrant/minority background
3 0 � 0 2 0
Respondent refuses co-operation 3 0 2 0 � 0Unable to conduct interview due to language difficulties 7 � 5 � 2 0respondents agreed to be interviewed 1084 81 500 79 532 84Total 1333 100 632 100 633 100
The average number of interviews carried out per household was �.7
9.2.3 recalls
In total 2,973 visits were made by the interviewers, out of which 6�2 (22%) were revisits.
Table 9.2.3 number of contacts
freq. %�st visit 233� 782nd visit �60 �53rd visit �82 6Total number 2973 100
9.2.4 post interview section
Type of neighbourhood:
Table 9.2.4 neighbourhood
predominantly immigrant predominantly poorfreq. % freq. %
Yes 770 7� �38 �0No �3 � 22� 20Mixed 27� 25 �25 39Total 1084�6 100 1084 100
�6 The base is the total number of minority interviews conducted including the interviews with ‘Other’ Black Africans’.

Technical Report: Methodology, Sampling and Fieldwork
�3
Respondent had any difficulty when answering questions:
Table 9.2.5 Difficulty when answering
Total north african Turkishfreq. % freq. % freq. %
no 788 73 389 78 363 68Yes-language �36 �3 �3 9 8� �6Yes-nature of questions �7� �6 70 �� 90 �7Yes-other reasons 35 3 �3 3 3� 6base 1084� 105* 500 104* 532 107** Multiple answers were possible
Need for using the minority language questionnaires (Arabic and Turkish):
9.3 bUlgarIa
9.3.1 HH-level response rates
In total �,533 door addresses were visited by the interviewers. Interviewers did not manage to contact households at 8% of these addresses.
Out of all the contacted households, interviewers were able to carry out at least � full interview at each of 6�5 households (�6%).
Table 9.3.1 final status codefreq. %
Wrong address/no follow up 52 3Address is not residential �7 �Address is not occupied (empty, second home, etc) 3� 2Address abandoned due to PSU replacement � 0Address already visited 0 0
north african (500) Turkish (532)
yes 3%
no 97%
yes 7%
no 93%
TargET groUpS: ROMA, TURKISH fieldwork period: �2 May – �7 June Coverage: Nationwide
Targeted sample size1000
actual sample size1000
by minority500 500
Roma Turkish
Majority interviews: 500

EU-MIDIS
��
freq. %Other problems that prevent interviewing at the address 3 0no contact with household 71 5Unsuccessful attempt to get inside the building, contact the household �7 �Nobody at home 5� �Contact with the HH, but recontact not possible 193 13Hard refusal by household �65 ��HH permanently ill � 0HH in an institution 0 0Language barrier 9 �HH is not capable (mentally or physically disabled) � 0HH is not available till the end of the fieldwork 7 0HH unavailable, for other reasons 7 0recontact possible, but no successful screener 8 1Soft refusal by household 2 0HH is not available at the moment 6 0HH wants to verify project 0 0Contact with the HH, successful pre-screener 564 37Minority, but not eligible 29 2Applicable for majority population survey 5�0 33Out of quota 25 2Missed appointment 0 0Contact with HH resulted in successful interview(s) 645 42Total 1533 100
9.3.2 respondent level response rates
In total, �,�62 persons from 6�5 households were found to be eligible for interviewing on the basis of their minority background. Once selected for interviewing, 68% of potential interviewees agreed to be interviewed. Most of those not interviewed were not at home.
Table 9.3.2 final status code of eligible respondents in 645 households
Total roma Turkishfinal status code of eligible respondents in 645 households
freq. % freq. % freq. %
Unsuccessful interviews 462 32 225 31 237 32The person is permanently away 66 5 35 5 3� �The person is ill, incapable of the interview till the end of fieldwork 37 3 �3 2 2� 3The person does not speak the interview language �� � 0 0 �� �Respondent is not at home �86 �3 98 �� 88 �2Respondent is at home, but prefers to be interviewed later �8 � �� 2 7 �Respondent is temporarily not able to answer (sick, etc.) 7 0 � � 3 0Respondent refuses co-operation �27 9 58 8 69 9Respondent does not consider him/herself as having an immigrant/minority background
� 0 � 0 0 0
Respondent is not eligible for other grounds (less than one year stay, or less than �6 years of age)
� 0 3 0 � 0
Unable to conduct interview due to language difficulties 5 0 2 0 3 0respondents agreed to be interviewed 1000 68 500 69 500 68Total 1462 100 725 100 737 100
The average number of interviews carried out per household was: �.6

Technical Report: Methodology, Sampling and Fieldwork
�5
9.3.3 recalls
In total �,78� visits were made by the interviewers, out of which 25� (��%) were revisits.
Table 9.3.3 number of contacts
freq. %�st visit �533 862nd visit �85 �03rd visit 66 �Total number 1784 100
9.3.4 post interview section
Type of neighbourhood:
Table 9.3.4 neighbourhood
predominantly immigrant predominantly poorfreq. % freq. %
Yes 673 67 277 28No 98 �0 �55 �6Mixed 229 23 268 27Total 1000 100 1000 100
Respondent had any difficulty when answering questions:
Table 9.3.5 Difficulty when answering
Total roma Turkishfreq. % freq. % freq. %
no 809 81 396 79 413 83Yes-language 50 5 2� 5 26 5Yes-nature of questions ��7 �5 8� �7 63 �3Yes-other reasons 7 � 6 � � 0base 1000 101 500 102 500 101* Multiple answers were possible
Need for using the minority language questionnaire (Turkish):
Turkish (532)
yes 3%
no 97%
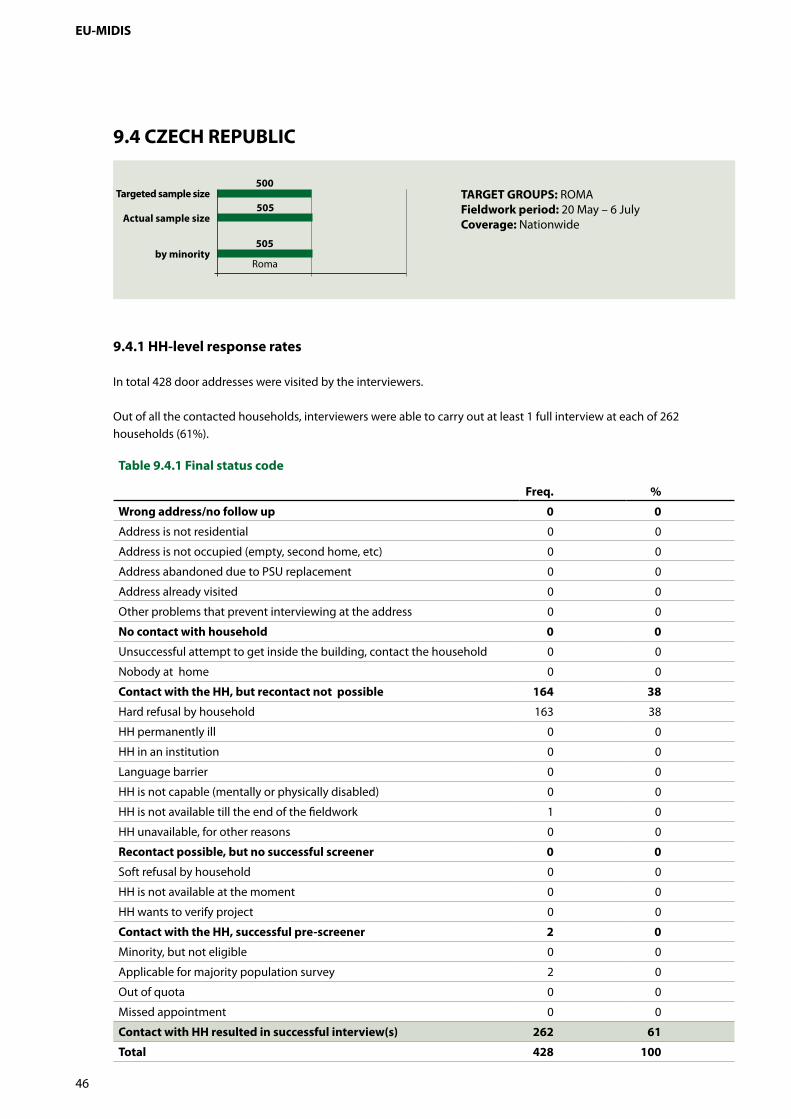
EU-MIDIS
�6
9.4 CZECH rEpUblIC
9.4.1 HH-level response rates
In total �28 door addresses were visited by the interviewers.
Out of all the contacted households, interviewers were able to carry out at least � full interview at each of 262 households (6�%).
Table 9.4.1 final status code
freq. %
Wrong address/no follow up 0 0
Address is not residential 0 0
Address is not occupied (empty, second home, etc) 0 0
Address abandoned due to PSU replacement 0 0
Address already visited 0 0
Other problems that prevent interviewing at the address 0 0
no contact with household 0 0
Unsuccessful attempt to get inside the building, contact the household 0 0
Nobody at home 0 0
Contact with the HH, but recontact not possible 164 38
Hard refusal by household �63 38
HH permanently ill 0 0
HH in an institution 0 0
Language barrier 0 0
HH is not capable (mentally or physically disabled) 0 0
HH is not available till the end of the fieldwork � 0
HH unavailable, for other reasons 0 0
recontact possible, but no successful screener 0 0
Soft refusal by household 0 0
HH is not available at the moment 0 0
HH wants to verify project 0 0
Contact with the HH, successful pre-screener 2 0
Minority, but not eligible 0 0
Applicable for majority population survey 2 0
Out of quota 0 0
Missed appointment 0 0
Contact with HH resulted in successful interview(s) 262 61
Total 428 100
TargET groUpS: ROMA fieldwork period: 20 May – 6 July Coverage: Nationwide
Targeted sample size500
actual sample size505
by minority505
Roma

Technical Report: Methodology, Sampling and Fieldwork
�7
9.4.2 respondent level response rates
In total, 539 persons from 262 households were found to be eligible for interviewing on the basis of their minority background. Once selected for interviewing. 9�% of potential interviewees agreed to be interviewed. Most of those not interviewed either were not at home or did not consider him/herself as having an immigrant/minority background.
Table 9.4.2 final status code of eligible respondents in 262 households
freq. %Unsuccessful interviews 34 6The person is permanently away 8 �The person is ill, incapable of the interview till the end of fieldwork 3 �Respondent is not at home 9 2Respondent is temporarily not able to answer (sick, etc.) 3 �Respondent does not consider him/herself as having an immigrant/minority background
9 2
Respondent is not eligible for other grounds (less than one year stay, or less than �6 years of age)
� 0
Unable to conduct interview due to language difficulties � 0respondents agreed to be interviewed 505 94Total 539 100
The average number of interviews carried out per household is: �.9. The number of completes in the 262 households are as follows:
33% = 3 interviews, 27%=2 interviews and �0%=� interview.
9.4.3 recalls
In total �6� visits were made by the interviewers, out of which 36 (8%) were revisits.
Table 9.4.3 number of contacts17
freq. %�st visit �28 922nd visit 29 63rd visit 7 2Total number 464 100
9.4.4 post interview section
Type of neighbourhood:
Table 9.4.4 neighbourhood
predominantly immigrant predominantly poorfreq. % freq. %
Yes �60 32 96 �9No �85 37 275 5�Mixed �60 32 �3� 27Total 505 100 505 100
�7 The low number of revisits was clarified by the fieldwork team: “The explanation is that if the Roma allowed the interviewer into their home, they were quite cooperative and in 6 out of �0 households more than � person agreed to be interviewed. They were usually at home during interviewing hours, so the vast majority of these interviews took place at the first visit. On the other hand if the Roma refused to participate, their refusal was hard, so no revisit was possible.”

EU-MIDIS
�8
Respondent had any difficulty when answering questions:
Table 9.4.5 Difficulty when answering
freq. %no 344 68Yes-language 3 �Yes-nature of questions �23 2�Yes-other reasons �7 9base 505 102** Multiple answers were possible
9.5 CyprUS
9.5.1 HH-level response rates
In total �,032 door addresses were visited by the interviewers. Interviewers did not manage to contact households at 9% of these addresses.
Out of all the contacted households, interviewers were able to carry out at least � full interview at each of �8� households (5�%).
Table 9.5.1 final status code
freq. %
Wrong address/no follow up 81 8
Address is not residential 33 3
Address is not occupied (empty, second home, etc) 3� 3
Address abandoned due to PSU replacement 0 0
Address already visited 0 0
Other problems that prevent interviewing at the address �� �
no contact with household 6 1
Unsuccessful attempt to get inside the building, contact the household 0 0
Nobody at home 6 �
Contact with the HH, but recontact not possible 50 5
Hard refusal by household 37 �
HH permanently ill 0 0
HH in an institution � 0
TargET groUpS: ASIANS�8 fieldwork period: �0 May – 22 June Coverage: Nationwide
Targeted sample size500
actual sample size500
by minority500
Asians
other Sub-Saharan african/black-Caribbean interviews: 5
�8 The term ‘Asian’ encompassed in the main: �9� Sri Lankans, �29 Philippinos, 5� Indians, 50 Bangladeshis, and 27 Pakistanis.

Technical Report: Methodology, Sampling and Fieldwork
�9
freq. %
Language barrier 8 �
HH is not capable (mentally or physically disabled) 0 0
HH is not available till the end of the fieldwork � 0
HH unavailable, for other reasons 3 0
recontact possible, but no successful screener 0 0
Soft refusal by household 0 0
HH is not available at the moment 0 0
HH wants to verify project 0 0
Contact with the HH, successful pre-screener 411 40
Minority, but not eligible 27 3
Applicable for majority population survey 38� 37
Out of quota 0 0
Missed appointment 0 0
Contact with HH resulted in successful interview(s) 484 47
Total 1032 100
9.5.2 respondent level response rates
In total, 507 persons from �8� households were found to be eligible for interviewing on the basis of their minority background. Once selected for interviewing, 98% of potential interviewees agreed to be interviewed. Most of those not interviewed refused co-operation.
Table 9.5.2 final status code eligible respondents in 484 households
freq. %Unsuccessful interviews 8 2Respondent is at home, but prefers to be interviewed later � 0Respondent refuses co-operation 5 �Unable to conduct interview due to language difficulties � 0respondents agreed to be interviewed 505 98Total 513 100
The average number of interviews carried out per household is: �.0
9.5.3 recalls
In total �,�36 visits were made by the interviewers, out of which �0� (9%) were revisits. The low number of revisits stems from the fact that most of the interviews were conducted with Asian housekeepers who reside and work in the house of their employers and, therefore, were mainly at home during interviewing hours. The majority of participants showed interest in the survey and were forthcoming with their cooperation on the project. Out of all participating countries, Cyprus achieved the highest response and cooperation rate.
Table 9.5.3 number of contacts
freq. %�st visit �032 9�2nd visit 93 83rd visit �� �Total number 1136 100

EU-MIDIS
50
9.5.4 post interview section
Type of neighbourhood:
Table 9.5.4 neighbourhood
predominantly immigrant predominantly poorfreq. % freq. %
Yes 80 �6 203 �0No 295 58 �99 39Mixed �30 26 �03 20Total 505�9 100 505 100
Respondent had any difficulty when answering questions:
Table 9.5.5 Difficulty when answeringfreq. %
no 189 38Yes-language �63 33Yes-nature of questions ��� 29Yes-other reasons �� 8base 505� 107** Multiple answers were possible
Need for using the minority language questionnaires (English and Philippines):
9.6 DEnMarK
yes 41%
no 59%
English 31%
philippines 10%
TargET groUpS: TURKISH, SOMALI fieldwork period: �9 May – 27 October Summer break: 22 July – �8 August Coverage: Copenhagen, Odense
Targeted sample size1000
actual sample size1114
by minority553 561
Turkish Somali
other Sub-Saharan african/black-Caribbean interviews: 3
�9 The base is the total number of minority interviews conducted including the interviews with ‘Other’ Black Africans’.

Technical Report: Methodology, Sampling and Fieldwork
5�
9.6.1 HH-level response rates
In total �,970 door addresses were visited by the interviewers. Interviewers did not manage to contact households at 32% of these addresses.
Out of all the contacted households, interviewers were able to carry out at least � full interview at each of 758 households (58%).
Table 9.6.1 final status code
freq. %Wrong address/no follow up 150 8Address is not residential 0 0Address is not occupied (empty, second home, etc) �23 6Address abandoned due to PSU replacement 0 0Address already visited 0 0Other problems that prevent interviewing at the address 27 �no contact with household 476 24Unsuccessful attempt to get inside the building, contact the household 37 2Nobody at home �39 22Contact with the HH, but recontact not possible 496 25Hard refusal by household 3�6 �8HH permanently ill �0 �HH in an institution 3 0Language barrier 69 �HH is not capable (mentally or physically disabled) �� �HH is not available till the end of the fieldwork �3 2HH unavailable, for other reasons �� �recontact possible, but no successful screener 55 3Soft refusal by household 22 �HH is not available at the moment 32 2HH wants to verify project � 0Contact with the HH, successful pre-screener 0 0Minority, but not eligible 0 0Applicable for majority population survey 0 0Out of quota 0 0Missed appointment 35 2Contact with HH resulted in successful interview(s) 758 38Total 1970 98
9.6.2 respondent level response rates
In total, �,553 persons from 758 households were found to be eligible for interviewing on the basis of their minority background. Once selected for interviewing, 72% of potential interviewees agreed to be interviewed. Most of those not interviewed refused co-operation.
Table 9.6.2 final status code of eligible respondents in 758 households
Total Turkish Somalifreq. % freq. % freq. %
Unsuccessful interviews 440 28 236 30 203 27The person is permanently away 35 2 23 3 �2 2The person is ill, incapable of the interview till the end of fieldwork 6 0 2 0 � �
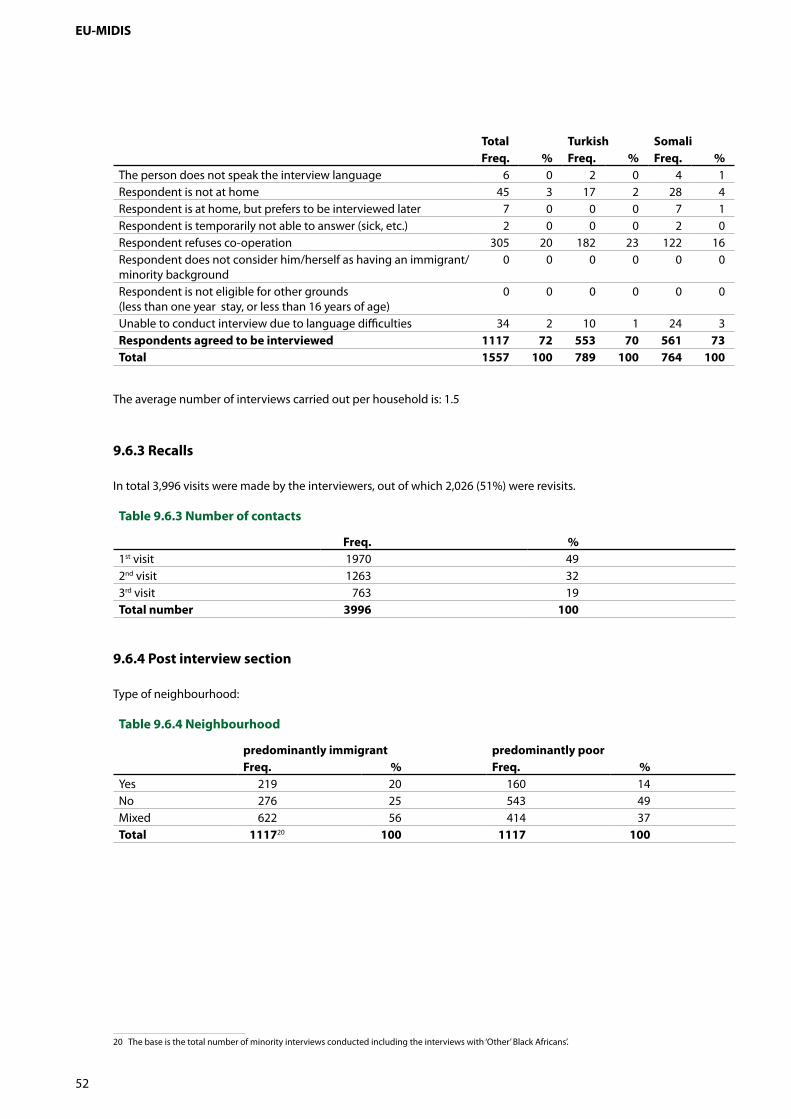
EU-MIDIS
52
Total Turkish Somalifreq. % freq. % freq. %
The person does not speak the interview language 6 0 2 0 � �Respondent is not at home �5 3 �7 2 28 �Respondent is at home, but prefers to be interviewed later 7 0 0 0 7 �Respondent is temporarily not able to answer (sick, etc.) 2 0 0 0 2 0Respondent refuses co-operation 305 20 �82 23 �22 �6Respondent does not consider him/herself as having an immigrant/minority background
0 0 0 0 0 0
Respondent is not eligible for other grounds (less than one year stay, or less than �6 years of age)
0 0 0 0 0 0
Unable to conduct interview due to language difficulties 3� 2 �0 � 2� 3respondents agreed to be interviewed 1117 72 553 70 561 73Total 1557 100 789 100 764 100
The average number of interviews carried out per household is: �.5
9.6.3 recalls
In total 3,996 visits were made by the interviewers, out of which 2,026 (5�%) were revisits.
Table 9.6.3 number of contacts
freq. %�st visit �970 �92nd visit �263 323rd visit 763 �9Total number 3996 100
9.6.4 post interview section
Type of neighbourhood:
Table 9.6.4 neighbourhood
predominantly immigrant predominantly poorfreq. % freq. %
Yes 2�9 20 �60 ��No 276 25 5�3 �9Mixed 622 56 ��� 37Total 111720 100 1117 100
20 The base is the total number of minority interviews conducted including the interviews with ‘Other’ Black Africans’.

Technical Report: Methodology, Sampling and Fieldwork
53
Respondent had any difficulty when answering questions:
Table 9.6.5 Difficulty when answering
Total Turkish Somalifreq. % freq. % freq. %
no 731 65 363 66 367 65Yes-language �99 �8 9� �6 �08 �9Yes-nature of questions 273 2� �29 23 ��2 25Yes-other reasons 55 5 2� � 3� 6base 1117� 113* 553 109* 561 116** Multiple answers were possible
Need for using the minority language questionnaires (Turkish and Somali):
9.7 ESTonIa
9.7.1 HH-level response rates
In total 825 door addresses were visited by the interviewers. Interviewers did not manage to contact households at 6% of these addresses.
Out of all the contacted households, interviewers were able to carry out at least � full interview at each of 288 households (37%).
Table 9.7.1 final status code
freq. %Wrong address/no follow up 9 1Address is not residential 7 �Address is not occupied (empty, second home, etc) 2 0Address abandoned due to PSU replacement 0 0
Turkish (553) Somali (561)
yes 14%
no 86%
yes 10%
no 90%
TargET groUpS: RUSSIAN fieldwork period: �2 May – 0� September Summer break: 22 July – 25 August Coverage: Tallinn
Targeted sample size500
actual sample size500
by minority500
Russian

EU-MIDIS
5�
freq. %Address already visited 0 0Other problems that prevent interviewing at the address 0 0no contact with household 44 5Unsuccessful attempt to get inside the building, contact the household 2 0Nobody at home �2 5Contact with the HH, but recontact not possible 173 21Hard refusal by household �7� 2�HH permanently ill � 0HH in an institution 0 0Language barrier 0 0HH is not capable (mentally or physically disabled) � 0HH is not available till the end of the fieldwork 0 0HH unavailable, for other reasons 0 0recontact possible, but no successful screener 0 0Soft refusal by household 0 0HH is not available at the moment 0 0HH wants to verify project 0 0Contact with the HH, successful pre-screener 311 38Minority, but not eligible 8 �Applicable for majority population survey 303 37Out of quota 0 0Missed appointment 0 0Contact with HH resulted in successful interview(s) 288 35Total 825 100
9.7.2 respondent level response rates
In total, 562 persons from 288 households were found to be eligible for interviewing on the basis of their minority background. Once selected for interviewing, 89% of potential interviewees agreed to be interviewed. Most of those not interviewed refused co-operation.
Table 9.7.2 final status code of eligible respondents in 288 households
freq. %Unsuccessful interviews 62 11The person is permanently away 7 �The person is ill, incapable of the interview till the end of fieldwork 0 0The person does not speak the interview language 0 0Respondent is not at home � �Respondent is at home, but prefers to be interviewed later 0 0Respondent is temporarily not able to answer (sick, etc.) 0 0Respondent refuses co-operation 5� 9Respondent does not consider him/herself as having an immigrant/minority background
0 0
Respondent is not eligible for other grounds (less than one year stay, or less than �6 years of age)
0 0
Unable to conduct interview due to language difficulties 0 0respondents agreed to be interviewed 500 89Total 562 100
The average number of interviews carried out per household is: �.7

Technical Report: Methodology, Sampling and Fieldwork
55
9.7.3 recalls
In total �,0�7 visits were made by the interviewers, out of which �92 (�9%) were revisits.
Table 9.7.3 number of contacts
freq. %�st visit 825 8�2nd visit �3� �33rd visit 58 6Total number 1017 100
9.7.4 post interview section
Type of neighbourhood:
Table 9.7.4 neighbourhood
predominantly immigrant predominantly poorfreq. % freq. %
Yes �7 9 5� �0No 22� �� 2�2 �8Mixed 232 �6 207 ��Total 500 100 500 100
Respondent had any difficulty when answering questions:
Table 9.7.5 Difficulty when answering
freq. %no 494 99Yes-language 0 0Yes-nature of questions 6 �Yes-other reasons 0 0base 500 100
9.8 fInlanD
TargET groUpS: RUSSIAN, SOMALI fieldwork period: �8 April – 25 August Summer break: 22 July – �8 August Coverage: Helsinki, metro area
Targeted sample size1000
actual sample size1046
by minority562 484
Russian Somali
other Sub-Saharan african/black-Caribbean interviews: 5

EU-MIDIS
56
9.8.1 HH-level response rates
In total 3,�62 door addresses were visited by the interviewers. Interviewers did not manage to contact households at 38% of these addresses.
Out of all the contacted households, interviewers were able to carry out at least � full interview at each of 963 households (5�%).
Table 9.8.1 final status code
freq. %Wrong address/no follow up 223 6Address is not residential �67 5Address is not occupied (empty, second home, etc) 0 0Address abandoned due to PSU replacement � 0Address already visited 27 �Other problems that prevent interviewing at the address 28 �no contact with household 1110 32Unsuccessful attempt to get inside the building, contact the household 983 28Nobody at home �27 �Contact with the HH, but recontact not possible 809 23Hard refusal by household 559 �6HH permanently ill � 0HH in an institution 0 0Language barrier �23 �HH is not capable (mentally or physically disabled) 9 0HH is not available till the end of the fieldwork 93 3HH unavailable, for other reasons 2� �recontact possible, but no successful screener 96 3Soft refusal by household 57 2HH is not available at the moment 3� �HH wants to verify project 5 0Contact with the HH, successful pre-screener 26 1Minority, but not eligible �7 0Applicable for majority population survey 6 0Out of quota 3 0Missed appointment 235 7Contact with HH resulted in successful interview(s) 963 28Total 3462 93
9.8.2 respondent level response rates
In total, �,5�8 persons from 963 households were found to be eligible for interviewing on the basis of their minority background. Once selected for interviewing, 69% of potential interviewees agreed to be interviewed. Most of those not interviewed refused co-operation.
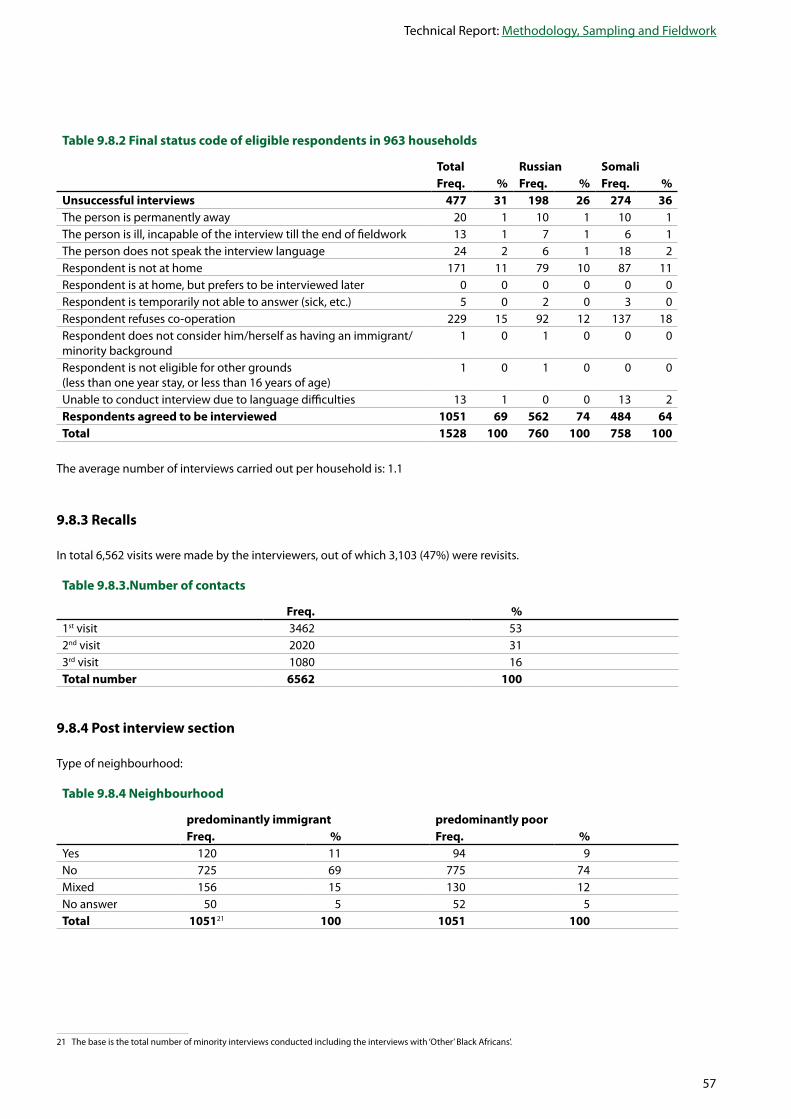
Technical Report: Methodology, Sampling and Fieldwork
57
Table 9.8.2 final status code of eligible respondents in 963 households
Total russian Somalifreq. % freq. % freq. %
Unsuccessful interviews 477 31 198 26 274 36The person is permanently away 20 � �0 � �0 �The person is ill, incapable of the interview till the end of fieldwork �3 � 7 � 6 �The person does not speak the interview language 2� 2 6 � �8 2Respondent is not at home �7� �� 79 �0 87 ��Respondent is at home, but prefers to be interviewed later 0 0 0 0 0 0Respondent is temporarily not able to answer (sick, etc.) 5 0 2 0 3 0Respondent refuses co-operation 229 �5 92 �2 �37 �8Respondent does not consider him/herself as having an immigrant/minority background
� 0 � 0 0 0
Respondent is not eligible for other grounds (less than one year stay, or less than �6 years of age)
� 0 � 0 0 0
Unable to conduct interview due to language difficulties �3 � 0 0 �3 2respondents agreed to be interviewed 1051 69 562 74 484 64Total 1528 100 760 100 758 100
The average number of interviews carried out per household is: �.�
9.8.3 recalls
In total 6,562 visits were made by the interviewers, out of which 3,�03 (�7%) were revisits.
Table 9.8.3.number of contacts
freq. %�st visit 3�62 532nd visit 2020 3�3rd visit �080 �6Total number 6562 100
9.8.4 post interview section
Type of neighbourhood:
Table 9.8.4 neighbourhood
predominantly immigrant predominantly poorfreq. % freq. %
Yes �20 �� 9� 9No 725 69 775 7�Mixed �56 �5 �30 �2No answer 50 5 52 5Total 10512� 100 1051 100
2� The base is the total number of minority interviews conducted including the interviews with ‘Other’ Black Africans’.

EU-MIDIS
58
Respondent had any difficulty when answering questions:
Table 9.8.5 Difficulty when answering
Total russian Somalifreq. % freq. % freq. %
no 705 67 412 73 288 60Yes-language 262 25 �03 �8 �59 33Yes-nature of questions ��3 �� �2 7 53 ��Yes-other reasons 28 2 �� 2 �6 3No answer 39 � 9 2 � �base 1051� 109* 562 103* 484 107** Multiple answers were possible
Need for using the minority language questionnaires (Russian and Somali):
9.9 franCE
9.9.1 HH-level response rates
In total 3,268 door addresses were visited by the interviewers. Interviewers did not manage to contact households at 29% of these addresses.
Out of all the contacted households, interviewers were able to carry out at least � full interview at each of 769 households (33%).
russian (562) Somali (484)
yes 40%
no 60%
yes 21%
no 79%
TargET groUpS: NORTH AFRICANS, SUB-SAHARAN AFRICANS
fieldwork period: 05 May – �5 September Summer break: 22 July – 25 August Coverage: Paris metro, Marseille, Lyon
Targeted sample size1000
actual sample size1000
by minority534 466
North Africans Sub-Saharan Africans
other Sub-Saharan african/black-Caribbean interviews: 23 Majority interviews: 503

Technical Report: Methodology, Sampling and Fieldwork
59
Table 9.9.1 final status code
freq. %Wrong address/no follow up 145 4Address is not residential 89 3Address is not occupied (empty, second home, etc) �9 �Address abandoned due to PSU replacement 0 0Address already visited 0 0Other problems that prevent interviewing at the address 7 0no contact with household 813 25Unsuccessful attempt to get inside the building, contact the household �8 �Nobody at home 765 23Contact with the HH, but recontact not possible 885 27Hard refusal by household 6�2 20HH permanently ill �0 0HH in an institution 7 0Language barrier �95 6HH is not capable (mentally or physically disabled) 3 0HH is not available till the end of the fieldwork �2 0HH unavailable, for other reasons �6 0recontact possible, but no successful screener 34 1Soft refusal by household �6 0HH is not available at the moment �5 0HH wants to verify project 3 0Contact with the HH, successful pre-screener 622 19Minority, but not eligible �20 �Applicable for majority population survey 502 �5Out of quota 0 0Missed appointment 0 0Contact with HH resulted in successful interview(s) 769 24Total 3268 100
9.9.2 respondent level response rates
In total, �,�52 persons from 769 households were found to be eligible for interviewing on the basis of their minority background. Once selected for interviewing, 69% of potential interviewees agreed to be interviewed. Most of those not interviewed refused co-operation.
Table 9.9.2 final status code of eligible respondents in 769 households
Totalnorth africans
Sub-Saharan africans
freq. % freq. % freq. %
Unsuccessful interviews �6� 3� 226 30 226 33
The person is permanently away 60 � 33 � 26 �
The person is ill, incapable of the interview till the end of fieldwork 5 0 2 0 3 0
The person does not speak the interview language �5 � 2 0 �3 2
Respondent is not at home 52 � 37 5 �� 2
Respondent is at home, but prefers to be interviewed later 2� 2 �� � �2 2
Respondent is temporarily not able to answer (sick, etc.) � 0 � � 0 0

EU-MIDIS
60
Totalnorth africans
Sub-Saharan africans
freq. % freq. % freq. %
Respondent refuses co-operation 292 20 �35 �8 �5� 22
Respondent does not consider him/herself as having an immigrant/minority background
� 0 0 0 � 0
Respondent is not eligible for other grounds (less than one year stay, or less than �6 years of age)
0 0 0 0 0 0
Unable to conduct interview due to language difficulties 8 � 2 0 6 �
respondents agreed to be interviewed 1023 69 534 70 466 67
Total 1484 100 760 100 692 100
The average number of interviews carried out per household is: �.3
9.9.3 recalls
In total 3,826 visits were made by the interviewers, out of which 558 (�5%) were revisits.
Table 9.9.3 number of contacts
freq. %�st visit 3268 852nd visit 386 �03rd visit �72 �Total number 3826 100
9.9.4 post interview section
Type of neighbourhood:
Table 9.9.4 neighbourhood
predominantly immigrant predominantly poorfreq. % freq. %
Yes �9� �8 �2� ��No �09 �� �70 �7Mixed �0� 39 �0� 39No answer 22 2 28 3Total 102322 100 1023 100
22 The base is the total number of minority interviews conducted including the interviews with ‘Other’ Black Africans’.

Technical Report: Methodology, Sampling and Fieldwork
6�
Respondent had any difficulty when answering questions:
Table 9.9.5 Difficulty when answering
Total north africans Sub-Saharan africansfreq. % freq. % freq. %
no 721 70 396 74 304 65Yes-language �30 �3 �6 9 83 �8Yes-nature of questions 23� 23 �08 20 �23 26Yes-other reasons 50 5 20 � 30 6No answer 23 2 �� 2 �� 2base 1023� 111* 534 109* 466 118** Multiple answers were possible
9.10 gErMany
9.10.1 HH-level response rates
In total �,2�2 door addresses were visited by the interviewers. Interviewers did not manage to contact households at �7% of these addresses.
Out of all the contacted households, interviewers were able to carry out at least � full interview at each of 565 households (56%).
Table 9.10.1 final status code
freq. %Wrong address/no follow up 121 10Address is not residential 32 3Address is not occupied (empty, second home, etc) �9 �Address abandoned due to PSU replacement 0 0Address already visited 5 0Other problems that prevent interviewing at the address 35 3no contact with household 79 7Unsuccessful attempt to get inside the building, contact the household 2 0Nobody at home 77 6Contact with the HH, but recontact not possible 244 20Hard refusal by household �97 �6HH permanently ill 5 0HH in an institution 0 0Language barrier �7 �HH is not capable (mentally or physically disabled) 2 0
TargET groUpS: TURKISH, EX-YUGOSLAVIAN fieldwork period: �0 May – 30 June Coverage: Berlin, Frankfurt, Munich
Targeted sample size1000
actual sample size1003
by minority503 500
Turkish Ex-Yugoslavian
other Sub-Saharan african/black-Caribbean interviews: � Majority interviews: 50�
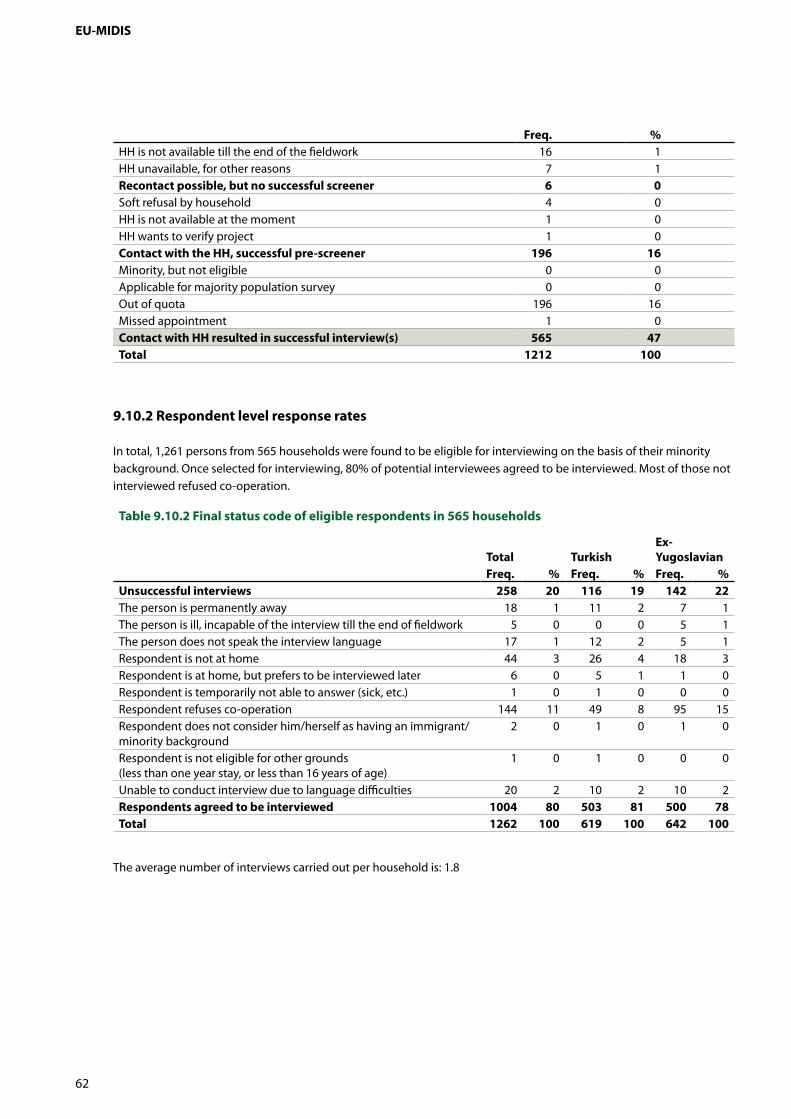
EU-MIDIS
62
freq. %HH is not available till the end of the fieldwork �6 �HH unavailable, for other reasons 7 �recontact possible, but no successful screener 6 0Soft refusal by household � 0HH is not available at the moment � 0HH wants to verify project � 0Contact with the HH, successful pre-screener 196 16Minority, but not eligible 0 0Applicable for majority population survey 0 0Out of quota �96 �6Missed appointment � 0Contact with HH resulted in successful interview(s) 565 47Total 1212 100
9.10.2 respondent level response rates
In total, �,26� persons from 565 households were found to be eligible for interviewing on the basis of their minority background. Once selected for interviewing, 80% of potential interviewees agreed to be interviewed. Most of those not interviewed refused co-operation.
Table 9.10.2 final status code of eligible respondents in 565 households
Total TurkishEx-yugoslavian
freq. % freq. % freq. %Unsuccessful interviews 258 20 116 19 142 22The person is permanently away �8 � �� 2 7 �The person is ill, incapable of the interview till the end of fieldwork 5 0 0 0 5 �The person does not speak the interview language �7 � �2 2 5 �Respondent is not at home �� 3 26 � �8 3Respondent is at home, but prefers to be interviewed later 6 0 5 � � 0Respondent is temporarily not able to answer (sick, etc.) � 0 � 0 0 0Respondent refuses co-operation ��� �� �9 8 95 �5Respondent does not consider him/herself as having an immigrant/minority background
2 0 � 0 � 0
Respondent is not eligible for other grounds (less than one year stay, or less than �6 years of age)
� 0 � 0 0 0
Unable to conduct interview due to language difficulties 20 2 �0 2 �0 2respondents agreed to be interviewed 1004 80 503 81 500 78Total 1262 100 619 100 642 100
The average number of interviews carried out per household is: �.8

Technical Report: Methodology, Sampling and Fieldwork
63
9.10.3 recalls
In total 2,��7 visits were made by the interviewers, out of which 935 (��%) were revisits.
Table 9.10.3 number of contacts
freq. %�st visit �2�2 562nd visit 660 3�3rd visit 275 �3Total number 2147 100
9.10.4 post interview section
Type of neighbourhood:
Table 9.10.4 neighbourhood
predominantly immigrant predominantly poorfreq. % freq. %
Yes 278 28 �29 �3No 2�6 22 36� 36Mixed 5�0 5� 5�� 5�Total 100423 100 1004 100
Respondent had any difficulty when answering questions:
Table 9.10.5 Difficulty when answering
Total Turkish Ex-yugoslavianfreq. % freq. % freq. %
no 722 72 361 72 361 72Yes-language 87 9 �7 9 �0 8Yes-nature of questions 202 20 99 20 �02 20Yes-other reasons �5 � 23 5 22 �base 1004� 105* 503 105* 500 105** Multiple answers were possible
Need for using the minority language questionnaires (Turkish and Serbian):
Turkish (503) Ex-yugoslavian (500)
yes 9%
no 91%
yes 5%
no 95%
23 The base is the total number of minority interviews conducted including the interviews with ‘Other’ Black Africans’.
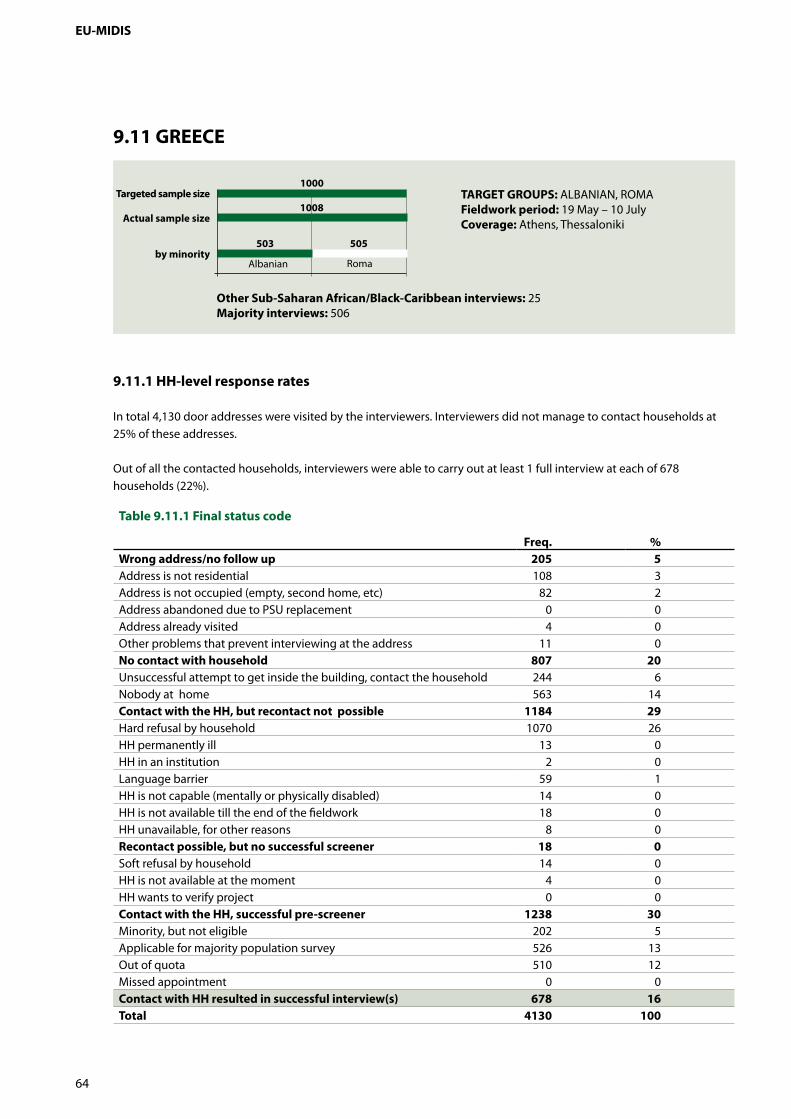
EU-MIDIS
6�
9.11 grEECE
9.11.1 HH-level response rates
In total �,�30 door addresses were visited by the interviewers. Interviewers did not manage to contact households at 25% of these addresses.
Out of all the contacted households, interviewers were able to carry out at least � full interview at each of 678 households (22%).
Table 9.11.1 final status code
freq. %Wrong address/no follow up 205 5Address is not residential �08 3Address is not occupied (empty, second home, etc) 82 2Address abandoned due to PSU replacement 0 0Address already visited � 0Other problems that prevent interviewing at the address �� 0no contact with household 807 20Unsuccessful attempt to get inside the building, contact the household 2�� 6Nobody at home 563 ��Contact with the HH, but recontact not possible 1184 29Hard refusal by household �070 26HH permanently ill �3 0HH in an institution 2 0Language barrier 59 �HH is not capable (mentally or physically disabled) �� 0HH is not available till the end of the fieldwork �8 0HH unavailable, for other reasons 8 0recontact possible, but no successful screener 18 0Soft refusal by household �� 0HH is not available at the moment � 0HH wants to verify project 0 0Contact with the HH, successful pre-screener 1238 30Minority, but not eligible 202 5Applicable for majority population survey 526 �3Out of quota 5�0 �2Missed appointment 0 0Contact with HH resulted in successful interview(s) 678 16Total 4130 100
TargET groUpS: ALBANIAN, ROMA fieldwork period: �9 May – �0 July Coverage: Athens, Thessaloniki
Targeted sample size1000
actual sample size1008
by minority503 505
Albanian Roma
other Sub-Saharan african/black-Caribbean interviews: 25 Majority interviews: 506

Technical Report: Methodology, Sampling and Fieldwork
65
9.11.2 respondent level response rates
In total, �,552 persons from 678 households were found to be eligible for interviewing on the basis of their minority background. Once selected for interviewing, 65% of potential interviewees agreed to be interviewed. Most of those not interviewed refused co-operation.
Table 9.11.2 final status code of eligible respondents in 678 households
Total albanian romafreq. % freq. % freq. %
Unsuccessful interviews 566 35 219 30 325 39The person is permanently away 3� 2 �5 2 �8 2The person is ill, incapable of the interview till the end of fieldwork �2 � 2 0 �0 �The person does not speak the interview language �3 � 2 0 � 0Respondent is not at home �85 �2 97 �3 82 �0Respondent is at home, but prefers to be interviewed later 0 0 0 0 0 0Respondent is temporarily not able to answer (sick, etc.) 0 0 0 0 0 0Respondent refuses co-operation 299 �9 97 �3 �96 2�Respondent does not consider him/herself as having an immigrant/minority background
0 0 0 0 0 0
Respondent is not eligible for other grounds (less than one year stay, or less than �6 years of age)
� 0 0 0 � 0
Unable to conduct interview due to language difficulties 22 � 6 � �� 2respondents agreed to be interviewed 1033 65 503 70 505 61Total 1599 100 722 100 830 100
The average number of interviews carried out per household is: �.5
9.11.3 recalls
In total 6,036 visits were made by the interviewers, out of which �,906 (32%) were revisits.
Table 9.11.3 number of contacts
freq. %�st visit ��30 682nd visit ��9� 203rd visit 7�5 �2Total number 6036 100
9.11.4 post interview section
Type of neighbourhood:
Table 9.11.4 neighbourhood
predominantly immigrant predominantly poorfreq. % freq. %
Yes �9� �8 6�� 59No 2�7 2� 26� 26Mixed 322 3� �55 �5Total 10332� 100 1033 100
2� The base is the total number of minority interviews conducted including the interviews with ‘Other’ Black Africans’.

EU-MIDIS
66
Respondent had any difficulty when answering questions:
Table 9.11.5 Difficulty when answering
Total albanian romafreq. % freq. % freq. %
no 758 73 342 68 410 81Yes-language �3� �3 �0� 20 �2 2Yes-nature of questions �37 �3 6� �2 75 �5Yes-other reasons �� � 5 � 9 2base 1033� 101* 503 101* 505 100* Multiple answers were possible
Need for using the minority language questionnaires (Albanian):
9.12 HUngary
9.12.1 HH-level response rates
In total 968 door addresses were visited by the interviewers. Interviewers did not manage to contact households at �6% of these addresses.
Out of all the contacted households, interviewers were able to carry out at least � full interview at each of 285 households (35%).
albanian (503)
yes 6%
no 94%
TargET groUpS: ROMA fieldwork period: �� May – 20 June Coverage: Budapest, Miskolc
Targeted sample size500
actual sample size500
by minority500
Roma

Technical Report: Methodology, Sampling and Fieldwork
67
Table 9.12.1 final status code
freq. %Wrong address/no follow up 108 11Address is not residential 63 7Address is not occupied (empty, second home, etc) 28 3Address abandoned due to PSU replacement 0 0Address already visited 0 0Other problems that prevent interviewing at the address �7 2no contact with household 44 5Unsuccessful attempt to get inside the building, contact the household 28 3Nobody at home �6 2Contact with the HH, but recontact not possible 351 36Hard refusal by household 3�� 32HH permanently ill �� �HH in an institution 0 0Language barrier 6 �HH is not capable (mentally or physically disabled) �2 �HH is not available till the end of the fieldwork 8 �HH unavailable, for other reasons 3 0recontact possible, but no successful screener 4 0Soft refusal by household 3 0HH is not available at the moment � 0HH wants to verify project 0 0Contact with the HH, successful pre-screener 175 18Minority, but not eligible � 0Applicable for majority population survey �7� �8Out of quota 0 0Missed appointment � 0Contact with HH resulted in successful interview(s) 285 29Total 968 100
9.12.2 respondent level response rates
In total, 6�6 persons from 285 households were found to be eligible for interviewing on the basis of their minority background. Once selected for interviewing, 8�% of potential interviewees agreed to be interviewed. Most of those not interviewed refused co-operation.
Table 9.12.2 final status code of eligible respondents in 285 households
freq. %Unsuccessful interviews 116 19The person is permanently away 28 5The person is ill, incapable of the interview till the end of fieldwork 2 0The person does not speak the interview language 0 0Respondent is not at home �� 2Respondent is at home, but prefers to be interviewed later 0 0Respondent is temporarily not able to answer (sick, etc.) � 0Respondent refuses co-operation 69 ��Respondent does not consider him/herself as having an immigrant/minority background
� 0
Respondent is not eligible for other grounds (less than one year stay, or less than �6 years of age)
� 0
Unable to conduct interview due to language difficulties 0 0respondents agreed to be interviewed 500 81Total 616 100

EU-MIDIS
68
The average number of interviews carried out per household is: �.8
9.12.3 recalls
In total �,0�� visits were made by the interviewers, out of which 76 (7%) were revisits.
Table 9.12.3 number of contacts
freq. %�st visit 968 932nd visit 55 53rd visit 2� 2Total number 1044 100
9.12.4 post interview section
Type of neighbourhood:
Table 9.12.4 neighbourhood
predominantly immigrant predominantly poorfreq. % freq. %
Yes 227 �5 3�0 62No 88 �8 82 �6Mixed �85 37 �08 22Total 500 100 500 100
Respondent had any difficulty when answering questions:
Table 9.12.5 Difficulty when answering
freq. %no 432 86Yes-language 5 �Yes-nature of questions 5� �0Yes-other reasons �3 3base 500 100
9.13 IrElanD
TargET groUpS: SUB-SAHARAN AFRICANS, CEE
fieldwork period: �5 August – 03 OctoberCoverage: Dublin metro area
Targeted sample size1000
actual sample size1112
by minority609 503
CEE Sub-Saharan Africans

Technical Report: Methodology, Sampling and Fieldwork
69
9.13.1 HH-level response rates
Because of the sampling approach adopted, data on household level are not available.
9.13.2 respondent level response rates
In total 2,7�� persons were approached and ��% of them agreed to take part in the survey.
Table 9.13.2. final status code of approached persons
Total CEE SS africansfreq. % freq. % freq. %
Unsuccessful attempt to interview target minority 775 28 426 23 349 40Hard refusal by approached person 775 28 �26 23 3�9 �0Successful pre-screener but no interview 854 31 825 44 29 3Minority, but not eligible 85� 3� 825 �� 29 3Successful interviews 1112 41 609 33 503 57Total 2741 100 1860 100 881 100
9.13.3 recalls
Because of the sampling approach adopted, data on revisits are not available.
9.13.4 post interview section
Type of neighbourhood:
Table 9.13.4 neighbourhood
predominantly immigrant predominantly poorfreq. % freq. %
Yes 66 6 30 3No �73 �3 526 �7Mixed 573 52 538 �8No answer 0 0 �8 2Total 1112 100 1112 100
Respondent had any difficulty when answering questions:
Table 9.13.5 Difficulty when answering
Total CCE SS africansfreq. % freq. % freq. %
no 999 90 592 97 407 81Yes-language 2� 2 3 0 2� �Yes-nature of questions 72 6 7 � 66 �3Yes-other reasons �9 2 9 � �� 2base 1112 100 609 100 503 100

EU-MIDIS
70
9.14 ITaly
9.14.1 HH-level response rates
In total 3,973 door addresses were visited by the interviewers. Interviewers did not manage to contact households at �5% of these addresses.
Out of all the contacted households, interviewers were able to carry out at least � full interview at each of 96� households (29%).
Table 9.14.1. final status code
freq. %Wrong address/no follow up 584 15Address is not residential �08 �0Address is not occupied (empty, second home, etc) �52 �Address abandoned due to PSU replacement � 0Address already visited 0 0Other problems that prevent interviewing at the address 23 �no contact with household 10 0Unsuccessful attempt to get inside the building, contact the household 0 0Nobody at home �0 0Contact with the HH, but recontact not possible 1876 47Hard refusal by household �525 38HH permanently ill �� 0HH in an institution � 0Language barrier �2� 3HH is not capable (mentally or physically disabled) 3� �HH is not available till the end of the fieldwork 50 �HH unavailable, for other reasons �3� 3recontact possible, but no successful screener 1 0Soft refusal by household � 0HH is not available at the moment 0 0HH wants to verify project 0 0Contact with the HH, successful pre-screener 538 14Minority, but not eligible 33 �Applicable for majority population survey 50� �3Out of quota � 0Missed appointment 0 0Contact with HH resulted in successful interview(s) 964 24Total 3973 100
TargET groUpS: ALBANIAN, NORTH AFRICAN, ROMANIANfieldwork period: �� May – 22 JulyCoverage: Rome, Milan, Bari
Targeted sample size1500
actual sample size1503
by minority500 501
Albanian
502
North African Romanian
other Sub-Saharan african/black-Caribbean interviews: �2Majority interviews: 502

Technical Report: Methodology, Sampling and Fieldwork
7�
9.14.2 respondent level response rates
In total, �,700 persons from 96� households were found to be eligible for interviewing on the basis of their minority background. Once selected for interviewing, 88% of potential interviewees agreed to be interviewed. Most of those not interviewed refused co-operation.
Table 9.14.2 final status code of eligible respondents in 964 households
Total albanian north african romanianfreq. % freq. % freq. % freq. %
Unsuccessful interviews 197 12 64 11 82 14 51 9The person is permanently away 28 2 6 � �� 2 �� 2The person is ill, incapable of the interview till the end of fieldwork
5 0 2 0 3 � 0 0
The person does not speak the interview language
5 0 � 0 2 0 2 0
Respondent is not at home 2 0 2 0 0 0 0 0Respondent is at home, but prefers to be interviewed later
3 0 2 0 0 0 � 0
Respondent is temporarily not able to answer (sick, etc.)
� 0 � 0 0 0 0 0
Respondent refuses co-operation �5� 9 �9 9 66 �� 36 7Respondent does not consider him/herself as having an immigrant/minority background
0 0 0 0 0 0 0 0
Respondent is not eligible for other grounds (less than one year stay, or less than �6 years of age)
0 0 0 0 0 0 0 0
Unable to conduct interview due to language difficulties
2 0 � 0 0 0 � 0
respondents agreed to be interviewed
1515 88 500 89 501 86 502 91
Total 1712 100 564 100 583 100 553 100
The average number of interviews carried out per household is: �.6
9.14.3 recalls
In total �,373 visits were made by the interviewers, out of which �00 (9%) were revisits. The low number of revisits can mainly be attributed to two reasons:
- Most of the unsuccessful contacts were hard refusals thus no revisit was possible;
- The correct identification of the starting points and the high cooperation rate of respondents resulted in successful interviews (either minority or majority) in almost all the visited households where re-contact was possible.
Table 9.14.3 number of contacts
Freq. %�st visit 3973 9�2nd visit 377 93rd visit 23 �Total number 4373 100

EU-MIDIS
72
9.14.4 post interview section
Type of neighbourhood:
Table 9.14.4 neighbourhood
predominantly immigrant predominantly poor
freq. % freq. %
Yes �70 �� �53 �0
No 607 �0 666 ��
Mixed 738 �9 696 �6
Total 151525 100 1515 100
Respondent had any difficulty when answering questions:
Table 9.14.5 Difficulty when answering
Total albanian north african romanian
freq. % freq. % freq. % freq. %
no 1080 72 368 74 313 62 392 78
Yes-language ��8 �0 29 6 88 �8 29 6
Yes-nature of questions 272 �8 9� �9 ��8 2� 56 ��
Yes-other reasons 7� 5 �9 � 20 � �2 8
No answer 7 0 6 � � 0 0 0
base 1515� 105* 500 103* 501 108* 502 103** Multiple answers were possible
Need for using the minority language questionnaires (Albanian, Arabic, Romanian):
25 The base is the total number of minority interviews conducted including the interviews with ‘Other’ Black Africans’.
albanian (500) north african (501) romanian (502)
yes 6%
no 94%
yes 10%
no 90%
yes 5%
no 95%

Technical Report: Methodology, Sampling and Fieldwork
73
9.15 laTvIa
9.15.1 HH-level response rates
In total 707 door addresses were visited by the interviewers. Interviewers did not manage to contact households at �9% of these addresses.
Out of all the contacted households, interviewers were able to carry out at least � full interview at each of 32� households (56%).
Table 9.15.1 final status code
freq. %Wrong address/no follow up 47 7Address is not residential 6 �Address is not occupied (empty, second home, etc) 39 6Address abandoned due to PSU replacement � 0Address already visited 0 0Other problems that prevent interviewing at the address � 0no contact with household 86 12Unsuccessful attempt to get inside the building, contact the household 6 �Nobody at home 80 ��Contact with the HH, but recontact not possible 121 17Hard refusal by household �02 ��HH permanently ill � �HH in an institution 0 0Language barrier � �HH is not capable (mentally or physically disabled) 9 �HH is not available till the end of the fieldwork 2 0HH unavailable, for other reasons 0 0recontact possible, but no successful screener 3 0Soft refusal by household 0 0HH is not available at the moment 3 0HH wants to verify project 0 0Contact with the HH, successful pre-screener 126 18Minority, but not eligible � 0Applicable for majority population survey �22 �7Out of quota 3 0Missed appointment 0 0Contact with HH resulted in successful interview(s) 324 46Total 707 100
TargET groUpS: RUSSIAN fieldwork period: �6 May – 2� July Coverage: Riga, Daugavpils
Targeted sample size500
actual sample size500
by minority500
Russian

EU-MIDIS
7�
9.15.2 respondent level response rates
In total, 582 persons from 32� households were found to be eligible for interviewing on the basis of their minority background. Once selected for interviewing, 86% of potential interviewees agreed to be interviewed. Most of those not interviewed refused co-operation.
Table 9.15.2 final status code of eligible respondents in 324 households
freq. %Unsuccessful interviews 82 14The person is permanently away 32 5The person is ill, incapable of the interview till the end of fieldwork �2 2The person does not speak the interview language 0 0Respondent is not at home 2 0Respondent is at home, but prefers to be interviewed later 0 0Respondent is temporarily not able to answer (sick, etc.) 0 0Respondent refuses co-operation 36 6Respondent does not consider him/herself as having an immigrant/minority background
0 0
Respondent is not eligible for other grounds (less than one year stay, or less than �6 years of age)
0 0
Unable to conduct interview due to language difficulties 0 0respondents agreed to be interviewed 500 86Total 582 100
The average number of interviews carried out per household is: �.5
9.15.3 recalls
In total 977 visits were made by the interviewers, out of which 270 (28%) were revisits.
Table 9.15.3 number of contacts
freq. %�st visit 707 722nd visit �7� �83rd visit 99 �0Total number 977 100
9.15.4 post interview section
Type of neighbourhood:
Table 9.15.4 neighbourhood
predominantly immigrant predominantly poorfreq. % freq. %
Yes �3 9 2� 5No 2 0 259 52Mixed �55 9� 2�7 �3Total 500 100 500 100
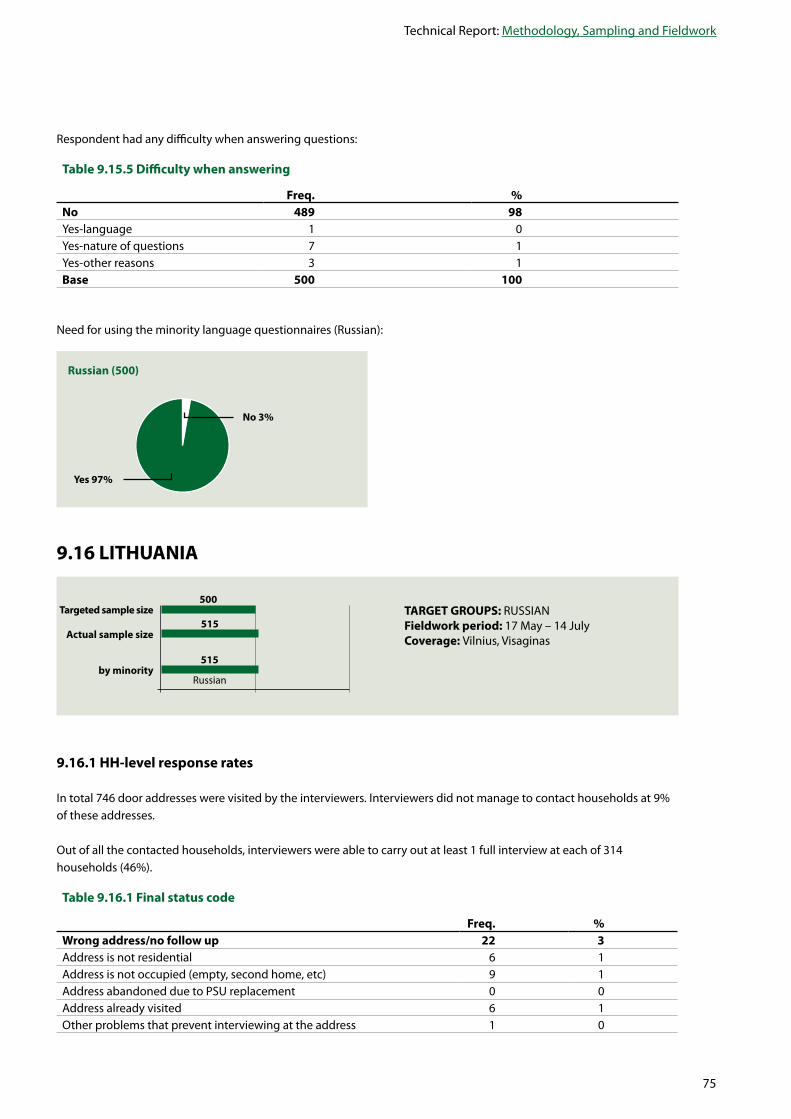
Technical Report: Methodology, Sampling and Fieldwork
75
Respondent had any difficulty when answering questions:
Table 9.15.5 Difficulty when answering
freq. %no 489 98Yes-language � 0Yes-nature of questions 7 �Yes-other reasons 3 �base 500 100
Need for using the minority language questionnaires (Russian):
9.16 lITHUanIa
9.16.1 HH-level response rates
In total 7�6 door addresses were visited by the interviewers. Interviewers did not manage to contact households at 9% of these addresses.
Out of all the contacted households, interviewers were able to carry out at least � full interview at each of 3�� households (�6%).
Table 9.16.1 final status code
freq. %Wrong address/no follow up 22 3Address is not residential 6 �Address is not occupied (empty, second home, etc) 9 �Address abandoned due to PSU replacement 0 0Address already visited 6 �Other problems that prevent interviewing at the address � 0
russian (500)
no 3%
yes 97%
TargET groUpS: RUSSIAN fieldwork period: �7 May – �� July Coverage: Vilnius, Visaginas
Targeted sample size500
actual sample size515
by minority515
Russian

EU-MIDIS
76
freq. %no contact with household 42 6Unsuccessful attempt to get inside the building, contact the household 3 0Nobody at home 39 5Contact with the HH, but recontact not possible 127 17Hard refusal by household ��9 �6HH permanently ill 2 0HH in an institution 0 0Language barrier � 0HH is not capable (mentally or physically disabled) 0 0HH is not available till the end of the fieldwork 5 �HH unavailable, for other reasons 0 0recontact possible, but no successful screener 0 0Soft refusal by household 0 0HH is not available at the moment 0 0HH wants to verify project 0 0Contact with the HH, successful pre-screener 241 32Minority, but not eligible 37 5Applicable for majority population survey �97 26Out of quota 7 �Missed appointment 0 0Contact with HH resulted in successful interview(s) 314 42Total 746 100
9.16.2 respondent level response rates
In total 570 persons from 3�� households were found to be eligible for interviewing on the basis of their ethnic background. Once selected for interviewing, 90% of potential interviewees agreed to be interviewed. Most of those not interviewed refused co-operation.
Table 9.16.2 final status code of eligible respondents in 314 households
freq. %Unsuccessful interviews 55 10The person is permanently away �8 3The person is ill, incapable of the interview till the end of fieldwork 2 0The person does not speak the interview language 0 0Respondent is not at home � 0Respondent is at home, but prefers to be interviewed later 0 0Respondent is temporarily not able to answer (sick, etc.) 0 0Respondent refuses co-operation 3� 6Respondent does not consider him/herself as having an immigrant/minority background
0 0
Respondent is not eligible for other grounds (less than one year stay, or less than �6 years of age)
0 0
Unable to conduct interview due to language difficulties 0 0respondents agreed to be interviewed 515 90Total 570 100
The average number of interviews carried out per household is: �.6

Technical Report: Methodology, Sampling and Fieldwork
77
9.16.3 recalls
In total 9�6 visits were made by the interviewers, out of which �70 (�8%) were revisits.
Table 9.16.3 number of contacts
freq. %�st visit 7�6 8�2nd visit �32 ��3rd visit 38 �Total number 916 100
9.16.4 post interview section
Type of neighbourhood:
Table 9.16.4 neighbourhood
predominantly immigrant predominantly poorfreq. % freq. %
Yes �06 2� 2� �No 287 56 �57 89Mixed �22 2� 37 7Total 515 100 515 100
Respondent had any difficulty when answering questions:
Table 9.16.5 Difficulty when answering
freq. %no 435 84Yes-language �6 3Yes-nature of questions 60 �2Yes-other reasons �6 3base 515 102** Multiple answers were possible
Need for using the minority language questionnaires (Russian):
russian (515)
no 20%
yes 80%

EU-MIDIS
78
9.17 lUXEMboUrg
9.17.1 HH-level response rates
In total 7�� door addresses were visited by the interviewers. Interviewers did not manage to contact households at 3�% of these addresses.
Out of all the contacted households, interviewers were able to carry out at least � full interview at each of 282 households (59%).
Table 9.17.1 final status code
freq. %Wrong address/no follow up 140 20Address is not residential 37 5Address is not occupied (empty, second home, etc) 37 5Address abandoned due to PSU replacement �5 2Address already visited 7 �Other problems that prevent interviewing at the address �� 6no contact with household 78 11Unsuccessful attempt to get inside the building, contact the household �7 2Nobody at home 6� 9Contact with the HH, but recontact not possible 167 23Hard refusal by household ��� �6HH permanently ill � 0HH in an institution 0 0Language barrier 33 5HH is not capable (mentally or physically disabled) � 0HH is not available till the end of the fieldwork 7 �HH unavailable, for other reasons �� 2recontact possible, but no successful screener 17 2Soft refusal by household 9 �HH is not available at the moment 6 �HH wants to verify project 2 0Contact with the HH, successful pre-screener 16 2Minority, but not eligible �2 2Applicable for majority population survey � �Out of quota 0 0Missed appointment �� 2Contact with HH resulted in successful interview(s) 282 40Total 711 98
TargET groUpS: EX-YUGOSLAVIA fieldwork period: 28 April – 06 September Summer break: 22 July – 25 August Coverage: Nationwide
Targeted sample size500
actual sample size497
by minority497
Ex-Yugoslavian
other Sub-Saharan african/black-Caribbean interviews: 3

Technical Report: Methodology, Sampling and Fieldwork
79
9.17.2 respondent level response rates
In total 639 persons from 282 households were found to be eligible for interviewing on the basis of their minority background. Once selected for interviewing, 78% of potential interviewees agreed to be interviewed. Most of those not interviewed refused co-operation.
Table 9.17.2 final status code of eligible respondents in 282 households
freq. %Unsuccessful interviews 145 22The person is permanently away 28 �The person is ill, incapable of the interview till the end of fieldwork � 0The person does not speak the interview language �6 2Respondent is not at home 23 �Respondent is at home, but prefers to be interviewed later 7 �Respondent is temporarily not able to answer (sick, etc.) � 0Respondent refuses co-operation 57 9Respondent does not consider him/herself as having an immigrant/minority background
2 0
Respondent is not eligible for other grounds (less than one year stay, or less than �6 years of age)
0 0
Unable to conduct interview due to language difficulties �0 2respondents agreed to be interviewed 500 78Total 645 100
The average number of interviews carried out per household is: �.8
9.17.3 recalls
In total �,2�5 visits were made by the interviewers, out of which 50� (��%) were revisits.
Table 9.17.3 number of contacts
freq. %�st visit 7�� 592nd visit 325 273rd visit �79 �5Total number �2�5 �00
9.17.4 post interview section
Type of neighbourhood:
Table 9.17.4 neighbourhood
predominantly immigrant predominantly poorfreq. % freq. %
Yes 63 �3 �5 9No 2�6 �3 370 7�Mixed 2�5 �3 79 �6No answer 6 � 6 �Total 50026 100 500 100
26 The base is the total number of minority interviews conducted including the interviews with ‘Other’ Black Africans’.

EU-MIDIS
80
Respondent had any difficulty when answering questions:
Table 9.17.5 Difficulty when answering
freq. %no 280 56Yes-language �03 2�Yes-nature of questions �6� 32Yes-other reasons 20 �No answer 6 0base 500� 113** Multiple answers were possible
Need for using the minority language questionnaires: No
9.18 THE nETHErlanDS
9.18.1 HH-level response rates – random route Sample
In total �,9�5 door addresses were visited by the interviewers. Interviewers did not manage to contact households at �2% of these addresses.
Out of all the contacted households, interviewers were able to carry out at least � full interview at each of 359 households (2�%).
Table 9.18.1 final status code
freq. %Wrong address/no follow up 9 0Address is not residential 7 0Address is not occupied (empty, second home, etc) � 0Address abandoned due to PSU replacement 0 0Address already visited 0 0Other problems that prevent interviewing at the address � 0no contact with household 230 12Unsuccessful attempt to get inside the building, contact the household 3 0Nobody at home 227 �2Contact with the HH, but recontact not possible 723 37Hard refusal by household 6�6 32HH permanently ill 25 �HH in an institution 25 �Language barrier 28 �
TargET groUpS: NORTH AFRICAN, TURKISH, SURINAMESE
fieldwork period: � May – 5 NovemberSummer break: 22 July – 25 AugustCoverage: Amsterdam, Rotterdam,
Utrecht, The Hague
Targeted sample size1500
actual sample size1375
by minority459 433
North African
471
Turkish Surinamese
other Sub-Saharan african/black-Caribbean interviews: �

Technical Report: Methodology, Sampling and Fieldwork
8�
freq. %HH is not capable (mentally or physically disabled) 0 0HH is not available till the end of the fieldwork 0 0HH unavailable, for other reasons 28 �recontact possible, but no successful screener 25 1Soft refusal by household 0 0HH is not available at the moment 0 0HH wants to verify project 25 �Contact with the HH, successful pre-screener 600 31Minority, but not eligible 257 �3Applicable for majority population survey 3�0 �8Out of quota 0 0Missed appointment 0 0Contact with HH resulted in successful interview(s) 359 18Total 1945 100
9.18.2 respondent level response rates
random route Sample:
In total, 737 persons from 359 households were found to be eligible for interviewing on the basis of their minority background. Once selected for interviewing, 77% of potential interviewees agreed to be interviewed. Most of those not interviewed refused co-operation.
Table 9.18.2.1 final status code of eligible respondents in 359 households
Total north african Turkish Surinamesefreq. % freq. % freq. % freq. %
Unsuccessful interviews 171 23 56 100 48 100 64 100The person is permanently away 5� 7 �� 25 �5 3� 23 36The person is ill, incapable of the interview till the end of fieldwork
5 � 3 5 � 2 � 2
The person does not speak the interview language
�0 � 6 �� 3 6 0 0
Respondent is not at home �� 2 5 9 3 6 6 9Respondent is at home, but prefers to be interviewed later
3 0 2 � � 2 0 0
Respondent is temporarily not able to answer (sick, etc.)
6 � � 2 0 0 5 8
Respondent refuses co-operation 78 �0 25 �5 25 52 28 ��Respondent does not consider him/herself as having an immigrant/minority background
� 0 0 0 0 0 � 2
Respondent is not eligible for other grounds (less than one year stay, or less than �6 years of age)
0 0 0 0 0 0 0 0
Unable to conduct interview due to language difficulties
0 0 0 0 0 0 0 0
respondents agreed to be interviewed
572 77 219 80 160 77 190 75
Total 743 100 275 100 208 100 254 100
The average number of interviews carried out per household (via Random Route) is: �.6

EU-MIDIS
82
Interviewer generated Sample:
In total 9�� persons were approached and 85% of them agreed to take part in the survey.
Table 9.18.2.2 final status code of approached persons
Total north african Turkish Surinamesefreq. % freq. % freq. % freq. %
Unsuccessful attempt to interview target minority
70 7 29 10 27 8 14 4
Hard refusal by approached person 70 7 29 �0 27 8 �� �Successful pre-screener but no interview
69 7 23 8 23 7 23 7
Minority, but not eligible 69 7 23 8 23 7 23 7Successful interviews 805 85 240 82 283 85 281 88Total 944 100 292 100 333 100 318 100
9.18.3 recalls – random route Sample
In total 2,236 visits were made by the interviewers, out of which 29� (�3%) were revisits.
Table 9.18.3 number of contacts
freq. %�st visit �9�5 872nd visit 2�6 ��3rd visit �5 2Total number 223627 100
9.18.4 post interview section
Type of neighbourhood:
Table 9.18.4 neighbourhood
predominantly immigrant predominantly poorfreq. % freq. %
Yes 632 �6 28� 2�No �29 9 558 ��Mixed 592 �3 5�0 37No answer 2� 2 25 2Total 1377 100 1377 100
27 The base is the total number of minority interviews conducted including the interviews with ‘Other’ Black Africans’.

Technical Report: Methodology, Sampling and Fieldwork
83
Respondent had any difficulty when answering questions:
Table 9.18.5 Difficulty when answering
Total north african Turkish Surinamesefreq. % freq. % freq. % freq. %
no 1134 82 403 88 302 68 425 90Yes-language �39 �0 28 6 �06 2� 5 �Yes-nature of questions ��5 8 27 6 6� �� 27 6Yes-other reasons 2� 2 8 2 9 2 � �No answer 27 2 3 � 8 2 �6 3base 1377 102* 459 102* 443 110* 471 101** Multiple answers were possible
Need for using the minority language questionnaires (Arabic and Turkish):
9.19 MalTa
9.19.1 HH-level response rates
Because of the sampling approach adopted, data on household level are not available.
9.19.2 respondent level response rates
Because of the sampling approach adopted, only success rate at the individual level can be calculated. Please see tables 8.�. and 8.2.
9.19.3 recalls
Because of the sampling approach adopted, data on revisits are not available.
north african (456) Turkish
yes 4%
no 96%
yes 20%
no 80%
TargET groUpS: AFRICANS fieldwork period: �6 May – 2� July Coverage: Nationwide
Targeted sample size500
actual sample size500
by minority500
Africans

EU-MIDIS
8�
9.19.4 post interview section
Respondent had any difficulty when answering questions:
Table 9.19.5 Difficulty when answering
freq. %no 170 34Yes-language 2�8 50Yes-nature of questions 9� �8Yes-other reasons �3 3base 500 104** Multiple answers were possible
Need for using the minority language questionnaires (Arabic):
9.20 polanD
9.20.1 HH-level response rates
In total �38 door addresses were visited by the interviewers. Interviewers did not manage to contact households at �2% of these addresses.
Out of all the contacted households, interviewers were able to carry out at least � full interview at each of 250 households (65%).
africans (500)
yes 7%
no 93%
TargET groUpS: ROMA fieldwork period: �� May – 20 June Coverage: Nationwide
Targeted sample size500
actual sample size500
by minority500
Roma

Technical Report: Methodology, Sampling and Fieldwork
85
Table 9.20.1 final status code
freq. %Wrong address/no follow up 16 4Address is not residential � 0Address is not occupied (empty, second home, etc) � 0Address abandoned due to PSU replacement 9 2Address already visited 0 0Other problems that prevent interviewing at the address 5 �no contact with household 35 8Unsuccessful attempt to get inside the building, contact the household 2 0Nobody at home 33 8Contact with the HH, but recontact not possible 131 30Hard refusal by household �05 2�HH permanently ill 0 0HH in an institution � 0Language barrier 0 0HH is not capable (mentally or physically disabled) 0 0HH is not available till the end of the fieldwork 0 0HH unavailable, for other reasons 25 6recontact possible, but no successful screener 2 0Soft refusal by household � 0HH is not available at the moment � 0HH wants to verify project 0 0Contact with the HH, successful pre-screener 4 1Minority, but not eligible 0 0Applicable for majority population survey � �Out of quota 0 0Missed appointment 0 0Contact with HH resulted in successful interview(s) 250 57Total 438 100
9.20.2 respondent level response rates
In total, 58� persons from 250 households were found to be eligible for interviewing on the basis of their minority background. Once selected for interviewing, 86% of potential interviewees agreed to be interviewed. Most of those not interviewed refused co-operation.
Table 9.20.2 final status code of eligible respondents in 250 households
freq. %Unsuccessful interviews 84 14The person is permanently away 22 �The person is ill, incapable of the interview till the end of fieldwork 3 �The person does not speak the interview language 0 0Respondent is not at home �0 2Respondent is at home, but prefers to be interviewed later 9 2Respondent is temporarily not able to answer (sick, etc.) � 0Respondent refuses co-operation 38 7Respondent does not consider him/herself as having an immigrant/minority background
0 0
Respondent is not eligible for other grounds (less than one year stay, or less than �6 years of age)
0 0

EU-MIDIS
86
freq. %Unable to conduct interview due to language difficulties � 0respondents agreed to be interviewed 500 86Total 584 100
The average number of interviews carried out per household is: 2.0
9.20.3 recalls
In total �76 visits were made by the interviewers, out of which 39 (8%) were revisits. The low number of revisits can be attributed to the fact that in �2% of the visited households re-contact was not possible mainly due to hard refusals (see Table 9.�.). On the other hand in the successfully contacted households the Roma’s high cooperation rate resulted in 2 completed interviews per household on average.
Table 9.20.3 number of contacts
freq. %�st visit �37 922nd visit 39 83rd visit 0 0Total number 476 100
9.20.4 post interview section
Type of neighbourhood:
Table 9.20.4 neighbourhood
predominantly immigrant predominantly poorfreq. % freq. %
Yes �87 37 ��9 2�No 262 52 27� 55Mixed 5� �0 �07 2�Total 500 100 500 100
Respondent had any difficulty when answering questions:
Table 9.20.5 Difficulty when answering
freq. %no 238 48Yes-language 7� ��Yes-nature of questions 236 �7Yes-other reasons �8 �base 500 113** Multiple answers were possible

Technical Report: Methodology, Sampling and Fieldwork
87
9.21 porTUgal
9.21.1 HH-level response rates
In total 3,89� door addresses were visited by the interviewers. Interviewers did not manage to contact households at �9% of these addresses.
Out of all the contacted households, interviewers were able to carry out at least � full interview at each of 677 households (2�%).
Table 9.21.1 final status code
freq. %Wrong address/no follow up 205 5Address is not residential �67 �Address is not occupied (empty, second home, etc) 38 �Address abandoned due to PSU replacement 0 0Address already visited 0 0Other problems that prevent interviewing at the address 0 0no contact with household 137 4Unsuccessful attempt to get inside the building, contact the household �6 0Nobody at home �2� 3Contact with the HH, but recontact not possible 20 1Hard refusal by household �7 0HH permanently ill 0 0HH in an institution 0 0Language barrier � 0HH is not capable (mentally or physically disabled) 0 0HH is not available till the end of the fieldwork 0 0HH unavailable, for other reasons 2 0recontact possible, but no successful screener 6 0Soft refusal by household 5 0HH is not available at the moment � 0HH wants to verify project 0 0Contact with the HH, successful pre-screener 2849 71Minority, but not eligible �0 0Applicable for majority population survey 2770 7�Out of quota 69 0Missed appointment 0 0Contact with HH resulted in successful interview(s) 677 0Total 3894 81
TargET groUpS: BRAZILIAN, SUB-SAHARAN AFRICANS
fieldwork period: �5 May – 2� JulyCoverage: Lisbon metro, Setubal
Targeted sample size1000
actual sample size1015
by minority505 510
Brazilian Sub-Saharan African

EU-MIDIS
88
9.21.2 respondent level response rates
In total, �,��8 persons from 677 households were found to be eligible for interviewing on the basis of their minority background. Once selected for interviewing, 72% of potential interviewees agreed to be interviewed. Most of those not interviewed were not at home.
Table 9.21.2 final status code of eligible respondents in 677 households
Total brazilian Sub-Saharan african
freq. % freq. % freq. %Unsuccessful interviews 403 28 89 15 314 38The person is permanently away �9 � 3 � �6 2The person is ill, incapable of the interview till the end of fieldwork 2 0 0 0 2 0The person does not speak the interview language � 0 0 0 � 0Respondent is not at home 285 20 65 �� 220 27Respondent is at home, but prefers to be interviewed later � 0 � 0 3 0Respondent is temporarily not able to answer (sick, etc.) 3 0 0 0 3 0Respondent refuses co-operation 88 6 20 3 68 8Respondent does not consider him/herself as having an immigrant/minority background
0 0 0 0 0 0
Respondent is not eligible for other grounds (less than one year stay, or less than �6 years of age)
0 0 0 0 0 0
Unable to conduct interview due to language difficulties � 0 0 0 � 0respondents agreed to be interviewed 1015 72 505 85 510 62Total 1418 100 594 100 824 100
The average number of interviews carried out per household is: �.5
9.21.3 recalls
In total �575 visits were made by the interviewers, out of which 68� (�5%) were revisits.
Table 9.21.3 number of contacts
freq. %�st visit 389� 852nd visit 553 �23rd visit �28 3Total number 4575 100
9.21.4 post interview section
Type of neighbourhood:
Table 9.21.4 neighbourhood
predominantly immigrant predominantly poorfreq. % freq. %
Yes 92 9 ��6 ��No �82 �7 597 59Mixed ��� �3 302 30Total 1015 100 1015 100

Technical Report: Methodology, Sampling and Fieldwork
89
Respondent had any difficulty when answering questions:
Table 9.21.5 Difficulty when answering
Total brazilian Sub-Saharan africanfreq. % freq. % freq. %
no 981 97 493 98 488 96Yes-language 7 � 0 0 7 �Yes-nature of questions 25 2 �2 2 �3 3Yes-other reasons 2 0 0 0 2 0base 1015 100 505 100 510 100
Need for using the minority language questionnaires (Brazilian and Sub-Saharan African): No
9.22 roManIa
9.22.1 HH-level response rates
In total �,0�2 door addresses were visited by the interviewers. Interviewers did not manage to contact households at 7% of these addresses.
Out of all the contacted households, interviewers were able to carry out at least � full interview at each of 328 households (3�%).
Table 9.22.1 final status code
freq. %Wrong address/no follow up 56 5Address is not residential 7 �Address is not occupied (empty, second home, etc) �� �Address abandoned due to PSU replacement 0 0Address already visited 0 0Other problems that prevent interviewing at the address 5 0no contact with household 23 2Unsuccessful attempt to get inside the building, contact the household �� �Nobody at home �2 �Contact with the HH, but recontact not possible 91 9Hard refusal by household 77 7HH permanently ill 0 0HH in an institution 3 0Language barrier � 0HH is not capable (mentally or physically disabled) � 0HH is not available till the end of the fieldwork 9 �
TargET groUpS: ROMA fieldwork period: �7 May – 25 June Coverage: Nationwide
Targeted sample size500
actual sample size500
by minority500
Roma
Majority interviews: 500

EU-MIDIS
90
freq. %HH unavailable, for other reasons 0 0recontact possible, but no successful screener 3 0Soft refusal by household � 0HH is not available at the moment 2 0HH wants to verify project 0 0Contact with the HH, successful pre-screener 541 52Minority, but not eligible 3� 3Applicable for majority population survey 500 �8Out of quota 7 �Missed appointment 0 0Contact with HH resulted in successful interview(s) 328 31Total 1042 100
9.22.2 respondent level response rates
In total, 779 persons from 328 households were found to be eligible for interviewing on the basis of their minority background. Once selected for interviewing, 6�% of potential interviewees agreed to be interviewed. Most of those not interviewed refused co-operation.
Table 9.22.2 final status code of eligible respondents in 328 households
freq. %Unsuccessful interviews 279 36The person is permanently away 7� 9The person is ill, incapable of the interview till the end of fieldwork �7 2The person does not speak the interview language �� �Respondent is not at home 59 8Respondent is at home, but prefers to be interviewed later 2� 3Respondent is temporarily not able to answer (sick, etc.) 2 0Respondent refuses co-operation 96 �2Respondent does not consider him/herself as having an immigrant/minority background
0 0
Respondent is not eligible for other grounds (less than one year stay, or less than �6 years of age)
0 0
Unable to conduct interview due to language difficulties 2 0respondents agreed to be interviewed 500 64Total 779 100
The average number of interviews carried out per household is: �.5
9.22.3 recalls
In total �,�69 visits were made by the interviewers, out of which �27 (��%) were revisits.
Table 9.22.3 number of contacts
freq. %�st visit �0�2 892nd visit 95 83rd visit 32 3Total number 1169 100

Technical Report: Methodology, Sampling and Fieldwork
9�
9.22.4 post interview section
Type of neighbourhood:
Table 9.22.4 neighbourhood
predominantly immigrant predominantly poorfreq. % freq. %
Yes 333 67 3�6 63No 66 �3 �02 20Mixed �0� 20 82 �6Total 500 100 500 100
Respondent had any difficulty when answering questions:
Table 9.22.5 Difficulty when answering
freq. %no 336 67Yes-language �5 3Yes-nature of questions ��3 29Yes-other reasons �2 2base 500 101** Multiple answers were possible
9.23 SlovaKIa
9.23.1 HH-level response rates
In total 863 door addresses were visited by the interviewers. Interviewers did not manage to contact households at 5% of these addresses.
Out of all the contacted households, interviewers were able to carry out at least � full interview at each of 238 households (29%).
TargET groUpS: ROMA fieldwork period: 03 May – 30 June Coverage: Nationwide
Targeted sample size500
actual sample size500
by minority500
Roma
Majority interviews: 500

EU-MIDIS
92
Table 9.23.1 final status code
freq. %Wrong address/no follow up 25 3Address is not residential �2 �Address is not occupied (empty, second home, etc) �3 2Address abandoned due to PSU replacement 0 0Address already visited 0 0Other problems that prevent interviewing at the address 0 0no contact with household 13 2Unsuccessful attempt to get inside the building, contact the household � 0Nobody at home 9 �Contact with the HH, but recontact not possible 83 10Hard refusal by household 75 9HH permanently ill � 0HH in an institution 0 0Language barrier � 0HH is not capable (mentally or physically disabled) 2 0HH is not available till the end of the fieldwork 0 0HH unavailable, for other reasons � 0recontact possible, but no successful screener 1 0Soft refusal by household � 0HH is not available at the moment 0 0HH wants to verify project 0 0Contact with the HH, successful pre-screener 503 58Minority, but not eligible � 0Applicable for majority population survey �90 57Out of quota �2 �Missed appointment 0 0Contact with HH resulted in successful interview(s) 238 28Total 863 100
9.23.2 respondent level response rates
In total, 56� persons from 238 households were found to be eligible for interviewing on the basis of their minority background. Once selected for interviewing, 89% of potential interviewees agreed to be interviewed. Most of those not interviewed refused co-operation.
Table 9.23.2 final status code of eligible respondents in 238 households
freq. %Unsuccessful interviews 61 11The person is permanently away �9 3The person is ill, incapable of the interview till the end of fieldwork �5 3The person does not speak the interview language 0 0Respondent is not at home � 0Respondent is at home, but prefers to be interviewed later 0 0Respondent is temporarily not able to answer (sick, etc.) 0 0Respondent refuses co-operation 25 �Respondent does not consider him/herself as having an immigrant/minority background
0 0
Respondent is not eligible for other grounds (less than one year stay, or less than �6 years of age)
0 0
Unable to conduct interview due to language difficulties � 0Respondents agreed to be interviewed 500 89Total 561 100

Technical Report: Methodology, Sampling and Fieldwork
93
The average number of interviews carried out per household is: 2.�
9.23.3 recalls
In total 9�3 visits were made by the interviewers, out of which 80 (8%) were revisits. The low number of revisit can mainly be attributed to the following reasons:
- Most of the unsuccessful contacts were hard refusals, thus no revisit was possible;
- The correct identification of the starting points and the high cooperation rate of respondents resulted in successful interviews (either minority or majority) in almost all the visited households where re-contact was possible.
- Interviewers noticed an overall interest of the Roma minority in the survey. Several times, mostly in multiple households, the interviewers encountered disappointment on the side of those members of the household who could not participate in the survey (it was very hard to explain the reason). In addition, Roma respondents were willing to identify those among their neighbours who were Roma, and therefore focused enumeration worked very well in Slovakia.
Table 9.23.3 number of contacts
freq. %�st visit 863 922nd visit 66 73rd visit �� �Total number 943 100
9.23.4 post interview section
Type of neighbourhood:
Table 9.23.4 neighbourhood
predominantly immigrant predominantly poorfreq. % freq. %
Yes 3�7 63 26� 53No 57 �� 98 20Mixed �26 25 �38 28Total 500 100 500 100
Respondent had any difficulty when answering questions:
Table 9.23.5 Difficulty when answering
freq. %no 309 62Yes-language 39 8Yes-nature of questions �62 32Yes-other reasons 30 6base 500 108** Multiple answers were possible

EU-MIDIS
9�
9.24 SlovEnIa
9.24.1 HH-level response rates
In total 7,��� door addresses were visited by the interviewers. Interviewers did not manage to contact households at 25% of these addresses.
Out of all the contacted households, interviewers were able to carry out at least � full interview at each of 723 households (��%).
Table 9.24.1 final status code
freq. %Wrong address/no follow up 33 0Address is not residential 6 0Address is not occupied (empty, second home, etc) �0 0Address abandoned due to PSU replacement � 0Address already visited � 0Other problems that prevent interviewing at the address �5 0no contact with household 1793 25Unsuccessful attempt to get inside the building, contact the household 53 �Nobody at home �7�0 25Contact with the HH, but recontact not possible 1707 24Hard refusal by household �59� 23HH permanently ill �� 0HH in an institution � 0Language barrier �7 0HH is not capable (mentally or physically disabled) 8 0HH is not available till the end of the fieldwork 2� 0HH unavailable, for other reasons 55 �recontact possible, but no successful screener 394 6Soft refusal by household 292 �HH is not available at the moment 99 �HH wants to verify project 3 0Contact with the HH, successful pre-screener 2488 35Minority, but not eligible 263 �Applicable for majority population survey 2208 3�Out of quota �7 0Missed appointment 3 0Contact with HH resulted in successful interview(s) 723 9Total 7141 100
TargET groUpS: SERBIAN, BOSNIANfieldwork period: �6 May – 30 SeptemberSummer break: 22 July – 25 AugustCoverage: Ljubljana, Jesenice
Targeted sample size1000
actual sample size1001
by minority473 528
Serbian Bosnian
other Sub-Saharan african/black-Caribbean interviews: 2

Technical Report: Methodology, Sampling and Fieldwork
95
9.24.2 respondent level response rates
In total, �,560 persons from 723 households were found to be eligible for interviewing on the basis of their minority background. Once selected for interviewing, 6�% of potential interviewees agreed to be interviewed. Most of those not interviewed refused co-operation.
Table 9.24.2 final status code of eligible respondents in 723 households
Total Serbian bosnianfreq. % freq. % freq. %
Unsuccessful interviews 559 36 279 37 280 35The person is permanently away 3� 2 �8 2 �3 2The person is ill, incapable of the interview till the end of fieldwork 3 0 2 0 � 0The person does not speak the interview language � 0 0 0 � 0Respondent is not at home �0 3 �8 2 22 3Respondent is at home, but prefers to be interviewed later 6 0 5 � � 0Respondent is temporarily not able to answer (sick, etc.) � 0 � 0 0 0Respondent refuses co-operation �76 30 23� 3� 2�2 30Respondent does not consider him/herself as having an immigrant/minority background
� 0 � 0 0 0
Respondent is not eligible for other grounds (less than one year stay, or less than �6 years of age)
0 0 0 0 0 0
Unable to conduct interview due to language difficulties 0 0 0 0 0 0respondents agreed to be interviewed 1003 64 473 63 528 65Total 1562 100 752 100 808 100
The average number of interviews carried out per household is: �.�
9.24.3 recalls
In total �3,298 visits were made by the interviewers, out of which 6,23� (�7%) were revisits.
Table 9.24.3 number of contacts
freq. %�st visit 7067 532nd visit 3833 293rd visit 2398 �8Total number 13298 100
9.24.4 post interview section
Type of neighbourhood:
Table 9.24.4 neighbourhood
predominantly immigrant predominantly poorfreq. % freq. %
Yes 25� 25 79 8No 2�0 2� 559 56Mixed 5�2 5� 365 36Total 100328 100 1003 100
28 The base is the total number of minority interviews conducted including the interviews with ‘Other’ Black Africans’.

EU-MIDIS
96
Respondent had any difficulty when answering questions:
Table 9.24.5 Difficulty when answering
Total Serbian bosnianfreq. % freq. % freq. %
no 860 86 361 72 361 72Yes-language 57 6 �7 9 �0 8Yes-nature of questions 75 7 99 20 �02 20Yes-other reasons �9 2 23 5 22 �base 1003� 101* 473 105* 528 105** Multiple answers were possible
Need for using the minority language questionnaires (Serbian):
9.25 SpaIn
9.25.1 HH-level response rates
In total 8,�85 door addresses were visited by the interviewers. Interviewers did not manage to contact households at 3�% of these addresses.
Out of all the contacted households, interviewers were able to carry out at least � full interview at each of �,362 households (23%).
Table 9.25.1 final status code
freq. %Wrong address/no follow up 435 5Address is not residential �8� 2Address is not occupied (empty, second home, etc) �99 2Address abandoned due to PSU replacement �0 0
Serbian (473) bosnian (528)
yes 1%
no 99%
yes 4%
no 96%
TargET groUpS: NORTH AFRICAN, SOUTH AMERICAN, ROMANIAN
fieldwork period: � May – 22 JulyCoverage: Madrid, Barcelona
Targeted sample size1500
actual sample size1526
by minority514 504
North African
508
South American Romanian
other Sub-Saharan african/black-Caribbean interviews: �0Majority interviews: 5�8

Technical Report: Methodology, Sampling and Fieldwork
97
freq. %Address already visited 5 0Other problems that prevent interviewing at the address 7 0no contact with household 2224 26Unsuccessful attempt to get inside the building, contact the household �22 �Nobody at home 2�02 25Contact with the HH, but recontact not possible 2881 34Hard refusal by household 2729 32HH permanently ill 9 0HH in an institution 0 0Language barrier �5 0HH is not capable (mentally or physically disabled) 0 0HH is not available till the end of the fieldwork 7 0HH unavailable, for other reasons �2� �recontact possible, but no successful screener 30 0Soft refusal by household 27 0HH is not available at the moment 3 0HH wants to verify project 0 0Contact with the HH, successful pre-screener 1553 18Minority, but not eligible 23 0Applicable for majority population survey 5�� 6Out of quota �0�9 �2Missed appointment 0 0Contact with HH resulted in successful interview(s) 1362 16Total 8485 100
9.25.2 respondent level response rates
In total, 2,637 persons from �,362 households were found to be eligible for interviewing on the basis of their minority background. Once selected for interviewing, 58% of potential interviewees agreed to be interviewed. Most of those not interviewed were permanently away.
Table 9.25.2 final status code of eligible respondents in 1362 households
Total north african South american romanianfreq. % freq. % freq. % freq. %
Unsuccessful interviews 1115 42 355 41 385 43 371 42The person is permanently away 572 22 �79 2� �85 2� 20� 23The person is ill, incapable of the interview till the end of fieldwork
3 0 2 0 0 0 � 0
The person does not speak the interview language
�5 � �2 � 0 0 3 0
Respondent is not at home 28 � 9 � �3 � 6 �Respondent is at home, but prefers to be interviewed later
2 0 2 0 0 0 0 0
Respondent is temporarily not able to answer (sick, etc.)
� 0 � 0 2 0 � 0
Respondent refuses co-operation �78 �8 ��� �7 �82 20 �52 �7Respondent does not consider him/herself as having an immigrant/minority background
2 0 0 0 2 0 0 0
Respondent is not eligible for other grounds (less than one year stay, or less than �6 years of age)
� 0 0 0 � 0 0 0
Unable to conduct interview due to language difficulties
�0 0 6 � 0 0 � 0

EU-MIDIS
98
Total north african South american romanianfreq. % freq. % freq. % freq. %
respondents agreed to be interviewed
1536 58 514 59 504 57 508 58
Total 2651 100 869 100 889 100 879 100
The average number of interviews carried out per household is: �.�
9.25.3 recalls
In total �0,��0 visits were made by the interviewers, out of which �,955 (�9%) were revisits.
Table 9.25.3 number of contacts
freq. %�st visit 8�85 8�2nd visit �372 �33rd visit 583 6Total number 10440 100
9.25.4 post interview section
Type of neighbourhood:
Table 9.25.4 neighbourhood
predominantly immigrant predominantly poorfreq. % freq. %
Yes 3�� 22 379 25No 27� �8 522 3�Mixed 9�8 60 635 ��Total 153629 100 1536 100
Respondent had any difficulty when answering questions:
Table 9.25.5 Difficulty when answering
Total north african South american romanianfreq. % freq. % freq. % freq. %
no 1306 85 377 73 478 95 443 87Yes-language �09 7 7� �� � � 30 6Yes-nature of questions
�2� 8 6� �2 20 � 36 7
Yes-other reasons 25 2 �9 � 3 � 3 �base 1536� 102* 514 104* 504 100 508 101** Multiple answers were possible
29 The base is the total number of minority interviews conducted including the interviews with ‘Other’ Black Africans’.

Technical Report: Methodology, Sampling and Fieldwork
99
Need for using the minority language questionnaires (Arabic, Romanian):
9.26 SWEDEn
9.26.1 HH-level response rates
Because of the sampling approach adopted, data on household level are not available.
9.26.2 respondent level response rates
In total ca. 6,02� persons were approached and only �7% of them agreed to take part in the survey.
Table 9.26.2 final status code of approached persons
Total Iraqi Somalifreq. % freq. % freq. %
Unsuccessful attempt to interview target minority 3112 52 1430 51 1682 52Hard refusal by approached person 29�� �8 �337 �8 �57� �9Language barrier 20� 3 92 3 �09 3Successful pre-screener but no interview 1908 32 877 31 1031 32Minority, but not eligible �908 32 877 3� �03� 32Successful interviews 1001 17 494 18 506 16Total 6021 100 2800 100 3219 100
9.26.3 recalls
Because of the sampling approach adopted, data on revisits are not available.
north african (514) South american (504) romanian (508)
yes 4%
no 96%
yes 0%
no 100%
yes 2%
no 98%
TargET groUpS: IRAQI, SOMALIfieldwork period: 3 May – 2� SeptemberSummer break: 22 July – �8 AugustCoverage: Stockholm, Malmö
Targeted sample size1000
actual sample size1000
by minority494 506
Iraqi Somali
other Sub-Saharan african/black-Caribbean interviews: �

EU-MIDIS
�00
9.26.4 post interview section
Type of neighbourhood:
Table 9.26.4 neighbourhood
predominantly immigrant predominantly poorfreq. % freq. %
Yes 508 5� ��0 ��No �20 �2 22� 22Mixed 373 37 367 37Total 100130 100 1001 100
Respondent had any difficulty when answering questions:
Table 9.26.5 Difficulty when answering
Total Iraqi Somalifreq. % freq. % freq. %
no 748 75 400 81 347 69Yes-language 99 �0 28 6 7� ��Yes-nature of questions �35 �3 52 �� 83 �6Yes-other reasons 63 6 29 6 37 7base 1001� 104* 494 103* 506 106** Multiple answers were possible
Need for using the minority language questionnaires (Arabic, Somali):
Iraqi (494) Somali (506)
yes 23%
no 77%
yes 32%
no 68%
30 The base is the total number of minority interviews conducted including the interviews with ‘Other’ Black Africans’.

Technical Report: Methodology, Sampling and Fieldwork
�0�
9.27 UnITED KIngDoM
9.27.1 HH-level response rates
Because of the sampling approach adopted, data on household level are not available.
9.27.2 respondent level response rates
In total �,903 persons were approached and about a fifth of them agreed to take part in the survey.
Table 9.27.2 final status code of approached persons
freq. %Unsuccessful attempt to interview target minority 2801 57Hard refusal by approached person �799 37Language barrier �002 20Successful pre-screener but no interview 1060 22Minority, but not eligible �060 22Successful interviews 1042 21Total 4903 100
9.27.3 recalls
Because of the sampling approach adopted, data on revisits are not available.
9.27.4 post interview section
Type of neighbourhood:
Table 9.27.4 neighbourhood
predominantly immigrant predominantly poorfreq. % freq. %
Yes 296 28 92 9No ��� �3 7�0 68Mixed 302 29 2�0 23Total 1042 100 1042 100
TargET groUpS: CENTRAL AND EASTERN EUROPEAN
fieldwork period: 07 May – �3 SeptemberCoverage: London
Targeted sample size1000
actual sample size1042
by minority1042
CCE
noTE: The decision was made to target central and east European migrants rather than established ethnic minority populations in the UK because the UK government and various research institutes carry out comprehensive and regular surveys on established ethnic minorities; such as British African-Caribbeans, British-Indians and British-Pakistanis, for example. In comparison, there is a relative lack of data concerning the experiences of recent migrants from central and east European countries who entered the UK in large numbers from 200�. For this reason, and given that discrimination and victimisation can also impact on groups that ‚look like‘ the majority population and who are also EU citizens, the FRA decided to explore the experiences of this largely undocumented group.
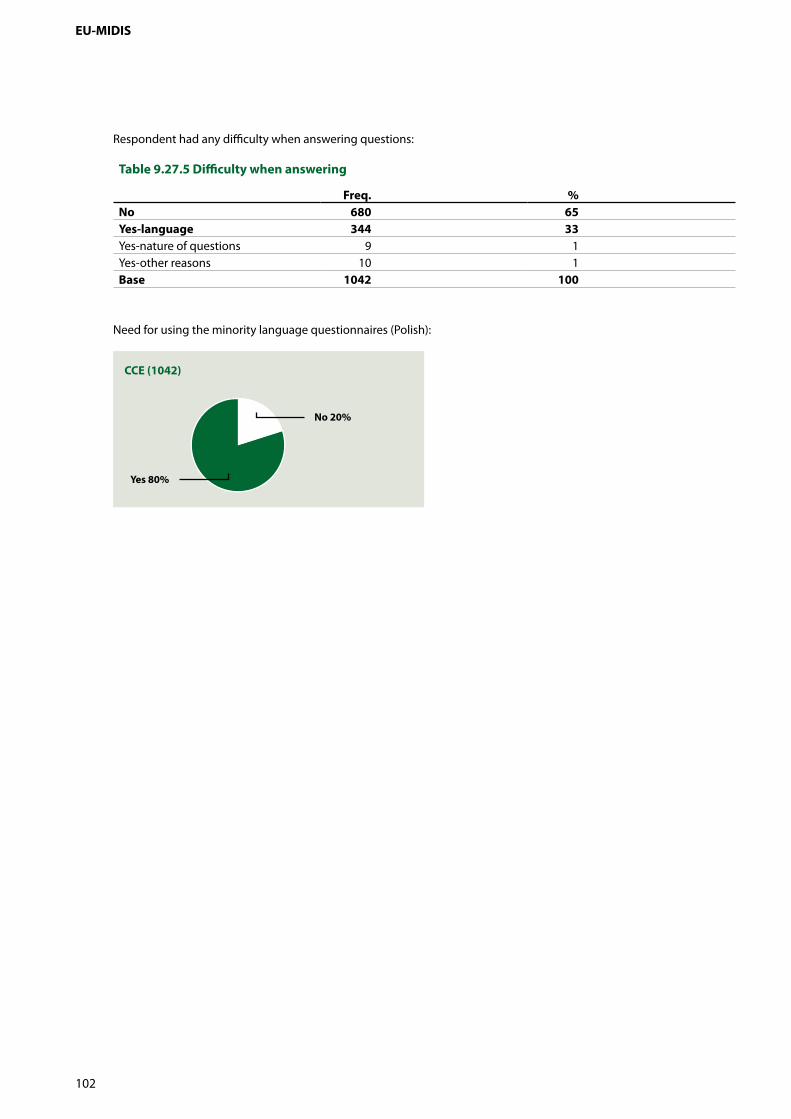
EU-MIDIS
�02
Respondent had any difficulty when answering questions:
Table 9.27.5 Difficulty when answering
freq. %no 680 65yes-language 344 33Yes-nature of questions 9 �Yes-other reasons �0 �base 1042 100
Need for using the minority language questionnaires (Polish):
CCE (1042)
no 20%
yes 80%

European Union agency for fundamental rights
EU-MIDIS Technical report : methodology, sampling and fieldwork European Union minorities and discrimination survey
Design: red hot ’n’ cool, ViennaPrinter: Elanders Hungary Kft., Budapest
2009 - �0� pp, - 2� x 29.7 cm
ISBN-�3: 978-92-9�92-398-�TK-80-09-632-EN-N
A great deal of information on the European Union Agency for Fundamental Rights is available on the Internet. It can be accessed through the FRA website (http://fra.europa.eu).
© European Union Agency for Fundamental Rights, 2009Reproduction is authorised, except for commercial purposes, provided the source is acknowledged.

TK-80-09-632-EN-N