Energy Audit of AMNEPL (Abhijeet MADC Nagpur Energy Private Limited)
13
1 A Project Report (TD607) On Abhijeet MADC Nagpur Energy Private Limited Mihan Power Plant, Khairy Khurd, Hingna, Nagpur Submitted in partial fulfillment for the Degree of M. Tech. in Technology & Development by Vishal Singh (Roll No. 123350007) Under the guidance of Prof. A. B. Rao Centre for Technology Alternatives for Rural Areas (CTARA), Indian Institute of Technology Bombay, Powai, Mumbai – 400076. March, 2013
-
Upload
vsingh876941 -
Category
Documents
-
view
57 -
download
0
description
The Abhijeet MADC Nagpur Energy Private Limited (AMNEPL) has a thermal power plant called the “Mihan Power Plant” situated at Khairy Khurd near Hingna in Nagpur. It is located at a distance of about 35 Kms from the railway station and about 30 Kms from the airport.The facility is located at a very secluded place away from population and the only agricultural activity seen nearby was cotton farming on the native black soil.Objective of audit Objective of auditObjective of auditObjective of audit Objective of auditObjective of audit Objective of auditThe audit was conducted in a walk through fashion on the Twelfth day of February '2013. The primary objective of this audit was to understand and estimate the quantity of energy that a thermal power plant takes as input and the amount of followed output of logical energy that it produces. Key systems and equipment studied are listed as follows:Chiller Plant Chillers Condenser water branch Cooling towersAir Handling Units Compressors Mechanical ventilation systems Indoor air quality Exhaust systemsBoiler Systems Boiler performance Feedwater pump performance Overall boiler system performance Turbines
Transcript of Energy Audit of AMNEPL (Abhijeet MADC Nagpur Energy Private Limited)

1
A Project Report (TD607)
On
Abhijeet MADC Nagpur Energy Private Limited
Mihan Power Plant, Khairy Khurd, Hingna, Nagpur
Submitted in partial fulfillment for the Degree of
M. Tech. in Technology & Development
by
Vishal Singh
(Roll No. 123350007)
Under the guidance of
Prof. A. B. Rao
Centre for Technology Alternatives for Rural Areas (CTARA),
Indian Institute of Technology Bombay,
Powai, Mumbai – 400076.
March, 2013

2
Contents List of symbols ....................................................................................................................... 3
List of subscripts .................................................................................................................... 3 Certificate by AMNEPL ............................................................................................................ 4 Executive Summary ................................................................................................................... 5 Objective of audit ....................................................................................................................... 5
Chiller Plant ........................................................................................................................... 5
Air Handling Units ................................................................................................................. 5 Boiler Systems ....................................................................................................................... 5
Introduction ................................................................................................................................ 6 Objectives of audit ................................................................................................................. 6 Methodology .......................................................................................................................... 6
Chiller Plant ............................................................................................................................... 7 Figure 1: Chiller plant operation ............................................................................................ 7 Chillers ................................................................................................................................... 8
Condenser water branch ......................................................................................................... 8
Cooling towers ....................................................................................................................... 8 Figure 2: Chiller facility......................................................................................................... 8
Air Handling Units ..................................................................................................................... 9 Figure 3: Air Handling Unit Operations ................................................................................ 9 Compressors ........................................................................................................................... 9
Mechanical ventilation systems ............................................................................................. 9 Indoor air quality.................................................................................................................... 9
Exhaust systems ..................................................................................................................... 9 Boiler Systems ......................................................................................................................... 10
Figure 4: Boiler system operation ........................................................................................ 10 Boiler details ........................................................................................................................ 10
Boiler performance .............................................................................................................. 10 Feedwater pump performance .............................................................................................. 10 Overall boiler system performance (Operating parameters) ................................................ 11 Turbine performance ............................................................................................................ 11
Other details ......................................................................................................................... 11 Total production ................................................................................................................... 11 Figure 5: Grid for distribution.............................................................................................. 11
Measures taken for energy saving............................................................................................ 12 Already implemented ........................................................................................................... 12
Under progress ..................................................................................................................... 12 Conclusions .............................................................................................................................. 13

3
List of symbols
mass flow rate kg/s
T temperature (°C)
work done (kJ/s)
heat transfer (kJ/s)
E flow energy (kJ/s)
S specific entropy (kJ/kg K)
H Specific entropy (kJ/kg)
List of subscripts
A air
F fuel
G gas
O dead state
S steam
W water
I inlet
O outlet

4
Certificate by AMNEPL

5
Executive Summary
The Abhijeet MADC Nagpur Energy Private Limited (AMNEPL) has a thermal power plant
called the “Mihan Power Plant” situated at Khairy Khurd near Hingna in Nagpur. It is located
at a distance of about 35 Kms from the railway station and about 30 Kms from the airport.
The facility is located at a very secluded place away from population and the only
agricultural activity seen nearby was cotton farming on the native black soil.
Objective of audit
The audit was conducted in a walk through fashion on the Twelfth day of February '2013.
The primary objective of this audit was to understand and estimate the quantity of energy that
a thermal power plant takes as input and the amount of followed output of logical energy that
it produces. Key systems and equipment studied are listed as follows:
Chiller Plant
Chillers
Condenser water branch
Cooling towers
Air Handling Units
Compressors
Mechanical ventilation systems
Indoor air quality
Exhaust systems
Boiler Systems
Boiler performance
Feedwater pump performance
Overall boiler system performance
Turbines

6
Introduction
Coal based thermal power plant generally operates on Rankine cycle. In ideal vapor power
cycle Carnot cycle has impracticalities associated with it which can be eliminated by
superheating the steam in the boiler and condensing it completely in the condenser. This is
achieved by the Rankine cycle.
The audit was carried out on 12th
February 2013 so as to fulfill the following objectives:
Objectives of audit
To study the energy production and consumption patterns of the of the facility
To identify energy conservation measures for implementation that take into
consideration facility’s technical and operational limitations
Brief description of facility audited
Methodology
Contact with HR department: Ms. Supriya
Fixing of appointment with HR head: 12th
February 2013, 1000 hrs
Meeting with Mr. NCSV Raju, AGM-HR & IR, Abhijet Group, Nagpur
Primary data collection: Mr. Prashant (HR)
Redirected to energy engineer: Mr. Mehul Tatia
Detailed data collection and process understanding
Recording of collected data

7
Chiller Plant
A chiller plant normally consists of evaporator pumps, chillers, condenser pumps, and
cooling towers. The evaporator pumps pump chilled water out to air handler units. They use
valves to vary the amount of chilled water entering the unit's water coil to control the
temperature of the air coming out of the unit. This process conserves energy by adding heat
back to the water which goes to the plant.
The return water from the building goes to the evaporator side of the chillers & they cool it
down, transferring the heat to the condenser side of the chillers, which is a separate water
loop again contributing to energy economy.
The condenser pumps pump the water out to the cooling towers. The water is pumped to the
top of the tower & then rains down inside it. There are big fans on the top of the tower that
pulls air through, thus across the raining water & blows it outside. This water pools up at the
bottom of the tower & is sucked back into the building to run through the condenser side of
the chillers again, thus removing the heat from the building.
The major constituents of the chiller plant are as follows:
Chillers
Condenser water branch
Cooling towers
Figure 1: Chiller plant operation1
1 http://www.energyc2.com/home/energyC2Images/coolingCycle.jpg

8
Chillers
Details of the equipment: Auxiliary Chilled water pumps
Total: 6 nos.
Flow rate: 1000 l/s
Pump head: 42.5 m
Motor power: 180 kW
Efficiency: >80%
Condenser water branch
Details of the equipment: Condenser water pump
Total: 10 nos.
Flow rate: 5500 m3/min
Pump head: 2.5 m
Motor power: 490 kW
Efficiency: >80%
Cooling towers
Condenser water supply: 38oC
Condenser water return: 28oC
Power: 75 kW
Figure 2: Chiller facility

9
Air Handling Units
Figure 3: Air Handling Unit Operations2
Major parts of the AHU are as follows:
Compressors
Mechanical ventilation systems
Indoor air quality
Exhaust systems
Compressors
Service air compressors: 8 nos.
Capacity: 160 kW/1000 cfm
Instrumentation screw type air compressors: 4 nos.
Capacity: 140 kW/750 cfm
Mechanical ventilation systems
Self-rotating type
Indoor air quality
Maintained by air conditioners
Exhaust systems
Use of long chimneys
2 http://docs.oracle.com/cd/E19065-01/servers.e25k/805-5863-13/figures/ch3-4.gif

10
Boiler Systems
Figure 4: Boiler system operation3
Major parts of the boiler system are discusses in details as follows:
Boiler details
Total: 4 nos.
Steam capacity: 250 tons/hr
Water flow rate: 255 tons/hr
Operating pressure: 98 kg/cm2
Safety measures: J seal blower
Boiler performance
Excess air: 20%
Flue gas temperature: 140oC
Temperature difference (Out-In): 110o-112
oC
Estimated boiler efficiency: 87%
Feedwater pump performance
Total: 4 nos.
Flow rate: 300 m3/hr
Head pressure: 175 kg/cm2
Power: 1600 kW
Pump efficiency: 87%
3 http://www.way2science.com/wp-content/uploads/2012/02/boiler.jpg
11
Overall boiler system performance (Operating parameters)
Steam production: 250 kg/s
Feedwater flow rate: 250 kg/s
No. of feedwater pumps in operation: 1
Total feedwater pump: 100 kW
Feedwater temperature: 240oC\
Turbine performance
Total: 4 nos.
Turbine heat rate: 2218 kcal/kWh
Auxiliary power consumption: 10.5%
Design vacuum: 0.91
Actual vacuum: 0.93
Other details
Unburnt in fly ash: 2%
Unburnt in bed ash: <1%
Total production
Overall plant heat rate: 2650 (± 20) kcal/kWh
Overall production: 4 X 61.5 MW
Overall plant efficiency: 36%
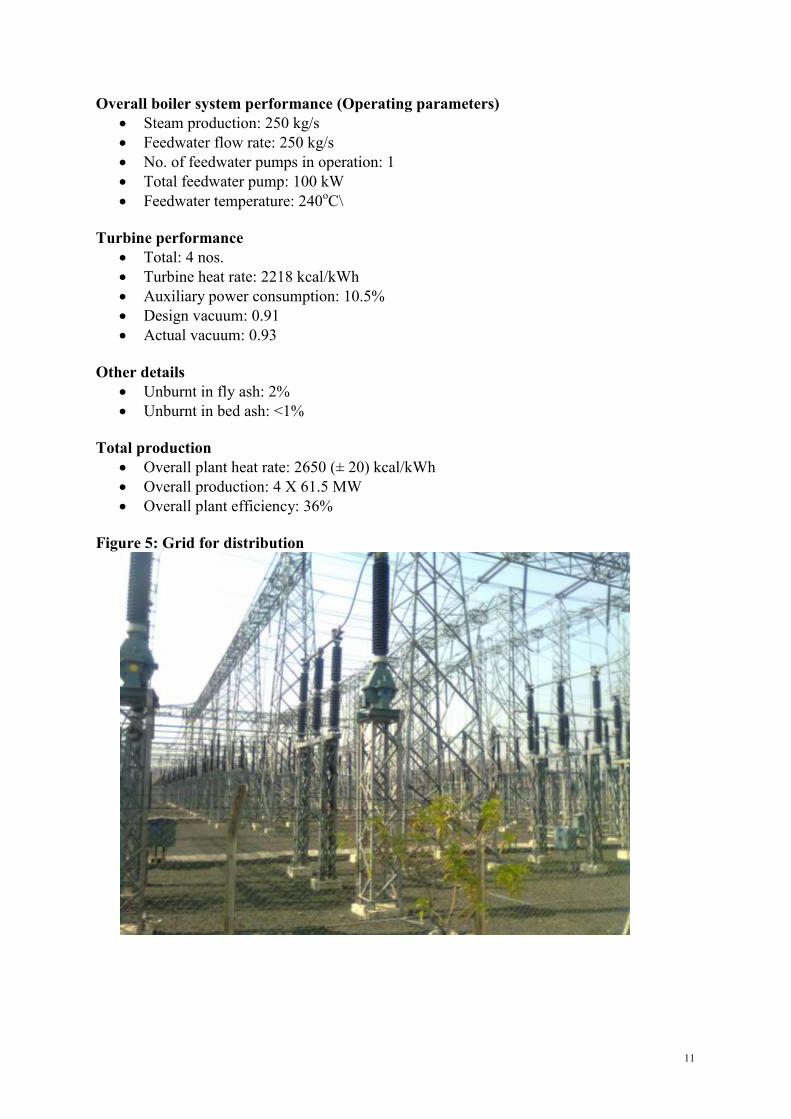
Figure 5: Grid for distribution
12
Measures taken for energy saving
The AMNEPL has undertaken some major steps in the recent years for saving of energy and
conservation of resources on the whole. Some of them are listed below:
Already implemented
₹45 lac saved in the boiler per unit (4 units of 1600 kW each) per annum by using
“Auto scoop control”.
Energy saved by 10% collectively in the boiler unit
Reduction in unburnt fly ash/bed ash as per operating philosophy is achieved
Under progress
Installation of new variable frequency drives, cooling tower fans, compressors, etc.
APH leak test in all 4 units to be conducted; heat rate reduced by ~ 250 kcal/kWh
Modification of CHP: running hours reduced to 4-5 hrs from 7-8 hrs earlier
Running capacity increased to 350 kcal/kWh from earlier 250
Vacuum improvement: earlier 0.87-0.88; now 0.91-0.93
Total improvement due to vacuum: 16 kcal/kWh (0.01% improvement)

13
Conclusions
The energy audit was successfully carried out at the premises of the Hingna Power Plant of
AMNEPL, Nagpur. This study provided valuable insights to the on-going processes in such a
thermal power plant. It also provided the knowledge that only about a third of the total energy
contained in the fuel source (coal in this case) is successfully converted to electricity and
supplied as output.
There are many transmission and leakage losses which the produced power faces before
reaching the consumer and hence the efficiency of conversion falls further down. The
leaching of resources in the form of thousands of tonnes of coal and millions of cubic meters
of water in the name of producing energy does seem wrong at so many levels. That too when
the very people of the locality have to face about 6 hours load shedding when there is 246
MW power plant running there itself.