Enel 9M2012 Results
46
Enel SpA Investor Relations 9M2012 Results November 13, 2012
-
Upload
enel-spa -
Category
Investor Relations
-
view
531 -
download
0
Transcript of Enel 9M2012 Results
Enel SpA
Investor Relations
9M2012 Results
November 13, 2012

1
Enel SpA
Investor Relations
• Opening remarks
• 9M2012 Results
• Annexes
Agenda
2
Enel SpA
Investor Relations Opening remarks
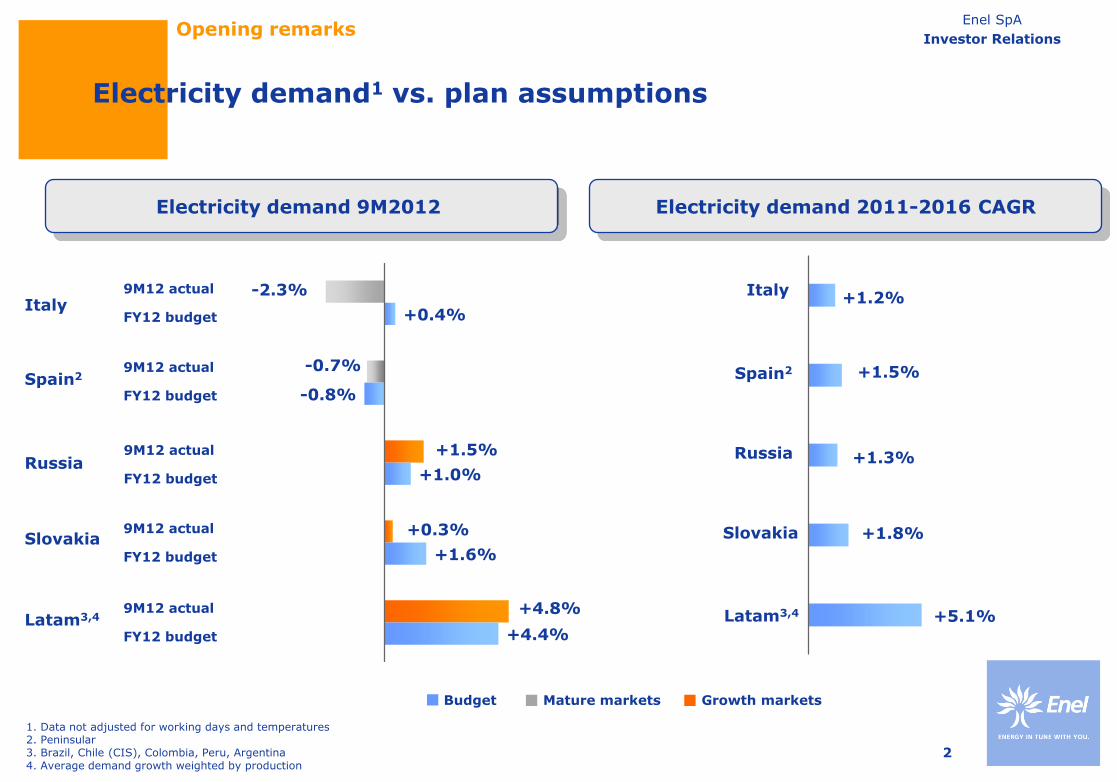
+1.2%
+1.5%
+1.3%
+1.8%
+5.1%
Electricity demand 2011-2016 CAGR
Italy
Spain2
Russia
Slovakia
Latam3,4
-2.3%
-0.7%
+1.5%
+0.3%
+4.8%
+0.4%
-0.8%
+1.0%
+1.6%
+4.4%
Electricity demand 9M2012
Italy
Spain2
Russia
Slovakia
Latam3,4
Electricity demand1 vs. plan assumptions
9M12 actual
FY12 budget
9M12 actual
FY12 budget
9M12 actual
FY12 budget
9M12 actual
FY12 budget
9M12 actual
FY12 budget
Budget Growth markets Mature markets
1. Data not adjusted for working days and temperatures 2. Peninsular 3. Brazil, Chile (CIS), Colombia, Peru, Argentina 4. Average demand growth weighted by production
3
Enel SpA
Investor Relations
• Opening remarks
• 9M2012 Results
• Annexes
Agenda
4
Enel SpA
Investor Relations
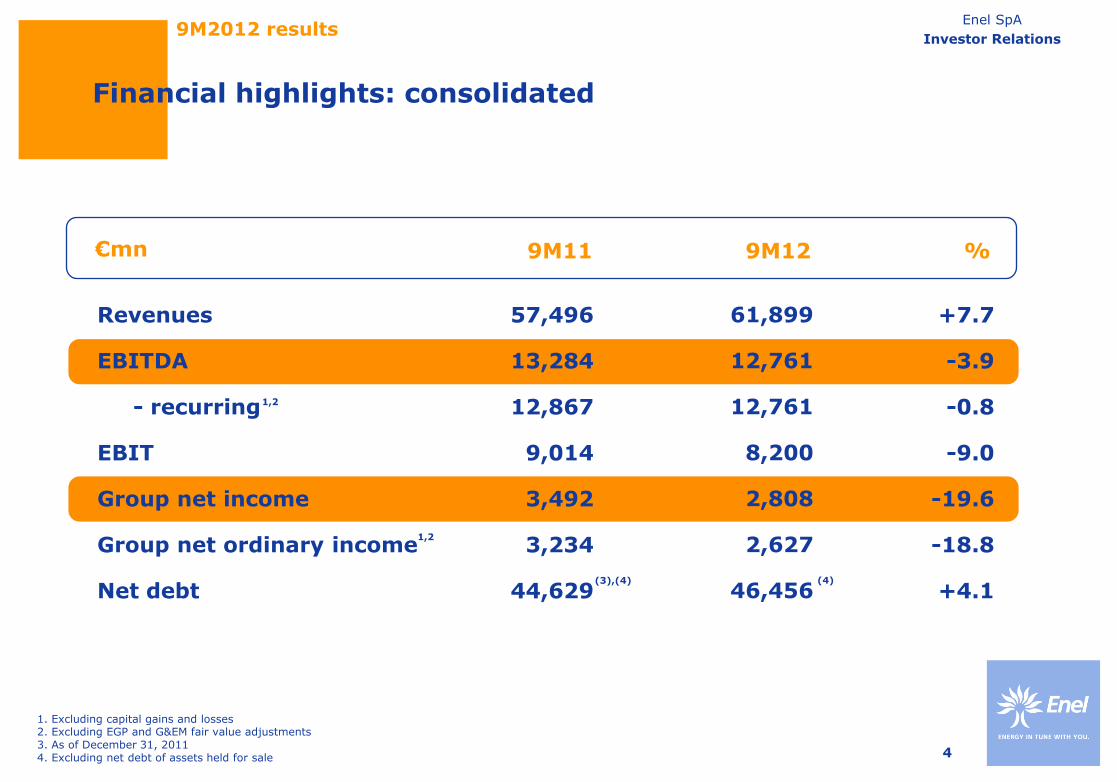
9M11 9M12 % €mn
1. Excluding capital gains and losses 2. Excluding EGP and G&EM fair value adjustments 3. As of December 31, 2011 4. Excluding net debt of assets held for sale
Revenues
EBITDA
- recurring
EBIT
Group net income
Group net ordinary income
Net debt
57,496
13,284
12,867
9,014
3,492
3,234
44,629
+7.7
-3.9
-0.8
-9.0
-19.6
-18.8
+4.1
9M2012 results
(3),(4)
61,899
12,761
12,761
8,200
2,808
2,627
46,456 (4)
Financial highlights: consolidated
1,2
1,2

5
Enel SpA
Investor Relations
EBIT
Net financial charges
Interest charges
Other
Net income from equity investments using equity method
EBT
Income tax
Net income (continuing operations & including third parties)
Minorities
Group net income
9M11 9M12 % €mn
From EBIT to Net Income
9,014
(2,338)
2,053
285
78
6,754
(2,280)
4,474
(982)
3,492
9M2012 results
8,200
(2,326)
2,148
178
65
5,939
(2,310)
3,629
(821)
2,808
-9.0
-0.5
+4.6
-37.5
-16.7
-12.1
+1.3
-18.9
-16.4
-19.6

6
Enel SpA
Investor Relations
Focus on forward electricity sales
Level of total production hedged (%)
Italy Spain
2013
100
2012 2013(2)
~ 45
~ 55
2012
2013
~ 70
~ 30
~80
2012
Latam
2013 2012
Slovakia
~ 20
Unhedged
Hedged
100
100 100
100 100
100 100
~ 20
~ 80(1)
~ 15
~ 85
1. Including roll-over 2. Not including domestic coal output
9M2012 results
~ 5
~ 95(1)

7
Enel SpA
Investor Relations
1,659 1,028
446 494
3,129 3,335
1,200 1,104
5,562 5,589
1,183 1,124
105 87
13,284 -631 12,761
1. Including Services & Holding, Engineering & Innovation, upstream gas and nuclear activities
9M11 G&EM Italy
Market Italy
I&N Italy
Iberia & Latam
9M12
-3.9%
Inter-national
EGP
Market
I&N
Other1
G&EM
Iberia & Latam International
EGP
Group EBITDA evolution (€mn)
9M2012 results
+48 +206 -96 +27 -59 -18
Other
8
Enel SpA
Investor Relations
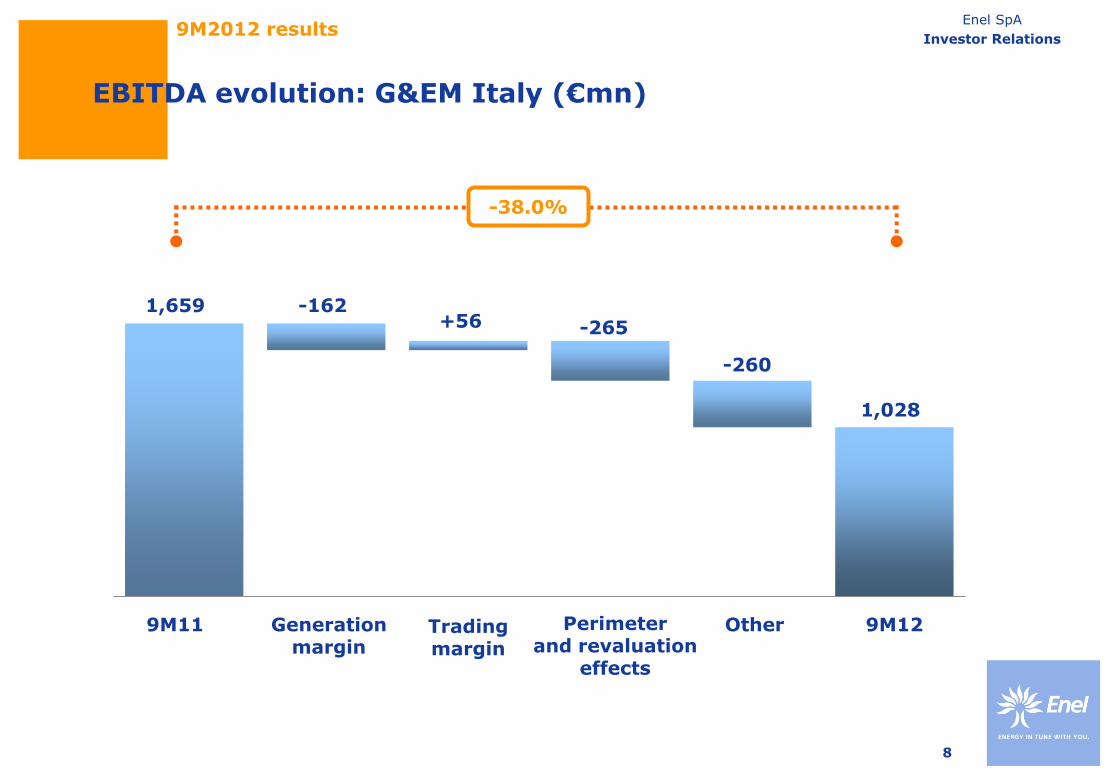
EBITDA evolution: G&EM Italy (€mn)
9M2012 results
9M11 Generation margin
9M12
-38.0%
Trading margin
Other
-162 +56
-260
1,659
1,028
Perimeter and revaluation
effects
-265

9
Enel SpA
Investor Relations
+16
9M11 Regulated market
9M12 Free market
446 +32
494
+10.8%
9M2012 results
EBITDA evolution: Market Italy (€mn)
10
Enel SpA
Investor Relations
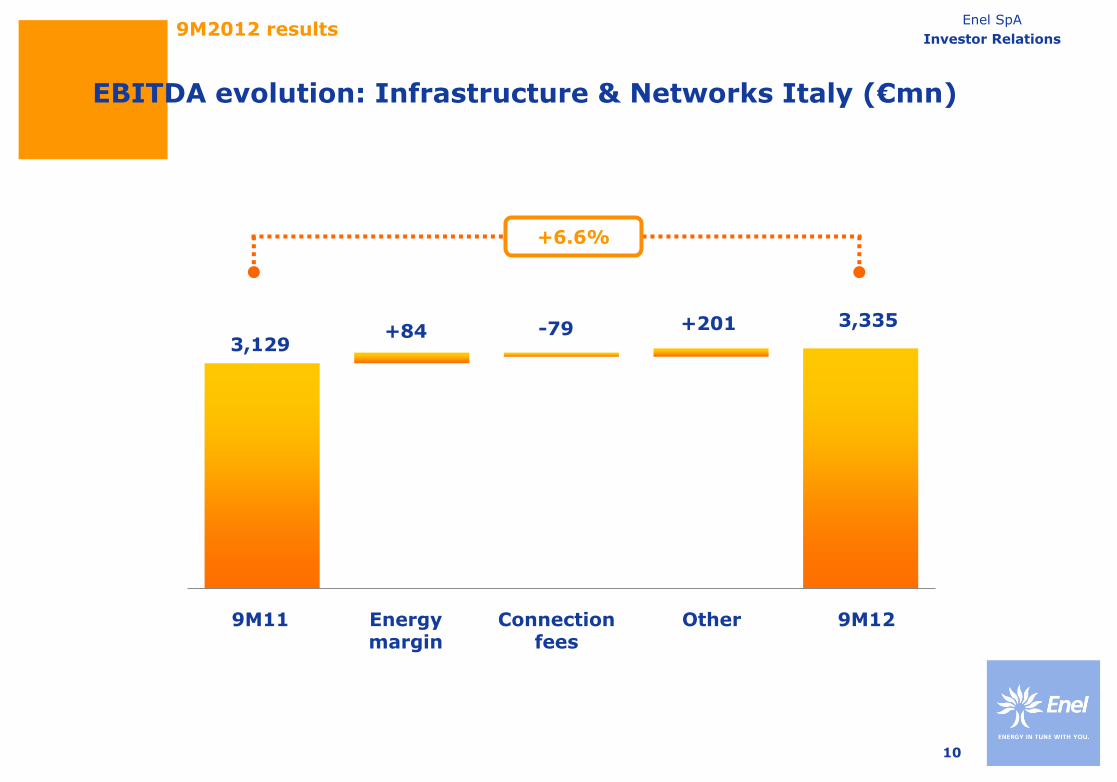
EBITDA evolution: Infrastructure & Networks Italy (€mn)
+84
9M11 Connection fees
9M12 Energy margin
3,129 -79 3,335
+6.6%
+201
Other
9M2012 results
11
Enel SpA
Investor Relations
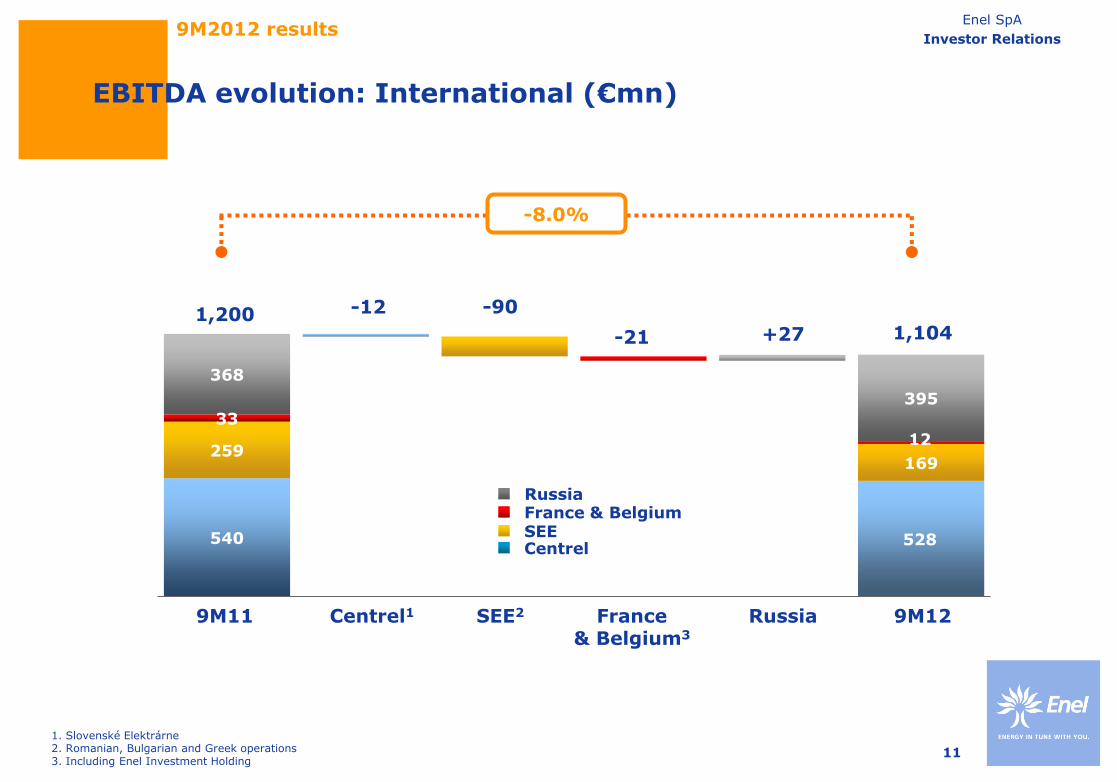
540 528
259 169
33
12
368
395
1,200 -12 -90
1,104 -21
9M11 9M12 Russia SEE2 France & Belgium3
SEE France & Belgium
Centrel
Russia
-8.0%
EBITDA evolution: International (€mn)
9M2012 results
1. Slovenské Elektrárne 2. Romanian, Bulgarian and Greek operations 3. Including Enel Investment Holding
Centrel1
+27
12
Enel SpA
Investor Relations
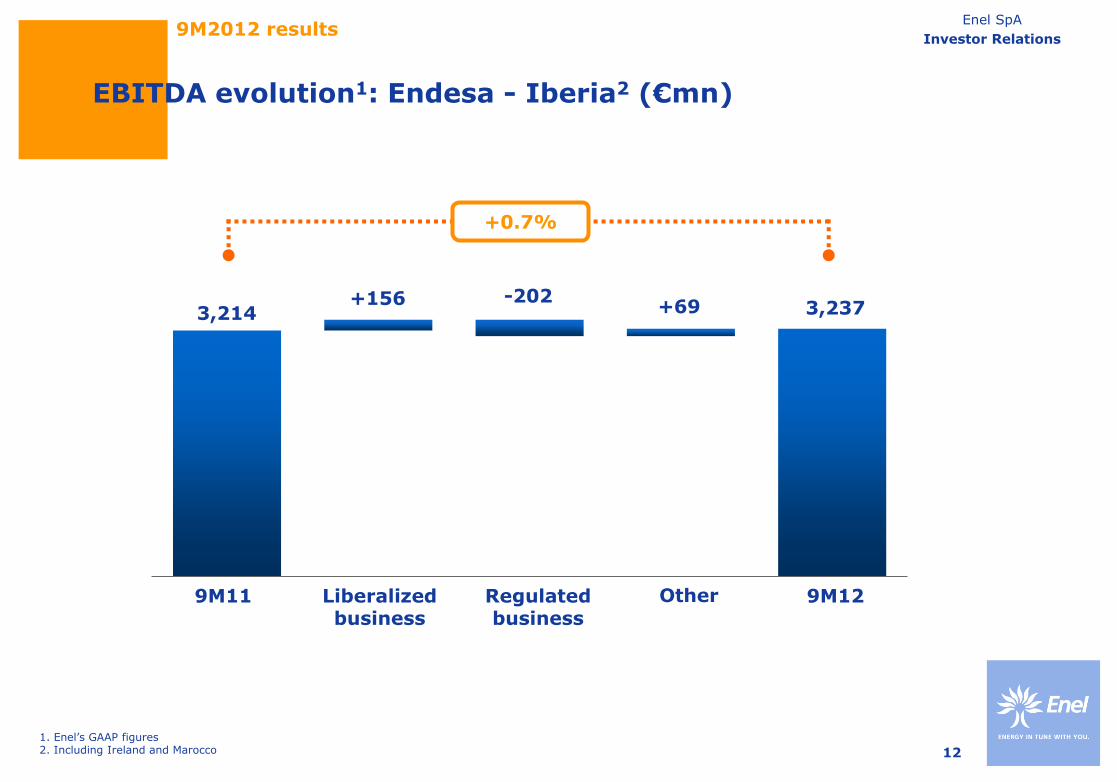
EBITDA evolution1: Endesa - Iberia2 (€mn)
9M2012 results
1. Enel’s GAAP figures 2. Including Ireland and Marocco
3,237 3,214
9M11
+0.7%
Liberalized business
Regulated business
9M12
+156 -202 +69
Other
13
Enel SpA
Investor Relations
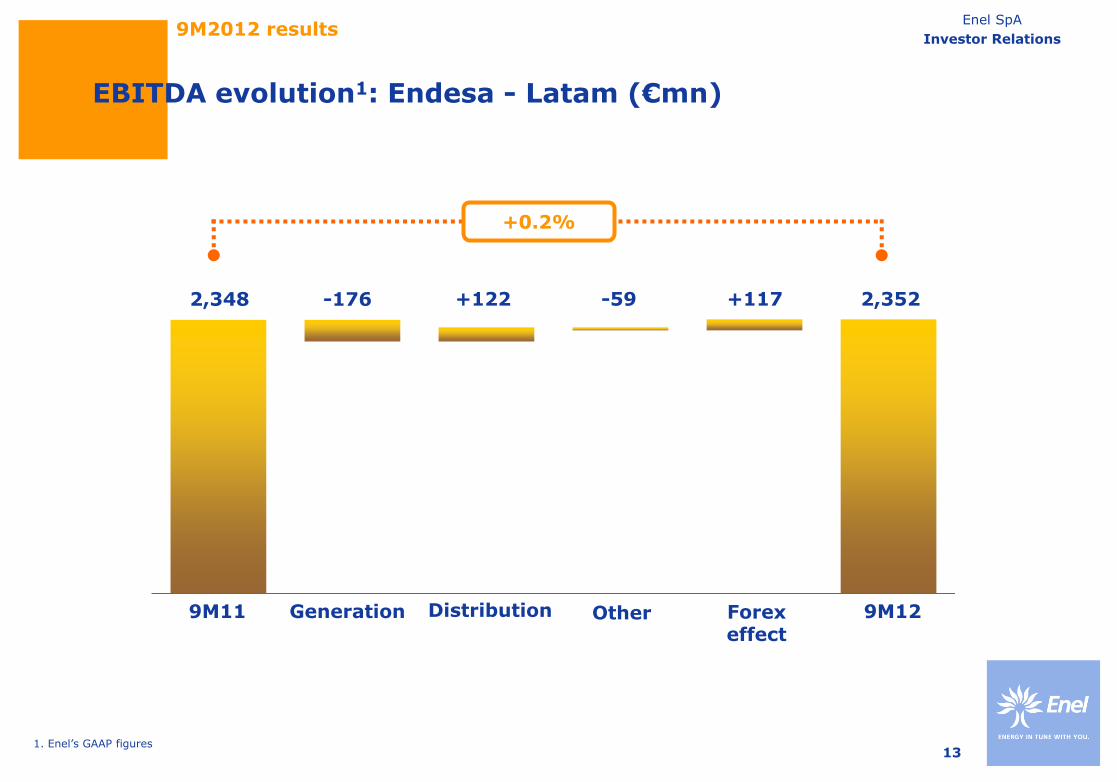
EBITDA evolution1: Endesa - Latam (€mn)
9M2012 results
1. Enel’s GAAP figures
2,352 2,348
9M11
+0.2%
Generation Distribution
9M12
-176 +122 -59
Other
+117
Forex effect
14
Enel SpA
Investor Relations
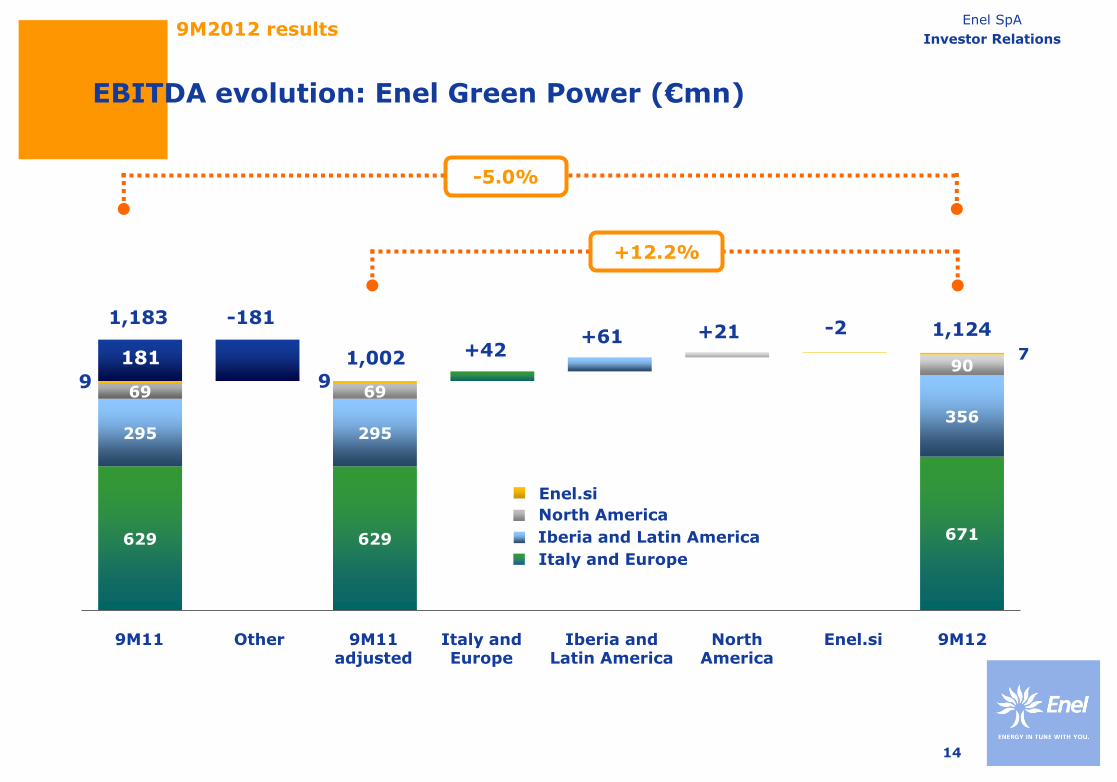
629 629 671
295 295 356
69 69
90
EBITDA evolution: Enel Green Power (€mn)
9M2012 results
+12.2%
9M11 Italy and Europe
9M12 North America
Other Iberia and Latin America
181
-181
+42 1,002
+21 1,124
Enel.si
Italy and Europe
Iberia and Latin America
North America
Enel.si
+61
9M11 adjusted
-2
7
9 9
1,183
-5.0%
15
Enel SpA
Investor Relations
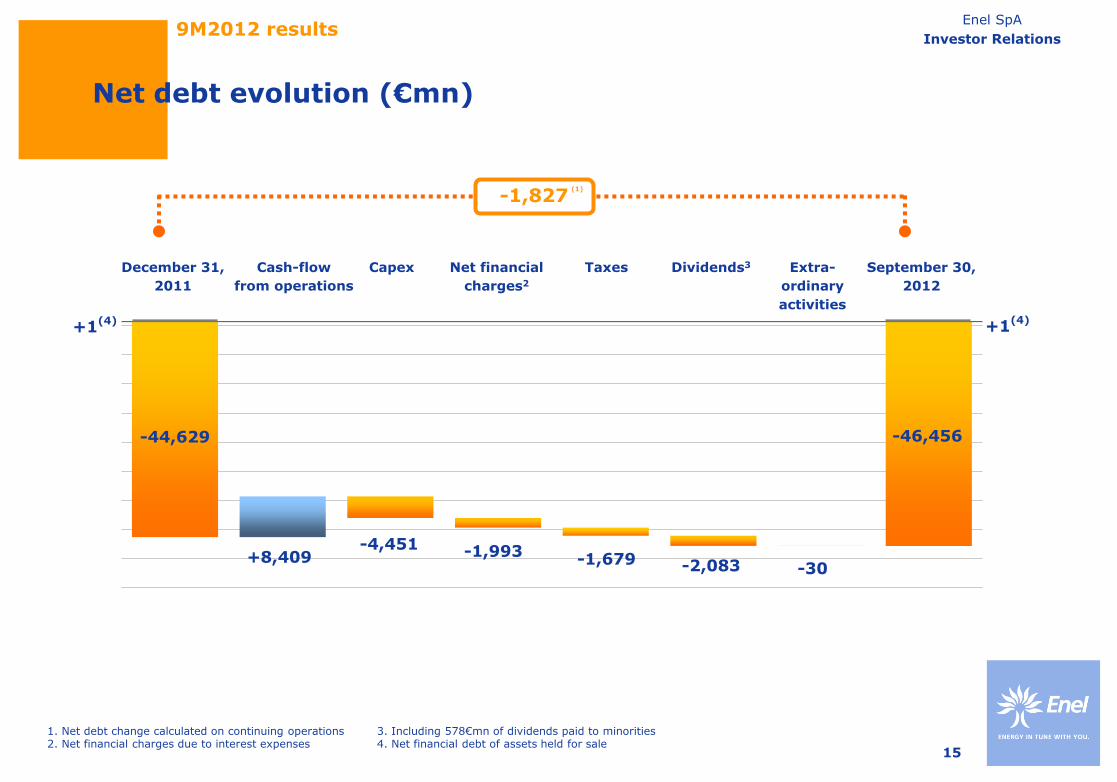
Net debt evolution (€mn)
9M2012 results
1. Net debt change calculated on continuing operations 2. Net financial charges due to interest expenses
3. Including 578€mn of dividends paid to minorities 4. Net financial debt of assets held for sale
-1,827 (1)
December 31,
2011
Capex Cash-flow
from operations
Net financial
charges2
Extra-
ordinary
activities
September 30,
2012
Dividends3
-44,629 -46,456
+8,409 -4,451 -1,993
-2,083 -30
Taxes
-1,679
+1(4)
+1(4)
16
Enel SpA
Investor Relations
• Opening remarks
• 9M2012 Results
• Annexes
Agenda
17
Enel SpA
Investor Relations
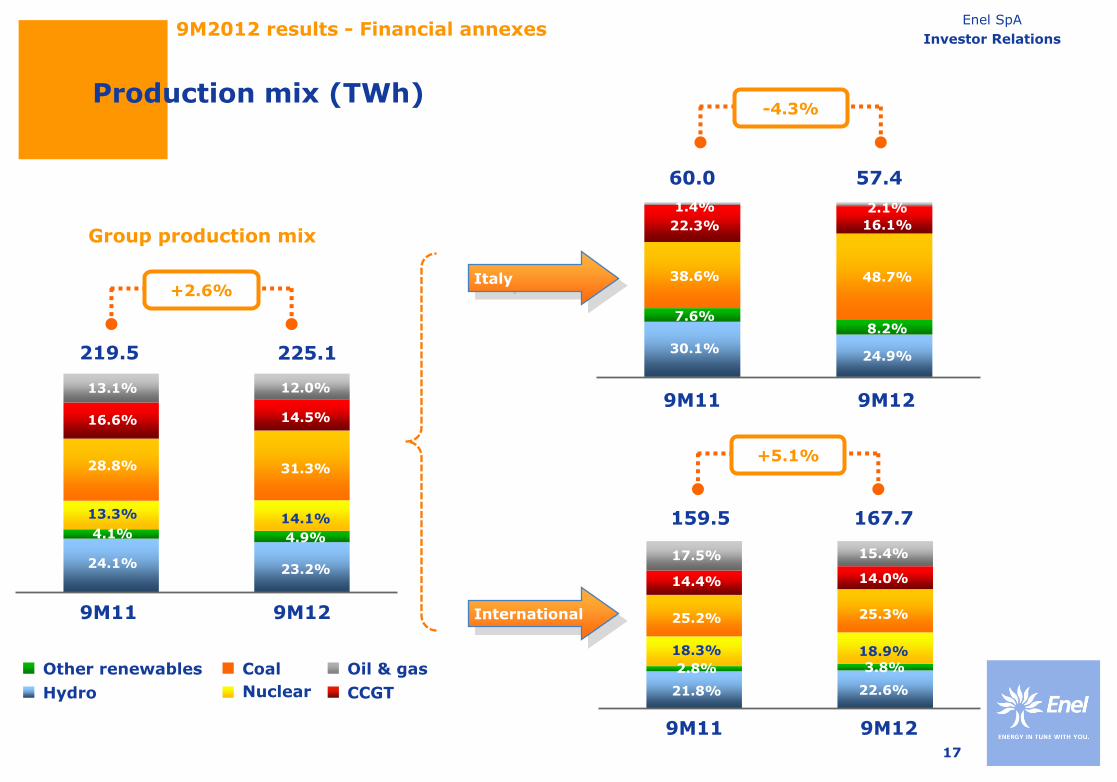
Group production mix
CCGT
Oil & gas Coal
Nuclear
Other renewables
Hydro
225.1 219.5
+2.6%
57.4 60.0
-4.3%
167.7 159.5
+5.1%
Italy
9M11 9M12
9M11 9M12
9M11 9M12
Production mix (TWh)
17.5%
14.4%
25.2%
21.8%
2.8%
18.3%
1.4%
22.3%
38.6%
30.1%
7.6%
13.1%
16.6%
28.8%
13.3%
4.1%
24.1%
12.0%
14.5%
31.3%
14.1%
4.9%
23.2%
2.1%
16.1%
48.7%
24.9%
8.2%
15.4%
14.0%
25.3%
22.6%
3.8% 18.9%
International
9M2012 results - Financial annexes
18
Enel SpA
Investor Relations
-
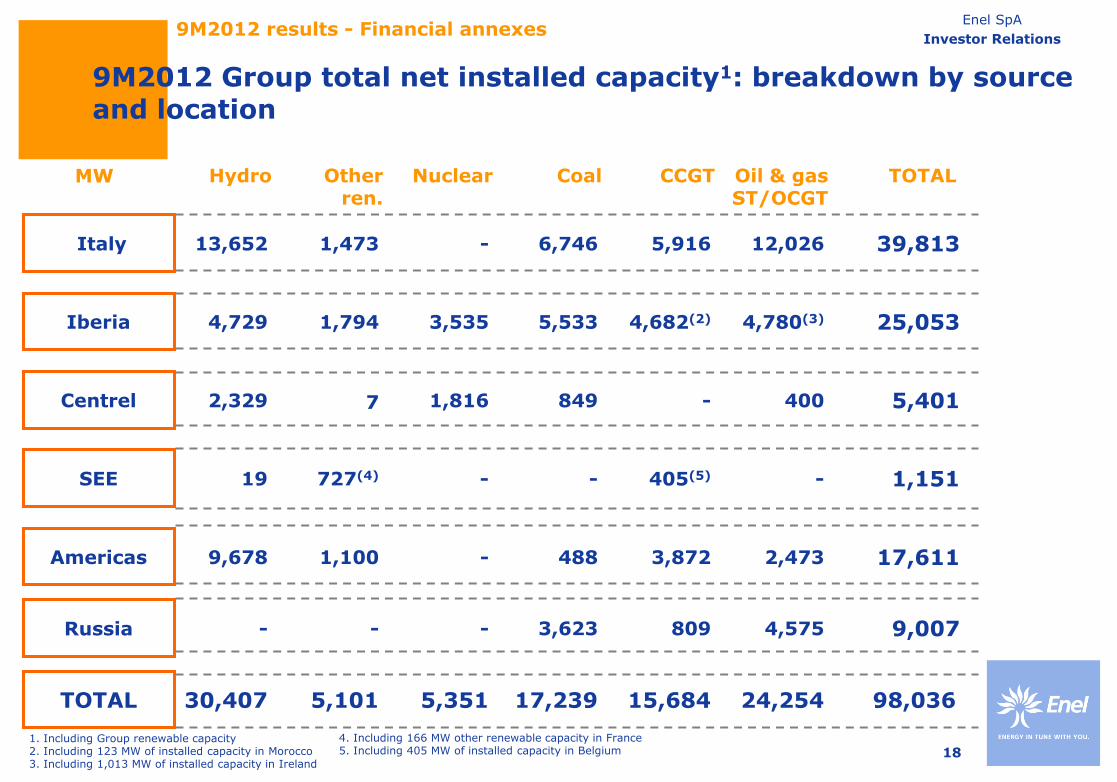
5,401
Other ren.
1,473
1,794
7
727(4)
1,100
5,101
MW Hydro
13,652
4,729
2,329
19
9,678
30,407
Nuclear
-
3,535
1,816
-
-
5,351
Coal
6,746
5,533
849
488
17,239
Oil & gas ST/OCGT
12,026
4,780(3)
400
-
2,473
24,254
Iberia
Centrel
Italy
SEE
Americas
TOTAL
CCGT
5,916
4,682(2)
-
405(5)
3,872
15,684
1. Including Group renewable capacity 2. Including 123 MW of installed capacity in Morocco 3. Including 1,013 MW of installed capacity in Ireland
- - - 3,623 4,575 Russia 809
TOTAL
39,813
25,053
1,151
17,611
9,007
98,036
4. Including 166 MW other renewable capacity in France 5. Including 405 MW of installed capacity in Belgium
9M2012 Group total net installed capacity1: breakdown by source and location
9M2012 results - Financial annexes
19
Enel SpA
Investor Relations
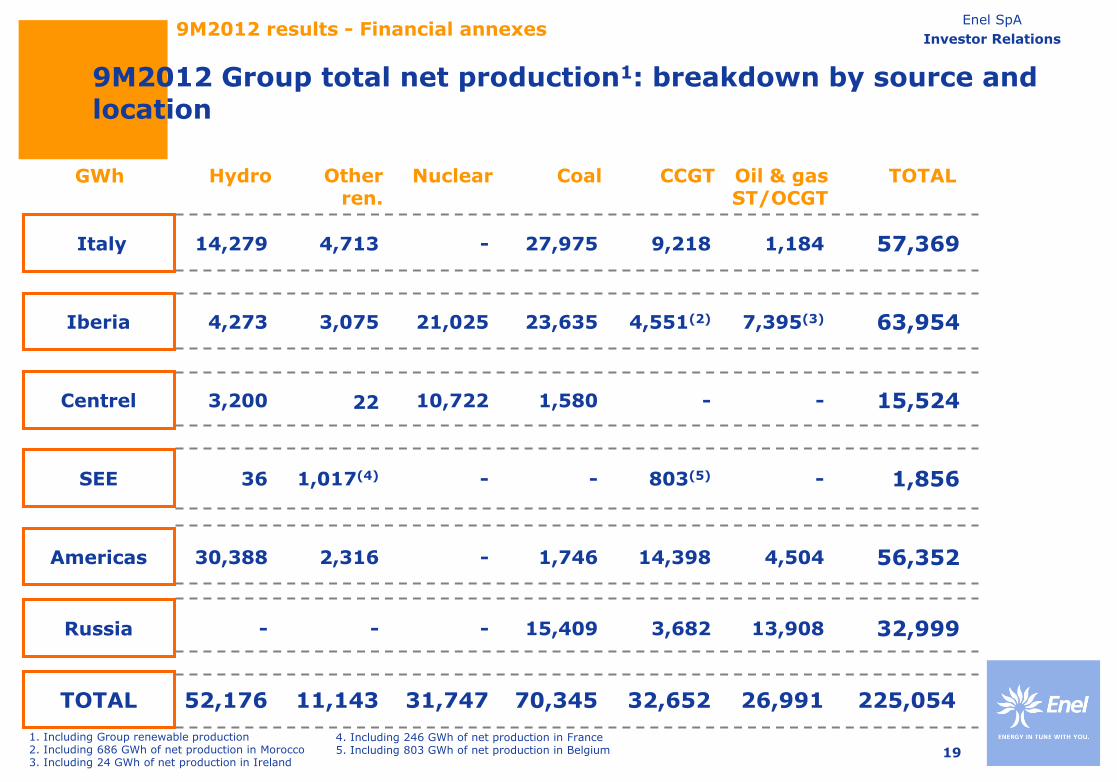
GWh Hydro Nuclear Coal Oil & gas ST/OCGT
Iberia
Centrel
Italy
SEE
Americas
TOTAL
CCGT
1. Including Group renewable production 2. Including 686 GWh of net production in Morocco 3. Including 24 GWh of net production in Ireland
Russia
TOTAL
4. Including 246 GWh of net production in France 5. Including 803 GWh of net production in Belgium
9M2012 Group total net production1: breakdown by source and location
Other ren.
-
15,524
4,713
3,075
22
1,017(4)
2,316
11,143
14,279
4,273
3,200
36
30,388
52,176
-
21,025
10,722
-
-
31,747
27,975
23,635
1,580
1,746
70,345
1,184
7,395(3)
-
-
4,504
26,991
9,218
4,551(2)
-
803(5)
14,398
32,652
- - - 15,409 13,908 3,682
57,369
63,954
1,856
56,352
32,999
225,054
9M2012 results - Financial annexes
20
Enel SpA
Investor Relations
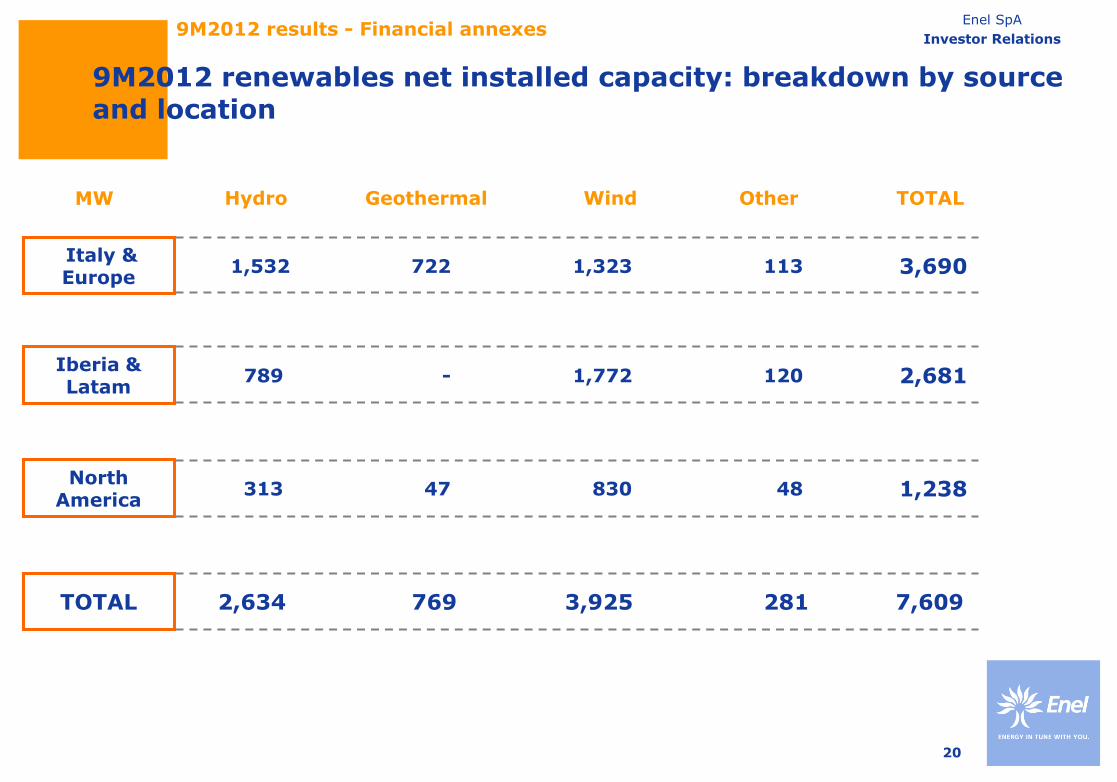
Geothermal MW Wind Other TOTAL Hydro
830
722
-
47
1,532
789
313
2,634 769
1,323
1,772
3,925
113
120
48
281
Iberia & Latam
Italy & Europe
North America
TOTAL
3,690
2,681
1,238
7,609
9M2012 renewables net installed capacity: breakdown by source and location
9M2012 results - Financial annexes
21
Enel SpA
Investor Relations
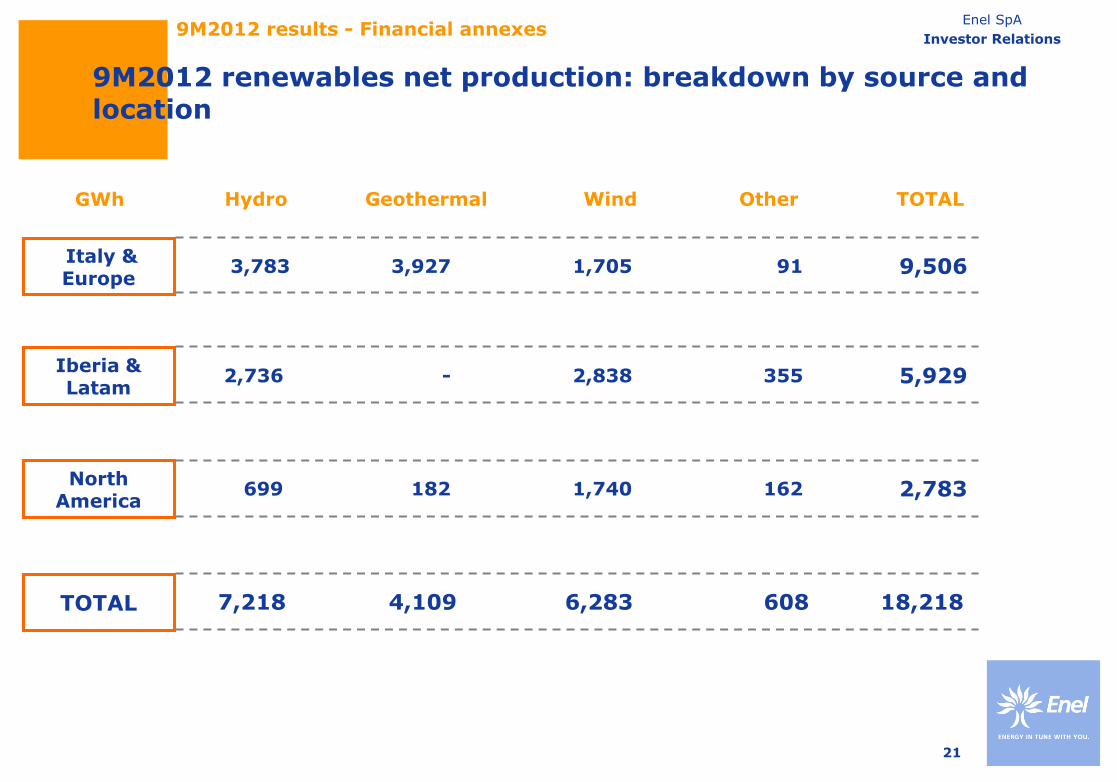
Hydro Wind Other TOTAL Geothermal GWh
Iberia & Latam
Italy & Europe
North America
TOTAL
9M2012 renewables net production: breakdown by source and location
1,740
3,927
-
182
3,783
2,736
699
7,218 4,109
1,705
2,838
6,283
91
355
162
608
9,506
5,929
2,783
18,218
9M2012 results - Financial annexes
22
Enel SpA
Investor Relations
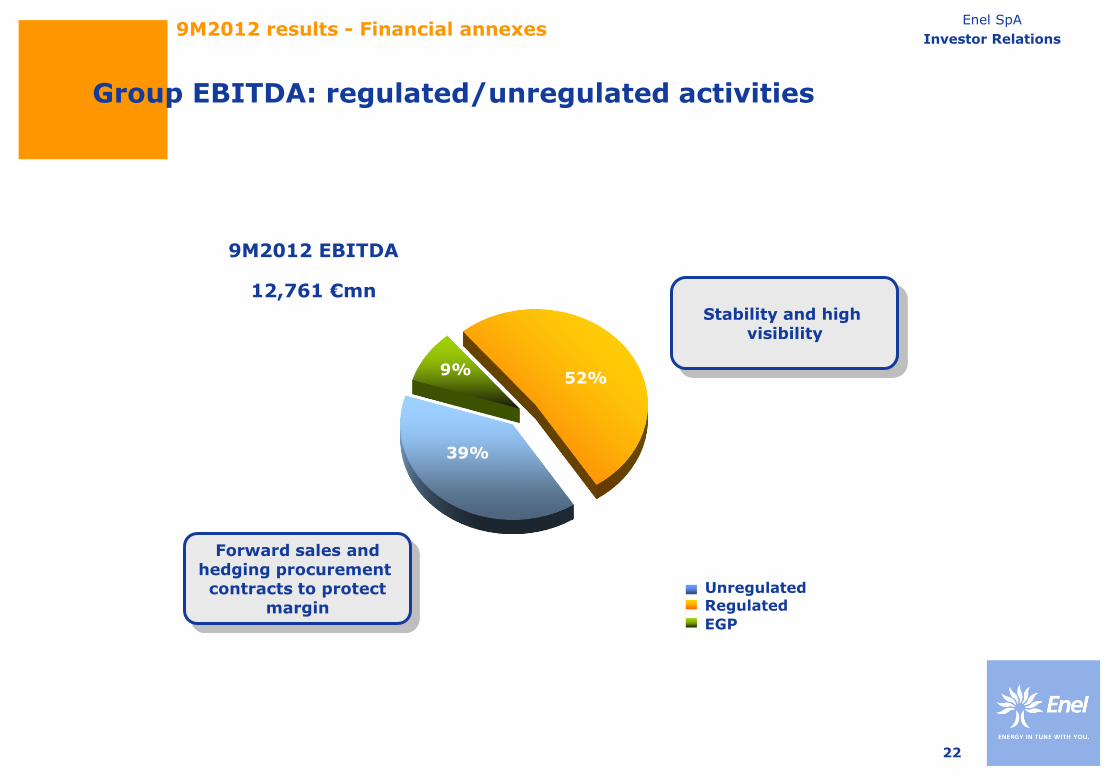
52%
39%
9%
9M2012 EBITDA
12,761 €mn
Unregulated
Regulated
EGP
Forward sales and
hedging procurement contracts to protect
margin
Stability and high
visibility
Group EBITDA: regulated/unregulated activities
9M2012 results - Financial annexes

23
Enel SpA
Investor Relations
<12m 4Q13 2015 2016 After 2016
Endesa
Enel Group (excluding Endesa)
4,218
460
6,015 5,115
35,797
6 years and 9 month Average cost of gross debt: 4.9%
2014
9,009
9M2012 results - Financial annexes
Enel’s long-term debt maturity profile (€mn)
Bonds Bank loans and others
3,067
1,151
2,189
2,029 793 233
1,152
4,863
713
4,402
3,226
5,783
3,429
32,368
227
24
Enel SpA
Investor Relations
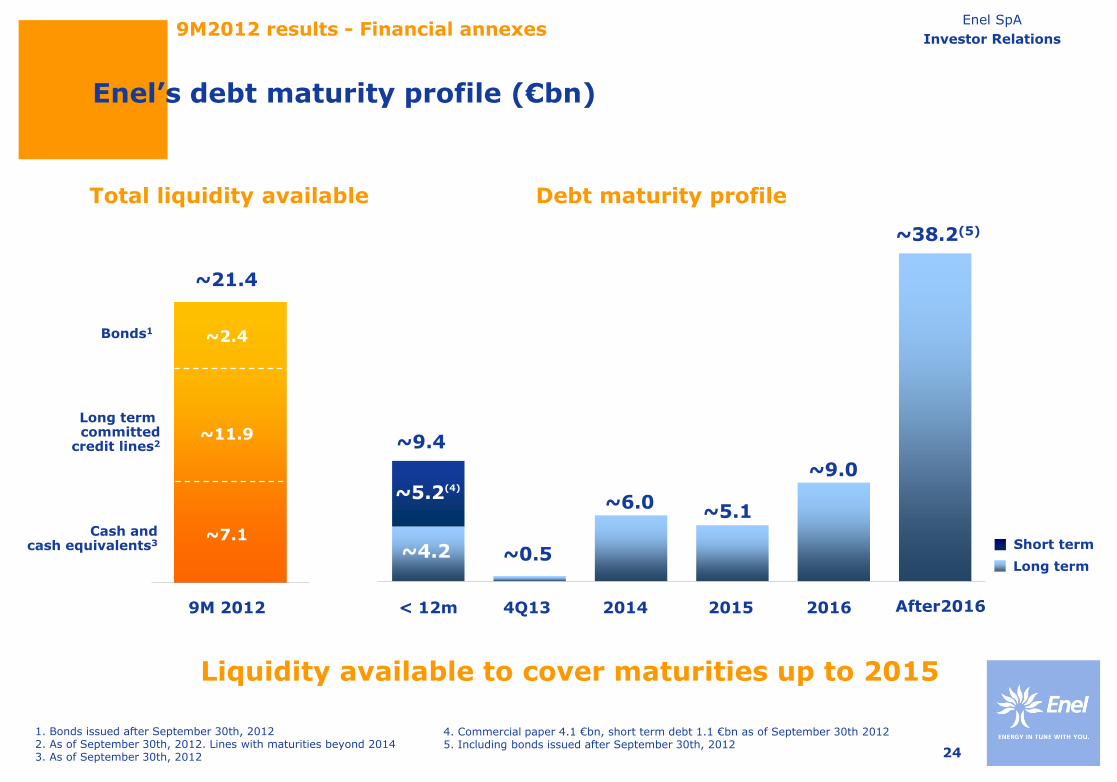
Enel’s debt maturity profile (€bn)
Debt maturity profile Total liquidity available
9M2012 results - Financial annexes
Liquidity available to cover maturities up to 2015
9M 2012
~21.4
Cash and cash equivalents3
Long term
1. Bonds issued after September 30th, 2012 2. As of September 30th, 2012. Lines with maturities beyond 2014 3. As of September 30th, 2012
Long term committed
credit lines2 ~11.9
~7.1
< 12m 4Q13 2014 2015 2016 After2016
~9.4
~0.5
~6.0 ~5.1
~9.0
~38.2(5)
~5.2(4)
~4.2 Short term
~2.4 Bonds1
4. Commercial paper 4.1 €bn, short term debt 1.1 €bn as of September 30th 2012 5. Including bonds issued after September 30th, 2012
25
Enel SpA
Investor Relations
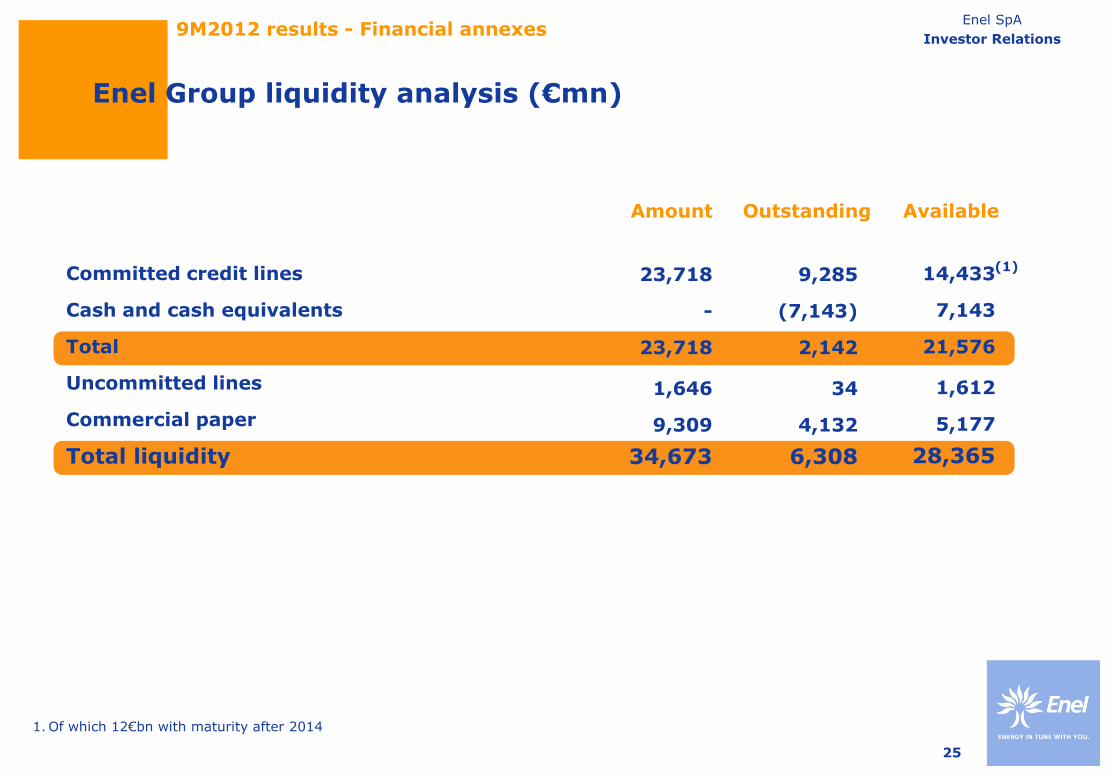
Committed credit lines
Cash and cash equivalents
Total
Uncommitted lines
Commercial paper
Total liquidity
Amount Available Outstanding
23,718
-
23,718
1,646
9,309
34,673
1. Of which 12€bn with maturity after 2014
9,285
(7,143)
2,142
34
4,132
6,308
14,433
7,143
21,576
1,612
5,177
28,365
(1)
Enel Group liquidity analysis (€mn)
9M2012 results - Financial annexes
26
Enel SpA
Investor Relations
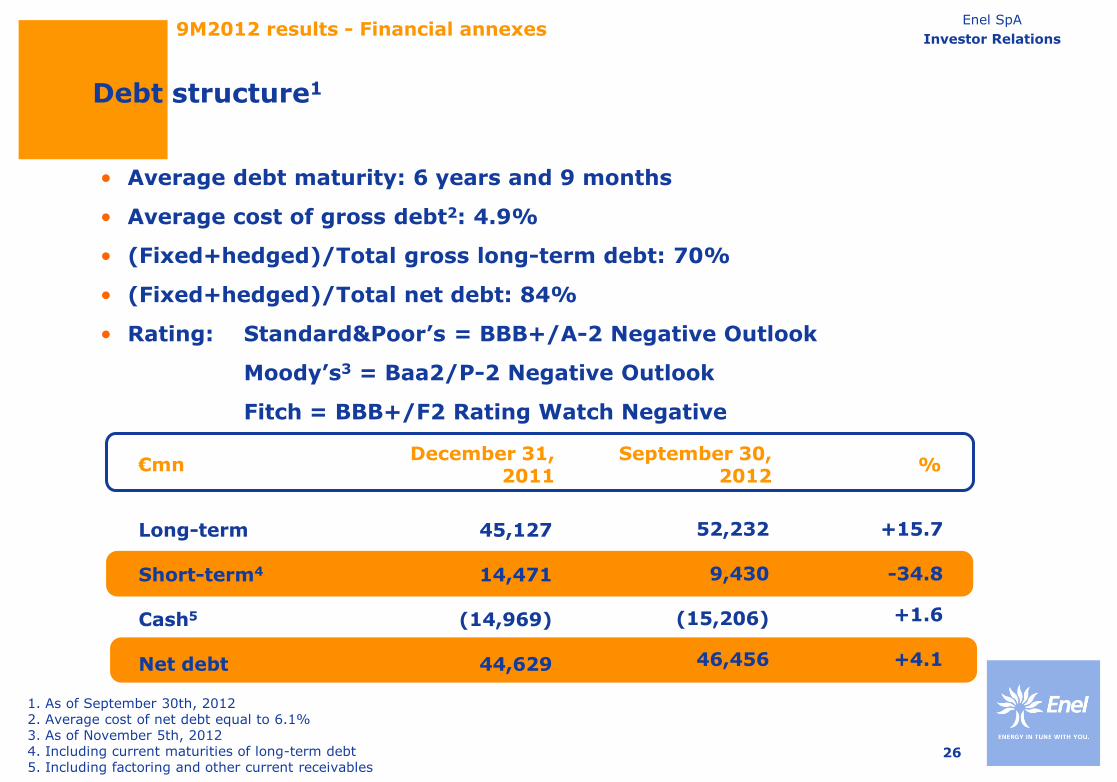
Debt structure1
• Average debt maturity: 6 years and 9 months
• Average cost of gross debt2: 4.9%
• (Fixed+hedged)/Total gross long-term debt: 70%
• (Fixed+hedged)/Total net debt: 84%
• Rating: Standard&Poor’s = BBB+/A-2 Negative Outlook
Moody’s3 = Baa2/P-2 Negative Outlook
Fitch = BBB+/F2 Rating Watch Negative
1. As of September 30th, 2012 2. Average cost of net debt equal to 6.1% 3. As of November 5th, 2012 4. Including current maturities of long-term debt 5. Including factoring and other current receivables
December 31, 2011
% €mn September 30,
2012
45,127
14,471
(14,969)
44,629
Long-term Short-term4
Cash5
Net debt
52,232
9,430
(15,206)
46,456
+15.7
-34.8
+1.6
+4.1
9M2012 results - Financial annexes

27
Enel SpA
Investor Relations
€mn
Bank loans – maturities > 12m Bonds – maturities > 12m Preference shares > 12m Other loans – maturities > 12m Financial receivables – maturities > 12m Total net LT debt - maturities > 12m Bank loans – maturities < 12m Bonds – maturities < 12m Preference shares < 12m Other loans – maturities < 12m Financial receivables – maturities < 12m Total net LT debt - maturities < 12m Other ST bank debt Commercial paper Cash Collateral and other derivatives payables Other ST financial debt ST debt Factoring receivables Cash Collateral and other derivatives receivables Other ST financial receivables Cash at banks and marketable securities Total net ST debt (incl. current maturities) Net financial debt
Enel Group (excluding Endesa)
12.31.2011
09.30.2012
12.31.2011 09.30.2012
Group - Total
09.30.2012
Endesa
1. As of September 30th, 2012
8,333
32,445 -
398 -2,499
38,677
4,199 1,075
- 139
-110 5,303
826
2,016 650
4 3,496
-370
-1,076 -592
-4,313 2,448
41,125
11,918 35,225
- 501
-3,092
44,552
417 1,699
- 72
-84 2,104
92
3,547 855 16
4,510
-283 -1,214
-270 -5,436
-589
43,963
1,585 5,016
180 746
-1,077
6,450
2,695 1,398
- 166
-5,522 -1,263
62
1,188 -
53 1,303
- -
-232 -2,754 -2,946
3,504
Enel’s group financial debt evolution1
3,970 4,087
- 695
-1,072
7,680
324 1,368
180 158
-5,957 -3,927
58
582 -
62 702
- -
-186 -1,776 -5,187
2,493
15,888 39,312
- 1,196
-4,164
52,232
741 3,067
180 230
-6,041 -1,823
150
4,129 855 78
5,212
-283 -1,214
-456 -7,212 -5,776
46,456
9M2012 results - Financial annexes
28
Enel SpA
Investor Relations
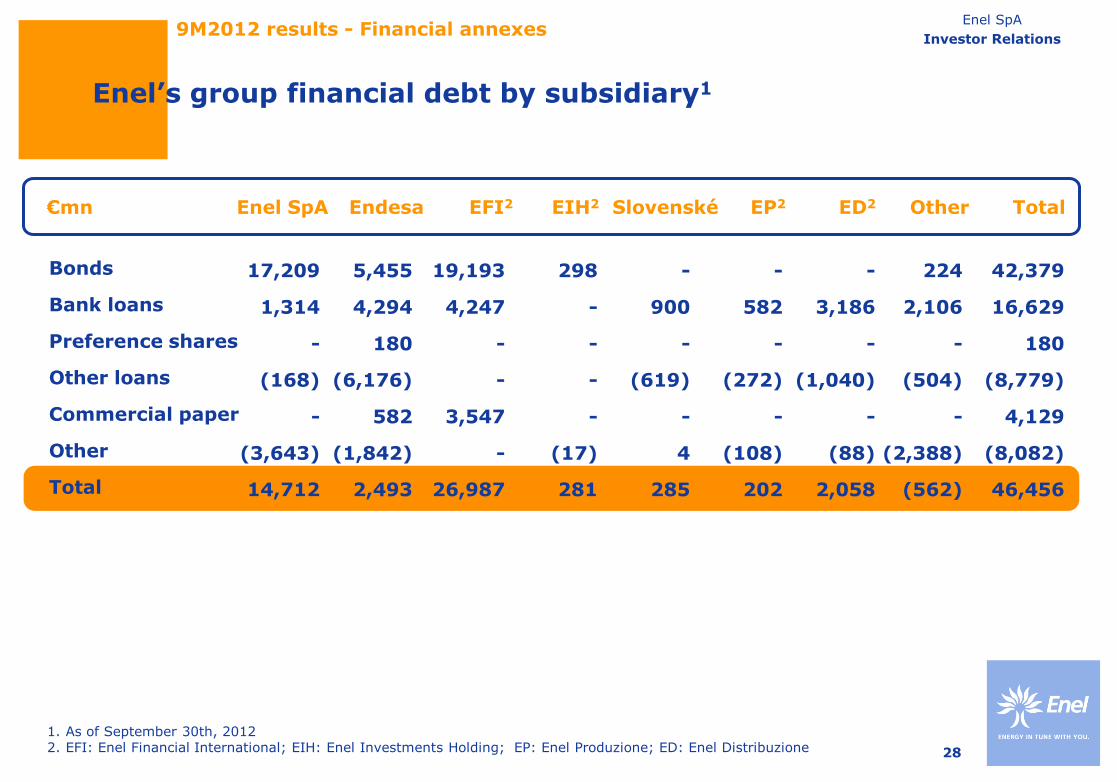
Enel SpA Slovenské €mn EFI2 Other Total Endesa EIH2 EP2 ED2
Bonds
Bank loans
Preference shares
Other loans
Commercial paper
Other
Total
1. As of September 30th, 2012 2. EFI: Enel Financial International; EIH: Enel Investments Holding; EP: Enel Produzione; ED: Enel Distribuzione
17,209
1,314
-
(168)
-
(3,643)
14,712
Enel’s group financial debt by subsidiary1
42,379
16,629
180
(8,779)
4,129
(8,082)
46,456
224
2,106
-
(504)
-
(2,388)
(562)
-
3,186
-
(1,040)
-
(88)
2,058
-
582
-
(272)
-
(108)
202
-
900
-
(619)
-
4
285
298
-
-
-
-
(17)
281
5,455
4,294
180
(6,176)
582
(1,842)
2,493
19,193
4,247
-
-
3,547
-
26,987
9M2012 results - Financial annexes

29
Enel SpA
Investor Relations
Average residual maturity (years:months)
Net financial debt (€bn)
Enel’s group financial debt
4.6% 4.9% 4.9%
2010 2011 9M12
5.5% 5.9% 6.1%
2010 2011 9M12
Fixed + Hedged /Total net debt
Fixed + Hedged /Total gross long term debt
Average cost of net debt Average cost of gross debt
93% 96% 84%
2010 2011 9M12
79% 78% 70%
2010 2011 9M12
44.9 44.6
46.5
2010 2011 9M12
6:8 6:7
6:9
2010 2011 9M12
9M2012 results - Financial annexes
30
Enel SpA
Investor Relations
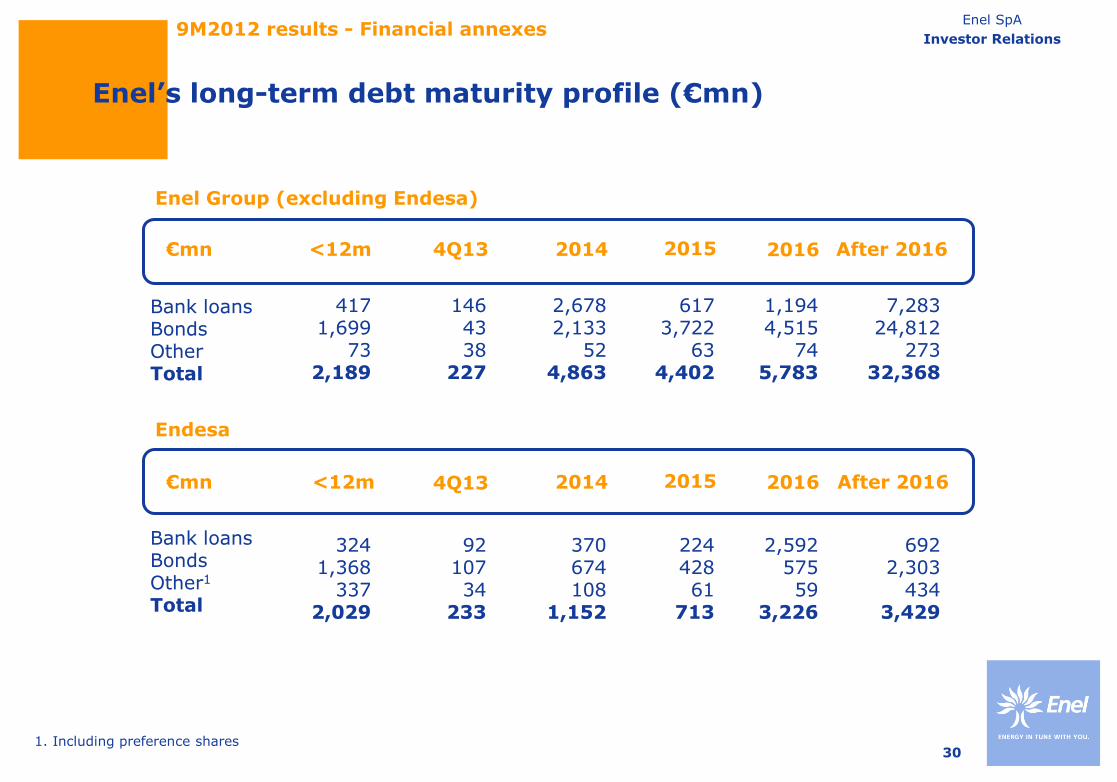
1. Including preference shares
€mn
Bank loans Bonds Other Total
<12m
Enel Group (excluding Endesa)
4Q13 2014 After 2016
€mn
Bank loans Bonds Other1
Total
<12m
Endesa
2014 After 2016
2015
2015
2016
2016
146 43 38
227
417 1,699
73 2,189
2,678 2,133
52 4,863
617 3,722
63 4,402
7,283 24,812
273 32,368
1,194 4,515
74 5,783
Enel’s long-term debt maturity profile (€mn)
92 107 34
233
324 1,368
337 2,029
370 674 108
1,152
224 428 61
713
692 2,303
434 3,429
2,592 575 59
3,226
4Q13
9M2012 results - Financial annexes
31
Enel SpA
Investor Relations
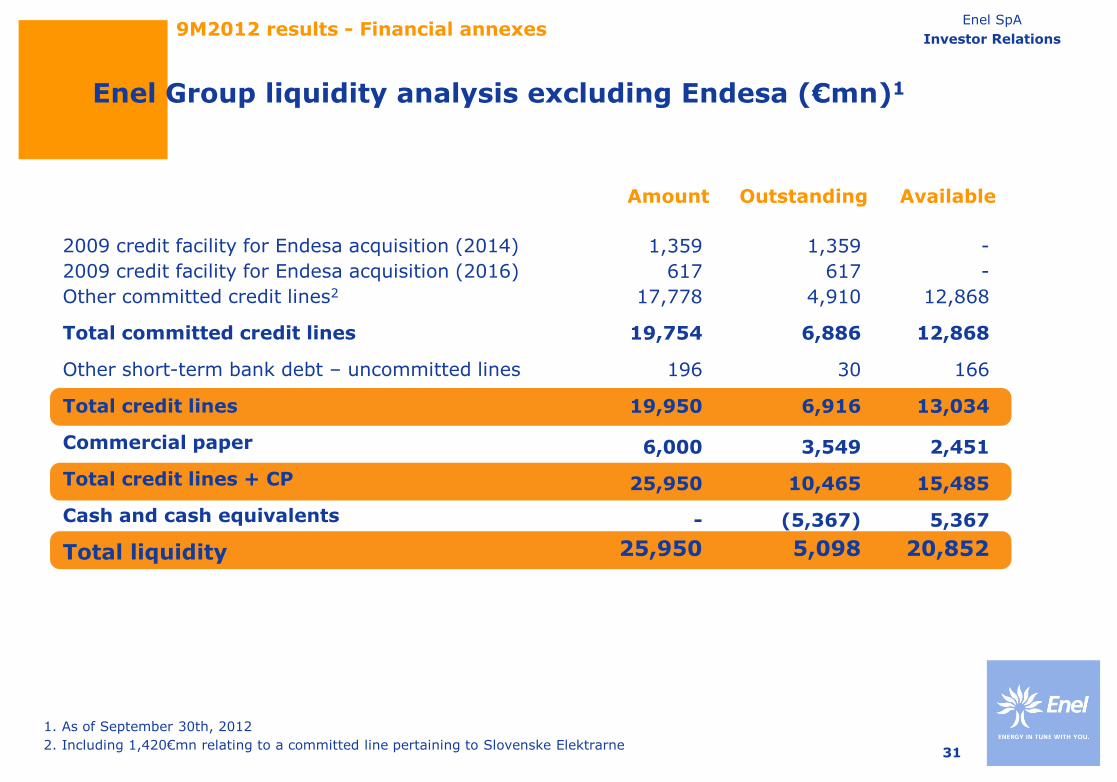
1. As of September 30th, 2012
2. Including 1,420€mn relating to a committed line pertaining to Slovenske Elektrarne
2009 credit facility for Endesa acquisition (2014)
2009 credit facility for Endesa acquisition (2016)
Other committed credit lines2
Total committed credit lines
Other short-term bank debt – uncommitted lines
Total credit lines
Commercial paper
Total credit lines + CP
Cash and cash equivalents
Total liquidity
Amount Available Outstanding
1,359
617
17,778
19,754
196
19,950
6,000
25,950
-
25,950
1,359
617
4,910
6,886
30
6,916
3,549
10,465
(5,367)
5,098
-
-
12,868
12,868
166
13,034
2,451
15,485
5,367
20,852
Enel Group liquidity analysis excluding Endesa (€mn)1
9M2012 results - Financial annexes
32
Enel SpA
Investor Relations
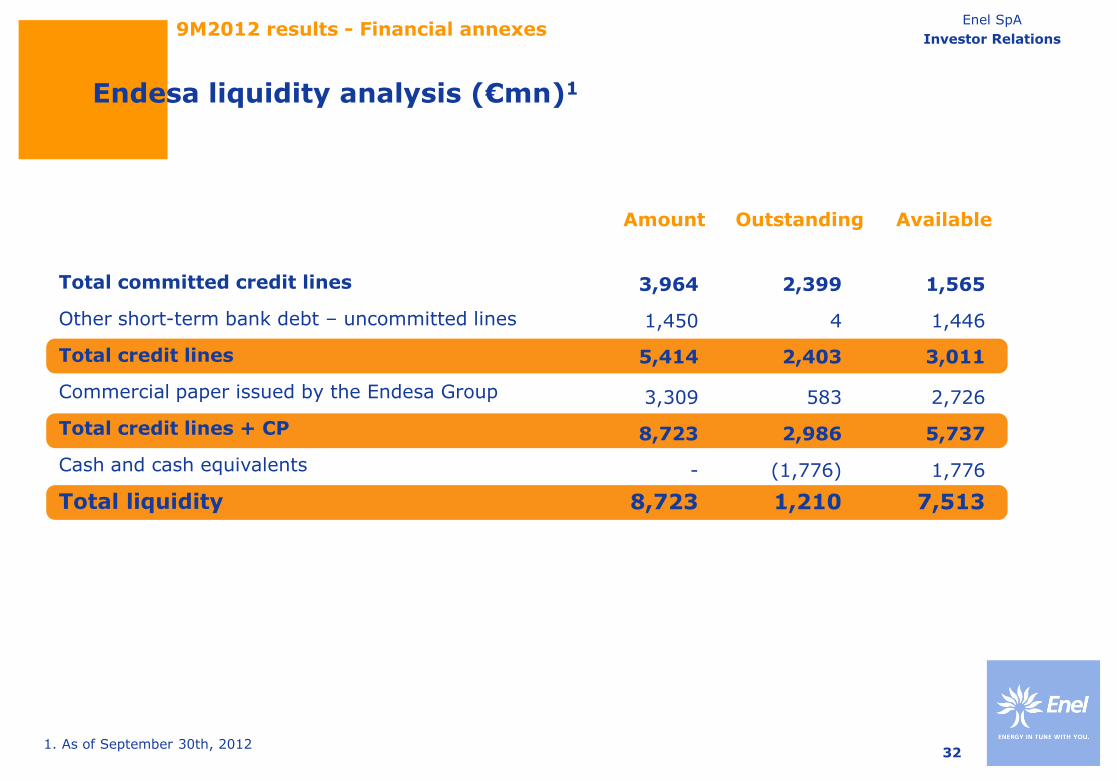
Total committed credit lines
Other short-term bank debt – uncommitted lines
Total credit lines
Commercial paper issued by the Endesa Group
Total credit lines + CP
Cash and cash equivalents
Total liquidity
Amount Available Outstanding
1. As of September 30th, 2012
3,964
1,450
5,414
3,309
8,723
-
8,723
Endesa liquidity analysis (€mn)1
2,399
4
2,403
583
2,986
(1,776)
1,210
1,565
1,446
3,011
2,726
5,737
1,776
7,513
9M2012 results - Financial annexes
33
Enel SpA
Investor Relations
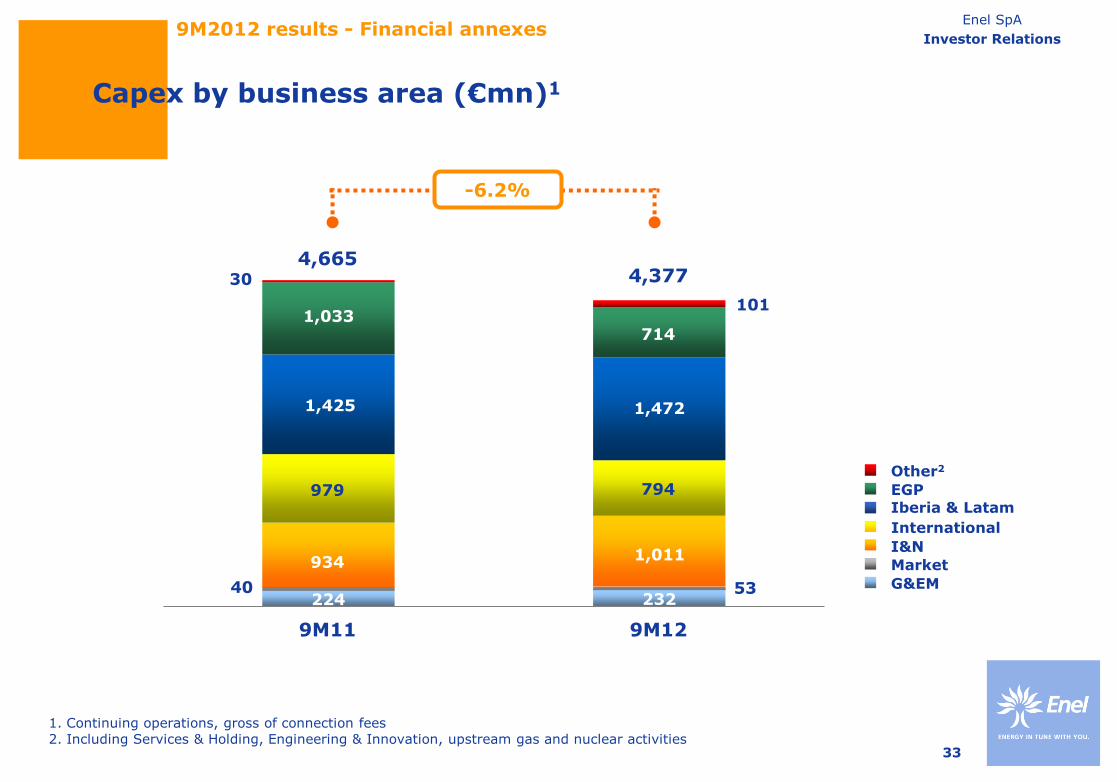
224 232 40 53
30
101
9M11 9M12
-6.2%
4,665
Iberia & Latam
Market
I&N
Other2
G&EM
International
EGP
1. Continuing operations, gross of connection fees
2. Including Services & Holding, Engineering & Innovation, upstream gas and nuclear activities
4,377
9M2012 results - Financial annexes
Capex by business area (€mn)1
1,425 1,472
714
934 1,011
979 794
1,033
34
Enel SpA
Investor Relations
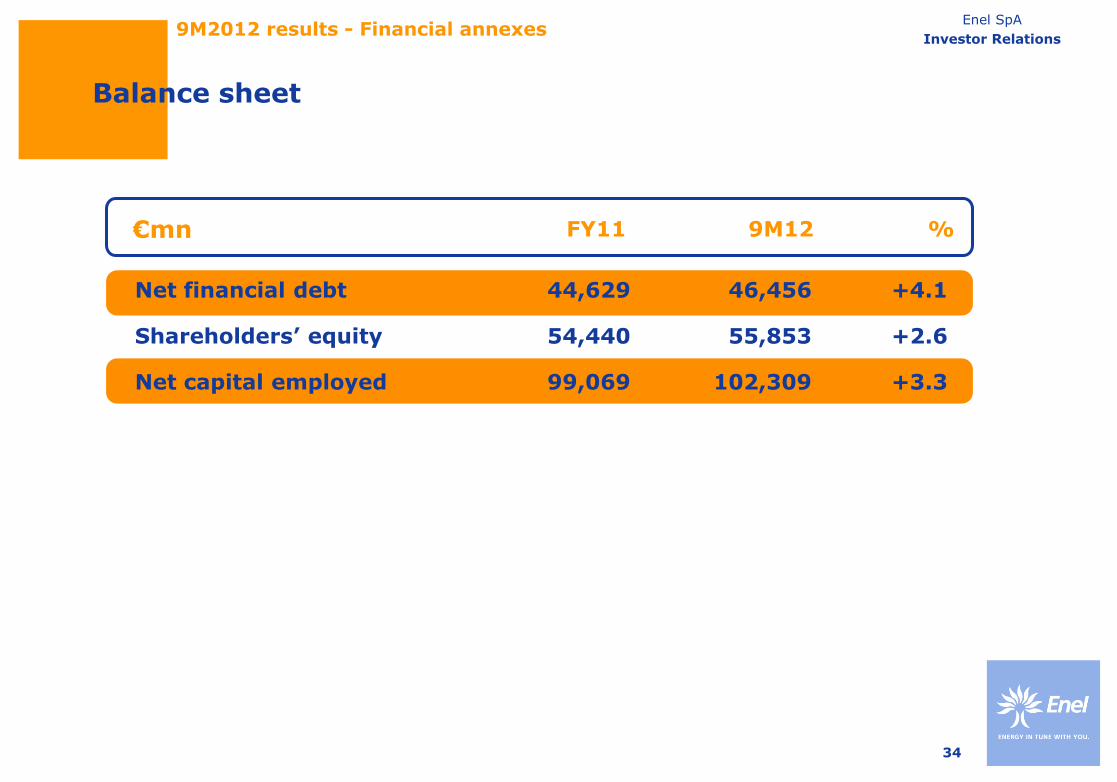
FY11 9M12 % €mn
44,629
54,440
99,069
46,456
55,853
102,309
+4.1
+2.6
+3.3
Net financial debt
Shareholders’ equity
Net capital employed
9M2012 results - Financial annexes
Balance sheet

35
Enel SpA
Investor Relations
% €mn
Revenues
EBITDA
EBIT
Capex
Headcount
+12.2
-38.0
-54.0
+3.6
-1.6
9M12
17,222
1,028
561
232
6,177
9M11
15,345
1,659
1,219
224
6,277
Generation & Energy Management - Italy
9M2012 results - Financial annexes
(1)
1. As of December 31st, 2011

36
Enel SpA
Investor Relations
Revenues
EBITDA
EBIT
Capex
Headcount
+7.2
+10.8
-26.8
+32.5
-0.7
13,860
494
161
53
3,718
12,932
446
220
40
3,745
% €mn 9M12 9M11
Market - Italy
9M2012 results - Financial annexes
(1)
1. As of December 31st, 2011
37
Enel SpA
Investor Relations
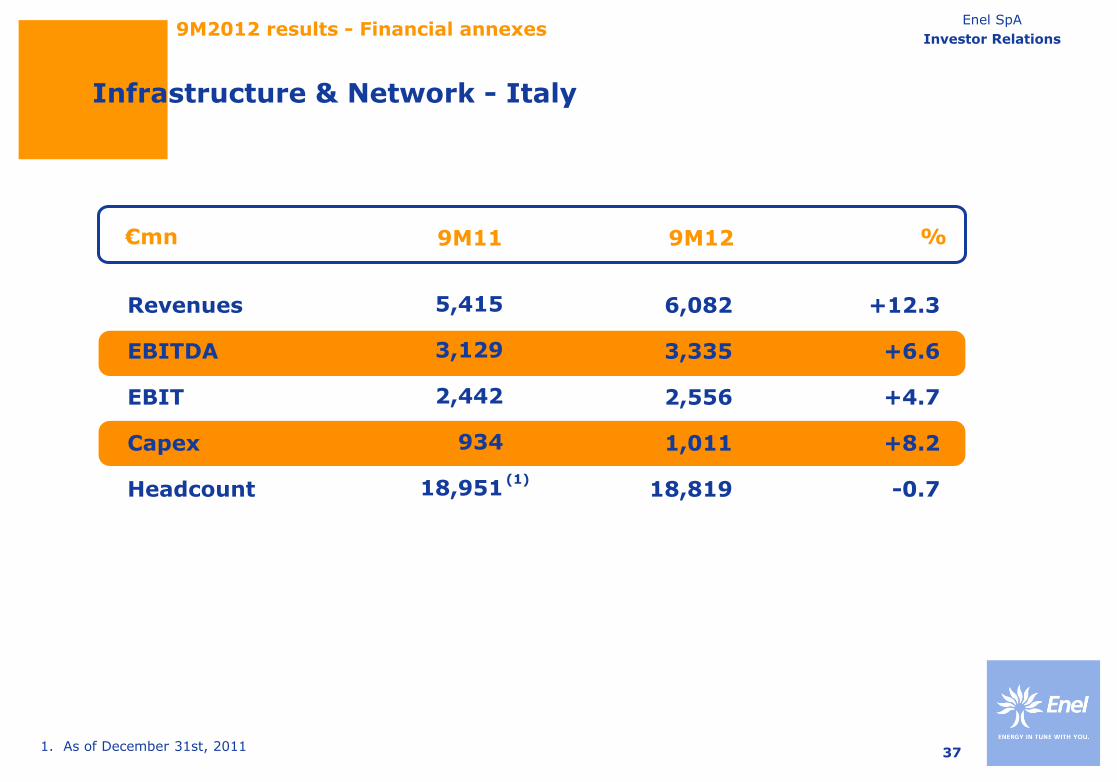
% €mn
Revenues
EBITDA
EBIT
Capex
Headcount
+12.3
+6.6
+4.7
+8.2
-0.7
6,082
3,335
2,556
1,011
18,819
5,415
3,129
2,442
934
18,951
9M12 9M11
Infrastructure & Network - Italy
9M2012 results - Financial annexes
(1)
1. As of December 31st, 2011

38
Enel SpA
Investor Relations
Revenues
EBITDA
EBIT
Capex
Headcount
+11.9
-8.0
+7.0
-18.9
-4.2
% €mn
6,324
1,104
825
794
13,199
5,650
1,200
771
979
13,779
9M12 9M11
International
9M2012 results - Financial annexes
(1)
1. As of December 31st, 2011

39
Enel SpA
Investor Relations
Revenues
EBITDA
EBIT
Capex
Headcount
+4.6
+0.5
-3.4
+3.3
+0.9
% €mn
25,140
5,589
3,334
1,472
23,087
24,029
5,562
3,450
1,425
22,877
9M12 9M11
Iberia & Latam
(1)
1. As of December 31st, 2011
9M2012 results - Financial annexes
40
Enel SpA
Investor Relations
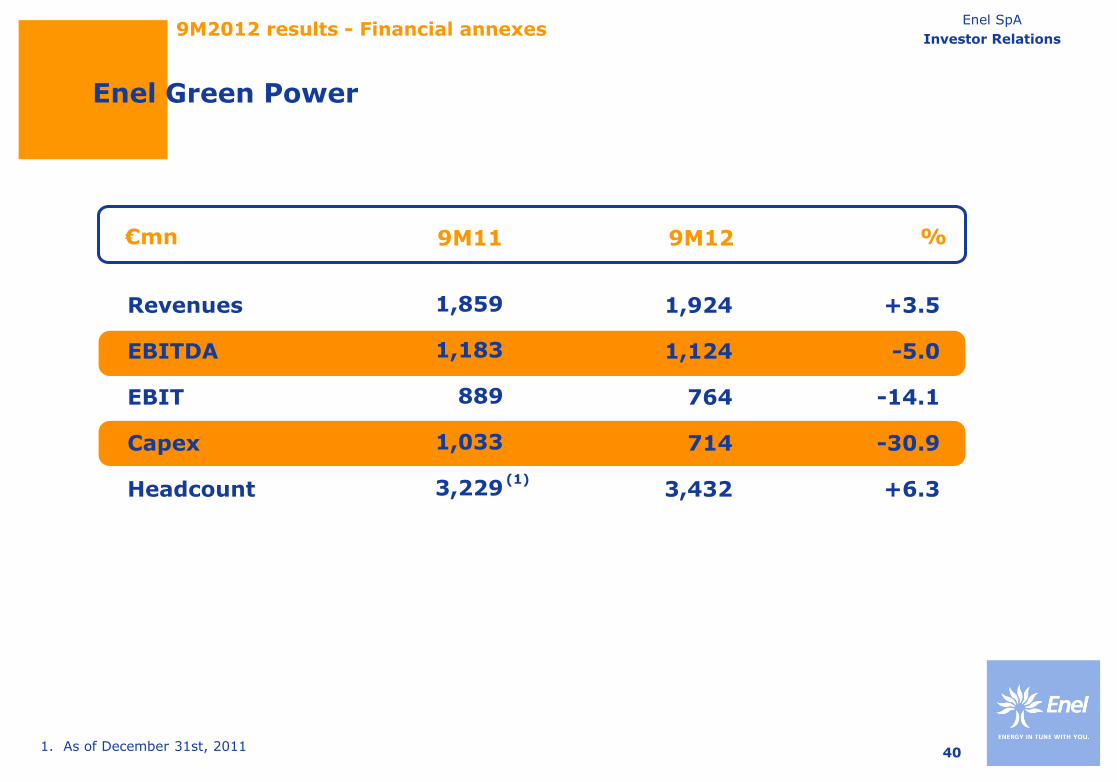
Revenues
EBITDA
EBIT
Capex
Headcount
+3.5
-5.0
-14.1
-30.9
+6.3
% €mn
1,924
1,124
764
714
3,432
1,859
1,183
889
1,033
3,229
9M12 9M11
Enel Green Power
9M2012 results - Financial annexes
(1)
1. As of December 31st, 2011
41
Enel SpA
Investor Relations
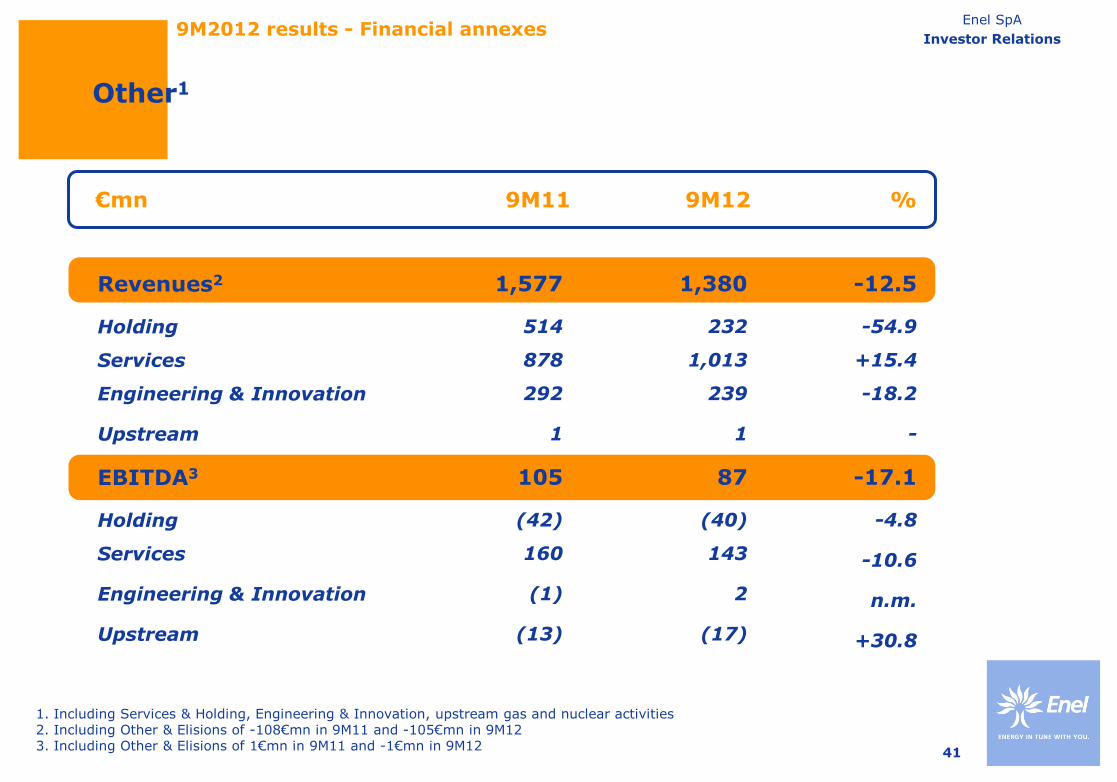
9M12 % €mn
Revenues2
Holding
Services
Engineering & Innovation
Upstream
EBITDA3
Holding
Services
Engineering & Innovation
Upstream
9M11
1. Including Services & Holding, Engineering & Innovation, upstream gas and nuclear activities 2. Including Other & Elisions of -108€mn in 9M11 and -105€mn in 9M12 3. Including Other & Elisions of 1€mn in 9M11 and -1€mn in 9M12
Other1
1,577
514
878
292
1
105
(42)
160
(1)
(13)
1,380
232
1,013
239
1
87
(40)
143
2
(17)
-12.5
-54.9
+15.4
-18.2
-
-17.1
-4.8
-10.6
n.m.
+30.8
9M2012 results - Financial annexes
42
Enel SpA
Investor Relations
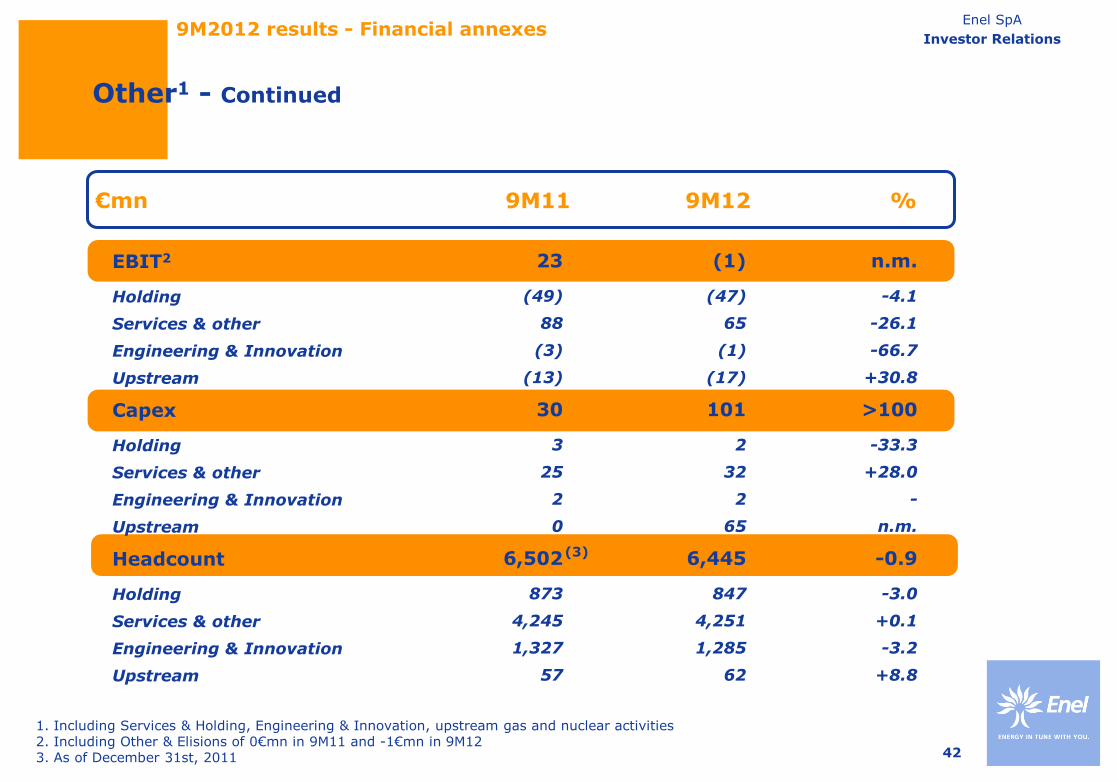
EBIT2
Holding
Services & other
Engineering & Innovation
Upstream
Capex
Holding
Services & other
Engineering & Innovation
Upstream
Headcount
Holding
Services & other
Engineering & Innovation
Upstream
9M12 % €mn 9M11
1. Including Services & Holding, Engineering & Innovation, upstream gas and nuclear activities 2. Including Other & Elisions of 0€mn in 9M11 and -1€mn in 9M12 3. As of December 31st, 2011
Other1 - Continued
23
(49)
88
(3)
(13)
30
3
25
2
0
6,502
873
4,245
1,327
57
(1)
(47)
65
(1)
(17)
101
2
32
2
65
6,445
847
4,251
1,285
62
n.m.
-4.1
-26.1
-66.7
+30.8
>100
-33.3
+28.0
-
n.m.
-0.9
-3.0
+0.1
-3.2
+8.8
9M2012 results - Financial annexes
(3)
43
Enel SpA
Investor Relations
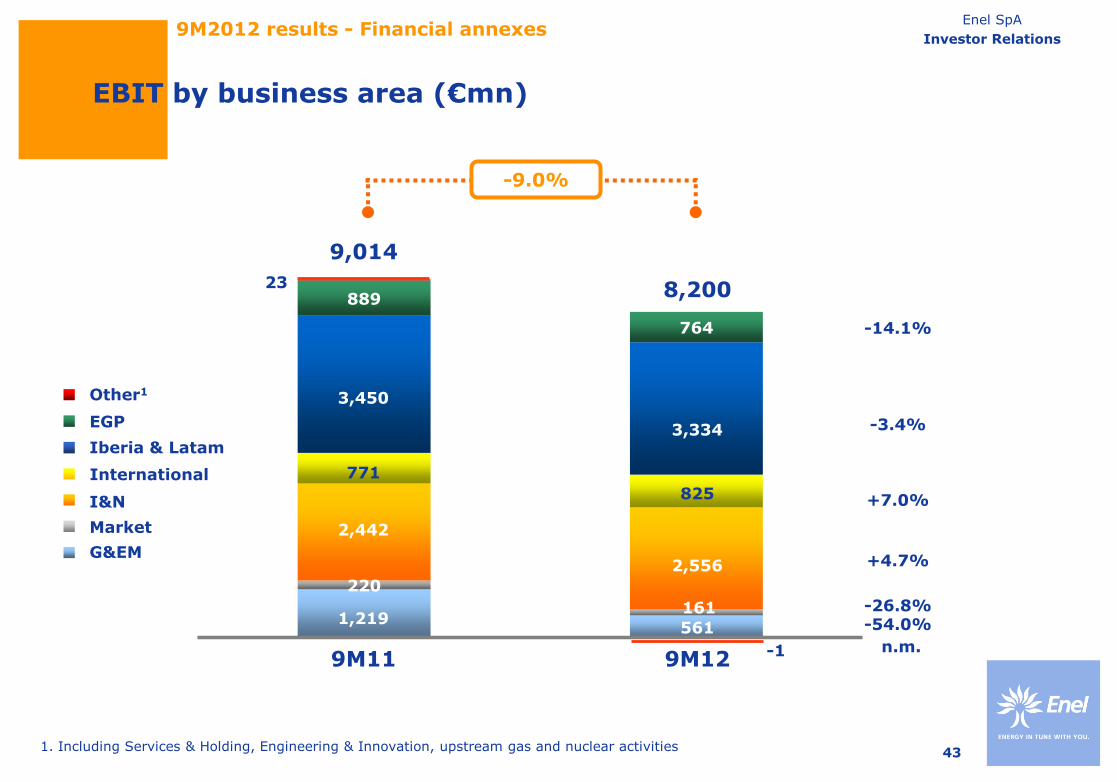
9M12
-9.0%
Iberia & Latam
Market
I&N
Other1
G&EM
International
EGP
-26.8%
+7.0%
-54.0%
-14.1%
-3.4%
+4.7%
EBIT by business area (€mn)
220
161
889
764
9,014
8,200
3,450
3,334
2,442
2,556
1,219 561
771
825
1. Including Services & Holding, Engineering & Innovation, upstream gas and nuclear activities
23
9M2012 results - Financial annexes
9M11 -1 n.m.
44
Enel SpA
Investor Relations
This presentation may contain certain statements that are neither reported financial results nor other historical information (“forward-looking statements”). These forward-looking statements are based on Enel S.p.A.’s current expectations and projections about future events. Because these forward-looking statements are subject to risks and uncertainties, actual future results may differ materially from those expressed in or implied by these statements due to any number of different factors, many of which are beyond the ability of Enel S.p.A. to control or estimate precisely, including changes in the regulatory environment, future market developments, fluctuations in the price and availability of fuel and other risks. You are cautioned not to place undue reliance on the forward-looking statements contained herein, which are made only as of the date of this presentation. Enel S.p.A. does not undertake any obligation to publicly release any revisions to any forward-looking statements to reflect events or circumstances after the date of this presentation.
Pursuant to art. 154-BIS, par. 2, of the Unified Financial Act of February 24, 1998, the executive in charge of preparing the corporate accounting documents at Enel, Luigi Ferraris, declares that the accounting information contained herein correspond to document results, books and accounting records.
Disclaimer
45
Enel SpA
Investor Relations
Contact us
Investor Relations Team ([email protected])
Visit our website at:
www.enel.com (Investor Relations)
• Luca Torchia (Head of IR)
• Pedro Cañamero (Equity IR)
• Elisabetta Ghezzi (Fixed income IR)
• Matteo Cavadini (Staff)
• Marco Donati (Staff)
• Federica Dori (Staff)
• Federica Todaro (Staff)
+39 06 8305 3437
+39 06 8305 5292
+39 06 8305 2708
+39 06 8305 2326
+39 06 8305 9252
+39 06 8305 7975
+39 06 8305 9502