Electronic Supplementary Information – Atomic domain magnetic … · 2014-09-03 · Electronic...
3
Electronic Supplementary Information – Atomic domain magnetic nanoalloys - interplay between molecular structure and temperature dependent magnetic and dielectric properties in manganese doped tin clusters 1 Quantum Chemistry 1.1 Geometry of the dianions Sn 2- N The minimum energy dianionic tin structures obtained by the GA approach resemble the corresponding structures found in related borates and Zintl phases up to N=12. In accord to Wade’s rule, the dianionic species build closo structures. The lowest energy structures of Sn 2- 9 is a tricapped trigonal prism of D 3h symmetry, Sn 2- 10 has the lowest energy with D 4d sym- metry, a bicapped square antiprism. In the case of Sn 2- 11 the hollow cage structure is C 2v symmetric, while Sn 2- 12 shows the known icosahedral symmetry I h of the Stannaspherene 1,2 with a large hollow site. Up to N =14 we continued the global optimization of the cage structure. The genetic algorithm ap- proach, however, generated in the case of bare Sn 2- 13 and Sn 2- 14 prolate minimum energy structures without a hollow site. Ap- parently the cages get too large to retain the hollow site and collapse. However, in both cases isomers with relative ener- gies of 0.96 eV (N =13) and 0.16 eV (N =14) compared to the global minima have cage structures. Upon doping with Mn 2+ and local relaxation the corresponding structures are lower in energy than the Mn doped clusters corresponding to the lowest energy dianionic structures. The charges on a sphere method resulted in a C 2v symmetric cage structure of Sn 2- 13 that was also found by the GA. However, in the case of Sn 2- 14 the D 6d symmetric structure found by this simple approach was not identified by the GA. It is very close, but slightly higher in energy (at LANL2/DZ level of theory) than the lowest energy hollow cage structure (T h ) found by the GA. Identification of identical molecular structures in GAs is an important issue and while more sophisticated methods are now implemented in other codes, 3 the GA used for this study only uses the energy as a criterion to identify identical structures. Structures with the same or slightly higher energy than the next lower lying isomer are removed from the population. The structures ob- tained from charges on a sphere converged to the correspond- ing minimum structure obtained in the GA approach upon lo- cal optimization with up to 12 atoms, giving hope to obtain promising start geometries also for larger clusters. The ge- ometries obtained with N charges on a sphere converged with N = 15 at D 3 , N = 16 at C 3 , N = 17 at D 5h and N = 18 at D 4d symmetry. The geometries obtained by global optimization and by the charges on a sphere model are presented in Fig. 1. Sn 13 (GM) Sn 13 (sph) Sn 14 (GM) Sn 14 (sph) Sn 15 (sph) Sn 16 (sph) Sn 17 (sph) Sn 18 (sph) Sn 9 (GM/sph) 2- Sn 10 (GM/sph) 2- Sn 11 (GM/sph) 2- Sn 12 (GM/sph) 2- 2- 2- 2- 2- 2- 2- 2- 2- Fig. 1 Global minimum (GM) energy structures of the dianions Sn 2- N and structures obtained by the charges on a sphere model (sph). The anionic structures with N = 9-12 are identical with both method (first line). With N = 13 and 14 the global minimum structures and those obtained by the spherical model differ (second line). With N = 15-18 only the structures generated by the charges on a sphere model are considered (third line). 1.2 Detailed geometric/dielectric data of Mn/Sn N In addition to the data presented in Fig. 1 of the main article, in Tab. 1 the components of the electric dipole moment and the moments of inertia of the Mn/Sn N clusters are displayed, required for the molecular dynamics simulations of the dielet- ric response. 2 Mass spectrometry and fit procedure Figure 2 shows a section of a TOF mass spectrum (MS) taken from one of the datasets. The MS presented was recorded close to the position of maximum intensity (z 0 ) and repre- sents typical measurement conditions. Sn N clusters can be observed with N = 10 – 18 and in between the correspond- ing signals of Mn/Sn N with N = 9–18 are located. The mass of Mn is roughly half the mass of Sn, allowing to separate the signals for integration. However in the range of 12–19 Sn atoms, neighbouring signals overlap at the base, causing the 1 Electronic Supplementary Material (ESI) for Physical Chemistry Chemical Physics. This journal is © the Owner Societies 2014
Transcript of Electronic Supplementary Information – Atomic domain magnetic … · 2014-09-03 · Electronic...
Electronic Supplementary Information – Atomic domain magneticnanoalloys - interplay between molecular structure and temperaturedependent magnetic and dielectric properties in manganese doped tinclusters1 Quantum Chemistry
1.1 Geometry of the dianions Sn2−N
The minimum energy dianionic tin structures obtained by theGA approach resemble the corresponding structures found inrelated borates and Zintl phases up to N=12. In accord toWade’s rule, the dianionic species build closo structures. Thelowest energy structures of Sn2−
9 is a tricapped trigonal prismof D3h symmetry, Sn2−
10 has the lowest energy with D4d sym-metry, a bicapped square antiprism. In the case of Sn2−
11 thehollow cage structure is C2v symmetric, while Sn2−
12 shows theknown icosahedral symmetry Ih of the Stannaspherene1,2 witha large hollow site. Up to N =14 we continued the globaloptimization of the cage structure. The genetic algorithm ap-proach, however, generated in the case of bare Sn2−
13 and Sn2−14
prolate minimum energy structures without a hollow site. Ap-parently the cages get too large to retain the hollow site andcollapse. However, in both cases isomers with relative ener-gies of 0.96 eV (N =13) and 0.16 eV (N =14) compared to theglobal minima have cage structures. Upon doping with Mn2+
and local relaxation the corresponding structures are lower inenergy than the Mn doped clusters corresponding to the lowestenergy dianionic structures. The charges on a sphere methodresulted in a C2v symmetric cage structure of Sn2−
13 that wasalso found by the GA. However, in the case of Sn2−
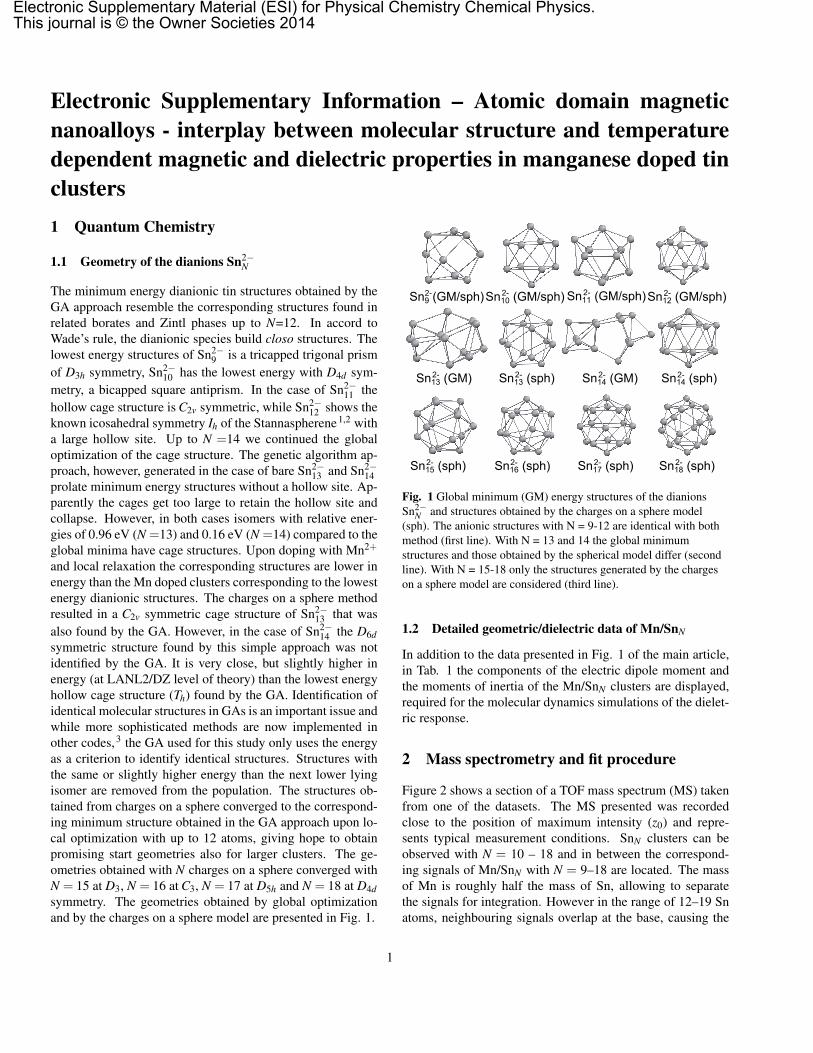
14 the D6dsymmetric structure found by this simple approach was notidentified by the GA. It is very close, but slightly higher inenergy (at LANL2/DZ level of theory) than the lowest energyhollow cage structure (Th) found by the GA. Identification ofidentical molecular structures in GAs is an important issue andwhile more sophisticated methods are now implemented inother codes,3 the GA used for this study only uses the energyas a criterion to identify identical structures. Structures withthe same or slightly higher energy than the next lower lyingisomer are removed from the population. The structures ob-tained from charges on a sphere converged to the correspond-ing minimum structure obtained in the GA approach upon lo-cal optimization with up to 12 atoms, giving hope to obtainpromising start geometries also for larger clusters. The ge-ometries obtained with N charges on a sphere converged withN = 15 at D3, N = 16 at C3, N = 17 at D5h and N = 18 at D4dsymmetry. The geometries obtained by global optimizationand by the charges on a sphere model are presented in Fig. 1.
Sn13 (GM) Sn13 (sph) Sn14 (GM) Sn14 (sph)
Sn15 (sph) Sn16 (sph) Sn17 (sph) Sn18 (sph)
Sn9 (GM/sph)2- Sn10 (GM/sph)2- Sn11 (GM/sph)2- Sn12 (GM/sph)2-
2- 2- 2- 2-
2- 2- 2- 2-
Fig. 1 Global minimum (GM) energy structures of the dianionsSn2−
N and structures obtained by the charges on a sphere model(sph). The anionic structures with N = 9-12 are identical with bothmethod (first line). With N = 13 and 14 the global minimumstructures and those obtained by the spherical model differ (secondline). With N = 15-18 only the structures generated by the chargeson a sphere model are considered (third line).
1.2 Detailed geometric/dielectric data of Mn/SnN
In addition to the data presented in Fig. 1 of the main article,in Tab. 1 the components of the electric dipole moment andthe moments of inertia of the Mn/SnN clusters are displayed,required for the molecular dynamics simulations of the dielet-ric response.
2 Mass spectrometry and fit procedure
Figure 2 shows a section of a TOF mass spectrum (MS) takenfrom one of the datasets. The MS presented was recordedclose to the position of maximum intensity (z0) and repre-sents typical measurement conditions. SnN clusters can beobserved with N = 10 – 18 and in between the correspond-ing signals of Mn/SnN with N = 9–18 are located. The massof Mn is roughly half the mass of Sn, allowing to separatethe signals for integration. However in the range of 12–19 Snatoms, neighbouring signals overlap at the base, causing the
1
Electronic Supplementary Material (ESI) for Physical Chemistry Chemical Physics.This journal is © the Owner Societies 2014

Table 1 Results of the DFT studies (Mn/SnN clusters). The first column contains the label of the cluster geometries of Mn/SnN as shown inFig. 1 in the main article. ∆EB3P86,min is the relative energy compared to the global minimum of the cluster isomer (minimum on the B3P86PES), and ∆EBP86,SP is the relative single point SCF energy in eV, obtained with the same geometry and the BP86 GGA functional. Symmdenotes the point group symmetry and M = 2S+1 the spin multiplicity. µx, µy and µz are the components and µel,0 the total magnitude of thepermanent electric dipole moment in the molecular fixed frame in Debye, and α is the static polarizability in A3. Ix, Iy and Iz are the momentsof inertia in the body fixed frame, given in 10−43 kg m2.
Lable ∆E,B3P86,min ∆E,BP86,SP Symm M µx µy µz µel,0 α Ix Iy Iz
9.0.s 0.0000 0.0000 C3v 6 0.00 0.00 -1.42 1.42 69.83 0.836 0.836 1.0839.1.q 0.5208 0.2901 Cs 4 -0.34 0.00 -0.43 0.55 69.46 0.784 0.906 1.0519.2.q 0.8664 0.4206 Cs 4 0.00 -0.53 -0.26 0.59 69.02 0.802 0.878 1.04010.0.s 0.0000 0.1895 D4d 6 0.00 0.00 0.00 0.00 74.24 0.956 1.091 1.09110.1.q 0.0639 0.0000 C3v 4 0.00 0.00 0.63 0.63 73.02 1.016 1.016 1.06310.2.q 0.0650 0.0038 C2v 4 0.00 0.00 0.67 0.67 72.98 1.004 1.026 1.06411.0.q 0.0000 0.0000 C5v 4 0.00 0.00 -0.26 0.26 79.38 1.197 1.197 1.32611.1.s 0.4099 0.4903 Cs 6 0.00 0.23 0.51 0.56 80.40 1.141 1.282 1.32211.2.q 0.6821 0.6050 C2v 4 0.54 0.00 0.00 0.54 81.77 1.131 1.254 1.47711.3.q 0.8234 0.6428 C1 4 1.87 0.24 0.01 1.89 81.25 1.057 1.350 1.40212.0.s 0.0000 0.0000 Ih 6 0.00 0.00 0.00 0.00 84.11 1.412 1.412 1.41212.1.q 1.0010 0.7261 D5d 4 0.00 0.00 0.00 0.00 83.94 1.375 1.375 1.45512.2.s 2.1820 2.2258 C3v 6 -4.42 0.00 0.00 4.42 91.70 1.436 1.487 1.48713.0.s 0.0000 0.1753 Cs 6 1.14 0.51 0.00 1.25 94.73 1.398 1.863 1.88113.1.q 0.0088 0.0000 Cs 4 -0.97 0.28 0.00 1.01 95.10 1.346 1.905 1.90813.2.s 0.0258 0.1927 C2v 6 -0.46 0.00 0.00 0.46 92.82 1.570 1.625 1.83113.3.q 0.1111 0.1086 Cs 4 0.00 -0.05 -0.32 0.32 93.30 1.498 1.707 1.85913.4.q 0.1147 0.1339 C2v 4 -0.82 0.00 0.00 0.82 93.35 1.451 1.719 1.89014.0.s 0.0000 0.0991 D6d 6 0.00 0.00 0.00 0.00 98.61 1.799 1.799 2.09614.1.q 0.1082 0.0000 C1 4 -0.12 0.07 -0.22 0.26 99.52 1.670 1.940 2.14414.2.s 0.1628 0.1985 Th 6 0.00 0.00 0.00 0.00 98.94 1.873 1.873 1.87314.3.d 0.3214 0.2020 C2v 2 0.00 -0.10 0.00 0.10 100.06 1.666 1.969 2.13915.0.s 0.0000 0.0424 Cs 6 0.32 0.00 0.28 0.42 105.62 1.992 2.199 2.21915.1.q 0.0439 0.0000 C2 4 0.00 0.00 -0.18 0.18 105.32 1.953 2.187 2.25216.0.q 0.0000 0.0000 C3v 4 -0.29 0.00 0.00 0.29 112.11 2.372 2.377 2.37716.1.s 0.4041 0.4792 C3v 6 0.00 0.00 -0.64 0.64 112.96 2.373 2.373 2.42817.0.s 0.0000 0.0000 C5v 6 -0.99 0.00 0.00 0.99 122.04 2.181 3.109 3.10917.1.q 0.4285 0.2790 C1 4 0.58 -1.30 -0.06 1.43 124.38 2.260 2.880 3.27918.0.s 0.0000 0.0000 C1 6 0.48 -0.34 -0.19 0.62 130.40 2.543 3.326 3.35918.1.q 0.9043 0.5545 C1 4 2.15 0.50 1.17 2.49 131.89 2.593 3.151 3.480
2

base line of the MS to deviate considerably from zero inten-sity (dotted black line). The signals of clusters containing tinnaturally have wide mass distribution due to the large numberof stable isotopes. With tin as primary component in the nano-alloys, broad signals are obtained. Simple numerical integra-tion in the range between the corresponding minima causesthe effect of the cluster species to be obscured by the effecton neighbouring signals. Therefore, a baseline correction isimplemented to the analysis, based on Gaussian fits of themass signals (see Fig. 2, red line). The measured data (blackline) is reproduced very well by the red line obtained as thesum of one Gaussian for each cluster species. Initially, ampli-tude, variance and peak position of each Gaussian are fitted byleast squares to the experimental MS with maximum intensity,i.e. with the scanning slit in the centre of the molecular beam(z0). Except for a small correction of the peak positions, onlythe amplitude of each Gaussian function is then varied to ob-tain the fitted MS for every measured MS in the dataset. Themolecular beam profiles are obtained as the analytic integralsof the mass signals as a function of the slit position.
time5of5flight5[µs]
ion5
coun
t5/5in
tens
ity5[a
rb.5u
.]
12,110,0
10,1
11,0
11,1
12,0
13,0
13,1
14,0
14,1
18,0
17,015,0
15,1
16,0
9,1
16,1
17,118,1
60 65 70 75 80
Fig. 2 Photo ionisation mass spectrum of SnN and Mn/SnN clusters.Signals of manganese doped clusters emerge in between the pure tincluster signals. The peaks are labelled by N,1 and N,0corresponding to the number on Sn and Mn atoms, respectively.Note the minute intensities of Mn/Sn9 and Mn@Sn10. Additionallythe signals of the larger clusters are not very well separated. A leastsquares fit procedure to apply Gaussian functions to each signal inthe range of interest was implemented, resembling the overlappingsignals and hence correcting the baseline error (see text). The sumof all Gaussian functions is the smooth red line.
3 Vibrational temperature from magnetic re-sponse
The observed response of Mn@Sn12 allows to obtain an ex-perimental estimate of the vibrational temperature of the clus-
ters in the molecular beam experiment. At very low nozzletemperatures the equilibration before expansion into vacuumis possibly insufficient and Tvib > Tnozzle.4 We use the two-component model proposed in ref. [4] that describes the mag-netic response of Mn@Sn12 at any temperature to obtain Tvibfrom the simulation with least square error. We obtain 28, 34,45 and 69 K for Tvib at Tnozzle= 16, 30, 50 and 70 K, respec-tively. The results agree with the assumption of Tvib ≈ Tnozzleat higher Tnozzle, taking into account an estimated uncertaintyof ± 5 K, but indeed clearly show increasing deviations inthe low temperature regime. We consequently use the valueof Tvib that produces the best agreement of the two componentmodel and the experimentally observed response of Mn@Sn12of each set of data to obtain the values of µmag,0 plotted in Fig.4 and P0 values used in Fig. 5 of the main article.
Notes and references1 L.-F. Cui, X. Huang, L.-M. Wang, D. Y. Zubarev, A. I. Boldyrev, J. Li and
L.-S. Wang, J. Am. Chem. Soc., 2006, 128, 8390.2 L.-F. Cui, X. Huang, L.-M. Wang, J. Li and L.-S. Wang, Angew. Chemie,
2007, 119, 756.3 S. Heiles and R. L. Johnston, Int. J. Quantum Chem., 2013, 113, 2091.4 U. Rohrmann and R. Schafer, Phys. Rev. Lett., 2013, 111, 133401.
3