Supplementary Materials for -...
42
www.sciencemag.org/content/352/6293/1542/suppl/DC1 Supplementary Materials for Atomic structure of Hsp90-Cdc37-Cdk4 reveals that Hsp90 traps and stabilizes an unfolded kinase Kliment A. Verba, Ray Yu-Ruei Wang, Akihiko Arakawa, Yanxin Liu, Mikako Shirouzu, Shigeyuki Yokoyama, David A. Agard* *Corresponding author. Email: [email protected] Published 24 June 2016, Science 352, 1542 (2016) DOI: 10.1126/science.aaf5023 This PDF file includes: Materials and Methods Figs. S1 to S13 Tables S1 and S2 References (37–58) Captions for Movies S1 to S4 Other Supplementary Materials for this manuscript include the following: (available at www.sciencemag.org/content/352/6293/1542/suppl/DC1) Movies S1 to S4
Transcript of Supplementary Materials for -...

www.sciencemag.org/content/352/6293/1542/suppl/DC1
Supplementary Materials for
Atomic structure of Hsp90-Cdc37-Cdk4 reveals that Hsp90 traps and stabilizes an unfolded kinase
Kliment A. Verba, Ray Yu-Ruei Wang, Akihiko Arakawa, Yanxin Liu, Mikako Shirouzu, Shigeyuki Yokoyama, David A. Agard*
*Corresponding author. Email: [email protected]
Published 24 June 2016, Science 352, 1542 (2016)
DOI: 10.1126/science.aaf5023
This PDF file includes:
Materials and Methods Figs. S1 to S13 Tables S1 and S2 References (37–58) Captions for Movies S1 to S4
Other Supplementary Materials for this manuscript include the following: (available at www.sciencemag.org/content/352/6293/1542/suppl/DC1)
Movies S1 to S4

3
Materials and Methods
Expression and purification of Hsp90/Cdc37/Cdk4 complex
Expression of the complex in Sf9 cells.
Such prepared sample was used for all the reconstructions except T4 Lysozyme
labeled complexes. The plasmids encoding the full-length human HSP90b and Cdc37
were kindly provided by Dr. Neil F Rebbe (The University of North Carolina at Chapel
Hill) and Dr. Ernest Laue (The University of Cambridge), respectively. The cDNA clone
for Cdk4 was purchased from Origine.
The DNA fragment of the full-length Hsp90b (residues 1-724) or the linker-
deleted Hsp90b (residues 1-220-GGGG-274-724), in which the linker region (residues
221-273) were replaced by GGGG, was independently amplified by PCR and subcloned
into the baculovirus transfer vector pFastBacHT (Thermo Fisher Scientific, USA) as a
fusion with an N-terminal Flag tag and a TEV cleavage site. The DNA fragment of the
Cdk4 (residues 1-303) for a fusion with an N-His tag and a TEV cleavage site and Cdc37
(residues 1-378) without tag were subcloned as the above-mention methods. The Flag-
tagged Hsp90, the His6-tagged Cdk4 and Cdc37 was co-expressed in Sf9 cells using
BAC-to-BAC Baculovirus Expression System (Thermo Fisher Scientific, USA).
Protein purification from Sf9 cells.

4
The infected Sf9 cells were lysed and sonicated in 20 mM Tris-HCl (pH 7.5), 150
mM NaCl, 20 mM imidazole, 10 mM MgCl2, 10 mM KCl, 20 mM Na2MoO4. The
protein solution was applied to a HisTap column (GE Healthcare, UK) and then eluted
with a buffer containing 500 mM imidazole. Elution solution was applied to Anti-FLAG
M2 agarose (SIGMA) and eluted a buffer (20 mM Tris-HCl (pH 7.5), 150 mM NaCl, 10
mM MgCl2, 10 mM KCl) with a 100 mg/ml FLAG peptide (SIGMA) to remove Cdc37
and Cdk4 unbound Hsp90. The Flag and His6 tag of the eluted sample was cleaved by
TEV protease at 4°C for overnight. In turn, the solution was flowed through a HisTap
column again to remove a cleaved Flag and His6 tag. The flow-through fraction was
separated by an ion exchange column (MonoQ, GE Healthcare) and a size exclusion
chromatography column (Superdex200, GE Healthcare) in a final buffer containing
20mM Tris-HCl (pH 7.5), 150 mM NaCl, 10 mM KCl, 10 mM MgCl2, 20 mM
Na2MoO4, 2mM DTT. The sample was concentrated to final concentration of about 10
mg/ml and stored at -80°C until use.
Expression of the complex in Saccharomyces cerevisiae.
To co-express human Hsp90β, human Cdc37 and human Cdk4 we utilized viral
2A peptides. This way we were able to construct a single plasmid, which had all three
proteins in it. The exact 2A sequence we used (P2A) was sourced from Porcine
Teschovirus-1 and was GSGATNFSLLKQAGDVEENPGP(37). The resulting construct
was of this arrangement:

5
hCdc37-TEVsite-P2A-hHsp90β-TEVsite-FLAG-P2A-hCdk4-TEVsite-HisTag.
This construct was generated and cloned into 83nu yeast expression vector (GAL1
promoter, His marker) using Gibson Assembly(NEB). For T4 Lysozyme tagging T4Lys
was added at either N terminus of Cdc37 or C terminus of Cdk4, separated from proteins
by Gly-Ser (cloning was done at 96Proteins, South San Francisco). The resulting
plasmids were sequence verified, transformed into JEL1 (MAT-alpha, leu2 trp1 ura3-52
prb1-1122 pep4-3 deltahis3::PGAL10-GAL4) yeast strain using Zymo Research EZ
Transformation protocol and plated on SD-HIS plates. After 3 days a colony was picked
and 250mL O/N culture (SD –His) was inoculated. Next day 1L of YPGL media was
inoculated with 10mLs of the O/N culture. After about 24h (OD of 1), galactose was
added to a final concentration of 2% w/v to induce protein expression. The culture was
pelleted after 6h of growth.
Purification of the complex from Saccharomyces cerevisiae.
The cells were lysed in 20mM Tris pH7.5, 150mM NaCl, 20mM Imidazole,
10mM MgCl2 , 10mM KCl, 20mM NaMoO4 (Lysis Buffer) with Roche protease
inhibitors by Emusiflex (Avestin). Lysate was cleared by centrifuging at 30000g for 30
minutes and bound to pre-equilibrated Ni-NTA beads (ThermoFisher) for 1h at 4°C. The
beads were washed with 20 bed volumes of Lysis buffer, and then were eluted into Lysis
buffer + 500mM Imidazole. The resulting eluate was then incubated with pre-equilibrated
M2 Anti FLAG magnetic beads (Sigma Aldrich) for 1h at 4°C. Beads were washed with
10 bed volumes of Lysis buffer, and the sample was eluted with 3 bed volumes of Lysis

6
buffer with 75ug/mL of FLAG peptide, twice. TEV was added to the eluent and it was
dialized against 20mM Tris pH7.5, 100mM NaCl, 10mM MgCl2, 10mM KCl, 20mM
NaMoO4 (Dialysis Buffer) O/N. The sample was then diluted 1:1 with the Dialysis buffer
without NaCl and was loaded onto pre-equilibrated 10/300 MonoQ column (GE
Healthcare). After washing out the unbound sample, a gradient was run up to 1M NaCl
with fractionation to elute the bound complex (came off at about 25% conductivity). The
fractions were pooled, concentrated and then loaded on 16/60 S200 Superdex (GE
Healthcare) column pre-equilibrated in 20mM Tris pH7.5, 150mM NaCl, 10mM KCl,
20mM NaMoO4, 1mM DTT. The peak fractions (at about 0.5CV) were pooled,
concentrated, flash frozen in liquid nitrogen and stored at -80°C.
Work on Cdc37-NTD expressed in E.coli
Expression and purification of Cdc37-NTD from E.coli.
DNA corresponding to residues 1-126 of human Cdc37 was codon optimized for
bacterial expression and ordered from ThermoFisher. Subsequently this construct was
cloned into pet28a vector via Gibson assembly. Bl21Star (DE3) cells were transformed
and plated. Colony was picked and an overnight culture in LB with antibiotic was grown.
6L of LB media with antibiotic were spiked with the O/N culture and induced at OD ~0.6
with 400uM of IPTG. After 3h of growth with shaking at 37C cells were pelleted by
centrifugation. Cell pellets were solubilized in Lysis buffer (50mM Tris pH7.5, 500mM
NaCl, 20mM Imidazole, 5mM BMe) and lysed on Emulciflex. The lysate was clarified

7
by centrifuging at 30000g for 30 minutes, and the supernatant was collected. The
supernatant was incubated with pre-equilibrated in Lysis buffer Ni-NTA beads
(ThermoFisher) for 1h at 4C, rotating. The sample was eluted of the beads with Lysis
buffer with 500mM Imidazole. TEV was added and the eluent was dialyzed against
Dialysis Buffer (20mM Tris pH8, 10mM NaCl, 1mM DTT) at 4C O/N. The sample was
diluted 1:1 with Dialysis buffer without salt and loaded on 10/300 MonoQ column.
Protein was eluted by running a gradient to 1M NaCl over 20 column volumes.
Appropriate peaks were collected and subsequently loaded on 16/60 Superdex 200
column. Appropriate peaks were collected, concentrated and flash frozen. For N15 growth
the protocol was the same, except M9 minimal media with 1g/L N15 ammonium sulfate
was used instead of LB during growth and expression.
NMR measurement on Cdc37-NTD.
HSQC measurements were performed on a Bruker Avance 800 on fully N15
labeled Cdc37-NTD. Chemical shifts were visualized in ccpNMR.
CD measurement on Cdc37-NTD
Cdc37-NTD was buffer exchanged into 10mM Potassium Phosphate pH7.4,
50mM sodium sulfate buffer. Protein was diluted to 0.4 mg/ml and 1mm CD cuvette was
used. CD spectra were collected on Jasco J710 from 185nm to 260nm.
Cryo-EM data acquisition

8
Main data collection
Initially all the samples were screened using negative stain via standard protocols
(~100nM protein concentration)(38). Cryo-EM grids were prepared with Vitrobot Mark
III (FEI Company), using 20°C and 90% humidity. 3uL aliquots of sample at
concentration of 1.1uM were applied to glow discharged C-flat 400 mesh 1.2/1.3 thick
carbon grids (Protochips), single blotted for 4 to 6 sec and plunge frozen in liquid ethane
cooled by liquid nitrogen. DDM was added to the protein to a final concentration of
0.085mM before applying sample to the grids. The grids with T4 Lysozyme labeled
complex were prepared the same as above. Images were taken at NRAMM Scripps on
FEI Titan Krios electron microscope operating at 300kV with a nominal magnification of
22500x. Images were recorded by Gatan K2 Summit detector (Gatan Company) with
super resolution mode(0.66Å/pix). Defocus varied from 1.4um to 3.8um. Each image was
fractionated to 38 frames (0.2sec each, total exposure of 7.6 seconds) with dose rate of
5.8e/Å/sec for a total dose of 44e/Å2. Leginon software was used for all the data
collection. 3718 total images were collected. For more details see Table S1.
T4 Lysozyme labeled complex data collection.
FEI Polara microscope operating at 300kV, at nominal magnification of 31000x,
was used for data collection. Images were recorded with Gatan K2 Summit detector in
Super Resolution mode (0.61Å/pix). Each image was fractionated into 30 frames (0.2

9
seconds each, 6 seconds total) at 6.7/Å2/sec for a total dose of 40e/Å2. Leginon software
was used for all the data collection. For more details see Table S1.
Image processing
Generating an initial reconstruction
Using EMAN2(39) for all aspects of processing, including initial model
generation (e2initialmodel), a 3D reconstruction was generated from about 10000
negative stain particles. As mentioned in the main text, over multiple cryoEM data
collections on F30 Polara, a 7Å reconstruction was obtained, using negative stain map as
an initial model. The collection parameters were the same as T4 Lysozyme collections,
but using UCSFImage4. This reconstruction, low pass filtered to 30Å, was used for
particle picking and as an initial model for the NRAMM reconstruction.
General processing and obtaining the 3.9Å and 4Å reconstructions.
Image stacks were corrected for motion and summed as described previously(40),
resulting in binned sums (1.315Å/pix). For particle picking the images were binned to
5.2Å/pix and Gaussian bandpass filtered between 15Å and 500Å using EMAN2.
SamViewer template based picking was then used to pick particles from all the
micrographs, followed by manual review of all the picks(41). After such procedure
802877 particles were picked in total and extracted from images binned to 2.6Å/pix.
CTFFIND4 was used to estimate defocus parameters for all the images(42). Relion 1.4

10
was used for all the following steps unless noted otherwise(43). Reference free 2D
classification into 300 classes for 75 iterations was performed followed by manual
examination of the resulting class averages. Low resolution/signal to noise/feature class
averages and contributing particles were discarded, resulting in 670000 particles left. The
resulting particles were 3D classified into 4 classes resulting in two classes having high-
resolution features (390000 particles). At this stage particles were extracted from
1.315Å/pix micrographs and all the following processing was done with these particles.
Using 3D Auto-refine in Relion 1.4, a reconstruction was obtained from 390000 particles
resulting from 3D classification above (using highest resolution 3D class as initial model,
low pass filtered to 20Å). Using the resulting parameters, the particles were further drift
corrected per particle and dose weighted using the Particle Polishing feature(44). The B-
factor weighing curve was fit by a polynomial (with a rationale that such a curve should
be smooth) and used to generate new weighting parameters for Particle Polishing, with
which 390000 particles were then polished. All further data processing was done using
the polished particles. Re-refinement of the 390000 particles after polishing yielded the
map at about 4Å resolution (determined using gold standard FSC in the PostProcessing
tab)(45). Raw particles were sharpened with a B-factor of -50, low pass filtered with
Gaussian filter to 3Å and the refinement was continued for 10 more iterations (until
convergence) with these particles (the rationale was that due to extremely low noise
levels of K2 direct detector, this would yield more accurate alignments due to presence of
more high resolution data in the images). This resulted in similar resolution but a
reconstruction with visually sharper features (Fig S13). This reconstruction, after

11
Modulation Transfer Function (MTF) correction and B-factor sharpening(46) yielded the
4Å reconstruction shown on Fig1 and shown without post processing in Fig2A and movie
S2. Lastly, this reconstruction was tightly masked around Hsp90 region and refinement
was further continued for 4 iterations (until convergence), with rationale that Hsp90
region is more coherent. This yielded a 3.9Å reconstruction with the best density for
Hsp90 region (Shown in inserts on Fig 1B, 2B and Fig 5), at the expense of Cdk4 C-lobe
and Cdc37 NTD density quality. Local resolution was estimated using ResMap(47).
Obtaining 3D classes for Cdc37 and Cdk4 N-lobe.
The 390000 polished particles were further sub-classified into four 3D classes. All
four resulting reconstructions were better than at 10Å resolution, with Hsp90 density
staying unchanged, but the densities on the periphery changing. One of the classes had a
low-resolution density where Cdc37 M/C was placed later, but at this resolution the fit
would be ambiguous. To obtain higher resolution reconstruction of this region, a local
mask was generated around this region. The 390000 particles were then 3D classified into
four different classes without particle re-alignment, using the alignment parameters from
4Å reconstruction. Particles contributing to each of the four classes were grouped and a
full 3D refinement with a spherical 200Å mask was performed with each of the four
groups of particles using the same initial model, low pass filtered to 20Å. One of the
classes (referred to as Cdc37 Reconstruction throughout the text and shown on Fig 3A)
had a distinct density into which we fit Cdc37 M/C (in UCSF Chimera(48)). There was
also a low-resolution density for the kinase N-lobe. To attain a better density for the

12
kinase N-lobe, we re-did the local masked 3D classification as described for Cdc37
Reconstruction, but used the subtraction protocol described recently(49). Again, particles
contributing to each of the masked classes were grouped and a full reconstruction with a
spherical 200Å mask was performed for each of the groups, starting with identical initial
models. Such a procedure generated the two kinase reconstructions (Blue Kinase
reconstruction and Maroon Kinase reconstruction shown in Fig3 B), a reconstruction with
Cdc37 M/C density (but no Cdk4 N-lobe density) and a reconstruction which had no
extra densities in that region (similarly to the 4Å reconstruction). The last two
reconstructions of this set were not shown or used in this manuscript. All the
reconstructions were filtered and sharpened using the PostProcessing tab in Relion. All
the reconstructions were visualized using UCSF Chimera.
Processing of T4 Lysozyme tagged data.
Image stacks were dose weighted, drift corrected, binned to 1.22Å/pix and
summed using new UCSF DriftCorr program. The particles were picked and the CTF was
estimated the same way as in the main data collection. Rounds of 2D classification (300
classes, 50 iterations) followed by 3D classification (2 classes, 50 iterations) in Relion 1.4
were used to eliminate low quality particles (using 30Å low pass filtered reconstruction
from the main data set as initial model). Using the final set of particles, 3D Auto-refine
feature in Relion 1.4 was used to generate the final maps. The parameters of final
reconstructions and post processing are reported in Table S1.
13
Model Building and refinement
Atomic model building and refinement the Hsp90/Cdc37/Cdk4 complex was
performed incrementally in five stages: 1) de novo model-building for Cdc37, 2) structure
refinement of the Hsp90/Cdc37 complex, 3) de novo model extension for Cdk4 in the
presence of the refined Hsp90/Cdc37 complex, and 4) structure refinement of the
Hsp90/Cdc37/Cdk4 complex. The atomic structure of Hsp90/Cdc37/Cdk4 complex was
used in the modeling of other low-resolution maps.
Initial fitting of hHsp90/Cdk4 C-lobe model
The V-shape structure of Hsp90 was clearly identified from the 4Å
reconstruction, in which it adapts the closed-state conformation of known Hsp90
structure. The hHsp90 homology model was derived from a close (~60% sequence
identity) homologous structure from Saccharomyces cerevisiae (PDB: 2CG9 chain A and
B), which also adapts a closed-state conformation. The unrefined hHsp90β model was
first rigid-body fit into the map using UCSF Chimera (Fit In Map function), revealing
good agreement with the density data, where most of the secondary-structure density
features can already be explained. The Cdk4 C-lobe (residues 96-295) from PDB:3G33
was fit based on structural alignment to a CATH(50) domain 3orkA02. This CATH
domain was obtained by downloading all the CATH protein folds and running
COLORES program (Situs package)(51) on each, rigid body fitting it into the segmented
globular region density (Fig 1B arrows and Fig S7). This resulted in an un-biased fit into

14
the density. The initial hHsp90β homology model was built together with Cdk4 C-lobe
using the Molecular Dynamics Flexible Fitting (MDFF) (52) in NAMD(53).
De novo building Cdc37-NTD into 4Å reconstruction using Rosetta.
With no homologues of known structure available for the Cdc37 N-terminal
domain (Cdc37-NTD), we employed the Rosetta automated de novo model-building
method (54) to register the sequence (residues 1-132) in the density. The density
belonging to Cdc37-NTD was manually segmented guided by the initial hHsp90/Cdk4 C-
lobe model using Chimera’s “Volume Cleaner” tool. The method first places 9-mer
fragments derived from local sequence into the density map, in order to simultaneously
trace the backbone and assign sequence. High-confidence partial models are generated
using Monte Carlo sampling to identify a set of placed fragments consistent with each
other and with maximum agreement to the data. After two iterations of applying the
procedure described above, the method converged on a partial model with residues
ranging from 2-50 and 92-122. RosettaCM was used to complete the partial model
through density-guided model rebuilding and refinement (55). To this end, de novo
model-building of Cdc37-NTD was done in the segmented density alone. However, it
was clear from our initial model that Cdc37 had extensive contacts with hHsp90 and
Cdk4 C-lobe in the map. Therefore, we carried out a further structure refinement in the
context of Cdc37-NTD and hHsp90.
Refinement of Hsp90/Cdc37 into 3.9Å map using Rosetta

15
The starting model of hHsp90 and Cdc37-NTD was obtained as described in the
previous paragraph. A split map approach was used to prevent and monitor models from
data over-fitting, and for model selection; one of the half maps used for calculating "gold-
standard" FSC was designated as the training map against which the model was refined,
and the other half map was designated as the testing map which was used for evaluations.
The training/testing map designations were strictly followed and consistent in all stages
of refinement. Guided by the starting Hsp90/Cdc37 model, density from the Cdk4 and
nucleotide was carefully removed from the training map using Chimera's "Volume
Cleaner" tool.
The refinement procedure has five cycles of iterative backbone rebuilding; in each
cycle, regions with poor fit to density or poor local geometry were automatically
identified, and rebuilding focused on these regions. Backbone rebuilding of a residue
identified as problematic is similar to what has been described in DiMaio et al.(56),
where the rebuilding starts with replacing the coordinates of the current model with
fragments at the residue position through Monte Carlo sampling, followed by Cartesian
space minimization. The fragment with the best fit to the local density is selected; the
backbone coordinates from the current model are replaced by the selected fragment. Each
rebuilding cycle was followed by side-chain rotamer optimization and all-atom
refinement with a physically realistic force field to ensure the regularity of the rebuilt
backbone. After the backbone rebuilding cycles, a "dual-space" all-atom refinement
which alternates between torsion-space and Cartesian-space optimization was carried out,
and was followed by a newly-developed "local relax" to ensure the convergence of side-

16
chain rotamer optimization in a large protein complex. Following this procedure, ~5,000
independent trajectories (models) were run.
Model selection was done in three steps. First, the initial pool of models were picked
by selecting 30% most physically realistic models accessed by the Rosetta all-atom force
field, from which the top 20% most well fit-to-density models were selected using
Rosetta all-atom electron density score ("elec_fast_dens"). Second, evaluating the fit-to-
density of the initial pool of models against the testing map using the high-resolution
shells (10-3 Å) of FSC; 50 models with low over-fitting (FSCtraining - FSCtesting < 3%) and
high correlation with the testing map were retained. Third, 10 out of 50 models were
picked using Molprobity (57), sorted first by Molprobity score and then "Ramachandran
favored" score. Lastly, a final model was selected among the 10 models through visual
inspection in Chimera. Here, the above described model refinement/selection procedure
was carried out with two iterations to reach a satisfactory model. Residues with poor fit to
density were specified to correct for the next iteration refinement.
De novo model extension for the docked Cdk4 C-lobe (into 3.9Å map)
Starting with a docked configuration of the Cdk4 C-lobe (residues 96-295), de
novo building of the upstream residues 87-95 (tube) was carried out using RosettaCM
into the tubular density as described in the main text. This density has extensive contacts
with the other two component proteins, Hsp90 and Cdc37-NTD. Thus, model building
into the tube density was done in the presence of Hsp90 and Cdc37-NTD. Density-guided
conformation sampling was primarily focused on the tube and the residues of Hsp90 that

17
were likely in contact with (residues 341-349 Hsp90 chain A and B), which combines
Monte Carlo sampling of backbone fragments with Cartesian space minimization in the
context of residues around the tube-like density. 50 low-energy models were selected by
finding models with physically realistic energy using Rosetta all-atom energy, as well as
good density-fit. Among the 50 low-energy models, one conformation was clearly
favored and showed good agreement with the density. Next, we used the iterative
backbone rebuilding procedure as described in the previous paragraph to further sample
and optimize the tube residues, as well as the surrounding residues from Hsp90. Finally,
the conformation again was favored and converged among the low-energy models.
Refinement of the Hsp90/Cdc37/Cdk4 complex in 3.9Å map
Refinement of the Hsp90/Cdc37/Cdk4 complex was done out using the same
procedure described in the paragraph of refining the Hsp90/Cdc37 complex. However,
due to the much worse resolution (~ 6 Å) of the density for Cdk4’s C-terminal domain
(residues 96-295, chain K) and Cdc37-NTD residues 56-91 (chain E), it was not
necessary to further optimize the structure; thus, no fragment-based rebuilding was
allowed in these residues. Three iterations of automatic model refinement/selection
procedure were carried out. Furthermore, through visual inspection residues that showed
poor density-fit were pinpointed and subject to the iterative backbone rebuilding on only
those residues. With three more iterations of human-guided model refinement/selection, a
satisfactory model was finally obtained. Next, heteroatoms including nucleotides (ATP),
Magnesium and phosphorylated-Serine were appended into the model. The intial ATP

18
conformations were adapted from the yHsp90 crystal structure (PDBID: 2CG9). The
model was refined using the Rosetta relax protocol with Cartesian space optimization,
followed by the local_relax. The same model selection procedure described in the
previous paragraph was used to select the final model of Hsp90/Cdc37/Cdk4 with
heteroatoms. B-factors of each atom in the atomic model were refined in the full
reconstruction using the approach from DiMaio et al.(56). Finally, we used the half maps
to find a weight of density map that does not introduce over fitting. Using this weight, we
did a local_relax in the 3.9Å map reconstructed from all the 390000 particles. The
resulting model (hHsp90β 10-690, hCdc37 2-132, hCdk4 87-295) would be used as rigid
body models for fitting into all the low resolution maps downstream.
Generating a model for residues 1-260 of Cdc37
Cdc37 crystal structure from PDB:1US7 was fit into the Cdc37 Reconstruction
(not post processed, so, low pass filtered to ~7Å and no B-Factor sharpened) manually
and then with UCSF Chimera “Fit In Map” tool. The model was truncated at residue 260,
as there was no reliable density for the rest of the crystal structure. The Rosetta built
model generated in the previous paragraph and the above fit crystal structure for residues
148-260 were loaded in Coot(58). The residues 133-147 were built in by hand into the
Cdc37 Reconstruction and residues 245-260 (helix) were rotated as a rigid body. To
relieve atomic clashes or bond length/angle distortions at the linker regions, the resulting
model was subjected to “Cartesian space relax” protocol within Cdc37 Reconstruction

19
density map using Rosetta. Final model was selected using the combined score of Rosetta
all-atom physically-realistic score and electron density score.
Generating a complete Cdk4 model (Blue and Maroon Kinase reconstructions)
Residues 5-86 (N-lobe) of Cdk4 were fit in Chimera as rigid body into the
appropriate density in each of the reconstructions. Such fit N-lobe of Cdk4 was further
tweaked in Coot in the context of model generated in the previous paragraph to join the
Cdk4 chain and minimize clashes for each of the maps. To relieve atomic clashes or bond
length/angle distortions at the linker regions, these models were subjected to “Cartesian
space relax” protocol within corresponding density maps using Rosetta. Final models
were selected using the combined score of Rosetta all-atom physically-realistic score and
electron density score.
Fitting of T4 Lysozyme into the T4 Lysozyme reconstructions.
Hsp90/Cdc37/Cdk4 model was fit into each of reconstructions in UCSF Chimera.
T4 Lysozyme (PDB:2LZM) was fit into the extra densities first by hand and then in
UCSF Chimera. No further refinement was undertaken.
Figure preparation
All model and reconstruction figures were prepared in UCSF Chimera except Fig.
4B which was prepared with pre-release version of ChimeraX.

20
Fig. S1.
Purification of Hsp90/Cdc37/Cdk4 complex from Sf9 cells.
(A) Final sample is monodisperse on S200 Superdex gel filtration column. (B) The peak
from the gel filtration ran on SDS-PAGE gel showing that all proteins are present in the
final sample and are highly pure.
About the Hsp90/Cdc37/Cdk4 complex
Sequences of Hsp90, Cdc37, and Cdk4
Purification of the Hsp90/Cdc37/Cdk4 HiLoad Superdex200 16/60 (GE Healthcare)
Running buffer: 20mM Tris-HCl (pH7.4), 150mM NaCl, 20mM Na2MoO4, 10mM KCl, 10mM MgCl2, 1mM
DTT, 10% Glycerol
Hsp90
ggfM EEVHHGEEEVE FAF AEIA LM LIIN FY NKEIFL ELI NA DALDKI YE L D KLD GKELKIDII N E L LVD GIGM
KADLINNLG IAK G KAFMEAL AGADI MIG FGVGFY AYLVAEKVVVI KHNDDE YAWE AGG F V ADHGE IG G KVILH
LKED EYLEE VKEVVKKH FIGY I LYLEKE EKEI DDEAEEEKGEKEEEDKDDEEK KIEDVG DEEDD GKDKKKK KKIKEKYI
D EELNK K IW N DDI EEYGEFYK L NDWEDHLAVKHF VEG LEF ALLFI A FDLFENKKKKNNIKLYV VFIMD CDE
LI EYLNFI GVVD EDL LNI EML KILKVI KNIVKKCLELF ELAEDKENYKKFYEAF KNLKLGIHED N L ELL YH
GDEM L EYV MKE K IYYI GE KE VAN AFVE V K GFEVVYM E IDEYCV LKEFDGK LV V KEGLEL EDEEEKKK
MEE KAKFENLCKLMKEILDKKVEKV I N LV CCIV YGW ANME IMKA AL DN MGYMMAKKHLEIN DH IVE L KA
EADKNDKAVKDLVVLLFE ALL GF LED H N IY MIKLGLGIDEDEVAAEE NAAV DEI LEGDEDA MEEVD
Cdc37
MVDY VWDHIEV DDEDE H NID A LF W H A VE ME F KEKEELD GC ECK KVAEC KLKELEVAEGGKAELE L AEA
L KEE WE KLEEM KKEK M WNVD L KDGF K MVN K EK EED EEV E KHK FVEKYEK IKHFGML WDD KYL
DNVHLVCEE ANYLVIWCIDLEVEEKCALME VAH IVM FILELAK LKVD ACF FF KIK AD YMEGFNDELEAFKE V G
AKL IEKAMKEYEEEE KK LG GGLD VEVYE L EEL KCFDVKDV ML DAI KMD DAKYHM CID GLWV N KA EAKEGE
EAG GD LLEAV K GDEKDV V
Cdk4
gamdpefMA YE VAEIGVGAYG VYKA D H GHFVALK V V NGGGGGGGL I V EVALL LEAFEH NVV LMDVCA
D EIKV LVFEHVD DL YLDKA GL AE IKDLM FL GLDFLHANCIVH DLK ENILV GG VKLADFGLA IY Y MAL
VVV LWY A EVLL YA VDMW VGCIFAEMF K LFCGN EAD LGKIFDLIGL EDDW DV L GAF G V VV
EMEE GA LLLEML FN HK I AF AL H YLHKDEGN E
Hsp90
Cdc37
Cdk4
Collect
mL
A B

21
Fig. S2
Pre reconstruction assessment shows high quality data.

22
(A) A crop of unfiltered drift corrected image stack sum shows clearly visible particles.
(B) 6 classes were picked from a total of 300 reference free classes (Relion). The classes
clearly show high-resolution features and the coiled coil protrusion. Marked with white
arrows is the charged linker, which clearly becomes more diffuse the further it is from the
center.

23
Fig S3.
Flowchart of the EM processing.

24
Fig. S4
Gold standard FSC of our highest resolution reconstruction.
In black is the unmasked FSC (ie 200Å spherical mask) of the reconstruction, crossing
0.143(dashed line) at 5.5Å. In red is the masked, corrected FSC of the same
reconstruction, crossing the 0.143 threshold at 4.0Å, generated in the post processing
node in Relion. In green is the corrected FSC for the 3.9Å reconstruction, which was
performed utilizing a mask around Hsp90 region (See methods for more details).
0.05 0.1 0.15 0.2 0.25 0.3 0.350
Resolution in 1/Å
1
0.8
0.6
0.4
0.2
FSC
Post Processing FSC - 4.0Å
Unmasked FSC - 5.5Å
Reconstruction with tighter mask, Post Processign FSC - 3.9Å

25
Fig. S5
Model vs map FSC shows no over fitting.
The difference between model vs the training map FSC (red curve) and model vs test
map FSC (green curve) is small, signifying no over fitting. In orange is the FSC between
the model refined into a half map and full 3.9Å map. In violet is the FSC of the final
model vs 3.9Å map. The final map was refined into the map from full dataset of particles
using weighting parameters from the half map refinements. (See methods for more
details).
0.05 0.1 0.15 0.2 0.25 0.3 0.350
1
0.8
0.6
0.4
0.2
FSC
Resolution in 1/Å

26
Fig. S6
There is a clear density for nucleotide in both Hsp90 monomers.
(A) View from the 4Å map showing the ATPs fitting perfectly into the density in both
monomers. (B) The density for the γ-phosphate is the strongest density in the whole map.
A B

27
Fig. S7
Fits of different CATH domains into the globular density plotted by cross
correlation.
The plot of the cross correlation coefficient vs CATH database domain, as output from
COLORES program in SITUS package. Upon manual examination, the three points
above 0.7CC are clearly artifacts. The CC values from kinase C-lobe, N-lobe and Cdc37
are marked with arrows.

28
Fig. S8
CDC37 N-terminal domain is helical.
(A) NMR spectrum of N15-H1 HSQC experiment performed on the CDC37 NTD, which
is characteristic for either unfolded or helical proteins. (B) CD of the same protein
fragment, showing spectrum characteristic of α-helix.
1H
15N
Wavelength, nm
Milli
degr
ees
A B

29
Fig. S9
Gold standard FSCs of the three alternate reconstructions.
Unmasked gold standard FSCs of the three reconstructions done after local 3D
classifications, as discussed in the main text. Due to using only a spherical mask, the
resolution estimates are quite conservative.
0.150.10.05 0.2 0.25 0.30
0.2
0.4
0.6
0.8
1FS
C
Resolution in 1/Å
Class with density for Cdc37 MC - 7.2ÅClass with density for NTD Cdk4 in blue - 9ÅClass with density for NTD Cdk4 in purple - 8.3Å
30
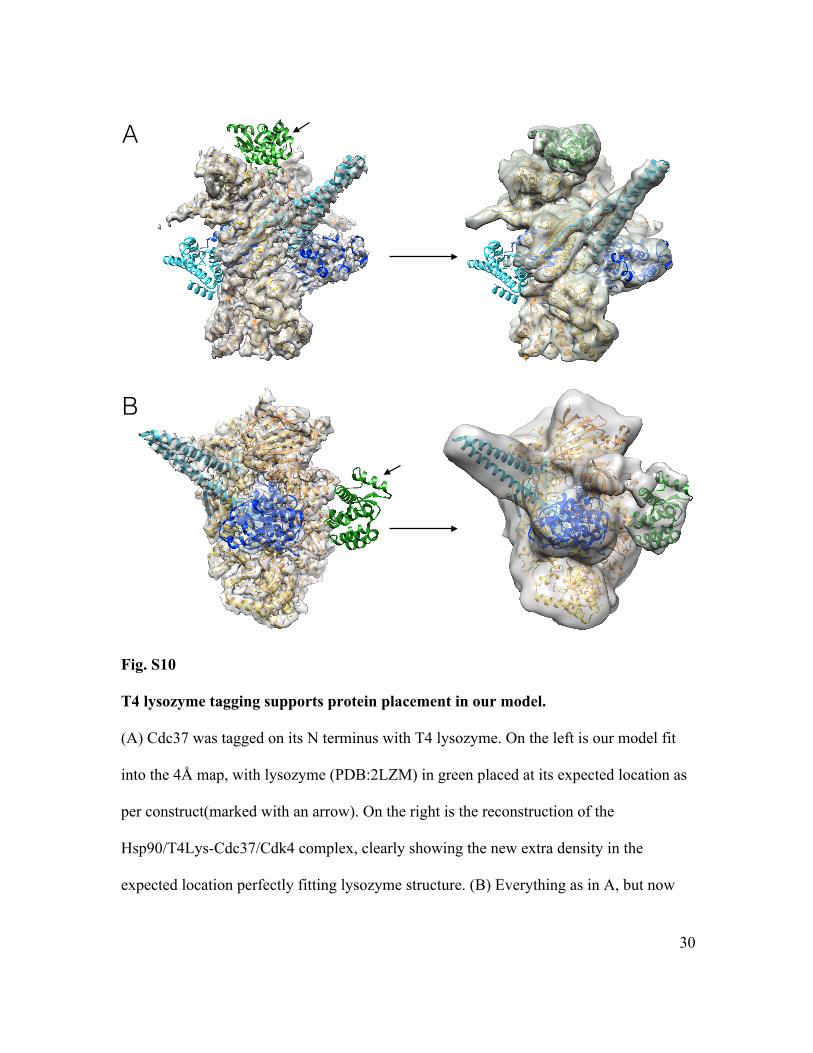
Fig. S10
T4 lysozyme tagging supports protein placement in our model.
(A) Cdc37 was tagged on its N terminus with T4 lysozyme. On the left is our model fit
into the 4Å map, with lysozyme (PDB:2LZM) in green placed at its expected location as
per construct(marked with an arrow). On the right is the reconstruction of the
Hsp90/T4Lys-Cdc37/Cdk4 complex, clearly showing the new extra density in the
expected location perfectly fitting lysozyme structure. (B) Everything as in A, but now
A
B

31
Cdk4 was tagged with T4 Lysozyme at its C terminus. Again, reconstruction of
Hsp90/Cdc37/Cdk4-T4Lys shows a clear new extra density for lysozyme.
32
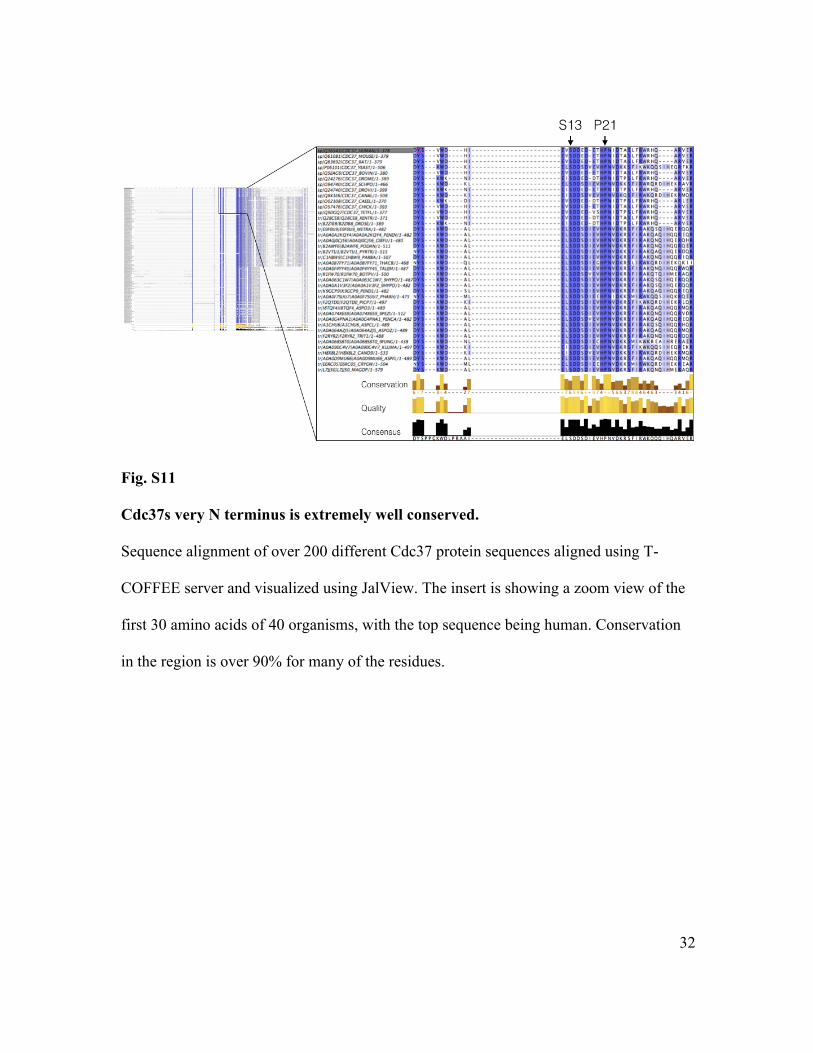
Fig. S11
Cdc37s very N terminus is extremely well conserved.
Sequence alignment of over 200 different Cdc37 protein sequences aligned using T-
COFFEE server and visualized using JalView. The insert is showing a zoom view of the
first 30 amino acids of 40 organisms, with the top sequence being human. Conservation
in the region is over 90% for many of the residues.

33
Fig. S12
αC-β4 loop in EGFR may be stabilized by an ionic interaction.
Overlay of the loop between Her2 and EGFR structures, with Her2 being in white and
EGFR being in blue. Considering the overall flexibility of protein kinases, Asp746 in
EGFR may electrostatically interact with Arg752, stabilizing the loop. This interaction
would be absent in Her2 as Asp746 is replaced with Gly778. (PDB codes 3PP0 and
1M17)
Asp746EGFRArg752EGFR
Arg784Her2
Gly778Her2

34
Fig S13
The effect of B-factor sharpening of the raw images.

35
(A) FSCs of reconstructions from sharpened and un-sharpened particles. Both, the
masked FSC and the un-masked are shown to demonstrate that the improved resolution is
not a masking artifact. Both FSCs show that reconstruction done from the sharpened
particles is of a higher resolution. (B, C) In panel (B) are two views of the model fit in the
reconstruction from the sharpened particles and in panel (C) are the same two regions
from the reconstruction done with the un-sharpened particles. The arrows show subtle
higher resolution features of the reconstruction done with the sharpened particles. The
region depicted is a different view of the region shown in the bottom insert on Fig1B in
the main text.

36
Table S1.
Parameters for all the reconstructions discussed in the main text and refinement
parameters for the final model refinement (omitting Cdc37 M/C and Cdk4 N-lobe)
fit into the 3.9Å reconstruction.
3.9Å and 4Å reconstructions
Cdc37 reconstruction
Blue Kinase reconstruction
Maroon Kinase reconstruction
Reconstruction T4 at the Cdc37 N
terminus
Reconstruction T4 at the Cdk4 C
terminus
Data CollectionMicroscope FEI Titan Krios FEI PolaraVoltage 300kV 300kVDetector Gatan K2 Summit Gatan K2 SummitPixel size 1.315Å 1.22ÅTotal electron dose 44e/Å2 40e/ÅDose rate 5.8e/Å2/sec 6.7e/Å2/secFrame rate 5 per sec 5 per secTotal images acquired 3718 1634 1082Defocus spread 1.4 - 3.8 µm 1 - 5µm 1 - 5µmTotal particles picked 802877 135142 85865
Reconstruction parametersNumber of particles 388688 114683 45974 61981 29313 29146Symmetry C1 C1 C1 C1 C1 C1Resolution(unmasked) 5.5Å 7.2Å 9Å 8.3Å 9.3Å 9.6ÅResolution(masked) 3.9Å/4.0Å 4.7Å 7Å 6.23Å 7.8Å -Map sharpening B-factor -90Å2 -141Å2 -200Å2 -126Å2 -438Å2 -
Refinement parameters parametersModel compositionNon-hydrogen atoms 26298Protein residues 1612Nucleotides 2
Ramachandran plotFavored 95.55%Allowed 99.50%Outliers 0.50%
Rms deviationsBonds 0.0154ÅAngles 1.04∘
ValidationMolprobity score 1.34Clashscore, all atoms 2.48Good rotamers 99.93%Poor rotamers 0.00%Bad bonds 0.01%Bad angles 0.00%Cß deviations>0.25Å 0.00%
37
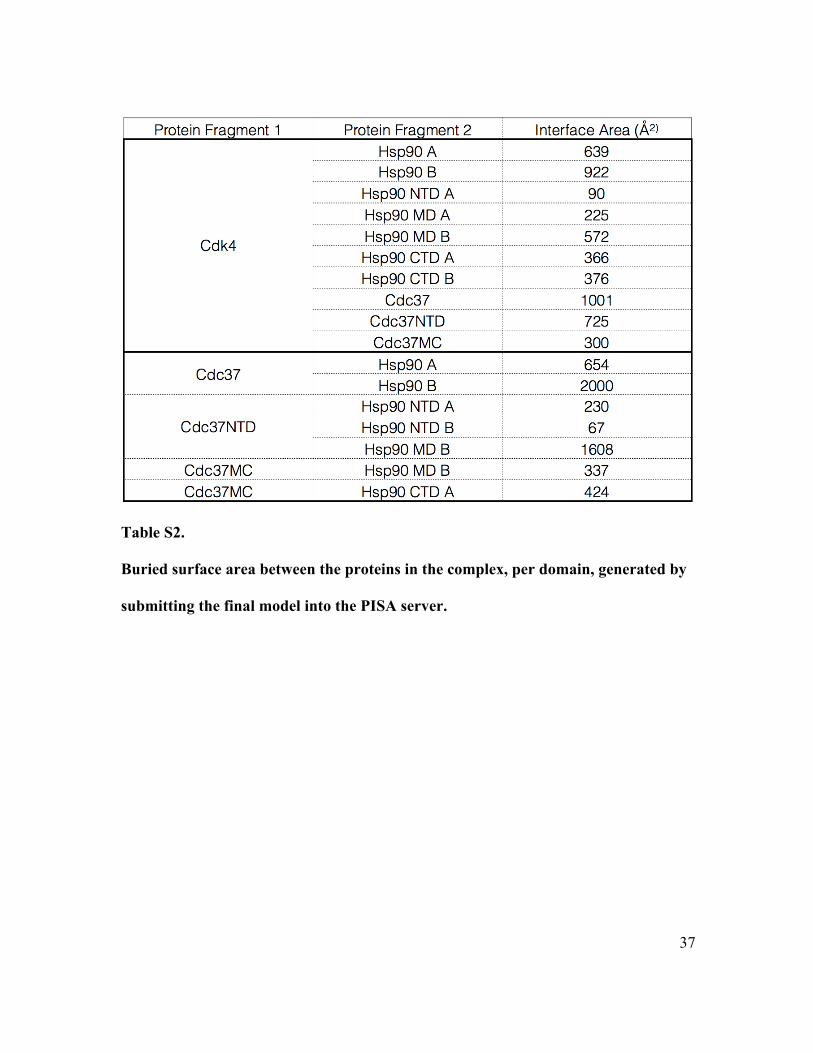
Table S2.
Buried surface area between the proteins in the complex, per domain, generated by
submitting the final model into the PISA server.
38
Movie S1
Movie showing Hsp90s CTD rotation to accommodate client binding.
Hsp90 and Cdk4 are colored as before. The movie starts with 2CG9 like state and ends
with the state in our structure. The regions that are client interacting and are ordered in
our structure are in magenta. They are showed as disordered in the movie due to Morph
Conformations methodology in Chimera.
Movie S2
Movie focusing on the Cdk4 C-lobe and part of N-lobe going through the lumen of
Hsp90.
In the light blue is a structure of a C-lobe from the CATH database, in medium blue is a
structure of full length Cdk4 and in dark blue is the structure of Cdk4 with the N-lobe
unfolded. The map which was used is the 4Å reconstruction without post processing (ie,
no b-factor sharpening, filtered to 5.5Å)
Movie S3
Movie showing morphs between 4 different reconstructions discussed in the text.
In gray is the 4Å reconstruction filtered to about 10Å, in teal is the reconstruction which
has clear density for the Cdc37 M/C, and in blue and maroon are the reconstructions with
alternative conformations of Cdk4 N-lobe.
Movie S4
Movie depicting profound conformational changes of Cdk4 and detailing the overall
arrangement of the complex.
REFERENCES AND NOTES 1. S. S. Taylor, M. M. Keshwani, J. M. Steichen, A. P. Kornev, Evolution of the eukaryotic
protein kinases as dynamic molecular switches. Philos. Trans. R. Soc. Lond. B Biol. Sci. 367, 2517–2528 (2012). Medline doi:10.1098/rstb.2012.0054
2. J. Zhang, P. L. Yang, N. S. Gray, Targeting cancer with small molecule kinase inhibitors. Nat. Rev. Cancer 9, 28–39 (2009). Medline doi:10.1038/nrc2559
3. J. A. Endicott, M. E. Noble, L. N. Johnson, The structural basis for control of eukaryotic protein kinases. Annu. Rev. Biochem. 81, 587–613 (2012). Medline doi:10.1146/annurev-biochem-052410-090317
4. J. Brugge, W. Yonemoto, D. Darrow, Interaction between the Rous sarcoma virus transforming protein and two cellular phosphoproteins: Analysis of the turnover and distribution of this complex. Mol. Cell. Biol. 3, 9–19 (1983). Medline doi:10.1128/MCB.3.1.9
5. M. Taipale, D. F. Jarosz, S. Lindquist, HSP90 at the hub of protein homeostasis: Emerging mechanistic insights. Nat. Rev. Mol. Cell Biol. 11, 515–528 (2010). Medline doi:10.1038/nrm2918
6. M. Taipale, I. Krykbaeva, M. Koeva, C. Kayatekin, K. D. Westover, G. I. Karras, S. Lindquist, Quantitative analysis of HSP90-client interactions reveals principles of substrate recognition. Cell 150, 987–1001 (2012). Medline doi:10.1016/j.cell.2012.06.047
7. Y. Miyata, H. Nakamoto, L. Neckers, The therapeutic target Hsp90 and cancer hallmarks. Curr. Pharm. Des. 19, 347–365 (2013). Medline doi:10.2174/138161213804143725
8. K. A. Krukenberg, T. O. Street, L. A. Lavery, D. A. Agard, Conformational dynamics of the molecular chaperone Hsp90. Q. Rev. Biophys. 44, 229–255 (2011). Medline doi:10.1017/S0033583510000314
9. M. P. Mayer, L. Le Breton, Hsp90: Breaking the symmetry. Mol. Cell 58, 8–20 (2015). Medline doi:10.1016/j.molcel.2015.02.022
10. D. R. Southworth, D. A. Agard, Species-dependent ensembles of conserved conformational states define the Hsp90 chaperone ATPase cycle. Mol. Cell 32, 631–640 (2008). Medline doi:10.1016/j.molcel.2008.10.024
11. S. Tsutsumi, M. Mollapour, C. Prodromou, C. T. Lee, B. Panaretou, S. Yoshida, M. P. Mayer, L. M. Neckers, Charged linker sequence modulates eukaryotic heat shock protein 90 (Hsp90) chaperone activity. Proc. Natl. Acad. Sci. U.S.A. 109, 2937–2942 (2012). Medline doi:10.1073/pnas.1114414109
12. J. Shao, A. Irwin, S. D. Hartson, R. L. Matts, Functional dissection of cdc37: Characterization of domain structure and amino acid residues critical for protein kinase binding. Biochemistry 42, 12577–12588 (2003). Medline doi:10.1021/bi035138j
13. S. M. Roe, M. M. Ali, P. Meyer, C. K. Vaughan, B. Panaretou, P. W. Piper, C. Prodromou, L. H. Pearl, The mechanism of Hsp90 regulation by the protein kinase-specific

cochaperone p50(cdc37). Cell 116, 87–98 (2004). Medline doi:10.1016/S0092-8674(03)01027-4
14. J. M. Eckl, D. A. Rutz, V. Haslbeck, B. K. Zierer, J. Reinstein, K. Richter, Cdc37 (cell division cycle 37) restricts Hsp90 (heat shock protein 90) motility by interaction with N-terminal and middle domain binding sites. J. Biol. Chem. 288, 16032–16042 (2013). Medline doi:10.1074/jbc.M112.439257
15. S. Polier, R. S. Samant, P. A. Clarke, P. Workman, C. Prodromou, L. H. Pearl, ATP-competitive inhibitors block protein kinase recruitment to the Hsp90-Cdc37 system. Nat. Chem. Biol. 9, 307–312 (2013). Medline doi:10.1038/nchembio.1212
16. C. K. Vaughan, M. Mollapour, J. R. Smith, A. Truman, B. Hu, V. M. Good, B. Panaretou, L. Neckers, P. A. Clarke, P. Workman, P. W. Piper, C. Prodromou, L. H. Pearl, Hsp90-dependent activation of protein kinases is regulated by chaperone-targeted dephosphorylation of Cdc37. Mol. Cell 31, 886–895 (2008). Medline doi:10.1016/j.molcel.2008.07.021
17. M. Taipale, I. Krykbaeva, L. Whitesell, S. Santagata, J. Zhang, Q. Liu, N. S. Gray, S. Lindquist, Chaperones as thermodynamic sensors of drug-target interactions reveal kinase inhibitor specificities in living cells. Nat. Biotechnol. 31, 630–637 (2013). Medline doi:10.1038/nbt.2620
18. E. E. Boczek, L. G. Reefschläger, M. Dehling, T. J. Struller, E. Häusler, A. Seidl, V. R. Kaila, J. Buchner, Conformational processing of oncogenic v-Src kinase by the molecular chaperone Hsp90. Proc. Natl. Acad. Sci. U.S.A. 112, E3189–E3198 (2015). Medline doi:10.1073/pnas.1424342112
19. C. K. Vaughan, U. Gohlke, F. Sobott, V. M. Good, M. M. Ali, C. Prodromou, C. V. Robinson, H. R. Saibil, L. H. Pearl, Structure of an Hsp90-Cdc37-Cdk4 complex. Mol. Cell 23, 697–707 (2006). Medline doi:10.1016/j.molcel.2006.07.016
20. Y. Cheng, Single-particle cryo-EM at crystallographic resolution. Cell 161, 450–457 (2015). Medline doi:10.1016/j.cell.2015.03.049
21. S. D. Hartson, V. Thulasiraman, W. Huang, L. Whitesell, R. L. Matts, Molybdate inhibits Hsp90, induces structural changes in its C-terminal domain, and alters its interactions with substrates. Biochemistry 38, 3837–3849 (1999). Medline doi:10.1021/bi983027s
22. Materials and methods are available as supplementary materials on Science Online.
23. M. M. Ali, S. M. Roe, C. K. Vaughan, P. Meyer, B. Panaretou, P. W. Piper, C. Prodromou, L. H. Pearl, Crystal structure of an Hsp90-nucleotide-p23/Sba1 closed chaperone complex. Nature 440, 1013–1017 (2006). Medline doi:10.1038/nature04716
24. T. Takaki, A. Echalier, N. R. Brown, T. Hunt, J. A. Endicott, M. E. Noble, The structure of CDK4/cyclin D3 has implications for models of CDK activation. Proc. Natl. Acad. Sci. U.S.A. 106, 4171–4176 (2009). Medline doi:10.1073/pnas.0809674106
25. O. Genest, M. Reidy, T. O. Street, J. R. Hoskins, J. L. Camberg, D. A. Agard, D. C. Masison, S. Wickner, Uncovering a region of heat shock protein 90 important for client binding in E. coli and chaperone function in yeast. Mol. Cell 49, 464–473 (2013). Medline doi:10.1016/j.molcel.2012.11.017

26. L. A. Lavery, J. R. Partridge, T. A. Ramelot, D. Elnatan, M. A. Kennedy, D. A. Agard, Structural asymmetry in the closed state of mitochondrial Hsp90 (TRAP1) supports a two-step ATP hydrolysis mechanism. Mol. Cell 53, 330–343 (2014). Medline doi:10.1016/j.molcel.2013.12.023
27. J. M. Eckl, M. J. Scherr, L. Freiburger, M. A. Daake, M. Sattler, K. Richter, Hsp90·Cdc37 complexes with protein kinases form cooperatively with multiple distinct interaction sites. J. Biol. Chem. 290, 30843–30854 (2015). Medline doi:10.1074/jbc.M115.693150
28. W. Liu, R. Landgraf, Phosphorylated and unphosphorylated serine 13 of CDC37 stabilize distinct interactions between its client and HSP90 binding domains. Biochemistry 54, 1493–1504 (2015). Medline doi:10.1021/bi501129g
29. P. J. Day, A. Cleasby, I. J. Tickle, M. O’Reilly, J. E. Coyle, F. P. Holding, R. L. McMenamin, J. Yon, R. Chopra, C. Lengauer, H. Jhoti, Crystal structure of human CDK4 in complex with a D-type cyclin. Proc. Natl. Acad. Sci. U.S.A. 106, 4166–4170 (2009). Medline doi:10.1073/pnas.0809645106
30. W. Xu, X. Yuan, Z. Xiang, E. Mimnaugh, M. Marcu, L. Neckers, Surface charge and hydrophobicity determine ErbB2 binding to the Hsp90 chaperone complex. Nat. Struct. Mol. Biol. 12, 120–126 (2005). Medline doi:10.1038/nsmb885
31. J. Lachowiec, T. Lemus, E. Borenstein, C. Queitsch, Hsp90 promotes kinase evolution. Mol. Biol. Evol. 32, 91–99 (2015). Medline doi:10.1093/molbev/msu270
32. O. Miyashita, J. N. Onuchic, P. G. Wolynes, Nonlinear elasticity, proteinquakes, and the energy landscapes of functional transitions in proteins. Proc. Natl. Acad. Sci. U.S.A. 100, 12570–12575 (2003). Medline doi:10.1073/pnas.2135471100
33. Y. Shan, A. Arkhipov, E. T. Kim, A. C. Pan, D. E. Shaw, Transitions to catalytically inactive conformations in EGFR kinase. Proc. Natl. Acad. Sci. U.S.A. 110, 7270–7275 (2013). Medline doi:10.1073/pnas.1220843110
34. E. Kirschke, D. Goswami, D. Southworth, P. R. Griffin, D. A. Agard, Glucocorticoid receptor function regulated by coordinated action of the Hsp90 and Hsp70 chaperone cycles. Cell 157, 1685–1697 (2014). Medline doi:10.1016/j.cell.2014.04.038
35. S. J. Arlander, S. J. Felts, J. M. Wagner, B. Stensgard, D. O. Toft, L. M. Karnitz, Chaperoning checkpoint kinase 1 (Chk1), an Hsp90 client, with purified chaperones. J. Biol. Chem. 281, 2989–2998 (2006). Medline doi:10.1074/jbc.M508687200
36. Single-letter abbreviations for the amino acid residues are as follows: A, Ala; C, Cys; D, Asp; E, Glu; F, Phe; G, Gly; H, His; I, Ile; K, Lys; L, Leu; M, Met; N, Asn; P, Pro; Q, Gln; R, Arg; S, Ser; T, Thr; V, Val; W, Trp; and Y, Tyr.
37. J. H. Kim, S. R. Lee, L. H. Li, H. J. Park, J. H. Park, K. Y. Lee, M. K. Kim, B. A. Shin, S. Y. Choi, High cleavage efficiency of a 2A peptide derived from porcine teschovirus-1 in human cell lines, zebrafish and mice. PLOS ONE 6, e18556 (2011). Medline doi:10.1371/journal.pone.0018556
38. D. S. Booth, A. Avila-Sakar, Y. Cheng, Visualizing proteins and macromolecular complexes by negative stain EM: From grid preparation to image acquisition. J. Vis. Exp. 2011, e3227 (2011). Medline

39. G. Tang, L. Peng, P. R. Baldwin, D. S. Mann, W. Jiang, I. Rees, S. J. Ludtke, EMAN2: An extensible image processing suite for electron microscopy. J. Struct. Biol. 157, 38–46 (2007). Medline doi:10.1016/j.jsb.2006.05.009
40. X. Li, P. Mooney, S. Zheng, C. R. Booth, M. B. Braunfeld, S. Gubbens, D. A. Agard, Y. Cheng, Electron counting and beam-induced motion correction enable near-atomic-resolution single-particle cryo-EM. Nat. Methods 10, 584–590 (2013). Medline doi:10.1038/nmeth.2472
41. M. Liao, E. Cao, D. Julius, Y. Cheng, Structure of the TRPV1 ion channel determined by electron cryo-microscopy. Nature 504, 107–112 (2013). Medline doi:10.1038/nature12822
42. A. Rohou, N. Grigorieff, CTFFIND4: Fast and accurate defocus estimation from electron micrographs. J. Struct. Biol. 192, 216–221 (2015). Medline doi:10.1016/j.jsb.2015.08.008
43. S. H. Scheres, RELION: Implementation of a Bayesian approach to cryo-EM structure determination. J. Struct. Biol. 180, 519–530 (2012). Medline doi:10.1016/j.jsb.2012.09.006
44. S. H. Scheres, Beam-induced motion correction for sub-megadalton cryo-EM particles. eLife 3, e03665 (2014). Medline doi:10.7554/eLife.03665
45. S. Chen, G. McMullan, A. R. Faruqi, G. N. Murshudov, J. M. Short, S. H. Scheres, R. Henderson, High-resolution noise substitution to measure overfitting and validate resolution in 3D structure determination by single particle electron cryomicroscopy. Ultramicroscopy 135, 24–35 (2013). Medline doi:10.1016/j.ultramic.2013.06.004
46. P. B. Rosenthal, R. Henderson, Optimal determination of particle orientation, absolute hand, and contrast loss in single-particle electron cryomicroscopy. J. Mol. Biol. 333, 721–745 (2003). Medline doi:10.1016/j.jmb.2003.07.013
47. A. Kucukelbir, F. J. Sigworth, H. D. Tagare, Quantifying the local resolution of cryo-EM density maps. Nat. Methods 11, 63–65 (2014). Medline doi:10.1038/nmeth.2727
48. E. F. Pettersen, T. D. Goddard, C. C. Huang, G. S. Couch, D. M. Greenblatt, E. C. Meng, T. E. Ferrin, UCSF Chimera—A visualization system for exploratory research and analysis. J. Comput. Chem. 25, 1605–1612 (2004). Medline doi:10.1002/jcc.20084
49. X. Bai, E. Rajendra, G. Yang, Y. Shi, S. H. Scheres, Sampling the conformational space of the catalytic subunit of human γ-secretase. eLife 4, e11182 (2015). Medline doi:10.7554/eLife.11182
50. I. Sillitoe, T. E. Lewis, A. Cuff, S. Das, P. Ashford, N. L. Dawson, N. Furnham, R. A. Laskowski, D. Lee, J. G. Lees, S. Lehtinen, R. A. Studer, J. Thornton, C. A. Orengo, CATH: Comprehensive structural and functional annotations for genome sequences. Nucleic Acids Res. 43, D376–D381 (2015). Medline doi:10.1093/nar/gku947
51. W. Wriggers, Conventions and workflows for using Situs. Acta Crystallogr. D 68, 344–351 (2012). Medline doi:10.1107/S0907444911049791

52. L. G. Trabuco, E. Villa, K. Mitra, J. Frank, K. Schulten, Flexible fitting of atomic structures into electron microscopy maps using molecular dynamics. Structure 16, 673–683 (2008). Medline doi:10.1016/j.str.2008.03.005
53. J. C. Phillips, R. Braun, W. Wang, J. Gumbart, E. Tajkhorshid, E. Villa, C. Chipot, R. D. Skeel, L. Kalé, K. Schulten, Scalable molecular dynamics with NAMD. J. Comput. Chem. 26, 1781–1802 (2005). Medline doi:10.1002/jcc.20289
54. R. Y. Wang, M. Kudryashev, X. Li, E. H. Egelman, M. Basler, Y. Cheng, D. Baker, F. DiMaio, De novo protein structure determination from near-atomic-resolution cryo-EM maps. Nat. Methods 12, 335–338 (2015). Medline doi:10.1038/nmeth.3287
55. Y. Song, F. DiMaio, R. Y. Wang, D. Kim, C. Miles, T. Brunette, J. Thompson, D. Baker, High-resolution comparative modeling with RosettaCM. Structure 21, 1735–1742 (2013). Medline doi:10.1016/j.str.2013.08.005
56. F. DiMaio, Y. Song, X. Li, M. J. Brunner, C. Xu, V. Conticello, E. Egelman, T. C. Marlovits, Y. Cheng, D. Baker, Atomic-accuracy models from 4.5-Å cryo-electron microscopy data with density-guided iterative local refinement. Nat. Methods 12, 361–365 (2015). Medline doi:10.1038/nmeth.3286
57. I. W. Davis, A. Leaver-Fay, V. B. Chen, J. N. Block, G. J. Kapral, X. Wang, L. W. Murray, W. B. Arendall III, J. Snoeyink, J. S. Richardson, D. C. Richardson, MolProbity: All-atom contacts and structure validation for proteins and nucleic acids. Nucleic Acids Res. 35 (suppl. 2), W375–W383 (2007). Medline doi:10.1093/nar/gkm216
58. P. Emsley, B. Lohkamp, W. G. Scott, K. Cowtan, Features and development of Coot. Acta Crystallogr. D 66, 486–501 (2010). Medline doi:10.1107/S0907444910007493