EGERTON UNIVERSITY APRIL, 2017
114
1 CHARACTERISATION OF PRODUCTION SYSTEMS AND DEVELOPMENT OF BREEDING OBJECTIVES FOR INDIGENOUS CHICKEN IN RWANDA MAHORO JANVIER A Thesis submitted to the Graduate School in Partial Fulfilment for the Requirements of the Master of Science Degree in Animal Breeding and Genetics of Egerton University EGERTON UNIVERSITY APRIL, 2017
Transcript of EGERTON UNIVERSITY APRIL, 2017
1
CHARACTERISATION OF PRODUCTION SYSTEMS AND DEVELOPMENT OF
BREEDING OBJECTIVES FOR INDIGENOUS CHICKEN IN RWANDA
MAHORO JANVIER
A Thesis submitted to the Graduate School in Partial Fulfilment for the Requirements
of the Master of Science Degree in Animal Breeding and Genetics of Egerton University
EGERTON UNIVERSITY
APRIL, 2017

ii
DECLARATION AND RECOMMENDATION
DECLARATION
This thesis is my original work and has not, wholly or in part, been presented in this or any
other University for an award of a degree.
Signed: ………………………………………Date……………………………….
Mr. MAHORO Janvier
KM11/13539/14
RECOMMENDATION
This thesis is the candidate’s original work and has been prepared with our guidance and
assistance; it has been submitted with our approval as the official University supervisors.
Signed…………………………………… Date……………………………………………
Prof. Dr. A. K. Kahi (Dr. rer. Agr)
Professor, Faculty of Agriculture, Department of Animal sciences,
Egerton University.
Signed……………………………………… Date: ................................................................…
Dr. Thomas K. Muasya (Dr. rer. Agr)
Lecturer, Faculty of Agriculture, Department of Animal sciences,
Egerton University.
Signed……………………………………… Date: …………………………………………...
Dr. Francis M. B. Mbuza (PhD)
Senior Lecturer, Faculty of Agriculture, Department of Animal Production
College of Agriculture, Animal sciences and veterinary medicine (CAVM)
University of Rwanda.

iii
COPYRIGHT
No part of this thesis may be produced, stored, in any retrieval system, or transmitted
in any form or means; electronically, mechanically, photocopying, recording or otherwise
without prior written permission of the author and/or Egerton University on that behalf.
© 2017 MAHORO JANVIER

iv
ACKNOWLEDGEMENT
First and foremost, I give all the glory to the Almighty God for successful completion
of this study. I would like to appreciate several institutions and persons who in one way or
another opened door and responded my ceaseless questions in the search for knowledge that
culminated in successful completion of this study. With gratitude, I recognize the role played
by the Graduate School and the Department of Animal sciences, Egerton University who
collectively offered me the chance to pursue post-graduate studies. My sincere thanks to the
Centre of Excellence for Livestock Innovation and Business for allowing me to use the
available facilities and unlimited internet at Egerton University. I am deeply indebted to the
Kingdom of the Netherlands through the NUFFIC project (NICHE RWA/173) for covering fee
and other financial support. I also recognized the immense support of the Government of
Rwanda through the College of Agriculture, Animal sciences and Veterinary Medicine
(CAAVM) of the University of Rwanda for granting me study leave during that period, which
enabled me to utilize the opportunity.
I am grateful to my supervisors, Prof. Dr. Alexander K. Kahi, Dr. Thomas K. Muasya
and Dr. Francis M.B. Mbuza for their technical advice, meticulous guidance, patience,
encouragement, leadership, professional supervision, inspiration and unlimited support during
the entire study period. A perfect blend of professional and social concern you showed during
my study period made even bleak ends shine, for this I say thank you. The unwavering kind
support from Dr. Tobias O. Okeno, Dr. James Ondiek and Mr. Jackson M. Mbuthia are highly
appreciated. I thank my fellow postgraduate students for the moral support. Thank you my
fellow Rwandan students, especially Aristide Niyokuri for the great hospitality in Egerton
University. I am highly indebted to my friends Casimir Hakizimana, Akwiyimana Theophile,
Jean Paul Mbarushimana, Remy Twagirimana and Kibeho Benoit for the support and
hospitality provided during data collection and for the most wonderful times we always shared.
Thank you my brothers Ndera Jackson, Ndera Ernest and Ndera Jacques for your daily
encouragement. Finally, I present my deepest gratitude to my fiancée Eline Nyirangirimana.

v
DEDICATION
This work is dedicated to my entire family; my aunts Antoinette Musabyeyezu, Clotilde and my
parents Ndera Jean and Narisansima Euprasie who have always inspired me to think big and try a
little harder. All the farmers and researchers who believe in the indigenous chicken.
vi
ABSTRACT
Poultry production is one of the animal production enterprises with a promising future in Rwanda
as 80.1% of all Rwandese raise chickens. Indigenous chickens (IC) are the most numerous and
important species of poultry as they are found in most rural households in Rwanda. Currently, IC
potential is underutilized due to the lack of well-defined production and breeding practices; the
farmer, marketer and consumers’ breed preferences and traits of economic importance are
unknown. The objectives of this study were to characterise the IC production systems in Rwanda,
to identify the breeding practices and traits of economic importance and to develop a bio-economic
model and estimate the economic values for traits of economic importance. Data were collected
using the structured questionnaires administered to farmers, marketers and consumers from
November 2015-January 2016. Data were analysed using SAS and SPSS software. The production
systems in all districts studied were mainly extensive (FRS) with minimum provision of
supplementary feeds. Semi-intensive (SIS) and intensive (IS) systems were also practiced at low
extend. The main challenges facing IC production were diseases outbreaks, lack of investment
capital and predators were the major challenges. Indices for the traits perceived by farmers as of
primary economic importance were egg yield (0.093), disease tolerance (0.091), high growth rate
(0.089), prolificacy (0.088), high body weight (0.087) and egg fertility (0.083). The most
importance traits considered by the marketers were body weight (BW), disease tolerance (DTOL),
plumage colour (PCOL), egg yolk colour (EYC), meat quality (MQ), growth rate (GR) and egg
yield (EN) whereas for consumers, meat quality, egg yolk colour, egg yield, body weight and
growth rate were considered. The results from the model show that IC can be utilised profitably
under free range system. A negative profit was observed in semi-intensive and intensive systems.
The economic values for EN, live weight for grower (LWg), live weight for cock (LWcock) and
live weight for hen (LWhen) were positive in all three production systems. Economic values for
fertility (FER) and hatchability (HA) were Frw 185.21 and 171.42, –68.16 and –63.08, and -427.10
and –395.295 in FRS, SIS and IS, respectively. An increase of 1% in EN resulted in an increase
in revenue of Frw 61.21, 112.12 and 143.95 in FRS, SIS and IS, respectively. Economic values
for LWhen increased by Frw 1225.00, 1312.50 and 1662.50 while the revenues from LWcock
increased by Frw 350.00, 375.00 and 475.00 of the total profits in the respective production
systems. one percent increment in LWg resulted in a profit of Frw 187.02, 270.49 and 431.23 in
FRS, SIS and IS. This study has presented the possibility of genetic improvement of productive
and functional traits of IC in Rwanda.
vii
TABLE OF CONTENTS
DECLARATION AND RECOMMENDATION ........................................................... ii
COPYRIGHT .................................................................................................................. iii
ACKNOWLEDGEMENT ...............................................................................................iv
DEDICATION ................................................................................................................... v
ABSTRACT ......................................................................................................................vi
LIST OF TABLES ............................................................................................................. x
LIST OF FIGURE .......................................................................................................... xii
LIST OF ABBREVIATIONS ....................................................................................... xiii
CHAPTER ONE .............................................................................................................. 14
GENERAL INTRODUCTION ...................................................................................... 14
1.1. Background information ....................................................................................... 14
1. 2. The statement of problem .......................................................................................... 16
1.3. Objectives ................................................................................................................... 16
1. 4. Research questions .................................................................................................... 17
1.5. Justification ................................................................................................................. 17
CHAPTER TWO ............................................................................................................. 18
LITERATURE REVIEW ............................................................................................... 18
2.1. Chicken production in Rwanda .................................................................................. 18
2.1.1. Chicken production systems ................................................................................. 20
2.1.2. Marketing systems for chickens and their products .............................................. 21
2.1.3. Chicken breeding .................................................................................................. 22
2.1.4. Constraints to chicken production ......................................................................... 23
2.2. Performance of indigenous chicken genotypes and their crosses............................... 24
2.3. Development of breeding objectives .......................................................................... 26
2.3.1. Specification of the breeding, production and marketing systems ....................... 27
2.3.2. Identification of sources of income and expenses ................................................. 27
2.3.3. Determination of biological traits influencing income and expenses ................... 27
2.3.4. Derivation of economic values of traits ................................................................ 28
2.4. Genetic and phenotypic parameters in chicken breeding ........................................... 28
2.5. Selection index theory ................................................................................................ 30
CHAPTER THREE ......................................................................................................... 32
CHARACTERISATION OF INDIGENOUS CHICKEN PRODUCTION
SYSTEMS IN RWANDA ................................................................................................ 32
3.1 Introduction ................................................................................................................. 32
viii
3.2 Materials and methods ................................................................................................. 33
3.2.1 Description of study area ....................................................................................... 33
3.2.2 Sampling framework and data collection procedures ............................................ 34
3.2.3 Data collection and analysis ................................................................................... 34
3.3 Results and discussion ................................................................................................. 35
3.3.1 Household characteristics ....................................................................................... 35
3.3.2 Land holding and livestock flock size .................................................................... 35
3.3.3 Chicken management ............................................................................................. 38
3.3.4 Production purpose, health management and constraints faced by IC in the study
area .................................................................................................................................. 40
3.3.5 Indigenous chicken ecotypes, flock structure, dynamics and reproduction
performance ..................................................................................................................... 43
3.3.6 Constraints to IC production .................................................................................. 47
3.4 Conclusions ................................................................................................................. 47
CHAPTER FOUR ........................................................................................................... 49
FARMERS BREEDING PRACTICES AND TRAITS OF ECONOMIC
IMPORTANCE FOR INDIGENOUS CHICKEN IN RWANDA .............................. 49
4.1 Introduction ................................................................................................................. 49
4.2 Materials and methods ................................................................................................. 50
4.2.1 Study areas and data collection .............................................................................. 50
4.2.2 Data analysis .......................................................................................................... 51
4.3 Results and discussion ................................................................................................. 51
4.3.1 Chicken genotypes kept and their attributes in the study area ............................... 51
4.3.2 Farmer’s flock selection practices .......................................................................... 53
4.3.3 Traits perceived by farmers, marketers and consumers as being of primary
importance. ...................................................................................................................... 55
4.4 Conclusion ................................................................................................................... 59
CHAPTER FIVE ............................................................................................................. 60
BIO-ECONOMIC MODEL DEVELOPMENT AND ESTIMATION OF
ECONOMIC VALUES FOR TRAITS .......................................................................... 60
5.1 Introduction ................................................................................................................. 60
5.2 Material and methods .................................................................................................. 61
5.2.1 Model description ................................................................................................... 61
5.2.2 Breeding, production and marketing ...................................................................... 63
5.3 Estimation of revenues, costs and profitability ........................................................... 65
ix
5.4 Derivation of economic values .................................................................................... 68
5.5 Assessment of the effect of economic values on genetic gain .................................... 70
5.5.1 Phenotypic and genetic parameters ........................................................................ 70
5.5.2 Selection indices and criteria ................................................................................. 70
5.6 Results and discussion ................................................................................................. 72
5.6.1 General bio-economic model ................................................................................. 72
5.6.2 Estimation of economic values .............................................................................. 75
5.6.3 Effect of economic values on genetic gain............................................................. 78
5.7 Conclusion ................................................................................................................... 80
CHAPTER SIX ................................................................................................................ 81
GENERAL DISCUSSION AND CONCLUSIONS ...................................................... 81
6.1 Aim of the study .......................................................................................................... 81
6.2 Study methodology ...................................................................................................... 81
6.3 Indigenous chicken production systems ...................................................................... 82
6.4 Breeding practices and traits of economic importance ................................................ 84
6.4.1 Chicken genotypes and their attributes .................................................................. 84
6.4.2 Traits of economic importance ............................................................................... 85
6.5 Bio-economic model ................................................................................................... 86
6.6 General conclusions ..................................................................................................... 86
6.7. General recommendations .......................................................................................... 87
References......................................................................................................................... 88
APPENDICES .................................................................................................................. 98
x
LIST OF TABLES
Table 1. Mean production and reproduction performance of indigenous chickens ................. 25
Table 2. Genetic and phenotypic parameters of some production and reproduction traits in
indigenous chicken .............................................................................................................. 29
Table 3a: Socio-economic status of indigenous chicken owners and farms in the study districts
of Rwanda ........................................................................................................................... 36
Table 3b: Socio-economic status of indigenous chicken owners and farms in the study
districts of Rwanda……………………………………………………………………......37
Table 4: IC production systems, housing and feeding practices .............................................. 39
Table 5a: Production purpose, health management and constraints faced by IC in the study area
............................................................................................................................................. 42
Table 5b: Production purpose, health management and constraints faced by IC in the study area
…………………………………………………………………………………………….43
Table 6. Indigenous chicken genotypes in the study area ........................................................ 44
Table 7. Indigenous chickens stock structure and dynamics ................................................... 45
Table 8. Productive and reproductive performance of Indigenous chickens ........................... 46
Table 9. Characteristics of the study area ................................................................................ 50
Table 10. Percentage and number of households perceiving different traits for each IC
genotypes to be important in Rwanda ................................................................................. 53
Table 11. Percentage ranking of traits used by farmers when selecting male and female chicken
for breeding purposes in selected districts of Rwanda ........................................................ 54
Table 12. Ranking of traits perceived by farmers, marketers and consumers as being of
primary economic importance…………………………………………………………….56
Table 13. Correlation of farmer, marketer and consumer rankings for traits of economic
importance…………………………………………………………………………...........58
Table 14. The level of production variables considered in the model ..................................... 64
Table 15: Unit prices and costs considered in the model ......................................................... 65
Table 16: The biological traits influencing revenues and costs ............................................. 699
Table 17.The phenotypic standard deviation, heritability, genetic and phenotypic correlations
for traits in breeding objective and selection criteria ........................................................ 700
Table 18: Estimated revenues, costs and profitability for indigenous chicken in the FRS, SIS
and IS production systems ................................................................................................ 733
Table 19: Economic values in Frw for traits under fixed flock size ..................................... 766

xi
Table 20. Genetic superiority in the breeding objective and economic response to selection for
production systems .............................................................................................................. 79

xii
LIST OF FIGURE
Figure 1. Indigenous chicken value chain in Rwanda. ............................................................ 22
Figure 2. Administrative map of Rwanda showing four provinces and Kigali city. ............... 33

xiii
LIST OF ABBREVIATIONS
AD Anno Domini
BC Before Christ
CRFS Confined full-ration system
CoELIB Centre of Excellence for Livestock Innovation and Business
EICV Enquête Intégrale sur les Conditions de Vie des Ménages
EACSOF East African Civil Society Organizations’ Forum
FAO Food and Agriculture Organization
Frw Francs Rwandais
GDP Gross Domestic Product
IC Indigenous Chicken
INCIP Smallholder Indigenous Chicken Improvement Programme
Kg Kilogram
Kcal Kilo calorie
KgD Kilo of Dry matter
MINAGRI Ministry of agriculture and animal resources
ND Newcastle Disease
NISR National Institute of Statistic of Rwanda
NGOs Non-Governmental Organizations
SAS Statistical Analysis System
SPSS Statistical Package for the Social Sciences
RAB Rwanda Agricultural Board
14
CHAPTER ONE
GENERAL INTRODUCTION
1.1. Background information
Livestock production in Rwanda is a major agricultural activity contributing about 12%
of the national GDP and 30% of the agricultural GDP (Rwanda Statistical yearbook, 2011).
The livestock sector is supported by different species, but poultry are the most predominant in
terms of numbers with an estimated population of 4.8 million heads (FAOSTAT, 2013). Out
of 4.8 million poultry birds, 24,000 are ducks and 11,000 are geese and guinea fowls
(FAOSTAT, 2013). Currently they contribute to the 3,000 tonnes of eggs and 2,144 tonnes of
chicken meat produced annually (FAOSTAT, 2013).
The most common poultry species is chicken that is raised by over 80% of farmers
especially for egg production making chicken production a promising animal enterprise for
achieving rural development (NISR, 2011). Poultry farming particularly IC are the most
numerous and important species found wherever there are human settlements in Africa
(Mekonnen et al., 2010). Their popularity among resource poor rural households and
disadvantaged groups in developing countries is attributed to their low costs of production
associated with less land requirement, low inputs, and low startup capital; adaptability to harsh
scavenging conditions and poor nutrition and tolerance to parasite and diseases (Dana et
al.,2010; Kingori et al., 2010). Apart from providing protein, IC keeping contributes to the
economy and poverty reduction because it serves as a source of income for farmers
(MINAGRI, 2012).
Since 1994, after the Tutsi genocide, there have been many programmes to restock the
family-farming sector with poultry including distribution of chickens to returning refugees and
cockerel exchange programmes. Some of the refugees came back with chicken from the areas
where they had lived (MINAGRI, 2012).
In 2012, the Ministry of Agriculture and Animal Resources (MINAGRI) initiated a
strategy and investment plan to strengthen the poultry industry in Rwanda starting from 2012-
2015 with aim of making the poultry a flagship of the Rwandan livestock (MINAGRI, 2012).
One component of the project was to improve the village poultry production by tackling the
factors affecting IC production through genetic improvement by crossbreeding IC with exotic
breeds; health and disease control and improvement of IC husbandry (MINAGRI, 2012). The
recently started crossbreeding trials with the “Kuroiler” synthetic breed are an example of such
a programme to study the possibilities to increase productivity of this chicken production
15
(MINAGRI, 2012). Despite the effort made by the Government of Rwanda as well as other
developing countries to recognize IC as an avenue to alleviate poverty and food insecurity
reduction, little efforts have been made to improve their productivity which has been
recognized as the major obstacle in their utilization and conservation. Their low productivity
has hindered their potential to uplift the living standards of their custodians and contribution to
rural development (Okeno et al., 2012).
In developing countries, previous attempts to improve the IC productivity through
crossbreeding with commercial exotic breeds have largely been unsuccessful due to
incompatibility of crossbreds with low-input production systems, lack of clear breeding
objectives and operational breeding programmes to ensure constant supply of breeding stock
to farmers (Natukunda et al., 2011; Magothe et al., 2012; Okeno et al., 2012). Other major
challenges to IC production identified were poor quality and inadequate feed resources,
healthcare, marketing, housing and lack of breeding stock (Okeno et al., 2011; Bett et al.,
2012). Second attempts were made in developing countries to increase the IC productivity. For
instance, in 2006 through a collaborative programme, the Smallholder Indigenous Chicken
Improvement Programme (INCIP) was initiated in Kenya. The objective of the programme was
to undertake a comprehensive analysis of the entire IC value chain for the purpose of
understanding the entire sub-sector (www.incip.org). Through INCIP, various steps for the
development of breeding programmes which is the first step in IC genetic improvement ( Bett
et al., 2011; Okeno et al., 2012) were undertaken. For example, the production systems of the
IC sub-sector in Kenya have been characterized by Bett et al. (2012) and Okeno et al. (2012a)
and on-station production and reproduction parameters of different IC genotypes and ecotypes
estimated by Magothe et al. (2010) and Ngeno (2011). The farmer’s preferences in selection
of IC genetic resources and IC disease and parasites prevalence were studied Kaingu et al.
(2010). In addition, the breeding objectives accounting for the needs of all stakeholders along
the value chain were also developed (Okeno et al., 2012). Bio-economic models have been
used to estimate profitability and economic values for traits of IC (Okeno et al., 2013). In
Rwanda, such studies are scarce. In addition, breeding objectives have not been documented
to guide the farmers on how to implement genetic improvement of IC to improve their
livelihoods. Therefore, there is need to develop breeding objectives accounting for the needs
of all stakeholders along the production value chain in the IC production. This will call for
comprehensive characterization of IC production systems.
16
1. 2. The statement of problem
In Rwanda, IC are the most numerous and important species of poultry as they are found
in most rural households. Currently they play significant roles to women, widows and orphaned
children in terms of food security and nutrition, cash income and savings. Despite IC
contribution to the rural household development, they have remained less competitive
compared to exotic breeds due to their low productivity. In developing countries, such as
Rwanda, previous attempts to improve their productivity through crossbreeding with exotic
chickens proved unsustainable because the resultant genotypes could not survive under
extensive production systems. This has been attributed to poor understanding of the IC
production systems as it was assumed that all production systems were homogenous with
similar production objectives and management interventions. The best way to promote the
competitiveness of IC is to improve their productivity without altering their morphological and
environmental characteristics. This requires characterisation of their production systems and
identification of the existing IC ecotypes and their features to producers as the first step.
Characterization would help in formulation of realistic breeding objectives that are relevant to
existing and future production conditions. Formulation of breeding objectives requires
identification of traits of economic importance and estimation of their economic values, which
is currently lacking.
1.3. Objectives
The main objective of this study was to contribute to the improved productivity of IC
through characterisation of IC production systems and development of breeding objectives for
IC in Rwanda. The specific objectives were:
i. To characterize the production and marketing systems of IC in Rwanda.
ii. To identify the breeding practices and traits of economic importance for IC genetic
resources from the perspective of stakeholders along the IC value chain in Rwanda.
iii. To develop a bio-economic model and estimate economic values of traits of economic
importance.
17
1. 4. Research questions
i. What are the characteristics of the production and marketing systems of indigenous
chicken in Rwanda?
ii. What are the breeding practices, breeding goals and traits of economic importance in the
selection of IC genetic resource?
iii. What are the economic value of the traits in the breeding objectives under different IC
production systems?
1.5. Justification
Characterization of IC production, breeding and marketing practices helped to
understand the production system under which IC are raised in Rwanda, the study explored the
farmers, traders and consumer’s breed preferences and traits of economic importance. The
generated information has been used to define IC breeding objectives. The developed breeding
objectives provided a clear basis tool to the development of sustainable breeding programme
for genetic improvement and conservation of IC genetic resources.
18
CHAPTER TWO
LITERATURE REVIEW
2.1. Chicken production in Rwanda
Despite the low productivity of indigenous poultry genotypes compared to commercial
strains, indigenous genotypes are widely distributed in rural and peri-urban of many developing
countries, frequently in excess of 80 percent (Gabanakgosi et al., 2013; Pym, 2010). In rural
villages in most countries, the majority of families have small flocks of poultry, mainly
chickens but sometimes other species including ducks, turkeys and guinea fowls, which
provide family needs for poultry meat and eggs (Pym, 2010). These birds are invariably
indigenous genotypes, or cross-breeds with a significant indigenous genotype component.
Globally, IC produce 30% of all the white meat consumed (FAO,2014 ).
In Africa chickens and IC in particular, are the most numerous and important species
of poultry as they are found wherever there are human settlements (Akinola et al., 2011).
Although, IC was primarily domesticated in Africa for cultural, ritual and social activities, their
roles have changed over time (Okeno et al., 2011). Currently they play various significant roles
such as generating income and employment for various categories of people including poultry
farmers, primary and secondary traders, processors and caterers from sale of birds and eggs.
IC play significant gender roles to women, widows, and orphaned children in terms of food
security and nutrition, cash income and savings. They provide a valuable source of protein in
the diet (Kingori et al., 2010; Okeno et al., 2012a). The IC also play an important socio-cultural
role and traditional medicine in many societies (Kingori et al., 2010; FAO, 2014). Compared
to other livestock species, IC have advantages in that they are hardy, adapting well to the harsh
scavenging conditions and poor nutrition and tolerance to parasites and diseases, survive on
low inputs and adapt to fluctuations in available feed resources. The IC have the advantages of
having quick returns to investment and relatively simple management practices with numerous
market outlets for their products (Kingori et al., 2010).
In the East African region, archaeological dates (calibrated) for the presence of chickens
are more recent; the earliest is mid-seventeenth century BC in Sudan compared to 800 AD in
coastal Kenya and in Akameru and Cyinkomane in Rwanda. However, the subsequent pattern
and chronology of dispersion of the species within the continent remain unclear (Mwacharo et
al., 2013).
In Rwanda, since 1994 there have been many programs to restock the family-farming
sector with poultry including distribution of chickens to returning refugees, cock exchange
program etc. Some of the refugees came back with chicken from the areas where they had
19
lived. The recently started crossbreeding trials with the “Kuroiler” synthetic breed are an
example of such a program to study the possibilities to increase productivity of this poultry
production sector. Up to date poultry population is estimated at 4,838,000 million heads
(chickens, ducks and turkeys).
Poultry industry in Rwanda is characterised by the coexistence of 2 systems;
rudimentary village poultry and industrial poultry which is at its infancy. These systems are
faced with scarcity of inputs to fully exploit their potential. The problem of low productivity is
wide spread in the country (MINAGRI, 2012). This is mainly attributed to the high mortality
of chicken occasioned by outbreaks of Newcastle disease (ND), fowl pox and fowl cholera;
poor management and insufficient food in quality and quantity (MINAGRI, 2012).
The exotic chicken breeds found in Rwanda are exotic layer breeds such as Leghorn,
Sussex, Rhode Island Red, Derco, Isa Brown, Norman with a laying performances range from
300 to 350 eggs per hen per year (MINAGRI, 2012). The exotic Broiler breeds are Cobb 500,
Hubbard, and Derco and in ideal conditions, they reach 2kg in 45 to 50 days (MINAGRI, 2012).
A substantial portion of the meat and eggs consumed in Rwanda are derived from commercial
broilers and layers respectively. The exotic chickens are kept under commercial poultry
production system provided with feeds, shelter and clean water and regularly vaccinated
against common poultry diseases such as New Castle Disease. However, in some farms exotic
chicken are kept in various place with low to minimal biosecurity. For example, a caged layer
farm with birds in open sheds, a farm with birds spending most of the time outside the shed or
a farm producing chickens and waterfowl (MINAGRI, 2012). The emergence of high-
performance exotic poultry industry is closely linked to the developed of the poultry feed
industry whose nonexistence compelled farmers to produce the diets themselves. As a result,
feed prices are higher due to the lack of economies of scale, not to mention quality problems.
Many ingredients used are relatively scarce in the domestic market and very expensive. There
is also an unpredictability of prices that fluctuate strongly over the year (MINAGRI, 2012).
The IC breeds like in other developing countries are dominant than the exotic chicken
in Rwanda and therefore tend to supply more families with eggs and meat than the commercial
chicken. The IC ecotypes found in Rwanda are dwarf, Normal and frizzled feathers, Naked
neck, cross and non-distinctive breeds utilised as dual-purpose birds producing both eggs and
meat. They are characterised with small flock size which varies seasonally and their laying
performance ranging from 40 to 100 eggs per hen per year. They are mostly kept under
subsistence production systems with minimal biosecurity (MINAGRI, 2012).

20
2.1.1. Chicken production systems
In the tropics, a number of production systems under which IC are raised have been
identified with variable management regimes (Kingori et al., 2010). They include the free-
range, backyard, semi-intensive and intensive production systems.
Free-range production system (FRS)
In FRS, the management of the chickens is mainly based on available indigenous
technical knowledge. Both the chicks and the mature chicken are mostly left to scavenge for
feeds during the day and confided at night (Kingori et al., 2010). They scavenge for insects,
food and kitchen leftovers, green grass, leafy vegetables and any scattered grains (Moges et
al., 2010). Occasionally the birds are supplemented with household crop leftovers such as
maize, millet, sorghum, ripe pawpaw seeds, amaranth’s seeds, cassava meal, cereal bran, wheat
(Kingori et al., 2010; Gabanakgosi et al., 2013). Supplements vary based on season and
availability. They are placed either on ground or into unprepared feeders. Drinking water is
irregularly given in tins or broken clay pot pieces (Kingori et al., 2010). Housing under free
scavenging system is not developed and where it exists it is mainly for birds’ protection against
predators and extreme weather (Kingori et al., 2010). The FRS system is characterised by low
outputs-egg and meat production per bird, but requires low capital input and hence low
economic risks (Dessie et al., 2011). Replacement stocks are obtained from own hatching
chicks or are purchased from the local market, or from neighbours or given as gift. Marketing
channels for products and live birds are undefined. During the time when there is urgent need
of money or when birds are sick or when hatching is not required, live birds and eggs are sold
at the gate or in the local market (Dessie et al., 2011). About 95% of the IC are raised under
FRS by rural smallholder farmers in the tropics (Dessie et al., 2011).
Semi-intensive system
The semi-intensive or semi-scavenging system (SIS) is practiced in small households
where families are financially able more than the rest of the household who practice the
scavenging system (Kingori et al., 2010). Chickens are partly confined, especially in relation
to the prevailing activities in arable agriculture, e.g., when crops are at stage where foraging
chickens could destroy them (Moges et al., 2010). Chickens are confined to avoid conflicts,
but they get crop residues, grains and kitchen leftovers as supplement for their daily feed
requirements. The chickens reared under this system are mainly crosses between indigenous
and exotic breeds. Water and sometimes veterinary or ethno-veterinary care is provided though
21
not adequately and mortality is 40-60% in young chicks (Moges et al., 2010; Kingori et al.,
2010).
Intensive system
The intensive system or confined full-ration system (IS), is the production system where
flock is confined all the time and supplied with a balanced diet (Moges et al., 2010).
Vaccination against endemic diseases is common under this system. This system is not
common in most tropical field situations because of high input requirements (Harrison et al.,
2010; Msoffe et al., 2010).
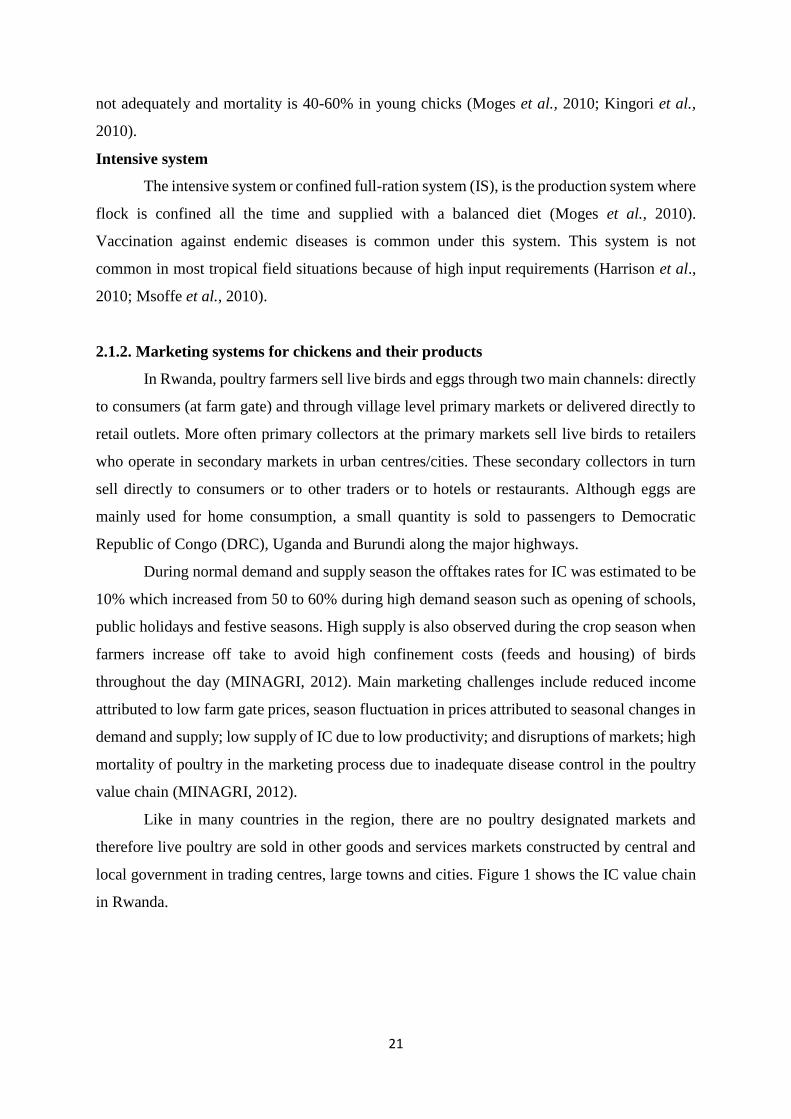
2.1.2. Marketing systems for chickens and their products
In Rwanda, poultry farmers sell live birds and eggs through two main channels: directly
to consumers (at farm gate) and through village level primary markets or delivered directly to
retail outlets. More often primary collectors at the primary markets sell live birds to retailers
who operate in secondary markets in urban centres/cities. These secondary collectors in turn
sell directly to consumers or to other traders or to hotels or restaurants. Although eggs are
mainly used for home consumption, a small quantity is sold to passengers to Democratic
Republic of Congo (DRC), Uganda and Burundi along the major highways.
During normal demand and supply season the offtakes rates for IC was estimated to be
10% which increased from 50 to 60% during high demand season such as opening of schools,
public holidays and festive seasons. High supply is also observed during the crop season when
farmers increase off take to avoid high confinement costs (feeds and housing) of birds
throughout the day (MINAGRI, 2012). Main marketing challenges include reduced income
attributed to low farm gate prices, season fluctuation in prices attributed to seasonal changes in
demand and supply; low supply of IC due to low productivity; and disruptions of markets; high
mortality of poultry in the marketing process due to inadequate disease control in the poultry
value chain (MINAGRI, 2012).
Like in many countries in the region, there are no poultry designated markets and
therefore live poultry are sold in other goods and services markets constructed by central and
local government in trading centres, large towns and cities. Figure 1 shows the IC value chain
in Rwanda.
22
Figure 1. Indigenous chicken value chain in Rwanda.
(Source: FAO / Tabitha Kimani and Alex Nyarko 2011)
2.1.3. Chicken breeding
In Rwanda, national supply of one-day chicks for both eggs and meat production are
virtually nonexistent. Almost all the chicks are imported, mostly from Uganda, Belgium and
Netherlands. Chicks from Uganda are cheaper (500 rwf vs. 700; 850 vs. 950 for laying chicks)
but the delivery times are long (2 to 3 months). Moreover, Rwanda faces competition from
RDC (Goma) and South Sudan which have strong demand. The National hatchery (Rubilizi
hatchery) and other small hatcheries located in different districts obtain parent stock directly
from international breeders and rear them for purposes of producing fertile eggs. Both layer
and broiler parent stock are kept on deep litter system, but provided with nest so as to avoid
getting dirty or broken eggs. During the growth of the parent stock, careful monitoring of live
23
weight gain is done so as to prevent the parent stock from achieving their growth potential and
thus create problems in fertility and hatchability.
The Incubation capacity, however, is misleading because most of these hatcheries
operate only partially. This is confirmed by the fact that the Rubilizi hatchery, which account
for 28% of the national chick production capacity, and the subsequent imports to fill the gap.
Previous study by MINAGRI (2012) indicated that the total parental stock was 15,468 hens
and incubation capacity was 95, 618 eggs. The fertile eggs are hatched and day old chicks are
bought by farmers on hatchery gate who transport chicks at their farms located in the urban
and peri-urban areas mostly surrounding Kigali city and the boundaries of Rwanda and
Democratic Republic of Congo. The farmers are given manuals on broiler and layer chicken
production and some attend poultry farming training organised by the National Agriculture
board. Generally, a substantial proportion of eggs and meat consumed in the country are
produced from specialized eggs and meat stock. At the end of their productive life, layers and
broiler parent stock are sold to be slaughtered for meat.
IC breeding in Rwanda like other developing countries is relatively individual affair
and the farmer decides what characteristics to proliferate (Menge, 2008). Some farmers have,
however, indicated that they prefer prolific chicken with high disease resistance while others
have shown preference for chicken with colours that are not bright for the purposes of
camouflaging the chicken from airborne predators as they are scavenging for feed (Moges et
al., 2010; Essien et al., 2011; Cabarles, 2013). Recently in 2014, FAO in collaboration with
Rwanda Agriculture Board (RAB) have launched a project worth US$800,000 to help improve
poultry farming in the country. This project aims to assist small scale poultry farmers to
increase production and promote their linkages to markets. To achieve the major objective, the
project adopted IC and their crosses and provided equipment like incubators, fund construction
of poultry shelter and long-term loans to the farmers. United Nation (UN) organisation offered
training in poultry, especially how to shorten the production cycle and reduce the associated
risks for small scale farmers so that they can provide high quality pullets.
2.1.4. Constraints to chicken production
Usually poor management and inappropriate construction of the house in the tropics
especially in sub-Sahara Africa does not allow for the maintenance of proper sanitation and
there is no regular dusting and use of antibiotics in minimal. The IC healthcare is poorly
undertaken across the countries (Asmara, 2014; Okeno, et al., 2012). This leads to high pest
infestation and frequent disease outbreaks, resulting in high mortalities. Various diseases have
24
been identified in FRS as major constraint both in terms of costs of prevention, treatment and/or
loss due to resulting mortality or reduced productivity. Expenditure on disease control is
minimal and chick mortalities average 40-60% over the first 8-weeks. Newcastle Disease (ND)
is the most prevalent and fatal in poultry in tropics (Moges et al., 2010; Okeno et al., 2012;
Gabanakgosi et al., 2013; Addisu et al., 2014). Other common diseases are fowl pox, fowl
typhoid and coccidiosis (Kingori et al., 2010; Mtileni et al., 2012). Other constraints identified
in IC production among smallholder in the tropics include costly and/ or poor quality feeds,
lack of high-quality breeding stocks, lack of finances, limited marketing channels, small flock
size, inadequate IC performance, low levels of literacy, lack of access to extension and
healthcare services (Moges et al., 2010; Okeno et al., 2012; Gabanakgosi et al., 2013).
2.2. Performance of indigenous chicken genotypes and their crosses
The traits influencing productivity include the annual egg number, live weight at sexual
maturity, egg weight, fertility, hatchability and chick survival rate are important because they
influence the of eggs spared for consumption or sale and generation of replacement stocks
(Menge, 2008). Traits such as resistance to diseases, incubation behaviours, scavenging
efficiency, plumage colour, naked necks and homing instinct are also essential for suitability
to particular environments (Menge, 2008).
A number of studies in the tropics have reported production and reproduction
performance of IC under FRS, SIS and IS. Table 1 shows the production and reproduction
performances of IC in several countries. Bekele et al. (2010) and Victor et al. (2014) reported
that in backyard and semi-intensive production systems, age at first egg ranges from 180 to 240
days in Tanzania and Sri Lanka. However, this has been shown to reduce to 166 days under
intensive management. This could be a clear indicator of genotype x environment interaction
effect under improved intensive system. The number of clutches per year ranges from 2 to 3 in
FRS and SIS and 4 clutches per year in IS (Kitalyi et al., 2002; Asresie et al., 2015). The
number of eggs per clutch ranges from 10 to 18 eggs in FRS and 22 eggs in SIS systems
whereas in IS it goes up to 30 eggs per clutch (Kitalyi et al., 2002; Njenga, 2005; Akinola and
Essien, 2011). The mean egg weight in all production systems range between 38-48 g. Fertility
and hatchability range between 60-93 % and hatching weights are often low, ranging between
30 to 43g (Table 1). The chick survival range between 13-84% in backyard and about 86% in
IS (Olwande et al., 2010; Akinola and Essien, 2011; Cabarles, 2013). IC are relatively active
and hardy thus have better ability to withstand the disease challenges associated with free-
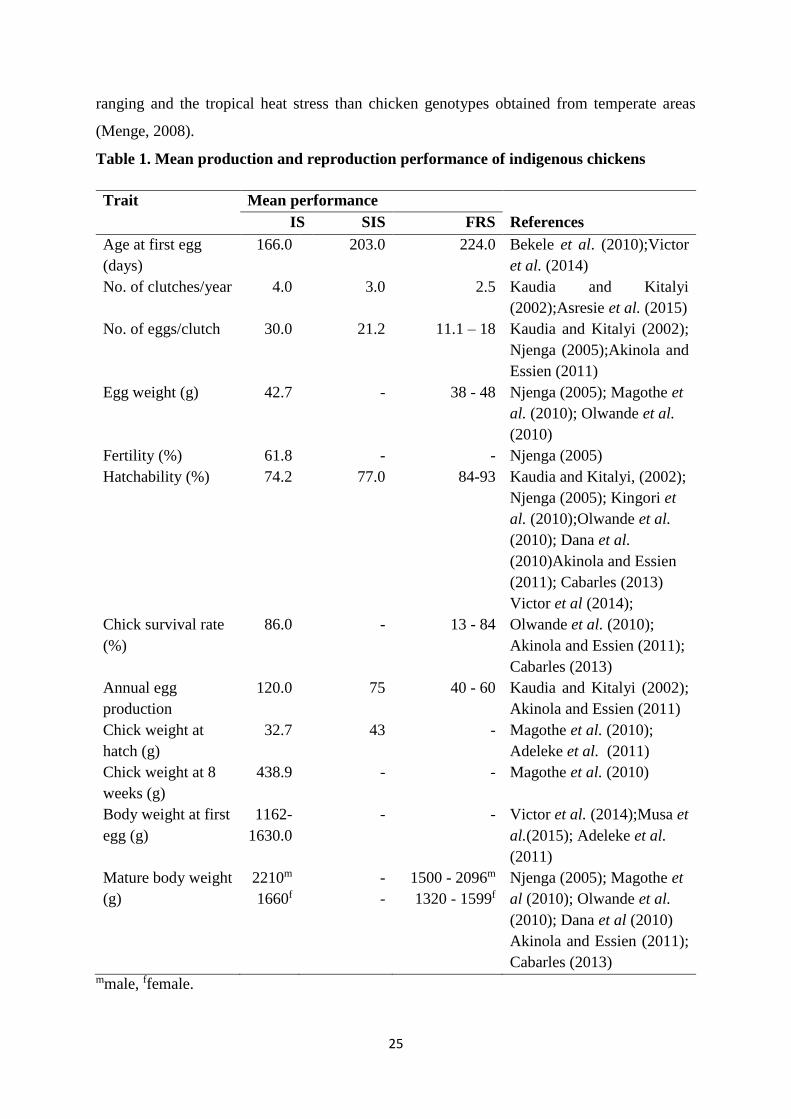
25
ranging and the tropical heat stress than chicken genotypes obtained from temperate areas
(Menge, 2008).
Table 1. Mean production and reproduction performance of indigenous chickens
Trait Mean performance
IS SIS FRS References
Age at first egg
(days)
166.0 203.0 224.0 Bekele et al. (2010);Victor
et al. (2014)
No. of clutches/year 4.0 3.0 2.5 Kaudia and Kitalyi
(2002);Asresie et al. (2015)
No. of eggs/clutch 30.0 21.2 11.1 – 18 Kaudia and Kitalyi (2002);
Njenga (2005);Akinola and
Essien (2011)
Egg weight (g) 42.7 - 38 - 48 Njenga (2005); Magothe et
al. (2010); Olwande et al.
(2010)
Fertility (%) 61.8 - - Njenga (2005)
Hatchability (%) 74.2 77.0 84-93 Kaudia and Kitalyi, (2002);
Njenga (2005); Kingori et
al. (2010);Olwande et al.
(2010); Dana et al.
(2010)Akinola and Essien
(2011); Cabarles (2013)
Victor et al (2014);
Chick survival rate
(%)
86.0 - 13 - 84 Olwande et al. (2010);
Akinola and Essien (2011);
Cabarles (2013)
Annual egg
production
120.0 75 40 - 60 Kaudia and Kitalyi (2002);
Akinola and Essien (2011)
Chick weight at
hatch (g)
32.7 43 - Magothe et al. (2010);
Adeleke et al. (2011)
Chick weight at 8
weeks (g)
438.9 - - Magothe et al. (2010)
Body weight at first
egg (g)
1162-
1630.0
- - Victor et al. (2014);Musa et
al.(2015); Adeleke et al.
(2011)
Mature body weight
(g)
2210m
1660f
-
-
1500 - 2096m
1320 - 1599f
Njenga (2005); Magothe et
al (2010); Olwande et al.
(2010); Dana et al (2010)
Akinola and Essien (2011);
Cabarles (2013) mmale, ffemale.
26
Hens lay about 45 eggs per year with a range between 40-75 eggs under FRS and SIS.
However, when supplemented with concentrates some lay up to 120 eggs under intensive
systems (Kitalyi et al., 2002; Akinola and Essien, 2011). The body weights of IC at first egg
are in the range of 1.1 to 1.6 kg under IS. Males grow faster and are heavier than females, with
an average mature body weight of 2.2 and 1.3 kg in all production systems respectively.
Crossbreeding the IC with exotic breeds has been shown to improve the growth traits,
such as live weights, feed conversion efficiency, daily gains and egg production traits. Studies
on the growth performance of Nigerian local chickens’ cross with exotic broiler breeder (Anak
Titan) showed that crosses involving Anak Titan sire x Naked neck dam had highest growth
performance. They revealed that genetic variations existed in crossbreeding the local chickens
with exotic breed on body weight, breast girth and keel length (Adeleke et al., 2011). In
Ethiopia, it was found that under farmers’ management conditions, the F1 crosses (Fayoumi-
crosses and RIR-crosses) had the highest egg production potential compared with that of IC
(Alewi et al., 2012). This could probably be due to heterosis effects. In addition to heterosis
effects, the higher mature body weight of crosses compared to IC would also have contributed
to the higher rates of live weight gain (Chimonyo and Dzama, 2007).
2.3. Development of breeding objectives
Definition of breeding objectives is the first step in genetic improvement as it defines
the direction of selection and genetic merits of performance traits (Bett et al., 2011; Okeno et
al., 2013). Development of breeding objectives involve the genetic evaluation, selection and
mating schemes with the aim of modifying animal performance. It involves definition of traits
that influence profitability and estimation of their economic values. Breeding objectives
should, therefore, reflect the production and economic environment under which the animals
are raised (Okeno et al., 2013). Development of breeding objectives requires a critical analysis
of costs and returns associated with the production system. There are four distinct phases in the
development of a breeding objective
i. Specification of the breeding, production and marketing system
ii. Identification of sources of income and expense
iii. Determination of biological traits influencing revenues and costs,
iv. Derivation of the economic value of each trait in the breeding objective.
27
2.3.1. Specification of the breeding, production and marketing systems
Characterisation of the breeding, production and mating system is a good starting point
for the definition of the breeding objective (Okeno et al., 2011). It helps to understand the
production and management practices of farmers and the associated challenges and
opportunities which are essential for holistic improvement (Okeno et al., 2011; Addisu et al.,
2014.). The breeding objective should reflect production and economic conditions in those
environments in which breeding animals have a genetic influence.
2.3.2. Identification of sources of income and expenses
In the description of the production and marketing system, inputs and outputs should
be quantified. Inputs are related to the cost, while incomes can be measured in terms of money
that are generated from the sale of the farm’s products (Åby et al., 2012; Gebre et al., 2012).
Inputs cost can be categorized into either variable or fixed. Variable cost depend on the level
of production (Mbuthia et al.,2015). Fixed cost are the costs incurred by the producer
independent of level of production of the flocks or herds (Bett et al., 2012; Okeno et al., 2013).
The description should be holistic and the following should be specified: the sources of income
(sales of surplus eggs, growers, culled hens and cocks; sale of unselected cockerels for
breeding) and expenses (cost of feeds according to each class of chicks; cost of labour, building
and equipment) are all necessary for fully description on production systems (Okeno et al.,
2012; Mbuthia et al., 2015).
2.3.3. Determination of biological traits influencing income and expenses
In principle, all traits influencing revenues and costs should be included in the breeding
objectives (Bett et al., 2011) even if one or more production traits cannot be measured directly.
The profit equation is expressed as a function of the principal biological traits contributing to
each source of income and expense. The traits that are considered important differ between
each farmers (Producers), marketers and consumers. Okeno et al. (2012) indicated that body
weight, production and reproductive performance and the survival rate are important traits
affecting sources of income and expenses in poultry production in Kenya. Development of a
breeding objective requires a critical analysis of costs and returns associated with the
production. A profit equation that identify and evaluate all costs and revenues have been used.
The economic contributions of changes in biological performance were used to establish the
effect of genetic change on profit (Okeno et al., 2012b; Mbuthia et al., 2014). Those studies
28
found that the distribution of fixed and variable costs across the enterprises changed when
considering the value of genetic change in both market and breeding animals because of
partitioning cost among different element of performance. Emphasis should be put on farm
profit (Okeno et al., 2012).
2.3.4. Derivation of economic values of traits
The economic value of the heritable traits is calculated from the change in predicted
profit, based on a single unit change in that breeding objective trait, holding all others traits
constant (Rewe et al., 2011; Mbuthia et al., 2015). The two ways of economic values derivation
are applied using either positive approach which analyses field data or normative approach
(data simulation also referred to as bio-economic modelling). In both approaches, derivation of
profit necessitates a profit maximization function that must include all economic traits goals.
The advantages of using the profit maximization function approach is the relative ease with the
economic weights can be recalculated for different market preferences, production systems and
sub-population or flock average. The profit maximization is the goal in any production system.
However, Kahi and Niger (2004) advised that in smallholder dairy or poultry production
systems in the tropics, minimisation of costs is important due to the limited amount of inputs.
Determination of economic value for genetic improvement of different traits goals requires
description of the production systems because the difference between revenue and cost can be
used to determine the economic value of traits (profit function).
The biological value of a trait is the change in biological efficiency due to a unit change
in genetic merit of a trait of interest, all other traits being constant. Traits in the breeding
objectives are not expressed at the same time or at the same frequency. In order to account for
these two methods are used: the first method consists of calculation of all income and costs
(expenses) in one year for a given flock or herd while the second method use the discounted
gene flow approach. In this procedure, the number of discounted expressions of a trait is
expressed as a function of the number of progeny or later descendants of an animal plus an
annual discount factor (Åby et al., 2012).
2.4. Genetic and phenotypic parameters in chicken breeding
Estimates of genetic and phenotypic (co)variances are essential for prediction of
breeding values and expected response to selection and monitoring genetic progress.
Knowledge of genetic parameters is the basis of sound livestock improvement programs.
29
Estimate of heritability and genetic correlations are essential population parameters required in
animal breeding research and in design and application of practical animal breeding programs.
Genetic parameters are a characteristic of the population in which they were estimated and may
change overtime due to selection and management decisions (Missanjo et al., 2013).
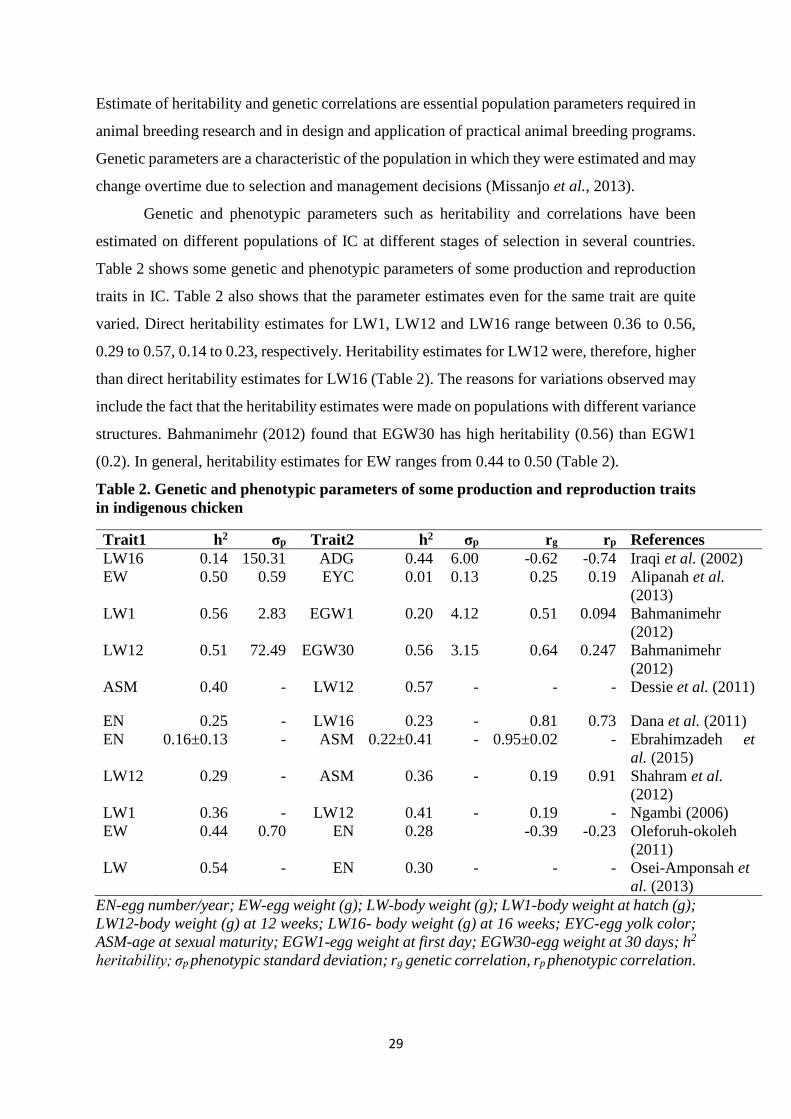
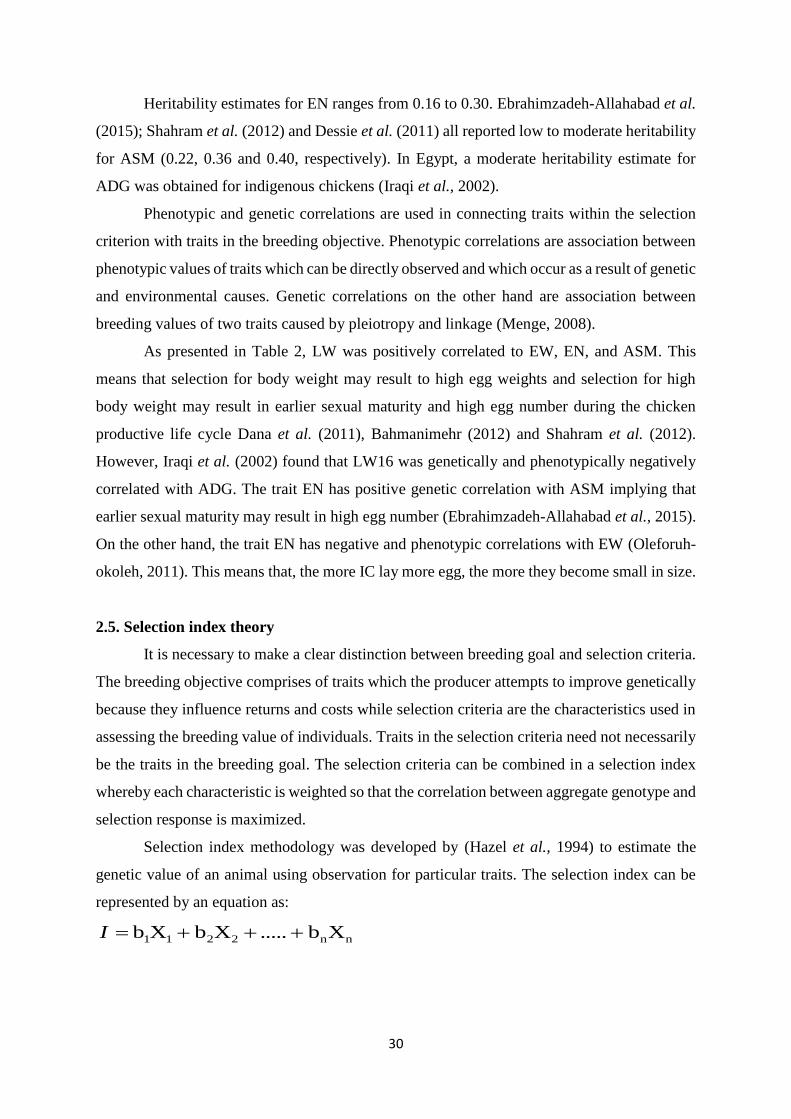
Genetic and phenotypic parameters such as heritability and correlations have been
estimated on different populations of IC at different stages of selection in several countries.
Table 2 shows some genetic and phenotypic parameters of some production and reproduction
traits in IC. Table 2 also shows that the parameter estimates even for the same trait are quite
varied. Direct heritability estimates for LW1, LW12 and LW16 range between 0.36 to 0.56,
0.29 to 0.57, 0.14 to 0.23, respectively. Heritability estimates for LW12 were, therefore, higher
than direct heritability estimates for LW16 (Table 2). The reasons for variations observed may
include the fact that the heritability estimates were made on populations with different variance
structures. Bahmanimehr (2012) found that EGW30 has high heritability (0.56) than EGW1
(0.2). In general, heritability estimates for EW ranges from 0.44 to 0.50 (Table 2).
Table 2. Genetic and phenotypic parameters of some production and reproduction traits
in indigenous chicken
Trait1 h2 σp Trait2 h2 σp rg rp References
LW16 0.14 150.31 ADG 0.44 6.00 -0.62 -0.74 Iraqi et al. (2002)
EW 0.50 0.59 EYC 0.01 0.13 0.25 0.19 Alipanah et al.
(2013)
LW1 0.56 2.83 EGW1 0.20 4.12 0.51 0.094 Bahmanimehr
(2012)
LW12 0.51 72.49 EGW30 0.56 3.15 0.64 0.247 Bahmanimehr
(2012)
ASM 0.40 - LW12 0.57 - - - Dessie et al. (2011)
EN 0.25 - LW16 0.23 - 0.81 0.73 Dana et al. (2011)
EN 0.16±0.13 - ASM 0.22±0.41 - 0.95±0.02 - Ebrahimzadeh et
al. (2015)
LW12 0.29 - ASM 0.36 - 0.19 0.91 Shahram et al.
(2012)
LW1 0.36 - LW12 0.41 - 0.19 - Ngambi (2006)
EW 0.44 0.70 EN 0.28 -0.39 -0.23 Oleforuh-okoleh
(2011)
LW 0.54 - EN 0.30 - - - Osei-Amponsah et
al. (2013)
EN-egg number/year; EW-egg weight (g); LW-body weight (g); LW1-body weight at hatch (g);
LW12-body weight (g) at 12 weeks; LW16- body weight (g) at 16 weeks; EYC-egg yolk color;
ASM-age at sexual maturity; EGW1-egg weight at first day; EGW30-egg weight at 30 days; h2
heritability; σp phenotypic standard deviation; rg genetic correlation, rp phenotypic correlation.
30
Heritability estimates for EN ranges from 0.16 to 0.30. Ebrahimzadeh-Allahabad et al.
(2015); Shahram et al. (2012) and Dessie et al. (2011) all reported low to moderate heritability
for ASM (0.22, 0.36 and 0.40, respectively). In Egypt, a moderate heritability estimate for
ADG was obtained for indigenous chickens (Iraqi et al., 2002).
Phenotypic and genetic correlations are used in connecting traits within the selection
criterion with traits in the breeding objective. Phenotypic correlations are association between
phenotypic values of traits which can be directly observed and which occur as a result of genetic
and environmental causes. Genetic correlations on the other hand are association between
breeding values of two traits caused by pleiotropy and linkage (Menge, 2008).
As presented in Table 2, LW was positively correlated to EW, EN, and ASM. This
means that selection for body weight may result to high egg weights and selection for high
body weight may result in earlier sexual maturity and high egg number during the chicken
productive life cycle Dana et al. (2011), Bahmanimehr (2012) and Shahram et al. (2012).
However, Iraqi et al. (2002) found that LW16 was genetically and phenotypically negatively
correlated with ADG. The trait EN has positive genetic correlation with ASM implying that
earlier sexual maturity may result in high egg number (Ebrahimzadeh-Allahabad et al., 2015).
On the other hand, the trait EN has negative and phenotypic correlations with EW (Oleforuh-
okoleh, 2011). This means that, the more IC lay more egg, the more they become small in size.
2.5. Selection index theory
It is necessary to make a clear distinction between breeding goal and selection criteria.
The breeding objective comprises of traits which the producer attempts to improve genetically
because they influence returns and costs while selection criteria are the characteristics used in
assessing the breeding value of individuals. Traits in the selection criteria need not necessarily
be the traits in the breeding goal. The selection criteria can be combined in a selection index
whereby each characteristic is weighted so that the correlation between aggregate genotype and
selection response is maximized.
Selection index methodology was developed by (Hazel et al., 1994) to estimate the
genetic value of an animal using observation for particular traits. The selection index can be
represented by an equation as:
nn2211 Xb.....XbXb I

31
where I is the index value for the information source, b1, b2 …bn are the weighting factors for
the source of information X1, X2 … Xn on an individual animal or its relatives. The selection
index coefficients are derived from the formula
where b is a vector containing the coefficients of the index traits, P is phenotypic variance-
covariance matrix of the characters in the selection index, G is the genetic variance-covariance
matrix between the characters in the index and traits in the breeding goal and a is a vector of
economic values of the traits in the breeding goal to be estimated. Assuming a selection
intensity of 1.0, the genetic gain (g) achieved after one round of selection is calculated as:
where σI is the standard deviation of the selection index and
where b, P and G are as defined above.
GaP b -1
IG/b g
Pbb I
32
CHAPTER THREE
CHARACTERISATION OF INDIGENOUS CHICKEN PRODUCTION SYSTEMS IN
RWANDA
3.1 Introduction
Livestock sector in Rwanda is supported by different species, but poultry is the most
predominant in terms of numbers with an estimated population of 4.8 million heads
(FAOSTAT, 2014). The most common poultry species are indigenous chickens (IC) that are
raised by over 80% of farmers especially for egg production making poultry production a
promising animal enterprise for achieving rural development (NISR, 2011). They play
significant roles to women, widows and orphaned children in terms of food security and
nutrition, cash income and savings.
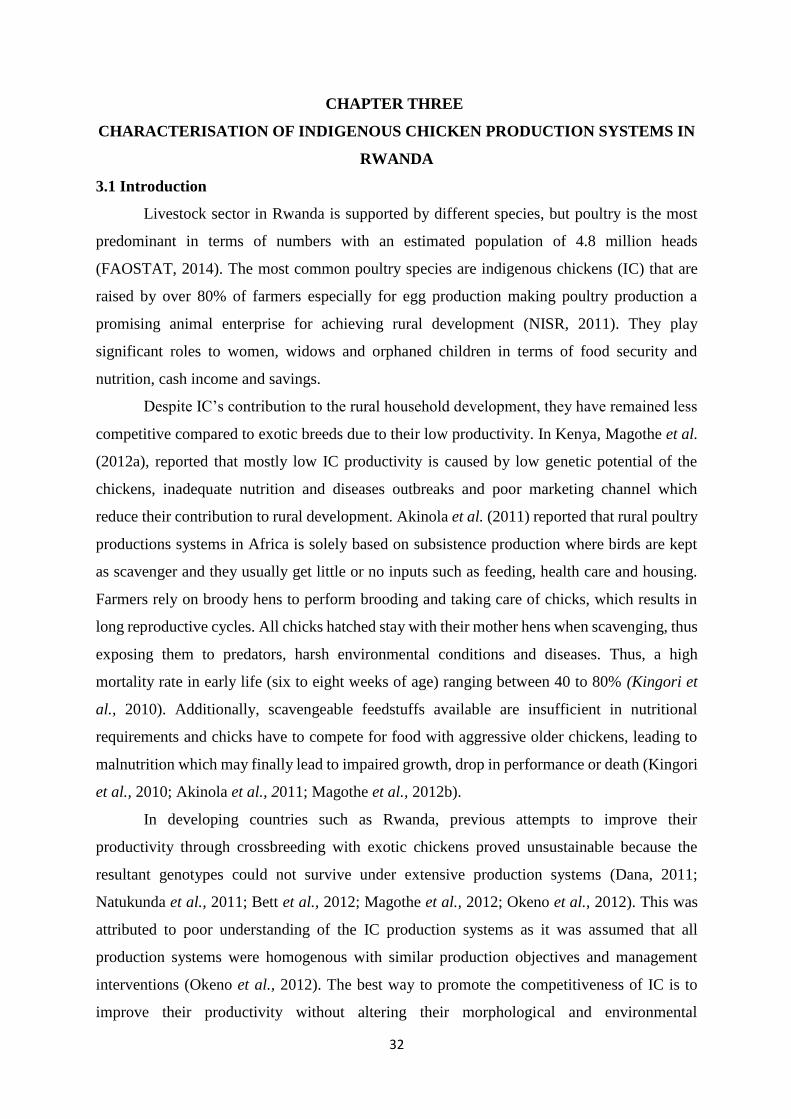
Despite IC’s contribution to the rural household development, they have remained less
competitive compared to exotic breeds due to their low productivity. In Kenya, Magothe et al.
(2012a), reported that mostly low IC productivity is caused by low genetic potential of the
chickens, inadequate nutrition and diseases outbreaks and poor marketing channel which
reduce their contribution to rural development. Akinola et al. (2011) reported that rural poultry
productions systems in Africa is solely based on subsistence production where birds are kept
as scavenger and they usually get little or no inputs such as feeding, health care and housing.
Farmers rely on broody hens to perform brooding and taking care of chicks, which results in
long reproductive cycles. All chicks hatched stay with their mother hens when scavenging, thus
exposing them to predators, harsh environmental conditions and diseases. Thus, a high
mortality rate in early life (six to eight weeks of age) ranging between 40 to 80% (Kingori et
al., 2010). Additionally, scavengeable feedstuffs available are insufficient in nutritional
requirements and chicks have to compete for food with aggressive older chickens, leading to
malnutrition which may finally lead to impaired growth, drop in performance or death (Kingori
et al., 2010; Akinola et al., 2011; Magothe et al., 2012b).
In developing countries such as Rwanda, previous attempts to improve their
productivity through crossbreeding with exotic chickens proved unsustainable because the
resultant genotypes could not survive under extensive production systems (Dana, 2011;
Natukunda et al., 2011; Bett et al., 2012; Magothe et al., 2012; Okeno et al., 2012). This was
attributed to poor understanding of the IC production systems as it was assumed that all
production systems were homogenous with similar production objectives and management
interventions (Okeno et al., 2012). The best way to promote the competitiveness of IC is to
improve their productivity without altering their morphological and environmental
33
characteristics. This requires characterisation of their production systems and identification of
the existing IC ecotypes and their features to producers as the first step. Therefore, this study
was initiated with the aim of characterising the IC production systems, management, feeding
and constraints faced by IC farmers in Rwanda.
3.2 Materials and methods
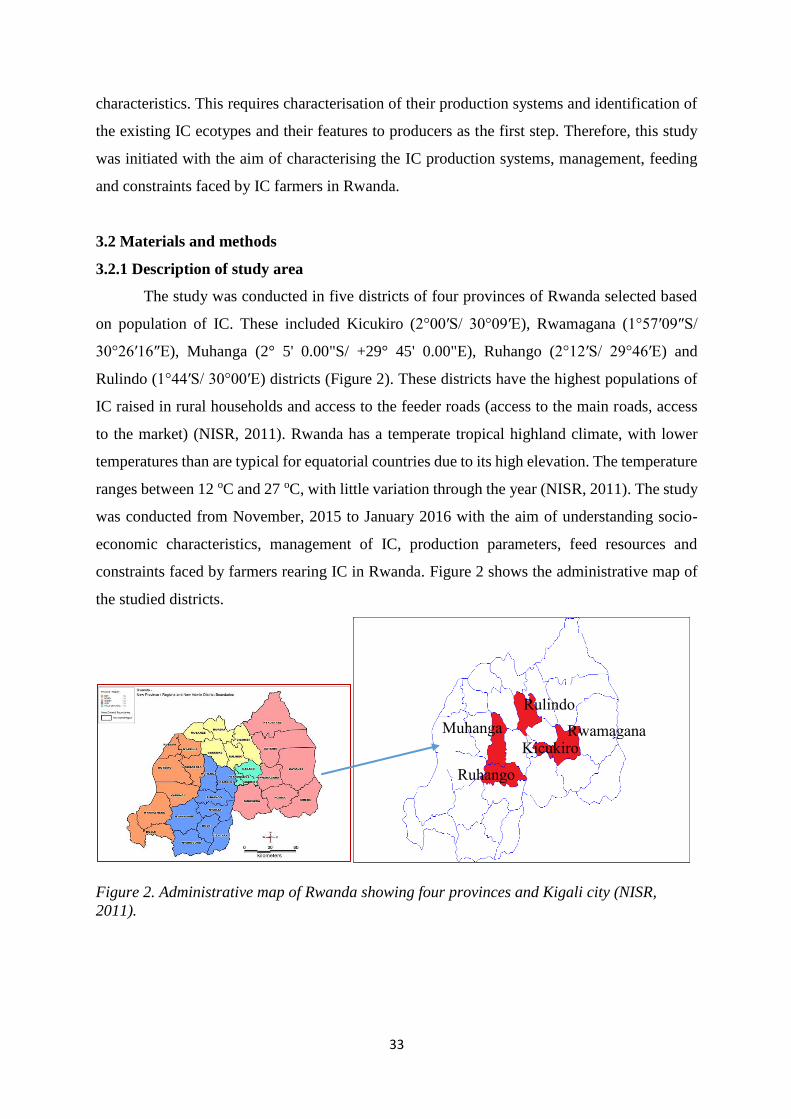
3.2.1 Description of study area
The study was conducted in five districts of four provinces of Rwanda selected based
on population of IC. These included Kicukiro (2°00′S/ 30°09′E), Rwamagana (1°57′09″S/
30°26′16″E), Muhanga (2° 5' 0.00"S/ +29° 45' 0.00"E), Ruhango (2°12′S/ 29°46′E) and
Rulindo (1°44′S/ 30°00′E) districts (Figure 2). These districts have the highest populations of
IC raised in rural households and access to the feeder roads (access to the main roads, access
to the market) (NISR, 2011). Rwanda has a temperate tropical highland climate, with lower
temperatures than are typical for equatorial countries due to its high elevation. The temperature
ranges between 12 oC and 27 oC, with little variation through the year (NISR, 2011). The study
was conducted from November, 2015 to January 2016 with the aim of understanding socio-
economic characteristics, management of IC, production parameters, feed resources and
constraints faced by farmers rearing IC in Rwanda. Figure 2 shows the administrative map of
the studied districts.
Figure 2. Administrative map of Rwanda showing four provinces and Kigali city (NISR,
2011).
Muhanga
Ruhango
Rulindo
Rwamagana Kicukiro
34
3.2.2 Sampling framework and data collection procedures
In this study, qualitative and quantitative research approaches were employed.
Qualitative data were obtained through observations made by enumerators and researcher and
group discussions held with farmers, whereas quantitative data were obtained by interviews. A
pretested structured questionnaire was used to gather information. During pretesting, local
enumerators were employed in each district and trained by the researcher. Local enumerators
were hired for ease of acceptability and communication within the communities. During visits,
farmers were explained the objectives and benefits of the survey. The required total respondents
were determined using the formula by Cochran (1963) for infinite population (infinite
population ≥ 50,000).
where No = required sample size.
Z2 = is the abscissa of the normal curve that cuts off an area at the tails (1-α) (95%= 1.96)
e= is the margin of error (e.g. ± 0.05% margin of error for confidence level of 95%)
p= is the degree of variability in the attributes being measured refers to the q=1-p. (p)(q) are
the estimate of variance.
= [(1.96)^2 𝑥(0.16)(0.84)] ∕ (0.05)^2 = [3.8416𝑥0.1344] ∕
(0.0025 = 206 households
The households in villages with at least five IC and above were recorded. Simple random
sampling procedure was used to select households for interviews by randomly picking 40
names of the households in each district. A total of 206 respondents were interviewed.
3.2.3 Data collection and analysis
Data were collected through direct observations and interviews with the farmers.
Information on households and the IC management characteristics were collected. The farmers’
characteristics including age, level of education, occupation, household size, household status,
farm size, land ownership, livestock species, number and reason of keeping them. The IC
management characteristics were, production systems, housing, nutrition, extension services
and challenges to IC production.
Data were analyzed using SPSS (version 22, 2013) and the general linear model
procedure of SAS (version 9.00, 2002). PROC FREQ and PROC MEANS were used to carry
out the frequency analysis and descriptive statistics, respectively.
22 / epqZNo
22 / epqZNo

35
3.3 Results and discussion
3.3.1 Household characteristics
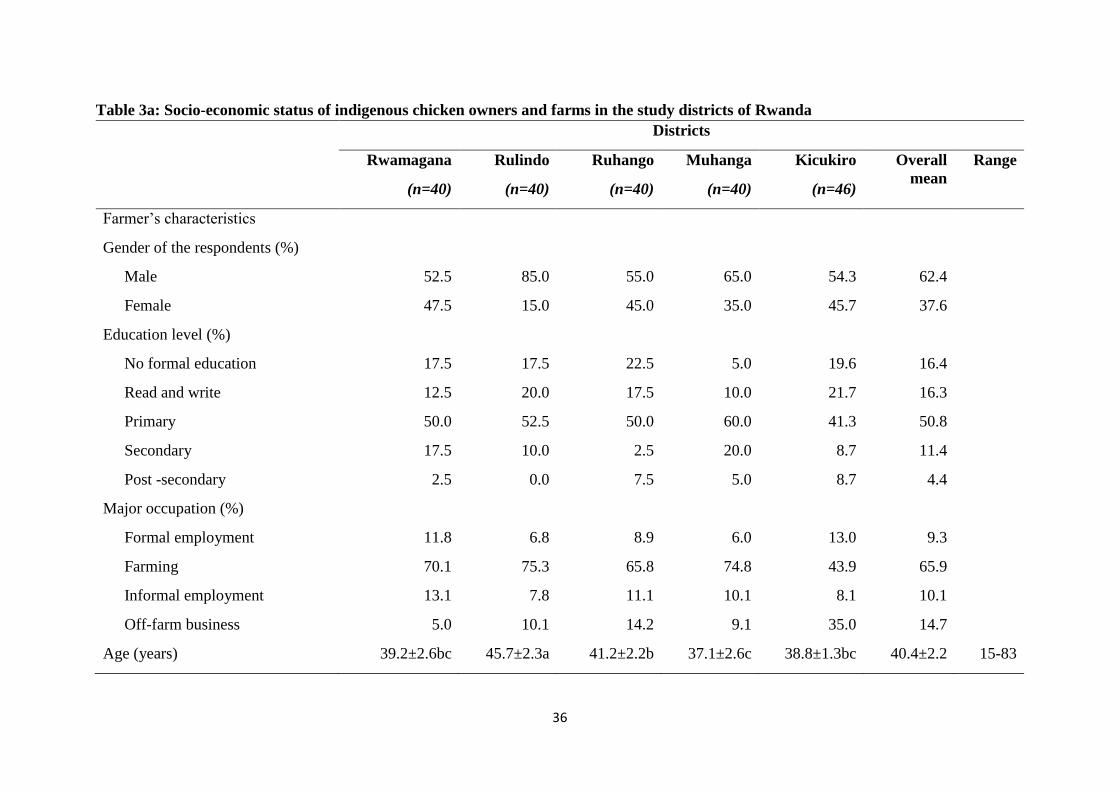
The household characteristics of IC owner and farms are presented in Table 3a and b.
From the total of 206 interviewed, 128 (62.4%) were male and 78 (37.6%) were females. The
average age of the respondents was 40.4 years with the age ranging from 15-83 years. However,
there was a significant difference between the age of respondents among the districts (P<0.05)
studied. Majority of the respondents (83.6%) had formal education with 16.3% having basic
education (reading and writing), 50.76% primary education and 16.48% had secondary and
post-secondary education whereas only 16.4% were illiterate. All family members were
involved in the chicken husbandry practices. However, women (78%) were highly responsible
for IC management activities such as cleaning of chicken’s house, feeding, collecting and
selling eggs. Children (18.6%) also participated in several husbandry activities like provision
of supplementary feed and water and cleaning of bird’s house.
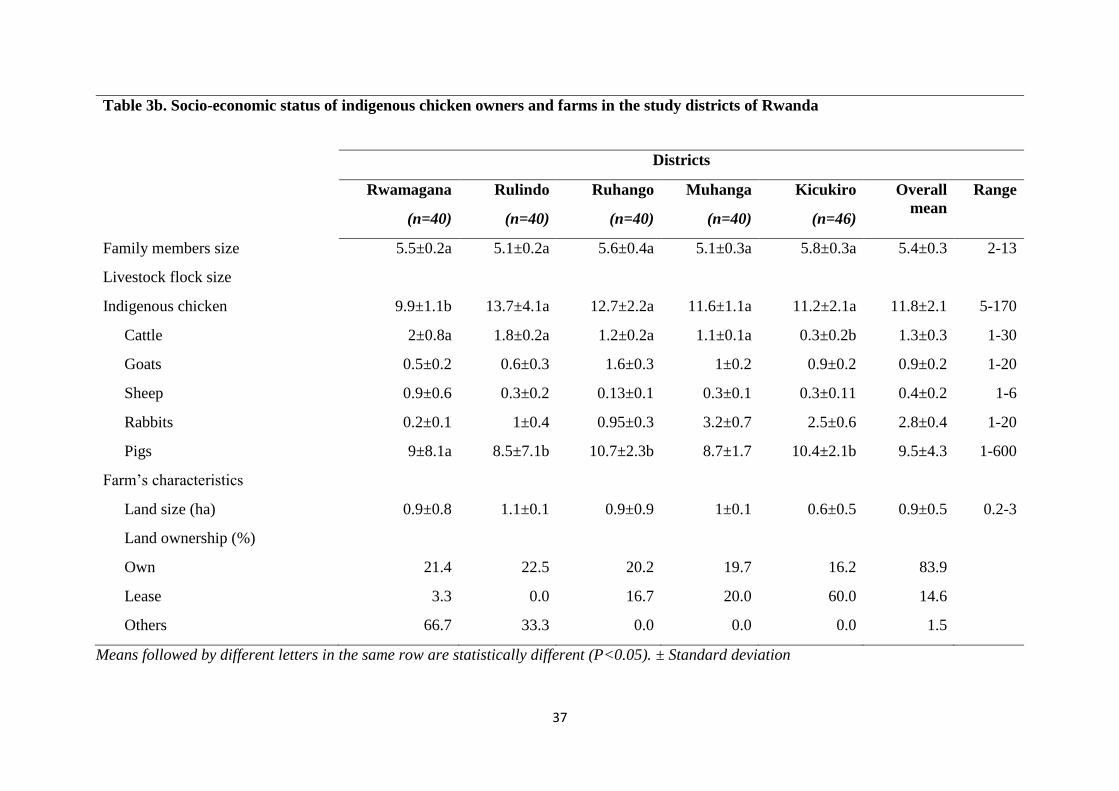
The family size averaged 5 persons (ranged 2-13) per household and the main source
of their livelihood was farming (66%), off-farm business (14.7%), informal (10%) and formal
employment (9.3%). There seems to be a decline in percentage of household depending on off
farming compared to 2014 when 80% was reported to depend on agriculture (EACS, 2014).
This may be due to the continued land subdivisions caused by the increasing human population,
conversion of land to other uses such as construction of new apartments (estates, villages) and
creation of new employment other than agriculture.
3.3.2 Land holding and livestock flock size
Land was privately owned by farmers (84%) with mean holding of 0.87 ha per
household, but there was no significant difference (P>0.05) in the land holding between the
districts Table 3b. The findings agree to those reported by NISR, (2011) that on a national level,
84% of cultivating households hold less than 0.9ha of land. As presented in Table 3b, pigs and
IC were ranked as sources of income in the households among other livestock species with an
average of 9.5 and 11. 8 respectively. There was a significant difference among livestock
species between districts (P<0.05). Cattle, goats, sheep and rabbits played a role as source of
livestock income to a lesser extent than pig and poultry. This might be due to the short
generation interval and low inputs required in pigs and poultry farming and increasing demand
for white meat and IC products in the rural and urban area.
36
Table 3a: Socio-economic status of indigenous chicken owners and farms in the study districts of Rwanda
Districts
Rwamagana
(n=40)
Rulindo
(n=40)
Ruhango
(n=40)
Muhanga
(n=40)
Kicukiro
(n=46)
Overall
mean
Range
Farmer’s characteristics
Gender of the respondents (%)
Male 52.5 85.0 55.0 65.0 54.3 62.4
Female 47.5 15.0 45.0 35.0 45.7 37.6
Education level (%)
No formal education 17.5 17.5 22.5 5.0 19.6 16.4
Read and write 12.5 20.0 17.5 10.0 21.7 16.3
Primary 50.0 52.5 50.0 60.0 41.3 50.8
Secondary 17.5 10.0 2.5 20.0 8.7 11.4
Post -secondary 2.5 0.0 7.5 5.0 8.7 4.4
Major occupation (%)
Formal employment 11.8 6.8 8.9 6.0 13.0 9.3
Farming 70.1 75.3 65.8 74.8 43.9 65.9
Informal employment 13.1 7.8 11.1 10.1 8.1 10.1
Off-farm business 5.0 10.1 14.2 9.1 35.0 14.7
Age (years) 39.2±2.6bc 45.7±2.3a 41.2±2.2b 37.1±2.6c 38.8±1.3bc 40.4±2.2 15-83
37
Table 3b. Socio-economic status of indigenous chicken owners and farms in the study districts of Rwanda
Districts
Rwamagana
(n=40)
Rulindo
(n=40)
Ruhango
(n=40)
Muhanga
(n=40)
Kicukiro
(n=46)
Overall
mean
Range
Family members size 5.5±0.2a 5.1±0.2a 5.6±0.4a 5.1±0.3a 5.8±0.3a 5.4±0.3 2-13
Livestock flock size
Indigenous chicken 9.9±1.1b 13.7±4.1a 12.7±2.2a 11.6±1.1a 11.2±2.1a 11.8±2.1 5-170
Cattle 2±0.8a 1.8±0.2a 1.2±0.2a 1.1±0.1a 0.3±0.2b 1.3±0.3 1-30
Goats 0.5±0.2 0.6±0.3 1.6±0.3 1±0.2 0.9±0.2 0.9±0.2 1-20
Sheep 0.9±0.6 0.3±0.2 0.13±0.1 0.3±0.1 0.3±0.11 0.4±0.2 1-6
Rabbits 0.2±0.1 1±0.4 0.95±0.3 3.2±0.7 2.5±0.6 2.8±0.4 1-20
Pigs 9±8.1a 8.5±7.1b 10.7±2.3b 8.7±1.7 10.4±2.1b 9.5±4.3 1-600
Farm’s characteristics
Land size (ha) 0.9±0.8 1.1±0.1 0.9±0.9 1±0.1 0.6±0.5 0.9±0.5 0.2-3
Land ownership (%)
Own 21.4 22.5 20.2 19.7 16.2 83.9
Lease 3.3 0.0 16.7 20.0 60.0 14.6
Others 66.7 33.3 0.0 0.0 0.0 1.5
Means followed by different letters in the same row are statistically different (P<0.05). ± Standard deviation
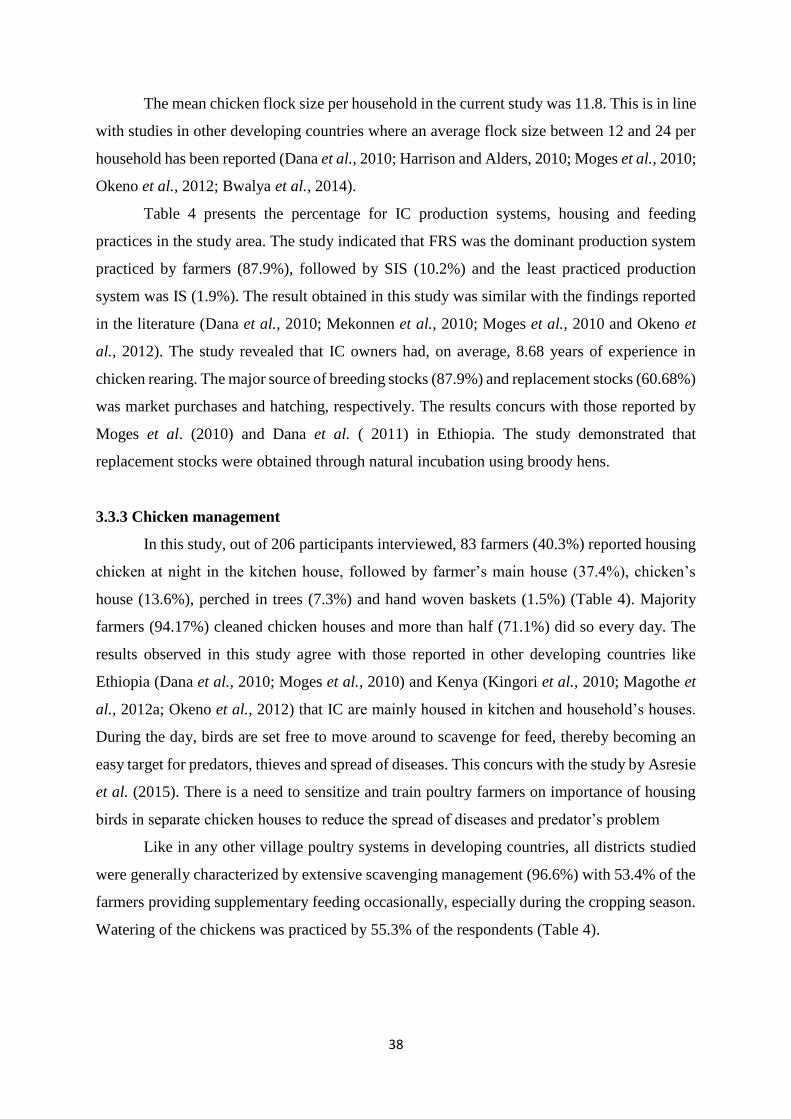
38
The mean chicken flock size per household in the current study was 11.8. This is in line
with studies in other developing countries where an average flock size between 12 and 24 per
household has been reported (Dana et al., 2010; Harrison and Alders, 2010; Moges et al., 2010;
Okeno et al., 2012; Bwalya et al., 2014).
Table 4 presents the percentage for IC production systems, housing and feeding
practices in the study area. The study indicated that FRS was the dominant production system
practiced by farmers (87.9%), followed by SIS (10.2%) and the least practiced production
system was IS (1.9%). The result obtained in this study was similar with the findings reported
in the literature (Dana et al., 2010; Mekonnen et al., 2010; Moges et al., 2010 and Okeno et
al., 2012). The study revealed that IC owners had, on average, 8.68 years of experience in
chicken rearing. The major source of breeding stocks (87.9%) and replacement stocks (60.68%)
was market purchases and hatching, respectively. The results concurs with those reported by
Moges et al. (2010) and Dana et al. ( 2011) in Ethiopia. The study demonstrated that
replacement stocks were obtained through natural incubation using broody hens.
3.3.3 Chicken management
In this study, out of 206 participants interviewed, 83 farmers (40.3%) reported housing
chicken at night in the kitchen house, followed by farmer’s main house (37.4%), chicken’s
house (13.6%), perched in trees (7.3%) and hand woven baskets (1.5%) (Table 4). Majority
farmers (94.17%) cleaned chicken houses and more than half (71.1%) did so every day. The
results observed in this study agree with those reported in other developing countries like
Ethiopia (Dana et al., 2010; Moges et al., 2010) and Kenya (Kingori et al., 2010; Magothe et
al., 2012a; Okeno et al., 2012) that IC are mainly housed in kitchen and household’s houses.
During the day, birds are set free to move around to scavenge for feed, thereby becoming an
easy target for predators, thieves and spread of diseases. This concurs with the study by Asresie
et al. (2015). There is a need to sensitize and train poultry farmers on importance of housing
birds in separate chicken houses to reduce the spread of diseases and predator’s problem
Like in any other village poultry systems in developing countries, all districts studied
were generally characterized by extensive scavenging management (96.6%) with 53.4% of the
farmers providing supplementary feeding occasionally, especially during the cropping season.
Watering of the chickens was practiced by 55.3% of the respondents (Table 4).
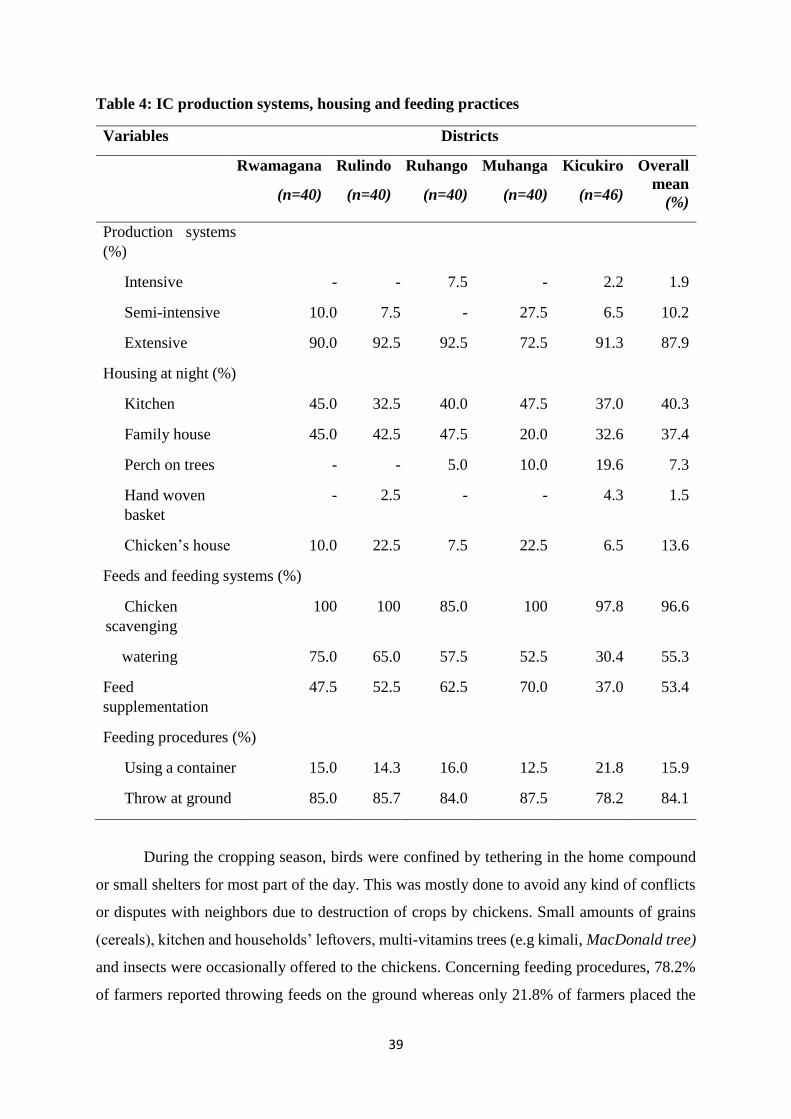
39
Table 4: IC production systems, housing and feeding practices
Variables Districts
Rwamagana
(n=40)
Rulindo
(n=40)
Ruhango
(n=40)
Muhanga
(n=40)
Kicukiro
(n=46)
Overall
mean
(%)
Production systems
(%)
Intensive - - 7.5 - 2.2 1.9
Semi-intensive 10.0 7.5 - 27.5 6.5 10.2
Extensive 90.0 92.5 92.5 72.5 91.3 87.9
Housing at night (%)
Kitchen 45.0 32.5 40.0 47.5 37.0 40.3
Family house 45.0 42.5 47.5 20.0 32.6 37.4
Perch on trees - - 5.0 10.0 19.6 7.3
Hand woven
basket
- 2.5 - - 4.3 1.5
Chicken’s house 10.0 22.5 7.5 22.5 6.5 13.6
Feeds and feeding systems (%)
Chicken
scavenging
100 100 85.0 100 97.8 96.6
watering 75.0 65.0 57.5 52.5 30.4 55.3
Feed
supplementation
47.5 52.5 62.5 70.0 37.0 53.4
Feeding procedures (%)
Using a container 15.0 14.3 16.0 12.5 21.8 15.9
Throw at ground 85.0 85.7 84.0 87.5 78.2 84.1
During the cropping season, birds were confined by tethering in the home compound
or small shelters for most part of the day. This was mostly done to avoid any kind of conflicts
or disputes with neighbors due to destruction of crops by chickens. Small amounts of grains
(cereals), kitchen and households’ leftovers, multi-vitamins trees (e.g kimali, MacDonald tree)
and insects were occasionally offered to the chickens. Concerning feeding procedures, 78.2%
of farmers reported throwing feeds on the ground whereas only 21.8% of farmers placed the
40
feeds in container. As a result, feed was rarely adjusted to the needs of the birds. Therefore,
chicks and adult birds had to compete for feed implying that the young and less aggressive
birds rarely got sufficient feed. The feeding management in this study is similar to those
reported elsewhere (Kingori et al., 2010; Mekonnen et al., 2010; Akinola and Essien, 2011;
Magothe et al., 2012; Okeno et al., 2012; Asresie, 2015).
The reasons reported for not supplementing chicken in the current study were high feed
cost (45.5%) followed by lack of cash and feed availability (33.6%) and lack of awareness
(19.8%) about chicken’s supplementation. As Rwanda is a small country where nearly all
population has less than 1 ha acreage of land and increasing population pressure, there is a risk
of food competition between humans and livestock. Therefore, it is important to look for
alternative feed resources for chickens. Feeding termites to chicken provides a mechanism for
converting unusable cellulose into food for human consumption with benefits to the ecosystem
(Okeno et al., 2012). Studies to analyze and record the proximate compositions of commonly
used local nonconventional feeding materials such as multi-vitamins trees (e.g kimali,
MacDonald tree), insects (e.g termites) and cereal crops are required.
3.3.4 Production purpose, health management and constraints faced by IC in the study
area
Table 5a and 5b presents the ranks in percentage of purpose of raising chicken, health
management and constraints faced by indigenous chicken. The main reasons of keeping IC
were egg production (47.1%) and income generation (37.9%). Other uses such meat production
and production of breeding stock were ranked lower at 9.2% and 5.8%, respectively. Similarly,
Moges et al. (2010) and Okeno et al. (2012) reported that aims of rearing indigenous chickens
were source of food, cash income, production of breeding stock, cultural and religious
ceremonies in both Kenya and Ethiopia.
All respondents reported natural incubation method using broody hens during egg
incubation period. Nearly all respondents (98.1%) provided nesting/bedding material during
incubation period with herbs and old clothes being the most used. Regarding mating system,
all respondents indicated that birds mated freely (uncontrolled) while scavenging. This
indicates a high risk of increasing rate of inbreeding as the flock size is small. The farmers
should control birds mating by exchanging breeding cocks with households of different
villages. Extension services were scarce as only 17.5% of respondents reported to have
received extension services from livestock officers. Records keeping is very important in farm

41
monitoring, evaluation and decision making. In this study, only 9.7% of respondents reported
to keep records either for egg laid per week or number of chicks hatched.
Health management
Majority of respondents (70.4%) experienced chicken disease outbreaks (Table 5a).
The majority of farmers (51.9%) recognized that green watery feces, difficulty breathing,
drooping wings, twisted neck and many deaths are signs of a disease locally called Umusinziro
(Newcastle disease) as the most important disease causing high mortality of young and adult
birds. Salmonellosis (15%) and coccidiosis (8.3%) were also found to be among the diseases
highlighted in this study whereas listlessness, coughing and sneezing signs were reported by
7.3% of the farmers. The findings concurs with other studies conducted in other developing
countries (Harrison and Alders, 2010; Moges et al., 2010; Okeno et al., 2012) where New
castle disease was reported to be the major cause of chickens’ death.
The result showed that 40.7% of respondents were locally treating the birds against
diseases. Majority of interviewed farmers (93.1%) reported treating birds with green pepper,
cutting the wing’s vein, burning the bird’s head feathers and only 6.9% of respondent were
calling a veterinarian to treat their chickens (Table 5a). This calls for research studies to
determine the veterinary properties and efficacy of these locally used medications. Nearly all
IC owners (98.1%) had not vaccinated their birds against any disease. About 21.8% of
respondents carried out ecto and endo-parasites control when need arose. The result of this
study concurs with the studies by Moges et al. (2010) and Dana et al. ( 2010) who reported that
immunization services are almost nonexistent for village chickens in Ethiopia.
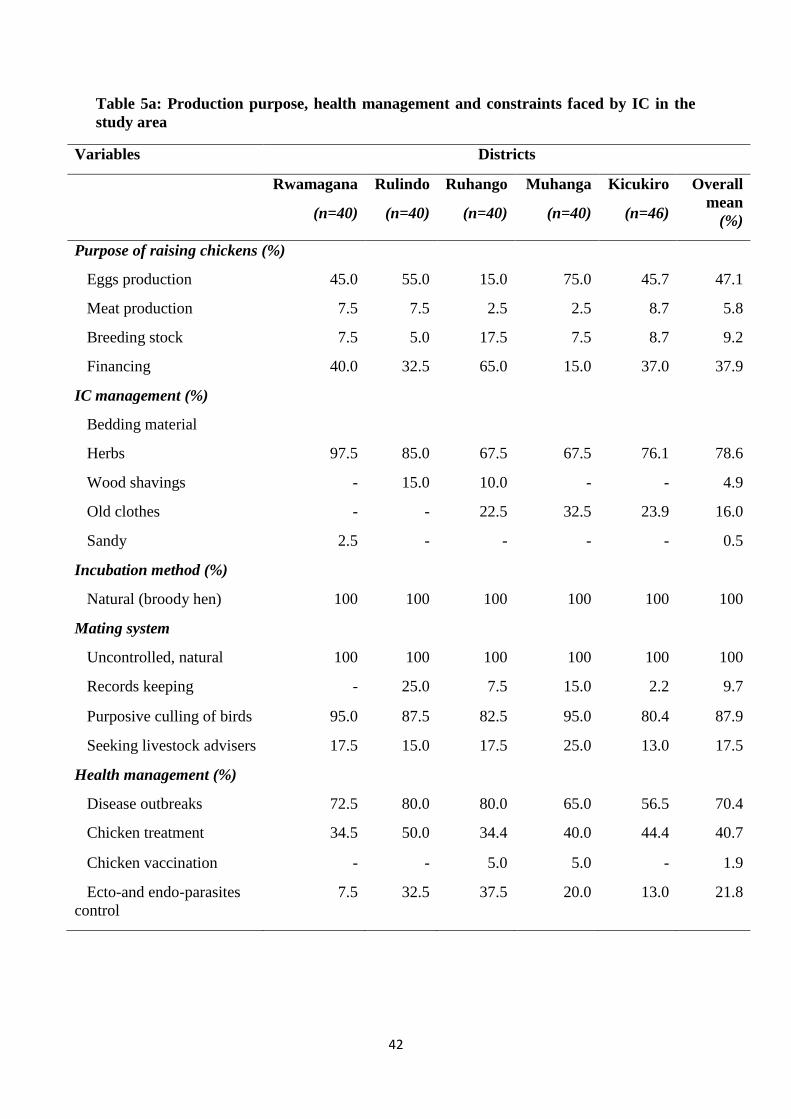
42
Table 5a: Production purpose, health management and constraints faced by IC in the
study area
Variables Districts
Rwamagana
(n=40)
Rulindo
(n=40)
Ruhango
(n=40)
Muhanga
(n=40)
Kicukiro
(n=46)
Overall
mean
(%)
Purpose of raising chickens (%)
Eggs production 45.0 55.0 15.0 75.0 45.7 47.1
Meat production 7.5 7.5 2.5 2.5 8.7 5.8
Breeding stock 7.5 5.0 17.5 7.5 8.7 9.2
Financing 40.0 32.5 65.0 15.0 37.0 37.9
IC management (%)
Bedding material
Herbs 97.5 85.0 67.5 67.5 76.1 78.6
Wood shavings - 15.0 10.0 - - 4.9
Old clothes - - 22.5 32.5 23.9 16.0
Sandy 2.5 - - - - 0.5
Incubation method (%)
Natural (broody hen) 100 100 100 100 100 100
Mating system
Uncontrolled, natural 100 100 100 100 100 100
Records keeping - 25.0 7.5 15.0 2.2 9.7
Purposive culling of birds 95.0 87.5 82.5 95.0 80.4 87.9
Seeking livestock advisers 17.5 15.0 17.5 25.0 13.0 17.5
Health management (%)
Disease outbreaks 72.5 80.0 80.0 65.0 56.5 70.4
Chicken treatment 34.5 50.0 34.4 40.0 44.4 40.7
Chicken vaccination - - 5.0 5.0 - 1.9
Ecto-and endo-parasites
control
7.5 32.5 37.5 20.0 13.0 21.8
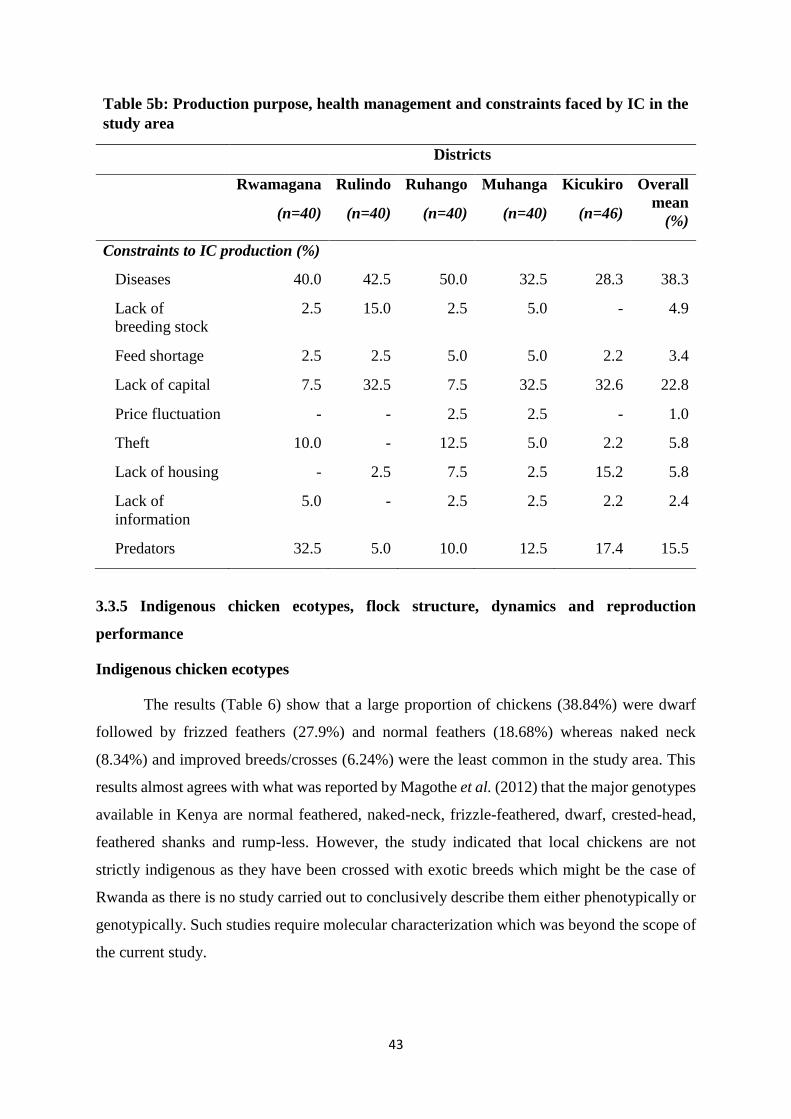
43
Table 5b: Production purpose, health management and constraints faced by IC in the
study area
Districts
Rwamagana
(n=40)
Rulindo
(n=40)
Ruhango
(n=40)
Muhanga
(n=40)
Kicukiro
(n=46)
Overall
mean
(%)
Constraints to IC production (%)
Diseases 40.0 42.5 50.0 32.5 28.3 38.3
Lack of
breeding stock
2.5 15.0 2.5 5.0 - 4.9
Feed shortage 2.5 2.5 5.0 5.0 2.2 3.4
Lack of capital 7.5 32.5 7.5 32.5 32.6 22.8
Price fluctuation - - 2.5 2.5 - 1.0
Theft 10.0 - 12.5 5.0 2.2 5.8
Lack of housing - 2.5 7.5 2.5 15.2 5.8
Lack of
information
5.0 - 2.5 2.5 2.2 2.4
Predators 32.5 5.0 10.0 12.5 17.4 15.5
3.3.5 Indigenous chicken ecotypes, flock structure, dynamics and reproduction
performance
Indigenous chicken ecotypes
The results (Table 6) show that a large proportion of chickens (38.84%) were dwarf
followed by frizzed feathers (27.9%) and normal feathers (18.68%) whereas naked neck
(8.34%) and improved breeds/crosses (6.24%) were the least common in the study area. This
results almost agrees with what was reported by Magothe et al. (2012) that the major genotypes
available in Kenya are normal feathered, naked-neck, frizzle-feathered, dwarf, crested-head,
feathered shanks and rump-less. However, the study indicated that local chickens are not
strictly indigenous as they have been crossed with exotic breeds which might be the case of
Rwanda as there is no study carried out to conclusively describe them either phenotypically or
genotypically. Such studies require molecular characterization which was beyond the scope of
the current study.
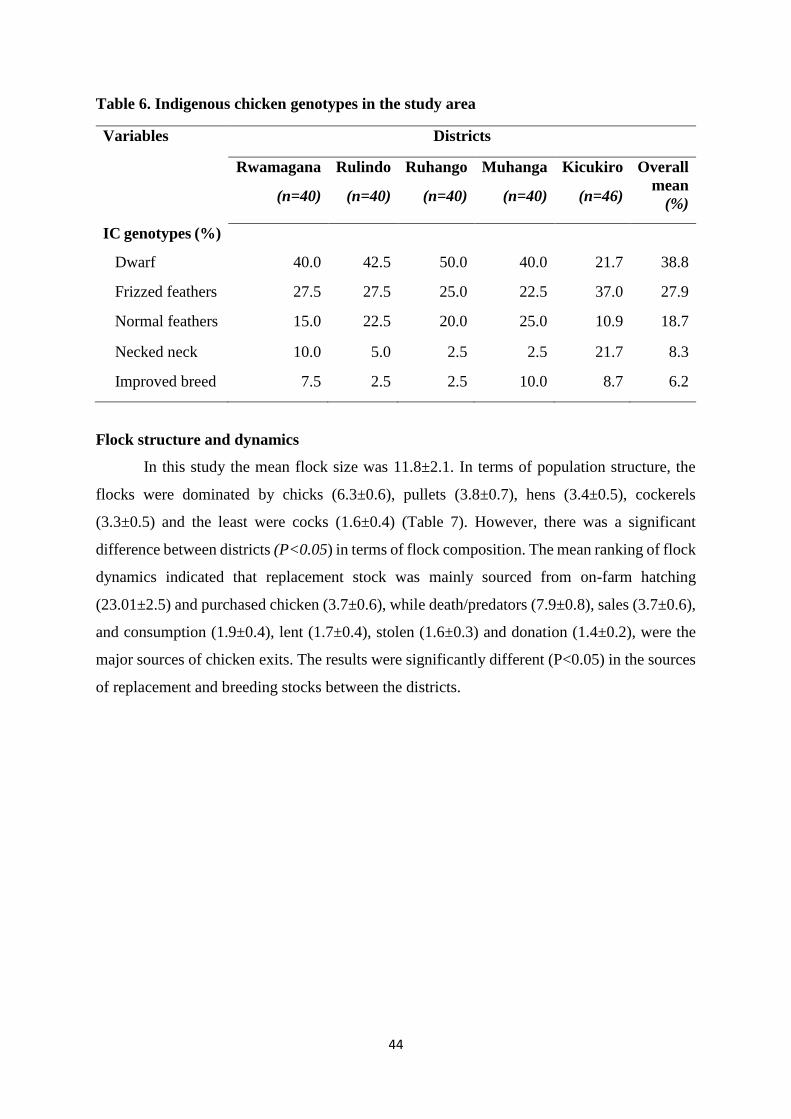
44
Table 6. Indigenous chicken genotypes in the study area
Variables Districts
Rwamagana
(n=40)
Rulindo
(n=40)
Ruhango
(n=40)
Muhanga
(n=40)
Kicukiro
(n=46)
Overall
mean
(%)
IC genotypes (%)
Dwarf 40.0 42.5 50.0 40.0 21.7 38.8
Frizzed feathers 27.5 27.5 25.0 22.5 37.0 27.9
Normal feathers 15.0 22.5 20.0 25.0 10.9 18.7
Necked neck 10.0 5.0 2.5 2.5 21.7 8.3
Improved breed 7.5 2.5 2.5 10.0 8.7 6.2
Flock structure and dynamics
In this study the mean flock size was 11.8±2.1. In terms of population structure, the
flocks were dominated by chicks (6.3±0.6), pullets (3.8±0.7), hens (3.4±0.5), cockerels
(3.3±0.5) and the least were cocks (1.6±0.4) (Table 7). However, there was a significant
difference between districts (P<0.05) in terms of flock composition. The mean ranking of flock
dynamics indicated that replacement stock was mainly sourced from on-farm hatching
(23.01±2.5) and purchased chicken (3.7±0.6), while death/predators (7.9±0.8), sales (3.7±0.6),
and consumption (1.9±0.4), lent (1.7±0.4), stolen (1.6±0.3) and donation (1.4±0.2), were the
major sources of chicken exits. The results were significantly different (P<0.05) in the sources
of replacement and breeding stocks between the districts.
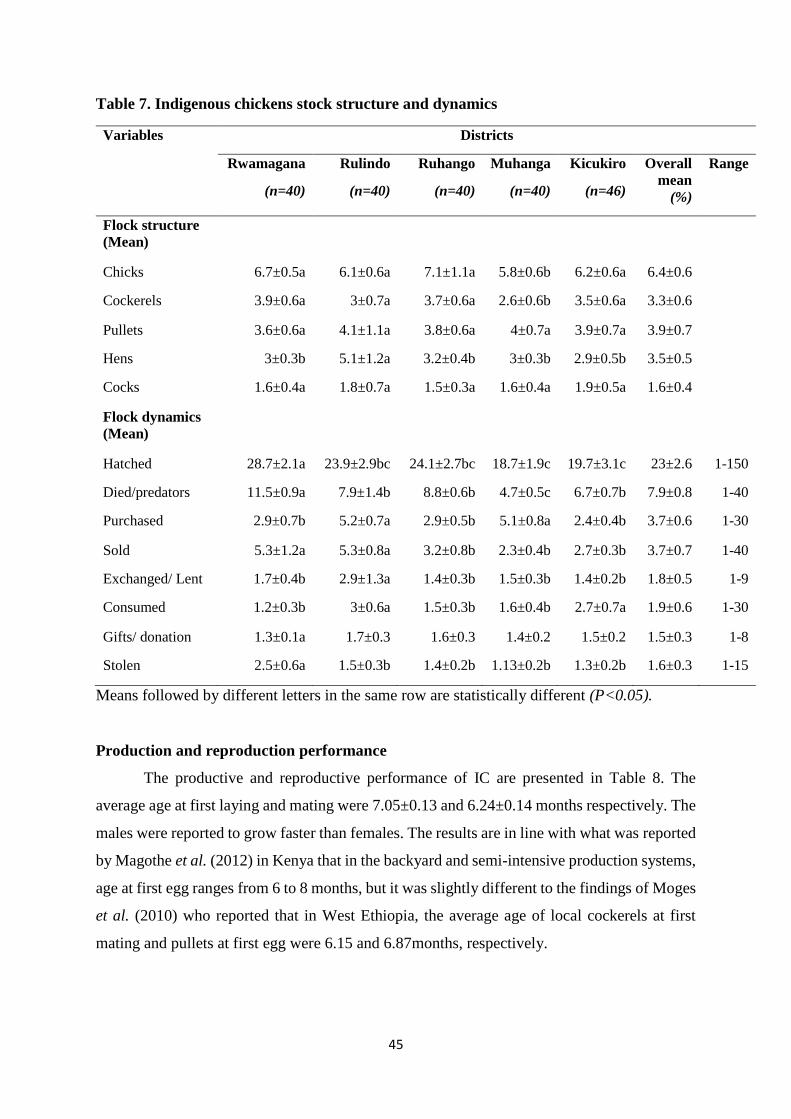
45
Table 7. Indigenous chickens stock structure and dynamics
Variables Districts
Rwamagana
(n=40)
Rulindo
(n=40)
Ruhango
(n=40)
Muhanga
(n=40)
Kicukiro
(n=46)
Overall
mean
(%)
Range
Flock structure
(Mean)
Chicks 6.7±0.5a 6.1±0.6a 7.1±1.1a 5.8±0.6b 6.2±0.6a 6.4±0.6
Cockerels 3.9±0.6a 3±0.7a 3.7±0.6a 2.6±0.6b 3.5±0.6a 3.3±0.6
Pullets 3.6±0.6a 4.1±1.1a 3.8±0.6a 4±0.7a 3.9±0.7a 3.9±0.7
Hens 3±0.3b 5.1±1.2a 3.2±0.4b 3±0.3b 2.9±0.5b 3.5±0.5
Cocks 1.6±0.4a 1.8±0.7a 1.5±0.3a 1.6±0.4a 1.9±0.5a 1.6±0.4
Flock dynamics
(Mean)
Hatched 28.7±2.1a 23.9±2.9bc 24.1±2.7bc 18.7±1.9c 19.7±3.1c 23±2.6 1-150
Died/predators 11.5±0.9a 7.9±1.4b 8.8±0.6b 4.7±0.5c 6.7±0.7b 7.9±0.8 1-40
Purchased 2.9±0.7b 5.2±0.7a 2.9±0.5b 5.1±0.8a 2.4±0.4b 3.7±0.6 1-30
Sold 5.3±1.2a 5.3±0.8a 3.2±0.8b 2.3±0.4b 2.7±0.3b 3.7±0.7 1-40
Exchanged/ Lent 1.7±0.4b 2.9±1.3a 1.4±0.3b 1.5±0.3b 1.4±0.2b 1.8±0.5 1-9
Consumed 1.2±0.3b 3±0.6a 1.5±0.3b 1.6±0.4b 2.7±0.7a 1.9±0.6 1-30
Gifts/ donation 1.3±0.1a 1.7±0.3 1.6±0.3 1.4±0.2 1.5±0.2 1.5±0.3 1-8
Stolen 2.5±0.6a 1.5±0.3b 1.4±0.2b 1.13±0.2b 1.3±0.2b 1.6±0.3 1-15
Means followed by different letters in the same row are statistically different (P<0.05).
Production and reproduction performance
The productive and reproductive performance of IC are presented in Table 8. The
average age at first laying and mating were 7.05±0.13 and 6.24±0.14 months respectively. The
males were reported to grow faster than females. The results are in line with what was reported
by Magothe et al. (2012) in Kenya that in the backyard and semi-intensive production systems,
age at first egg ranges from 6 to 8 months, but it was slightly different to the findings of Moges
et al. (2010) who reported that in West Ethiopia, the average age of local cockerels at first
mating and pullets at first egg were 6.15 and 6.87months, respectively.
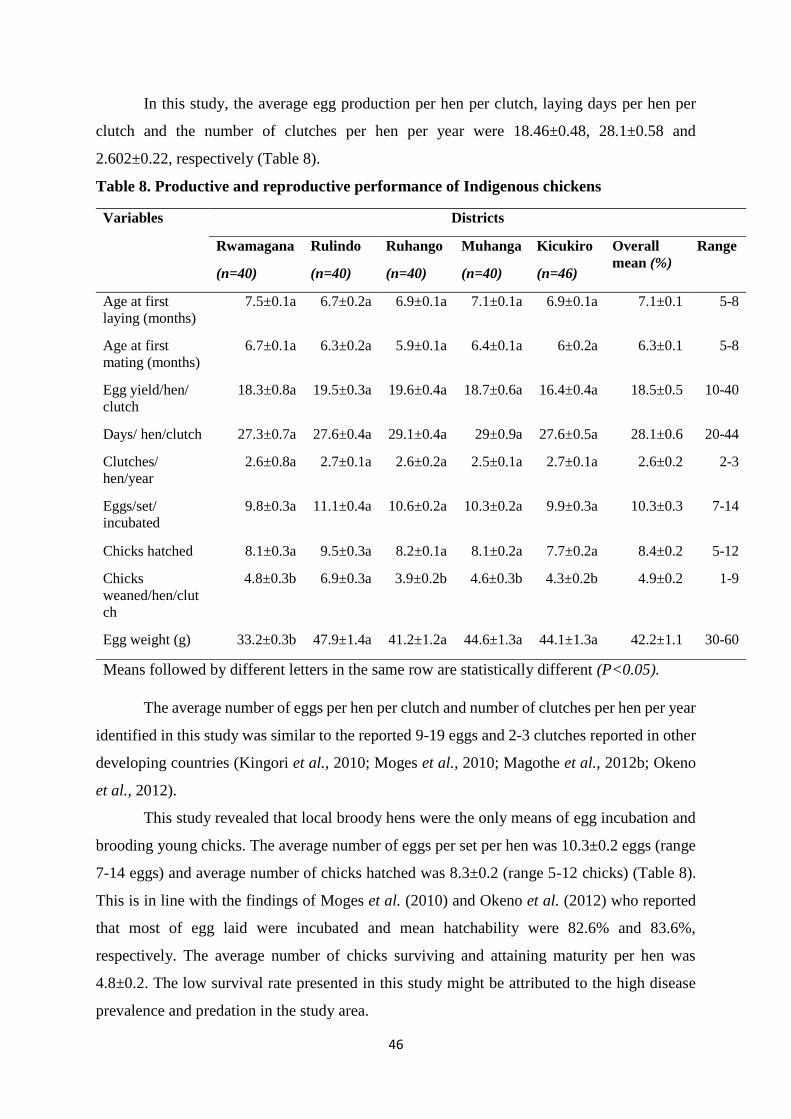
46
In this study, the average egg production per hen per clutch, laying days per hen per
clutch and the number of clutches per hen per year were 18.46±0.48, 28.1±0.58 and
2.602±0.22, respectively (Table 8).
Table 8. Productive and reproductive performance of Indigenous chickens
Variables Districts
Rwamagana
(n=40)
Rulindo
(n=40)
Ruhango
(n=40)
Muhanga
(n=40)
Kicukiro
(n=46)
Overall
mean (%)
Range
Age at first
laying (months)
7.5±0.1a 6.7±0.2a 6.9±0.1a 7.1±0.1a 6.9±0.1a 7.1±0.1 5-8
Age at first
mating (months)
6.7±0.1a 6.3±0.2a 5.9±0.1a 6.4±0.1a 6±0.2a 6.3±0.1 5-8
Egg yield/hen/
clutch
18.3±0.8a 19.5±0.3a 19.6±0.4a 18.7±0.6a 16.4±0.4a 18.5±0.5 10-40
Days/ hen/clutch 27.3±0.7a 27.6±0.4a 29.1±0.4a 29±0.9a 27.6±0.5a 28.1±0.6 20-44
Clutches/
hen/year
2.6±0.8a 2.7±0.1a 2.6±0.2a 2.5±0.1a 2.7±0.1a 2.6±0.2 2-3
Eggs/set/
incubated
9.8±0.3a 11.1±0.4a 10.6±0.2a 10.3±0.2a 9.9±0.3a 10.3±0.3 7-14
Chicks hatched 8.1±0.3a 9.5±0.3a 8.2±0.1a 8.1±0.2a 7.7±0.2a 8.4±0.2 5-12
Chicks
weaned/hen/clut
ch
4.8±0.3b 6.9±0.3a 3.9±0.2b 4.6±0.3b 4.3±0.2b 4.9±0.2 1-9
Egg weight (g) 33.2±0.3b 47.9±1.4a 41.2±1.2a 44.6±1.3a 44.1±1.3a 42.2±1.1 30-60
Means followed by different letters in the same row are statistically different (P<0.05).
The average number of eggs per hen per clutch and number of clutches per hen per year
identified in this study was similar to the reported 9-19 eggs and 2-3 clutches reported in other
developing countries (Kingori et al., 2010; Moges et al., 2010; Magothe et al., 2012b; Okeno
et al., 2012).
This study revealed that local broody hens were the only means of egg incubation and
brooding young chicks. The average number of eggs per set per hen was 10.3±0.2 eggs (range
7-14 eggs) and average number of chicks hatched was 8.3±0.2 (range 5-12 chicks) (Table 8).
This is in line with the findings of Moges et al. (2010) and Okeno et al. (2012) who reported
that most of egg laid were incubated and mean hatchability were 82.6% and 83.6%,
respectively. The average number of chicks surviving and attaining maturity per hen was
4.8±0.2. The low survival rate presented in this study might be attributed to the high disease
prevalence and predation in the study area.
47
Regarding egg production, it was estimated that egg production per hen per year ranges
from 30- 60 eggs with the average egg weight of 42.19±1.09 grams (range 30-60 grams). This
was in conformity with what was reported by Magothe et al. (2012) that, IC hens lay about 45
eggs per year with a range between 30 and 75 eggs under free range and semi-free range
systems with a mean egg weight of 47.4 g (range 36-52g).
3.3.6 Constraints to IC production
Generally, diseases outbreaks, lack of investment capital and predators were the major
challenges in IC production ranked by 38.3%, 22.8% and 15.5% of farmers respectively. Others
challenges like feed shortage, thieves, fluctuation of market price, lack of information of
poultry rearing and lack of chicken house were also highlighted, but ranked low (Table 5b).
The result obtained in this study is in agreement with studies carried elsewhere (Dana et al.,
2010; Harrison and Alders, 2010; Magothe et al., 2012; Mekonnen et al., 2010; Moges et al.,
2010; Okeno et al., 2012) who reported that Newcastle disease and predators were the serious
constraints to the poultry flock causing severe losses.
Majority of the respondents (70.1%) indicated that Newcastle disease, diarrhea and
predation occur mostly during dry season between June and September. This might be
attributed to the dry conditions favoring the spread of the disease-causative agents like
microbes, virus and high chicken mobility, as the period coincides with the crop harvesting
season. The same findings were also reported by Magothe et al. (2012a). Notification of the
seasons of outbreaks (Okeno et al., 2012) should be used to schedule vaccination programs
against these diseases. This calls for all institutions involved in animal health and husbandry
practices to sensitize all poultry farmers to vaccinate their birds, i.e chickens can be vaccinated
during dry seasons as suggested by Okeno et al. (2012) to enable birds to develop immunity
before the outbreaks in the wet seasons.
3.4 Conclusions
This study revealed that IC plays an important part in household livelihood in terms of
food provision, income and employment generation. However, their productivity is low due to
the associated constraints mentioned such as disease outbreaks, predators, lack of investment
capital, price fluctuation and lack of breeding stock which need urgent mitigation measures to
sustain their utilisation against the changing climatic and economic conditions. Studies on the
locally used feeds and medications should be considered. There is a need to sensitize farmers
to construct separate chicken houses to reduce the spread of diseases and predators. Therefore,

48
individual, public institutions and non-governmental organisations efforts are required to
develop a sustainable IC breeding objectives that account for whole production circumstances
and farmer’s need.
49
CHAPTER FOUR
FARMERS BREEDING PRACTICES AND TRAITS OF ECONOMIC
IMPORTANCE FOR INDIGENOUS CHICKEN IN RWANDA
4.1 Introduction
Despite the low productivity of indigenous poultry genotypes compared to commercial
strains, they are widely distributed in rural and peri-urban areas and account for about 80% of
the world’s poultry stocks in many developing countries (Pym, 2010; Akinola and Essien,
2011; Gabanakgosi et al., 2013). In Africa, IC are the most numerous and important species of
poultry as they are found wherever there are human settlements (Akinola and Essien, 2011).
They play numerous significant roles such as generating income and employment for various
categories of people including poultry farmers, primary and secondary traders, processors and
marketers from sale of birds and eggs (Akinola and Essien, 2011; Okeno et al., 2012). IC play
significant gender roles to women, widows, and orphaned children in terms of food security
and nutrition, cash income and savings. They provide a valuable source of protein in the diet
(Kingori et al., 2010; Okeno et al., 2012). They also play an important socio-cultural role and
traditional medicine in many societies (Kingori et al., 2010; Rakhmanin and Gennari, 2014).
Compared to other livestock species, IC have advantages in that they are hardy,
adapting well to the harsh scavenging conditions and poor nutrition and tolerant to parasites
and diseases, survive on low inputs and adapt to fluctuations in available feed resources (Dana
et al., 2010; Okeno et al., 2011; Magothe et al., 2012). Despite their importance, IC are under
threat due to several factors such as poor nutrition, high mortalities, market fluctuation, lack of
appropriate breeds and inadequate knowledge on consumer preference, changing of production
systems and indiscriminate crossbreeding hampering their exploitation and ability to improve
rural household livelihoods (Dana et al., 2010; Okeno et al., 2011). To tackle the highlighted
challenges, development of breeding objectives and breeding programme accounting for all
stakeholders’ needs are required for genetic improvement programmes of IC to be successful.
In Rwanda like other developing countries, breeding objectives and programs for IC
breeds are missing. Therefore, there is a need to develop the breeding objectives which will be
further used to support genetic improvement programs. Characterisation of the production
systems, identification of breeding practices, production objectives and traits of economic
importance for IC farmers are key in the development of breeding objectives (Dana et al., 2010;
Okeno et al., 2011). The objective of this study was therefore, to determine the breeding
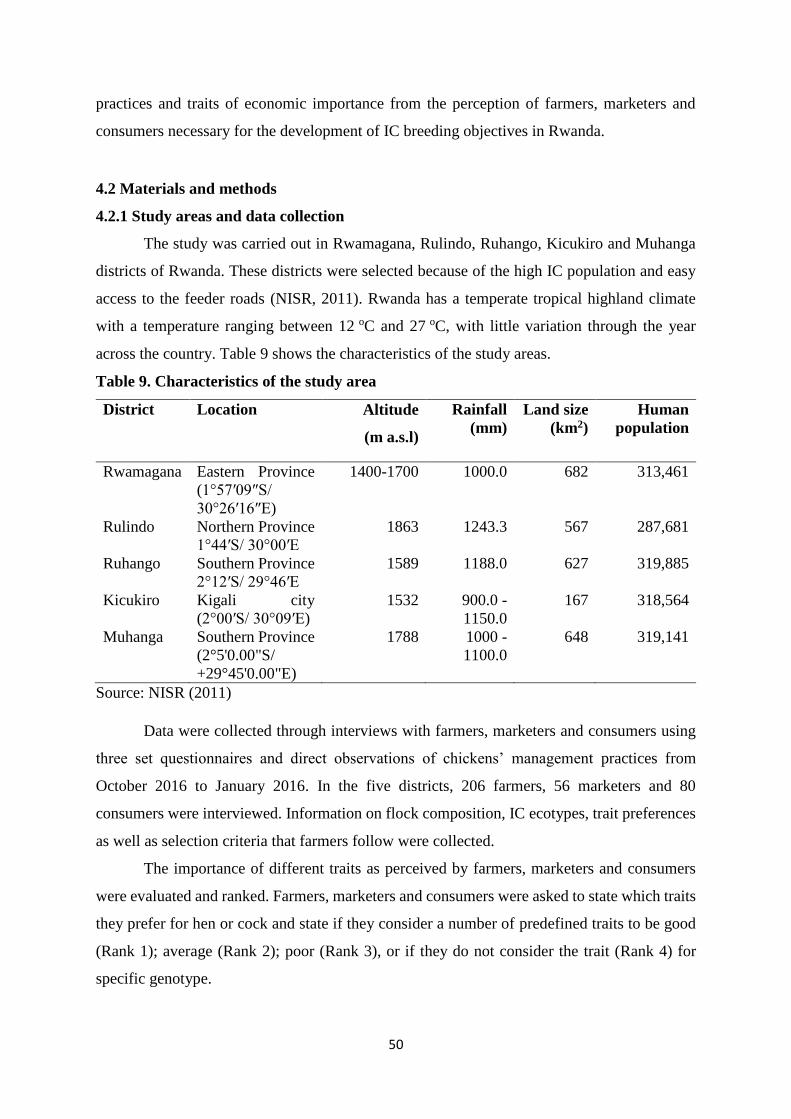
50
practices and traits of economic importance from the perception of farmers, marketers and
consumers necessary for the development of IC breeding objectives in Rwanda.
4.2 Materials and methods
4.2.1 Study areas and data collection
The study was carried out in Rwamagana, Rulindo, Ruhango, Kicukiro and Muhanga
districts of Rwanda. These districts were selected because of the high IC population and easy
access to the feeder roads (NISR, 2011). Rwanda has a temperate tropical highland climate
with a temperature ranging between 12 oC and 27 oC, with little variation through the year
across the country. Table 9 shows the characteristics of the study areas.
Table 9. Characteristics of the study area
District Location Altitude
(m a.s.l)
Rainfall
(mm)
Land size
(km2)
Human
population
Rwamagana Eastern Province
(1°57′09″S/
30°26′16″E)
1400-1700 1000.0 682 313,461
Rulindo Northern Province
1°44′S/ 30°00′E
1863 1243.3 567 287,681
Ruhango Southern Province
2°12′S/ 29°46′E
1589 1188.0 627 319,885
Kicukiro Kigali city
(2°00′S/ 30°09′E)
1532 900.0 -
1150.0
167 318,564
Muhanga Southern Province
(2°5'0.00"S/
+29°45'0.00"E)
1788 1000 -
1100.0
648 319,141
Source: NISR (2011)
Data were collected through interviews with farmers, marketers and consumers using
three set questionnaires and direct observations of chickens’ management practices from
October 2016 to January 2016. In the five districts, 206 farmers, 56 marketers and 80
consumers were interviewed. Information on flock composition, IC ecotypes, trait preferences
as well as selection criteria that farmers follow were collected.
The importance of different traits as perceived by farmers, marketers and consumers
were evaluated and ranked. Farmers, marketers and consumers were asked to state which traits
they prefer for hen or cock and state if they consider a number of predefined traits to be good
(Rank 1); average (Rank 2); poor (Rank 3), or if they do not consider the trait (Rank 4) for
specific genotype.
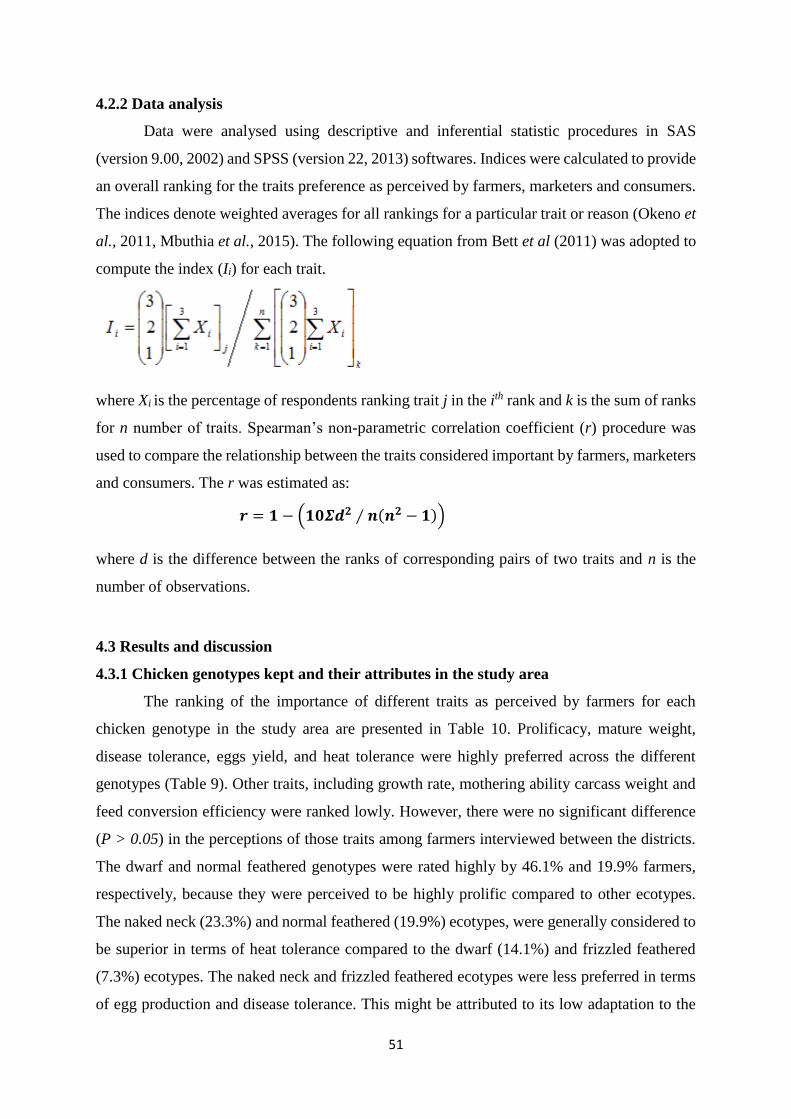
51
4.2.2 Data analysis
Data were analysed using descriptive and inferential statistic procedures in SAS
(version 9.00, 2002) and SPSS (version 22, 2013) softwares. Indices were calculated to provide
an overall ranking for the traits preference as perceived by farmers, marketers and consumers.
The indices denote weighted averages for all rankings for a particular trait or reason (Okeno et
al., 2011, Mbuthia et al., 2015). The following equation from Bett et al (2011) was adopted to
compute the index (Ii) for each trait.
where Xi is the percentage of respondents ranking trait j in the ith rank and k is the sum of ranks
for n number of traits. Spearman’s non-parametric correlation coefficient (r) procedure was
used to compare the relationship between the traits considered important by farmers, marketers
and consumers. The r was estimated as:
𝒓 = 𝟏 − (𝟏𝟎𝜮𝒅𝟐 ∕ 𝒏(𝒏𝟐 − 𝟏))
where d is the difference between the ranks of corresponding pairs of two traits and n is the
number of observations.
4.3 Results and discussion
4.3.1 Chicken genotypes kept and their attributes in the study area
The ranking of the importance of different traits as perceived by farmers for each
chicken genotype in the study area are presented in Table 10. Prolificacy, mature weight,
disease tolerance, eggs yield, and heat tolerance were highly preferred across the different
genotypes (Table 9). Other traits, including growth rate, mothering ability carcass weight and
feed conversion efficiency were ranked lowly. However, there were no significant difference
(P > 0.05) in the perceptions of those traits among farmers interviewed between the districts.
The dwarf and normal feathered genotypes were rated highly by 46.1% and 19.9% farmers,
respectively, because they were perceived to be highly prolific compared to other ecotypes.
The naked neck (23.3%) and normal feathered (19.9%) ecotypes, were generally considered to
be superior in terms of heat tolerance compared to the dwarf (14.1%) and frizzled feathered
(7.3%) ecotypes. The naked neck and frizzled feathered ecotypes were less preferred in terms
of egg production and disease tolerance. This might be attributed to its low adaptation to the
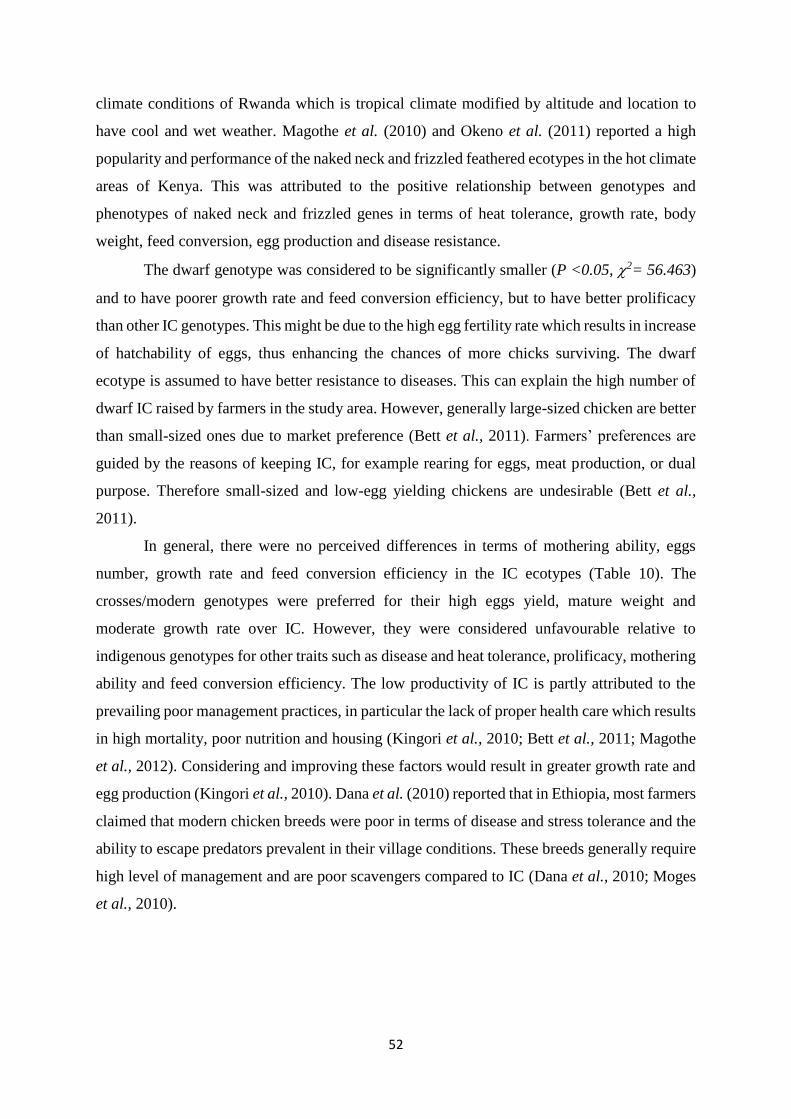
52
climate conditions of Rwanda which is tropical climate modified by altitude and location to
have cool and wet weather. Magothe et al. (2010) and Okeno et al. (2011) reported a high
popularity and performance of the naked neck and frizzled feathered ecotypes in the hot climate
areas of Kenya. This was attributed to the positive relationship between genotypes and
phenotypes of naked neck and frizzled genes in terms of heat tolerance, growth rate, body
weight, feed conversion, egg production and disease resistance.
The dwarf genotype was considered to be significantly smaller (P <0.05, 2= 56.463)
and to have poorer growth rate and feed conversion efficiency, but to have better prolificacy
than other IC genotypes. This might be due to the high egg fertility rate which results in increase
of hatchability of eggs, thus enhancing the chances of more chicks surviving. The dwarf
ecotype is assumed to have better resistance to diseases. This can explain the high number of
dwarf IC raised by farmers in the study area. However, generally large-sized chicken are better
than small-sized ones due to market preference (Bett et al., 2011). Farmers’ preferences are
guided by the reasons of keeping IC, for example rearing for eggs, meat production, or dual
purpose. Therefore small-sized and low-egg yielding chickens are undesirable (Bett et al.,
2011).
In general, there were no perceived differences in terms of mothering ability, eggs
number, growth rate and feed conversion efficiency in the IC ecotypes (Table 10). The
crosses/modern genotypes were preferred for their high eggs yield, mature weight and
moderate growth rate over IC. However, they were considered unfavourable relative to
indigenous genotypes for other traits such as disease and heat tolerance, prolificacy, mothering
ability and feed conversion efficiency. The low productivity of IC is partly attributed to the
prevailing poor management practices, in particular the lack of proper health care which results
in high mortality, poor nutrition and housing (Kingori et al., 2010; Bett et al., 2011; Magothe
et al., 2012). Considering and improving these factors would result in greater growth rate and
egg production (Kingori et al., 2010). Dana et al. (2010) reported that in Ethiopia, most farmers
claimed that modern chicken breeds were poor in terms of disease and stress tolerance and the
ability to escape predators prevalent in their village conditions. These breeds generally require
high level of management and are poor scavengers compared to IC (Dana et al., 2010; Moges
et al., 2010).
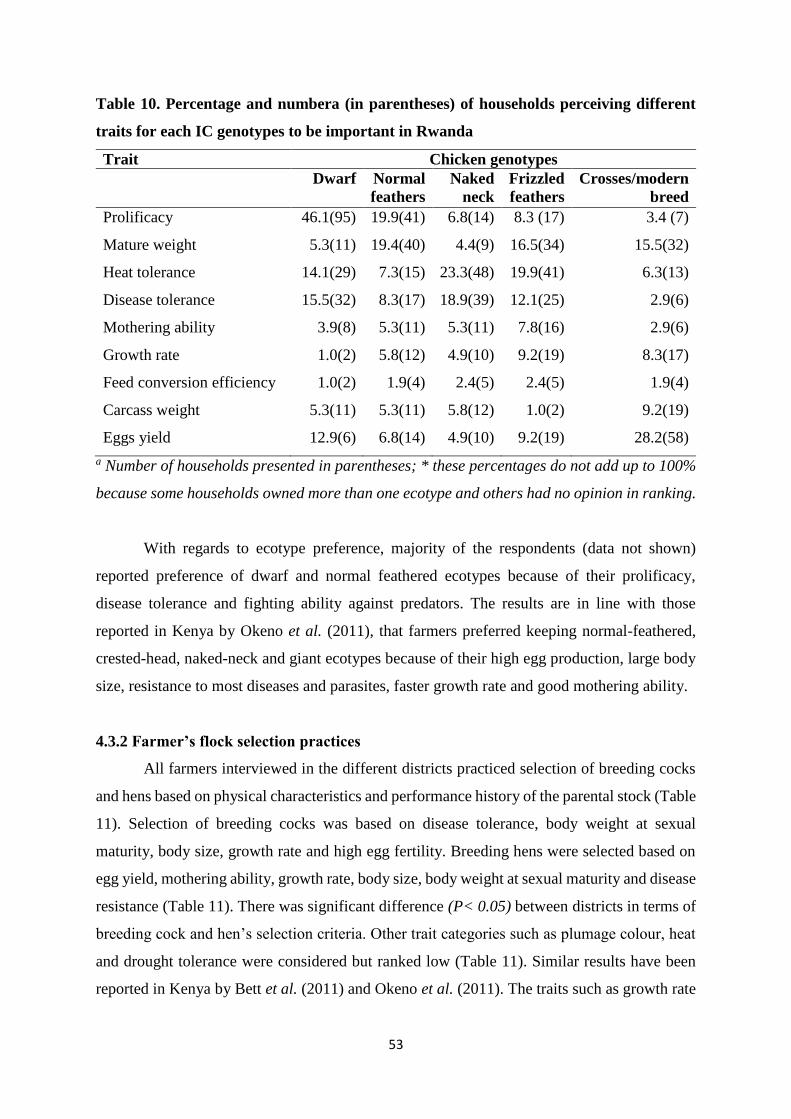
53
Table 10. Percentage and numbera (in parentheses) of households perceiving different
traits for each IC genotypes to be important in Rwanda
Trait Chicken genotypes
Dwarf Normal
feathers
Naked
neck
Frizzled
feathers
Crosses/modern
breed
Prolificacy 46.1(95) 19.9(41) 6.8(14) 8.3 (17) 3.4 (7)
Mature weight 5.3(11) 19.4(40) 4.4(9) 16.5(34) 15.5(32)
Heat tolerance 14.1(29) 7.3(15) 23.3(48) 19.9(41) 6.3(13)
Disease tolerance 15.5(32) 8.3(17) 18.9(39) 12.1(25) 2.9(6)
Mothering ability 3.9(8) 5.3(11) 5.3(11) 7.8(16) 2.9(6)
Growth rate 1.0(2) 5.8(12) 4.9(10) 9.2(19) 8.3(17)
Feed conversion efficiency 1.0(2) 1.9(4) 2.4(5) 2.4(5) 1.9(4)
Carcass weight 5.3(11) 5.3(11) 5.8(12) 1.0(2) 9.2(19)
Eggs yield 12.9(6) 6.8(14) 4.9(10) 9.2(19) 28.2(58)
a Number of households presented in parentheses; * these percentages do not add up to 100%
because some households owned more than one ecotype and others had no opinion in ranking.
With regards to ecotype preference, majority of the respondents (data not shown)
reported preference of dwarf and normal feathered ecotypes because of their prolificacy,
disease tolerance and fighting ability against predators. The results are in line with those
reported in Kenya by Okeno et al. (2011), that farmers preferred keeping normal-feathered,
crested-head, naked-neck and giant ecotypes because of their high egg production, large body
size, resistance to most diseases and parasites, faster growth rate and good mothering ability.
4.3.2 Farmer’s flock selection practices
All farmers interviewed in the different districts practiced selection of breeding cocks
and hens based on physical characteristics and performance history of the parental stock (Table
11). Selection of breeding cocks was based on disease tolerance, body weight at sexual
maturity, body size, growth rate and high egg fertility. Breeding hens were selected based on
egg yield, mothering ability, growth rate, body size, body weight at sexual maturity and disease
resistance (Table 11). There was significant difference (P< 0.05) between districts in terms of
breeding cock and hen’s selection criteria. Other trait categories such as plumage colour, heat
and drought tolerance were considered but ranked low (Table 11). Similar results have been
reported in Kenya by Bett et al. (2011) and Okeno et al. (2011). The traits such as growth rate

54
and live body weight are economically important when rearing cocks for sale, because heavy
cocks fetch high prices in the market (Bett et al., 2011).The findings disagrees with what was
reported by Dana et al. (2010) and Hailu et al. (2014) that in Ethiopia, all farmers practiced
selection on breeding and replacement males and females based on plumage colour, live
weight, comb type and qumena (conformation, visual attraction, size).
Table 11. Percentage ranking of traits used by farmers when selecting male and female
chicken for breeding purposes in selected districts of Rwanda
Category Districts
Rwamagana Rulindo Ruhango Muhanga Kicukiro Total
(%)
Breeding cocks
Body size 60.7 56.4 34.2 23.7 26.7 40.3
Body weight at
sexual maturity
49.5 44.5 39.8 42.9 36.6 42.7
Disease tolerance 58.5 56.5 45.0 28.5 35.4 44.8
Egg fertility 14.5 15.7 8.5 15.4 18.7 32.8
Growth rate 36.5 28.9 42.3 32.6 39.8 36.0
Heat tolerance 12.5 16.7 12.5 12.5 14.5 13.7
Plumage colour 17.5 15.5 13.5 10.0 14.3 14.2
Breeding hens
Body size 60.5 52.5 32.5 45.5 34.3 45.1
Body weight at
sexual maturity
37.3 43.0 42.5 57.5 31.6 42.4
Disease tolerance 52.5 47.5 61.2 70.0 68.3 42.4
Drought tolerance 13.5 22.7 25.6 13.8 14.3 17.9
Egg yield 71.5 54.5 79.0 63.2 46.7 62.9
Egg fertility 11.5 19.8 29.5 17.5 31.3 21.9
Growth rate 67.5 42.5 58.7 47.5 44.5 52.1
Mothering ability 55.1 63.7 76.5 60.0 32.1 57.5
Plumage colour 12.0 20.0 22.5 19.5 22.2 19.2
Prolificacy 54.6 35.0 45.6 47.5 38.7 44.3
aThese percentages do not add up to 100% since households were selecting male and female
breeding and replacement stock based on more than one trait category.
55
4.3.3 Traits perceived by farmers, marketers and consumers as being of primary
importance.
The ranking of traits perceived by farmers, marketers and consumers as being of
primary economic importance is presented in Table 12. There was no significant difference
(P>0.05) across all trait categories as perceived by farmers. In general, farmers wanted
chickens which combined productive, reproductive, functional and aesthetic traits (Table 12).
However, egg yield, disease tolerance, high growth rate, prolificacy, high body weight and egg
fertility were highly preferred by farmers. This indicates that all perceived traits, though having
various utility values, are important for breeding and selection purposes.
In this study, the most importance traits considered by the marketers were meat quality,
egg yolk colour, plumage colour, disease tolerance, growth rate and body weight (Table 12).
On the other hand, consumers are interested in chicken with heavy body weight and quality
meat and eggs with yellow yolk (Table 12). Guèye, (1998) and (2002) revealed that the average
IC meat prices in Dakar, Senegal, varied from US$ 2.54 to 3.93 per kg at markets and
supermarkets, respectively. These represented increases of about 13% at market and 27%
higher at supermarkets compared to prices of meat from commercial chicken. Abeykoon, et al
(2013) has shown that in Sri Lanka, meat and egg production of village chicken is lower than
the commercial chicken breeds, but there is a niche market for their meat and eggs Consumers
with higher income group are willing to pay more to get indigenous meat (Padhi, 2016).
Some farmers recognized that chicken with certain colour for instance white colour
were easily targeted by terrestrial and aerial predators. The ability of IC to camouflage in the
surrounding environment is determined by plumage colour (Bett et al., 2011). In Kenya and
Ethiopia, cock’s and hens’ plumage colour influence the market value and the preferences of
buyers Dana et al. (2010), Bett et al. (2011) and Hailu et al. (2013). Development of breeding
program without considering the needs of all stakeholders has high chances of being rejected
by end users (Bett et al., 2011). Therefore, design of breeding objectives and breeding
programmes of IC improvement should consider the traits perceived by farmers, traders and
consumers.
The price of egg in this study was determined by the egg yolk and shell colour. This
can be supported by the fact that the price of indigenous egg is almost twice the price of exotic’s
egg in the study area. Consumers preferred white and pale eggs’ colour with a yellow egg yolk.
Most of the consumers stated that they prefer IC over exotic because of the quality meat.
Similarly, marketers and consumers in Ethiopia and Kenya considered morphological traits
such as plumage colour, egg shell colour and comb type to have significant economic values
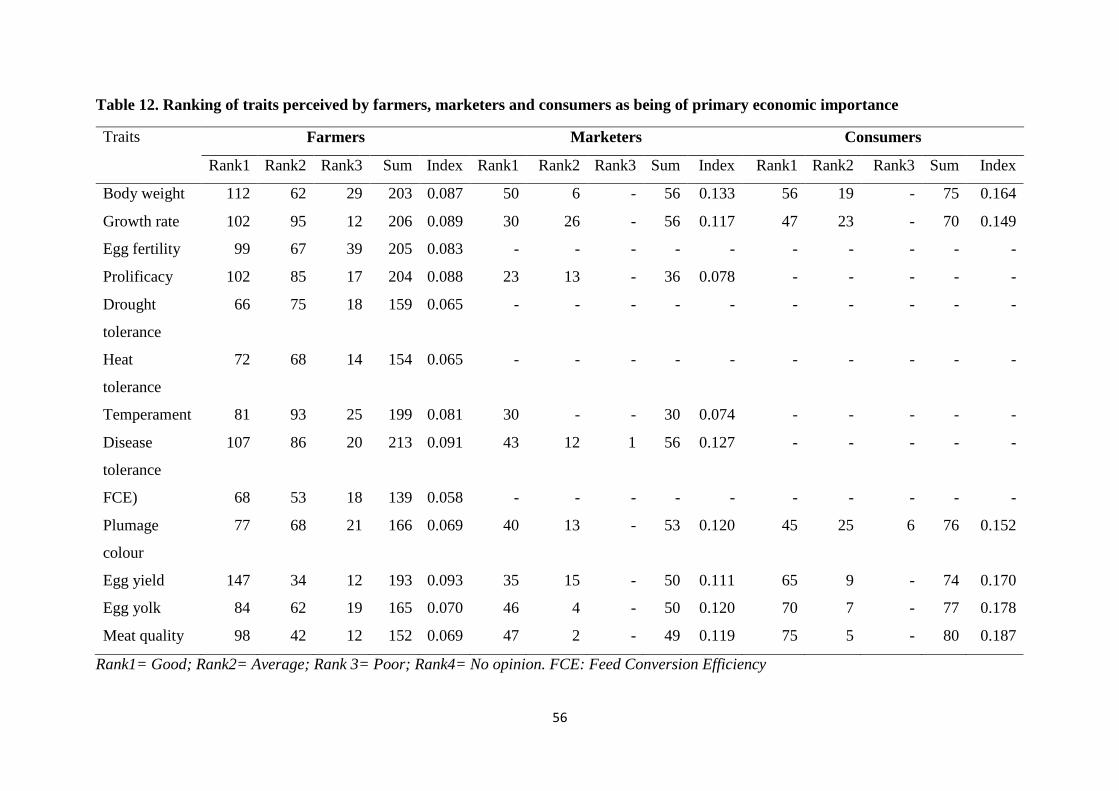
56
Table 12. Ranking of traits perceived by farmers, marketers and consumers as being of primary economic importance
Traits Farmers Marketers Consumers
Rank1 Rank2 Rank3 Sum Index Rank1 Rank2 Rank3 Sum Index Rank1 Rank2 Rank3 Sum Index
Body weight 112 62 29 203 0.087 50 6 - 56 0.133 56 19 - 75 0.164
Growth rate 102 95 12 206 0.089 30 26 - 56 0.117 47 23 - 70 0.149
Egg fertility 99 67 39 205 0.083 - - - - - - - - - -
Prolificacy 102 85 17 204 0.088 23 13 - 36 0.078 - - - - -
Drought
tolerance
66 75 18 159 0.065 - - - - - - - - - -
Heat
tolerance
72 68 14 154 0.065 - - - - - - - - - -
Temperament 81 93 25 199 0.081 30 - - 30 0.074 - - - - -
Disease
tolerance
107 86 20 213 0.091 43 12 1 56 0.127 - - - - -
FCE) 68 53 18 139 0.058 - - - - - - - - - -
Plumage
colour
77 68 21 166 0.069 40 13 - 53 0.120 45 25 6 76 0.152
Egg yield 147 34 12 193 0.093 35 15 - 50 0.111 65 9 - 74 0.170
Egg yolk 84 62 19 165 0.070 46 4 - 50 0.120 70 7 - 77 0.178
Meat quality 98 42 12 152 0.069 47 2 - 49 0.119 75 5 - 80 0.187
Rank1= Good; Rank2= Average; Rank 3= Poor; Rank4= No opinion. FCE: Feed Conversion Efficiency
57
alongside other quantitative traits related to body size, growth rate and egg yield Dana et al.
(2010), Okeno et al. (2011) and Hailu et al. (2014).
IC were ranked to have superior qualities with regard to traits such as heat and cold
tolerance, disease resistance, ability to fight and escape from predators, broody behaviour, high
hatchability of eggs and scavenging for food which are important in adaptation to the village
conditions; and those traits, such as taste of egg and meat, affect consumers’ preference and
the market value (Dana et al., 2010).
The spearman’s non-parametric rank correlations were calculated independently for the
traits perceived important by farmers, marketers and consumers and are presented in Table 13.
For the traits perceived to be important by farmers, there was a positive and significant
correlation (P < 0.01) between BW and growth rate (GR) and FER. This implies that farmers
wanted chickens with high growth rate and high egg fertility rate and larger body size to
increase their flock size.
Correlation were moderate between body weight and prolificacy (PRL), drought
tolerance (DRTOL), disease tolerance (DTOL) and egg yolk colour (EYC). Preference of body
weight was negatively correlated with temperament (TEMP), heat tolerance (HTOL), plumage
colour (Pcol) and ESC. There was a significant negative correlation (P < 0.01) between meat
quality (MQ) and BW, GR and FER. DRTOL and HTOL were positively correlated with Fer
and PRL. Preference of Prl was positively correlated with FER indicating that farmers prefer
hens with high egg fertility thus producing more chicks. Disease tolerance was moderately
correlated with BW, GR and PRL but negatively correlated with FER. A moderate correlation
was between FCE and BW, GR and PRL but negatively correlated to egg fertility. This
indicates that poor feeding IC affects their egg fertility. In general, disease tolerance, egg
fertility, growth rate and prolificacy were the most important reproductive, productive and
functional traits.
Regarding marketer and consumers’ preferences ranks correlation, positively and
significant correlation (P < 0.01, P < 0.05) were obtained between BW and GR and MQ.
Preference for BW was positively correlated with PRL, ESC, PCOL and EYC for both
marketers and consumers. A moderate positive correlation was observed between GR and Pcol,
ESC, EYC and MQ. Correlations of FER, PRL, DRTOL, TEMP, HTOL, DTOL, FCE and
other traits in the consumers’ preference were not calculated due to the low ranking these traits
obtained (Table 13).
Consideration of farmers’ genotypes or breed and trait preferences is important in
design of sustainable improvement programs (Mbuthia et al., 2015). This is because it ensures
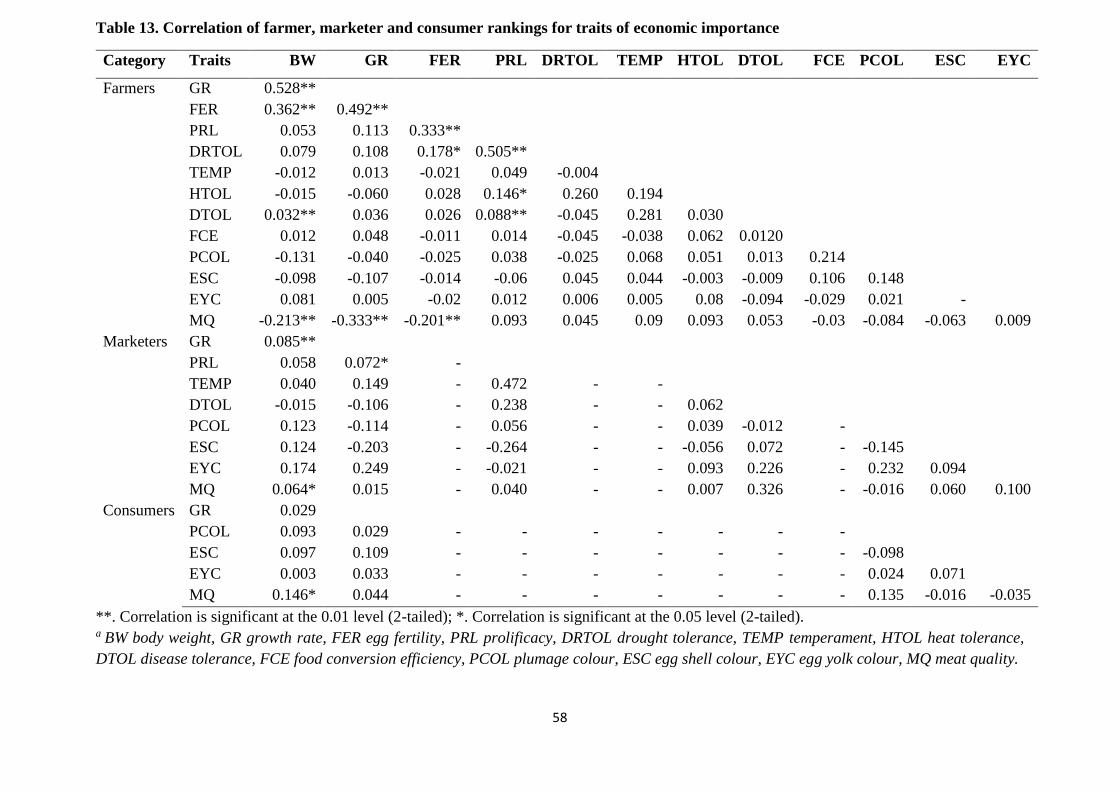
58
Table 13. Correlation of farmer, marketer and consumer rankings for traits of economic importance
Category Traits BW GR FER PRL DRTOL TEMP HTOL DTOL FCE PCOL ESC EYC
Farmers GR 0.528**
FER 0.362** 0.492**
PRL 0.053 0.113 0.333**
DRTOL 0.079 0.108 0.178* 0.505**
TEMP -0.012 0.013 -0.021 0.049 -0.004
HTOL -0.015 -0.060 0.028 0.146* 0.260 0.194
DTOL 0.032** 0.036 0.026 0.088** -0.045 0.281 0.030
FCE 0.012 0.048 -0.011 0.014 -0.045 -0.038 0.062 0.0120
PCOL -0.131 -0.040 -0.025 0.038 -0.025 0.068 0.051 0.013 0.214
ESC -0.098 -0.107 -0.014 -0.06 0.045 0.044 -0.003 -0.009 0.106 0.148
EYC 0.081 0.005 -0.02 0.012 0.006 0.005 0.08 -0.094 -0.029 0.021 -
MQ -0.213** -0.333** -0.201** 0.093 0.045 0.09 0.093 0.053 -0.03 -0.084 -0.063 0.009
Marketers GR 0.085**
PRL 0.058 0.072* -
TEMP 0.040 0.149 - 0.472 - -
DTOL -0.015 -0.106 - 0.238 - - 0.062
PCOL 0.123 -0.114 - 0.056 - - 0.039 -0.012 -
ESC 0.124 -0.203 - -0.264 - - -0.056 0.072 - -0.145
EYC 0.174 0.249 - -0.021 - - 0.093 0.226 - 0.232 0.094
MQ 0.064* 0.015 - 0.040 - - 0.007 0.326 - -0.016 0.060 0.100
Consumers GR 0.029
PCOL 0.093 0.029 - - - - - - -
ESC 0.097 0.109 - - - - - - - -0.098
EYC 0.003 0.033 - - - - - - - 0.024 0.071
MQ 0.146* 0.044 - - - - - - - 0.135 -0.016 -0.035
**. Correlation is significant at the 0.01 level (2-tailed); *. Correlation is significant at the 0.05 level (2-tailed). a BW body weight, GR growth rate, FER egg fertility, PRL prolificacy, DRTOL drought tolerance, TEMP temperament, HTOL heat tolerance,
DTOL disease tolerance, FCE food conversion efficiency, PCOL plumage colour, ESC egg shell colour, EYC egg yolk colour, MQ meat quality.
59
that animal selection is based on traits that farmers understand, measures and records easily and
derives direct economic value (Tada et al., 2013). However, it might be difficult to combine both
productive, reproductive and functional traits as some are negatively correlated (Table 13). When
the traits of interest are numerous and/or some of them are antagonistic, different lines may be
created, and maintained by within-line selection. Therefore, intervention measures where some
traits can be improved through management while others through selection are needed (Okeno et
al., 2011). This can be achieved through consideration of appropriate genotypes that can efficiently
utilize available resources and are adapted to the environment conditions.
4.4 Conclusion
Results from this study revealed that prolificacy, mature weight, disease tolerance, egg
number, and heat tolerance were the most preferred attributes across different IC genotypes.
Selection of breeding cocks and hens was mainly based on disease tolerance, body weight at sexual
maturity, body size, growth rate and high egg fertility were the highly-preferred traits for breeding
cocks. Egg yield, mothering ability, growth rate, body size, body weight at sexual maturity and
disease resistance were the most important traits preferred for hens.
In general, farmers wanted chicken which combined productive, reproductive, functional
and aesthetic traits. However, egg yield, disease tolerance, high growth rate, prolificacy, high body
weight and egg fertility were highly preferred by farmers. For the traits perceived to be important
by farmers, there was a positive and significant correlation between body weight and GR and FER.
There was a significant negative correlation between meat quality (MQ) and BW, GR and FER
Regarding marketer and consumer’ preferences rank correlation, positively and significant
correlation were obtained between BW and GR and MQ. The trait preferences perceived by
marketer and consumers were meat quality, egg yolk colour, plumage colour, disease tolerance,
and growth rate and body weight. As such, appropriate genotypes which suit these characteristics
need to be identified and utilized based on their performance and adaption to the environment
conditions to ensure efficient resource utilisation. The study has clearly showed there is need to
consider the stakeholders’ preferences in the future development of improvement programs for IC.
60
CHAPTER FIVE
BIO-ECONOMIC MODEL DEVELOPMENT AND ESTIMATION OF ECONOMIC
VALUES FOR TRAITS
5.1 Introduction
Poultry, particularly chicken are the most widely raised livestock species in the world and
also the most numerous (Mengesha and Tsega, 2011; FAO, 2013; Gabanakgosi et al., 2013 ). More
than 80% of the total poultry are kept in rural and peri-urban areas of developing countries
(Gabanakgosi et al., 2013). They significantly contribute to improving human nutrition, provision
of much needed source of nutrients and micronutrients and generate income and savings,
especially in disadvantaged groups and low income food-deficit countries (Guèye, 2002; Akinola
and Essien, 2011; FAO, 2013). In Africa, IC make up over 70% of the total chicken population
(Kingori, et al., 2010).
Over 80% of the small-scale farmers in Rwanda rear chicken, majority of which are IC
(FAO, 2009; NISR, 2011). In Rwanda, they contribute 3000 tonnes of eggs and 2144 tonnes of
chicken produced annually (FAOSTAT, 2014). Their popularity among resource poor rural
households in developing countries is attributed to their low cost of production, adaptability to
harsh scavenging conditions, resistance to disease outbreaks and adjustment to the fluctuations of
feed availability (Menge et al., 2005; Akinola and Essien, 2011; Dana et al., 2010; Kingori et al.,
2010; Mengesha and Tsega, 2011). Compared to other livestock species, chicken production has
the advantages of having quick returns to investment and relatively simple management practices
with numerous market outlets for products (Kingori et al., 2010). Chicken production has less
detrimental impact on the environment than other livestock, and uses less water (FAO, 2013). IC
are extremely important in providing income and high-quality protein in the diets of rural people
whose traditional foods are typically rich in carbohydrate but low in protein (FAO, 2013). Their
contribution goes beyond provision of food, cash income and employment as they also serve as a
means of wealth accumulation and are valued in religious and sociocultural lives of most
communities (Mack et al., 2005; Grobbelaar et al., 2010; Kingori et al., 2010; Okeno et al., 2012).
Despite playing these important roles, production constraints such as high disease
incidences, inadequate nutrition, low genetic ability for eggs and meat production, poor housing,
healthcare, marketing channels and lack of appropriate breeding objectives, reduce their
contribution to rural development (Mengesha and Tsega, 2011; Magothe et al., 2012; Okeno et
61
al., 2013). However, IC possess high genetic diversity for many traits which can be improved
through selection (Okeno et al., 2013).
Definition of breeding objectives is the first step in genetic improvement as it describes the
direction of selection and genetic merits of performance traits (Åby et al., 2012; Wolc et al., 2011).
Breeding objectives are linear combinations of the traits that have an impact on the profitability of
a given production system, weighted with their respective economic values (Menge et al., 2005;
Henning et al., 2013). The breeding objective should reflect the production and economic
environment under which the animals are raised (Okeno et al., 2013; Mbuthia et al., 2015a). In
chicken production, different production environment, management and marketing exist, further
complicating the process of developing a general breeding objective. Under such situations, a
general bio-economic model becomes an important tool as a larger number of factors and their
complex interactions in the production systems are considered concurrently (Kahi and Nitter,
2004; Åby et al., 2012).
In developing countries, bio-economic models have been developed and utilised to
estimate the profitability and economic values for pigs (Mbuthia et al., 2015a), dual purpose goats
(Bett, et al., 2007), Boran beef breed and dairy cattle (Rewe et al., 2006; Åby et al., 2012), and
indigenous chicken (Menge et al., 2005; Henning et al., 2013; Okeno et al., 2013). Such
highlighted studies are non-existent in Rwanda. There is a need to develop a bio-economic model
integrating the productive and functional traits, and deriving their economic values under the
production circumstances of Rwanda. The present study aimed to develop a bio-economic model
incorporating biological and functional traits and estimate their economic values to support
smallholder chicken production systems.
5.2 Material and methods
5.2.1 Model description
In this study, a deterministic model was developed and used to evaluate the biological and
economic aspects of IC production systems in Rwanda. A deterministic model is one in which
every set of variable states is uniquely determined by parameters in the model and by sets of
previous states of these variables; therefore, a deterministic model always performs the same way
for a given set of initial conditions. The model involves description of typical production systems
practised and modelling their profitability taking into account traits that have influence on revenues
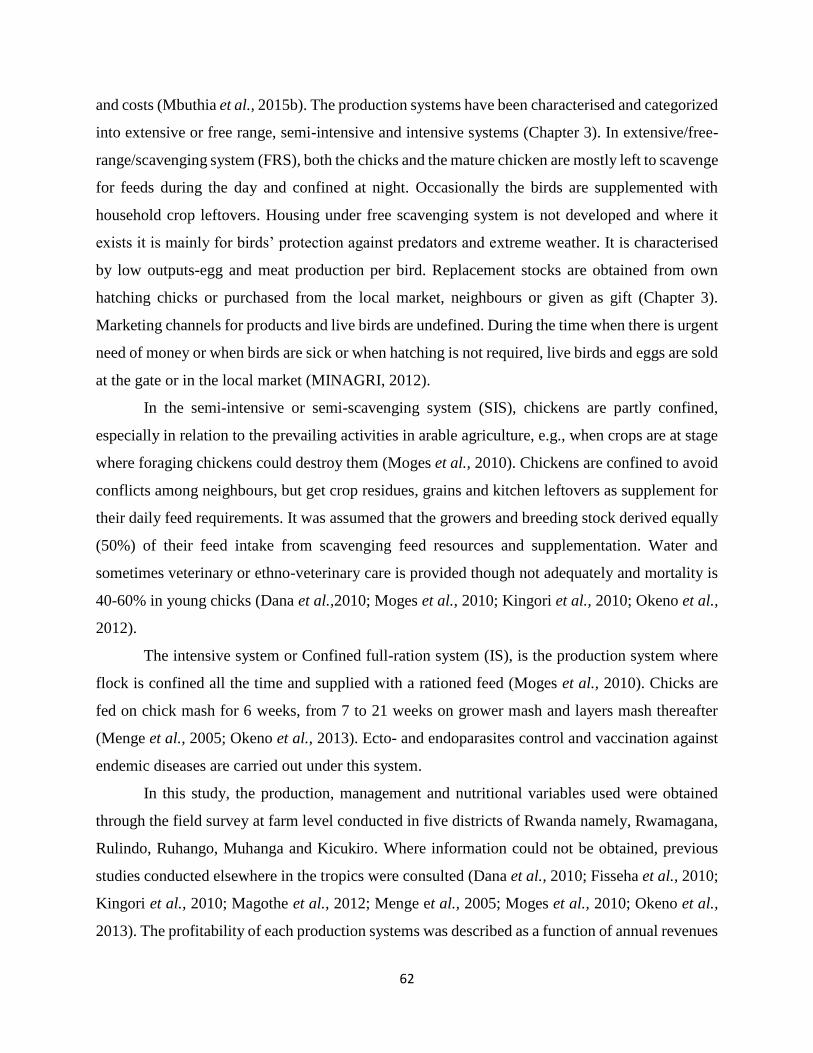
62
and costs (Mbuthia et al., 2015b). The production systems have been characterised and categorized
into extensive or free range, semi-intensive and intensive systems (Chapter 3). In extensive/free-
range/scavenging system (FRS), both the chicks and the mature chicken are mostly left to scavenge
for feeds during the day and confined at night. Occasionally the birds are supplemented with
household crop leftovers. Housing under free scavenging system is not developed and where it
exists it is mainly for birds’ protection against predators and extreme weather. It is characterised
by low outputs-egg and meat production per bird. Replacement stocks are obtained from own
hatching chicks or purchased from the local market, neighbours or given as gift (Chapter 3).
Marketing channels for products and live birds are undefined. During the time when there is urgent
need of money or when birds are sick or when hatching is not required, live birds and eggs are sold
at the gate or in the local market (MINAGRI, 2012).
In the semi-intensive or semi-scavenging system (SIS), chickens are partly confined,
especially in relation to the prevailing activities in arable agriculture, e.g., when crops are at stage
where foraging chickens could destroy them (Moges et al., 2010). Chickens are confined to avoid
conflicts among neighbours, but get crop residues, grains and kitchen leftovers as supplement for
their daily feed requirements. It was assumed that the growers and breeding stock derived equally
(50%) of their feed intake from scavenging feed resources and supplementation. Water and
sometimes veterinary or ethno-veterinary care is provided though not adequately and mortality is
40-60% in young chicks (Dana et al.,2010; Moges et al., 2010; Kingori et al., 2010; Okeno et al.,
2012).
The intensive system or Confined full-ration system (IS), is the production system where
flock is confined all the time and supplied with a rationed feed (Moges et al., 2010). Chicks are
fed on chick mash for 6 weeks, from 7 to 21 weeks on grower mash and layers mash thereafter
(Menge et al., 2005; Okeno et al., 2013). Ecto- and endoparasites control and vaccination against
endemic diseases are carried out under this system.
In this study, the production, management and nutritional variables used were obtained
through the field survey at farm level conducted in five districts of Rwanda namely, Rwamagana,
Rulindo, Ruhango, Muhanga and Kicukiro. Where information could not be obtained, previous
studies conducted elsewhere in the tropics were consulted (Dana et al., 2010; Fisseha et al., 2010;
Kingori et al., 2010; Magothe et al., 2012; Menge et al., 2005; Moges et al., 2010; Okeno et al.,
2013). The profitability of each production systems was described as a function of annual revenues

63
and costs per hen per year and was dependent on the input and output parameters. The main inputs
were feeds, husbandry (i.e. vaccinations, disease treatments, labour etc.) and marketing costs. Sales
of surplus eggs, growers not selected for replacement and culled breeding stock were the main
sources of revenues. These input parameters reflect the actual performances of IC reared under the
three production systems in Rwanda. To simplify the calculations some parameters were assumed
to be the same for all production systems, although this might not be practical because management
and production may differ between the systems. The economic variables were based on the actual
average input and output prices. The prices were in Rwandan Francs (Frw) where US$ 1= Frw
772.7 and Ksh1= Frw 7.64.
5.2.2 Breeding, production and marketing
Flock composition and replacement
The composition by sex of the chicks at day old was assumed to be 1:1. The mating ratio
was assumed to be 1 cock to 5 hens for all production systems, and hens were used to incubate
eggs and brood chicks to weaning. The hens were able to lay 18, 30, 40 eggs per clutch in the FRS,
SIS and IS, respectively. The average number of incubated eggs per hen per clutch was 12 with a
laying cycle of 15 weeks translating to 3 clutches per year (Okeno et al., 2013). In all systems, the
hatching weight was assumed to be 30g. The replacement policy was such that 50% of old stocks
were culled each year and the expected mature weights were 1.87 and 2.22kg for females and
males, respectively (Moges et al., 2010; Magothe et al., 2012; Okeno et al., 2013). The
replacement pullets and cockerels were selected at 21 weeks and surplus cockerels and pullets
were sold off when they reached sexual maturity. Table 14 shows the realistic estimated level of
production variables considered in the model for all production systems.
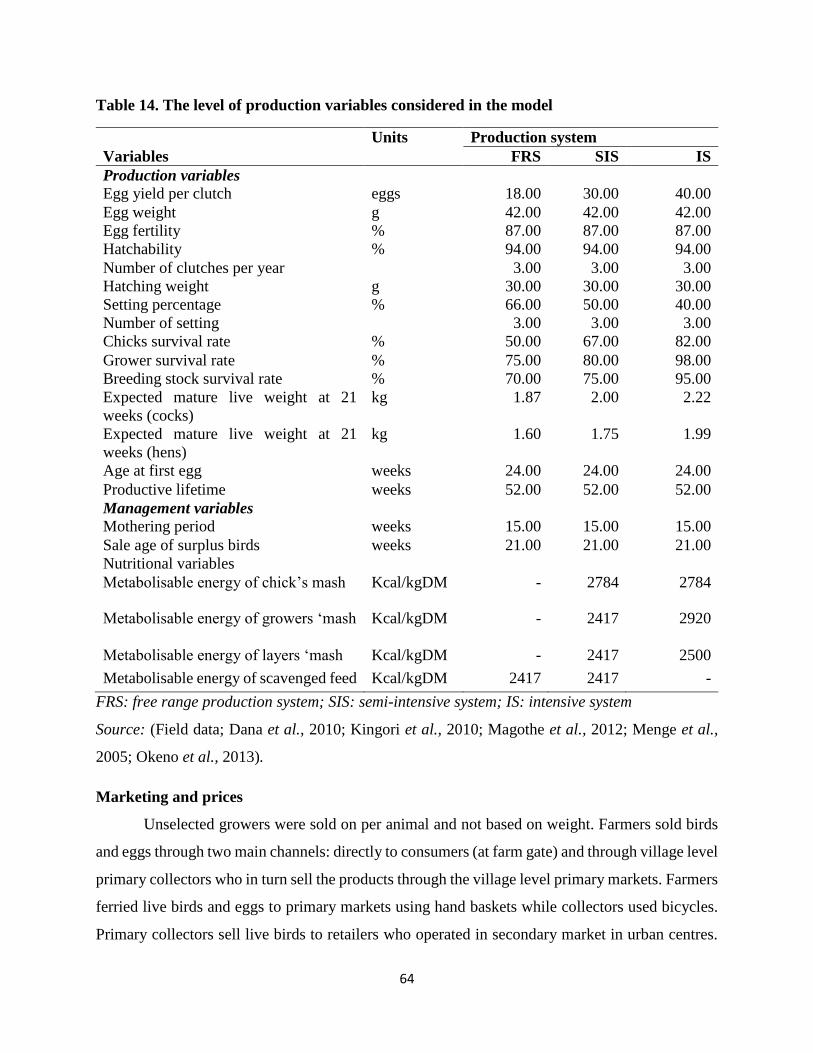
64
Table 14. The level of production variables considered in the model
Units Production system
Variables FRS SIS IS
Production variables
Egg yield per clutch eggs 18.00 30.00 40.00
Egg weight g 42.00 42.00 42.00
Egg fertility % 87.00 87.00 87.00
Hatchability % 94.00 94.00 94.00
Number of clutches per year 3.00 3.00 3.00
Hatching weight
Setting percentage
Number of setting
g
%
30.00
66.00
3.00
30.00
50.00
3.00
30.00
40.00
3.00
Chicks survival rate % 50.00 67.00 82.00
Grower survival rate
Breeding stock survival rate
%
%
75.00
70.00
80.00
75.00
98.00
95.00
Expected mature live weight at 21
weeks (cocks)
kg 1.87 2.00 2.22
Expected mature live weight at 21
weeks (hens)
kg 1.60 1.75 1.99
Age at first egg weeks 24.00 24.00 24.00
Productive lifetime weeks 52.00 52.00 52.00
Management variables
Mothering period weeks 15.00 15.00 15.00
Sale age of surplus birds weeks 21.00 21.00 21.00
Nutritional variables
Metabolisable energy of chick’s mash Kcal/kgDM - 2784 2784
Metabolisable energy of growers ‘mash Kcal/kgDM - 2417 2920
Metabolisable energy of layers ‘mash Kcal/kgDM - 2417 2500
Metabolisable energy of scavenged feed Kcal/kgDM 2417 2417 -
FRS: free range production system; SIS: semi-intensive system; IS: intensive system
Source: (Field data; Dana et al., 2010; Kingori et al., 2010; Magothe et al., 2012; Menge et al.,
2005; Okeno et al., 2013).
Marketing and prices
Unselected growers were sold on per animal and not based on weight. Farmers sold birds
and eggs through two main channels: directly to consumers (at farm gate) and through village level
primary collectors who in turn sell the products through the village level primary markets. Farmers
ferried live birds and eggs to primary markets using hand baskets while collectors used bicycles.
Primary collectors sell live birds to retailers who operated in secondary market in urban centres.
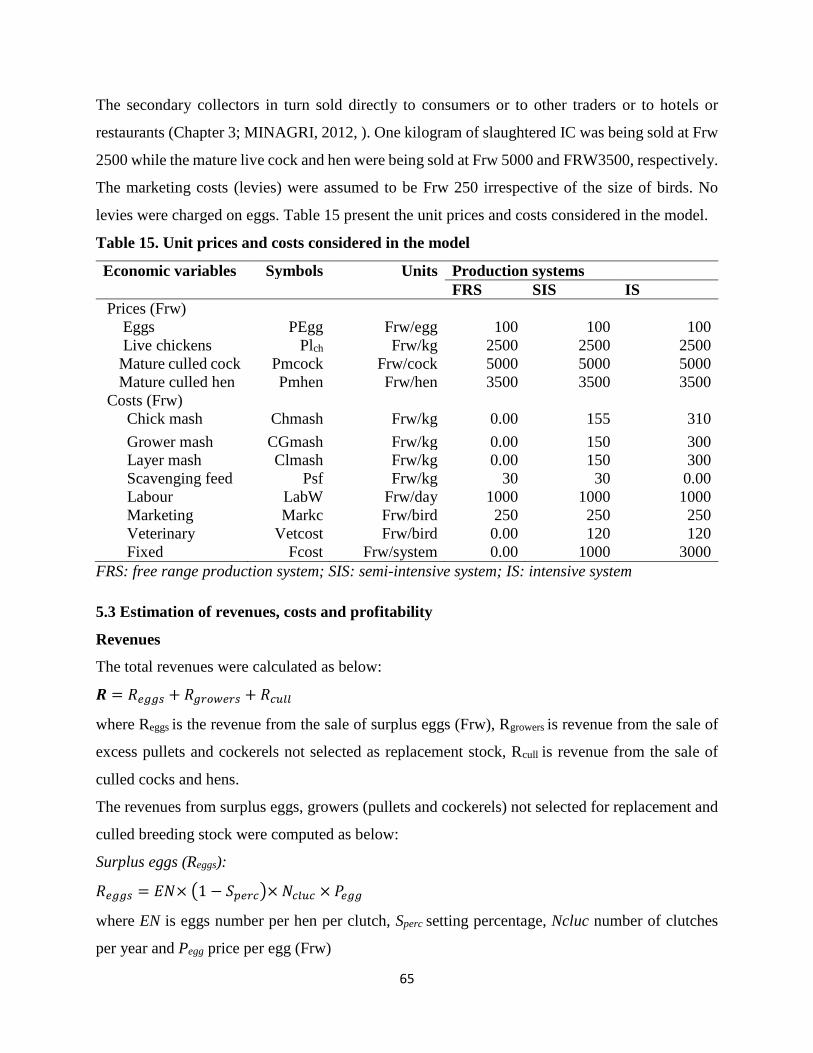
65
The secondary collectors in turn sold directly to consumers or to other traders or to hotels or
restaurants (Chapter 3; MINAGRI, 2012, ). One kilogram of slaughtered IC was being sold at Frw
2500 while the mature live cock and hen were being sold at Frw 5000 and FRW3500, respectively.
The marketing costs (levies) were assumed to be Frw 250 irrespective of the size of birds. No
levies were charged on eggs. Table 15 present the unit prices and costs considered in the model.
Table 15. Unit prices and costs considered in the model
Economic variables Symbols Units Production systems
FRS SIS IS
Prices (Frw)
Eggs PEgg Frw/egg 100 100 100
Live chickens Plch Frw/kg 2500 2500 2500
Mature culled cock Pmcock Frw/cock 5000 5000 5000
Mature culled hen Pmhen Frw/hen 3500 3500 3500
Costs (Frw)
Chick mash Chmash Frw/kg 0.00 155 310
Grower mash CGmash Frw/kg 0.00 150 300
Layer mash Clmash Frw/kg 0.00 150 300
Scavenging feed Psf Frw/kg 30 30 0.00
Labour LabW Frw/day 1000 1000 1000
Marketing Markc Frw/bird 250 250 250
Veterinary Vetcost Frw/bird 0.00 120 120
Fixed Fcost Frw/system 0.00 1000 3000
FRS: free range production system; SIS: semi-intensive system; IS: intensive system
5.3 Estimation of revenues, costs and profitability
Revenues
The total revenues were calculated as below:
𝑹 = 𝑅𝑒𝑔𝑔𝑠 + 𝑅𝑔𝑟𝑜𝑤𝑒𝑟𝑠 + 𝑅𝑐𝑢𝑙𝑙
where Reggs is the revenue from the sale of surplus eggs (Frw), Rgrowers is revenue from the sale of
excess pullets and cockerels not selected as replacement stock, Rcull is revenue from the sale of
culled cocks and hens.
The revenues from surplus eggs, growers (pullets and cockerels) not selected for replacement and
culled breeding stock were computed as below:
Surplus eggs (Reggs):
𝑅𝑒𝑔𝑔𝑠 = 𝐸𝑁× (1 − 𝑆𝑝𝑒𝑟𝑐)× 𝑁𝑐𝑙𝑢𝑐 × 𝑃𝑒𝑔𝑔
where EN is eggs number per hen per clutch, Sperc setting percentage, Ncluc number of clutches
per year and Pegg price per egg (Frw)
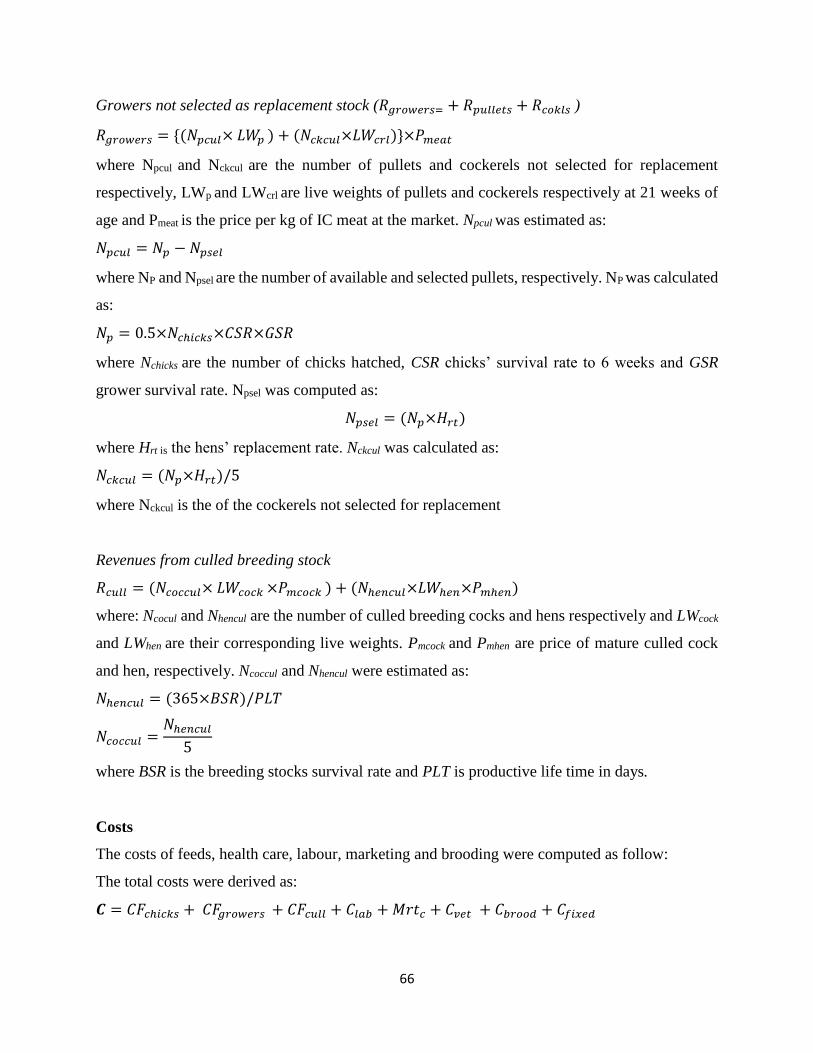
66
Growers not selected as replacement stock (𝑅𝑔𝑟𝑜𝑤𝑒𝑟𝑠= + 𝑅𝑝𝑢𝑙𝑙𝑒𝑡𝑠 + 𝑅𝑐𝑜𝑘𝑙𝑠 )
𝑅𝑔𝑟𝑜𝑤𝑒𝑟𝑠 = {(𝑁𝑝𝑐𝑢𝑙× 𝐿𝑊𝑝 ) + (𝑁𝑐𝑘𝑐𝑢𝑙×𝐿𝑊𝑐𝑟𝑙)}×𝑃𝑚𝑒𝑎𝑡
where Npcul and Nckcul are the number of pullets and cockerels not selected for replacement
respectively, LWp and LWcrl are live weights of pullets and cockerels respectively at 21 weeks of
age and Pmeat is the price per kg of IC meat at the market. Npcul was estimated as:
𝑁𝑝𝑐𝑢𝑙 = 𝑁𝑝 − 𝑁𝑝𝑠𝑒𝑙
where NP and Npsel are the number of available and selected pullets, respectively. NP was calculated
as:
𝑁𝑝 = 0.5×𝑁𝑐ℎ𝑖𝑐𝑘𝑠×𝐶𝑆𝑅×𝐺𝑆𝑅
where Nchicks are the number of chicks hatched, CSR chicks’ survival rate to 6 weeks and GSR
grower survival rate. Npsel was computed as:
𝑁𝑝𝑠𝑒𝑙 = (𝑁𝑝×𝐻𝑟𝑡)
where Hrt is the hens’ replacement rate. Nckcul was calculated as:
𝑁𝑐𝑘𝑐𝑢𝑙 = (𝑁𝑝×𝐻𝑟𝑡)/5
where Nckcul is the of the cockerels not selected for replacement
Revenues from culled breeding stock
𝑅𝑐𝑢𝑙𝑙 = (𝑁𝑐𝑜𝑐𝑐𝑢𝑙× 𝐿𝑊𝑐𝑜𝑐𝑘 ×𝑃𝑚𝑐𝑜𝑐𝑘 ) + (𝑁ℎ𝑒𝑛𝑐𝑢𝑙×𝐿𝑊ℎ𝑒𝑛×𝑃𝑚ℎ𝑒𝑛)
where: Ncocul and Nhencul are the number of culled breeding cocks and hens respectively and LWcock
and LWhen are their corresponding live weights. Pmcock and Pmhen are price of mature culled cock
and hen, respectively. Ncoccul and Nhencul were estimated as:
𝑁ℎ𝑒𝑛𝑐𝑢𝑙 = (365×𝐵𝑆𝑅)/𝑃𝐿𝑇
𝑁𝑐𝑜𝑐𝑐𝑢𝑙 =𝑁ℎ𝑒𝑛𝑐𝑢𝑙
5
where BSR is the breeding stocks survival rate and PLT is productive life time in days.
Costs
The costs of feeds, health care, labour, marketing and brooding were computed as follow:
The total costs were derived as:
𝑪 = 𝐶𝐹𝑐ℎ𝑖𝑐𝑘𝑠 + 𝐶𝐹𝑔𝑟𝑜𝑤𝑒𝑟𝑠 + 𝐶𝐹𝑐𝑢𝑙𝑙 + 𝐶𝑙𝑎𝑏 + 𝑀𝑟𝑡𝑐 + 𝐶𝑣𝑒𝑡 + 𝐶𝑏𝑟𝑜𝑜𝑑 + 𝐶𝑓𝑖𝑥𝑒𝑑
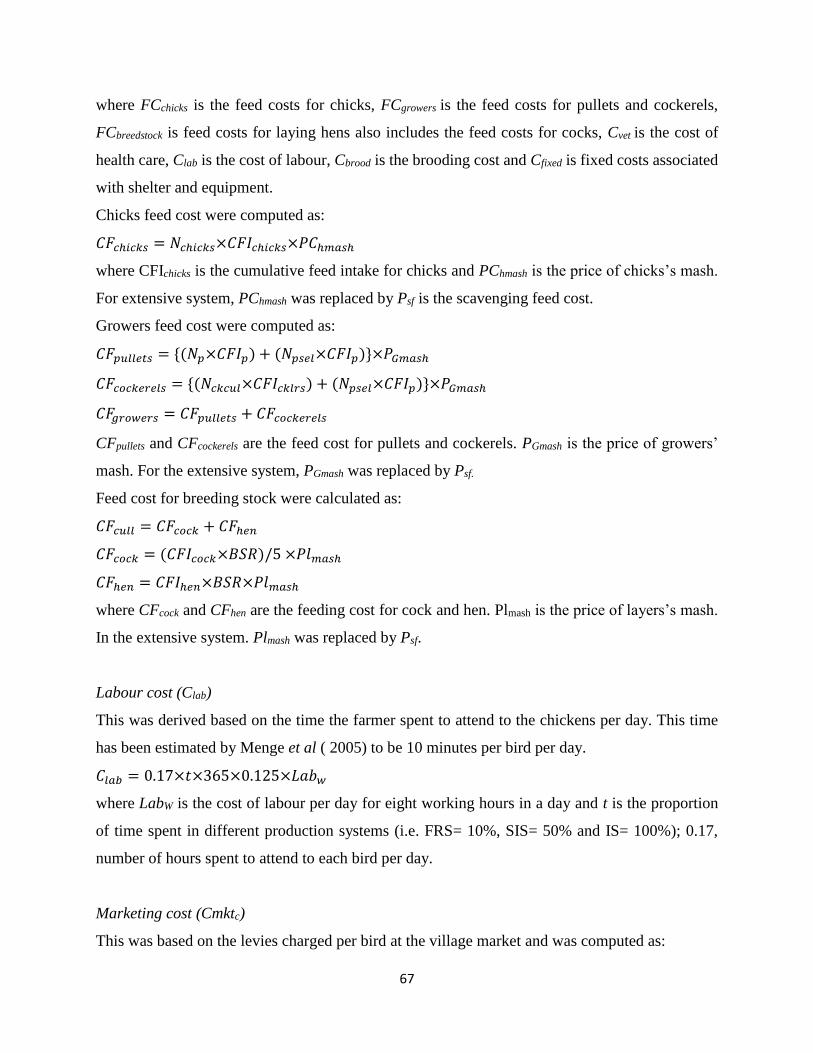
67
where FCchicks is the feed costs for chicks, FCgrowers is the feed costs for pullets and cockerels,
FCbreedstock is feed costs for laying hens also includes the feed costs for cocks, Cvet is the cost of
health care, Clab is the cost of labour, Cbrood is the brooding cost and Cfixed is fixed costs associated
with shelter and equipment.
Chicks feed cost were computed as:
𝐶𝐹𝑐ℎ𝑖𝑐𝑘𝑠 = 𝑁𝑐ℎ𝑖𝑐𝑘𝑠×𝐶𝐹𝐼𝑐ℎ𝑖𝑐𝑘𝑠×𝑃𝐶ℎ𝑚𝑎𝑠ℎ
where CFIchicks is the cumulative feed intake for chicks and PChmash is the price of chicks’s mash.
For extensive system, PChmash was replaced by Psf is the scavenging feed cost.
Growers feed cost were computed as:
𝐶𝐹𝑝𝑢𝑙𝑙𝑒𝑡𝑠 = {(𝑁𝑝×𝐶𝐹𝐼𝑝) + (𝑁𝑝𝑠𝑒𝑙×𝐶𝐹𝐼𝑝)}×𝑃𝐺𝑚𝑎𝑠ℎ
𝐶𝐹𝑐𝑜𝑐𝑘𝑒𝑟𝑒𝑙𝑠 = {(𝑁𝑐𝑘𝑐𝑢𝑙×𝐶𝐹𝐼𝑐𝑘𝑙𝑟𝑠) + (𝑁𝑝𝑠𝑒𝑙×𝐶𝐹𝐼𝑝)}×𝑃𝐺𝑚𝑎𝑠ℎ
𝐶𝐹𝑔𝑟𝑜𝑤𝑒𝑟𝑠 = 𝐶𝐹𝑝𝑢𝑙𝑙𝑒𝑡𝑠 + 𝐶𝐹𝑐𝑜𝑐𝑘𝑒𝑟𝑒𝑙𝑠
CFpullets and CFcockerels are the feed cost for pullets and cockerels. PGmash is the price of growers’
mash. For the extensive system, PGmash was replaced by Psf.
Feed cost for breeding stock were calculated as:
𝐶𝐹𝑐𝑢𝑙𝑙 = 𝐶𝐹𝑐𝑜𝑐𝑘 + 𝐶𝐹ℎ𝑒𝑛
𝐶𝐹𝑐𝑜𝑐𝑘 = (𝐶𝐹𝐼𝑐𝑜𝑐𝑘×𝐵𝑆𝑅)/5 ×𝑃𝑙𝑚𝑎𝑠ℎ
𝐶𝐹ℎ𝑒𝑛 = 𝐶𝐹𝐼ℎ𝑒𝑛×𝐵𝑆𝑅×𝑃𝑙𝑚𝑎𝑠ℎ
where CFcock and CFhen are the feeding cost for cock and hen. Plmash is the price of layers’s mash.
In the extensive system. Plmash was replaced by Psf.
Labour cost (Clab)
This was derived based on the time the farmer spent to attend to the chickens per day. This time
has been estimated by Menge et al ( 2005) to be 10 minutes per bird per day.
𝐶𝑙𝑎𝑏 = 0.17×𝑡×365×0.125×𝐿𝑎𝑏𝑤
where LabW is the cost of labour per day for eight working hours in a day and t is the proportion
of time spent in different production systems (i.e. FRS= 10%, SIS= 50% and IS= 100%); 0.17,
number of hours spent to attend to each bird per day.
Marketing cost (Cmktc)
This was based on the levies charged per bird at the village market and was computed as:
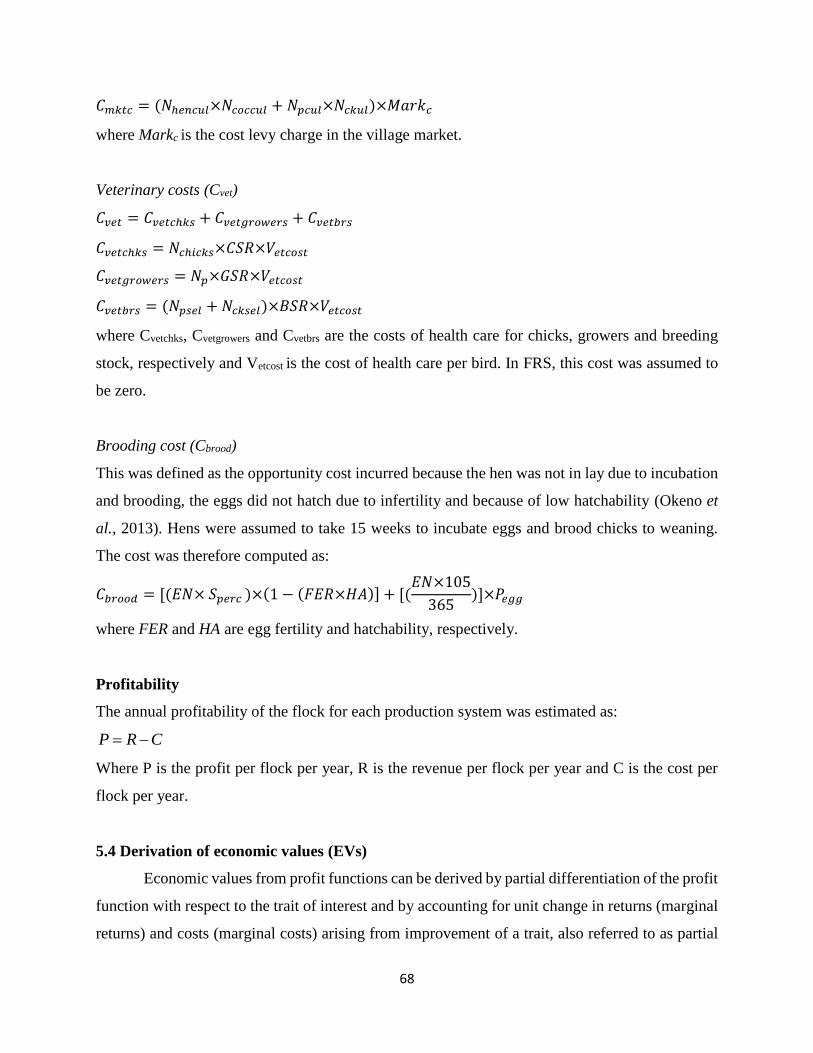
68
𝐶𝑚𝑘𝑡𝑐 = (𝑁ℎ𝑒𝑛𝑐𝑢𝑙×𝑁𝑐𝑜𝑐𝑐𝑢𝑙 + 𝑁𝑝𝑐𝑢𝑙×𝑁𝑐𝑘𝑢𝑙)×𝑀𝑎𝑟𝑘𝑐
where Markc is the cost levy charge in the village market.
Veterinary costs (Cvet)
𝐶𝑣𝑒𝑡 = 𝐶𝑣𝑒𝑡𝑐ℎ𝑘𝑠 + 𝐶𝑣𝑒𝑡𝑔𝑟𝑜𝑤𝑒𝑟𝑠 + 𝐶𝑣𝑒𝑡𝑏𝑟𝑠
𝐶𝑣𝑒𝑡𝑐ℎ𝑘𝑠 = 𝑁𝑐ℎ𝑖𝑐𝑘𝑠×𝐶𝑆𝑅×𝑉𝑒𝑡𝑐𝑜𝑠𝑡
𝐶𝑣𝑒𝑡𝑔𝑟𝑜𝑤𝑒𝑟𝑠 = 𝑁𝑝×𝐺𝑆𝑅×𝑉𝑒𝑡𝑐𝑜𝑠𝑡
𝐶𝑣𝑒𝑡𝑏𝑟𝑠 = (𝑁𝑝𝑠𝑒𝑙 + 𝑁𝑐𝑘𝑠𝑒𝑙)×𝐵𝑆𝑅×𝑉𝑒𝑡𝑐𝑜𝑠𝑡
where Cvetchks, Cvetgrowers and Cvetbrs are the costs of health care for chicks, growers and breeding
stock, respectively and Vetcost is the cost of health care per bird. In FRS, this cost was assumed to
be zero.
Brooding cost (Cbrood)
This was defined as the opportunity cost incurred because the hen was not in lay due to incubation
and brooding, the eggs did not hatch due to infertility and because of low hatchability (Okeno et
al., 2013). Hens were assumed to take 15 weeks to incubate eggs and brood chicks to weaning.
The cost was therefore computed as:
𝐶𝑏𝑟𝑜𝑜𝑑 = [(𝐸𝑁× 𝑆𝑝𝑒𝑟𝑐 )×(1 − (𝐹𝐸𝑅×𝐻𝐴)] + [(𝐸𝑁×105
365)]×𝑃𝑒𝑔𝑔
where FER and HA are egg fertility and hatchability, respectively.
Profitability
The annual profitability of the flock for each production system was estimated as:
Where P is the profit per flock per year, R is the revenue per flock per year and C is the cost per
flock per year.
5.4 Derivation of economic values (EVs)
Economic values from profit functions can be derived by partial differentiation of the profit
function with respect to the trait of interest and by accounting for unit change in returns (marginal
returns) and costs (marginal costs) arising from improvement of a trait, also referred to as partial
CRP
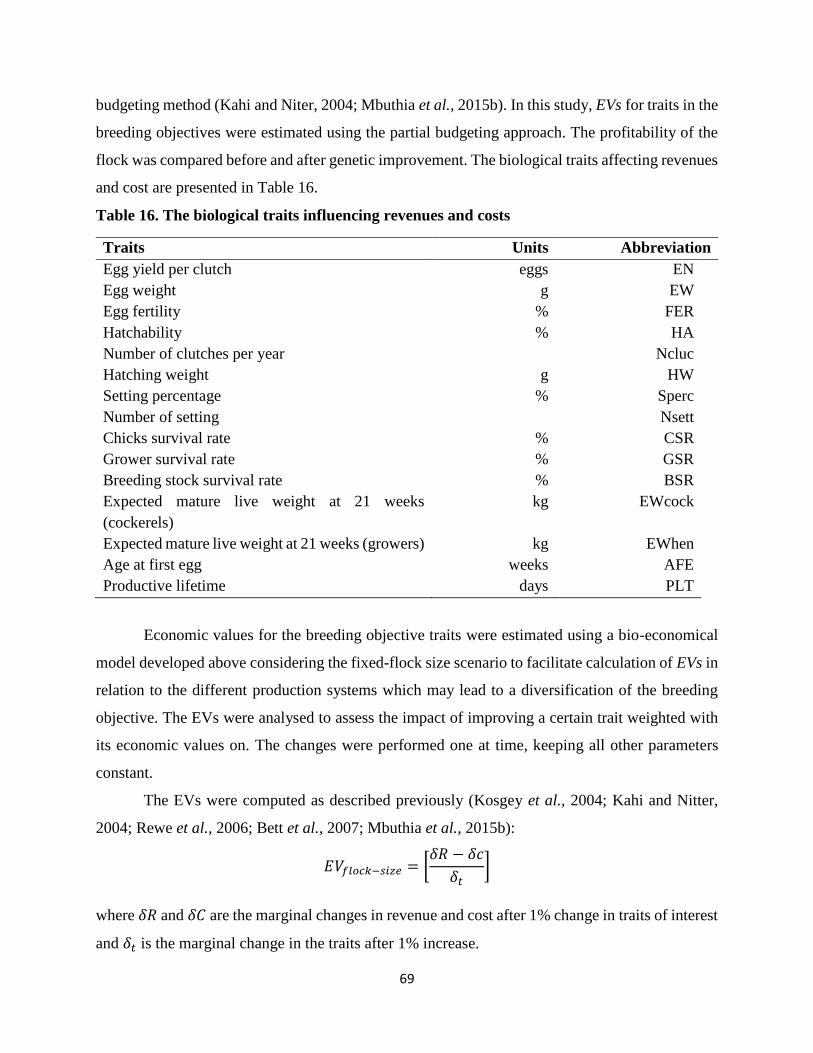
69
budgeting method (Kahi and Niter, 2004; Mbuthia et al., 2015b). In this study, EVs for traits in the
breeding objectives were estimated using the partial budgeting approach. The profitability of the
flock was compared before and after genetic improvement. The biological traits affecting revenues
and cost are presented in Table 16.
Table 16. The biological traits influencing revenues and costs
Traits Units Abbreviation
Egg yield per clutch eggs EN
Egg weight g EW
Egg fertility % FER
Hatchability % HA
Number of clutches per year Ncluc
Hatching weight
Setting percentage
Number of setting
g
%
HW
Sperc
Nsett
Chicks survival rate % CSR
Grower survival rate
Breeding stock survival rate
%
%
GSR
BSR
Expected mature live weight at 21 weeks
(cockerels)
kg EWcock
Expected mature live weight at 21 weeks (growers) kg EWhen
Age at first egg weeks AFE
Productive lifetime days PLT
Economic values for the breeding objective traits were estimated using a bio-economical
model developed above considering the fixed-flock size scenario to facilitate calculation of EVs in
relation to the different production systems which may lead to a diversification of the breeding
objective. The EVs were analysed to assess the impact of improving a certain trait weighted with
its economic values on. The changes were performed one at time, keeping all other parameters
constant.
The EVs were computed as described previously (Kosgey et al., 2004; Kahi and Nitter,
2004; Rewe et al., 2006; Bett et al., 2007; Mbuthia et al., 2015b):
𝐸𝑉𝑓𝑙𝑜𝑐𝑘−𝑠𝑖𝑧𝑒 = [𝛿𝑅 − 𝛿𝑐
𝛿𝑡]
where 𝛿𝑅 and 𝛿𝐶 are the marginal changes in revenue and cost after 1% change in traits of interest
and 𝛿𝑡 is the marginal change in the traits after 1% increase.
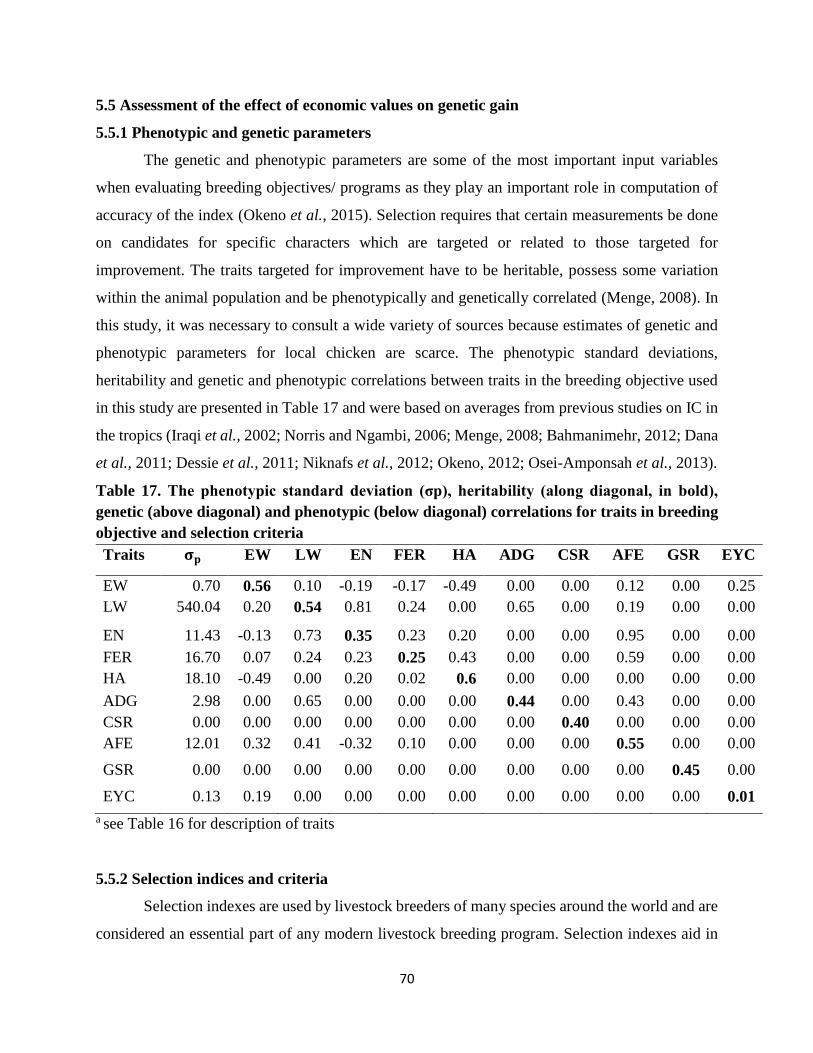
70
5.5 Assessment of the effect of economic values on genetic gain
5.5.1 Phenotypic and genetic parameters
The genetic and phenotypic parameters are some of the most important input variables
when evaluating breeding objectives/ programs as they play an important role in computation of
accuracy of the index (Okeno et al., 2015). Selection requires that certain measurements be done
on candidates for specific characters which are targeted or related to those targeted for
improvement. The traits targeted for improvement have to be heritable, possess some variation
within the animal population and be phenotypically and genetically correlated (Menge, 2008). In
this study, it was necessary to consult a wide variety of sources because estimates of genetic and
phenotypic parameters for local chicken are scarce. The phenotypic standard deviations,
heritability and genetic and phenotypic correlations between traits in the breeding objective used
in this study are presented in Table 17 and were based on averages from previous studies on IC in
the tropics (Iraqi et al., 2002; Norris and Ngambi, 2006; Menge, 2008; Bahmanimehr, 2012; Dana
et al., 2011; Dessie et al., 2011; Niknafs et al., 2012; Okeno, 2012; Osei-Amponsah et al., 2013).
Table 17. The phenotypic standard deviation (σp), heritability (along diagonal, in bold),
genetic (above diagonal) and phenotypic (below diagonal) correlations for traits in breeding
objective and selection criteria
Traits 𝛔𝐩 EW LW EN FER HA ADG CSR AFE GSR EYC
EW 0.70 0.56 0.10 -0.19 -0.17 -0.49 0.00 0.00 0.12 0.00 0.25
LW 540.04 0.20 0.54 0.81 0.24 0.00 0.65 0.00 0.19 0.00 0.00
EN 11.43 -0.13 0.73 0.35 0.23 0.20 0.00 0.00 0.95 0.00 0.00
FER 16.70 0.07 0.24 0.23 0.25 0.43 0.00 0.00 0.59 0.00 0.00
HA 18.10 -0.49 0.00 0.20 0.02 0.6 0.00 0.00 0.00 0.00 0.00
ADG 2.98 0.00 0.65 0.00 0.00 0.00 0.44 0.00 0.43 0.00 0.00
CSR 0.00 0.00 0.00 0.00 0.00 0.00 0.00 0.40 0.00 0.00 0.00
AFE 12.01 0.32 0.41 -0.32 0.10 0.00 0.00 0.00 0.55 0.00 0.00
GSR 0.00 0.00 0.00 0.00 0.00 0.00 0.00 0.00 0.00 0.45 0.00
EYC 0.13 0.19 0.00 0.00 0.00 0.00 0.00 0.00 0.00 0.00 0.01
a see Table 16 for description of traits
5.5.2 Selection indices and criteria
Selection indexes are used by livestock breeders of many species around the world and are
considered an essential part of any modern livestock breeding program. Selection indexes aid in
71
the selection of animals for use within a breeding programme where there are several traits of
economic or functional importance by providing an overall score of an animal’s genetic value.
Selection indexes are calculated for a specific breeding purpose and are calculated based on
weightings placed on individual traits that are deemed to be important for that purpose.
In the current study, the breeding objective based on marketable end products was therefore
considered. The breeding objective was to produce dual-purpose IC for both egg and meat
production. The breeding goal traits consisted of EN, FER, HA, CSR, GSR, BSR, LWg, LWcock
and LWhen. The traits considered in selection index were egg number (EN) after the first clutch,
live weight at end of first clutch (LWhen), age at first egg (AFE) and average daily gain (ADG).
Selection for females was assumed to occur at the end of first clutch. Males were selected at 8
weeks. Hens were selected based on individual information on EN, LW, AFE and ADG and
information on their dams. The males were selected based on their LW at 8 weeks and on
information on EN, LW, AFE and ADG on their dams and sisters.
One major advantage of selection indexes is that genetic values of the traits can be weighted
by their relative economic value. In the current study where selection is for several traits at a time,
the economic values are used as weights (Hazel et al., 1994). The genetic response (GR) for traits
in the breeding objective was defined as genetic superiority for each trait (j) achieved after one
round of selection assuming selection intensity of one. It was estimated as:
𝐺𝑅𝑗 = (ⅈ𝑏′𝐺
𝜎𝑡)
where i is the selection intensity, b the index weights, G variance-covariance matrix between traits
in the index and the breeding objective and 𝜎𝑡 the standard deviation of the index.
The b was derived as follows:
𝑏 = 𝑃−1𝐺𝑎
where b is a vector of the selection coefficients of the index traits, P-1 is inverse of the phenotypic
variance-covariance matrix of the characters in the selection index and a the vector of economic
values of the traits in the breeding objective in Rwandese francs (Frw).
The economic response (ER, Frw) for traits in the breeding goal was defined as the sum of GR for
all traits in the breeding goal, each weighted by its economic value. The ER after one round of
selection was calculated using the equation:
72
𝐸𝑅𝑗 = ∑(𝐺𝑅𝑗 𝑋 𝐸𝑉𝑗)
𝑗
𝑖=1
where EVj is the economic values for trait j.
5.6 Results and discussion
5.6.1 General bio-economic model
The model developed simulated the revenues, costs and profitability of different classes of
IC under the different production systems evaluated which may be very difficult to collect in field
conditions. It was not possible to validate the profit models by comparing estimated values with
actual observations from experimental results but the simulated outputs were checked to determine
whether they were reasonable or not. The values obtained for each production system depended
on the flock structure used since the three production systems had different flock composition. The
revenues, costs and profit are presented in Table 18. Generally, the revenues and costs were higher
in IS than in both SIS and FRS production systems. The results show that the sales of surplus
growers (pullets and cockerels), culled hens and surplus eggs had a positive impact on profitability
of the three production systems.
The sales of surplus growers accounted for 83.7, 83.23 and 82.57% of the total revenues in
IS, FRS and SIS operations, respectively. The simulated revenues obtained in this study were in
agreement with those reported by Okeno et al. (2013) in Kenya where surplus growers accounted
for 74.45, 67.00 and 58.32 % of the total revenues in FRS, SIS and IS, respectively. Sales of culled
hens and cocks contributed to revenues in all production systems (9.85% in FRS, 6.95% in SIS
and 6.14% in IS) indicating that culled hens and cocks are important sources of revenue in all
production systems. Eggs contributed 10.48, 10.13 and 6.92 % of the total revenues in SIS, IS and
FRS indicating that egg production traits are also important in these production systems. This could
be due to the fact that the number of setting and eggs setting percentage used as input in the model
was higher indicating the need for chicks by farmers. The revenues from sales of surplus eggs
obtained from the model were comparable to those reported by Menge et al. (2005).
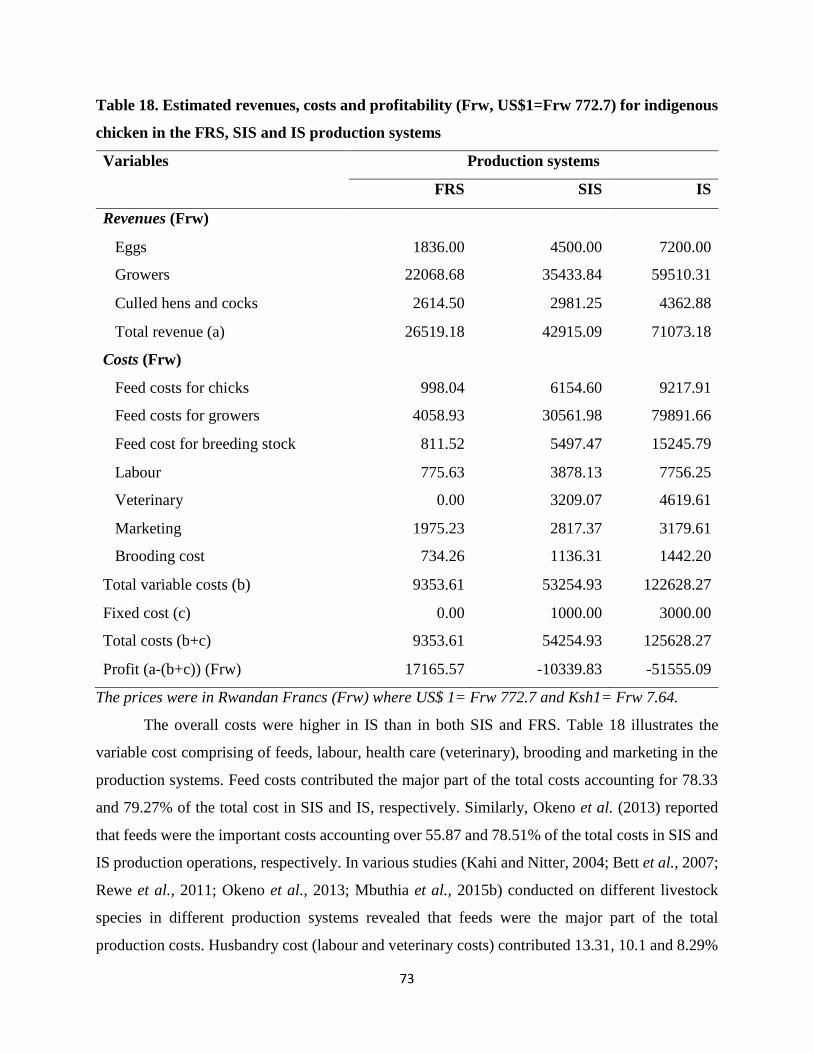
73
Table 18. Estimated revenues, costs and profitability (Frw, US$1=Frw 772.7) for indigenous
chicken in the FRS, SIS and IS production systems
Variables Production systems
FRS SIS IS
Revenues (Frw)
Eggs 1836.00 4500.00 7200.00
Growers 22068.68 35433.84 59510.31
Culled hens and cocks 2614.50 2981.25 4362.88
Total revenue (a) 26519.18 42915.09 71073.18
Costs (Frw)
Feed costs for chicks 998.04 6154.60 9217.91
Feed costs for growers 4058.93 30561.98 79891.66
Feed cost for breeding stock 811.52 5497.47 15245.79
Labour 775.63 3878.13 7756.25
Veterinary 0.00 3209.07 4619.61
Marketing
Brooding cost
1975.23
734.26
2817.37
1136.31
3179.61
1442.20
Total variable costs (b) 9353.61 53254.93 122628.27
Fixed cost (c) 0.00 1000.00 3000.00
Total costs (b+c) 9353.61 54254.93 125628.27
Profit (a-(b+c)) (Frw) 17165.57 -10339.83 -51555.09
The prices were in Rwandan Francs (Frw) where US$ 1= Frw 772.7 and Ksh1= Frw 7.64.
The overall costs were higher in IS than in both SIS and FRS. Table 18 illustrates the
variable cost comprising of feeds, labour, health care (veterinary), brooding and marketing in the
production systems. Feed costs contributed the major part of the total costs accounting for 78.33
and 79.27% of the total cost in SIS and IS, respectively. Similarly, Okeno et al. (2013) reported
that feeds were the important costs accounting over 55.87 and 78.51% of the total costs in SIS and
IS production operations, respectively. In various studies (Kahi and Nitter, 2004; Bett et al., 2007;
Rewe et al., 2011; Okeno et al., 2013; Mbuthia et al., 2015b) conducted on different livestock
species in different production systems revealed that feeds were the major part of the total
production costs. Husbandry cost (labour and veterinary costs) contributed 13.31, 10.1 and 8.29%
74
of the total production cost in SIS, IS and FRS operation systems, respectively, followed by
marketing and brooding costs. The levy cost was fixed at the village market irrespective of the size
of the chicken. The opportunity cost for using broody hens to incubate eggs and brooding chicks
to weaning contributed the least to total production costs (Table 18). This is in contrast to what
was reported by Okeno et al. (2013) that the marketing costs contributed the least to total
production costs. The simulated results also agrees with those reported in Kenya by Menge et al.
(2005) that labour contributed significantly to the total costs in all systems (34.91% in IS, 52.92%
in SIS and 28.12% in FRS).
The brooding cost can be minimised by allowing the hens to incubate the eggs up to
hatching then raising the chicks artificially because such practices have been found to increase egg
production and number of clutches per hen per year and reduce chick’s mortality Kugonza et al.
(2012) and Okeno et al. (2013). The inclusions of family labour and marketing costs in bio-
economical models in this study resulted to increased cost of production. This is in agreement with
previous studies (Bett et al., 2011; Okeno et al., 2013; Mbuthia et al., 2015b) who reported that
inclusions of family labour costs in the models results to inflate costs.
Profits were simulated by subtracting the total production cost including fixed costs from
total revenues. The use of IC was the most profitable in FRS and not in SIS and IS operation
systems (Table 18). The profitability of FRS could be explained by low input costs as feeds. Even
though, it is difficult to quantify the cost of scavenging feed resources, ignoring such costs leads
to overestimation of profitability (Menge et al., 2005; Okeno et al., 2013). The other major sources
of variation may be due to fixed and veterinary costs which were set to zero in FRS. The
profitability of FRS over other production systems agrees with the reports by Menge et al. (2005)
but contradicts the negative profitability for SIS reported by (Okeno et al., 2013). This might be
attributed to the difference in terms of parameters used in the model as in SIS commercial feeds
and scavenging feeds accounted equally 50% of feeds used in this system.
The profitability obtained in this study revealed that chicken can be utilised in FRS and
can lead to increased smallholder poultry production income. Although SIS and IS showed
negative profitability, they cannot be overlooked as transition from subsistence to commercial
production requires that management levels get better as the genetic potential of the birds is also
improved. The FRS has been described as a low input system compared to the SIS and IS which
75
require high capital investment in terms of feeds, healthcare, housing and labour (Dana et al., 2010;
Kingori et al., 2010; Akinola and Essien, 2011; Magothe et al., 2012).
The cost of feeds observed in IS and SIS systems can be reduced by exploring other locally
available feed sources for chicken such as drought-tolerant cereals or the possibility of harnessing
insects such as termites which are abundantly available during dry seasons when cereals are scarce.
This will not only reduce the cost of production but also will improve productivity hence increased
profitability (Okeno et al., 2012).
In Rwanda, like other developing countries with increased population and less acreage of
land, there is need of shifting from substance to commercial production systems. This requires
utilisation of IC under SIS and IS systems. This calls for developing the simple, applicable and
affordable technologies such as use of hand woven baskets to protect birds against predators,
constructions of simple chickens’ house, vaccination programs and formulation of chicken feeds
using the locally available feed stuffs. Such practices will result to increased flock size, reduction
of conflicts between households due to crop destruction by chickens and increased profitability.
However, these strategies should not only focus on increasing IC productivity but there is, also a
need to consider marketers and consumer preferences.
5.6.2 Estimation of economic values (EVs)
The economic values were estimated using traditional bio-economic model. The EVs for
traits in the breeding objectives for the three production systems under fixed flock size production
conditions are presented in Table 19. Generally, economic values were higher under FRS than in
both SIS and IS (Table 19). Economic values for traits such as egg yield, fertility rate, hatchability
rate, chicks’ survival rate, growers’ survival rate, brooding stock survival rate, live weight for
pullets, cocks and hens in FRS were all positive. There was a decrease in EVs as level
intensification increased (Table 19).
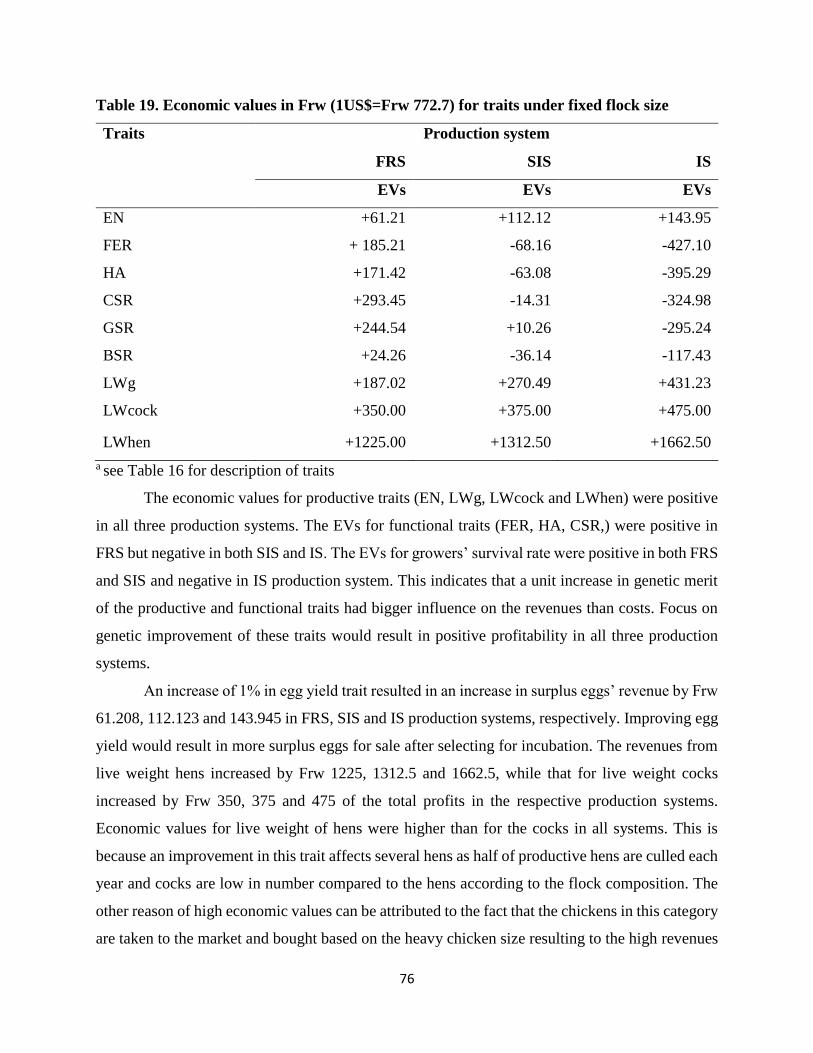
76
Table 19. Economic values in Frw (1US$=Frw 772.7) for traits under fixed flock size
Traits Production system
FRS SIS IS
EVs EVs EVs
EN +61.21 +112.12 +143.95
FER + 185.21 -68.16 -427.10
HA +171.42 -63.08 -395.29
CSR +293.45 -14.31 -324.98
GSR +244.54 +10.26 -295.24
BSR +24.26 -36.14 -117.43
LWg +187.02 +270.49 +431.23
LWcock +350.00 +375.00 +475.00
LWhen +1225.00 +1312.50 +1662.50
a see Table 16 for description of traits
The economic values for productive traits (EN, LWg, LWcock and LWhen) were positive
in all three production systems. The EVs for functional traits (FER, HA, CSR,) were positive in
FRS but negative in both SIS and IS. The EVs for growers’ survival rate were positive in both FRS
and SIS and negative in IS production system. This indicates that a unit increase in genetic merit
of the productive and functional traits had bigger influence on the revenues than costs. Focus on
genetic improvement of these traits would result in positive profitability in all three production
systems.
An increase of 1% in egg yield trait resulted in an increase in surplus eggs’ revenue by Frw
61.208, 112.123 and 143.945 in FRS, SIS and IS production systems, respectively. Improving egg
yield would result in more surplus eggs for sale after selecting for incubation. The revenues from
live weight hens increased by Frw 1225, 1312.5 and 1662.5, while that for live weight cocks
increased by Frw 350, 375 and 475 of the total profits in the respective production systems.
Economic values for live weight of hens were higher than for the cocks in all systems. This is
because an improvement in this trait affects several hens as half of productive hens are culled each
year and cocks are low in number compared to the hens according to the flock composition. The
other reason of high economic values can be attributed to the fact that the chickens in this category
are taken to the market and bought based on the heavy chicken size resulting to the high revenues
77
compared to grower chickens which have moderate body size. Okeno et al. (2012) reported that
these traits had direct impact on the profitability of the production systems and indicated that their
improvement would be economically beneficial to the producers. However, improving live weight
would result in increased costs as a result of increased feed consumption by mature chickens in
SIS and IS systems.
In the current study, grower chickens are the major contributor to revenue. From the bio-
economic model, an increase of 1% in LWg resulted in a profit of Frw 187.023, 270.487 and
431.234 in free range, semi-intensive and intensive systems, respectively. This implies that
increase LWg not selected for replacement have great effect on the revenues. The economic values
for fertility and hatchability rate were positive for FRS and negative for both SIS and IS production
systems. By increasing the Fer and HA by 1%, profit increased by Frw 185.207 and 171.415 in
FRS, respectively. The negative economic values observed in SIS and IS implies that an increase
1% in FER and HA will result in an increase in the number of chicks which will directly increase
the cost of feeds for chicks in SIS and IS production systems. The positive economic values for
FER and HA obtained in this study agree with those reported by Okeno et al. (2013). Positive
economic values for fertility has also been reported in pigs (Mbuthia et al., 2015a) and in goats
(Bett et al., 2011).
An increase in profit for both CSR, GSR and BSR traits were observed in FRS production
system. These traits influenced profit negatively in SIS and IS. This might be due to the fact that
the improvement in survival traits exerts changes in flock composition rather than in individual
performance. Therefore, the larger the flock size, the more production costs thus low profitability
of these systems. However, survival traits are important in the tropics where prevailing conditions
are characterized by disease challenges, poor nutrition and heat stress (Mbuthia et al., 2015b).
In general, the positive economic values obtained in FRS compared to SIS and IS
production systems could be explained by the low cost of production (Table 19). The findings
concur with studies by Menge et al. (2005) and Okeno et al. (2012) which reported that economic
values were large in FRS compared to SIS and IS. This implies also that improved indigenous
chicken would be more profitable if raised under free range production systems. Meat quality, egg
size, combo colour, egg yolk drought tolerance and diseases resistance perceived by farmers were
not included in the model because it was difficult to measure these attributes.
78
5.6.3 Effect of economic values on genetic gain
The influence of economic values on genetic improvement was assessed by comparing the
genetic gain achieved in the breeding objective. The economic values, economic response and
accuracy to selection assuming different production systems when EN, LW, AFE, FER and HA
were considered are presented in Table 20. Generally, the economic response for reproduction
traits (AFE, FER and HA) where lower compared to the economic response for production traits
(EN, and LW) in all production systems. The selection accuracy was almost uniform and high
across all traits selection in all production systems. The increase of inbreeding rate was 0.152%
per generation. This might be attributed to the chicken population size (1000 females and 200
males), intensity of selection of males and female candidates (10% of male and 25 % of females)
and relationship information used when simulating the genetic gain and economic response. There
was a slight difference in overall response between FRS, SIS and IS production systems. However,
the economic response for production traits in IS was highest compared to economic response for
FRS and SIS (Table 20). This might be due to the better management practices applied in IS
production system. Therefore, the large positive economic values obtained in IS should be
assumed. Improvement in genetic merit should be advantageous for the improved IC (Menge,
2008).
In FRS and SIS, FER and HA had a smaller economic impact than production traits. The
negative economic response obtained when selection was focused on FER could be due to large
negative economic value for FER obtained in this study which resulted in loss in economic
response (ER) (Table 20). This in agreement with the results reported by Menge (2008) that CSR,
HA and FER contributed minimally to economic response in all the production systems. Selection
targeting improvement of LW resulted in economic response of Frw 23416.85, Frw 2495.06 and
Frw 3106.44 for FRS, SIS and IS production systems, respectively. On the other hand, selection
relative to EN resulted in positive economic values for Frw 96.87, Frw 179.78 and Frw 229.96 in
FRS, SIS and IS, respectively. The economic response obtained for LW and EN imply that genetic
improvement targeting selection of the production traits will have a positive impact on profitability
of the IC kept in all three production systems. The predicted genetic superiority for LW and EN
traits showed that farmers whose emphasis is to increase LW for meat production will have more
profit than farmers emphasizing on eggs production (Table 20). Although the IC birds are kept in
a dual-purpose role, more is to be gained from meat than eggs. Therefore, the study suggests that
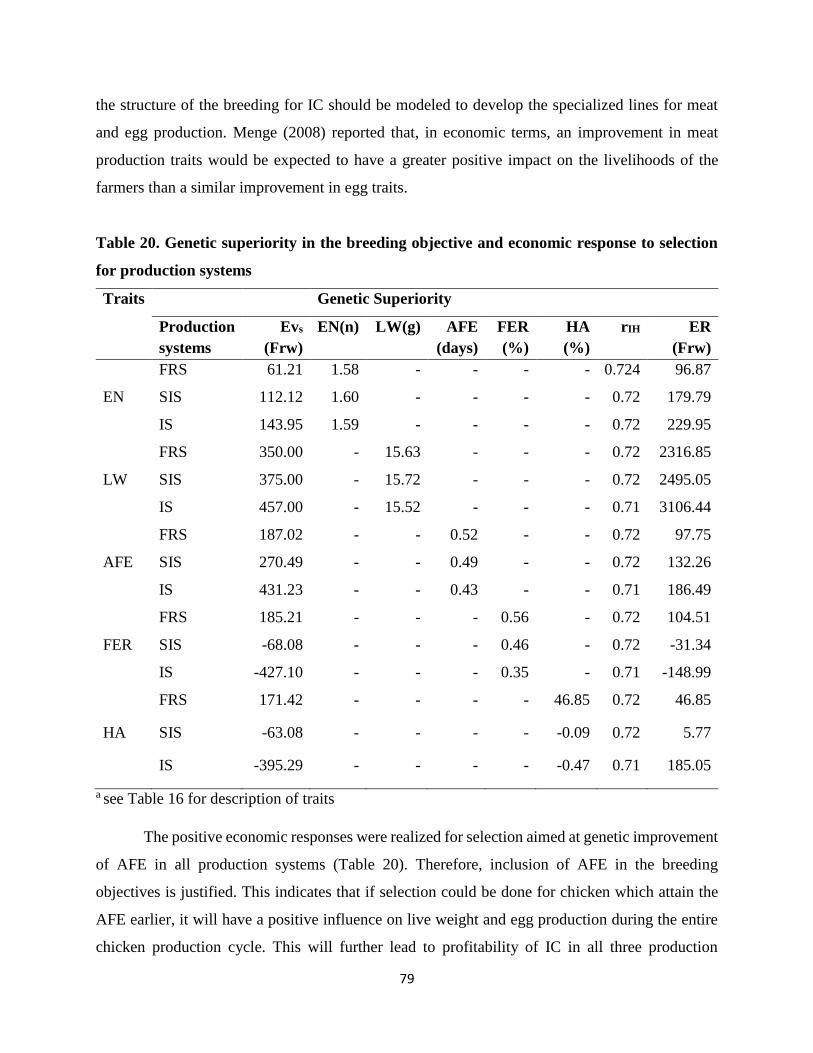
79
the structure of the breeding for IC should be modeled to develop the specialized lines for meat
and egg production. Menge (2008) reported that, in economic terms, an improvement in meat
production traits would be expected to have a greater positive impact on the livelihoods of the
farmers than a similar improvement in egg traits.
Table 20. Genetic superiority in the breeding objective and economic response to selection
for production systems
Traits Genetic Superiority
Production
systems
Evs
(Frw)
EN(n) LW(g) AFE
(days)
FER
(%)
HA
(%)
rIH ER
(Frw)
FRS 61.21 1.58 - - - - 0.724 96.87
EN SIS 112.12 1.60 - - - - 0.72 179.79
IS 143.95 1.59 - - - - 0.72 229.95
FRS 350.00 - 15.63 - - - 0.72 2316.85
LW SIS 375.00 - 15.72 - - - 0.72 2495.05
IS 457.00 - 15.52 - - - 0.71 3106.44
FRS 187.02 - - 0.52 - - 0.72 97.75
AFE SIS 270.49 - - 0.49 - - 0.72 132.26
IS 431.23 - - 0.43 - - 0.71 186.49
FRS 185.21 - - - 0.56 - 0.72 104.51
FER SIS -68.08 - - - 0.46 - 0.72 -31.34
IS -427.10 - - - 0.35 - 0.71 -148.99
FRS 171.42 - - - - 46.85 0.72 46.85
HA SIS -63.08 - - - - -0.09 0.72 5.77
IS -395.29 - - - - -0.47 0.71 185.05
a see Table 16 for description of traits
The positive economic responses were realized for selection aimed at genetic improvement
of AFE in all production systems (Table 20). Therefore, inclusion of AFE in the breeding
objectives is justified. This indicates that if selection could be done for chicken which attain the
AFE earlier, it will have a positive influence on live weight and egg production during the entire
chicken production cycle. This will further lead to profitability of IC in all three production
80
systems. The results of this study are not in agreement with the previous study by Menge (2008)
who reported that genetic improvement of AFE will have a negative impact on profitability in all
production systems.
In general, the study demonstrated the feasibility of incorporating productive and
reproductive traits in the breeding goals. There were relationships between the economic values
and genetic gain in the breeding goals traits, which is an indicator of positive impact of the
magnitude of economic values of traits of IC. Even though traits like FER and HA had lower to
negative genetic superiority than LW and EN, they should be considered in the breeding program
because it has been shown that intense selection for high body weight alone introduces infertility
problems among chicken. The breeding objectives defined in this study need to be converted into
actual material and monetary gain for smallholder formers who rear IC. Therefore, there is need
to identify IC with the best genetic merit relative to the breeding objective. Further research is also
needed to identify the genetic and phenotypic parameters for IC and identify the optimum breeding
strategies that can be used to achieve these breeding objectives.
5.7 Conclusion
This study focused on development of a bio-economic model and assessment of the
economic values for the traits of economic importance perceived by farmers. The bio-economic
model was used to estimate the revenues, costs and profitability of IC in different smallholder
production in the breeding objective. The results from the model show that IC can be utilised
profitably under FRS. However, negative profits were observed in SIS and IS. The results show
that genetic improvement of the production (EN, LWg, LWcock and LWhen) and functional (FER,
HA, CSR,) traits would give the highest economic values hence increase profitability of IC
production systems. Traits considered in this study could probably be combined with other traits
in the breeding objectives. However, it might be difficult to genetically change them as they might
have antagonistic relationships. It is important to note that further studies on bio-economic model
incorporating risk-rated economic values are needed as it will prevent over-estimation of profits
for the IC production systems. This will help farmers to select IC based on traits that suit their
production system.

81
CHAPTER SIX
GENERAL DISCUSSION AND CONCLUSIONS
6.1 Aim of the study
The role of IC to rural households in developing countries is well known. This is evident
from the fact that indigenous genotypes are widely distributed in rural and peri-urban area of
developing countries, frequently in excess of 80 percent (Gabanakgosi et al., 2013; Pym, 2010).
For the last several decades, IC have been recognized as important tools to wealth creation, poverty
and food insecurity alleviation in developing countries (Dana, 2011; MINAGRI, 2012). In many
developing countries, several projects had been initiated to improve the IC productivity through
crossbreeding with exotic commercial breeds. However, most of these projects have been
unsuccessful due to several factors such as poor understanding of IC production systems, lack of
clear breeding objectives and operational breeding programs. Therefore, there is need to establish
the socio-economic contribution of chicken in the overall effort to alleviate poverty and food
insecurity. The current study focused on generating information on IC production systems,
identifying the traits of economic importance and developing the breeding objectives for IC genetic
improvement in Rwanda. The study had three objectives. Firstly, to understand the socio-economic
characteristics, management of IC, production parameters, feed resources and constraints faced by
farmers rearing IC in Rwanda. Secondly, to determine farmers breeding practices and identify
traits of economic importance for IC genetic resources from the perspective of stakeholders along
the IC value chain in Rwanda. Thirdly, to develop a bio-economic model and estimate economic
values for production and functional traits for IC in Rwanda.
This thesis addressed three major research questions namely: 1) what are the characteristics
of the production and marketing systems of IC in Rwanda? 2) what are the breeding practices and
traits of economic importance in the selection of IC genetic resources? and 3) what are the
economic value of the traits in the breeding objectives under different IC production systems?
6.2 Study methodology
Information on IC production systems characteristics was achieved through direct
observations and interviews with the farmers selected in five districts with high IC population in
Rwanda. They included Kicukiro, Rwamagana, Muhanga, Ruhango and Rulindo districts (NISR,
2011). Qualitative and quantitative data were obtained through interviews using pre-tested
82
structured questionnaires, farmers group discussions and observations made by enumerators and
researcher. The main information covered were farmers’ characteristics (including age, level of
education, occupation, household size, household status), farms’ characteristics (farm size, land
ownership, livestock species, number and reason of keeping IC) and IC management
characteristics (production systems, housing, nutrition, extension services and challenges to IC
production). A total of 206 farmers were interviewed. Results of the first objective are presented
in Chapter 3 of this thesis. The analysis employed PROC FREQ and PROC MEANS procedures
of SAS (version 9.00, 2002) to determine the frequency and descriptive statistics.
Information on farmers’ breeding practices and traits of economic importance were
obtained from the farmers, marketers and consumers using three set questionnaires. Data on flock
composition, IC ecotypes, traits preferences as well as selection criteria were captured. A total of
206 farmers, 56 marketers and 80 consumers were interviewed. Ranking and index methodology
was applied to provide the overall ranking for the traits preferences perceived by farmers,
marketers and consumers. The use of ranking and index have been extensively used to identify the
most important traits or issues which need to be addressed (Kosgey et al., 2004; Bett et al., 2011;
Mbuthia et al., 2015a). The breeding practices and traits of economic importance are covered in
Chapter 4 of this thesis.
The required information on development of breeding objectives was obtained by
reviewing the literature, performance records from various studies and field survey. A bio-
economic modeling approach was then used to estimate profitability and marginal returns of the
production systems. The production variables used in the model were representative of the
production circumstances in Rwanda and many are applicable in others tropical regions. Partial
budgeting was applied to assess the effect of profitability of increasing specific traits by a unit to
derive the economic values (Ponzoni and Newman, 2010).
6.3 Indigenous chicken production systems
Characterization of the existing IC production systems is an important step for making
decision on conservation and sustainable utilization of IC genetic resources. This study was
initiated to provide a clear picture of socio-economic contribution of the IC, production
circumstances and constraints and opportunities for IC production (Chapter 3). Such information
are critical in developing appropriate breeding objectives (Dana et al., 2010; Okeno et al., 2012;
83
Mbuthia et al., 2014), but were lacking in the literature, since there were no studies conducted on
IC production systems in Rwanda. This study indicated that chicken in Rwanda are raised for eggs
and meat production and income generation. The production environment is mainly extensive
characterized by inadequate feeding, uncontrolled mating, high diseases prevalence, lack of initial
capital and predation risks (Chapter 3). This call for a combined effort from government, higher
learning institutions and non-government organizations to develop and research on alterative feed
resources using non-conventional feed stuffs such as insects. This will not only generate feeds for
chickens but also will reduce the food competition problem between human and livestock on use
of cereals and legumes. It has been reported that feeding termites to chicken provides a mechanism
for converting cellulose into food for human consumption with benefits to the ecosystem (Okeno
et al., 2012). There is a need to sensitize and train poultry farmers on importance of housing birds
in separate chicken houses to reduce the spread of diseases and predator’s problem. Poultry need
good housing. It should be locked up at night to protect chicken from bad weather, predators, and
thieves.
A poultry house allows for inspection of birds and handling for normal management
practices. It also allows collection of eggs from the same place. Therefore, to access training and
other extension services on poultry housing and management, farmers must be organized into
groups. However, this study indicated that the extension services are limited. The limited extension
services can be supplemented by high learning institutions and non-governmental organizations
(NGOs) as it has been demonstrated that most farmers, especially women who are the custodians
of IC prefer to work with NGOs (Ochieng et al., 2011; Okeno, 2012). Okeno et al. (2012) reported
that government extension officers should be trained through refresher or short courses to equip
them with modern technologies on poultry management and participation of NGOs in farmers
training and organization is critical. He concluded that such approaches have been found to be
successful in improving the IC production environment and productivity. There is need to focus
on farmer’s education and training in the areas of chicken breeding, feeding, diseases and parasite
control and treatment and marketing. Training and education should be tailored to both sexes but
the major focus should be on women as they play a major role in IC production systems (Halima
et al., 2007; Magothe et al., 2012).
The high prevalence of Newcastle disease observed in this study (Chapter 3) has also been
reported elsewhere in the tropics (Gondwe et al., 2007; Fisseha et al., 2010; Moges et al., 2010;
84
Akinola and Essien, 2011; Okeno et al., 2012). This led to the necessity of anticipating
implementation of efficient poultry health management system. A country vaccination program
for chickens will be an ideal strategy to enable chickens to develop immunity and prevent them
from disease outbreaks. This can be supported by the Rwanda Agricultural Board (RAB) and
NGOs which can provide human resources, vaccines and facilities to the farmers.
Small flock size, uncontrolled mating and lack of recording scheme are the characteristic
features of IC production systems also observed in this study (Chapter 3). Under such
circumstances, multiplication centers for poultry breeds with separate tier operating on profit basis
should be established by the government (Ministry of Agriculture) across the country. The
multiplication centers can further provide various services to the surrounding farmers such as
extension services, farm recording systems training and selling of fertile eggs for hatching using
broody hens or 3 months old chickens. To achieve this, appropriate mechanisms for multiplication
and dissemination of improved poultry management technologies and improved breeds are
required. Therefore, financial support from NGOs and private sectors will help to ensure the
sustainability of this multiplier centers. This will result to increased flock size among smallholders.
6.4 Breeding practices and traits of economic importance
6.4.1 Chicken genotypes and their attributes
In this study, majority of farmers reported preference of dwarf and normal feathered
genotypes over others (i.e. Frizzled feathers, naked neck, crossbreds) because of their prolificacy,
disease tolerance and fighting ability against predators (Chapter 4). The dwarf gene is known to
increase feed efficiency and mass egg production (Magothe et al., 2012a). Utilizing dwarf and
normal feathered or dwarf-normal feathered genotypes for dual purpose production would be
expected to increase live bird offtake and egg yield and evade predators without additional cost
increases. The crosses were preferred for their high eggs yield, mature weight and moderate growth
rate over IC. Introducing the exotic genes into dwarf and normal feathered genotypes would be
expected to improve egg production under all production systems. However, management and
husbandry measures should be considered because the crossbreds (hybrids) are not resistant to
diseases compared to the pure indigenous IC. A well planned crossbreeding program would not
only result to conservation of the pure lines and improved productivity of crossbreds due to
heterosis and breed complementarity, but could also lead to development of a synthetic breed
85
which would carry valuable genes from the original indigenous breeds to future generations
(Scholtz and Theunissen, 2010). However, evaluating the potential of different breeds under
village conditions in relation to the overall breeding objectives is important for deciding on the
type of breeding scheme (Dana, 2011).
In general, gaining a better understanding of farmers’ preferred chicken ecotypes and their
attributes (traits) might be used by government or NGOs in planning of appropriate breeding
program.
6.4.2 Traits of economic importance
As presented in Chapter 4, selection of breeding stocks was based on combination of
productive, reproductive, functional and aesthetics traits. Egg yield, disease tolerance, high growth
rate, prolificacy, high body weight and egg fertility were highly preferred by farmers. The traits
perceived by marketer and consumers were meat quality, egg yolk colour, plumage colour, disease
tolerance and body weight. These traits proposed by farmer, marketer and consumers should be
included in the development of IC breeding program to capture the expected future market
dynamics. A critical economic consideration is: who will pay for the development of IC breeding
program (IC genetic improvement)? This question is not particularly important when breeding
nuclei, multipliers and commercial flocks are fully integrated. Therefore, creation of breeding
nuclei and multipliers for IC genetic resources in different part of Rwanda will be justifiable. This
commonly provides justification for public and private sectors, and NGOs involvement in facets
of IC genetic improvement. An alternative model to improve village poultry is the Bangladesh
model (http://stud.epsilon.slu.se/6336/1/Tan_D_131220.pdf). The Bangladesh model is a macro-
credit based model emphasizing on the entire supply chain. The beneficiaries are specialized in
different activities ranging from vaccination and medication supply, rearing of chicks of different
age classes, fertile egg production, hatching or feed supply. Some of the reasons for the success of
the program are that the different activities of the beneficiaries are tightly integrated and inter-
dependent and the actors at all levels profit from their activity. Challenge of this model is the
insufficient numbers of high quality chickens produced that are able to withstand the local
environments (Permin et al., 1998; Dana, 2011).
86
6.5 Bio-economic model
A country’s development objectives for agricultural production traditionally include
economic variables, but should be extended to accommodate ethics, and other social aspects of
human well-being (FAO, 2007). Different tools are available for this. The most common is bio-
economic model or the profit function.
In this study, a deterministic approach to capture the features of production systems was
applied and used to estimate the economic values for production and functional traits (Chapter 5).
The result show that IC can be utilized profitably under FRS. The SIS and IS system resulted to a
negative profit. This might be attributed to the facts that the flock-size was fixed. Bett et al (2007)
noted that the assumption of the fixed flock-size may not always be true because the animals are
kept in small flocks with fluctuating numbers in the smallholder systems. In addition,
unpredictable dates of animal disposal and seasonal variation of prices of chicken and feeds on
markets may also affect the profitability production systems. The positive economic values for
EN, LWg, LWcock and LWhen in all production systems indicate that genetic improvement of
these traits would have positive effect on the profitability in these smallholder production systems
(Chapter 6). The positive economic values for functional traits (FER, HA and CSR) under these
systems indicated that breeding for increased FER, HA and CSR would be beneficial in influencing
the number of animals available for replacement and markets hence increasing profitability of
production systems. The inclusion of these traits in the breeding objectives would increase the
flock size and offtake, which is a tool with which to change the product output levels of the flock
and replacement rates.
6.6 General conclusions
This study has generated vital information on the IC sub-sector in Rwanda, identified the
traits of economic importance and developed the breeding objectives.
i. The nutritional, income and employment roles played by IC demonstrates their importance in
the households’ livelihood. However, their productivity is low due to the associated
constraints mentioned such as disease outbreaks, predators, lack of investment capital, price
fluctuation and lack of breeding stock.
ii. The trait perceived by farmers were prolificacy, mature weight, disease tolerance, egg number,
and heat tolerance were the most preferred attributes across different IC genotypes.
87
iii. The trait preferences perceived by marketer and consumers were meat quality, egg yolk
colour, plumage colour, disease tolerance, and growth rate and body weight.
iv. The results from the model show that IC can be utilised profitably under FRS. However,
negative profits were observed in SIS and IS. The economic values for traits such as EN, FER,
HA, CSR, GSR, BSR, LWg, LWhen and LWcock in FRS were all positive. There was a decrease
in EVs as level intensification increased. The economic response for reproduction traits (AFE,
FER and HA) where lower compared to the economic response for production traits (EN, and
LW) in all production systems.
6.7. General recommendations
i. The production constraints mentioned in this study need urgent mitigation measures to sustain
utilisation of IC against the changing climatic and economic conditions. Studies on the locally
used feeds and medications should be considered. There is a need to sensitize farmers to
construct separate chicken houses to reduce the spread of diseases and predators. Therefore,
individual, public institutions and non-governmental organisations efforts are required to
develop a sustainable IC breeding objectives that account for whole production circumstances
and farmer’s need.
ii. Further studies on phenotypic and genotypic characterization should be considered to evaluate
the uniqueness of the present genotypes and generate more information on the breeds for the
future utilization and conservation of these IC genetic resources.
iii. The Identified traits of economic importance by farmers, marketers and consumers should be
considered in development of breeding objectives or other IC genetic improvement
interventions. There is need to identify IC genotypes which are superior in traits in the
breeding goals and develop breeding strategies to be used in dissemination of improved genes.
This can be achieved if trait recording, performance testing and breeding value estimation are
undertaken. With the right policies and investment, there is ample evidence that well designed
and participative development program will help to overcome the constraints faced by the
smallholder poultry producer with significant economic and social benefits.
iv. The results of this study showed that genetic improvement of the production (EN, LWg,
LWcock and LWhen) and functional (FER, HA, CSR,) traits would give the highest economic
values hence increase profitability of IC production systems.
88
References
Abeykoon, M. N. D. F., Weerahewa, J., and Silva, G. L. L. P. (2013). Determinants of Market
Participation by Indigenous Poultry Farmers : A Case Study in Anuradhapura District in Sri
Lanka. Tropical Agricultural Research, 24(4), 347–361.
Åby, B. A., Aass, L., Sehested, E., and Vangen, O. (2012). A bio-economic model for calculating
economic values of traits for intensive and extensive beef cattle breeds. Livestock Science,
143(2–3), 259–269.
Addisu, H., Zewdu, W., and Hailu, M. (2014). Breeding practice and objective of indigenous
chicken in North Wollo, Amhara regional State, Ethiopia. International Journal of Livestock
Production, 5(1), 15–22.
Adeleke, M. A., Peters, S. O., Ozoje, M. O., Ikeobi, C. O. N., Bamgbose, A. M., and Adebambo,
O. A. (2011). Growth performance of Nigerian local chickens in crosses involving an exotic
broiler breeder. Tropical Animal Health and Production, 43(3), 643–650.
Akinola, L. A. F., and Essien, A. (2011). Relevance of rural poultry production in developing
countries with special reference to Africa. Worlds Poultry Science Journal, 67, 697–705.
Alewi, M., Melesse, A, and Teklegiorgis, Y. (2012). Crossbreeding Effect on Egg Quality Traits
of Local Chickens and Their F 1 Crosses With Rhode Island Red and Fayoumi Chicken
Breeds Under Farmers ’ Management Conditions Crossbreeding Effect on Egg Quality Traits
of Local Chickens and Their F 1 Crosses Wi. Journal of Animal Production Advances, 2(8),
697–705.
Alipanah, M., Deljo, J., Rokouie, M., and Mohammadnia, R. (2013). Heritabilities and Genetic
and Phenotypic Correlations of Egg Quality Traits in Khazak Layers. Trakia Journal of
Sciences, 11(2), 175–180.
Asmara, I. Y. (2014). Risk status of selected indigenous chicken breeds in Java , Indonesia :
Challenges and opportunities for conservation Master of Biology Environment. MSc Thesis,
Charles Darwin University.
Asresie, Aleme; Mitiku, E. (2015). Traditional Chicken Production System and Marketing in
Ethiopia : A review. Journal of Marketing and Consumer Research, 8(2422–8451), 27–35.
Bahmanimehr, A. (2012a). Inheritance of Important Economic Traits in Chickens Under Short
Term Selection. International Journal of Animal and Veterinary Advances, 4(2), 109–112.
Bahmanimehr, A. (2012b). Selection for economic traits in chickens breeding program according
89
to genetic parameters and correlation between traits. World Applied Sciences Journal, 20(10),
1332–1335.
Bekele, F., AdnoØy, T., GjoØen, H. M., Kathle, J., and Abebe, G. (2010). Production performance
of dual purpose crosses of two indigenous with two exotic chicken breeds in sub-tropical
environment. International Journal of Poultry Science, 9(7), 702–710.
Bett, H. K., Bett, R. C., Peters, K. J., Kahi, A. K., and Bokelmann, W. (2011). Estimating farmers
’ preferences in selection of indigenous chicken genetic resources using non-market
attributes. Animal Genetic Resources, 49, 51–63.
Bett, H. K., Bett, R. C., Peters, K. J., Kahi, A. K., and Bokelmann, W. (2012). Linking Utilisation
and Conservation of Indigenous Chicken Genetic Resources to Value Chains Linking
Utilisation and Conservation of Indigenous Chicken Genetic Resources to Value Chains.
Journal of Animal Production Advances, 2(1), 33–51.
Bett, R. C., Gicheha, M. G., Kosgey, I. S., Kahi, A. K., and Peters, K. J. (2012). Economic values
for disease resistance traits in dairy goat production systems in Kenya. Small Ruminant
Research, 102(2–3), 135–141.
Bett, R. C., Kosgey, I. S., Bebe, B. O., and Kahi, A. K. (2007). Breeding goals for the Kenya Dual
Purpose goat. II. Estimation of economic values for production and functional traits. Tropical
Animal Health and Production, 39(7), 467–475.
Bett, R. C., Kosgey, I. S., Kahi, A. K., and Peters, K. J. (2011). Definition of breeding objectives
and optimum crossbreeding levels for goats in the smallholder production systems. Small
Ruminant Research, 96(1), 16–24.
Bwalya, R. (2014). An Analysis of the Value Chain for Indigenous Chickens in Zambia ’ s Lusaka
and Central Provinces. Journal of Agricultural Studies, 2(2), 32–51.
Cabarles, J. C. (2013). Production potentials of native chickens (Gallus gallus domesticus L.) of
Western Visayas, Philippines. Tropical Animal Health and Production, 45(2), 405–410.
Chimonyo, M., and Dzama, K. (2007). Estimation of genetic parameters for growth performance
and carcass traits in Mukota pigs. Animal, 1(3), 317–323.
Dana, N. (2011). Breeding programs for indigenous chicken in Ethiopia: analysis of diversity in
production systems and chicken populations. Wageningen University. Retrieved on 14th July,
2016 from http://library.wur.nl/WebQuery/wda/lang/1955246
Dana, N., Dessie, T., van der Waaij, L. H., and van Arendonk, J. A. M. (2010). Morphological

90
features of indigenous chicken populations of Ethiopia. Animal Genetic Resources, 46, 11–
23.
Dana, N., van der Waaij, L. H., Dessie, T., and van Arendonk, J. A. M. (2010). Production
objectives and trait preferences of village poultry producers of Ethiopia: Implications for
designing breeding schemes utilizing indigenous chicken genetic resources. Tropical Animal
Health and Production, 42(7), 1519–1529.
Dana, N., vander Waaij, E. H., and van Arendonk, J. A. M. (2011). Genetic and phenotypic
parameter estimates for body weights and egg production in Horro chicken of Ethiopia.
Tropical Animal Health and Production, 43(1), 21–28.
Dessie, T., Taye, T., Dana, N., Ayalew, W., and Hanotte, O. (2011). Current state of knowledge
on phenotypic characteristics of indigenous chickens in the tropics. World’s Poultry Science
Journal, 67(3), 507–516.
EACS. (2014). Promote agricultural investments: An opportunity to enhance food security in the
East Africa countries. EAC Geneva Forum, 1–8.
Ebrahimzadeh-Allahabad, A., Mahmodian, Z., Pezeshkian, Z., and Mollaei, A. (2015). Estimation
of genetic and phenotypic parameters of some important economic traits in Khazak native
hen in Iran. Animal Genetic Resources, 57, 99–103.
Essien, A., Harcourt, P., State, R., and State, C. R. (2011). Small-Scale Family Poultry Production
Relevance of rural poultry production in developing countries with special reference to
Africa. World’s Poultry Science Journal, 67, 697–705.
FAO. (2007). Genetic improvement methods to support sustainable utilization. In the state of the
world’s commission on genetic resources for food and agriculture food and agriculture
organization of the united nations rome, 2007 animal genetic resources for food and
agriculture – in brief (pp. 381–427). Rome, Italy. Retrieved on 3rd March, 2016 from
http://www.fao.org/3/a-a1250e/a1250e18.pdf
FAO. (2009). Revue du secteur avicole Revue, Rwanda. In division de la production et de la sante
animales de la fao. Retrieved on 4th March, 2016 from
http://www.fao.org/avianflu/en/poultryproduction.html
FAO. (2013). Poultry Development Review. Retrieved on 4th March, 2016 from
http://www.fao.org/avianflu/en/poultryreview.html
Fisseha, M., Abera, M., Tadelle, D. (2010). Assessment of village chicken production system and
91
evaluation of the productive and reproductive performance of local chicken ecotype in Bure
district, North west Ethiopia. African Journal of Agricultural Research, 5(13), 1739–1748.
Fisseha, Moges, Azage, Tegegne and Tadelle, D. (2010). Indigenous chicken production and
marketing systems in ethiopia : characteristics and opportunities for market-oriented
development indigenous chicken production and marketing. International Livestok Research
Institute, 24, 8-45.
Gabanakgosi, K., Moreki, J. C., Tsopito, C. M., and Nsoso, S. J. (2013). Impact of family chickens
on the livelihoods of people living with HIV and AIDS in four villages of Botswana. Journal
of World’s Poultry Research, 3, 43–53.
Gebre, K. T., Fuerst-Waltl, B., Wurzinger, M., Philipsson, J., Duguma, G., Mirkena, T., and
Sölkner, J. (2012). Estimates of economic values for important traits of two indigenous
Ethiopian sheep breeds. Small Ruminant Research, 105(1–3), 154–160.
Gondwe, T. N., and Wollny, C. B. A. (2007). Local chicken production system in Malawi:
Household flock structure, dynamics, management and health. Tropical Animal Health and
Production, 39(2), 103–113.
Grobbelaar, J. A. N., Sutherland, B., and Molalakgotla, N. M. (2010). Egg production potentials
of certain indigenous chicken breeds from South Africa. Animal Genetic Resources, (46), 25–
32.
Guèye, E. F. (1998). Village egg and fowl meat production in Africa. World´s Poultry Science
Journal, 54, 73–86.
Guèye, E. F. (2002). Employment and income generation through family poultry in low-income
food-deficit countries. World’s Poultry Science Journal, 58(4), 541–557.
Hailu, A., Wuletaw, Z., and Mazengia, H. (2013). Breeding practice and objective of indigenous
chicken in North Wollo , Amhara regional State , Ethiopia. International Journal of Livestock
Production, 5, 15–22.
Halima, H., Neser, F. W. C., Van Marle-Koster, E., and De Kock, A. (2007). Village-based
indigenous chicken production system in north-west Ethiopia. Tropical Animal Health and
Production, 39(3), 189–197.
Harrison, J. L., and Alders, R. G. (2010). An assessment of chicken husbandry including
Newcastle disease control in rural areas of Chibuto, Mozambique. Tropical Animal Health
and Production, 42(4), 729–736.
92
Hazel, L. N., Dickerson, G. E., and Freeman, A. E. (1994). The selection index--then, now, and
for the future. Journal of Dairy Science, 77(10), 3236–3251.
Henning, J., Morton, J., Pym, R., Hla, T., Sunn, K., and Meers, J. (2013). Economic analysis of
interventions to improve village chicken production in Myanmar. Preventive Veterinary
Medicine, 110(3–4), 525–40.
Kahi, A. K., and Nitter, G. (2004). Developing breeding schemes for pasture based dairy
production systems in Kenya: I. Derivation of economic values using profit functions.
Livestock Production Science, 88(1–2), 161–177.
Kahi, A. K., Nitter, G., and Gall, C. (2004). Developing breeding schemes for pasture based dairy
production systems in Kenya. Livestock Production Science, 88(1–2), 179–192.
Kaingu, F. B., Kibor, A. C., Shivairo, R., Kutima, H., Okeno, T., Waihenya, R., and Kahi, A. K.
(2010). Prevalence of gastro-intestinal helminthes and coccidia in indigenous chicken from
different agro-climatic zones in Kenya. African Journal of Agricultural Research, 5(6), 458–
462.
Kingori, A. M., Wachira, A. M., and Tuitoek, J. K. (2010). Indigenous chicken production in
Kenya: A review. International Journal of Poultry Science, 9(4), 309–316.
Kiplangat, N. (2011). Genetic Analysis of Growth Patterns of Different Ecotypes of Indigenous
chicken in Kenya. MSc Thesis, Egerton University.
Kitalyi, A., and Kaudia, T. J. (2002). Commercializing rearing of village chicken in Kenya Thomas
Junne Kaudia and Aichi Kitalyi. International Network for Family Poultry Development,
(1998). Retrieved on 5th May, 2016 from http://www.infpd.net/econference/view/id/29
Kosgey, I. S., Van Arendonk, J. A. M., and Baker, R. L. (2004). Economic values for traits in
breeding objectives for sheep in the tropics: Impact of tangible and intangible benefits.
Livestock Production Science, 88(1–2), 143–160.
Kugonza, D. R., Nabasirye, M., Hanotte, O., Mpairwe, D., and Okeyo, A. M. (2012). Pastoralists’
indigenous selection criteria and other breeding practices of the long-horned Ankole cattle in
Uganda. Tropical Animal Health and Production, 44(3), 557–565.
M.M, Iraqi, M.S, Hanafi, M.H, Khalill, A.F, El-Labban and M, E.-S. (2002). Genetic evaluation
of growth traits in a crossbreeding experiment involving two local strains of chickens using
multi-trait animal model. Livestock Research for Rural Development., 1(5).
Mack, S., Hoffmann, D., and Otte, J. (2005). The contribution of poultry to rural development.
93
World’s Poultry Science Journal, 61(1), 7–14.
Magothe, T. M., Muhuyi, W. B., and Kahi, A. K. (2010). Influence of major genes for crested-
head, frizzle-feather and naked-neck on body weights and growth patterns of indigenous
chickens reared intensively in Kenya. Tropical Animal Health and Production, 42(2), 173–
183.
Magothe, T. M., Okeno, T. O., Muhuyi, W. B., and Kahi, A. K. (2012a). Indigenous chicken
production in Kenya : II . Prospects for research and development. World’s Poultry Science
Journal, 68, 133–144.
Magothe, T. M., Okeno, T. O., Muhuyi, W. B., and Kahi, A. K. (2012b). Small-Scale Family
Poultry Production Indigenous chicken production in Kenya : I . Current status. World’s
Poultry Science Journal, 68, 119–132.
Mbuthia, J. M., Rewe, T. O., and Kahi, A. K. (2014). Breeding objectives for pigs in Kenya. II:
economic values incorporating risks in different smallholder production systems. Tropical
Animal Health and Production, 47(2), 361–367.
Mbuthia, J. M., Rewe, T. O., and Kahi, A. K. (2015a). Analysis of pig breeding management and
trait preferences in smallholder production systems in Kenya. Animal Genetic Resources, 1–
7.
Mbuthia, J. M., Rewe, T. O., and Kahi, A. K. (2015b). Breeding objectives for pigs in Kenya. I:
Bio-economic model development and application to smallholder production systems.
Tropical Animal Health and Production, 47(2), 299–309.
Mekonnen, H., Mulatu, D., Kelay, B., and Berhan, T. (2010). Assessment of the nutritional status
of indigenous scavenging chickens in Ada’a district, Ethiopia. Tropical Animal Health and
Production, 42(1), 123–130.
Menge, E. O. (2008). Breeding Goals for Production Systems Utilising. MSc Thesis, Egerton
University.
Menge, E. O., Kosgey, I. S., and Kahi, A. K. (2005). Bio-economic model to support breeding of
indigenous chicken in different production systems. International Journal of Poultry Science,
4(11), 827–839.
Mengesha, M., and Tsega, W. (2011). Phenotypic and genotypic characteristics of indigenous
chickens in Ethiopia : A review. Journal of Agricultural Research, 6(24), 5398–5404.
MINAGRI. (2012). Investment plan to strengthen meat industry in rwanda final report.
94
Missanjo, E., Imbayarwo-Chikosi, V., and Halimani, T. (2013). Estimation of genetic and
phenotypic parameters for production traits and somatic cell count for jersey dairy cattle in
zimbabwe. ISRN Veterinary Science, 2013, 470585.
Moges, F., Mellesse, A., and Dessie, T. (2010). Assessment of village chicken production system
and evaluation of the productive and reproductive performance of local chicken ecotype in
Bure district, North west Ethiopia. African Journal of Agricultural Research, 5(13), 1739–
1748.
Msoffe, P. L. M., Bunn, D., Muhairwa, A. P., Mtambo, M. M. A., Mwamhehe, H., Msago, A., and
Cardona, C. J. (2010). Implementing poultry vaccination and biosecurity at the village level
in Tanzania: A social strategy to promote health in free-range poultry populations. Tropical
Animal Health and Production, 42(2), 253–263.
Mtileni, B. J., Muchadeyi, F. C., Maiwashe, A., Chimonyo, M., Mapiye, C., and Dzama, K. (2012).
Influence of socioeconomic factors on production constraints faced by indigenous chicken
producers in South Africa. Tropical Animal Health and Production, 45(1), 67–74.
Musa A.A, Orunmuyi M., Akpa G.N, Olutunmogun A.K, Muhammad H., Adedibu, I. (2015).
Diallel analysis for bodyweight involving three genotypes of Nigerian indigenous chickens.
South African Journal of Animal sciences, 45, 2221-4062.
Mwacharo, J. M., Bjørnstad, G., Han, J. L., and Hanotte, O. (2013). The History of African Village
Chickens: An Archaeological and Molecular Perspective. African Archaeological Review,
30(1), 97–114.
Natukunda, K., Kugonza, D. R., and Kyarisiima, C. C. (2011). Indigenous chickens of the Kamuli
plains in Uganda: I. production system and flock dynamics. Livestock Research for Rural
Development, 23(10).
Niknafs, S., Nejati-Javaremi, A., Mehrabani-Yeganeh, H., and Fatemi, S. A. (2012). Estimation of
genetic parameters for body weight and egg production traits in Mazandaran native chicken.
Tropical Animal Health and Production, 44(7), 1437–1443.
NISR. (2011). Integrated household living conditions survey .eicv3 thematic report Agriculture.
Retrieved on 27th July, 2015 from http://microdata.statistics.gov.rw/index.php/catalog/36
NISR. (2012). Characteristics of households and housing characteristics. Retrieved on 27th July,
2015 from http://microdata.statistics.gov.rw/index.php/catalog/65
Njenga, S. K. (2005). Productivity and Socio-Cultural Aspects of Local Poultry Phenotypes in
95
Coastal Kenya. MSc Thesis, The Royal Veterinary and Agricultural University.
Norris, D., and Ngambi, J. W. (2006). Genetic parameter estimates for body weight in local Venda
chickens. Tropical Animal Health and Production, 38(7–8), 605–609.
Ochieng, J., Owuor, G., Bebe, B.O., Ochieng, D. (2011). Effect of Management Interventions on
Productive Performance of Indigenous Chicken in Western Kenya. Retrieved on 12th August
2015 from http://www.lrrd.org/lrrd23/5/ochi23114.html
Okeno, T. O. (2012). Production Systems , Breeding Objectives and Selection Schemes for
Indigenous Chicken Genetic Resources in Kenya. Humboldt University of Berlin. Retrieved
on 13th August 2015 from http://pure.au.dk/portal/da/publications-research/production-
systems-breeding-objectives-and-selection-schemes-for-indigenous-chicken-genetic-
resources-in-kenya%28ce971fa9-6ec5-489c-b2d3-8fd961ab34fa%29.html
Okeno, T. O., Kahi, A. K., and Peters, K. J. (2011). Breed selection practices and traits of economic
importance for indigenous chicken in Kenya. Livestock Research for Rural Development,
23(10).
Okeno, T. O., Kahi, A. K., and Peters, K. J. (2012). Characterization of indigenous chicken
production systems in Kenya. Tropical Animal Health and Production, 44(3), 601–608.
Okeno, T. O., Kahi, A. K., and Peters, K. J. (2012). Genetic and economic evaluation of alternative
breeding objectives for adoption in the smallholder Indigenous Chicken Improvement
Program. In Conference on International Research on Food security, Natural Resource
Management and Rural Development (Vol. 1, pp. 1–4).
Okeno, T. O., Kahi, A. K., and Peters, K. J. (2015). Evaluation of breeding objectives for purebred
and crossbred selection schemes for adoption in indigenous chicken breeding programmes.
British Poultry Science, 1668, 54, 62-75.
Okeno, T. O., Magothe, T. M., Kahi, A. K., and Peters, K. J. (2012). Application of risk-rated
profit model functions in estimation of economic values for indigenous chicken breeding.
Tropical Animal Health and Production, 44, 1279–1287.
Okeno, T. O., Magothe, T. M., Kahi, A. K., and Peters, K. J. (2012). Breeding objectives for
indigenous chicken : Model development and application to different production systems.
Tropical Animal Health and Production, 45, 193–203.
Oleforuh-okoleh, V. U. (2011). Estimation of Genetic Parameters and Selection for Egg
Production Traits in a Nigerian Local Chicken Ecotype. ARPN Journal of Agricultural and
96
Biological Science, 6(12), 2006–2009.
Olwande, P. O., Ogara, W. O., Okuthe, S. O., Muchemi, G., Okoth, E., Odindo, M. O., and
Adhiambo, R. F. (2010). Assessing the productivity of indigenous chickens in an extensive
management system in Southern Nyanza, Kenya. Tropical Animal Health and Production,
42(2), 283–288.
Osei-Amponsah, R., Kayang, B. B., and Naazie, A. (2013). Phenotypic and genetic parameters for
production traits of local chickens in Ghana. Animal Genetic Resources, 53, 45–50.
Padhi, M. K. (2016). Importance of Indigenous Breeds of Chicken for Rural Economy. Scientifica,
2016(Article ID 2604685), 9.
Permin, A., Pedersen, G., and Riise, J. C. (1998). Poultry as a Tool for Poverty Alleviation :
Opportunities and Problems Related to Poultry Production at Village Level, (Pandey 1992),
143–147.
Ponzoni, R. W., and Newman, S. (2010). Developing breeding objectives for australian beef cattle
production. Animal Production, 49(1), 35–47.
Pym, R. A. E. (2010). The role of the world’s poultry science association (WPSA) in support of
poultry production in developing countries. Proceedings of the 21st Annual Australian
Poultry Science Sumposium, Sydney, New South Wales, 1-3rd February 2010.
Rakhmanin, V. O., and Gennari, P. (2014). FAO Statistical Yearbook 2014, 130. Retrieved ofrom
http://scholar.google.com/scholar?hl=enandbtnG=Searchandq=intitle:No+Title#0
Rewe, T. O., Herold, P., Kahi, A. K., and Zárate, A. V. (2011). Trait improvement and monetary
returns in alternative closed and open nucleus breeding programmes for Boran cattle reared
in semi-arid tropics. Livestock Science, 136(2–3), 122–135.
Rewe, T. O., Indetie, D., Ojango, J. M. K., and Kahi, A. K. (2006). Breeding objectives for the
Boran breed in Kenya: Model development and application to pasture-based production
systems. Animal sciences Journal, 77(2), 163–177.
Scholtz, M. M., and Theunissen, A. (2010). The use of indigenous cattle in terminal cross-breeding
to improve beef cattle production in Sub-Saharan Africa. Animal Genetic Resources, 46, 33–
39.
Tada, O., Muchenje, V., and Dzama, K. (2013). Preferential traits for breeding Nguni cattle in low-
input in-situ conservation production systems. SpringerPlus, 2(1), 195.
Victor A.C, Subalini E., and T. S. (2014). Socio-economic role, farming system and productive
performance of local chicken in the Eastern Province of Sri Lanka. In International

97
Conference of Agriculture Sciences (Aginsight 2014) (pp. 1–5).
Wolc, A., Stricker, C., Arango, J., and Fulton, J. E. (2011). Breeding Value Prediction for
Production Traits in Layers Using High-density SNP Markers. Animal Industry Report, 657.
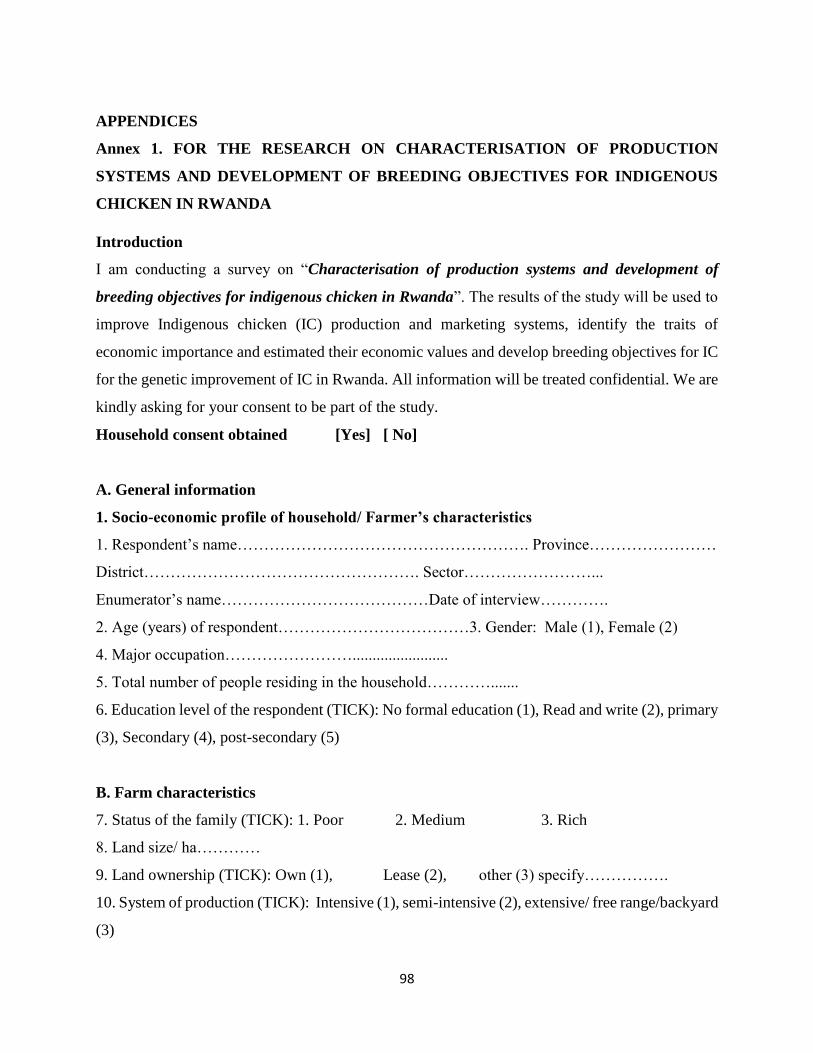
98
APPENDICES
Annex 1. FOR THE RESEARCH ON CHARACTERISATION OF PRODUCTION
SYSTEMS AND DEVELOPMENT OF BREEDING OBJECTIVES FOR INDIGENOUS
CHICKEN IN RWANDA
Introduction
I am conducting a survey on “Characterisation of production systems and development of
breeding objectives for indigenous chicken in Rwanda”. The results of the study will be used to
improve Indigenous chicken (IC) production and marketing systems, identify the traits of
economic importance and estimated their economic values and develop breeding objectives for IC
for the genetic improvement of IC in Rwanda. All information will be treated confidential. We are
kindly asking for your consent to be part of the study.
Household consent obtained [Yes] [ No]
A. General information
1. Socio-economic profile of household/ Farmer’s characteristics
1. Respondent’s name………………………………………………. Province……………………
District……………………………………………. Sector……………………...
Enumerator’s name…………………………………Date of interview………….
2. Age (years) of respondent………………………………3. Gender: Male (1), Female (2)
4. Major occupation……………………........................
5. Total number of people residing in the household………….......
6. Education level of the respondent (TICK): No formal education (1), Read and write (2), primary
(3), Secondary (4), post-secondary (5)
B. Farm characteristics
7. Status of the family (TICK): 1. Poor 2. Medium 3. Rich
8. Land size/ ha…………
9. Land ownership (TICK): Own (1), Lease (2), other (3) specify…………….
10. System of production (TICK): Intensive (1), semi-intensive (2), extensive/ free range/backyard
(3)
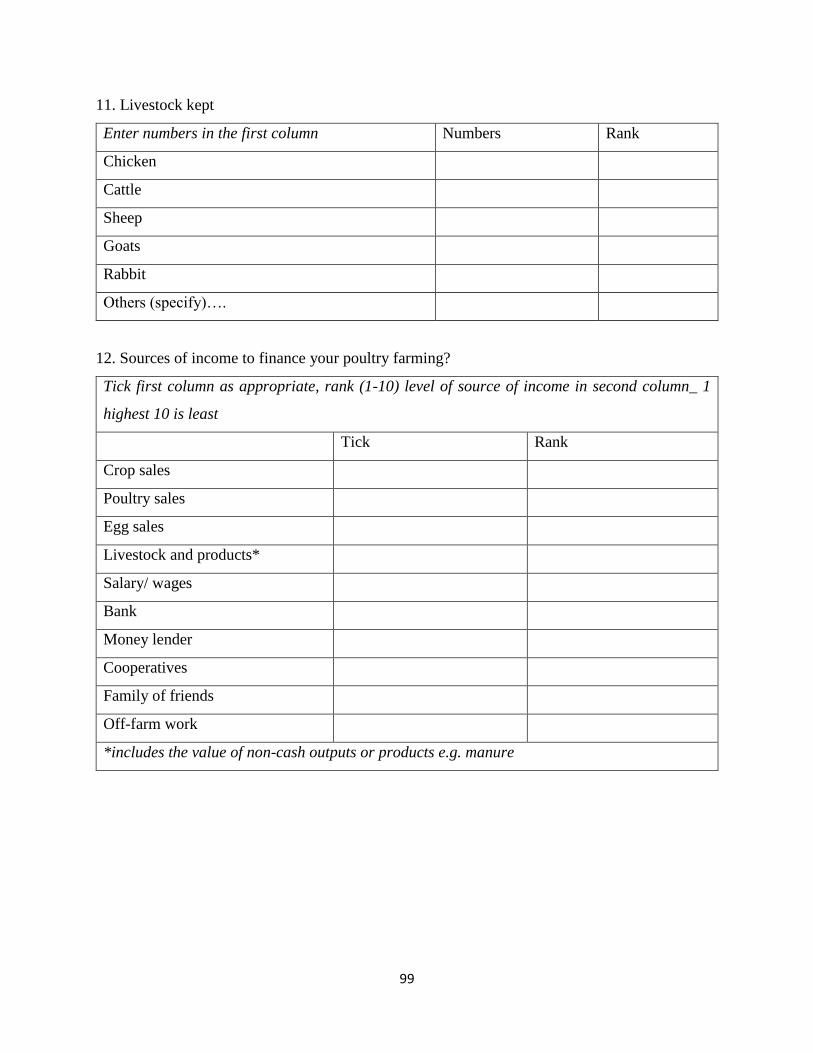
99
11. Livestock kept
Enter numbers in the first column Numbers Rank
Chicken
Cattle
Sheep
Goats
Rabbit
Others (specify)….
12. Sources of income to finance your poultry farming?
Tick first column as appropriate, rank (1-10) level of source of income in second column_ 1
highest 10 is least
Tick Rank
Crop sales
Poultry sales
Egg sales
Livestock and products*
Salary/ wages
Bank
Money lender
Cooperatives
Family of friends
Off-farm work
*includes the value of non-cash outputs or products e.g. manure
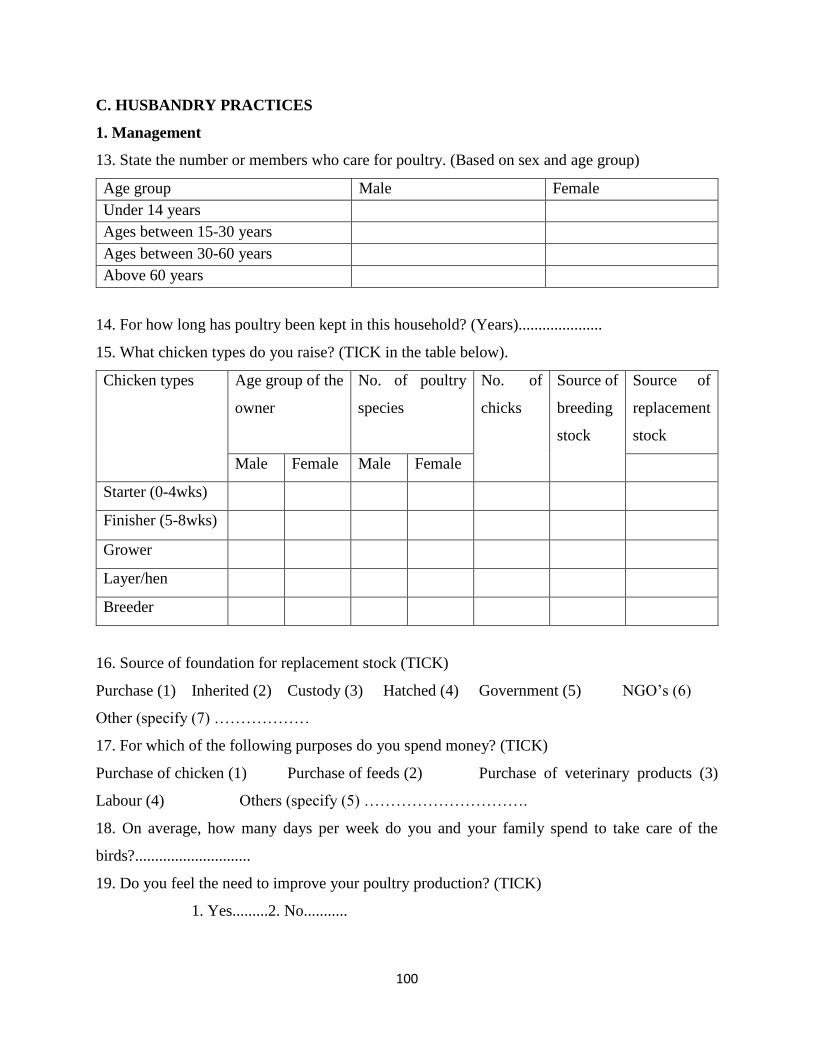
100
C. HUSBANDRY PRACTICES
1. Management
13. State the number or members who care for poultry. (Based on sex and age group)
Age group Male Female
Under 14 years
Ages between 15-30 years
Ages between 30-60 years
Above 60 years
14. For how long has poultry been kept in this household? (Years).....................
15. What chicken types do you raise? (TICK in the table below).
Chicken types Age group of the
owner
No. of poultry
species
No. of
chicks
Source of
breeding
stock
Source of
replacement
stock
Male Female Male Female
Starter (0-4wks)
Finisher (5-8wks)
Grower
Layer/hen
Breeder
16. Source of foundation for replacement stock (TICK)
Purchase (1) Inherited (2) Custody (3) Hatched (4) Government (5) NGO’s (6)
Other (specify (7) ………………
17. For which of the following purposes do you spend money? (TICK)
Purchase of chicken (1) Purchase of feeds (2) Purchase of veterinary products (3)
Labour (4) Others (specify (5) ………………………….
18. On average, how many days per week do you and your family spend to take care of the
birds?.............................
19. Do you feel the need to improve your poultry production? (TICK)
1. Yes.........2. No...........
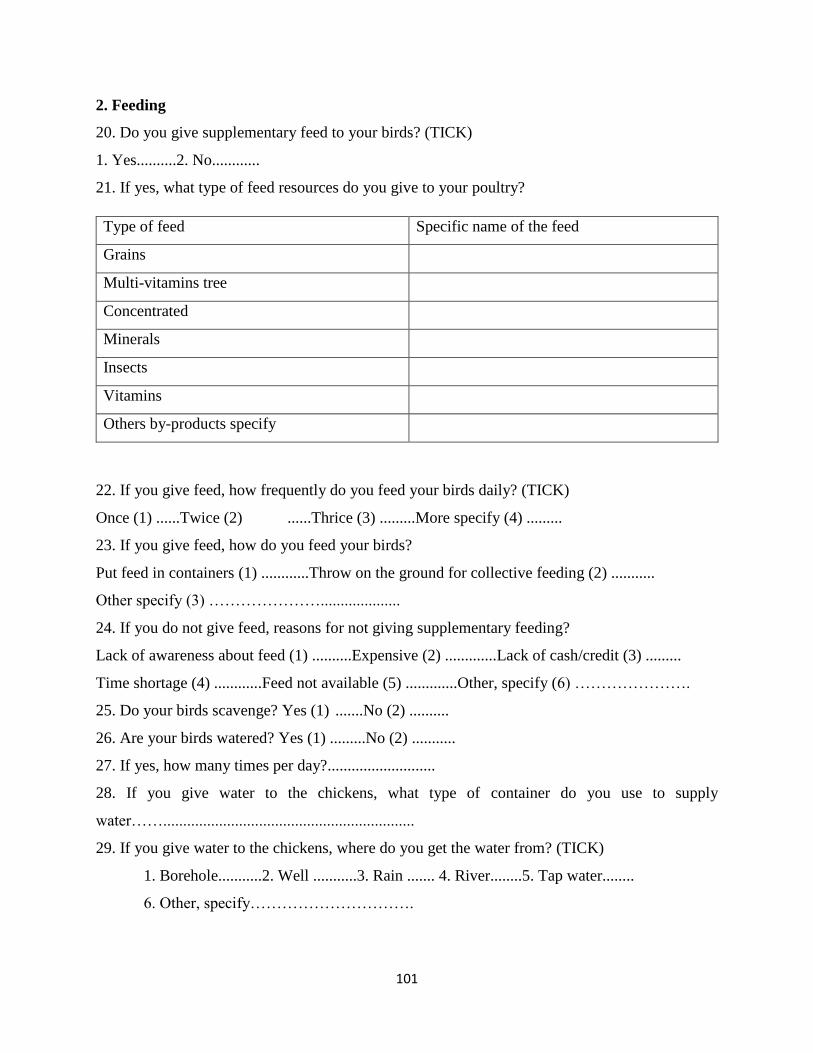
101
2. Feeding
20. Do you give supplementary feed to your birds? (TICK)
1. Yes..........2. No............
21. If yes, what type of feed resources do you give to your poultry?
Type of feed Specific name of the feed
Grains
Multi-vitamins tree
Concentrated
Minerals
Insects
Vitamins
Others by-products specify
22. If you give feed, how frequently do you feed your birds daily? (TICK)
Once (1) ......Twice (2) ......Thrice (3) .........More specify (4) .........
23. If you give feed, how do you feed your birds?
Put feed in containers (1) ............Throw on the ground for collective feeding (2) ...........
Other specify (3) …………………....................
24. If you do not give feed, reasons for not giving supplementary feeding?
Lack of awareness about feed (1) ..........Expensive (2) .............Lack of cash/credit (3) .........
Time shortage (4) ............Feed not available (5) .............Other, specify (6) ………………….
25. Do your birds scavenge? Yes (1) .......No (2) ..........
26. Are your birds watered? Yes (1) .........No (2) ...........
27. If yes, how many times per day?...........................
28. If you give water to the chickens, what type of container do you use to supply
water……...............................................................
29. If you give water to the chickens, where do you get the water from? (TICK)
1. Borehole...........2. Well ...........3. Rain ....... 4. River........5. Tap water........
6. Other, specify………………………….

102
3. Housing
30. Where do your birds rest at night? (TICK)
1. in the kitchen .........2. A room inside the house..........3. Perch on trees........4. Hand woven
basket...........5. In the house purposely made for chicken ..........6. Other,
specify………………………
31. If they rest in chicken house or cage, how frequently do you clean per week?................
4. Health and disease control
32. Do you experience serious disease outbreaks? (TICK)Yes (1) .......No (2) .......
33. What do you do when birds fall sick? (TICK)
1. Treat them myself.........2. Call in the veterinarian........3. Let birds to cure them
self.........4. Kill them immediately..........5. Consume them immediately .........6. Sell them
immediately...........7. Other, specify………….
34. Describe the common diseases you have experienced in your flock. If none tick this box
Local name or
Symptoms of
disease
English/
scientific
name of
diseases
Susceptible
species
(age)
Favorable
seasons
Severity
death
(age)
Are chicken
treated when
sick?
Treatment
given (if
known) Dry Wet
Yes No
1.
2.
3.
4.
5.
6.
7.
8.
35. Have your flock been vaccinated against prevalent disease? (TICK) 1. Yes.......2. No.........
If yes, which type of disease?.....................................................

103
36. Ecto-parasite and endo-parasite control for chickens
Tick the most
appropriate
Done routinely Done when need arise comments
Dry Wet Dry Wet
Ecto-parasites
Endo-parasites
D. Production and Breeding
37. Which breeds of chicken do you keep and which traits are considered important in each?
Breed Traits: (1) = prolificacy, (2) =mature weight, (3) = heat tolerance, (4) =
disease tolerance, (5) = mothering ability, (6) = mature weight, (7) = growth
rate, (8) =feed conversion efficiency, (9) = carcass weight, (10) = egg weight
Dwarf 1 2 3 4 5 6 7 8 9 10
Frizzed feather
Necked neck
Long legs
Improved breed
Others
38. Quality of traits perceived by owner as of primary importance (Rank 1- 4) (tick inside)
Trait Rank Breed 1 Breed 2
Performance Good Average Poor No
Opinion
Good Average Poor No
Opinion
High body weights
Big size
High growth rate
Reproduction
High fertility
High prolificacy
Functional
Drought tolerance
Heat tolerance
Temperament
Disease tolerance

104
Residual feed
conversion
efficiency
Aesthetic
Colour
Shape
Meat quality
39. Purpose of keeping chickens
Reasons tick Rank (1-6) Which brings in more income
1. Eggs
2. Meat
3. Breeding stock
4. Financing
5. Manure
6. social roles (i.e. ceremonies)
40. Flock structure
1. Are performance records (e.g. live weights, eggs hatched, eggs laid) available?
1. Yes......2. No........
If yes, which records do you keep…………………………………...................................?
Give the reasons for recording the traits. 1.………………………, 2. …………………….,
3.…………………………, 4…………………………., 5..........................…….
If records are not available, do you wish to keep or do performance recording?
1. Yes......, 2. No................
41. Flock Dynamic
Number of entries Number of exits
Hatched / died Class (1) ….
Bought /sold Class (1) …. (2) ….. (3)
Exchanged / lent
Slaughtered/ consumed
Received as gifts / stolen
Others
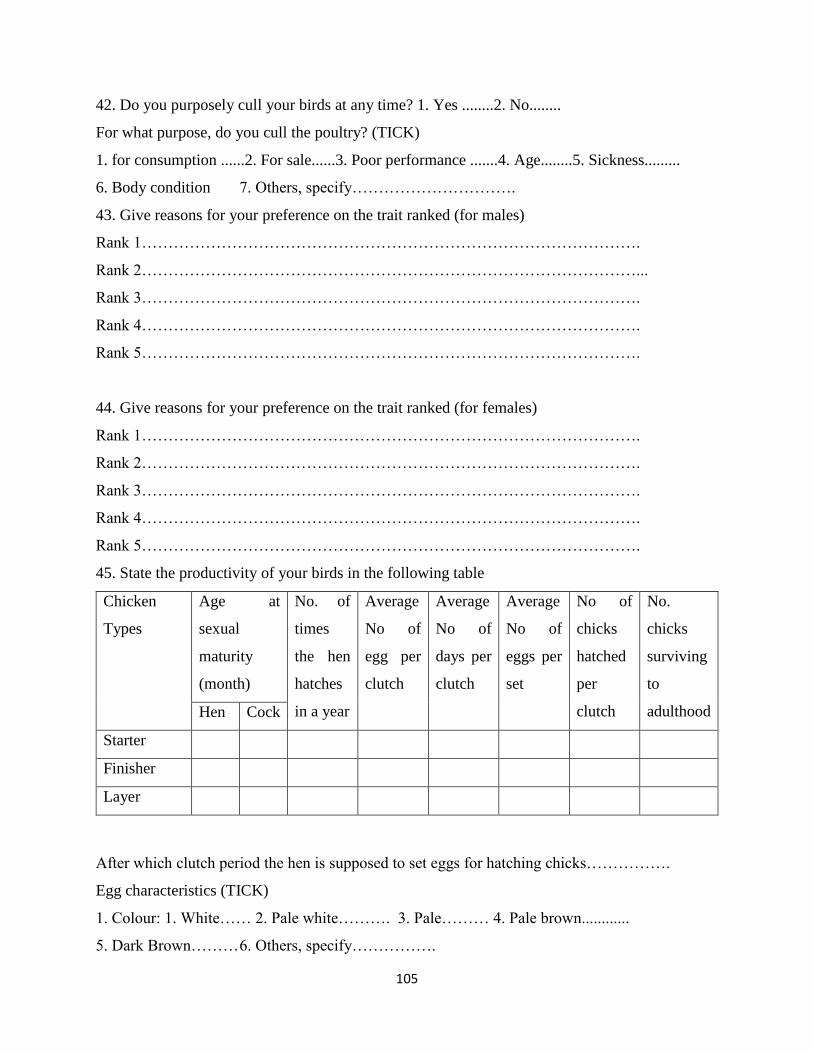
105
42. Do you purposely cull your birds at any time? 1. Yes ........2. No........
For what purpose, do you cull the poultry? (TICK)
1. for consumption ......2. For sale......3. Poor performance .......4. Age........5. Sickness.........
6. Body condition 7. Others, specify………………………….
43. Give reasons for your preference on the trait ranked (for males)
Rank 1………………………………………………………………………………….
Rank 2…………………………………………………………………………………...
Rank 3………………………………………………………………………………….
Rank 4………………………………………………………………………………….
Rank 5………………………………………………………………………………….
44. Give reasons for your preference on the trait ranked (for females)
Rank 1………………………………………………………………………………….
Rank 2………………………………………………………………………………….
Rank 3………………………………………………………………………………….
Rank 4………………………………………………………………………………….
Rank 5………………………………………………………………………………….
45. State the productivity of your birds in the following table
Chicken
Types
Age at
sexual
maturity
(month)
No. of
times
the hen
hatches
in a year
Average
No of
egg per
clutch
Average
No of
days per
clutch
Average
No of
eggs per
set
No of
chicks
hatched
per
clutch
No.
chicks
surviving
to
adulthood Hen Cock
Starter
Finisher
Layer
After which clutch period the hen is supposed to set eggs for hatching chicks…………….
Egg characteristics (TICK)
1. Colour: 1. White…… 2. Pale white………. 3. Pale……… 4. Pale brown............
5. Dark Brown……… 6. Others, specify…………….

106
Egg weight (in grams) ………………
What kind of bedding materials are used during incubation of eggs? ...............................
E. Extension
46. 1) did you actively seek advices on poultry farming in the last 12 months? (1) Yes......., (2)
No...........If yes go to 2 and if no go to 5.
2). If yes whom did you approach for the advice?
(1) sector livestock officer..........., (2) District veterinary officer................, (3) RAB extension
officer.................., (4) farmer co-operative...................., (5) Neighbour farmer....................., (6)
Radio/Television......................, (7) Newspapers......................., (8) church......................., (9)
Agricultural exhibition....................., (10) market......................, (11) friends.................., (12)
others, specify………….
3) Did you succeed in contacting the extension agent? (1) Yes.............., (2) No..............
4) If the farmer meets with extension agent note the normal meeting place?............................
Distance to meeting place (Km)…………….
Cost of transport (Rfw)………………….
5) If no why did you not seek advice? TICK reasons.
(1) Long distance......, (2) Time consuming........, (2) extension agent not available............,
(3) Too expensive........, (4) not necessary........., (5) other, specify………….
47. Constraints to poultry production
What are the main constraints to poultry production according to you?
Constraints Rank Comments
Diseases
Lack of breeding stock
Feed shortage
Lack of capital
Marketing/ price fluctuation
Theft
Lack of housing
Lack of information
Others (specify)
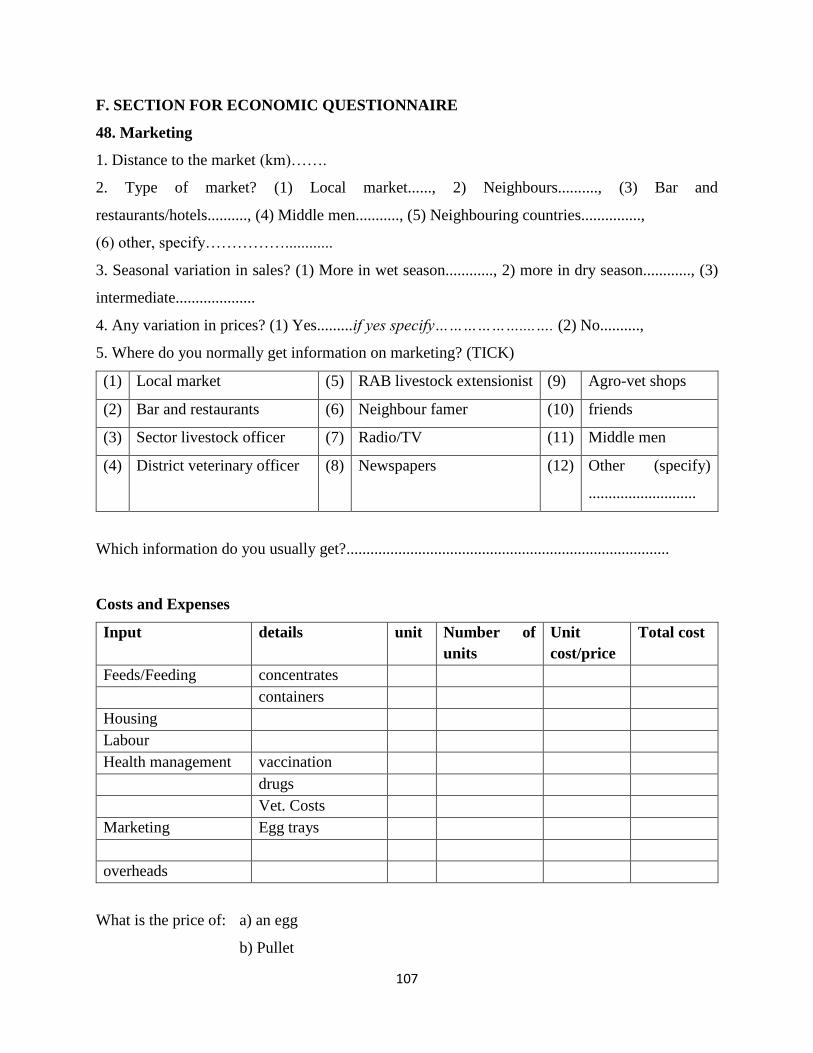
107
F. SECTION FOR ECONOMIC QUESTIONNAIRE
48. Marketing
1. Distance to the market (km)…….
2. Type of market? (1) Local market......, 2) Neighbours.........., (3) Bar and
restaurants/hotels.........., (4) Middle men..........., (5) Neighbouring countries...............,
(6) other, specify……………............
3. Seasonal variation in sales? (1) More in wet season............, 2) more in dry season............, (3)
intermediate....................
4. Any variation in prices? (1) Yes.........if yes specify………………....…. (2) No..........,
5. Where do you normally get information on marketing? (TICK)
(1) Local market (5) RAB livestock extensionist (9) Agro-vet shops
(2) Bar and restaurants (6) Neighbour famer (10) friends
(3) Sector livestock officer (7) Radio/TV (11) Middle men
(4) District veterinary officer (8) Newspapers (12) Other (specify)
...........................
Which information do you usually get?.................................................................................
Costs and Expenses
Input details unit Number of
units
Unit
cost/price
Total cost
Feeds/Feeding concentrates
containers
Housing
Labour
Health management vaccination
drugs
Vet. Costs
Marketing Egg trays
overheads
What is the price of: a) an egg
b) Pullet

108
c) Cockerel
d) Mature hen or cock
e) 1kg of body carcass
f) 1kg of manure
__________________________________________________________________________
THANK YOU FOR YOUR RESPONSES
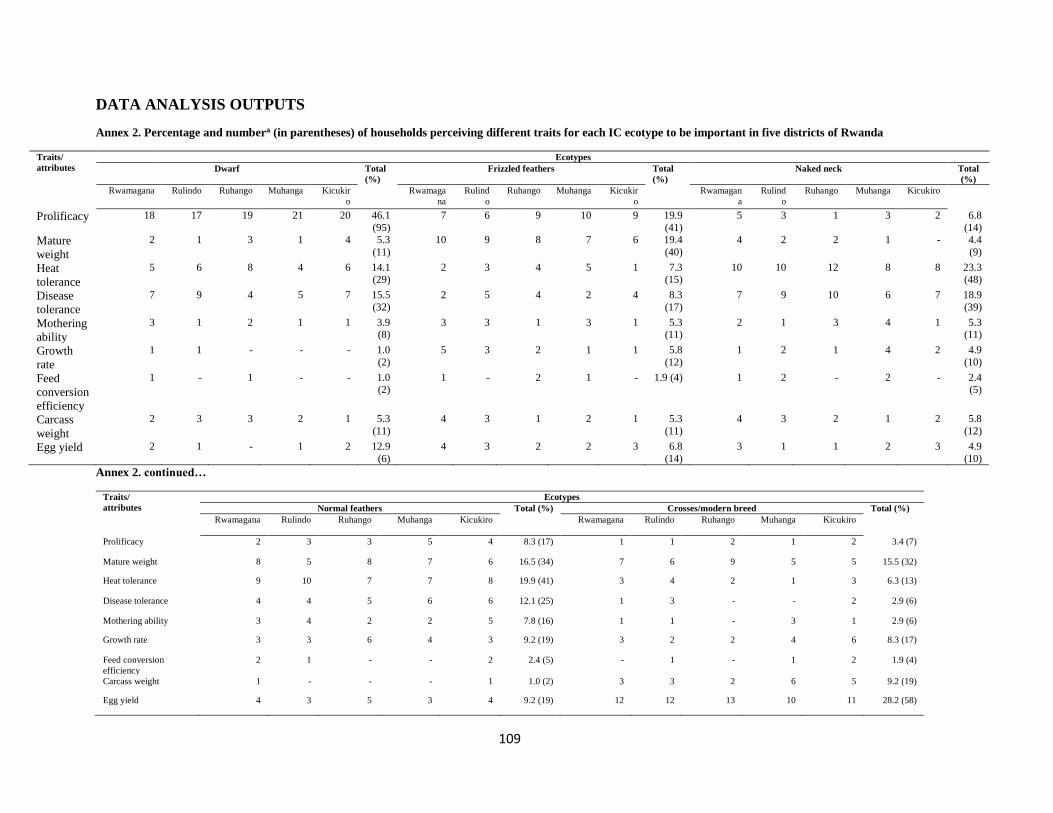
109
DATA ANALYSIS OUTPUTS
Annex 2. Percentage and numbera (in parentheses) of households perceiving different traits for each IC ecotype to be important in five districts of Rwanda
Traits/
attributes
Ecotypes
Dwarf Total
(%)
Frizzled feathers Total
(%)
Naked neck Total
(%)
Rwamagana Rulindo Ruhango Muhanga Kicukir
o
Rwamaga
na
Rulind
o
Ruhango Muhanga Kicukir
o
Rwamagan
a
Rulind
o
Ruhango Muhanga Kicukiro
Prolificacy 18 17 19 21 20 46.1
(95)
7 6 9 10 9 19.9
(41)
5 3 1 3 2 6.8
(14)
Mature
weight
2 1 3 1 4 5.3
(11)
10 9 8 7 6 19.4
(40)
4 2 2 1 - 4.4
(9)
Heat
tolerance
5 6 8 4 6 14.1 (29)
2 3 4 5 1 7.3 (15)
10 10 12 8 8 23.3 (48)
Disease
tolerance
7 9 4 5 7 15.5
(32)
2 5 4 2 4 8.3
(17)
7 9 10 6 7 18.9
(39)
Mothering
ability
3 1 2 1 1 3.9 (8)
3 3 1 3 1 5.3 (11)
2 1 3 4 1 5.3 (11)
Growth
rate
1 1 - - - 1.0
(2)
5 3 2 1 1 5.8
(12)
1 2 1 4 2 4.9
(10)
Feed
conversion
efficiency
1 - 1 - - 1.0 (2)
1 - 2 1 - 1.9 (4) 1 2 - 2 - 2.4 (5)
Carcass
weight
2 3 3 2 1 5.3
(11)
4 3 1 2 1 5.3
(11)
4 3 2 1 2 5.8
(12)
Egg yield 2 1 - 1 2 12.9
(6)
4 3 2 2 3 6.8
(14)
3 1 1 2 3 4.9
(10)
Annex 2. continued…
Traits/
attributes
Ecotypes
Normal feathers Total (%) Crosses/modern breed Total (%)
Rwamagana Rulindo Ruhango Muhanga Kicukiro Rwamagana Rulindo Ruhango Muhanga Kicukiro
Prolificacy 2 3 3 5 4 8.3 (17) 1 1 2 1 2 3.4 (7)
Mature weight 8 5 8 7 6 16.5 (34) 7 6 9 5 5 15.5 (32)
Heat tolerance 9 10 7 7 8 19.9 (41) 3 4 2 1 3 6.3 (13)
Disease tolerance 4 4 5 6 6 12.1 (25) 1 3 - - 2 2.9 (6)
Mothering ability 3 4 2 2 5 7.8 (16) 1 1 - 3 1 2.9 (6)
Growth rate 3 3 6 4 3 9.2 (19) 3 2 2 4 6 8.3 (17)
Feed conversion
efficiency
2 1 - - 2 2.4 (5) - 1 - 1 2 1.9 (4)
Carcass weight 1 - - - 1 1.0 (2) 3 3 2 6 5 9.2 (19)
Egg yield 4 3 5 3 4 9.2 (19) 12 12 13 10 11 28.2 (58)
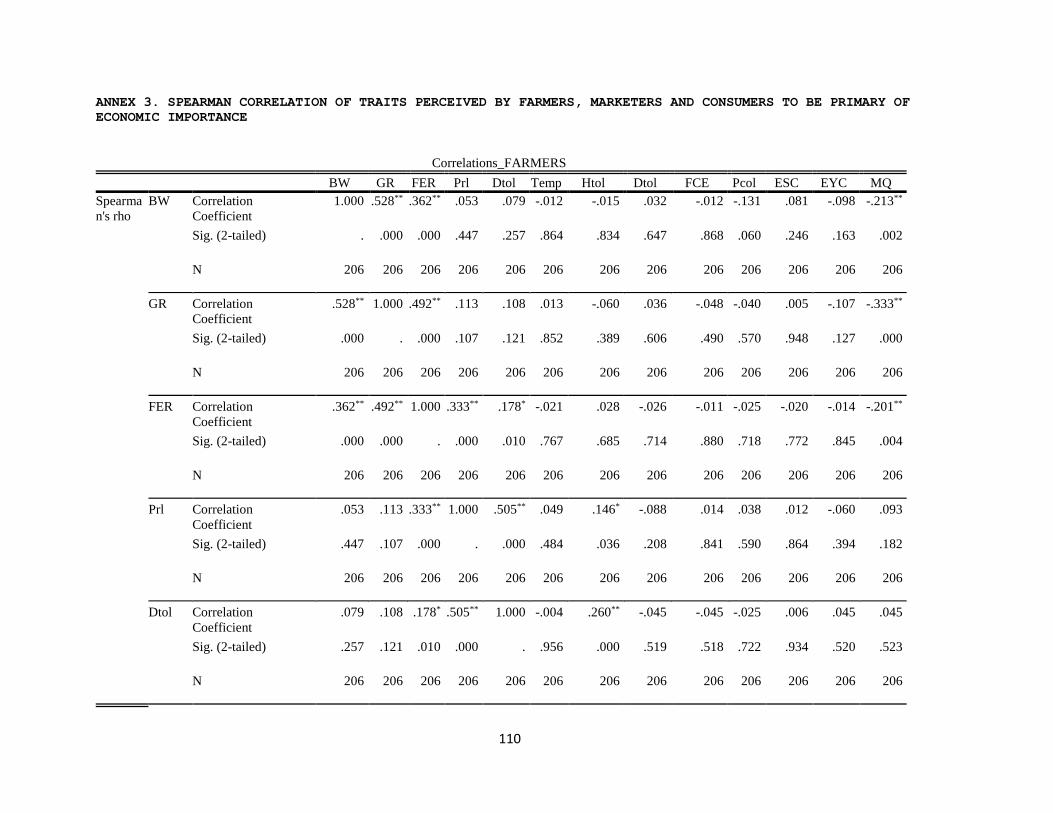
110
ANNEX 3. SPEARMAN CORRELATION OF TRAITS PERCEIVED BY FARMERS, MARKETERS AND CONSUMERS TO BE PRIMARY OF
ECONOMIC IMPORTANCE
Correlations_FARMERS
BW GR FER Prl Dtol Temp Htol Dtol FCE Pcol ESC EYC MQ
Spearma
n's rho
BW Correlation
Coefficient
1.000 .528** .362** .053 .079 -.012 -.015 .032 -.012 -.131 .081 -.098 -.213**
Sig. (2-tailed) . .000 .000 .447 .257 .864 .834 .647 .868 .060 .246 .163 .002
N 206 206 206 206 206 206 206 206 206 206 206 206 206
GR Correlation
Coefficient
.528** 1.000 .492** .113 .108 .013 -.060 .036 -.048 -.040 .005 -.107 -.333**
Sig. (2-tailed) .000 . .000 .107 .121 .852 .389 .606 .490 .570 .948 .127 .000
N 206 206 206 206 206 206 206 206 206 206 206 206 206
FER Correlation
Coefficient
.362** .492** 1.000 .333** .178* -.021 .028 -.026 -.011 -.025 -.020 -.014 -.201**
Sig. (2-tailed) .000 .000 . .000 .010 .767 .685 .714 .880 .718 .772 .845 .004
N 206 206 206 206 206 206 206 206 206 206 206 206 206
Prl Correlation
Coefficient
.053 .113 .333** 1.000 .505** .049 .146* -.088 .014 .038 .012 -.060 .093
Sig. (2-tailed) .447 .107 .000 . .000 .484 .036 .208 .841 .590 .864 .394 .182
N 206 206 206 206 206 206 206 206 206 206 206 206 206
Dtol Correlation
Coefficient
.079 .108 .178* .505** 1.000 -.004 .260** -.045 -.045 -.025 .006 .045 .045
Sig. (2-tailed) .257 .121 .010 .000 . .956 .000 .519 .518 .722 .934 .520 .523
N 206 206 206 206 206 206 206 206 206 206 206 206 206
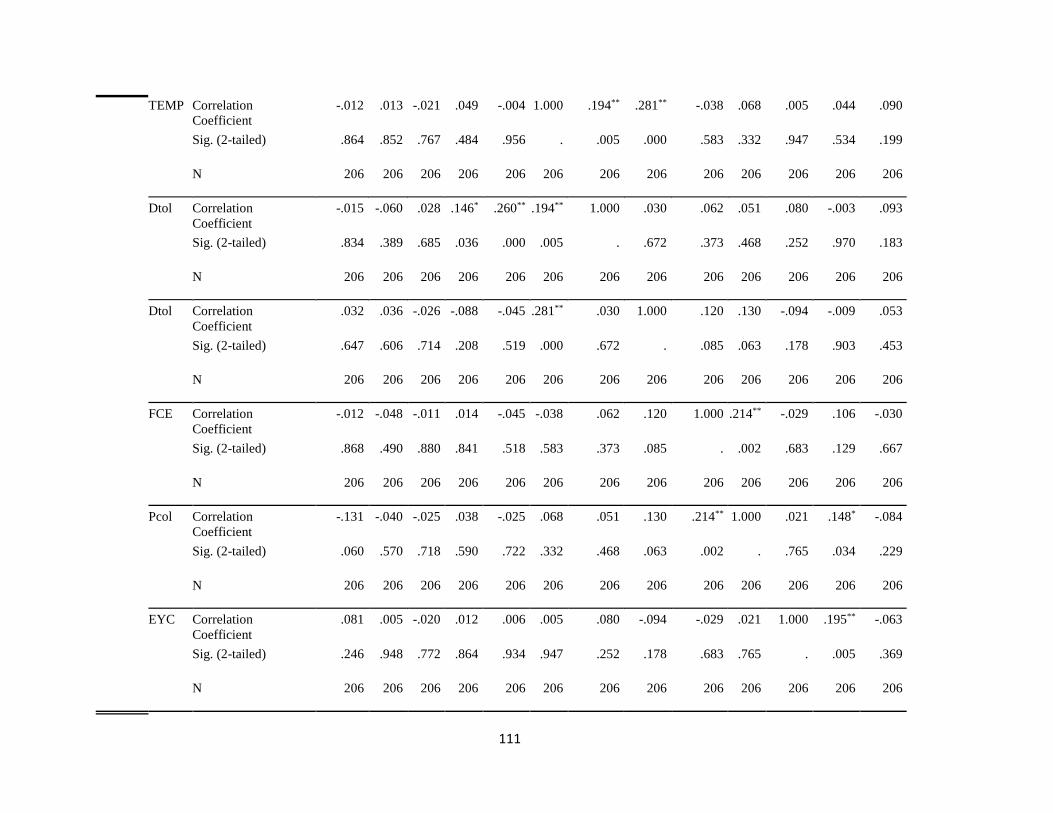
111
TEMP Correlation
Coefficient
-.012 .013 -.021 .049 -.004 1.000 .194** .281** -.038 .068 .005 .044 .090
Sig. (2-tailed) .864 .852 .767 .484 .956 . .005 .000 .583 .332 .947 .534 .199
N 206 206 206 206 206 206 206 206 206 206 206 206 206
Dtol Correlation
Coefficient
-.015 -.060 .028 .146* .260** .194** 1.000 .030 .062 .051 .080 -.003 .093
Sig. (2-tailed) .834 .389 .685 .036 .000 .005 . .672 .373 .468 .252 .970 .183
N 206 206 206 206 206 206 206 206 206 206 206 206 206
Dtol Correlation
Coefficient
.032 .036 -.026 -.088 -.045 .281** .030 1.000 .120 .130 -.094 -.009 .053
Sig. (2-tailed) .647 .606 .714 .208 .519 .000 .672 . .085 .063 .178 .903 .453
N 206 206 206 206 206 206 206 206 206 206 206 206 206
FCE Correlation
Coefficient
-.012 -.048 -.011 .014 -.045 -.038 .062 .120 1.000 .214** -.029 .106 -.030
Sig. (2-tailed) .868 .490 .880 .841 .518 .583 .373 .085 . .002 .683 .129 .667
N 206 206 206 206 206 206 206 206 206 206 206 206 206
Pcol Correlation
Coefficient
-.131 -.040 -.025 .038 -.025 .068 .051 .130 .214** 1.000 .021 .148* -.084
Sig. (2-tailed) .060 .570 .718 .590 .722 .332 .468 .063 .002 . .765 .034 .229
N 206 206 206 206 206 206 206 206 206 206 206 206 206
EYC Correlation
Coefficient
.081 .005 -.020 .012 .006 .005 .080 -.094 -.029 .021 1.000 .195** -.063
Sig. (2-tailed) .246 .948 .772 .864 .934 .947 .252 .178 .683 .765 . .005 .369
N 206 206 206 206 206 206 206 206 206 206 206 206 206
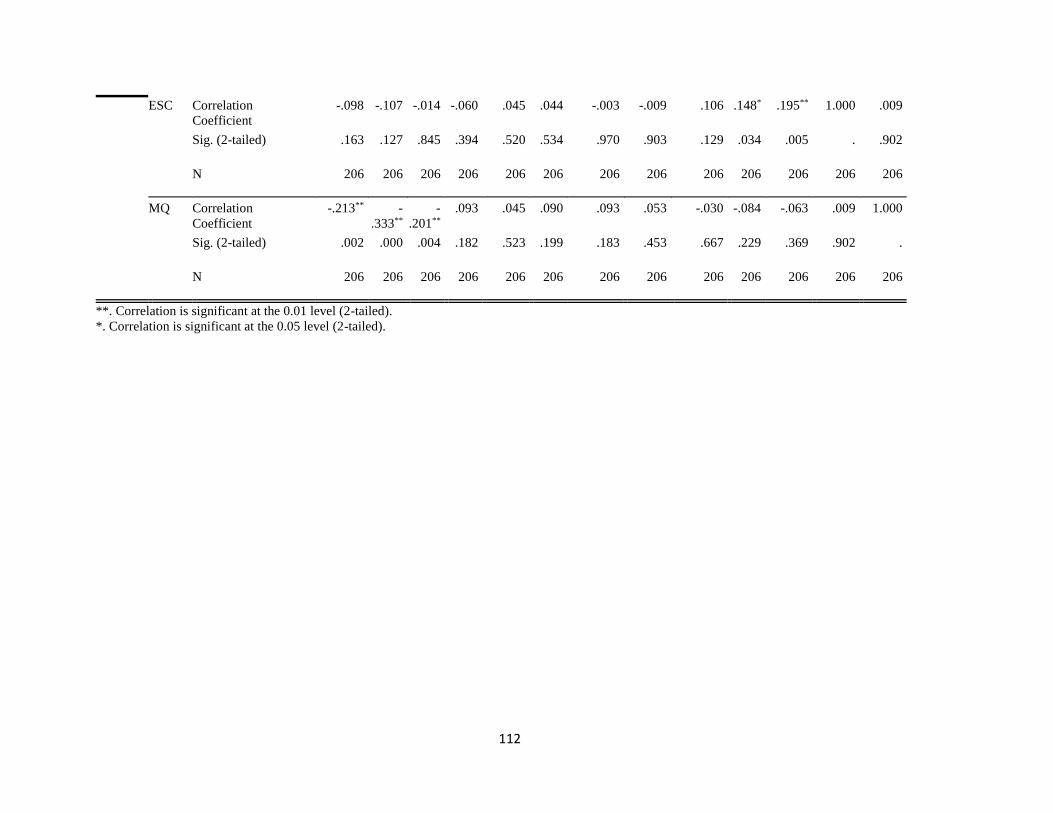
112
ESC Correlation
Coefficient
-.098 -.107 -.014 -.060 .045 .044 -.003 -.009 .106 .148* .195** 1.000 .009
Sig. (2-tailed) .163 .127 .845 .394 .520 .534 .970 .903 .129 .034 .005 . .902
N 206 206 206 206 206 206 206 206 206 206 206 206 206
MQ Correlation
Coefficient
-.213** -
.333**
-
.201**
.093 .045 .090 .093 .053 -.030 -.084 -.063 .009 1.000
Sig. (2-tailed) .002 .000 .004 .182 .523 .199 .183 .453 .667 .229 .369 .902 .
N 206 206 206 206 206 206 206 206 206 206 206 206 206
**. Correlation is significant at the 0.01 level (2-tailed).
*. Correlation is significant at the 0.05 level (2-tailed).
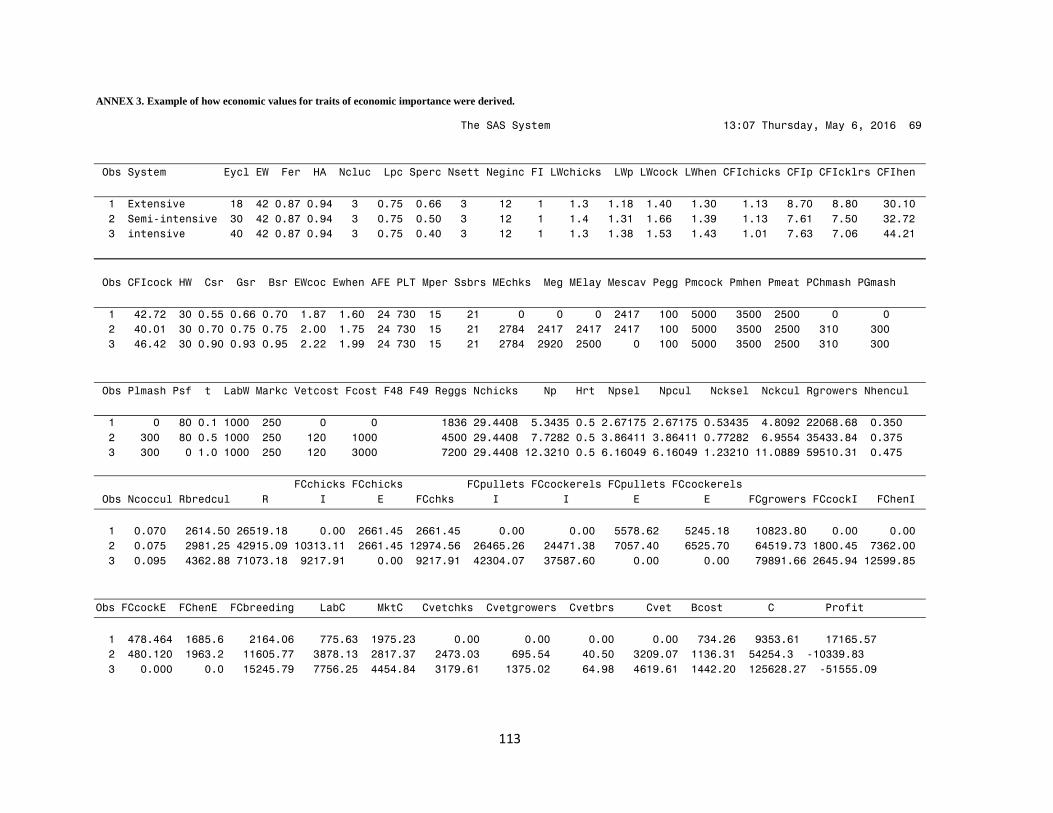
113
ANNEX 3. Example of how economic values for traits of economic importance were derived.
The SAS System 13:07 Thursday, May 6, 2016 69
Obs System Eycl EW Fer HA Ncluc Lpc Sperc Nsett Neginc FI LWchicks LWp LWcock LWhen CFIchicks CFIp CFIcklrs CFIhen
1 Extensive 18 42 0.87 0.94 3 0.75 0.66 3 12 1 1.3 1.18 1.40 1.30 1.13 8.70 8.80 30.10
2 Semi-intensive 30 42 0.87 0.94 3 0.75 0.50 3 12 1 1.4 1.31 1.66 1.39 1.13 7.61 7.50 32.72
3 intensive 40 42 0.87 0.94 3 0.75 0.40 3 12 1 1.3 1.38 1.53 1.43 1.01 7.63 7.06 44.21
Obs CFIcock HW Csr Gsr Bsr EWcoc Ewhen AFE PLT Mper Ssbrs MEchks Meg MElay Mescav Pegg Pmcock Pmhen Pmeat PChmash PGmash
1 42.72 30 0.55 0.66 0.70 1.87 1.60 24 730 15 21 0 0 0 2417 100 5000 3500 2500 0 0
2 40.01 30 0.70 0.75 0.75 2.00 1.75 24 730 15 21 2784 2417 2417 2417 100 5000 3500 2500 310 300
3 46.42 30 0.90 0.93 0.95 2.22 1.99 24 730 15 21 2784 2920 2500 0 100 5000 3500 2500 310 300
Obs Plmash Psf t LabW Markc Vetcost Fcost F48 F49 Reggs Nchicks Np Hrt Npsel Npcul Ncksel Nckcul Rgrowers Nhencul
1 0 80 0.1 1000 250 0 0 1836 29.4408 5.3435 0.5 2.67175 2.67175 0.53435 4.8092 22068.68 0.350
2 300 80 0.5 1000 250 120 1000 4500 29.4408 7.7282 0.5 3.86411 3.86411 0.77282 6.9554 35433.84 0.375
3 300 0 1.0 1000 250 120 3000 7200 29.4408 12.3210 0.5 6.16049 6.16049 1.23210 11.0889 59510.31 0.475
FCchicks FCchicks FCpullets FCcockerels FCpullets FCcockerels
Obs Ncoccul Rbredcul R I E FCchks I I E E FCgrowers FCcockI FChenI
1 0.070 2614.50 26519.18 0.00 2661.45 2661.45 0.00 0.00 5578.62 5245.18 10823.80 0.00 0.00
2 0.075 2981.25 42915.09 10313.11 2661.45 12974.56 26465.26 24471.38 7057.40 6525.70 64519.73 1800.45 7362.00
3 0.095 4362.88 71073.18 9217.91 0.00 9217.91 42304.07 37587.60 0.00 0.00 79891.66 2645.94 12599.85
Obs FCcockE FChenE FCbreeding LabC MktC Cvetchks Cvetgrowers Cvetbrs Cvet Bcost C Profit
1 478.464 1685.6 2164.06 775.63 1975.23 0.00 0.00 0.00 0.00 734.26 9353.61 17165.57
2 480.120 1963.2 11605.77 3878.13 2817.37 2473.03 695.54 40.50 3209.07 1136.31 54254.3 -10339.83
3 0.000 0.0 15245.79 7756.25 4454.84 3179.61 1375.02 64.98 4619.61 1442.20 125628.27 -51555.09
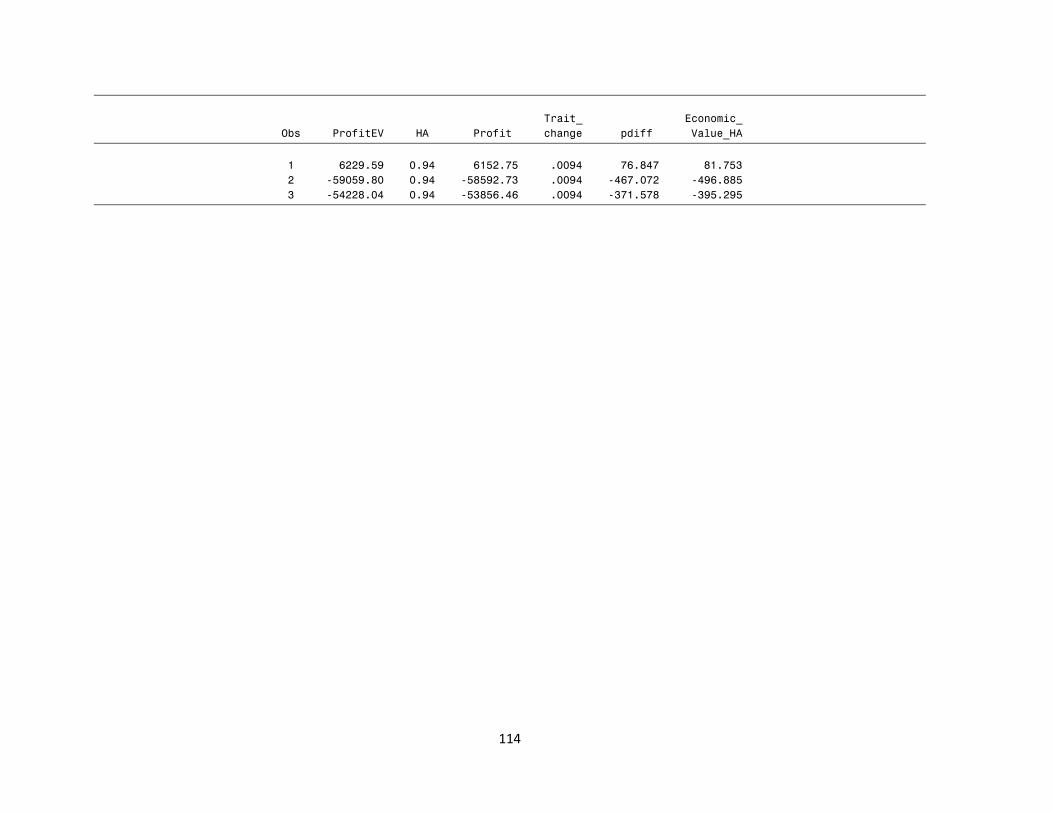
114
Trait_ Economic_
Obs ProfitEV HA Profit change pdiff Value_HA
1 6229.59 0.94 6152.75 .0094 76.847 81.753
2 -59059.80 0.94 -58592.73 .0094 -467.072 -496.885
3 -54228.04 0.94 -53856.46 .0094 -371.578 -395.295