Dietary Reference Intakes for Japanese -2010- - … · Dietary Reference Intakes for Japanese...
46
1 Dietary Reference Intakes for Japanese -2010- The summary report from the Scientific Committee of “Dietary Reference intakes for Japanese” National Institute of Health and Nutrition Department of Nutritional Epidemiology
-
Upload
nguyenhanh -
Category
Documents
-
view
230 -
download
0
Transcript of Dietary Reference Intakes for Japanese -2010- - … · Dietary Reference Intakes for Japanese...

1
Dietary Reference Intakes for Japanese
-2010- The summary report from the Scientific Committee of
“Dietary Reference intakes for Japanese”
National Institute of Health and Nutrition Department of Nutritional Epidemiology

2
Copyright ©National Institute of Health and Nutrition, Japan 2011-2012
All rights reserved by the National Institute of Health and Nutrition, Japan. Copyright is protected by
the Japan Copyright Act and international treaties.
All or part of the contents of this document can be quoted, reprinted, and reproduced as long as the
source is cited, such as for private use or quotation, according to the Copyright Act. All or part of the
contents of this document cannot be changed without permission from the National Institute of
Health and Nutrition.
Dietary Reference Intakes for Japanese -2010- is the government report that is available on the web:
http://www.mhlw.go.jp/bunya/kenkou/sessyu-kijun.html [Report in Japanese]
The following members take full responsibility for writing this article:
Megumi Tsubota-Utsugi, Ph.D, MPH, R.D,
Eri Imai, Ph.D, R.D,
Makiko Nakade, Ph.D, R.D,
Nobuyo Tsuboyama-Kasaoka, Ph.D, R.D,
Akemi Morita, Ph.D, M.D, and
Shinkan Tokudome, Ph.D, M.D.
1
1. Historical overview
In Japan, the Recommended Dietary Allowance (RDA) was first established in 1970, after
which revisions have been made every five years by the Ministry of Health and Welfare (MHW).
The concept of Dietary Reference Intakes (DRIs) was first introduced in the 6th revision of the RDA
(2000-2004). In order to more comprehensively follow the approach of the 6th revision of the RDA,
the 7th revision was established as the “Dietary Reference Intakes for Japanese (DRIs-J) 2005” by the
Ministry of Health, Labour and Welfare (MHLW), based on the Health Promotion Law.
The DRIs-J 2005 have been prepared not only to prevent energy or nutrient deficiencies that
may be caused by insufficient intake of energy or nutrients, but also for the primary prevention of
lifestyle-related diseases caused by excess and/or imbalanced consumption of energy and nutrients. It
is expected that those who use the DRIs-J should not become too focused on the values themselves,
but should rather have an accurate understanding of the concept of the DRIs-J and apply them
correctly. In that sense, the current DRIs-J are not to be used as a fact sheet, but should be used for
various nutrition-related practices.
The current version is the DRIs-J 2010.
1) Differences from previous RDAs.
DRIs-J consist of six reference values (one for energy and five for nutrients) to prevent
deficiencies, adverse effects by excess intake, and lifestyle-related diseases. The
recommended dietary intake level is shown by a “Range” and is not a one-point value.
DRIs-J were established on a scientific basis. The project to establish DRIs-J 2010
started in April 2008. A total of more than sixty scientists and assistants with varied
expertise in Japan were asked to participate in this project by the Japanese Ministry of
Health, Labour, and Welfare. Using a comprehensive systematic review, over 15,000
publications were collected and reviewed.
Table 1. Historical Overview of the Development of Dietary Recommendations in Japan
Versions Periods of use Recommendations made
RDAs 1st version Apr.1970-Mar.1975 Aug. 1969
RDAs 1st revision Apr.1975-Mar.1980 Mar. 1975
RDAs 2nd revision Apr.1981-Mar.1985 Aug. 1979
RDAs 3rd revision Apr.1985-Mar.1990 Aug. 1984
RDAs 4th revision Apr.1990-Mar.1995 Sep. 1989
RDAs 5th revision Apr.1995-Mar.2000 Mar. 1994
RDAs 6th revision Apr.2000-Mar.2005 Jun. 1999
DRIs-J 2005 Apr.2005-Mar.2010 Oct. 2004
DRIs-J 2010 revision Apr.2010-Mar.2015 May. 2009

2
2. Concept of DRIs-J
When making use of DRIs-J, the following basic theories are important.
1) Purpose
The DRIs-J are designed to present reference values for healthy individuals and groups for
intake of energy and 34 nutrients:
To maintain and promote health
To prevent lifestyle-related diseases due to insufficient, excess, and/or imbalanced
consumption of energy and nutrients
2) Target population
Healthy individuals and groups
Including those who have certain mild ailments (e.g. hypertension, diabetes, or
hyperlipidemia), without dietary education, diet restrictions, or prescribed diets. If the target
populations have dietary education, diet restrictions, or prescribed diets, the disease-specific
clinical practice guidelines are given priority and used, and DRIs-J should be used as an
auxiliary tool.
3) Sources of Intake
“Habitual daily intake” or long-term daily intake of energy and nutrients from dietary sources
and dietary supplements.
IT IS NOT recommended that values be compared with the nutrient contents of one day’s
intake or those of one dish or meal.
4) The DRIs-J categories
Inclusion criteria of DRI-J for energy and nutrients:
Energy is essential for health and life
Nutrients were selected based on the following criteria:
a) Essential for life and the maintenance and/or improvement of health
b) Values are scientifically reliable or have achieved global consensus

3
Figure 1. Estimated Energy Requirement (EER)
Estimated Energy Requirement
Habitual intake
Ris
k of
def
icie
ncy
Ris
k of
exc
ess
inta
keA curve showing the risk of deficiency
A curve showing the risk of excess intake
EER
1.0
0.5
0.0
Energy
Figure 1 illustrates the concept of Estimated Energy Requirement (EER).
EER is defined as the average dietary energy intake that is assumed to maintain energy
balance and good health in a healthy adult of a defined age, sex, weight, height, and physical activity
level (PAL). There is one reference value because energy intake below the EER would be expected to
result in weight-loss, leanness, and protein-energy malnutrition, while energy intake above the EER
would increase the probability of weight gain.
The doubly-labeled water (DLW) method is used to determine energy expenditure by
healthy individuals who maintain normal daily activities. Due to financial and technical constraints,
the EER for an adult is calculated from his/her Basal Metabolic Rate (BMR) (= reference basal
metabolic rate × reference body weight) and PAL.
EER for adults (kcal/day) = BMR×PAL
For infants and children in the growth stage, the EER includes the caloric intake needed to
maintain the current body weight and that necessary for growth. For pregnant women and lactating
mothers, additional energy values are needed for fetal growth and lactation in order to meet the EER.
Table 3 indicates the EER values by sex, age group, and PAL.

4
Nutrients
Reference values for 34 nutrients were developed for the DRIs-J 2010. Nutrient values that
could not be established due to insufficient evidence were not included. Since the DRIs were based
on the results of reliable studies, the findings were integrated in accordance with the chart introduced
in Table 2. The DRIs include the EER, Estimated Average Requirement (EAR), RDA, Adequate
Intake (AI), Tolerable Upper Intake Level (UL), and Tentative Dietary Goal for Preventing
Lifestyle-related Diseases (DG).
Figure 2 illustrates the definitions of each of the DRIs for nutrient intake.
Specific definitions were given to DRIs as follows:
a) Deficiency:
Estimated Average Requirement (EAR) – an average requirement (50%) for the
nutrient for each age and sex group
Recommended Dietary Allowance (RDA) – an intake that covers the needs of 97.5%
of the population, for each age and sex group. The RDA was calculated by EAR +
2SD EAR. However, the variance is usually unknown, so the coefficient of variation is
adopted instead
Adequate Intake (AI) – a less well-defined value, generally the median of the
population without evidence of deficiency
b) Adverse effects:
Tolerable Upper Intake Level (UL) – the highest level of intake that can be tolerated
without the possibility of causing adverse effects
c) Primary prevention of lifestyle-related diseases:
Tentative Dietary Goal for Preventing Lifestyle-related Diseases (DG) – the value
for primary prevention of lifestyle-related diseases
Table 2. Conceptual differences in reference values
EAR, RDA, AI UL DG
Purpose Avoidance of deficiencies
by insufficient intake
Avoidance of adverse
effects by excess intake
Prevention of
lifestyle-related diseases
Research methods Experimental and
epidemiological studies Case reports Epidemiological studies
Timescale to develop
health problems Several months Several years
Number of reports Extremely rare ‐ many Extremely rare ‐ few Many

5
Amount of habitual intake
0%
Ris
k of
def
icie
ncy
EAR RDA AI UL
No added benefit, or harm.Sufficient for
most people andsurplus for certain people
No data for humans
100%
50%
Figure 2. Intake range for nutrientsEAR, estimated average requirement; RDA, recommended dietary allowance; AI, adequate intake; UL, tolerable upper intake level
2-3%
Risk of excess intake, e.g., supplement users
0%
Ris
k of
exc
ess
inta
ke
100%
Range of nutrient needs for individual or group
Intake from food items alone is difficult.
A DG has been set for several macronutrients and minerals that have been shown in
epidemiologic studies and is defined as the intake level (or range) that Japanese should currently
consume to primarily prevent lifestyle-related diseases. Thus, DG is unique to Japan, while others
are similar to those used in other countries.
In the DRIs, particular emphasis was placed on primary prevention of cardiovascular
diseases (e.g., hypertension, hyperlipidemia, stroke, and myocardial infarction) and cancer (such as
stomach cancer). Specifically, it was directed towards the intake of protein, fat (fatty acids),
cholesterol, carbohydrates, dietary fiber, calcium, sodium (salt), and potassium.
Table 3 shows the list of established DRIs for each nutrient for persons at least 1 year of age.
The appendix also demonstrates the reference values for each nutrient by sex and age.
Since the meaning of deficiency is different from nutrient to nutrient, the calculation
methods of EAR differ for each nutrient. Furthermore, it should be noted that several nutrients, i.e.,
vitamin C and calcium, have implications beyond the above definitions. For example, EAR and RDA
for vitamin C in adults were set at 85 mg/d and 100 mg/d, respectively. The disease caused by
vitamin C deficiency is scurvy; however, it is sufficient to take 6-12 mg/d of vitamin C to prevent it.
Reference values of vitamin C also include the prevention of cardiovascular diseases: that is, the
current values include the implications of the DG rather than EAR and RDA.

6
Using nutrient-specific calculation methods for the development of EAR
>Balance studies: protein, sodium, magnesium, chromium, and molybdenum
>Factorial method: calcium, iron, zinc, and iodine
>Biomarkers of nutritional status: vitamin A, vitamin B1, vitamin B2, niacin, vitamin B6,
vitamin B12, folic acid, vitamin C, copper, and selenium

7
Table 3. Nutrients for which DRIs have been established (persons > 1 year old)
Nutrients EAR RDA AI UL DG
Protein ○ ○ - - -
Fat
Total fat
- - - - ○ Saturated fatty
acids
Cholesterol
n-6 fatty acids - - ○ - ○
n-3 fatty acids
Carbohydrates
Carbohydrates - - - - ○
Dietary fibers
Vitamins
Fat-soluble
Vitamin A ○ ○ - ○ -
Vitamin D and E - - ○ ○ -
Vitamin K - - ○ - -
Water-soluble
Vitamin B1, B2,
B12, ○ ○ - - -
and C
Niacin ○ ○ - ○ -
Vitamin B6
Folic acid ○ ○ - ○* -
Pantothenic acid - - ○ - -
Biotin
Minerals
Macro
Sodium ○ - - - ○
Potassium - - ○ - ○
Calcium ○ ○ - ○ -
Magnesium ○ ○ - ○* -
Phosphorus - - ○ ○ -
Micro
Iron, Zinc,
Copper, Iodine,
Selenium,
Molybdenum
○ ○ - ○ -
Manganese - - ○ ○ -
Chromium ○ ○ - - -
* Defined as intake from sources other than daily food items.
EAR, estimated average requirement; RDA, recommended dietary allowance; AI, adequate intake; UL, tolerable upper intake level, and DG,
tentative dietary goal for preventing non-communicable diseases

8
3. Application and implementation of DRIs-J
This section includes several tips for promoting effective use of DRIs-J 2010.
The applications of DRIs-J were broadly classified into “improvement of diet” and
“management of food services”. Common and important elements of these applications take turns in
the Assessment > Plan > Implementation cycle.
1) Improvement of diet
The steps in “improvement of diet” include assessment of dietary intake, planning, and
implementation for dietary improvement. The theories of application differ for individuals and
groups.
a) Individuals
For assessment of insufficient or excess intake of energy, changes in body weight and
body mass index (BMI) are used. For planning and implementation, the focus should
be maintenance of a normal range of BMI (normally 18.5-25.0 kg/m2). Ideally,
measurements and reviews of body weight and BMI should be done twice or more
within several-month intervals.
For assessment of adequate or inadequate intake of nutrients, EAR and RDA are used.
If these values are unavailable, AI is used instead. However, AI cannot be used as an
evaluation of risk of insufficiency by its definition. Assessment using AI requires
careful attention when intake is below AI. For planning and implementation, RDA is
used for nutrients. UL is used for preventing excess intake.
b) Groups
For assessment of insufficient or excess energy intake, the BMI distribution is used.
For planning and implementation, the focus should be on increasing the percentage of
individuals within a normal range of BMI (normally 18.5-25.0 kg/m2, but this is
dependent on the characteristics of the group).
For assessment of adequate or inadequate intake of nutrients, EAR values are used. If
these values are unavailable, AI is used carefully instead. Using a cut-point method or
a probability method, the percentage of people who report values below the EAR
should be calculated. Since several measurement errors usually occur in the
assessment of groups, careful monitoring of the construction of the dietary survey is
needed. For planning and implementation, EAR or AI is used. UL is used for
preventing excess intake.
To prevent lifestyle-related diseases, DG should be used for assessment, planning, and
implementation.

9
There are various ways of assessment, such as: a) anthropometric measurements, especially
body weight and BMI; b) data of clinical examinations and biochemical analyses; and c)
ascertainment of dietary intake. Unfortunately, because a perfect method to evaluate habitual dietary
intake has not been established, it is important to know that there are measurement errors in dietary
assessment, such as under- or over-reporting and day-to-day variation.
2) Management of food services
Table 4 demonstrates the basic concept for the working procedures for applying DRIs-J in
food services. The important points are to undertake information gathering of the characteristics of
the group (assessment), decide an appropriate plan based on the assessment, create menus (plan), and
serve quality-controlled meals (do), and feedback within regular intervals.
Table 4. Basic concept of working procedure for applying DRIs-J in food service
Orders Basic concept of working procedure
1. Selection of subject group to
serve meals and identify
characteristics of the group
-- Selecting subject group to serve meals.
-- Gathering information and distribution about group
characteristics (sex, age groups, height, weight, and
PAL).
2. Assessment of dietary intake -- Assessing dietary intake (every meal and snack).
Obtain the proportion of dietary intake from food
services in whole meal.
-- When it is difficult to obtain the above data, , only the
meals that are provided by food services, assessing the
meals, assessing a few members of the group, or using
the data from other groups with similar characteristics
could be used.
3. Dietary plan (nutrient base) -- Make a dietary plan based on the results of the above
assessment.
4. Dietary plan (food base) -- Make a specific menu plan.
5. Serving meals -- Serve meals under appropriate quality control.
6. Check dietary intakes -- Obtain dietary intake of the subject (or subject
groups).
7. Revise dietary plan -- Verify and feedback #3 based on the results of #6 and
recheck of #1.
10
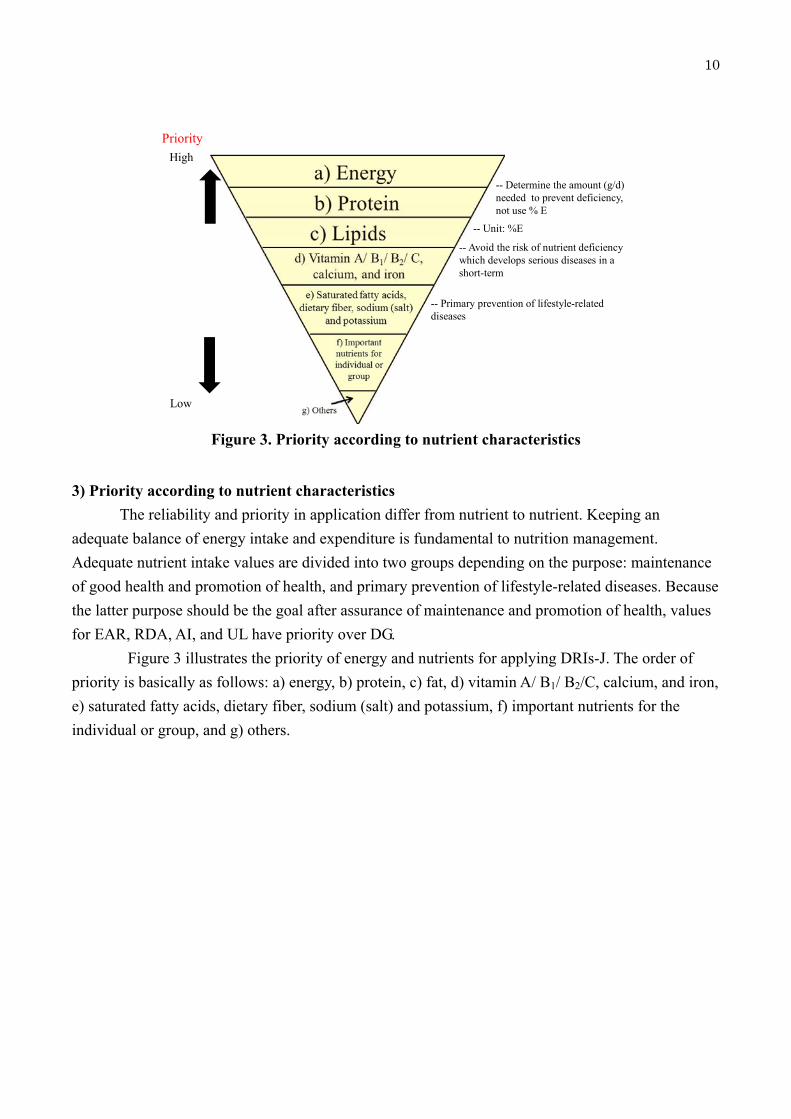
-- Determine the amount (g/d) needed to prevent deficiency, not use % E
-- Unit: %E
-- Avoid the risk of nutrient deficiency which develops serious diseases in a short-term
-- Primary prevention of lifestyle-related diseases
Figure 3. Priority according to nutrient characteristics
High
Low
Priority
3) Priority according to nutrient characteristics
The reliability and priority in application differ from nutrient to nutrient. Keeping an
adequate balance of energy intake and expenditure is fundamental to nutrition management.
Adequate nutrient intake values are divided into two groups depending on the purpose: maintenance
of good health and promotion of health, and primary prevention of lifestyle-related diseases. Because
the latter purpose should be the goal after assurance of maintenance and promotion of health, values
for EAR, RDA, AI, and UL have priority over DG.
Figure 3 illustrates the priority of energy and nutrients for applying DRIs-J. The order of
priority is basically as follows: a) energy, b) protein, c) fat, d) vitamin A/ B1/ B2/C, calcium, and iron,
e) saturated fatty acids, dietary fiber, sodium (salt) and potassium, f) important nutrients for the
individual or group, and g) others.

11
[APPENDIX]
Reference physique (reference height and weights) and reference
values for Dietary Reference Intakes for Japanese 2010
*Abbreviations: EER, estimated energy requirements; PAL: physical activity level, EAR, estimated
average requirement; RDA, recommended dietary allowance; AI, adequate intake; UL, tolerable
upper intake level
Table appendix-1. Reference physique (reference height and weights)
Sex Males Females1
Age Reference height
(cm)
Reference weights
(kg)
Reference height
(cm)
Reference weights
(kg)
0-5 months 61.5 6.4 60 5.9
6-11 71.5 8.8 69.9 8.2
6-8 69.7 8.5 68.1 7.8
9-11 73.2 9.1 71.6 8.5
1-2 years 85 11.7 84 11
3-5 103.4 16.2 103.2 16.2
6-7 120 22 118.6 22
8-9 130 27.5 130.2 27.2
10-11 142.9 35.5 141.4 34.5
12-14 159.6 48 155 46
15-17 170 58.4 157 50.6
18-29 171.4 63 158 50.6
30-49 170.5 68.5 158 53
50-69 165.7 65 153 53.6
>70 161 59.7 147.5 49 1 Excluded pregnant women.

12
Table appendix-2. Estimated Energy Requirements (EERs) (kcal/day)1
Sex Males Females
PAL I II III I II III
0-5 months - 550 - - 500 -
6-8 - 650 - - 600 -
9-11 - 700 - - 650 -
1-2 years - 1,000 - - 900 -
3-5 - 1,300 - - 1,250 -
6-7 1,350 1,550 1,700 1,250 1,450 1,650
8-9 1,600 1,800 2,050 1,500 1,700 1,900
10-11 1,950 2,250 2,500 1,750 2,000 2,250
12-14 2,200 2,500 2,750 2,000 2,250 2,550
15-17 2,450 2,750 3,100 2,000 2,250 2,500
18-29 2,250 2,650 3,000 1,700 1,950 2,250
30-49 2,300 2,650 3,050 1,750 2,000 2,300
50-69 2,100 2,450 2,800 1,650 1,950 2,200
>702 1,850 2,200 2,500 1,450 1,700 2,000
Pregnant women:
+50 +50 +50 Early-stage
(amount to be added)
Mid-stage +250 +250 +250
(amount to be added)
Late-stage +450 +450 +450
(amount to be added)
Lactating women +350 +350 +350
(amount to be added) 1 For adults, the following formula was used for computation: Estimated Energy Requirement=Basal Metabolic Rate (kcal/day) ×PAL.
For those between 18 and 69 years, the PALs were designated as I=1.50, II=1.75 or III=2.00. For those 70 years or older, the following were
used instead: I=1.45, II=1.70, III=1.95.
2 Subjects data mainly obtained from healthy independent elderly aged 70-75 years old

13
Table appendix-3. Protein (g/day)
Sex Males Females
Age EAR RDA AI UL EAR RDA AI UL
0-5 months - - 10 - - - 10 -
6-8 - - 15 - - - 15 -
9-11 - - 25 - - - 25 -
1-2 years 15 20 - - 15 20 - -
3-5 20 25 - - 20 25 - -
6-7 25 30 - - 25 30 - -
8-9 30 40 - - 30 40 - -
10-11 40 45 - - 35 45 - -
12-14 45 60 - - 45 55 - -
15-17 50 60 - - 45 55 - -
18-29 50 60 - - 40 50 - -
30-49 50 60 - - 40 50 - -
50-69 50 60 - - 40 50 - -
>702 50 60 - - 40 50 - -
Pregnant women:
+0 +0
- Early-stage -
(amount to be added)
Mid-stage +5 +5
- -
(amount to be added)
Late-stage +20 +25
- -
(amount to be added)
Lactating women +15 +20 - -
(amount to be added)

14
Table appendix-4.1. Lipids --total fat, and saturated fatty acids--
Total fat Saturated fatty acids
(% energy) (% energy)
Sex Male Females Males Females
Age AI DG(range) AI DG(range) DG(range) DG(range)
0-5 months 50 - 50 - - -
6-11 40 - 40 - - -
1-2 years - 20<, <30 - 20<, <30 - -
3-5 - 20<, <30 - 20<, <30 - -
6-7 - 20<, <30 - 20<, <30 - -
8-9 - 20<, <30 - 20<, <30 - -
10-11 - 20<, <30 - 20<, <30 - -
12-14 - 20<, <30 - 20<, <30 - -
15-17 - 20<, <30 - 20<, <30 - -
18-29 - 20<, <30 - 20<, <30 4.5<, <7.0 4.5<, <7.0
30-49 - 20<, <25 - 20<, <25 4.5<, <7.0 4.5<, <7.0
50-69 - 20<, <25 - 20<, <25 4.5<, <7.0 4.5<, <7.0
>70 - 20<, <25 - 20<, <25 4.5<, <7.0 4.5<, <7.0
Pregnant women:
- -
- (amount to be added)
Lactating women - - -
(amount to be added)

15
Table appendix-4.2. Lipids (contd.) --total fat, and saturated fatty acids--
n-6 fatty acids n-3 fatty acids Cholesterol
(g/day) (g/day) (mg/day)
Sex Males Females Males Females Males Females
Age AI DG AI DG AI DG2 AI DG2 DG DG
0-5 months 4 - 4 - 0.9 - 0.9 - - -
6-11 5 - 5 - 0.9 - 0.9 - - -
1-2 years 5 - 5 - 0.9 - 0.9 - - -
3-5 7 - 6 - 1.2 - 1.2 - - -
6-7 8 - 7 - 1.6 - 1.3 - - -
8-9 9 - 8 - 1.7 - 1.5 - - -
10-11 10 - 9 - 1.8 - 1.7 - - -
12-14 11 - 10 - 2.1 - 2.1 - - -
15-17 13 - 11 - 2.5 - 2.1 - - -
18-29 11 <10 9 <10 - >2.1 - >1.8 <750 <600
30-49 10 <10 9 <10 - >2.2 - >1.8 <750 <600
50-69 10 <10 8 <10 - >2.4 - >2.1 <750 <600
>70 8 <10 7 <10 - >2.2 - >1.8 <750 <600
Pregnant women
11 -
1.9 -
-
Lactating women 01 - 1.7 - -
1 Amount to be added
2 In DG, it is desirable to intake more than 1 g/day of EPA and DHA.

16
Table appendix-5. Carbohydrates (% energy) 1
Sex Males Females
Age EAR RDA AI DG
(range)
UL EAR RDA AI DG
(range)
UL
0-5 months - - - - - - - - - -
6-11 - - - - - - - - - -
1-2 years - - - 50<, <70 - - - - 50<, <70 -
3-5 - - - 50<, <70 - - - - 50<, <70 -
6-7 - - - 50<, <70 - - - - 50<, <70 -
8-9 - - - 50<, <70 - - - - 50<, <70 -
10-11 - - - 50<, <70 - - - - 50<, <70 -
12-14 - - - 50<, <70 - - - - 50<, <70 -
15-17 - - - 50<, <70 - - - - 50<, <70 -
18-29 - - - 50<, <70 - - - - 50<, <70 -
30-49 - - - 50<, <70 - - - - 50<, <70 -
50-69 - - - 50<, <70 - - - - 50<, <70 -
>70 - - - 50<, <70 - - - - 50<, <70 -
Pregnant women
- - - - − (amount to be added)
Lactating women - - - - −
(amount to be added) 1Including energy derived from alcohol.

17
Table appendix-6. Dietary fibers (g/day)
Sex Males Females
Age EAR RDA AI DG UL EAR RDA AI DG UL
0-5 months - - - - - - - - - -
6-11 - - - - - - - - - -
1-2 years - - - - - - - - - -
3-5 - - - - - - - - - -
6-7 - - - - - - - - - -
8-9 - - - - - - - - - -
10-11 - - - - - - - - - -
12-14 - - - - - - - - - -
15-17 - - - - - - - - - -
18-29 - - >19 - - - >17 -
30-49 - - >19 - - - >17 -
50-69 - - >19 - - - >17 -
>70 - - >19 - - - >17 -
Pregnant women
- - - - - (amount to be added)
Lactating women - - - - -
(amount to be added)

18
Table appendix-7. Vitamin A (μg RE/day)1
Sex Males Females
Age EAR2 RDA2 AI3 UL3 EAR2 RDA 2 AI3 UL3
0-5 months - - 300 600 - - 300 600
6-11 - - 400 600 - - 400 600
1-2 years 300 400 - 600 250 350 - 600
3-5 300 450 - 700 300 450 - 700
6-7 300 450 - 900 300 400 - 900
8-9 350 500 - 1,200 350 500 - 1,200
10-11 450 600 - 1,500 400 550 - 1,500
12-14 550 750 - 2,000 500 700 - 2,000
15-17 650 900 - 2,500 450 650 - 2,500
18-29 600 850 - 2,700 450 650 - 2,700
30-49 600 850 - 2,700 500 700 - 2,700
50-69 600 850 - 2,700 500 700 - 2,700
>70 550 800 - 2,700 450 650 - 2,700
Pregnant women:
(amount to be added)
Early-stage +0 +0 - -
Mid-stage +0 +0 - -
Late-stage +60 +80 - -
Lactating women +300 +450 - -
(amount to be added)
RE=retinol equivalents
1 Retinol equivalent (mg RE) = retinol (mg) + beta-carotene (mg) *1/12 + alpha-carotene(mg) *1/24 + beta-cryptoxanthin(mg) *1/24 + other
provitamin A carotenoids(mg)*1/24
2 Including provitamin A carotenoids.
3 Excluding provitamin A carotenoids

19
Table appendix-8. Vitamin D (μg/day)
Sex Males Females
Age EAR RDA AI UL EAR RDA AI UL
0-5 months - -
2.5
(5.0)125 - -
2.5
(5.0)1 25
6-11 - -
5.0
(5.0)125 - -
5.0
(5.0)1 25
1-2 years - - 2.5 25 - - 2.5 25
3-5 - - 2.5 30 - - 2.5 30
6-7 - - 2.5 30 - - 2.5 30
8-9 - - 3 35 - - 3 35
10-11 - - 3.5 35 - - 3.5 35
12-14 - - 3.5 45 - - 3.5 45
15-17 - - 4.5 50 - - 4.5 50
18-29 - - 5.5 50 - - 5.5 50
30-49 - - 5.5 50 - - 5.5 50
50-69 - - 5.5 50 - - 5.5 50
>70 - - 5.5 50 - - 5.5 50
Pregnant women
- - +1.5 - (amount to be added)
Lactating women - - +2.5 -
(amount to be added) 1Adequate intakes for an infant who is exposed to appropriate sunlight. The value in parentheses is adequate intakes for those with less sunlight
exposure.

20
Table appendix-9. Vitamin E (mg/day)1
Sex Males Females
Age EAR RDA AI UL EAR RDA AI UL
0-5 months - - 3.0 - - - 3.0 -
6-11 - - 3.5 - - - 3.5 -
1-2 years - - 3.5 150 - - 3.5 150
3-5 - - 4.5 200 - - 4.5 200
6-7 - - 5.0 300 - - 5.0 300
8-9 - - 6.0 350 - - 5.5 350
10-11 - - 6.5 450 - - 6.0 450
12-14 - - 7.0 600 - - 7.0 600
15-17 - - 8.0 750 - - 7.0 650
18-29 - - 7.0 800 - - 6.5 650
30-49 - - 7.0 900 - - 6.5 700
50-69 - - 7.0 850 - - 6.5 700
>70 - - 7.0 750 - - 6.5 650
Pregnant women
- - +0.0 - (amount to be added)
Lactating women - - +3.0 -
(amount to be added)1 Computation was made on α-tocopherol. Not included vitamins E other than αα-tocopherol.
21
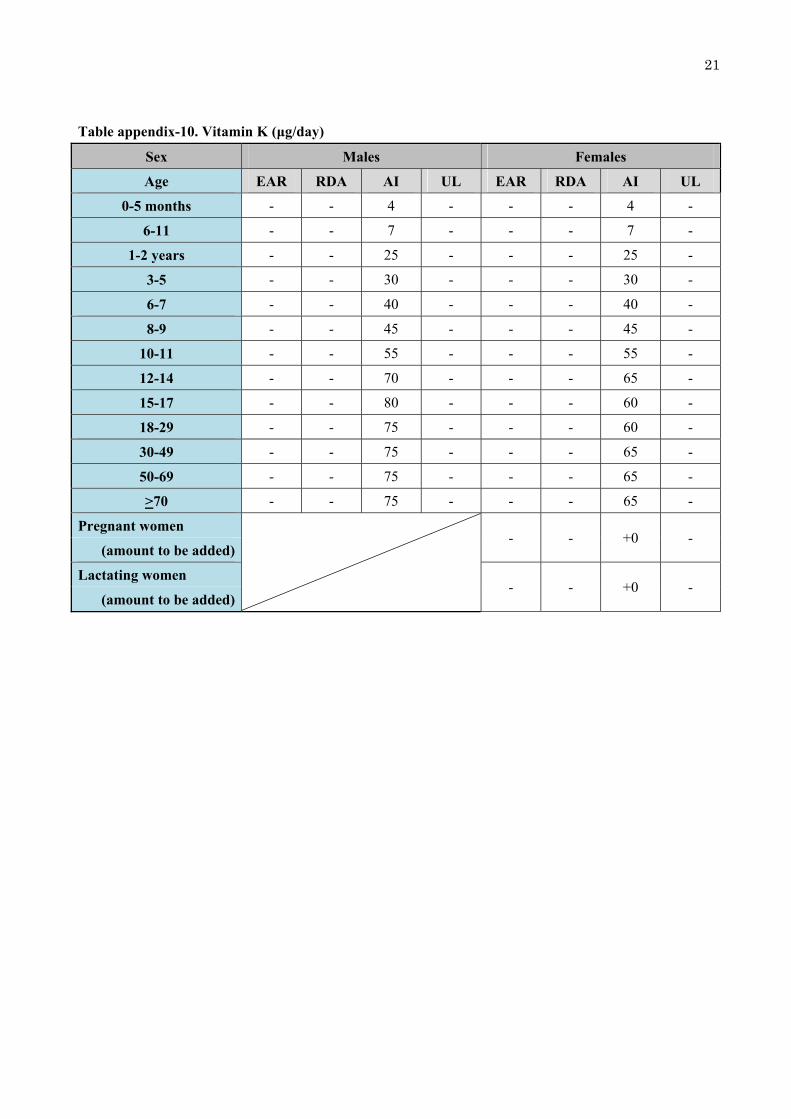
Table appendix-10. Vitamin K (μg/day)
Sex Males Females
Age EAR RDA AI UL EAR RDA AI UL
0-5 months - - 4 - - - 4 -
6-11 - - 7 - - - 7 -
1-2 years - - 25 - - - 25 -
3-5 - - 30 - - - 30 -
6-7 - - 40 - - - 40 -
8-9 - - 45 - - - 45 -
10-11 - - 55 - - - 55 -
12-14 - - 70 - - - 65 -
15-17 - - 80 - - - 60 -
18-29 - - 75 - - - 60 -
30-49 - - 75 - - - 65 -
50-69 - - 75 - - - 65 -
>70 - - 75 - - - 65 -
Pregnant women
- - +0 - (amount to be added)
Lactating women - - +0 -
(amount to be added)
22
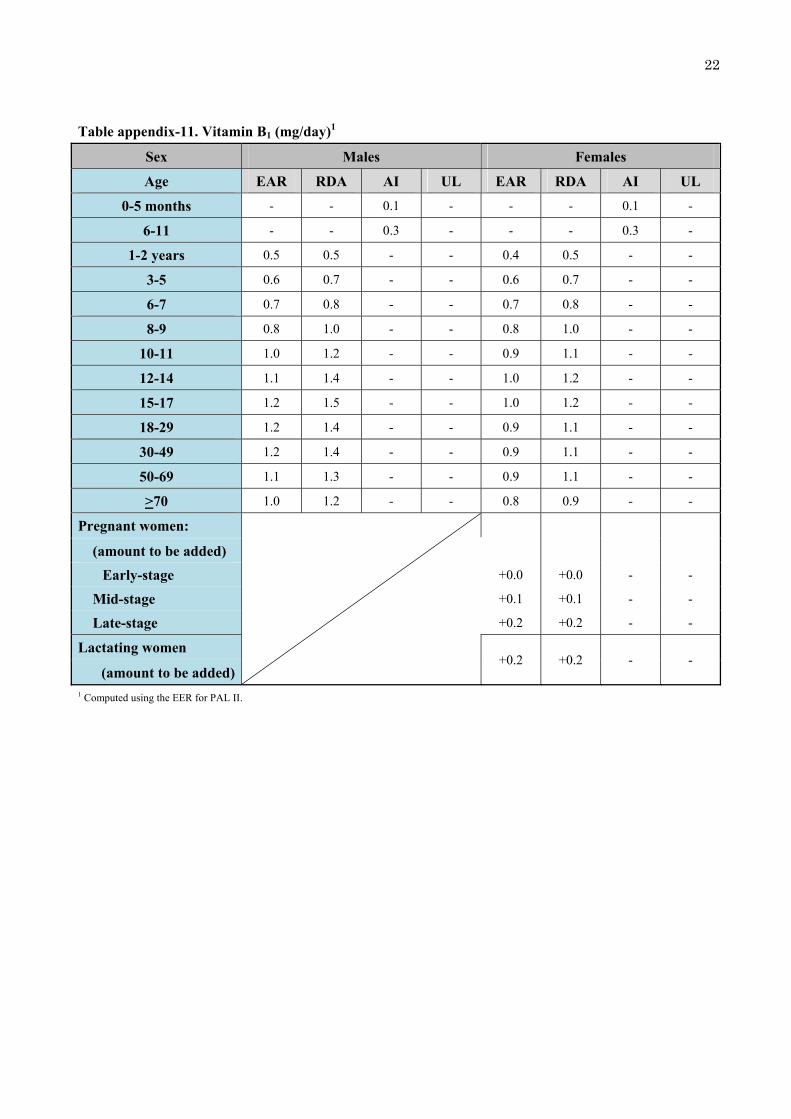
Table appendix-11. Vitamin B1 (mg/day)1
Sex Males Females
Age EAR RDA AI UL EAR RDA AI UL
0-5 months - - 0.1 - - - 0.1 -
6-11 - - 0.3 - - - 0.3 -
1-2 years 0.5 0.5 - - 0.4 0.5 - -
3-5 0.6 0.7 - - 0.6 0.7 - -
6-7 0.7 0.8 - - 0.7 0.8 - -
8-9 0.8 1.0 - - 0.8 1.0 - -
10-11 1.0 1.2 - - 0.9 1.1 - -
12-14 1.1 1.4 - - 1.0 1.2 - -
15-17 1.2 1.5 - - 1.0 1.2 - -
18-29 1.2 1.4 - - 0.9 1.1 - -
30-49 1.2 1.4 - - 0.9 1.1 - -
50-69 1.1 1.3 - - 0.9 1.1 - -
>70 1.0 1.2 - - 0.8 0.9 - -
Pregnant women:
(amount to be added)
Early-stage +0.0 +0.0 - -
Mid-stage +0.1 +0.1 - -
Late-stage +0.2 +0.2 - -
Lactating women +0.2 +0.2 - -
(amount to be added)1 Computed using the EER for PAL II.

23
Table appendix-12. Vitamin B2 (mg/day)1
Sex Males Females
Age EAR RDA AI UL EAR RDA AI UL
0-5 months - - 0.3 - - - 0.3 -
6-11 - - 0.4 - - - 0.4 -
1-2 years 0.5 0.6 - - 0.5 0.5 - -
3-5 0.7 0.8 - - 0.6 0.8 - -
6-7 0.8 0.9 - - 0.7 0.9 - -
8-9 0.9 1.1 - - 0.9 1.0 - -
10-11 1.1 1.4 - - 1.0 1.2 - -
12-14 1.3 1.5 - - 1.1 1.4 - -
15-17 1.4 1.7 - - 1.1 1.4 - -
18-29 1.3 1.6 - - 1.0 1.2 - -
30-49 1.3 1.6 - - 1.0 1.2 - -
50-69 1.2 1.5 - - 1.0 1.2 - -
>70 1.1 1.3 - - 0.9 1.0 - -
Pregnant women: - -
(amount to be added) - -
Early-stage +0.0 +0.0 - -
Mid-stage +0.1 +0.2
Late-stage +0.2 +0.3
Lactating women +0.3 +0.4 - -
(amount to be added)1 Computed using the EER for PAL II.

24
Table appendix-13. Niacin (mg NE/day)1
Sex Males Females
Age EAR RDA AI UL2 EAR RDA AI UL2
0-5 months3 - - 23 - - - 23 -
6-11 - - 3 - - - 3 -
1-2 years 5 6 - 60 (15) 4 5 - 60 (15)
3-5 6 7 - 80 (20) 6 7 - 80 (20)
6-7 7 9 - 100 (30) 7 8 - 100 (30)
8-9 9 10 - 150 (35) 8 10 - 150 (35)
10-11 11 13 - 200 (45) 10 12 - 150 (45)
12-14 12 14 - 250 (60) 11 13 - 250 (60)
15-17 13 16 - 300 (70) 11 13 - 250 (65)
18-29 13 15 - 300 (80) 9 11 - 250 (65)
30-49 13 15 - 350 (85) 10 12 - 250 (65)
50-69 12 14 - 350 (80) 9 11 - 250 (65)
>70 11 13 - 300 (75) 8 10 - 250 (60)
Pregnant women
+0 +0 - - (amount to be added)
Lactating women +3 v3 - -
(amount to be added)1 NE= niacin equivalent = niacin+1/60 tryptophan. Computed using the Estimated Energy Requirement for PAL II.
2 Quantity as nicotinamide (mg). The values in parentheses show nicotinic acid (mg). Computed by reference weight (kg).
3 Unit: mg/day

25
Table appendix-14. Vitamin B6 (mg/day)1
Sex Males Females
Age EAR RDA AI UL2 EAR RDA AI UL2
0-5 months - - 0.2 - - - 0.2 -
6-11 - - 0.3 - - - 0.3 -
1-2 years 0.4 0.5 - 10.0 0.4 0.5 - 10.0
3-5 0.5 0.6 - 15.0 0.5 0.6 - 15.0
6-7 0.7 0.8 - 20.0 0.6 0.7 - 20.0
8-9 0.8 0.9 - 25.0 0.8 0.9 - 25.0
10-11 0.9 1.0 - 30.0 0.9 1.0 - 30.0
12-14 1.0 1.3 - 40.0 1.0 1.3 - 40.0
15-17 1.1 1.4 - 50.0 1.0 1.3 - 45.0
18-29 1.1 1.4 - 55.0 1.0 1.1 - 45.0
30-49 1.1 1.4 - 60.0 1.0 1.1 - 45.0
50-69 1.1 1.4 - 55.0 1.0 1.1 - 45.0
>70 1.1 1.4 - 50.0 1.0 1.1 - 40.0
Pregnant women +0.7 +0.8 - -
(amount to be added)
Lactating women +0.3 +0.3 - -
(amount to be added)1 Computed using the EER for PAL II.
2 Quantity as pyridoxine, not indicating values in dietary vitamin B6.

26
Table appendix-15. Vitamin B12 (μg/day)
Sex Males Females
Age EAR RDA AI UL EAR RDA AI UL
0-5 months - - 0.4 - - - 0.4 -
6-11 - - 0.6 - - - 0.6 -
1-2 years 0.8 0.9 - - 0.8 0.9 - -
3-5 0.9 1.1 - - 0.9 1.1 - -
6-7 1.1 1.4 - - 1.1 1.4 - -
8-9 1.3 1.6 - - 1.3 1.6 - -
10-11 1.6 1.9 - - 1.6 1.9 - -
12-14 2.0 2.4 - - 2.0 2.4 - -
15-17 2.0 2.4 - - 2.0 2.4 - -
18-29 2.0 2.4 - - 2.0 2.4 - -
30-49 2.0 2.4 - - 2.0 2.4 - -
50-69 2.0 2.4 - - 2.0 2.4 - -
>70 2.0 2.4 - - 2.0 2.4 - -
Pregnant women
+0.3 +0.4 - - (amount to be added)
Lactating women +0.7 +0.8 - -
(amount to be added)

27
Table appendix-16. Folic acid (μg/day)1
Sex Males Females
Age EAR RDA AI UL2 EAR RDA AI UL2
0-5 months - - 40 - - - 40 -
6-11 - - 65 - - - 65 -
1-2 years 80 100 - 300 80 100 - 300
3-5 90 110 - 400 90 110 - 400
6-7 110 140 - 600 110 140 - 600
8-9 130 160 - 700 130 160 - 700
10-11 160 190 - 900 160 190 - 900
12-14 200 240 - 1,200 200 240 - 1,200
15-17 200 240 - 1,300 200 240 - 1,300
18-29 200 240 - 1,300 200 240 - 1,300
30-49 200 240 - 1,400 200 240 - 1,400
50-69 200 240 - 1,400 200 240 - 1,400
>70 200 240 - 1,300 200 240 - 1,300
Pregnant women
+200 +240 - - (amount to be added)
Lactating women +80 +100 - -
(amount to be added)1 Intake of 400 mg/day is desired for women who are planning to get pregnant or may be pregnant to reduce the risk of neural tube closure.
2 Quantity as pteroyl-monoglutamic acid (intake from sources other than ordinary food).

28
Table appendix-17. Pantothenic acid (mg/day)
Sex Males Females
Age EAR RDA AI UL EAR RDA AI UL
0-5 months - - 4 - - - 4 -
6-11 - - 5 - - - 5 -
1-2 years - - 3 - - - 3 -
3-5 - - 4 - - - 4 -
6-7 - - 5 - - - 5 -
8-9 - - 6 - - - 5 -
10-11 - - 7 - - - 6 -
12-14 - - 7 - - - 6 -
15-17 - - 7 - - - 5 -
18-29 - - 5 - - - 5 -
30-49 - - 5 - - - 5 -
50-69 - - 6 - - - 5 -
>70 - - 6 - - - 5 -
Pregnant women
- - +1 - (amount to be added)
Lactating women - - +1 -
(amount to be added)

29
Table appendix-18. Botin (μg/day)
Sex Males Females
Age EAR RDA AI UL EAR RDA AI UL
0-5 months - - 4 - - - 4 -
6-11 - - 10 - - - 10 -
1-2 years - - 20 - - - 20 -
3-5 - - 25 - - - 25 -
6-7 - - 30 - - - 30 -
8-9 - - 35 - - - 35 -
10-11 - - 40 - - - 40 -
12-14 - - 50 - - - 50 -
15-17 - - 50 - - - 50 -
18-29 - - 50 - - - 50 -
30-49 - - 50 - - - 50 -
50-69 - - 50 - - - 50 -
>70 - - 50 - - - 50 -
Pregnant women
- - +2 − (amount to be added)
Lactating women - - +5 −
(amount to be added)

30
Table appendix-19. vitamin C (mg/day)
Sex Males Females
Age EAR RDA AI EAR RDA AI
0-5 months - - 40 - - 40
6-11 - - 40 - - 40
1-2 years 35 40 - 35 40 -
3-5 40 45 - 40 45 -
6-7 45 55 - 45 55 -
8-9 55 65 - 55 65 -
10-11 65 80 - 65 80 -
12-14 85 100 - 85 100 -
15-17 85 100 - 85 100 -
18-29 85 100 - 85 100 -
30-49 85 100 - 85 100 -
50-69 85 100 - 85 100 -
>70 85 100 - 85 100 -
Pregnant women
+10 +10 - (amount to be added)
Lactating women +40 +50 -
(amount to be added)

31
Table appendix-20. Sodium (mg/day, the value in parentheses is equivalent to table salt [g/day])
Sex Males Females
Age EAR AI DG EAR AI DG
0-5 months - 100 (0.3) - - 100 (0.3) -
6-11 - 600 (1.5) - - 600 (1.5) -
1-2 years - - (<4.0) - - (<4.0)
3-5 - - (<5.0) - - (<5.0)
6-7 - - (<6.0) - - (<6.0)
8-9 - - (<7.0) - - (<7.0)
10-11 - - (<8.0) - - (<7.5)
12-14 - - (<9.0) - - (<7.5)
15-17 - - (<9.0) - - (<7.5)
18-29 600 (1.5) - (<9.0) 600 (1.5) - (<7.5)
30-49 600 (1.5) - (<9.0) 600 (1.5) - (<7.5)
50-69 600 (1.5) - (<9.0) 600 (1.5) - (<7.5)
>70 600 (1.5) - (<9.0) 600 (1.5) - (<7.5)
Pregnant women
- - - (amount to be added)
Lactating women - - -
(amount to be added)
32
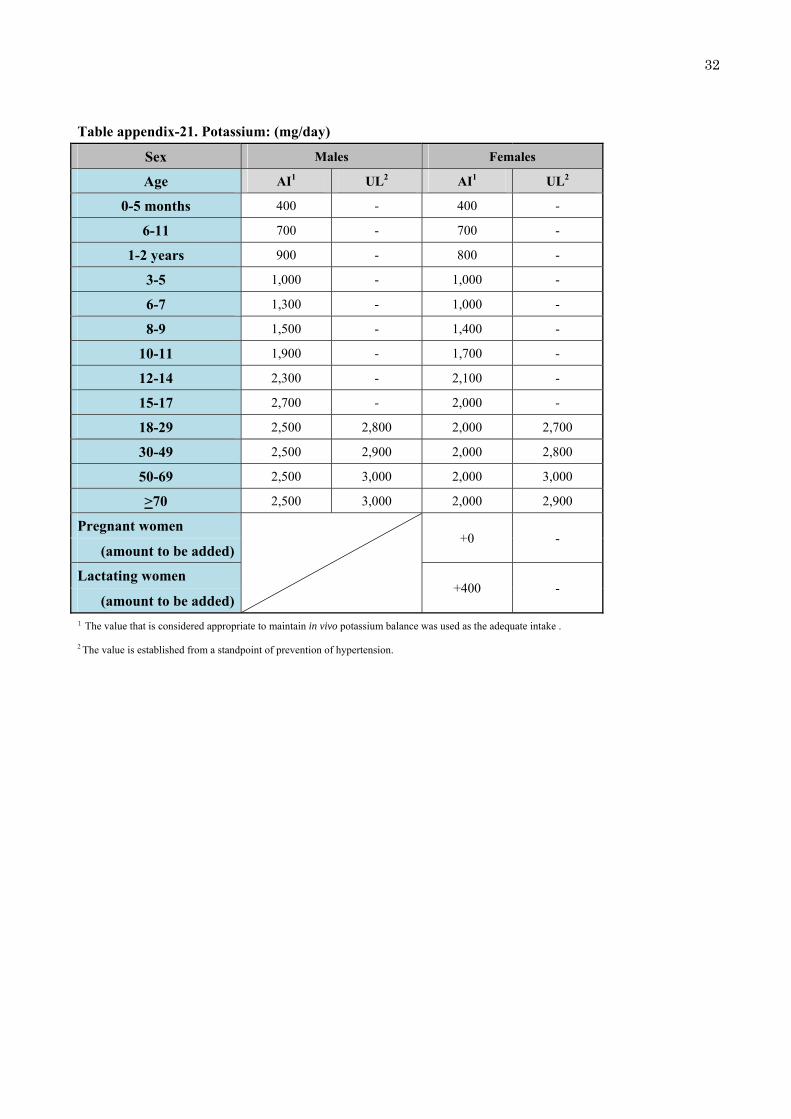
Table appendix-21. Potassium: (mg/day)
Sex Males Females
Age AI1 UL2 AI1 UL2
0-5 months 400 - 400 -
6-11 700 - 700 -
1-2 years 900 - 800 -
3-5 1,000 - 1,000 -
6-7 1,300 - 1,000 -
8-9 1,500 - 1,400 -
10-11 1,900 - 1,700 -
12-14 2,300 - 2,100 -
15-17 2,700 - 2,000 -
18-29 2,500 2,800 2,000 2,700
30-49 2,500 2,900 2,000 2,800
50-69 2,500 3,000 2,000 3,000
>70 2,500 3,000 2,000 2,900
Pregnant women
+0 - (amount to be added)
Lactating women +400 -
(amount to be added)1 The value that is considered appropriate to maintain in vivo potassium balance was used as the adequate intake .
2 The value is established from a standpoint of prevention of hypertension.

33
Table appendix-22. Calcium (mg/day)
Sex Males Females
Age EAR RDA AI UL EAR RDA AI UL
0-5 months - - 200 - - - 200 -
6-11 - - 250 - - - 250 -
1-2 years 350 400 - - 350 400 - -
3-5 500 600 - - 450 550 - -
6-7 500 600 - - 450 550 - -
8-9 550 650 - - 600 750 - -
10-11 600 700 - - 600 700 - -
12-14 800 1,000 - - 650 800 - -
15-17 650 800 - - 550 650 - -
18-29 650 800 - 2,300 550 650 - 2,300
30-49 550 650 - 2,300 550 650 - 2,300
50-69 600 700 - 2,300 550 650 - 2,300
>70 600 700 - 2,300 550 650 - 2,300
Pregnant women
+0 +0 - - (amount to be added)
Lactating women +0 +0 - -
(amount to be added)

34
Table appendix-23. Magnesium (mg/day)
Sex Males Females
Age EAR RDA AI UL1 EAR RDA AI UL1
0-5 months - - 20 - - - 20 -
6-11 - - 60 - - - 60 -
1-2 years 60 70 - - 60 70 - -
3-5 80 100 - - 80 100 - -
6-7 110 130 - - 110 130 - -
8-9 140 170 - - 140 160 - -
10-11 180 210 - - 170 210 - -
12-14 240 290 - - 230 280 - -
15-17 290 350 - - 250 300 - -
18-29 280 340 - - 230 270 - -
30-49 310 370 - - 240 290 - -
50-69 290 350 - - 240 290 - -
>70 270 320 - - 220 260 - -
Pregnant women
30 40 - - (amount to be added)
Lactating women 0 0 - -
(amount to be added)1 When the nutrient is obtained from ordinary food, no upper threshold is set. When the nutrient is obtained from a source other than ordinary food,
the upper threshold is set at 350 mg/day for adults and 5 mg/kg weight/day for children.

35
Table appendix-24. Phosphorus (mg/day)
Sex Males Females
Age EAR RDA AI UL EAR RDA AI UL
0-5 months - - 120 - - - 120 -
6-11 - - 260 - - - 260 -
1-2 years - - 600 - - - 600 -
3-5 - - 800 - - - 700 -
6-7 - - 900 - - - 900 -
8-9 - - 1,100 - - - 1,000 -
10-11 - - 1,200 - - - 1,100 -
12-14 - - 1,200 - - - 1,100 -
15-17 - - 1,200 - - - 1,000 -
18-29 - - 1,000 3,000 - - 900 3,000
30-49 - - 1,000 3,000 - - 900 3,000
50-69 - - 1,000 3,000 - - 900 3,000
>70 - - 1,000 3,000 - - 900 3,000
Pregnant women
- - +0 - (amount to be added)
Lactating women - - +0 -
(amount to be added)
36
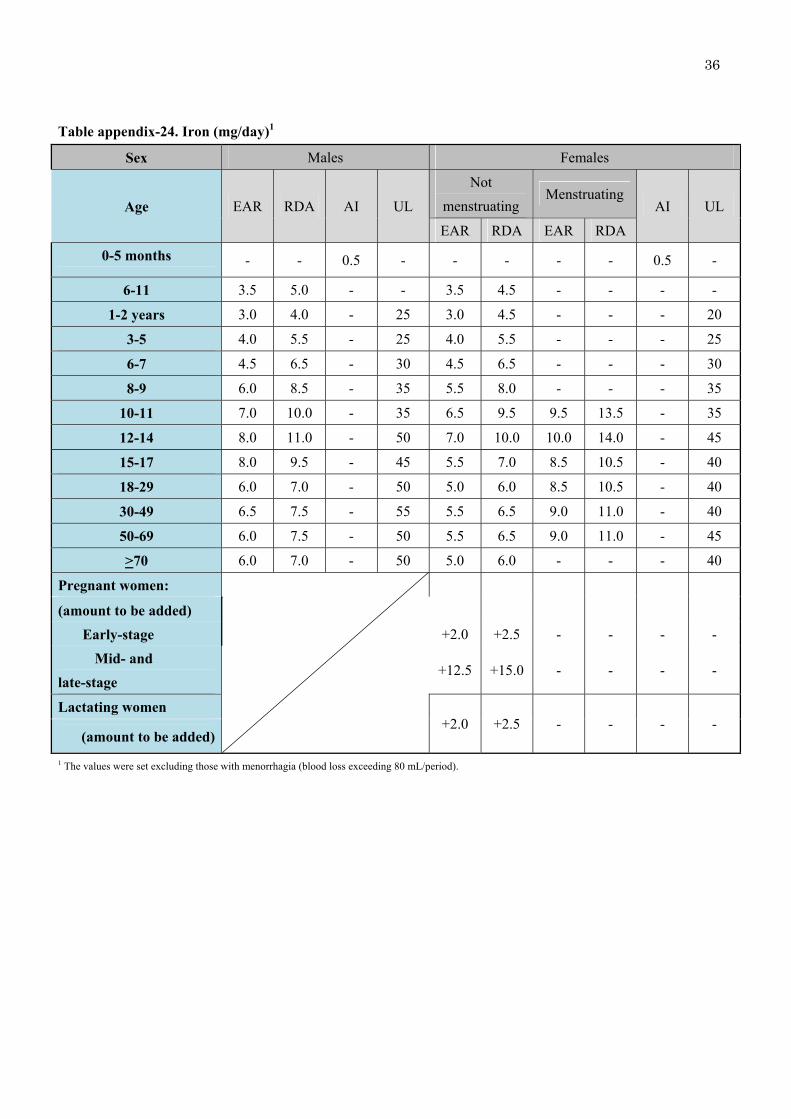
Table appendix-24. Iron (mg/day)1
Sex Males Females
Age EAR RDA AI UL
Not
menstruating Menstruating
AI UL
EAR RDA EAR RDA
0-5 months - - 0.5 - - - - - 0.5 -
6-11 3.5 5.0 - - 3.5 4.5 - - - -
1-2 years 3.0 4.0 - 25 3.0 4.5 - - - 20
3-5 4.0 5.5 - 25 4.0 5.5 - - - 25
6-7 4.5 6.5 - 30 4.5 6.5 - - - 30
8-9 6.0 8.5 - 35 5.5 8.0 - - - 35
10-11 7.0 10.0 - 35 6.5 9.5 9.5 13.5 - 35
12-14 8.0 11.0 - 50 7.0 10.0 10.0 14.0 - 45
15-17 8.0 9.5 - 45 5.5 7.0 8.5 10.5 - 40
18-29 6.0 7.0 - 50 5.0 6.0 8.5 10.5 - 40
30-49 6.5 7.5 - 55 5.5 6.5 9.0 11.0 - 40
50-69 6.0 7.5 - 50 5.5 6.5 9.0 11.0 - 45
>70 6.0 7.0 - 50 5.0 6.0 - - - 40
Pregnant women:
(amount to be added)
Early-stage +2.0 +2.5 - - - -
Mid- and
late-stage +12.5 +15.0 - - - -
Lactating women +2.0 +2.5 - - - -
(amount to be added)
1 The values were set excluding those with menorrhagia (blood loss exceeding 80 mL/period).

37
Table appendix-25. Zinc (mg/day)
Sex Males Females
Age EAR RDA AI UL EAR RDA AI UL
0-5 months - - 2 - - - 2 -
6-11 - - 3 - - - 3 -
1-2 years 4 5 - - 4 5 - -
3-5 5 6 - - 5 6 - -
6-7 6 7 - - 6 7 - -
8-9 7 8 - - 7 8 - -
10-11 8 10 - - 8 10 - -
12-14 9 11 - - 8 9 - -
15-17 11 13 - - 7 9 - -
18-29 10 12 - 40 7 9 - 35
30-49 10 12 - 45 8 9 - 35
50-69 10 12 - 45 8 9 - 35
>70 9 11 - 40 7 9 - 30
Pregnant women
+1 +2 - - (amount to be added)
Lactating women +3 +3 - -
(amount to be added)

38
Table appendix-26. Copper (mg/day)
Sex Males Females
Age EAR RDA AI UL EAR RDA AI UL
0-5 months - - 0.3 - - - 0.3 -
6-11 - - 0.3 - - - 0.3 -
1-2 years 0.2 0.3 - - 0.2 0.3 - -
3-5 0.3 0.3 - - 0.3 0.3 - -
6-7 0.3 0.4 - - 0.3 0.4 - -
8-9 0.4 0.5 - - 0.4 0.5 - -
10-11 0.5 0.6 - - 0.5 0.6 - -
12-14 0.6 0.8 - - 0.6 0.8 - -
15-17 0.7 0.9 - - 0.6 0.7 - -
18-29 0.7 0.9 - 10 0.6 0.7 - 10
30-49 0.7 0.9 - 10 0.6 0.7 - 10
50-69 0.7 0.9 - 10 0.6 0.7 - 10
>70 0.6 0.8 - 10 0.5 0.7 - 10
Pregnant women
+0.1 +0.1 - - (amount to be added)
Lactating women +0.5 +0.6 - -
(amount to be added)

39
Table appendix-27. Manganese (mg/day)
Sex Males Females
Age EAR RDA AI UL EAR RDA AI UL
0-5 months - - 0.01 - - - 0.01 -
6-11 - - 0.5 - - - 0.5 -
1-2 years - - 1.5 - - - 1.5 -
3-5 - - 1.5 - - - 1.5 -
6-7 - - 2.0 - - - 2.0 -
8-9 - - 2.5 - - - 2.5 -
10-11 - - 3.0 - - - 3.0 -
12-14 - - 4.0 - - - 3.5 -
15-17 - - 4.5 - - - 3.5 -
18-29 - - 4.0 11 - - 3.5 11
30-49 - - 4.0 11 - - 3.5 11
50-69 - - 4.0 11 - - 3.5 11
>70 - - 4.0 11 - - 3.5 11
Pregnant women
- - +0 - (amount to be added)
Lactating women - - +0 -
(amount to be added)

40
Table appendix-28. iodine (μg/day)
Sex Males Females
Age EAR RDA AI UL EAR RDA AI UL
0-5 months - - 100 250 - - 100 250
6-11 - - 130 250 - - 130 250
1-2 years 35 50 - 250 35 50 - 250
3-5 45 60 - 350 45 60 - 350
6-7 55 75 - 500 55 75 - 500
8-9 65 90 - 500 65 90 - 500
10-11 75 110 - 500 75 110 - 500
12-14 95 130 - 1,300 95 130 - 1,300
15-17 100 140 - 2,100 100 140 - 2,100
18-29 95 130 - 2,200 95 130 - 2,200
30-49 95 130 - 2,200 95 130 - 2,200
50-69 95 130 - 2,200 95 130 - 2,200
>70 95 130 - 2,200 95 130 - 2,200
Pregnant women
+75 +110 - - (amount to be added)
Lactating women +100 +140 - -
(amount to be added)

41
Table appendix-28. Selenium (μg/day)
Sex Males Females
Age EAR RDA AI UL EAR RDA AI UL
0-5 months - - 15 - - - 15 -
6-11 - - 15 - - - 15 -
1-2 years 10 10 - 50 10 10 - 50
3-5 10 15 - 70 10 15 - 70
6-7 15 15 - 100 15 15 - 100
8-9 15 20 - 120 15 20 - 120
10-11 20 25 - 160 20 20 - 150
12-14 25 30 - 210 20 25 - 200
15-17 25 35 - 260 20 25 - 220
18-29 25 30 - 280 20 25 - 220
30-49 25 30 - 300 20 25 - 230
50-69 25 30 - 280 20 25 - 230
>70 25 30 - 260 20 25 - 210
Pregnant women
+5 +5 - - (amount to be added)
Lactating women +15 +20 - -
(amount to be added)
42
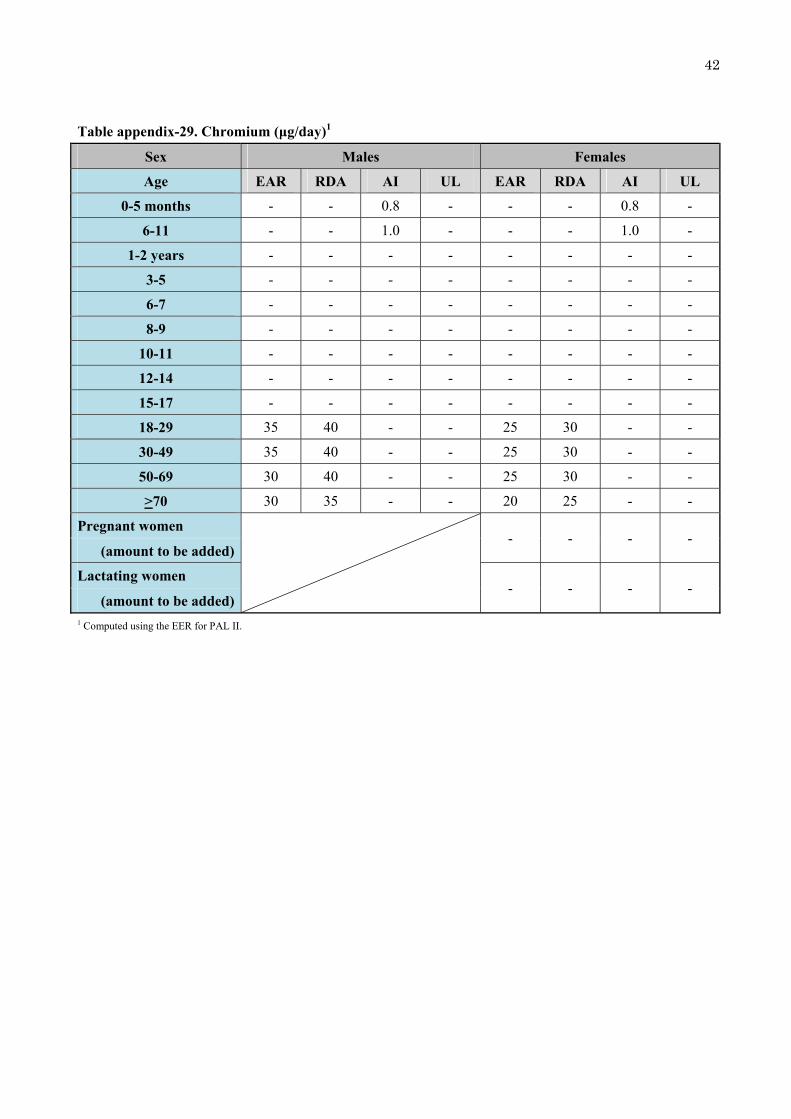
Table appendix-29. Chromium (μg/day)1
Sex Males Females
Age EAR RDA AI UL EAR RDA AI UL
0-5 months - - 0.8 - - - 0.8 -
6-11 - - 1.0 - - - 1.0 -
1-2 years - - - - - - - -
3-5 - - - - - - - -
6-7 - - - - - - - -
8-9 - - - - - - - -
10-11 - - - - - - - -
12-14 - - - - - - - -
15-17 - - - - - - - -
18-29 35 40 - - 25 30 - -
30-49 35 40 - - 25 30 - -
50-69 30 40 - - 25 30 - -
>70 30 35 - - 20 25 - -
Pregnant women
- - - - (amount to be added)
Lactating women - - - -
(amount to be added)1 Computed using the EER for PAL II.

43
Table appendix-30. Molybdenum (μg /day)
Sex Males Females
Age EAR RDA AI UL EAR RDA AI UL
0-5 months - - 2 - - - 2 -
6-11 - - 3 - - - 3 -
1-2 years - - - - - - - -
3-5 - - - - - - - -
6-7 - - - - - - - -
8-9 - - - - - - - -
10-11 - - - - - - - -
12-14 - - - - - - - -
15-17 - - - - - - - -
18-29 20 25 - 550 20 20 - 450
30-49 25 30 - 600 20 25 - 500
50-69 20 25 - 600 20 25 - 500
>70 20 25 - 550 20 20 - 450
Pregnant women
- - - - (amount to be added)
Lactating women +3 +3 - -
(amount to be added)

44