Development of road traffic emission inventories for urban ... · Development of road traffic...
36
21 st USEPA International Emission Inventory Conference. April 13-16, 2015. San Diego (California) Development of road traffic emission inventories for urban air quality modeling in Madrid (Spain) R. Borge , C. Quaassdorff, J. Pérez, D. de la Paz, J. Lumbreras, J.M. de Andrés, A. Narros, E. Rodríguez Laboratory of Environmental Modelling Technical University of Madrid (UPM) [email protected] San Diego, California. April, 16th Session 7: Mobile sources
Transcript of Development of road traffic emission inventories for urban ... · Development of road traffic...

21st USEPA International Emission Inventory Conference.
April 13-16, 2015. San Diego (California)
Development of road traffic emission inventories for
urban air quality modeling in Madrid (Spain)
R. Borge, C. Quaassdorff, J. Pérez, D. de la Paz, J.
Lumbreras, J.M. de Andrés, A. Narros, E. Rodríguez
Laboratory of Environmental Modelling
Technical University of Madrid (UPM)
San Diego, California. April, 16th
Session 7: Mobile sources

21st USEPA International Emission Inventory Conference.
April 13-16, 2015. San Diego (California)
1. Introduction
2. Methodology
2.1. Emission models
2.2. Measurement campaign
3. Results and discussion
4. Conclusions
OUTLINE

21st USEPA International Emission Inventory Conference.
April 13-16, 2015. San Diego (California)
1. INTRODUCTION
• Madrid city (Spain): 3.2
million inhabitants in the
city, more than 5 million
people in the metropolitan
area
Annual evolution of NO2 levels in Madrid city
(average by station type; relative to 2005)
•Positive trend of AQ in the city.
Remaining issues: NO2 %
Traffic
Urban background
Suburban background

21st USEPA International Emission Inventory Conference.
April 13-16, 2015. San Diego (California)
•The main responsible to high NO2 ambient air concentration values is
road traffic
Accurate and updated road traffic emission inventories are
needed to define and simulate abatement measures
Figures from Borge et al., 2014 (STOTEN)

21st USEPA International Emission Inventory Conference.
April 13-16, 2015. San Diego (California)
•Emission inventories have been
developed to support the
simulation of city-scale measures,
but also complementary local
measures to deal with particular
issues in specific hot-spots such
as Fernandez Ladreda (FL)
square
FL air quality
monitoring station
NO
2A
nnualm
ean (
2014)
Traffic stations in the Madrid City Council Air Quality Network

21st USEPA International Emission Inventory Conference.
April 13-16, 2015. San Diego (California)
2. METHODOLOGY
2.1. Emission models
•The development of emission inventories for on-road mobile sources is
particularly complex, since emissions depend on multiple factors:
- road type and traffic conditions
- vehicle type, age and maintenance conditions
- driving patterns / driving stage
- meteorology

21st USEPA International Emission Inventory Conference.
April 13-16, 2015. San Diego (California)
•There are many emission models based on alternative approaches for
emission computation; according to Smit (2009):
-‘Average-speed’ models (e.g. COPERT, MOBILE, EMFAC) –
macroscopic description
-‘Traffic-situation’ models (e.g. HBEFA, ARTEMIS) – link level
-‘Traffic-variable’ models (e.g. TEE, Matzoros model) – traffic flow
variables defined by macro or microscale traffic models
-‘Cycle-variable’ models (e.g. MEASURE, VERSIT+) – individual
vehicle driving patterns
-‘Modal’ models – engine operation, also microscale approach
•The choice of the modeling approach would depend on the purpose of
the computation (detail needed, scale of interest, etc)

21st USEPA International Emission Inventory Conference.
April 13-16, 2015. San Diego (California)
•The COPERT model (COmputer Programme to calculate Emissions from
Road Transport) (currently v.4.11) is the reference model according to the
EMEP/EEA methodology for the computation of road traffic emission
inventories in Europe
• Average speed model, more than 100 vehicle categories
• It has been integrated with the regional traffic model (TDM) for emission
computation at link level
0.00
0.20
0.40
0.60
0.80
1.00
1.20
1.40
1.60
10 20 30 40 50 60 70 80 90 100 110 120 130
Average speed (km/h)
NO
X e
mis
sio
ns
(g/k
m)
PC Euro 1 - 91/441/EEC
PC Euro 2 - 94/12/EEC
PC Euro 3 - 98/69/EC Stage2000
PC Euro 4 - 98/69/EC Stage2005
PC Euro 5 - EC 715/2007
PC Euro 6 - EC 715/2007

21st USEPA International Emission Inventory Conference.
April 13-16, 2015. San Diego (California)
Madrid city council TDM
• Distance travelled by vehicle type
• Running vehicle fleet
Vehicle fleet study
- EMT buses
- Other vehicle types
• Traffic counts
• Specific statistics
COPERT 4
Total emissions by zone and vehicle
type (63 categories)
Zone-specific aggregated emission curves = f(v)
Temporal profiles (weekly, diurnal)
Hourly emissions at link level
Surrogate data
Gridded annual emissions (1 km2)
Chemical speciation (NOX, COVs)
Mesoscale air
quality modeling
• Distance travelled by zone (veh*km)
• Average speed by zone
• Mesoscale road traffic emission computation scheme

21st USEPA International Emission Inventory Conference.
April 13-16, 2015. San Diego (California)
- Link-level, 1h intensity and speed from a macroscopic traffic model
- Fleet composition and age from field campaigns (characterization
study)
COPERT
• Fleet composition is a key input
for emission computation and
also from the policy making
perspectiveFigures from Borge et al., 2012 (AtmosEnv)
15 000 links aprox.

21st USEPA International Emission Inventory Conference.
April 13-16, 2015. San Diego (California)
• Outputs from COPERT
are routinely used for
the compilation of the
Madrid emission
inventory and
mesoscale modeling
activities (e.g. Madrid’s
Air Quality Plan)
•It has been found to
perform reasonably well
and similar to traffic-
situation models
(HBEFA)
Figures from Borge et al., 2012 (AtmosEnv)

21st USEPA International Emission Inventory Conference.
April 13-16, 2015. San Diego (California)
• Microscale emission computation
µg/m3
TECNAIRE project (2015)
• Further computation
detail is needed to
understand pollution
dynamics in urban hot-
spots (e.g. FL square; a
heavily-trafficked
roundabout)
•High temporal and spatial
resolution emissions from
cycle-variable models are
needed to simulate air
quality at this scale
21st USEPA International Emission Inventory Conference.
April 13-16, 2015. San Diego (California)
• Computation of microscale emissions require additional information to
describe the behaviour of single vehicles to produce individual
braking-acceleration patterns
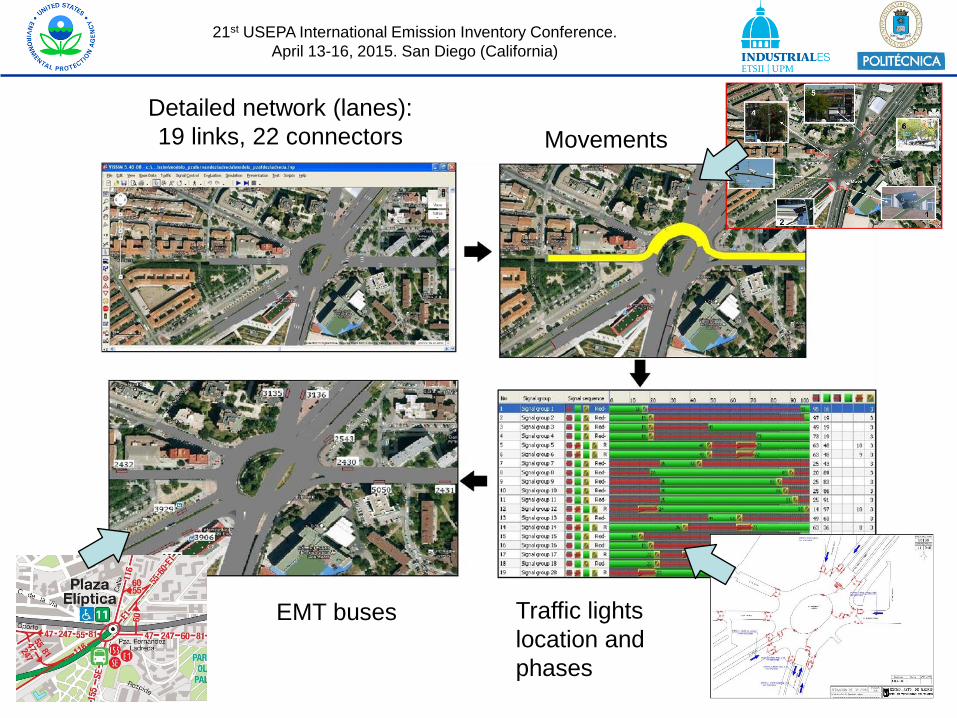
• The PTV VISSIM 6.00-19 microscale traffic flow model was selected
to generate realistic traffic data
• In addition to fleet composition this
model needs information on:
- Detailed network definition
- Vehicle fluxes and routes within
the modeling domain
- Traffic signs
- Traffic lights phases

21st USEPA International Emission Inventory Conference.
April 13-16, 2015. San Diego (California)
• Emissions are computed through VERSIT+ emission factors
• The link between traffic variables and emission factors is done by the
ENVIVER interface
* Limited by VERSIT+ classes
*

21st USEPA International Emission Inventory Conference.
April 13-16, 2015. San Diego (California)
•12 scenarios were selected to perform 1-h length simulations
• Representative of working and weekend days, peak and valley hours
Week
days
Weekends
Ave
rag
e tra
ffic
in
ten
sity
Ave
rag
e tra
ffic
in
ten
sity
Madrid municipality
Madrid Greater Region - others
Other provinces
Unknown

21st USEPA International Emission Inventory Conference.
April 13-16, 2015. San Diego (California)
2.2. Measurement campaign
•A 10-day field campaign (May 22-June 2, 2013) was carried out to:
- update vehicle fleet characterization in Madrid and in FL specifically
- detailed traffic flows within the microscale modeling domain
•The sampling points were
selected to be representative of
each of the areas defined in the
TDM (merged into 5: A to E)
• Already available equipment was
used as much as possible
• Additional cameras were only
deployed in FL

21st USEPA International Emission Inventory Conference.
April 13-16, 2015. San Diego (California)
Red-light cameras (17 locations)
FL cameras (2 locations)
Calle 30 cameras (tunnels) (34 loc.)
M-30 cameras (2 locations)
Manual sampling (13 locations)

21st USEPA International Emission Inventory Conference.
April 13-16, 2015. San Diego (California)
• Public buses were excluded. This information was provided by the
Municipal Transport Company (EMT):
- number and mileage of buses on each line
- detailed routes and frequency in each line
- plate number and characteristics of each bus

21st USEPA International Emission Inventory Conference.
April 13-16, 2015. San Diego (California)
• A total of 4,911,708 plate readings was made during the campaign
• Up to 1,304,112 different plates were identified (after data cleaning and
duplicates removal)
• Vehicle information was retrieved from the vehicle registration database
managed by the national traffic authority (DGT):
- date of first registration
- brand and model
- vehicle type (segment)
- service (public / private)
- number of seats / weight
- engine size
- propulsion technology
• hybrid indicator (yes/no)
• ZIP codes (vehicle & owner)

21st USEPA International Emission Inventory Conference.
April 13-16, 2015. San Diego (California)
• Vehicles were mapped into COPERT categories (plus some others
interesting for policy purposes; e.g. taxis)
• 199 vehicle type in this study
• Individual readings were merge by
vehicle type and zone to get a
“standard vehicle” by zone
• Total mileage in each zone was not
estimated but taken from the TDM

21st USEPA International Emission Inventory Conference.
April 13-16, 2015. San Diego (California)
• Additional data for the microscale simulation
• Video cameras (don’t read plates) to account for vehicle fluxes in each
possible route in the area of interest (FL square): movements
21st USEPA International Emission Inventory Conference.
April 13-16, 2015. San Diego (California)
Detailed network (lanes):
19 links, 22 connectors Movements
EMT buses Traffic lights
location and
phases

21st USEPA International Emission Inventory Conference.
April 13-16, 2015. San Diego (California)
Señalización: Velocidades, semáforos, líneas de detención.
Líneas regulares de autobús

21st USEPA International Emission Inventory Conference.
April 13-16, 2015. San Diego (California)
3. RESULTS AND DISCUSSION
• Fleet composition and emissions in Madrid
• Despite a decreasing tendency, road traffic is still the main contributor
of emissions in Madrid city (year 2013):
- 56.3 % of NOX
- 65.1 % of PM2.5 (exhaust)
- 40.6 % of CO2
21st USEPA International Emission Inventory Conference.
April 13-16, 2015. San Diego (California)
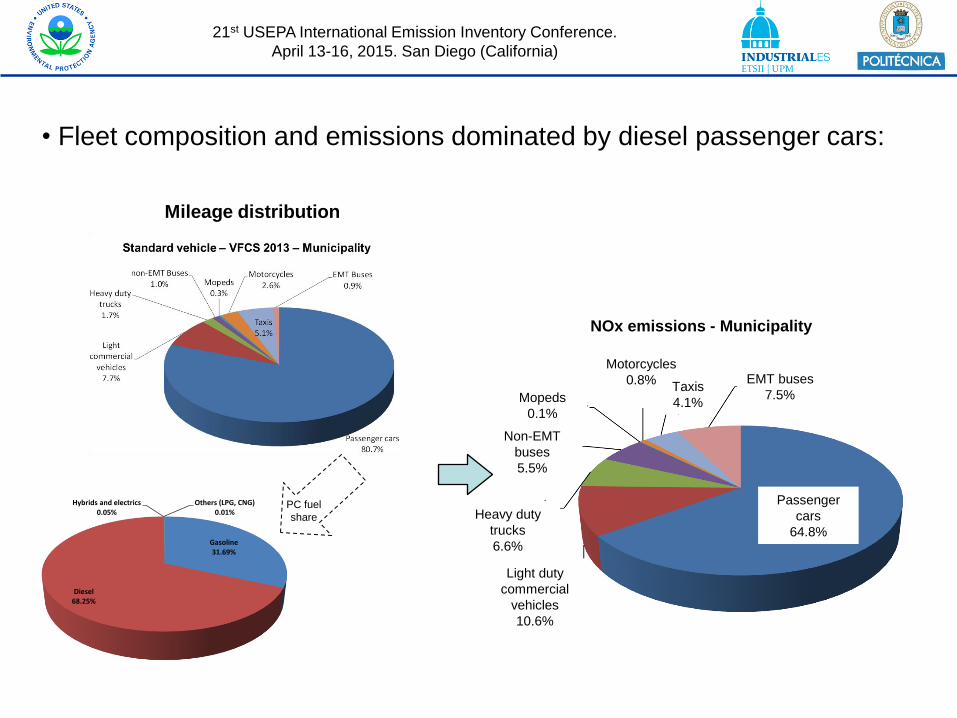
• Fleet composition and emissions dominated by diesel passenger cars:
Gasoline31.69%
Diesel68.25%
Hybrids and electrics0.05%
Others (LPG, CNG)0.01%
NOx emissions - Municipality
Motorcycles
0.8%Taxis
4.1%
EMT buses
7.5%Mopeds
0.1%
Non-EMT
buses
5.5%
Heavy duty
trucks
6.6%
Light duty
commercial
vehicles
10.6%
Passenger
cars
64.8%
PC fuel
share
Mileage distribution

21st USEPA International Emission Inventory Conference.
April 13-16, 2015. San Diego (California)
• NOX emissions are driven,
basically, by diesel vehicles (89%)
(99% of NO2)
• PM emissions are also generated
by diesel vehicles (86%)
• Gasoline influence on CO2
emissions is higher than
corresponding mileage share
(39%)
Source: Lumbreras et al., 2014

21st USEPA International Emission Inventory Conference.
April 13-16, 2015. San Diego (California)
• Average age has considerably increase (from the last, pre-crisis, fleet
characterization study)
Convencional
NOX 42.2%
NO2 57.6%
CO2 36.8%
ECE 15/00-01 y PRE ECE
ECE 15/02 a ECE 15/04
Euro 1
Euro 2
Euro 3
Euro 4
E5
Euro 3
Euro 1
Euro 4
E5
Euro 2
Diesel cars age histogram (Average = 7,2 years)Gasoline cars age histogram (Average = 13,0 years)
Previous study
(2009)
5.7
5.1
6.8
6.2
3.1
-
YearsYears

21st USEPA International Emission Inventory Conference.
April 13-16, 2015. San Diego (California)
• Microscale emission simulation in Fernández Ladreda square
• The 12 simulations were successfully performed
• The model produces individual speed and acceleration patterns for
every vehicle trip with a 0.2 sec. resolution
a (m/s2)
v (m/s)
(km/h)
tunnel
Combination frequency
+
-

21st USEPA International Emission Inventory Conference.
April 13-16, 2015. San Diego (California)
• This information is processed by ENVIVER to produce very high
resolution emissions
• The result need to be aggregated in time as needed (requirements of
the air quality model to be coupled)
• Emissions for every trip in each scenario were computed and the
results were aggregated for the whole hour period for comparison (and
5 m horizontal resolution)
Result example: speed-
acceleration graphic of a
passenger car for a given trip
in the E9 scenario

21st USEPA International Emission Inventory Conference.
April 13-16, 2015. San Diego (California)
• Hourly average speed was also computed in order to compare the
results with COPERT
Average speed (E1): low traffic intensity, freeflow
(Wednesday 4:00-5:00 AM)
NOX emissions (E1): 111 gr/h

21st USEPA International Emission Inventory Conference.
April 13-16, 2015. San Diego (California)
Average speed (E2): high traffic intensity, saturated
(Wednesday 8:00-9:00 AM)
NOX emissions (E2): 1721 gr/h
• The inverse relationship between average speed and emission is
clearly reproduced by the microscale model

21st USEPA International Emission Inventory Conference.
April 13-16, 2015. San Diego (California)
• NOX hourly emissions in the square range from 100 to more than 2000
grams
• Maximum emissions (afternoon peak hour) do not correspond to
maximum traffic intensity
•There is a significant variation in emissions per vehicle and distance
travelled throughout the day / week
• Vehicle type emission contribution (not shown) also varies considerably

21st USEPA International Emission Inventory Conference.
April 13-16, 2015. San Diego (California)
• Secondary emission factors as a function of speed have been computed
for each scenario and compared with the corresponding outputs of the
mesoscale model
COPERT IV and VERSIT+
micro NOx emissions
factors (g/km) for
passenger car
• Mean normalized bias error = 15.5% (taking COPERT as a reference)
• Deviations of VERSIT+ at scenario level range between -5% and 40%
0.0
0.2
0.4
0.6
0.8
1.0
1.2
1.4
1.6
1.8
2.0
E1 E2 E3 E4 E5 E6 E7 E8 E9 E10 E11 E12
VERSIT+ micro
COPERT IV4

21st USEPA International Emission Inventory Conference.
April 13-16, 2015. San Diego (California)
4. CONCLUSIONS
• Road traffic is the main emitting sector in Madrid
• The methodology applied to compute emissions at microscale shows
promising results
• Good agreement with well-known average speed algorithms used for
mesoscale modeling
• According to the results, complementary local measures in hot spots may
play a relevant role in future air quality policies

21st USEPA International Emission Inventory Conference.
April 13-16, 2015. San Diego (California)
• Apply the methodology to other hot spot configurations (junctions, street
canyons, etc.)
• Better understanding and refinement of emission computation algorithms
to expand the vehicle type categories available and make full use of the
data provided by the fleet characterization study
• Enhance emission results exportability and other issues for
postprocessing and integration with CFD codes (numerical results, grid
cell size) for hot-spot air quality modeling
Next steps (microscale emission modeling)

21st USEPA International Emission Inventory Conference.
April 13-16, 2015. San Diego (California)
Thank you for your [email protected]
• The Madrid City Council provided the
mesoscale traffic model outputs, traffic
cameras and funded this studys
• The fleet characterization study was
possible thanks to the collaboration of the
national traffic authority (DGT), the
Municipal Transport Company (EMT, S.A.),
Madrid Calle 30, S.A.
• Acknowledgments:
• The TECNAIRE-CM research project was
funded by the Madrid Greater Region
(S2013/MAE-2972)
• VISSIM and VERSIT+micro (ENVIVER)
ware licensed by PTV Group and TNO