Danish emission inventories for stationary combustion ...
240
AU NATIONAL ENVIRONMENTAL RESEARCH INSTITUTE AARHUS UNIVERSITY NERI Technical Report no. 795 2010 DANISH EMISSION INVENTORIES FOR STATIONARY COMBUSTION PLANTS Inventories until 2008
Transcript of Danish emission inventories for stationary combustion ...
AUNATIONAL ENVIRONMENTAL RESEARCH INSTITUTEAARHUS UNIVERSITY
NERI Technical Report no. 795 2010
DANISH EMISSION INVENTORIESfOR STATIONARY COMbUSTION pLANTSInventories until 2008

[Blank page]
AU
Danish emission inventories for stationary combustion plantsinventories until 2008
neri technical report no. 795 2010
malene nielsen ole-Kenneth nielsenmarlene plejdrupKatja hjelgaard
national environmental research instituteaarhus university
����������
Series title and no.: NERI Technical Report No. 795
Title: Danish emission inventories for stationary combustion plants Subtitle: Inventories until 2008
Authors: Malene Nielsen, Ole-Kenneth Nielsen. Marlene Plejdrup, Katja Hjelgaard Department: Department of Policy Analysis Publisher: National Environmental Research Institute
Aarhus University - Denmark URL: http://www.neri.dk
Year of publication: October 2010 Editing completed: September 2010
Financial support: No external financial support
Please cite as: Nielsen, M., Nielsen, O.-K., Plejdrup, M. & Hjelgaard, K., 2010: Danish Emission Inventories for Stationary Combustion Plants. Inventories until 2008. National Environmental Research Insti-tute, Aarhus University, Denmark. 236 pp. – NERI Technical Report No. 795. http://www.dmu.dk/Pub/FR795.pdf.
Reproduction permitted provided the source is explicitly acknowledged
Abstract: Emission inventories for stationary combustion plants are presented and the methodologies and assumptions used for the inventories are described. The pollutants considered are SO2, NOx, NMVOC, CH4, CO, CO2, N2O, NH3, particulate matter, heavy metals, dioxins, HCB and PAH. The CO2 emission in 2008 was 16 % lower than in 1990. However, fluctuations in the emission level are large as a result of electricity import/export. The emission of CH4 has increased due to increased use of lean-burn gas engines in combined heating and power (CHP) plants. However, the emission has decreased in recent years due to structural changes in the Danish electricity market. The N2O emission was higher in 2008 than in 1990 but the fluctuations in the time-series are significant. A considerable decrease of the SO2, NOx and heavy metal emissions is mainly a result of decreased emissions from large power plants and waste incineration plants. The combustion of wood in residential plants has increased considerably in recent years result-ing in increased emission of PAH, particulate matter and CO. The emission of NMVOC has in-creased since 1990 as a result of both the increased combustion of wood in residential plants and the increased emission from lean-burn gas engines. The dioxin emission decreased since 1990 due to flue gas cleaning on waste incineration plants. However in recent years the emis-sion has increased as a result of the increased combustion of wood in residential plants.
Keywords: Emission, combustion, power plants, district heating, CHP, co-generation, incineration, MSW, residential combustion, SO2, NOx, NMVOC, CH4, CO, CO2, N2O, PM, NH3, heavy metals, dioxin, PAH, HCB, greenhouse gas, emission inventory, uncertainty.
Layout: Ann-Katrine Holme Christoffersen ISBN: 978-87-7073-192-8 ISSN (electronic): 1600-0048 Number of pages: 236
Internet version: The report is available in electronic format (pdf) at NERI's website http://www.dmu.dk/Pub/FR795.pdf
!������
"���������������������
#��������
$�������
$����%��&�''
' ����%������'(
� ������ ����������'�
) *�� �����������%����'�
( +��������&������������) 4.1 CO2 24 4.2 CH4 26 4.3 N2O 28
� $,�-��,�-��./,!��%�!,�)� 5.1 SO2 30 5.2 NOx 32 5.3 NMVOC 33 5.4 CO 35
0 #������ �����������1#.2�)�
� 3��������� ��('
#43�(0
� ���5��(�
'� 3!6��'
'' �3����
'� $������ ����%��) 12.1 1A1 Energy industries 53 12.2 1A2 Industry 63 12.3 1A4 Other Sectors 69
') +��&������ �%��������������������������� '
'( .���%� �&��� �������� � 14.1 Emission source categories 82 14.2 Tiers 84 14.3 Large point sources 84
14.4 Area sources 85 14.5 Activity rates, fuel consumption 85 14.6 Town gas 86 14.7 Emission factors 88 14.8 Disaggregation to specific industrial subcategories 106
'� 7���������'�� 15.1 Methodology 107 15.2 Results 110
'0 8498!��%�������������''� 16.1 Reference approach 112 16.2 External review 113 16.3 Key source analysis 114
'� �������������%����� �� ������������������&��������''�
' # ��%�������������''
'� !�� �����''�
����������'���
4�5���'� �
�
5
"��������������������
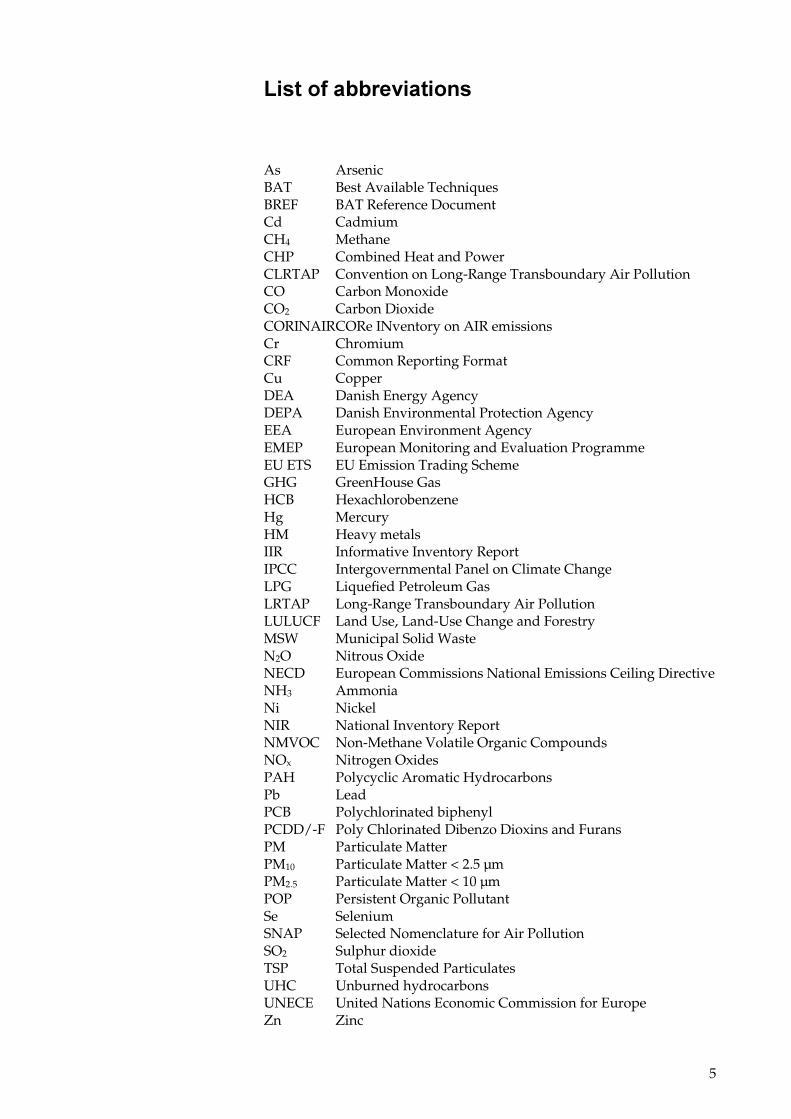
As Arsenic BAT Best Available Techniques BREF BAT Reference Document Cd Cadmium CH4 Methane CHP Combined Heat and Power CLRTAP Convention on Long-Range Transboundary Air Pollution CO Carbon Monoxide CO2 Carbon Dioxide CORINAIR CORe INventory on AIR emissions Cr Chromium CRF Common Reporting Format Cu Copper DEA Danish Energy Agency DEPA Danish Environmental Protection Agency EEA European Environment Agency EMEP European Monitoring and Evaluation Programme EU ETS EU Emission Trading Scheme GHG GreenHouse Gas HCB Hexachlorobenzene Hg Mercury HM Heavy metals IIR Informative Inventory Report IPCC Intergovernmental Panel on Climate Change LPG Liquefied Petroleum Gas LRTAP Long-Range Transboundary Air Pollution LULUCF Land Use, Land-Use Change and Forestry MSW Municipal Solid Waste N2O Nitrous Oxide NECD European Commissions National Emissions Ceiling Directive NH3 Ammonia Ni Nickel NIR National Inventory Report NMVOC Non-Methane Volatile Organic Compounds NOx Nitrogen Oxides PAH Polycyclic Aromatic Hydrocarbons Pb Lead PCB Polychlorinated biphenyl PCDD/-F Poly Chlorinated Dibenzo Dioxins and Furans PM Particulate Matter PM10 Particulate Matter < 2.5 µm PM2.5 Particulate Matter < 10 µm POP Persistent Organic Pollutant Se Selenium SNAP Selected Nomenclature for Air Pollution SO2 Sulphur dioxide TSP Total Suspended Particulates UHC Unburned hydrocarbons UNECE United Nations Economic Commission for Europe Zn Zinc

6
7
#�������
On behalf of the Ministry of the Environment and the Ministry of Cli-mate and Energy, the Danish National Environmental Research Insti-tute (NERI) at Aarhus University prepares the Danish atmospheric emis-sion inventories and reports the results on an annual basis to the United Nations Framework Convention on Climate Change (UNFCCC) and to the United Nations Economic Commission for Europe (UNECE) Conven-tion on Long-Range Transboundary Air Pollution (LRTAP Convention). This report forms part of the documentation for the inventories and cov-ers emissions from stationary combustion plants. The results of invento-ries up to 2008 are included. The report updates the four reports pub-lished in 2004, 2006, 2007 and 2009.
The 2004, 2006 and 2009 updates of this report were reviewed by Jan Erik Johnsson from the Technical University of Denmark, Bo Sander from El-sam Engineering and Annemette Geertinger from FORCE Technology.
8
$�������
Danish emission inventories are prepared on an annual basis and are re-ported to the United Nations Framework Convention on Climate Change (UNFCCC or Climate Convention) and to the Kyoto Protocol as well as to the United Nations Economic Commission for Europe (UN-ECE) Convention on Long-Range Transboundary Air Pollution (LRTAP Convention). Furthermore, a greenhouse gas emission inventory is re-ported to the European Union (EU) due to the EU – as well as the indi-vidual member states – being party to the Climate Convention. Four pol-lutants are estimated for reporting to the European Commissions Na-tional Emissions Ceiling Directive (NECD). The annual Danish emission inventories are prepared by the Danish National Environmental Re-search Institute (NERI), Aarhus University (AU). The inventories include the following pollutants relevant to stationary combustion: CO2, CH4, N2O, SO2, NOx, NMVOC, CO, particulate matter, NH3, heavy metals, di-oxins, PAH and HCB. In addition to annual national emissions, the re-port includes emission data for a number of source categories. Every five years the reporting includes data on the geographical distribution of the emissions, a projection of emissions, data and details of the activity data, e.g. fuel consumption – on which the inventories are based.
The inventories for stationary combustion are based on the Danish en-ergy statistics and on a set of emission factors for various source catego-ries, technologies and fuels. Plant specific emissions for large combustion sources are incorporated into the inventories. This report provides de-tailed background information on the methodology and references for the input data in the inventory - energy statistics and emission factors.
The emission factors are based on either national references or on inter-national guidebooks (EEA, 2008; IPCC, 1997). The majority of the coun-try-specific emission factors refer to: Danish legislation, Danish research reports or calculations based on plant-specific emission data from a con-siderable number of large point sources. The plant-specific emission fac-tors are provided by plant operators, e.g. in annual environmental re-ports or in the EU ETS1.
In the inventory for the year 2008, 70 stationary combustion plants are specified as large point sources. The point sources include large power plants, municipal waste incineration plants, industrial combustion plants and petroleum refining plants. The fuel consumption of these large point sources corresponds to 58 % of the overall fuel consumption of station-ary combustion.
In 2008 the total fuel consumption was 7 % higher than in 1990; the fossil fuel consumption, however, was 7 % lower than in 1990. The use of coal has decreased whereas the use of natural gas and biomass has increased. The fuel consumption for stationary combustion plants fluctuates due to variation in the import/export of electricity from year to year.
1 EU Emission Trading Scheme.
9
Stationary combustion plants account for more than 50 % of the national emission for the following pollutants: SO2, CO2, heavy metals (except Cu, Pb and Zn), PM10, PM2.5, dioxin, HCB and PAH. Furthermore, the emis-sion from stationary combustion plants accounts for more than 10 % of the national emission for the following pollutants: NOx, CO, NMVOC, TSP, Cu, Pb and Zn. Stationary combustion plants account for less than 10 % of the national emission of CH4, N2O and NH3.
Public electricity and heat production are the most important stationary combustion emission source for CO2, N2O, SO2 and NOx.
Lean-burn gas engines installed in decentralised combined heating and power (CHP) plants and combustion of biomass in residential plants are the two largest emission sources for CH4.
Residential plants represent the most important stationary combustion emission source for CO, NMVOC, particulate matter, PAH and dioxin. Wood combustion in residential plants is the predominant emission source.
Industrial plants, public electricity and heat production plants and resi-dential plants are the main emission sources for the different heavy met-als.
The greenhouse gas (GHG) emission trend follows the CO2 emission trend closely. Both the CO2 and the total GHG emission were lower in 2008 than in 1990: CO2 by 16 % and GHG by 15 %. However, fluctuations in the GHG emission level are large. The fluctuations in the time-series are mainly a result of electricity import/export but also of outdoor tem-perature variations from year to year that results in fluctuations in the consumption for space heating.
The CH4 emission from stationary combustion has increased by a factor of 3.5 since 1990. This is mainly a result of the considerable number of lean-burn gas engines installed in CHP plants in Denmark during the 1990s. In recent years the emission has declined. This is due to structural changes in the Danish electricity market, which means that the fuel con-sumption in gas engines has decreased. The CH4 emission from residen-tial plants has increased since 1990 due to increased combustion of wood in residential plants.
The emission of N2O was 7 % higher in 2008 than in 1990. The fluctua-tions follow the fluctuations of the fuel consumption, which is a result of import/export of electricity.
SO2 emission from stationary combustion plants has decreased by 90 % since 1990. The considerable emission decrease is mainly a result of the reduced emission from electricity and heat production due to installation of desulphurisation technology and the use of fuels with lower sulphur content. These improvements are a result of both sulphur tax laws and legislation concerning sulphur content of fuels, emission ceilings for large power plants and emission limits for several plant categories.
The NOx emission from stationary combustion plants has decreased by 56 % since 1990. The reduced emission is mainly a result of the reduced
10
emission from electricity and heat production due to installation of low NOx burners and selective catalytic reduction (SCR) units. The installa-tion of the technical improvements was launched by legislation includ-ing emission ceilings for large power plants and lower emission limits for several plant categories. The fluctuations in the emission time-series follow fluctuations in electricity import/export.
In 2008 the wood consumption in residential plants was four times the 1990 level. This increase causes considerable changes in the emission of NMVOC, CO, PM and PAH from stationary combustion due to the fact that residential wood combustion is a major emission source for these pollutants. However, a change of technology (installation of modern stoves) has caused decreasing emission factors for several pollutants.
The CO emission from stationary combustion has increased 16 % since 1990. The increase in CO emission from residential plants is less than the increase in wood consumption because the CO emission factor for wood combustion in residential plants has decreased since 1990. Furthermore, the emission from straw-fired farmhouse boilers has decreased consid-erably.
The NMVOC emission from stationary combustion plants has increased 50 % since 1990. The increased NMVOC emission is mainly a result of the increasing wood combustion in residential plants and the increased use of lean-burn gas engines. The emission from straw-fired farmhouse boilers has decreased.
The emission of TSP, PM10 and PM2.5 has increased by 57-62 % since 2000 due to the increase of wood combustion in residential plants. The emis-sion of PAHs has increased by 120-170 % since 1990, also a result of the increased combustion of wood in residential plants.
All the heavy metal emissions have decreased considerably since 1990 – between 65 % and 87 %; Zn, however, only 5 %. This is a result of the in-stallation and improved performance of gas cleaning devices in munici-pal waste incineration plants and large power plants.
Dioxin emission has decreased 55 % since 1990 mainly due to installation of dioxin filters in municipal solid waste (MSW) incineration plants that was necessary due to the emission limit included in Danish legislation. However, the emission from residential plants has increased due to the increased wood combustion in the sector. This has caused an increase of dioxin emission from stationary combustion since 2004.
The uncertainty level of the Danish greenhouse gas (GHG) emission from stationary combustion is estimated to be within a range of ±2.1 % and the trend in GHG emission (1990-2008) is -14.6 % ± 1.4 %-age points2.
2 Tier 1 approach. This year a tier 2 approach for uncertainty estimates have also been applied.
11
$����%��&�
Opgørelser over de samlede danske luftemissioner rapporteres årligt til Klimakonventionen (United Nation Framework Convention on Climate Change, UNFCCC) og Kyotoprotokollen samt til UNECE (United Na-tions Economic Commission for Europe) Konventionen om langtrans-porteret grænseoverskridende luftforurening (UNECE Convention on Long-Range Transboundary Air Pollution, der forkortes LRTAP Conven-tion). Endvidere rapporteres drivhusgasemissionen til EU, fordi EU – så-vel som de enkelte medlemslande – har ratificeret klimakonventionen. Der udarbejdes også opgørelser til rapportering til Europa-Kommissionens NEC (National Emissions Ceiling) direktiv. De danske emissioner opgøres og rapporteres af Danmarks Miljøundersøgelser (DMU) ved Aarhus Universitet (AU). Emissionsopgørelserne omfatter følgende stoffer af relevans for stationær forbrænding: CO2, CH4, N2O, SO2, NOx, NMVOC, CO, partikler, NH3, tungmetaller, dioxin, PAH og HCB. Foruden de årlige opgørelser over samlede nationale emissioner, rapporteres også sektoropdelt emission. Hvert femte år rapporteres end-videre en geografisk fordeling af emissionerne, fremskrivning af emissi-onerne samt de aktivitetsdata – fx brændselsforbrug – der ligger til grund for opgørelserne.
Emissionsopgørelserne for stationære forbrændingsanlæg (ikke mobile kilder) er baseret på den danske energistatistik og på et sæt emissions-faktorer for forskellige sektorer, teknologier og brændsler. Anlægsspeci-fikke emissionsdata for store anlæg, som fx kraftværker, indarbejdes i opgørelserne. Denne rapport giver detaljeret baggrundsinformation om den anvendte metode samt referencer for de data der ligger til grund for opgørelsen – energistatistikken og emissionsfaktorerne.
Emissionsfaktorerne stammer enten fra danske referencer eller fra inter-nationale guidebøger (EEA, 2009 og IPCC, 1997) udarbejdet til brug for denne type emissionsopgørelser. De danske referencer omfatter miljø-lovgivning, danske rapporter samt middelværdier baseret på anlægsspe-cifikke emissionsdata fra et betydeligt antal større værker. Anlægsspeci-fikke emissionsfaktorer oplyses af anlægsejere, bl.a. i grønne regnskaber og i CO2-kvoteindberetninger.
I emissionsopgørelsen for 2008 er 70 stationære forbrændingsanlæg defi-neret som punktkilder. Punktkilderne omfatter: kraftværker, decentrale kraftvarmeværker, affaldsforbrændingsanlæg, industrielle forbræn-dingsanlæg samt raffinaderier. Brændselsforbruget for disse anlæg ud-gør 58 % af det samlede brændselsforbrug for stationære forbrændings-anlæg.
Variationen i årlig import/eksport af el medvirker til at brændselsfor-bruget til stationære forbrændingsanlæg varierer. I 2008 var det samlede brændselsforbruget 7 % højere end i 1990, mens forbruget af fossile brændsler var 7 % lavere. Forbruget af kul er faldet, mens forbruget af naturgas og af biobrændsler er steget.
12
For følgende stoffer udgør emissionen fra stationær forbrænding over 50 % af den nationale emission: SO2, CO2, tungmetaller (dog ikke Cu, Pb og Zn), PM10, PM2.5, dioxin, HCB og PAH. Endvidere udgør emissionen over 10 % for NOx, CO, NMVOC, TSP, Cu, Pb og Zn. Stationær forbræn-ding bidrager med mindre end 10 % af den nationale emission af CH4, N2O og NH3.
Indenfor stationær forbrænding er kraftværker og decentrale kraftvar-meværker den betydeligste emissionskilde for CO2, N2O, SO2 og NOx.
Gasmotorer installeret på decentrale kraftvarmeværker er sammen med forbrænding af biomasse i forbindelse med beboelse de største emissi-onskilder for CH4.
Emissioner fra kedler, brændeovne mv. i forbindelse med beboelse er den betydeligste emissionskilde for CO, NMVOC, partikler, dioxin og PAH. Det er især forbrænding af træ, som bidrager til disse emissioner.
Både industrianlæg, kraftværker/kraftvarmeværker samt villakedler/-brændeovne er væsentlige emissionskilder for de forskellige tungmetal-ler.
I rapporten vises tidsserier for emissioner fra stationær forbrænding.
Udviklingen i drivhusgasemissionen følger udviklingen i CO2-emis-sionen ganske tæt. Både CO2-emissionen og den samlede drivhusgas-emission fra stationær forbrænding er lavere i 2008 end i 1990. CO2 er 16 % lavere og drivhusgasemissionen er 15 % lavere. Emissionerne fluktue-rer dog betydeligt, primært pga. variationerne i import/eksport af el men også pga. varierende udetemperatur og deraf følgende brændsels-forbrug til rumopvarmning.
CH4-emissionen fra stationær forbrænding er steget med en faktor 3,5 siden 1990. Denne stigning skyldes primært, at der i 1990’erne blev in-stalleret et betydeligt antal gasmotorer på decentrale kraftvarmeværker. De senere år er emissionen dog faldet lidt. Som følge af de ændrede af-regningsregler i henhold til det frie elmarked. Emissionen fra beboelse er steget væsentligt de senere år pga. den øgede forbrænding af træ i bræn-deovne mv.
Emissionen af N2O var 7 % højere i 2008 end i 1990. Emissionen af N2O fluktuerer som følge af variationerne i import/eksport af el.
SO2-emissionen fra stationær forbrænding er faldet med 90 % siden 1990. Den store reduktion er primært et resultat af installering af afsvovlnings-anlæg fra el- og fjernvarmeproducerende anlæg samt brug af brændsler med lavere svovlindhold. Dette er sket på baggrund af en indført svovl-afgift, grænseværdier for svovlindhold i brændsler, emissionskvotebe-stemmelser for centrale kraftværker samt emissionsgrænseværdier.
NOx-emissionen fra stationær forbrænding er faldet med 56 % siden 1990. Reduktionen er primært et resultat af, at emissionen fra el- og fjernvarmeproducerende anlæg er faldet som følge af, at der benyttes lav-NOx-brændere på flere anlæg og at der er idriftsat NOx-røggasrensning på flere store kraftværker. Baggrunden herfor er emissi-
13
onskvotebestemmelser for de centrale kraftværker samt skærpede emis-sionsgrænseværdier for flere anlægstyper. NOx-emissionen fluktuerer som følge af variationen i import/eksport af el.
Mængden af træ forbrændt i villakedler og brændeovne var i 2008 fire gange så højt som i 1990. Dette har stor betydning for emissionstidsse-rierne for en række emissionskomponenter for hvilke netop træ, anvendt i villakedler/brændeovne, er en væsentlig emissionskilde: NMVOC, CO, partikler og PAH. Emissionen fra nyere brændeovne mv. er lavere end for de ældre, idet forbrændingsteknologien er forbedret, og stigningen i emissioner er således lavere end stigningen i brændselsforbruget.
CO-emissionen fra stationær forbrænding er steget 16 % siden 1990. Emissionen fra brændeovne er steget, men samtidig er emissionen fra halmfyrede gårdanlæg faldet.
Emissionen af NMVOC fra stationær forbrænding er øget med 50 % si-den 1990. Stigningen er primært et resultat af det øgede forbrug af træ i forbindelse med beboelse (brændeovne mv.) og idriftsættelsen af gasmo-torer på decentrale kraftvarmeværker.
Emissionen af TSP er steget 57 % siden år 2000 - igen på grund af den øgede brug af træ i brændeovne og små villakedler. Emissionen af de forskellige PAH’er er af samme grund steget 120-170 % siden 1990.
Emissionen af dioxin var 55 % lavere i 2008 end i 1990. Dette fald skyldes primært installering af dioxinrensningsanlæg på affaldsforbrændingsan-læg som alle affaldsforbrændingsanlæg iht. forbrændingsbekendtgørel-sen3 skulle idriftsætte senest i 2005. Emissionen fra brændeovne er dog samtidig steget og dette har resulteret i en stigning i dioxinemissionen de senere år.
Tungmetalemissionerne er faldet betydeligt siden 1990. Emissionen af de enkelte tungmetaller er reduceret mellem 65 % og 87 %, Zn dog kun 5 %. Reduktionen er et resultat af den forbedrede røggasrensning på affalds-forbrændingsanlæg og på kraftværker.
Emissionen af drivhusgasser er bestemt med en usikkerhed på ±2,1 %. Drivhusgasemissionen er siden 1990 faldet 14,6 % ± 1,4 %-point4.
3 Bekendtgørelse om anlæg der forbrænder affald, Bekendtgørelse 162 af 11. marts 2003. 4 Resultater af Tier 1 approach. I år er der endvidere beregnet usikkerhed med tier 2 approach.
14
'� ����%������
Danish emission inventories are prepared on an annual basis and are re-ported to the United Nations Framework Convention on Climate Change (UNFCCC or Climate Convention) and to the Kyoto Protocol as well as to the United Nations Economic Commission for Europe (UN-ECE) Convention on Long-Range Transboundary Air Pollution (LRTAP Convention). Furthermore, a greenhouse gas emission inventory is re-ported to the European Union (EU), due to the EU – as well as the indi-vidual member states – being party to the Climate Convention. Four pol-lutants are estimated for reporting to the European Commissions Na-tional Emissions Ceiling Directive (NECD). The annual Danish emission inventories are prepared by the Danish National Environmental Re-search Institute (NERI), Aarhus University (AU) on behalf of the Minis-try of the Environment and the Ministry of Climate and Energy.
The data in this report do not include emissions from Greenland and the Faroe Islands.
Stationary combustion plants include power plants, district heating plants, non-industrial and industrial combustion plants, industrial proc-ess burners, petroleum-refining plants, as well as combustion in oil/gas extraction and in pipeline compressors. Emissions from flaring in oil/gas production and from flaring carried out in refineries are not covered by this report.�
This report presents detailed emission inventories and time-series for emissions from stationary combustion plants. Furthermore, emissions from stationary combustion plants are compared with national emis-sions.
The methodology and references for the emission inventories for station-ary combustion plants are described.
Furthermore, the report includes key source analysis, uncertainty esti-mates and reporting of QA/QC activities.�
15
�� ������ ����������
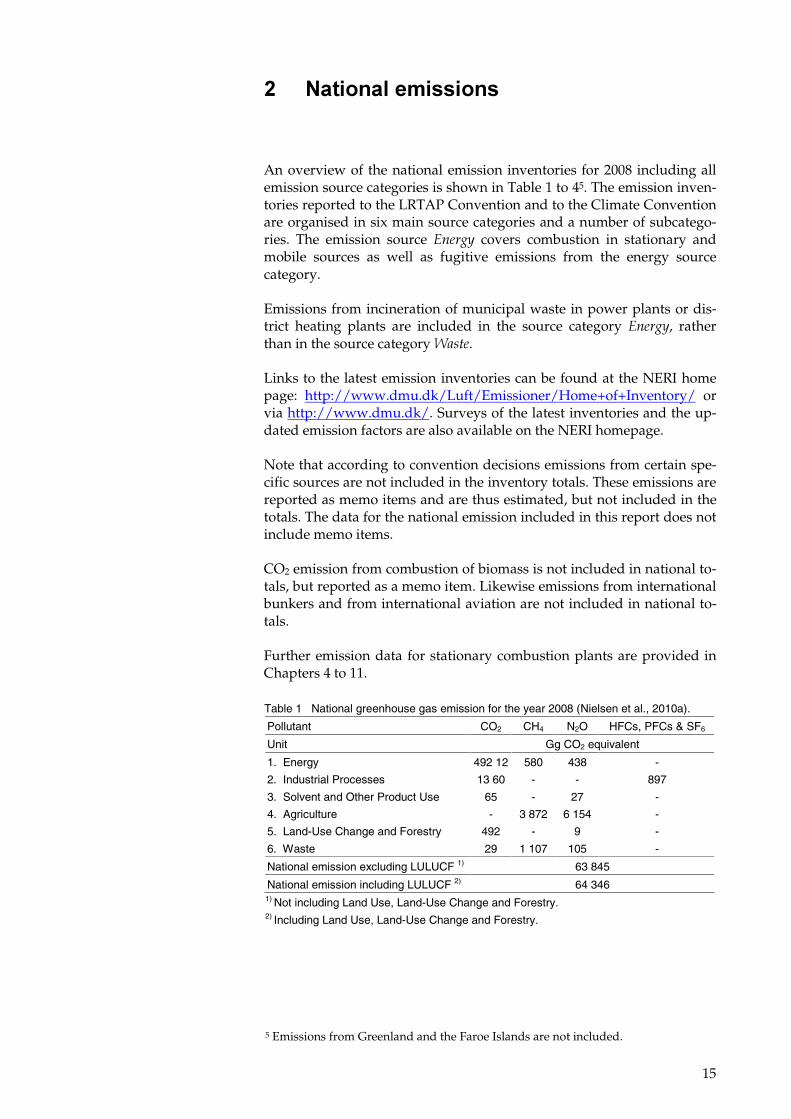
An overview of the national emission inventories for 2008 including all emission source categories is shown in Table 1 to 45. The emission inven-tories reported to the LRTAP Convention and to the Climate Convention are organised in six main source categories and a number of subcatego-ries. The emission source ������ covers combustion in stationary and mobile sources as well as fugitive emissions from the energy source category.
Emissions from incineration of municipal waste in power plants or dis-trict heating plants are included in the source category ������, rather than in the source category ���.
Links to the latest emission inventories can be found at the NERI home page: http://www.dmu.dk/Luft/Emissioner/Home+of+Inventory/ or via http://www.dmu.dk/. Surveys of the latest inventories and the up-dated emission factors are also available on the NERI homepage.
Note that according to convention decisions emissions from certain spe-cific sources are not included in the inventory totals. These emissions are reported as memo items and are thus estimated, but not included in the totals. The data for the national emission included in this report does not include memo items.
CO2 emission from combustion of biomass is not included in national to-tals, but reported as a memo item. Likewise emissions from international bunkers and from international aviation are not included in national to-tals.
Further emission data for stationary combustion plants are provided in Chapters 4 to 11.
Table 1 National greenhouse gas emission for the year 2008 (Nielsen et al., 2010a).
Pollutant CO2 CH4 N2O HFCs, PFCs & SF6
Unit Gg CO2 equivalent
1. Energy 492 12 580 438 -
2. Industrial Processes 13 60 - - 897
3. Solvent and Other Product Use 65 - 27 -
4. Agriculture - 3 872 6 154 -
5. Land-Use Change and Forestry 492 - 9 -
6. Waste 29 1 107 105 -
National emission excluding LULUCF 1) 63 845
National emission including LULUCF 2) 64 346 1) Not including Land Use, Land-Use Change and Forestry. 2) Including Land Use, Land-Use Change and Forestry.
5 Emissions from Greenland and the Faroe Islands are not included.
16
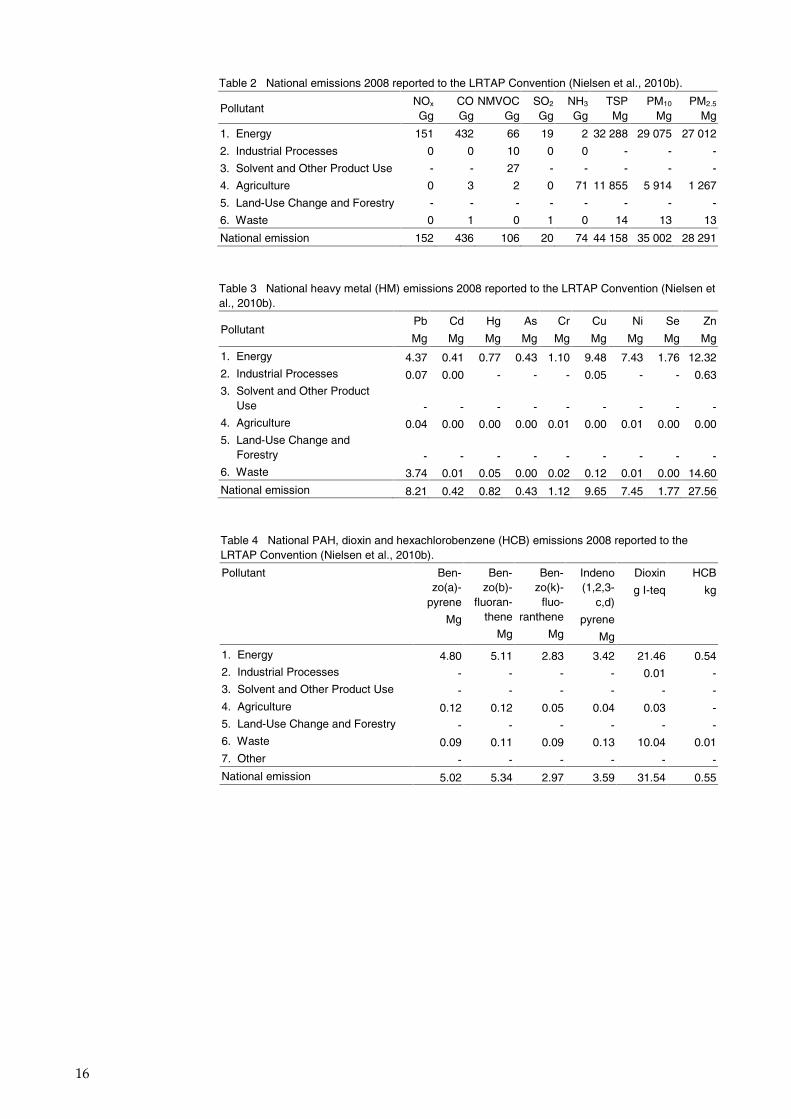
Table 2 National emissions 2008 reported to the LRTAP Convention (Nielsen et al., 2010b).
Table 3 National heavy metal (HM) emissions 2008 reported to the LRTAP Convention (Nielsen et al., 2010b).
Table 4 National PAH, dioxin and hexachlorobenzene (HCB) emissions 2008 reported to the LRTAP Convention (Nielsen et al., 2010b).
Pollutant Ben-zo(a)-
pyrene
Mg
Ben-zo(b)-
fluoran- thene
Mg
Ben-zo(k)-
fluo-ranthene
Mg
Indeno (1,2,3-
c,d)
pyrene
Mg
Dioxin
g I-teq
HCB
kg
1. Energy 4.80 5.11 2.83 3.42 21.46 0.54 2. Industrial Processes - - - - 0.01 - 3. Solvent and Other Product Use - - - - - - 4. Agriculture 0.12 0.12 0.05 0.04 0.03 - 5. Land-Use Change and Forestry - - - - - - 6. Waste 0.09 0.11 0.09 0.13 10.04 0.01 7. Other - - - - - -
National emission 5.02 5.34 2.97 3.59 31.54 0.55
Pollutant NOx Gg
CO Gg
NMVOC Gg
SO2
Gg NH3
Gg TSP Mg
PM10
Mg PM2.5
Mg
1. Energy 151 432 66 19 2 32 288 29 075 27 012
2. Industrial Processes 0 0 10 0 0 - - -
3. Solvent and Other Product Use - - 27 - - - - -
4. Agriculture 0 3 2 0 71 11 855 5 914 1 267
5. Land-Use Change and Forestry - - - - - - - -
6. Waste 0 1 0 1 0 14 13 13
National emission 152 436 106 20 74 44 158 35 002 28 291
Pollutant Pb
Mg
Cd
Mg
Hg
Mg
As
Mg
Cr
Mg
Cu
Mg
Ni
Mg
Se
Mg
Zn
Mg
1. Energy 4.37 0.41 0.77 0.43 1.10 9.48 7.43 1.76 12.32 2. Industrial Processes 0.07 0.00 - - - 0.05 - - 0.63 3. Solvent and Other Product
Use - - - - - - - - - 4. Agriculture 0.04 0.00 0.00 0.00 0.01 0.00 0.01 0.00 0.00 5. Land-Use Change and
Forestry - - - - - - - - - 6. Waste 3.74 0.01 0.05 0.00 0.02 0.12 0.01 0.00 14.60
National emission 8.21 0.42 0.82 0.43 1.12 9.65 7.45 1.77 27.56
17
)� *�� �����������%����
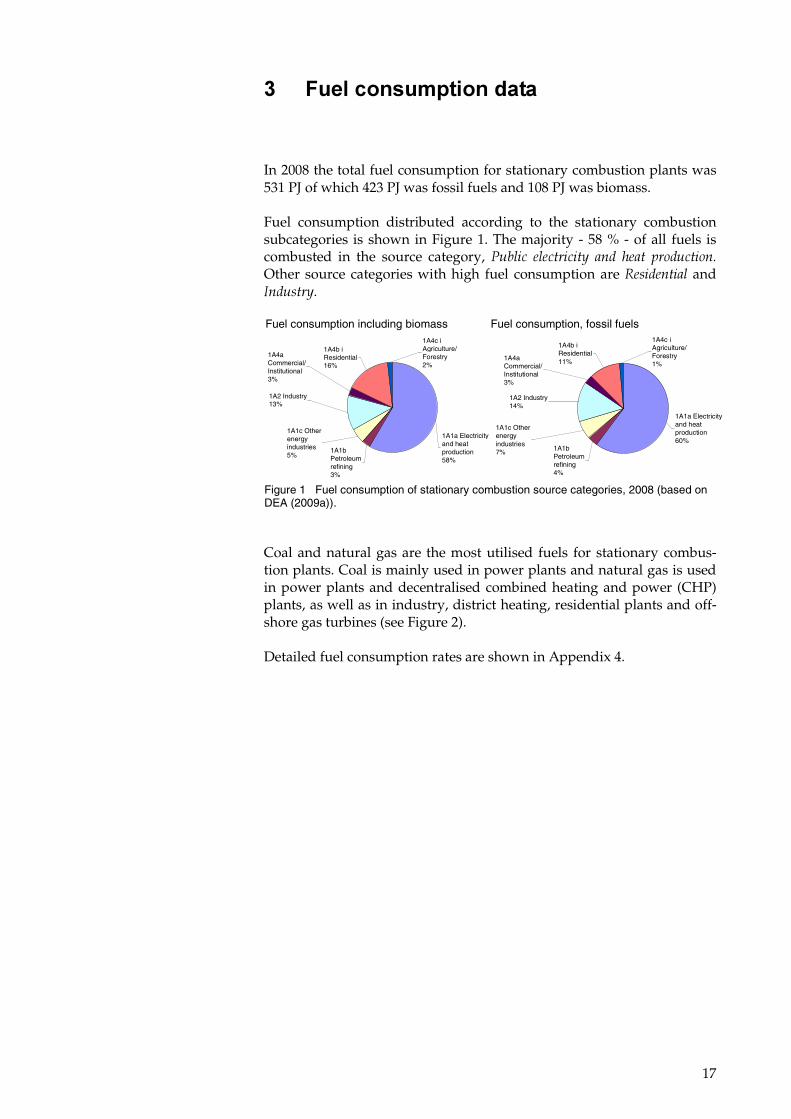
In 2008 the total fuel consumption for stationary combustion plants was 531 PJ of which 423 PJ was fossil fuels and 108 PJ was biomass.
Fuel consumption distributed according to the stationary combustion subcategories is shown in Figure 1. The majority - 58 % - of all fuels is combusted in the source category, �� ���� ���������� ���� ���� ���������� Other source categories with high fuel consumption are ��������� and ������.
Fuel consumption including biomass Fuel consumption, fossil fuels
1A1b Petroleum refining3%
1A1c Other energy industries5%
1A2 Industry13%
1A4a Commercial/ Institutional3%
1A4b i Residential16%
1A4c i Agriculture/ Forestry2%
1A1a Electricity and heat production58%
1A1b Petroleum refining4%
1A1c Other energy industries7%
1A2 Industry14%
1A4a Commercial/ Institutional3%
1A4b i Residential11%
1A4c i Agriculture/ Forestry1%
1A1a Electricity and heat production60%
Figure 1 Fuel consumption of stationary combustion source categories, 2008 (based on DEA (2009a)).
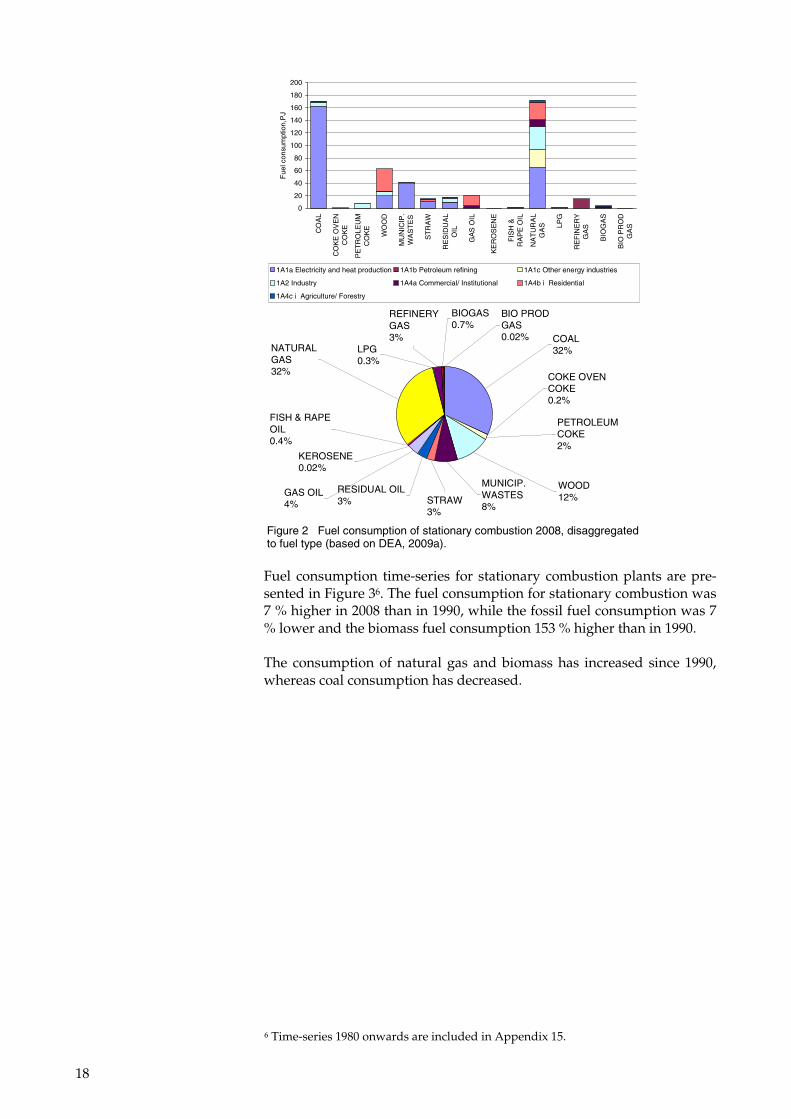
Coal and natural gas are the most utilised fuels for stationary combus-tion plants. Coal is mainly used in power plants and natural gas is used in power plants and decentralised combined heating and power (CHP) plants, as well as in industry, district heating, residential plants and off-shore gas turbines (see Figure 2).
Detailed fuel consumption rates are shown in Appendix 4.
18
0
20
40
60
80
100
120
140
160
180
200
CO
AL
CO
KE
OV
EN
CO
KE
PE
TR
OLE
UM
CO
KE
WO
OD
MU
NIC
IP.
WA
ST
ES
ST
RA
W
RE
SID
UA
LO
IL
GA
S O
IL
KE
RO
SE
NE
FIS
H &
RA
PE
OIL
NA
TU
RA
LG
AS LP
G
RE
FIN
ER
YG
AS
BIO
GA
S
BIO
PR
OD
GA
S
Fue
l con
sum
ptio
n,P
J
1A1a Electricity and heat production 1A1b Petroleum refining 1A1c Other energy industries
1A2 Industry 1A4a Commercial/ Institutional 1A4b i Residential
1A4c i Agriculture/ Forestry
BIO PROD GAS0.02%
GAS OIL4% STRAW
3%
RESIDUAL OIL3%
MUNICIP. WASTES8%
KEROSENE0.02%
WOOD12%
COKE OVEN COKE0.2%
PETROLEUM COKE2%
FISH & RAPE OIL0.4%
LPG0.3%
BIOGAS0.7%
REFINERY GAS3%
NATURAL GAS32%
COAL32%
Figure 2 Fuel consumption of stationary combustion 2008, disaggregated to fuel type (based on DEA, 2009a).
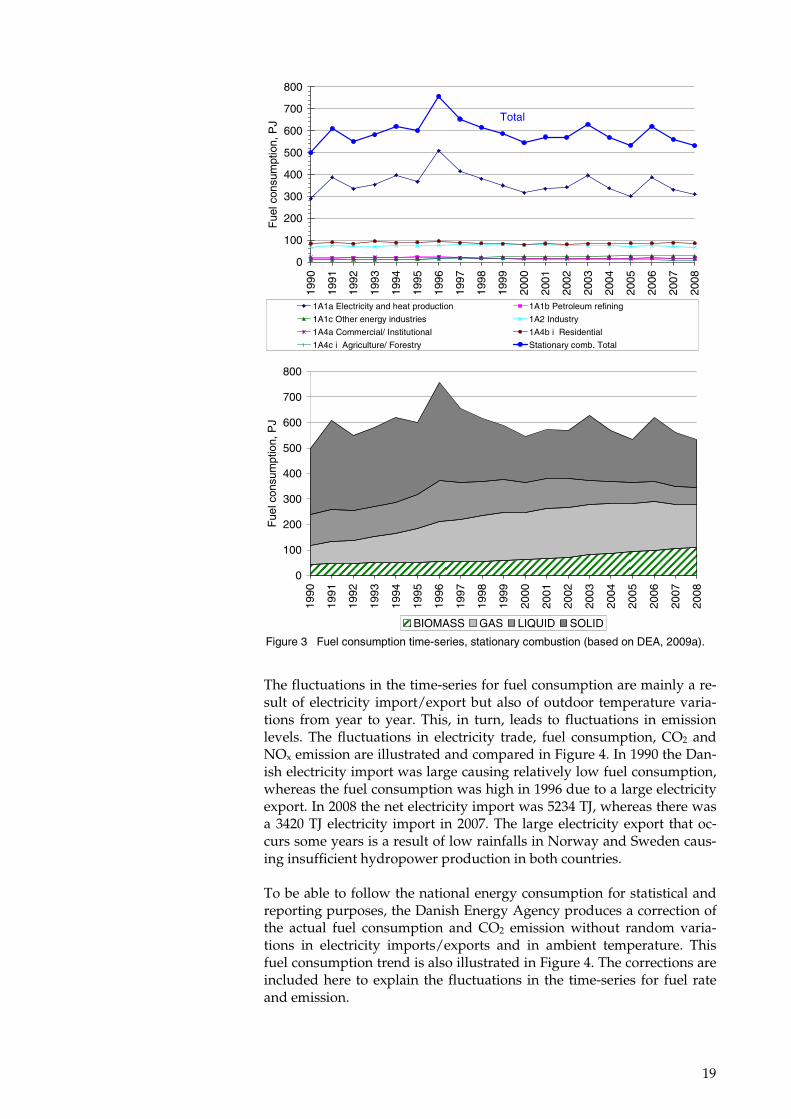
Fuel consumption time-series for stationary combustion plants are pre-sented in Figure 36. The fuel consumption for stationary combustion was 7 % higher in 2008 than in 1990, while the fossil fuel consumption was 7 % lower and the biomass fuel consumption 153 % higher than in 1990.
The consumption of natural gas and biomass has increased since 1990, whereas coal consumption has decreased.
6 Time-series 1980 onwards are included in Appendix 15.
19
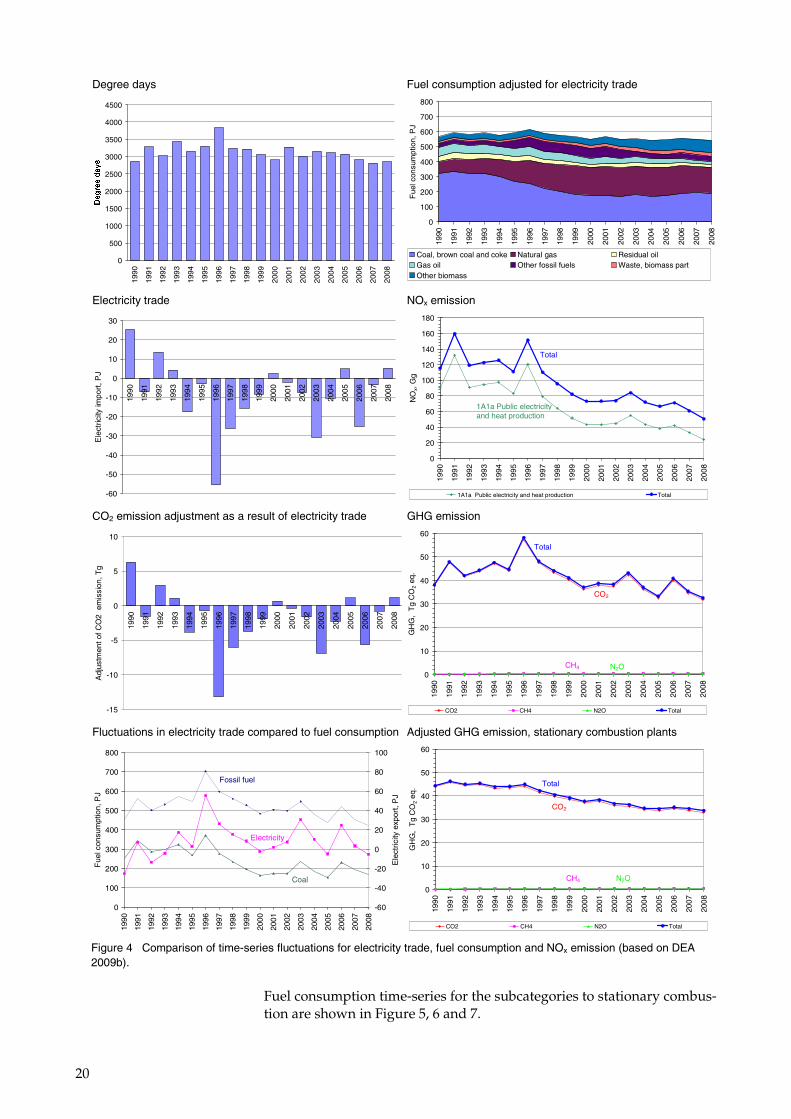
The fluctuations in the time-series for fuel consumption are mainly a re-sult of electricity import/export but also of outdoor temperature varia-tions from year to year. This, in turn, leads to fluctuations in emission levels. The fluctuations in electricity trade, fuel consumption, CO2 and NOx emission are illustrated and compared in Figure 4. In 1990 the Dan-ish electricity import was large causing relatively low fuel consumption, whereas the fuel consumption was high in 1996 due to a large electricity export. In 2008 the net electricity import was 5234 TJ, whereas there was a 3420 TJ electricity import in 2007. The large electricity export that oc-curs some years is a result of low rainfalls in Norway and Sweden caus-ing insufficient hydropower production in both countries.
To be able to follow the national energy consumption for statistical and reporting purposes, the Danish Energy Agency produces a correction of the actual fuel consumption and CO2 emission without random varia-tions in electricity imports/exports and in ambient temperature. This fuel consumption trend is also illustrated in Figure 4. The corrections are included here to explain the fluctuations in the time-series for fuel rate and emission.
0
100
200
300
400
500
600
700
800
1990
1991
1992
1993
1994
1995
1996
1997
1998
1999
2000
2001
2002
2003
2004
2005
2006
2007
2008
Fue
l con
sum
ptio
n, P
J
1A1a Electricity and heat production 1A1b Petroleum refining
1A1c Other energy industries 1A2 Industry
1A4a Commercial/ Institutional 1A4b i Residential
1A4c i Agriculture/ Forestry Stationary comb. Total
Total
0
100
200
300
400
500
600
700
800
1990
1991
1992
1993
1994
1995
1996
1997
1998
1999
2000
2001
2002
2003
2004
2005
2006
2007
2008
Fue
l con
sum
ptio
n, P
J
BIOMASS GAS LIQUID SOLID
Figure 3 Fuel consumption time-series, stationary combustion (based on DEA, 2009a).
20
Degree days Fuel consumption adjusted for electricity trade
0
500
1000
1500
2000
2500
3000
3500
4000
4500
1990
1991
1992
1993
1994
1995
1996
1997
1998
1999
2000
2001
2002
2003
2004
2005
2006
2007
2008
�����������
0
100
200
300
400
500
600
700
800
1990
1991
1992
1993
1994
1995
1996
1997
1998
1999
2000
2001
2002
2003
2004
2005
2006
2007
2008
Fue
l con
sum
ptio
n, P
J
Coal, brown coal and coke Natural gas Residual oilGas oil Other fossil fuels Waste, biomass partOther biomass
Electricity trade NOx emission
-60
-50
-40
-30
-20
-10
0
10
20
30
1990
1991
1992
1993
1994
1995
1996
1997
1998
1999
2000
2001
2002
2003
2004
2005
2006
2007
2008
Ele
ctric
ity im
port
, PJ
0
20
40
60
80
100
120
140
160
180
1990
1991
1992
1993
1994
1995
1996
1997
1998
1999
2000
2001
2002
2003
2004
2005
2006
2007
2008
NO
x, G
g
1A1a Public electricity and heat production Total
Total
1A1a Public electricity and heat production
CO2 emission adjustment as a result of electricity trade GHG emission
-15
-10
-5
0
5
10
1990
1991
1992
1993
1994
1995
1996
1997
1998
1999
2000
2001
2002
2003
2004
2005
2006
2007
2008
Adj
ustm
ent o
f CO
2 e
mis
sion
, Tg
0
10
20
30
40
50
60
1990
1991
1992
1993
1994
1995
1996
1997
1998
1999
2000
2001
2002
2003
2004
2005
2006
2007
2008
GH
G,
Tg
CO
2 eq
.
CO2 CH4 N2O Total
Total
CO2
CH4 N2O
Fluctuations in electricity trade compared to fuel consumption Adjusted GHG emission, stationary combustion plants
0
100
200
300
400
500
600
700
800
1990
1991
1992
1993
1994
1995
1996
1997
1998
1999
2000
2001
2002
2003
2004
2005
2006
2007
2008
Fue
l con
sum
ptio
n, P
J
-60
-40
-20
0
20
40
60
80
100
Ele
ctric
ity e
xpor
t, P
J
Coal
Fossil fuel
Electricity
0
10
20
30
40
50
60
1990
1991
1992
1993
1994
1995
1996
1997
1998
1999
2000
2001
2002
2003
2004
2005
2006
2007
2008
GH
G,
Tg
CO
2 eq
.
CO2 CH4 N2O Total
Total
CO2
CH4 N2O
Figure 4 Comparison of time-series fluctuations for electricity trade, fuel consumption and NOx emission (based on DEA 2009b).
Fuel consumption time-series for the subcategories to stationary combus-tion are shown in Figure 5, 6 and 7.
21
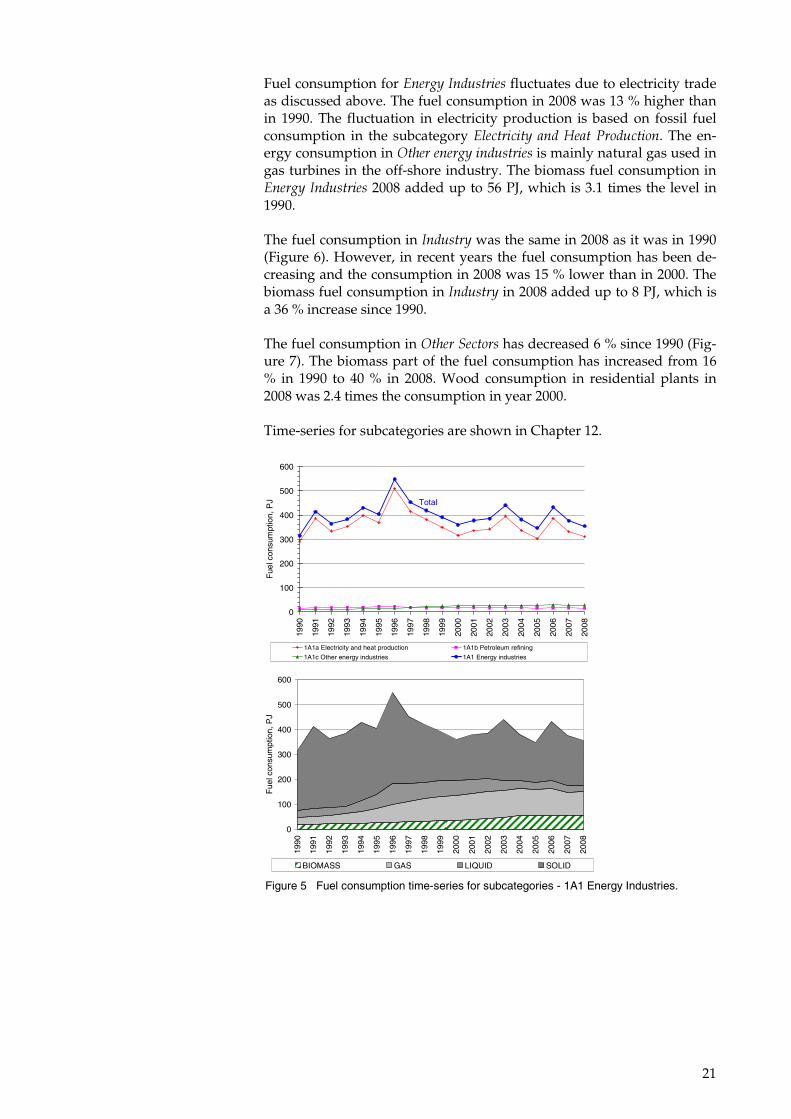
Fuel consumption for �������������� fluctuates due to electricity trade as discussed above. The fuel consumption in 2008 was 13 % higher than in 1990. The fluctuation in electricity production is based on fossil fuel consumption in the subcategory ���������� �����������������. The en-ergy consumption in ������������������� is mainly natural gas used in gas turbines in the off-shore industry. The biomass fuel consumption in �������������� 2008 added up to 56 PJ, which is 3.1 times the level in 1990.
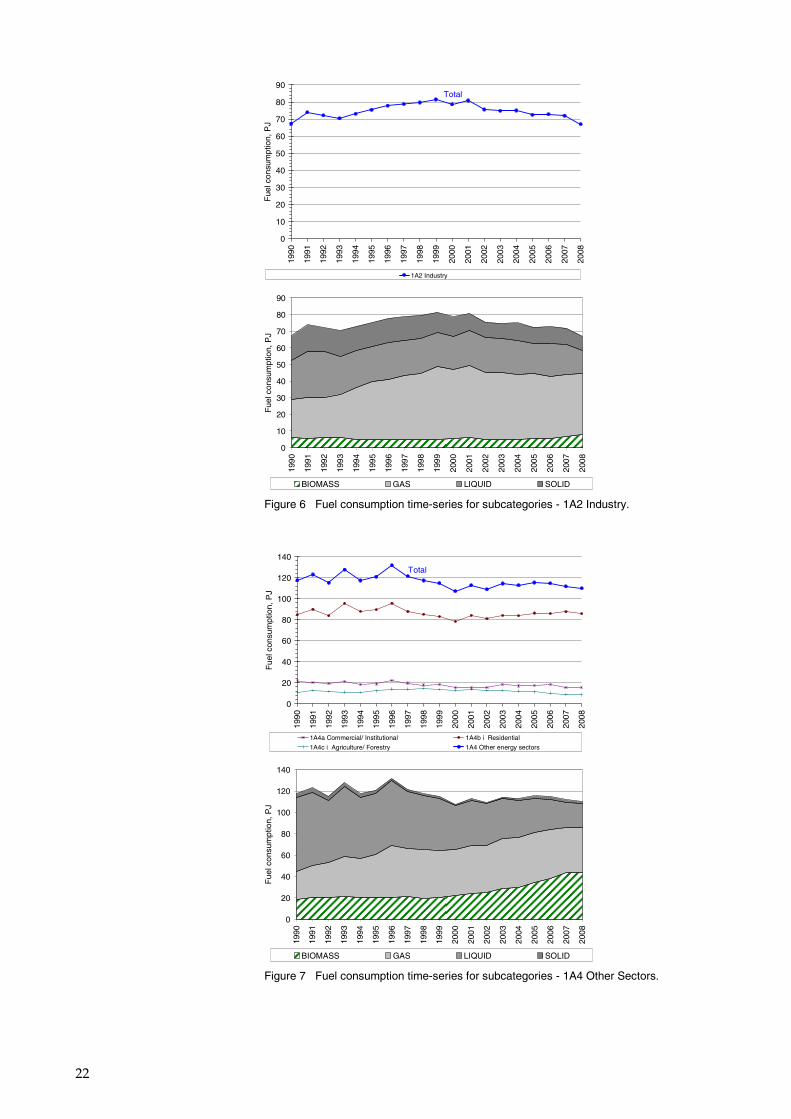
The fuel consumption in ������ was the same in 2008 as it was in 1990 (Figure 6). However, in recent years the fuel consumption has been de-creasing and the consumption in 2008 was 15 % lower than in 2000. The biomass fuel consumption in ������ in 2008 added up to 8 PJ, which is a 36 % increase since 1990.
The fuel consumption in ���������� has decreased 6 % since 1990 (Fig-ure 7). The biomass part of the fuel consumption has increased from 16 % in 1990 to 40 % in 2008. Wood consumption in residential plants in 2008 was 2.4 times the consumption in year 2000.
Time-series for subcategories are shown in Chapter 12.
0
100
200
300
400
500
600
1990
1991
1992
1993
1994
1995
1996
1997
1998
1999
2000
2001
2002
2003
2004
2005
2006
2007
2008
Fue
l con
sum
ptio
n, P
J
1A1a Electricity and heat production 1A1b Petroleum refining
1A1c Other energy industries 1A1 Energy industries
Total
0
100
200
300
400
500
600
1990
1991
1992
1993
1994
1995
1996
1997
1998
1999
2000
2001
2002
2003
2004
2005
2006
2007
2008
Fue
l con
sum
ptio
n, P
J
BIOMASS GAS LIQUID SOLID Figure 5 Fuel consumption time-series for subcategories - 1A1 Energy Industries.
22
0
10
20
30
40
50
60
70
80
90
1990
1991
1992
1993
1994
1995
1996
1997
1998
1999
2000
2001
2002
2003
2004
2005
2006
2007
2008
Fue
l con
sum
ptio
n, P
J1A2 Industry
Total
0
10
20
30
40
50
60
70
80
9019
90
1991
1992
1993
1994
1995
1996
1997
1998
1999
2000
2001
2002
2003
2004
2005
2006
2007
2008
Fue
l con
sum
ptio
n, P
J
BIOMASS GAS LIQUID SOLID Figure 6 Fuel consumption time-series for subcategories - 1A2 Industry.�
0
20
40
60
80
100
120
140
1990
1991
1992
1993
1994
1995
1996
1997
1998
1999
2000
2001
2002
2003
2004
2005
2006
2007
2008
Fue
l con
sum
ptio
n, P
J
1A4a Commercial/ Institutional 1A4b i Residential
1A4c i Agriculture/ Forestry 1A4 Other energy sectors
Total
0
20
40
60
80
100
120
140
1990
1991
1992
1993
1994
1995
1996
1997
1998
1999
2000
2001
2002
2003
2004
2005
2006
2007
2008
Fue
l con
sum
ptio
n, P
J
BIOMASS GAS LIQUID SOLID Figure 7 Fuel consumption time-series for subcategories - 1A4 Other Sectors.
23
(� +��������&�����������
The national greenhouse gas (GHG) emission in 2008 was 64,346 Gg CO2 equivalent, including Land-Use, Land-Use Change and Forestry (LU-LUCF) or 63,845 Gg CO2 equivalent, excluding LULUCF. The green-house gas pollutants HFCs, PFCs and SF6 are not emitted from combus-tion plants and, as such, only the pollutants CO2, CH4 and N2O are con-sidered below.
The global warming potentials of CH4 and N2O applied in greenhouse gas inventories refer to the second IPCC assessment report (IPCC 1995):
• 1 g CH4 equals 21 g CO2 • 1 g N2O equals 310 g CO2 The GHG emissions from stationary combustion are listed in Table 5. The emission from stationary combustion accounted for 51 % of the na-tional GHG emission (excluding LULUCF) in 2008.
The CO2 emission from stationary combustion plants accounts for 63 % of the national CO2 emission (excluding LULUCF). The CH4 emission ac-counts for 8 % of the national CH4 emission and the N2O emission for 4 % of the national N2O emission.
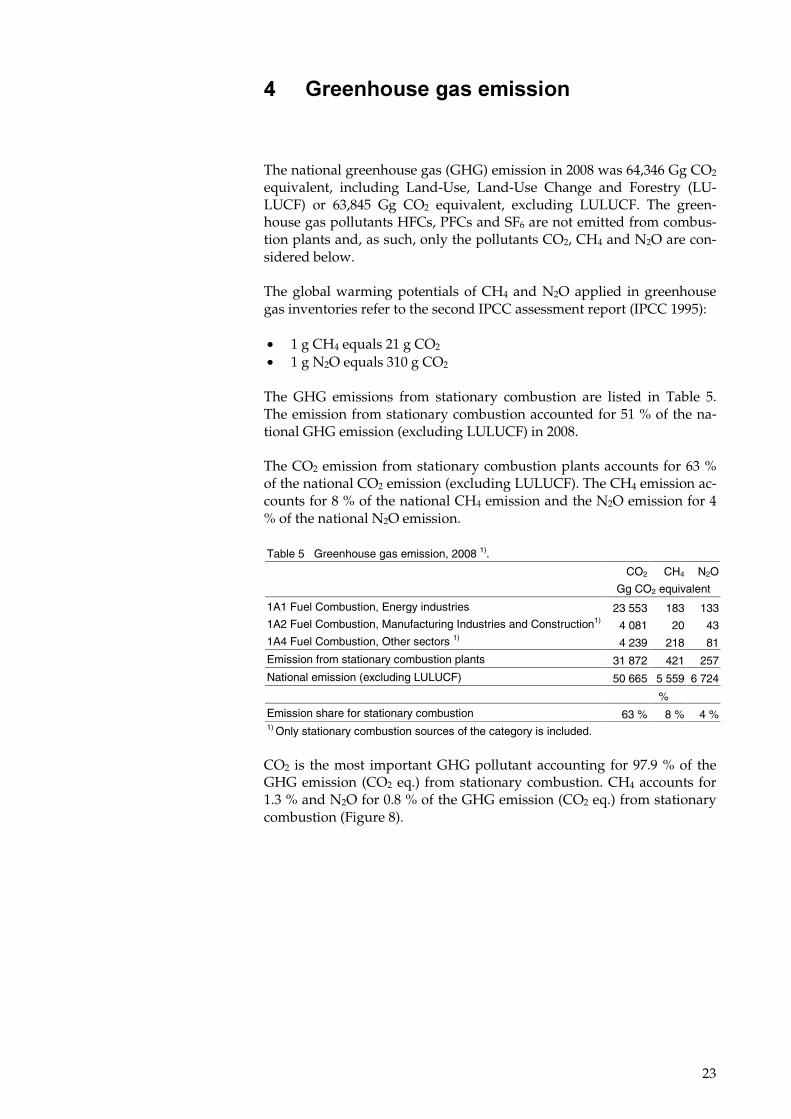
Table 5 Greenhouse gas emission, 2008 1).
CO2 CH4 N2O
Gg CO2 equivalent
1A1 Fuel Combustion, Energy industries 23 553 183 133 1A2 Fuel Combustion, Manufacturing Industries and Construction1) 4 081 20 43 1A4 Fuel Combustion, Other sectors 1) 4 239 218 81
Emission from stationary combustion plants 31 872 421 257
National emission (excluding LULUCF) 50 665 5 559 6 724
%
Emission share for stationary combustion 63 % 8 % 4 % 1) Only stationary combustion sources of the category is included.
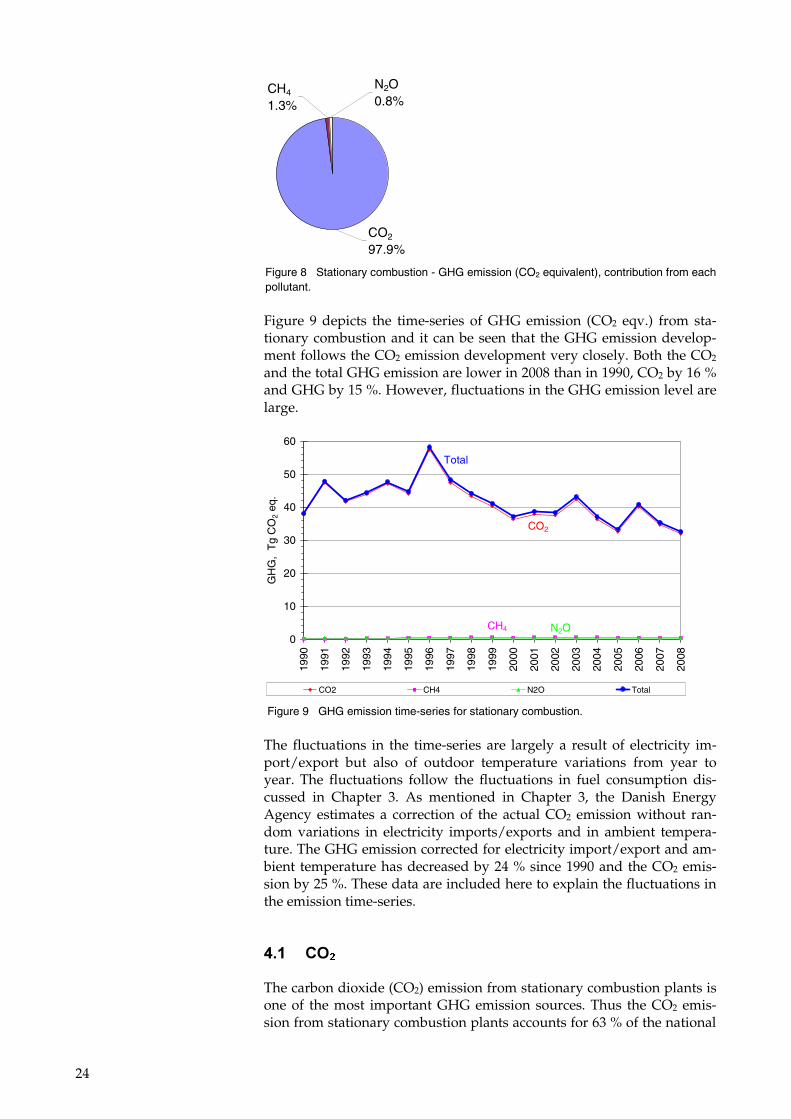
CO2 is the most important GHG pollutant accounting for 97.9 % of the GHG emission (CO2 eq.) from stationary combustion. CH4 accounts for 1.3 % and N2O for 0.8 % of the GHG emission (CO2 eq.) from stationary combustion (Figure 8).
24
CO2
97.9%
CH4
1.3%
N2O0.8%
Figure 8 Stationary combustion - GHG emission (CO2 equivalent), contribution from each pollutant.
Figure 9 depicts the time-series of GHG emission (CO2 eqv.) from sta-tionary combustion and it can be seen that the GHG emission develop-ment follows the CO2 emission development very closely. Both the CO2 and the total GHG emission are lower in 2008 than in 1990, CO2 by 16 % and GHG by 15 %. However, fluctuations in the GHG emission level are large.
0
10
20
30
40
50
60
1990
1991
1992
1993
1994
1995
1996
1997
1998
1999
2000
2001
2002
2003
2004
2005
2006
2007
2008
GH
G,
Tg
CO
2 eq
.
CO2 CH4 N2O Total
Total
CO2
CH4 N2O
Figure 9 GHG emission time-series for stationary combustion.
The fluctuations in the time-series are largely a result of electricity im-port/export but also of outdoor temperature variations from year to year. The fluctuations follow the fluctuations in fuel consumption dis-cussed in Chapter 3. As mentioned in Chapter 3, the Danish Energy Agency estimates a correction of the actual CO2 emission without ran-dom variations in electricity imports/exports and in ambient tempera-ture. The GHG emission corrected for electricity import/export and am-bient temperature has decreased by 24 % since 1990 and the CO2 emis-sion by 25 %. These data are included here to explain the fluctuations in the emission time-series.
(�'� !,��
The carbon dioxide (CO2) emission from stationary combustion plants is one of the most important GHG emission sources. Thus the CO2 emis-sion from stationary combustion plants accounts for 63 % of the national
25
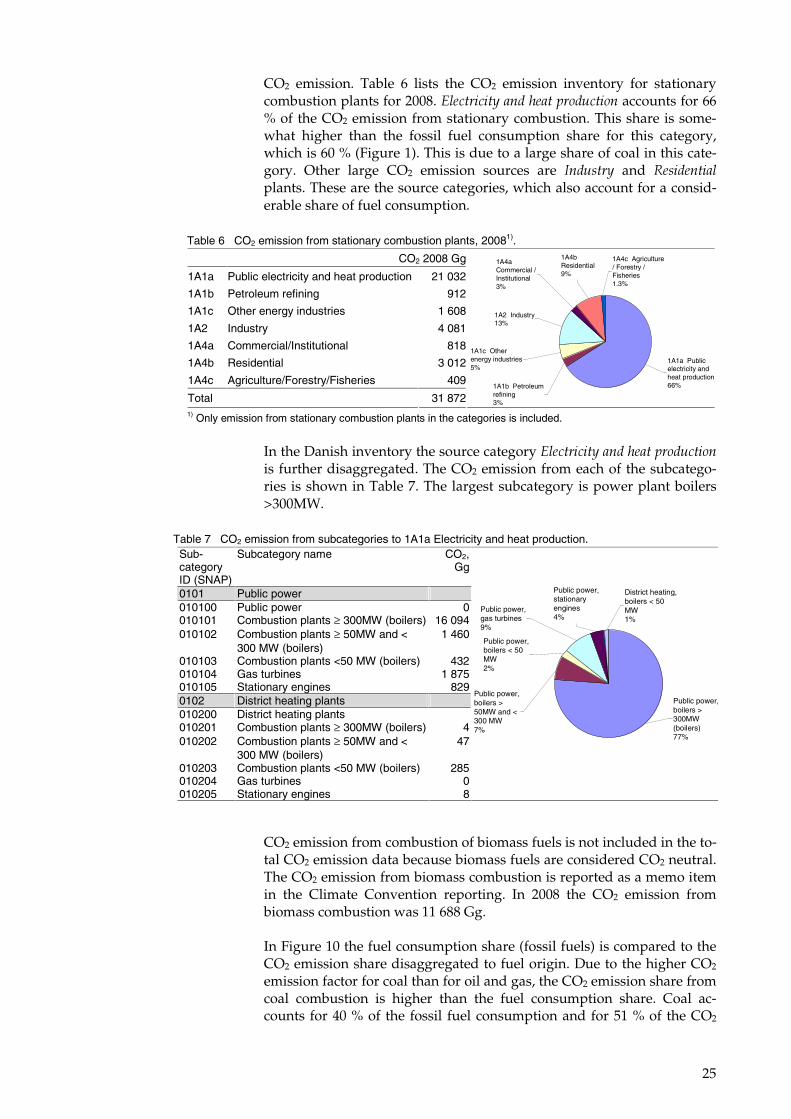
CO2 emission. Table 6 lists the CO2 emission inventory for stationary combustion plants for 2008. ��������������������������� accounts for 66 % of the CO2 emission from stationary combustion. This share is some-what higher than the fossil fuel consumption share for this category, which is 60 % (Figure 1). This is due to a large share of coal in this cate-gory. Other large CO2 emission sources are ������� and ��������� plants. These are the source categories, which also account for a consid-erable share of fuel consumption.
Table 6 CO2 emission from stationary combustion plants, 20081).
CO2 2008 Gg
1A1a Public electricity and heat production 21 032
1A1b Petroleum refining 912
1A1c Other energy industries 1 608
1A2 Industry 4 081
1A4a Commercial/Institutional 818
1A4b Residential 3 012
1A4c Agriculture/Forestry/Fisheries 409
Total 31 8721A1b Petroleum refining3%
1A1c Other energy industries5%
1A2 Industry13%
1A4b Residential9%
1A4a Commercial / Institutional3%
1A4c Agriculture / Forestry / Fisheries1.3%
1A1a Public electricity and heat production66%
1) Only emission from stationary combustion plants in the categories is included.
In the Danish inventory the source category ��������������������������� is further disaggregated. The CO2 emission from each of the subcatego-ries is shown in Table 7. The largest subcategory is power plant boilers >300MW.
Table 7 CO2 emission from subcategories to 1A1a Electricity and heat production.
CO2 emission from combustion of biomass fuels is not included in the to-tal CO2 emission data because biomass fuels are considered CO2 neutral. The CO2 emission from biomass combustion is reported as a memo item in the Climate Convention reporting. In 2008 the CO2 emission from biomass combustion was 11 688 Gg.
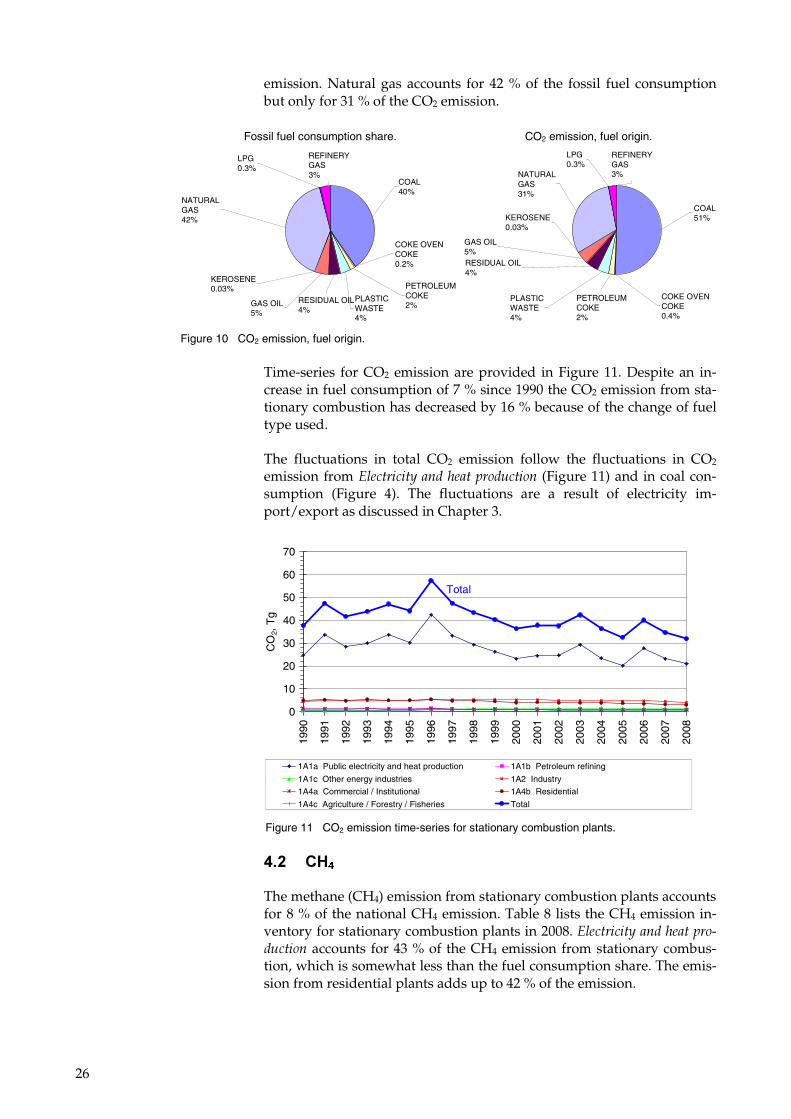
In Figure 10 the fuel consumption share (fossil fuels) is compared to the CO2 emission share disaggregated to fuel origin. Due to the higher CO2 emission factor for coal than for oil and gas, the CO2 emission share from coal combustion is higher than the fuel consumption share. Coal ac-counts for 40 % of the fossil fuel consumption and for 51 % of the CO2
Sub-category ID (SNAP)
Subcategory name CO2, Gg
0101 Public power �
010100 Public power 0 010101 Combustion plants ≥ 300MW (boilers) 16 094 010102 Combustion plants ≥ 50MW and <
300 MW (boilers) 1 460
010103 Combustion plants <50 MW (boilers) 432 010104 Gas turbines 1 875 010105 Stationary engines 829 0102 District heating plants 010200 District heating plants 010201 Combustion plants ≥ 300MW (boilers) 4 010202 Combustion plants ≥ 50MW and <
300 MW (boilers) 47
010203 Combustion plants <50 MW (boilers) 285 010204 Gas turbines 0 010205 Stationary engines 8
District heating, boilers < 50 MW1%
Public power, stationary engines4%
Public power, gas turbines9%
Public power, boilers < 50 MW2%
Public power, boilers > 50MW and < 300 MW7%
Public power,boilers > 300MW (boilers)77%
26
emission. Natural gas accounts for 42 % of the fossil fuel consumption but only for 31 % of the CO2 emission.
Fossil fuel consumption share. CO2 emission, fuel origin.
PLASTIC WASTE4%
RESIDUAL OIL4%
COKE OVEN COKE0.2%
PETROLEUM COKE2%GAS OIL
5%
KEROSENE0.03%
LPG0.3%
REFINERY GAS3%
NATURAL GAS42%
COAL40%
PLASTIC WASTE4%
RESIDUAL OIL4%
COKE OVEN COKE0.4%
PETROLEUM COKE2%
GAS OIL5%
KEROSENE0.03%
LPG0.3%
REFINERY GAS3%NATURAL
GAS31%
COAL51%
Figure 10 CO2 emission, fuel origin.
Time-series for CO2 emission are provided in Figure 11. Despite an in-crease in fuel consumption of 7 % since 1990 the CO2 emission from sta-tionary combustion has decreased by 16 % because of the change of fuel type used.
The fluctuations in total CO2 emission follow the fluctuations in CO2 emission from ��������������������������� (Figure 11) and in coal con-sumption (Figure 4). The fluctuations are a result of electricity im-port/export as discussed in Chapter 3.
0
10
20
30
40
50
60
70
1990
1991
1992
1993
1994
1995
1996
1997
1998
1999
2000
2001
2002
2003
2004
2005
2006
2007
2008
CO
2, T
g
1A1a Public electricity and heat production 1A1b Petroleum refining
1A1c Other energy industries 1A2 Industry
1A4a Commercial / Institutional 1A4b Residential
1A4c Agriculture / Forestry / Fisheries Total
Total
Figure 11 CO2 emission time-series for stationary combustion plants.
(��� !3��
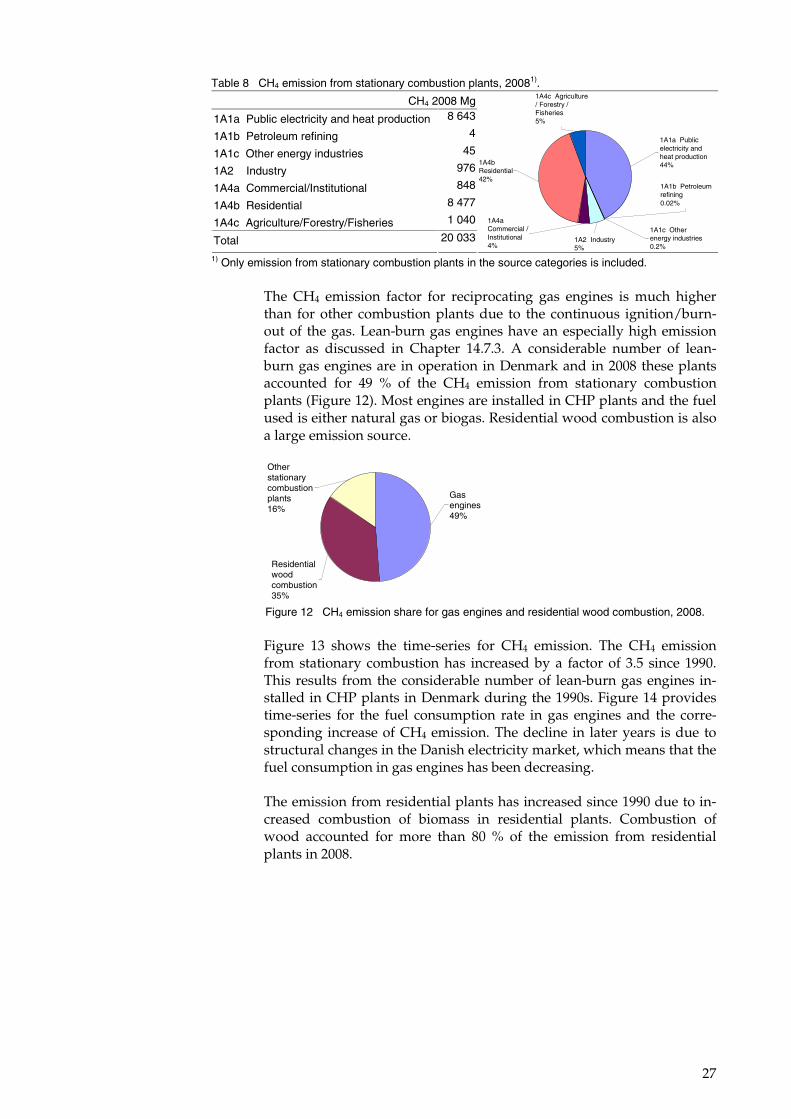
The methane (CH4) emission from stationary combustion plants accounts for 8 % of the national CH4 emission. Table 8 lists the CH4 emission in-ventory for stationary combustion plants in 2008. ���������������������������� accounts for 43 % of the CH4 emission from stationary combus-tion, which is somewhat less than the fuel consumption share. The emis-sion from residential plants adds up to 42 % of the emission.
27
Table 8 CH4 emission from stationary combustion plants, 20081).
CH4 2008 Mg
1A1a Public electricity and heat production 8 643
1A1b Petroleum refining 4
1A1c Other energy industries 45
1A2 Industry 976
1A4a Commercial/Institutional 848
1A4b Residential 8 477
1A4c Agriculture/Forestry/Fisheries 1 040
Total 20 033
1A1b Petroleum refining0.02%
1A1c Other energy industries0.2%
1A2 Industry5%
1A4b Residential42%
1A4a Commercial / Institutional4%
1A4c Agriculture / Forestry / Fisheries5%
1A1a Public electricity and heat production44%
1) Only emission from stationary combustion plants in the source categories is included.
The CH4 emission factor for reciprocating gas engines is much higher than for other combustion plants due to the continuous ignition/burn-out of the gas. Lean-burn gas engines have an especially high emission factor as discussed in Chapter 14.7.3. A considerable number of lean-burn gas engines are in operation in Denmark and in 2008 these plants accounted for 49 % of the CH4 emission from stationary combustion plants (Figure 12). Most engines are installed in CHP plants and the fuel used is either natural gas or biogas. Residential wood combustion is also a large emission source.
Other stationary combustion plants16%
Gas engines49%
Residential wood combustion35%
Figure 12 CH4 emission share for gas engines and residential wood combustion, 2008.
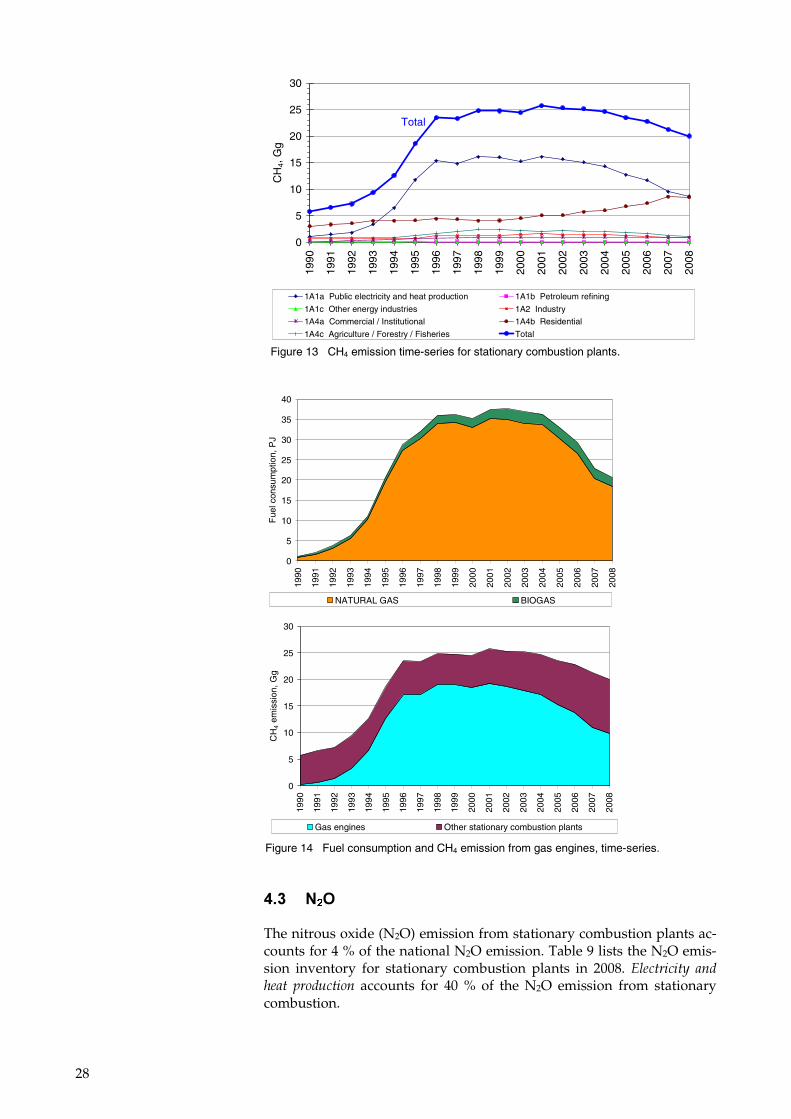
Figure 13 shows the time-series for CH4 emission. The CH4 emission from stationary combustion has increased by a factor of 3.5 since 1990. This results from the considerable number of lean-burn gas engines in-stalled in CHP plants in Denmark during the 1990s. Figure 14 provides time-series for the fuel consumption rate in gas engines and the corre-sponding increase of CH4 emission. The decline in later years is due to structural changes in the Danish electricity market, which means that the fuel consumption in gas engines has been decreasing.
The emission from residential plants has increased since 1990 due to in-creased combustion of biomass in residential plants. Combustion of wood accounted for more than 80 % of the emission from residential plants in 2008.
28
0
5
10
15
20
25
30
35
40
1990
1991
1992
1993
1994
1995
1996
1997
1998
1999
2000
2001
2002
2003
2004
2005
2006
2007
2008
Fue
l con
sum
ptio
n, P
J
NATURAL GAS BIOGAS
0
5
10
15
20
25
30
1990
1991
1992
1993
1994
1995
1996
1997
1998
1999
2000
2001
2002
2003
2004
2005
2006
2007
2008
CH
4 em
issi
on, G
g
Gas engines Other stationary combustion plants
Figure 14 Fuel consumption and CH4 emission from gas engines, time-series.
(�)� ��,�
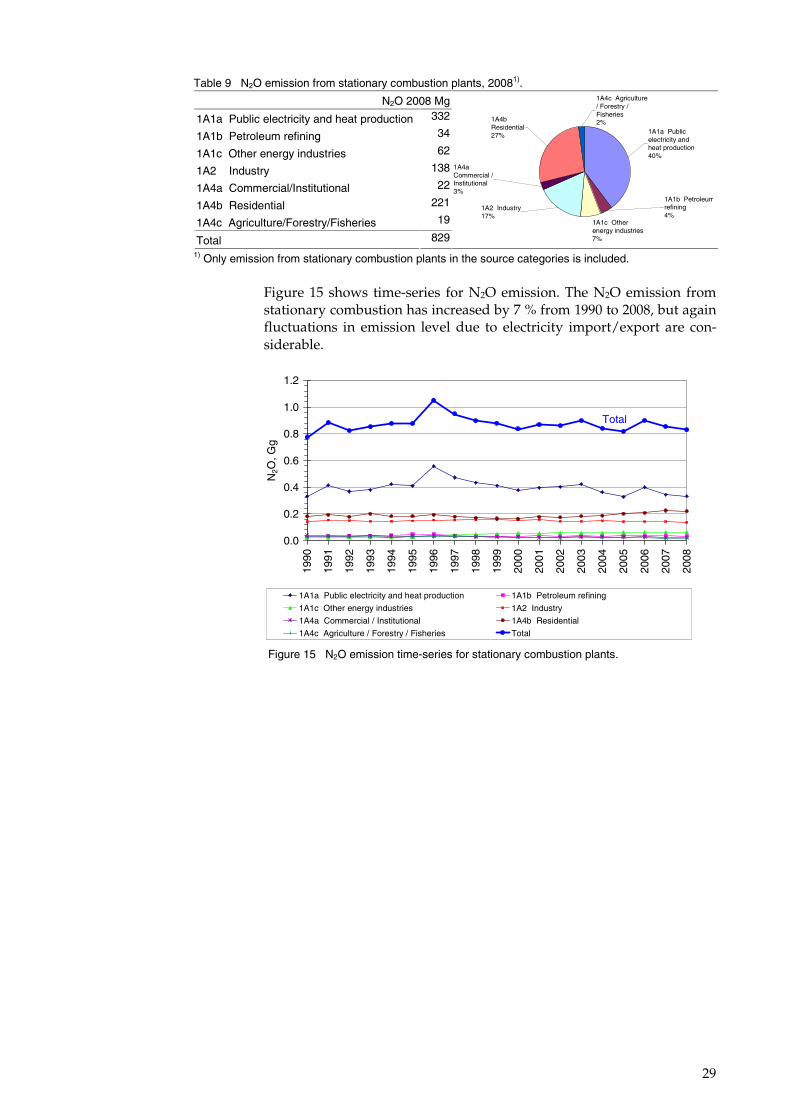
The nitrous oxide (N2O) emission from stationary combustion plants ac-counts for 4 % of the national N2O emission. Table 9 lists the N2O emis-sion inventory for stationary combustion plants in 2008. ���������� �������� ��������� accounts for 40 % of the N2O emission from stationary combustion.
0
5
10
15
20
25
30
1990
1991
1992
1993
1994
1995
1996
1997
1998
1999
2000
2001
2002
2003
2004
2005
2006
2007
2008
CH
4, G
g
1A1a Public electricity and heat production 1A1b Petroleum refining
1A1c Other energy industries 1A2 Industry
1A4a Commercial / Institutional 1A4b Residential
1A4c Agriculture / Forestry / Fisheries Total
Total
Figure 13 CH4 emission time-series for stationary combustion plants.
29
Table 9 N2O emission from stationary combustion plants, 20081).
N2O 2008 Mg
1A1a Public electricity and heat production 332
1A1b Petroleum refining 34
1A1c Other energy industries 62
1A2 Industry 138
1A4a Commercial/Institutional 22
1A4b Residential 221
1A4c Agriculture/Forestry/Fisheries 19
Total 829
1A1b Petroleumrefining4%
1A1c Other energy industries7%
1A2 Industry17%
1A4b Residential27%
1A4a Commercial / Institutional3%
1A4c Agriculture / Forestry / Fisheries2%
1A1a Public electricity and heat production40%
1) Only emission from stationary combustion plants in the source categories is included.
Figure 15 shows time-series for N2O emission. The N2O emission from stationary combustion has increased by 7 % from 1990 to 2008, but again fluctuations in emission level due to electricity import/export are con-siderable.
0.0
0.2
0.4
0.6
0.8
1.0
1.2
1990
1991
1992
1993
1994
1995
1996
1997
1998
1999
2000
2001
2002
2003
2004
2005
2006
2007
2008
N2O
, Gg
1A1a Public electricity and heat production 1A1b Petroleum refining
1A1c Other energy industries 1A2 Industry
1A4a Commercial / Institutional 1A4b Residential
1A4c Agriculture / Forestry / Fisheries Total
Total
Figure 15 N2O emission time-series for stationary combustion plants.

30
�� $,�-��,5-��./,!��%�!,��
The emissions of sulphur dioxide (SO2), nitrogen oxides (NOx), non-volatile organic compounds (NMVOC) and carbon monoxide (CO) from Danish stationary combustion plants 2008 are presented in Table 10. The emission of these pollutants is included in the reporting to both the Cli-mate Convention and the LRTAP Convention. Emissions of SO2, NOx and NMVOC are also included in the reporting to the National Emis-sions Ceiling Directive (NECD). The NECD reporting also includes NH3.
SO2 from stationary combustion plants accounts for 83 % of the national emission. NOx, CO and NMVOC account for 33 %, 38 % and 21 % of na-tional emissions, respectively.
Table 10 SO2, NOx, NMVOC and CO emission, 20081).
��'� $,��
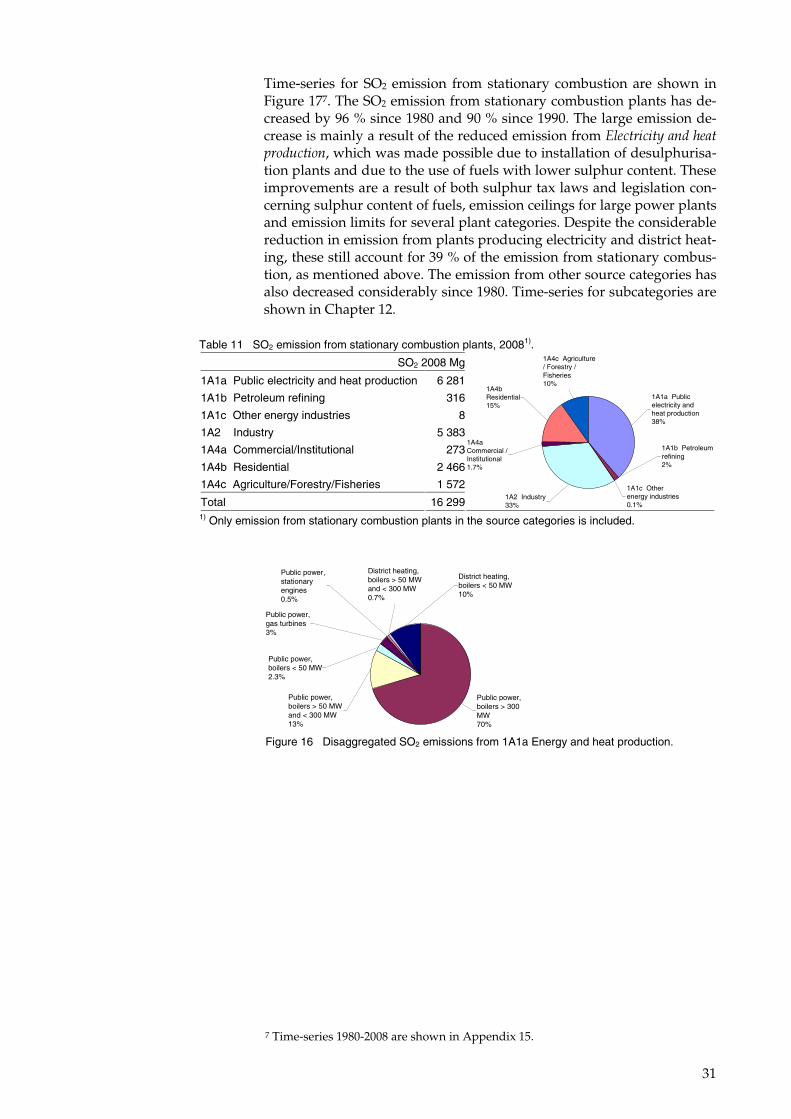
Stationary combustion is the most important emission source for SO2 ac-counting for 83 % of the national emission. Table 11 presents the SO2 emission inventory for the stationary combustion subcategories.
����������������������������is the largest emission source accounting for 39 % of the emission. However, the SO2 emission share is lower than the fuel consumption share for this source category, which is 58 %. This is a result of effective flue gas desulphurisation equipment installed in power plants combusting coal. In the Danish inventory the source cate-gory ���������� ���� ���� ��������� is further disaggregated. Figure 16 shows the SO2 emission from ���������� ���� ���� ��������� on a disag-gregated level. Power plants >300MWth are the main emission source, accounting for 70 % of the emission.
The SO2 emission from industrial plants is 33 %, a remarkably high emis-sion share compared with fuel consumption. The main emission sources in the industrial category are combustion of coal and residual oil, but emissions from the cement industry is also a considerable emission source. Ten years ago SO2 emission from the industrial category only ac-counted for a small part of the emission from stationary combustion, but as a result of reduced emissions from power plants the share has now in-creased.
Pollutant NOx
Gg
CO
Gg
NMVOC
Gg
SO2
Gg
1A1 Fuel consumption, Energy industries 32.6 8.2 1.9 6.6 1A2 Fuel consumption, Manufacturing Industries and Construction1) 9.6 12.9 0.4 5.4 1A4 Fuel consumption, Other sectors1) 8.2 144.0 20.1 4.3
Emission from stationary combustion plants 50.4 165.1 22.3 16.3
Emission share for stationary combustion 33 38 21 83 1) Only emissions from stationary combustion plants in the source categories are included.
31
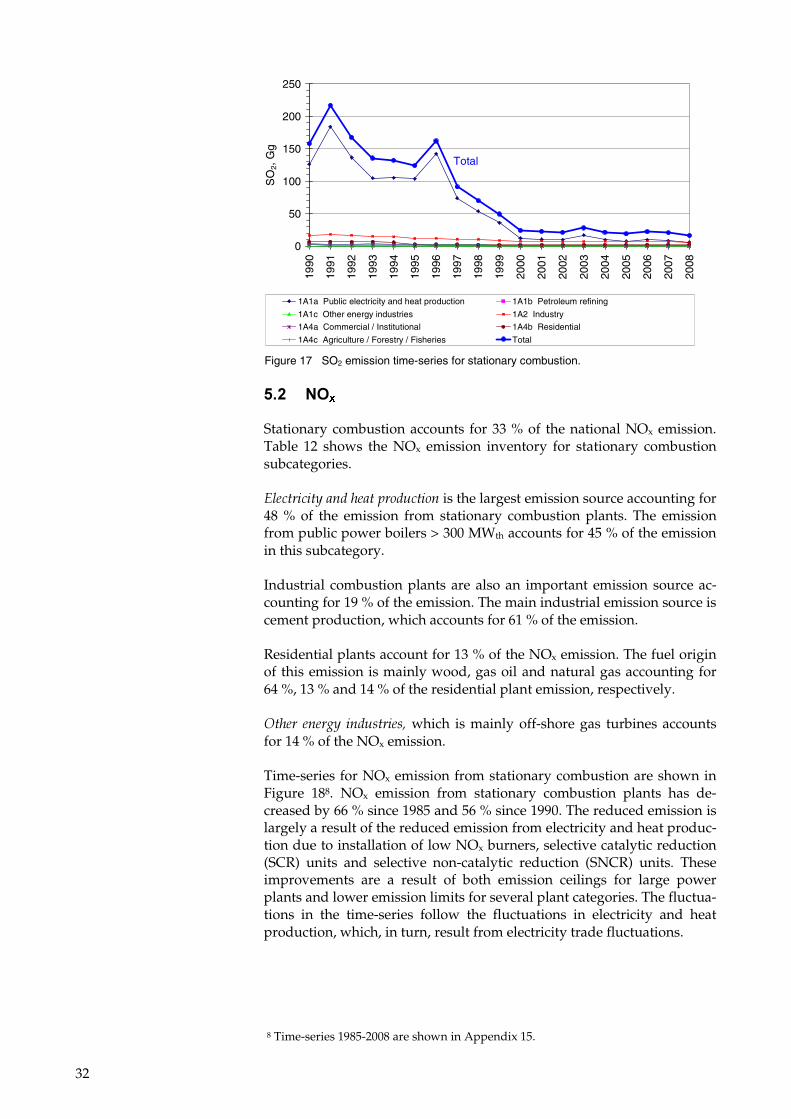
Time-series for SO2 emission from stationary combustion are shown in Figure 177. The SO2 emission from stationary combustion plants has de-creased by 96 % since 1980 and 90 % since 1990. The large emission de-crease is mainly a result of the reduced emission from ���������������������������, which was made possible due to installation of desulphurisa-tion plants and due to the use of fuels with lower sulphur content. These improvements are a result of both sulphur tax laws and legislation con-cerning sulphur content of fuels, emission ceilings for large power plants and emission limits for several plant categories. Despite the considerable reduction in emission from plants producing electricity and district heat-ing, these still account for 39 % of the emission from stationary combus-tion, as mentioned above. The emission from other source categories has also decreased considerably since 1980. Time-series for subcategories are shown in Chapter 12.
Table 11 SO2 emission from stationary combustion plants, 20081).
SO2 2008 Mg
1A1a Public electricity and heat production 6 281
1A1b Petroleum refining 316
1A1c Other energy industries 8
1A2 Industry 5 383
1A4a Commercial/Institutional 273
1A4b Residential 2 466
1A4c Agriculture/Forestry/Fisheries 1 572
Total 16 299
1A1b Petroleum refining2%
1A1c Other energy industries0.1%
1A2 Industry33%
1A4b Residential15%
1A4a Commercial / Institutional1.7%
1A4c Agriculture / Forestry / Fisheries10%
1A1a Public electricity and heat production38%
1) Only emission from stationary combustion plants in the source categories is included.
Public power, boilers < 50 MW2.3%
Public power, stationary engines0.5%
District heating, boilers > 50 MW and < 300 MW0.7%
Public power, boilers > 300 MW70%
Public power, boilers > 50 MW and < 300 MW13%
Public power, gas turbines3%
District heating, boilers < 50 MW10%
Figure 16 Disaggregated SO2 emissions from 1A1a Energy and heat production.
7 Time-series 1980-2008 are shown in Appendix 15.
32
0
50
100
150
200
250
1990
1991
1992
1993
1994
1995
1996
1997
1998
1999
2000
2001
2002
2003
2004
2005
2006
2007
2008
SO
2, G
g
1A1a Public electricity and heat production 1A1b Petroleum refining
1A1c Other energy industries 1A2 Industry
1A4a Commercial / Institutional 1A4b Residential
1A4c Agriculture / Forestry / Fisheries Total
Total
Figure 17 SO2 emission time-series for stationary combustion.
���� �,��
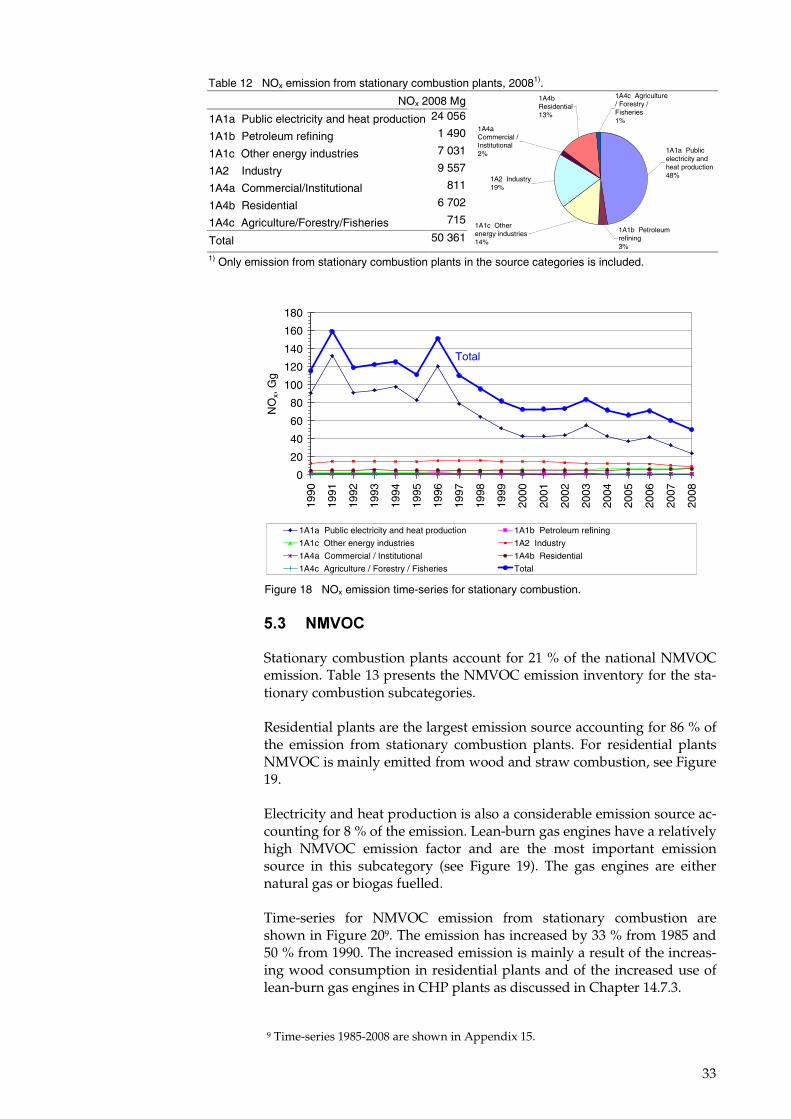
Stationary combustion accounts for 33 % of the national NOx emission. Table 12 shows the NOx emission inventory for stationary combustion subcategories.
����������������������������is the largest emission source accounting for 48 % of the emission from stationary combustion plants. The emission from public power boilers > 300 MWth accounts for 45 % of the emission in this subcategory.
Industrial combustion plants are also an important emission source ac-counting for 19 % of the emission. The main industrial emission source is cement production, which accounts for 61 % of the emission.
Residential plants account for 13 % of the NOx emission. The fuel origin of this emission is mainly wood, gas oil and natural gas accounting for 64 %, 13 % and 14 % of the residential plant emission, respectively.
����� ������� �������� which is mainly off-shore gas turbines accounts for 14 % of the NOx emission.
Time-series for NOx emission from stationary combustion are shown in Figure 188. NOx emission from stationary combustion plants has de-creased by 66 % since 1985 and 56 % since 1990. The reduced emission is largely a result of the reduced emission from electricity and heat produc-tion due to installation of low NOx burners, selective catalytic reduction (SCR) units and selective non-catalytic reduction (SNCR) units� These improvements are a result of both emission ceilings for large power plants and lower emission limits for several plant categories. The fluctua-tions in the time-series follow the fluctuations in electricity and heat production, which, in turn, result from electricity trade fluctuations.
8 Time-series 1985-2008 are shown in Appendix 15.
33
Table 12 NOx emission from stationary combustion plants, 20081).
NOx 2008 Mg
1A1a Public electricity and heat production 24 056
1A1b Petroleum refining 1 490
1A1c Other energy industries 7 031
1A2 Industry 9 557
1A4a Commercial/Institutional 811
1A4b Residential 6 702
1A4c Agriculture/Forestry/Fisheries 715
Total 50 361 1A1b Petroleum refining3%
1A1c Other energy industries14%
1A2 Industry19%
1A4b Residential13%
1A4a Commercial / Institutional2%
1A4c Agriculture / Forestry / Fisheries1%
1A1a Public electricity and heat production48%
1) Only emission from stationary combustion plants in the source categories is included.
0
20
40
60
80
100
120
140
160
18019
90
1991
1992
1993
1994
1995
1996
1997
1998
1999
2000
2001
2002
2003
2004
2005
2006
2007
2008
NO
x, G
g
1A1a Public electricity and heat production 1A1b Petroleum refining
1A1c Other energy industries 1A2 Industry
1A4a Commercial / Institutional 1A4b Residential
1A4c Agriculture / Forestry / Fisheries Total
Total
Figure 18 NOx emission time-series for stationary combustion.
��)� �./,!�
Stationary combustion plants account for 21 % of the national NMVOC emission. Table 13 presents the NMVOC emission inventory for the sta-tionary combustion subcategories.
Residential plants are the largest emission source accounting for 86 % of the emission from stationary combustion plants. For residential plants NMVOC is mainly emitted from wood and straw combustion, see Figure 19.
Electricity and heat production is also a considerable emission source ac-counting for 8 % of the emission. Lean-burn gas engines have a relatively high NMVOC emission factor and are the most important emission source in this subcategory (see Figure 19). The gas engines are either natural gas or biogas fuelled.
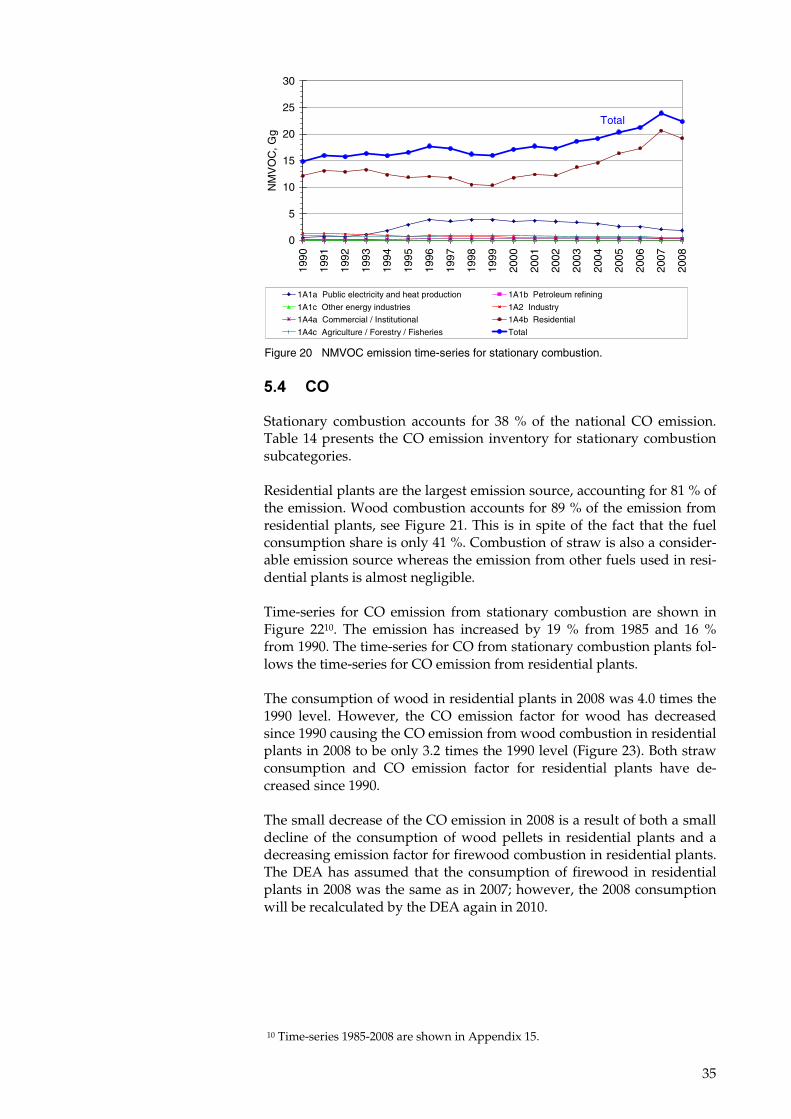
Time-series for NMVOC emission from stationary combustion are shown in Figure 209. The emission has increased by 33 % from 1985 and 50 % from 1990. The increased emission is mainly a result of the increas-ing wood consumption in residential plants and of the increased use of lean-burn gas engines in CHP plants as discussed in Chapter 14.7.3.
9 Time-series 1985-2008 are shown in Appendix 15.
34
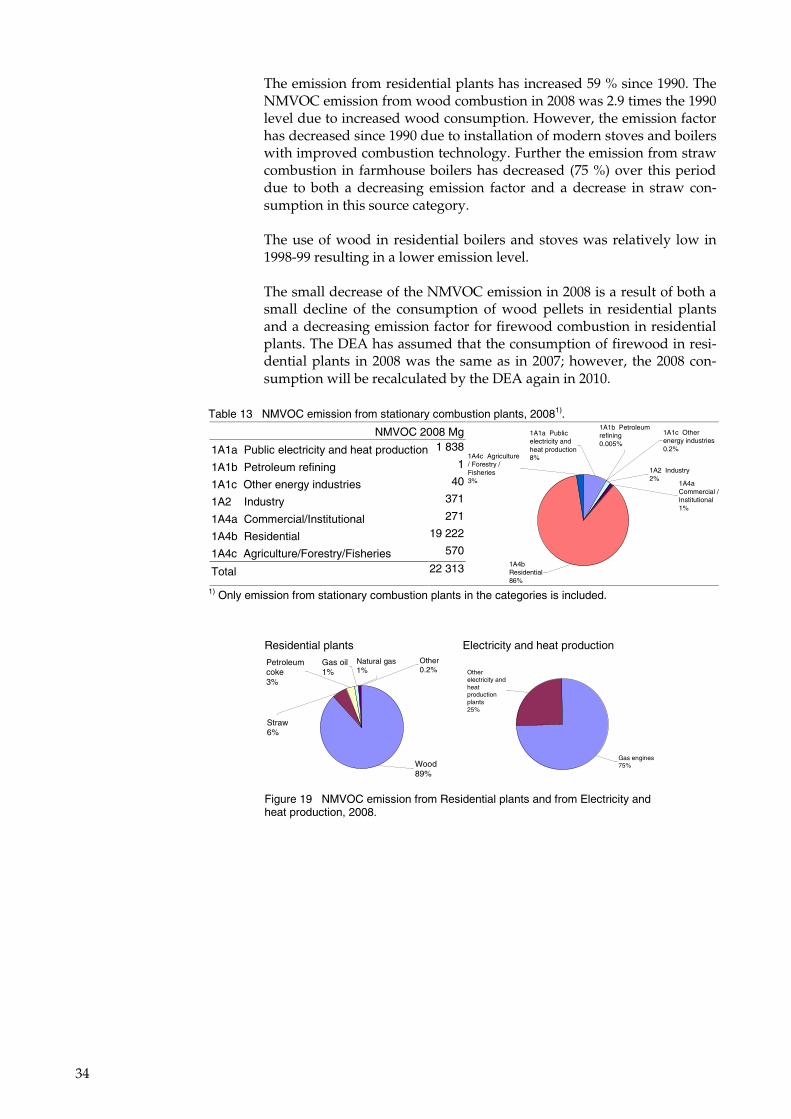
The emission from residential plants has increased 59 % since 1990. The NMVOC emission from wood combustion in 2008 was 2.9 times the 1990 level due to increased wood consumption. However, the emission factor has decreased since 1990 due to installation of modern stoves and boilers with improved combustion technology. Further the emission from straw combustion in farmhouse boilers has decreased (75 %) over this period due to both a decreasing emission factor and a decrease in straw con-sumption in this source category.
The use of wood in residential boilers and stoves was relatively low in 1998-99 resulting in a lower emission level.
The small decrease of the NMVOC emission in 2008 is a result of both a small decline of the consumption of wood pellets in residential plants and a decreasing emission factor for firewood combustion in residential plants. The DEA has assumed that the consumption of firewood in resi-dential plants in 2008 was the same as in 2007; however, the 2008 con-sumption will be recalculated by the DEA again in 2010.
Table 13 NMVOC emission from stationary combustion plants, 20081).
NMVOC 2008 Mg
1A1a Public electricity and heat production 1 838
1A1b Petroleum refining 1
1A1c Other energy industries 40
1A2 Industry 371
1A4a Commercial/Institutional 271
1A4b Residential 19 222
1A4c Agriculture/Forestry/Fisheries 570
Total 22 313
1A1b Petroleum refining0.005%
1A1c Other energy industries0.2%
1A2 Industry2%
1A4b Residential86%
1A4a Commercial / Institutional1%
1A4c Agriculture / Forestry / Fisheries3%
1A1a Public electricity and heat production8%
1) Only emission from stationary combustion plants in the categories is included.
Residential plants Electricity and heat production
Gas oil1%
Wood89%
Straw6%
Petroleum coke3%
Other0.2%
Natural gas1%
Gas engines75%
Other electricity and heat production plants25%
Figure 19 NMVOC emission from Residential plants and from Electricity and heat production, 2008.
35
0
5
10
15
20
25
30
1990
1991
1992
1993
1994
1995
1996
1997
1998
1999
2000
2001
2002
2003
2004
2005
2006
2007
2008
NM
VO
C, G
g
1A1a Public electricity and heat production 1A1b Petroleum refining
1A1c Other energy industries 1A2 Industry
1A4a Commercial / Institutional 1A4b Residential
1A4c Agriculture / Forestry / Fisheries Total
Total
Figure 20 NMVOC emission time-series for stationary combustion.
��(� !,�
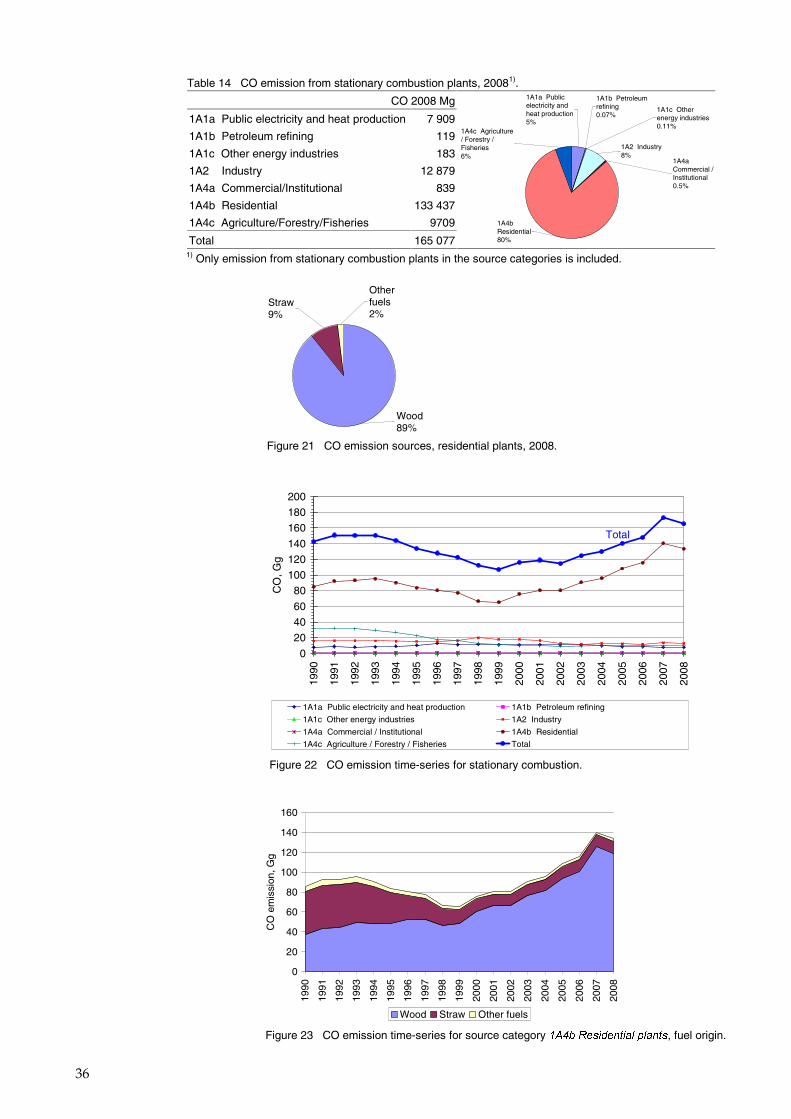
Stationary combustion accounts for 38 % of the national CO emission. Table 14 presents the CO emission inventory for stationary combustion subcategories.
Residential plants are the largest emission source, accounting for 81 % of the emission. Wood combustion accounts for 89 % of the emission from residential plants, see Figure 21. This is in spite of the fact that the fuel consumption share is only 41 %. Combustion of straw is also a consider-able emission source whereas the emission from other fuels used in resi-dential plants is almost negligible.
Time-series for CO emission from stationary combustion are shown in Figure 2210. The emission has increased by 19 % from 1985 and 16 % from 1990. The time-series for CO from stationary combustion plants fol-lows the time-series for CO emission from residential plants.�
The consumption of wood in residential plants in 2008 was 4.0 times the 1990 level. However, the CO emission factor for wood has decreased since 1990 causing the CO emission from wood combustion in residential plants in 2008 to be only 3.2 times the 1990 level (Figure 23). Both straw consumption and CO emission factor for residential plants have de-creased since 1990.�
The small decrease of the CO emission in 2008 is a result of both a small decline of the consumption of wood pellets in residential plants and a decreasing emission factor for firewood combustion in residential plants. The DEA has assumed that the consumption of firewood in residential plants in 2008 was the same as in 2007; however, the 2008 consumption will be recalculated by the DEA again in 2010.
10 Time-series 1985-2008 are shown in Appendix 15.
36
Table 14 CO emission from stationary combustion plants, 20081).
CO 2008 Mg
1A1a Public electricity and heat production 7 909
1A1b Petroleum refining 119
1A1c Other energy industries 183
1A2 Industry 12 879
1A4a Commercial/Institutional 839
1A4b Residential 133 437
1A4c Agriculture/Forestry/Fisheries 9709
Total 165 077
1A1b Petroleum refining0.07%
1A1c Other energy industries0.11%
1A2 Industry8%
1A4b Residential80%
1A4a Commercial / Institutional0.5%
1A4c Agriculture / Forestry / Fisheries6%
1A1a Public electricity and heat production5%
1) Only emission from stationary combustion plants in the source categories is included.
Wood89%
Straw9%
Other fuels2%
Figure 21 CO emission sources, residential plants, 2008.
0
20
40
60
80
100
120
140
160
1990
1991
1992
1993
1994
1995
1996
1997
1998
1999
2000
2001
2002
2003
2004
2005
2006
2007
2008
CO
em
issi
on, G
g
Wood Straw Other fuels Figure 23 CO emission time-series for source category ������������� �� ���, fuel origin.
0
20
40
60
80
100
120
140
160
180
200
1990
1991
1992
1993
1994
1995
1996
1997
1998
1999
2000
2001
2002
2003
2004
2005
2006
2007
2008
CO
, Gg
1A1a Public electricity and heat production 1A1b Petroleum refining
1A1c Other energy industries 1A2 Industry
1A4a Commercial / Institutional 1A4b Residential
1A4c Agriculture / Forestry / Fisheries Total
Total
Figure 22 CO emission time-series for stationary combustion.
37
0� #������ �����������1#.2�
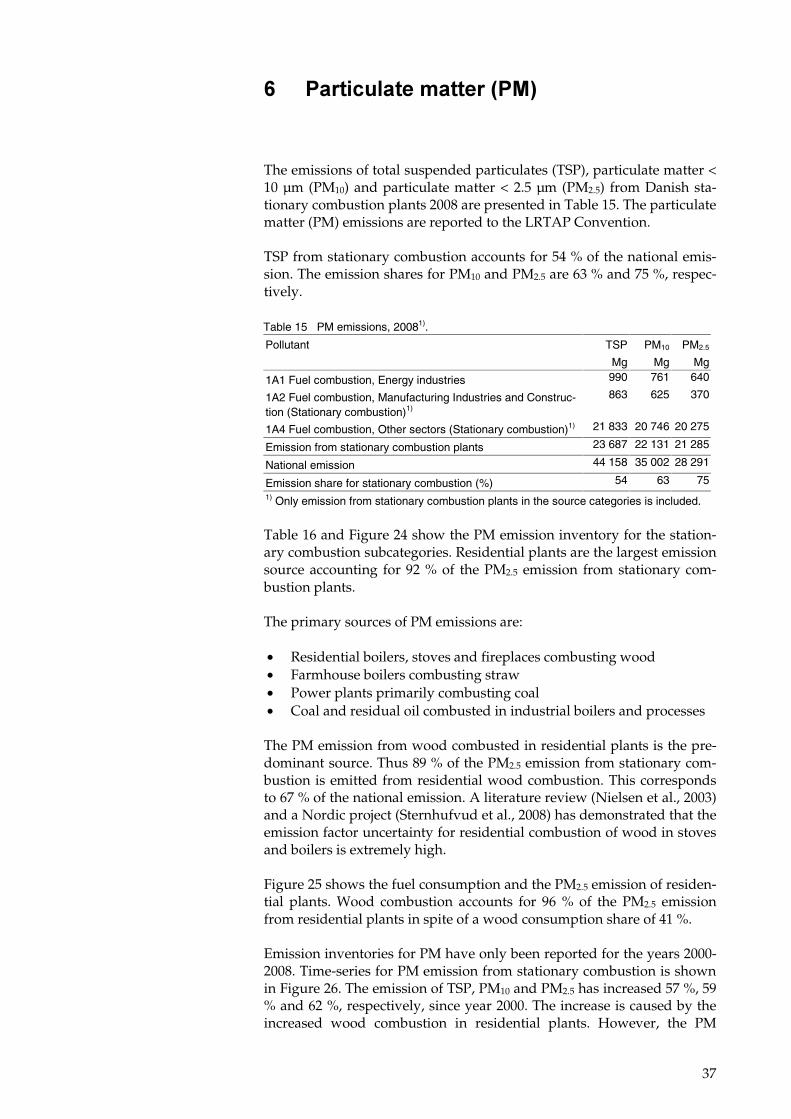
The emissions of total suspended particulates (TSP), particulate matter < 10 µm (PM10) and particulate matter < 2.5 µm (PM2.5) from Danish sta-tionary combustion plants 2008 are presented in Table 15. The particulate matter (PM) emissions are reported to the LRTAP Convention.�
TSP from stationary combustion accounts for 54 % of the national emis-sion. The emission shares for PM10 and PM2.5 are 63 % and 75 %, respec-tively.
Table 15 PM emissions, 20081).
Pollutant TSP
Mg
PM10
Mg
PM2.5
Mg
1A1 Fuel combustion, Energy industries 990 761 640
1A2 Fuel combustion, Manufacturing Industries and Construc-tion (Stationary combustion)1)
863 625 370
1A4 Fuel combustion, Other sectors (Stationary combustion)1) 21 833 20 746 20 275
Emission from stationary combustion plants 23 687 22 131 21 285
National emission 44 158 35 002 28 291
Emission share for stationary combustion (%) 54 63 75 1) Only emission from stationary combustion plants in the source categories is included.
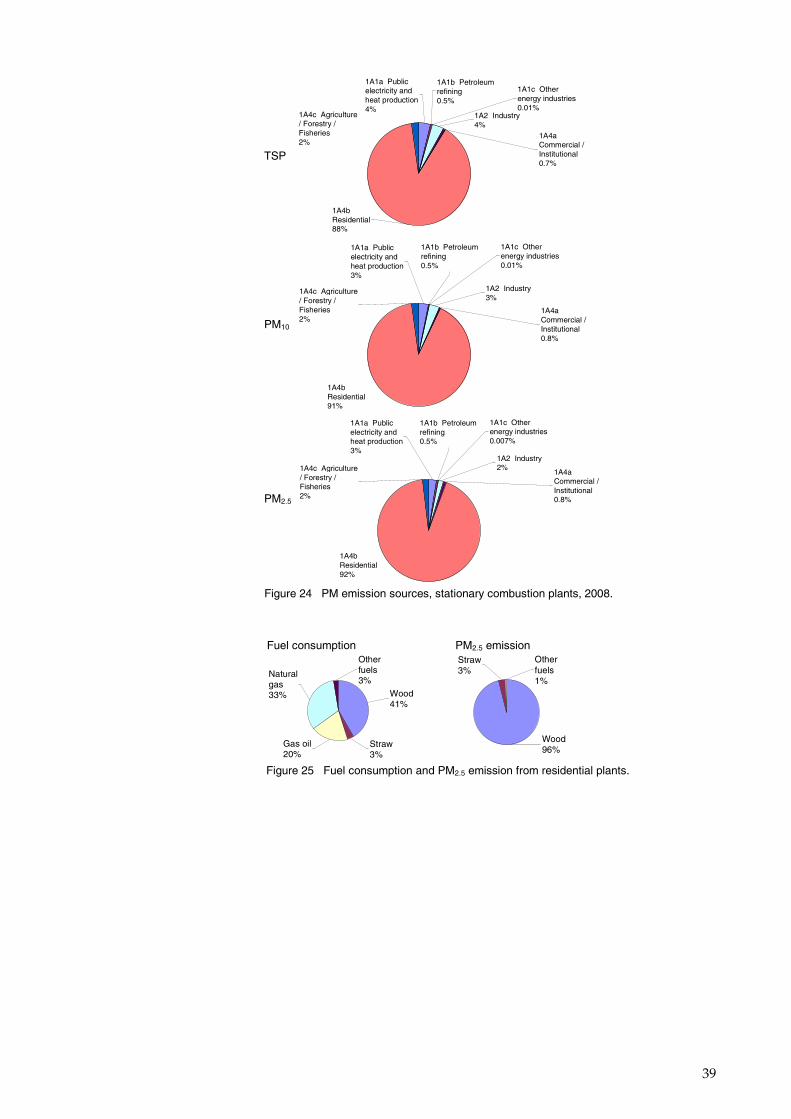
Table 16 and Figure 24 show the PM emission inventory for the station-ary combustion subcategories. Residential plants are the largest emission source accounting for 92 % of the PM2.5 emission from stationary com-bustion plants.
The primary sources of PM emissions are:
• Residential boilers, stoves and fireplaces combusting wood • Farmhouse boilers combusting straw • Power plants primarily combusting coal • Coal and residual oil combusted in industrial boilers and processes The PM emission from wood combusted in residential plants is the pre-dominant source. Thus 89 % of the PM2.5 emission from stationary com-bustion is emitted from residential wood combustion. This corresponds to 67 % of the national emission. A literature review (Nielsen et al., 2003) and a Nordic project (Sternhufvud et al., 2008) has demonstrated that the emission factor uncertainty for residential combustion of wood in stoves and boilers is extremely high.�
Figure 25 shows the fuel consumption and the PM2.5 emission of residen-tial plants. Wood combustion accounts for 96 % of the PM2.5 emission from residential plants in spite of a wood consumption share of 41 %.
Emission inventories for PM have only been reported for the years 2000-2008. Time-series for PM emission from stationary combustion is shown in Figure 26. The emission of TSP, PM10 and PM2.5 has increased 57 %, 59 % and 62 %, respectively, since year 2000. The increase is caused by the increased wood combustion in residential plants. However, the PM
38
emission factors have decreased for this emission source category due to installation of modern stoves and boilers. The small decrease of the PM emissions in 2008 is a result of a constant consumption rate for firewood in residential plants assumed in the energy statistics and a decreasing emission factor. Further, the consumption of wood pellets in residential plants has decreased. The consumption of firewood in residential plants 2008 will be recalculated by the DEA again in 2010.
The time-series for PM emission from stationary combustion plants fol-lows the time-series for PM emission from residential plants (Figure 26 and Figure 27).
Table 16 PM emission from stationary combustion plants, 20081).
TSP, Mg PM10, Mg PM2.5, Mg
1A1a Public electricity and heat production 868 649 533 1A1b Petroleum refining 119 110 106 1A1c Other energy industries 3 2 1 1A2 Industry 863 625 370 1A4a Commercial/Institutional 176 172 161 1A4b Residential 21 150 20 102 19 676 1A4c Agriculture/Forestry/Fisheries 508 472 438
Total 23 687 22 131 21 285 1) Only emission from stationary combustion plants in the source categories is included.
39
TSP
1A1b Petroleum refining0.5%
1A1c Other energy industries0.01%
1A2 Industry4%
1A4b Residential88%
1A4a Commercial / Institutional0.7%
1A4c Agriculture / Forestry / Fisheries2%
1A1a Public electricity and heat production4%
PM10
1A1b Petroleum refining0.5%
1A1c Other energy industries0.01%
1A2 Industry3%
1A4b Residential91%
1A4a Commercial / Institutional0.8%
1A4c Agriculture / Forestry / Fisheries2%
1A1a Public electricity and heat production3%
PM2.5
1A1b Petroleum refining0.5%
1A1c Other energy industries0.007%
1A2 Industry2%
1A4b Residential92%
1A4a Commercial / Institutional0.8%
1A4c Agriculture / Forestry / Fisheries2%
1A1a Public electricity and heat production3%
Figure 24 PM emission sources, stationary combustion plants, 2008.
Fuel consumption PM2.5 emission
Gas oil20%
Straw3%
Wood41%
Other fuels3%
Natural gas33%
Other fuels1%
Straw3%
Wood96%
Figure 25 Fuel consumption and PM2.5 emission from residential plants.
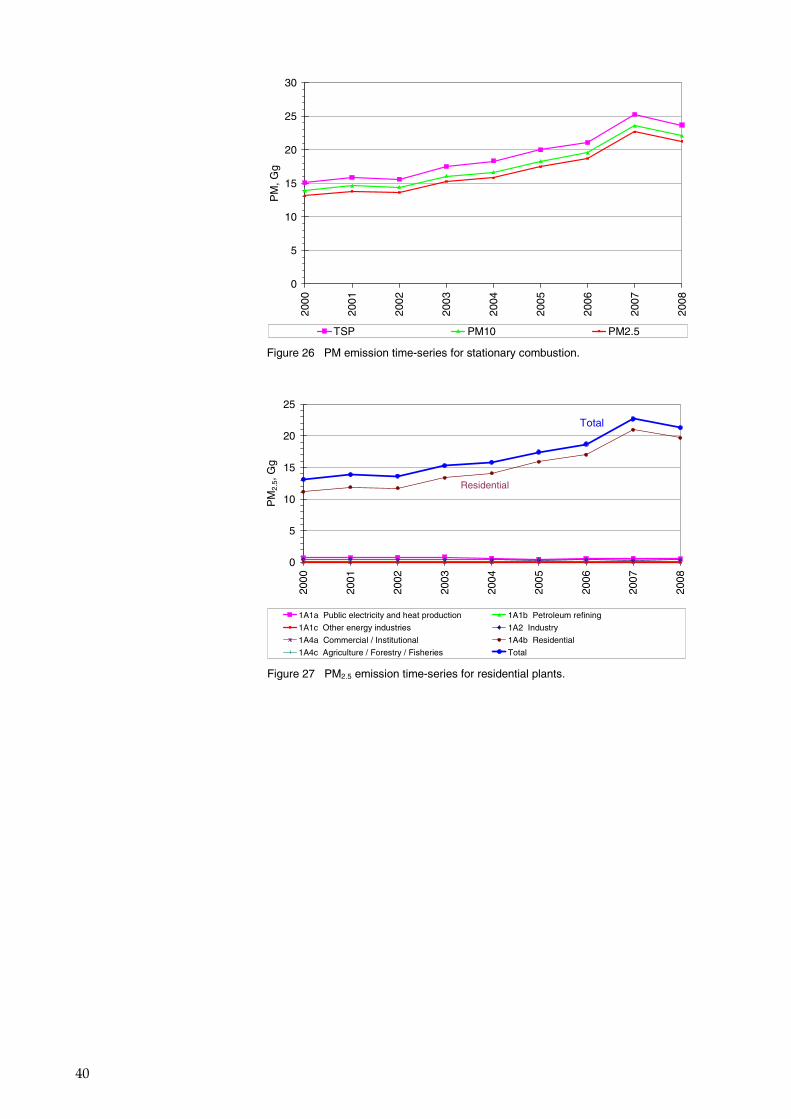
40
0
5
10
15
20
25
30
2000
2001
2002
2003
2004
2005
2006
2007
2008
PM
, Gg
TSP PM10 PM2.5
Figure 26 PM emission time-series for stationary combustion.
0
5
10
15
20
25
2000
2001
2002
2003
2004
2005
2006
2007
2008
PM
2.5,
Gg
1A1a Public electricity and heat production 1A1b Petroleum refining
1A1c Other energy industries 1A2 Industry
1A4a Commercial / Institutional 1A4b Residential
1A4c Agriculture / Forestry / Fisheries Total
Total
Residential
Figure 27 PM2.5 emission time-series for residential plants.
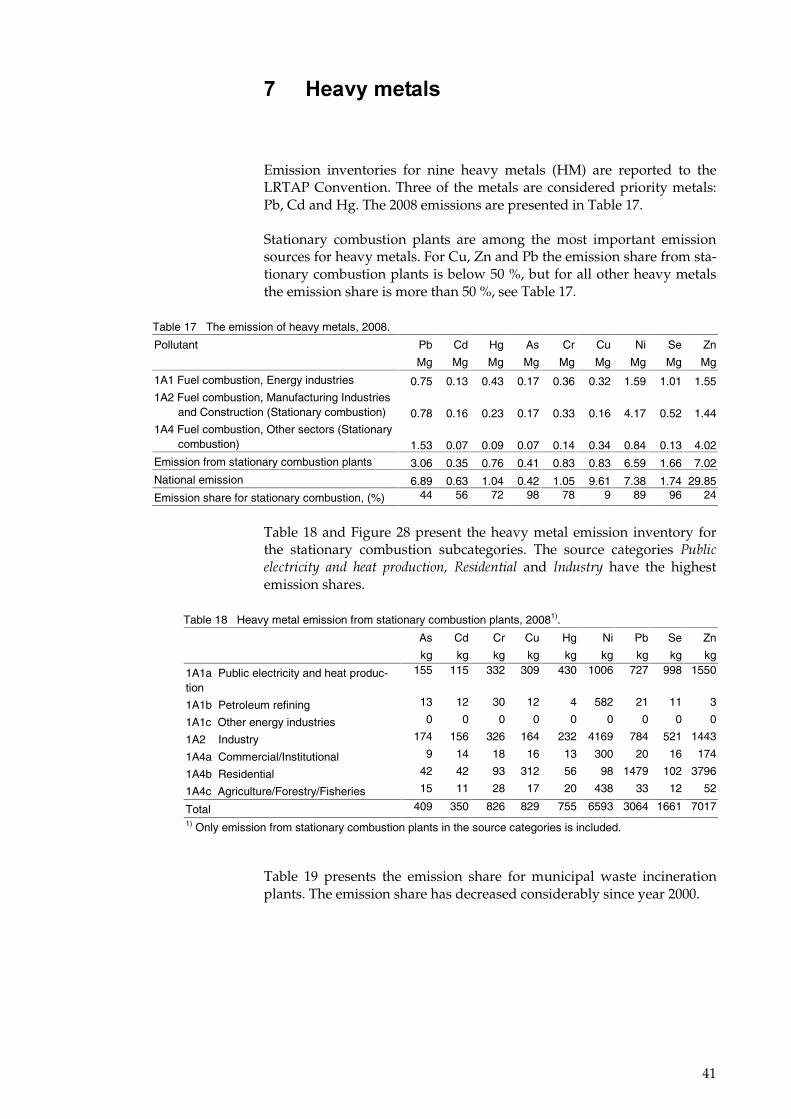
41
�� 3��������� ��
Emission inventories for nine heavy metals (HM) are reported to the LRTAP Convention. Three of the metals are considered priority metals: Pb, Cd and Hg. The 2008 emissions are presented in Table 17.
Stationary combustion plants are among the most important emission sources for heavy metals. For Cu, Zn and Pb the emission share from sta-tionary combustion plants is below 50 %, but for all other heavy metals the emission share is more than 50 %, see Table 17.
Table 17 The emission of heavy metals, 2008.
Pollutant Pb
Mg
Cd
Mg
Hg
Mg
As
Mg
Cr
Mg
Cu
Mg
Ni
Mg
Se
Mg
Zn
Mg
1A1 Fuel combustion, Energy industries 0.75 0.13 0.43 0.17 0.36 0.32 1.59 1.01 1.55 1A2 Fuel combustion, Manufacturing Industries
and Construction (Stationary combustion) 0.78 0.16 0.23 0.17 0.33 0.16 4.17 0.52 1.44 1A4 Fuel combustion, Other sectors (Stationary
combustion) 1.53 0.07 0.09 0.07 0.14 0.34 0.84 0.13 4.02
Emission from stationary combustion plants 3.06 0.35 0.76 0.41 0.83 0.83 6.59 1.66 7.02
National emission 6.89 0.63 1.04 0.42 1.05 9.61 7.38 1.74 29.85
Emission share for stationary combustion, (%) 44 56 72 98 78 9 89 96 24
Table 18 and Figure 28 present the heavy metal emission inventory for the stationary combustion subcategories. The source categories �� �������������� ���� ���� ����������� ��������� and ������ have the highest emission shares.
Table 18 Heavy metal emission from stationary combustion plants, 20081).
Table 19 presents the emission share for municipal waste incineration plants. The emission share has decreased considerably since year 2000.
As
kg
Cd
kg
Cr
kg
Cu
kg
Hg
kg
Ni
kg
Pb
kg
Se
kg
Zn
kg
1A1a Public electricity and heat produc-tion
155 115 332 309 430 1006 727 998 1550
1A1b Petroleum refining 13 12 30 12 4 582 21 11 3
1A1c Other energy industries 0 0 0 0 0 0 0 0 0
1A2 Industry 174 156 326 164 232 4169 784 521 1443
1A4a Commercial/Institutional 9 14 18 16 13 300 20 16 174
1A4b Residential 42 42 93 312 56 98 1479 102 3796
1A4c Agriculture/Forestry/Fisheries 15 11 28 17 20 438 33 12 52
Total 409 350 826 829 755 6593 3064 1661 7017 1) Only emission from stationary combustion plants in the source categories is included.
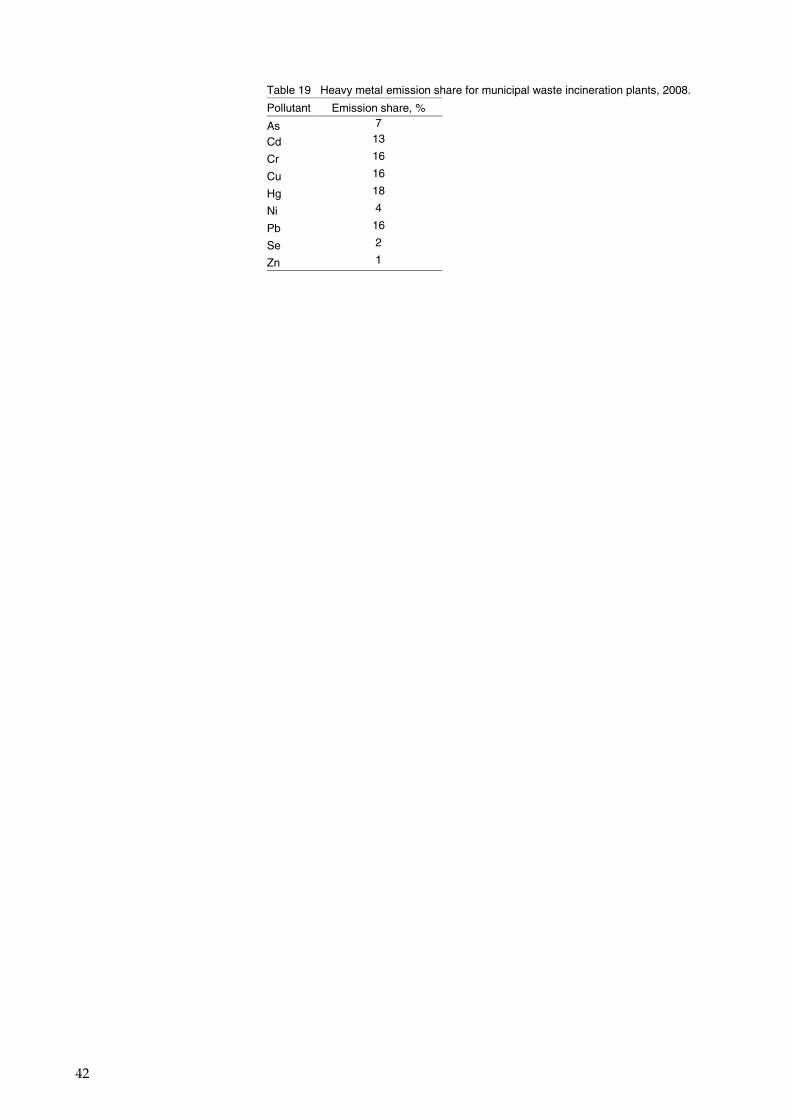
42
Table 19 Heavy metal emission share for municipal waste incineration plants, 2008.
Pollutant Emission share, %
As 7
Cd 13
Cr 16
Cu 16
Hg 18
Ni 4
Pb 16
Se 2
Zn 1
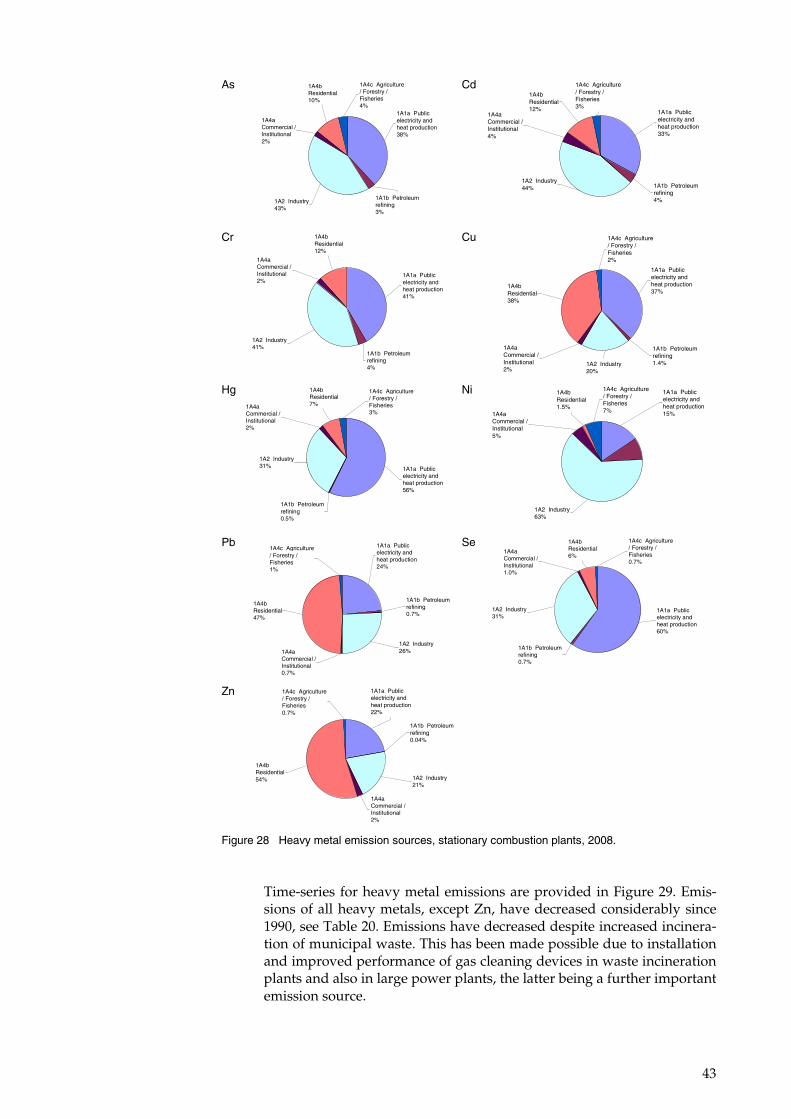
43
Time-series for heavy metal emissions are provided in Figure 29. Emis-sions of all heavy metals, except Zn, have decreased considerably since 1990, see Table 20. Emissions have decreased despite increased incinera-tion of municipal waste. This has been made possible due to installation and improved performance of gas cleaning devices in waste incineration plants and also in large power plants, the latter being a further important emission source.
As
1A1b Petroleum refining3%
1A2 Industry43%
1A4b Residential10%
1A4a Commercial / Institutional2%
1A4c Agriculture / Forestry / Fisheries4%
1A1a Public electricity and heat production38%
Cd
1A1b Petroleum refining4%
1A2 Industry44%
1A4b Residential12%
1A4a Commercial / Institutional4%
1A4c Agriculture / Forestry / Fisheries3%
1A1a Public electricity and heat production33%
Cr 1A4b Residential12%
1A4a Commercial / Institutional2%
1A2 Industry41%
1A1b Petroleum refining4%
1A1a Public electricity and heat production41%
Cu
1A1b Petroleum refining1.4%1A2 Industry
20%
1A4b Residential38%
1A4a Commercial / Institutional2%
1A4c Agriculture / Forestry / Fisheries2%
1A1a Public electricity and heat production37%
Hg
1A1b Petroleum refining0.5%
1A2 Industry31%
1A4a Commercial / Institutional2%
1A4b Residential7%
1A4c Agriculture / Forestry / Fisheries3%
1A1a Public electricity and heat production56%
Ni
1A2 Industry63%
1A4b Residential1.5%
1A4a Commercial / Institutional5%
1A4c Agriculture / Forestry / Fisheries7%
1A1a Public electricity and heat production15%
Pb
1A1b Petroleum refining0.7%
1A2 Industry26%
1A4b Residential47%
1A4a Commercial / Institutional0.7%
1A4c Agriculture / Forestry / Fisheries1%
1A1a Public electricity and heat production24%
Se
1A1a Public electricity and heat production60%
1A1b Petroleum refining0.7%
1A2 Industry31%
1A4b Residential6%
1A4c Agriculture / Forestry / Fisheries0.7%
1A4a Commercial / Institutional1.0%
Zn 1A1a Public
electricity and heat production22%
1A1b Petroleum refining0.04%
1A2 Industry21%
1A4b Residential54%
1A4c Agriculture / Forestry / Fisheries0.7%
1A4a Commercial / Institutional2%
Figure 28 Heavy metal emission sources, stationary combustion plants, 2008.
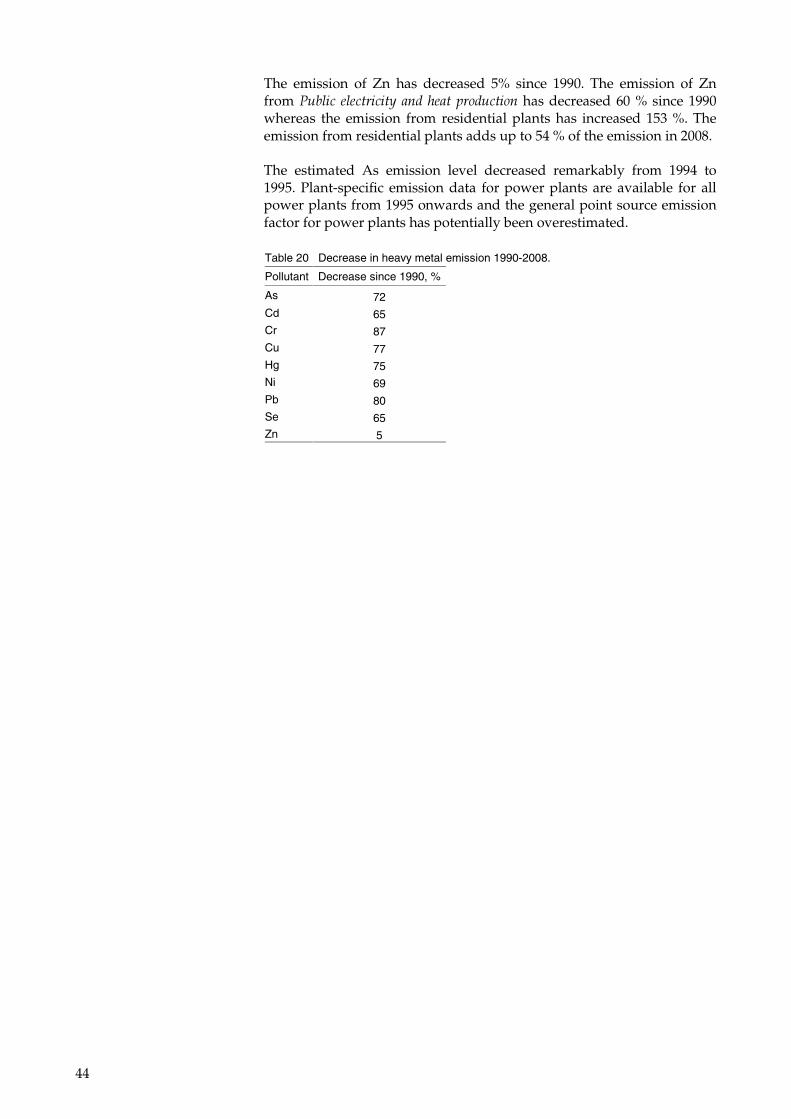
44
The emission of Zn has decreased 5% since 1990. The emission of Zn from �� ���� ���������� �������� ��������� has decreased 60 % since 1990 whereas the emission from residential plants has increased 153 %. The emission from residential plants adds up to 54 % of the emission in 2008.
The estimated As emission level decreased remarkably from 1994 to 1995. Plant-specific emission data for power plants are available for all power plants from 1995 onwards and the general point source emission factor for power plants has potentially been overestimated.
Table 20 Decrease in heavy metal emission 1990-2008.
Pollutant Decrease since 1990, %
As 72 Cd 65 Cr 87 Cu 77 Hg 75 Ni 69 Pb 80 Se 65 Zn 5
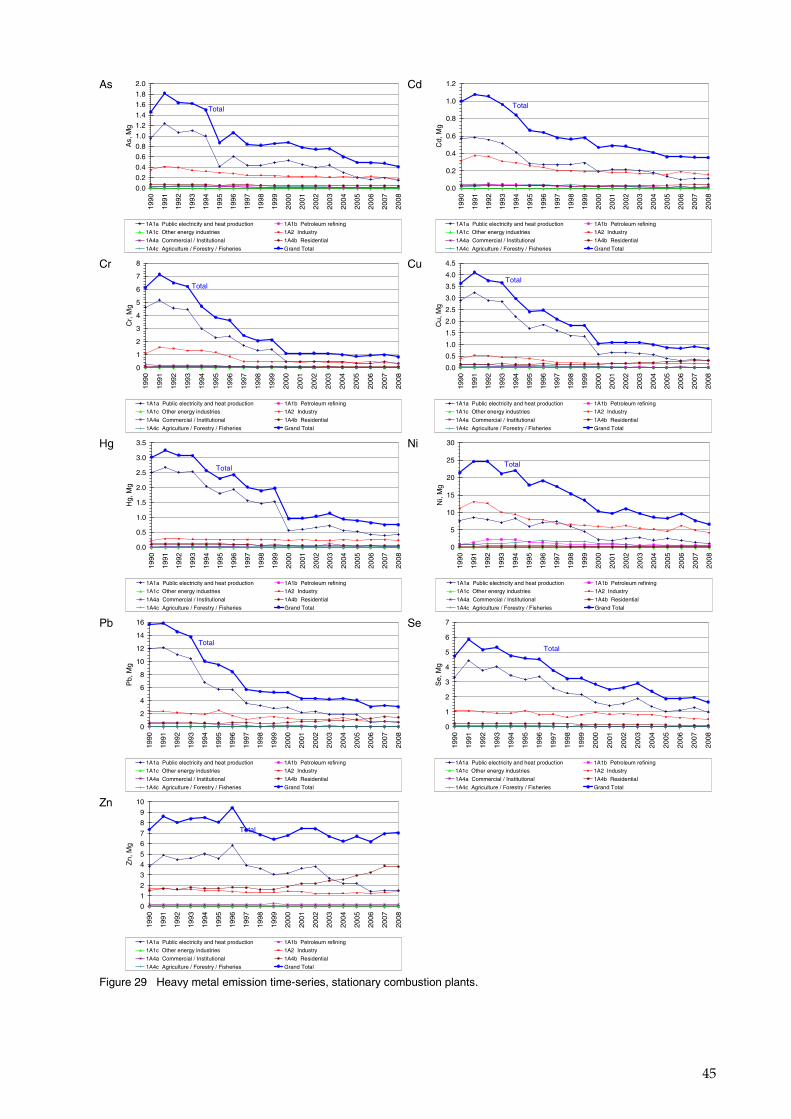
45
As
0.0
0.2
0.4
0.6
0.8
1.0
1.2
1.4
1.6
1.8
2.0
1990
1991
1992
1993
1994
1995
1996
1997
1998
1999
2000
2001
2002
2003
2004
2005
2006
2007
2008
As,
Mg
1A1a Public electricity and heat production 1A1b Petroleum refining
1A1c Other energy industries 1A2 Industry
1A4a Commercial / Institutional 1A4b Residential
1A4c Agriculture / Forestry / Fisheries Grand Total
Total
Cd
0.0
0.2
0.4
0.6
0.8
1.0
1.2
1990
1991
1992
1993
1994
1995
1996
1997
1998
1999
2000
2001
2002
2003
2004
2005
2006
2007
2008
Cd,
Mg
1A1a Public electricity and heat production 1A1b Petroleum refining
1A1c Other energy industries 1A2 Industry
1A4a Commercial / Institutional 1A4b Residential
1A4c Agriculture / Forestry / Fisheries Grand Total
Total
Cr
0
1
2
3
4
5
6
7
8
1990
1991
1992
1993
1994
1995
1996
1997
1998
1999
2000
2001
2002
2003
2004
2005
2006
2007
2008
Cr,
Mg
1A1a Public electricity and heat production 1A1b Petroleum refining
1A1c Other energy industries 1A2 Industry
1A4a Commercial / Institutional 1A4b Residential
1A4c Agriculture / Forestry / Fisheries Grand Total
Total
Cu
0.0
0.5
1.0
1.5
2.0
2.5
3.0
3.5
4.0
4.5
1990
1991
1992
1993
1994
1995
1996
1997
1998
1999
2000
2001
2002
2003
2004
2005
2006
2007
2008
Cu,
Mg
1A1a Public electricity and heat production 1A1b Petroleum refining
1A1c Other energy industries 1A2 Industry
1A4a Commercial / Institutional 1A4b Residential
1A4c Agriculture / Forestry / Fisheries Grand Total
Total
Hg
0.0
0.5
1.0
1.5
2.0
2.5
3.0
3.5
1990
1991
1992
1993
1994
1995
1996
1997
1998
1999
2000
2001
2002
2003
2004
2005
2006
2007
2008
Hg,
Mg
1A1a Public electricity and heat production 1A1b Petroleum refining
1A1c Other energy industries 1A2 Industry
1A4a Commercial / Institutional 1A4b Residential
1A4c Agriculture / Forestry / Fisheries Grand Total
Total
Ni
0
5
10
15
20
25
30
1990
1991
1992
1993
1994
1995
1996
1997
1998
1999
2000
2001
2002
2003
2004
2005
2006
2007
2008
Ni,
Mg
1A1a Public electricity and heat production 1A1b Petroleum refining
1A1c Other energy industries 1A2 Industry
1A4a Commercial / Institutional 1A4b Residential
1A4c Agriculture / Forestry / Fisheries Grand Total
Total
Pb
0
2
4
6
8
10
12
14
16
1990
1991
1992
1993
1994
1995
1996
1997
1998
1999
2000
2001
2002
2003
2004
2005
2006
2007
2008
Pb,
Mg
1A1a Public electricity and heat production 1A1b Petroleum refining
1A1c Other energy industries 1A2 Industry
1A4a Commercial / Institutional 1A4b Residential
1A4c Agriculture / Forestry / Fisheries Grand Total
Total
Se
0
1
2
3
4
5
6
7
1990
1991
1992
1993
1994
1995
1996
1997
1998
1999
2000
2001
2002
2003
2004
2005
2006
2007
2008
Se,
Mg
1A1a Public electricity and heat production 1A1b Petroleum refining
1A1c Other energy industries 1A2 Industry
1A4a Commercial / Institutional 1A4b Residential
1A4c Agriculture / Forestry / Fisheries Grand Total
Total
Zn
0
1
2
3
4
5
6
7
8
9
10
1990
1991
1992
1993
1994
1995
1996
1997
1998
1999
2000
2001
2002
2003
2004
2005
2006
2007
2008
Zn,
Mg
1A1a Public electricity and heat production 1A1b Petroleum refining
1A1c Other energy industries 1A2 Industry
1A4a Commercial / Institutional 1A4b Residential
1A4c Agriculture / Forestry / Fisheries Grand Total
Total
Figure 29 Heavy metal emission time-series, stationary combustion plants.
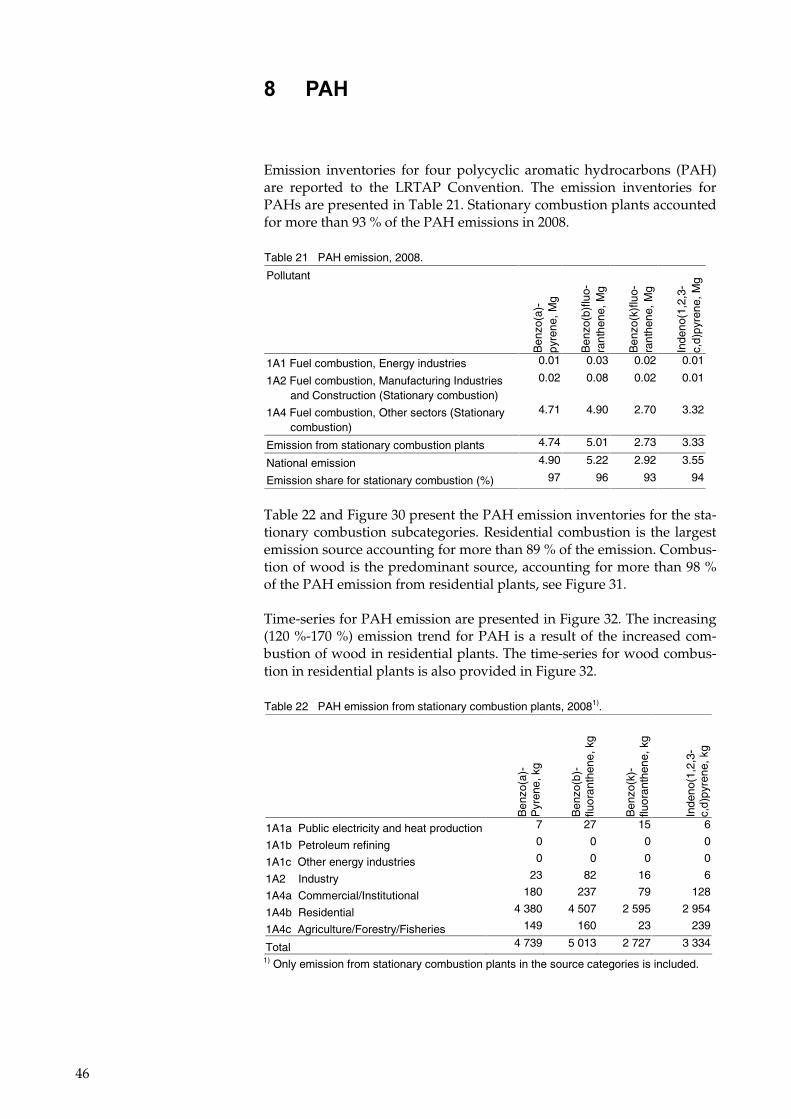
46
� #43�
Emission inventories for four polycyclic aromatic hydrocarbons (PAH) are reported to the LRTAP Convention. The emission inventories for PAHs are presented in Table 21. Stationary combustion plants accounted for more than 93 % of the PAH emissions in 2008.
Table 21 PAH emission, 2008.
Pollutant
Ben
zo(a
)-py
rene
, Mg
Ben
zo(b
)flu
o-ra
nthe
ne, M
g
Ben
zo(k
)flu
o-ra
nthe
ne, M
g
Inde
no(1
,2,3
-c,
d)py
rene
, Mg
1A1 Fuel combustion, Energy industries 0.01 0.03 0.02 0.01
1A2 Fuel combustion, Manufacturing Industries and Construction (Stationary combustion)
0.02 0.08 0.02 0.01
1A4 Fuel combustion, Other sectors (Stationary combustion)
4.71 4.90 2.70 3.32
Emission from stationary combustion plants 4.74 5.01 2.73 3.33
National emission 4.90 5.22 2.92 3.55
Emission share for stationary combustion (%) 97 96 93 94
Table 22 and Figure 30 present the PAH emission inventories for the sta-tionary combustion subcategories. Residential combustion is the largest emission source accounting for more than 89 % of the emission. Combus-tion of wood is the predominant source, accounting for more than 98 % of the PAH emission from residential plants, see Figure 31.
Time-series for PAH emission are presented in Figure 32. The increasing (120 %-170 %) emission trend for PAH is a result of the increased com-bustion of wood in residential plants. The time-series for wood combus-tion in residential plants is also provided in Figure 32.
Table 22 PAH emission from stationary combustion plants, 20081).
Ben
zo(a
)-
Pyr
ene,
kg
Ben
zo(b
)-flu
oran
then
e, k
g
Ben
zo(k
)-flu
oran
then
e, k
g
Inde
no(1
,2,3
-c,
d)py
rene
, kg
1A1a Public electricity and heat production 7 27 15 6
1A1b Petroleum refining 0 0 0 0
1A1c Other energy industries 0 0 0 0
1A2 Industry 23 82 16 6
1A4a Commercial/Institutional 180 237 79 128
1A4b Residential 4 380 4 507 2 595 2 954
1A4c Agriculture/Forestry/Fisheries 149 160 23 239
Total 4 739 5 013 2 727 3 334 1) Only emission from stationary combustion plants in the source categories is included.
�
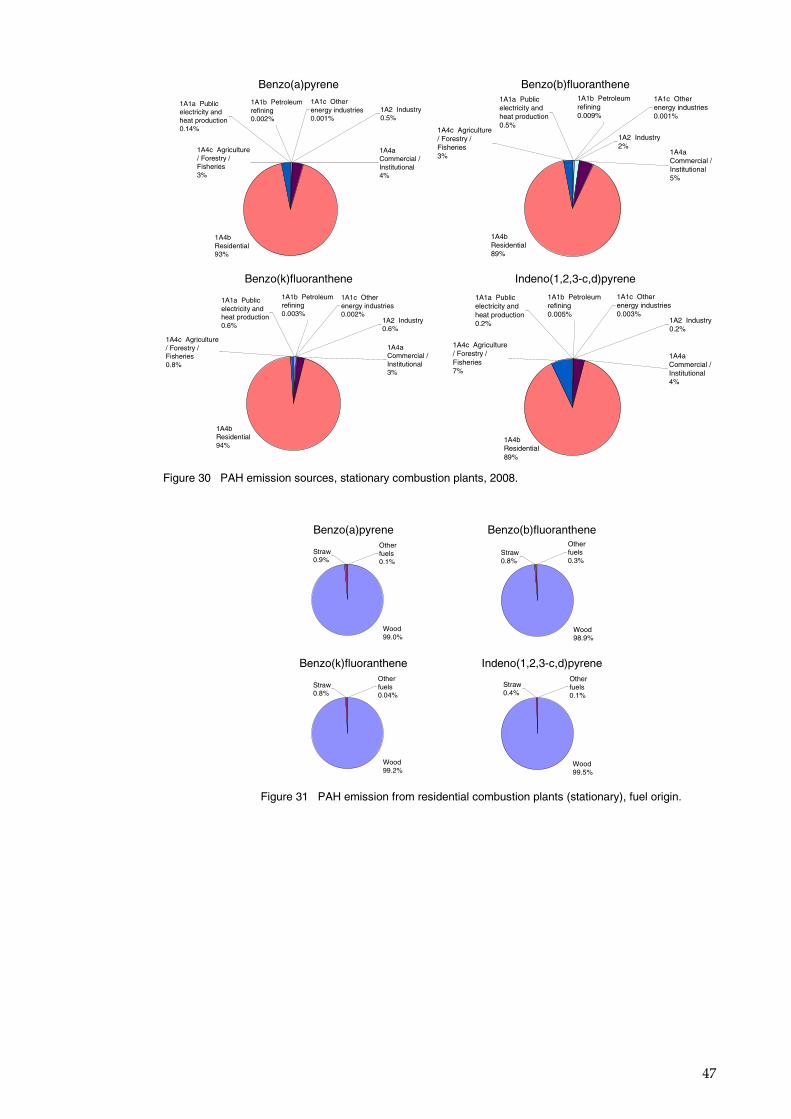
47
Benzo(a)pyrene Benzo(b)fluoranthene 1A1b Petroleum refining0.002%
1A4b Residential93%
1A1a Public electricity and heat production0.14%
1A1c Other energy industries0.001%
1A4c Agriculture / Forestry / Fisheries3%
1A2 Industry0.5%
1A4a Commercial / Institutional4%
1A1b Petroleum refining0.009%
1A4b Residential89%
1A1a Public electricity and heat production0.5%
1A1c Other energy industries0.001%
1A4c Agriculture / Forestry / Fisheries3%
1A2 Industry2%
1A4a Commercial / Institutional5%
Benzo(k)fluoranthene Indeno(1,2,3-c,d)pyrene
1A1b Petroleum refining0.003%
1A4b Residential94%
1A1a Public electricity and heat production0.6%
1A1c Other energy industries0.002%
1A4c Agriculture / Forestry / Fisheries0.8%
1A2 Industry0.6%
1A4a Commercial / Institutional3%
1A1b Petroleum refining0.005%
1A4b Residential89%
1A1a Public electricity and heat production0.2%
1A1c Other energy industries0.003%
1A4c Agriculture / Forestry / Fisheries7%
1A2 Industry0.2%
1A4a Commercial / Institutional4%
Figure 30 PAH emission sources, stationary combustion plants, 2008.
Benzo(a)pyrene Benzo(b)fluoranthene
Wood99.0%
Other fuels0.1%
Straw0.9%
Wood98.9%
Other fuels0.3%
Straw0.8%
Benzo(k)fluoranthene Indeno(1,2,3-c,d)pyrene
Wood99.2%
Other fuels0.04%
Straw0.8%
Wood99.5%
Other fuels0.1%
Straw0.4%
Figure 31 PAH emission from residential combustion plants (stationary), fuel origin.
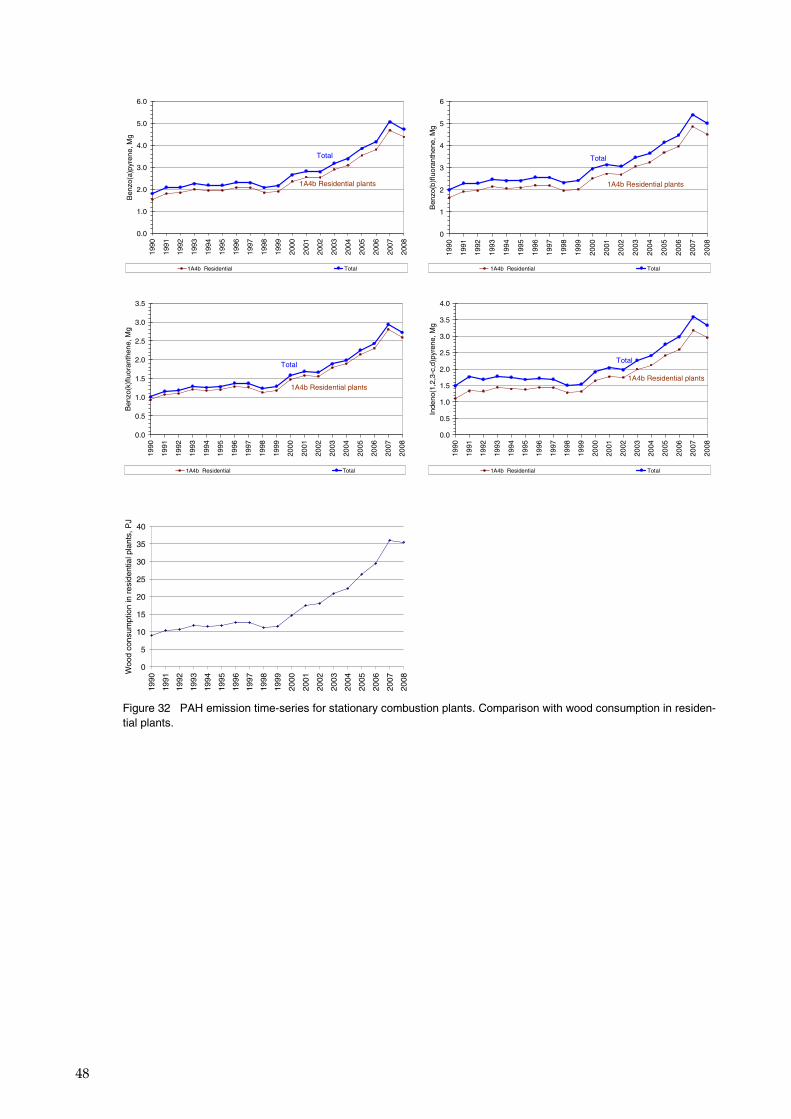
48
Benzo(a)pyrene
0.0
1.0
2.0
3.0
4.0
5.0
6.0
1990
1991
1992
1993
1994
1995
1996
1997
1998
1999
2000
2001
2002
2003
2004
2005
2006
2007
2008
Ben
zo(a
)pyr
ene,
Mg
1A4b Residential Total
Total
1A4b Residential plants
Benzo(b)fluoranthene
0
1
2
3
4
5
6
1990
1991
1992
1993
1994
1995
1996
1997
1998
1999
2000
2001
2002
2003
2004
2005
2006
2007
2008
Ben
zo(b
)flu
oran
then
e, M
g
1A4b Residential Total
Total
1A4b Residential plants
Benzo(k)fluoranthene
0.0
0.5
1.0
1.5
2.0
2.5
3.0
3.5
1990
1991
1992
1993
1994
1995
1996
1997
1998
1999
2000
2001
2002
2003
2004
2005
2006
2007
2008
Ben
zo(k
)flu
oran
then
e, M
g
1A4b Residential Total
Total
1A4b Residential plants
Indeno(1,2,3-c,d)pyrene
0.0
0.5
1.0
1.5
2.0
2.5
3.0
3.5
4.0
1990
1991
1992
1993
1994
1995
1996
1997
1998
1999
2000
2001
2002
2003
2004
2005
2006
2007
2008
Inde
no(1
,2,3
-c,d
)pyr
ene,
Mg
1A4b Residential Total
Total
1A4b Residential plants
Combustion of wood in residential plants
0
5
10
15
20
25
30
35
40
1990
1991
1992
1993
1994
1995
1996
1997
1998
1999
2000
2001
2002
2003
2004
2005
2006
2007
2008
Woo
d co
nsum
ptio
n in
res
iden
tial p
lant
s, P
J
Figure 32 PAH emission time-series for stationary combustion plants. Comparison with wood consumption in residen-tial plants.
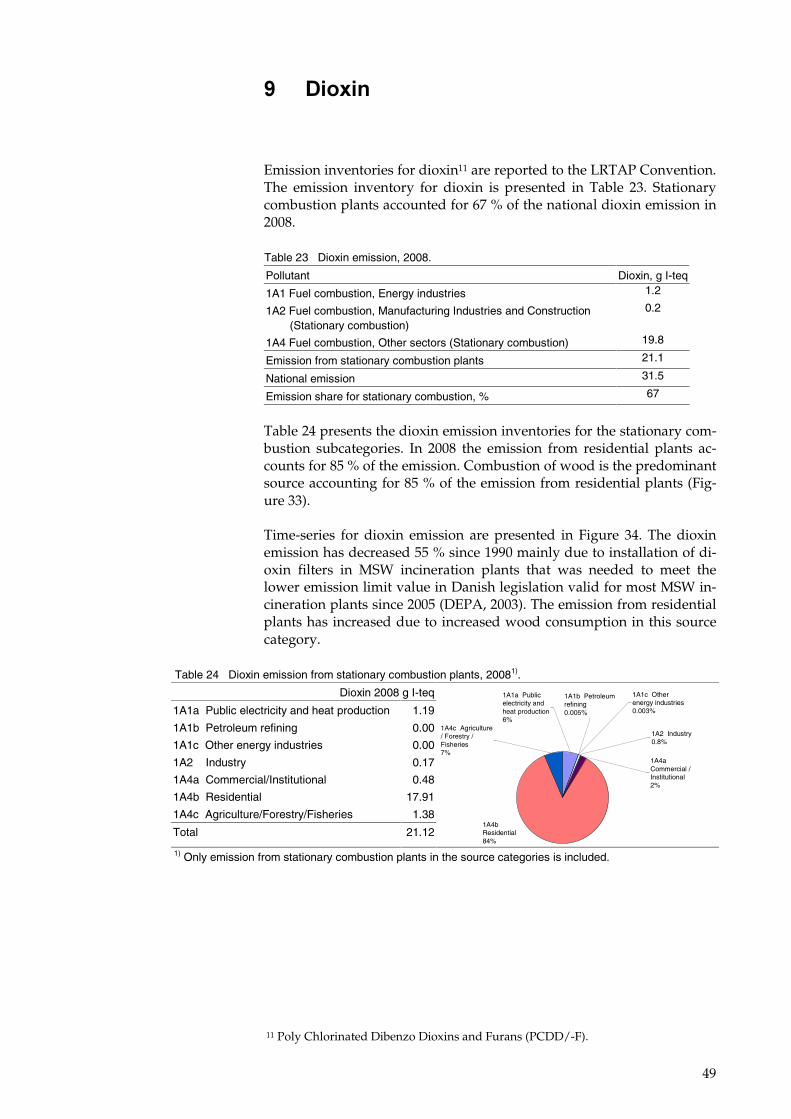
49
�� ���5��
Emission inventories for dioxin11 are reported to the LRTAP Convention. The emission inventory for dioxin is presented in Table 23. Stationary combustion plants accounted for 67 % of the national dioxin emission in 2008.
Table 23 Dioxin emission, 2008.
Pollutant Dioxin, g I-teq
1A1 Fuel combustion, Energy industries 1.2
1A2 Fuel combustion, Manufacturing Industries and Construction (Stationary combustion)
0.2
1A4 Fuel combustion, Other sectors (Stationary combustion) 19.8
Emission from stationary combustion plants 21.1
National emission 31.5
Emission share for stationary combustion, % 67
Table 24 presents the dioxin emission inventories for the stationary com-bustion subcategories. In 2008 the emission from residential plants ac-counts for 85 % of the emission. Combustion of wood is the predominant source accounting for 85 % of the emission from residential plants (Fig-ure 33).
Time-series for dioxin emission are presented in Figure 34. The dioxin emission has decreased 55 % since 1990 mainly due to installation of di-oxin filters in MSW incineration plants that was needed to meet the lower emission limit value in Danish legislation valid for most MSW in-cineration plants since 2005 (DEPA, 2003). The emission from residential plants has increased due to increased wood consumption in this source category.
Table 24 Dioxin emission from stationary combustion plants, 20081).
Dioxin 2008 g I-teq
1A1a Public electricity and heat production 1.19
1A1b Petroleum refining 0.00
1A1c Other energy industries 0.00
1A2 Industry 0.17
1A4a Commercial/Institutional 0.48
1A4b Residential 17.91
1A4c Agriculture/Forestry/Fisheries 1.38
Total 21.12
1A1b Petroleum refining0.005%
1A4b Residential84%
1A1a Public electricity and heat production6%
1A1c Other energy industries0.003%
1A4c Agriculture / Forestry / Fisheries7%
1A2 Industry0.8%
1A4a Commercial / Institutional2%
1) Only emission from stationary combustion plants in the source categories is included.
11 Poly Chlorinated Dibenzo Dioxins and Furans (PCDD/-F).
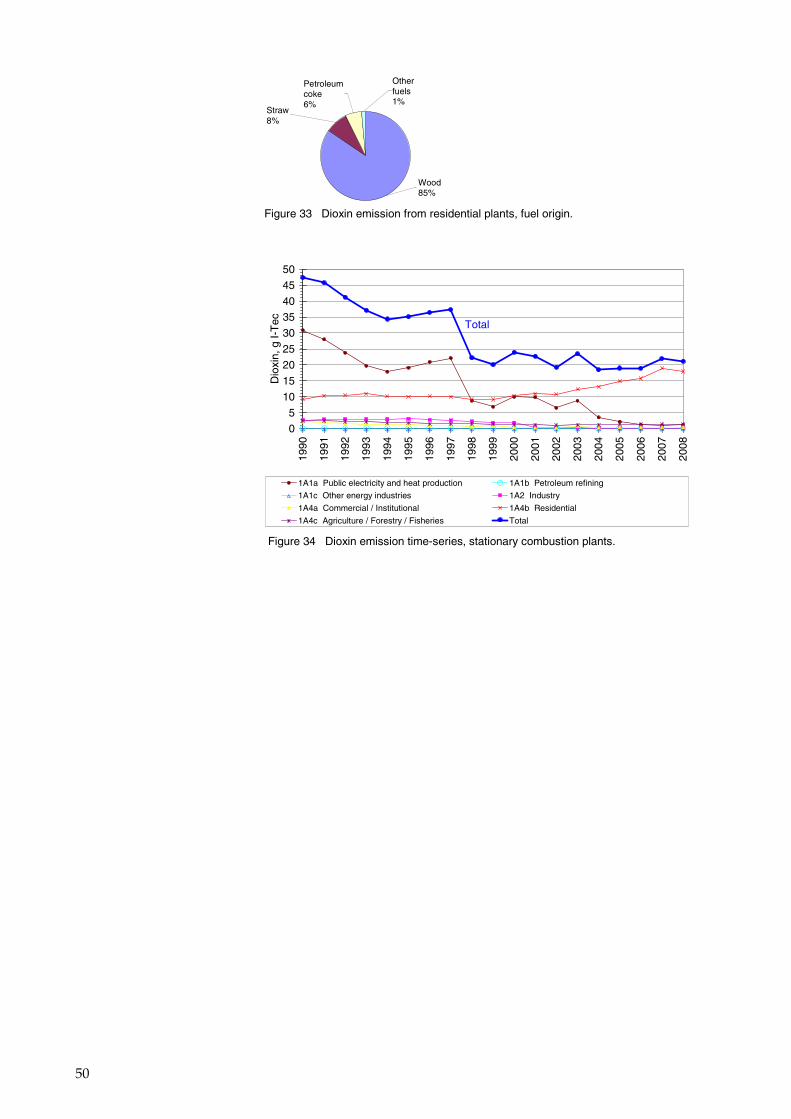
50
Other fuels1%
Wood85%
Petroleum coke6%
Straw8%
Figure 33 Dioxin emission from residential plants, fuel origin.
0
5
10
15
20
25
30
35
40
45
50
1990
1991
1992
1993
1994
1995
1996
1997
1998
1999
2000
2001
2002
2003
2004
2005
2006
2007
2008
Dio
xin,
g I-
Tec
1A1a Public electricity and heat production 1A1b Petroleum refining
1A1c Other energy industries 1A2 Industry
1A4a Commercial / Institutional 1A4b Residential
1A4c Agriculture / Forestry / Fisheries Total
Total
Figure 34 Dioxin emission time-series, stationary combustion plants.
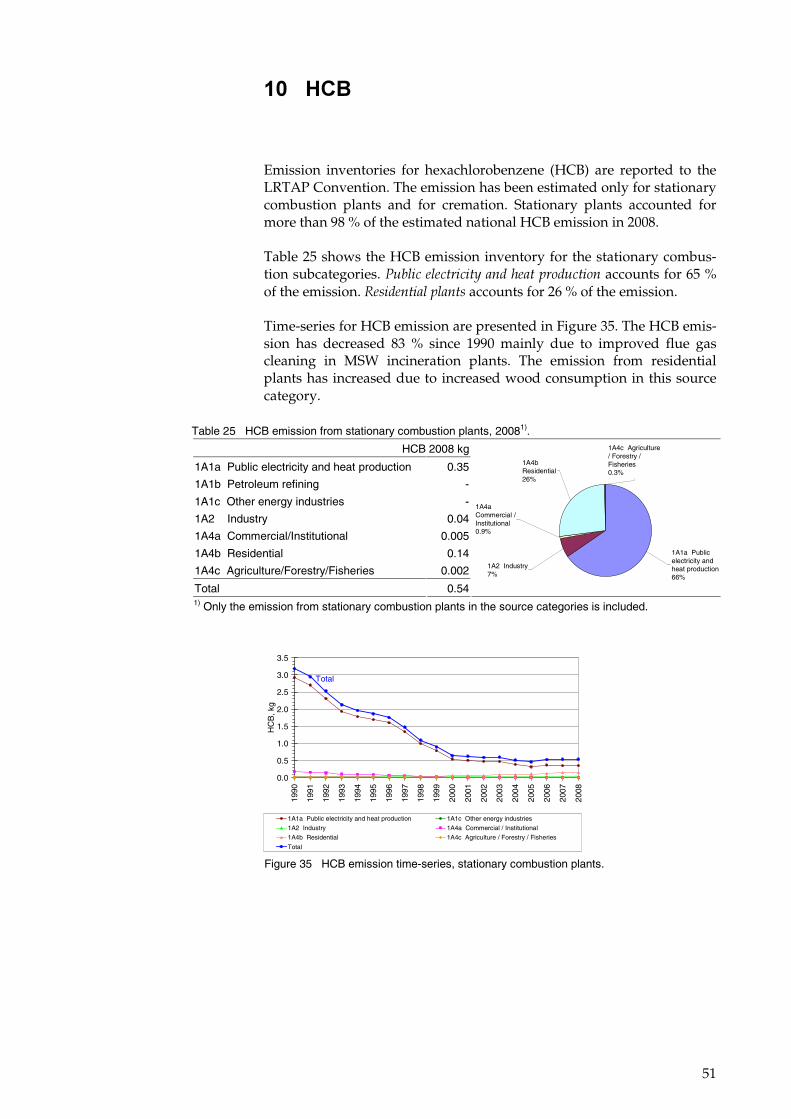
51
'�� 3!6�
Emission inventories for hexachlorobenzene (HCB) are reported to the LRTAP Convention. The emission has been estimated only for stationary combustion plants and for cremation. Stationary plants accounted for more than 98 % of the estimated national HCB emission in 2008.
Table 25 shows the HCB emission inventory for the stationary combus-tion subcategories. �� ������������������������������� accounts for 65 % of the emission. �������������� accounts for 26 % of the emission.
Time-series for HCB emission are presented in Figure 35. The HCB emis-sion has decreased 83 % since 1990 mainly due to improved flue gas cleaning in MSW incineration plants. The emission from residential plants has increased due to increased wood consumption in this source category.
Table 25 HCB emission from stationary combustion plants, 20081).
HCB 2008 kg
1A1a Public electricity and heat production 0.35
1A1b Petroleum refining -
1A1c Other energy industries -
1A2 Industry 0.04
1A4a Commercial/Institutional 0.005
1A4b Residential 0.14
1A4c Agriculture/Forestry/Fisheries 0.002
Total 0.54
1A2 Industry7%
1A1a Public electricity and heat production66%
1A4a Commercial / Institutional0.9%
1A4b Residential26%
1A4c Agriculture / Forestry / Fisheries0.3%
1) Only the emission from stationary combustion plants in the source categories is included.
0.0
0.5
1.0
1.5
2.0
2.5
3.0
3.5
1990
1991
1992
1993
1994
1995
1996
1997
1998
1999
2000
2001
2002
2003
2004
2005
2006
2007
2008
HC
B, k
g
1A1a Public electricity and heat production 1A1c Other energy industries
1A2 Industry 1A4a Commercial / Institutional
1A4b Residential 1A4c Agriculture / Forestry / Fisheries
Total
Total
Figure 35 HCB emission time-series, stationary combustion plants.
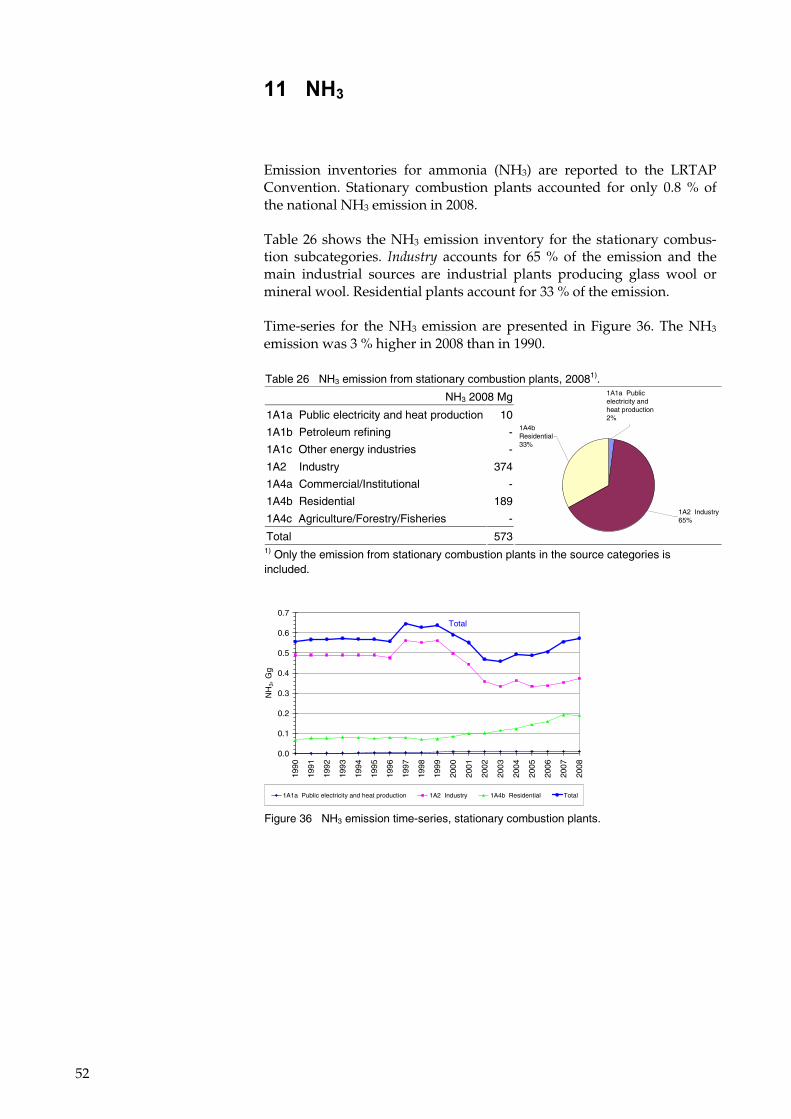
52
''� �3)�
Emission inventories for ammonia (NH3) are reported to the LRTAP Convention. Stationary combustion plants accounted for only 0.8 % of the national NH3 emission in 2008.
Table 26 shows the NH3 emission inventory for the stationary combus-tion subcategories. ������ accounts for 65 % of the emission and the main industrial sources are industrial plants producing glass wool or mineral wool. Residential plants account for 33 % of the emission.
Time-series for the NH3 emission are presented in Figure 36. The NH3 emission was 3 % higher in 2008 than in 1990.
Table 26 NH3 emission from stationary combustion plants, 20081).
NH3 2008 Mg
1A1a Public electricity and heat production 10
1A1b Petroleum refining -
1A1c Other energy industries -
1A2 Industry 374
1A4a Commercial/Institutional -
1A4b Residential 189
1A4c Agriculture/Forestry/Fisheries -
Total 573
1A2 Industry65%
1A4b Residential33%
1A1a Public electricity and heat production2%
1) Only the emission from stationary combustion plants in the source categories is included.
0.0
0.1
0.2
0.3
0.4
0.5
0.6
0.7
1990
1991
1992
1993
1994
1995
1996
1997
1998
1999
2000
2001
2002
2003
2004
2005
2006
2007
2008
NH
3, G
g
1A1a Public electricity and heat production 1A2 Industry 1A4b Residential Total
Total
Figure 36 NH3 emission time-series, stationary combustion plants.
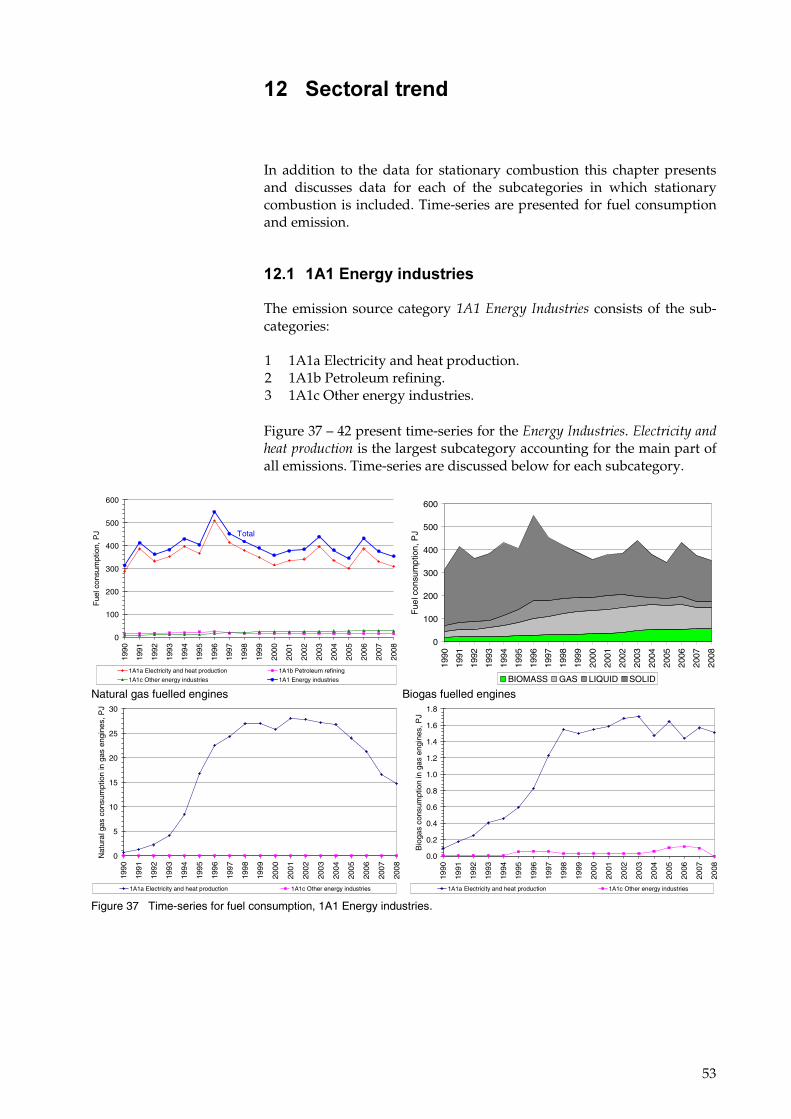
53
'�� $������ ����%�
In addition to the data for stationary combustion this chapter presents and discusses data for each of the subcategories in which stationary combustion is included. Time-series are presented for fuel consumption and emission.
'��'� '4'����&���%��������
The emission source category ����������� ������� consists of the sub-categories:
1 1A1a Electricity and heat production. 2 1A1b Petroleum refining. 3 1A1c Other energy industries. Figure 37 – 42 present time-series for the ��������������. ��������������������������� is the largest subcategory accounting for the main part of all emissions. Time-series are discussed below for each subcategory.
0
100
200
300
400
500
600
1990
1991
1992
1993
1994
1995
1996
1997
1998
1999
2000
2001
2002
2003
2004
2005
2006
2007
2008
Fue
l con
sum
ptio
n, P
J
1A1a Electricity and heat production 1A1b Petroleum refining
1A1c Other energy industries 1A1 Energy industries
Total
0
100
200
300
400
500
600
1990
1991
1992
1993
1994
1995
1996
1997
1998
1999
2000
2001
2002
2003
2004
2005
2006
2007
2008
Fue
l con
sum
ptio
n, P
J
BIOMASS GAS LIQUID SOLID Natural gas fuelled engines
0
5
10
15
20
25
30
1990
1991
1992
1993
1994
1995
1996
1997
1998
1999
2000
2001
2002
2003
2004
2005
2006
2007
2008
Nat
ural
gas
con
sum
ptio
n in
gas
eng
ines
, PJ
1A1a Electricity and heat production 1A1c Other energy industries
Biogas fuelled engines
0.0
0.2
0.4
0.6
0.8
1.0
1.2
1.4
1.6
1.8
1990
1991
1992
1993
1994
1995
1996
1997
1998
1999
2000
2001
2002
2003
2004
2005
2006
2007
2008
Bio
gas
cons
umpt
ion
in g
as e
ngin
es, P
J
1A1a Electricity and heat production 1A1c Other energy industries Figure 37 Time-series for fuel consumption, 1A1 Energy industries.
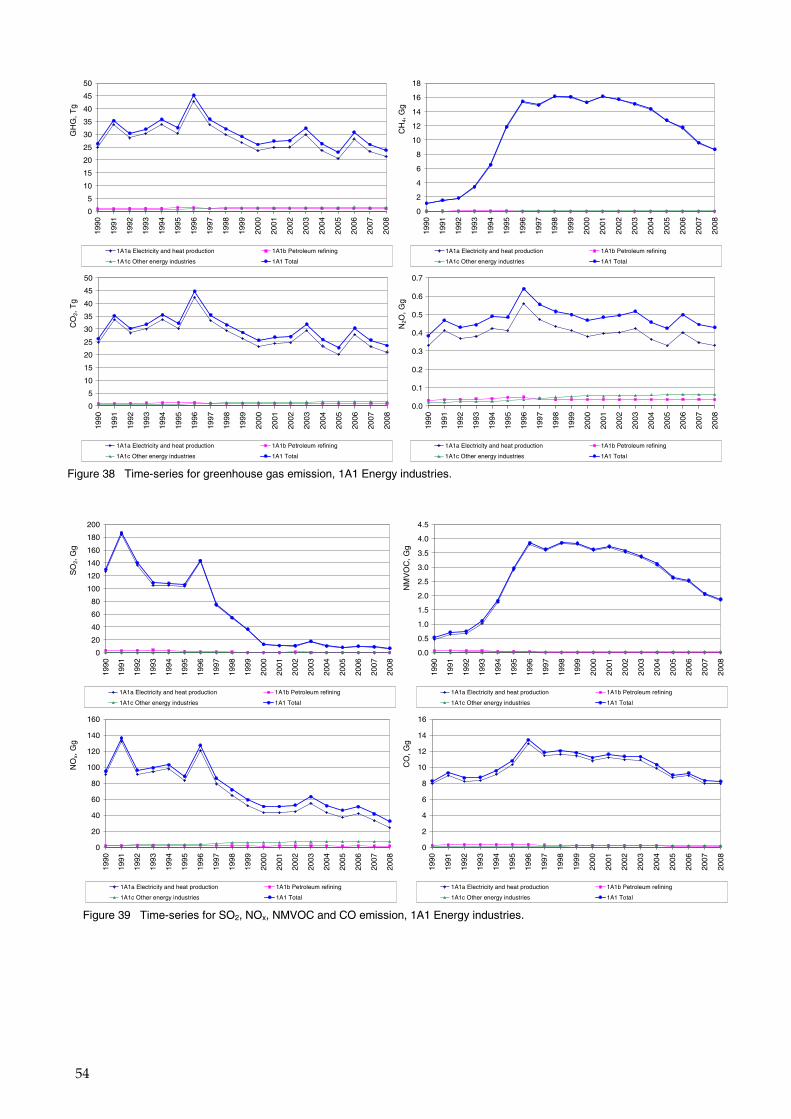
54
GH
G, T
g___
__
0
5
10
15
20
25
30
35
40
45
50
1990
1991
1992
1993
1994
1995
1996
1997
1998
1999
2000
2001
2002
2003
2004
2005
2006
2007
2008
1A1a Electricity and heat production 1A1b Petroleum refining
1A1c Other energy industries 1A1 Total
CH
4, G
g___
__
0
2
4
6
8
10
12
14
16
18
1990
1991
1992
1993
1994
1995
1996
1997
1998
1999
2000
2001
2002
2003
2004
2005
2006
2007
2008
1A1a Electricity and heat production 1A1b Petroleum refining
1A1c Other energy industries 1A1 Total
CO
2, T
g___
__
0
5
10
15
20
25
30
35
40
45
50
1990
1991
1992
1993
1994
1995
1996
1997
1998
1999
2000
2001
2002
2003
2004
2005
2006
2007
2008
1A1a Electricity and heat production 1A1b Petroleum refining
1A1c Other energy industries 1A1 Total
N2O
, Gg_
____
0.0
0.1
0.2
0.3
0.4
0.5
0.6
0.7
1990
1991
1992
1993
1994
1995
1996
1997
1998
1999
2000
2001
2002
2003
2004
2005
2006
2007
2008
1A1a Electricity and heat production 1A1b Petroleum refining
1A1c Other energy industries 1A1 Total
Figure 38 Time-series for greenhouse gas emission, 1A1 Energy industries.
SO
2, G
g___
__
0
20
40
60
80
100
120
140
160
180
200
1990
1991
1992
1993
1994
1995
1996
1997
1998
1999
2000
2001
2002
2003
2004
2005
2006
2007
2008
1A1a Electricity and heat production 1A1b Petroleum refining
1A1c Other energy industries 1A1 Total
NM
VO
C, G
g___
__
0.0
0.5
1.0
1.5
2.0
2.5
3.0
3.5
4.0
4.5
1990
1991
1992
1993
1994
1995
1996
1997
1998
1999
2000
2001
2002
2003
2004
2005
2006
2007
2008
1A1a Electricity and heat production 1A1b Petroleum refining
1A1c Other energy industries 1A1 Total
NO
x, G
g___
__
0
20
40
60
80
100
120
140
160
1990
1991
1992
1993
1994
1995
1996
1997
1998
1999
2000
2001
2002
2003
2004
2005
2006
2007
2008
1A1a Electricity and heat production 1A1b Petroleum refining
1A1c Other energy industries 1A1 Total
CO
, Gg_
____
0
2
4
6
8
10
12
14
16
1990
1991
1992
1993
1994
1995
1996
1997
1998
1999
2000
2001
2002
2003
2004
2005
2006
2007
2008
1A1a Electricity and heat production 1A1b Petroleum refining
1A1c Other energy industries 1A1 Total
Figure 39 Time-series for SO2, NOx, NMVOC and CO emission, 1A1 Energy industries.
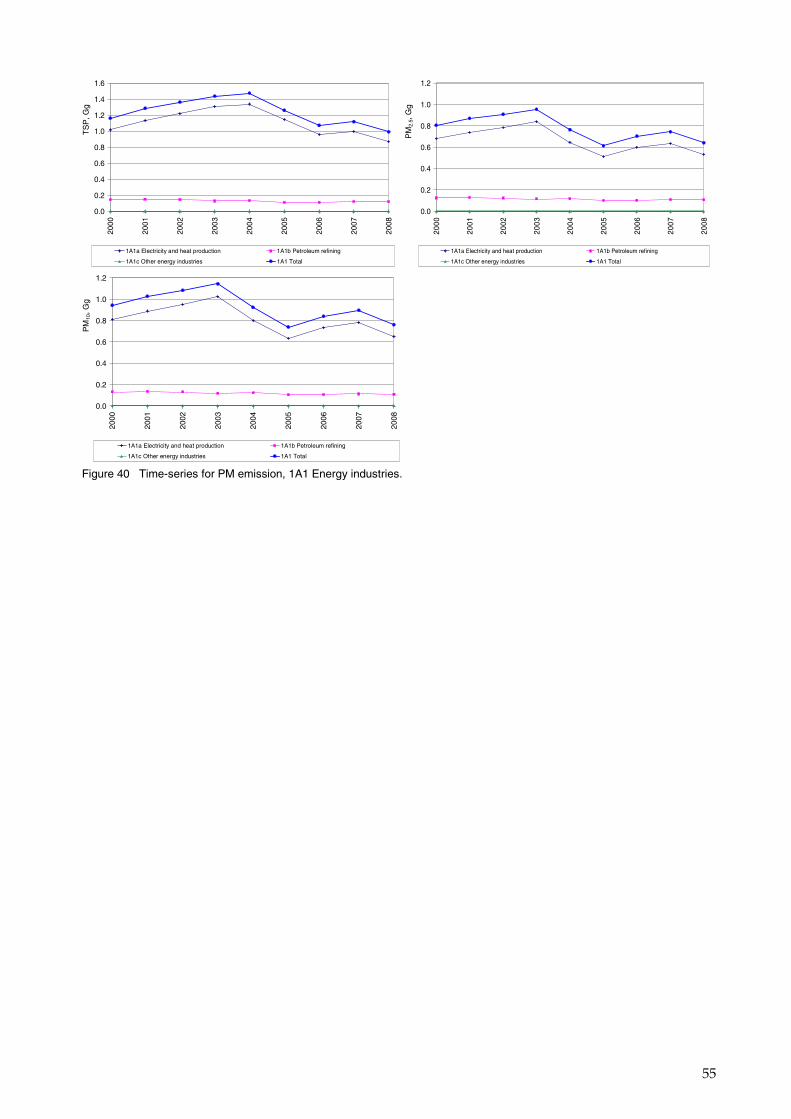
55
TS
P, G
g___
__
0.0
0.2
0.4
0.6
0.8
1.0
1.2
1.4
1.6
2000
2001
2002
2003
2004
2005
2006
2007
2008
1A1a Electricity and heat production 1A1b Petroleum refining
1A1c Other energy industries 1A1 Total
PM
2.5,
Gg_
____
0.0
0.2
0.4
0.6
0.8
1.0
1.2
2000
2001
2002
2003
2004
2005
2006
2007
2008
1A1a Electricity and heat production 1A1b Petroleum refining
1A1c Other energy industries 1A1 Total
PM
10, G
g___
__
0.0
0.2
0.4
0.6
0.8
1.0
1.2
2000
2001
2002
2003
2004
2005
2006
2007
2008
1A1a Electricity and heat production 1A1b Petroleum refining
1A1c Other energy industries 1A1 Total
Figure 40 Time-series for PM emission, 1A1 Energy industries.
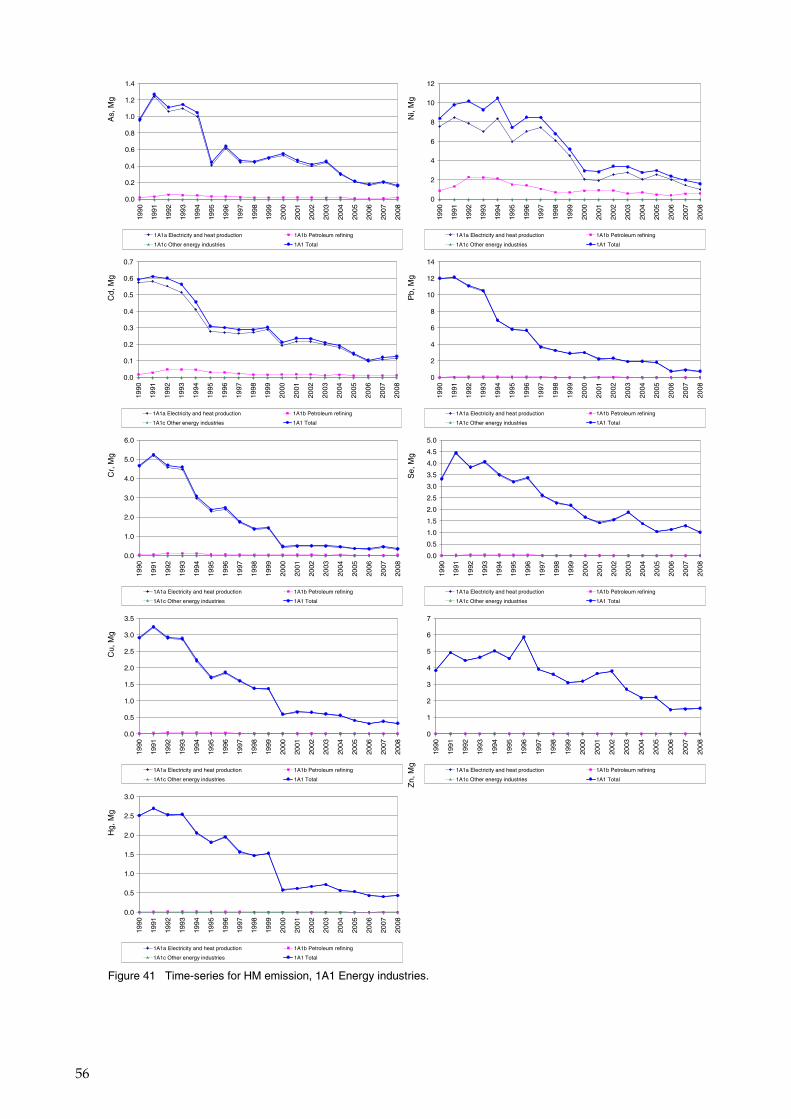
56
As,
Mg_
____
0.0
0.2
0.4
0.6
0.8
1.0
1.2
1.4
1990
1991
1992
1993
1994
1995
1996
1997
1998
1999
2000
2001
2002
2003
2004
2005
2006
2007
2008
1A1a Electricity and heat production 1A1b Petroleum refining
1A1c Other energy industries 1A1 Total
Ni,
Mg_
____
0
2
4
6
8
10
12
1990
1991
1992
1993
1994
1995
1996
1997
1998
1999
2000
2001
2002
2003
2004
2005
2006
2007
2008
1A1a Electricity and heat production 1A1b Petroleum refining
1A1c Other energy industries 1A1 Total
Cd,
Mg_
____
0.0
0.1
0.2
0.3
0.4
0.5
0.6
0.7
1990
1991
1992
1993
1994
1995
1996
1997
1998
1999
2000
2001
2002
2003
2004
2005
2006
2007
2008
1A1a Electricity and heat production 1A1b Petroleum refining
1A1c Other energy industries 1A1 Total
Pb,
Mg_
____
0
2
4
6
8
10
12
14
1990
1991
1992
1993
1994
1995
1996
1997
1998
1999
2000
2001
2002
2003
2004
2005
2006
2007
2008
1A1a Electricity and heat production 1A1b Petroleum refining
1A1c Other energy industries 1A1 Total
Cr,
Mg_
____
0.0
1.0
2.0
3.0
4.0
5.0
6.0
1990
1991
1992
1993
1994
1995
1996
1997
1998
1999
2000
2001
2002
2003
2004
2005
2006
2007
2008
1A1a Electricity and heat production 1A1b Petroleum refining
1A1c Other energy industries 1A1 Total
Se,
Mg_
____
0.0
0.5
1.0
1.5
2.0
2.5
3.0
3.5
4.0
4.5
5.019
90
1991
1992
1993
1994
1995
1996
1997
1998
1999
2000
2001
2002
2003
2004
2005
2006
2007
2008
1A1a Electricity and heat production 1A1b Petroleum refining
1A1c Other energy industries 1A1 Total
Cu,
Mg_
____
0.0
0.5
1.0
1.5
2.0
2.5
3.0
3.5
1990
1991
1992
1993
1994
1995
1996
1997
1998
1999
2000
2001
2002
2003
2004
2005
2006
2007
2008
1A1a Electricity and heat production 1A1b Petroleum refining
1A1c Other energy industries 1A1 Total Zn,
Mg_
____
0
1
2
3
4
5
6
7
1990
1991
1992
1993
1994
1995
1996
1997
1998
1999
2000
2001
2002
2003
2004
2005
2006
2007
2008
1A1a Electricity and heat production 1A1b Petroleum refining
1A1c Other energy industries 1A1 Total
Hg,
Mg_
____
0.0
0.5
1.0
1.5
2.0
2.5
3.0
1990
1991
1992
1993
1994
1995
1996
1997
1998
1999
2000
2001
2002
2003
2004
2005
2006
2007
2008
1A1a Electricity and heat production 1A1b Petroleum refining
1A1c Other energy industries 1A1 Total
Figure 41 Time-series for HM emission, 1A1 Energy industries.
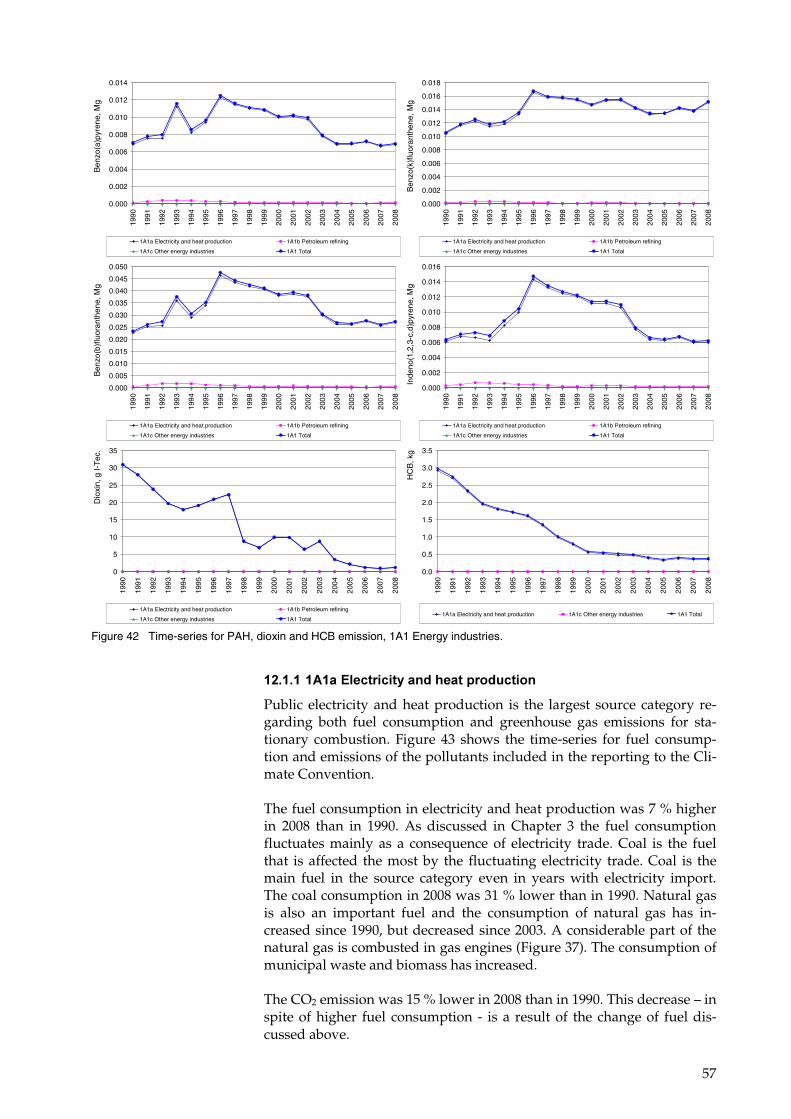
57
Ben
zo(a
)pyr
ene,
Mg_
___
0.000
0.002
0.004
0.006
0.008
0.010
0.012
0.014
1990
1991
1992
1993
1994
1995
1996
1997
1998
1999
2000
2001
2002
2003
2004
2005
2006
2007
2008
1A1a Electricity and heat production 1A1b Petroleum refining
1A1c Other energy industries 1A1 Total
Ben
zo(k
)flu
oran
then
e, M
g___
_
0.000
0.002
0.004
0.006
0.008
0.010
0.012
0.014
0.016
0.018
1990
1991
1992
1993
1994
1995
1996
1997
1998
1999
2000
2001
2002
2003
2004
2005
2006
2007
2008
1A1a Electricity and heat production 1A1b Petroleum refining
1A1c Other energy industries 1A1 Total
Ben
zo(b
)flu
oran
then
e, M
g___
_
0.000
0.005
0.010
0.015
0.020
0.025
0.030
0.035
0.040
0.045
0.050
1990
1991
1992
1993
1994
1995
1996
1997
1998
1999
2000
2001
2002
2003
2004
2005
2006
2007
2008
1A1a Electricity and heat production 1A1b Petroleum refining
1A1c Other energy industries 1A1 Total
Inde
no(1
,2,3
-c,d
)pyr
ene,
Mg_
___
0.000
0.002
0.004
0.006
0.008
0.010
0.012
0.014
0.016
1990
1991
1992
1993
1994
1995
1996
1997
1998
1999
2000
2001
2002
2003
2004
2005
2006
2007
2008
1A1a Electricity and heat production 1A1b Petroleum refining
1A1c Other energy industries 1A1 Total
Dio
xin,
g I-
Tec
.
0
5
10
15
20
25
30
35
1990
1991
1992
1993
1994
1995
1996
1997
1998
1999
2000
2001
2002
2003
2004
2005
2006
2007
2008
1A1a Electricity and heat production 1A1b Petroleum refining
1A1c Other energy industries 1A1 Total
HC
B, k
g
0.0
0.5
1.0
1.5
2.0
2.5
3.0
3.5
1990
1991
1992
1993
1994
1995
1996
1997
1998
1999
2000
2001
2002
2003
2004
2005
2006
2007
2008
1A1a Electricity and heat production 1A1c Other energy industries 1A1 Total
Figure 42 Time-series for PAH, dioxin and HCB emission, 1A1 Energy industries.
'��'�'�'4'��� �����������%��������%������
Public electricity and heat production is the largest source category re-garding both fuel consumption and greenhouse gas emissions for sta-tionary combustion. Figure 43 shows the time-series for fuel consump-tion and emissions of the pollutants included in the reporting to the Cli-mate Convention.
The fuel consumption in electricity and heat production was 7 % higher in 2008 than in 1990. As discussed in Chapter 3 the fuel consumption fluctuates mainly as a consequence of electricity trade. Coal is the fuel that is affected the most by the fluctuating electricity trade. Coal is the main fuel in the source category even in years with electricity import. The coal consumption in 2008 was 31 % lower than in 1990. Natural gas is also an important fuel and the consumption of natural gas has in-creased since 1990, but decreased since 2003. A considerable part of the natural gas is combusted in gas engines (Figure 37). The consumption of municipal waste and biomass has increased.
The CO2 emission was 15 % lower in 2008 than in 1990. This decrease – in spite of higher fuel consumption - is a result of the change of fuel dis-cussed above.
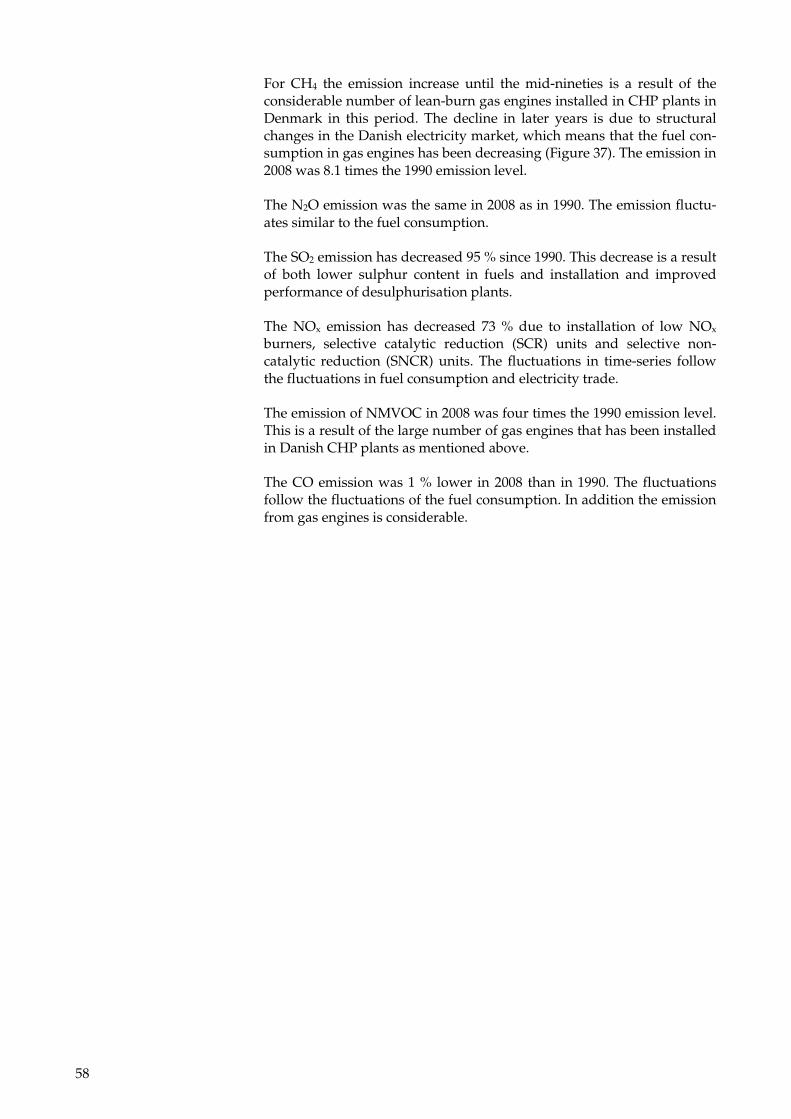
58
For CH4 the emission increase until the mid-nineties is a result of the considerable number of lean-burn gas engines installed in CHP plants in Denmark in this period. The decline in later years is due to structural changes in the Danish electricity market, which means that the fuel con-sumption in gas engines has been decreasing (Figure 37). The emission in 2008 was 8.1 times the 1990 emission level.
The N2O emission was the same in 2008 as in 1990. The emission fluctu-ates similar to the fuel consumption.
The SO2 emission has decreased 95 % since 1990. This decrease is a result of both lower sulphur content in fuels and installation and improved performance of desulphurisation plants.
The NOx emission has decreased 73 % due to installation of low NOx burners, selective catalytic reduction (SCR) units and selective non-catalytic reduction (SNCR) units. The fluctuations in time-series follow the fluctuations in fuel consumption and electricity trade.
The emission of NMVOC in 2008 was four times the 1990 emission level. This is a result of the large number of gas engines that has been installed in Danish CHP plants as mentioned above.
The CO emission was 1 % lower in 2008 than in 1990. The fluctuations follow the fluctuations of the fuel consumption. In addition the emission from gas engines is considerable.
59
0
100
200
300
400
500
600
1990
1991
1992
1993
1994
1995
1996
1997
1998
1999
2000
2001
2002
2003
2004
2005
2006
2007
2008
Fue
l con
sum
ptio
n, P
J
WOOD STRAW FISH & RAPE OIL BIOGAS
BIO PROD GAS MUNICIP. WASTES NATURAL GAS PETROLEUM COKE
RESIDUAL OIL GAS OIL ORIMULSION LPG
REFINERY GAS COAL
SO
2, G
g___
_
0
20
40
60
80
100
120
140
160
180
200
1990
1991
1992
1993
1994
1995
1996
1997
1998
1999
2000
2001
2002
2003
2004
2005
2006
2007
2008
CO
2, T
g___
__
0
5
10
15
20
25
30
35
40
45
1990
1991
1992
1993
1994
1995
1996
1997
1998
1999
2000
2001
2002
2003
2004
2005
2006
2007
2008
NO
x, G
g___
__
0
20
40
60
80
100
120
140
1990
1991
1992
1993
1994
1995
1996
1997
1998
1999
2000
2001
2002
2003
2004
2005
2006
2007
2008
CH
4, G
g___
__
0
2
4
6
8
10
12
14
16
18
1990
1991
1992
1993
1994
1995
1996
1997
1998
1999
2000
2001
2002
2003
2004
2005
2006
2007
2008
NM
VO
C, G
g___
__
0.0
0.5
1.0
1.5
2.0
2.5
3.0
3.5
4.0
4.5
1990
1991
1992
1993
1994
1995
1996
1997
1998
1999
2000
2001
2002
2003
2004
2005
2006
2007
2008
N2O
, Gg_
____
0.0
0.1
0.2
0.3
0.4
0.5
0.6
1990
1991
1992
1993
1994
1995
1996
1997
1998
1999
2000
2001
2002
2003
2004
2005
2006
2007
2008
CO
, Gg_
____
0
2
4
6
8
10
12
14
1990
1991
1992
1993
1994
1995
1996
1997
1998
1999
2000
2001
2002
2003
2004
2005
2006
2007
2008
Figure 43 Time-series for 1A1a Electricity and heat production
'��'���'4'��#���� ���������&�
Petroleum refining is a small source category regarding both fuel con-sumption and greenhouse gas emissions for stationary combustion. There are presently only two refineries operating in Denmark. Figure 44 shows the time-series for fuel consumption and emissions.
The significant decrease in both fuel consumption and emissions in 1996 is a result of the closure of a third refinery.
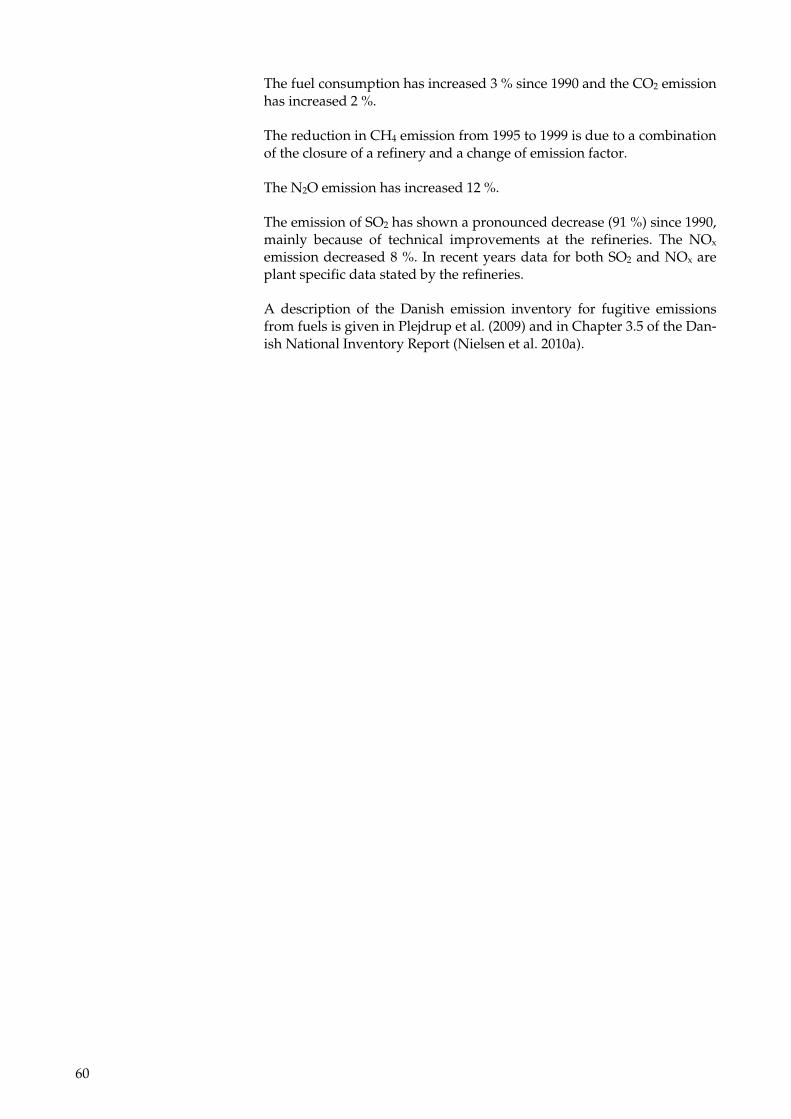
60
The fuel consumption has increased 3 % since 1990 and the CO2 emission has increased 2 %.
The reduction in CH4 emission from 1995 to 1999 is due to a combination of the closure of a refinery and a change of emission factor.
The N2O emission has increased 12 %.
The emission of SO2 has shown a pronounced decrease (91 %) since 1990, mainly because of technical improvements at the refineries. The NOx emission decreased 8 %. In recent years data for both SO2 and NOx are plant specific data stated by the refineries.
A description of the Danish emission inventory for fugitive emissions from fuels is given in Plejdrup et al. (2009) and in Chapter 3.5 of the Dan-ish National Inventory Report (Nielsen et al. 2010a).
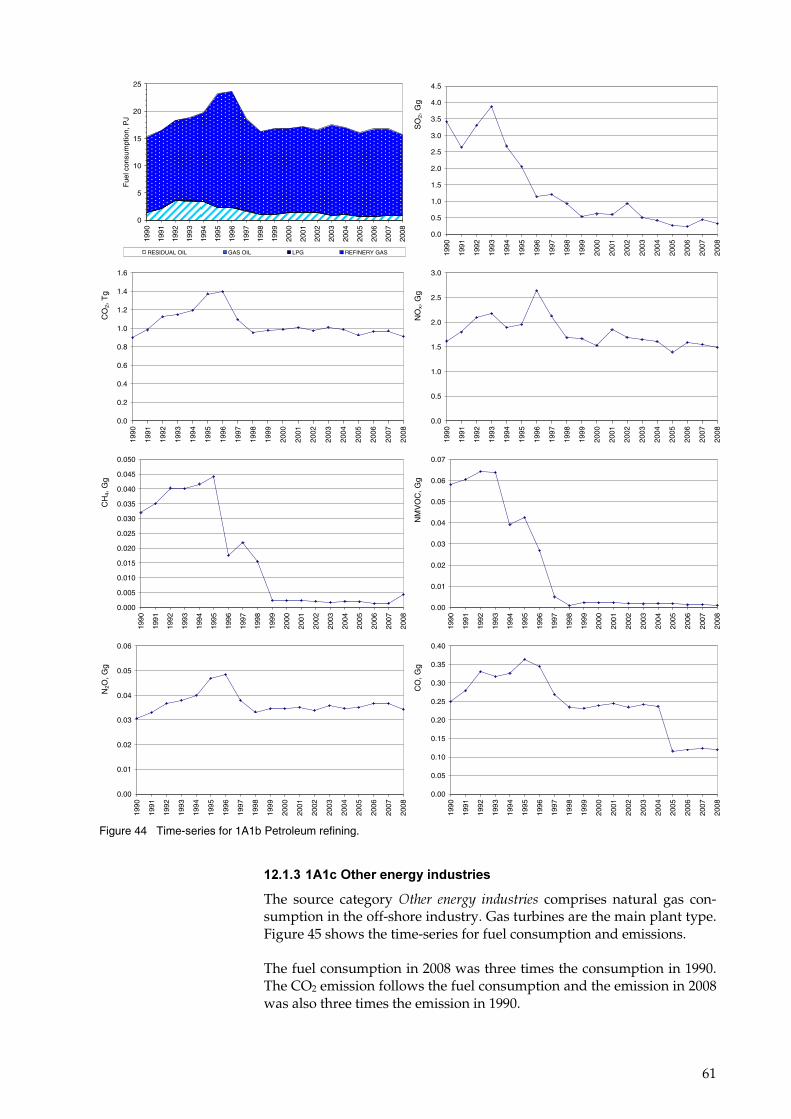
61
0
5
10
15
20
25
1990
1991
1992
1993
1994
1995
1996
1997
1998
1999
2000
2001
2002
2003
2004
2005
2006
2007
2008
Fue
l con
sum
ptio
n, P
J
RESIDUAL OIL GAS OIL LPG REFINERY GAS
SO
2, G
g___
_
0.0
0.5
1.0
1.5
2.0
2.5
3.0
3.5
4.0
4.5
1990
1991
1992
1993
1994
1995
1996
1997
1998
1999
2000
2001
2002
2003
2004
2005
2006
2007
2008
CO
2, T
g___
__
0.0
0.2
0.4
0.6
0.8
1.0
1.2
1.4
1.6
1990
1991
1992
1993
1994
1995
1996
1997
1998
1999
2000
2001
2002
2003
2004
2005
2006
2007
2008
NO
x, G
g___
__
0.0
0.5
1.0
1.5
2.0
2.5
3.0
1990
1991
1992
1993
1994
1995
1996
1997
1998
1999
2000
2001
2002
2003
2004
2005
2006
2007
2008
CH
4, G
g___
__
0.000
0.005
0.010
0.015
0.020
0.025
0.030
0.035
0.040
0.045
0.050
1990
1991
1992
1993
1994
1995
1996
1997
1998
1999
2000
2001
2002
2003
2004
2005
2006
2007
2008
NM
VO
C, G
g___
__
0.00
0.01
0.02
0.03
0.04
0.05
0.06
0.0719
90
1991
1992
1993
1994
1995
1996
1997
1998
1999
2000
2001
2002
2003
2004
2005
2006
2007
2008
N2O
, Gg_
____
0.00
0.01
0.02
0.03
0.04
0.05
0.06
1990
1991
1992
1993
1994
1995
1996
1997
1998
1999
2000
2001
2002
2003
2004
2005
2006
2007
2008
CO
, Gg_
____
0.00
0.05
0.10
0.15
0.20
0.25
0.30
0.35
0.40
1990
1991
1992
1993
1994
1995
1996
1997
1998
1999
2000
2001
2002
2003
2004
2005
2006
2007
2008
Figure 44 Time-series for 1A1b Petroleum refining.
'��'�)�'4'��,�������&���%��������
The source category ����� ������� ������� comprises natural gas con-sumption in the off-shore industry. Gas turbines are the main plant type. Figure 45 shows the time-series for fuel consumption and emissions.
The fuel consumption in 2008 was three times the consumption in 1990. The CO2 emission follows the fuel consumption and the emission in 2008 was also three times the emission in 1990.
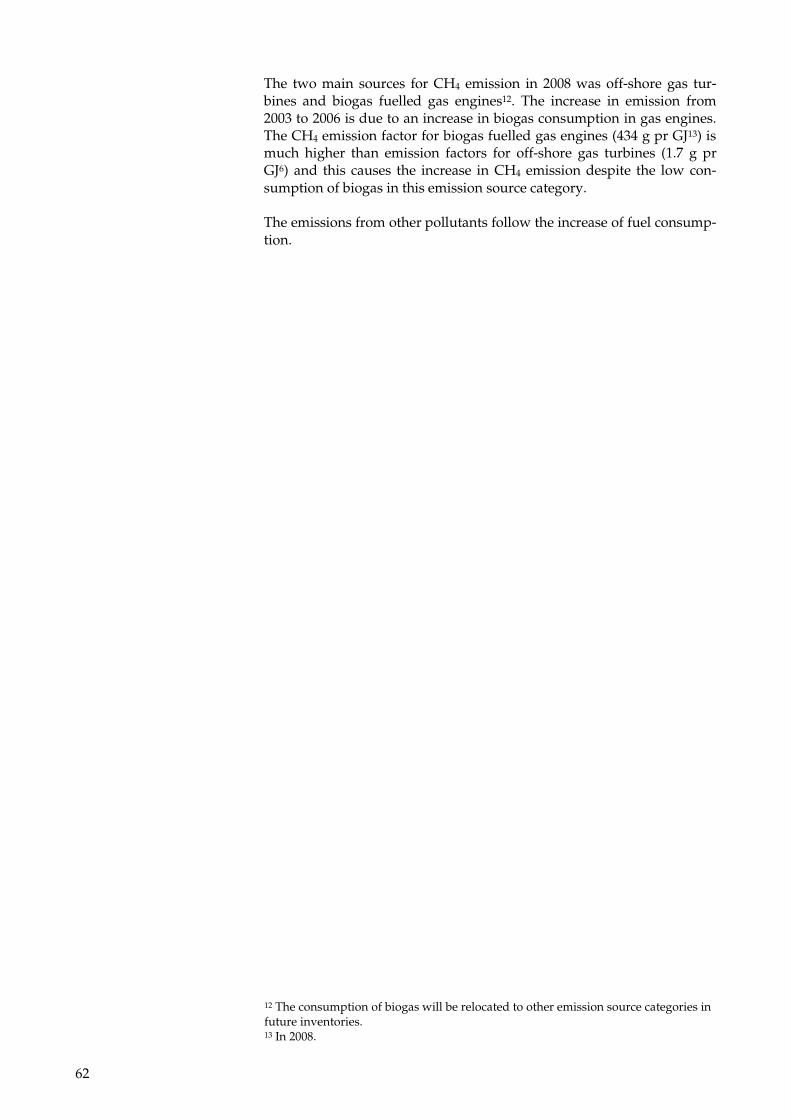
62
The two main sources for CH4 emission in 2008 was off-shore gas tur-bines and biogas fuelled gas engines12. The increase in emission from 2003 to 2006 is due to an increase in biogas consumption in gas engines. The CH4 emission factor for biogas fuelled gas engines (434 g pr GJ13) is much higher than emission factors for off-shore gas turbines (1.7 g pr GJ6) and this causes the increase in CH4 emission despite the low con-sumption of biogas in this emission source category.
The emissions from other pollutants follow the increase of fuel consump-tion.
12 The consumption of biogas will be relocated to other emission source categories in future inventories. 13 In 2008.
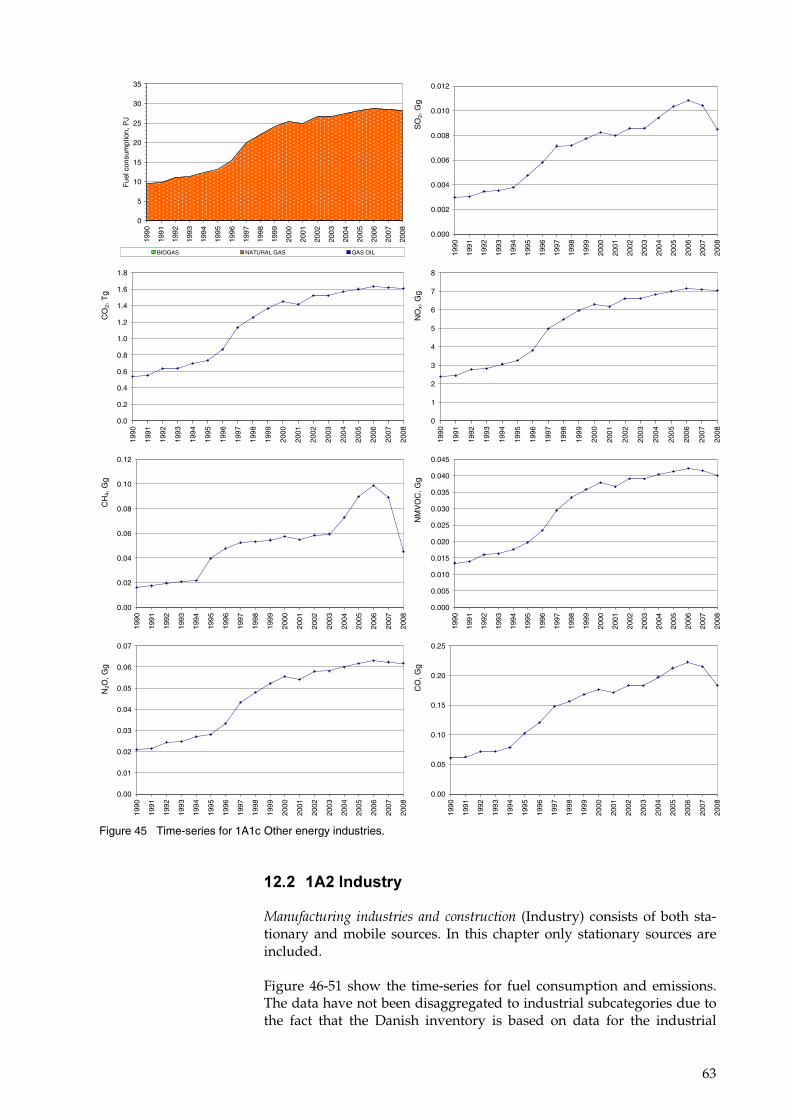
63
0
5
10
15
20
25
30
35
1990
1991
1992
1993
1994
1995
1996
1997
1998
1999
2000
2001
2002
2003
2004
2005
2006
2007
2008
Fue
l con
sum
ptio
n, P
J
BIOGAS NATURAL GAS GAS OIL
SO
2, G
g___
_
0.000
0.002
0.004
0.006
0.008
0.010
0.012
1990
1991
1992
1993
1994
1995
1996
1997
1998
1999
2000
2001
2002
2003
2004
2005
2006
2007
2008
CO
2, T
g___
__
0.0
0.2
0.4
0.6
0.8
1.0
1.2
1.4
1.6
1.8
1990
1991
1992
1993
1994
1995
1996
1997
1998
1999
2000
2001
2002
2003
2004
2005
2006
2007
2008
NO
x, G
g___
__
0
1
2
3
4
5
6
7
8
1990
1991
1992
1993
1994
1995
1996
1997
1998
1999
2000
2001
2002
2003
2004
2005
2006
2007
2008
CH
4, G
g___
__
0.00
0.02
0.04
0.06
0.08
0.10
0.12
1990
1991
1992
1993
1994
1995
1996
1997
1998
1999
2000
2001
2002
2003
2004
2005
2006
2007
2008
NM
VO
C, G
g___
__
0.000
0.005
0.010
0.015
0.020
0.025
0.030
0.035
0.040
0.04519
90
1991
1992
1993
1994
1995
1996
1997
1998
1999
2000
2001
2002
2003
2004
2005
2006
2007
2008
N2O
, Gg_
____
0.00
0.01
0.02
0.03
0.04
0.05
0.06
0.07
1990
1991
1992
1993
1994
1995
1996
1997
1998
1999
2000
2001
2002
2003
2004
2005
2006
2007
2008
CO
, Gg_
____
0.00
0.05
0.10
0.15
0.20
0.25
1990
1991
1992
1993
1994
1995
1996
1997
1998
1999
2000
2001
2002
2003
2004
2005
2006
2007
2008
Figure 45 Time-series for 1A1c Other energy industries.
'���� '4���%������
���!�������� �������� ���� ��������� (Industry) consists of both sta-tionary and mobile sources. In this chapter only stationary sources are included.
Figure 46-51 show the time-series for fuel consumption and emissions. The data have not been disaggregated to industrial subcategories due to the fact that the Danish inventory is based on data for the industrial
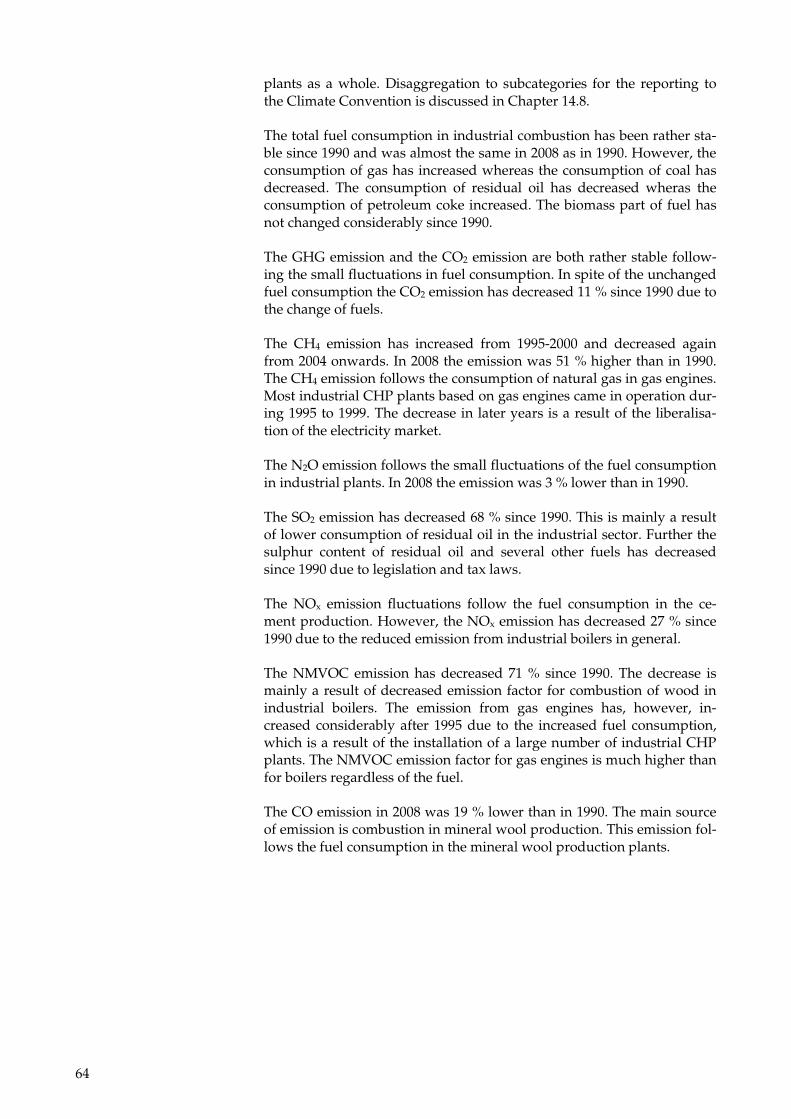
64
plants as a whole. Disaggregation to subcategories for the reporting to the Climate Convention is discussed in Chapter 14.8.
The total fuel consumption in industrial combustion has been rather sta-ble since 1990 and was almost the same in 2008 as in 1990. However, the consumption of gas has increased whereas the consumption of coal has decreased. The consumption of residual oil has decreased wheras the consumption of petroleum coke increased. The biomass part of fuel has not changed considerably since 1990.
The GHG emission and the CO2 emission are both rather stable follow-ing the small fluctuations in fuel consumption. In spite of the unchanged fuel consumption the CO2 emission has decreased 11 % since 1990 due to the change of fuels.
The CH4 emission has increased from 1995-2000 and decreased again from 2004 onwards. In 2008 the emission was 51 % higher than in 1990. The CH4 emission follows the consumption of natural gas in gas engines. Most industrial CHP plants based on gas engines came in operation dur-ing 1995 to 1999. The decrease in later years is a result of the liberalisa-tion of the electricity market.
The N2O emission follows the small fluctuations of the fuel consumption in industrial plants. In 2008 the emission was 3 % lower than in 1990.
The SO2 emission has decreased 68 % since 1990. This is mainly a result of lower consumption of residual oil in the industrial sector. Further the sulphur content of residual oil and several other fuels has decreased since 1990 due to legislation and tax laws.
The NOx emission fluctuations follow the fuel consumption in the ce-ment production. However, the NOx emission has decreased 27 % since 1990 due to the reduced emission from industrial boilers in general.
The NMVOC emission has decreased 71 % since 1990. The decrease is mainly a result of decreased emission factor for combustion of wood in industrial boilers. The emission from gas engines has, however, in-creased considerably after 1995 due to the increased fuel consumption, which is a result of the installation of a large number of industrial CHP plants. The NMVOC emission factor for gas engines is much higher than for boilers regardless of the fuel.
The CO emission in 2008 was 19 % lower than in 1990. The main source of emission is combustion in mineral wool production. This emission fol-lows the fuel consumption in the mineral wool production plants.
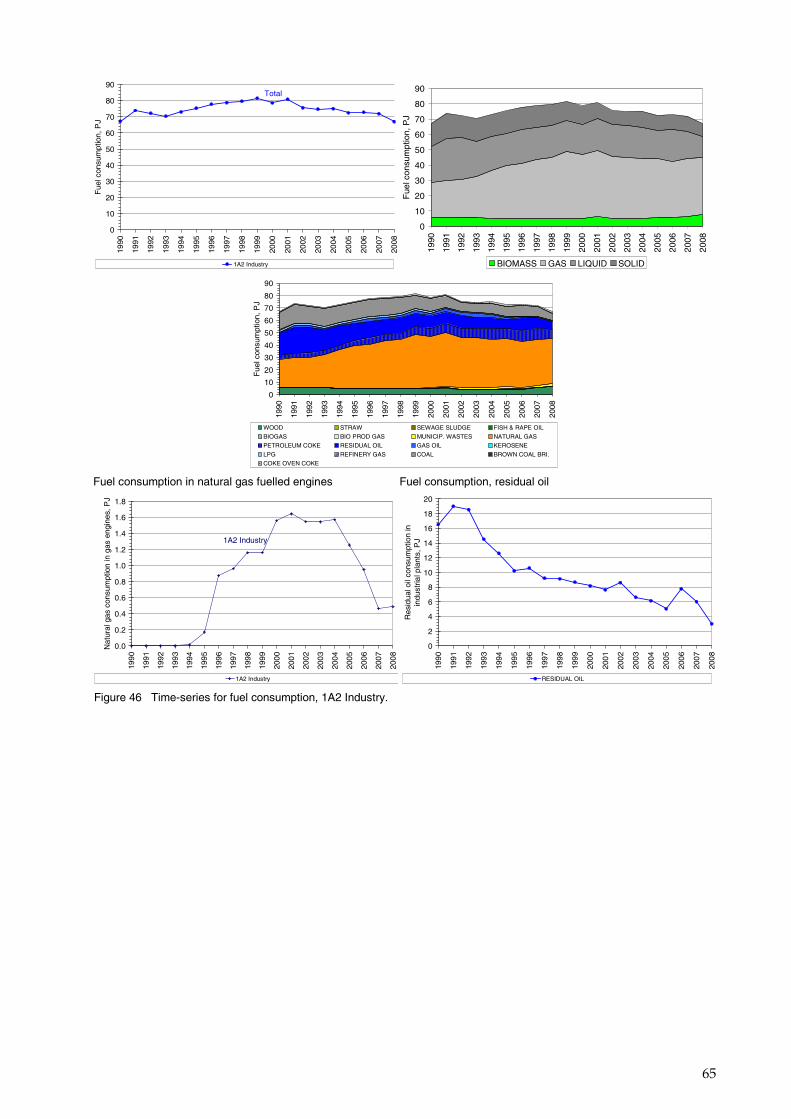
65
0
10
20
30
40
50
60
70
80
90
1990
1991
1992
1993
1994
1995
1996
1997
1998
1999
2000
2001
2002
2003
2004
2005
2006
2007
2008
Fue
l con
sum
ptio
n, P
J
1A2 Industry
Total
0
10
20
30
40
50
60
70
80
90
1990
1991
1992
1993
1994
1995
1996
1997
1998
1999
2000
2001
2002
2003
2004
2005
2006
2007
2008
Fue
l con
sum
ptio
n, P
J
BIOMASS GAS LIQUID SOLID
0
10
20
30
40
50
60
70
80
9019
90
1991
1992
1993
1994
1995
1996
1997
1998
1999
2000
2001
2002
2003
2004
2005
2006
2007
2008
Fue
l con
sum
ptio
n, P
J
WOOD STRAW SEWAGE SLUDGE FISH & RAPE OIL
BIOGAS BIO PROD GAS MUNICIP. WASTES NATURAL GAS
PETROLEUM COKE RESIDUAL OIL GAS OIL KEROSENE
LPG REFINERY GAS COAL BROWN COAL BRI.
COKE OVEN COKE Fuel consumption in natural gas fuelled engines Fuel consumption, residual oil
1A2 Industry
0.0
0.2
0.4
0.6
0.8
1.0
1.2
1.4
1.6
1.8
1990
1991
1992
1993
1994
1995
1996
1997
1998
1999
2000
2001
2002
2003
2004
2005
2006
2007
2008
Nat
ural
gas
con
sum
ptio
n in
gas
eng
ines
, PJ
1A2 Industry
0
2
4
6
8
10
12
14
16
18
20
1990
1991
1992
1993
1994
1995
1996
1997
1998
1999
2000
2001
2002
2003
2004
2005
2006
2007
2008
Res
idua
l oil
cons
umpt
ion
in
indu
stria
l pla
nts,
PJ
RESIDUAL OIL Figure 46 Time-series for fuel consumption, 1A2 Industry.
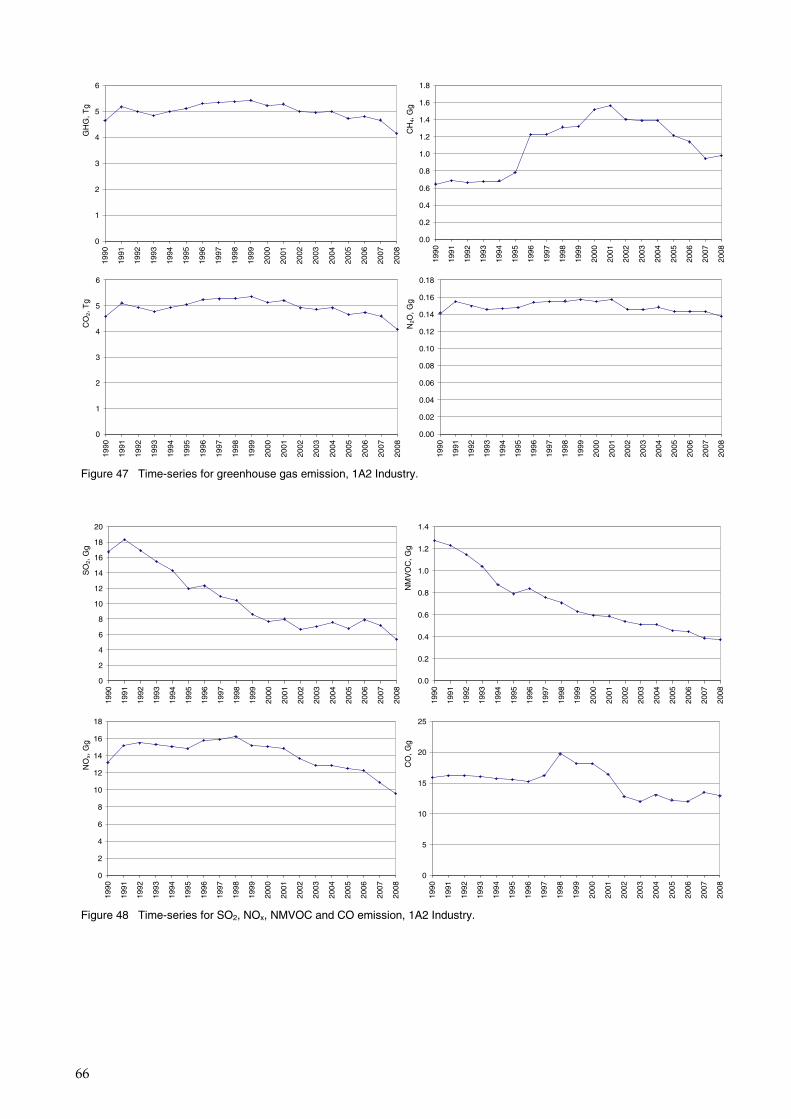
66
GH
G, T
g___
__
0
1
2
3
4
5
6
1990
1991
1992
1993
1994
1995
1996
1997
1998
1999
2000
2001
2002
2003
2004
2005
2006
2007
2008
CH
4, G
g___
__
0.0
0.2
0.4
0.6
0.8
1.0
1.2
1.4
1.6
1.8
1990
1991
1992
1993
1994
1995
1996
1997
1998
1999
2000
2001
2002
2003
2004
2005
2006
2007
2008
CO
2, T
g___
__
0
1
2
3
4
5
6
1990
1991
1992
1993
1994
1995
1996
1997
1998
1999
2000
2001
2002
2003
2004
2005
2006
2007
2008
N2O
, Gg_
____
0.00
0.02
0.04
0.06
0.08
0.10
0.12
0.14
0.16
0.18
1990
1991
1992
1993
1994
1995
1996
1997
1998
1999
2000
2001
2002
2003
2004
2005
2006
2007
2008
Figure 47 Time-series for greenhouse gas emission, 1A2 Industry.
SO
2, G
g___
__
0
2
4
6
8
10
12
14
16
18
20
1990
1991
1992
1993
1994
1995
1996
1997
1998
1999
2000
2001
2002
2003
2004
2005
2006
2007
2008
NM
VO
C, G
g___
__
0.0
0.2
0.4
0.6
0.8
1.0
1.2
1.4
1990
1991
1992
1993
1994
1995
1996
1997
1998
1999
2000
2001
2002
2003
2004
2005
2006
2007
2008
NO
x, G
g___
__
0
2
4
6
8
10
12
14
16
18
1990
1991
1992
1993
1994
1995
1996
1997
1998
1999
2000
2001
2002
2003
2004
2005
2006
2007
2008
CO
, Gg_
____
0
5
10
15
20
25
1990
1991
1992
1993
1994
1995
1996
1997
1998
1999
2000
2001
2002
2003
2004
2005
2006
2007
2008
Figure 48 Time-series for SO2, NOx, NMVOC and CO emission, 1A2 Industry.
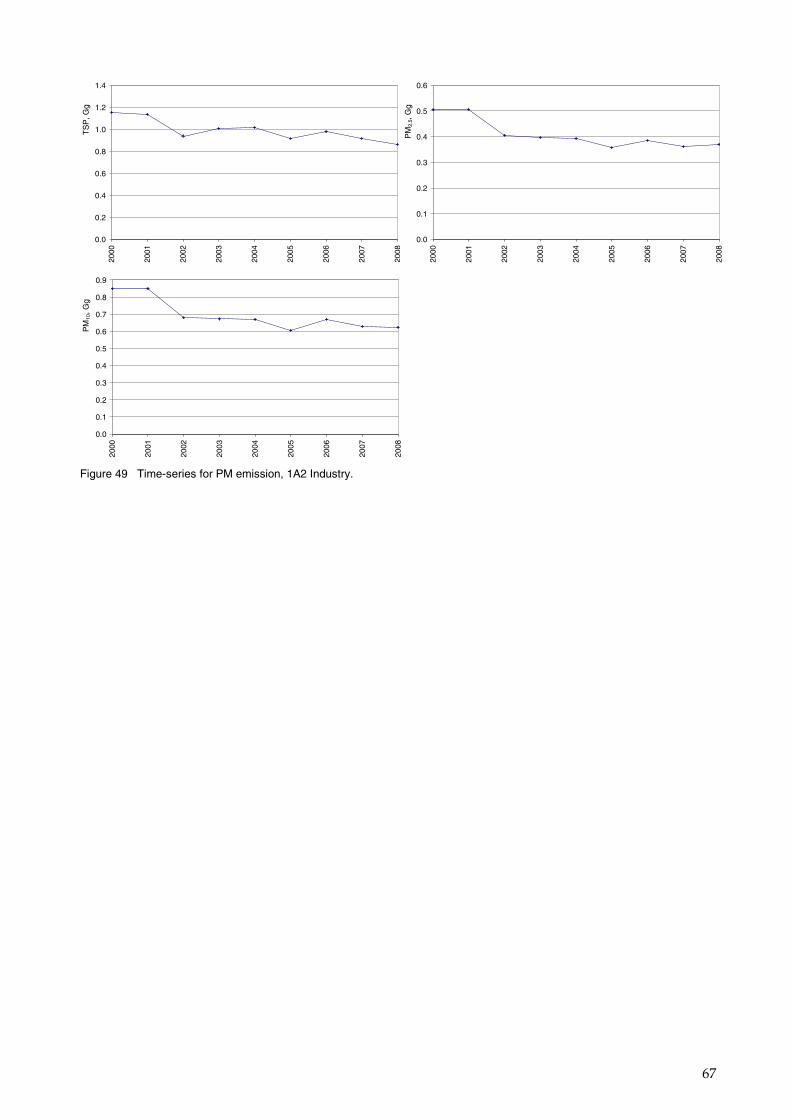
67
TS
P, G
g___
__
0.0
0.2
0.4
0.6
0.8
1.0
1.2
1.4
2000
2001
2002
2003
2004
2005
2006
2007
2008
PM
2.5,
Gg_
____
0.0
0.1
0.2
0.3
0.4
0.5
0.6
2000
2001
2002
2003
2004
2005
2006
2007
2008
PM
10, G
g___
__
0.0
0.1
0.2
0.3
0.4
0.5
0.6
0.7
0.8
0.9
2000
2001
2002
2003
2004
2005
2006
2007
2008
Figure 49 Time-series for PM emission, 1A2 Industry.
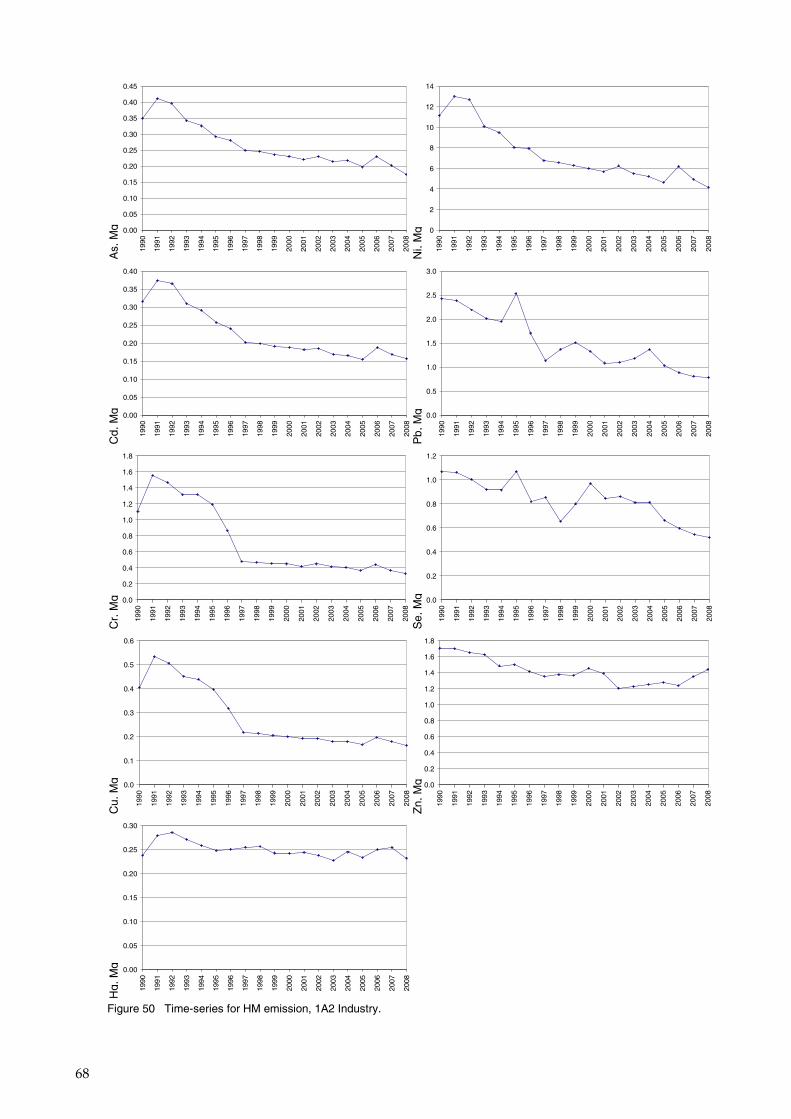
68
As,
Mg_
____
0.00
0.05
0.10
0.15
0.20
0.25
0.30
0.35
0.40
0.45
1990
1991
1992
1993
1994
1995
1996
1997
1998
1999
2000
2001
2002
2003
2004
2005
2006
2007
2008
Ni,
Mg_
____
0
2
4
6
8
10
12
14
1990
1991
1992
1993
1994
1995
1996
1997
1998
1999
2000
2001
2002
2003
2004
2005
2006
2007
2008
Cd,
Mg_
____
0.00
0.05
0.10
0.15
0.20
0.25
0.30
0.35
0.40
1990
1991
1992
1993
1994
1995
1996
1997
1998
1999
2000
2001
2002
2003
2004
2005
2006
2007
2008
Pb,
Mg_
____
0.0
0.5
1.0
1.5
2.0
2.5
3.0
1990
1991
1992
1993
1994
1995
1996
1997
1998
1999
2000
2001
2002
2003
2004
2005
2006
2007
2008
Cr,
Mg_
____
0.0
0.2
0.4
0.6
0.8
1.0
1.2
1.4
1.6
1.8
1990
1991
1992
1993
1994
1995
1996
1997
1998
1999
2000
2001
2002
2003
2004
2005
2006
2007
2008
Se,
Mg_
____
0.0
0.2
0.4
0.6
0.8
1.0
1.2
1990
1991
1992
1993
1994
1995
1996
1997
1998
1999
2000
2001
2002
2003
2004
2005
2006
2007
2008
Cu,
Mg_
____
0.0
0.1
0.2
0.3
0.4
0.5
0.6
1990
1991
1992
1993
1994
1995
1996
1997
1998
1999
2000
2001
2002
2003
2004
2005
2006
2007
2008
Zn,
Mg_
____
0.0
0.2
0.4
0.6
0.8
1.0
1.2
1.4
1.6
1.8
1990
1991
1992
1993
1994
1995
1996
1997
1998
1999
2000
2001
2002
2003
2004
2005
2006
2007
2008
Hg,
Mg_
____
0.00
0.05
0.10
0.15
0.20
0.25
0.30
1990
1991
1992
1993
1994
1995
1996
1997
1998
1999
2000
2001
2002
2003
2004
2005
2006
2007
2008
Figure 50 Time-series for HM emission, 1A2 Industry.
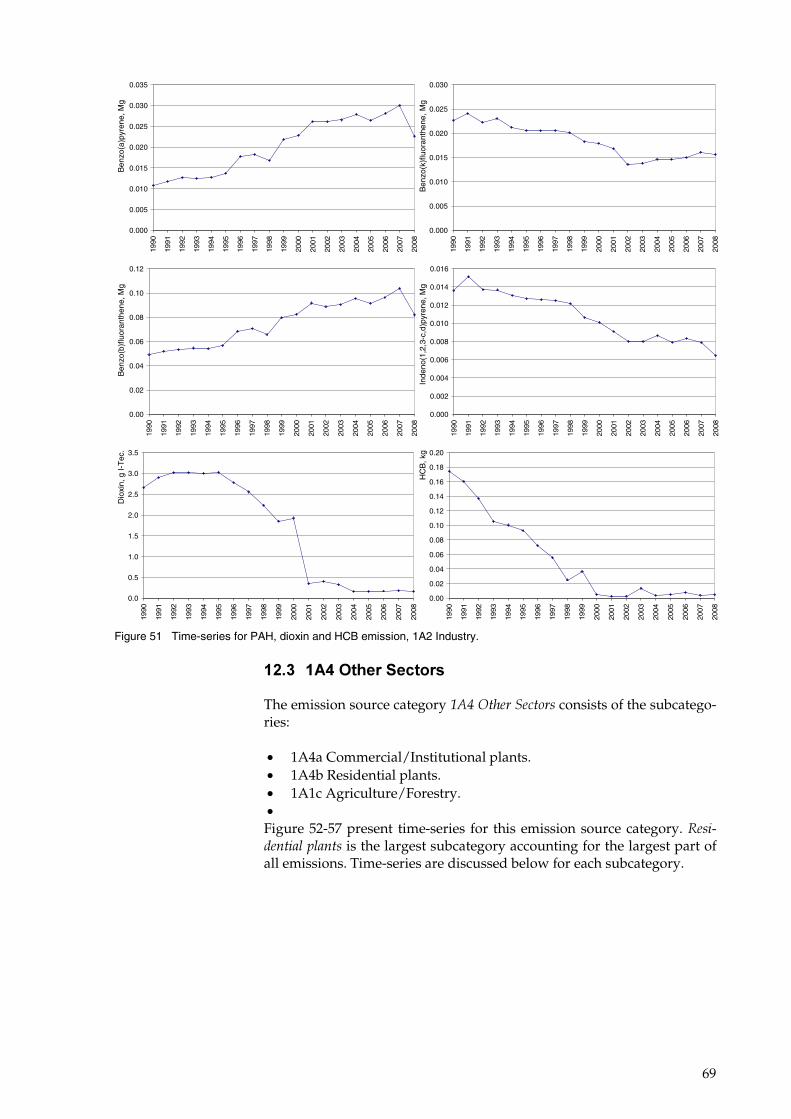
69
Ben
zo(a
)pyr
ene,
Mg_
___
0.000
0.005
0.010
0.015
0.020
0.025
0.030
0.035
1990
1991
1992
1993
1994
1995
1996
1997
1998
1999
2000
2001
2002
2003
2004
2005
2006
2007
2008
Ben
zo(k
)flu
oran
then
e, M
g___
_
0.000
0.005
0.010
0.015
0.020
0.025
0.030
1990
1991
1992
1993
1994
1995
1996
1997
1998
1999
2000
2001
2002
2003
2004
2005
2006
2007
2008
Ben
zo(b
)flu
oran
then
e, M
g___
_
0.00
0.02
0.04
0.06
0.08
0.10
0.12
1990
1991
1992
1993
1994
1995
1996
1997
1998
1999
2000
2001
2002
2003
2004
2005
2006
2007
2008
Inde
no(1
,2,3
-c,d
)pyr
ene,
Mg_
___
0.000
0.002
0.004
0.006
0.008
0.010
0.012
0.014
0.016
1990
1991
1992
1993
1994
1995
1996
1997
1998
1999
2000
2001
2002
2003
2004
2005
2006
2007
2008
Dio
xin,
g I-
Tec
.
0.0
0.5
1.0
1.5
2.0
2.5
3.0
3.5
1990
1991
1992
1993
1994
1995
1996
1997
1998
1999
2000
2001
2002
2003
2004
2005
2006
2007
2008
HC
B, k
g
0.00
0.02
0.04
0.06
0.08
0.10
0.12
0.14
0.16
0.18
0.2019
90
1991
1992
1993
1994
1995
1996
1997
1998
1999
2000
2001
2002
2003
2004
2005
2006
2007
2008
Figure 51 Time-series for PAH, dioxin and HCB emission, 1A2 Industry.
'��)� '4(�,����$�������
The emission source category ��"����������� consists of the subcatego-ries:
• 1A4a Commercial/Institutional plants. • 1A4b Residential plants. • 1A1c Agriculture/Forestry. • Figure 52-57 present time-series for this emission source category. ��������������� is the largest subcategory accounting for the largest part of all emissions. Time-series are discussed below for each subcategory.
�
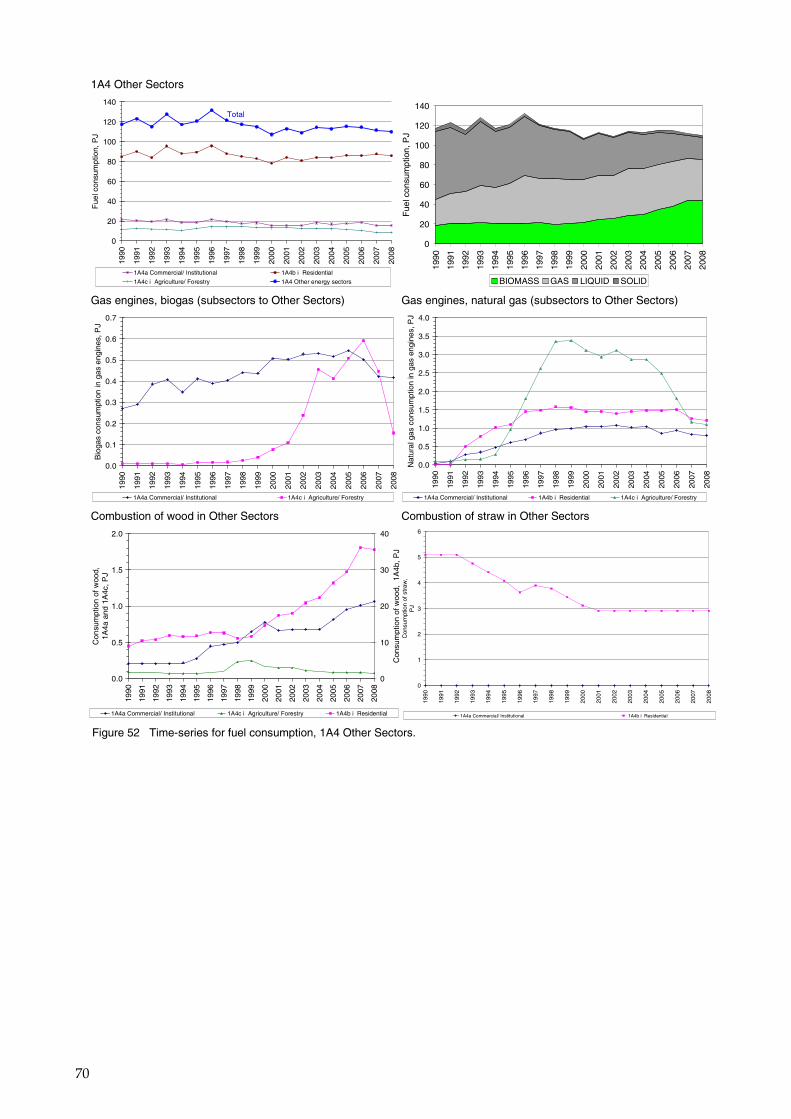
70
1A4 Other Sectors
0
20
40
60
80
100
120
140
1990
1991
1992
1993
1994
1995
1996
1997
1998
1999
2000
2001
2002
2003
2004
2005
2006
2007
2008
Fue
l con
sum
ptio
n, P
J
1A4a Commercial/ Institutional 1A4b i Residential
1A4c i Agriculture/ Forestry 1A4 Other energy sectors
Total
0
20
40
60
80
100
120
140
1990
1991
1992
1993
1994
1995
1996
1997
1998
1999
2000
2001
2002
2003
2004
2005
2006
2007
2008
Fue
l con
sum
ptio
n, P
J
BIOMASS GAS LIQUID SOLID Gas engines, biogas (subsectors to Other Sectors)
0.0
0.1
0.2
0.3
0.4
0.5
0.6
0.7
1990
1991
1992
1993
1994
1995
1996
1997
1998
1999
2000
2001
2002
2003
2004
2005
2006
2007
2008
Bio
gas
cons
umpt
ion
in g
as e
ngin
es, P
J
1A4a Commercial/ Institutional 1A4c i Agriculture/ Forestry
Gas engines, natural gas (subsectors to Other Sectors)
0.0
0.5
1.0
1.5
2.0
2.5
3.0
3.5
4.0
1990
1991
1992
1993
1994
1995
1996
1997
1998
1999
2000
2001
2002
2003
2004
2005
2006
2007
2008
Nat
ural
gas
con
sum
ptio
n in
gas
eng
ines
, PJ
1A4a Commercial/ Institutional 1A4b i Residential 1A4c i Agriculture/ Forestry Combustion of wood in Other Sectors
0.0
0.5
1.0
1.5
2.0
1990
1991
1992
1993
1994
1995
1996
1997
1998
1999
2000
2001
2002
2003
2004
2005
2006
2007
2008
Con
sum
ptio
n of
woo
d,
1A4a
and
1A
4c, P
J
0
10
20
30
40
Con
sum
ptio
n of
woo
d, 1
A4b
, PJ
1A4a Commercial/ Institutional 1A4c i Agriculture/ Forestry 1A4b i Residential
Combustion of straw in Other Sectors
0
1
2
3
4
5
6
1990
1991
1992
1993
1994
1995
1996
1997
1998
1999
2000
2001
2002
2003
2004
2005
2006
2007
2008
Con
sum
ptio
n of
str
aw,
PJ
1A4a Commercial/ Institutional 1A4b i Residential Figure 52 Time-series for fuel consumption, 1A4 Other Sectors.
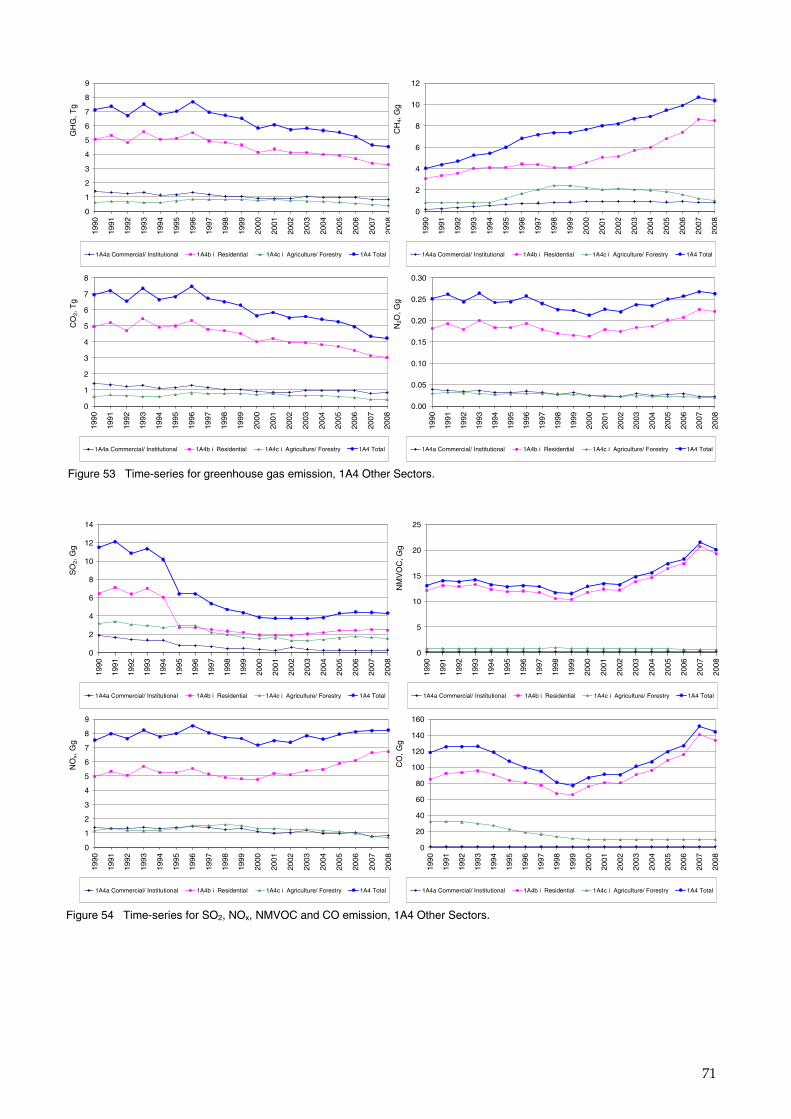
71
GH
G, T
g___
__
0
1
2
3
4
5
6
7
8
919
90
1991
1992
1993
1994
1995
1996
1997
1998
1999
2000
2001
2002
2003
2004
2005
2006
2007
2008
1A4a Commercial/ Institutional 1A4b i Residential 1A4c i Agriculture/ Forestry 1A4 Total
CH
4, G
g___
__
0
2
4
6
8
10
12
1990
1991
1992
1993
1994
1995
1996
1997
1998
1999
2000
2001
2002
2003
2004
2005
2006
2007
2008
1A4a Commercial/ Institutional 1A4b i Residential 1A4c i Agriculture/ Forestry 1A4 Total
CO
2, T
g___
__
0
1
2
3
4
5
6
7
8
1990
1991
1992
1993
1994
1995
1996
1997
1998
1999
2000
2001
2002
2003
2004
2005
2006
2007
2008
1A4a Commercial/ Institutional 1A4b i Residential 1A4c i Agriculture/ Forestry 1A4 Total
N2O
, Gg_
____
0.00
0.05
0.10
0.15
0.20
0.25
0.30
1990
1991
1992
1993
1994
1995
1996
1997
1998
1999
2000
2001
2002
2003
2004
2005
2006
2007
2008
1A4a Commercial/ Institutional 1A4b i Residential 1A4c i Agriculture/ Forestry 1A4 Total
Figure 53 Time-series for greenhouse gas emission, 1A4 Other Sectors.
SO
2, G
g___
__
0
2
4
6
8
10
12
14
1990
1991
1992
1993
1994
1995
1996
1997
1998
1999
2000
2001
2002
2003
2004
2005
2006
2007
2008
1A4a Commercial/ Institutional 1A4b i Residential 1A4c i Agriculture/ Forestry 1A4 Total
NM
VO
C, G
g___
__
0
5
10
15
20
25
1990
1991
1992
1993
1994
1995
1996
1997
1998
1999
2000
2001
2002
2003
2004
2005
2006
2007
2008
1A4a Commercial/ Institutional 1A4b i Residential 1A4c i Agriculture/ Forestry 1A4 Total
NO
x, G
g___
__
0
1
2
3
4
5
6
7
8
9
1990
1991
1992
1993
1994
1995
1996
1997
1998
1999
2000
2001
2002
2003
2004
2005
2006
2007
2008
1A4a Commercial/ Institutional 1A4b i Residential 1A4c i Agriculture/ Forestry 1A4 Total
CO
, Gg_
____
0
20
40
60
80
100
120
140
160
1990
1991
1992
1993
1994
1995
1996
1997
1998
1999
2000
2001
2002
2003
2004
2005
2006
2007
2008
1A4a Commercial/ Institutional 1A4b i Residential 1A4c i Agriculture/ Forestry 1A4 Total
Figure 54 Time-series for SO2, NOx, NMVOC and CO emission, 1A4 Other Sectors.
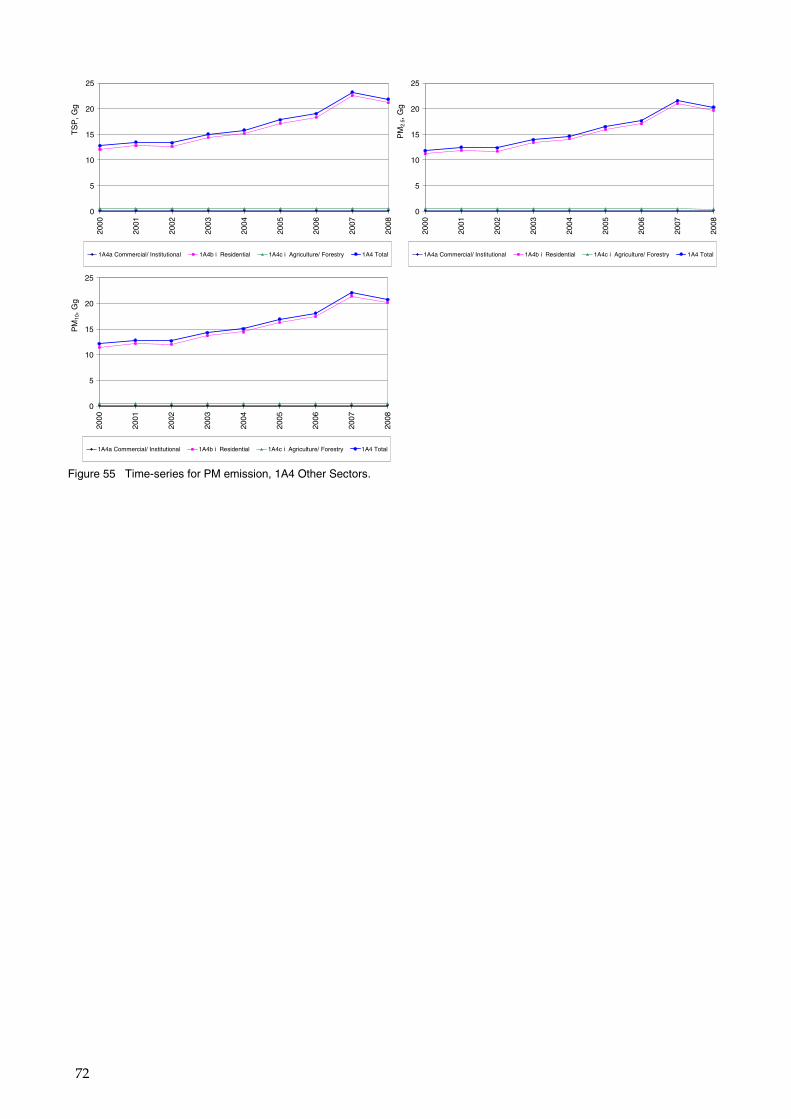
72
TS
P, G
g___
__
0
5
10
15
20
25
2000
2001
2002
2003
2004
2005
2006
2007
2008
1A4a Commercial/ Institutional 1A4b i Residential 1A4c i Agriculture/ Forestry 1A4 Total
PM
2.5,
Gg_
____
0
5
10
15
20
25
2000
2001
2002
2003
2004
2005
2006
2007
2008
1A4a Commercial/ Institutional 1A4b i Residential 1A4c i Agriculture/ Forestry 1A4 Total
PM
10, G
g___
__
0
5
10
15
20
25
2000
2001
2002
2003
2004
2005
2006
2007
2008
1A4a Commercial/ Institutional 1A4b i Residential 1A4c i Agriculture/ Forestry 1A4 Total
Figure 55 Time-series for PM emission, 1A4 Other Sectors.
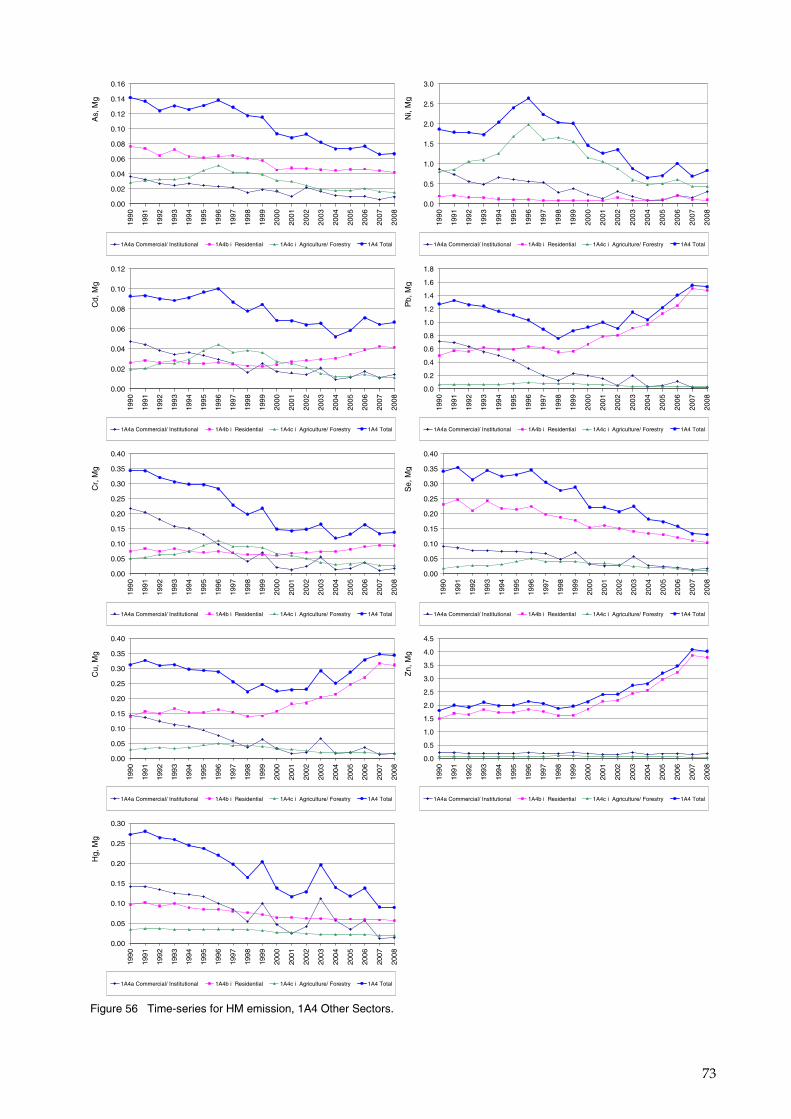
73
As,
Mg_
____
0.00
0.02
0.04
0.06
0.08
0.10
0.12
0.14
0.16
1990
1991
1992
1993
1994
1995
1996
1997
1998
1999
2000
2001
2002
2003
2004
2005
2006
2007
2008
1A4a Commercial/ Institutional 1A4b i Residential 1A4c i Agriculture/ Forestry 1A4 Total
Ni,
Mg_
____
0.0
0.5
1.0
1.5
2.0
2.5
3.0
1990
1991
1992
1993
1994
1995
1996
1997
1998
1999
2000
2001
2002
2003
2004
2005
2006
2007
2008
1A4a Commercial/ Institutional 1A4b i Residential 1A4c i Agriculture/ Forestry 1A4 Total
Cd,
Mg_
____
0.00
0.02
0.04
0.06
0.08
0.10
0.12
1990
1991
1992
1993
1994
1995
1996
1997
1998
1999
2000
2001
2002
2003
2004
2005
2006
2007
2008
1A4a Commercial/ Institutional 1A4b i Residential 1A4c i Agriculture/ Forestry 1A4 Total
Pb,
Mg_
____
0.0
0.2
0.4
0.6
0.8
1.0
1.2
1.4
1.6
1.8
1990
1991
1992
1993
1994
1995
1996
1997
1998
1999
2000
2001
2002
2003
2004
2005
2006
2007
2008
1A4a Commercial/ Institutional 1A4b i Residential 1A4c i Agriculture/ Forestry 1A4 Total
Cr,
Mg_
____
0.00
0.05
0.10
0.15
0.20
0.25
0.30
0.35
0.40
1990
1991
1992
1993
1994
1995
1996
1997
1998
1999
2000
2001
2002
2003
2004
2005
2006
2007
2008
1A4a Commercial/ Institutional 1A4b i Residential 1A4c i Agriculture/ Forestry 1A4 Total
Se,
Mg_
____
0.00
0.05
0.10
0.15
0.20
0.25
0.30
0.35
0.40
1990
1991
1992
1993
1994
1995
1996
1997
1998
1999
2000
2001
2002
2003
2004
2005
2006
2007
2008
1A4a Commercial/ Institutional 1A4b i Residential 1A4c i Agriculture/ Forestry 1A4 Total
Cu,
Mg_
____
0.00
0.05
0.10
0.15
0.20
0.25
0.30
0.35
0.40
1990
1991
1992
1993
1994
1995
1996
1997
1998
1999
2000
2001
2002
2003
2004
2005
2006
2007
2008
1A4a Commercial/ Institutional 1A4b i Residential 1A4c i Agriculture/ Forestry 1A4 Total
Zn,
Mg_
____
0.0
0.5
1.0
1.5
2.0
2.5
3.0
3.5
4.0
4.5
1990
1991
1992
1993
1994
1995
1996
1997
1998
1999
2000
2001
2002
2003
2004
2005
2006
2007
2008
1A4a Commercial/ Institutional 1A4b i Residential 1A4c i Agriculture/ Forestry 1A4 Total
Hg,
Mg_
____
0.00
0.05
0.10
0.15
0.20
0.25
0.30
1990
1991
1992
1993
1994
1995
1996
1997
1998
1999
2000
2001
2002
2003
2004
2005
2006
2007
2008
1A4a Commercial/ Institutional 1A4b i Residential 1A4c i Agriculture/ Forestry 1A4 Total
Figure 56 Time-series for HM emission, 1A4 Other Sectors.
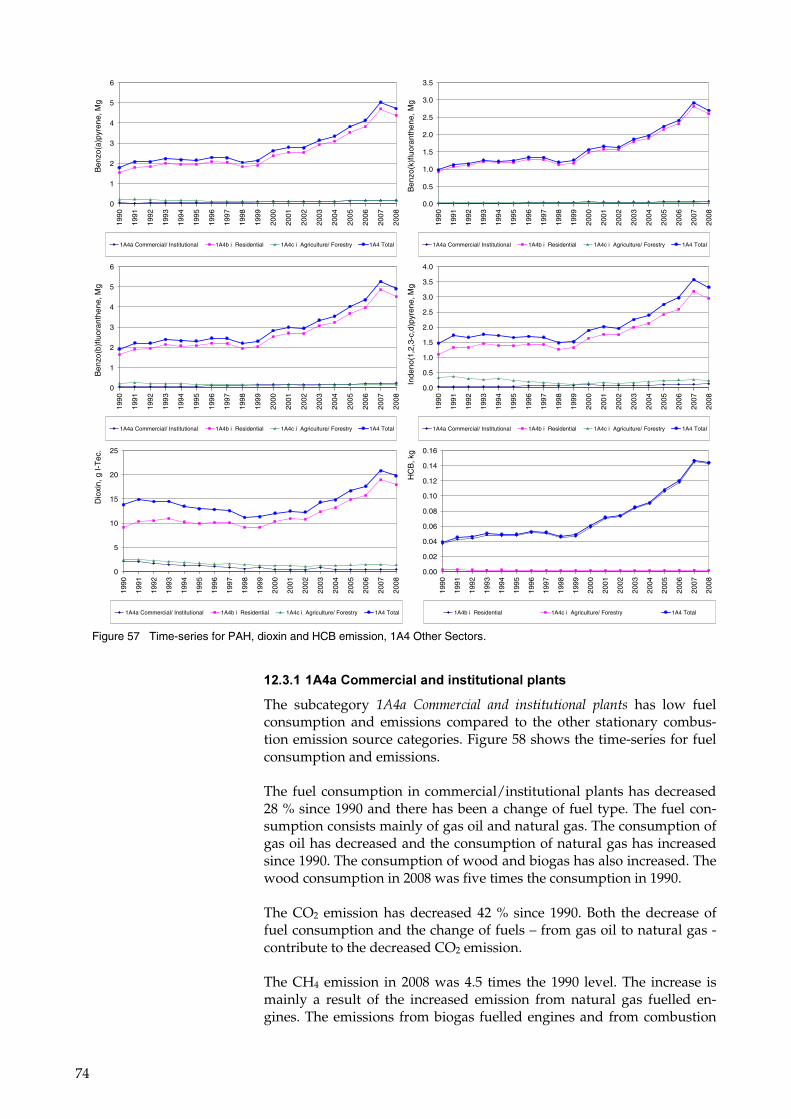
74
Ben
zo(a
)pyr
ene,
Mg_
___
0
1
2
3
4
5
6
1990
1991
1992
1993
1994
1995
1996
1997
1998
1999
2000
2001
2002
2003
2004
2005
2006
2007
2008
1A4a Commercial/ Institutional 1A4b i Residential 1A4c i Agriculture/ Forestry 1A4 Total
Ben
zo(k
)flu
oran
then
e, M
g___
_
0.0
0.5
1.0
1.5
2.0
2.5
3.0
3.5
1990
1991
1992
1993
1994
1995
1996
1997
1998
1999
2000
2001
2002
2003
2004
2005
2006
2007
2008
1A4a Commercial/ Institutional 1A4b i Residential 1A4c i Agriculture/ Forestry 1A4 Total
Ben
zo(b
)flu
oran
then
e, M
g___
_
0
1
2
3
4
5
6
1990
1991
1992
1993
1994
1995
1996
1997
1998
1999
2000
2001
2002
2003
2004
2005
2006
2007
2008
1A4a Commercial/ Institutional 1A4b i Residential 1A4c i Agriculture/ Forestry 1A4 Total
Inde
no(1
,2,3
-c,d
)pyr
ene,
Mg_
___
0.0
0.5
1.0
1.5
2.0
2.5
3.0
3.5
4.0
1990
1991
1992
1993
1994
1995
1996
1997
1998
1999
2000
2001
2002
2003
2004
2005
2006
2007
2008
1A4a Commercial/ Institutional 1A4b i Residential 1A4c i Agriculture/ Forestry 1A4 Total
Dio
xin,
g I-
Tec
.
0
5
10
15
20
25
1990
1991
1992
1993
1994
1995
1996
1997
1998
1999
2000
2001
2002
2003
2004
2005
2006
2007
2008
1A4a Commercial/ Institutional 1A4b i Residential 1A4c i Agriculture/ Forestry 1A4 Total
HC
B, k
g
0.00
0.02
0.04
0.06
0.08
0.10
0.12
0.14
0.1619
90
1991
1992
1993
1994
1995
1996
1997
1998
1999
2000
2001
2002
2003
2004
2005
2006
2007
2008
1A4b i Residential 1A4c i Agriculture/ Forestry 1A4 Total
Figure 57 Time-series for PAH, dioxin and HCB emission, 1A4 Other Sectors.
'��)�'�'4(��!�������� ��%����������� �� ����
The subcategory ��"�� #�$$������� ���� ���������� ���� has low fuel consumption and emissions compared to the other stationary combus-tion emission source categories. Figure 58 shows the time-series for fuel consumption and emissions.
The fuel consumption in commercial/institutional plants has decreased 28 % since 1990 and there has been a change of fuel type. The fuel con-sumption consists mainly of gas oil and natural gas. The consumption of gas oil has decreased and the consumption of natural gas has increased since 1990. The consumption of wood and biogas has also increased. The wood consumption in 2008 was five times the consumption in 1990.
The CO2 emission has decreased 42 % since 1990. Both the decrease of fuel consumption and the change of fuels – from gas oil to natural gas - contribute to the decreased CO2 emission.
The CH4 emission in 2008 was 4.5 times the 1990 level. The increase is mainly a result of the increased emission from natural gas fuelled en-gines. The emissions from biogas fuelled engines and from combustion
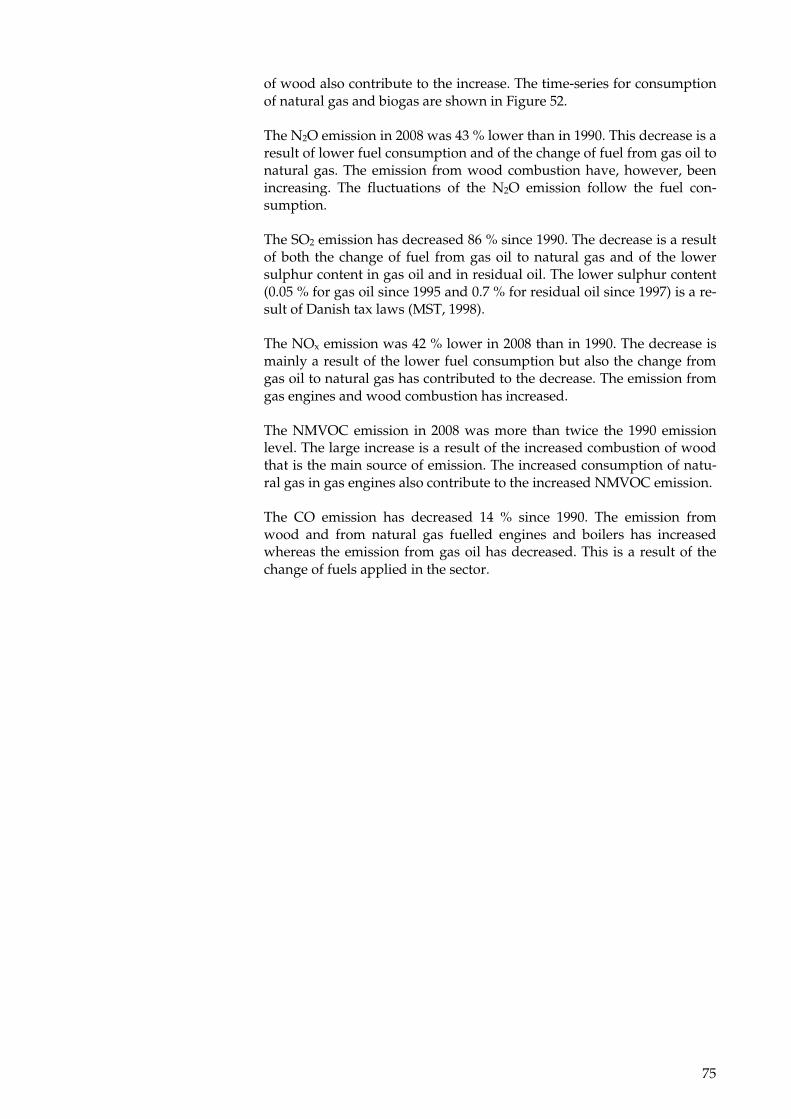
75
of wood also contribute to the increase. The time-series for consumption of natural gas and biogas are shown in Figure 52.
The N2O emission in 2008 was 43 % lower than in 1990. This decrease is a result of lower fuel consumption and of the change of fuel from gas oil to natural gas. The emission from wood combustion have, however, been increasing. The fluctuations of the N2O emission follow the fuel con-sumption.
The SO2 emission has decreased 86 % since 1990. The decrease is a result of both the change of fuel from gas oil to natural gas and of the lower sulphur content in gas oil and in residual oil. The lower sulphur content (0.05 % for gas oil since 1995 and 0.7 % for residual oil since 1997) is a re-sult of Danish tax laws (MST, 1998).
The NOx emission was 42 % lower in 2008 than in 1990. The decrease is mainly a result of the lower fuel consumption but also the change from gas oil to natural gas has contributed to the decrease. The emission from gas engines and wood combustion has increased.
The NMVOC emission in 2008 was more than twice the 1990 emission level. The large increase is a result of the increased combustion of wood that is the main source of emission. The increased consumption of natu-ral gas in gas engines also contribute to the increased NMVOC emission.
The CO emission has decreased 14 % since 1990. The emission from wood and from natural gas fuelled engines and boilers has increased whereas the emission from gas oil has decreased. This is a result of the change of fuels applied in the sector.
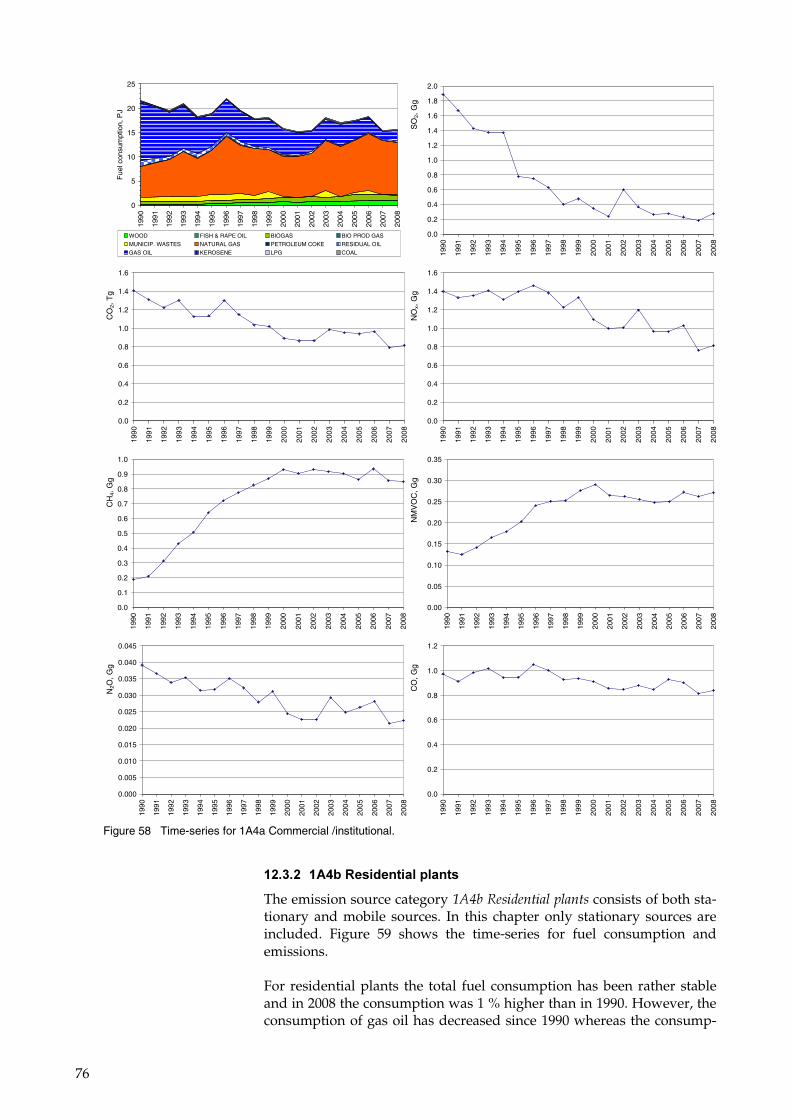
76
0
5
10
15
20
25
1990
1991
1992
1993
1994
1995
1996
1997
1998
1999
2000
2001
2002
2003
2004
2005
2006
2007
2008
Fue
l con
sum
ptio
n, P
J
WOOD FISH & RAPE OIL BIOGAS BIO PROD GAS
MUNICIP. WASTES NATURAL GAS PETROLEUM COKE RESIDUAL OIL
GAS OIL KEROSENE LPG COAL
SO
2, G
g___
_
0.0
0.2
0.4
0.6
0.8
1.0
1.2
1.4
1.6
1.8
2.0
1990
1991
1992
1993
1994
1995
1996
1997
1998
1999
2000
2001
2002
2003
2004
2005
2006
2007
2008
CO
2, T
g___
__
0.0
0.2
0.4
0.6
0.8
1.0
1.2
1.4
1.6
1990
1991
1992
1993
1994
1995
1996
1997
1998
1999
2000
2001
2002
2003
2004
2005
2006
2007
2008
NO
x, G
g___
__
0.0
0.2
0.4
0.6
0.8
1.0
1.2
1.4
1.6
1990
1991
1992
1993
1994
1995
1996
1997
1998
1999
2000
2001
2002
2003
2004
2005
2006
2007
2008
CH
4, G
g___
__
0.0
0.1
0.2
0.3
0.4
0.5
0.6
0.7
0.8
0.9
1.0
1990
1991
1992
1993
1994
1995
1996
1997
1998
1999
2000
2001
2002
2003
2004
2005
2006
2007
2008
NM
VO
C, G
g___
__
0.00
0.05
0.10
0.15
0.20
0.25
0.30
0.35
1990
1991
1992
1993
1994
1995
1996
1997
1998
1999
2000
2001
2002
2003
2004
2005
2006
2007
2008
N2O
, Gg_
____
0.000
0.005
0.010
0.015
0.020
0.025
0.030
0.035
0.040
0.045
1990
1991
1992
1993
1994
1995
1996
1997
1998
1999
2000
2001
2002
2003
2004
2005
2006
2007
2008
CO
, Gg_
____
0.0
0.2
0.4
0.6
0.8
1.0
1.2
1990
1991
1992
1993
1994
1995
1996
1997
1998
1999
2000
2001
2002
2003
2004
2005
2006
2007
2008
Figure 58 Time-series for 1A4a Commercial /institutional.
'��)����'4(������%���� �� ����
The emission source category ��" ��������������� consists of both sta-tionary and mobile sources. In this chapter only stationary sources are included. Figure 59 shows the time-series for fuel consumption and emissions.
For residential plants the total fuel consumption has been rather stable and in 2008 the consumption was 1 % higher than in 1990. However, the consumption of gas oil has decreased since 1990 whereas the consump-
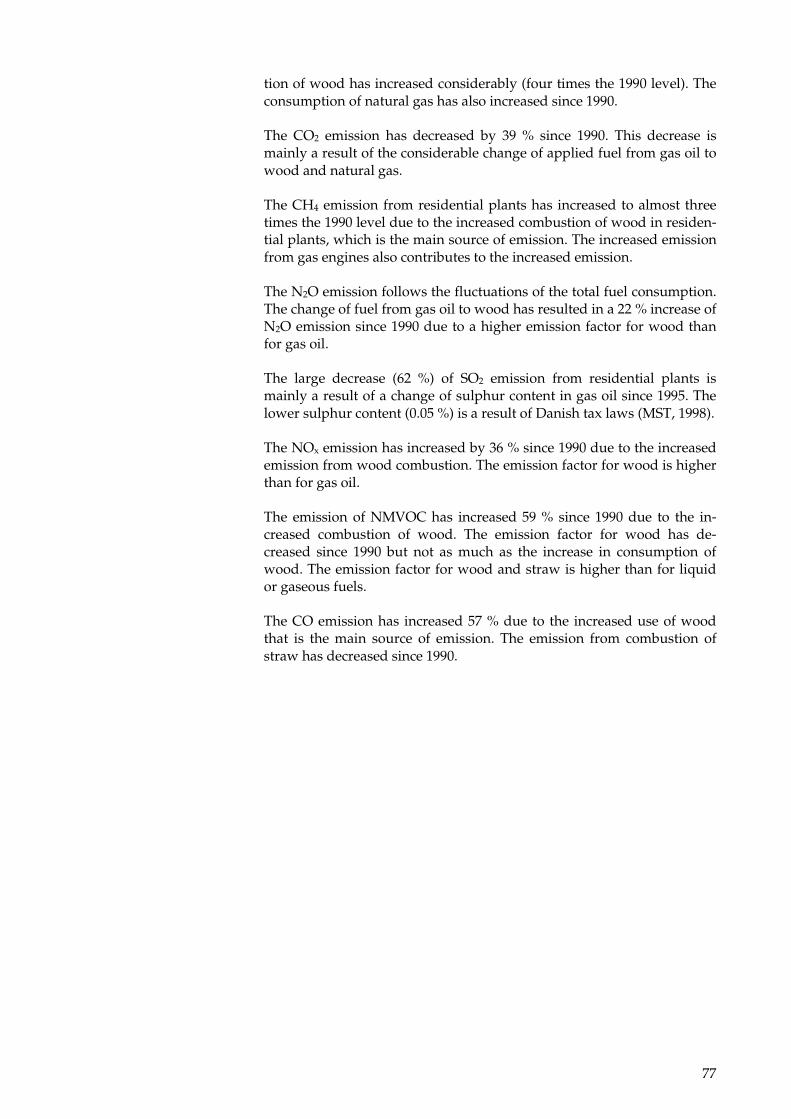
77
tion of wood has increased considerably (four times the 1990 level). The consumption of natural gas has also increased since 1990.
The CO2 emission has decreased by 39 % since 1990. This decrease is mainly a result of the considerable change of applied fuel from gas oil to wood and natural gas.
The CH4 emission from residential plants has increased to almost three times the 1990 level due to the increased combustion of wood in residen-tial plants, which is the main source of emission. The increased emission from gas engines also contributes to the increased emission.
The N2O emission follows the fluctuations of the total fuel consumption. The change of fuel from gas oil to wood has resulted in a 22 % increase of N2O emission since 1990 due to a higher emission factor for wood than for gas oil.
The large decrease (62 %) of SO2 emission from residential plants is mainly a result of a change of sulphur content in gas oil since 1995. The lower sulphur content (0.05 %) is a result of Danish tax laws (MST, 1998).
The NOx emission has increased by 36 % since 1990 due to the increased emission from wood combustion. The emission factor for wood is higher than for gas oil.
The emission of NMVOC has increased 59 % since 1990 due to the in-creased combustion of wood. The emission factor for wood has de-creased since 1990 but not as much as the increase in consumption of wood. The emission factor for wood and straw is higher than for liquid or gaseous fuels.
The CO emission has increased 57 % due to the increased use of wood that is the main source of emission. The emission from combustion of straw has decreased since 1990.
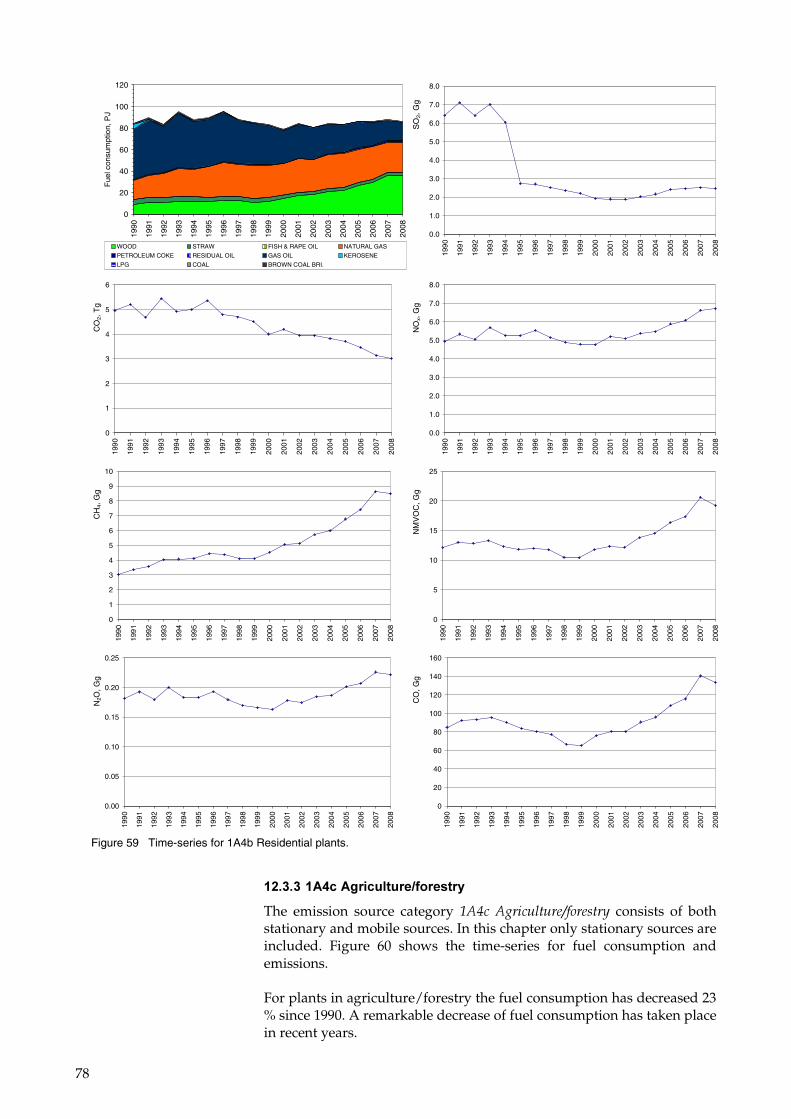
78
0
20
40
60
80
100
120
1990
1991
1992
1993
1994
1995
1996
1997
1998
1999
2000
2001
2002
2003
2004
2005
2006
2007
2008
Fue
l con
sum
ptio
n, P
J
WOOD STRAW FISH & RAPE OIL NATURAL GAS
PETROLEUM COKE RESIDUAL OIL GAS OIL KEROSENE
LPG COAL BROWN COAL BRI.
SO
2, G
g___
_
0.0
1.0
2.0
3.0
4.0
5.0
6.0
7.0
8.0
1990
1991
1992
1993
1994
1995
1996
1997
1998
1999
2000
2001
2002
2003
2004
2005
2006
2007
2008
CO
2, T
g___
__
0
1
2
3
4
5
6
1990
1991
1992
1993
1994
1995
1996
1997
1998
1999
2000
2001
2002
2003
2004
2005
2006
2007
2008
NO
x, G
g___
__
0.0
1.0
2.0
3.0
4.0
5.0
6.0
7.0
8.0
1990
1991
1992
1993
1994
1995
1996
1997
1998
1999
2000
2001
2002
2003
2004
2005
2006
2007
2008
CH
4, G
g___
__
0
1
2
3
4
5
6
7
8
9
10
1990
1991
1992
1993
1994
1995
1996
1997
1998
1999
2000
2001
2002
2003
2004
2005
2006
2007
2008
NM
VO
C, G
g___
__
0
5
10
15
20
25
1990
1991
1992
1993
1994
1995
1996
1997
1998
1999
2000
2001
2002
2003
2004
2005
2006
2007
2008
N2O
, Gg_
____
0.00
0.05
0.10
0.15
0.20
0.25
1990
1991
1992
1993
1994
1995
1996
1997
1998
1999
2000
2001
2002
2003
2004
2005
2006
2007
2008
CO
, Gg_
____
0
20
40
60
80
100
120
140
160
1990
1991
1992
1993
1994
1995
1996
1997
1998
1999
2000
2001
2002
2003
2004
2005
2006
2007
2008
Figure 59 Time-series for 1A4b Residential plants.
'��)�)�'4(��4&���� ����9���������
The emission source category ��"������������%!����� consists of both stationary and mobile sources. In this chapter only stationary sources are included. Figure 60 shows the time-series for fuel consumption and emissions.
For plants in agriculture/forestry the fuel consumption has decreased 23 % since 1990. A remarkable decrease of fuel consumption has taken place in recent years.
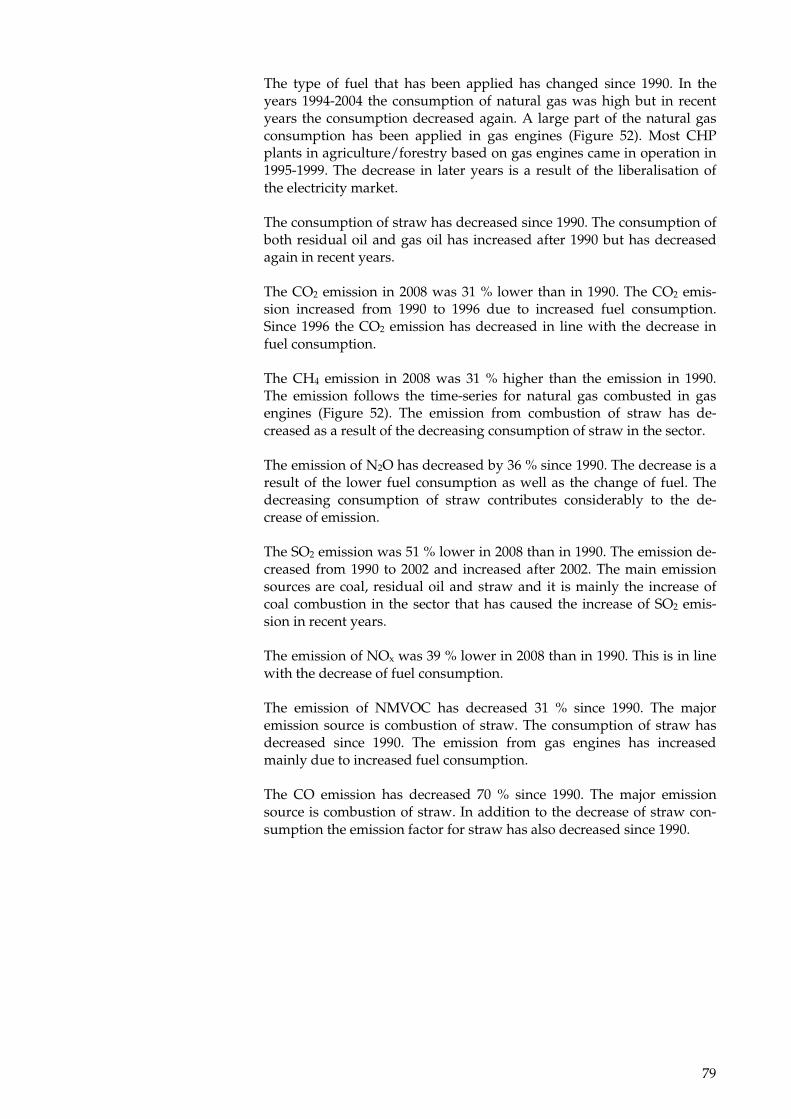
79
The type of fuel that has been applied has changed since 1990. In the years 1994-2004 the consumption of natural gas was high but in recent years the consumption decreased again. A large part of the natural gas consumption has been applied in gas engines (Figure 52). Most CHP plants in agriculture/forestry based on gas engines came in operation in 1995-1999. The decrease in later years is a result of the liberalisation of the electricity market.
The consumption of straw has decreased since 1990. The consumption of both residual oil and gas oil has increased after 1990 but has decreased again in recent years.
The CO2 emission in 2008 was 31 % lower than in 1990. The CO2 emis-sion increased from 1990 to 1996 due to increased fuel consumption. Since 1996 the CO2 emission has decreased in line with the decrease in fuel consumption.
The CH4 emission in 2008 was 31 % higher than the emission in 1990. The emission follows the time-series for natural gas combusted in gas engines (Figure 52). The emission from combustion of straw has de-creased as a result of the decreasing consumption of straw in the sector.
The emission of N2O has decreased by 36 % since 1990. The decrease is a result of the lower fuel consumption as well as the change of fuel. The decreasing consumption of straw contributes considerably to the de-crease of emission.
The SO2 emission was 51 % lower in 2008 than in 1990. The emission de-creased from 1990 to 2002 and increased after 2002. The main emission sources are coal, residual oil and straw and it is mainly the increase of coal combustion in the sector that has caused the increase of SO2 emis-sion in recent years.
The emission of NOx was 39 % lower in 2008 than in 1990. This is in line with the decrease of fuel consumption.
The emission of NMVOC has decreased 31 % since 1990. The major emission source is combustion of straw. The consumption of straw has decreased since 1990. The emission from gas engines has increased mainly due to increased fuel consumption.
The CO emission has decreased 70 % since 1990. The major emission source is combustion of straw. In addition to the decrease of straw con-sumption the emission factor for straw has also decreased since 1990.
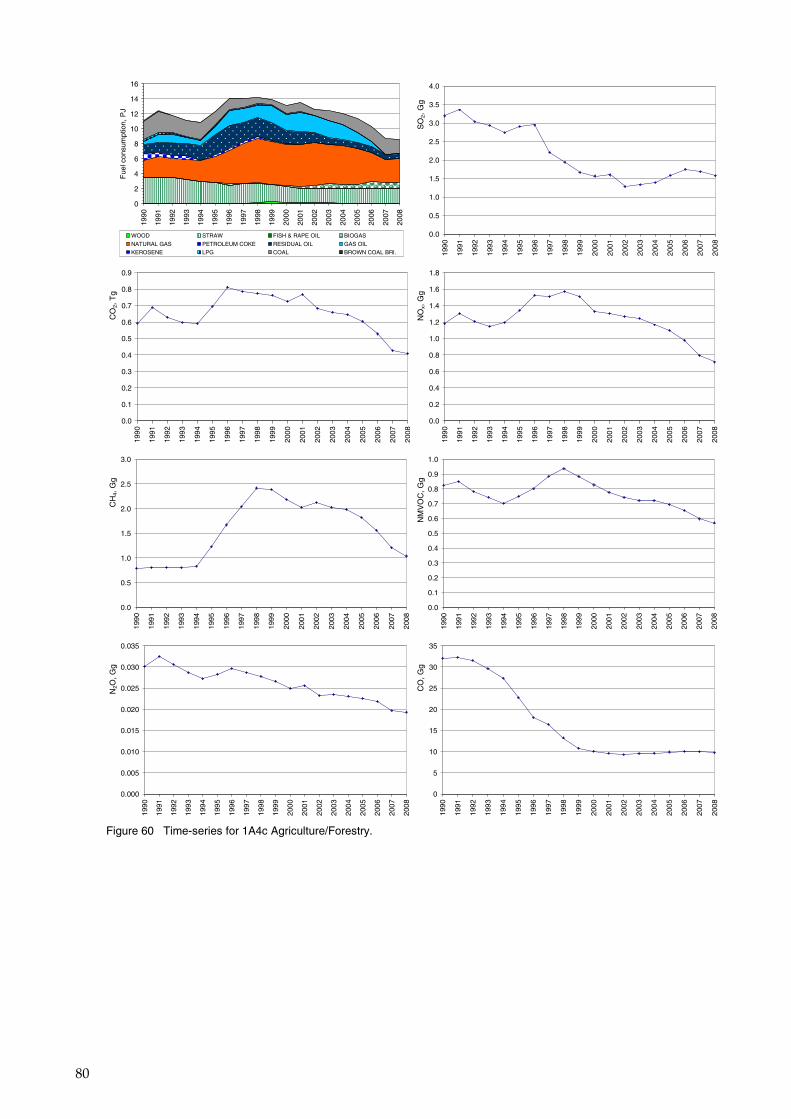
80
0
2
4
6
8
10
12
14
16
1990
1991
1992
1993
1994
1995
1996
1997
1998
1999
2000
2001
2002
2003
2004
2005
2006
2007
2008
Fue
l con
sum
ptio
n, P
J
WOOD STRAW FISH & RAPE OIL BIOGAS
NATURAL GAS PETROLEUM COKE RESIDUAL OIL GAS OIL
KEROSENE LPG COAL BROWN COAL BRI.
SO
2, G
g___
_
0.0
0.5
1.0
1.5
2.0
2.5
3.0
3.5
4.0
1990
1991
1992
1993
1994
1995
1996
1997
1998
1999
2000
2001
2002
2003
2004
2005
2006
2007
2008
CO
2, T
g___
__
0.0
0.1
0.2
0.3
0.4
0.5
0.6
0.7
0.8
0.9
1990
1991
1992
1993
1994
1995
1996
1997
1998
1999
2000
2001
2002
2003
2004
2005
2006
2007
2008
NO
x, G
g___
__
0.0
0.2
0.4
0.6
0.8
1.0
1.2
1.4
1.6
1.8
1990
1991
1992
1993
1994
1995
1996
1997
1998
1999
2000
2001
2002
2003
2004
2005
2006
2007
2008
CH
4, G
g___
__
0.0
0.5
1.0
1.5
2.0
2.5
3.0
1990
1991
1992
1993
1994
1995
1996
1997
1998
1999
2000
2001
2002
2003
2004
2005
2006
2007
2008
NM
VO
C, G
g___
__
0.0
0.1
0.2
0.3
0.4
0.5
0.6
0.7
0.8
0.9
1.0
1990
1991
1992
1993
1994
1995
1996
1997
1998
1999
2000
2001
2002
2003
2004
2005
2006
2007
2008
N2O
, Gg_
____
0.000
0.005
0.010
0.015
0.020
0.025
0.030
0.035
1990
1991
1992
1993
1994
1995
1996
1997
1998
1999
2000
2001
2002
2003
2004
2005
2006
2007
2008
CO
, Gg_
____
0
5
10
15
20
25
30
35
1990
1991
1992
1993
1994
1995
1996
1997
1998
1999
2000
2001
2002
2003
2004
2005
2006
2007
2008
Figure 60 Time-series for 1A4c Agriculture/Forestry.
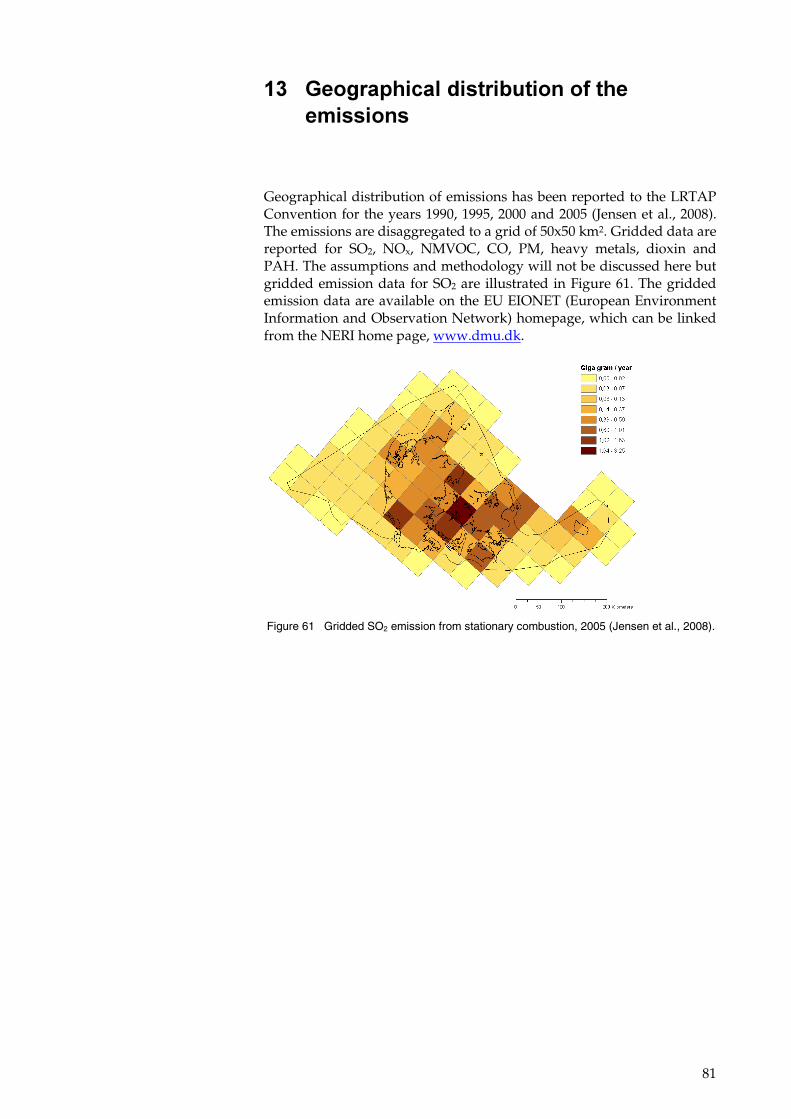
81
')� +��&������ �%���������������������������
Geographical distribution of emissions has been reported to the LRTAP Convention for the years 1990, 1995, 2000 and 2005 (Jensen et al., 2008). The emissions are disaggregated to a grid of 50x50 km2. Gridded data are reported for SO2, NOx, NMVOC, CO, PM, heavy metals, dioxin and PAH. The assumptions and methodology will not be discussed here but gridded emission data for SO2 are illustrated in Figure 61. The gridded emission data are available on the EU EIONET (European Environment Information and Observation Network) homepage, which can be linked from the NERI home page, www.dmu.dk.
Figure 61 Gridded SO2 emission from stationary combustion, 2005 (Jensen et al., 2008).
82
'(� .���%� �&��� ��������
The Danish emission inventory is based on the CORINAIR (CORe IN-ventory on AIR emissions) system, which is a European program for air emission inventories. CORINAIR includes methodology, structure and software for inventories. The methodology is described in the EMEP/CORINAIR Emission Inventory Guidebook 3rd edition, 2007 up-date, prepared by the UNECE/EMEP Task Force on Emissions Invento-ries and Projections (EEA 2007). Emission data are stored in an Access database from which data are transferred to the reporting formats.
The emission inventory for stationary combustion is based on activity rates from the Danish energy statistics. General emission factors for vari-ous fuels, plants and sectors have been determined. Some large plants, such as power plants, are registered individually as large point sources and plant-specific emission data are used.
'(�'� �������������������&������
In the Danish emission database all activity rates and emissions are de-fined in SNAP sector categories (Selected Nomenclature for Air Pollu-tion) according the CORINAIR system. The emission inventories are prepared from a complete emission database based on the SNAP source categories. Aggregation to the source category codes used for both the Climate Convention and the LRTAP Convention is based on a corre-spondence list enclosed in Appendix 3.
The emission source codes applied in the reporting activity will be re-ferred to as IPCC source categories. The IPCC source categories define six main source categories, listed in Table 27 and a number of subcatego-ries. Stationary combustion is part of the IPCC source category 1, ������. Table 28 presents subcategories in the IPCC energy category. The table also presents the source category in which the NERI documentation is included. Though industrial combustion is part of the stationary com-bustion detailed documentation for some of the specific industries is dis-cussed in the industry chapters/reports. Stationary combustion is de-fined as combustion activities in the SNAP categories 01-03.
Table 27 IPCC main source categories. 1. Energy 2. Industrial Processes 3. Solvent and Other Product Use 4. Agriculture 5. Land-Use Change and Forestry 6. Waste
83
Table 28 IPCC emission source subcategories for energy.
Stationary combustion plants are included in the emission source sub-categories to ������, &������$ ����:
• 1A1 Energy Industries. • 1A2 Manufacturing Industries and Construction. • 1A4 Other Sectors.
IPCC id IPCC source category name NERI documentation 1 Energy Stationary combustion, Transport, Fugitive,
Industrial Processes 1A Fuel Combustion Activities Stationary combustion, Transport, Industrial
Processes 1A1 Energy Industries Stationary combustion
1A1a Electricity and Heat Production Stationary combustion
1A1b Petroleum Refining Stationary combustion, Fugitive
1A1c Solid Fuel Transf./Other Energy Industries Stationary combustion
1A2 Fuel Combustion Activities/Industry (ISIC) Stationary combustion, Transport, Industrial Processes
1A2a Iron and Steel Stationary combustion, Industrial Processes
1A2b Non-Ferrous Metals Stationary combustion, Industrial Processes 1A2c Chemicals Stationary combustion, Industrial Processes
1A2d Pulp, Paper and Print Stationary combustion, Industrial Processes
1A2e Food Processing, Beverages and Tobacco Stationary combustion, Industrial Processes
1A2f Other (please specify) Stationary combustion, Transport, Industrial Processes
1A3 Transport Transport 1A3a Civil Aviation Transport 1A3b Road Transportation Transport 1A3c Railways Transport 1A3d Navigation Transport 1A3e Other (please specify) Transport 1A4 Other Sectors Stationary combustion, Transport 1A4a Commercial/Institutional Stationary combustion 1A4b Residential Stationary combustion, Transport
1A4c Agriculture/Forestry/Fishing Stationary combustion, Transport 1A5 Other (please specify) Stationary combustion, Transport
1A5a Stationary Stationary combustion 1A5b Mobile Transport 1B Fugitive Emissions from Fuels Fugitive 1B1 Solid Fuels Fugitive 1B1a Coal Mining Fugitive 1B1a1 Underground Mines Fugitive 1B1a2 Surface Mines Fugitive 1B1b Solid Fuel Transformation Fugitive 1B1c Other (please specify) Fugitive 1B2 Oil and Natural Gas Fugitive
1B2a Oil Fugitive 1B2a2 Production Fugitive 1B2a3 Transport Fugitive 1B2a4 Refining/Storage Fugitive 1B2a5 Distribution of oil products Fugitive 1B2a6 Other Fugitive 1B2b Natural Gas Fugitive 1B2b1 Production/processing Fugitive 1B2b2 Transmission/distribution Fugitive 1B2c Venting and Flaring Fugitive 1B2c1 Venting and Flaring Oil Fugitive
1B2c2 Venting and Flaring Gas Fugitive 1B2d Other Fugitive
84
However, the emission sources ��' and ��" also include emission from transport subcategories. The emission source ��' includes emissions from some off-road machinery in the industry. The emission source ��" includes off-road machinery in agriculture, forestry and house-hold/gardening. Further emissions from national fishing are included in subcategory ��".
The emission and fuel consumption data included in tables and figures in this report only include emissions originating from stationary com-bustion plants of a given IPCC source category. The IPCC source cate-gory codes have been applied unchanged but some source category names have been changed to reflect the stationary combustion element of the source.�
The CO2 emission from calcinations is not part of the source category �������. This emission is included in the source category ���������������.
'(��� ������
The emission inventory is based on the methodology referred to as Tier 2 and Tier 3 in the IPCC Guidelines (IPCC 1997).
'(�)� "��&���������������
Large emission sources such as power plants, industrial plants and refin-eries are included as large point sources in the Danish emission database. Each point source may consist of more than one part, e.g. a power plant with several units. By registering the plants as point sources in the data-base it is possible to use plant-specific emission factors.
In the inventory for the year 2008, 70 stationary combustion plants are specified as large point sources. These point sources include:
• Power plants and decentralised CHP plants (combined heat and power plants).
• Municipal waste incineration plants. • Large industrial combustion plants. • Petroleum refining plants. The criteria for selection of point sources consist of the following:
• All centralized power plants, including smaller units. • All units with a capacity of above 25 MWe. • All district heating plants with an installed effect of 50 MWth or
above and significant fuel consumption. • All waste incineration plants obliged to publish annual environ-
mental reports according to Danish law (Miljøstyrelsen, 2006). • Industrial plants,
• with an installed effect of 50 MWth or above and significant fuel consumption.
• with a significant process related emission.
85
The fuel consumption of stationary combustion plants registered as large point sources in the 2008 inventory was 309 PJ. This corresponds to 58 % of the overall fuel consumption for stationary combustion.
A list of the large point sources for 2008 and the fuel consumption rates is provided in Appendix 8. The number of large point sources registered in the databases increased from 1990 to 2008.
The emissions from a point source are based either on plant specific emission data or, if plant specific data are not available, on fuel con-sumption data and the general Danish emission factors. Appendix 8 shows which of the emission data for large point sources are plant-specific and the corresponding share of the emission from stationary combustion.
SO2 and NOx emissions from large point sources are often plant-specific based on emission measurements. CO2 emission factors are plant specific for the major power plants. Emissions of CO and NMVOC are also plant-specific for some plants. Plant-specific emission data are obtained from:
• Annual environmental reports. • Annual plant-specific reporting of SO2 and NOx from power plants
>25MWe prepared for the Danish Energy Agency due to Danish leg-islation.
• Emission data reported by DONG Energy and Vattenfall, the two major electricity suppliers.
• CO2 data reported under the EU Emission Trading Scheme. • Emission data reported from industrial plants. Annual environmental reports for the plants include a considerable number of emission data sets. Emission data from annual environmental reports are, in general, based on emission measurements but some emis-sions have potentially been calculated from general emission factors.
If plant-specific emission factors are not available, general area source emission factors are used. Emissions of the greenhouse gases CH4 and N2O from the large point sources are all based on the area source emis-sion factors.
'(�(� 4������������
Fuels not combusted in large point sources are included as source cate-gory specific area sources in the emission database. Plants such as resi-dential boilers, small district heating plants, small CHP plants and some industrial boilers are defined as area sources. Emissions from area sources are based on fuel consumption data and emission factors. Further information on emission factors is provided in Chapter 14.7.
'(��� 4�������������-���� �����������
The fuel consumption rates are based on the official Danish energy statis-tics prepared by the Danish Energy Agency (DEA). The DEA aggregates fuel consumption rates to SNAP categories (DEA, 2008a). Some fuel
86
types in the official Danish energy statistics are added to obtain a less de-tailed fuel aggregation level cf. Appendix 5. The calorific values, on which the energy statistics are based, are also enclosed in Appendix 5. The correspondence list between the energy statistics and SNAP catego-ries is enclosed in Appendix 13.
The fuel consumption of the IPCC category ���!����������������������������� (corresponding to SNAP category ()�#�$ ��������$���!����������������* is not disaggregated into specific industries in the NERI emission database. So far disaggregation into specific industries is only estimated for the reporting to the Climate Convention. The disaggrega-tion of fuel consumption and emissions from the industrial category is discussed in Chapter 14.8.
Both traded and non-traded fuels are included in the Danish energy sta-tistics. Thus, for example, estimation of the annual consumption of non-traded wood is included.
Petroleum coke purchased abroad and combusted in Danish residential plants (border trade of 251 TJ) is added to the apparent consumption of petroleum coke and the emissions are included in the inventory.
The fuel consumption data for large point sources refer to the EU Emis-sion Trading Scheme (EU ETS) data for plants for which the CO2 emis-sion also refer to EU ETS, see Chapter 14.7.1.
For all other large point sources the fuel consumption refers to a DEA database (DEA, 2008c). The DEA compiles a database for the fuel con-sumption of each district heating and power-producing plant, based on data reported by plant operators.
The fuel consumption of area sources is calculated as total fuel consump-tion minus fuel consumption of large point sources.
The Danish national energy statistics includes three fuels used for non-energy purposes, namely bitumen, white spirit and lubricants. The total consumption for non-energy purposes is relatively low, e.g. 11.1 PJ in 2008. The use of white spirit is included in the inventory in ���+��������������������� (Nielsen et al., 2010a). The emissions associated with the use of bitumen and lubricants are included in ���������������� (Niel-sen et al., 2010a)� The non-energy use of fuels is included in the reference approach for Climate Convention reporting.
In Denmark all municipal waste incineration is utilised for heat and power production. Thus, incineration of waste is included as stationary combustion in the source category ������ (subcategories ���, ��' and ��"*.
Fuel consumption data are presented in Chapter 3.
'(�0� ��:�&���
Town gas has been included in the fuel category natural gas. The con-sumption of town gas in Denmark is very low, e.g. 0.4 PJ in 2008. In 1990
87
the town gas consumption was 1.5 PJ and the consumption has been steadily decreasing through out the time-series.
In Denmark town gas is produced based on natural gas. The use of coal for town gas production ceased in the early 1980s.
An indicative composition of town gas according to the largest supplier of town gas in Denmark is shown in Table 29 (KE, 2009).
Table 29 Composition of town gas currently used (KE, 2009). Component Town gas, % (mol.) Methane 43.9 Ethane 2.9 Propane 1.1 Butane 0.5 Carbon dioxide 0.4 Nitrogen 40.5 Oxygen 10.7
The lower heating value of the town gas currently used is 19.3 MJ per Nm3 and the CO2 emission factor 56.4 kg per GJ. This is very close to the emission factor used for natural gas of 56.77 kg per GJ. According to the supplier both the composition and heating value will change during the year. It has not been possible to obtain a yearly average.
In earlier years the composition of town gas was somewhat different. Table 30 is constructed with the input from Københavns Energi (KE) (Copenhagen Energy) and Danish Gas Technology Centre (DGC), (Jeppesen, 2008; Kristensen, 2007). The data refer to three measurements performed several years apart; the first in 2000 and the latest in 2005.
Table 30 Composition of town gas, information from the period 2000-2005. Component Town gas,
% (mol.) Methane 22.3-27.8
Ethane 1.2-1.8
Propane 0.5-0.9
Butane 0.13-0.2
Higher hydrocarbons 0-0.6
Carbon dioxide 8-11.6
Nitrogen 15.6-20.9
Oxygen 2.3-3.2
Hydrogen 35.4-40.5
Carbon monoxide 2.6-2.8
The lower calorific value has been between 15.6 and 17.8 MJ per Nm3. The CO2 emission factors - derived from the few available measurements - are in the range of 52-57 kg per GJ.�
The Danish approach includes town gas as part of the fuel category natural gas and thus indirectly assumes the same CO2 emission factor. This is a conservative approach ensuring that the CO2 emissions are not underestimated.
Due to the scarce data available and the very low consumption of town gas compared to consumption of natural gas, the methodology will be applied unchanged in future inventories.
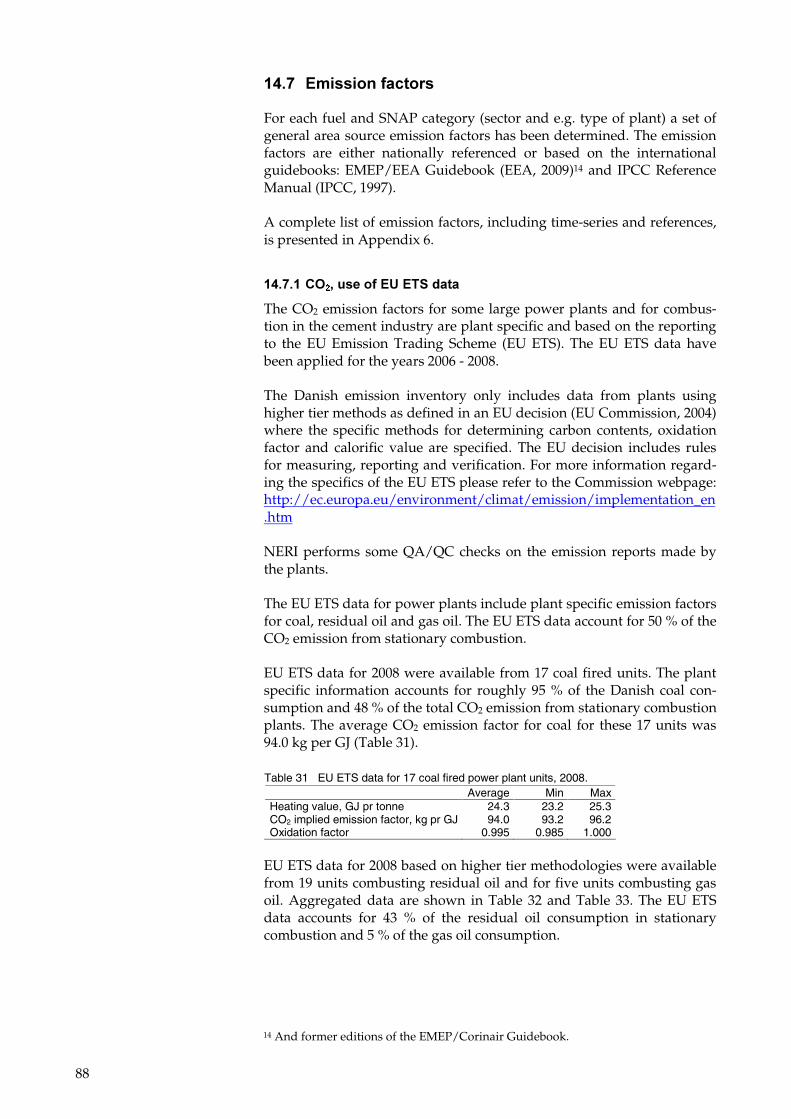
88
'(��� �����������������
For each fuel and SNAP category (sector and e.g. type of plant) a set of general area source emission factors has been determined. The emission factors are either nationally referenced or based on the international guidebooks: EMEP/EEA Guidebook (EEA, 2009)14 and IPCC Reference Manual (IPCC, 1997).
A complete list of emission factors, including time-series and references, is presented in Appendix 6.
'(���'�!,�-���������7���$�%����
The CO2 emission factors for some large power plants and for combus-tion in the cement industry are plant specific and based on the reporting to the EU Emission Trading Scheme (EU ETS). The EU ETS data have been applied for the years 2006 - 2008.
The Danish emission inventory only includes data from plants using higher tier methods as defined in an EU decision (EU Commission, 2004) where the specific methods for determining carbon contents, oxidation factor and calorific value are specified. The EU decision includes rules for measuring, reporting and verification. For more information regard-ing the specifics of the EU ETS please refer to the Commission webpage: http://ec.europa.eu/environment/climat/emission/implementation_en.htm
NERI performs some QA/QC checks on the emission reports made by the plants.
The EU ETS data for power plants include plant specific emission factors for coal, residual oil and gas oil. The EU ETS data account for 50 % of the CO2 emission from stationary combustion.
EU ETS data for 2008 were available from 17 coal fired units. The plant specific information accounts for roughly 95 % of the Danish coal con-sumption and 48 % of the total CO2 emission from stationary combustion plants. The average CO2 emission factor for coal for these 17 units was 94.0 kg per GJ (Table 31).
Table 31 EU ETS data for 17 coal fired power plant units, 2008. Average Min Max Heating value, GJ pr tonne 24.3 23.2 25.3 CO2 implied emission factor, kg pr GJ 94.0 93.2 96.2 Oxidation factor 0.995 0.985 1.000
EU ETS data for 2008 based on higher tier methodologies were available from 19 units combusting residual oil and for five units combusting gas oil. Aggregated data are shown in Table 32 and Table 33. The EU ETS data accounts for 43 % of the residual oil consumption in stationary combustion and 5 % of the gas oil consumption.
14 And former editions of the EMEP/Corinair Guidebook.
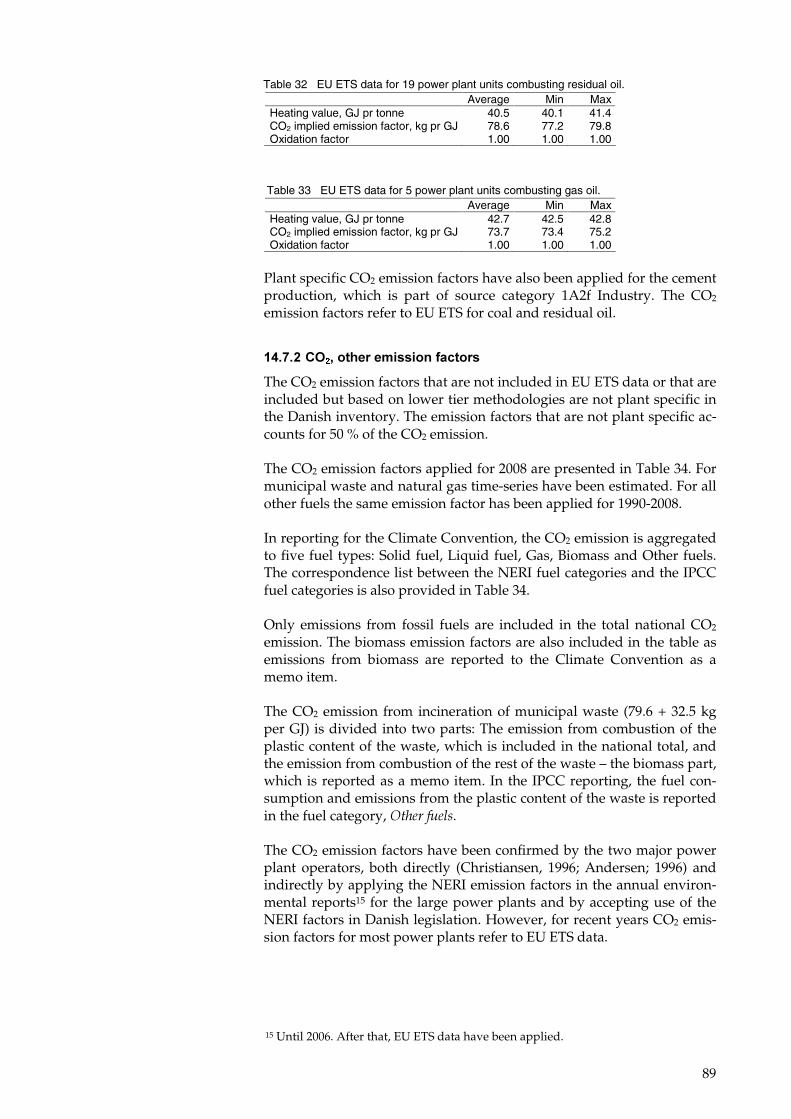
89
Table 32 EU ETS data for 19 power plant units combusting residual oil. Average Min Max Heating value, GJ pr tonne 40.5 40.1 41.4 CO2 implied emission factor, kg pr GJ 78.6 77.2 79.8 Oxidation factor 1.00 1.00 1.00
Table 33 EU ETS data for 5 power plant units combusting gas oil. Average Min Max Heating value, GJ pr tonne 42.7 42.5 42.8 CO2 implied emission factor, kg pr GJ 73.7 73.4 75.2 Oxidation factor 1.00 1.00 1.00
Plant specific CO2 emission factors have also been applied for the cement production, which is part of source category 1A2f Industry. The CO2 emission factors refer to EU ETS for coal and residual oil.
'(�����!,�-����������������������
The CO2 emission factors that are not included in EU ETS data or that are included but based on lower tier methodologies are not plant specific in the Danish inventory. The emission factors that are not plant specific ac-counts for 50 % of the CO2 emission.
The CO2 emission factors applied for 2008 are presented in Table 34. For municipal waste and natural gas time-series have been estimated. For all other fuels the same emission factor has been applied for 1990-2008.
In reporting for the Climate Convention, the CO2 emission is aggregated to five fuel types: Solid fuel, Liquid fuel, Gas, Biomass and Other fuels. The correspondence list between the NERI fuel categories and the IPCC fuel categories is also provided in Table 34.
Only emissions from fossil fuels are included in the total national CO2 emission. The biomass emission factors are also included in the table as emissions from biomass are reported to the Climate Convention as a memo item.
The CO2 emission from incineration of municipal waste (79.6 + 32.5 kg per GJ) is divided into two parts: The emission from combustion of the plastic content of the waste, which is included in the national total, and the emission from combustion of the rest of the waste – the biomass part, which is reported as a memo item. In the IPCC reporting, the fuel con-sumption and emissions from the plastic content of the waste is reported in the fuel category, �����!���.
The CO2 emission factors have been confirmed by the two major power plant operators, both directly (Christiansen, 1996; Andersen; 1996) and indirectly by applying the NERI emission factors in the annual environ-mental reports15 for the large power plants and by accepting use of the NERI factors in Danish legislation. However, for recent years CO2 emis-sion factors for most power plants refer to EU ETS data.
15 Until 2006. After that, EU ETS data have been applied.
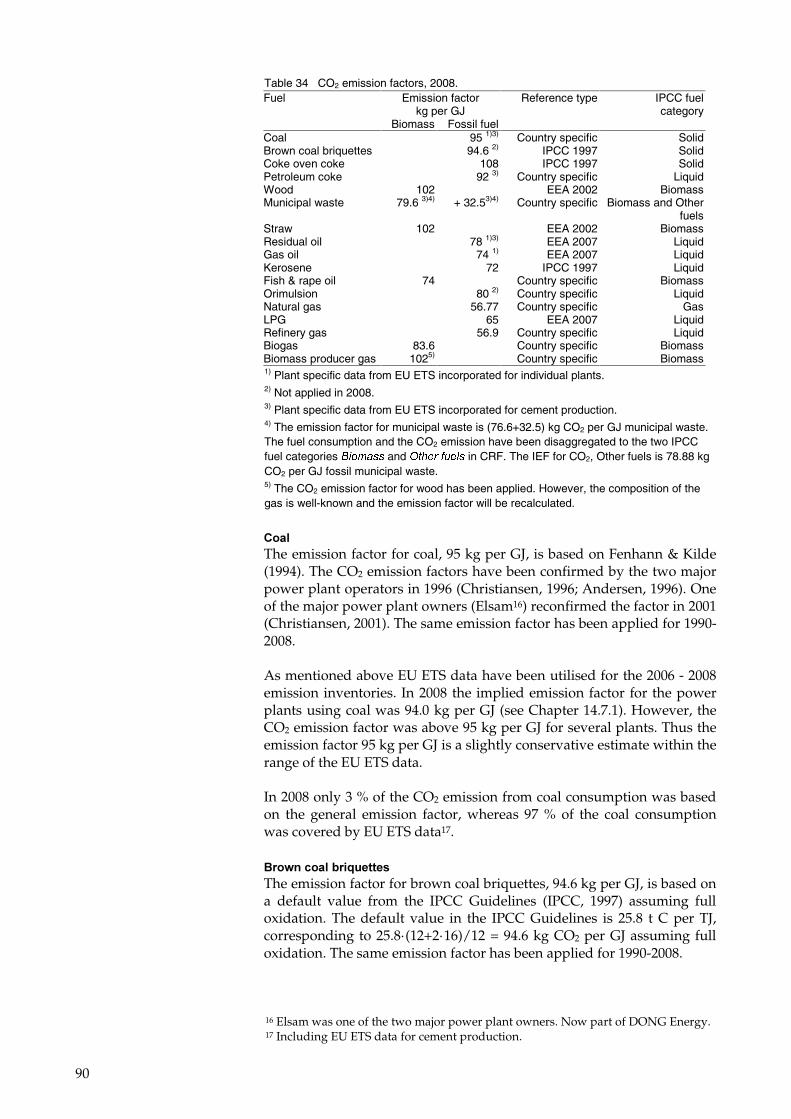
90
Table 34 CO2 emission factors, 2008. Fuel Emission factor
kg per GJ Reference type IPCC fuel
category Biomass Fossil fuel Coal 95 1)3) Country specific Solid Brown coal briquettes 94.6 2) IPCC 1997 Solid Coke oven coke 108 IPCC 1997 Solid Petroleum coke 92 3) Country specific Liquid Wood 102 EEA 2002 Biomass Municipal waste 79.6 3)4) + 32.53)4) Country specific Biomass and Other
fuels Straw 102 EEA 2002 Biomass Residual oil 78 1)3) EEA 2007 Liquid Gas oil 74 1) EEA 2007 Liquid Kerosene 72 IPCC 1997 Liquid Fish & rape oil 74 Country specific Biomass Orimulsion 80 2) Country specific Liquid Natural gas 56.77 Country specific Gas LPG 65 EEA 2007 Liquid Refinery gas 56.9 Country specific Liquid Biogas 83.6 Country specific Biomass Biomass producer gas 1025) Country specific Biomass 1) Plant specific data from EU ETS incorporated for individual plants. 2) Not applied in 2008. 3) Plant specific data from EU ETS incorporated for cement production. 4) The emission factor for municipal waste is (76.6+32.5) kg CO2 per GJ municipal waste. The fuel consumption and the CO2 emission have been disaggregated to the two IPCC fuel categories ������� and ����� �� in CRF. The IEF for CO2, Other fuels is 78.88 kg CO2 per GJ fossil municipal waste. 5) The CO2 emission factor for wood has been applied. However, the composition of the gas is well-known and the emission factor will be recalculated.
!�� �The emission factor for coal, 95 kg per GJ, is based on Fenhann & Kilde (1994). The CO2 emission factors have been confirmed by the two major power plant operators in 1996 (Christiansen, 1996; Andersen, 1996). One of the major power plant owners (Elsam16) reconfirmed the factor in 2001 (Christiansen, 2001). The same emission factor has been applied for 1990-2008.
As mentioned above EU ETS data have been utilised for the 2006 - 2008 emission inventories. In 2008 the implied emission factor for the power plants using coal was 94.0 kg per GJ (see Chapter 14.7.1). However, the CO2 emission factor was above 95 kg per GJ for several plants. Thus the emission factor 95 kg per GJ is a slightly conservative estimate within the range of the EU ETS data.
In 2008 only 3 % of the CO2 emission from coal consumption was based on the general emission factor, whereas 97 % of the coal consumption was covered by EU ETS data17.
6��:���� ����;�������The emission factor for brown coal briquettes, 94.6 kg per GJ, is based on a default value from the IPCC Guidelines (IPCC, 1997) assuming full oxidation. The default value in the IPCC Guidelines is 25.8 t C per TJ, corresponding to 25.8·(12+2·16)/12 = 94.6 kg CO2 per GJ assuming full oxidation. The same emission factor has been applied for 1990-2008.
16 Elsam was one of the two major power plant owners. Now part of DONG Energy. 17 Including EU ETS data for cement production.
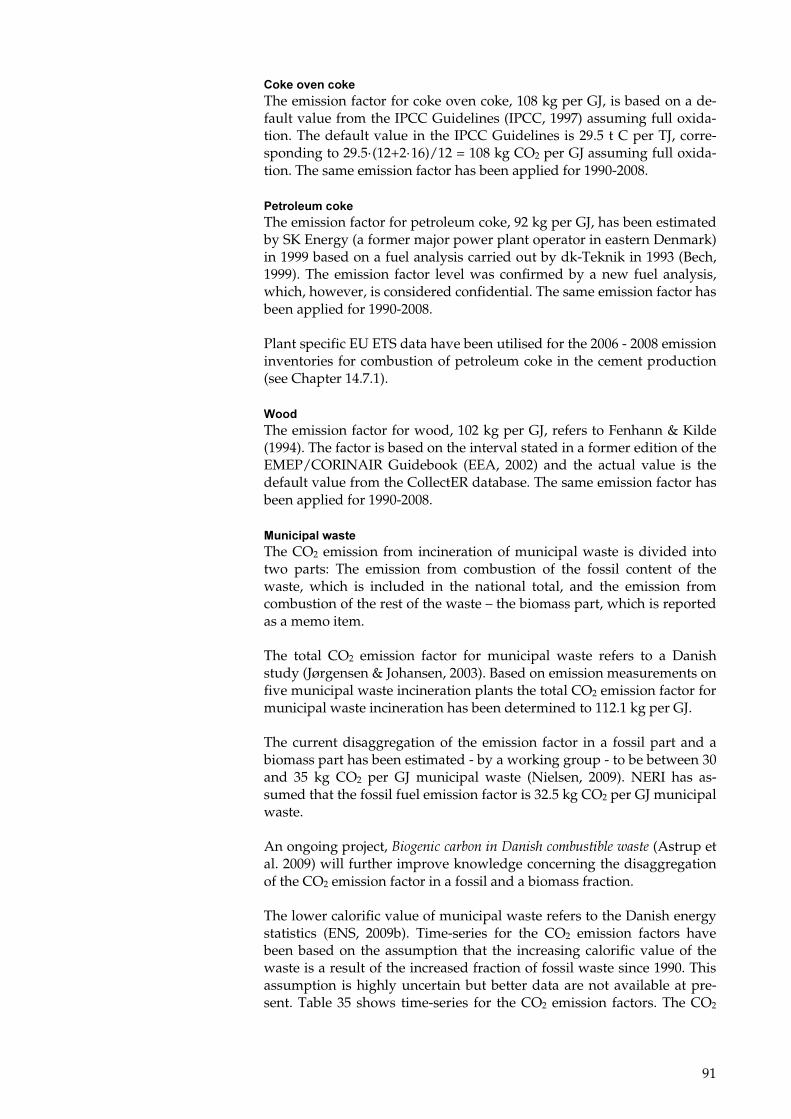
91
!�<��������<��The emission factor for coke oven coke, 108 kg per GJ, is based on a de-fault value from the IPCC Guidelines (IPCC, 1997) assuming full oxida-tion. The default value in the IPCC Guidelines is 29.5 t C per TJ, corre-sponding to 29.5·(12+2·16)/12 = 108 kg CO2 per GJ assuming full oxida-tion. The same emission factor has been applied for 1990-2008.
#���� ������<��The emission factor for petroleum coke, 92 kg per GJ, has been estimated by SK Energy (a former major power plant operator in eastern Denmark) in 1999 based on a fuel analysis carried out by dk-Teknik in 1993 (Bech, 1999). The emission factor level was confirmed by a new fuel analysis, which, however, is considered confidential. The same emission factor has been applied for 1990-2008.
Plant specific EU ETS data have been utilised for the 2006 - 2008 emission inventories for combustion of petroleum coke in the cement production (see Chapter 14.7.1).
=��%�The emission factor for wood, 102 kg per GJ, refers to Fenhann & Kilde (1994). The factor is based on the interval stated in a former edition of the EMEP/CORINAIR Guidebook (EEA, 2002) and the actual value is the default value from the CollectER database. The same emission factor has been applied for 1990-2008.
.������ �:�����The CO2 emission from incineration of municipal waste is divided into two parts: The emission from combustion of the fossil content of the waste, which is included in the national total, and the emission from combustion of the rest of the waste – the biomass part, which is reported as a memo item.
The total CO2 emission factor for municipal waste refers to a Danish study (Jørgensen & Johansen, 2003). Based on emission measurements on five municipal waste incineration plants the total CO2 emission factor for municipal waste incineration has been determined to 112.1 kg per GJ.
The current disaggregation of the emission factor in a fossil part and a biomass part has been estimated - by a working group - to be between 30 and 35 kg CO2 per GJ municipal waste (Nielsen, 2009). NERI has as-sumed that the fossil fuel emission factor is 32.5 kg CO2 per GJ municipal waste.
An ongoing project, ,����������� ������-�������$ �� ���.�� (Astrup et al. 2009) will further improve knowledge concerning the disaggregation of the CO2 emission factor in a fossil and a biomass fraction.
The lower calorific value of municipal waste refers to the Danish energy statistics (ENS, 2009b). Time-series for the CO2 emission factors have been based on the assumption that the increasing calorific value of the waste is a result of the increased fraction of fossil waste since 1990. This assumption is highly uncertain but better data are not available at pre-sent. Table 35 shows time-series for the CO2 emission factors. The CO2
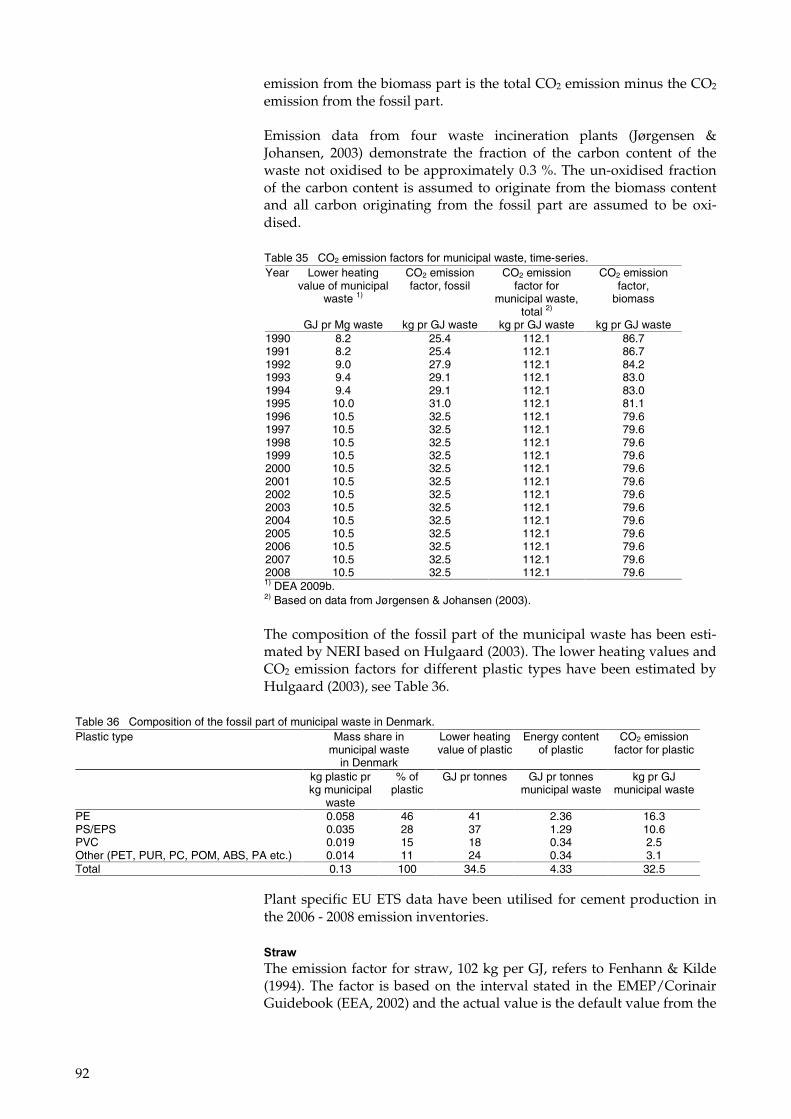
92
emission from the biomass part is the total CO2 emission minus the CO2 emission from the fossil part.
Emission data from four waste incineration plants (Jørgensen & Johansen, 2003) demonstrate the fraction of the carbon content of the waste not oxidised to be approximately 0.3 %. The un-oxidised fraction of the carbon content is assumed to originate from the biomass content and all carbon originating from the fossil part are assumed to be oxi-dised.
Table 35 CO2 emission factors for municipal waste, time-series. Year Lower heating
value of municipal waste 1)
CO2 emission factor, fossil
CO2 emission factor for
municipal waste, total 2)
CO2 emission factor,
biomass
GJ pr Mg waste kg pr GJ waste kg pr GJ waste kg pr GJ waste 1990 8.2 25.4 112.1 86.7 1991 8.2 25.4 112.1 86.7 1992 9.0 27.9 112.1 84.2 1993 9.4 29.1 112.1 83.0 1994 9.4 29.1 112.1 83.0 1995 10.0 31.0 112.1 81.1 1996 10.5 32.5 112.1 79.6 1997 10.5 32.5 112.1 79.6 1998 10.5 32.5 112.1 79.6 1999 10.5 32.5 112.1 79.6 2000 10.5 32.5 112.1 79.6 2001 10.5 32.5 112.1 79.6 2002 10.5 32.5 112.1 79.6 2003 10.5 32.5 112.1 79.6 2004 10.5 32.5 112.1 79.6 2005 10.5 32.5 112.1 79.6 2006 10.5 32.5 112.1 79.6 2007 10.5 32.5 112.1 79.6 2008 10.5 32.5 112.1 79.6 1) DEA 2009b. 2) Based on data from Jørgensen & Johansen (2003).
The composition of the fossil part of the municipal waste has been esti-mated by NERI based on Hulgaard (2003). The lower heating values and CO2 emission factors for different plastic types have been estimated by Hulgaard (2003), see Table 36.
Table 36 Composition of the fossil part of municipal waste in Denmark. Plastic type Mass share in
municipal waste in Denmark
Lower heating value of plastic
Energy content of plastic
CO2 emission factor for plastic
kg plastic pr kg municipal
waste
% of plastic
GJ pr tonnes GJ pr tonnes municipal waste
kg pr GJ municipal waste
PE 0.058 46 41 2.36 16.3 PS/EPS 0.035 28 37 1.29 10.6 PVC 0.019 15 18 0.34 2.5 Other (PET, PUR, PC, POM, ABS, PA etc.) 0.014 11 24 0.34 3.1 Total 0.13 100 34.5 4.33 32.5
Plant specific EU ETS data have been utilised for cement production in the 2006 - 2008 emission inventories.
$���:�The emission factor for straw, 102 kg per GJ, refers to Fenhann & Kilde (1994). The factor is based on the interval stated in the EMEP/Corinair Guidebook (EEA, 2002) and the actual value is the default value from the
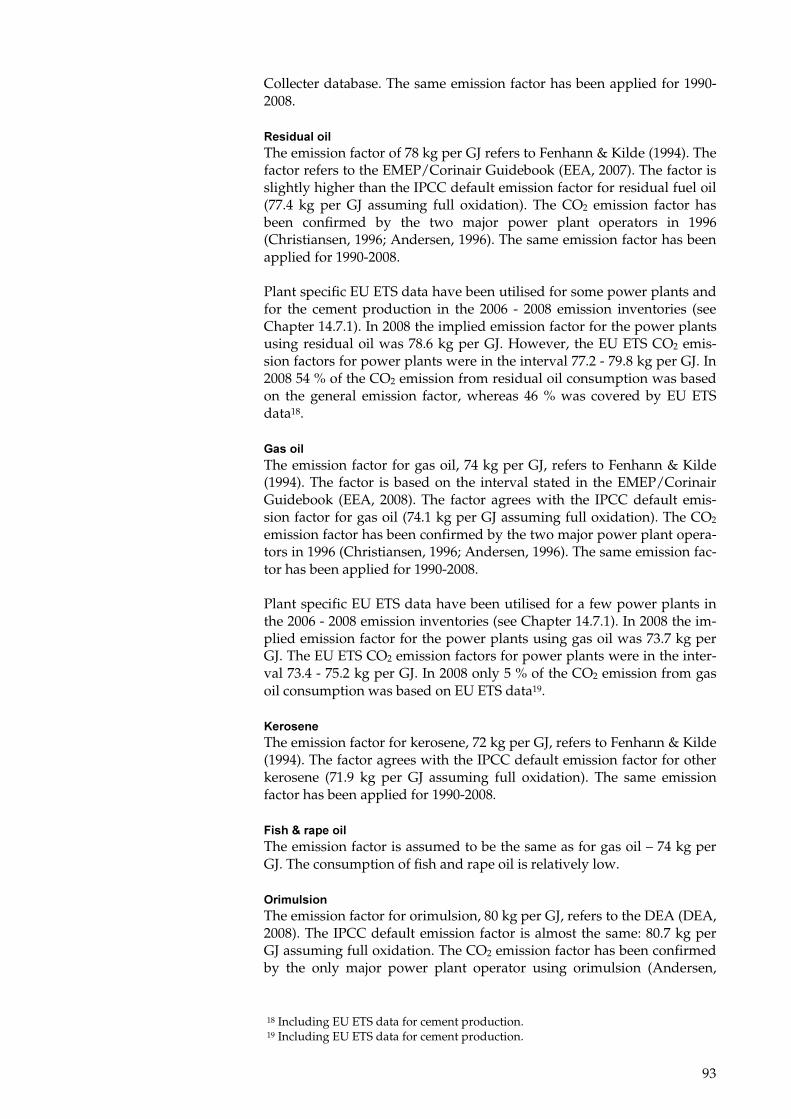
93
Collecter database. The same emission factor has been applied for 1990-2008.
����%�� ��� �The emission factor of 78 kg per GJ refers to Fenhann & Kilde (1994). The factor refers to the EMEP/Corinair Guidebook (EEA, 2007). The factor is slightly higher than the IPCC default emission factor for residual fuel oil (77.4 kg per GJ assuming full oxidation). The CO2 emission factor has been confirmed by the two major power plant operators in 1996 (Christiansen, 1996; Andersen, 1996). The same emission factor has been applied for 1990-2008.
Plant specific EU ETS data have been utilised for some power plants and for the cement production in the 2006 - 2008 emission inventories (see Chapter 14.7.1). In 2008 the implied emission factor for the power plants using residual oil was 78.6 kg per GJ. However, the EU ETS CO2 emis-sion factors for power plants were in the interval 77.2 - 79.8 kg per GJ. In 2008 54 % of the CO2 emission from residual oil consumption was based on the general emission factor, whereas 46 % was covered by EU ETS data18.
+����� �The emission factor for gas oil, 74 kg per GJ, refers to Fenhann & Kilde (1994). The factor is based on the interval stated in the EMEP/Corinair Guidebook (EEA, 2008). The factor agrees with the IPCC default emis-sion factor for gas oil (74.1 kg per GJ assuming full oxidation). The CO2 emission factor has been confirmed by the two major power plant opera-tors in 1996 (Christiansen, 1996; Andersen, 1996). The same emission fac-tor has been applied for 1990-2008.�
Plant specific EU ETS data have been utilised for a few power plants in the 2006 - 2008 emission inventories (see Chapter 14.7.1). In 2008 the im-plied emission factor for the power plants using gas oil was 73.7 kg per GJ. The EU ETS CO2 emission factors for power plants were in the inter-val 73.4 - 75.2 kg per GJ. In 2008 only 5 % of the CO2 emission from gas oil consumption was based on EU ETS data19.
>�������The emission factor for kerosene, 72 kg per GJ, refers to Fenhann & Kilde (1994). The factor agrees with the IPCC default emission factor for other kerosene (71.9 kg per GJ assuming full oxidation). The same emission factor has been applied for 1990-2008.
*���?�������� �The emission factor is assumed to be the same as for gas oil – 74 kg per GJ. The consumption of fish and rape oil is relatively low.
,���� ����The emission factor for orimulsion, 80 kg per GJ, refers to the DEA (DEA, 2008). The IPCC default emission factor is almost the same: 80.7 kg per GJ assuming full oxidation. The CO2 emission factor has been confirmed by the only major power plant operator using orimulsion (Andersen,
18 Including EU ETS data for cement production. 19 Including EU ETS data for cement production.
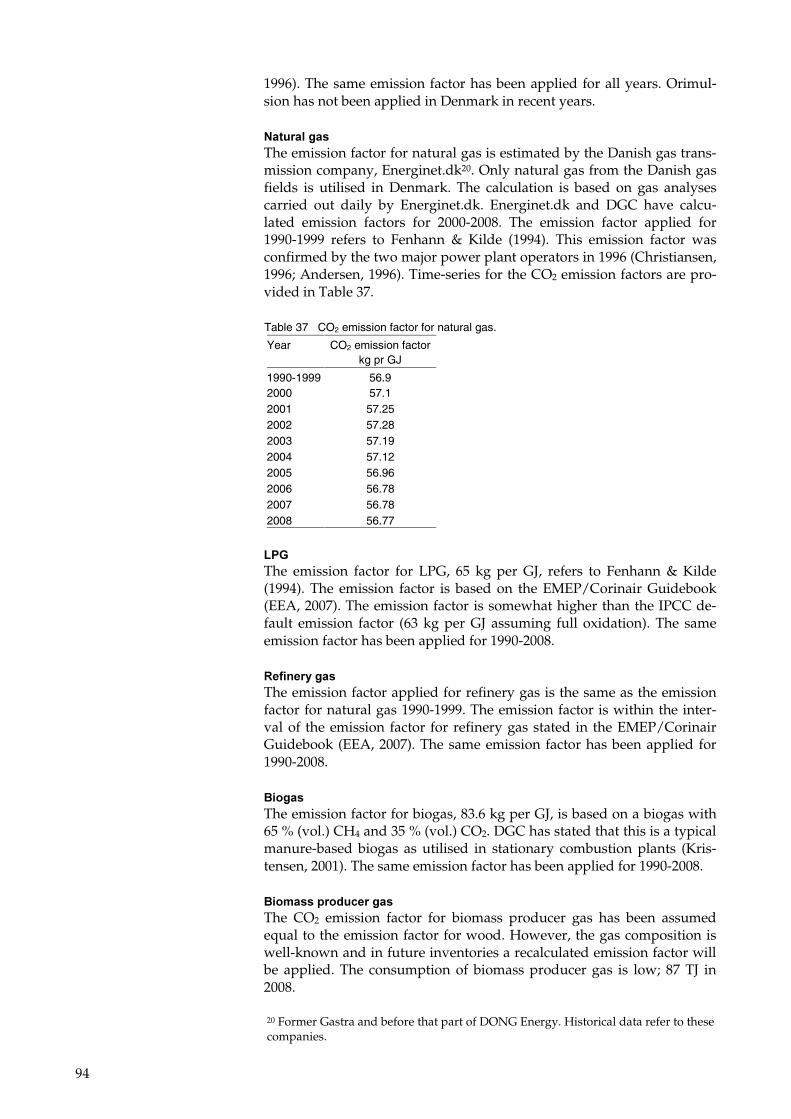
94
1996). The same emission factor has been applied for all years. Orimul-sion has not been applied in Denmark in recent years.
������ �&���The emission factor for natural gas is estimated by the Danish gas trans-mission company, Energinet.dk20. Only natural gas from the Danish gas fields is utilised in Denmark. The calculation is based on gas analyses carried out daily by Energinet.dk. Energinet.dk and DGC have calcu-lated emission factors for 2000-2008. The emission factor applied for 1990-1999 refers to Fenhann & Kilde (1994). This emission factor was confirmed by the two major power plant operators in 1996 (Christiansen, 1996; Andersen, 1996). Time-series for the CO2 emission factors are pro-vided in Table 37.
Table 37 CO2 emission factor for natural gas.
Year CO2 emission factor kg pr GJ
1990-1999 56.9 2000 57.1 2001 57.25 2002 57.28 2003 57.19 2004 57.12 2005 56.96 2006 56.78 2007 56.78 2008 56.77
"#+�The emission factor for LPG, 65 kg per GJ, refers to Fenhann & Kilde (1994). The emission factor is based on the EMEP/Corinair Guidebook (EEA, 2007). The emission factor is somewhat higher than the IPCC de-fault emission factor (63 kg per GJ assuming full oxidation). The same emission factor has been applied for 1990-2008.
��������&���The emission factor applied for refinery gas is the same as the emission factor for natural gas 1990-1999. The emission factor is within the inter-val of the emission factor for refinery gas stated in the EMEP/Corinair Guidebook (EEA, 2007). The same emission factor has been applied for 1990-2008.�
6��&���The emission factor for biogas, 83.6 kg per GJ, is based on a biogas with 65 % (vol.) CH4 and 35 % (vol.) CO2. DGC has stated that this is a typical manure-based biogas as utilised in stationary combustion plants (Kris-tensen, 2001). The same emission factor has been applied for 1990-2008.
6����������%�����&���The CO2 emission factor for biomass producer gas has been assumed equal to the emission factor for wood. However, the gas composition is well-known and in future inventories a recalculated emission factor will be applied. The consumption of biomass producer gas is low; 87 TJ in 2008.
20 Former Gastra and before that part of DONG Energy. Historical data refer to these companies.
95
'(���)�!3��
The CH4 emission factors applied for 2008 are presented in Table 38. In general, the same emission factors have been applied for 1990-2008. However, time-series have been estimated for both natural gas fuelled engines and biogas fuelled engines. Time-series has also been estimated for MSW incineration plants, which, however, is not a large emission source.
Emission factors for CHP plants < 25 MWe refer to emission measure-ments carried out on Danish plants (Nielsen et al. 2010c; Nielsen & Illerup, 2003; Nielsen et al. 2008). Most other emission factors refer to the EMEP/Corinair Guidebook, 2007 update (EEA, 2007).
Gas engines combusting natural gas or biogas accounts for approxi-mately half the CH4 emission from stationary combustion plants. The relatively high emission factor for gas engines is well-documented and further discussed below.
Time-series for the CH4 emission factor for wood combustion in residen-tial plants have not been estimated. Due to the increasing importance of this source this will be considered in future inventories.
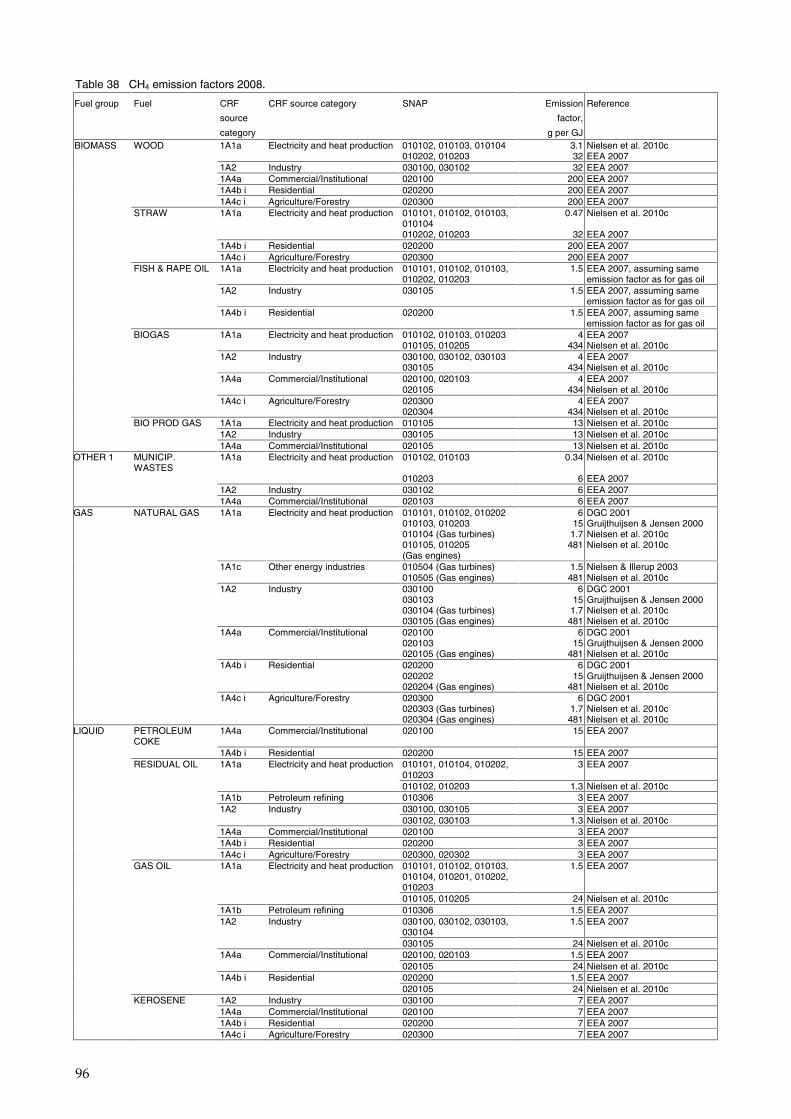
96
Table 38 CH4 emission factors 2008.
Fuel group Fuel CRF
source
category
CRF source category SNAP Emission
factor,
g per GJ
Reference
BIOMASS WOOD 1A1a Electricity and heat production 010102, 010103, 010104 3.1 Nielsen et al. 2010c 010202, 010203 32 EEA 2007 1A2 Industry 030100, 030102 32 EEA 2007 1A4a Commercial/Institutional 020100 200 EEA 2007 1A4b i Residential 020200 200 EEA 2007 1A4c i Agriculture/Forestry 020300 200 EEA 2007 STRAW 1A1a Electricity and heat production 010101, 010102, 010103,
010104 0.47 Nielsen et al. 2010c
010202, 010203 32 EEA 2007 1A4b i Residential 020200 200 EEA 2007 1A4c i Agriculture/Forestry 020300 200 EEA 2007 FISH & RAPE OIL 1A1a Electricity and heat production 010101, 010102, 010103,
010202, 010203 1.5 EEA 2007, assuming same
emission factor as for gas oil 1A2 Industry 030105 1.5 EEA 2007, assuming same
emission factor as for gas oil 1A4b i Residential 020200 1.5 EEA 2007, assuming same
emission factor as for gas oil BIOGAS 1A1a Electricity and heat production 010102, 010103, 010203 4 EEA 2007 010105, 010205 434 Nielsen et al. 2010c 1A2 Industry 030100, 030102, 030103 4 EEA 2007 030105 434 Nielsen et al. 2010c 1A4a Commercial/Institutional 020100, 020103 4 EEA 2007 020105 434 Nielsen et al. 2010c 1A4c i Agriculture/Forestry 020300 4 EEA 2007 020304 434 Nielsen et al. 2010c
BIO PROD GAS 1A1a Electricity and heat production 010105 13 Nielsen et al. 2010c 1A2 Industry 030105 13 Nielsen et al. 2010c 1A4a Commercial/Institutional 020105 13 Nielsen et al. 2010c
OTHER 1 MUNICIP. WASTES
1A1a Electricity and heat production 010102, 010103 0.34 Nielsen et al. 2010c
010203 6 EEA 2007 1A2 Industry 030102 6 EEA 2007 1A4a Commercial/Institutional 020103 6 EEA 2007
GAS NATURAL GAS 1A1a Electricity and heat production 010101, 010102, 010202 6 DGC 2001 010103, 010203 15 Gruijthuijsen & Jensen 2000 010104 (Gas turbines) 1.7 Nielsen et al. 2010c 010105, 010205
(Gas engines) 481 Nielsen et al. 2010c
1A1c Other energy industries 010504 (Gas turbines) 1.5 Nielsen & Illerup 2003 010505 (Gas engines) 481 Nielsen et al. 2010c 1A2 Industry 030100 6 DGC 2001 030103 15 Gruijthuijsen & Jensen 2000 030104 (Gas turbines) 1.7 Nielsen et al. 2010c 030105 (Gas engines) 481 Nielsen et al. 2010c 1A4a Commercial/Institutional 020100 6 DGC 2001 020103 15 Gruijthuijsen & Jensen 2000 020105 (Gas engines) 481 Nielsen et al. 2010c 1A4b i Residential 020200 6 DGC 2001 020202 15 Gruijthuijsen & Jensen 2000 020204 (Gas engines) 481 Nielsen et al. 2010c 1A4c i Agriculture/Forestry 020300 6 DGC 2001 020303 (Gas turbines) 1.7 Nielsen et al. 2010c 020304 (Gas engines) 481 Nielsen et al. 2010c LIQUID PETROLEUM
COKE 1A4a Commercial/Institutional 020100 15 EEA 2007
1A4b i Residential 020200 15 EEA 2007 RESIDUAL OIL 1A1a Electricity and heat production 010101, 010104, 010202,
010203 3 EEA 2007
010102, 010203 1.3 Nielsen et al. 2010c 1A1b Petroleum refining 010306 3 EEA 2007 1A2 Industry 030100, 030105 3 EEA 2007 030102, 030103 1.3 Nielsen et al. 2010c 1A4a Commercial/Institutional 020100 3 EEA 2007 1A4b i Residential 020200 3 EEA 2007 1A4c i Agriculture/Forestry 020300, 020302 3 EEA 2007 GAS OIL 1A1a Electricity and heat production 010101, 010102, 010103,
010104, 010201, 010202, 010203
1.5 EEA 2007
010105, 010205 24 Nielsen et al. 2010c 1A1b Petroleum refining 010306 1.5 EEA 2007 1A2 Industry 030100, 030102, 030103,
030104 1.5 EEA 2007
030105 24 Nielsen et al. 2010c 1A4a Commercial/Institutional 020100, 020103 1.5 EEA 2007 020105 24 Nielsen et al. 2010c 1A4b i Residential 020200 1.5 EEA 2007 020105 24 Nielsen et al. 2010c KEROSENE 1A2 Industry 030100 7 EEA 2007 1A4a Commercial/Institutional 020100 7 EEA 2007 1A4b i Residential 020200 7 EEA 2007 1A4c i Agriculture/Forestry 020300 7 EEA 2007
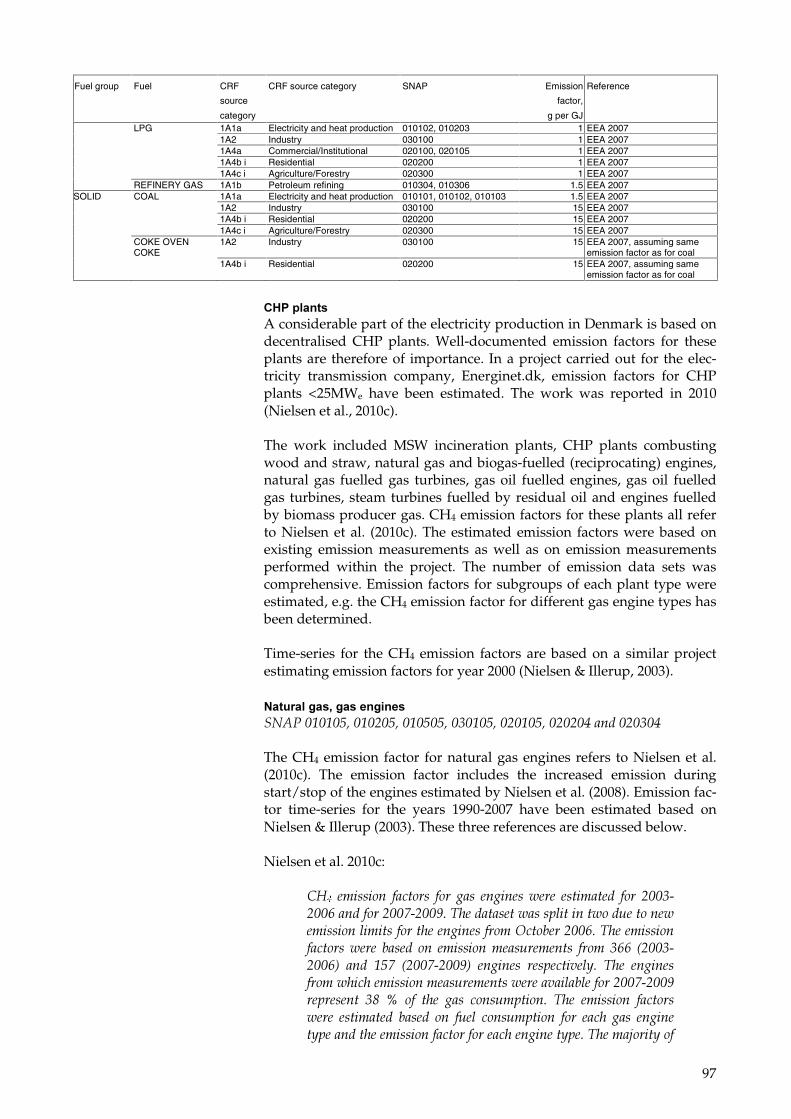
97
Fuel group Fuel CRF
source
category
CRF source category SNAP Emission
factor,
g per GJ
Reference
LPG 1A1a Electricity and heat production 010102, 010203 1 EEA 2007 1A2 Industry 030100 1 EEA 2007 1A4a Commercial/Institutional 020100, 020105 1 EEA 2007 1A4b i Residential 020200 1 EEA 2007 1A4c i Agriculture/Forestry 020300 1 EEA 2007
REFINERY GAS 1A1b Petroleum refining 010304, 010306 1.5 EEA 2007 SOLID COAL 1A1a Electricity and heat production 010101, 010102, 010103 1.5 EEA 2007 1A2 Industry 030100 15 EEA 2007 1A4b i Residential 020200 15 EEA 2007 1A4c i Agriculture/Forestry 020300 15 EEA 2007 COKE OVEN
COKE 1A2 Industry 030100 15 EEA 2007, assuming same
emission factor as for coal 1A4b i Residential 020200 15 EEA 2007, assuming same
emission factor as for coal
!3#�� ����A considerable part of the electricity production in Denmark is based on decentralised CHP plants. Well-documented emission factors for these plants are therefore of importance. In a project carried out for the elec-tricity transmission company, Energinet.dk, emission factors for CHP plants <25MWe have been estimated. The work was reported in 2010 (Nielsen et al., 2010c).
The work included MSW incineration plants, CHP plants combusting wood and straw, natural gas and biogas-fuelled (reciprocating) engines, natural gas fuelled gas turbines, gas oil fuelled engines, gas oil fuelled gas turbines, steam turbines fuelled by residual oil and engines fuelled by biomass producer gas. CH4 emission factors for these plants all refer to Nielsen et al. (2010c). The estimated emission factors were based on existing emission measurements as well as on emission measurements performed within the project. The number of emission data sets was comprehensive. Emission factors for subgroups of each plant type were estimated, e.g. the CH4 emission factor for different gas engine types has been determined.
Time-series for the CH4 emission factors are based on a similar project estimating emission factors for year 2000 (Nielsen & Illerup, 2003).
������ �&��-�&����&�����/���(�(�(0��(�('(0��(�(0(0��()(�(0��('(�(0��('('("�����('()("�
The CH4 emission factor for natural gas engines refers to Nielsen et al. (2010c). The emission factor includes the increased emission during start/stop of the engines estimated by Nielsen et al. (2008). Emission fac-tor time-series for the years 1990-2007 have been estimated based on Nielsen & Illerup (2003). These three references are discussed below.
Nielsen et al. 2010c:
#��� �$����� !����� !��� ��� �������.���� ��$���� !��� '(()�'((1�����!���'((2�'((3��4��������.���������.����������.��$�������$��!�������������!��$���� ���'((1��4����$�����!�����.���� ���� ��� �$�����$�����$��� !��$� )11� 5'(()�'((1*� ���� �02� 5'((2�'((3*� ������� ������+����� 4��� �������!��$�.������$�����$�����$���.�����+���� ���!���'((2�'((3��������� )6� 7� �!� ��� ��� ����$������ 4��� �$����� !�����.���� ��$���� ���� ��� !���� ����$����� !��� ����� ��� �������������������$�����!�����!��������������������4���$�8������!�
98
�$�����$�����$������.����������!��$���.������������8����������������������$������!������� �������������� ���5#��� 9� / :�#*�� �� ������ ������������� !����� .�� ���$���� ���� ��� 3� �$����� $�����$��� ���������� ��� #�������/ :�#����
Nielsen & Illerup (2003):�
����$�����!����� !��������������������.����$���� ������� '3�� �$����� $�����$��� ��� ��"� ��!!����� ������ 4�������� !��$�.������$�����$�����$���.�����+���� ��������������""�7��!���������������$��������������������������'(((���
Nielsen et al. (2008):
4���������������������%�������������!������������������!��������� �$����� !������ 4��� !����� .�� �������� !��� ��� �$���������$�������/������;���������5'(()*��&��������������������!�����.���������������/������������5'(�(�*��
The emission factor for lean-burn gas engines is relatively high, espe-cially for pre-chamber engines, which account for more than half the gas consumption in Danish gas engines. However, the emission factors for different pre-chamber engine types differ considerably.
The installation of natural gas engines in decentralised CHP plants in Denmark has taken place since 1990. The first engines installed were relatively small open-chamber engines but later mainly pre-chamber en-gines were installed. As mentioned above, pre-chamber engines have a higher CH4 emission factor than open-chamber engines; therefore, the emission factor has increased during the period 1990-1995. After that technical improvements of the engines have been implemented as a re-sult of upcoming emission limits that most installed gas engines had to meet in late 2006 (MST, 2005).
The time-series were based on:
• Full load emission factors for different engine types in year 2000 (Nielsen & Illerup, 2003), 2003-2006 and 2007-2009 (Nielsen et al. 2010c).
• Data for year of installation for each engine and fuel consumption of each engine 1994-2002 from the Danish Energy Agency (DEA, 2003).
• Research concerning the CH4 emission from gas engines carried out in 1997 (Nielsen & Wit, 1997).
• Correction factors including increased emission during start/stop of the engines (Nielsen et al. 2008)
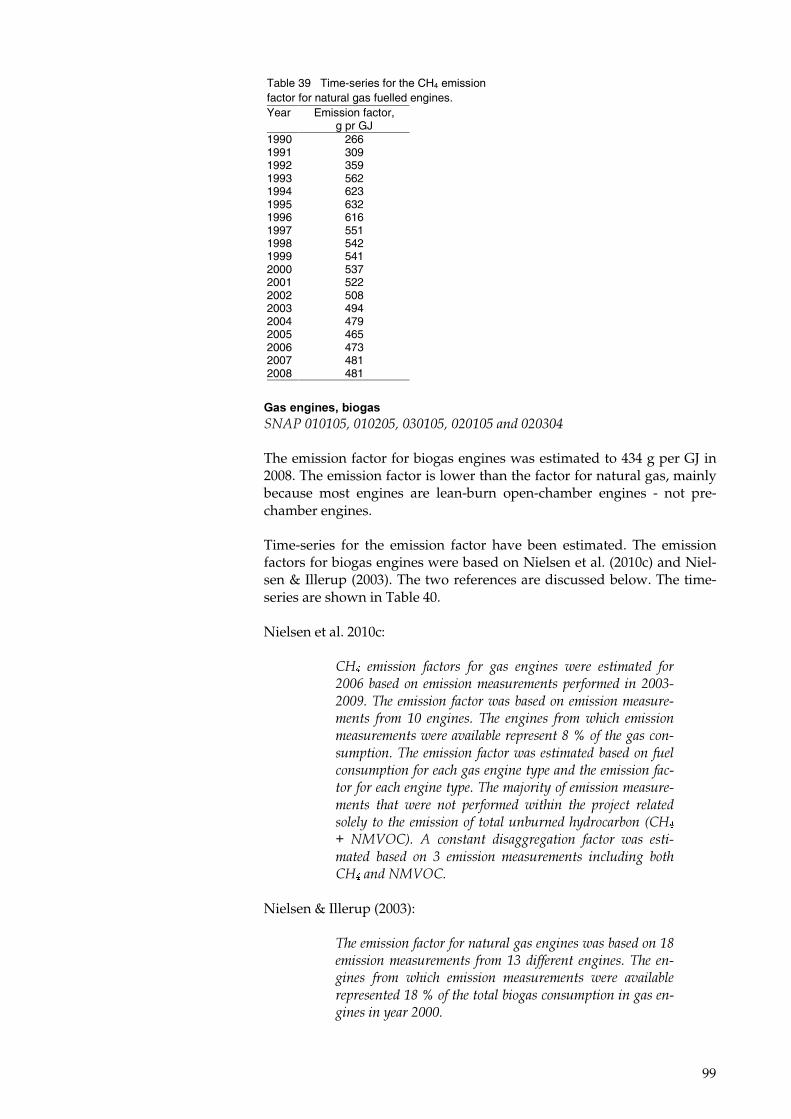
99
Table 39 Time-series for the CH4 emission factor for natural gas fuelled engines. Year Emission factor,
g pr GJ 1990 266 1991 309 1992 359 1993 562 1994 623 1995 632 1996 616 1997 551 1998 542 1999 541 2000 537 2001 522 2002 508 2003 494 2004 479 2005 465 2006 473 2007 481 2008 481
+����&���-����&����/���(�(�(0��(�('(0��()(�(0��('(�(0�����('()("�
The emission factor for biogas engines was estimated to 434 g per GJ in 2008. The emission factor is lower than the factor for natural gas, mainly because most engines are lean-burn open-chamber engines - not pre-chamber engines.
Time-series for the emission factor have been estimated. The emission factors for biogas engines were based on Nielsen et al. (2010c) and Niel-sen & Illerup (2003). The two references are discussed below. The time-series are shown in Table 40.
Nielsen et al. 2010c:
#��� �$����� !����� !��� ��� ������� .���� ��$���� !���'((1� ������� �$�����$�����$������!��$��� ���'(()�'((3��4����$�����!�����.�� ��������$�����$������$��� !��$� �(� �������� 4��� ������� !��$�.����� �$�����$�����$���.�����+���� �����������6�7��!������������$������4����$�����!�����.����$���� �������!��������$�����!������������������������������$�����!������!��������������������4���$�8������!��$�����$������$��� ��� .���� ��� ���!��$��� .����� ��� ���8��� �������������������$������!������� �������������� ���5#���9� / :�#*�� �� ������ ������������� !����� .�� ���$���� ���� ��� )� �$����� $�����$��� ���������� ���#�������/ :�#��
Nielsen & Illerup (2003):�
4����$�����!�����!��������������������.�� ��������6��$�����$�����$��� !��$��)���!!����� ��������4��� �������� !��$� .����� �$����� $�����$��� .���� �+���� ��������������6�7��!�������� ���������$���������������������������'(((��
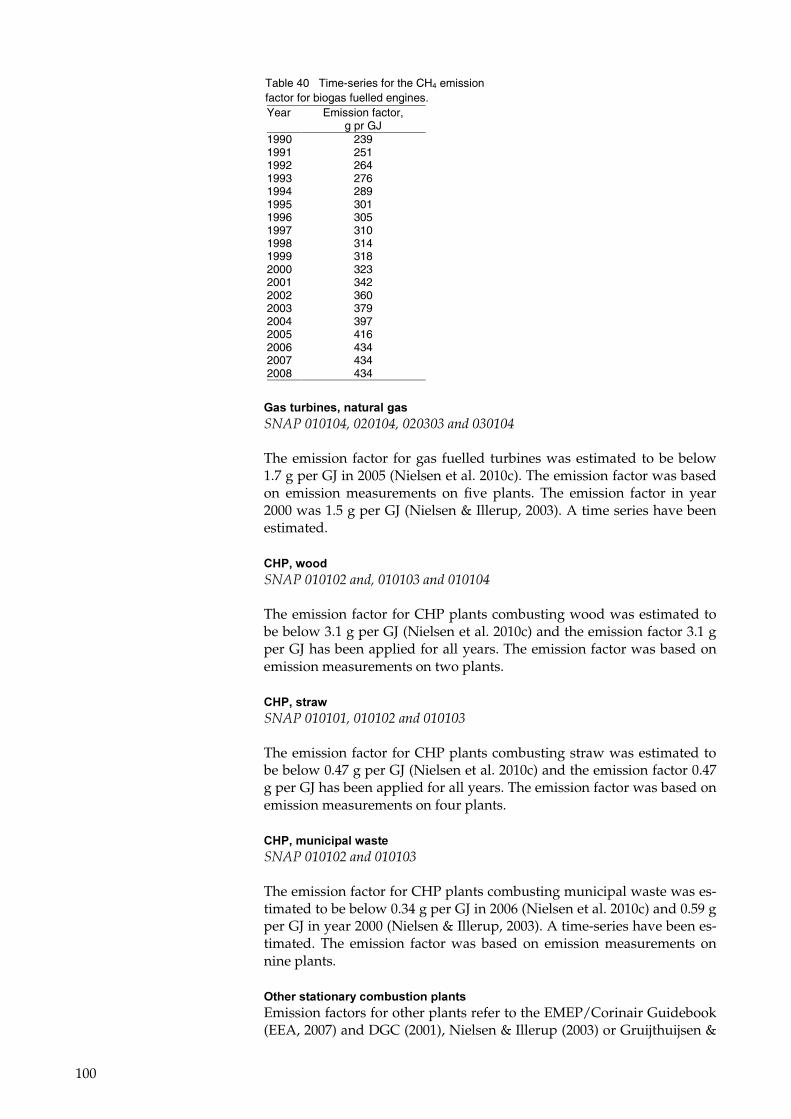
100
Table 40 Time-series for the CH4 emission factor for biogas fuelled engines. Year Emission factor,
g pr GJ 1990 239 1991 251 1992 264 1993 276 1994 289 1995 301 1996 305 1997 310 1998 314 1999 318 2000 323 2001 342 2002 360 2003 379 2004 397 2005 416 2006 434 2007 434 2008 434
+����������-������ �&����/���(�(�("��('(�("��('()()�����()(�("�
The emission factor for gas fuelled turbines was estimated to be below 1.7 g per GJ in 2005 (Nielsen et al. 2010c). The emission factor was based on emission measurements on five plants. The emission factor in year 2000 was 1.5 g per GJ (Nielsen & Illerup, 2003). A time series have been estimated.
!3#-�:��%��/���(�(�('������(�(�()�����(�(�("�
The emission factor for CHP plants combusting wood was estimated to be below 3.1 g per GJ (Nielsen et al. 2010c) and the emission factor 3.1 g per GJ has been applied for all years. The emission factor was based on emission measurements on two plants.
!3#-�����:��/���(�(�(���(�(�('�����(�(�()��
The emission factor for CHP plants combusting straw was estimated to be below 0.47 g per GJ (Nielsen et al. 2010c) and the emission factor 0.47 g per GJ has been applied for all years. The emission factor was based on emission measurements on four plants.
!3#-�������� �:������/���(�(�('�����(�(�()��
The emission factor for CHP plants combusting municipal waste was es-timated to be below 0.34 g per GJ in 2006 (Nielsen et al. 2010c) and 0.59 g per GJ in year 2000 (Nielsen & Illerup, 2003). A time-series have been es-timated. The emission factor was based on emission measurements on nine plants.�
,������������������������� ����Emission factors for other plants refer to the EMEP/Corinair Guidebook (EEA, 2007) and DGC (2001), Nielsen & Illerup (2003) or Gruijthuijsen &
101
Jensen (2000). The same emission factors have been applied for 1990-2008.
'(���(���,�
The N2O emission factors applied for the 2008 inventory are listed in Ta-ble 41. Time-series have been estimated for natural gas fuelled gas tur-bines. All other emission factors have been applied unchanged for 1990-2008.
Emission factors for natural gas fuelled reciprocating engines, natural gas fuelled gas turbines, CHP plants < 300 MW combusting wood, straw or residual oil, MSW incineration plants, engines fuelled by gas oil and gas engines fuelled by biomass producer gas all refer to emission meas-urements carried out on Danish plants (Nielsen et al. 2010c).
The emission factor for public power plants combusting coal refers to re-search conducted by Elsam (now part of DONG Energy). The emission factor for off-shore gas turbines refer to a Danish study concerning CHP plants (Nielsen & Illerup, 2003).
All other emission factors refer to the EMEP/CORINAIR Guidebook, 2007 update (EEA, 2007).
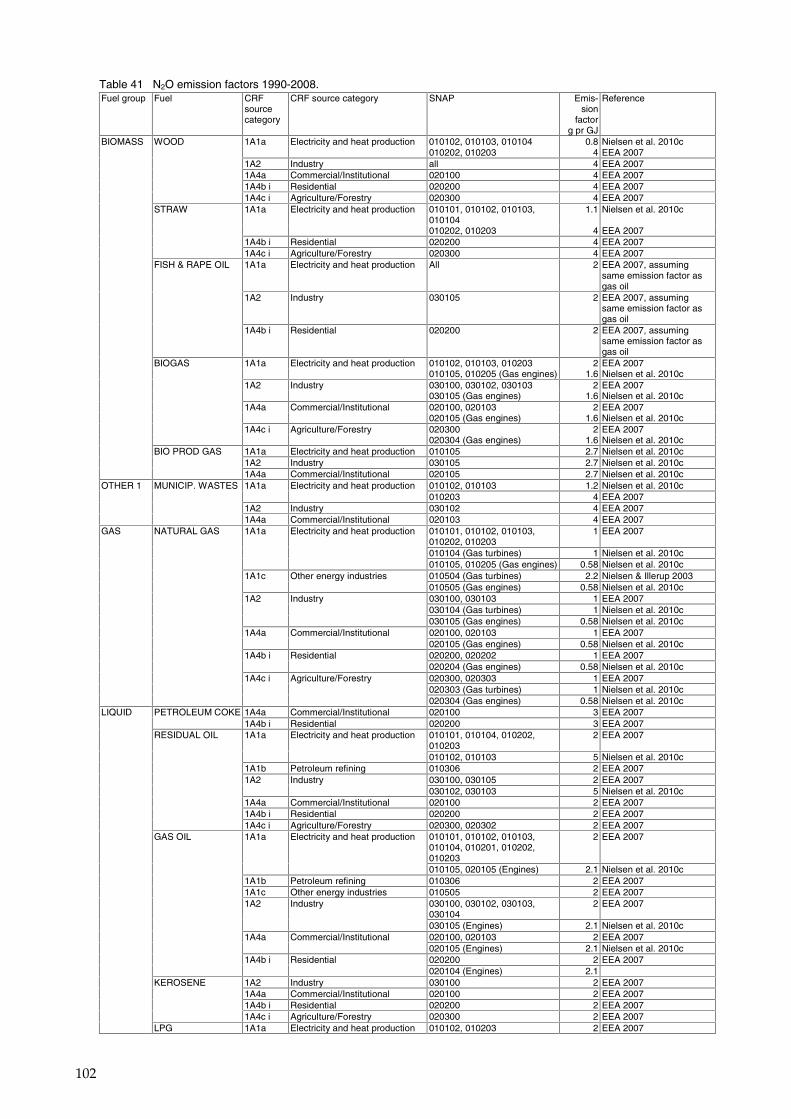
102
Table 41 N2O emission factors 1990-2008. Fuel group Fuel CRF
source category
CRF source category SNAP Emis-sion
factor g pr GJ
Reference
BIOMASS WOOD 1A1a Electricity and heat production 010102, 010103, 010104 0.8 Nielsen et al. 2010c 010202, 010203 4 EEA 2007 1A2 Industry all 4 EEA 2007 1A4a Commercial/Institutional 020100 4 EEA 2007 1A4b i Residential 020200 4 EEA 2007 1A4c i Agriculture/Forestry 020300 4 EEA 2007 STRAW 1A1a Electricity and heat production 010101, 010102, 010103,
010104 1.1 Nielsen et al. 2010c
010202, 010203 4 EEA 2007 1A4b i Residential 020200 4 EEA 2007 1A4c i Agriculture/Forestry 020300 4 EEA 2007 FISH & RAPE OIL 1A1a Electricity and heat production All 2 EEA 2007, assuming
same emission factor as gas oil
1A2 Industry 030105 2 EEA 2007, assuming same emission factor as gas oil
1A4b i Residential 020200 2 EEA 2007, assuming same emission factor as gas oil
BIOGAS 1A1a Electricity and heat production 010102, 010103, 010203 2 EEA 2007 010105, 010205 (Gas engines) 1.6 Nielsen et al. 2010c 1A2 Industry 030100, 030102, 030103 2 EEA 2007 030105 (Gas engines) 1.6 Nielsen et al. 2010c 1A4a Commercial/Institutional 020100, 020103 2 EEA 2007 020105 (Gas engines) 1.6 Nielsen et al. 2010c 1A4c i Agriculture/Forestry 020300 2 EEA 2007 020304 (Gas engines) 1.6 Nielsen et al. 2010c BIO PROD GAS 1A1a Electricity and heat production 010105 2.7 Nielsen et al. 2010c 1A2 Industry 030105 2.7 Nielsen et al. 2010c 1A4a Commercial/Institutional 020105 2.7 Nielsen et al. 2010c OTHER 1 MUNICIP. WASTES 1A1a Electricity and heat production 010102, 010103 1.2 Nielsen et al. 2010c 010203 4 EEA 2007 1A2 Industry 030102 4 EEA 2007 1A4a Commercial/Institutional 020103 4 EEA 2007 GAS NATURAL GAS 1A1a Electricity and heat production 010101, 010102, 010103,
010202, 010203 1 EEA 2007
010104 (Gas turbines) 1 Nielsen et al. 2010c 010105, 010205 (Gas engines) 0.58 Nielsen et al. 2010c 1A1c Other energy industries 010504 (Gas turbines) 2.2 Nielsen & Illerup 2003 010505 (Gas engines) 0.58 Nielsen et al. 2010c 1A2 Industry 030100, 030103 1 EEA 2007 030104 (Gas turbines) 1 Nielsen et al. 2010c 030105 (Gas engines) 0.58 Nielsen et al. 2010c 1A4a Commercial/Institutional 020100, 020103 1 EEA 2007 020105 (Gas engines) 0.58 Nielsen et al. 2010c 1A4b i Residential 020200, 020202 1 EEA 2007 020204 (Gas engines) 0.58 Nielsen et al. 2010c 1A4c i Agriculture/Forestry 020300, 020303 1 EEA 2007 020303 (Gas turbines) 1 Nielsen et al. 2010c 020304 (Gas engines) 0.58 Nielsen et al. 2010c LIQUID PETROLEUM COKE 1A4a Commercial/Institutional 020100 3 EEA 2007 1A4b i Residential 020200 3 EEA 2007 RESIDUAL OIL 1A1a Electricity and heat production 010101, 010104, 010202,
010203 2 EEA 2007
010102, 010103 5 Nielsen et al. 2010c 1A1b Petroleum refining 010306 2 EEA 2007 1A2 Industry 030100, 030105 2 EEA 2007 030102, 030103 5 Nielsen et al. 2010c 1A4a Commercial/Institutional 020100 2 EEA 2007 1A4b i Residential 020200 2 EEA 2007 1A4c i Agriculture/Forestry 020300, 020302 2 EEA 2007 GAS OIL 1A1a Electricity and heat production 010101, 010102, 010103,
010104, 010201, 010202, 010203
2 EEA 2007
010105, 020105 (Engines) 2.1 Nielsen et al. 2010c 1A1b Petroleum refining 010306 2 EEA 2007 1A1c Other energy industries 010505 2 EEA 2007 1A2 Industry 030100, 030102, 030103,
030104 2 EEA 2007
030105 (Engines) 2.1 Nielsen et al. 2010c 1A4a Commercial/Institutional 020100, 020103 2 EEA 2007 020105 (Engines) 2.1 Nielsen et al. 2010c 1A4b i Residential 020200 2 EEA 2007 020104 (Engines) 2.1 KEROSENE 1A2 Industry 030100 2 EEA 2007 1A4a Commercial/Institutional 020100 2 EEA 2007 1A4b i Residential 020200 2 EEA 2007 1A4c i Agriculture/Forestry 020300 2 EEA 2007 LPG 1A1a Electricity and heat production 010102, 010203 2 EEA 2007
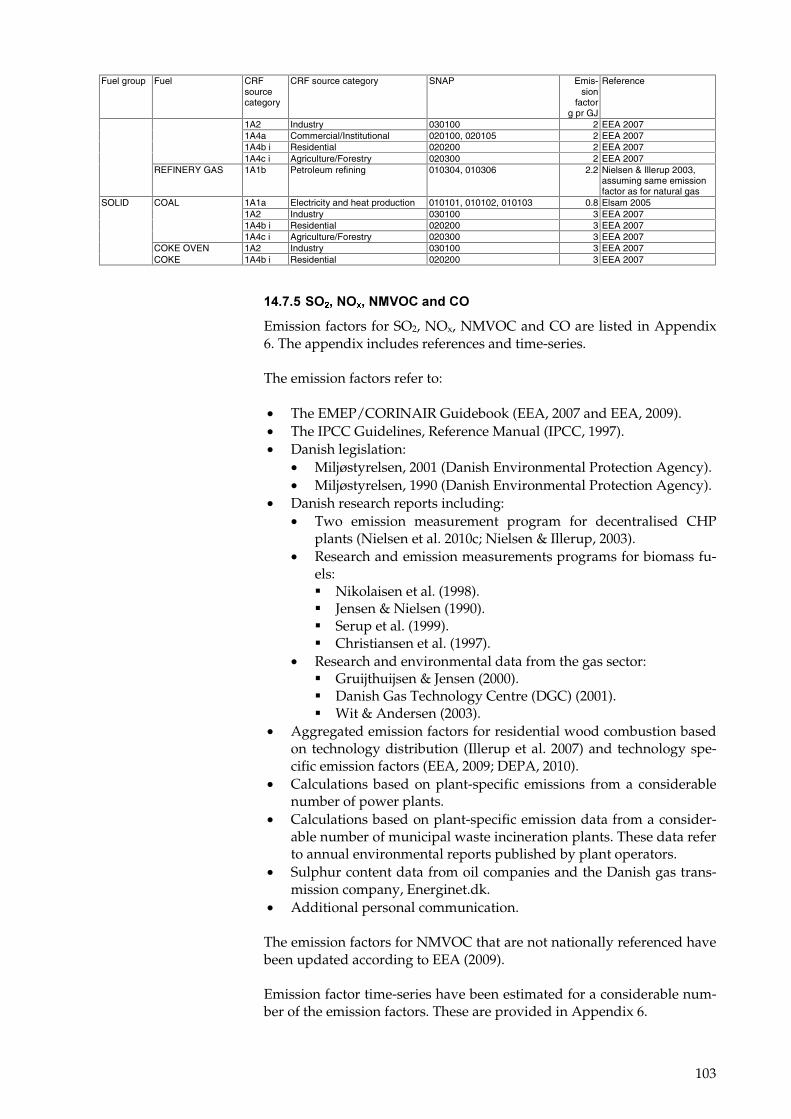
103
Fuel group Fuel CRF source category
CRF source category SNAP Emis-sion
factor g pr GJ
Reference
1A2 Industry 030100 2 EEA 2007 1A4a Commercial/Institutional 020100, 020105 2 EEA 2007 1A4b i Residential 020200 2 EEA 2007 1A4c i Agriculture/Forestry 020300 2 EEA 2007 REFINERY GAS 1A1b Petroleum refining 010304, 010306 2.2 Nielsen & Illerup 2003,
assuming same emission factor as for natural gas
SOLID COAL 1A1a Electricity and heat production 010101, 010102, 010103 0.8 Elsam 2005 1A2 Industry 030100 3 EEA 2007 1A4b i Residential 020200 3 EEA 2007 1A4c i Agriculture/Forestry 020300 3 EEA 2007 COKE OVEN 1A2 Industry 030100 3 EEA 2007 COKE 1A4b i Residential 020200 3 EEA 2007
'(�����$,�-��,�-��./,!��%�!,�
Emission factors for SO2, NOx, NMVOC and CO are listed in Appendix 6. The appendix includes references and time-series.
The emission factors refer to:
• The EMEP/CORINAIR Guidebook (EEA, 2007 and EEA, 2009). • The IPCC Guidelines, Reference Manual (IPCC, 1997). • Danish legislation:
• Miljøstyrelsen, 2001 (Danish Environmental Protection Agency). • Miljøstyrelsen, 1990 (Danish Environmental Protection Agency).
• Danish research reports including: • Two emission measurement program for decentralised CHP
plants (Nielsen et al. 2010c; Nielsen & Illerup, 2003). • Research and emission measurements programs for biomass fu-
els: � Nikolaisen et al. (1998). � Jensen & Nielsen (1990). � Serup et al. (1999). � Christiansen et al. (1997).
• Research and environmental data from the gas sector: � Gruijthuijsen & Jensen (2000). � Danish Gas Technology Centre (DGC) (2001). � Wit & Andersen (2003).
• Aggregated emission factors for residential wood combustion based on technology distribution (Illerup et al. 2007) and technology spe-cific emission factors (EEA, 2009; DEPA, 2010).
• Calculations based on plant-specific emissions from a considerable number of power plants.
• Calculations based on plant-specific emission data from a consider-able number of municipal waste incineration plants. These data refer to annual environmental reports published by plant operators.
• Sulphur content data from oil companies and the Danish gas trans-mission company, Energinet.dk.
• Additional personal communication. The emission factors for NMVOC that are not nationally referenced have been updated according to EEA (2009).
Emission factor time-series have been estimated for a considerable num-ber of the emission factors. These are provided in Appendix 6.
104
'(���0�#������ �����������1#.2�
Emission factors for PM and references for the emission factors are listed in Appendix 6. The emission factors are based on:
• The TNO/CEPMEIP emission factor database (CEPMEIP, 2001). and a considerable number of country-specific factors referring to: • Danish legislation:
• <�!+�8��������� (MST, 2001), legislation from Danish Environ-mental Protection Agency.
• ,�=��163 (MST, 1990), legislation from Danish Environmental Pro-tection Agency.
• Calculations based on plant-specific emission data from a consider-able number of municipal waste incineration plants.
• Aggregated emission factors for residential wood combustion based on technology distribution (Illerup et al. 2007) and technology specific emission factors (EEA, 2009; DEPA, 2010).
• Two emission measurement programs for decentralised CHP plants (Nielsen et al. 2010c; Nielsen & Illerup, 2003).
• An emission measurement program for large power plants (Livbjerg et al., 2001).
• Research leading to the first Danish PM emission inventory for sta-tionary combustion (Nielsen et al. 2003).
• Additional personal communication concerning straw combustion in residential plants.
Emission factor time-series have been estimated for residential wood combustion and MSW incineration. All other emission factors have been considered constant in 2000-2008.
'(�����3��������� ��
Emission factors for 2008 for heavy metals (HM) are presented in Ap-pendix 6. The appendix includes references and time-series. The emis-sion factors refer to:
• Research concerning heavy metal emission factors representative for Denmark (Illerup et al. 1999).
• Two emission measurement programs carried out on Danish decen-tralised CHP plants (Nielsen et al. 2010c; Nielsen & Illerup, 2003).
Time-series have been estimated for municipal waste incineration. For all other sources the same emission factors have been applied for 1990-2008.�
The HM emission factors listed in Appendix 6 are only given for the categories where activity data are available. Missing emission factors for some categories and some years reflect that the aggregation level is dif-ferent for different years.
'(��� �#43�
Emission factors 2008 for PAHs are shown in Appendix 6. The appendix includes references. The PAH emission factors refer to:
105
• Research carried out by TNO (Berdowski et al. 1995). • Research carried out by Statistics Norway (Finstad et al. 2001). • An emission measurement program performed on biomass fuelled
plants. The project was carried out for the Danish Environmental Protection Agency (Jensen & Nielsen, 1996).
• Two emission measurement programs carried out on Danish decen-tralised CHP plants (Nielsen et al. 2010c; Nielsen & Illerup, 2003).
• Additional information from the gas sector (Jensen, 2001). • For residential wood combustion country specific emission factors
have been aggregated based on technology distribution in the sector (Illerup et al., 2007) and technology specific emission factors (EEA, 2009; DEPA, 2010).
Emission factor time-series have been estimated for residential wood combustion, natural gas fuelled engines, biogas fuelled engines and MSW incineration plants. All other emission factors have been consid-ered constant from 1990 to 2008. In general, emission factors for PAH are uncertain.
'(��������5��
Emission factors 2008 for dioxin are shown in Appendix 6.
The emission factor for residential wood combustion refers to technology specific emission factors (EEA, 2009; DEPA, 2010) and to updated tech-nology distribution data (Illerup et al. 2007).
The emission factors for decentralised CHP plants21 refer to an emission measurement program for these plants (Nielsen et al. 2010c).
All other emission factors refer to research regarding dioxin emission carried out by NERI to prepare a new dioxin emission inventory (Hen-riksen et al. 2006).
Time-series for residential wood combustion and for combustion of mu-nicipal waste have been estimated. For all other sources the same emis-sion factors have been applied for 1990-2008.�
'(���'�� 3!6�
Emission factors for HCB are shown in Appendix 6. The emission factors for MSW incineration plants, CHP plants combusting straw, biogas fu-elled engines, gas oil fuelled engines and engines combusting biomass producer gas refer to a Danish emission measurement programme for decentralised CHP plants (Nielsen et al. 2010). All other HCB emission factors refer to the EMEP/Corinair Guidebook (EEA, 2009). Time-series have been estimated for MSW incineration plants. All other emission fac-tors have been considered constant in 1990-2008.
21 Natural gas fuelled engines, biogas fuelled engines, gasoil fuelled engines, engines fuelled by biomass producer gas, CHP plants combusting straw or wood and MSW incineration plants.
106
'(���''� �3��
Emission factors have been included for residential wood combustion, residential straw combustion, MSW incineration in public power pro-duction and residential combustion of coal and coke oven coke. The emission factor for MSW incineration plants refers to a Danish emission measurement programme (Nielsen et al. 2010c) and all other emission factors refer to the EMEP/EEA Guidebook (EEA, 2009). Time-series have not been estimated.
'(���'�� ��� ��%�����������������
A considerable part of the emission data for municipal waste incinera-tion plants and large power plants are plant-specific. The area source emission factors do therefore not necessarily represent average values for these plant categories. To attain a set of emission factors that ex-presses the average emission for power plants combusting coal and for municipal waste incineration plants, implied emission factors have been calculated for these two plant categories. The implied emission factors are presented in Appendix 7. The implied emission factors are calculated as total emission divided by total fuel consumption.
'(� � ����&&��&������������������%������ ��������&������
The national statistics, on which the emission inventories are based, do not include a direct disaggregation to specific industrial subsectors. However, separate national statistics from Statistics Denmark include a disaggregation to industrial subsectors. This part of the energy statistics is also included in the official energy statistics from the DEA.
Every other year Statistics Denmark collects fuel consumption data for all industrial companies of a considerable size. The deviation between the total fuel consumption from the DEA and the data collected by Statis-tics Denmark is rather small. Thus the disaggregation to industrial sub-sectors available from Statistics Denmark can be applied for estimating disaggregation keys for fuel consumption and emissions.
The industrial fuel consumption is considered in three aspects:
• Fuel consumption for transport. This part of the fuel consumption is not disaggregated to the industrial subcategories.
• Fuel consumption applied in power or district heating plants. Dis-aggregation of fuel and emissions is plant specific.
• Fuel consumption for other purposes. The total fuel consumption and the total emissions are disaggregated to industrial subcatego-ries.
All pollutants included in the Climate Convention reporting have been disaggregated to industrial subcategories.
107
'�� 7���������
According to the IPCC Good Practice Guidance (IPCC, 2000) and the Good Practice Guidance for LRTAP Emission Inventories (Pulles & Aardenne, 2003) uncertainty estimates should be included in the annual National Inventory Report (NIR) and the annual Informative Inventory Report (IIR), respectively.
Uncertainty estimates include uncertainty with regard to the total emis-sion inventory as well as uncertainty with regard to trends. The GHG emission from stationary combustion plants has been estimated with an uncertainty interval of ±2.1 %22 and the decrease in the GHG emission since 1990 has been estimated to be 14.6 % ± 1.4 %-age-points22.
'��'� .���%� �&��
'��'�'�+��������&�����
The uncertainty for GHG emissions have been estimated according to the IPCC Good Practice Guidance (IPCC, 2000). The uncertainty has been estimated by two approaches; Tier 1 and Tier 2. Both approaches are fur-ther described in the NIR Chapter 1.7 (Nielsen et al. 2010a).
The ������������� is based on a normal distribution and a confidence interval of 95 %.
The input data for the Tier 1 approach are:
• Emission data for the base year and the latest year. • Uncertainties for emission factors. • Uncertainty for fuel consumption rates. The emission source categories applied are listed in Table 42.
The ����� �������� is a Monte Carlo approach based on a lognormal distribution. The input data for the model is based on 67 % confidence interval (standard deviation) whereas the results are given as 95 % con-fidence intervals. The input data for the Tier 2 approach are:
• Fuel consumption data for the base year and the latest year. • Emission factors or implied emission factors (IEF) for the base year
and the latest year. • Standard deviation for emission factors for the base year and the lat-
est year. If the same standard deviation is applied for both years the data can be indicated as statistically dependent or independent.
• Standard deviation for fuel consumption rates in the base year and the latest year. If the same standard deviation is applied for both years the data can be indicated as statistically dependent or inde-pendent.
22 Tier 1 approach, 95 % confidence interval.
108
The same emission source categories and emission data have been ap-plied for both approaches. In general, the same uncertainty levels have been applied for both approaches. However, the Tier 2 approach allows different uncertainty levels for 1990 and 2008 and this is relevant to a few uncertainties as discussed below. The 2008 uncertainty levels have been applied in the Tier 1 approach. Due to the difference of confidence inter-val of the input data for the two approaches the uncertainty input for the Tier 2 approach have been estimated based on the Tier 1 approach di-vided by a factor 2.
Most of the applied uncertainty estimates for activity rates and emission factors are default values from the IPCC Reference Manual or aggre-gated by NERI based on the default values. Some of the uncertainty es-timates are, however, based on national estimates.
In general the uncertainty of the fuel consumption data have been as-sumed to be the same in 1990 and 2008 and the uncertainty has been as-sumed to be statistically independent. However, a considerable part of the residential wood consumption is non-traded and the uncertainty of biomass consumption has been assumed statistically dependent.
For coal combustion the uncertainty of the CO2 emission factor is lower in 2008 than in 1990 due to availability of EU ETS data. Further, the CO2 emission factor for the fossil part of municipal waste is less uncertain for 2008 than for 1990.
The uncertainty of the CH4 emission factors for gas engines has been as-sumed higher in 1990 than in 2008 due to the emission measurement programmes on which the emission factors in later years are based.
All other uncertainty levels for emission factors have been assumed equal in 1990 and 2008 and statistically dependent.
Uncertainty estimates for the non-CO2 emission factors for decentralised CHP plants will be updated in the next inventory when uncertainty es-timates for the emission measurement programme (Nielsen et al. 2010c), on which these emission factors are based, have been reported.
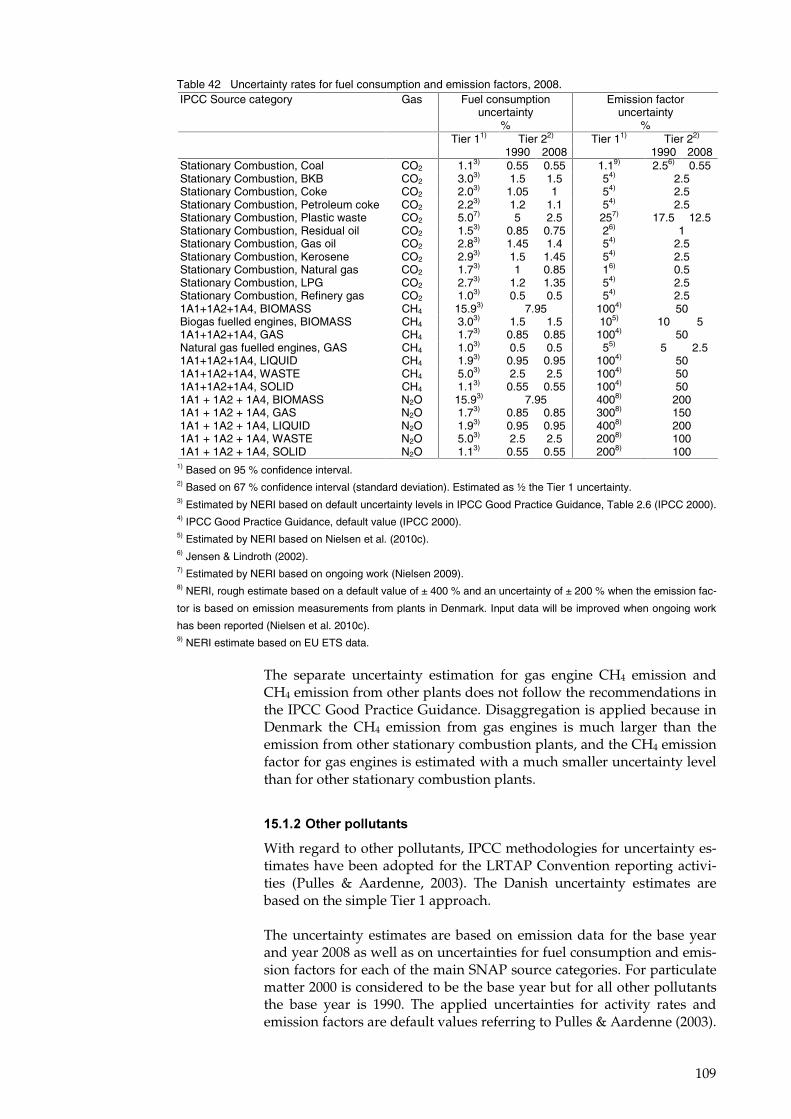
109
Table 42 Uncertainty rates for fuel consumption and emission factors, 2008. IPCC Source category Gas Fuel consumption
uncertainty %
Emission factor uncertainty
% Tier 11) Tier 22) Tier 11) Tier 22) 1990 2008 1990 2008 Stationary Combustion, Coal CO2 1.13) 0.55 0.55 1.19) 2.56) 0.55 Stationary Combustion, BKB CO2 3.03) 1.5 1.5 54) 2.5 Stationary Combustion, Coke CO2 2.03) 1.05 1 54) 2.5 Stationary Combustion, Petroleum coke CO2 2.23) 1.2 1.1 54) 2.5 Stationary Combustion, Plastic waste CO2 5.07) 5 2.5 257) 17.5 12.5 Stationary Combustion, Residual oil CO2 1.53) 0.85 0.75 26) 1 Stationary Combustion, Gas oil CO2 2.83) 1.45 1.4 54) 2.5 Stationary Combustion, Kerosene CO2 2.93) 1.5 1.45 54) 2.5 Stationary Combustion, Natural gas CO2 1.73) 1 0.85 16) 0.5 Stationary Combustion, LPG CO2 2.73) 1.2 1.35 54) 2.5 Stationary Combustion, Refinery gas CO2 1.03) 0.5 0.5 54) 2.5 1A1+1A2+1A4, BIOMASS CH4 15.93) 7.95 1004) 50 Biogas fuelled engines, BIOMASS CH4 3.03) 1.5 1.5 105) 10 5 1A1+1A2+1A4, GAS CH4 1.73) 0.85 0.85 1004) 50 Natural gas fuelled engines, GAS CH4 1.03) 0.5 0.5 55) 5 2.5 1A1+1A2+1A4, LIQUID CH4 1.93) 0.95 0.95 1004) 50 1A1+1A2+1A4, WASTE CH4 5.03) 2.5 2.5 1004) 50 1A1+1A2+1A4, SOLID CH4 1.13) 0.55 0.55 1004) 50 1A1 + 1A2 + 1A4, BIOMASS N2O 15.93) 7.95 4008) 200 1A1 + 1A2 + 1A4, GAS N2O 1.73) 0.85 0.85 3008) 150 1A1 + 1A2 + 1A4, LIQUID N2O 1.93) 0.95 0.95 4008) 200 1A1 + 1A2 + 1A4, WASTE N2O 5.03) 2.5 2.5 2008) 100 1A1 + 1A2 + 1A4, SOLID N2O 1.13) 0.55 0.55 2008) 100
1) Based on 95 % confidence interval. 2) Based on 67 % confidence interval (standard deviation). Estimated as ½ the Tier 1 uncertainty. 3) Estimated by NERI based on default uncertainty levels in IPCC Good Practice Guidance, Table 2.6 (IPCC 2000). 4) IPCC Good Practice Guidance, default value (IPCC 2000). 5) Estimated by NERI based on Nielsen et al. (2010c). 6) Jensen & Lindroth (2002). 7) Estimated by NERI based on ongoing work (Nielsen 2009). 8) NERI, rough estimate based on a default value of ± 400 % and an uncertainty of ± 200 % when the emission fac-
tor is based on emission measurements from plants in Denmark. Input data will be improved when ongoing work
has been reported (Nielsen et al. 2010c). 9) NERI estimate based on EU ETS data.
The separate uncertainty estimation for gas engine CH4 emission and CH4 emission from other plants does not follow the recommendations in the IPCC Good Practice Guidance. Disaggregation is applied because in Denmark the CH4 emission from gas engines is much larger than the emission from other stationary combustion plants, and the CH4 emission factor for gas engines is estimated with a much smaller uncertainty level than for other stationary combustion plants.
'��'���,������ ������
With regard to other pollutants, IPCC methodologies for uncertainty es-timates have been adopted for the LRTAP Convention reporting activi-ties (Pulles & Aardenne, 2003). The Danish uncertainty estimates are based on the simple Tier 1 approach.
The uncertainty estimates are based on emission data for the base year and year 2008 as well as on uncertainties for fuel consumption and emis-sion factors for each of the main SNAP source categories. For particulate matter 2000 is considered to be the base year but for all other pollutants the base year is 1990. The applied uncertainties for activity rates and emission factors are default values referring to Pulles & Aardenne (2003).
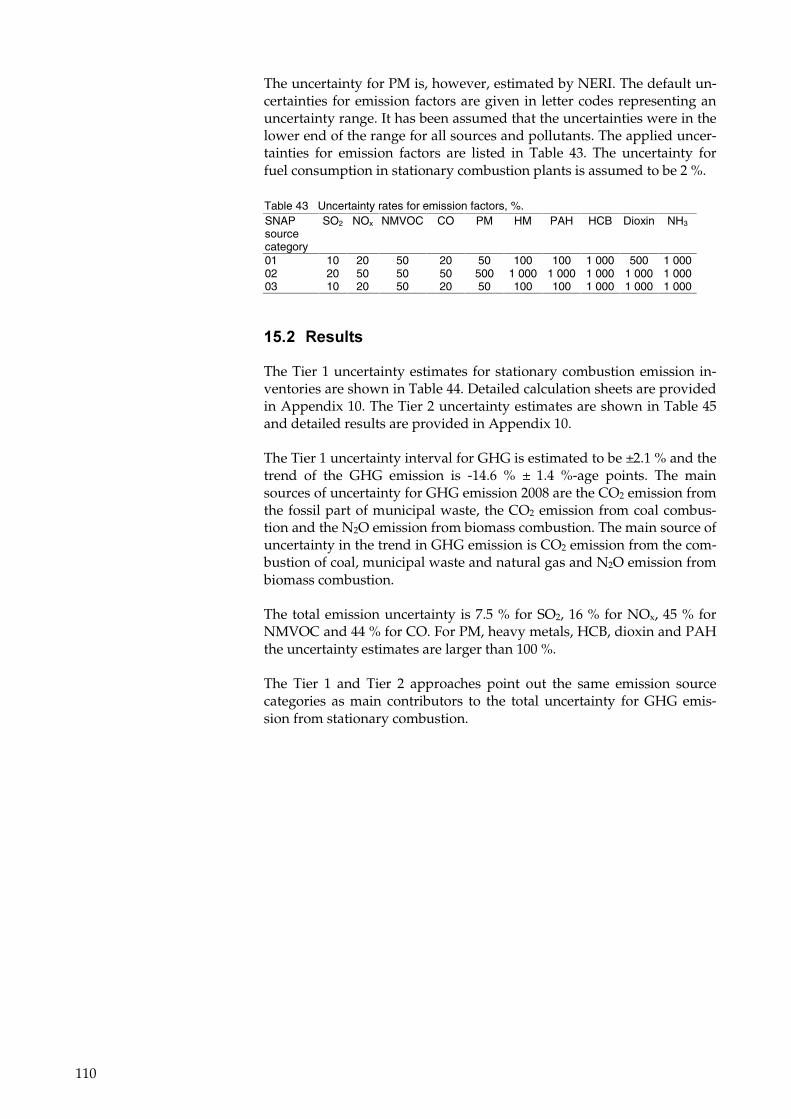
110
The uncertainty for PM is, however, estimated by NERI. The default un-certainties for emission factors are given in letter codes representing an uncertainty range. It has been assumed that the uncertainties were in the lower end of the range for all sources and pollutants. The applied uncer-tainties for emission factors are listed in Table 43. The uncertainty for fuel consumption in stationary combustion plants is assumed to be 2 %.
Table 43 Uncertainty rates for emission factors, %. SNAP source category
SO2 NOx NMVOC CO PM HM PAH HCB Dioxin NH3
01 10 20 50 20 50 100 100 1 000 500 1 000 02 20 50 50 50 500 1 000 1 000 1 000 1 000 1 000 03 10 20 50 20 50 100 100 1 000 1 000 1 000
'���� ���� ���
The Tier 1 uncertainty estimates for stationary combustion emission in-ventories are shown in Table 44. Detailed calculation sheets are provided in Appendix 10. The Tier 2 uncertainty estimates are shown in Table 45 and detailed results are provided in Appendix 10.
The Tier 1 uncertainty interval for GHG is estimated to be ±2.1 % and the trend of the GHG emission is -14.6 % ± 1.4 %-age points. The main sources of uncertainty for GHG emission 2008 are the CO2 emission from the fossil part of municipal waste, the CO2 emission from coal combus-tion and the N2O emission from biomass combustion. The main source of uncertainty in the trend in GHG emission is CO2 emission from the com-bustion of coal, municipal waste and natural gas and N2O emission from biomass combustion.
The total emission uncertainty is 7.5 % for SO2, 16 % for NOx, 45 % for NMVOC and 44 % for CO. For PM, heavy metals, HCB, dioxin and PAH the uncertainty estimates are larger than 100 %.
The Tier 1 and Tier 2 approaches point out the same emission source categories as main contributors to the total uncertainty for GHG emis-sion from stationary combustion.
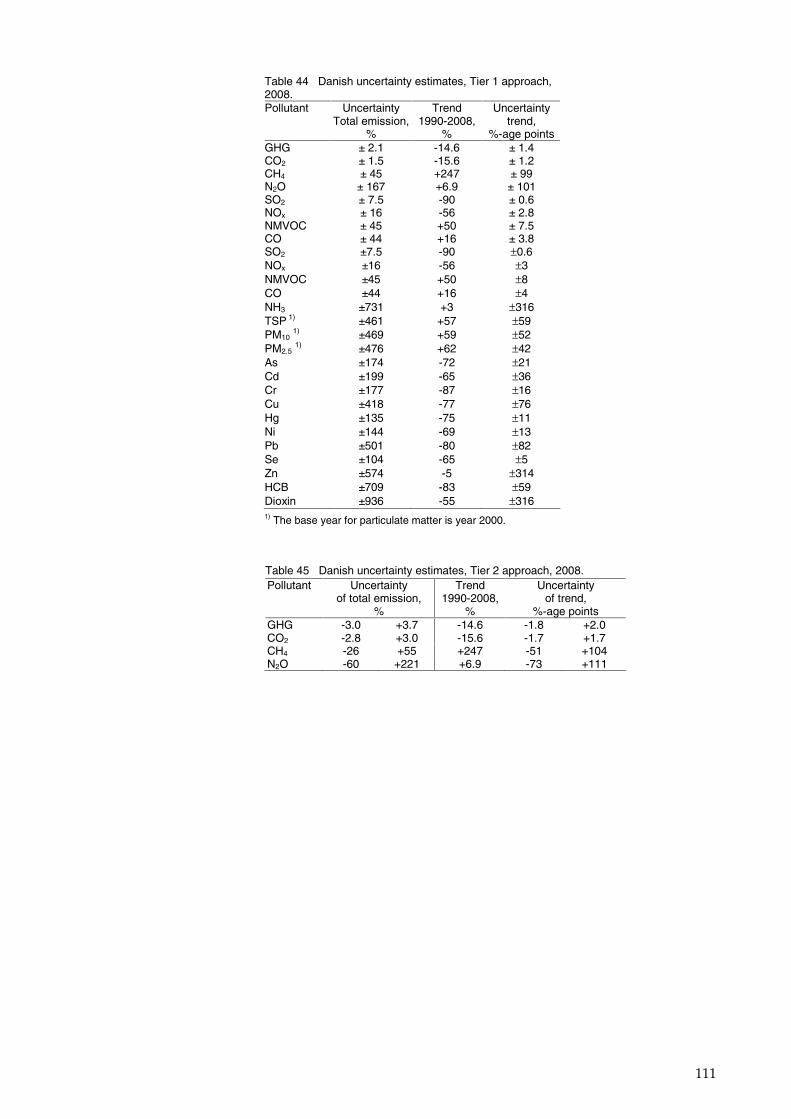
111
Table 44 Danish uncertainty estimates, Tier 1 approach, 2008. Pollutant Uncertainty
Total emission, %
Trend 1990-2008,
%
Uncertainty trend,
%-age points GHG ± 2.1 -14.6 ± 1.4 CO2 ± 1.5 -15.6 ± 1.2 CH4 ± 45 +247 ± 99 N2O ± 167 +6.9 ± 101 SO2 ± 7.5 -90 ± 0.6 NOx ± 16 -56 ± 2.8 NMVOC ± 45 +50 ± 7.5 CO ± 44 +16 ± 3.8 SO2 ±7.5 -90 ±0.6 NOx ±16 -56 ±3 NMVOC ±45 +50 ±8 CO ±44 +16 ±4 NH3 ±731 +3 ±316 TSP 1) ±461 +57 ±59 PM10 1) ±469 +59 ±52 PM2.5 1) ±476 +62 ±42 As ±174 -72 ±21 Cd ±199 -65 ±36 Cr ±177 -87 ±16 Cu ±418 -77 ±76 Hg ±135 -75 ±11 Ni ±144 -69 ±13 Pb ±501 -80 ±82 Se ±104 -65 ±5 Zn ±574 -5 ±314 HCB ±709 -83 ±59 Dioxin ±936 -55 ±316 1) The base year for particulate matter is year 2000.
Table 45 Danish uncertainty estimates, Tier 2 approach, 2008. Pollutant Uncertainty
of total emission, %
Trend 1990-2008,
%
Uncertainty of trend,
%-age points GHG -3.0 +3.7 -14.6 -1.8 +2.0 CO2 -2.8 +3.0 -15.6 -1.7 +1.7 CH4 -26 +55 +247 -51 +104 N2O -60 +221 +6.9 -73 +111
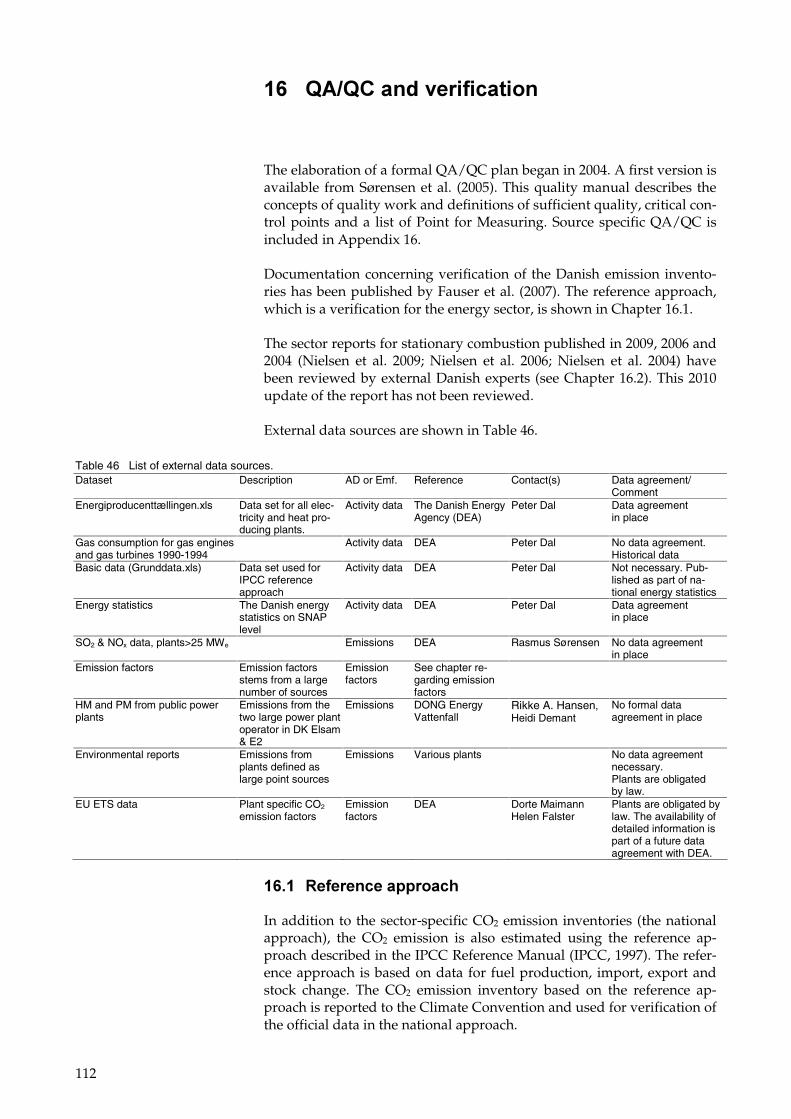
112
'0� 8498!��%�������������
The elaboration of a formal QA/QC plan began in 2004. A first version is available from Sørensen et al. (2005). This quality manual describes the concepts of quality work and definitions of sufficient quality, critical con-trol points and a list of Point for Measuring. Source specific QA/QC is included in Appendix 16.
Documentation concerning verification of the Danish emission invento-ries has been published by Fauser et al. (2007). The reference approach, which is a verification for the energy sector, is shown in Chapter 16.1.
The sector reports for stationary combustion published in 2009, 2006 and 2004 (Nielsen et al. 2009; Nielsen et al. 2006; Nielsen et al. 2004) have been reviewed by external Danish experts (see Chapter 16.2). This 2010 update of the report has not been reviewed.
External data sources are shown in Table 46.
Table 46 List of external data sources. Dataset Description AD or Emf. Reference Contact(s) Data agreement/
Comment Energiproducenttællingen.xls Data set for all elec-
tricity and heat pro-ducing plants.
Activity data The Danish Energy Agency (DEA)
Peter Dal Data agreement in place
Gas consumption for gas engines and gas turbines 1990-1994
Activity data DEA Peter Dal No data agreement. Historical data
Basic data (Grunddata.xls) Data set used for IPCC reference approach
Activity data DEA Peter Dal Not necessary. Pub-lished as part of na-tional energy statistics
Energy statistics The Danish energy statistics on SNAP level
Activity data DEA Peter Dal Data agreement in place
SO2 & NOx data, plants>25 MWe Emissions DEA Rasmus Sørensen No data agreement in place
Emission factors Emission factors stems from a large number of sources
Emission factors
See chapter re-garding emission factors
HM and PM from public power plants
Emissions from the two large power plant operator in DK Elsam & E2
Emissions DONG Energy Vattenfall
Rikke A. Hansen, Heidi Demant
No formal data agreement in place
Environmental reports Emissions from plants defined as large point sources
Emissions Various plants No data agreement necessary. Plants are obligated by law.
EU ETS data Plant specific CO2 emission factors
Emission factors
DEA Dorte Maimann Helen Falster
Plants are obligated by law. The availability of detailed information is part of a future data agreement with DEA.
'0�'� �����������������
In addition to the sector-specific CO2 emission inventories (the national approach), the CO2 emission is also estimated using the reference ap-proach described in the IPCC Reference Manual (IPCC, 1997). The refer-ence approach is based on data for fuel production, import, export and stock change. The CO2 emission inventory based on the reference ap-proach is reported to the Climate Convention and used for verification of the official data in the national approach.
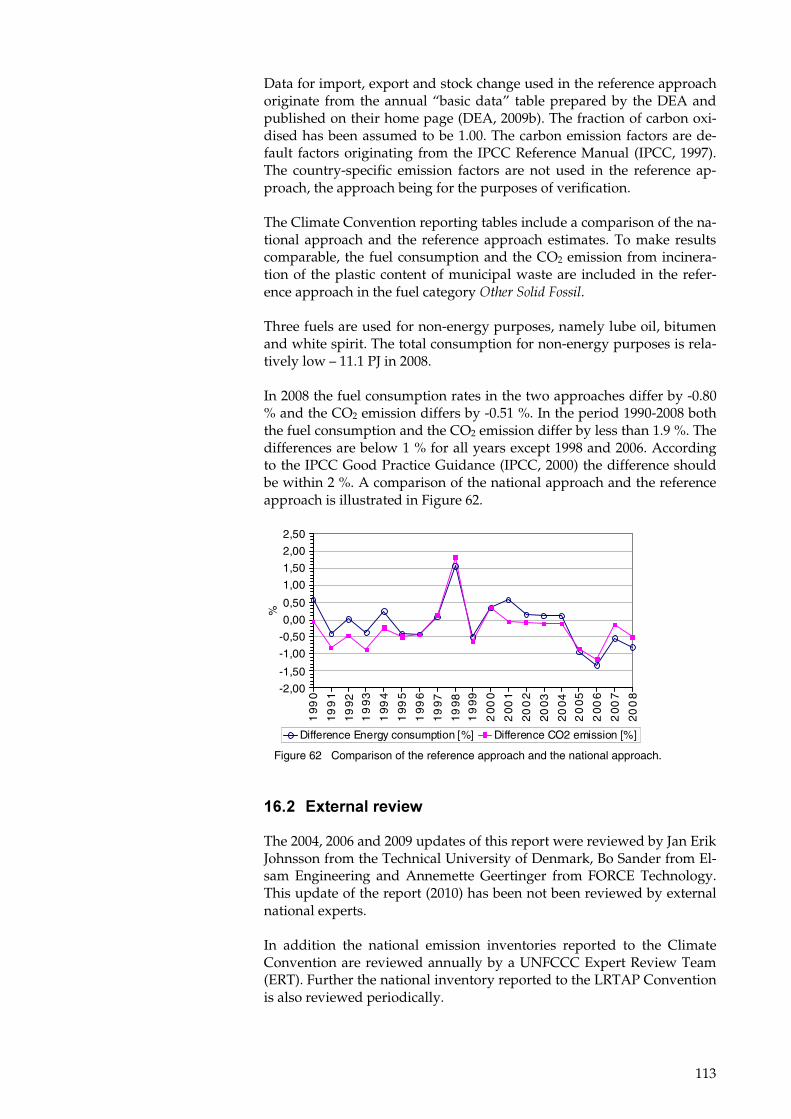
113
Data for import, export and stock change used in the reference approach originate from the annual “basic data” table prepared by the DEA and published on their home page (DEA, 2009b). The fraction of carbon oxi-dised has been assumed to be 1.00. The carbon emission factors are de-fault factors originating from the IPCC Reference Manual (IPCC, 1997). The country-specific emission factors are not used in the reference ap-proach, the approach being for the purposes of verification.
The Climate Convention reporting tables include a comparison of the na-tional approach and the reference approach estimates. To make results comparable, the fuel consumption and the CO2 emission from incinera-tion of the plastic content of municipal waste are included in the refer-ence approach in the fuel category �����������&���.
Three fuels are used for non-energy purposes, namely lube oil, bitumen and white spirit. The total consumption for non-energy purposes is rela-tively low – 11.1 PJ in 2008.
In 2008 the fuel consumption rates in the two approaches differ by -0.80 % and the CO2 emission differs by -0.51 %. In the period 1990-2008 both the fuel consumption and the CO2 emission differ by less than 1.9 %. The differences are below 1 % for all years except 1998 and 2006. According to the IPCC Good Practice Guidance (IPCC, 2000) the difference should be within 2 %. A comparison of the national approach and the reference approach is illustrated in Figure 62.
-2,00
-1,50
-1,00
-0,50
0,00
0,50
1,00
1,50
2,00
2,50
19
90
19
91
19
92
19
93
19
94
19
95
19
96
19
97
19
98
19
99
20
00
20
01
20
02
20
03
20
04
20
05
20
06
20
07
20
08
%
Difference Energy consumption [%] Difference CO2 emission [%] Figure 62 Comparison of the reference approach and the national approach.
'0��� �5���� ������:�
The 2004, 2006 and 2009 updates of this report were reviewed by Jan Erik Johnsson from the Technical University of Denmark, Bo Sander from El-sam Engineering and Annemette Geertinger from FORCE Technology. This update of the report (2010) has been not been reviewed by external national experts.
In addition the national emission inventories reported to the Climate Convention are reviewed annually by a UNFCCC Expert Review Team (ERT). Further the national inventory reported to the LRTAP Convention is also reviewed periodically.
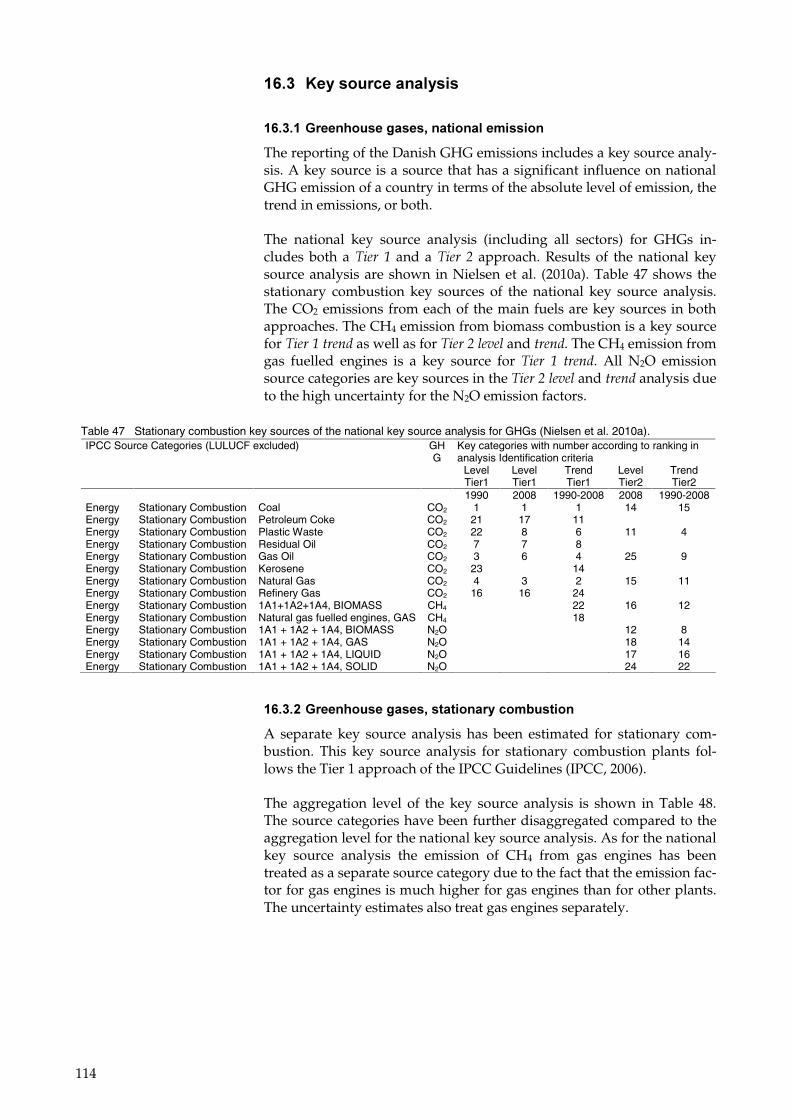
114
'0�)� >������������ �����
'0�)�'�+��������&����-������ ���������
The reporting of the Danish GHG emissions includes a key source analy-sis. A key source is a source that has a significant influence on national GHG emission of a country in terms of the absolute level of emission, the trend in emissions, or both.
The national key source analysis (including all sectors) for GHGs in-cludes both a 4���� � and a 4���� ' approach. Results of the national key source analysis are shown in Nielsen et al. (2010a). Table 47 shows the stationary combustion key sources of the national key source analysis. The CO2 emissions from each of the main fuels are key sources in both approaches. The CH4 emission from biomass combustion is a key source for 4���������� as well as for 4����'���+�� and ����. The CH4 emission from gas fuelled engines is a key source for 4���� �� ����. All N2O emission source categories are key sources in the 4����'���+�� and ���� analysis due to the high uncertainty for the N2O emission factors.
Table 47 Stationary combustion key sources of the national key source analysis for GHGs (Nielsen et al. 2010a). IPCC Source Categories (LULUCF excluded) GH
G Key categories with number according to ranking in analysis Identification criteria
Level Tier1
Level Tier1
Trend Tier1
Level Tier2
Trend Tier2
1990 2008 1990-2008 2008 1990-2008 Energy Stationary Combustion Coal CO2 1 1 1 14 15 Energy Stationary Combustion Petroleum Coke CO2 21 17 11 Energy Stationary Combustion Plastic Waste CO2 22 8 6 11 4 Energy Stationary Combustion Residual Oil CO2 7 7 8 Energy Stationary Combustion Gas Oil CO2 3 6 4 25 9 Energy Stationary Combustion Kerosene CO2 23 14 Energy Stationary Combustion Natural Gas CO2 4 3 2 15 11 Energy Stationary Combustion Refinery Gas CO2 16 16 24 Energy Stationary Combustion 1A1+1A2+1A4, BIOMASS CH4 22 16 12 Energy Stationary Combustion Natural gas fuelled engines, GAS CH4 18 Energy Stationary Combustion 1A1 + 1A2 + 1A4, BIOMASS N2O 12 8 Energy Stationary Combustion 1A1 + 1A2 + 1A4, GAS N2O 18 14 Energy Stationary Combustion 1A1 + 1A2 + 1A4, LIQUID N2O 17 16 Energy Stationary Combustion 1A1 + 1A2 + 1A4, SOLID N2O 24 22
'0�)���+��������&����-���������������������
A separate key source analysis has been estimated for stationary com-bustion. This key source analysis for stationary combustion plants fol-lows the Tier 1 approach of the IPCC Guidelines (IPCC, 2006).
The aggregation level of the key source analysis is shown in Table 48. The source categories have been further disaggregated compared to the aggregation level for the national key source analysis. As for the national key source analysis the emission of CH4 from gas engines has been treated as a separate source category due to the fact that the emission fac-tor for gas engines is much higher for gas engines than for other plants. The uncertainty estimates also treat gas engines separately.
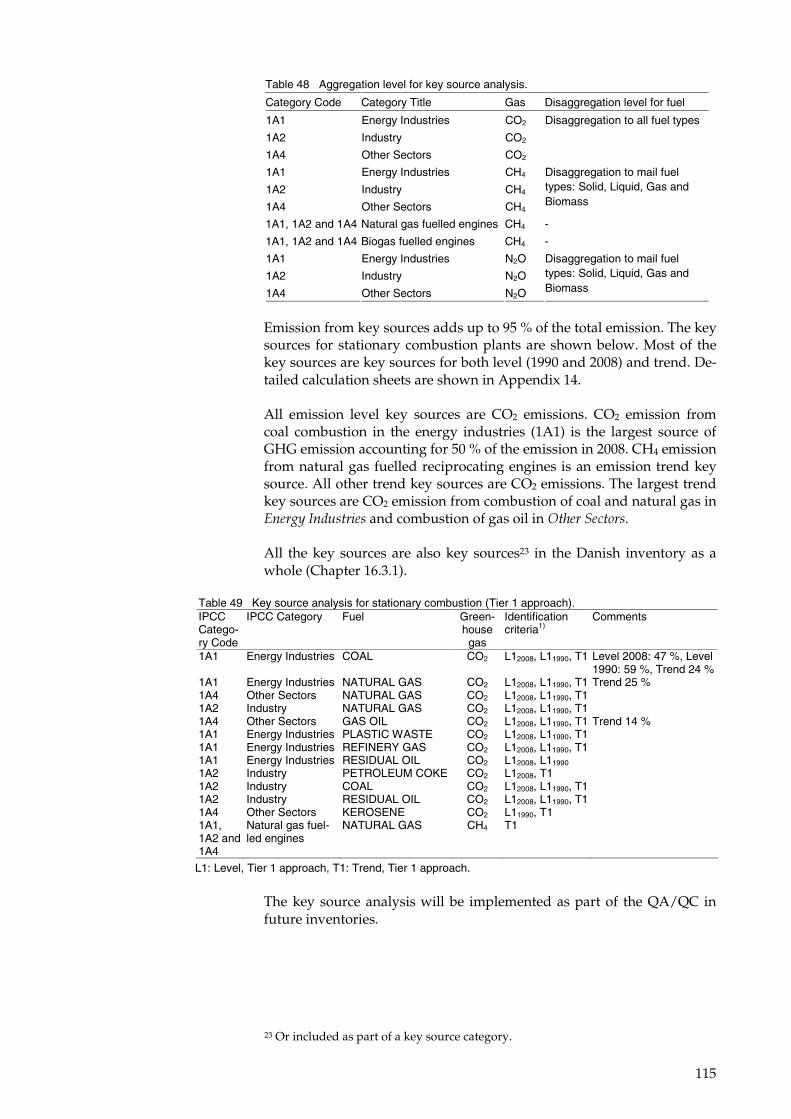
115
Table 48 Aggregation level for key source analysis.
Category Code Category Title Gas Disaggregation level for fuel
1A1 Energy Industries CO2
1A2 Industry CO2
1A4 Other Sectors CO2
Disaggregation to all fuel types
1A1 Energy Industries CH4
1A2 Industry CH4
1A4 Other Sectors CH4
Disaggregation to mail fuel types: Solid, Liquid, Gas and Biomass
1A1, 1A2 and 1A4 Natural gas fuelled engines CH4 -
1A1, 1A2 and 1A4 Biogas fuelled engines CH4 -
1A1 Energy Industries N2O
1A2 Industry N2O
1A4 Other Sectors N2O
Disaggregation to mail fuel types: Solid, Liquid, Gas and Biomass
Emission from key sources adds up to 95 % of the total emission. The key sources for stationary combustion plants are shown below. Most of the key sources are key sources for both level (1990 and 2008) and trend. De-tailed calculation sheets are shown in Appendix 14.
All emission level key sources are CO2 emissions. CO2 emission from coal combustion in the energy industries (1A1) is the largest source of GHG emission accounting for 50 % of the emission in 2008. CH4 emission from natural gas fuelled reciprocating engines is an emission trend key source. All other trend key sources are CO2 emissions. The largest trend key sources are CO2 emission from combustion of coal and natural gas in �������������� and combustion of gas oil in ����������.
All the key sources are also key sources23 in the Danish inventory as a whole (Chapter 16.3.1).
Table 49 Key source analysis for stationary combustion (Tier 1 approach). IPCC Catego-ry Code
IPCC Category Fuel Green-house gas
Identification criteria1)
Comments
1A1 Energy Industries COAL CO2 L12008, L11990, T1 Level 2008: 47 %, Level 1990: 59 %, Trend 24 %
1A1 Energy Industries NATURAL GAS CO2 L12008, L11990, T1 Trend 25 % 1A4 Other Sectors NATURAL GAS CO2 L12008, L11990, T1 1A2 Industry NATURAL GAS CO2 L12008, L11990, T1 1A4 Other Sectors GAS OIL CO2 L12008, L11990, T1 Trend 14 % 1A1 Energy Industries PLASTIC WASTE CO2 L12008, L11990, T1 1A1 Energy Industries REFINERY GAS CO2 L12008, L11990, T1 1A1 Energy Industries RESIDUAL OIL CO2 L12008, L11990 1A2 Industry PETROLEUM COKE CO2 L12008, T1 1A2 Industry COAL CO2 L12008, L11990, T1 1A2 Industry RESIDUAL OIL CO2 L12008, L11990, T1 1A4 Other Sectors KEROSENE CO2 L11990, T1 1A1, 1A2 and 1A4
Natural gas fuel-led engines
NATURAL GAS CH4 T1
L1: Level, Tier 1 approach, T1: Trend, Tier 1 approach.
The key source analysis will be implemented as part of the QA/QC in future inventories.
23 Or included as part of a key source category.
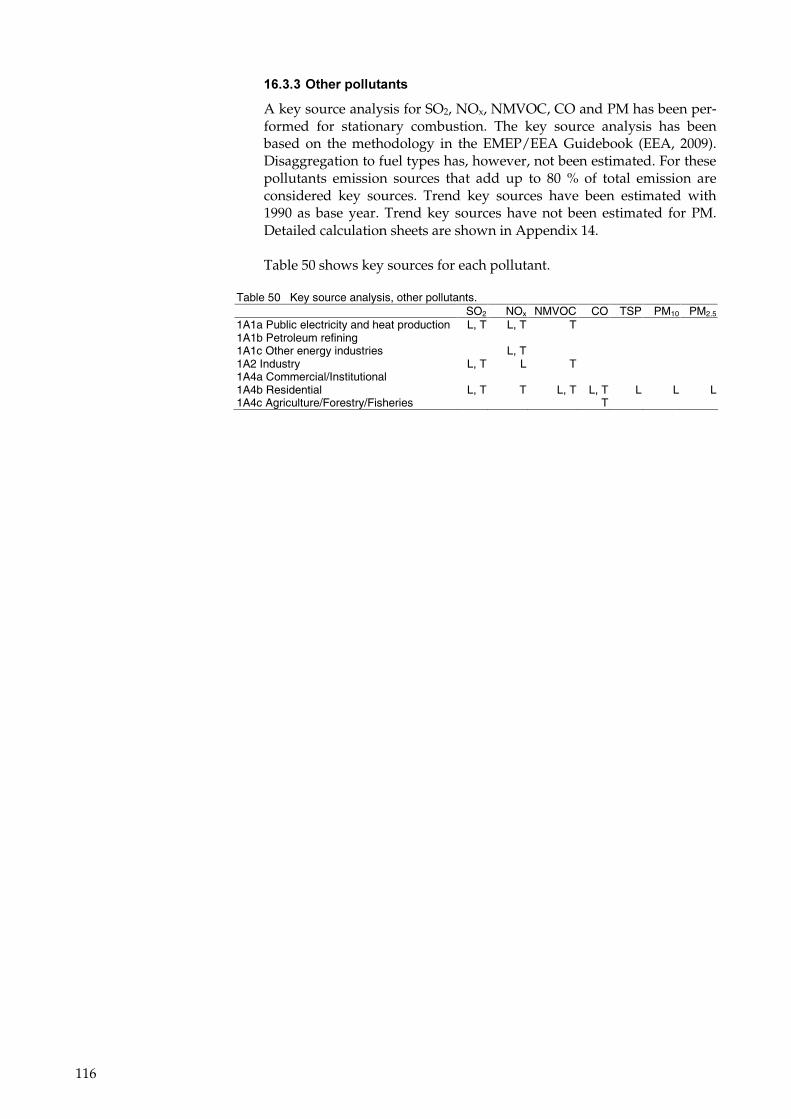
116
'0�)�)�,������ ������
A key source analysis for SO2, NOx, NMVOC, CO and PM has been per-formed for stationary combustion. The key source analysis has been based on the methodology in the EMEP/EEA Guidebook (EEA, 2009). Disaggregation to fuel types has, however, not been estimated. For these pollutants emission sources that add up to 80 % of total emission are considered key sources. Trend key sources have been estimated with 1990 as base year. Trend key sources have not been estimated for PM. Detailed calculation sheets are shown in Appendix 14.
Table 50 shows key sources for each pollutant.
Table 50 Key source analysis, other pollutants. SO2 NOx NMVOC CO TSP PM10 PM2.5 1A1a Public electricity and heat production L, T L, T T 1A1b Petroleum refining 1A1c Other energy industries L, T 1A2 Industry L, T L T 1A4a Commercial/Institutional 1A4b Residential L, T T L, T L, T L L L 1A4c Agriculture/Forestry/Fisheries T
117
'�� �������������%����� �� ������������������&��������
Improvements and recalculations since the 2009 emission inventory submission include:
• The national energy statistics has been updated for the years 1980-2007. This has only resulted in small differences.
• The split of the CO2 emission factor for municipal waste between biomass and fossil fuel has been recalculated.
• In CRF the fossil fuel content of municipal waste and the correspond-ing emissions are now included in fuel category ����� !���� The biomass content of municipal waste and the corresponding emis-sions are reported as part of the fuel category ,��$�.
• Improved emission factors for decentralised CHP plants referring to a Danish emission measurement program (Nielsen et al. 2010c) have been implemented.
• A time-series has been estimated for the HCB emission factor for MSW incineration.
• The NMVOC emission factors that are not country specific now all refer to EEA (2009). The emission factors for the key-sources are country specific and are not affected by this recalculation.
• For residential wood combustion emission factors of NMVOC, TSP, PM10, PM2.5 and dioxin have been updated for some technologies. For NMVOC the change in emission factor is for new stoves; for par-ticulate matter the updated emission factors are for old and new stoves and for dioxin the recalculations are done for new boilers with accumulation tank and for boilers using wood pellets. The recalcula-tion is done for the years 2000-2007. The update in emission factors refer to a study funded by the Danish EPA (DEPA, 2010).
• NH3 emissions from residential plants have been estimated for the first time. The emission factors for coal, brown coal, coke and wood refer to the EMEP/EEA Guidebook (EEA, 2009).
• A Tier 2 approach for uncertainty has been applied for greenhouse gases.
• Data from the EU ETS have been utilised for the third time in the 2010 inventory submission. The uncertainty estimates (Tier 1 and Tier 2) now take into account the lower uncertainty of the heating values and CO2 emission factors based on the EU ETS data compared to the national heating values and emission factors.
118
' � # ��%�������������
A number of planned improvements to the emission inventories are dis-cussed below.
'2��������%�%�������������������������������The reporting of, and references for the applied emission factors will be further developed in future inventories.
�2�7�������������������Uncertainty estimates are based mainly on default uncertainty levels for activity rates and emission factors. Default uncertainty levels will be up-dated according to the updated EMEP/Corinair Guidebook (EEA, 2009). More country-specific uncertainty estimates will be incorporated in fu-ture inventories. Uncertainty data for emission factors for decentralised CHP plants will be included (Nielsen et al. 2010c).
)2��������%�!,���������������������������� �:�����Ongoing work will further improve the CO2 emission factor for munici-pal waste.
(2���� �����������������������������������4������Some emission factors refer to older version of the EMEP/CORINAIR Guidebook. The emission factors will be updated according to EEA (2009).
119
'�� !�� �����
The annual Danish emission inventories are prepared and reported by the Danish National Environmental Research Institute (NERI), Aarhus University. The inventories for stationary combustion are based on the Danish energy statistics and on a set of emission factors for various source categories, technologies and fuels. Plant specific emissions for large combustion sources are incorporated into the inventories.�
In 2008 the fuel consumption was 7 % higher than in 1990; the fossil fuel consumption, however, was 7 % lower than in 1990. The use of coal has decreased whereas the use of natural gas and biomass has increased. The fuel consumption for stationary combustion fluctuates due to variation in the import/export of electricity from year to year.
Stationary combustion plants account for more than 50 % of the national emission for the following pollutants: SO2, CO2, heavy metals (except Cu, Pb and Zn), PM10, PM2.5, dioxin, HCB and PAH. Furthermore, the emis-sion from stationary combustion plants accounts for more than 10 % of the national emission for the following pollutants: NOx, CO, NMVOC, TSP, Cu, Pb and Zn. Stationary combustion plants account for less than 10 % of the national emission of CH4, N2O and NH3.
Public electricity and heat production are the most important stationary combustion emission source for CO2, N2O, SO2 and NOx.
Lean-burn gas engines installed in decentralised CHP plants and com-bustion of biomass in residential plants are the two largest emission sources for CH4.
Residential plants represent the most important stationary combustion emission source for CO, NMVOC, particulate matter, PAH and dioxin. Wood combustion in residential plants is the predominant emission source.
Industrial plants, public electricity and heat production plants and resi-dential plants are the main emission sources for the different heavy met-als.
The greenhouse gas (GHG) emission trend follows the CO2 emission trend closely. Both the CO2 and the total GHG emission were lower in 2008 than in 1990; CO2 by 16 % and GHG by 15 %. However, fluctuations in the GHG emission level are large. The fluctuations in the time-series are a result of electricity import/export and of outdoor temperature variations from year to year.
The CH4 emission from stationary combustion has increased by a factor of 3.5 since 1990. This is mainly a result of the considerable number of lean-burn gas engines installed in CHP plants in Denmark during the 1990s. In recent years the emission has declined. This is due to structural changes in the Danish electricity market, which means that the fuel con-sumption in gas engines has been decreasing. The CH4 emission from
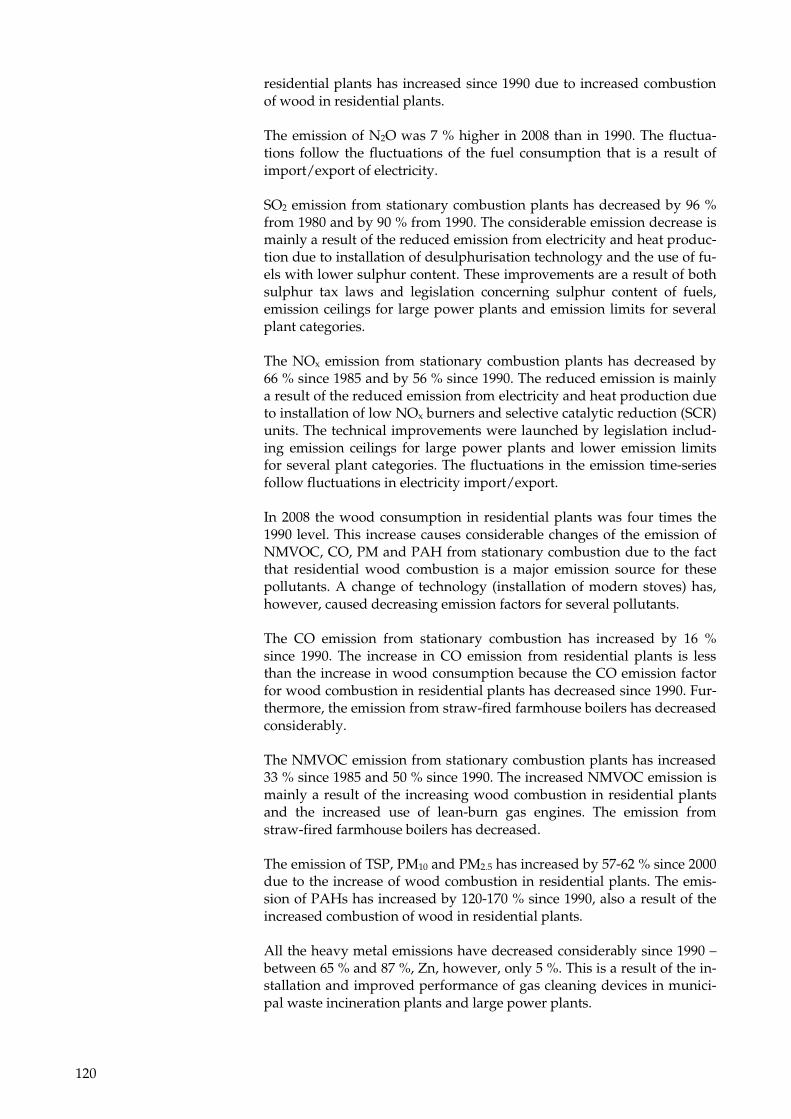
120
residential plants has increased since 1990 due to increased combustion of wood in residential plants.
The emission of N2O was 7 % higher in 2008 than in 1990. The fluctua-tions follow the fluctuations of the fuel consumption that is a result of import/export of electricity.
SO2 emission from stationary combustion plants has decreased by 96 % from 1980 and by 90 % from 1990. The considerable emission decrease is mainly a result of the reduced emission from electricity and heat produc-tion due to installation of desulphurisation technology and the use of fu-els with lower sulphur content. These improvements are a result of both sulphur tax laws and legislation concerning sulphur content of fuels, emission ceilings for large power plants and emission limits for several plant categories.
The NOx emission from stationary combustion plants has decreased by 66 % since 1985 and by 56 % since 1990. The reduced emission is mainly a result of the reduced emission from electricity and heat production due to installation of low NOx burners and selective catalytic reduction (SCR) units. The technical improvements were launched by legislation includ-ing emission ceilings for large power plants and lower emission limits for several plant categories. The fluctuations in the emission time-series follow fluctuations in electricity import/export.
In 2008 the wood consumption in residential plants was four times the 1990 level. This increase causes considerable changes of the emission of NMVOC, CO, PM and PAH from stationary combustion due to the fact that residential wood combustion is a major emission source for these pollutants. A change of technology (installation of modern stoves) has, however, caused decreasing emission factors for several pollutants.
The CO emission from stationary combustion has increased by 16 % since 1990. The increase in CO emission from residential plants is less than the increase in wood consumption because the CO emission factor for wood combustion in residential plants has decreased since 1990. Fur-thermore, the emission from straw-fired farmhouse boilers has decreased considerably.
The NMVOC emission from stationary combustion plants has increased 33 % since 1985 and 50 % since 1990. The increased NMVOC emission is mainly a result of the increasing wood combustion in residential plants and the increased use of lean-burn gas engines. The emission from straw-fired farmhouse boilers has decreased.
The emission of TSP, PM10 and PM2.5 has increased by 57-62 % since 2000 due to the increase of wood combustion in residential plants. The emis-sion of PAHs has increased by 120-170 % since 1990, also a result of the increased combustion of wood in residential plants.
All the heavy metal emissions have decreased considerably since 1990 – between 65 % and 87 %, Zn, however, only 5 %. This is a result of the in-stallation and improved performance of gas cleaning devices in munici-pal waste incineration plants and large power plants.
121
Dioxin emission has decreased 55 % since 1990 mainly due to installation of dioxin filters in MSW incineration plants that was necessary due to the emission limit included in Danish legislation. However, the emission from residential plants has increased in recent years due to the increased wood combustion in the sector. This has caused an increase of dioxin emission from stationary combustion since 2004.
The uncertainty level of the Danish greenhouse gas emission from sta-tionary combustion is estimated to be within a range of ±2.1 % and the trend in GHG emission (1990-2008) is -14.6 % ± 1.4 %-age points24.
24 Tier 1 approach. This year a Tier 2 approach for uncertainty estimates has also been applied.
122
����������
Andersen, M.A. 1996: Elkraft, personal communication letter 07-05-1996.
Bech, N. 1999: Personal communication, letter 05-11-1999, Sjællandske Kraftværker, SK Energi.
Berdowski, J.J.M., Veldt, C., Baas, J., Bloos, J.P.J. & Klein, A.E. 1995: Technical Paper to the OSPARCOM-HELCOM-UNECE Emission Inven-tory of heavy Metals and Persistent Organic Pollutants, TNO-report, TNO-MEP – R 95/247.
CEPMEIP, 2001: The o-ordinated �uropean Programme on �articulate �atter �mission �nventories, �rojections and Guidance. Available at: http://www.air.sk/tno/cepmeip/ (2010-04-27).
Christiansen, B.H., Evald, A., Baadsgaard-Jensen, J. Bülow, K. 1997: Fyring med biomassebaserede restprodukter, Miljøprojekt nr. 358, 1997, Miljøstyrelsen.
Christiansen, M. 1996: Elsam, personal communication, letter 07-05-1996.
Christiansen, M., 2001: Elsam, personal communication, e-mail 23-08-2001 to Jytte Boll Illerup.
Danish Energy Agency (DEA), 2003: Data for installation and fuel con-sumption for each gas engine 1994-2002. Unpublished.
Danish Energy Agency (DEA), 2009a: The Danish energy statistics ag-gregated to SNAP sectors. Unpublished.
Danish Energy Agency (DEA) 2009b: The Danish energy statistics, Available at: http://www.ens.dk/en-US/Info/FactsAndFigures/Energy_statistics_and_indicators/Annual%20Statistics/Documents/BasicData2008.xls (2010-04-27).
Danish Energy Agency (DEA), 2009c: The Danish energy statistics, Ener-giproducenttællingen 2008. Unpublished.
Danish Environmental Protection Agency (DEPA), 2010: Emissioner fra træfyrede brændeovne/kedler (Emissions from wood fired stoves/boilers). Danish Environmental Protection Agency, 2010. Avail-able at: http://www.mst.dk/Publikationer/Publikationer/2010/04/978-87-92617-85-9.htm (2010-04-27).
Danish Gas Technology Centre (DGC), 2001: Naturgas – Energi og miljø (In Danish). Available at: http://www.dgc.dk/publikationer/rapporter/data/PDF/enermilbroch.pdf (2010-04-27).
123
Technical University of Denmark (DTU), 2008: Biogenic Carbon in Dan-ish Combustible Waste. Ongoing project.
EU Commission, 2004: COMMISSION DECISION of 29 January 2004 es-tablishing guidelines for the monitoring and reporting of greenhouse gas emissions pursuant to Directive 2003/87/EC of the European Parliament and of the Council. Available in English: http://eur-lex.europa.eu/LexUriServ/LexUriServ.do?uri=OJ:L:2004:059:0001:0074:EN:PDF (2010-04-27). Official translation to Danish with comments avail-able at: http://www.ens.dk/graphics/Energipolitik/dansk_energipolitik/CO2_kvoter/publ/Vejledning%20om%20CO2-kvoteordningen_dec08.pdf (2010-04-27).
European Environment Agency (EEA), 2002: EMEP/CORINAIR Atmos-pheric Emission Inventory Guidebook – 2002, prepared by the UN-ECE/EMEP Task Force on Emissions Inventories and Projections. Technical Report No 30/2002. Available at: http://www.eea.europa.eu/publications/technical_report_2001_3 (2010-02-30).
European Environment Agency (EEA), 2007: EMEP/CORINAIR Atmos-pheric Emission Inventory Guidebook – 2007, prepared by the UN-ECE/EMEP Task Force on Emissions Inventories and Projections. Technical Report No 16/2007. Available at: http://www.eea.europa.eu/publications/EMEPCORINAIR5 (2010-02-03).
European Environment Agency (EEA), 2009: EMEP/EEA air pollutant emission inventory guidebook 2009. Technical guidance to prepare na-tional emission inventories. EEA Technical Report 9/2009. Available at: http://www.eea.europa.eu/publications/emep-eea-emission-inventory-guidebook-2009 (2010-02-03).
Fauser, P., Thomsen, M., Nielsen, O-K., Winther, M., Gyldenkærne, S., Hoffmann, L., Lyck, E. & Illerup, J.B. 2007: Verification of the Danish emission inventory data by national and international
data comparisons. National Environmental Research Institute, Univer-sity of Aarhus, Denmark. 53 pp. – NERI Technical Report no. 627. Avail-able at: http://www.dmu.dk/Udgivelser/Faglige+rapporter/Nr.+600-649/ (2010-04-27).
Fenhann, J. & Kilde, N.A. 1994: Inventory of Emissions to the air from Danish Sources 1972-1992, RISØ.
Finstad, A., Haakonsen, G., Kvingedal, E. & Rypdal, K. 2001: Utslipp til luft av noen miljøgifter i Norge, Dokumentasjon av metode og resultater, Statistics Norway Report 2001/17 (In Norwegian).
Gruijthuijsen, L.v. & Jensen, J.K. 2000: Energi- og miljøoversigt, Danish Gas Technology Centre 2000 (In Danish). Available at:
124
http://www.dgc.dk/publikationer/rapporter/data/PDF/energi_og_miljoedata.pdf (2010-04-27).
Henriksen, T.C., Illerup, J.B. & Nielsen, O.-K. 2006: Dioxin Air Emission Inventory 1990-2004. National Environmental Research Institute, Den-mark. 90 pp. – NERI Technical report no 602. Available at: http://www2.dmu.dk/Pub/FR602.pdf (2010-04-27).
Hulgaard, T. 2003: Personal communication, e-mail 02-10-2003, Rambøll.
Illerup, J.B., Geertinger, A., Hoffmann, L. & Christiansen, K. 1999: Emis-sionsfaktorer for tungmetaller 1990-1996. Danmarks Miljøundersøgelser. 66 s. – Faglig rapport fra DMU nr. 301. (In Danish) Available at: http://www2.dmu.dk/1_viden/2_Publikationer/3_fagrapporter/rapporter/fr301.pdf (2010-04-27).
Illerup, J.B., Henriksen, T.C., Lundhede, T., Breugel, C.v., Jensen, N.Z. 2007: Brændeovne og små kedler – partikelemission og reduktionstiltag. Miljøstyrelsen, Miljøprojekt 1164, 2007. Available at: http://www2.mst.dk/common/Udgivramme/Frame.asp?http://www2.mst.dk/Udgiv/publikationer/2007/978-87-7052-451-3/html/default.htm (2010-04-27).
Intergovernmental Panel on Climate Change (IPCC), 1997: Revised 1996 IPCC Guidelines for National Greenhouse Gas Inventories. Available at: http://www.ipcc-nggip.iges.or.jp/public/gl/invs6.html (2010-04-27).
Intergovernmental Panel on Climate Change (IPCC), 2000: Penman, J., Kruger, D., Galbally, I., Hiraishi, T., Nyenzi, B., Emmanuel, S., Buendia, L., Hoppaus, R., Martinsen, T., Meijer, J., Miwa, K. & Tanabe, K. (Eds). Good Practice Guidance and Uncertainty Management in National Greenhouse Gas Inventories. Published: IPCC/OECD/IEA/IGES, Ha-yama, Japan. Available at: http://www.ipcc-nggip.iges.or.jp/public/gp/english/index.html (2010-04-27).
Jensen, B.G. & Lindroth, M. 2002: Kontrol af indberetning af CO2-udledning fra el-producenter i 2001, Carl Bro for Energistyrelsens 6. kon-tor (in Danish, not published).
Jensen, J. 2001: Danish Gas Technology Centre, Personal communication e-mail 11-10-2001.
Jensen, L. & Nielsen, P.A. 1990: Emissioner fra halm- og flisfyr, dk-Teknik & Levnedsmiddelstyrelsen 1990 (In Danish).
Jensen, L. & Nielsen, P.B. 1996: Emissioner fra halm- og flisfyr, Ar-bejdsrapport fra Miljøstyrelsen nr 5 1996, Bilagsrapport (In Danish).
Jeppesen, J.S. 2008: Københavns Energi (KE), (Copenhagen Energy), Jør-gen Steen Jeppesen, personal communication.
Jørgensen, L. & Johansen, L.P. 2003: Eltra PSO 3141, Kortlægning af emissioner fra decentrale kraftvarmeværker, Anlæg A1-A5, dk-Teknik (In Danish). Available at:
125
http://www.energinet.dk/da/menu/Forskning/ForskEL-programmet/Projekter/Afsluttede/Projekt+3141.htm (2010-04-27).
Københavns Energi (KE), 2009: Københavns Energi (Copenhagen Ener-gy) fact sheet on town gas. Available at: http://www.ke.dk/portal/pls/portal/docs/346012.PDF (2010-04-27).
Kristensen, P.G. 2001: Personal communication, e-mail 10-04-2001, Dan-ish Gas Technology Centre.
Kristensen, P.G. 2007: Danish Gas Technology Centre, Per Gravers Kris-tensen, personal communication.
Livbjerg, H. Thellefsen, M. Sander, B. Simonsen, P., Lund, C., Poulsen, K. & Fogh, C.L. 2001: Feltstudier af Forbrændingsaerosoler, EFP -98 Projekt, Aerosollaboratoriet DTU, FLS Miljø, Forskningscenter Risø, Elsam, En-ergi E2 (in Danish).
Miljøstyrelsen (MST), 1990: Bekendtgørelse om begrænsning af emissio-ner af svovl-dioxid, kvælstofoxider og støv fra store fyringsanlæg, Be-kendtgørelse 689 af 15/10/1990, (Danish legislation).
Miljøstyrelsen (MST), 1998: Bekendtgørelseom begrænsning af svovlind-holdet i visse flydende og faste brændstoffer, Bekendtgørelse 698 af 22/09/1998 (Danish legislation).
Miljøstyrelsen (MST), 2001: Luftvejledningen, Begrænsning af luftforu-rening fra virksomheder, Vejledning fra Miljøstyrelsen nr. 2 2001 (Danish legislation).
Miljøstyrelsen (MST), 2005: Bekendtgørelse om begrænsning af emission af nitrogenoxider, uforbrændte carbonhydrider og carbonmonooxid mv. fra motorer og turbiner. Bekendtgørelse 621 af 23/06/2005. (Danish le-gislation). Availeabe at: https://www.retsinformation.dk/Forms/R0710.aspx?id=12836&exp=1 (2010-04-27)
Miljøstyrelsen (MST), 2006: Bekendtgørelse om visse virksomheders pligt til at udarbejde grønt regnskab. Bekendtgørelse 1515 af 14/12/2006 - �����=. (Danish legislation). Available at: https://www.retsinformation.dk/Forms/R0710.aspx?id=12993&exp=1 (2010-04-27).
Nielsen, M. & Wit, J. 1997: Emissionsforhold for gasdrevne kraftvar-meænlæg < 25MWe, Miljøstyrelsen, Arbejdsrapport Nr. 17 1997 (In Da-nish). Available at: http://www2.mst.dk/Udgiv/publikationer/1997/87-7810-759-8/pdf/87-7810-759-8.pdf (2010-04-27).
Nielsen, M. & Illerup, J.B. 2003: Emissionsfaktorer og emissionsopgørelse for decentral kraftvarme. Eltra PSO projekt 3141. Kortlægning af emissi-oner fra decentrale kraftvarmeværker. Delrapport 6. Danmarks Miljøun-dersøgelser. 116 s. –Faglig rapport fra DMU nr. 442. (In Danish, with an English summary). Available at:
126
http://www2.dmu.dk/1_viden/2_Publikationer/3_fagrapporter/rapporter/FR442.pdf (2010-04-27).
Nielsen, M. Winther, M., Illerup, J.B. & Mikkelsen, M.H. 2003: Danish emission inventory for particulate matter (PM). National Environmental Research Institute, Denmark. 126 p. – Research Notes from NERI No. 189. Available at: http://www2.dmu.dk/1_viden/2_Publikationer/3_arbrapporter/rapporter/AR189.pdf (2010-04-27).
Nielsen, M. & Illerup, J.B. 2004: Danish emission inventories for station-ary combustion plants. Inventories until year 2002. National Environ-mental Research Institute, Denmark. 127pp. – Research Notes from NERI no. 200. Available at: http://www.dmu.dk/Udgivelser/Arbejdsrapporter/Nr.+200-249/ (2010-04-27).
Nielsen, M. & Illerup, J.B. 2006: Danish emission inventories for station-ary combustion plants. Inventories until year 2003. National Environ-mental Research Institute, Denmark. 162 pp. – Research Notes from NERI no. 229. Available at: http://www.dmu.dk/Udgivelser/Arbejdsrapporter/Nr.+200-249/ (2010-04-27).
Nielsen, O.-K., Nielsen, M. & Illerup, J.B. 2007: Danish Emission Invento-ries for Stationary Combustion Plants. Inventories until year 2004. Na-tional Environmental Research Institute, University of Aarhus, Denmark. 176 pp. – NERI Technical Report no. 628. Available at: http://www.dmu.dk/Udgivelser/Faglige+rapporter/Nr.+600-649/ (2010-04-27).
Nielsen, M., Illerup, J.B. & Birr-Petersen, K. 2008: Revised emission fac-tors for gas engines including start/stop emissions. Sub-report 3 (NERI). National Environmental Research Institute, University of Aarhus. 69 pp. - NERI Technical Report No. 672. Available at: http://www.dmu.dk/Pub/FR672.pdf (2010-04-27)�
Nielsen, O.-K. 2009: Angående CO2-emissioner fra affaldsforbrænding, 2009-08-19. Research notes, not published.
Nielsen, M., Nielsen, O.-K., Plejdrup, M. & Hjelgaard, K. 2009: Danish Emission Inventories for Stationary Combustion Plants. Inventories until year 2007. National Environmental Research Institute, Aarhus Univer-sity, Denmark. 216 pp. – NERI Technical Report no. 744. Available at: http://www.dmu.dk/Pub/FR744.pdf (2010-04-27).
Nielsen, O.-K., Lyck, E., Mikkelsen, M.H., Hoffmann, L., Gyldenkærne, S., Winther, M., Nielsen, M., Fauser, P., Thomsen, M., Plejdrup, M.S., Illerup, J.B., Sørensen, P.B. & Vesterdal, L. 2010a: Denmark’s National Inventory Report 2010 - Emission Inventories 1990-2008 - Submitted un-der the United Nations Framework Convention on Climate Change. Na-tional Environmental Research Institute, University of Aarhus. 1178 pp. – NERI Technical Report no. 784. Available at: http://www.dmu.dk/Pub/FR784.pdf
127
Nielsen, O-K., Winther, M., Mikkelsen, M.H., Hoffmann, L., Nielsen, M., Gyldenkærne, S., Fauser, P., Jensen, M.T., Plejdrup, M.S. & Illerup, J.B. 2010b: Annual Danish Emission Inventory Report to UNECE. Inventories from the base year of the protocols to year 2008. National Environmental Research Institute, University of Aarhus. 565 pp. – NERI Technical Re-port No. 776. Available at: http://www.dmu.dk/Pub/FR776.pdf
Nielsen, M., Nielsen, O.-K. & Thomsen, M. 2010c: Emissionskortlægning for decentral kraftvarme 2007 - Energinet.dk miljøprojekt nr. 07/1882. Delrapport 5 Emissionsfaktorer og emissionsopgørelse for decentral kraftvarme, 2006. Danmarks Miljøundersøgelser, Aarhus Universitet.105 s. – Faglig rapport fra DMU nr. 781. Available at: http://www.dmu.dk/Pub/FR781.pdf (2010-04-22).
Nikolaisen, L., Nielsen, C., Larsen, M.G., Nielsen, V. Zielke, U., Kris-tensen, J.K. & Holm-Christensen, B. 1998: Halm til energiformål, Teknik – Miljø – Økonomi, 2. udgave, 1998, Videncenter for halm og flisfyring (In Danish).
Plejdrup, M.S., Nielsen, O.-K. & Nielsen, M. 2009: Emission Inventory for Fugitive Emissions in Denmark. National Environmental Research Insti-tute, Aarhus University, Denmark. 47 pp. – NERI Technical Report no. 739. Available at: http://www.dmu.dk/pub/FR739.pdf (2010-04-27).
Pulles, T. & Aardenne, J.v. 2004: Good Practice Guidance for LRTAP Emission Inventories, 24. Juni 2004. Available at: http://www.eea.europa.eu/publications/EMEPCORINAIR5/BGPG.pdf (2010-04-27).
Serup, H., Falster, H., Gamborg, C., Gundersen, P., Hansen, L. Heding, N., Jacobsen, H.H., Kofman, P., Nikolaisen, L. & Thomsen, I.M. 1999: Træ til energiformål, Teknik – Miljø – Økonomi, 2. udgave, 1999, Videncenter for halm og flisfyring (In Danish).
Sørensen, P.B., Illerup, J.B., Nielsen, M., Lyck, E., Bruun, H.G., Winther, M., Mikkelsen, M.H. & Gyldenkærne, S. 2005: Quality manual for the greenhouse gas inventory. Version 1. National Environmental Research Institute, Denmark. 25 pp. – Research Notes from NERI no. 224. Avail-able at: http://www.dmu.dk/Udgivelser/Arbejdsrapporter/Nr.+200-249/ (2010-04-27)
Sternhufvud, C., Karvosenoja, N., Illerup, J., Kindbom, K., Lükewille, A., Johansson, M. & Jensen, D. 2004: Particulate matter emissions and abatement options in residential wood burning in the Nordic countries.
Wit, J.d & Andersen, S.D. 2003: Emission fra større gasfyrede kedler, Dansk Gasteknisk Center, 2003. Available at: http://www.dgc.dk/publikationer/rapporter/data/03/emission.htm (2010-02-14).
128
���������
Appendix 1: The Danish emission inventory for the year 2008 reported to the Climate Convention in 2010
Appendix 2: Emission inventory for the year 2008 reported to the LRTAP Convention in 2010
Appendix 3: IPCC/SNAP source correspondence list
Appendix 4: Fuel rate
Appendix 5: Lower Calorific Value (LCV) of fuels
Appendix 6: Emission factors
Appendix 7: Implied emission factors for power plants and municipal waste incineration plants
Appendix 8: Large point sources
Appendix 9: Adjustment of CO2 emission
Appendix 10: Uncertainty estimates
Appendix 11: Reference approach
Appendix 12: Emission inventory 2008 based on SNAP sectors
Appendix 13: Description of the Danish energy statistics
Appendix 14: Key source analysis
Appendix 15: Time-series 1980-2008
Appendix 16: Source specific QA/QC
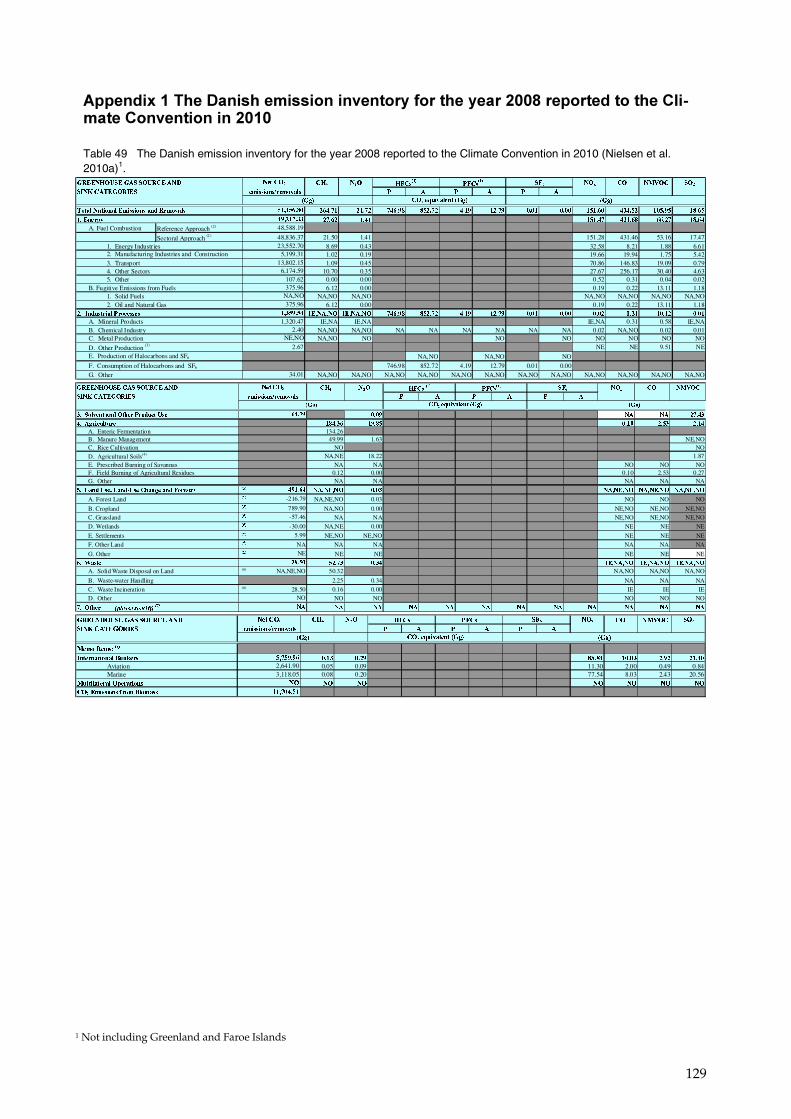
129
�������������� ���������������������������������� ���������������������������� ���������������������
Table 49 The Danish emission inventory for the year 2008 reported to the Climate Convention in 2010 (Nielsen et al. 2010a)1.
����������������������� �� ��� �� ���
�� ��� ��� ��� �� ���� ���
������������� � � �
������������������ ��� ������������ �� !"# �#!"� " �!$% %&�!"� !#$ #�!"$ '!'# '!'' #&#!�' ( !&� #'&!$& #%!�&
#!����)*+ �"!�� #! # #&#! " (#!�% ��!�" #%!�
A. Fuel Combustion Reference Approach (2)
Sectoral Approach (2 ) 21.50 1.41 151.28 431.46 53.16 17.471. Energy Industries 8.69 0.43 32.58 8.21 1.88 6.61
1.02 0.19 19.66 19.94 1.75 5.423. Transport 1.09 0.45 70.86 146.83 19.09 0.794. Other Sectors 10.70 0.35 27.67 256.17 30.40 4.635. Other 0.00 0.00 0.52 0.31 0.04 0.02
B. Fugitive Emissions from Fuels 6.12 0.00 0.19 0.22 13.11 1.181. Solid Fuels NA,NO NA,NO NA,NO NA,NO NA,NO NA,NO2. Oil and Natural Gas 6.12 0.00 0.19 0.22 13.11 1.18
�!�����, �)�����)�-� � ��.�.�� ��.�.�� " �!$% %&�!"� !#$ #�!"$ '!'# '!'' '!'� '!(# #'!#� '!'#
A. Mineral Products IE,NA IE,NA IE,NA 0.31 0.58 IE,NAB. Chemical Industry NA,NO NA,NO NA NA NA NA NA NA 0.02 NA,NO 0.02 0.01C. Metal Production NA,NO NO NO NO NO NO NO NO
D. Other Production (3) NE NE 9.51 NEE. Production of Halocarbons and SF6 NA,NO NA,NO NO
F. Consumption of Halocarbons and SF6 746.98 852.72 4.19 12.79 0.01 0.00G. Other NA,NO NA,NO NA,NO NA,NO NA,NO NA,NO NA,NO NA,NO NA,NO NA,NO NA,NO NA,NO34.01
2.40NE,NO
2.67
NA,NO375.96
#.(&$!&
1,320.47
13,802.156,174.59
107.62375.96
48,836.3723,552.70
2. Manufacturing Industries and Construction 5,199.31
/�*0
&#.#&�!%'
$.�#�!((
48,588.19
������
���� ��� 1)������
/�*0 ����2,��������/�*0
���������������������� �� ��� �� �
�����
��� ��� ��� �� ����
������������� � � �
�������������������������� !��� � "�"# � � $%�&�
&���'�(! �� �� )*&��+ )#�*, "�)" $�,� $�)&
A. Enteric Fermentation 134.26B. Manure Management 49.99 1.63 NE,NOC. Rice Cultivation NO NO
D. Agricultural Soils(4) NA,NE 18.22 1.87E. Prescribed Burning of Savannas NA NA NO NO NOF. Field Burning of Agricultural Residues 0.12 0.00 0.10 2.53 0.27G. Other NA NA NA NA NA
,���-����� �.�-���/� �����'���������� ��0 ��� �.��.�� "�"� �.��.�� �.��.�� �.��.��
A. Forest Land ��� NA,NE,NO 0.03 NO NO NO
B. Cropland ��� NA,NO 0.00 NE,NO NE,NO NE,NOC. Grassland ��� NA NA NE,NO NE,NO NE,NO
D. Wetlands ��� NA,NE 0.00 NE NE NE
E. Settlements ��� NE,NO NE,NO NE NE NE
F. Other Land ��� NA NA NA NA NA
G. Other ��� NE NE NE NE NE+���1� �� ,$�%� "��& ��.�.�� ��.�.�� ��.�.��
A. Solid Waste Disposal on Land (6) 50.32 NA,NO NA,NO NA,NO
B. Waste-water Handling 2.25 0.34 NA NA NA
C. Waste Incineration (6) 0.16 0.00 IE IE IED. Other NO NO NO NO NO
%���������������������������������� � � � � � � � � � � �
28.50NO
�
NANE
$*�,"
NA,NE,NO
789.90-57.46
-30.005.99
&#)�+&
-216.79
2�'3
+&�%#
�4( (�� 5��4����
2�'3 ����6 (�������2�'3
�������
����������������������� �� ��� �� �� ��� ��� �� ���� ���
������������� � � �
��������� �����
����������������� �� !"#$ !"%& ''"'( #!"!$ %"&% %#"(!
Aviation 0.05 0.09 11.30 2.00 0.49 0.84Marine 0.08 0.20 77.54 8.03 2.43 20.56
��������������)������� �� �� �� �� �� ��
������ ��� �*���������
3,118.05��
##+,!("-#
.�/0
-+,-&"&1
2,641.90
������
���� ��� 2����3��
.�/0 ����4��3������.�/0
1 Not including Greenland and Faroe Islands
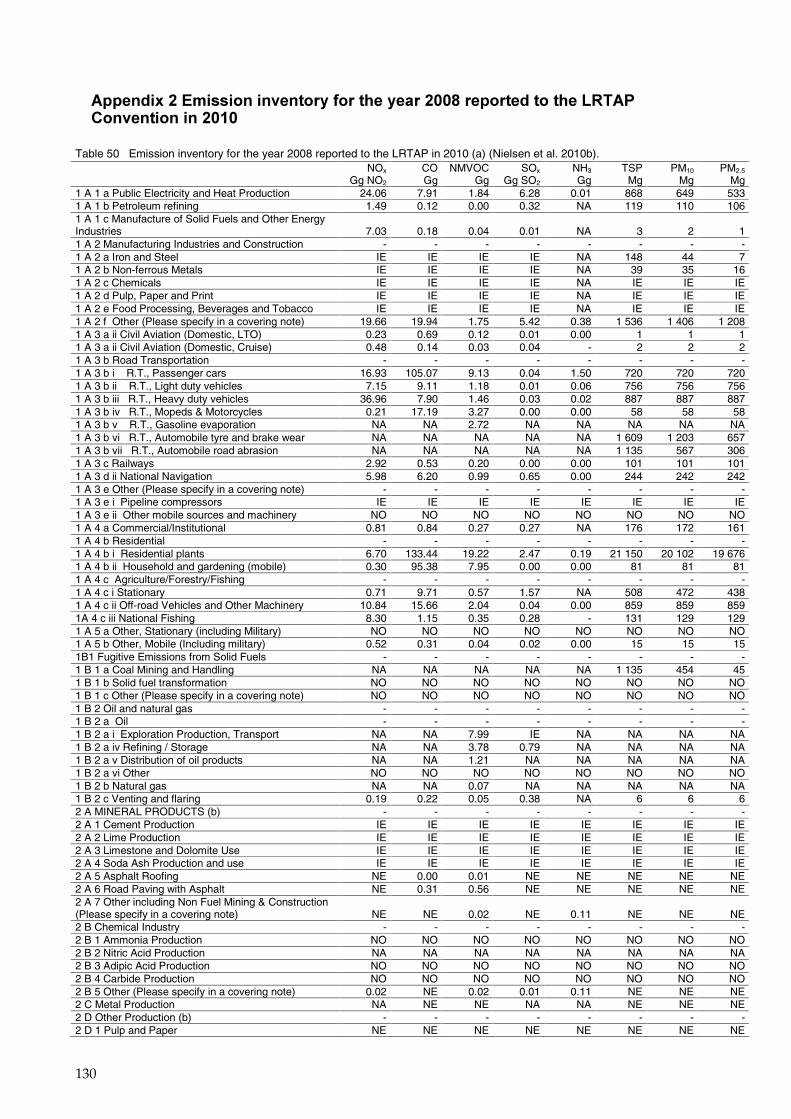
130
���������������������������������������� ����������������������������������������������
Table 50 Emission inventory for the year 2008 reported to the LRTAP in 2010 (a) (Nielsen et al. 2010b). �� NOx CO NMVOC SOx NH3 TSP PM10 PM2.5 �� Gg NO2 Gg Gg Gg SO2 Gg Mg Mg Mg 1 A 1 a Public Electricity and Heat Production 24.06 7.91 1.84 6.28 0.01 868 649 533 1 A 1 b Petroleum refining 1.49 0.12 0.00 0.32 NA 119 110 106 1 A 1 c Manufacture of Solid Fuels and Other Energy Industries 7.03 0.18 0.04 0.01 NA 3 2 1 1 A 2 Manufacturing Industries and Construction - - - - - - - - 1 A 2 a Iron and Steel IE IE IE IE NA 148 44 7 1 A 2 b Non-ferrous Metals IE IE IE IE NA 39 35 16 1 A 2 c Chemicals IE IE IE IE NA IE IE IE 1 A 2 d Pulp, Paper and Print IE IE IE IE NA IE IE IE 1 A 2 e Food Processing, Beverages and Tobacco IE IE IE IE NA IE IE IE 1 A 2 f Other (Please specify in a covering note) 19.66 19.94 1.75 5.42 0.38 1 536 1 406 1 208 1 A 3 a ii Civil Aviation (Domestic, LTO) 0.23 0.69 0.12 0.01 0.00 1 1 1 1 A 3 a ii Civil Aviation (Domestic, Cruise) 0.48 0.14 0.03 0.04 - 2 2 2 1 A 3 b Road Transportation - - - - - - - - 1 A 3 b i R.T., Passenger cars 16.93 105.07 9.13 0.04 1.50 720 720 720 1 A 3 b ii R.T., Light duty vehicles 7.15 9.11 1.18 0.01 0.06 756 756 756 1 A 3 b iii R.T., Heavy duty vehicles 36.96 7.90 1.46 0.03 0.02 887 887 887 1 A 3 b iv R.T., Mopeds & Motorcycles 0.21 17.19 3.27 0.00 0.00 58 58 58 1 A 3 b v R.T., Gasoline evaporation NA NA 2.72 NA NA NA NA NA 1 A 3 b vi R.T., Automobile tyre and brake wear NA NA NA NA NA 1 609 1 203 657 1 A 3 b vii R.T., Automobile road abrasion NA NA NA NA NA 1 135 567 306 1 A 3 c Railways 2.92 0.53 0.20 0.00 0.00 101 101 101 1 A 3 d ii National Navigation 5.98 6.20 0.99 0.65 0.00 244 242 242 1 A 3 e Other (Please specify in a covering note) - - - - - - - - 1 A 3 e i Pipeline compressors IE IE IE IE IE IE IE IE 1 A 3 e ii Other mobile sources and machinery NO NO NO NO NO NO NO NO 1 A 4 a Commercial/Institutional 0.81 0.84 0.27 0.27 NA 176 172 161 1 A 4 b Residential - - - - - - - - 1 A 4 b i Residential plants 6.70 133.44 19.22 2.47 0.19 21 150 20 102 19 676 1 A 4 b ii Household and gardening (mobile) 0.30 95.38 7.95 0.00 0.00 81 81 81 1 A 4 c Agriculture/Forestry/Fishing - - - - - - - - 1 A 4 c i Stationary 0.71 9.71 0.57 1.57 NA 508 472 438 1 A 4 c ii Off-road Vehicles and Other Machinery 10.84 15.66 2.04 0.04 0.00 859 859 859 1A 4 c iii National Fishing 8.30 1.15 0.35 0.28 - 131 129 129 1 A 5 a Other, Stationary (including Military) NO NO NO NO NO NO NO NO 1 A 5 b Other, Mobile (Including military) 0.52 0.31 0.04 0.02 0.00 15 15 15 1B1 Fugitive Emissions from Solid Fuels - - - - - - - - 1 B 1 a Coal Mining and Handling NA NA NA NA NA 1 135 454 45 1 B 1 b Solid fuel transformation NO NO NO NO NO NO NO NO 1 B 1 c Other (Please specify in a covering note) NO NO NO NO NO NO NO NO 1 B 2 Oil and natural gas - - - - - - - - 1 B 2 a Oil - - - - - - - - 1 B 2 a i Exploration Production, Transport NA NA 7.99 IE NA NA NA NA 1 B 2 a iv Refining / Storage NA NA 3.78 0.79 NA NA NA NA 1 B 2 a v Distribution of oil products NA NA 1.21 NA NA NA NA NA 1 B 2 a vi Other NO NO NO NO NO NO NO NO 1 B 2 b Natural gas NA NA 0.07 NA NA NA NA NA 1 B 2 c Venting and flaring 0.19 0.22 0.05 0.38 NA 6 6 6 2 A MINERAL PRODUCTS (b) - - - - - - - - 2 A 1 Cement Production IE IE IE IE IE IE IE IE 2 A 2 Lime Production IE IE IE IE IE IE IE IE 2 A 3 Limestone and Dolomite Use IE IE IE IE IE IE IE IE 2 A 4 Soda Ash Production and use IE IE IE IE IE IE IE IE 2 A 5 Asphalt Roofing NE 0.00 0.01 NE NE NE NE NE 2 A 6 Road Paving with Asphalt NE 0.31 0.56 NE NE NE NE NE 2 A 7 Other including Non Fuel Mining & Construction (Please specify in a covering note) NE NE 0.02 NE 0.11 NE NE NE 2 B Chemical Industry - - - - - - - - 2 B 1 Ammonia Production NO NO NO NO NO NO NO NO 2 B 2 Nitric Acid Production NA NA NA NA NA NA NA NA 2 B 3 Adipic Acid Production NO NO NO NO NO NO NO NO 2 B 4 Carbide Production NO NO NO NO NO NO NO NO 2 B 5 Other (Please specify in a covering note) 0.02 NE 0.02 0.01 0.11 NE NE NE 2 C Metal Production NA NE NE NA NA NE NE NE 2 D Other Production (b) - - - - - - - - 2 D 1 Pulp and Paper NE NE NE NE NE NE NE NE
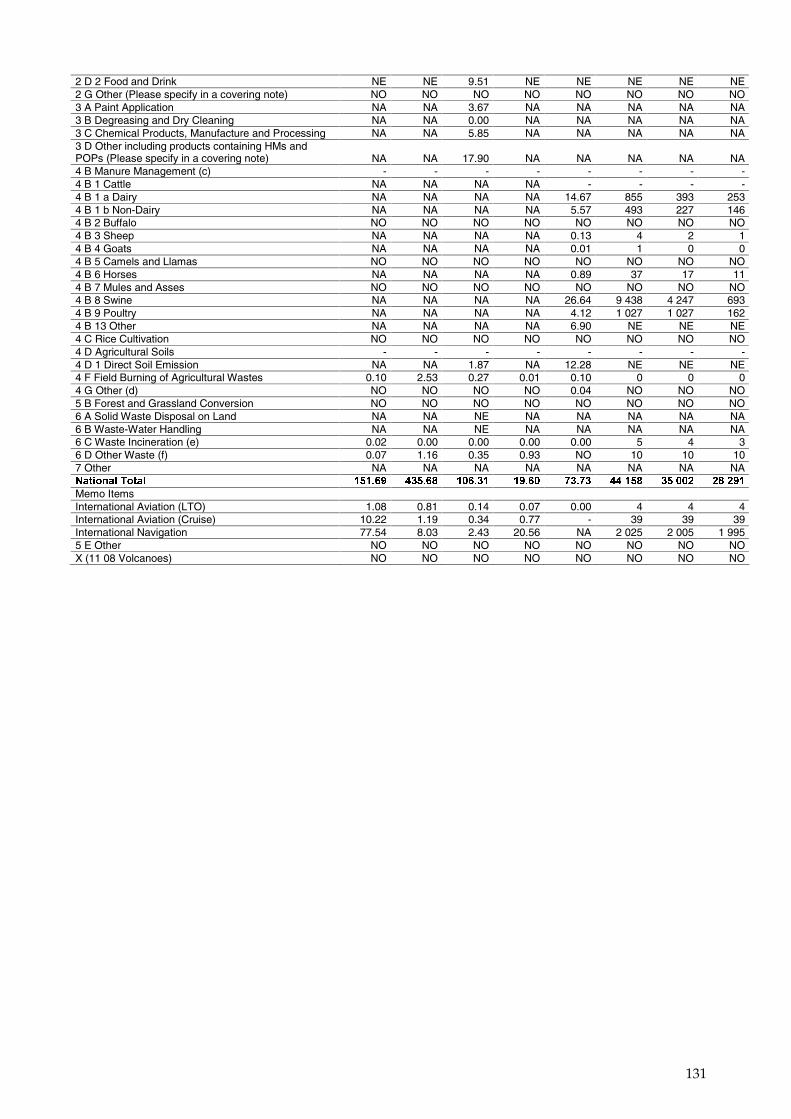
131
2 D 2 Food and Drink NE NE 9.51 NE NE NE NE NE 2 G Other (Please specify in a covering note) NO NO NO NO NO NO NO NO 3 A Paint Application NA NA 3.67 NA NA NA NA NA 3 B Degreasing and Dry Cleaning NA NA 0.00 NA NA NA NA NA 3 C Chemical Products, Manufacture and Processing NA NA 5.85 NA NA NA NA NA 3 D Other including products containing HMs and POPs (Please specify in a covering note) NA NA 17.90 NA NA NA NA NA 4 B Manure Management (c) - - - - - - - - 4 B 1 Cattle NA NA NA NA - - - - 4 B 1 a Dairy NA NA NA NA 14.67 855 393 253 4 B 1 b Non-Dairy NA NA NA NA 5.57 493 227 146 4 B 2 Buffalo NO NO NO NO NO NO NO NO 4 B 3 Sheep NA NA NA NA 0.13 4 2 1 4 B 4 Goats NA NA NA NA 0.01 1 0 0 4 B 5 Camels and Llamas NO NO NO NO NO NO NO NO 4 B 6 Horses NA NA NA NA 0.89 37 17 11 4 B 7 Mules and Asses NO NO NO NO NO NO NO NO 4 B 8 Swine NA NA NA NA 26.64 9 438 4 247 693 4 B 9 Poultry NA NA NA NA 4.12 1 027 1 027 162 4 B 13 Other NA NA NA NA 6.90 NE NE NE 4 C Rice Cultivation NO NO NO NO NO NO NO NO 4 D Agricultural Soils - - - - - - - - 4 D 1 Direct Soil Emission NA NA 1.87 NA 12.28 NE NE NE 4 F Field Burning of Agricultural Wastes 0.10 2.53 0.27 0.01 0.10 0 0 0 4 G Other (d) NO NO NO NO 0.04 NO NO NO 5 B Forest and Grassland Conversion NO NO NO NO NO NO NO NO 6 A Solid Waste Disposal on Land NA NA NE NA NA NA NA NA 6 B Waste-Water Handling NA NA NE NA NA NA NA NA 6 C Waste Incineration (e) 0.02 0.00 0.00 0.00 0.00 5 4 3 6 D Other Waste (f) 0.07 1.16 0.35 0.93 NO 10 10 10 7 Other NA NA NA NA NA NA NA NA ��������������� ��� � ������� ������ � ���� ������� ����� ������ ���� �
Memo Items International Aviation (LTO) 1.08 0.81 0.14 0.07 0.00 4 4 4 International Aviation (Cruise) 10.22 1.19 0.34 0.77 - 39 39 39 International Navigation 77.54 8.03 2.43 20.56 NA 2 025 2 005 1 995 5 E Other NO NO NO NO NO NO NO NO X (11 08 Volcanoes) NO NO NO NO NO NO NO NO
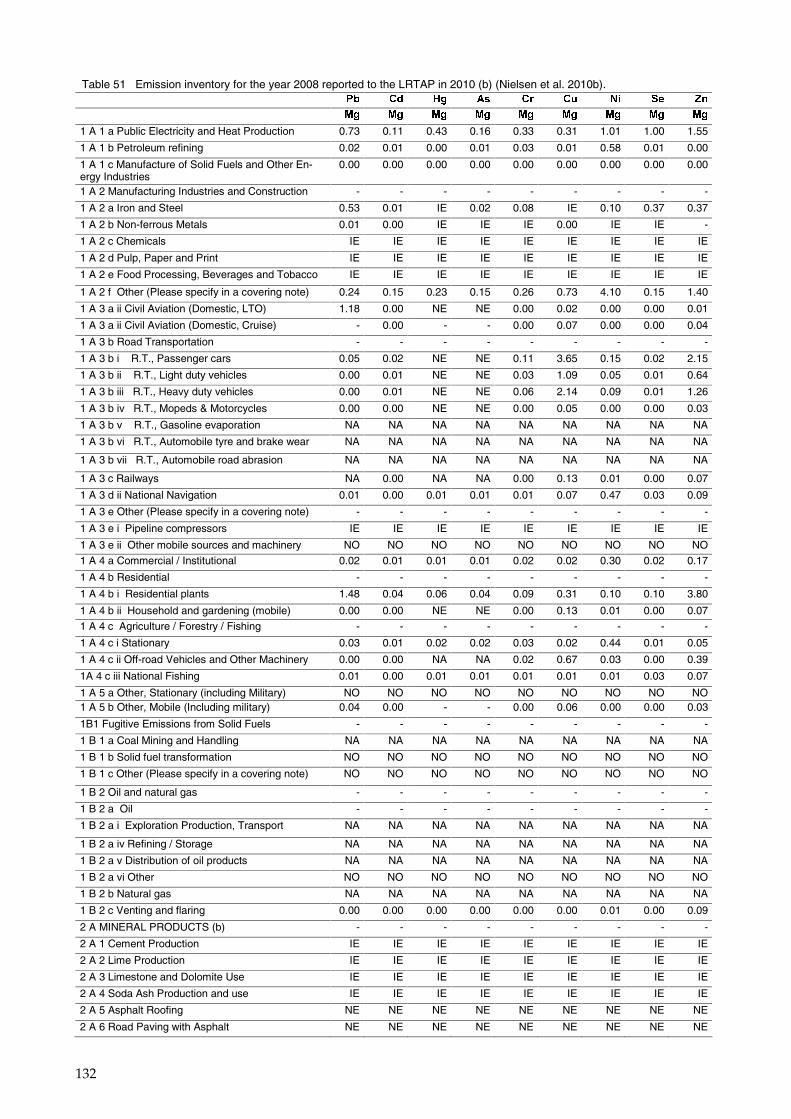
132
Table 51 Emission inventory for the year 2008 reported to the LRTAP in 2010 (b) (Nielsen et al. 2010b). �� ��� ��� ��� ��� ��� ��� ��� ��� ��
�� !�� !�� !�� !�� !�� !�� !�� !�� !��
1 A 1 a Public Electricity and Heat Production 0.73 0.11 0.43 0.16 0.33 0.31 1.01 1.00 1.55
1 A 1 b Petroleum refining 0.02 0.01 0.00 0.01 0.03 0.01 0.58 0.01 0.00
1 A 1 c Manufacture of Solid Fuels and Other En-ergy Industries
0.00 0.00 0.00 0.00 0.00 0.00 0.00 0.00 0.00
1 A 2 Manufacturing Industries and Construction - - - - - - - - -
1 A 2 a Iron and Steel 0.53 0.01 IE 0.02 0.08 IE 0.10 0.37 0.37
1 A 2 b Non-ferrous Metals 0.01 0.00 IE IE IE 0.00 IE IE -
1 A 2 c Chemicals IE IE IE IE IE IE IE IE IE
1 A 2 d Pulp, Paper and Print IE IE IE IE IE IE IE IE IE
1 A 2 e Food Processing, Beverages and Tobacco IE IE IE IE IE IE IE IE IE
1 A 2 f Other (Please specify in a covering note) 0.24 0.15 0.23 0.15 0.26 0.73 4.10 0.15 1.40
1 A 3 a ii Civil Aviation (Domestic, LTO) 1.18 0.00 NE NE 0.00 0.02 0.00 0.00 0.01
1 A 3 a ii Civil Aviation (Domestic, Cruise) - 0.00 - - 0.00 0.07 0.00 0.00 0.04
1 A 3 b Road Transportation - - - - - - - - -
1 A 3 b i R.T., Passenger cars 0.05 0.02 NE NE 0.11 3.65 0.15 0.02 2.15
1 A 3 b ii R.T., Light duty vehicles 0.00 0.01 NE NE 0.03 1.09 0.05 0.01 0.64
1 A 3 b iii R.T., Heavy duty vehicles 0.00 0.01 NE NE 0.06 2.14 0.09 0.01 1.26
1 A 3 b iv R.T., Mopeds & Motorcycles 0.00 0.00 NE NE 0.00 0.05 0.00 0.00 0.03
1 A 3 b v R.T., Gasoline evaporation NA NA NA NA NA NA NA NA NA
1 A 3 b vi R.T., Automobile tyre and brake wear NA NA NA NA NA NA NA NA NA
1 A 3 b vii R.T., Automobile road abrasion NA NA NA NA NA NA NA NA NA
1 A 3 c Railways NA 0.00 NA NA 0.00 0.13 0.01 0.00 0.07
1 A 3 d ii National Navigation 0.01 0.00 0.01 0.01 0.01 0.07 0.47 0.03 0.09
1 A 3 e Other (Please specify in a covering note) - - - - - - - - -
1 A 3 e i Pipeline compressors IE IE IE IE IE IE IE IE IE
1 A 3 e ii Other mobile sources and machinery NO NO NO NO NO NO NO NO NO
1 A 4 a Commercial / Institutional 0.02 0.01 0.01 0.01 0.02 0.02 0.30 0.02 0.17
1 A 4 b Residential - - - - - - - - -
1 A 4 b i Residential plants 1.48 0.04 0.06 0.04 0.09 0.31 0.10 0.10 3.80
1 A 4 b ii Household and gardening (mobile) 0.00 0.00 NE NE 0.00 0.13 0.01 0.00 0.07
1 A 4 c Agriculture / Forestry / Fishing - - - - - - - - -
1 A 4 c i Stationary 0.03 0.01 0.02 0.02 0.03 0.02 0.44 0.01 0.05
1 A 4 c ii Off-road Vehicles and Other Machinery 0.00 0.00 NA NA 0.02 0.67 0.03 0.00 0.39
1A 4 c iii National Fishing 0.01 0.00 0.01 0.01 0.01 0.01 0.01 0.03 0.07
1 A 5 a Other, Stationary (including Military) NO NO NO NO NO NO NO NO NO 1 A 5 b Other, Mobile (Including military) 0.04 0.00 - - 0.00 0.06 0.00 0.00 0.03
1B1 Fugitive Emissions from Solid Fuels - - - - - - - - -
1 B 1 a Coal Mining and Handling NA NA NA NA NA NA NA NA NA
1 B 1 b Solid fuel transformation NO NO NO NO NO NO NO NO NO
1 B 1 c Other (Please specify in a covering note) NO NO NO NO NO NO NO NO NO
1 B 2 Oil and natural gas - - - - - - - - -
1 B 2 a Oil - - - - - - - - -
1 B 2 a i Exploration Production, Transport NA NA NA NA NA NA NA NA NA
1 B 2 a iv Refining / Storage NA NA NA NA NA NA NA NA NA
1 B 2 a v Distribution of oil products NA NA NA NA NA NA NA NA NA
1 B 2 a vi Other NO NO NO NO NO NO NO NO NO
1 B 2 b Natural gas NA NA NA NA NA NA NA NA NA
1 B 2 c Venting and flaring 0.00 0.00 0.00 0.00 0.00 0.00 0.01 0.00 0.09
2 A MINERAL PRODUCTS (b) - - - - - - - - -
2 A 1 Cement Production IE IE IE IE IE IE IE IE IE
2 A 2 Lime Production IE IE IE IE IE IE IE IE IE
2 A 3 Limestone and Dolomite Use IE IE IE IE IE IE IE IE IE
2 A 4 Soda Ash Production and use IE IE IE IE IE IE IE IE IE
2 A 5 Asphalt Roofing NE NE NE NE NE NE NE NE NE
2 A 6 Road Paving with Asphalt NE NE NE NE NE NE NE NE NE
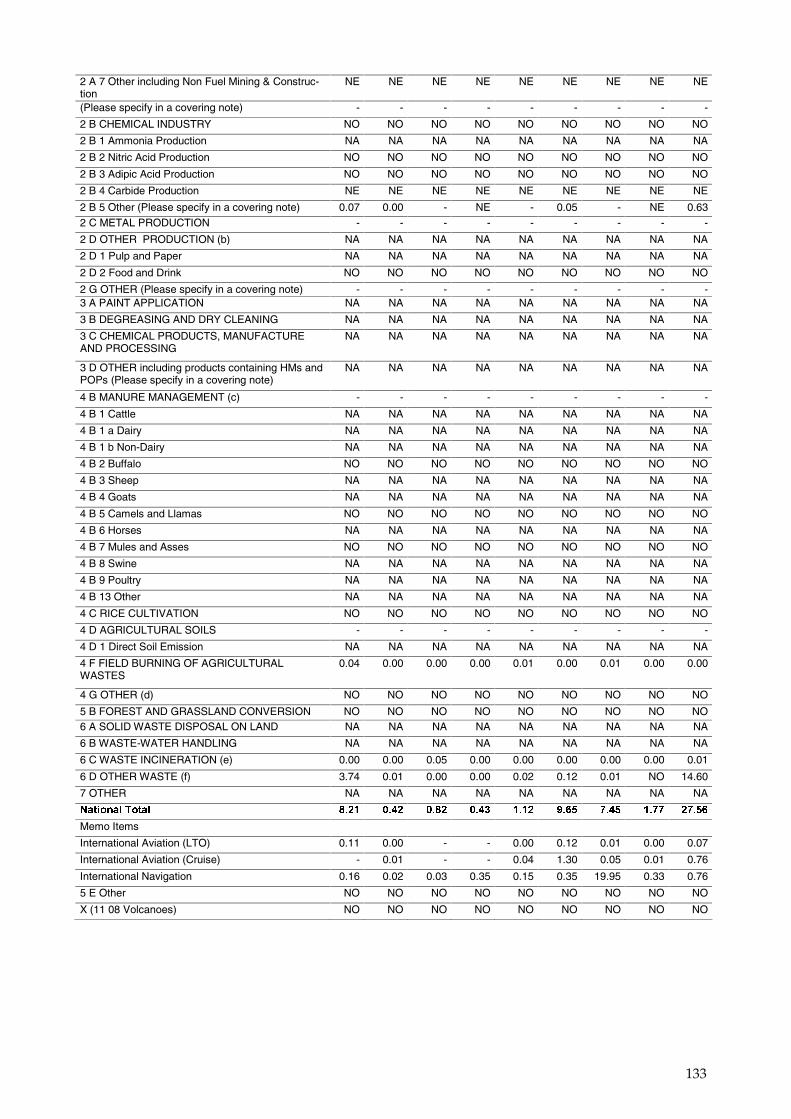
133
2 A 7 Other including Non Fuel Mining & Construc-tion
NE NE NE NE NE NE NE NE NE
(Please specify in a covering note) - - - - - - - - -
2 B CHEMICAL INDUSTRY NO NO NO NO NO NO NO NO NO
2 B 1 Ammonia Production NA NA NA NA NA NA NA NA NA
2 B 2 Nitric Acid Production NO NO NO NO NO NO NO NO NO
2 B 3 Adipic Acid Production NO NO NO NO NO NO NO NO NO
2 B 4 Carbide Production NE NE NE NE NE NE NE NE NE
2 B 5 Other (Please specify in a covering note) 0.07 0.00 - NE - 0.05 - NE 0.63
2 C METAL PRODUCTION - - - - - - - - -
2 D OTHER PRODUCTION (b) NA NA NA NA NA NA NA NA NA
2 D 1 Pulp and Paper NA NA NA NA NA NA NA NA NA
2 D 2 Food and Drink NO NO NO NO NO NO NO NO NO
2 G OTHER (Please specify in a covering note) - - - - - - - - - 3 A PAINT APPLICATION NA NA NA NA NA NA NA NA NA
3 B DEGREASING AND DRY CLEANING NA NA NA NA NA NA NA NA NA
3 C CHEMICAL PRODUCTS, MANUFACTURE AND PROCESSING
NA NA NA NA NA NA NA NA NA
3 D OTHER including products containing HMs and POPs (Please specify in a covering note)
NA NA NA NA NA NA NA NA NA
4 B MANURE MANAGEMENT (c) - - - - - - - - -
4 B 1 Cattle NA NA NA NA NA NA NA NA NA
4 B 1 a Dairy NA NA NA NA NA NA NA NA NA
4 B 1 b Non-Dairy NA NA NA NA NA NA NA NA NA
4 B 2 Buffalo NO NO NO NO NO NO NO NO NO
4 B 3 Sheep NA NA NA NA NA NA NA NA NA
4 B 4 Goats NA NA NA NA NA NA NA NA NA
4 B 5 Camels and Llamas NO NO NO NO NO NO NO NO NO
4 B 6 Horses NA NA NA NA NA NA NA NA NA
4 B 7 Mules and Asses NO NO NO NO NO NO NO NO NO
4 B 8 Swine NA NA NA NA NA NA NA NA NA
4 B 9 Poultry NA NA NA NA NA NA NA NA NA
4 B 13 Other NA NA NA NA NA NA NA NA NA
4 C RICE CULTIVATION NO NO NO NO NO NO NO NO NO
4 D AGRICULTURAL SOILS - - - - - - - - -
4 D 1 Direct Soil Emission NA NA NA NA NA NA NA NA NA
4 F FIELD BURNING OF AGRICULTURAL WASTES
0.04 0.00 0.00 0.00 0.01 0.00 0.01 0.00 0.00
4 G OTHER (d) NO NO NO NO NO NO NO NO NO
5 B FOREST AND GRASSLAND CONVERSION NO NO NO NO NO NO NO NO NO 6 A SOLID WASTE DISPOSAL ON LAND NA NA NA NA NA NA NA NA NA
6 B WASTE-WATER HANDLING NA NA NA NA NA NA NA NA NA
6 C WASTE INCINERATION (e) 0.00 0.00 0.05 0.00 0.00 0.00 0.00 0.00 0.01
6 D OTHER WASTE (f) 3.74 0.01 0.00 0.00 0.02 0.12 0.01 NO 14.60
7 OTHER NA NA NA NA NA NA NA NA NA
��������������� ����� ������ ������ ������ ���� � ��� ����� ����� ������
Memo Items
International Aviation (LTO) 0.11 0.00 - - 0.00 0.12 0.01 0.00 0.07
International Aviation (Cruise) - 0.01 - - 0.04 1.30 0.05 0.01 0.76
International Navigation 0.16 0.02 0.03 0.35 0.15 0.35 19.95 0.33 0.76
5 E Other NO NO NO NO NO NO NO NO NO
X (11 08 Volcanoes) NO NO NO NO NO NO NO NO NO
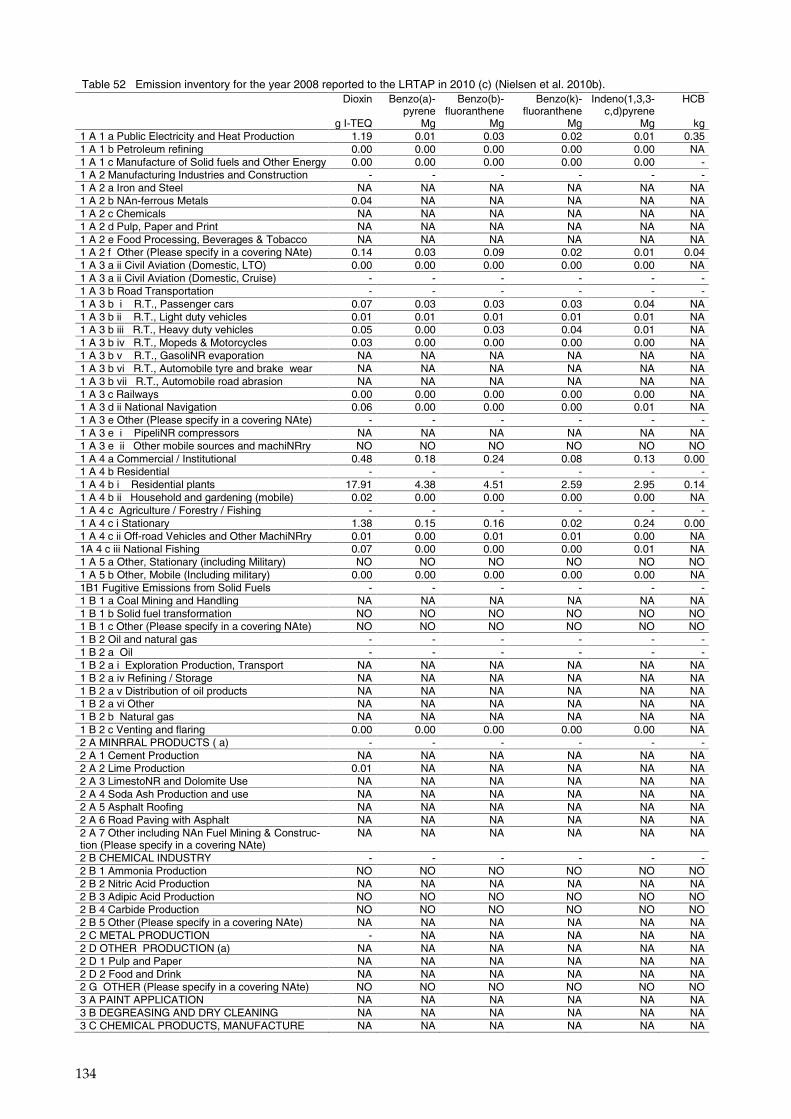
134
Table 52 Emission inventory for the year 2008 reported to the LRTAP in 2010 (c) (Nielsen et al. 2010b). Dioxin Benzo(a)-
pyrene Benzo(b)-
fluoranthene Benzo(k)-
fluoranthene Indeno(1,3,3-
c,d)pyrene HCB
g I-TEQ Mg Mg Mg Mg kg 1 A 1 a Public Electricity and Heat Production 1.19 0.01 0.03 0.02 0.01 0.35 1 A 1 b Petroleum refining 0.00 0.00 0.00 0.00 0.00 NA 1 A 1 c Manufacture of Solid fuels and Other Energy 0.00 0.00 0.00 0.00 0.00 - 1 A 2 Manufacturing Industries and Construction - - - - - - 1 A 2 a Iron and Steel NA NA NA NA NA NA 1 A 2 b NAn-ferrous Metals 0.04 NA NA NA NA NA 1 A 2 c Chemicals NA NA NA NA NA NA 1 A 2 d Pulp, Paper and Print NA NA NA NA NA NA 1 A 2 e Food Processing, Beverages & Tobacco NA NA NA NA NA NA 1 A 2 f Other (Please specify in a covering NAte) 0.14 0.03 0.09 0.02 0.01 0.04 1 A 3 a ii Civil Aviation (Domestic, LTO) 0.00 0.00 0.00 0.00 0.00 NA 1 A 3 a ii Civil Aviation (Domestic, Cruise) - - - - - - 1 A 3 b Road Transportation - - - - - - 1 A 3 b i R.T., Passenger cars 0.07 0.03 0.03 0.03 0.04 NA 1 A 3 b ii R.T., Light duty vehicles 0.01 0.01 0.01 0.01 0.01 NA 1 A 3 b iii R.T., Heavy duty vehicles 0.05 0.00 0.03 0.04 0.01 NA 1 A 3 b iv R.T., Mopeds & Motorcycles 0.03 0.00 0.00 0.00 0.00 NA 1 A 3 b v R.T., GasoliNR evaporation NA NA NA NA NA NA 1 A 3 b vi R.T., Automobile tyre and brake wear NA NA NA NA NA NA 1 A 3 b vii R.T., Automobile road abrasion NA NA NA NA NA NA 1 A 3 c Railways 0.00 0.00 0.00 0.00 0.00 NA 1 A 3 d ii National Navigation 0.06 0.00 0.00 0.00 0.01 NA 1 A 3 e Other (Please specify in a covering NAte) - - - - - - 1 A 3 e i PipeliNR compressors NA NA NA NA NA NA 1 A 3 e ii Other mobile sources and machiNRry NO NO NO NO NO NO 1 A 4 a Commercial / Institutional 0.48 0.18 0.24 0.08 0.13 0.00 1 A 4 b Residential - - - - - - 1 A 4 b i Residential plants 17.91 4.38 4.51 2.59 2.95 0.14 1 A 4 b ii Household and gardening (mobile) 0.02 0.00 0.00 0.00 0.00 NA 1 A 4 c Agriculture / Forestry / Fishing - - - - - - 1 A 4 c i Stationary 1.38 0.15 0.16 0.02 0.24 0.00 1 A 4 c ii Off-road Vehicles and Other MachiNRry 0.01 0.00 0.01 0.01 0.00 NA 1A 4 c iii National Fishing 0.07 0.00 0.00 0.00 0.01 NA 1 A 5 a Other, Stationary (including Military) NO NO NO NO NO NO 1 A 5 b Other, Mobile (Including military) 0.00 0.00 0.00 0.00 0.00 NA 1B1 Fugitive Emissions from Solid Fuels - - - - - - 1 B 1 a Coal Mining and Handling NA NA NA NA NA NA 1 B 1 b Solid fuel transformation NO NO NO NO NO NO 1 B 1 c Other (Please specify in a covering NAte) NO NO NO NO NO NO 1 B 2 Oil and natural gas - - - - - - 1 B 2 a Oil - - - - - - 1 B 2 a i Exploration Production, Transport NA NA NA NA NA NA 1 B 2 a iv Refining / Storage NA NA NA NA NA NA 1 B 2 a v Distribution of oil products NA NA NA NA NA NA 1 B 2 a vi Other NA NA NA NA NA NA 1 B 2 b Natural gas NA NA NA NA NA NA 1 B 2 c Venting and flaring 0.00 0.00 0.00 0.00 0.00 NA 2 A MINRRAL PRODUCTS ( a) - - - - - - 2 A 1 Cement Production NA NA NA NA NA NA 2 A 2 Lime Production 0.01 NA NA NA NA NA 2 A 3 LimestoNR and Dolomite Use NA NA NA NA NA NA 2 A 4 Soda Ash Production and use NA NA NA NA NA NA 2 A 5 Asphalt Roofing NA NA NA NA NA NA 2 A 6 Road Paving with Asphalt NA NA NA NA NA NA 2 A 7 Other including NAn Fuel Mining & Construc-tion (Please specify in a covering NAte)
NA NA NA NA NA NA
2 B CHEMICAL INDUSTRY - - - - - - 2 B 1 Ammonia Production NO NO NO NO NO NO 2 B 2 Nitric Acid Production NA NA NA NA NA NA 2 B 3 Adipic Acid Production NO NO NO NO NO NO 2 B 4 Carbide Production NO NO NO NO NO NO 2 B 5 Other (Please specify in a covering NAte) NA NA NA NA NA NA 2 C METAL PRODUCTION - NA NA NA NA NA 2 D OTHER PRODUCTION (a) NA NA NA NA NA NA 2 D 1 Pulp and Paper NA NA NA NA NA NA 2 D 2 Food and Drink NA NA NA NA NA NA 2 G OTHER (Please specify in a covering NAte) NO NO NO NO NO NO 3 A PAINT APPLICATION NA NA NA NA NA NA 3 B DEGREASING AND DRY CLEANING NA NA NA NA NA NA 3 C CHEMICAL PRODUCTS, MANUFACTURE NA NA NA NA NA NA
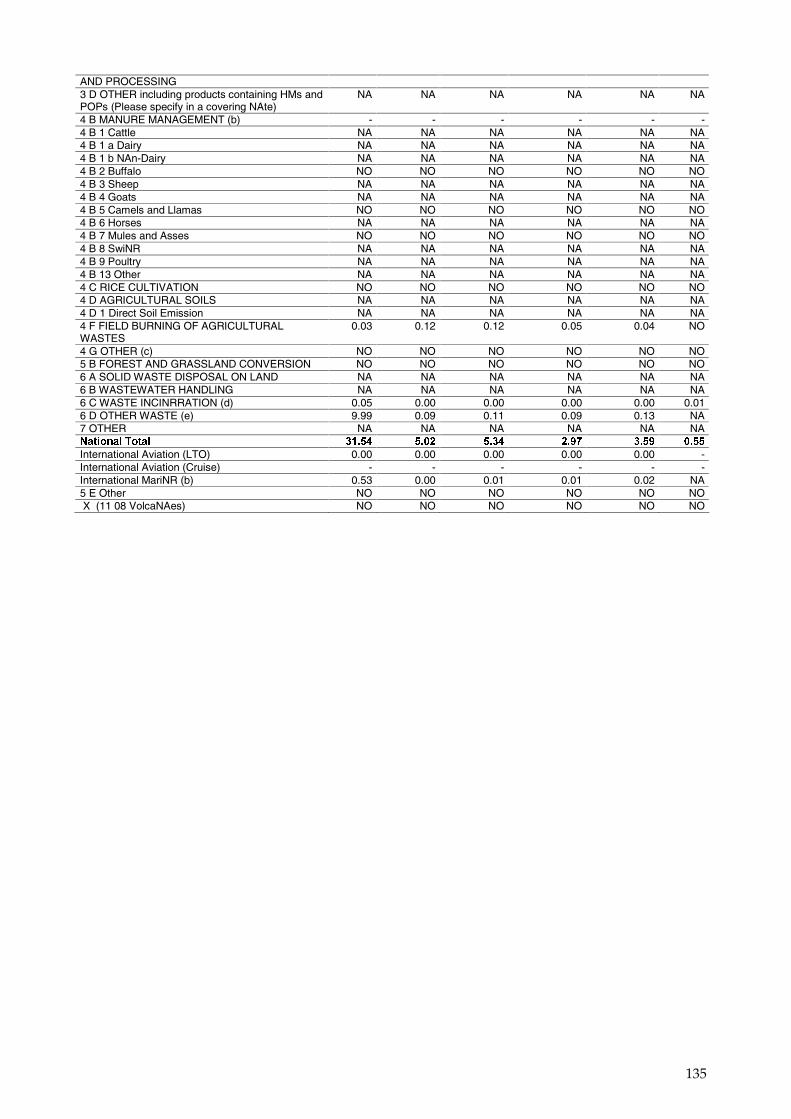
135
AND PROCESSING 3 D OTHER including products containing HMs and POPs (Please specify in a covering NAte)
NA NA NA NA NA NA
4 B MANURE MANAGEMENT (b) - - - - - - 4 B 1 Cattle NA NA NA NA NA NA 4 B 1 a Dairy NA NA NA NA NA NA 4 B 1 b NAn-Dairy NA NA NA NA NA NA 4 B 2 Buffalo NO NO NO NO NO NO 4 B 3 Sheep NA NA NA NA NA NA 4 B 4 Goats NA NA NA NA NA NA 4 B 5 Camels and Llamas NO NO NO NO NO NO 4 B 6 Horses NA NA NA NA NA NA 4 B 7 Mules and Asses NO NO NO NO NO NO 4 B 8 SwiNR NA NA NA NA NA NA 4 B 9 Poultry NA NA NA NA NA NA 4 B 13 Other NA NA NA NA NA NA 4 C RICE CULTIVATION NO NO NO NO NO NO 4 D AGRICULTURAL SOILS NA NA NA NA NA NA 4 D 1 Direct Soil Emission NA NA NA NA NA NA 4 F FIELD BURNING OF AGRICULTURAL WASTES
0.03 0.12 0.12 0.05 0.04 NO
4 G OTHER (c) NO NO NO NO NO NO 5 B FOREST AND GRASSLAND CONVERSION NO NO NO NO NO NO 6 A SOLID WASTE DISPOSAL ON LAND NA NA NA NA NA NA 6 B WASTEWATER HANDLING NA NA NA NA NA NA 6 C WASTE INCINRRATION (d) 0.05 0.00 0.00 0.00 0.00 0.01 6 D OTHER WASTE (e) 9.99 0.09 0.11 0.09 0.13 NA 7 OTHER NA NA NA NA NA NA ��������������� ����� ����� ����� ��� �� ��� � ����
International Aviation (LTO) 0.00 0.00 0.00 0.00 0.00 - International Aviation (Cruise) - - - - - - International MariNR (b) 0.53 0.00 0.01 0.01 0.02 NA 5 E Other NO NO NO NO NO NO X (11 08 VolcaNAes) NO NO NO NO NO NO
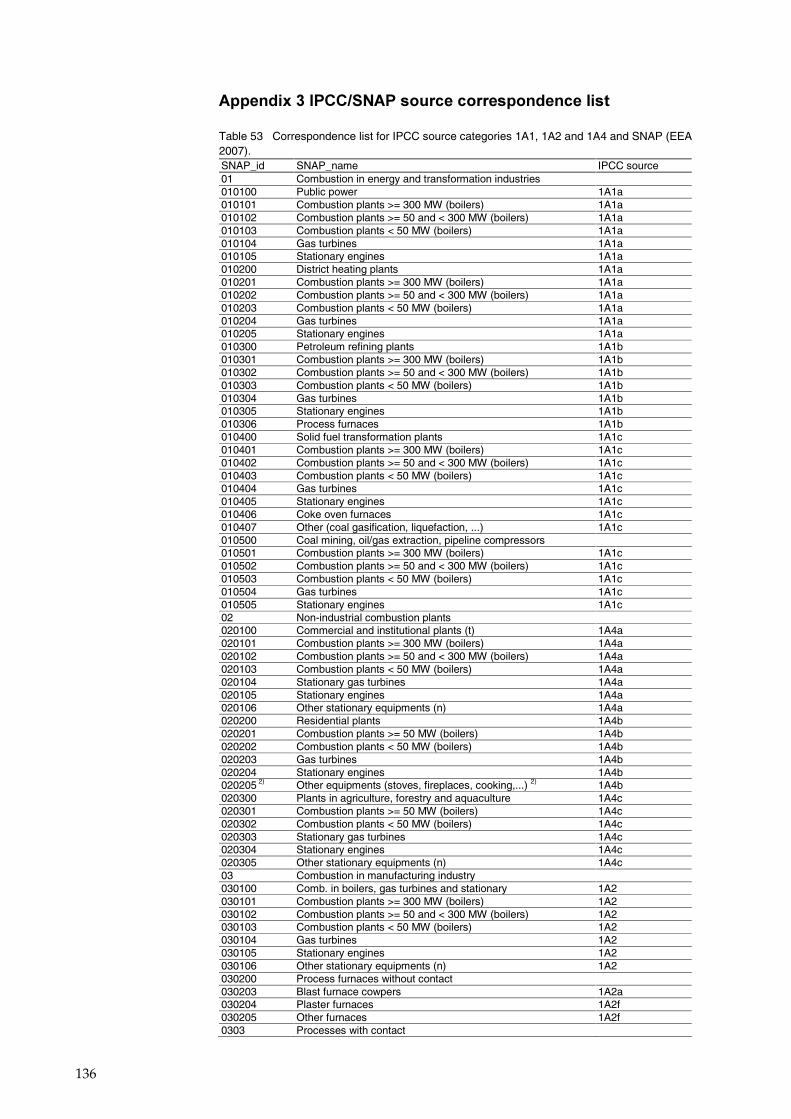
136
��������� �!���"#$�����%�&��&�����������&�������
Table 53 Correspondence list for IPCC source categories 1A1, 1A2 and 1A4 and SNAP (EEA 2007). SNAP_id SNAP_name IPCC source 01 Combustion in energy and transformation industries 010100 Public power 1A1a 010101 Combustion plants >= 300 MW (boilers) 1A1a 010102 Combustion plants >= 50 and < 300 MW (boilers) 1A1a 010103 Combustion plants < 50 MW (boilers) 1A1a 010104 Gas turbines 1A1a 010105 Stationary engines 1A1a 010200 District heating plants 1A1a 010201 Combustion plants >= 300 MW (boilers) 1A1a 010202 Combustion plants >= 50 and < 300 MW (boilers) 1A1a 010203 Combustion plants < 50 MW (boilers) 1A1a 010204 Gas turbines 1A1a 010205 Stationary engines 1A1a 010300 Petroleum refining plants 1A1b 010301 Combustion plants >= 300 MW (boilers) 1A1b 010302 Combustion plants >= 50 and < 300 MW (boilers) 1A1b 010303 Combustion plants < 50 MW (boilers) 1A1b 010304 Gas turbines 1A1b 010305 Stationary engines 1A1b 010306 Process furnaces 1A1b 010400 Solid fuel transformation plants 1A1c 010401 Combustion plants >= 300 MW (boilers) 1A1c 010402 Combustion plants >= 50 and < 300 MW (boilers) 1A1c 010403 Combustion plants < 50 MW (boilers) 1A1c 010404 Gas turbines 1A1c 010405 Stationary engines 1A1c 010406 Coke oven furnaces 1A1c 010407 Other (coal gasification, liquefaction, ...) 1A1c 010500 Coal mining, oil/gas extraction, pipeline compressors 010501 Combustion plants >= 300 MW (boilers) 1A1c 010502 Combustion plants >= 50 and < 300 MW (boilers) 1A1c 010503 Combustion plants < 50 MW (boilers) 1A1c 010504 Gas turbines 1A1c 010505 Stationary engines 1A1c 02 Non-industrial combustion plants 020100 Commercial and institutional plants (t) 1A4a 020101 Combustion plants >= 300 MW (boilers) 1A4a 020102 Combustion plants >= 50 and < 300 MW (boilers) 1A4a 020103 Combustion plants < 50 MW (boilers) 1A4a 020104 Stationary gas turbines 1A4a 020105 Stationary engines 1A4a 020106 Other stationary equipments (n) 1A4a 020200 Residential plants 1A4b 020201 Combustion plants >= 50 MW (boilers) 1A4b 020202 Combustion plants < 50 MW (boilers) 1A4b 020203 Gas turbines 1A4b 020204 Stationary engines 1A4b 020205 2) Other equipments (stoves, fireplaces, cooking,...) 2) 1A4b 020300 Plants in agriculture, forestry and aquaculture 1A4c 020301 Combustion plants >= 50 MW (boilers) 1A4c 020302 Combustion plants < 50 MW (boilers) 1A4c 020303 Stationary gas turbines 1A4c 020304 Stationary engines 1A4c 020305 Other stationary equipments (n) 1A4c 03 Combustion in manufacturing industry 030100 Comb. in boilers, gas turbines and stationary 1A2 030101 Combustion plants >= 300 MW (boilers) 1A2 030102 Combustion plants >= 50 and < 300 MW (boilers) 1A2 030103 Combustion plants < 50 MW (boilers) 1A2 030104 Gas turbines 1A2 030105 Stationary engines 1A2 030106 Other stationary equipments (n) 1A2 030200 Process furnaces without contact 030203 Blast furnace cowpers 1A2a 030204 Plaster furnaces 1A2f 030205 Other furnaces 1A2f 0303 Processes with contact
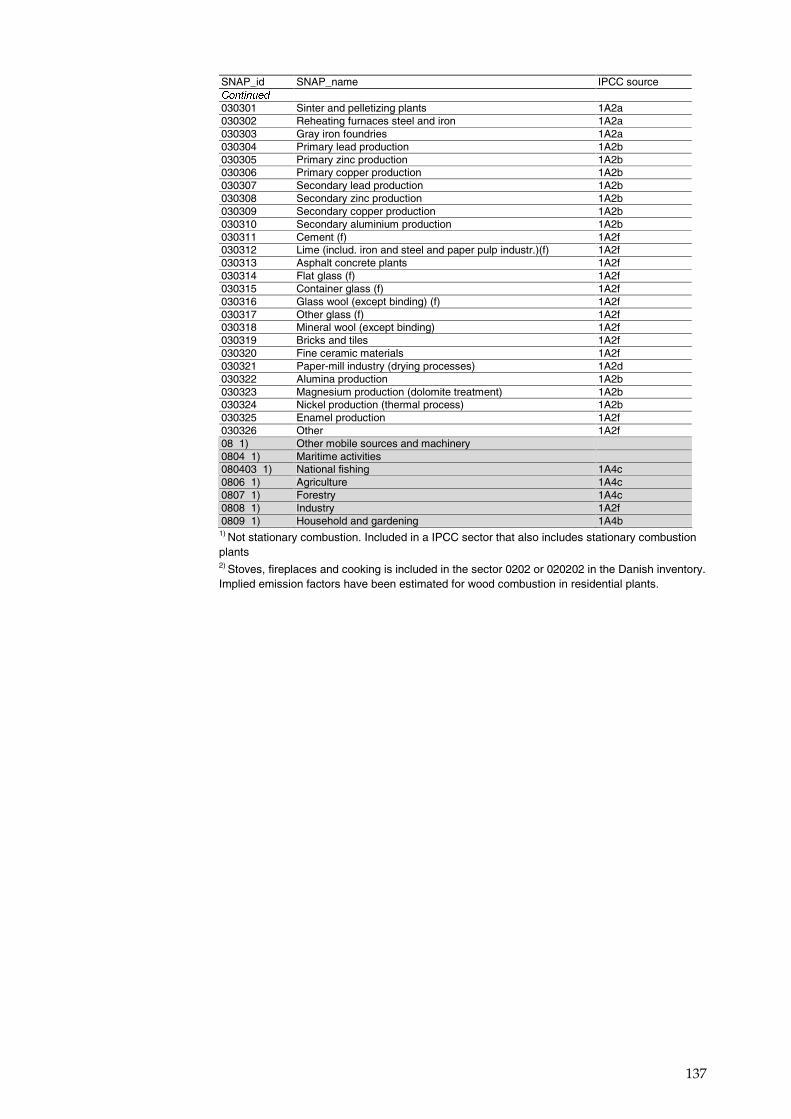
137
SNAP_id SNAP_name IPCC source ���������� 030301 Sinter and pelletizing plants 1A2a 030302 Reheating furnaces steel and iron 1A2a 030303 Gray iron foundries 1A2a 030304 Primary lead production 1A2b 030305 Primary zinc production 1A2b 030306 Primary copper production 1A2b 030307 Secondary lead production 1A2b 030308 Secondary zinc production 1A2b 030309 Secondary copper production 1A2b 030310 Secondary aluminium production 1A2b 030311 Cement (f) 1A2f 030312 Lime (includ. iron and steel and paper pulp industr.)(f) 1A2f 030313 Asphalt concrete plants 1A2f 030314 Flat glass (f) 1A2f 030315 Container glass (f) 1A2f 030316 Glass wool (except binding) (f) 1A2f 030317 Other glass (f) 1A2f 030318 Mineral wool (except binding) 1A2f 030319 Bricks and tiles 1A2f 030320 Fine ceramic materials 1A2f 030321 Paper-mill industry (drying processes) 1A2d 030322 Alumina production 1A2b 030323 Magnesium production (dolomite treatment) 1A2b 030324 Nickel production (thermal process) 1A2b 030325 Enamel production 1A2f 030326 Other 1A2f 08 1) Other mobile sources and machinery 0804 1) Maritime activities 080403 1) National fishing 1A4c 0806 1) Agriculture 1A4c 0807 1) Forestry 1A4c 0808 1) Industry 1A2f 0809 1) Household and gardening 1A4b
1) Not stationary combustion. Included in a IPCC sector that also includes stationary combustion plants 2) Stoves, fireplaces and cooking is included in the sector 0202 or 020202 in the Danish inventory. Implied emission factors have been estimated for wood combustion in residential plants.
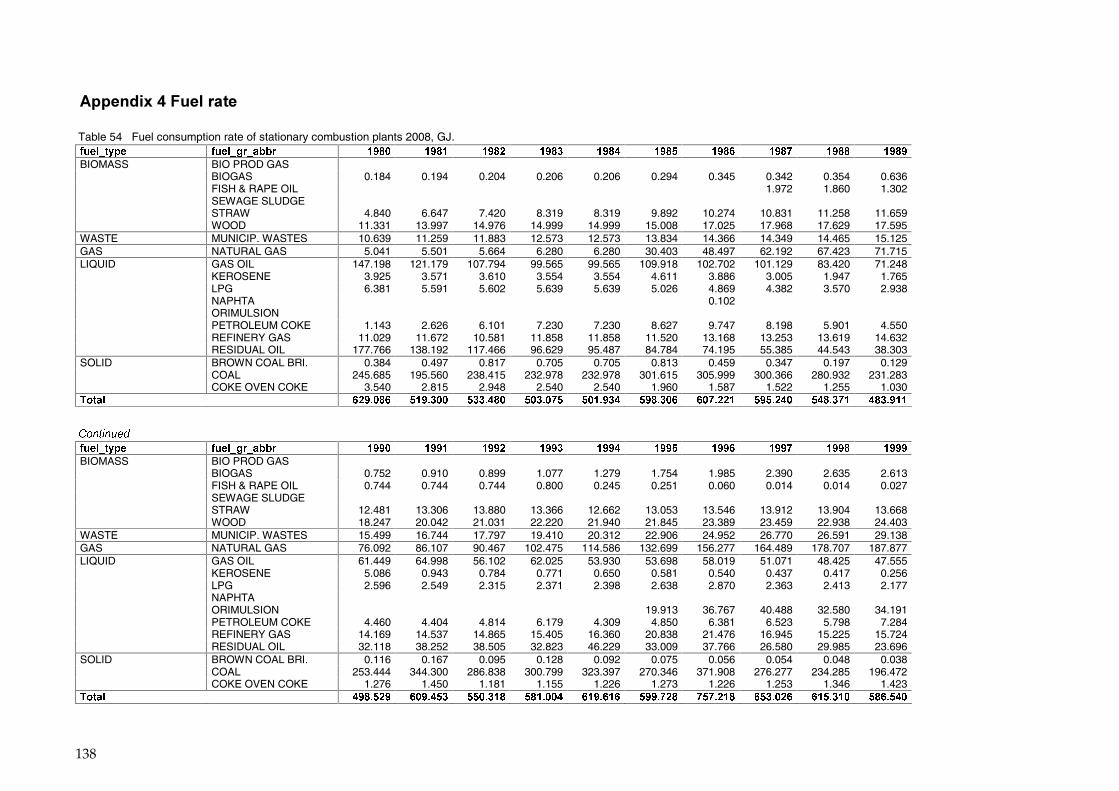
138
�������������� ����
Table 54 Fuel consumption rate of stationary combustion plants 2008, GJ. ���������� ���������� ���� �� � ���� ���� ���� ���� ���� ���� ���� ����
BIOMASS BIO PROD GAS BIOGAS 0.184 0.194 0.204 0.206 0.206 0.294 0.345 0.342 0.354 0.636 FISH & RAPE OIL 1.972 1.860 1.302 SEWAGE SLUDGE STRAW 4.840 6.647 7.420 8.319 8.319 9.892 10.274 10.831 11.258 11.659 WOOD 11.331 13.997 14.976 14.999 14.999 15.008 17.025 17.968 17.629 17.595 WASTE MUNICIP. WASTES 10.639 11.259 11.883 12.573 12.573 13.834 14.366 14.349 14.465 15.125 GAS NATURAL GAS 5.041 5.501 5.664 6.280 6.280 30.403 48.497 62.192 67.423 71.715 LIQUID GAS OIL 147.198 121.179 107.794 99.565 99.565 109.918 102.702 101.129 83.420 71.248 KEROSENE 3.925 3.571 3.610 3.554 3.554 4.611 3.886 3.005 1.947 1.765 LPG 6.381 5.591 5.602 5.639 5.639 5.026 4.869 4.382 3.570 2.938 NAPHTA 0.102 ORIMULSION PETROLEUM COKE 1.143 2.626 6.101 7.230 7.230 8.627 9.747 8.198 5.901 4.550 REFINERY GAS 11.029 11.672 10.581 11.858 11.858 11.520 13.168 13.253 13.619 14.632 RESIDUAL OIL 177.766 138.192 117.466 96.629 95.487 84.784 74.195 55.385 44.543 38.303 SOLID BROWN COAL BRI. 0.384 0.497 0.817 0.705 0.705 0.813 0.459 0.347 0.197 0.129 COAL 245.685 195.560 238.415 232.978 232.978 301.615 305.999 300.366 280.932 231.283 COKE OVEN COKE 3.540 2.815 2.948 2.540 2.540 1.960 1.587 1.522 1.255 1.030 ������ � �������� � ������ �������� �������� �� ����� �������� ������ � �������� ������ � ����� �
����������
���������� ���������� ���� �� � ���� ���� ���� ���� ���� ���� ���� ����
BIOMASS BIO PROD GAS BIOGAS 0.752 0.910 0.899 1.077 1.279 1.754 1.985 2.390 2.635 2.613 FISH & RAPE OIL 0.744 0.744 0.744 0.800 0.245 0.251 0.060 0.014 0.014 0.027 SEWAGE SLUDGE STRAW 12.481 13.306 13.880 13.366 12.662 13.053 13.546 13.912 13.904 13.668 WOOD 18.247 20.042 21.031 22.220 21.940 21.845 23.389 23.459 22.938 24.403 WASTE MUNICIP. WASTES 15.499 16.744 17.797 19.410 20.312 22.906 24.952 26.770 26.591 29.138 GAS NATURAL GAS 76.092 86.107 90.467 102.475 114.586 132.699 156.277 164.489 178.707 187.877 LIQUID GAS OIL 61.449 64.998 56.102 62.025 53.930 53.698 58.019 51.071 48.425 47.555 KEROSENE 5.086 0.943 0.784 0.771 0.650 0.581 0.540 0.437 0.417 0.256 LPG 2.596 2.549 2.315 2.371 2.398 2.638 2.870 2.363 2.413 2.177 NAPHTA ORIMULSION 19.913 36.767 40.488 32.580 34.191 PETROLEUM COKE 4.460 4.404 4.814 6.179 4.309 4.850 6.381 6.523 5.798 7.284 REFINERY GAS 14.169 14.537 14.865 15.405 16.360 20.838 21.476 16.945 15.225 15.724 RESIDUAL OIL 32.118 38.252 38.505 32.823 46.229 33.009 37.766 26.580 29.985 23.696 SOLID BROWN COAL BRI. 0.116 0.167 0.095 0.128 0.092 0.075 0.056 0.054 0.048 0.038 COAL 253.444 344.300 286.838 300.799 323.397 270.346 371.908 276.277 234.285 196.472 COKE OVEN COKE 1.276 1.450 1.181 1.155 1.226 1.273 1.226 1.253 1.346 1.423 ������ � �������� �������� ����� �� �� ����� � ��� �� �������� ����� �� �������� � ��� �� ��������
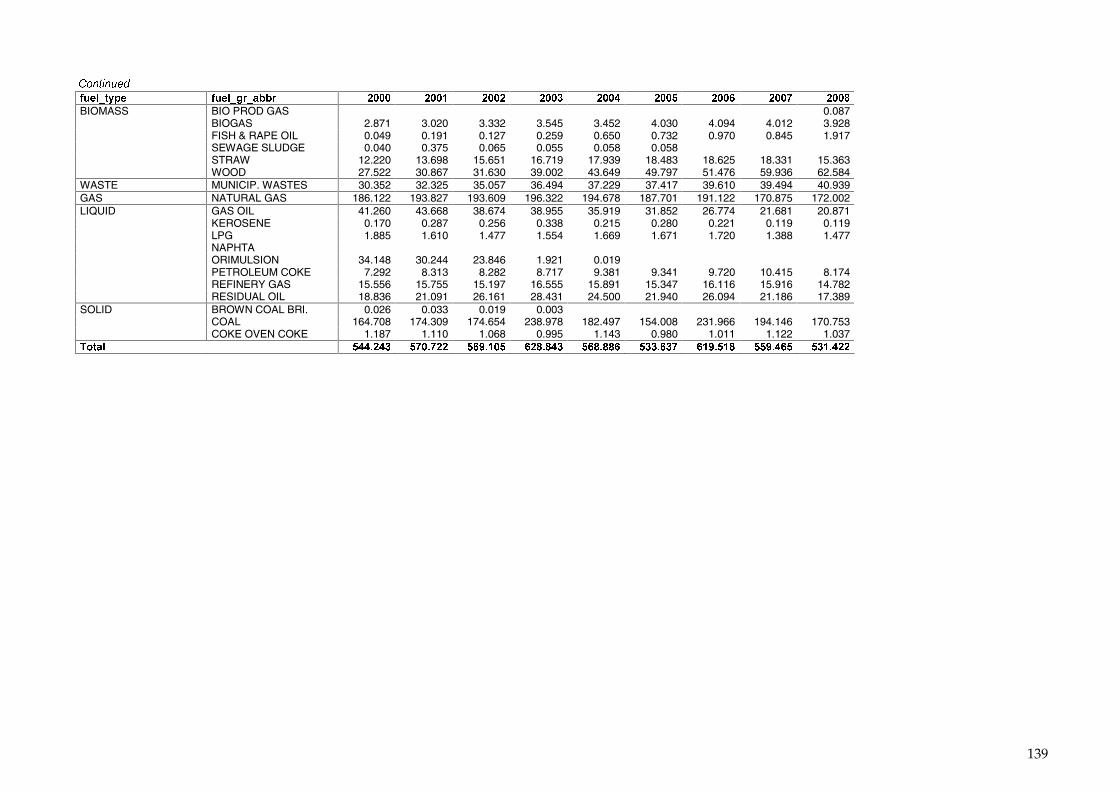
139
����������
���������� ���������� ����� ��� � ����� ����� ����� ����� ����� ����� �����
BIOMASS BIO PROD GAS 0.087 BIOGAS 2.871 3.020 3.332 3.545 3.452 4.030 4.094 4.012 3.928 FISH & RAPE OIL 0.049 0.191 0.127 0.259 0.650 0.732 0.970 0.845 1.917 SEWAGE SLUDGE 0.040 0.375 0.065 0.055 0.058 0.058 STRAW 12.220 13.698 15.651 16.719 17.939 18.483 18.625 18.331 15.363 WOOD 27.522 30.867 31.630 39.002 43.649 49.797 51.476 59.936 62.584 WASTE MUNICIP. WASTES 30.352 32.325 35.057 36.494 37.229 37.417 39.610 39.494 40.939 GAS NATURAL GAS 186.122 193.827 193.609 196.322 194.678 187.701 191.122 170.875 172.002 LIQUID GAS OIL 41.260 43.668 38.674 38.955 35.919 31.852 26.774 21.681 20.871 KEROSENE 0.170 0.287 0.256 0.338 0.215 0.280 0.221 0.119 0.119 LPG 1.885 1.610 1.477 1.554 1.669 1.671 1.720 1.388 1.477 NAPHTA ORIMULSION 34.148 30.244 23.846 1.921 0.019 PETROLEUM COKE 7.292 8.313 8.282 8.717 9.381 9.341 9.720 10.415 8.174 REFINERY GAS 15.556 15.755 15.197 16.555 15.891 15.347 16.116 15.916 14.782 RESIDUAL OIL 18.836 21.091 26.161 28.431 24.500 21.940 26.094 21.186 17.389 SOLID BROWN COAL BRI. 0.026 0.033 0.019 0.003 COAL 164.708 174.309 174.654 238.978 182.497 154.008 231.966 194.146 170.753 COKE OVEN COKE 1.187 1.110 1.068 0.995 1.143 0.980 1.011 1.122 1.037 ������ � �������� �������� ���� ��� �������� �������� �������� � ��� �� �������� �� �����
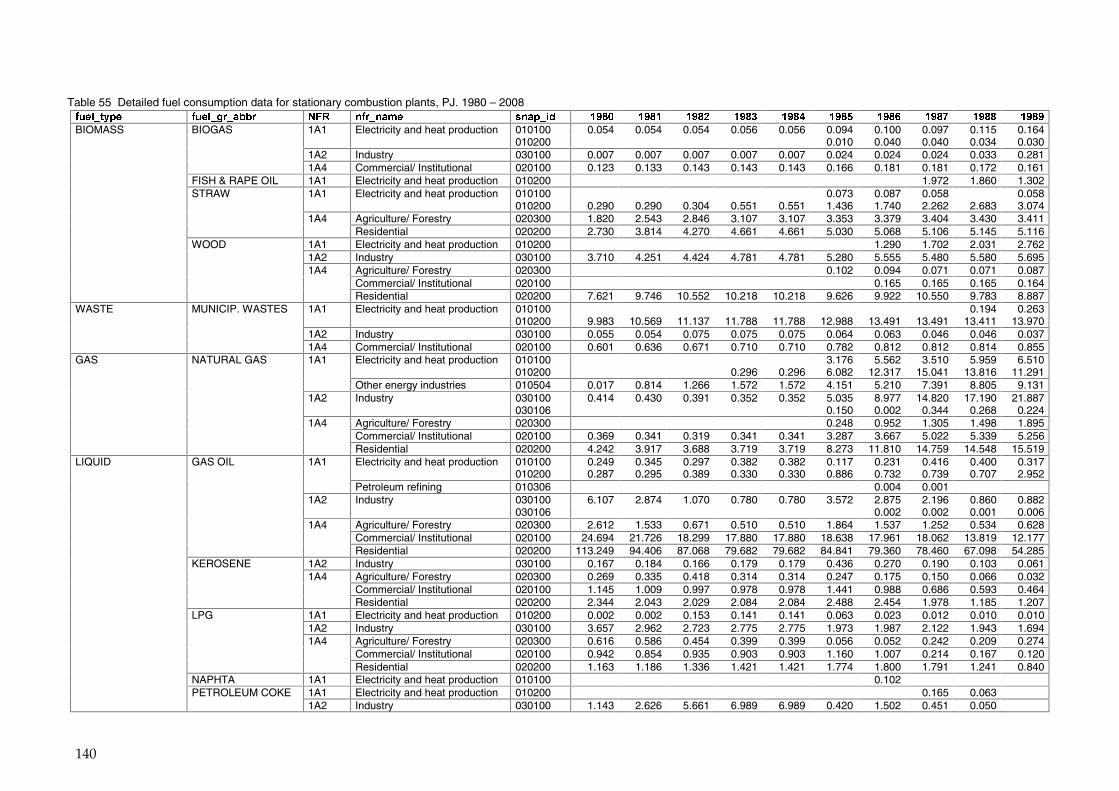
140
Table 55 Detailed fuel consumption data for stationary combustion plants, PJ. 1980 – 2008 ���������� ���������� ���� �������� ����� !� ���� �� � ���� ���� ���� ���� ���� ���� ���� ����
BIOMASS BIOGAS 1A1 Electricity and heat production 010100 0.054 0.054 0.054 0.056 0.056 0.094 0.100 0.097 0.115 0.164 010200 0.010 0.040 0.040 0.034 0.030 1A2 Industry 030100 0.007 0.007 0.007 0.007 0.007 0.024 0.024 0.024 0.033 0.281 1A4 Commercial/ Institutional 020100 0.123 0.133 0.143 0.143 0.143 0.166 0.181 0.181 0.172 0.161 FISH & RAPE OIL 1A1 Electricity and heat production 010200 1.972 1.860 1.302 STRAW 1A1 Electricity and heat production 010100 0.073 0.087 0.058 0.058 010200 0.290 0.290 0.304 0.551 0.551 1.436 1.740 2.262 2.683 3.074 1A4 Agriculture/ Forestry 020300 1.820 2.543 2.846 3.107 3.107 3.353 3.379 3.404 3.430 3.411 Residential 020200 2.730 3.814 4.270 4.661 4.661 5.030 5.068 5.106 5.145 5.116 WOOD 1A1 Electricity and heat production 010200 1.290 1.702 2.031 2.762 1A2 Industry 030100 3.710 4.251 4.424 4.781 4.781 5.280 5.555 5.480 5.580 5.695 1A4 Agriculture/ Forestry 020300 0.102 0.094 0.071 0.071 0.087 Commercial/ Institutional 020100 0.165 0.165 0.165 0.164 Residential 020200 7.621 9.746 10.552 10.218 10.218 9.626 9.922 10.550 9.783 8.887 WASTE MUNICIP. WASTES 1A1 Electricity and heat production 010100 0.194 0.263 010200 9.983 10.569 11.137 11.788 11.788 12.988 13.491 13.491 13.411 13.970 1A2 Industry 030100 0.055 0.054 0.075 0.075 0.075 0.064 0.063 0.046 0.046 0.037 1A4 Commercial/ Institutional 020100 0.601 0.636 0.671 0.710 0.710 0.782 0.812 0.812 0.814 0.855 GAS NATURAL GAS 1A1 Electricity and heat production 010100 3.176 5.562 3.510 5.959 6.510 010200 0.296 0.296 6.082 12.317 15.041 13.816 11.291 Other energy industries 010504 0.017 0.814 1.266 1.572 1.572 4.151 5.210 7.391 8.805 9.131 1A2 Industry 030100 0.414 0.430 0.391 0.352 0.352 5.035 8.977 14.820 17.190 21.887 030106 0.150 0.002 0.344 0.268 0.224 1A4 Agriculture/ Forestry 020300 0.248 0.952 1.305 1.498 1.895 Commercial/ Institutional 020100 0.369 0.341 0.319 0.341 0.341 3.287 3.667 5.022 5.339 5.256 Residential 020200 4.242 3.917 3.688 3.719 3.719 8.273 11.810 14.759 14.548 15.519 LIQUID GAS OIL 1A1 Electricity and heat production 010100 0.249 0.345 0.297 0.382 0.382 0.117 0.231 0.416 0.400 0.317 010200 0.287 0.295 0.389 0.330 0.330 0.886 0.732 0.739 0.707 2.952 Petroleum refining 010306 0.004 0.001 1A2 Industry 030100 6.107 2.874 1.070 0.780 0.780 3.572 2.875 2.196 0.860 0.882 030106 0.002 0.002 0.001 0.006 1A4 Agriculture/ Forestry 020300 2.612 1.533 0.671 0.510 0.510 1.864 1.537 1.252 0.534 0.628 Commercial/ Institutional 020100 24.694 21.726 18.299 17.880 17.880 18.638 17.961 18.062 13.819 12.177 Residential 020200 113.249 94.406 87.068 79.682 79.682 84.841 79.360 78.460 67.098 54.285 KEROSENE 1A2 Industry 030100 0.167 0.184 0.166 0.179 0.179 0.436 0.270 0.190 0.103 0.061 1A4 Agriculture/ Forestry 020300 0.269 0.335 0.418 0.314 0.314 0.247 0.175 0.150 0.066 0.032 Commercial/ Institutional 020100 1.145 1.009 0.997 0.978 0.978 1.441 0.988 0.686 0.593 0.464 Residential 020200 2.344 2.043 2.029 2.084 2.084 2.488 2.454 1.978 1.185 1.207 LPG 1A1 Electricity and heat production 010200 0.002 0.002 0.153 0.141 0.141 0.063 0.023 0.012 0.010 0.010 1A2 Industry 030100 3.657 2.962 2.723 2.775 2.775 1.973 1.987 2.122 1.943 1.694 1A4 Agriculture/ Forestry 020300 0.616 0.586 0.454 0.399 0.399 0.056 0.052 0.242 0.209 0.274 Commercial/ Institutional 020100 0.942 0.854 0.935 0.903 0.903 1.160 1.007 0.214 0.167 0.120 Residential 020200 1.163 1.186 1.336 1.421 1.421 1.774 1.800 1.791 1.241 0.840 NAPHTA 1A1 Electricity and heat production 010100 0.102 PETROLEUM COKE 1A1 Electricity and heat production 010200 0.165 0.063 1A2 Industry 030100 1.143 2.626 5.661 6.989 6.989 0.420 1.502 0.451 0.050
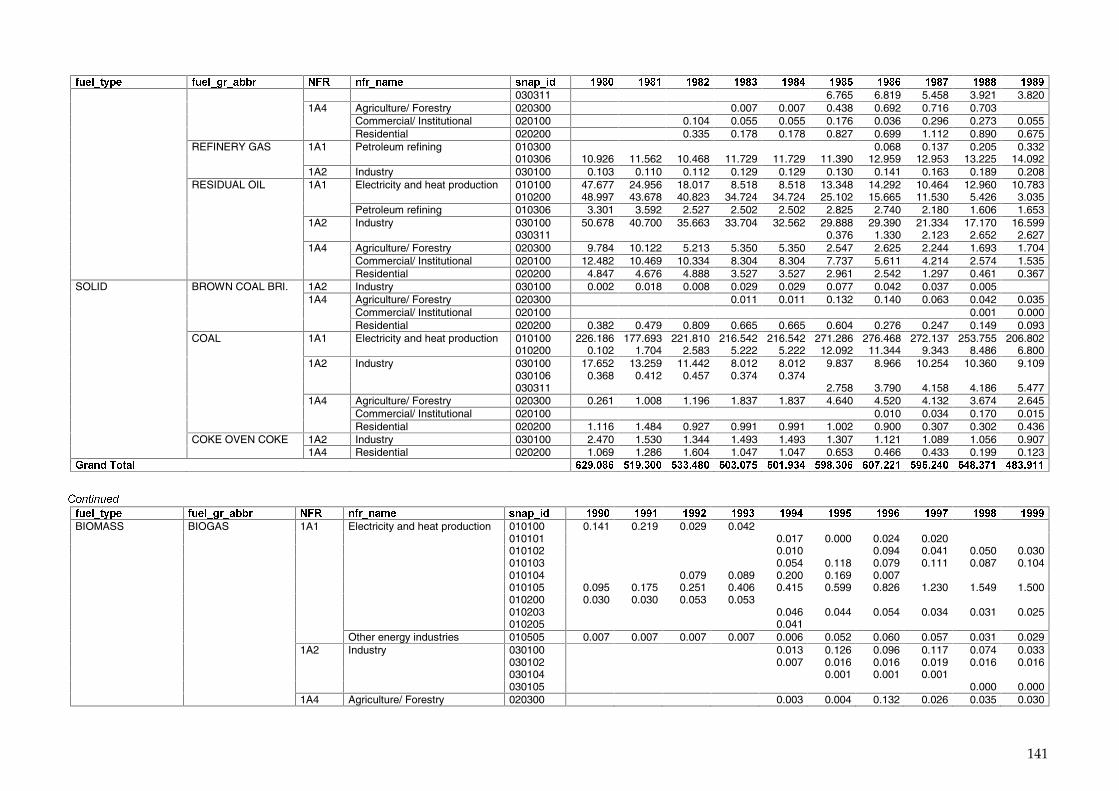
141
���������� ���������� ���� �������� ����� !� ���� �� � ���� ���� ���� ���� ���� ���� ���� ����
030311 6.765 6.819 5.458 3.921 3.820 1A4 Agriculture/ Forestry 020300 0.007 0.007 0.438 0.692 0.716 0.703 Commercial/ Institutional 020100 0.104 0.055 0.055 0.176 0.036 0.296 0.273 0.055 Residential 020200 0.335 0.178 0.178 0.827 0.699 1.112 0.890 0.675 REFINERY GAS 1A1 Petroleum refining 010300 0.068 0.137 0.205 0.332 010306 10.926 11.562 10.468 11.729 11.729 11.390 12.959 12.953 13.225 14.092 1A2 Industry 030100 0.103 0.110 0.112 0.129 0.129 0.130 0.141 0.163 0.189 0.208 RESIDUAL OIL 1A1 Electricity and heat production 010100 47.677 24.956 18.017 8.518 8.518 13.348 14.292 10.464 12.960 10.783 010200 48.997 43.678 40.823 34.724 34.724 25.102 15.665 11.530 5.426 3.035 Petroleum refining 010306 3.301 3.592 2.527 2.502 2.502 2.825 2.740 2.180 1.606 1.653 1A2 Industry 030100 50.678 40.700 35.663 33.704 32.562 29.888 29.390 21.334 17.170 16.599 030311 0.376 1.330 2.123 2.652 2.627 1A4 Agriculture/ Forestry 020300 9.784 10.122 5.213 5.350 5.350 2.547 2.625 2.244 1.693 1.704 Commercial/ Institutional 020100 12.482 10.469 10.334 8.304 8.304 7.737 5.611 4.214 2.574 1.535 Residential 020200 4.847 4.676 4.888 3.527 3.527 2.961 2.542 1.297 0.461 0.367 SOLID BROWN COAL BRI. 1A2 Industry 030100 0.002 0.018 0.008 0.029 0.029 0.077 0.042 0.037 0.005 1A4 Agriculture/ Forestry 020300 0.011 0.011 0.132 0.140 0.063 0.042 0.035 Commercial/ Institutional 020100 0.001 0.000 Residential 020200 0.382 0.479 0.809 0.665 0.665 0.604 0.276 0.247 0.149 0.093 COAL 1A1 Electricity and heat production 010100 226.186 177.693 221.810 216.542 216.542 271.286 276.468 272.137 253.755 206.802 010200 0.102 1.704 2.583 5.222 5.222 12.092 11.344 9.343 8.486 6.800 1A2 Industry 030100 17.652 13.259 11.442 8.012 8.012 9.837 8.966 10.254 10.360 9.109 030106 0.368 0.412 0.457 0.374 0.374 030311 2.758 3.790 4.158 4.186 5.477 1A4 Agriculture/ Forestry 020300 0.261 1.008 1.196 1.837 1.837 4.640 4.520 4.132 3.674 2.645 Commercial/ Institutional 020100 0.010 0.034 0.170 0.015 Residential 020200 1.116 1.484 0.927 0.991 0.991 1.002 0.900 0.307 0.302 0.436 COKE OVEN COKE 1A2 Industry 030100 2.470 1.530 1.344 1.493 1.493 1.307 1.121 1.089 1.056 0.907 1A4 Residential 020200 1.069 1.286 1.604 1.047 1.047 0.653 0.466 0.433 0.199 0.123 "��!������� �� �� �� �� �������� � ������ �������� �������� �� ����� �������� ������ � �������� ������ � ����� �
����������
���������� ���������� ���� �������� ����� !� ���� �� � ���� ���� ���� ���� ���� ���� ���� ����
BIOMASS BIOGAS 1A1 Electricity and heat production 010100 0.141 0.219 0.029 0.042 010101 0.017 0.000 0.024 0.020 010102 0.010 0.094 0.041 0.050 0.030 010103 0.054 0.118 0.079 0.111 0.087 0.104 010104 0.079 0.089 0.200 0.169 0.007 010105 0.095 0.175 0.251 0.406 0.415 0.599 0.826 1.230 1.549 1.500 010200 0.030 0.030 0.053 0.053 010203 0.046 0.044 0.054 0.034 0.031 0.025 010205 0.041 Other energy industries 010505 0.007 0.007 0.007 0.007 0.006 0.052 0.060 0.057 0.031 0.029 1A2 Industry 030100 0.013 0.126 0.096 0.117 0.074 0.033 030102 0.007 0.016 0.016 0.019 0.016 0.016 030104 0.001 0.001 0.001 030105 0.000 0.000 1A4 Agriculture/ Forestry 020300 0.003 0.004 0.132 0.026 0.035 0.030
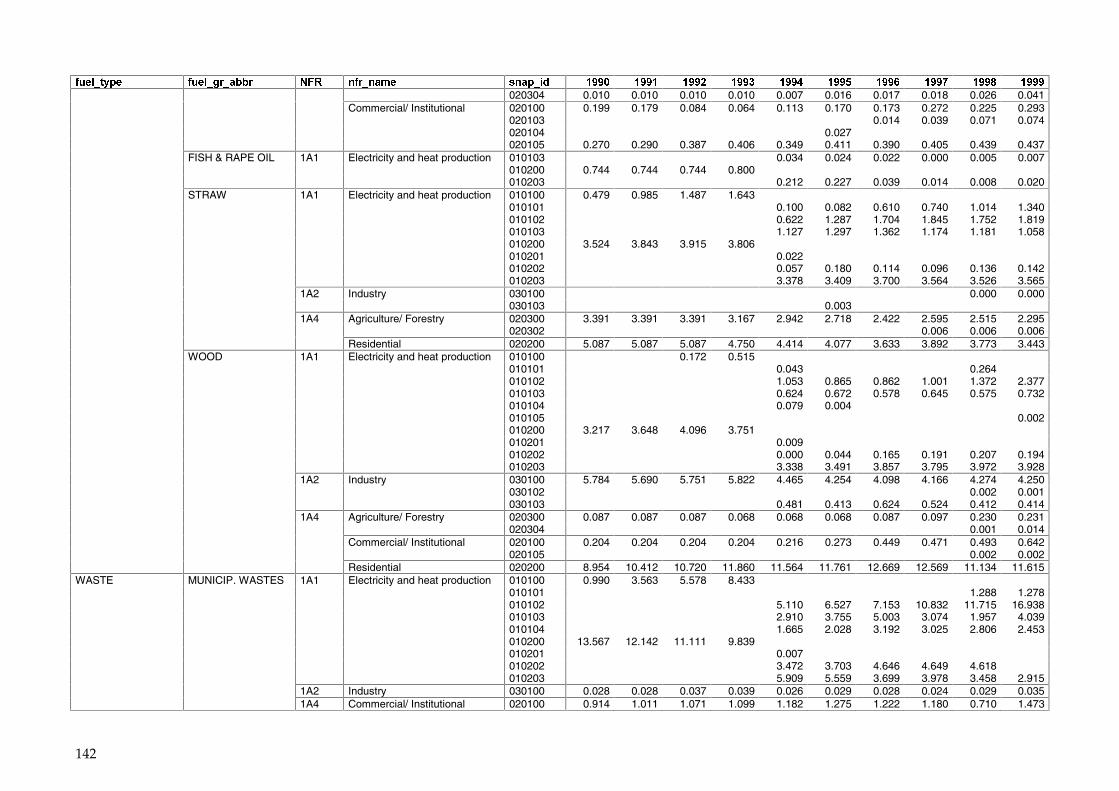
142
���������� ���������� ���� �������� ����� !� ���� �� � ���� ���� ���� ���� ���� ���� ���� ����
020304 0.010 0.010 0.010 0.010 0.007 0.016 0.017 0.018 0.026 0.041 Commercial/ Institutional 020100 0.199 0.179 0.084 0.064 0.113 0.170 0.173 0.272 0.225 0.293 020103 0.014 0.039 0.071 0.074 020104 0.027 020105 0.270 0.290 0.387 0.406 0.349 0.411 0.390 0.405 0.439 0.437 FISH & RAPE OIL 1A1 Electricity and heat production 010103 0.034 0.024 0.022 0.000 0.005 0.007 010200 0.744 0.744 0.744 0.800 010203 0.212 0.227 0.039 0.014 0.008 0.020 STRAW 1A1 Electricity and heat production 010100 0.479 0.985 1.487 1.643 010101 0.100 0.082 0.610 0.740 1.014 1.340 010102 0.622 1.287 1.704 1.845 1.752 1.819 010103 1.127 1.297 1.362 1.174 1.181 1.058 010200 3.524 3.843 3.915 3.806 010201 0.022 010202 0.057 0.180 0.114 0.096 0.136 0.142 010203 3.378 3.409 3.700 3.564 3.526 3.565 1A2 Industry 030100 0.000 0.000 030103 0.003 1A4 Agriculture/ Forestry 020300 3.391 3.391 3.391 3.167 2.942 2.718 2.422 2.595 2.515 2.295 020302 0.006 0.006 0.006 Residential 020200 5.087 5.087 5.087 4.750 4.414 4.077 3.633 3.892 3.773 3.443 WOOD 1A1 Electricity and heat production 010100 0.172 0.515 010101 0.043 0.264 010102 1.053 0.865 0.862 1.001 1.372 2.377 010103 0.624 0.672 0.578 0.645 0.575 0.732 010104 0.079 0.004 010105 0.002 010200 3.217 3.648 4.096 3.751 010201 0.009 010202 0.000 0.044 0.165 0.191 0.207 0.194 010203 3.338 3.491 3.857 3.795 3.972 3.928 1A2 Industry 030100 5.784 5.690 5.751 5.822 4.465 4.254 4.098 4.166 4.274 4.250 030102 0.002 0.001 030103 0.481 0.413 0.624 0.524 0.412 0.414 1A4 Agriculture/ Forestry 020300 0.087 0.087 0.087 0.068 0.068 0.068 0.087 0.097 0.230 0.231 020304 0.001 0.014 Commercial/ Institutional 020100 0.204 0.204 0.204 0.204 0.216 0.273 0.449 0.471 0.493 0.642 020105 0.002 0.002 Residential 020200 8.954 10.412 10.720 11.860 11.564 11.761 12.669 12.569 11.134 11.615 WASTE MUNICIP. WASTES 1A1 Electricity and heat production 010100 0.990 3.563 5.578 8.433 010101 1.288 1.278 010102 5.110 6.527 7.153 10.832 11.715 16.938 010103 2.910 3.755 5.003 3.074 1.957 4.039 010104 1.665 2.028 3.192 3.025 2.806 2.453 010200 13.567 12.142 11.111 9.839 010201 0.007 010202 3.472 3.703 4.646 4.649 4.618 010203 5.909 5.559 3.699 3.978 3.458 2.915 1A2 Industry 030100 0.028 0.028 0.037 0.039 0.026 0.029 0.028 0.024 0.029 0.035 1A4 Commercial/ Institutional 020100 0.914 1.011 1.071 1.099 1.182 1.275 1.222 1.180 0.710 1.473
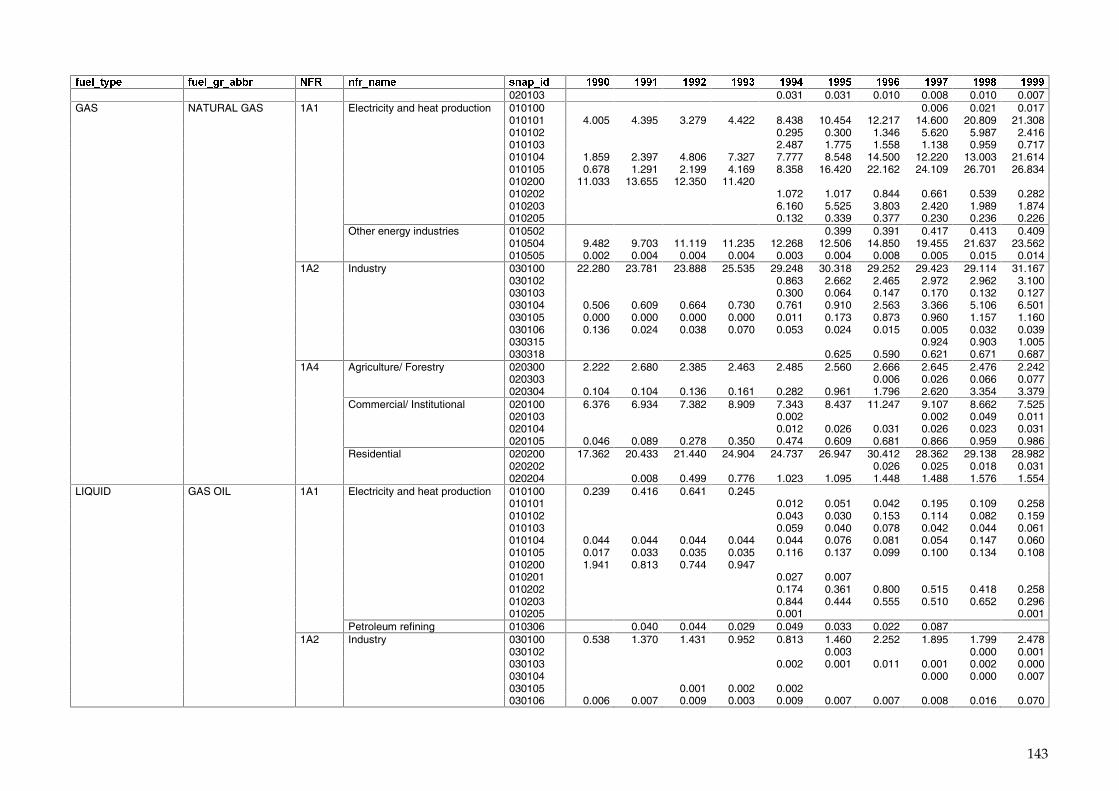
143
���������� ���������� ���� �������� ����� !� ���� �� � ���� ���� ���� ���� ���� ���� ���� ����
020103 0.031 0.031 0.010 0.008 0.010 0.007 GAS NATURAL GAS 1A1 Electricity and heat production 010100 0.006 0.021 0.017 010101 4.005 4.395 3.279 4.422 8.438 10.454 12.217 14.600 20.809 21.308 010102 0.295 0.300 1.346 5.620 5.987 2.416 010103 2.487 1.775 1.558 1.138 0.959 0.717 010104 1.859 2.397 4.806 7.327 7.777 8.548 14.500 12.220 13.003 21.614 010105 0.678 1.291 2.199 4.169 8.358 16.420 22.162 24.109 26.701 26.834 010200 11.033 13.655 12.350 11.420 010202 1.072 1.017 0.844 0.661 0.539 0.282 010203 6.160 5.525 3.803 2.420 1.989 1.874 010205 0.132 0.339 0.377 0.230 0.236 0.226 Other energy industries 010502 0.399 0.391 0.417 0.413 0.409 010504 9.482 9.703 11.119 11.235 12.268 12.506 14.850 19.455 21.637 23.562 010505 0.002 0.004 0.004 0.004 0.003 0.004 0.008 0.005 0.015 0.014 1A2 Industry 030100 22.280 23.781 23.888 25.535 29.248 30.318 29.252 29.423 29.114 31.167 030102 0.863 2.662 2.465 2.972 2.962 3.100 030103 0.300 0.064 0.147 0.170 0.132 0.127 030104 0.506 0.609 0.664 0.730 0.761 0.910 2.563 3.366 5.106 6.501 030105 0.000 0.000 0.000 0.000 0.011 0.173 0.873 0.960 1.157 1.160 030106 0.136 0.024 0.038 0.070 0.053 0.024 0.015 0.005 0.032 0.039 030315 0.924 0.903 1.005 030318 0.625 0.590 0.621 0.671 0.687 1A4 Agriculture/ Forestry 020300 2.222 2.680 2.385 2.463 2.485 2.560 2.666 2.645 2.476 2.242 020303 0.006 0.026 0.066 0.077 020304 0.104 0.104 0.136 0.161 0.282 0.961 1.796 2.620 3.354 3.379 Commercial/ Institutional 020100 6.376 6.934 7.382 8.909 7.343 8.437 11.247 9.107 8.662 7.525 020103 0.002 0.002 0.049 0.011 020104 0.012 0.026 0.031 0.026 0.023 0.031 020105 0.046 0.089 0.278 0.350 0.474 0.609 0.681 0.866 0.959 0.986 Residential 020200 17.362 20.433 21.440 24.904 24.737 26.947 30.412 28.362 29.138 28.982 020202 0.026 0.025 0.018 0.031 020204 0.008 0.499 0.776 1.023 1.095 1.448 1.488 1.576 1.554 LIQUID GAS OIL 1A1 Electricity and heat production 010100 0.239 0.416 0.641 0.245 010101 0.012 0.051 0.042 0.195 0.109 0.258 010102 0.043 0.030 0.153 0.114 0.082 0.159 010103 0.059 0.040 0.078 0.042 0.044 0.061 010104 0.044 0.044 0.044 0.044 0.044 0.076 0.081 0.054 0.147 0.060 010105 0.017 0.033 0.035 0.035 0.116 0.137 0.099 0.100 0.134 0.108 010200 1.941 0.813 0.744 0.947 010201 0.027 0.007 010202 0.174 0.361 0.800 0.515 0.418 0.258 010203 0.844 0.444 0.555 0.510 0.652 0.296 010205 0.001 0.001 Petroleum refining 010306 0.040 0.044 0.029 0.049 0.033 0.022 0.087 1A2 Industry 030100 0.538 1.370 1.431 0.952 0.813 1.460 2.252 1.895 1.799 2.478 030102 0.003 0.000 0.001 030103 0.002 0.001 0.011 0.001 0.002 0.000 030104 0.000 0.000 0.007 030105 0.001 0.002 0.002 030106 0.006 0.007 0.009 0.003 0.009 0.007 0.007 0.008 0.016 0.070
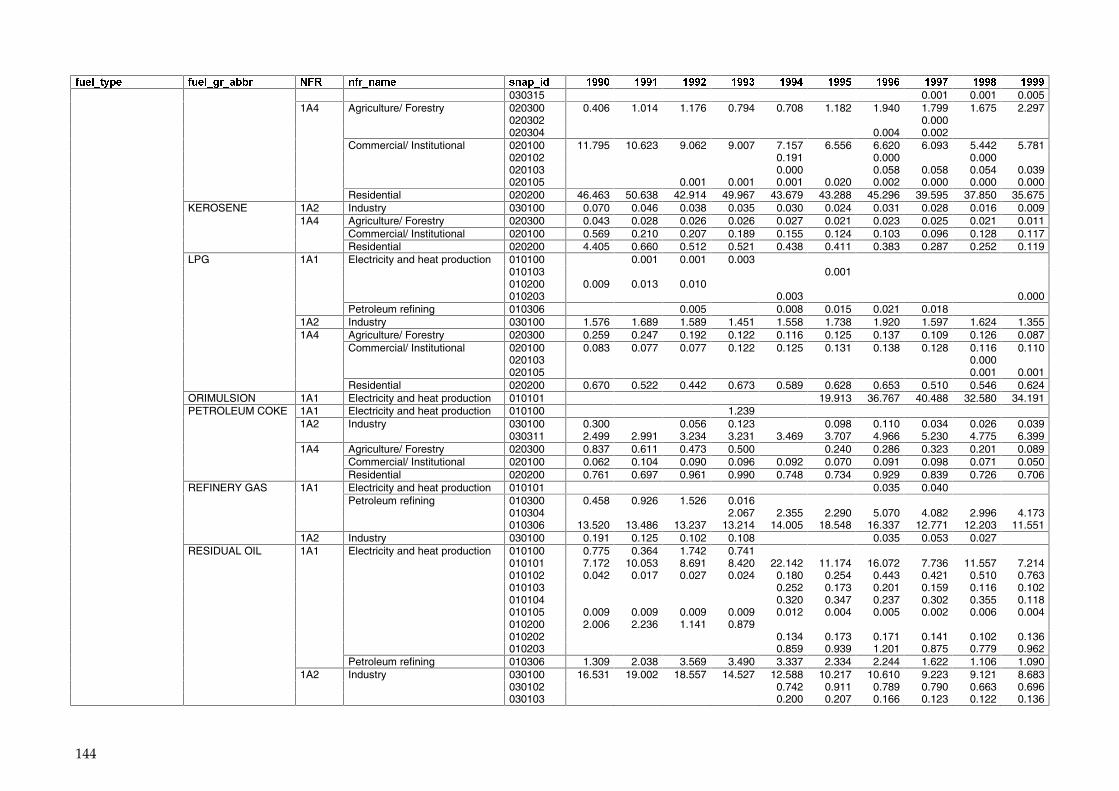
144
���������� ���������� ���� �������� ����� !� ���� �� � ���� ���� ���� ���� ���� ���� ���� ����
030315 0.001 0.001 0.005 1A4 Agriculture/ Forestry 020300 0.406 1.014 1.176 0.794 0.708 1.182 1.940 1.799 1.675 2.297 020302 0.000 020304 0.004 0.002 Commercial/ Institutional 020100 11.795 10.623 9.062 9.007 7.157 6.556 6.620 6.093 5.442 5.781 020102 0.191 0.000 0.000 020103 0.000 0.058 0.058 0.054 0.039 020105 0.001 0.001 0.001 0.020 0.002 0.000 0.000 0.000 Residential 020200 46.463 50.638 42.914 49.967 43.679 43.288 45.296 39.595 37.850 35.675 KEROSENE 1A2 Industry 030100 0.070 0.046 0.038 0.035 0.030 0.024 0.031 0.028 0.016 0.009 1A4 Agriculture/ Forestry 020300 0.043 0.028 0.026 0.026 0.027 0.021 0.023 0.025 0.021 0.011 Commercial/ Institutional 020100 0.569 0.210 0.207 0.189 0.155 0.124 0.103 0.096 0.128 0.117 Residential 020200 4.405 0.660 0.512 0.521 0.438 0.411 0.383 0.287 0.252 0.119 LPG 1A1 Electricity and heat production 010100 0.001 0.001 0.003 010103 0.001 010200 0.009 0.013 0.010 010203 0.003 0.000 Petroleum refining 010306 0.005 0.008 0.015 0.021 0.018 1A2 Industry 030100 1.576 1.689 1.589 1.451 1.558 1.738 1.920 1.597 1.624 1.355 1A4 Agriculture/ Forestry 020300 0.259 0.247 0.192 0.122 0.116 0.125 0.137 0.109 0.126 0.087 Commercial/ Institutional 020100 0.083 0.077 0.077 0.122 0.125 0.131 0.138 0.128 0.116 0.110 020103 0.000 020105 0.001 0.001 Residential 020200 0.670 0.522 0.442 0.673 0.589 0.628 0.653 0.510 0.546 0.624 ORIMULSION 1A1 Electricity and heat production 010101 19.913 36.767 40.488 32.580 34.191 PETROLEUM COKE 1A1 Electricity and heat production 010100 1.239 1A2 Industry 030100 0.300 0.056 0.123 0.098 0.110 0.034 0.026 0.039 030311 2.499 2.991 3.234 3.231 3.469 3.707 4.966 5.230 4.775 6.399 1A4 Agriculture/ Forestry 020300 0.837 0.611 0.473 0.500 0.240 0.286 0.323 0.201 0.089 Commercial/ Institutional 020100 0.062 0.104 0.090 0.096 0.092 0.070 0.091 0.098 0.071 0.050 Residential 020200 0.761 0.697 0.961 0.990 0.748 0.734 0.929 0.839 0.726 0.706 REFINERY GAS 1A1 Electricity and heat production 010101 0.035 0.040 Petroleum refining 010300 0.458 0.926 1.526 0.016 010304 2.067 2.355 2.290 5.070 4.082 2.996 4.173 010306 13.520 13.486 13.237 13.214 14.005 18.548 16.337 12.771 12.203 11.551 1A2 Industry 030100 0.191 0.125 0.102 0.108 0.035 0.053 0.027 RESIDUAL OIL 1A1 Electricity and heat production 010100 0.775 0.364 1.742 0.741 010101 7.172 10.053 8.691 8.420 22.142 11.174 16.072 7.736 11.557 7.214 010102 0.042 0.017 0.027 0.024 0.180 0.254 0.443 0.421 0.510 0.763 010103 0.252 0.173 0.201 0.159 0.116 0.102 010104 0.320 0.347 0.237 0.302 0.355 0.118 010105 0.009 0.009 0.009 0.009 0.012 0.004 0.005 0.002 0.006 0.004 010200 2.006 2.236 1.141 0.879 010202 0.134 0.173 0.171 0.141 0.102 0.136 010203 0.859 0.939 1.201 0.875 0.779 0.962 Petroleum refining 010306 1.309 2.038 3.569 3.490 3.337 2.334 2.244 1.622 1.106 1.090 1A2 Industry 030100 16.531 19.002 18.557 14.527 12.588 10.217 10.610 9.223 9.121 8.683 030102 0.742 0.911 0.789 0.790 0.663 0.696 030103 0.200 0.207 0.166 0.123 0.122 0.136
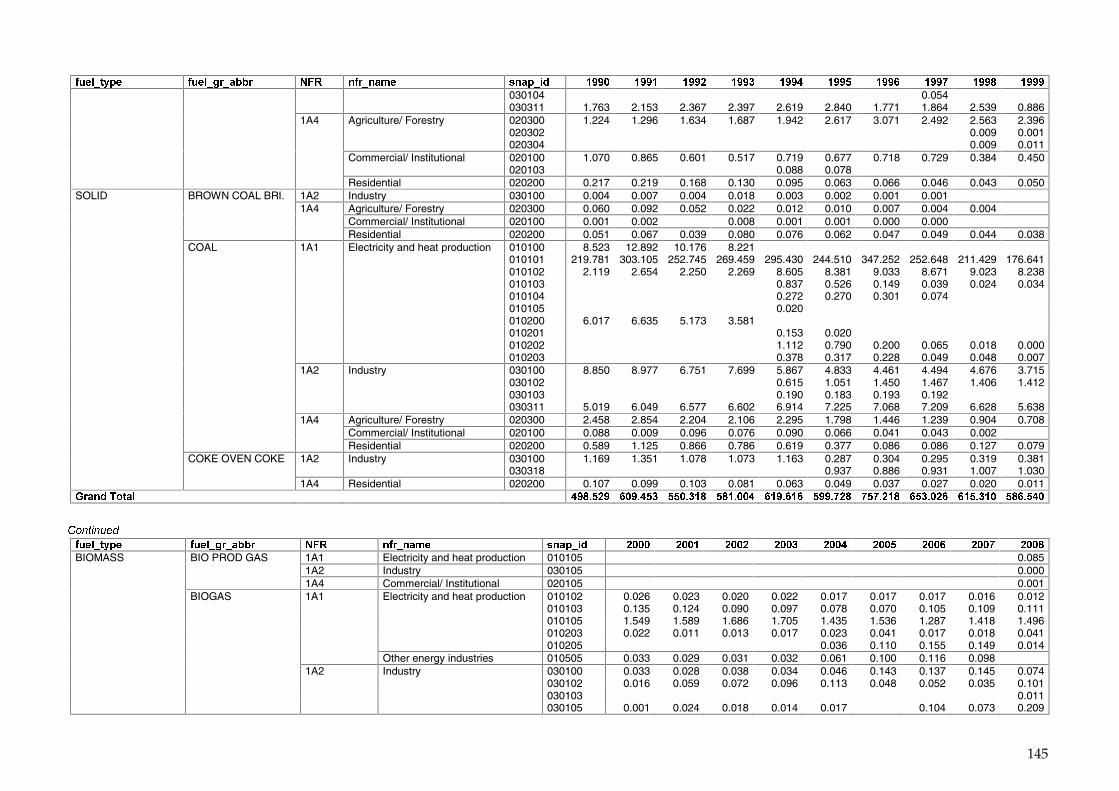
145
���������� ���������� ���� �������� ����� !� ���� �� � ���� ���� ���� ���� ���� ���� ���� ����
030104 0.054 030311 1.763 2.153 2.367 2.397 2.619 2.840 1.771 1.864 2.539 0.886 1A4 Agriculture/ Forestry 020300 1.224 1.296 1.634 1.687 1.942 2.617 3.071 2.492 2.563 2.396 020302 0.009 0.001 020304 0.009 0.011 Commercial/ Institutional 020100 1.070 0.865 0.601 0.517 0.719 0.677 0.718 0.729 0.384 0.450 020103 0.088 0.078 Residential 020200 0.217 0.219 0.168 0.130 0.095 0.063 0.066 0.046 0.043 0.050 SOLID BROWN COAL BRI. 1A2 Industry 030100 0.004 0.007 0.004 0.018 0.003 0.002 0.001 0.001 1A4 Agriculture/ Forestry 020300 0.060 0.092 0.052 0.022 0.012 0.010 0.007 0.004 0.004 Commercial/ Institutional 020100 0.001 0.002 0.008 0.001 0.001 0.000 0.000 Residential 020200 0.051 0.067 0.039 0.080 0.076 0.062 0.047 0.049 0.044 0.038 COAL 1A1 Electricity and heat production 010100 8.523 12.892 10.176 8.221 010101 219.781 303.105 252.745 269.459 295.430 244.510 347.252 252.648 211.429 176.641 010102 2.119 2.654 2.250 2.269 8.605 8.381 9.033 8.671 9.023 8.238 010103 0.837 0.526 0.149 0.039 0.024 0.034 010104 0.272 0.270 0.301 0.074 010105 0.020 010200 6.017 6.635 5.173 3.581 010201 0.153 0.020 010202 1.112 0.790 0.200 0.065 0.018 0.000 010203 0.378 0.317 0.228 0.049 0.048 0.007 1A2 Industry 030100 8.850 8.977 6.751 7.699 5.867 4.833 4.461 4.494 4.676 3.715 030102 0.615 1.051 1.450 1.467 1.406 1.412 030103 0.190 0.183 0.193 0.192 030311 5.019 6.049 6.577 6.602 6.914 7.225 7.068 7.209 6.628 5.638 1A4 Agriculture/ Forestry 020300 2.458 2.854 2.204 2.106 2.295 1.798 1.446 1.239 0.904 0.708 Commercial/ Institutional 020100 0.088 0.009 0.096 0.076 0.090 0.066 0.041 0.043 0.002 Residential 020200 0.589 1.125 0.866 0.786 0.619 0.377 0.086 0.086 0.127 0.079 COKE OVEN COKE 1A2 Industry 030100 1.169 1.351 1.078 1.073 1.163 0.287 0.304 0.295 0.319 0.381 030318 0.937 0.886 0.931 1.007 1.030 1A4 Residential 020200 0.107 0.099 0.103 0.081 0.063 0.049 0.037 0.027 0.020 0.011 "��!������� �� �� �� �������� �������� ����� �� �� ����� � ��� �� �������� ����� �� �������� � ��� �� ��������
����������
���������� ���������� ���� �������� ����� !� ����� ��� � ����� ����� ����� ����� ����� ����� �����
BIOMASS BIO PROD GAS 1A1 Electricity and heat production 010105 0.085 1A2 Industry 030105 0.000 1A4 Commercial/ Institutional 020105 0.001 BIOGAS 1A1 Electricity and heat production 010102 0.026 0.023 0.020 0.022 0.017 0.017 0.017 0.016 0.012 010103 0.135 0.124 0.090 0.097 0.078 0.070 0.105 0.109 0.111 010105 1.549 1.589 1.686 1.705 1.435 1.536 1.287 1.418 1.496 010203 0.022 0.011 0.013 0.017 0.023 0.041 0.017 0.018 0.041 010205 0.036 0.110 0.155 0.149 0.014 Other energy industries 010505 0.033 0.029 0.031 0.032 0.061 0.100 0.116 0.098 1A2 Industry 030100 0.033 0.028 0.038 0.034 0.046 0.143 0.137 0.145 0.074 030102 0.016 0.059 0.072 0.096 0.113 0.048 0.052 0.035 0.101 030103 0.011 030105 0.001 0.024 0.018 0.014 0.017 0.104 0.073 0.209
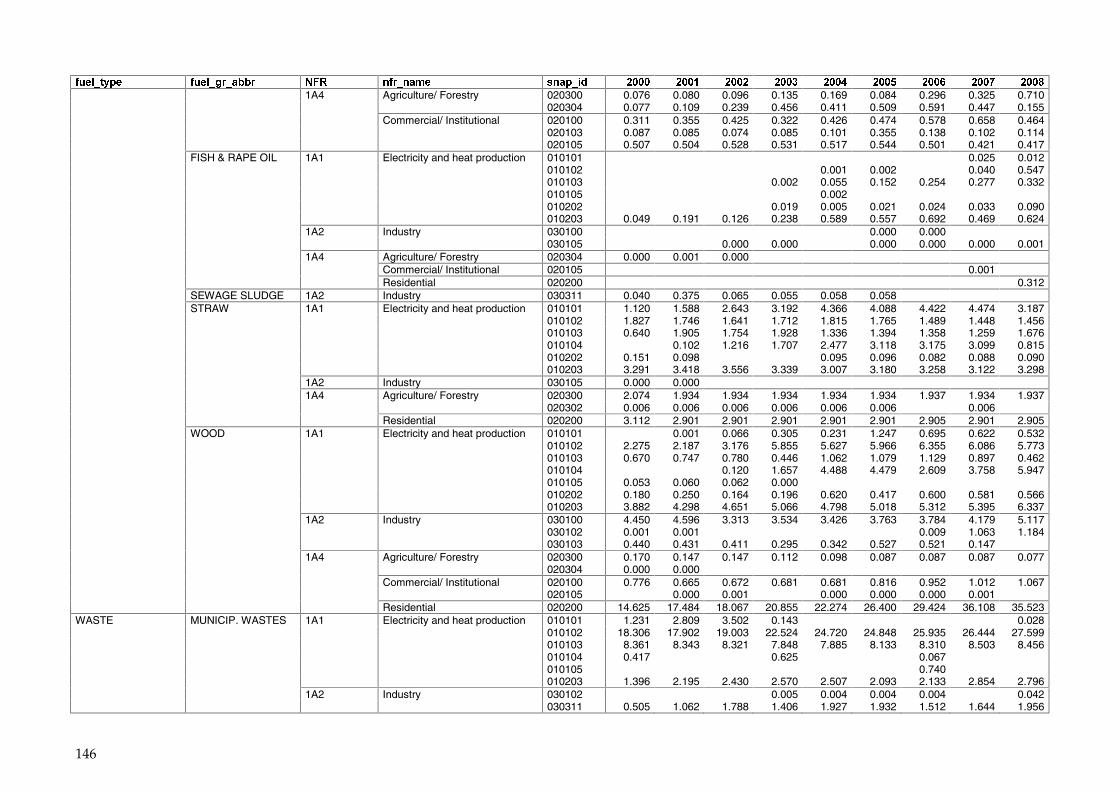
146
���������� ���������� ���� �������� ����� !� ����� ��� � ����� ����� ����� ����� ����� ����� �����
1A4 Agriculture/ Forestry 020300 0.076 0.080 0.096 0.135 0.169 0.084 0.296 0.325 0.710 020304 0.077 0.109 0.239 0.456 0.411 0.509 0.591 0.447 0.155 Commercial/ Institutional 020100 0.311 0.355 0.425 0.322 0.426 0.474 0.578 0.658 0.464 020103 0.087 0.085 0.074 0.085 0.101 0.355 0.138 0.102 0.114 020105 0.507 0.504 0.528 0.531 0.517 0.544 0.501 0.421 0.417 FISH & RAPE OIL 1A1 Electricity and heat production 010101 0.025 0.012 010102 0.001 0.002 0.040 0.547 010103 0.002 0.055 0.152 0.254 0.277 0.332 010105 0.002 010202 0.019 0.005 0.021 0.024 0.033 0.090 010203 0.049 0.191 0.126 0.238 0.589 0.557 0.692 0.469 0.624 1A2 Industry 030100 0.000 0.000 030105 0.000 0.000 0.000 0.000 0.000 0.001 1A4 Agriculture/ Forestry 020304 0.000 0.001 0.000 Commercial/ Institutional 020105 0.001 Residential 020200 0.312 SEWAGE SLUDGE 1A2 Industry 030311 0.040 0.375 0.065 0.055 0.058 0.058 STRAW 1A1 Electricity and heat production 010101 1.120 1.588 2.643 3.192 4.366 4.088 4.422 4.474 3.187 010102 1.827 1.746 1.641 1.712 1.815 1.765 1.489 1.448 1.456 010103 0.640 1.905 1.754 1.928 1.336 1.394 1.358 1.259 1.676 010104 0.102 1.216 1.707 2.477 3.118 3.175 3.099 0.815 010202 0.151 0.098 0.095 0.096 0.082 0.088 0.090 010203 3.291 3.418 3.556 3.339 3.007 3.180 3.258 3.122 3.298 1A2 Industry 030105 0.000 0.000 1A4 Agriculture/ Forestry 020300 2.074 1.934 1.934 1.934 1.934 1.934 1.937 1.934 1.937 020302 0.006 0.006 0.006 0.006 0.006 0.006 0.006 Residential 020200 3.112 2.901 2.901 2.901 2.901 2.901 2.905 2.901 2.905 WOOD 1A1 Electricity and heat production 010101 0.001 0.066 0.305 0.231 1.247 0.695 0.622 0.532 010102 2.275 2.187 3.176 5.855 5.627 5.966 6.355 6.086 5.773 010103 0.670 0.747 0.780 0.446 1.062 1.079 1.129 0.897 0.462 010104 0.120 1.657 4.488 4.479 2.609 3.758 5.947 010105 0.053 0.060 0.062 0.000 010202 0.180 0.250 0.164 0.196 0.620 0.417 0.600 0.581 0.566 010203 3.882 4.298 4.651 5.066 4.798 5.018 5.312 5.395 6.337 1A2 Industry 030100 4.450 4.596 3.313 3.534 3.426 3.763 3.784 4.179 5.117 030102 0.001 0.001 0.009 1.063 1.184 030103 0.440 0.431 0.411 0.295 0.342 0.527 0.521 0.147 1A4 Agriculture/ Forestry 020300 0.170 0.147 0.147 0.112 0.098 0.087 0.087 0.087 0.077 020304 0.000 0.000 Commercial/ Institutional 020100 0.776 0.665 0.672 0.681 0.681 0.816 0.952 1.012 1.067 020105 0.000 0.001 0.000 0.000 0.000 0.001 Residential 020200 14.625 17.484 18.067 20.855 22.274 26.400 29.424 36.108 35.523 WASTE MUNICIP. WASTES 1A1 Electricity and heat production 010101 1.231 2.809 3.502 0.143 0.028 010102 18.306 17.902 19.003 22.524 24.720 24.848 25.935 26.444 27.599 010103 8.361 8.343 8.321 7.848 7.885 8.133 8.310 8.503 8.456 010104 0.417 0.625 0.067 010105 0.740 010203 1.396 2.195 2.430 2.570 2.507 2.093 2.133 2.854 2.796 1A2 Industry 030102 0.005 0.004 0.004 0.004 0.042 030311 0.505 1.062 1.788 1.406 1.927 1.932 1.512 1.644 1.956
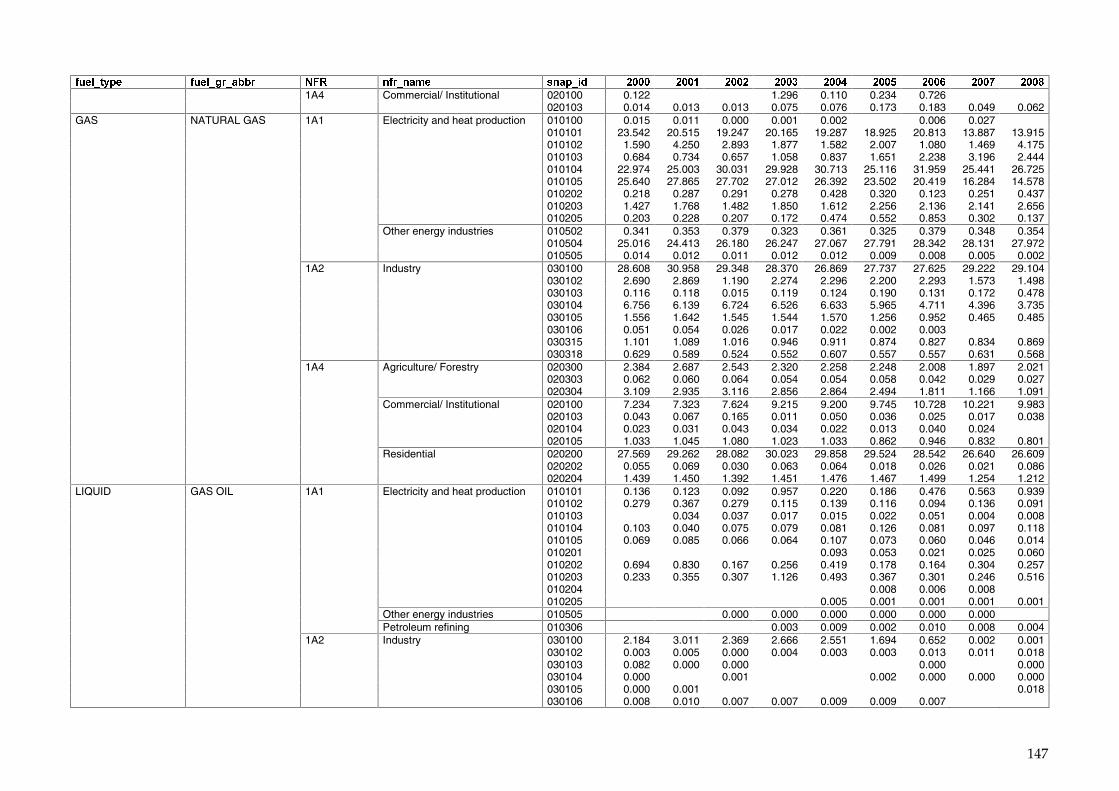
147
���������� ���������� ���� �������� ����� !� ����� ��� � ����� ����� ����� ����� ����� ����� �����
1A4 Commercial/ Institutional 020100 0.122 1.296 0.110 0.234 0.726 020103 0.014 0.013 0.013 0.075 0.076 0.173 0.183 0.049 0.062 GAS NATURAL GAS 1A1 Electricity and heat production 010100 0.015 0.011 0.000 0.001 0.002 0.006 0.027 010101 23.542 20.515 19.247 20.165 19.287 18.925 20.813 13.887 13.915 010102 1.590 4.250 2.893 1.877 1.582 2.007 1.080 1.469 4.175 010103 0.684 0.734 0.657 1.058 0.837 1.651 2.238 3.196 2.444 010104 22.974 25.003 30.031 29.928 30.713 25.116 31.959 25.441 26.725 010105 25.640 27.865 27.702 27.012 26.392 23.502 20.419 16.284 14.578 010202 0.218 0.287 0.291 0.278 0.428 0.320 0.123 0.251 0.437 010203 1.427 1.768 1.482 1.850 1.612 2.256 2.136 2.141 2.656 010205 0.203 0.228 0.207 0.172 0.474 0.552 0.853 0.302 0.137 Other energy industries 010502 0.341 0.353 0.379 0.323 0.361 0.325 0.379 0.348 0.354 010504 25.016 24.413 26.180 26.247 27.067 27.791 28.342 28.131 27.972 010505 0.014 0.012 0.011 0.012 0.012 0.009 0.008 0.005 0.002 1A2 Industry 030100 28.608 30.958 29.348 28.370 26.869 27.737 27.625 29.222 29.104 030102 2.690 2.869 1.190 2.274 2.296 2.200 2.293 1.573 1.498 030103 0.116 0.118 0.015 0.119 0.124 0.190 0.131 0.172 0.478 030104 6.756 6.139 6.724 6.526 6.633 5.965 4.711 4.396 3.735 030105 1.556 1.642 1.545 1.544 1.570 1.256 0.952 0.465 0.485 030106 0.051 0.054 0.026 0.017 0.022 0.002 0.003 030315 1.101 1.089 1.016 0.946 0.911 0.874 0.827 0.834 0.869 030318 0.629 0.589 0.524 0.552 0.607 0.557 0.557 0.631 0.568 1A4 Agriculture/ Forestry 020300 2.384 2.687 2.543 2.320 2.258 2.248 2.008 1.897 2.021 020303 0.062 0.060 0.064 0.054 0.054 0.058 0.042 0.029 0.027 020304 3.109 2.935 3.116 2.856 2.864 2.494 1.811 1.166 1.091 Commercial/ Institutional 020100 7.234 7.323 7.624 9.215 9.200 9.745 10.728 10.221 9.983 020103 0.043 0.067 0.165 0.011 0.050 0.036 0.025 0.017 0.038 020104 0.023 0.031 0.043 0.034 0.022 0.013 0.040 0.024 020105 1.033 1.045 1.080 1.023 1.033 0.862 0.946 0.832 0.801 Residential 020200 27.569 29.262 28.082 30.023 29.858 29.524 28.542 26.640 26.609 020202 0.055 0.069 0.030 0.063 0.064 0.018 0.026 0.021 0.086 020204 1.439 1.450 1.392 1.451 1.476 1.467 1.499 1.254 1.212 LIQUID GAS OIL 1A1 Electricity and heat production 010101 0.136 0.123 0.092 0.957 0.220 0.186 0.476 0.563 0.939 010102 0.279 0.367 0.279 0.115 0.139 0.116 0.094 0.136 0.091 010103 0.034 0.037 0.017 0.015 0.022 0.051 0.004 0.008 010104 0.103 0.040 0.075 0.079 0.081 0.126 0.081 0.097 0.118 010105 0.069 0.085 0.066 0.064 0.107 0.073 0.060 0.046 0.014 010201 0.093 0.053 0.021 0.025 0.060 010202 0.694 0.830 0.167 0.256 0.419 0.178 0.164 0.304 0.257 010203 0.233 0.355 0.307 1.126 0.493 0.367 0.301 0.246 0.516 010204 0.008 0.006 0.008 010205 0.005 0.001 0.001 0.001 0.001 Other energy industries 010505 0.000 0.000 0.000 0.000 0.000 0.000 Petroleum refining 010306 0.003 0.009 0.002 0.010 0.008 0.004 1A2 Industry 030100 2.184 3.011 2.369 2.666 2.551 1.694 0.652 0.002 0.001 030102 0.003 0.005 0.000 0.004 0.003 0.003 0.013 0.011 0.018 030103 0.082 0.000 0.000 0.000 0.000 030104 0.000 0.001 0.002 0.000 0.000 0.000 030105 0.000 0.001 0.018 030106 0.008 0.010 0.007 0.007 0.009 0.009 0.007
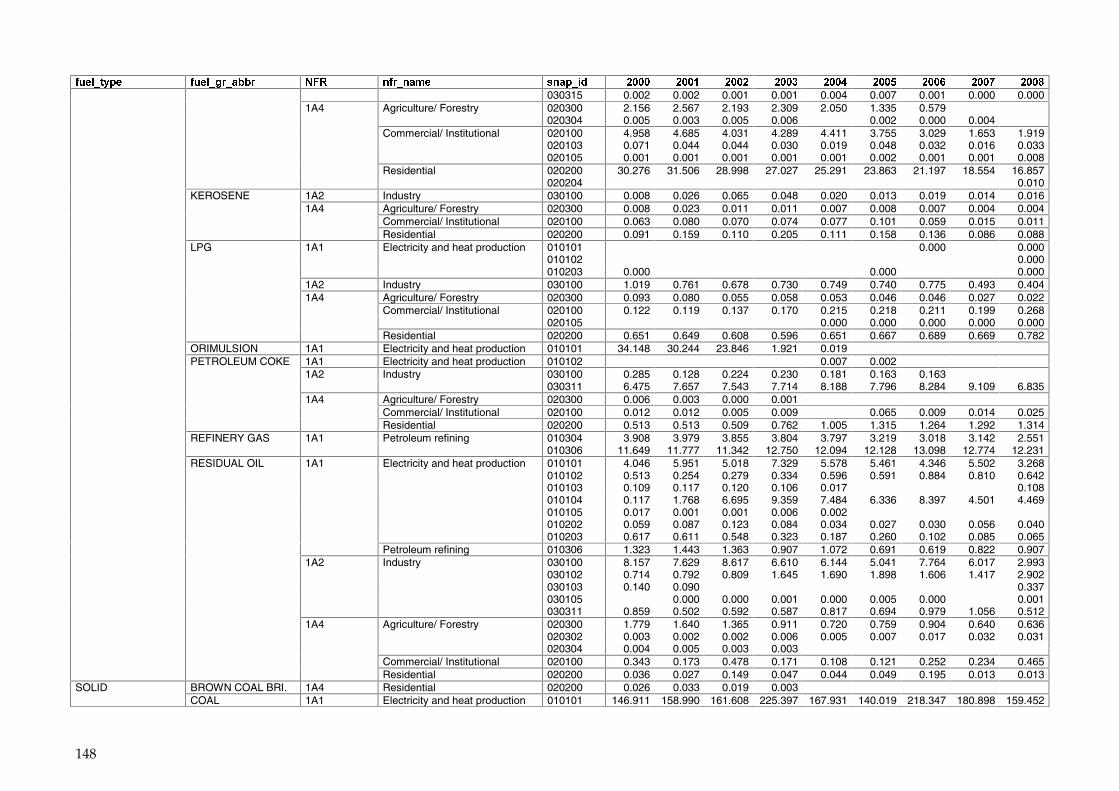
148
���������� ���������� ���� �������� ����� !� ����� ��� � ����� ����� ����� ����� ����� ����� �����
030315 0.002 0.002 0.001 0.001 0.004 0.007 0.001 0.000 0.000 1A4 Agriculture/ Forestry 020300 2.156 2.567 2.193 2.309 2.050 1.335 0.579 020304 0.005 0.003 0.005 0.006 0.002 0.000 0.004 Commercial/ Institutional 020100 4.958 4.685 4.031 4.289 4.411 3.755 3.029 1.653 1.919 020103 0.071 0.044 0.044 0.030 0.019 0.048 0.032 0.016 0.033 020105 0.001 0.001 0.001 0.001 0.001 0.002 0.001 0.001 0.008 Residential 020200 30.276 31.506 28.998 27.027 25.291 23.863 21.197 18.554 16.857 020204 0.010 KEROSENE 1A2 Industry 030100 0.008 0.026 0.065 0.048 0.020 0.013 0.019 0.014 0.016 1A4 Agriculture/ Forestry 020300 0.008 0.023 0.011 0.011 0.007 0.008 0.007 0.004 0.004 Commercial/ Institutional 020100 0.063 0.080 0.070 0.074 0.077 0.101 0.059 0.015 0.011 Residential 020200 0.091 0.159 0.110 0.205 0.111 0.158 0.136 0.086 0.088 LPG 1A1 Electricity and heat production 010101 0.000 0.000 010102 0.000 010203 0.000 0.000 0.000 1A2 Industry 030100 1.019 0.761 0.678 0.730 0.749 0.740 0.775 0.493 0.404 1A4 Agriculture/ Forestry 020300 0.093 0.080 0.055 0.058 0.053 0.046 0.046 0.027 0.022 Commercial/ Institutional 020100 0.122 0.119 0.137 0.170 0.215 0.218 0.211 0.199 0.268 020105 0.000 0.000 0.000 0.000 0.000 Residential 020200 0.651 0.649 0.608 0.596 0.651 0.667 0.689 0.669 0.782 ORIMULSION 1A1 Electricity and heat production 010101 34.148 30.244 23.846 1.921 0.019 PETROLEUM COKE 1A1 Electricity and heat production 010102 0.007 0.002 1A2 Industry 030100 0.285 0.128 0.224 0.230 0.181 0.163 0.163 030311 6.475 7.657 7.543 7.714 8.188 7.796 8.284 9.109 6.835 1A4 Agriculture/ Forestry 020300 0.006 0.003 0.000 0.001 Commercial/ Institutional 020100 0.012 0.012 0.005 0.009 0.065 0.009 0.014 0.025 Residential 020200 0.513 0.513 0.509 0.762 1.005 1.315 1.264 1.292 1.314 REFINERY GAS 1A1 Petroleum refining 010304 3.908 3.979 3.855 3.804 3.797 3.219 3.018 3.142 2.551 010306 11.649 11.777 11.342 12.750 12.094 12.128 13.098 12.774 12.231 RESIDUAL OIL 1A1 Electricity and heat production 010101 4.046 5.951 5.018 7.329 5.578 5.461 4.346 5.502 3.268 010102 0.513 0.254 0.279 0.334 0.596 0.591 0.884 0.810 0.642 010103 0.109 0.117 0.120 0.106 0.017 0.108 010104 0.117 1.768 6.695 9.359 7.484 6.336 8.397 4.501 4.469 010105 0.017 0.001 0.001 0.006 0.002 010202 0.059 0.087 0.123 0.084 0.034 0.027 0.030 0.056 0.040 010203 0.617 0.611 0.548 0.323 0.187 0.260 0.102 0.085 0.065 Petroleum refining 010306 1.323 1.443 1.363 0.907 1.072 0.691 0.619 0.822 0.907 1A2 Industry 030100 8.157 7.629 8.617 6.610 6.144 5.041 7.764 6.017 2.993 030102 0.714 0.792 0.809 1.645 1.690 1.898 1.606 1.417 2.902 030103 0.140 0.090 0.337 030105 0.000 0.000 0.001 0.000 0.005 0.000 0.001 030311 0.859 0.502 0.592 0.587 0.817 0.694 0.979 1.056 0.512 1A4 Agriculture/ Forestry 020300 1.779 1.640 1.365 0.911 0.720 0.759 0.904 0.640 0.636 020302 0.003 0.002 0.002 0.006 0.005 0.007 0.017 0.032 0.031 020304 0.004 0.005 0.003 0.003 Commercial/ Institutional 020100 0.343 0.173 0.478 0.171 0.108 0.121 0.252 0.234 0.465 Residential 020200 0.036 0.027 0.149 0.047 0.044 0.049 0.195 0.013 0.013 SOLID BROWN COAL BRI. 1A4 Residential 020200 0.026 0.033 0.019 0.003 COAL 1A1 Electricity and heat production 010101 146.911 158.990 161.608 225.397 167.931 140.019 218.347 180.898 159.452
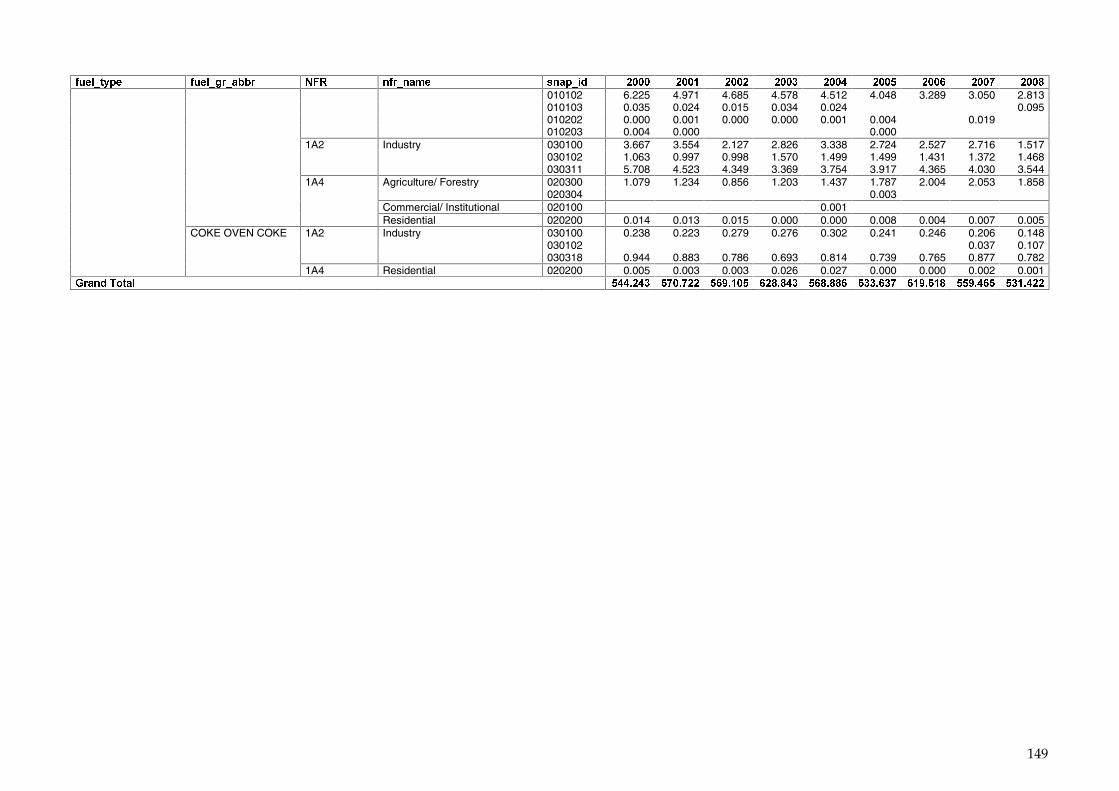
149
���������� ���������� ���� �������� ����� !� ����� ��� � ����� ����� ����� ����� ����� ����� �����
010102 6.225 4.971 4.685 4.578 4.512 4.048 3.289 3.050 2.813 010103 0.035 0.024 0.015 0.034 0.024 0.095 010202 0.000 0.001 0.000 0.000 0.001 0.004 0.019 010203 0.004 0.000 0.000 1A2 Industry 030100 3.667 3.554 2.127 2.826 3.338 2.724 2.527 2.716 1.517 030102 1.063 0.997 0.998 1.570 1.499 1.499 1.431 1.372 1.468 030311 5.708 4.523 4.349 3.369 3.754 3.917 4.365 4.030 3.544 1A4 Agriculture/ Forestry 020300 1.079 1.234 0.856 1.203 1.437 1.787 2.004 2.053 1.858 020304 0.003 Commercial/ Institutional 020100 0.001 Residential 020200 0.014 0.013 0.015 0.000 0.000 0.008 0.004 0.007 0.005 COKE OVEN COKE 1A2 Industry 030100 0.238 0.223 0.279 0.276 0.302 0.241 0.246 0.206 0.148 030102 0.037 0.107 030318 0.944 0.883 0.786 0.693 0.814 0.739 0.765 0.877 0.782 1A4 Residential 020200 0.005 0.003 0.003 0.026 0.027 0.000 0.000 0.002 0.001 "��!������� �� �� �� �������� �������� ���� ��� �������� �������� �������� � ��� �� �������� �� �����
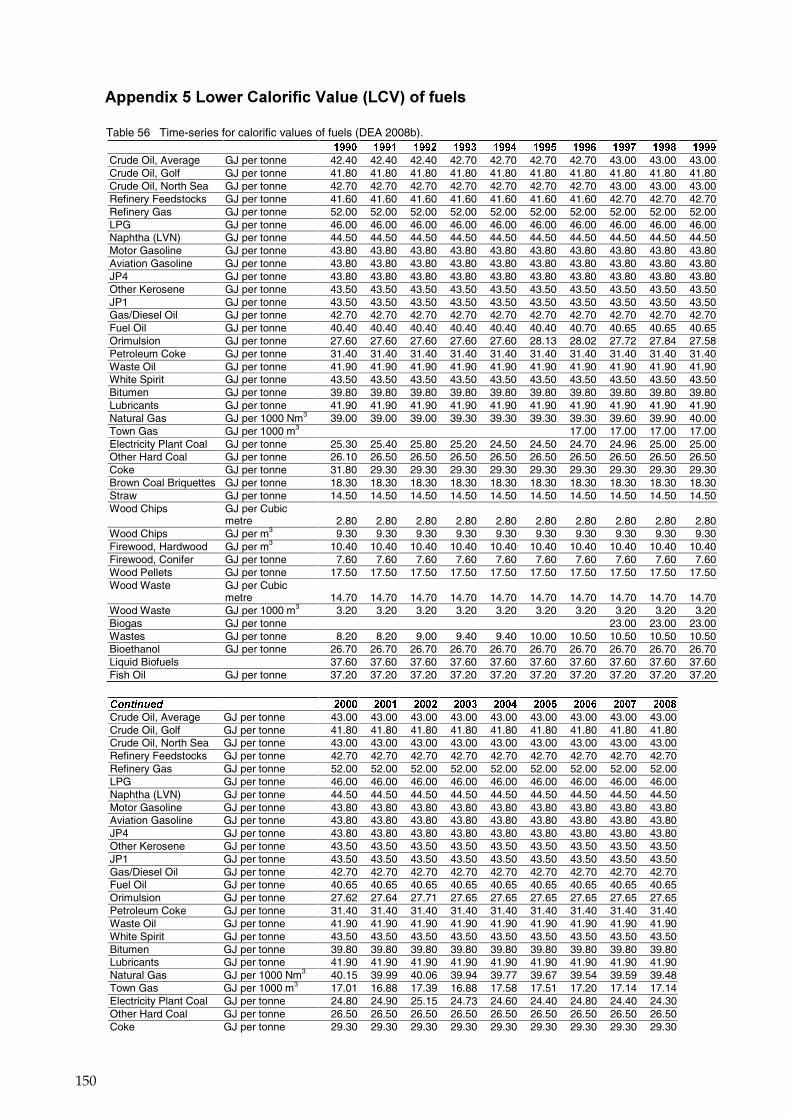
150
������������� ����� �������������������������
Table 56 Time-series for calorific values of fuels (DEA 2008b).
���������� � ����� ����� ����� ����� ����� ����� ����� ����� ����
Crude Oil, Average GJ per tonne 43.00 43.00 43.00 43.00 43.00 43.00 43.00 43.00 43.00 Crude Oil, Golf GJ per tonne 41.80 41.80 41.80 41.80 41.80 41.80 41.80 41.80 41.80 Crude Oil, North Sea GJ per tonne 43.00 43.00 43.00 43.00 43.00 43.00 43.00 43.00 43.00 Refinery Feedstocks GJ per tonne 42.70 42.70 42.70 42.70 42.70 42.70 42.70 42.70 42.70 Refinery Gas GJ per tonne 52.00 52.00 52.00 52.00 52.00 52.00 52.00 52.00 52.00 LPG GJ per tonne 46.00 46.00 46.00 46.00 46.00 46.00 46.00 46.00 46.00 Naphtha (LVN) GJ per tonne 44.50 44.50 44.50 44.50 44.50 44.50 44.50 44.50 44.50 Motor Gasoline GJ per tonne 43.80 43.80 43.80 43.80 43.80 43.80 43.80 43.80 43.80 Aviation Gasoline GJ per tonne 43.80 43.80 43.80 43.80 43.80 43.80 43.80 43.80 43.80 JP4 GJ per tonne 43.80 43.80 43.80 43.80 43.80 43.80 43.80 43.80 43.80 Other Kerosene GJ per tonne 43.50 43.50 43.50 43.50 43.50 43.50 43.50 43.50 43.50 JP1 GJ per tonne 43.50 43.50 43.50 43.50 43.50 43.50 43.50 43.50 43.50 Gas/Diesel Oil GJ per tonne 42.70 42.70 42.70 42.70 42.70 42.70 42.70 42.70 42.70 Fuel Oil GJ per tonne 40.65 40.65 40.65 40.65 40.65 40.65 40.65 40.65 40.65 Orimulsion GJ per tonne 27.62 27.64 27.71 27.65 27.65 27.65 27.65 27.65 27.65 Petroleum Coke GJ per tonne 31.40 31.40 31.40 31.40 31.40 31.40 31.40 31.40 31.40 Waste Oil GJ per tonne 41.90 41.90 41.90 41.90 41.90 41.90 41.90 41.90 41.90 White Spirit GJ per tonne 43.50 43.50 43.50 43.50 43.50 43.50 43.50 43.50 43.50 Bitumen GJ per tonne 39.80 39.80 39.80 39.80 39.80 39.80 39.80 39.80 39.80 Lubricants GJ per tonne 41.90 41.90 41.90 41.90 41.90 41.90 41.90 41.90 41.90 Natural Gas GJ per 1000 Nm3 40.15 39.99 40.06 39.94 39.77 39.67 39.54 39.59 39.48 Town Gas GJ per 1000 m3 17.01 16.88 17.39 16.88 17.58 17.51 17.20 17.14 17.14 Electricity Plant Coal GJ per tonne 24.80 24.90 25.15 24.73 24.60 24.40 24.80 24.40 24.30 Other Hard Coal GJ per tonne 26.50 26.50 26.50 26.50 26.50 26.50 26.50 26.50 26.50 Coke GJ per tonne 29.30 29.30 29.30 29.30 29.30 29.30 29.30 29.30 29.30
� � ��� ��� ��� ��� ��� ��� ��� ��� �� ��
Crude Oil, Average GJ per tonne 42.40 42.40 42.40 42.70 42.70 42.70 42.70 43.00 43.00 43.00 Crude Oil, Golf GJ per tonne 41.80 41.80 41.80 41.80 41.80 41.80 41.80 41.80 41.80 41.80 Crude Oil, North Sea GJ per tonne 42.70 42.70 42.70 42.70 42.70 42.70 42.70 43.00 43.00 43.00 Refinery Feedstocks GJ per tonne 41.60 41.60 41.60 41.60 41.60 41.60 41.60 42.70 42.70 42.70 Refinery Gas GJ per tonne 52.00 52.00 52.00 52.00 52.00 52.00 52.00 52.00 52.00 52.00 LPG GJ per tonne 46.00 46.00 46.00 46.00 46.00 46.00 46.00 46.00 46.00 46.00 Naphtha (LVN) GJ per tonne 44.50 44.50 44.50 44.50 44.50 44.50 44.50 44.50 44.50 44.50 Motor Gasoline GJ per tonne 43.80 43.80 43.80 43.80 43.80 43.80 43.80 43.80 43.80 43.80 Aviation Gasoline GJ per tonne 43.80 43.80 43.80 43.80 43.80 43.80 43.80 43.80 43.80 43.80 JP4 GJ per tonne 43.80 43.80 43.80 43.80 43.80 43.80 43.80 43.80 43.80 43.80 Other Kerosene GJ per tonne 43.50 43.50 43.50 43.50 43.50 43.50 43.50 43.50 43.50 43.50 JP1 GJ per tonne 43.50 43.50 43.50 43.50 43.50 43.50 43.50 43.50 43.50 43.50 Gas/Diesel Oil GJ per tonne 42.70 42.70 42.70 42.70 42.70 42.70 42.70 42.70 42.70 42.70 Fuel Oil GJ per tonne 40.40 40.40 40.40 40.40 40.40 40.40 40.70 40.65 40.65 40.65 Orimulsion GJ per tonne 27.60 27.60 27.60 27.60 27.60 28.13 28.02 27.72 27.84 27.58 Petroleum Coke GJ per tonne 31.40 31.40 31.40 31.40 31.40 31.40 31.40 31.40 31.40 31.40 Waste Oil GJ per tonne 41.90 41.90 41.90 41.90 41.90 41.90 41.90 41.90 41.90 41.90 White Spirit GJ per tonne 43.50 43.50 43.50 43.50 43.50 43.50 43.50 43.50 43.50 43.50 Bitumen GJ per tonne 39.80 39.80 39.80 39.80 39.80 39.80 39.80 39.80 39.80 39.80 Lubricants GJ per tonne 41.90 41.90 41.90 41.90 41.90 41.90 41.90 41.90 41.90 41.90 Natural Gas GJ per 1000 Nm3 39.00 39.00 39.00 39.30 39.30 39.30 39.30 39.60 39.90 40.00 Town Gas GJ per 1000 m3 17.00 17.00 17.00 17.00 Electricity Plant Coal GJ per tonne 25.30 25.40 25.80 25.20 24.50 24.50 24.70 24.96 25.00 25.00 Other Hard Coal GJ per tonne 26.10 26.50 26.50 26.50 26.50 26.50 26.50 26.50 26.50 26.50 Coke GJ per tonne 31.80 29.30 29.30 29.30 29.30 29.30 29.30 29.30 29.30 29.30 Brown Coal Briquettes GJ per tonne 18.30 18.30 18.30 18.30 18.30 18.30 18.30 18.30 18.30 18.30 Straw GJ per tonne 14.50 14.50 14.50 14.50 14.50 14.50 14.50 14.50 14.50 14.50 Wood Chips GJ per Cubic
metre 2.80 2.80 2.80 2.80 2.80 2.80 2.80 2.80 2.80 2.80 Wood Chips GJ per m3 9.30 9.30 9.30 9.30 9.30 9.30 9.30 9.30 9.30 9.30 Firewood, Hardwood GJ per m3 10.40 10.40 10.40 10.40 10.40 10.40 10.40 10.40 10.40 10.40 Firewood, Conifer GJ per tonne 7.60 7.60 7.60 7.60 7.60 7.60 7.60 7.60 7.60 7.60 Wood Pellets GJ per tonne 17.50 17.50 17.50 17.50 17.50 17.50 17.50 17.50 17.50 17.50 Wood Waste GJ per Cubic
metre 14.70 14.70 14.70 14.70 14.70 14.70 14.70 14.70 14.70 14.70 Wood Waste GJ per 1000 m3 3.20 3.20 3.20 3.20 3.20 3.20 3.20 3.20 3.20 3.20 Biogas GJ per tonne 23.00 23.00 23.00 Wastes GJ per tonne 8.20 8.20 9.00 9.40 9.40 10.00 10.50 10.50 10.50 10.50 Bioethanol GJ per tonne 26.70 26.70 26.70 26.70 26.70 26.70 26.70 26.70 26.70 26.70 Liquid Biofuels 37.60 37.60 37.60 37.60 37.60 37.60 37.60 37.60 37.60 37.60 Fish Oil GJ per tonne 37.20 37.20 37.20 37.20 37.20 37.20 37.20 37.20 37.20 37.20
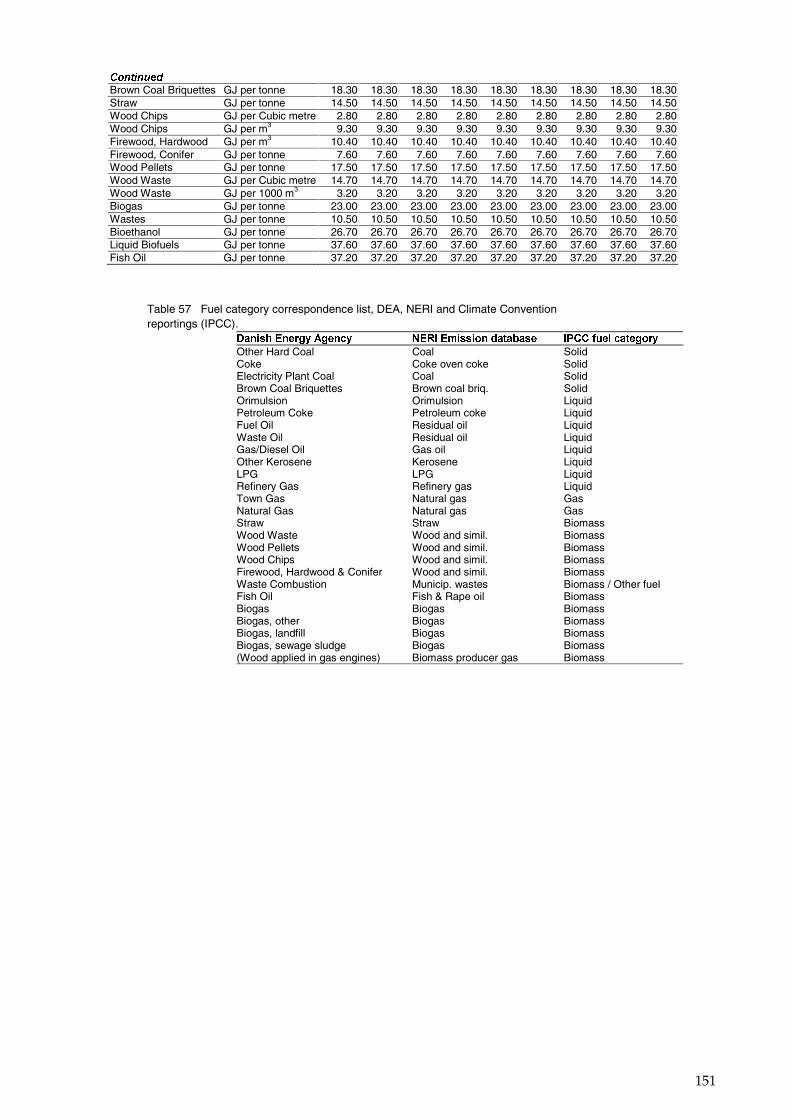
151
���������� Brown Coal Briquettes GJ per tonne 18.30 18.30 18.30 18.30 18.30 18.30 18.30 18.30 18.30 Straw GJ per tonne 14.50 14.50 14.50 14.50 14.50 14.50 14.50 14.50 14.50 Wood Chips GJ per Cubic metre 2.80 2.80 2.80 2.80 2.80 2.80 2.80 2.80 2.80 Wood Chips GJ per m3 9.30 9.30 9.30 9.30 9.30 9.30 9.30 9.30 9.30 Firewood, Hardwood GJ per m3 10.40 10.40 10.40 10.40 10.40 10.40 10.40 10.40 10.40 Firewood, Conifer GJ per tonne 7.60 7.60 7.60 7.60 7.60 7.60 7.60 7.60 7.60 Wood Pellets GJ per tonne 17.50 17.50 17.50 17.50 17.50 17.50 17.50 17.50 17.50 Wood Waste GJ per Cubic metre 14.70 14.70 14.70 14.70 14.70 14.70 14.70 14.70 14.70 Wood Waste GJ per 1000 m3 3.20 3.20 3.20 3.20 3.20 3.20 3.20 3.20 3.20 Biogas GJ per tonne 23.00 23.00 23.00 23.00 23.00 23.00 23.00 23.00 23.00 Wastes GJ per tonne 10.50 10.50 10.50 10.50 10.50 10.50 10.50 10.50 10.50 Bioethanol GJ per tonne 26.70 26.70 26.70 26.70 26.70 26.70 26.70 26.70 26.70 Liquid Biofuels GJ per tonne 37.60 37.60 37.60 37.60 37.60 37.60 37.60 37.60 37.60 Fish Oil GJ per tonne 37.20 37.20 37.20 37.20 37.20 37.20 37.20 37.20 37.20
Table 57 Fuel category correspondence list, DEA, NERI and Climate Convention reportings (IPCC).
�� ����� �������� ��� ������������ ���������� � !!�"#�$����������
Other Hard Coal Coal Solid Coke Coke oven coke Solid Electricity Plant Coal Coal Solid Brown Coal Briquettes Brown coal briq. Solid Orimulsion Orimulsion Liquid Petroleum Coke Petroleum coke Liquid Fuel Oil Residual oil Liquid Waste Oil Residual oil Liquid Gas/Diesel Oil Gas oil Liquid Other Kerosene Kerosene Liquid LPG LPG Liquid Refinery Gas Refinery gas Liquid Town Gas Natural gas Gas Natural Gas Natural gas Gas Straw Straw Biomass Wood Waste Wood and simil. Biomass Wood Pellets Wood and simil. Biomass Wood Chips Wood and simil. Biomass Firewood, Hardwood & Conifer Wood and simil. Biomass Waste Combustion Municip. wastes Biomass / Other fuel Fish Oil Fish & Rape oil Biomass Biogas Biogas Biomass Biogas, other Biogas Biomass Biogas, landfill Biogas Biomass Biogas, sewage sludge Biogas Biomass (Wood applied in gas engines) Biomass producer gas Biomass
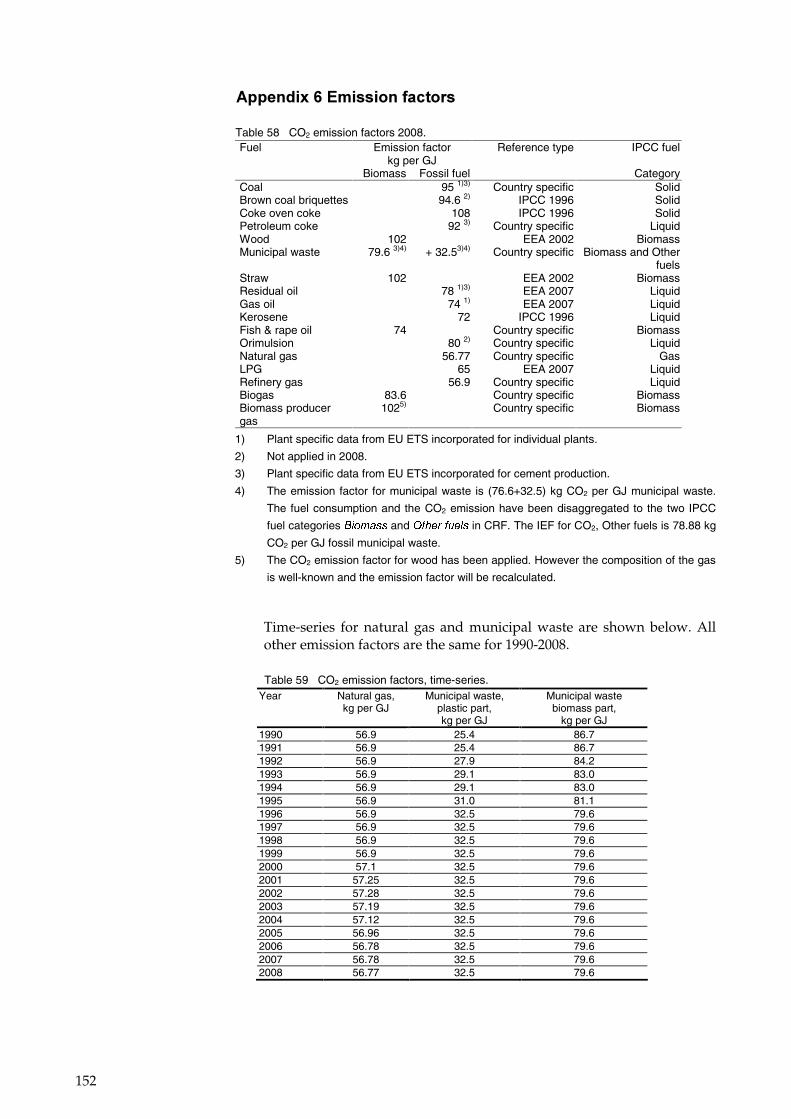
152
������������������������� ��
Table 58 CO2 emission factors 2008. Fuel Emission factor
kg per GJ Reference type IPCC fuel
Biomass Fossil fuel Category Coal 95 1)3) Country specific Solid Brown coal briquettes 94.6 2) IPCC 1996 Solid Coke oven coke 108 IPCC 1996 Solid Petroleum coke 92 3) Country specific Liquid Wood 102 EEA 2002 Biomass Municipal waste 79.6 3)4) + 32.53)4) Country specific Biomass and Other
fuels Straw 102 EEA 2002 Biomass Residual oil 78 1)3) EEA 2007 Liquid Gas oil 74 1) EEA 2007 Liquid Kerosene 72 IPCC 1996 Liquid Fish & rape oil 74 Country specific Biomass Orimulsion 80 2) Country specific Liquid Natural gas 56.77 Country specific Gas LPG 65 EEA 2007 Liquid Refinery gas 56.9 Country specific Liquid Biogas 83.6 Country specific Biomass Biomass producer gas
1025) Country specific Biomass
1) Plant specific data from EU ETS incorporated for individual plants.
2) Not applied in 2008.
3) Plant specific data from EU ETS incorporated for cement production.
4) The emission factor for municipal waste is (76.6+32.5) kg CO2 per GJ municipal waste.
The fuel consumption and the CO2 emission have been disaggregated to the two IPCC
fuel categories ������� and ����� �� in CRF. The IEF for CO2, Other fuels is 78.88 kg
CO2 per GJ fossil municipal waste.
5) The CO2 emission factor for wood has been applied. However the composition of the gas
is well-known and the emission factor will be recalculated.
Time-series for natural gas and municipal waste are shown below. All other emission factors are the same for 1990-2008.
Table 59 CO2 emission factors, time-series. Year Natural gas,
kg per GJ Municipal waste,
plastic part, kg per GJ
Municipal waste biomass part,
kg per GJ 1990 56.9 25.4 86.7 1991 56.9 25.4 86.7 1992 56.9 27.9 84.2 1993 56.9 29.1 83.0 1994 56.9 29.1 83.0 1995 56.9 31.0 81.1 1996 56.9 32.5 79.6 1997 56.9 32.5 79.6 1998 56.9 32.5 79.6 1999 56.9 32.5 79.6 2000 57.1 32.5 79.6 2001 57.25 32.5 79.6 2002 57.28 32.5 79.6 2003 57.19 32.5 79.6 2004 57.12 32.5 79.6 2005 56.96 32.5 79.6 2006 56.78 32.5 79.6 2007 56.78 32.5 79.6 2008 56.77 32.5 79.6
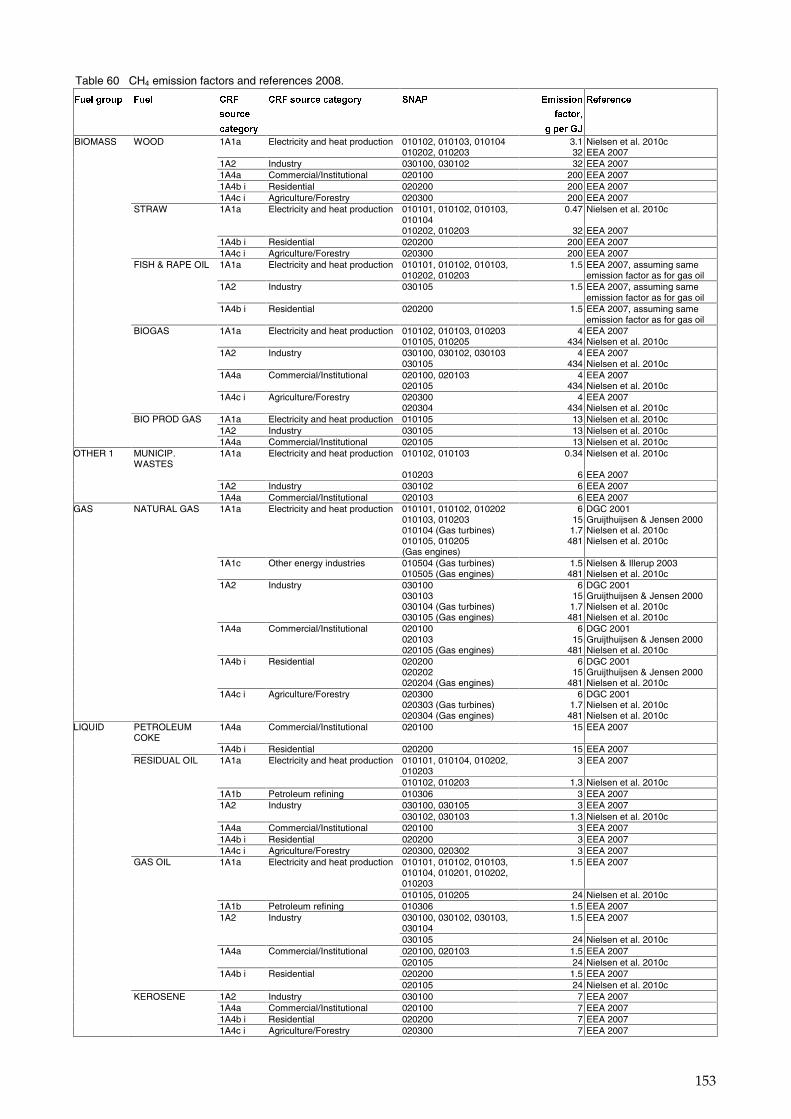
153
Table 60 CH4 emission factors and references 2008.
����������� ����� ��
�������
� �������
���������� ������� ����� ���������
� ������
���������
���������
BIOMASS WOOD 1A1a Electricity and heat production 010102, 010103, 010104 3.1 Nielsen et al. 2010c 010202, 010203 32 EEA 2007 1A2 Industry 030100, 030102 32 EEA 2007 1A4a Commercial/Institutional 020100 200 EEA 2007 1A4b i Residential 020200 200 EEA 2007 1A4c i Agriculture/Forestry 020300 200 EEA 2007 STRAW 1A1a Electricity and heat production 010101, 010102, 010103,
010104 0.47 Nielsen et al. 2010c
010202, 010203 32 EEA 2007 1A4b i Residential 020200 200 EEA 2007 1A4c i Agriculture/Forestry 020300 200 EEA 2007 FISH & RAPE OIL 1A1a Electricity and heat production 010101, 010102, 010103,
010202, 010203 1.5 EEA 2007, assuming same
emission factor as for gas oil 1A2 Industry 030105 1.5 EEA 2007, assuming same
emission factor as for gas oil 1A4b i Residential 020200 1.5 EEA 2007, assuming same
emission factor as for gas oil BIOGAS 1A1a Electricity and heat production 010102, 010103, 010203 4 EEA 2007 010105, 010205 434 Nielsen et al. 2010c 1A2 Industry 030100, 030102, 030103 4 EEA 2007 030105 434 Nielsen et al. 2010c 1A4a Commercial/Institutional 020100, 020103 4 EEA 2007 020105 434 Nielsen et al. 2010c 1A4c i Agriculture/Forestry 020300 4 EEA 2007 020304 434 Nielsen et al. 2010c
BIO PROD GAS 1A1a Electricity and heat production 010105 13 Nielsen et al. 2010c 1A2 Industry 030105 13 Nielsen et al. 2010c 1A4a Commercial/Institutional 020105 13 Nielsen et al. 2010c
OTHER 1 MUNICIP. WASTES
1A1a Electricity and heat production 010102, 010103 0.34 Nielsen et al. 2010c
010203 6 EEA 2007 1A2 Industry 030102 6 EEA 2007 1A4a Commercial/Institutional 020103 6 EEA 2007
GAS NATURAL GAS 1A1a Electricity and heat production 010101, 010102, 010202 6 DGC 2001 010103, 010203 15 Gruijthuijsen & Jensen 2000 010104 (Gas turbines) 1.7 Nielsen et al. 2010c 010105, 010205
(Gas engines) 481 Nielsen et al. 2010c
1A1c Other energy industries 010504 (Gas turbines) 1.5 Nielsen & Illerup 2003 010505 (Gas engines) 481 Nielsen et al. 2010c 1A2 Industry 030100 6 DGC 2001 030103 15 Gruijthuijsen & Jensen 2000 030104 (Gas turbines) 1.7 Nielsen et al. 2010c 030105 (Gas engines) 481 Nielsen et al. 2010c 1A4a Commercial/Institutional 020100 6 DGC 2001 020103 15 Gruijthuijsen & Jensen 2000 020105 (Gas engines) 481 Nielsen et al. 2010c 1A4b i Residential 020200 6 DGC 2001 020202 15 Gruijthuijsen & Jensen 2000 020204 (Gas engines) 481 Nielsen et al. 2010c 1A4c i Agriculture/Forestry 020300 6 DGC 2001 020303 (Gas turbines) 1.7 Nielsen et al. 2010c 020304 (Gas engines) 481 Nielsen et al. 2010c LIQUID PETROLEUM
COKE 1A4a Commercial/Institutional 020100 15 EEA 2007
1A4b i Residential 020200 15 EEA 2007 RESIDUAL OIL 1A1a Electricity and heat production 010101, 010104, 010202,
010203 3 EEA 2007
010102, 010203 1.3 Nielsen et al. 2010c 1A1b Petroleum refining 010306 3 EEA 2007 1A2 Industry 030100, 030105 3 EEA 2007 030102, 030103 1.3 Nielsen et al. 2010c 1A4a Commercial/Institutional 020100 3 EEA 2007 1A4b i Residential 020200 3 EEA 2007 1A4c i Agriculture/Forestry 020300, 020302 3 EEA 2007 GAS OIL 1A1a Electricity and heat production 010101, 010102, 010103,
010104, 010201, 010202, 010203
1.5 EEA 2007
010105, 010205 24 Nielsen et al. 2010c 1A1b Petroleum refining 010306 1.5 EEA 2007 1A2 Industry 030100, 030102, 030103,
030104 1.5 EEA 2007
030105 24 Nielsen et al. 2010c 1A4a Commercial/Institutional 020100, 020103 1.5 EEA 2007 020105 24 Nielsen et al. 2010c 1A4b i Residential 020200 1.5 EEA 2007 020105 24 Nielsen et al. 2010c KEROSENE 1A2 Industry 030100 7 EEA 2007 1A4a Commercial/Institutional 020100 7 EEA 2007 1A4b i Residential 020200 7 EEA 2007 1A4c i Agriculture/Forestry 020300 7 EEA 2007
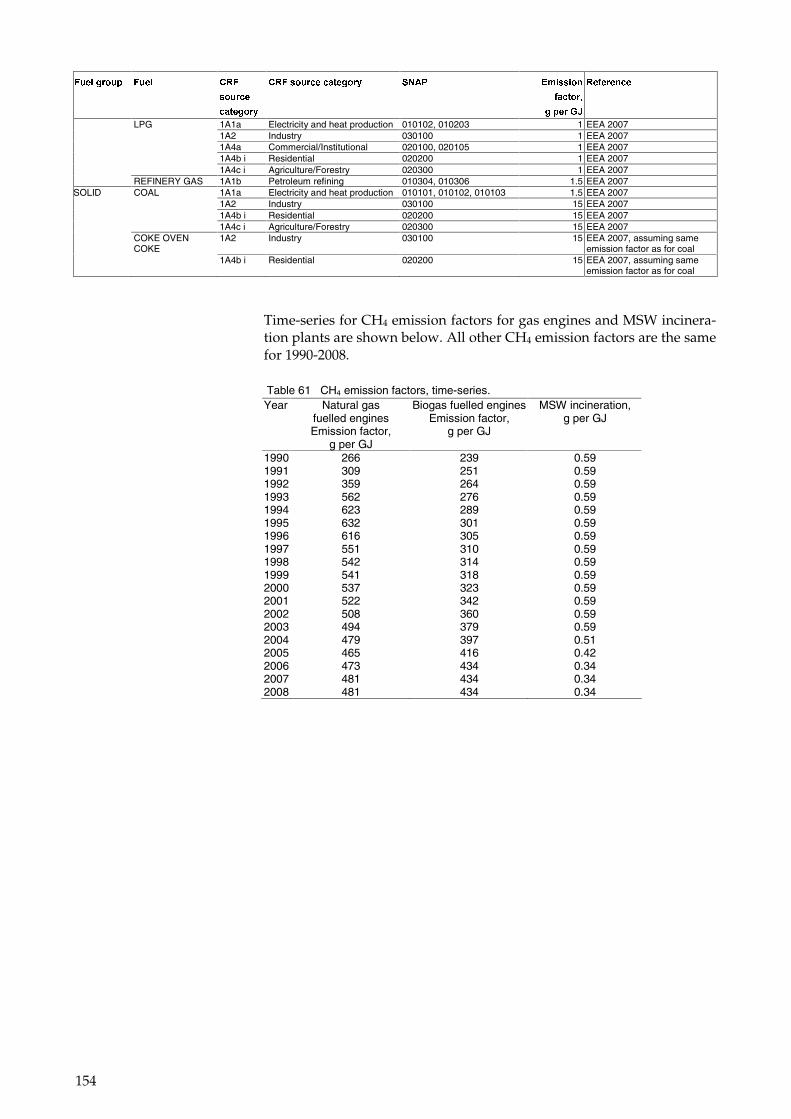
154
����������� ����� ��
�������
� �������
���������� ������� ����� ���������
� ������
���������
���������
LPG 1A1a Electricity and heat production 010102, 010203 1 EEA 2007 1A2 Industry 030100 1 EEA 2007 1A4a Commercial/Institutional 020100, 020105 1 EEA 2007 1A4b i Residential 020200 1 EEA 2007 1A4c i Agriculture/Forestry 020300 1 EEA 2007
REFINERY GAS 1A1b Petroleum refining 010304, 010306 1.5 EEA 2007 SOLID COAL 1A1a Electricity and heat production 010101, 010102, 010103 1.5 EEA 2007 1A2 Industry 030100 15 EEA 2007 1A4b i Residential 020200 15 EEA 2007 1A4c i Agriculture/Forestry 020300 15 EEA 2007 COKE OVEN
COKE 1A2 Industry 030100 15 EEA 2007, assuming same
emission factor as for coal 1A4b i Residential 020200 15 EEA 2007, assuming same
emission factor as for coal
Time-series for CH4 emission factors for gas engines and MSW incinera-tion plants are shown below. All other CH4 emission factors are the same for 1990-2008.
Table 61 CH4 emission factors, time-series. Year Natural gas
fuelled engines Emission factor,
g per GJ
Biogas fuelled engines Emission factor,
g per GJ
MSW incineration, g per GJ
1990 266 239 0.59 1991 309 251 0.59 1992 359 264 0.59 1993 562 276 0.59 1994 623 289 0.59 1995 632 301 0.59 1996 616 305 0.59 1997 551 310 0.59 1998 542 314 0.59 1999 541 318 0.59 2000 537 323 0.59 2001 522 342 0.59 2002 508 360 0.59 2003 494 379 0.59 2004 479 397 0.51 2005 465 416 0.42 2006 473 434 0.34 2007 481 434 0.34 2008 481 434 0.34
�
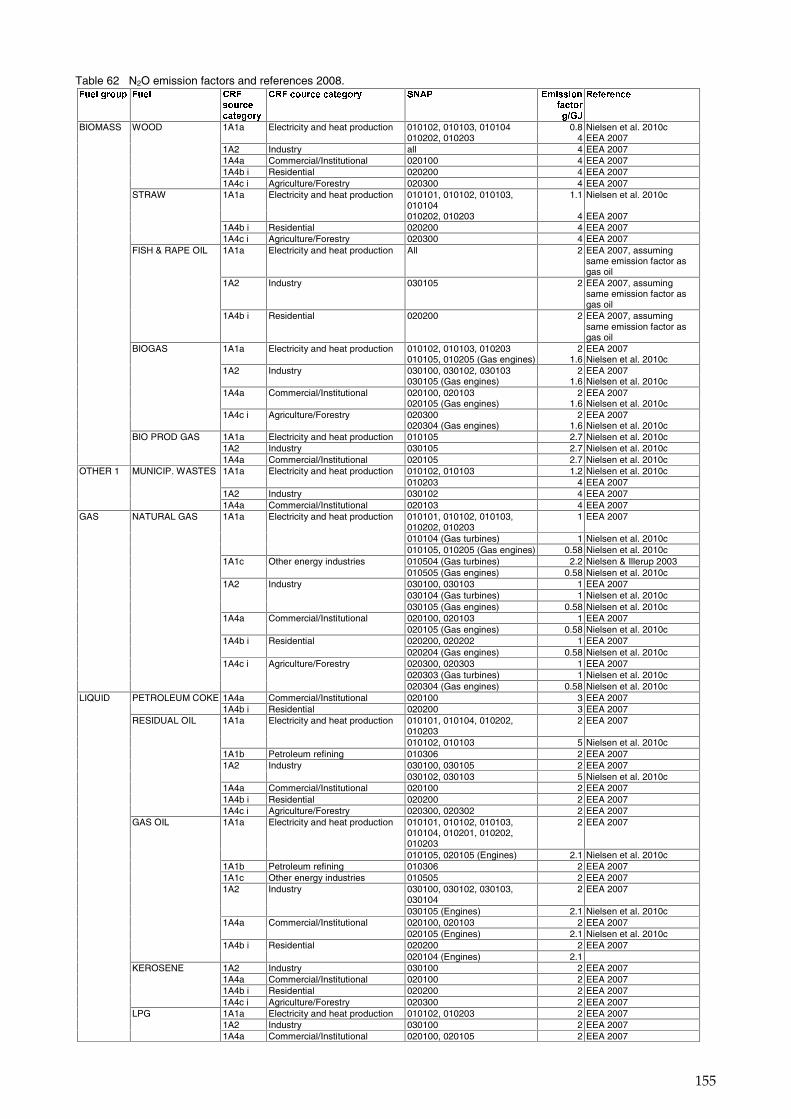
155
Table 62 N2O emission factors and references 2008. ����������� ����� ��
�������� �������
���������� ������� ����� ���������� ����������
���������
BIOMASS WOOD 1A1a Electricity and heat production 010102, 010103, 010104 0.8 Nielsen et al. 2010c 010202, 010203 4 EEA 2007 1A2 Industry all 4 EEA 2007 1A4a Commercial/Institutional 020100 4 EEA 2007 1A4b i Residential 020200 4 EEA 2007 1A4c i Agriculture/Forestry 020300 4 EEA 2007 STRAW 1A1a Electricity and heat production 010101, 010102, 010103,
010104 1.1 Nielsen et al. 2010c
010202, 010203 4 EEA 2007 1A4b i Residential 020200 4 EEA 2007 1A4c i Agriculture/Forestry 020300 4 EEA 2007 FISH & RAPE OIL 1A1a Electricity and heat production All 2 EEA 2007, assuming
same emission factor as gas oil
1A2 Industry 030105 2 EEA 2007, assuming same emission factor as gas oil
1A4b i Residential 020200 2 EEA 2007, assuming same emission factor as gas oil
BIOGAS 1A1a Electricity and heat production 010102, 010103, 010203 2 EEA 2007 010105, 010205 (Gas engines) 1.6 Nielsen et al. 2010c 1A2 Industry 030100, 030102, 030103 2 EEA 2007 030105 (Gas engines) 1.6 Nielsen et al. 2010c 1A4a Commercial/Institutional 020100, 020103 2 EEA 2007 020105 (Gas engines) 1.6 Nielsen et al. 2010c 1A4c i Agriculture/Forestry 020300 2 EEA 2007 020304 (Gas engines) 1.6 Nielsen et al. 2010c BIO PROD GAS 1A1a Electricity and heat production 010105 2.7 Nielsen et al. 2010c 1A2 Industry 030105 2.7 Nielsen et al. 2010c 1A4a Commercial/Institutional 020105 2.7 Nielsen et al. 2010c OTHER 1 MUNICIP. WASTES 1A1a Electricity and heat production 010102, 010103 1.2 Nielsen et al. 2010c 010203 4 EEA 2007 1A2 Industry 030102 4 EEA 2007 1A4a Commercial/Institutional 020103 4 EEA 2007 GAS NATURAL GAS 1A1a Electricity and heat production 010101, 010102, 010103,
010202, 010203 1 EEA 2007
010104 (Gas turbines) 1 Nielsen et al. 2010c 010105, 010205 (Gas engines) 0.58 Nielsen et al. 2010c 1A1c Other energy industries 010504 (Gas turbines) 2.2 Nielsen & Illerup 2003 010505 (Gas engines) 0.58 Nielsen et al. 2010c 1A2 Industry 030100, 030103 1 EEA 2007 030104 (Gas turbines) 1 Nielsen et al. 2010c 030105 (Gas engines) 0.58 Nielsen et al. 2010c 1A4a Commercial/Institutional 020100, 020103 1 EEA 2007 020105 (Gas engines) 0.58 Nielsen et al. 2010c 1A4b i Residential 020200, 020202 1 EEA 2007 020204 (Gas engines) 0.58 Nielsen et al. 2010c 1A4c i Agriculture/Forestry 020300, 020303 1 EEA 2007 020303 (Gas turbines) 1 Nielsen et al. 2010c 020304 (Gas engines) 0.58 Nielsen et al. 2010c LIQUID PETROLEUM COKE 1A4a Commercial/Institutional 020100 3 EEA 2007 1A4b i Residential 020200 3 EEA 2007 RESIDUAL OIL 1A1a Electricity and heat production 010101, 010104, 010202,
010203 2 EEA 2007
010102, 010103 5 Nielsen et al. 2010c 1A1b Petroleum refining 010306 2 EEA 2007 1A2 Industry 030100, 030105 2 EEA 2007 030102, 030103 5 Nielsen et al. 2010c 1A4a Commercial/Institutional 020100 2 EEA 2007 1A4b i Residential 020200 2 EEA 2007 1A4c i Agriculture/Forestry 020300, 020302 2 EEA 2007 GAS OIL 1A1a Electricity and heat production 010101, 010102, 010103,
010104, 010201, 010202, 010203
2 EEA 2007
010105, 020105 (Engines) 2.1 Nielsen et al. 2010c 1A1b Petroleum refining 010306 2 EEA 2007 1A1c Other energy industries 010505 2 EEA 2007 1A2 Industry 030100, 030102, 030103,
030104 2 EEA 2007
030105 (Engines) 2.1 Nielsen et al. 2010c 1A4a Commercial/Institutional 020100, 020103 2 EEA 2007 020105 (Engines) 2.1 Nielsen et al. 2010c 1A4b i Residential 020200 2 EEA 2007 020104 (Engines) 2.1 KEROSENE 1A2 Industry 030100 2 EEA 2007 1A4a Commercial/Institutional 020100 2 EEA 2007 1A4b i Residential 020200 2 EEA 2007 1A4c i Agriculture/Forestry 020300 2 EEA 2007 LPG 1A1a Electricity and heat production 010102, 010203 2 EEA 2007 1A2 Industry 030100 2 EEA 2007 1A4a Commercial/Institutional 020100, 020105 2 EEA 2007
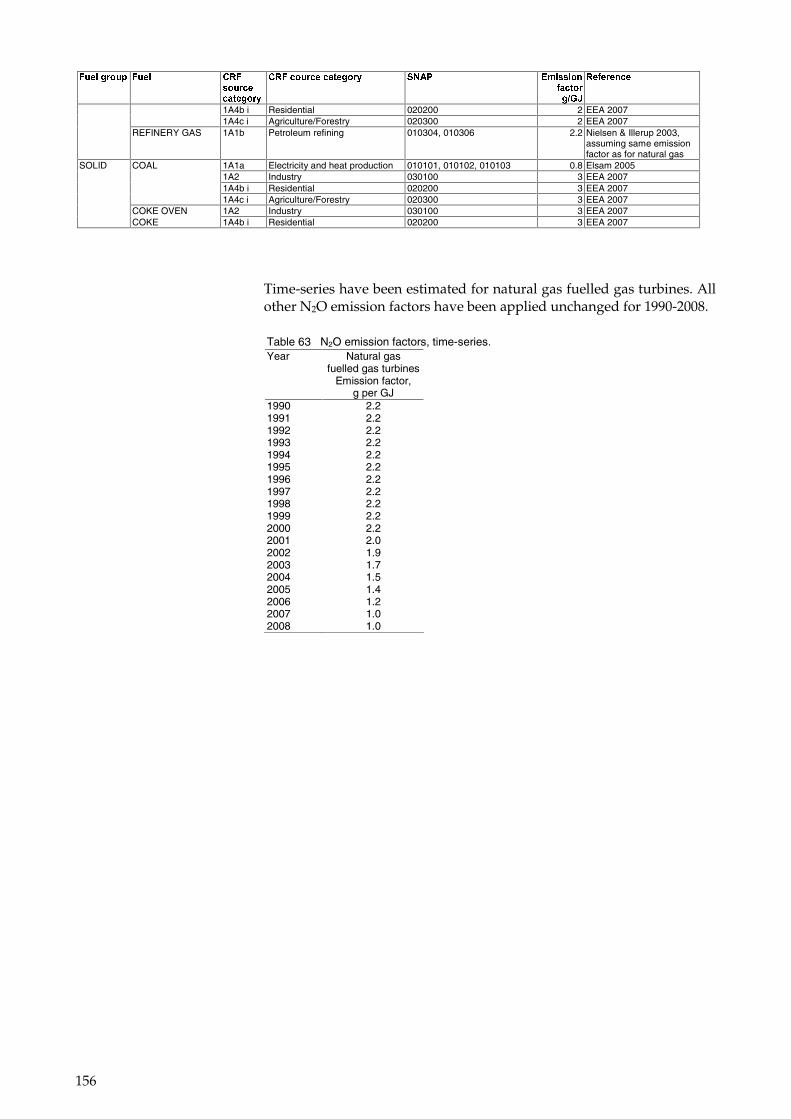
156
����������� ����� ���������� �������
���������� ������� ����� ���������� ����������
���������
1A4b i Residential 020200 2 EEA 2007 1A4c i Agriculture/Forestry 020300 2 EEA 2007 REFINERY GAS 1A1b Petroleum refining 010304, 010306 2.2 Nielsen & Illerup 2003,
assuming same emission factor as for natural gas
SOLID COAL 1A1a Electricity and heat production 010101, 010102, 010103 0.8 Elsam 2005 1A2 Industry 030100 3 EEA 2007 1A4b i Residential 020200 3 EEA 2007 1A4c i Agriculture/Forestry 020300 3 EEA 2007 COKE OVEN 1A2 Industry 030100 3 EEA 2007 COKE 1A4b i Residential 020200 3 EEA 2007
Time-series have been estimated for natural gas fuelled gas turbines. All other N2O emission factors have been applied unchanged for 1990-2008.
Table 63 N2O emission factors, time-series. Year Natural gas
fuelled gas turbines Emission factor,
g per GJ 1990 2.2 1991 2.2 1992 2.2 1993 2.2 1994 2.2 1995 2.2 1996 2.2 1997 2.2 1998 2.2 1999 2.2 2000 2.2 2001 2.0 2002 1.9 2003 1.7 2004 1.5 2005 1.4 2006 1.2 2007 1.0 2008 1.0
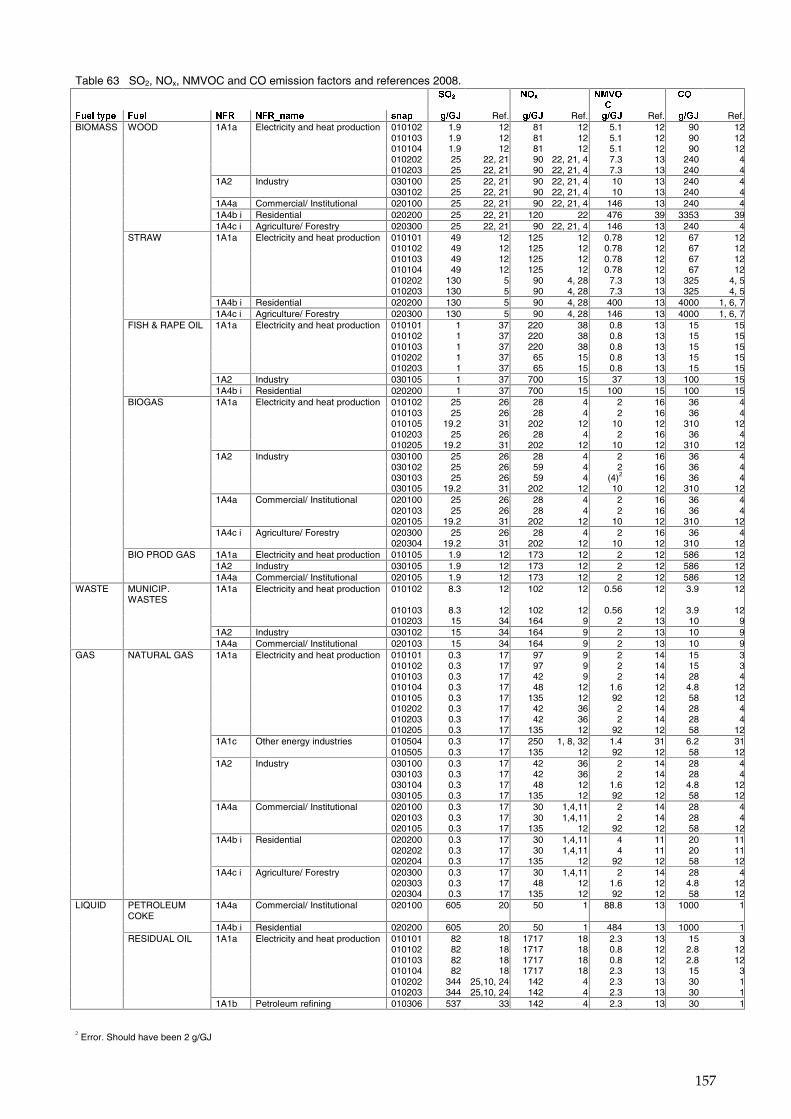
157
Table 63 SO2, NOx, NMVOC and CO emission factors and references 2008. �� �� �� �� �� ���� � ���� � ����
�� ��
���������� ����� ��� �� � ��� �� �� ����� Ref. ����� Ref. ����� Ref. ����� Ref.BIOMASS WOOD 1A1a Electricity and heat production 010102 1.9 12 81 12 5.1 12 90 12 010103 1.9 12 81 12 5.1 12 90 12 010104 1.9 12 81 12 5.1 12 90 12 010202 25 22, 21 90 22, 21, 4 7.3 13 240 4 010203 25 22, 21 90 22, 21, 4 7.3 13 240 4 1A2 Industry 030100 25 22, 21 90 22, 21, 4 10 13 240 4 030102 25 22, 21 90 22, 21, 4 10 13 240 4 1A4a Commercial/ Institutional 020100 25 22, 21 90 22, 21, 4 146 13 240 4 1A4b i Residential 020200 25 22, 21 120 22 476 39 3353 39 1A4c i Agriculture/ Forestry 020300 25 22, 21 90 22, 21, 4 146 13 240 4 STRAW 1A1a Electricity and heat production 010101 49 12 125 12 0.78 12 67 12 010102 49 12 125 12 0.78 12 67 12 010103 49 12 125 12 0.78 12 67 12 010104 49 12 125 12 0.78 12 67 12 010202 130 5 90 4, 28 7.3 13 325 4, 5 010203 130 5 90 4, 28 7.3 13 325 4, 5 1A4b i Residential 020200 130 5 90 4, 28 400 13 4000 1, 6, 7 1A4c i Agriculture/ Forestry 020300 130 5 90 4, 28 146 13 4000 1, 6, 7 FISH & RAPE OIL 1A1a Electricity and heat production 010101 1 37 220 38 0.8 13 15 15 010102 1 37 220 38 0.8 13 15 15 010103 1 37 220 38 0.8 13 15 15 010202 1 37 65 15 0.8 13 15 15 010203 1 37 65 15 0.8 13 15 15 1A2 Industry 030105 1 37 700 15 37 13 100 15 1A4b i Residential 020200 1 37 700 15 100 15 100 15 BIOGAS 1A1a Electricity and heat production 010102 25 26 28 4 2 16 36 4 010103 25 26 28 4 2 16 36 4 010105 19.2 31 202 12 10 12 310 12 010203 25 26 28 4 2 16 36 4 010205 19.2 31 202 12 10 12 310 12 1A2 Industry 030100 25 26 28 4 2 16 36 4 030102 25 26 59 4 2 16 36 4 030103 25 26 59 4 (4)2 16 36 4 030105 19.2 31 202 12 10 12 310 12 1A4a Commercial/ Institutional 020100 25 26 28 4 2 16 36 4 020103 25 26 28 4 2 16 36 4 020105 19.2 31 202 12 10 12 310 12 1A4c i Agriculture/ Forestry 020300 25 26 28 4 2 16 36 4 020304 19.2 31 202 12 10 12 310 12 BIO PROD GAS 1A1a Electricity and heat production 010105 1.9 12 173 12 2 12 586 12 1A2 Industry 030105 1.9 12 173 12 2 12 586 12 1A4a Commercial/ Institutional 020105 1.9 12 173 12 2 12 586 12WASTE MUNICIP.
WASTES 1A1a Electricity and heat production 010102 8.3 12 102 12 0.56 12 3.9 12
010103 8.3 12 102 12 0.56 12 3.9 12 010203 15 34 164 9 2 13 10 9 1A2 Industry 030102 15 34 164 9 2 13 10 9 1A4a Commercial/ Institutional 020103 15 34 164 9 2 13 10 9GAS NATURAL GAS 1A1a Electricity and heat production 010101 0.3 17 97 9 2 14 15 3 010102 0.3 17 97 9 2 14 15 3 010103 0.3 17 42 9 2 14 28 4 010104 0.3 17 48 12 1.6 12 4.8 12 010105 0.3 17 135 12 92 12 58 12 010202 0.3 17 42 36 2 14 28 4 010203 0.3 17 42 36 2 14 28 4 010205 0.3 17 135 12 92 12 58 12 1A1c Other energy industries 010504 0.3 17 250 1, 8, 32 1.4 31 6.2 31 010505 0.3 17 135 12 92 12 58 12 1A2 Industry 030100 0.3 17 42 36 2 14 28 4 030103 0.3 17 42 36 2 14 28 4 030104 0.3 17 48 12 1.6 12 4.8 12 030105 0.3 17 135 12 92 12 58 12 1A4a Commercial/ Institutional 020100 0.3 17 30 1,4,11 2 14 28 4 020103 0.3 17 30 1,4,11 2 14 28 4 020105 0.3 17 135 12 92 12 58 12 1A4b i Residential 020200 0.3 17 30 1,4,11 4 11 20 11 020202 0.3 17 30 1,4,11 4 11 20 11 020204 0.3 17 135 12 92 12 58 12 1A4c i Agriculture/ Forestry 020300 0.3 17 30 1,4,11 2 14 28 4 020303 0.3 17 48 12 1.6 12 4.8 12 020304 0.3 17 135 12 92 12 58 12LIQUID PETROLEUM
COKE 1A4a Commercial/ Institutional 020100 605 20 50 1 88.8 13 1000 1
1A4b i Residential 020200 605 20 50 1 484 13 1000 1 RESIDUAL OIL 1A1a Electricity and heat production 010101 82 18 1717 18 2.3 13 15 3 010102 82 18 1717 18 0.8 12 2.8 12 010103 82 18 1717 18 0.8 12 2.8 12 010104 82 18 1717 18 2.3 13 15 3 010202 344 25,10, 24 142 4 2.3 13 30 1 010203 344 25,10, 24 142 4 2.3 13 30 1 1A1b Petroleum refining 010306 537 33 142 4 2.3 13 30 1
2 Error. Should have been 2 g/GJ
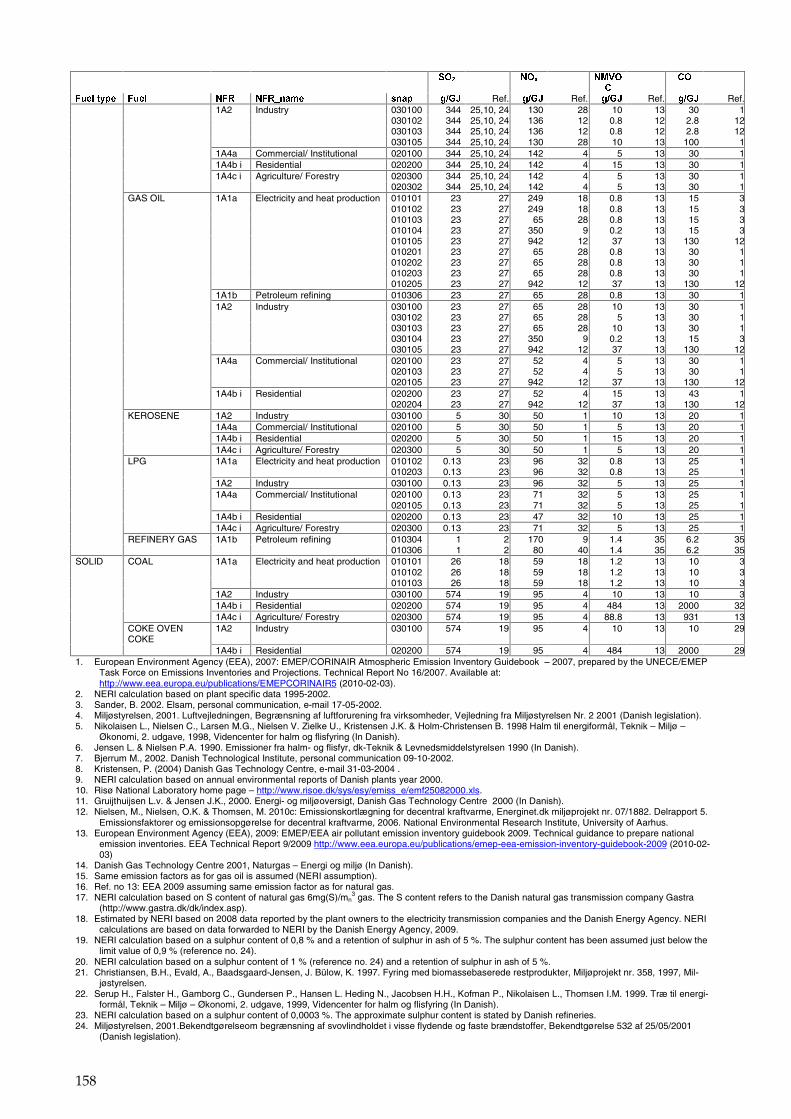
158
�� �� �� �� �� ���� � ���� � �����
� ��
���������� ����� ��� �� � ��� �� �� ����� Ref. ����� Ref. ����� Ref. ����� Ref. 1A2 Industry 030100 344 25,10, 24 130 28 10 13 30 1 030102 344 25,10, 24 136 12 0.8 12 2.8 12 030103 344 25,10, 24 136 12 0.8 12 2.8 12 030105 344 25,10, 24 130 28 10 13 100 1 1A4a Commercial/ Institutional 020100 344 25,10, 24 142 4 5 13 30 1 1A4b i Residential 020200 344 25,10, 24 142 4 15 13 30 1 1A4c i Agriculture/ Forestry 020300 344 25,10, 24 142 4 5 13 30 1 020302 344 25,10, 24 142 4 5 13 30 1 GAS OIL 1A1a Electricity and heat production 010101 23 27 249 18 0.8 13 15 3 010102 23 27 249 18 0.8 13 15 3 010103 23 27 65 28 0.8 13 15 3 010104 23 27 350 9 0.2 13 15 3 010105 23 27 942 12 37 13 130 12 010201 23 27 65 28 0.8 13 30 1 010202 23 27 65 28 0.8 13 30 1 010203 23 27 65 28 0.8 13 30 1 010205 23 27 942 12 37 13 130 12 1A1b Petroleum refining 010306 23 27 65 28 0.8 13 30 1 1A2 Industry 030100 23 27 65 28 10 13 30 1 030102 23 27 65 28 5 13 30 1 030103 23 27 65 28 10 13 30 1 030104 23 27 350 9 0.2 13 15 3 030105 23 27 942 12 37 13 130 12 1A4a Commercial/ Institutional 020100 23 27 52 4 5 13 30 1 020103 23 27 52 4 5 13 30 1 020105 23 27 942 12 37 13 130 12 1A4b i Residential 020200 23 27 52 4 15 13 43 1 020204 23 27 942 12 37 13 130 12 KEROSENE 1A2 Industry 030100 5 30 50 1 10 13 20 1 1A4a Commercial/ Institutional 020100 5 30 50 1 5 13 20 1 1A4b i Residential 020200 5 30 50 1 15 13 20 1 1A4c i Agriculture/ Forestry 020300 5 30 50 1 5 13 20 1 LPG 1A1a Electricity and heat production 010102 0.13 23 96 32 0.8 13 25 1 010203 0.13 23 96 32 0.8 13 25 1 1A2 Industry 030100 0.13 23 96 32 5 13 25 1 1A4a Commercial/ Institutional 020100 0.13 23 71 32 5 13 25 1 020105 0.13 23 71 32 5 13 25 1 1A4b i Residential 020200 0.13 23 47 32 10 13 25 1 1A4c i Agriculture/ Forestry 020300 0.13 23 71 32 5 13 25 1 REFINERY GAS 1A1b Petroleum refining 010304 1 2 170 9 1.4 35 6.2 35 010306 1 2 80 40 1.4 35 6.2 35SOLID COAL 1A1a Electricity and heat production 010101 26 18 59 18 1.2 13 10 3 010102 26 18 59 18 1.2 13 10 3 010103 26 18 59 18 1.2 13 10 3 1A2 Industry 030100 574 19 95 4 10 13 10 3 1A4b i Residential 020200 574 19 95 4 484 13 2000 32 1A4c i Agriculture/ Forestry 020300 574 19 95 4 88.8 13 931 13 COKE OVEN
COKE 1A2 Industry 030100 574 19 95 4 10 13 10 29
1A4b i Residential 020200 574 19 95 4 484 13 2000 291. European Environment Agency (EEA), 2007: EMEP/CORINAIR Atmospheric Emission Inventory Guidebook – 2007, prepared by the UNECE/EMEP
Task Force on Emissions Inventories and Projections. Technical Report No 16/2007. Available at: http://www.eea.europa.eu/publications/EMEPCORINAIR5 (2010-02-03).
2. NERI calculation based on plant specific data 1995-2002. 3. Sander, B. 2002. Elsam, personal communication, e-mail 17-05-2002. 4. Miljøstyrelsen, 2001. Luftvejledningen, Begrænsning af luftforurening fra virksomheder, Vejledning fra Miljøstyrelsen Nr. 2 2001 (Danish legislation). 5. Nikolaisen L., Nielsen C., Larsen M.G., Nielsen V. Zielke U., Kristensen J.K. & Holm-Christensen B. 1998 Halm til energiformål, Teknik – Miljø –
Økonomi, 2. udgave, 1998, Videncenter for halm og flisfyring (In Danish). 6. Jensen L. & Nielsen P.A. 1990. Emissioner fra halm- og flisfyr, dk-Teknik & Levnedsmiddelstyrelsen 1990 (In Danish). 7. Bjerrum M., 2002. Danish Technological Institute, personal communication 09-10-2002. 8. Kristensen, P. (2004) Danish Gas Technology Centre, e-mail 31-03-2004 . 9. NERI calculation based on annual environmental reports of Danish plants year 2000. 10. Risø National Laboratory home page – http://www.risoe.dk/sys/esy/emiss_e/emf25082000.xls. 11. Gruijthuijsen L.v. & Jensen J.K., 2000. Energi- og miljøoversigt, Danish Gas Technology Centre 2000 (In Danish). 12. Nielsen, M., Nielsen, O.K. & Thomsen, M. 2010c: Emissionskortlægning for decentral kraftvarme, Energinet.dk miljøprojekt nr. 07/1882. Delrapport 5.
Emissionsfaktorer og emissionsopgørelse for decentral kraftvarme, 2006. National Environmental Research Institute, University of Aarhus. 13. European Environment Agency (EEA), 2009: EMEP/EEA air pollutant emission inventory guidebook 2009. Technical guidance to prepare national
emission inventories. EEA Technical Report 9/2009 http://www.eea.europa.eu/publications/emep-eea-emission-inventory-guidebook-2009 (2010-02-03)
14. Danish Gas Technology Centre 2001, Naturgas – Energi og miljø (In Danish). 15. Same emission factors as for gas oil is assumed (NERI assumption). 16. Ref. no 13: EEA 2009 assuming same emission factor as for natural gas. 17. NERI calculation based on S content of natural gas 6mg(S)/mn
3 gas. The S content refers to the Danish natural gas transmission company Gastra (http://www.gastra.dk/dk/index.asp).
18. Estimated by NERI based on 2008 data reported by the plant owners to the electricity transmission companies and the Danish Energy Agency. NERI calculations are based on data forwarded to NERI by the Danish Energy Agency, 2009.
19. NERI calculation based on a sulphur content of 0,8 % and a retention of sulphur in ash of 5 %. The sulphur content has been assumed just below the limit value of 0,9 % (reference no. 24).
20. NERI calculation based on a sulphur content of 1 % (reference no. 24) and a retention of sulphur in ash of 5 %. 21. Christiansen, B.H., Evald, A., Baadsgaard-Jensen, J. Bülow, K. 1997. Fyring med biomassebaserede restprodukter, Miljøprojekt nr. 358, 1997, Mil-
jøstyrelsen. 22. Serup H., Falster H., Gamborg C., Gundersen P., Hansen L. Heding N., Jacobsen H.H., Kofman P., Nikolaisen L., Thomsen I.M. 1999. Træ til energi-
formål, Teknik – Miljø – Økonomi, 2. udgave, 1999, Videncenter for halm og flisfyring (In Danish). 23. NERI calculation based on a sulphur content of 0,0003 %. The approximate sulphur content is stated by Danish refineries. 24. Miljøstyrelsen, 2001.Bekendtgørelseom begrænsning af svovlindholdet i visse flydende og faste brændstoffer, Bekendtgørelse 532 af 25/05/2001
(Danish legislation).
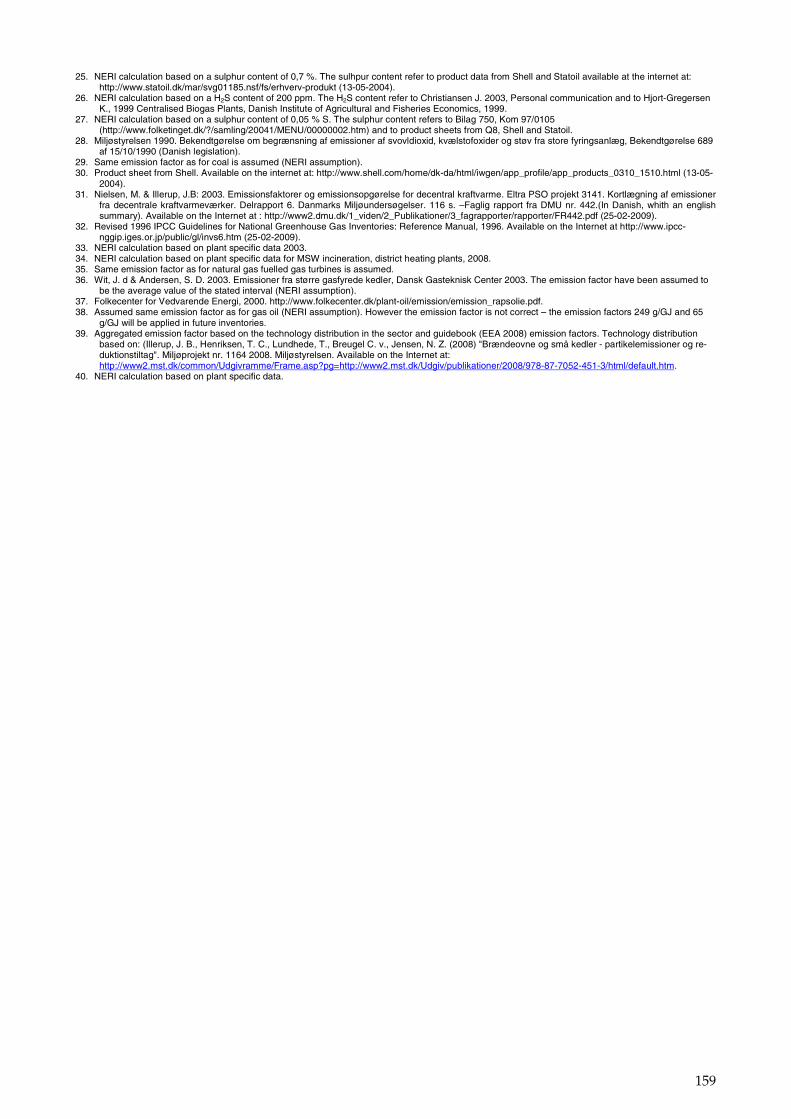
159
25. NERI calculation based on a sulphur content of 0,7 %. The sulhpur content refer to product data from Shell and Statoil available at the internet at: http://www.statoil.dk/mar/svg01185.nsf/fs/erhverv-produkt (13-05-2004).
26. NERI calculation based on a H2S content of 200 ppm. The H2S content refer to Christiansen J. 2003, Personal communication�and to Hjort-Gregersen K., 1999 Centralised Biogas Plants, Danish Institute of Agricultural and Fisheries Economics, 1999.
27. NERI calculation based on a sulphur content of 0,05 % S. The sulphur content refers to Bilag 750, Kom 97/0105 (http://www.folketinget.dk/?/samling/20041/MENU/00000002.htm) and to product sheets from Q8, Shell and Statoil.
28. Miljøstyrelsen 1990. Bekendtgørelse om begrænsning af emissioner af svovldioxid, kvælstofoxider og støv fra store fyringsanlæg, Bekendtgørelse 689 af 15/10/1990 (Danish legislation).
29. Same emission factor as for coal is assumed (NERI assumption). 30. Product sheet from Shell. Available on the internet at: http://www.shell.com/home/dk-da/html/iwgen/app_profile/app_products_0310_1510.html (13-05-
2004). 31. Nielsen, M. & Illerup, J.B: 2003. Emissionsfaktorer og emissionsopgørelse for decentral kraftvarme. Eltra PSO projekt 3141. Kortlægning af emissioner
fra decentrale kraftvarmeværker. Delrapport 6. Danmarks Miljøundersøgelser. 116 s. –Faglig rapport fra DMU nr. 442.(In Danish, whith an english summary). Available on the Internet at : http://www2.dmu.dk/1_viden/2_Publikationer/3_fagrapporter/rapporter/FR442.pdf (25-02-2009).
32. Revised 1996 IPCC Guidelines for National Greenhouse Gas Inventories: Reference Manual, 1996. Available on the Internet at http://www.ipcc-nggip.iges.or.jp/public/gl/invs6.htm (25-02-2009).
33. NERI calculation based on plant specific data 2003. 34. NERI calculation based on plant specific data for MSW incineration, district heating plants, 2008. 35. Same emission factor as for natural gas fuelled gas turbines is assumed. 36. Wit, J. d & Andersen, S. D. 2003. Emissioner fra større gasfyrede kedler, Dansk Gasteknisk Center 2003. The emission factor have been assumed to
be the average value of the stated interval (NERI assumption). 37. Folkecenter for Vedvarende Energi, 2000. http://www.folkecenter.dk/plant-oil/emission/emission_rapsolie.pdf. 38. Assumed same emission factor as for gas oil (NERI assumption). However the emission factor is not correct – the emission factors 249 g/GJ and 65
g/GJ will be applied in future inventories. 39. Aggregated emission factor based on the technology distribution in the sector and guidebook (EEA 2008) emission factors. Technology distribution
based on: (Illerup, J. B., Henriksen, T. C., Lundhede, T., Breugel C. v., Jensen, N. Z. (2008) "Brændeovne og små kedler - partikelemissioner og re-duktionstiltag". Miljøprojekt nr. 1164 2008. Miljøstyrelsen. Available on the Internet at: http://www2.mst.dk/common/Udgivramme/Frame.asp?pg=http://www2.mst.dk/Udgiv/publikationer/2008/978-87-7052-451-3/html/default.htm.
40. NERI calculation based on plant specific data.
�
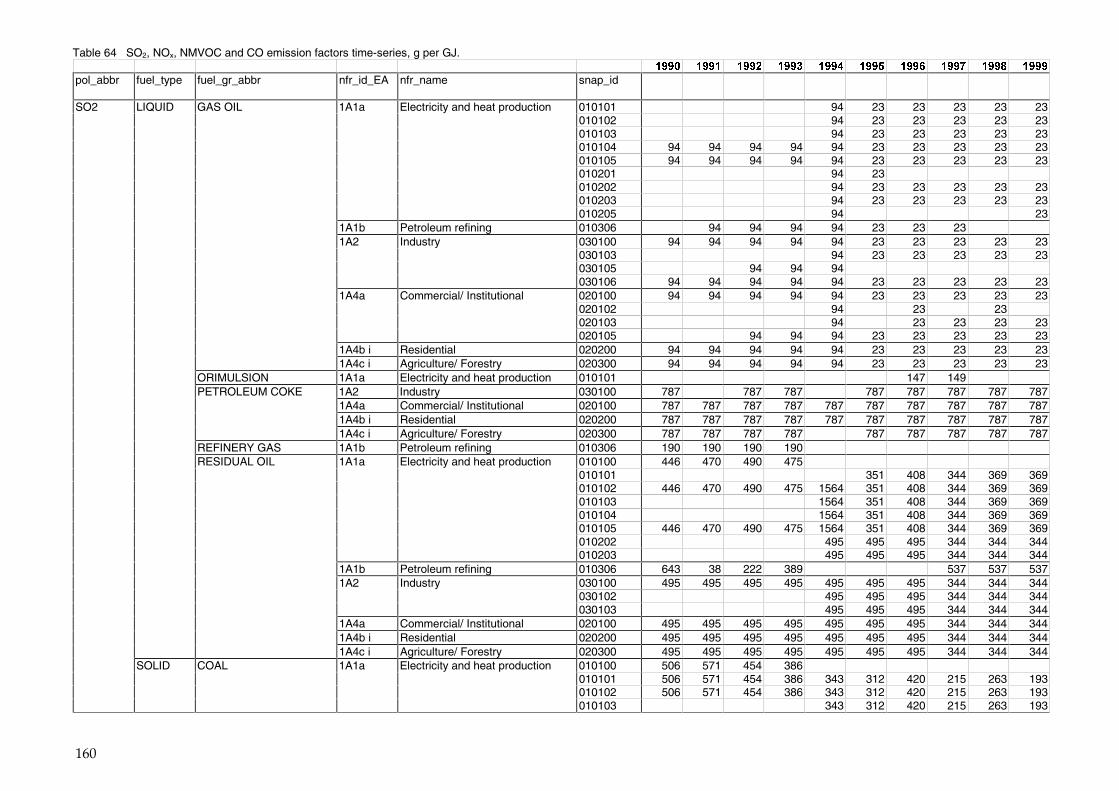
160
Table 64 SO2, NOx, NMVOC and CO emission factors time-series, g per GJ. � � � � � � ����� ����� ����� ����� ����� ����� ����� ���� ���� �����
pol_abbr fuel_type fuel_gr_abbr nfr_id_EA nfr_name snap_id Sum of 1990
Sum of 1991
Sum of 1992
Sum of 1993
Sum of 1994
Sum of 1995
Sum of 1996
Sum of 1997
Sum of 1998
Sum of 1999
SO2 LIQUID GAS OIL 1A1a Electricity and heat production 010101 94 23 23 23 23 23 010102 94 23 23 23 23 23 010103 94 23 23 23 23 23 010104 94 94 94 94 94 23 23 23 23 23 010105 94 94 94 94 94 23 23 23 23 23 010201 94 23 010202 94 23 23 23 23 23 010203 94 23 23 23 23 23 010205 94 23 1A1b Petroleum refining 010306 94 94 94 94 23 23 23 1A2 Industry 030100 94 94 94 94 94 23 23 23 23 23 030103 94 23 23 23 23 23 030105 94 94 94 030106 94 94 94 94 94 23 23 23 23 23 1A4a Commercial/ Institutional 020100 94 94 94 94 94 23 23 23 23 23 020102 94 23 23 020103 94 23 23 23 23 020105 94 94 94 23 23 23 23 23 1A4b i Residential 020200 94 94 94 94 94 23 23 23 23 23 1A4c i Agriculture/ Forestry 020300 94 94 94 94 94 23 23 23 23 23 ORIMULSION 1A1a Electricity and heat production 010101 147 149 PETROLEUM COKE 1A2 Industry 030100 787 787 787 787 787 787 787 787 1A4a Commercial/ Institutional 020100 787 787 787 787 787 787 787 787 787 787 1A4b i Residential 020200 787 787 787 787 787 787 787 787 787 787 1A4c i Agriculture/ Forestry 020300 787 787 787 787 787 787 787 787 787 REFINERY GAS 1A1b Petroleum refining 010306 190 190 190 190 RESIDUAL OIL 1A1a Electricity and heat production 010100 446 470 490 475 010101 351 408 344 369 369 010102 446 470 490 475 1564 351 408 344 369 369 010103 1564 351 408 344 369 369 010104 1564 351 408 344 369 369 010105 446 470 490 475 1564 351 408 344 369 369 010202 495 495 495 344 344 344 010203 495 495 495 344 344 344 1A1b Petroleum refining 010306 643 38 222 389 537 537 537 1A2 Industry 030100 495 495 495 495 495 495 495 344 344 344 030102 495 495 495 344 344 344 030103 495 495 495 344 344 344 1A4a Commercial/ Institutional 020100 495 495 495 495 495 495 495 344 344 344 1A4b i Residential 020200 495 495 495 495 495 495 495 344 344 344 1A4c i Agriculture/ Forestry 020300 495 495 495 495 495 495 495 344 344 344 SOLID COAL 1A1a Electricity and heat production 010100 506 571 454 386 010101 506 571 454 386 343 312 420 215 263 193 010102 506 571 454 386 343 312 420 215 263 193 010103 343 312 420 215 263 193
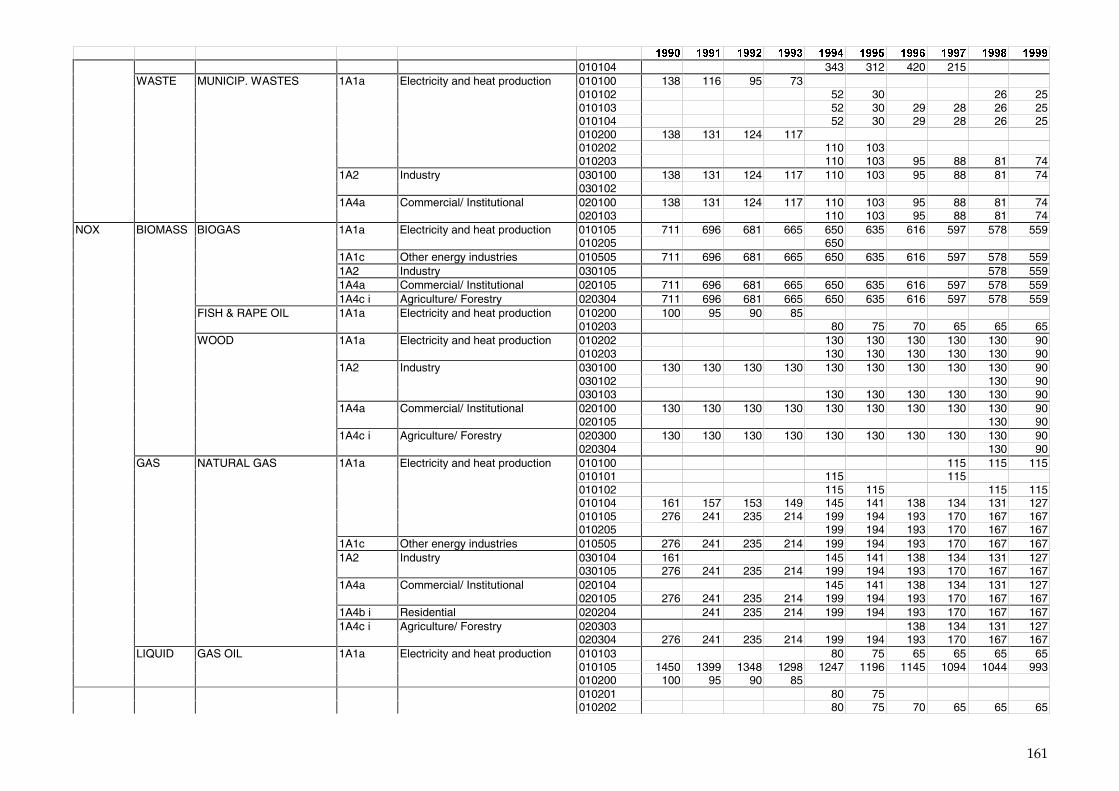
161
� � � � � � ����� ����� ����� ����� ����� ����� ����� ���� ���� �����
010104 343 312 420 215 WASTE MUNICIP. WASTES 1A1a Electricity and heat production 010100 138 116 95 73 010102 52 30 26 25 010103 52 30 29 28 26 25 010104 52 30 29 28 26 25 010200 138 131 124 117 010202 110 103 010203 110 103 95 88 81 74 1A2 Industry 030100 138 131 124 117 110 103 95 88 81 74 030102 1A4a Commercial/ Institutional 020100 138 131 124 117 110 103 95 88 81 74 020103 110 103 95 88 81 74
NOX BIOMASS BIOGAS 1A1a Electricity and heat production 010105 711 696 681 665 650 635 616 597 578 559 010205 650 1A1c Other energy industries 010505 711 696 681 665 650 635 616 597 578 559 1A2 Industry 030105 578 559 1A4a Commercial/ Institutional 020105 711 696 681 665 650 635 616 597 578 559 1A4c i Agriculture/ Forestry 020304 711 696 681 665 650 635 616 597 578 559 FISH & RAPE OIL 1A1a Electricity and heat production 010200 100 95 90 85 010203 80 75 70 65 65 65 WOOD 1A1a Electricity and heat production 010202 130 130 130 130 130 90 010203 130 130 130 130 130 90 1A2 Industry 030100 130 130 130 130 130 130 130 130 130 90 030102 130 90 030103 130 130 130 130 130 90 1A4a Commercial/ Institutional 020100 130 130 130 130 130 130 130 130 130 90 020105 130 90 1A4c i Agriculture/ Forestry 020300 130 130 130 130 130 130 130 130 130 90 020304 130 90 GAS NATURAL GAS 1A1a Electricity and heat production 010100 115 115 115 010101 115 115 010102 115 115 115 115 010104 161 157 153 149 145 141 138 134 131 127 010105 276 241 235 214 199 194 193 170 167 167 010205 199 194 193 170 167 167 1A1c Other energy industries 010505 276 241 235 214 199 194 193 170 167 167 1A2 Industry 030104 161 145 141 138 134 131 127 030105 276 241 235 214 199 194 193 170 167 167 1A4a Commercial/ Institutional 020104 145 141 138 134 131 127 020105 276 241 235 214 199 194 193 170 167 167 1A4b i Residential 020204 241 235 214 199 194 193 170 167 167 1A4c i Agriculture/ Forestry 020303 138 134 131 127 020304 276 241 235 214 199 194 193 170 167 167 LIQUID GAS OIL 1A1a Electricity and heat production 010103 80 75 65 65 65 65 010105 1450 1399 1348 1298 1247 1196 1145 1094 1044 993 010200 100 95 90 85 010201 80 75 010202 80 75 70 65 65 65
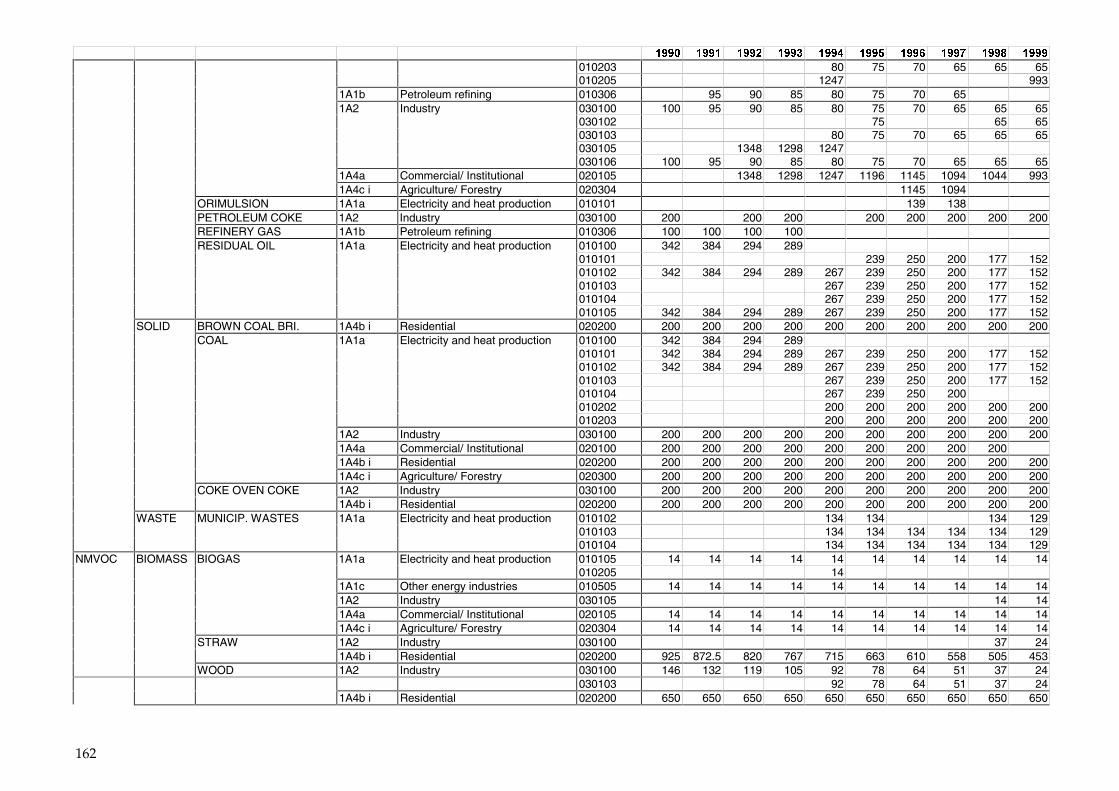
162
� � � � � � ����� ����� ����� ����� ����� ����� ����� ���� ���� �����
010203 80 75 70 65 65 65 010205 1247 993 1A1b Petroleum refining 010306 95 90 85 80 75 70 65 1A2 Industry 030100 100 95 90 85 80 75 70 65 65 65 030102 75 65 65 030103 80 75 70 65 65 65 030105 1348 1298 1247 030106 100 95 90 85 80 75 70 65 65 65 1A4a Commercial/ Institutional 020105 1348 1298 1247 1196 1145 1094 1044 993 1A4c i Agriculture/ Forestry 020304 1145 1094 ORIMULSION 1A1a Electricity and heat production 010101 139 138 PETROLEUM COKE 1A2 Industry 030100 200 200 200 200 200 200 200 200 REFINERY GAS 1A1b Petroleum refining 010306 100 100 100 100 RESIDUAL OIL 1A1a Electricity and heat production 010100 342 384 294 289 010101 239 250 200 177 152 010102 342 384 294 289 267 239 250 200 177 152 010103 267 239 250 200 177 152 010104 267 239 250 200 177 152 010105 342 384 294 289 267 239 250 200 177 152 SOLID BROWN COAL BRI. 1A4b i Residential 020200 200 200 200 200 200 200 200 200 200 200 COAL 1A1a Electricity and heat production 010100 342 384 294 289 010101 342 384 294 289 267 239 250 200 177 152 010102 342 384 294 289 267 239 250 200 177 152 010103 267 239 250 200 177 152 010104 267 239 250 200 010202 200 200 200 200 200 200 010203 200 200 200 200 200 200 1A2 Industry 030100 200 200 200 200 200 200 200 200 200 200 1A4a Commercial/ Institutional 020100 200 200 200 200 200 200 200 200 200 1A4b i Residential 020200 200 200 200 200 200 200 200 200 200 200 1A4c i Agriculture/ Forestry 020300 200 200 200 200 200 200 200 200 200 200 COKE OVEN COKE 1A2 Industry 030100 200 200 200 200 200 200 200 200 200 200 1A4b i Residential 020200 200 200 200 200 200 200 200 200 200 200 WASTE MUNICIP. WASTES 1A1a Electricity and heat production 010102 134 134 134 129 010103 134 134 134 134 134 129 010104 134 134 134 134 134 129
NMVOC BIOMASS BIOGAS 1A1a Electricity and heat production 010105 14 14 14 14 14 14 14 14 14 14 010205 14 1A1c Other energy industries 010505 14 14 14 14 14 14 14 14 14 14 1A2 Industry 030105 14 14 1A4a Commercial/ Institutional 020105 14 14 14 14 14 14 14 14 14 14 1A4c i Agriculture/ Forestry 020304 14 14 14 14 14 14 14 14 14 14 STRAW 1A2 Industry 030100 37 24 1A4b i Residential 020200 925 872.5 820 767 715 663 610 558 505 453 WOOD 1A2 Industry 030100 146 132 119 105 92 78 64 51 37 24 030103 92 78 64 51 37 24 1A4b i Residential 020200 650 650 650 650 650 650 650 650 650 650
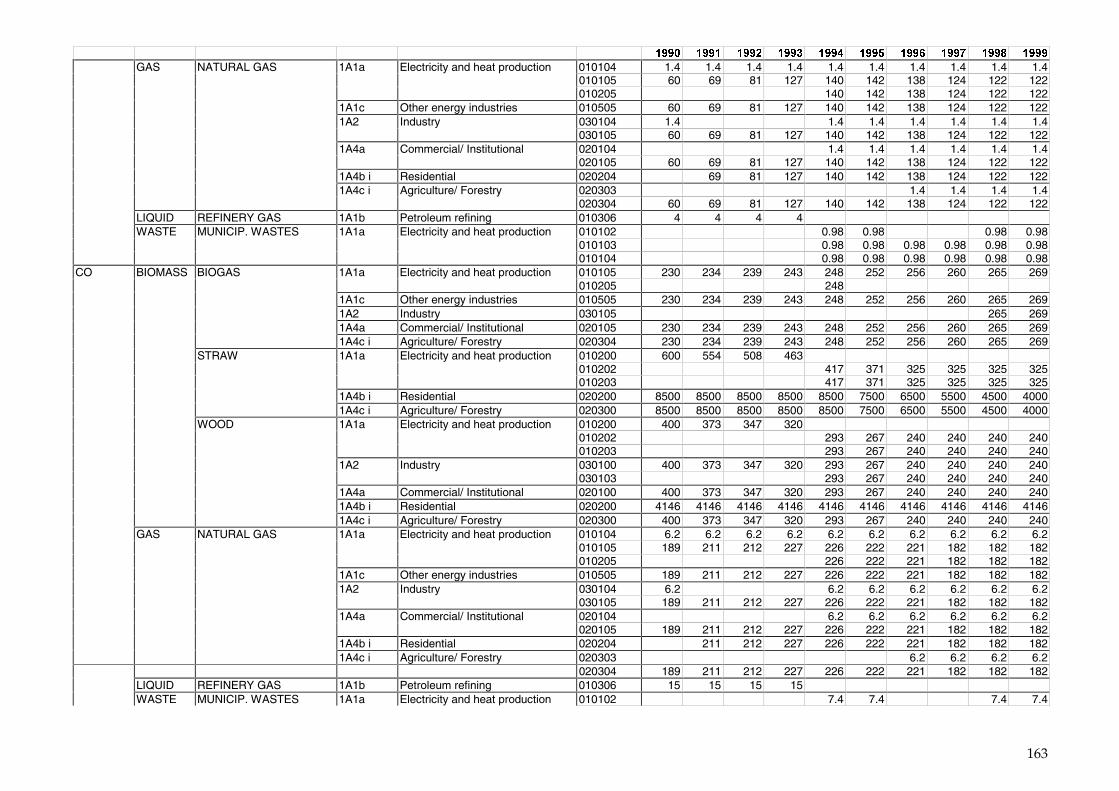
163
� � � � � � ����� ����� ����� ����� ����� ����� ����� ���� ���� �����
GAS NATURAL GAS 1A1a Electricity and heat production 010104 1.4 1.4 1.4 1.4 1.4 1.4 1.4 1.4 1.4 1.4 010105 60 69 81 127 140 142 138 124 122 122 010205 140 142 138 124 122 122 1A1c Other energy industries 010505 60 69 81 127 140 142 138 124 122 122 1A2 Industry 030104 1.4 1.4 1.4 1.4 1.4 1.4 1.4 030105 60 69 81 127 140 142 138 124 122 122 1A4a Commercial/ Institutional 020104 1.4 1.4 1.4 1.4 1.4 1.4 020105 60 69 81 127 140 142 138 124 122 122 1A4b i Residential 020204 69 81 127 140 142 138 124 122 122 1A4c i Agriculture/ Forestry 020303 1.4 1.4 1.4 1.4 020304 60 69 81 127 140 142 138 124 122 122 LIQUID REFINERY GAS 1A1b Petroleum refining 010306 4 4 4 4 WASTE MUNICIP. WASTES 1A1a Electricity and heat production 010102 0.98 0.98 0.98 0.98 010103 0.98 0.98 0.98 0.98 0.98 0.98 010104 0.98 0.98 0.98 0.98 0.98 0.98
CO BIOMASS BIOGAS 1A1a Electricity and heat production 010105 230 234 239 243 248 252 256 260 265 269 010205 248 1A1c Other energy industries 010505 230 234 239 243 248 252 256 260 265 269 1A2 Industry 030105 265 269 1A4a Commercial/ Institutional 020105 230 234 239 243 248 252 256 260 265 269 1A4c i Agriculture/ Forestry 020304 230 234 239 243 248 252 256 260 265 269 STRAW 1A1a Electricity and heat production 010200 600 554 508 463 010202 417 371 325 325 325 325 010203 417 371 325 325 325 325 1A4b i Residential 020200 8500 8500 8500 8500 8500 7500 6500 5500 4500 4000 1A4c i Agriculture/ Forestry 020300 8500 8500 8500 8500 8500 7500 6500 5500 4500 4000 WOOD 1A1a Electricity and heat production 010200 400 373 347 320 010202 293 267 240 240 240 240 010203 293 267 240 240 240 240 1A2 Industry 030100 400 373 347 320 293 267 240 240 240 240 030103 293 267 240 240 240 240 1A4a Commercial/ Institutional 020100 400 373 347 320 293 267 240 240 240 240 1A4b i Residential 020200 4146 4146 4146 4146 4146 4146 4146 4146 4146 4146 1A4c i Agriculture/ Forestry 020300 400 373 347 320 293 267 240 240 240 240 GAS NATURAL GAS 1A1a Electricity and heat production 010104 6.2 6.2 6.2 6.2 6.2 6.2 6.2 6.2 6.2 6.2 010105 189 211 212 227 226 222 221 182 182 182 010205 226 222 221 182 182 182 1A1c Other energy industries 010505 189 211 212 227 226 222 221 182 182 182 1A2 Industry 030104 6.2 6.2 6.2 6.2 6.2 6.2 6.2 030105 189 211 212 227 226 222 221 182 182 182 1A4a Commercial/ Institutional 020104 6.2 6.2 6.2 6.2 6.2 6.2 020105 189 211 212 227 226 222 221 182 182 182 1A4b i Residential 020204 211 212 227 226 222 221 182 182 182 1A4c i Agriculture/ Forestry 020303 6.2 6.2 6.2 6.2 020304 189 211 212 227 226 222 221 182 182 182 LIQUID REFINERY GAS 1A1b Petroleum refining 010306 15 15 15 15 WASTE MUNICIP. WASTES 1A1a Electricity and heat production 010102 7.4 7.4 7.4 7.4
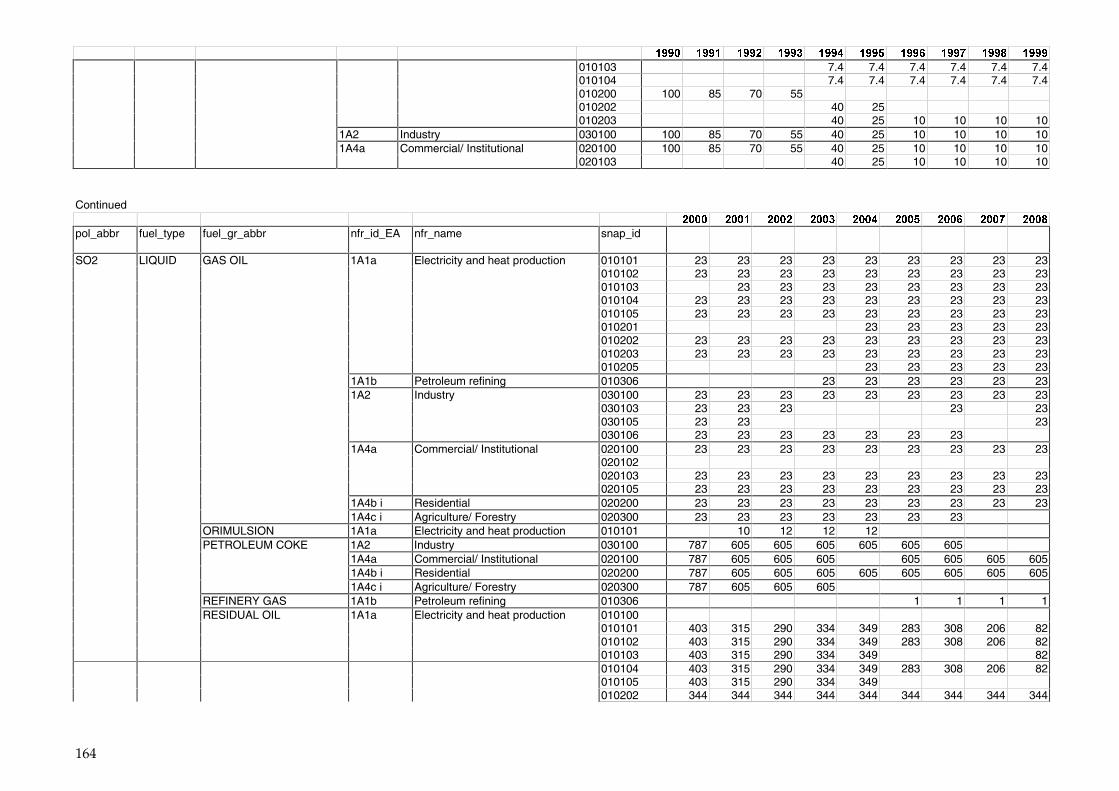
164
� � � � � � ����� ����� ����� ����� ����� ����� ����� ���� ���� �����
010103 7.4 7.4 7.4 7.4 7.4 7.4 010104 7.4 7.4 7.4 7.4 7.4 7.4 010200 100 85 70 55 010202 40 25 010203 40 25 10 10 10 10 1A2 Industry 030100 100 85 70 55 40 25 10 10 10 10 1A4a Commercial/ Institutional 020100 100 85 70 55 40 25 10 10 10 10 020103 40 25 10 10 10 10
Continued
� � � � � � ����� ����� ����� ����� ����� ����� ����� ���� ����
pol_abbr fuel_type fuel_gr_abbr nfr_id_EA nfr_name snap_id Sum of 2000
Sum of 2001
Sum of 2002
Sum of 2003
Sum of 2004
Sum of 2005
Sum of 2006
Sum of 2007
Sum of 2008
SO2 LIQUID GAS OIL 1A1a Electricity and heat production 010101 23 23 23 23 23 23 23 23 23 010102 23 23 23 23 23 23 23 23 23 010103 23 23 23 23 23 23 23 23 010104 23 23 23 23 23 23 23 23 23 010105 23 23 23 23 23 23 23 23 23 010201 23 23 23 23 23 010202 23 23 23 23 23 23 23 23 23 010203 23 23 23 23 23 23 23 23 23 010205 23 23 23 23 23 1A1b Petroleum refining 010306 23 23 23 23 23 23 1A2 Industry 030100 23 23 23 23 23 23 23 23 23 030103 23 23 23 23 23 030105 23 23 23 030106 23 23 23 23 23 23 23 1A4a Commercial/ Institutional 020100 23 23 23 23 23 23 23 23 23 020102 020103 23 23 23 23 23 23 23 23 23 020105 23 23 23 23 23 23 23 23 23 1A4b i Residential 020200 23 23 23 23 23 23 23 23 23 1A4c i Agriculture/ Forestry 020300 23 23 23 23 23 23 23 ORIMULSION 1A1a Electricity and heat production 010101 10 12 12 12 PETROLEUM COKE 1A2 Industry 030100 787 605 605 605 605 605 605 1A4a Commercial/ Institutional 020100 787 605 605 605 605 605 605 605 1A4b i Residential 020200 787 605 605 605 605 605 605 605 605 1A4c i Agriculture/ Forestry 020300 787 605 605 605 REFINERY GAS 1A1b Petroleum refining 010306 1 1 1 1 RESIDUAL OIL 1A1a Electricity and heat production 010100 010101 403 315 290 334 349 283 308 206 82 010102 403 315 290 334 349 283 308 206 82 010103 403 315 290 334 349 82 010104 403 315 290 334 349 283 308 206 82 010105 403 315 290 334 349 010202 344 344 344 344 344 344 344 344 344
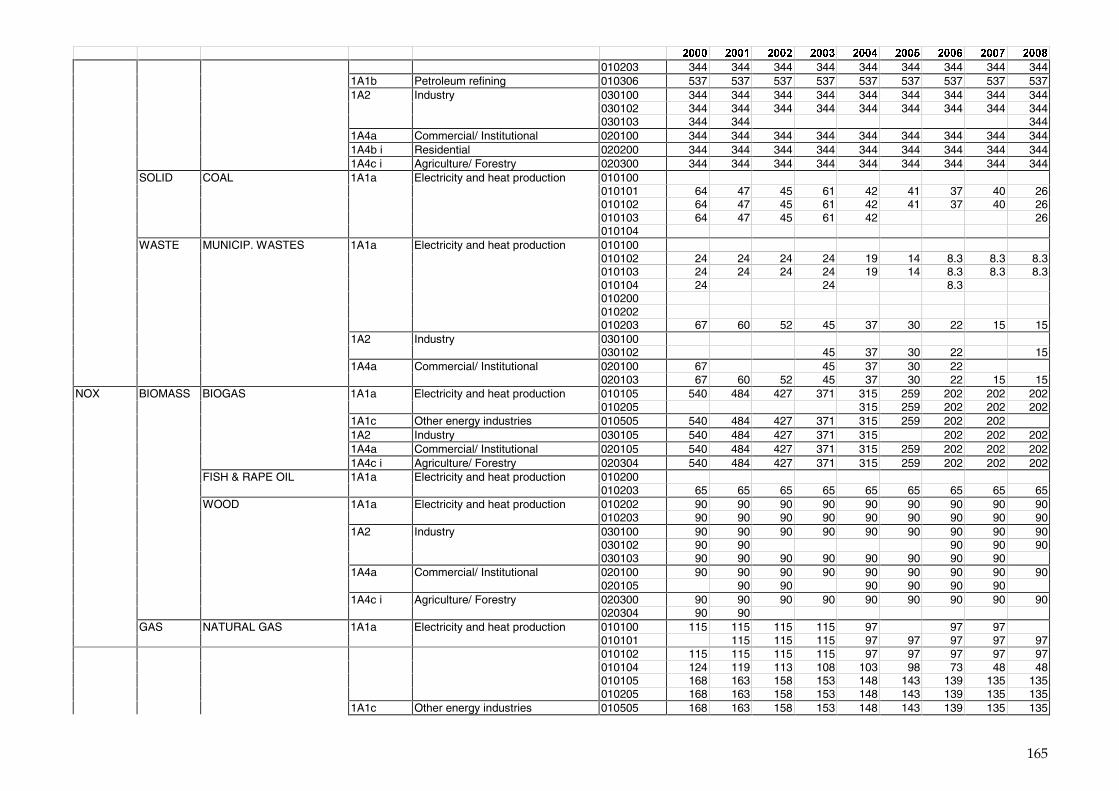
165
� � � � � � ����� ����� ����� ����� ����� ����� ����� ���� ����
010203 344 344 344 344 344 344 344 344 344 1A1b Petroleum refining 010306 537 537 537 537 537 537 537 537 537 1A2 Industry 030100 344 344 344 344 344 344 344 344 344 030102 344 344 344 344 344 344 344 344 344 030103 344 344 344 1A4a Commercial/ Institutional 020100 344 344 344 344 344 344 344 344 344 1A4b i Residential 020200 344 344 344 344 344 344 344 344 344 1A4c i Agriculture/ Forestry 020300 344 344 344 344 344 344 344 344 344 SOLID COAL 1A1a Electricity and heat production 010100 010101 64 47 45 61 42 41 37 40 26 010102 64 47 45 61 42 41 37 40 26 010103 64 47 45 61 42 26 010104 WASTE MUNICIP. WASTES 1A1a Electricity and heat production 010100 010102 24 24 24 24 19 14 8.3 8.3 8.3 010103 24 24 24 24 19 14 8.3 8.3 8.3 010104 24 24 8.3 010200 010202 010203 67 60 52 45 37 30 22 15 15 1A2 Industry 030100 030102 45 37 30 22 15 1A4a Commercial/ Institutional 020100 67 45 37 30 22 020103 67 60 52 45 37 30 22 15 15
NOX BIOMASS BIOGAS 1A1a Electricity and heat production 010105 540 484 427 371 315 259 202 202 202 010205 315 259 202 202 202 1A1c Other energy industries 010505 540 484 427 371 315 259 202 202 1A2 Industry 030105 540 484 427 371 315 202 202 202 1A4a Commercial/ Institutional 020105 540 484 427 371 315 259 202 202 202 1A4c i Agriculture/ Forestry 020304 540 484 427 371 315 259 202 202 202 FISH & RAPE OIL 1A1a Electricity and heat production 010200 010203 65 65 65 65 65 65 65 65 65 WOOD 1A1a Electricity and heat production 010202 90 90 90 90 90 90 90 90 90 010203 90 90 90 90 90 90 90 90 90 1A2 Industry 030100 90 90 90 90 90 90 90 90 90 030102 90 90 90 90 90 030103 90 90 90 90 90 90 90 90 1A4a Commercial/ Institutional 020100 90 90 90 90 90 90 90 90 90 020105 90 90 90 90 90 90 1A4c i Agriculture/ Forestry 020300 90 90 90 90 90 90 90 90 90 020304 90 90 GAS NATURAL GAS 1A1a Electricity and heat production 010100 115 115 115 115 97 97 97 010101 115 115 115 97 97 97 97 97 010102 115 115 115 115 97 97 97 97 97 010104 124 119 113 108 103 98 73 48 48 010105 168 163 158 153 148 143 139 135 135 010205 168 163 158 153 148 143 139 135 135 1A1c Other energy industries 010505 168 163 158 153 148 143 139 135 135
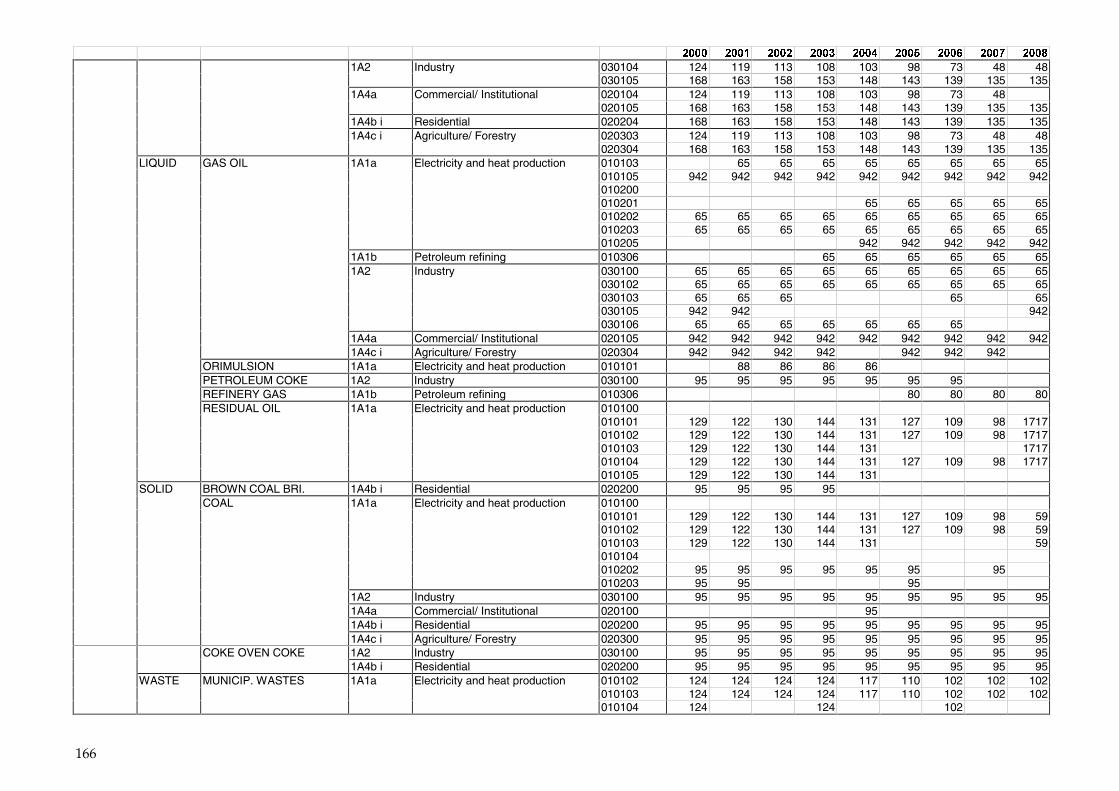
166
� � � � � � ����� ����� ����� ����� ����� ����� ����� ���� ����
1A2 Industry 030104 124 119 113 108 103 98 73 48 48 030105 168 163 158 153 148 143 139 135 135 1A4a Commercial/ Institutional 020104 124 119 113 108 103 98 73 48 020105 168 163 158 153 148 143 139 135 135 1A4b i Residential 020204 168 163 158 153 148 143 139 135 135 1A4c i Agriculture/ Forestry 020303 124 119 113 108 103 98 73 48 48 020304 168 163 158 153 148 143 139 135 135 LIQUID GAS OIL 1A1a Electricity and heat production 010103 65 65 65 65 65 65 65 65 010105 942 942 942 942 942 942 942 942 942 010200 010201 65 65 65 65 65 010202 65 65 65 65 65 65 65 65 65 010203 65 65 65 65 65 65 65 65 65 010205 942 942 942 942 942 1A1b Petroleum refining 010306 65 65 65 65 65 65 1A2 Industry 030100 65 65 65 65 65 65 65 65 65 030102 65 65 65 65 65 65 65 65 65 030103 65 65 65 65 65 030105 942 942 942 030106 65 65 65 65 65 65 65 1A4a Commercial/ Institutional 020105 942 942 942 942 942 942 942 942 942 1A4c i Agriculture/ Forestry 020304 942 942 942 942 942 942 942 ORIMULSION 1A1a Electricity and heat production 010101 88 86 86 86 PETROLEUM COKE 1A2 Industry 030100 95 95 95 95 95 95 95 REFINERY GAS 1A1b Petroleum refining 010306 80 80 80 80 RESIDUAL OIL 1A1a Electricity and heat production 010100 010101 129 122 130 144 131 127 109 98 1717 010102 129 122 130 144 131 127 109 98 1717 010103 129 122 130 144 131 1717 010104 129 122 130 144 131 127 109 98 1717 010105 129 122 130 144 131 SOLID BROWN COAL BRI. 1A4b i Residential 020200 95 95 95 95 COAL 1A1a Electricity and heat production 010100 010101 129 122 130 144 131 127 109 98 59 010102 129 122 130 144 131 127 109 98 59 010103 129 122 130 144 131 59 010104 010202 95 95 95 95 95 95 95 010203 95 95 95 1A2 Industry 030100 95 95 95 95 95 95 95 95 95 1A4a Commercial/ Institutional 020100 95 1A4b i Residential 020200 95 95 95 95 95 95 95 95 95 1A4c i Agriculture/ Forestry 020300 95 95 95 95 95 95 95 95 95 COKE OVEN COKE 1A2 Industry 030100 95 95 95 95 95 95 95 95 95 1A4b i Residential 020200 95 95 95 95 95 95 95 95 95 WASTE MUNICIP. WASTES 1A1a Electricity and heat production 010102 124 124 124 124 117 110 102 102 102 010103 124 124 124 124 117 110 102 102 102 010104 124 124 102
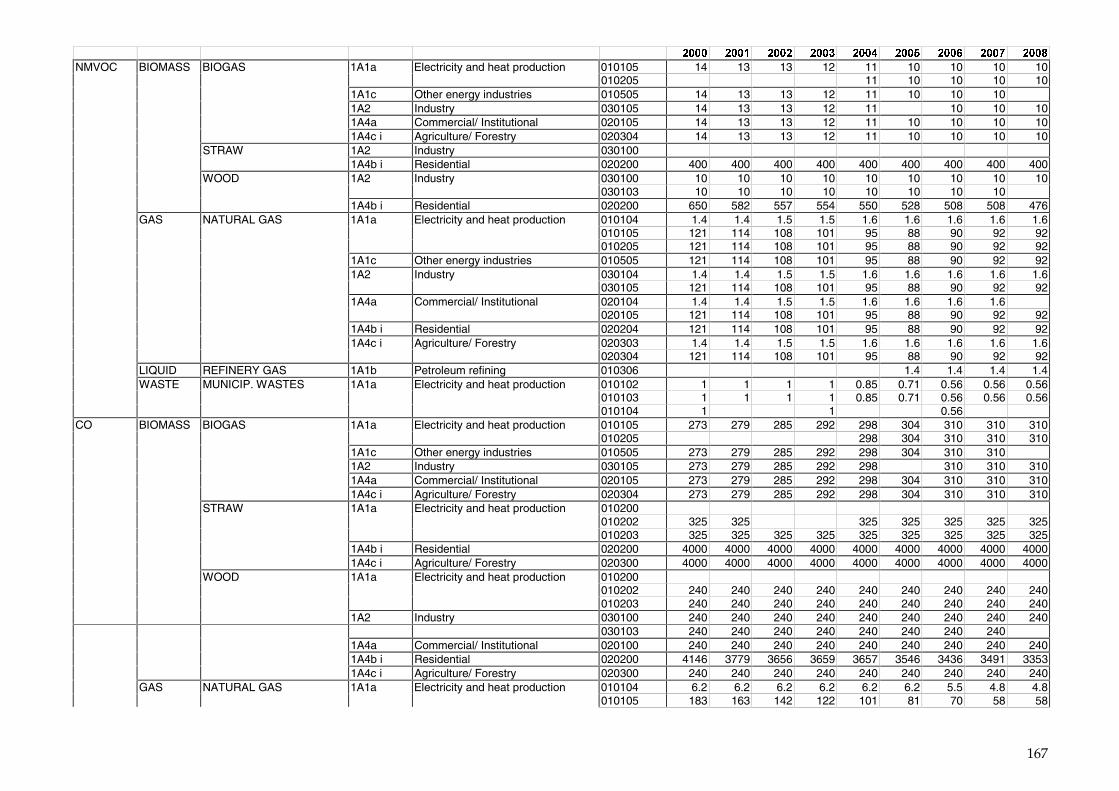
167
� � � � � � ����� ����� ����� ����� ����� ����� ����� ���� ����
NMVOC BIOMASS BIOGAS 1A1a Electricity and heat production 010105 14 13 13 12 11 10 10 10 10 010205 11 10 10 10 10 1A1c Other energy industries 010505 14 13 13 12 11 10 10 10 1A2 Industry 030105 14 13 13 12 11 10 10 10 1A4a Commercial/ Institutional 020105 14 13 13 12 11 10 10 10 10 1A4c i Agriculture/ Forestry 020304 14 13 13 12 11 10 10 10 10 STRAW 1A2 Industry 030100 1A4b i Residential 020200 400 400 400 400 400 400 400 400 400 WOOD 1A2 Industry 030100 10 10 10 10 10 10 10 10 10 030103 10 10 10 10 10 10 10 10 1A4b i Residential 020200 650 582 557 554 550 528 508 508 476 GAS NATURAL GAS 1A1a Electricity and heat production 010104 1.4 1.4 1.5 1.5 1.6 1.6 1.6 1.6 1.6 010105 121 114 108 101 95 88 90 92 92 010205 121 114 108 101 95 88 90 92 92 1A1c Other energy industries 010505 121 114 108 101 95 88 90 92 92 1A2 Industry 030104 1.4 1.4 1.5 1.5 1.6 1.6 1.6 1.6 1.6 030105 121 114 108 101 95 88 90 92 92 1A4a Commercial/ Institutional 020104 1.4 1.4 1.5 1.5 1.6 1.6 1.6 1.6 020105 121 114 108 101 95 88 90 92 92 1A4b i Residential 020204 121 114 108 101 95 88 90 92 92 1A4c i Agriculture/ Forestry 020303 1.4 1.4 1.5 1.5 1.6 1.6 1.6 1.6 1.6 020304 121 114 108 101 95 88 90 92 92 LIQUID REFINERY GAS 1A1b Petroleum refining 010306 1.4 1.4 1.4 1.4 WASTE MUNICIP. WASTES 1A1a Electricity and heat production 010102 1 1 1 1 0.85 0.71 0.56 0.56 0.56 010103 1 1 1 1 0.85 0.71 0.56 0.56 0.56 010104 1 1 0.56
CO BIOMASS BIOGAS 1A1a Electricity and heat production 010105 273 279 285 292 298 304 310 310 310 010205 298 304 310 310 310 1A1c Other energy industries 010505 273 279 285 292 298 304 310 310 1A2 Industry 030105 273 279 285 292 298 310 310 310 1A4a Commercial/ Institutional 020105 273 279 285 292 298 304 310 310 310 1A4c i Agriculture/ Forestry 020304 273 279 285 292 298 304 310 310 310 STRAW 1A1a Electricity and heat production 010200 010202 325 325 325 325 325 325 325 010203 325 325 325 325 325 325 325 325 325 1A4b i Residential 020200 4000 4000 4000 4000 4000 4000 4000 4000 4000 1A4c i Agriculture/ Forestry 020300 4000 4000 4000 4000 4000 4000 4000 4000 4000 WOOD 1A1a Electricity and heat production 010200 010202 240 240 240 240 240 240 240 240 240 010203 240 240 240 240 240 240 240 240 240 1A2 Industry 030100 240 240 240 240 240 240 240 240 240 030103 240 240 240 240 240 240 240 240 1A4a Commercial/ Institutional 020100 240 240 240 240 240 240 240 240 240 1A4b i Residential 020200 4146 3779 3656 3659 3657 3546 3436 3491 3353 1A4c i Agriculture/ Forestry 020300 240 240 240 240 240 240 240 240 240 GAS NATURAL GAS 1A1a Electricity and heat production 010104 6.2 6.2 6.2 6.2 6.2 6.2 5.5 4.8 4.8 010105 183 163 142 122 101 81 70 58 58
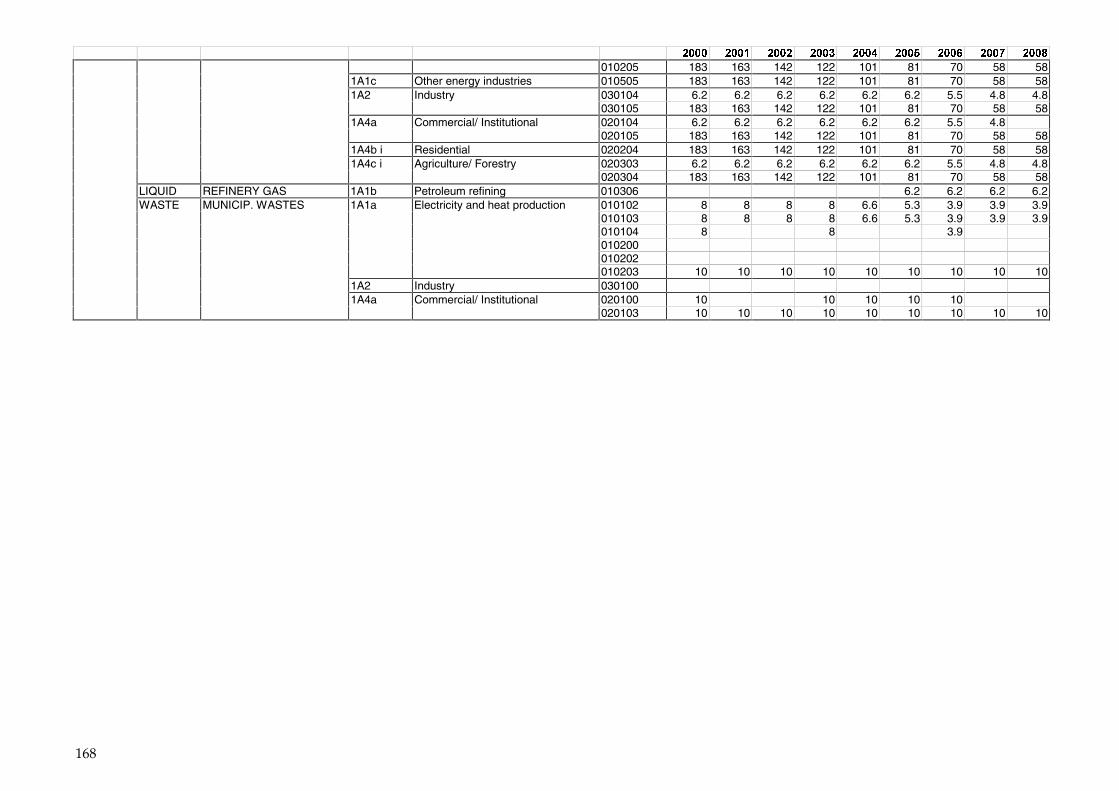
168
� � � � � � ����� ����� ����� ����� ����� ����� ����� ���� ����
010205 183 163 142 122 101 81 70 58 58 1A1c Other energy industries 010505 183 163 142 122 101 81 70 58 58 1A2 Industry 030104 6.2 6.2 6.2 6.2 6.2 6.2 5.5 4.8 4.8 030105 183 163 142 122 101 81 70 58 58 1A4a Commercial/ Institutional 020104 6.2 6.2 6.2 6.2 6.2 6.2 5.5 4.8 020105 183 163 142 122 101 81 70 58 58 1A4b i Residential 020204 183 163 142 122 101 81 70 58 58 1A4c i Agriculture/ Forestry 020303 6.2 6.2 6.2 6.2 6.2 6.2 5.5 4.8 4.8 020304 183 163 142 122 101 81 70 58 58 LIQUID REFINERY GAS 1A1b Petroleum refining 010306 6.2 6.2 6.2 6.2 WASTE MUNICIP. WASTES 1A1a Electricity and heat production 010102 8 8 8 8 6.6 5.3 3.9 3.9 3.9 010103 8 8 8 8 6.6 5.3 3.9 3.9 3.9 010104 8 8 3.9 010200 010202 010203 10 10 10 10 10 10 10 10 10 1A2 Industry 030100 1A4a Commercial/ Institutional 020100 10 10 10 10 10 020103 10 10 10 10 10 10 10 10 10
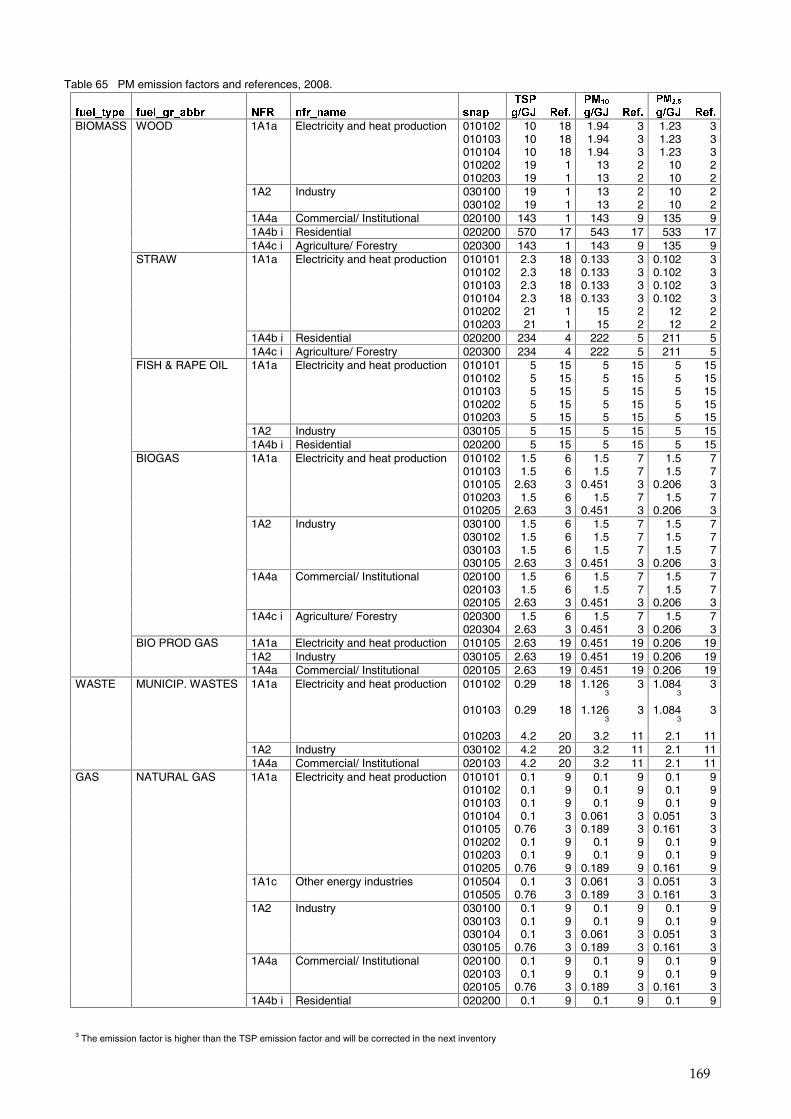
169
Table 65 PM emission factors and references, 2008. �� �� �� �� �� ���� � ������ � ������� �
�������� ���� ������ ���� �������� ����� ���� ����� ���� ����� ���� �����
BIOMASS WOOD 1A1a Electricity and heat production 010102 10 18 1.94 3 1.23 3 010103 10 18 1.94 3 1.23 3 010104 10 18 1.94 3 1.23 3 010202 19 1 13 2 10 2 010203 19 1 13 2 10 2 1A2 Industry 030100 19 1 13 2 10 2 030102 19 1 13 2 10 2 1A4a Commercial/ Institutional 020100 143 1 143 9 135 9 1A4b i Residential 020200 570 17 543 17 533 17 1A4c i Agriculture/ Forestry 020300 143 1 143 9 135 9 STRAW 1A1a Electricity and heat production 010101 2.3 18 0.133 3 0.102 3 010102 2.3 18 0.133 3 0.102 3 010103 2.3 18 0.133 3 0.102 3 010104 2.3 18 0.133 3 0.102 3 010202 21 1 15 2 12 2 010203 21 1 15 2 12 2 1A4b i Residential 020200 234 4 222 5 211 5 1A4c i Agriculture/ Forestry 020300 234 4 222 5 211 5 FISH & RAPE OIL 1A1a Electricity and heat production 010101 5 15 5 15 5 15 010102 5 15 5 15 5 15 010103 5 15 5 15 5 15 010202 5 15 5 15 5 15 010203 5 15 5 15 5 15 1A2 Industry 030105 5 15 5 15 5 15 1A4b i Residential 020200 5 15 5 15 5 15 BIOGAS 1A1a Electricity and heat production 010102 1.5 6 1.5 7 1.5 7 010103 1.5 6 1.5 7 1.5 7 010105 2.63 3 0.451 3 0.206 3 010203 1.5 6 1.5 7 1.5 7 010205 2.63 3 0.451 3 0.206 3 1A2 Industry 030100 1.5 6 1.5 7 1.5 7 030102 1.5 6 1.5 7 1.5 7 030103 1.5 6 1.5 7 1.5 7 030105 2.63 3 0.451 3 0.206 3 1A4a Commercial/ Institutional 020100 1.5 6 1.5 7 1.5 7 020103 1.5 6 1.5 7 1.5 7 020105 2.63 3 0.451 3 0.206 3 1A4c i Agriculture/ Forestry 020300 1.5 6 1.5 7 1.5 7 020304 2.63 3 0.451 3 0.206 3 BIO PROD GAS 1A1a Electricity and heat production 010105 2.63 19 0.451 19 0.206 19 1A2 Industry 030105 2.63 19 0.451 19 0.206 19 1A4a Commercial/ Institutional 020105 2.63 19 0.451 19 0.206 19 WASTE MUNICIP. WASTES 1A1a Electricity and heat production 010102 0.29 18 1.126
3 3 1.084
3 3
010103 0.29 18 1.1263
3 1.0843
3
010203 4.2 20 3.2 11 2.1 11 1A2 Industry 030102 4.2 20 3.2 11 2.1 11 1A4a Commercial/ Institutional 020103 4.2 20 3.2 11 2.1 11 GAS NATURAL GAS 1A1a Electricity and heat production 010101 0.1 9 0.1 9 0.1 9 010102 0.1 9 0.1 9 0.1 9 010103 0.1 9 0.1 9 0.1 9 010104 0.1 3 0.061 3 0.051 3 010105 0.76 3 0.189 3 0.161 3 010202 0.1 9 0.1 9 0.1 9 010203 0.1 9 0.1 9 0.1 9 010205 0.76 9 0.189 9 0.161 9 1A1c Other energy industries 010504 0.1 3 0.061 3 0.051 3 010505 0.76 3 0.189 3 0.161 3 1A2 Industry 030100 0.1 9 0.1 9 0.1 9 030103 0.1 9 0.1 9 0.1 9 030104 0.1 3 0.061 3 0.051 3 030105 0.76 3 0.189 3 0.161 3 1A4a Commercial/ Institutional 020100 0.1 9 0.1 9 0.1 9 020103 0.1 9 0.1 9 0.1 9 020105 0.76 3 0.189 3 0.161 3 1A4b i Residential 020200 0.1 9 0.1 9 0.1 9
3 The emission factor is higher than the TSP emission factor and will be corrected in the next inventory
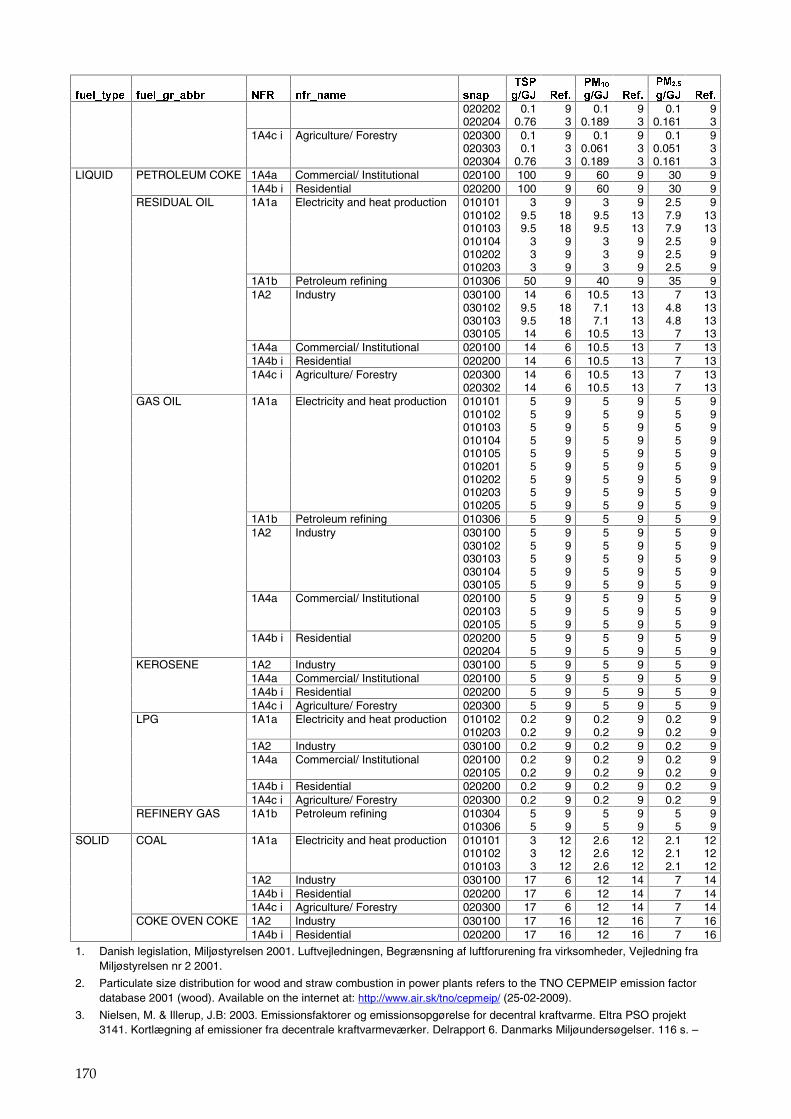
170
�� �� �� �� �� ���� � ������ � ������� �
�������� ���� ������ ���� �������� ����� ���� ����� ���� ����� ���� �����
020202 0.1 9 0.1 9 0.1 9 020204 0.76 3 0.189 3 0.161 3 1A4c i Agriculture/ Forestry 020300 0.1 9 0.1 9 0.1 9 020303 0.1 3 0.061 3 0.051 3 020304 0.76 3 0.189 3 0.161 3 LIQUID PETROLEUM COKE 1A4a Commercial/ Institutional 020100 100 9 60 9 30 9 1A4b i Residential 020200 100 9 60 9 30 9 RESIDUAL OIL 1A1a Electricity and heat production 010101 3 9 3 9 2.5 9 010102 9.5 18 9.5 13 7.9 13 010103 9.5 18 9.5 13 7.9 13 010104 3 9 3 9 2.5 9 010202 3 9 3 9 2.5 9 010203 3 9 3 9 2.5 9 1A1b Petroleum refining 010306 50 9 40 9 35 9 1A2 Industry 030100 14 6 10.5 13 7 13 030102 9.5 18 7.1 13 4.8 13 030103 9.5 18 7.1 13 4.8 13 030105 14 6 10.5 13 7 13 1A4a Commercial/ Institutional 020100 14 6 10.5 13 7 13 1A4b i Residential 020200 14 6 10.5 13 7 13 1A4c i Agriculture/ Forestry 020300 14 6 10.5 13 7 13 020302 14 6 10.5 13 7 13 GAS OIL 1A1a Electricity and heat production 010101 5 9 5 9 5 9 010102 5 9 5 9 5 9 010103 5 9 5 9 5 9 010104 5 9 5 9 5 9 010105 5 9 5 9 5 9 010201 5 9 5 9 5 9 010202 5 9 5 9 5 9 010203 5 9 5 9 5 9 010205 5 9 5 9 5 9 1A1b Petroleum refining 010306 5 9 5 9 5 9 1A2 Industry 030100 5 9 5 9 5 9 030102 5 9 5 9 5 9 030103 5 9 5 9 5 9 030104 5 9 5 9 5 9 030105 5 9 5 9 5 9 1A4a Commercial/ Institutional 020100 5 9 5 9 5 9 020103 5 9 5 9 5 9 020105 5 9 5 9 5 9 1A4b i Residential 020200 5 9 5 9 5 9 020204 5 9 5 9 5 9 KEROSENE 1A2 Industry 030100 5 9 5 9 5 9 1A4a Commercial/ Institutional 020100 5 9 5 9 5 9 1A4b i Residential 020200 5 9 5 9 5 9 1A4c i Agriculture/ Forestry 020300 5 9 5 9 5 9 LPG 1A1a Electricity and heat production 010102 0.2 9 0.2 9 0.2 9 010203 0.2 9 0.2 9 0.2 9 1A2 Industry 030100 0.2 9 0.2 9 0.2 9 1A4a Commercial/ Institutional 020100 0.2 9 0.2 9 0.2 9 020105 0.2 9 0.2 9 0.2 9 1A4b i Residential 020200 0.2 9 0.2 9 0.2 9 1A4c i Agriculture/ Forestry 020300 0.2 9 0.2 9 0.2 9 REFINERY GAS 1A1b Petroleum refining 010304 5 9 5 9 5 9 010306 5 9 5 9 5 9 SOLID COAL 1A1a Electricity and heat production 010101 3 12 2.6 12 2.1 12 010102 3 12 2.6 12 2.1 12 010103 3 12 2.6 12 2.1 12 1A2 Industry 030100 17 6 12 14 7 14 1A4b i Residential 020200 17 6 12 14 7 14 1A4c i Agriculture/ Forestry 020300 17 6 12 14 7 14 COKE OVEN COKE 1A2 Industry 030100 17 16 12 16 7 16 1A4b i Residential 020200 17 16 12 16 7 16
1. Danish legislation, Miljøstyrelsen 2001. Luftvejledningen, Begrænsning af luftforurening fra virksomheder, Vejledning fra Miljøstyrelsen nr 2 2001.
2. Particulate size distribution for wood and straw combustion in power plants refers to the TNO CEPMEIP emission factor database 2001 (wood). Available on the internet at: http://www.air.sk/tno/cepmeip/ (25-02-2009).
3. Nielsen, M. & Illerup, J.B: 2003. Emissionsfaktorer og emissionsopgørelse for decentral kraftvarme. Eltra PSO projekt 3141. Kortlægning af emissioner fra decentrale kraftvarmeværker. Delrapport 6. Danmarks Miljøundersøgelser. 116 s. –
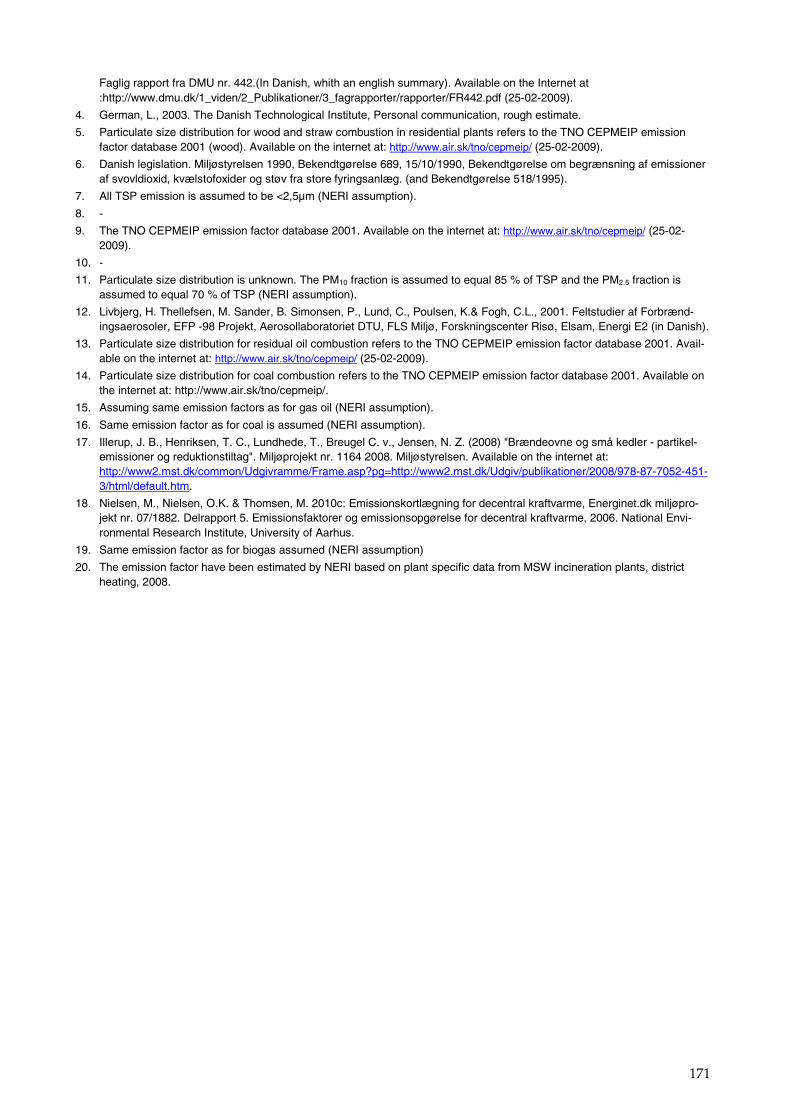
171
Faglig rapport fra DMU nr. 442.(In Danish, whith an english summary). Available on the Internet at :http://www.dmu.dk/1_viden/2_Publikationer/3_fagrapporter/rapporter/FR442.pdf (25-02-2009).
4. German, L., 2003. The Danish Technological Institute, Personal communication, rough estimate.
5. Particulate size distribution for wood and straw combustion in residential plants refers to the TNO CEPMEIP emission factor database 2001 (wood). Available on the internet at: http://www.air.sk/tno/cepmeip/ (25-02-2009).
6. Danish legislation. Miljøstyrelsen 1990, Bekendtgørelse 689, 15/10/1990, Bekendtgørelse om begrænsning af emissioner af svovldioxid, kvælstofoxider og støv fra store fyringsanlæg. (and Bekendtgørelse 518/1995).
7. All TSP emission is assumed to be <2,5µm (NERI assumption).
8. -
9. The TNO CEPMEIP emission factor database 2001. Available on the internet at: http://www.air.sk/tno/cepmeip/ (25-02-2009).
10. -
11. Particulate size distribution is unknown. The PM10 fraction is assumed to equal 85 % of TSP and the PM2.5 fraction is assumed to equal 70 % of TSP (NERI assumption).
12. Livbjerg, H. Thellefsen, M. Sander, B. Simonsen, P., Lund, C., Poulsen, K.& Fogh, C.L., 2001. Feltstudier af Forbrænd-ingsaerosoler, EFP -98 Projekt, Aerosollaboratoriet DTU, FLS Miljø, Forskningscenter Risø, Elsam, Energi E2 (in Danish).
13. Particulate size distribution for residual oil combustion refers to the TNO CEPMEIP emission factor database 2001. Avail-able on the internet at: http://www.air.sk/tno/cepmeip/ (25-02-2009).
14. Particulate size distribution for coal combustion refers to the TNO CEPMEIP emission factor database 2001. Available on the internet at: http://www.air.sk/tno/cepmeip/.
15. Assuming same emission factors as for gas oil (NERI assumption).
16. Same emission factor as for coal is assumed (NERI assumption).
17. Illerup, J. B., Henriksen, T. C., Lundhede, T., Breugel C. v., Jensen, N. Z. (2008) "Brændeovne og små kedler - partikel-emissioner og reduktionstiltag". Miljøprojekt nr. 1164 2008. Miljøstyrelsen. Available on the internet at: http://www2.mst.dk/common/Udgivramme/Frame.asp?pg=http://www2.mst.dk/Udgiv/publikationer/2008/978-87-7052-451-3/html/default.htm.
18. Nielsen, M., Nielsen, O.K. & Thomsen, M. 2010c: Emissionskortlægning for decentral kraftvarme, Energinet.dk miljøpro-jekt nr. 07/1882. Delrapport 5. Emissionsfaktorer og emissionsopgørelse for decentral kraftvarme, 2006. National Envi-ronmental Research Institute, University of Aarhus.
19. Same emission factor as for biogas assumed (NERI assumption)
20. The emission factor have been estimated by NERI based on plant specific data from MSW incineration plants, district heating, 2008.
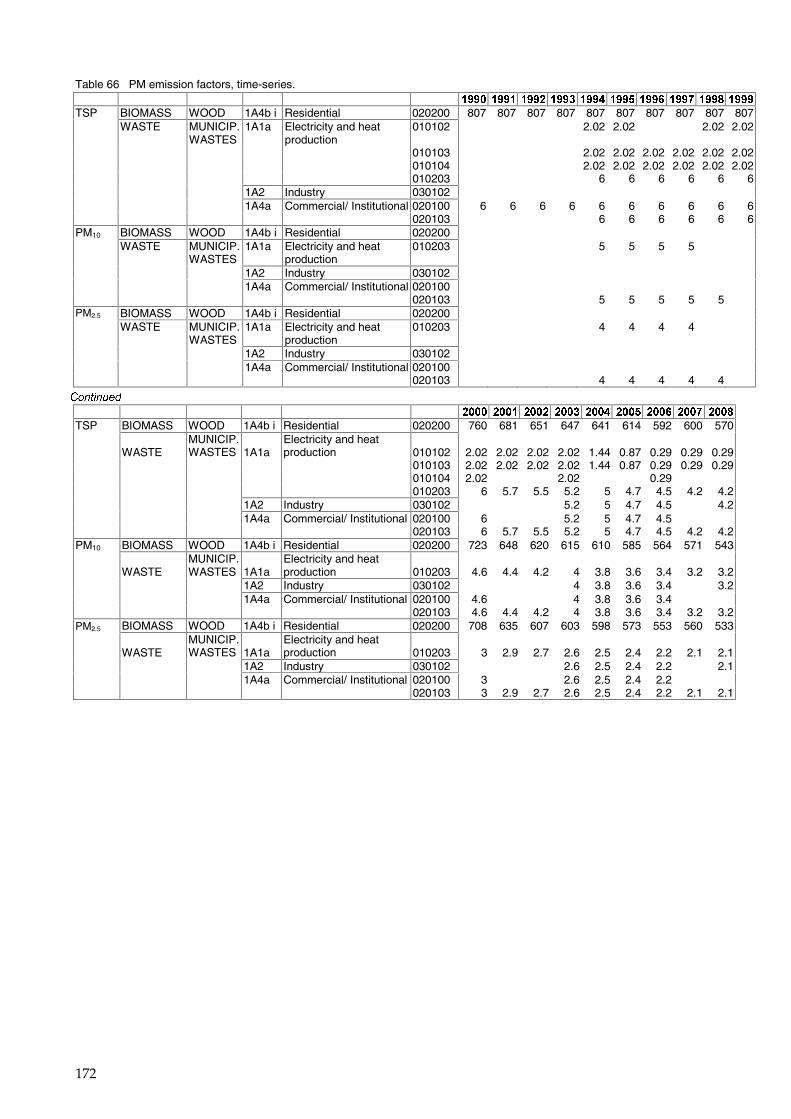
172
Table 66 PM emission factors, time-series. �� �� �� �� �� �� ����������������������� ����!����"����#����$������
TSP BIOMASS WOOD 1A4b i Residential 020200 807 807 807 807 807 807 807 807 807 807 WASTE MUNICIP.
WASTES 1A1a Electricity and heat
production 010102 2.02 2.02 2.02 2.02
010103 2.02 2.02 2.02 2.02 2.02 2.02 010104 2.02 2.02 2.02 2.02 2.02 2.02 010203 6 6 6 6 6 6 1A2 Industry 030102 1A4a Commercial/ Institutional 020100 6 6 6 6 6 6 6 6 6 6 020103 6 6 6 6 6 6 PM10 BIOMASS WOOD 1A4b i Residential 020200 WASTE MUNICIP.
WASTES 1A1a Electricity and heat
production 010203 5 5 5 5
1A2 Industry 030102 1A4a Commercial/ Institutional 020100 020103 5 5 5 5 5 PM2.5 BIOMASS WOOD 1A4b i Residential 020200 WASTE MUNICIP.
WASTES 1A1a Electricity and heat
production 010203 4 4 4 4
1A2 Industry 030102 1A4a Commercial/ Institutional 020100 020103 4 4 4 4 4
����������
�� �� �� �� �� �� ����� ����� ����� ����� ��� � ���!� ���"� ���#� ���$�
TSP BIOMASS WOOD 1A4b i Residential 020200 760 681 651 647 641 614 592 600 570
WASTE MUNICIP. WASTES 1A1a
Electricity and heat production 010102 2.02 2.02 2.02 2.02 1.44 0.87 0.29 0.29 0.29
010103 2.02 2.02 2.02 2.02 1.44 0.87 0.29 0.29 0.29 010104 2.02 2.02 0.29 010203 6 5.7 5.5 5.2 5 4.7 4.5 4.2 4.2 1A2 Industry 030102 5.2 5 4.7 4.5 4.2 1A4a Commercial/ Institutional 020100 6 5.2 5 4.7 4.5 020103 6 5.7 5.5 5.2 5 4.7 4.5 4.2 4.2 PM10 BIOMASS WOOD 1A4b i Residential 020200 723 648 620 615 610 585 564 571 543
WASTE MUNICIP. WASTES 1A1a
Electricity and heat production 010203 4.6 4.4 4.2 4 3.8 3.6 3.4 3.2 3.2
1A2 Industry 030102 4 3.8 3.6 3.4 3.2 1A4a Commercial/ Institutional 020100 4.6 4 3.8 3.6 3.4 020103 4.6 4.4 4.2 4 3.8 3.6 3.4 3.2 3.2 PM2.5 BIOMASS WOOD 1A4b i Residential 020200 708 635 607 603 598 573 553 560 533
WASTE MUNICIP. WASTES 1A1a
Electricity and heat production 010203 3 2.9 2.7 2.6 2.5 2.4 2.2 2.1 2.1
1A2 Industry 030102 2.6 2.5 2.4 2.2 2.1 1A4a Commercial/ Institutional 020100 3 2.6 2.5 2.4 2.2 020103 3 2.9 2.7 2.6 2.5 2.4 2.2 2.1 2.1
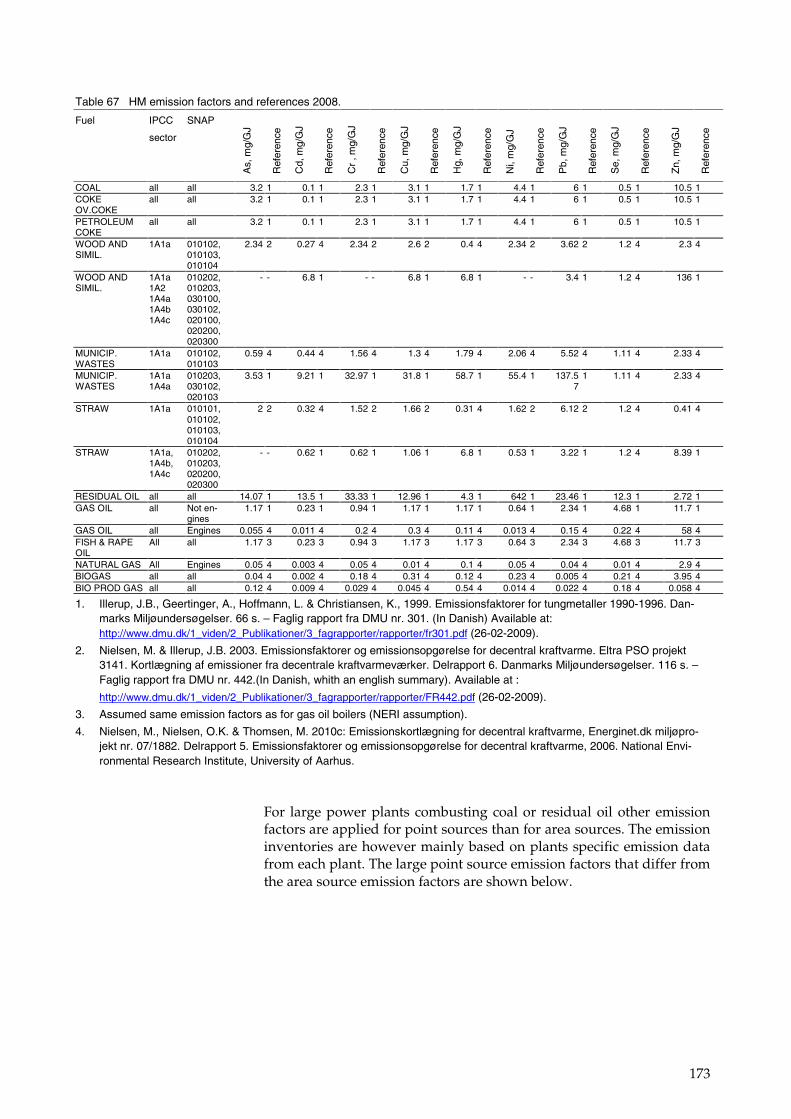
173
Table 67 HM emission factors and references 2008.
Fuel IPCC
sector
SNAP
As,
mg/
GJ
Ref
eren
ce
Cd,
mg/
GJ
Ref
eren
ce
Cr
, mg/
GJ
Ref
eren
ce
Cu,
mg/
GJ
Ref
eren
ce
Hg,
mg/
GJ
Ref
eren
ce
Ni,
mg/
GJ
Ref
eren
ce
Pb,
mg/
GJ
Ref
eren
ce
Se,
mg/
GJ
Ref
eren
ce
Zn,
mg/
GJ
Ref
eren
ce
COAL all all 3.2 1 0.1 1 2.3 1 3.1 1 1.7 1 4.4 1 6 1 0.5 1 10.5 1 COKE OV.COKE
all all 3.2 1 0.1 1 2.3 1 3.1 1 1.7 1 4.4 1 6 1 0.5 1 10.5 1
PETROLEUM COKE
all all 3.2 1 0.1 1 2.3 1 3.1 1 1.7 1 4.4 1 6 1 0.5 1 10.5 1
WOOD AND SIMIL.
1A1a 010102, 010103, 010104
2.34 2 0.27 4 2.34 2 2.6 2 0.4 4 2.34 2 3.62 2 1.2 4 2.3 4
WOOD AND SIMIL.
1A1a 1A2 1A4a 1A4b 1A4c
010202, 010203, 030100, 030102, 020100, 020200, 020300
- - 6.8 1 - - 6.8 1 6.8 1 - - 3.4 1 1.2 4 136 1
MUNICIP. WASTES
1A1a 010102, 010103
0.59 4 0.44 4 1.56 4 1.3 4 1.79 4 2.06 4 5.52 4 1.11 4 2.33 4
MUNICIP. WASTES
1A1a 1A4a
010203, 030102, 020103
3.53 1 9.21 1 32.97 1 31.8 1 58.7 1 55.4 1 137.57
1 1.11 4 2.33 4
STRAW 1A1a 010101, 010102, 010103, 010104
2 2 0.32 4 1.52 2 1.66 2 0.31 4 1.62 2 6.12 2 1.2 4 0.41 4
STRAW 1A1a, 1A4b, 1A4c
010202, 010203, 020200, 020300
- - 0.62 1 0.62 1 1.06 1 6.8 1 0.53 1 3.22 1 1.2 4 8.39 1
RESIDUAL OIL all all 14.07 1 13.5 1 33.33 1 12.96 1 4.3 1 642 1 23.46 1 12.3 1 2.72 1 GAS OIL all Not en-
gines 1.17 1 0.23 1 0.94 1 1.17 1 1.17 1 0.64 1 2.34 1 4.68 1 11.7 1
GAS OIL all Engines 0.055 4 0.011 4 0.2 4 0.3 4 0.11 4 0.013 4 0.15 4 0.22 4 58 4 FISH & RAPE OIL
All all 1.17 3 0.23 3 0.94 3 1.17 3 1.17 3 0.64 3 2.34 3 4.68 3 11.7 3
NATURAL GAS All Engines 0.05 4 0.003 4 0.05 4 0.01 4 0.1 4 0.05 4 0.04 4 0.01 4 2.9 4 BIOGAS all all 0.04 4 0.002 4 0.18 4 0.31 4 0.12 4 0.23 4 0.005 4 0.21 4 3.95 4 BIO PROD GAS all all 0.12 4 0.009 4 0.029 4 0.045 4 0.54 4 0.014 4 0.022 4 0.18 4 0.058 4
1. Illerup, J.B., Geertinger, A., Hoffmann, L. & Christiansen, K., 1999. Emissionsfaktorer for tungmetaller 1990-1996. Dan-marks Miljøundersøgelser. 66 s. – Faglig rapport fra DMU nr. 301. (In Danish) Available at: http://www.dmu.dk/1_viden/2_Publikationer/3_fagrapporter/rapporter/fr301.pdf (26-02-2009).
2. Nielsen, M. & Illerup, J.B. 2003. Emissionsfaktorer og emissionsopgørelse for decentral kraftvarme. Eltra PSO projekt 3141. Kortlægning af emissioner fra decentrale kraftvarmeværker. Delrapport 6. Danmarks Miljøundersøgelser. 116 s. –Faglig rapport fra DMU nr. 442.(In Danish, whith an english summary). Available at :
http://www.dmu.dk/1_viden/2_Publikationer/3_fagrapporter/rapporter/FR442.pdf (26-02-2009).
3. Assumed same emission factors as for gas oil boilers (NERI assumption).
4. Nielsen, M., Nielsen, O.K. & Thomsen, M. 2010c: Emissionskortlægning for decentral kraftvarme, Energinet.dk miljøpro-jekt nr. 07/1882. Delrapport 5. Emissionsfaktorer og emissionsopgørelse for decentral kraftvarme, 2006. National Envi-ronmental Research Institute, University of Aarhus.
For large power plants combusting coal or residual oil other emission factors are applied for point sources than for area sources. The emission inventories are however mainly based on plants specific emission data from each plant. The large point source emission factors that differ from the area source emission factors are shown below.
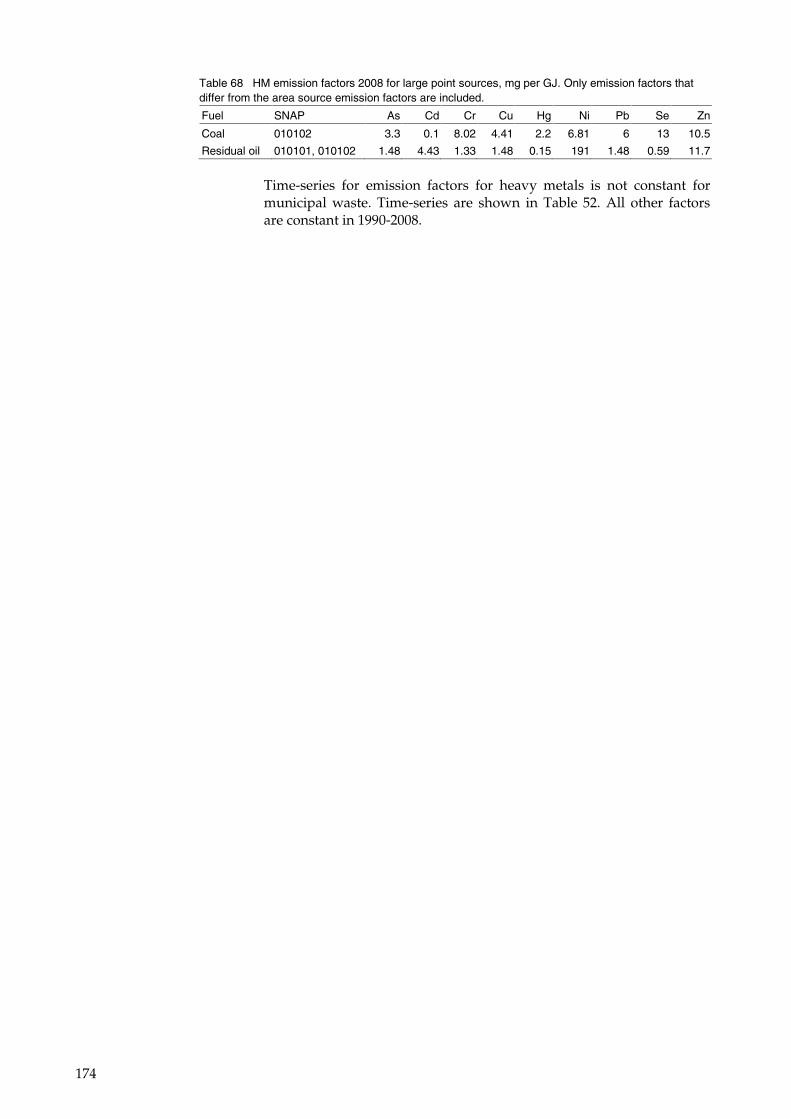
174
Table 68 HM emission factors 2008 for large point sources, mg per GJ. Only emission factors that differ from the area source emission factors are included.
Fuel SNAP As Cd Cr Cu Hg Ni Pb Se Zn
Coal 010102 3.3 0.1 8.02 4.41 2.2 6.81 6 13 10.5
Residual oil 010101, 010102 1.48 4.43 1.33 1.48 0.15 191 1.48 0.59 11.7
Time-series for emission factors for heavy metals is not constant for municipal waste. Time-series are shown in Table 52. All other factors are constant in 1990-2008.
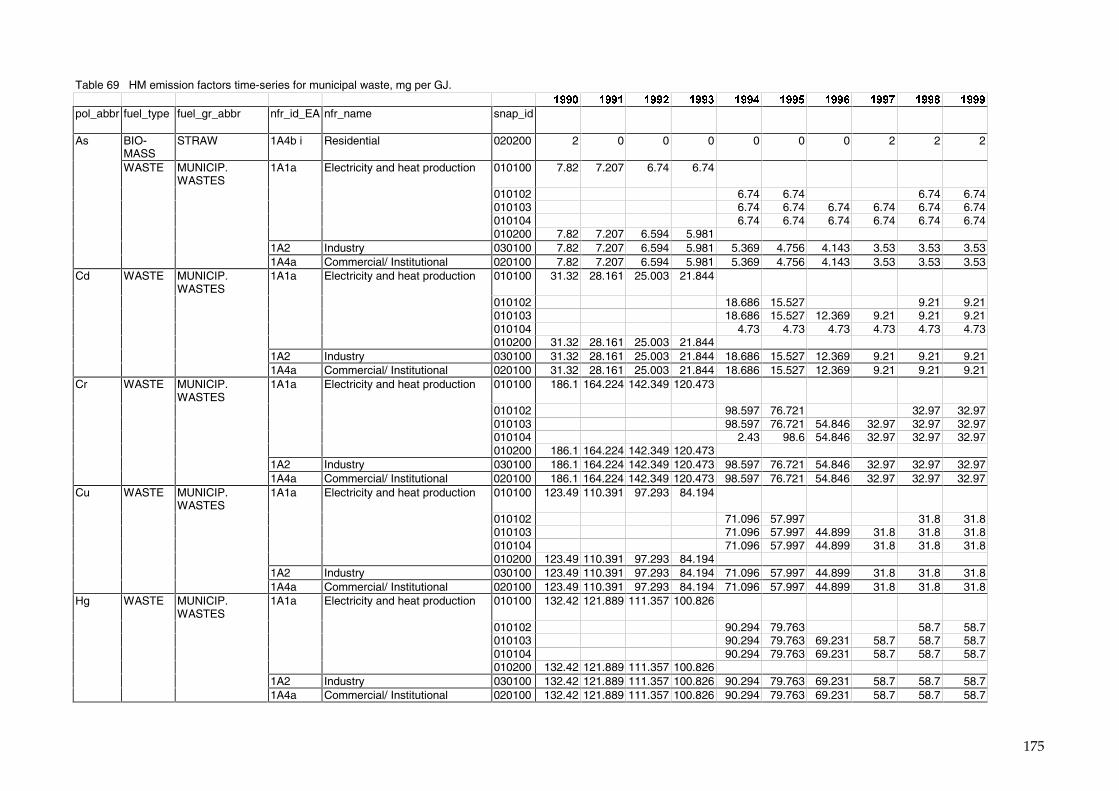
175
Table 69 HM emission factors time-series for municipal waste, mg per GJ. � � � � � � ����� ����� ����� ����� ����� ����� ����� ���� ���� �����
pol_abbr fuel_type fuel_gr_abbr nfr_id_EA nfr_name snap_id Sum of 1990
Sum of 1991
Sum of 1992
Sum of 1993
Sum of 1994
Sum of 1995
Sum of 1996
Sum of 1997
Sum of 1998
Sum of 1999
As BIO-MASS
STRAW 1A4b i Residential 020200 2 0 0 0 0 0 0 2 2 2
WASTE MUNICIP. WASTES
1A1a Electricity and heat production 010100 7.82 7.207 6.74 6.74
010102 6.74 6.74 6.74 6.74 010103 6.74 6.74 6.74 6.74 6.74 6.74 010104 6.74 6.74 6.74 6.74 6.74 6.74 010200 7.82 7.207 6.594 5.981 1A2 Industry 030100 7.82 7.207 6.594 5.981 5.369 4.756 4.143 3.53 3.53 3.53 1A4a Commercial/ Institutional 020100 7.82 7.207 6.594 5.981 5.369 4.756 4.143 3.53 3.53 3.53 Cd WASTE MUNICIP.
WASTES 1A1a Electricity and heat production 010100 31.32 28.161 25.003 21.844
010102 18.686 15.527 9.21 9.21 010103 18.686 15.527 12.369 9.21 9.21 9.21 010104 4.73 4.73 4.73 4.73 4.73 4.73 010200 31.32 28.161 25.003 21.844 1A2 Industry 030100 31.32 28.161 25.003 21.844 18.686 15.527 12.369 9.21 9.21 9.21 1A4a Commercial/ Institutional 020100 31.32 28.161 25.003 21.844 18.686 15.527 12.369 9.21 9.21 9.21 Cr WASTE MUNICIP.
WASTES 1A1a Electricity and heat production 010100 186.1 164.224 142.349 120.473
010102 98.597 76.721 32.97 32.97 010103 98.597 76.721 54.846 32.97 32.97 32.97 010104 2.43 98.6 54.846 32.97 32.97 32.97 010200 186.1 164.224 142.349 120.473 1A2 Industry 030100 186.1 164.224 142.349 120.473 98.597 76.721 54.846 32.97 32.97 32.97 1A4a Commercial/ Institutional 020100 186.1 164.224 142.349 120.473 98.597 76.721 54.846 32.97 32.97 32.97 Cu WASTE MUNICIP.
WASTES 1A1a Electricity and heat production 010100 123.49 110.391 97.293 84.194
010102 71.096 57.997 31.8 31.8 010103 71.096 57.997 44.899 31.8 31.8 31.8 010104 71.096 57.997 44.899 31.8 31.8 31.8 010200 123.49 110.391 97.293 84.194 1A2 Industry 030100 123.49 110.391 97.293 84.194 71.096 57.997 44.899 31.8 31.8 31.8 1A4a Commercial/ Institutional 020100 123.49 110.391 97.293 84.194 71.096 57.997 44.899 31.8 31.8 31.8 Hg WASTE MUNICIP.
WASTES 1A1a Electricity and heat production 010100 132.42 121.889 111.357 100.826
010102 90.294 79.763 58.7 58.7 010103 90.294 79.763 69.231 58.7 58.7 58.7 010104 90.294 79.763 69.231 58.7 58.7 58.7 010200 132.42 121.889 111.357 100.826 1A2 Industry 030100 132.42 121.889 111.357 100.826 90.294 79.763 69.231 58.7 58.7 58.7 1A4a Commercial/ Institutional 020100 132.42 121.889 111.357 100.826 90.294 79.763 69.231 58.7 58.7 58.7
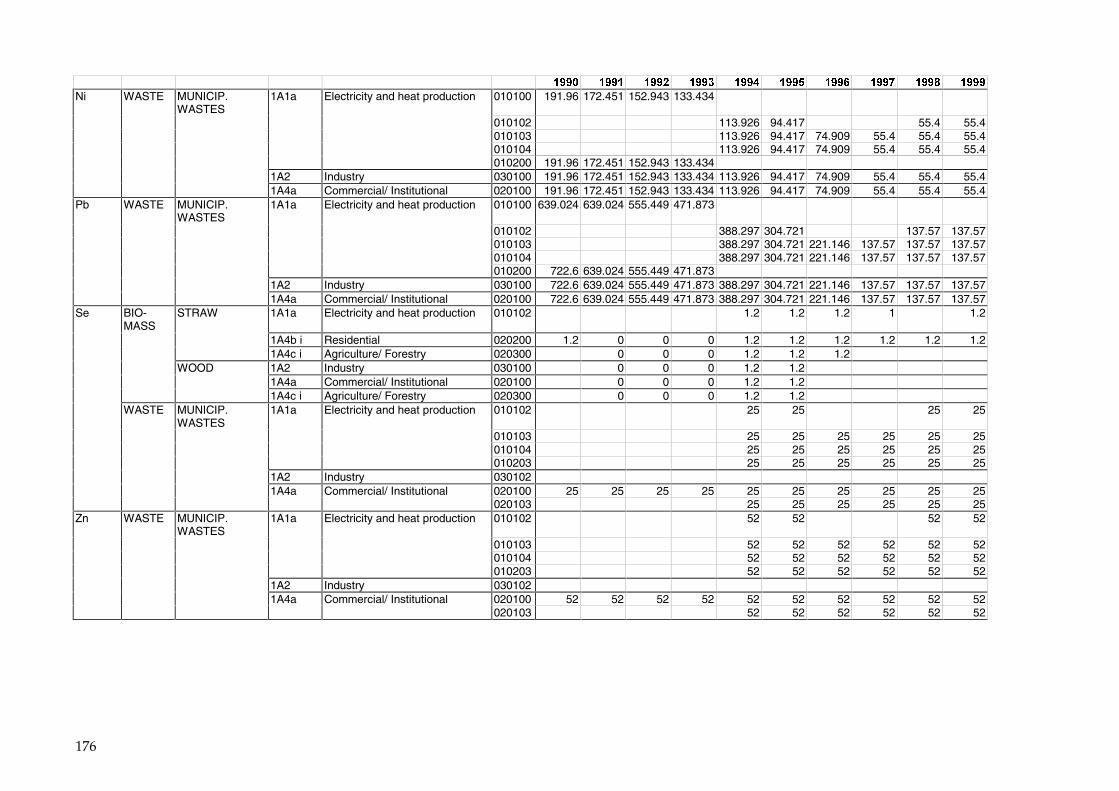
176
� � � � � � ����� ����� ����� ����� ����� ����� ����� ���� ���� �����
Ni WASTE MUNICIP. WASTES
1A1a Electricity and heat production 010100 191.96 172.451 152.943 133.434
010102 113.926 94.417 55.4 55.4 010103 113.926 94.417 74.909 55.4 55.4 55.4 010104 113.926 94.417 74.909 55.4 55.4 55.4 010200 191.96 172.451 152.943 133.434 1A2 Industry 030100 191.96 172.451 152.943 133.434 113.926 94.417 74.909 55.4 55.4 55.4 1A4a Commercial/ Institutional 020100 191.96 172.451 152.943 133.434 113.926 94.417 74.909 55.4 55.4 55.4 Pb WASTE MUNICIP.
WASTES 1A1a Electricity and heat production 010100 639.024 639.024 555.449 471.873
010102 388.297 304.721 137.57 137.57 010103 388.297 304.721 221.146 137.57 137.57 137.57 010104 388.297 304.721 221.146 137.57 137.57 137.57 010200 722.6 639.024 555.449 471.873 1A2 Industry 030100 722.6 639.024 555.449 471.873 388.297 304.721 221.146 137.57 137.57 137.57 1A4a Commercial/ Institutional 020100 722.6 639.024 555.449 471.873 388.297 304.721 221.146 137.57 137.57 137.57 Se BIO-
MASS STRAW 1A1a Electricity and heat production 010102 1.2 1.2 1.2 1 1.2
1A4b i Residential 020200 1.2 0 0 0 1.2 1.2 1.2 1.2 1.2 1.2 1A4c i Agriculture/ Forestry 020300 0 0 0 1.2 1.2 1.2 WOOD 1A2 Industry 030100 0 0 0 1.2 1.2 1A4a Commercial/ Institutional 020100 0 0 0 1.2 1.2 1A4c i Agriculture/ Forestry 020300 0 0 0 1.2 1.2 WASTE MUNICIP.
WASTES 1A1a Electricity and heat production 010102 25 25 25 25
010103 25 25 25 25 25 25 010104 25 25 25 25 25 25 010203 25 25 25 25 25 25 1A2 Industry 030102 1A4a Commercial/ Institutional 020100 25 25 25 25 25 25 25 25 25 25 020103 25 25 25 25 25 25 Zn WASTE MUNICIP.
WASTES 1A1a Electricity and heat production 010102 52 52 52 52
010103 52 52 52 52 52 52 010104 52 52 52 52 52 52 010203 52 52 52 52 52 52 1A2 Industry 030102 1A4a Commercial/ Institutional 020100 52 52 52 52 52 52 52 52 52 52 020103 52 52 52 52 52 52
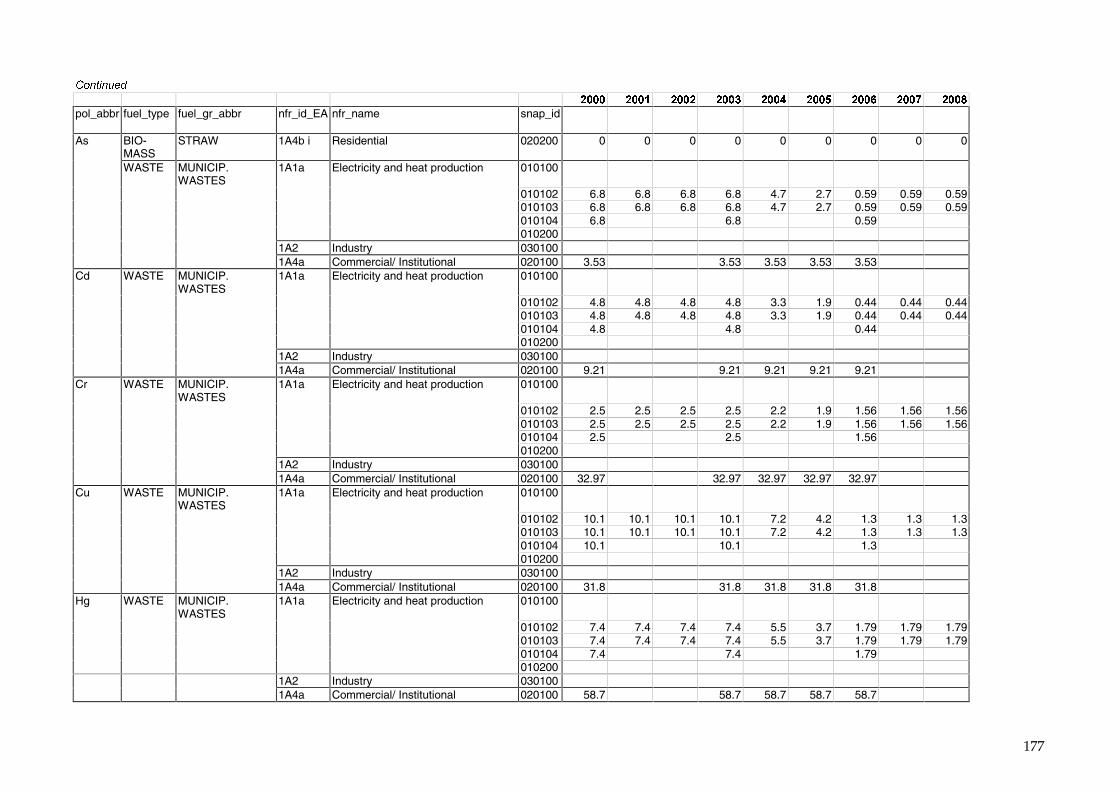
177
����������
� � � � � � ����� ����� ����� ����� ����� ����� ����� ���� ����
pol_abbr fuel_type fuel_gr_abbr nfr_id_EA nfr_name snap_id Sum of 2000
Sum of 2001
Sum of 2002
Sum of 2003
Sum of 2004
Sum of 2005
Sum of 2006
Sum of 2007
Sum of 2008
As BIO-MASS
STRAW 1A4b i Residential 020200 0 0 0 0 0 0 0 0 0
WASTE MUNICIP. WASTES
1A1a Electricity and heat production 010100
010102 6.8 6.8 6.8 6.8 4.7 2.7 0.59 0.59 0.59 010103 6.8 6.8 6.8 6.8 4.7 2.7 0.59 0.59 0.59 010104 6.8 6.8 0.59 010200 1A2 Industry 030100 1A4a Commercial/ Institutional 020100 3.53 3.53 3.53 3.53 3.53
Cd WASTE MUNICIP. WASTES
1A1a Electricity and heat production 010100
010102 4.8 4.8 4.8 4.8 3.3 1.9 0.44 0.44 0.44 010103 4.8 4.8 4.8 4.8 3.3 1.9 0.44 0.44 0.44 010104 4.8 4.8 0.44 010200 1A2 Industry 030100 1A4a Commercial/ Institutional 020100 9.21 9.21 9.21 9.21 9.21
Cr WASTE MUNICIP. WASTES
1A1a Electricity and heat production 010100
010102 2.5 2.5 2.5 2.5 2.2 1.9 1.56 1.56 1.56 010103 2.5 2.5 2.5 2.5 2.2 1.9 1.56 1.56 1.56 010104 2.5 2.5 1.56 010200 1A2 Industry 030100 1A4a Commercial/ Institutional 020100 32.97 32.97 32.97 32.97 32.97
Cu WASTE MUNICIP. WASTES
1A1a Electricity and heat production 010100
010102 10.1 10.1 10.1 10.1 7.2 4.2 1.3 1.3 1.3 010103 10.1 10.1 10.1 10.1 7.2 4.2 1.3 1.3 1.3 010104 10.1 10.1 1.3 010200 1A2 Industry 030100 1A4a Commercial/ Institutional 020100 31.8 31.8 31.8 31.8 31.8
Hg WASTE MUNICIP. WASTES
1A1a Electricity and heat production 010100
010102 7.4 7.4 7.4 7.4 5.5 3.7 1.79 1.79 1.79 010103 7.4 7.4 7.4 7.4 5.5 3.7 1.79 1.79 1.79 010104 7.4 7.4 1.79 010200 1A2 Industry 030100 1A4a Commercial/ Institutional 020100 58.7 58.7 58.7 58.7 58.7
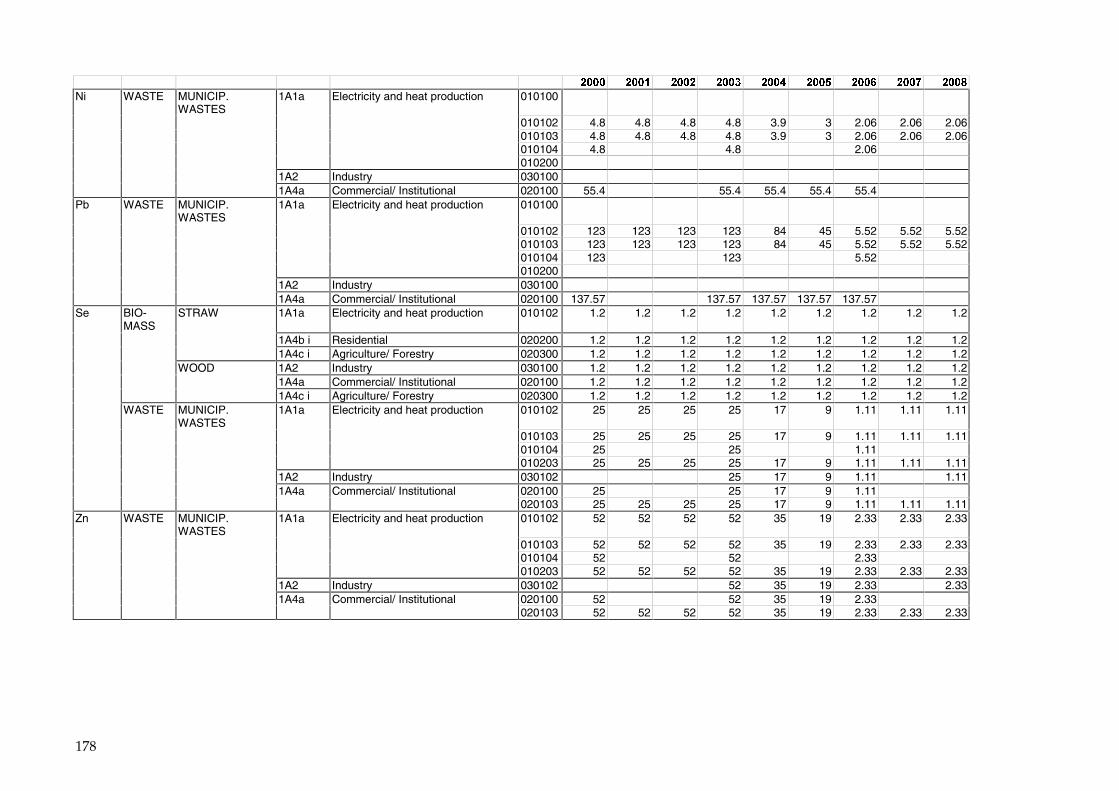
178
� � � � � � ����� ����� ����� ����� ����� ����� ����� ���� ����
Ni WASTE MUNICIP. WASTES
1A1a Electricity and heat production 010100
010102 4.8 4.8 4.8 4.8 3.9 3 2.06 2.06 2.06 010103 4.8 4.8 4.8 4.8 3.9 3 2.06 2.06 2.06 010104 4.8 4.8 2.06 010200 1A2 Industry 030100 1A4a Commercial/ Institutional 020100 55.4 55.4 55.4 55.4 55.4
Pb WASTE MUNICIP. WASTES
1A1a Electricity and heat production 010100
010102 123 123 123 123 84 45 5.52 5.52 5.52 010103 123 123 123 123 84 45 5.52 5.52 5.52 010104 123 123 5.52 010200 1A2 Industry 030100 1A4a Commercial/ Institutional 020100 137.57 137.57 137.57 137.57 137.57
Se BIO-MASS
STRAW 1A1a Electricity and heat production 010102 1.2 1.2 1.2 1.2 1.2 1.2 1.2 1.2 1.2
1A4b i Residential 020200 1.2 1.2 1.2 1.2 1.2 1.2 1.2 1.2 1.2 1A4c i Agriculture/ Forestry 020300 1.2 1.2 1.2 1.2 1.2 1.2 1.2 1.2 1.2 WOOD 1A2 Industry 030100 1.2 1.2 1.2 1.2 1.2 1.2 1.2 1.2 1.2 1A4a Commercial/ Institutional 020100 1.2 1.2 1.2 1.2 1.2 1.2 1.2 1.2 1.2 1A4c i Agriculture/ Forestry 020300 1.2 1.2 1.2 1.2 1.2 1.2 1.2 1.2 1.2 WASTE MUNICIP.
WASTES 1A1a Electricity and heat production 010102 25 25 25 25 17 9 1.11 1.11 1.11
010103 25 25 25 25 17 9 1.11 1.11 1.11 010104 25 25 1.11 010203 25 25 25 25 17 9 1.11 1.11 1.11 1A2 Industry 030102 25 17 9 1.11 1.11 1A4a Commercial/ Institutional 020100 25 25 17 9 1.11 020103 25 25 25 25 17 9 1.11 1.11 1.11
Zn WASTE MUNICIP. WASTES
1A1a Electricity and heat production 010102 52 52 52 52 35 19 2.33 2.33 2.33
010103 52 52 52 52 35 19 2.33 2.33 2.33 010104 52 52 2.33 010203 52 52 52 52 35 19 2.33 2.33 2.33 1A2 Industry 030102 52 35 19 2.33 2.33 1A4a Commercial/ Institutional 020100 52 52 35 19 2.33 020103 52 52 52 52 35 19 2.33 2.33 2.33
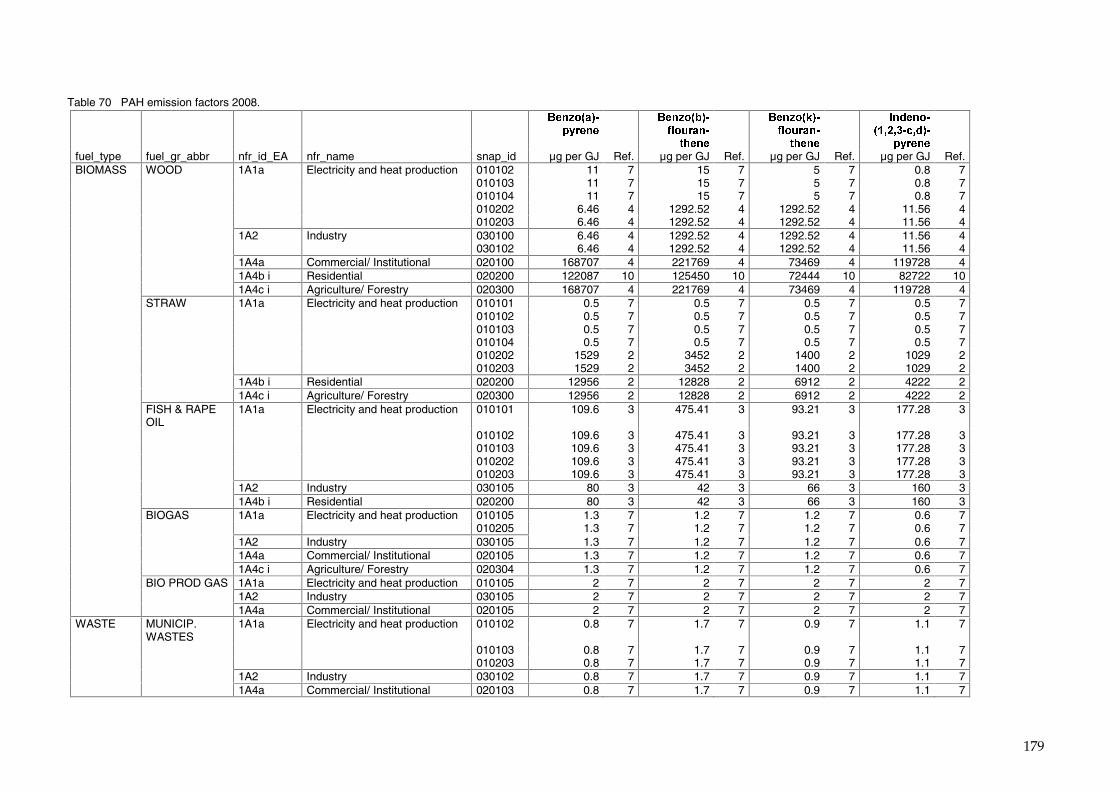
179
Table 70 PAH emission factors 2008. �� �� �� �� �� �� ������
���� ��� �� ������
������ ���� ��
� �� ������������ �
��� ��
� � �� ���� � ��! ���
���� ��
�
fuel_type fuel_gr_abbr nfr_id_EA nfr_name snap_id µg per GJ Ref. µg per GJ Ref. µg per GJ Ref. µg per GJ Ref. BIOMASS WOOD 1A1a Electricity and heat production 010102 11 7 15 7 5 7 0.8 7 010103 11 7 15 7 5 7 0.8 7 010104 11 7 15 7 5 7 0.8 7 010202 6.46 4 1292.52 4 1292.52 4 11.56 4 010203 6.46 4 1292.52 4 1292.52 4 11.56 4 1A2 Industry 030100 6.46 4 1292.52 4 1292.52 4 11.56 4 030102 6.46 4 1292.52 4 1292.52 4 11.56 4 1A4a Commercial/ Institutional 020100 168707 4 221769 4 73469 4 119728 4 1A4b i Residential 020200 122087 10 125450 10 72444 10 82722 10 1A4c i Agriculture/ Forestry 020300 168707 4 221769 4 73469 4 119728 4 STRAW 1A1a Electricity and heat production 010101 0.5 7 0.5 7 0.5 7 0.5 7 010102 0.5 7 0.5 7 0.5 7 0.5 7 010103 0.5 7 0.5 7 0.5 7 0.5 7 010104 0.5 7 0.5 7 0.5 7 0.5 7 010202 1529 2 3452 2 1400 2 1029 2 010203 1529 2 3452 2 1400 2 1029 2 1A4b i Residential 020200 12956 2 12828 2 6912 2 4222 2 1A4c i Agriculture/ Forestry 020300 12956 2 12828 2 6912 2 4222 2 FISH & RAPE
OIL 1A1a Electricity and heat production 010101 109.6 3 475.41 3 93.21 3 177.28 3
010102 109.6 3 475.41 3 93.21 3 177.28 3 010103 109.6 3 475.41 3 93.21 3 177.28 3 010202 109.6 3 475.41 3 93.21 3 177.28 3 010203 109.6 3 475.41 3 93.21 3 177.28 3 1A2 Industry 030105 80 3 42 3 66 3 160 3 1A4b i Residential 020200 80 3 42 3 66 3 160 3 BIOGAS 1A1a Electricity and heat production 010105 1.3 7 1.2 7 1.2 7 0.6 7 010205 1.3 7 1.2 7 1.2 7 0.6 7 1A2 Industry 030105 1.3 7 1.2 7 1.2 7 0.6 7 1A4a Commercial/ Institutional 020105 1.3 7 1.2 7 1.2 7 0.6 7 1A4c i Agriculture/ Forestry 020304 1.3 7 1.2 7 1.2 7 0.6 7 BIO PROD GAS 1A1a Electricity and heat production 010105 2 7 2 7 2 7 2 7 1A2 Industry 030105 2 7 2 7 2 7 2 7 1A4a Commercial/ Institutional 020105 2 7 2 7 2 7 2 7 WASTE MUNICIP.
WASTES 1A1a Electricity and heat production 010102 0.8 7 1.7 7 0.9 7 1.1 7
010103 0.8 7 1.7 7 0.9 7 1.1 7 010203 0.8 7 1.7 7 0.9 7 1.1 7 1A2 Industry 030102 0.8 7 1.7 7 0.9 7 1.1 7 1A4a Commercial/ Institutional 020103 0.8 7 1.7 7 0.9 7 1.1 7
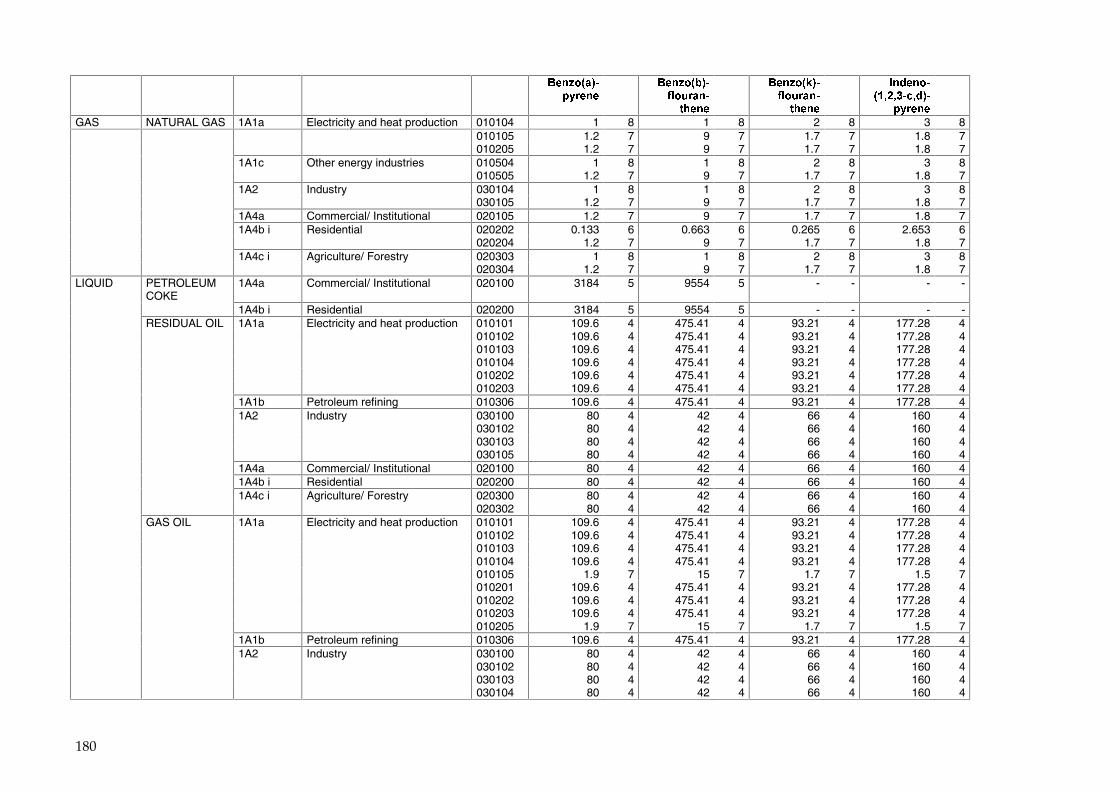
180
�� �� �� �� �� �� ���������� ��
� �� ������������ �
��� ��
� �� ������������ �
��� ��
� � �� ���� � ��! ���
���� ��
�
GAS NATURAL GAS 1A1a Electricity and heat production 010104 1 8 1 8 2 8 3 8 010105 1.2 7 9 7 1.7 7 1.8 7 010205 1.2 7 9 7 1.7 7 1.8 7 1A1c Other energy industries 010504 1 8 1 8 2 8 3 8 010505 1.2 7 9 7 1.7 7 1.8 7 1A2 Industry 030104 1 8 1 8 2 8 3 8 030105 1.2 7 9 7 1.7 7 1.8 7 1A4a Commercial/ Institutional 020105 1.2 7 9 7 1.7 7 1.8 7 1A4b i Residential 020202 0.133 6 0.663 6 0.265 6 2.653 6 020204 1.2 7 9 7 1.7 7 1.8 7 1A4c i Agriculture/ Forestry 020303 1 8 1 8 2 8 3 8 020304 1.2 7 9 7 1.7 7 1.8 7 LIQUID PETROLEUM
COKE 1A4a Commercial/ Institutional 020100 3184 5 9554 5 - - - -
1A4b i Residential 020200 3184 5 9554 5 - - - - RESIDUAL OIL 1A1a Electricity and heat production 010101 109.6 4 475.41 4 93.21 4 177.28 4 010102 109.6 4 475.41 4 93.21 4 177.28 4 010103 109.6 4 475.41 4 93.21 4 177.28 4 010104 109.6 4 475.41 4 93.21 4 177.28 4 010202 109.6 4 475.41 4 93.21 4 177.28 4 010203 109.6 4 475.41 4 93.21 4 177.28 4 1A1b Petroleum refining 010306 109.6 4 475.41 4 93.21 4 177.28 4 1A2 Industry 030100 80 4 42 4 66 4 160 4 030102 80 4 42 4 66 4 160 4 030103 80 4 42 4 66 4 160 4 030105 80 4 42 4 66 4 160 4 1A4a Commercial/ Institutional 020100 80 4 42 4 66 4 160 4 1A4b i Residential 020200 80 4 42 4 66 4 160 4 1A4c i Agriculture/ Forestry 020300 80 4 42 4 66 4 160 4 020302 80 4 42 4 66 4 160 4 GAS OIL 1A1a Electricity and heat production 010101 109.6 4 475.41 4 93.21 4 177.28 4 010102 109.6 4 475.41 4 93.21 4 177.28 4 010103 109.6 4 475.41 4 93.21 4 177.28 4 010104 109.6 4 475.41 4 93.21 4 177.28 4 010105 1.9 7 15 7 1.7 7 1.5 7 010201 109.6 4 475.41 4 93.21 4 177.28 4 010202 109.6 4 475.41 4 93.21 4 177.28 4 010203 109.6 4 475.41 4 93.21 4 177.28 4 010205 1.9 7 15 7 1.7 7 1.5 7 1A1b Petroleum refining 010306 109.6 4 475.41 4 93.21 4 177.28 4 1A2 Industry 030100 80 4 42 4 66 4 160 4 030102 80 4 42 4 66 4 160 4 030103 80 4 42 4 66 4 160 4 030104 80 4 42 4 66 4 160 4
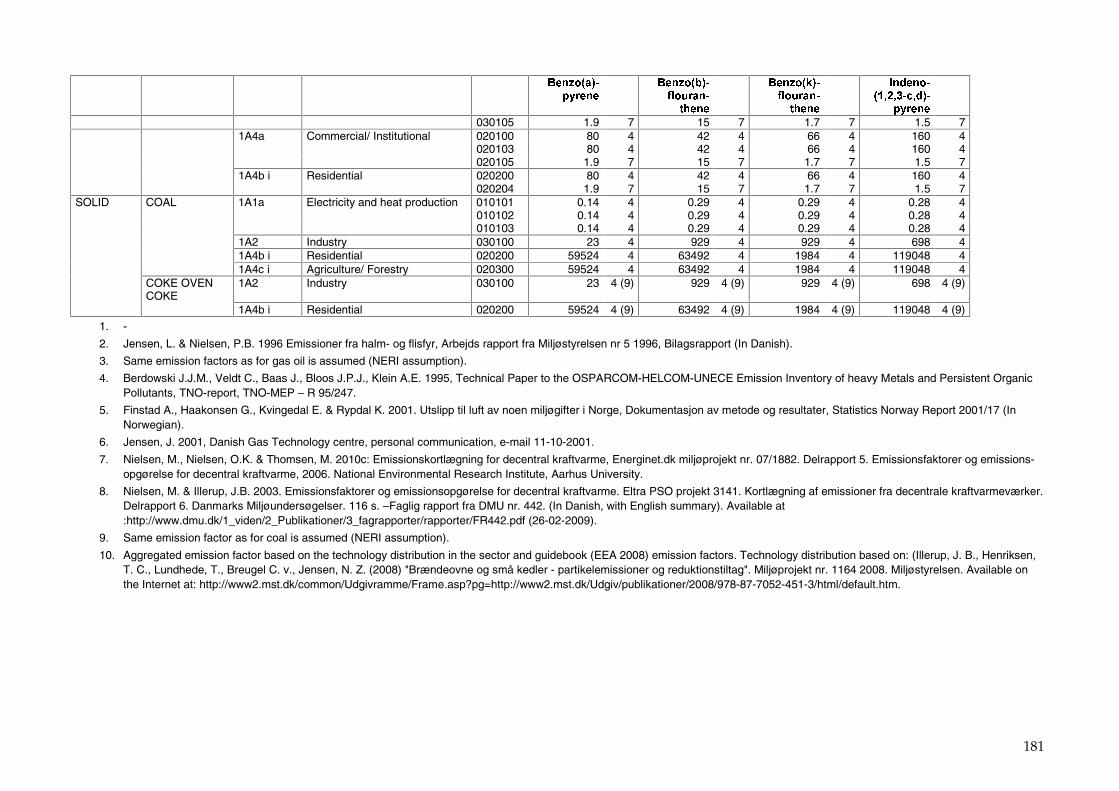
181
�� �� �� �� �� �� ���������� ��
� �� ������������ �
��� ��
� �� ������������ �
��� ��
� � �� ���� � ��! ���
���� ��
�
030105 1.9 7 15 7 1.7 7 1.5 7 1A4a Commercial/ Institutional 020100 80 4 42 4 66 4 160 4 020103 80 4 42 4 66 4 160 4 020105 1.9 7 15 7 1.7 7 1.5 7 1A4b i Residential 020200 80 4 42 4 66 4 160 4 020204 1.9 7 15 7 1.7 7 1.5 7 SOLID COAL 1A1a Electricity and heat production 010101 0.14 4 0.29 4 0.29 4 0.28 4 010102 0.14 4 0.29 4 0.29 4 0.28 4 010103 0.14 4 0.29 4 0.29 4 0.28 4 1A2 Industry 030100 23 4 929 4 929 4 698 4 1A4b i Residential 020200 59524 4 63492 4 1984 4 119048 4 1A4c i Agriculture/ Forestry 020300 59524 4 63492 4 1984 4 119048 4 COKE OVEN
COKE 1A2 Industry 030100 23 4 (9) 929 4 (9) 929 4 (9) 698 4 (9)
1A4b i Residential 020200 59524 4 (9) 63492 4 (9) 1984 4 (9) 119048 4 (9)
1. -
2. Jensen, L. & Nielsen, P.B. 1996 Emissioner fra halm- og flisfyr, Arbejds rapport fra Miljøstyrelsen nr 5 1996, Bilagsrapport (In Danish).
3. Same emission factors as for gas oil is assumed (NERI assumption).
4. Berdowski J.J.M., Veldt C., Baas J., Bloos J.P.J., Klein A.E. 1995, Technical Paper to the OSPARCOM-HELCOM-UNECE Emission Inventory of heavy Metals and Persistent Organic Pollutants, TNO-report, TNO-MEP – R 95/247.
5. Finstad A., Haakonsen G., Kvingedal E. & Rypdal K. 2001. Utslipp til luft av noen miljøgifter i Norge, Dokumentasjon av metode og resultater, Statistics Norway Report 2001/17 (In Norwegian).
6. Jensen, J. 2001, Danish Gas Technology centre, personal communication, e-mail 11-10-2001.
7. Nielsen, M., Nielsen, O.K. & Thomsen, M. 2010c: Emissionskortlægning for decentral kraftvarme, Energinet.dk miljøprojekt nr. 07/1882. Delrapport 5. Emissionsfaktorer og emissions-opgørelse for decentral kraftvarme, 2006. National Environmental Research Institute, Aarhus University.
8. Nielsen, M. & Illerup, J.B. 2003. Emissionsfaktorer og emissionsopgørelse for decentral kraftvarme. Eltra PSO projekt 3141. Kortlægning af emissioner fra decentrale kraftvarmeværker. Delrapport 6. Danmarks Miljøundersøgelser. 116 s. –Faglig rapport fra DMU nr. 442. (In Danish, with English summary). Available at :http://www.dmu.dk/1_viden/2_Publikationer/3_fagrapporter/rapporter/FR442.pdf (26-02-2009).
9. Same emission factor as for coal is assumed (NERI assumption).
10. Aggregated emission factor based on the technology distribution in the sector and guidebook (EEA 2008) emission factors. Technology distribution based on: (Illerup, J. B., Henriksen, T. C., Lundhede, T., Breugel C. v., Jensen, N. Z. (2008) "Brændeovne og små kedler - partikelemissioner og reduktionstiltag". Miljøprojekt nr. 1164 2008. Miljøstyrelsen. Available on the Internet at: http://www2.mst.dk/common/Udgivramme/Frame.asp?pg=http://www2.mst.dk/Udgiv/publikationer/2008/978-87-7052-451-3/html/default.htm.
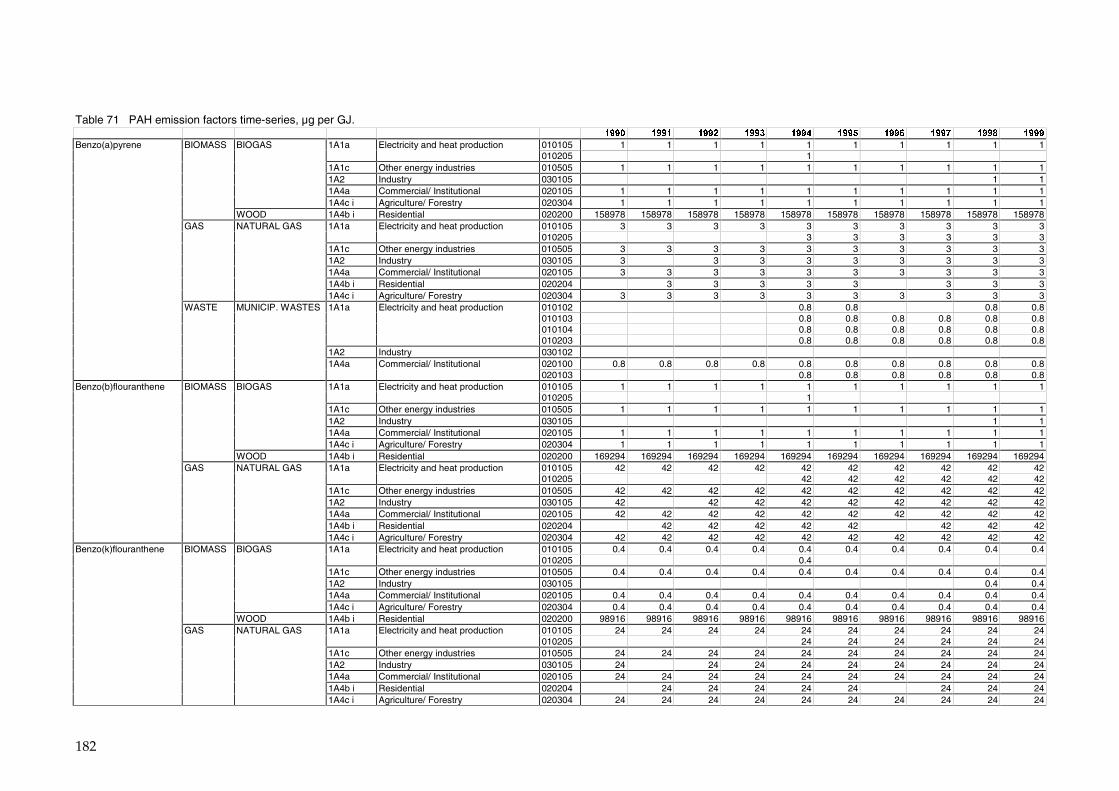
182
Table 71 PAH emission factors time-series, µg per GJ. � � � � � � ����� ����� ����� ����� ����� ����� ����� ���� ���� �����
Benzo(a)pyrene BIOMASS BIOGAS 1A1a Electricity and heat production 010105 1 1 1 1 1 1 1 1 1 1 010205 1 1A1c Other energy industries 010505 1 1 1 1 1 1 1 1 1 1 1A2 Industry 030105 1 1 1A4a Commercial/ Institutional 020105 1 1 1 1 1 1 1 1 1 1 1A4c i Agriculture/ Forestry 020304 1 1 1 1 1 1 1 1 1 1 WOOD 1A4b i Residential 020200 158978 158978 158978 158978 158978 158978 158978 158978 158978 158978 GAS NATURAL GAS 1A1a Electricity and heat production 010105 3 3 3 3 3 3 3 3 3 3 010205 3 3 3 3 3 3 1A1c Other energy industries 010505 3 3 3 3 3 3 3 3 3 3 1A2 Industry 030105 3 3 3 3 3 3 3 3 3 1A4a Commercial/ Institutional 020105 3 3 3 3 3 3 3 3 3 3 1A4b i Residential 020204 3 3 3 3 3 3 3 3 1A4c i Agriculture/ Forestry 020304 3 3 3 3 3 3 3 3 3 3 WASTE MUNICIP. WASTES 1A1a Electricity and heat production 010102 0.8 0.8 0.8 0.8 010103 0.8 0.8 0.8 0.8 0.8 0.8 010104 0.8 0.8 0.8 0.8 0.8 0.8 010203 0.8 0.8 0.8 0.8 0.8 0.8 1A2 Industry 030102 1A4a Commercial/ Institutional 020100 0.8 0.8 0.8 0.8 0.8 0.8 0.8 0.8 0.8 0.8 020103 0.8 0.8 0.8 0.8 0.8 0.8
Benzo(b)flouranthene BIOMASS BIOGAS 1A1a Electricity and heat production 010105 1 1 1 1 1 1 1 1 1 1 010205 1 1A1c Other energy industries 010505 1 1 1 1 1 1 1 1 1 1 1A2 Industry 030105 1 1 1A4a Commercial/ Institutional 020105 1 1 1 1 1 1 1 1 1 1 1A4c i Agriculture/ Forestry 020304 1 1 1 1 1 1 1 1 1 1 WOOD 1A4b i Residential 020200 169294 169294 169294 169294 169294 169294 169294 169294 169294 169294 GAS NATURAL GAS 1A1a Electricity and heat production 010105 42 42 42 42 42 42 42 42 42 42 010205 42 42 42 42 42 42 1A1c Other energy industries 010505 42 42 42 42 42 42 42 42 42 42 1A2 Industry 030105 42 42 42 42 42 42 42 42 42 1A4a Commercial/ Institutional 020105 42 42 42 42 42 42 42 42 42 42 1A4b i Residential 020204 42 42 42 42 42 42 42 42 1A4c i Agriculture/ Forestry 020304 42 42 42 42 42 42 42 42 42 42
Benzo(k)flouranthene BIOMASS BIOGAS 1A1a Electricity and heat production 010105 0.4 0.4 0.4 0.4 0.4 0.4 0.4 0.4 0.4 0.4 010205 0.4 1A1c Other energy industries 010505 0.4 0.4 0.4 0.4 0.4 0.4 0.4 0.4 0.4 0.4 1A2 Industry 030105 0.4 0.4 1A4a Commercial/ Institutional 020105 0.4 0.4 0.4 0.4 0.4 0.4 0.4 0.4 0.4 0.4 1A4c i Agriculture/ Forestry 020304 0.4 0.4 0.4 0.4 0.4 0.4 0.4 0.4 0.4 0.4 WOOD 1A4b i Residential 020200 98916 98916 98916 98916 98916 98916 98916 98916 98916 98916 GAS NATURAL GAS 1A1a Electricity and heat production 010105 24 24 24 24 24 24 24 24 24 24 010205 24 24 24 24 24 24 1A1c Other energy industries 010505 24 24 24 24 24 24 24 24 24 24 1A2 Industry 030105 24 24 24 24 24 24 24 24 24 1A4a Commercial/ Institutional 020105 24 24 24 24 24 24 24 24 24 24 1A4b i Residential 020204 24 24 24 24 24 24 24 24 1A4c i Agriculture/ Forestry 020304 24 24 24 24 24 24 24 24 24 24
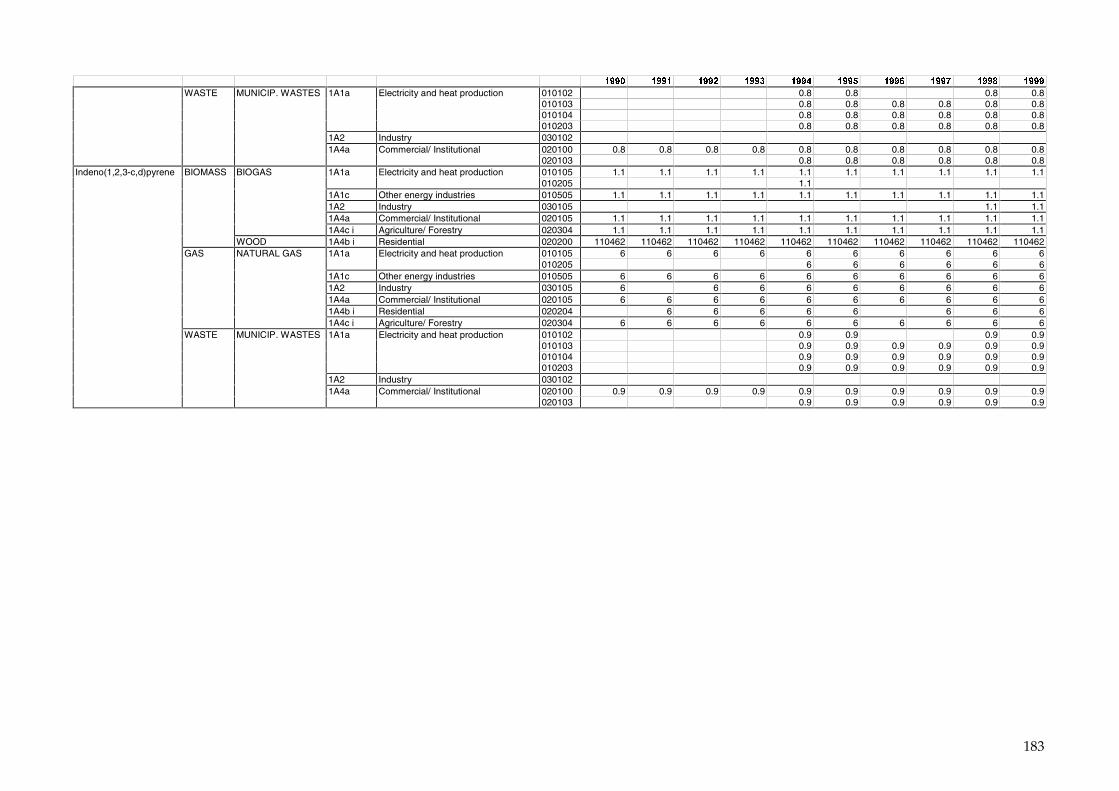
183
� � � � � � ����� ����� ����� ����� ����� ����� ����� ���� ���� �����
WASTE MUNICIP. WASTES 1A1a Electricity and heat production 010102 0.8 0.8 0.8 0.8 010103 0.8 0.8 0.8 0.8 0.8 0.8 010104 0.8 0.8 0.8 0.8 0.8 0.8 010203 0.8 0.8 0.8 0.8 0.8 0.8 1A2 Industry 030102 1A4a Commercial/ Institutional 020100 0.8 0.8 0.8 0.8 0.8 0.8 0.8 0.8 0.8 0.8 020103 0.8 0.8 0.8 0.8 0.8 0.8
Indeno(1,2,3-c,d)pyrene BIOMASS BIOGAS 1A1a Electricity and heat production 010105 1.1 1.1 1.1 1.1 1.1 1.1 1.1 1.1 1.1 1.1 010205 1.1 1A1c Other energy industries 010505 1.1 1.1 1.1 1.1 1.1 1.1 1.1 1.1 1.1 1.1 1A2 Industry 030105 1.1 1.1 1A4a Commercial/ Institutional 020105 1.1 1.1 1.1 1.1 1.1 1.1 1.1 1.1 1.1 1.1 1A4c i Agriculture/ Forestry 020304 1.1 1.1 1.1 1.1 1.1 1.1 1.1 1.1 1.1 1.1 WOOD 1A4b i Residential 020200 110462 110462 110462 110462 110462 110462 110462 110462 110462 110462 GAS NATURAL GAS 1A1a Electricity and heat production 010105 6 6 6 6 6 6 6 6 6 6 010205 6 6 6 6 6 6 1A1c Other energy industries 010505 6 6 6 6 6 6 6 6 6 6 1A2 Industry 030105 6 6 6 6 6 6 6 6 6 1A4a Commercial/ Institutional 020105 6 6 6 6 6 6 6 6 6 6 1A4b i Residential 020204 6 6 6 6 6 6 6 6 1A4c i Agriculture/ Forestry 020304 6 6 6 6 6 6 6 6 6 6 WASTE MUNICIP. WASTES 1A1a Electricity and heat production 010102 0.9 0.9 0.9 0.9 010103 0.9 0.9 0.9 0.9 0.9 0.9 010104 0.9 0.9 0.9 0.9 0.9 0.9 010203 0.9 0.9 0.9 0.9 0.9 0.9 1A2 Industry 030102 1A4a Commercial/ Institutional 020100 0.9 0.9 0.9 0.9 0.9 0.9 0.9 0.9 0.9 0.9 020103 0.9 0.9 0.9 0.9 0.9 0.9
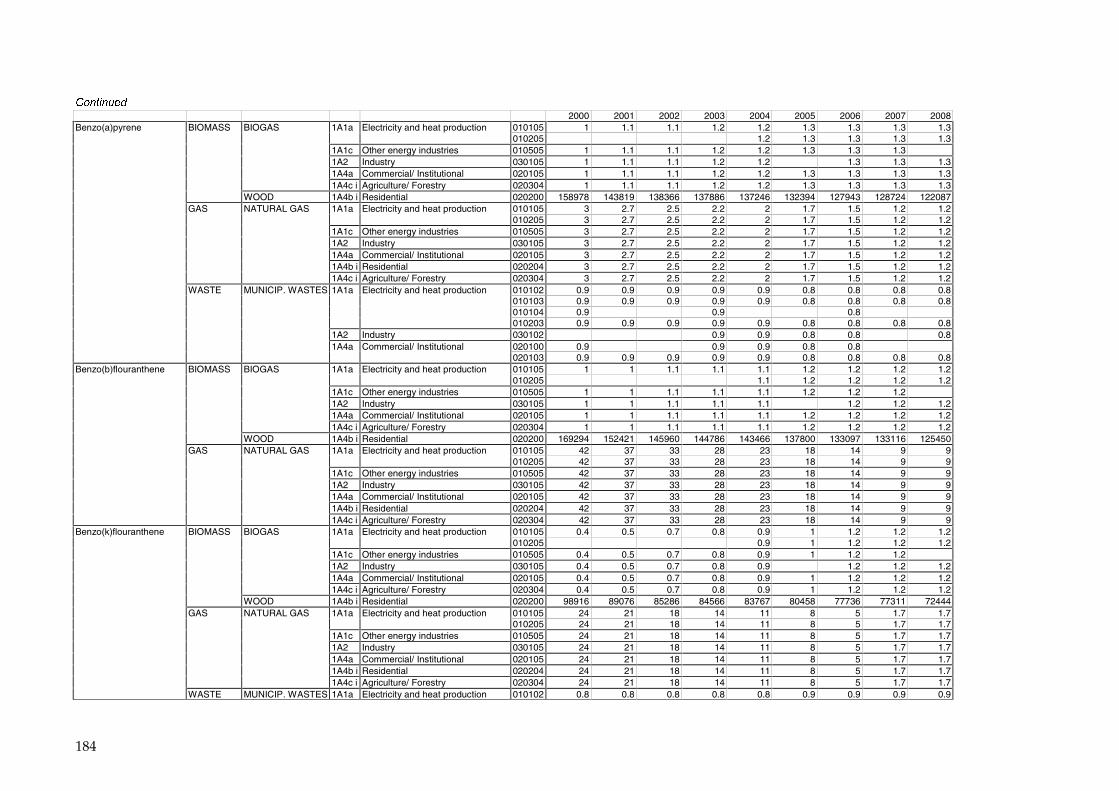
184
����������
2000 2001 2002 2003 2004 2005 2006 2007 2008 Benzo(a)pyrene BIOMASS BIOGAS 1A1a Electricity and heat production 010105 1 1.1 1.1 1.2 1.2 1.3 1.3 1.3 1.3
010205 1.2 1.3 1.3 1.3 1.3 1A1c Other energy industries 010505 1 1.1 1.1 1.2 1.2 1.3 1.3 1.3 1A2 Industry 030105 1 1.1 1.1 1.2 1.2 1.3 1.3 1.3 1A4a Commercial/ Institutional 020105 1 1.1 1.1 1.2 1.2 1.3 1.3 1.3 1.3 1A4c i Agriculture/ Forestry 020304 1 1.1 1.1 1.2 1.2 1.3 1.3 1.3 1.3 WOOD 1A4b i Residential 020200 158978 143819 138366 137886 137246 132394 127943 128724 122087 GAS NATURAL GAS 1A1a Electricity and heat production 010105 3 2.7 2.5 2.2 2 1.7 1.5 1.2 1.2 010205 3 2.7 2.5 2.2 2 1.7 1.5 1.2 1.2 1A1c Other energy industries 010505 3 2.7 2.5 2.2 2 1.7 1.5 1.2 1.2 1A2 Industry 030105 3 2.7 2.5 2.2 2 1.7 1.5 1.2 1.2 1A4a Commercial/ Institutional 020105 3 2.7 2.5 2.2 2 1.7 1.5 1.2 1.2 1A4b i Residential 020204 3 2.7 2.5 2.2 2 1.7 1.5 1.2 1.2 1A4c i Agriculture/ Forestry 020304 3 2.7 2.5 2.2 2 1.7 1.5 1.2 1.2 WASTE MUNICIP. WASTES 1A1a Electricity and heat production 010102 0.9 0.9 0.9 0.9 0.9 0.8 0.8 0.8 0.8 010103 0.9 0.9 0.9 0.9 0.9 0.8 0.8 0.8 0.8 010104 0.9 0.9 0.8 010203 0.9 0.9 0.9 0.9 0.9 0.8 0.8 0.8 0.8 1A2 Industry 030102 0.9 0.9 0.8 0.8 0.8 1A4a Commercial/ Institutional 020100 0.9 0.9 0.9 0.8 0.8 020103 0.9 0.9 0.9 0.9 0.9 0.8 0.8 0.8 0.8
Benzo(b)flouranthene BIOMASS BIOGAS 1A1a Electricity and heat production 010105 1 1 1.1 1.1 1.1 1.2 1.2 1.2 1.2 010205 1.1 1.2 1.2 1.2 1.2 1A1c Other energy industries 010505 1 1 1.1 1.1 1.1 1.2 1.2 1.2 1A2 Industry 030105 1 1 1.1 1.1 1.1 1.2 1.2 1.2 1A4a Commercial/ Institutional 020105 1 1 1.1 1.1 1.1 1.2 1.2 1.2 1.2 1A4c i Agriculture/ Forestry 020304 1 1 1.1 1.1 1.1 1.2 1.2 1.2 1.2 WOOD 1A4b i Residential 020200 169294 152421 145960 144786 143466 137800 133097 133116 125450 GAS NATURAL GAS 1A1a Electricity and heat production 010105 42 37 33 28 23 18 14 9 9 010205 42 37 33 28 23 18 14 9 9 1A1c Other energy industries 010505 42 37 33 28 23 18 14 9 9 1A2 Industry 030105 42 37 33 28 23 18 14 9 9 1A4a Commercial/ Institutional 020105 42 37 33 28 23 18 14 9 9 1A4b i Residential 020204 42 37 33 28 23 18 14 9 9 1A4c i Agriculture/ Forestry 020304 42 37 33 28 23 18 14 9 9
Benzo(k)flouranthene BIOMASS BIOGAS 1A1a Electricity and heat production 010105 0.4 0.5 0.7 0.8 0.9 1 1.2 1.2 1.2 010205 0.9 1 1.2 1.2 1.2 1A1c Other energy industries 010505 0.4 0.5 0.7 0.8 0.9 1 1.2 1.2 1A2 Industry 030105 0.4 0.5 0.7 0.8 0.9 1.2 1.2 1.2 1A4a Commercial/ Institutional 020105 0.4 0.5 0.7 0.8 0.9 1 1.2 1.2 1.2 1A4c i Agriculture/ Forestry 020304 0.4 0.5 0.7 0.8 0.9 1 1.2 1.2 1.2 WOOD 1A4b i Residential 020200 98916 89076 85286 84566 83767 80458 77736 77311 72444 GAS NATURAL GAS 1A1a Electricity and heat production 010105 24 21 18 14 11 8 5 1.7 1.7 010205 24 21 18 14 11 8 5 1.7 1.7 1A1c Other energy industries 010505 24 21 18 14 11 8 5 1.7 1.7 1A2 Industry 030105 24 21 18 14 11 8 5 1.7 1.7 1A4a Commercial/ Institutional 020105 24 21 18 14 11 8 5 1.7 1.7 1A4b i Residential 020204 24 21 18 14 11 8 5 1.7 1.7 1A4c i Agriculture/ Forestry 020304 24 21 18 14 11 8 5 1.7 1.7 WASTE MUNICIP. WASTES 1A1a Electricity and heat production 010102 0.8 0.8 0.8 0.8 0.8 0.9 0.9 0.9 0.9
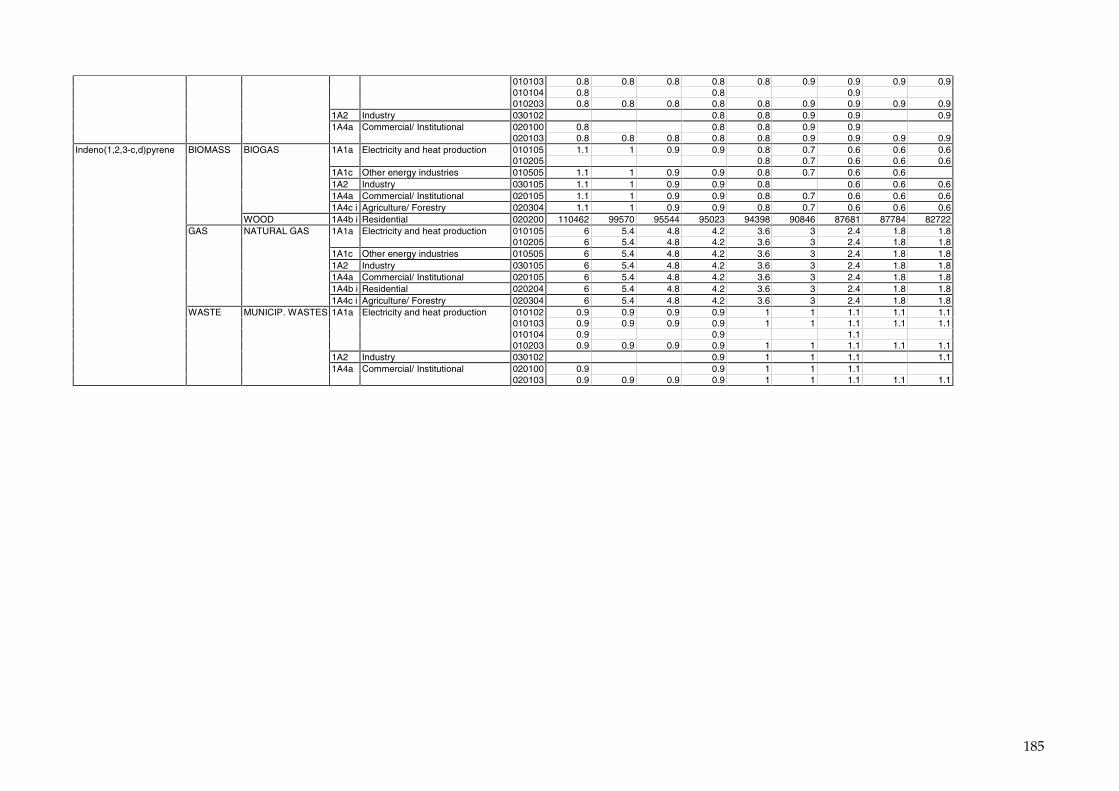
185
010103 0.8 0.8 0.8 0.8 0.8 0.9 0.9 0.9 0.9 010104 0.8 0.8 0.9 010203 0.8 0.8 0.8 0.8 0.8 0.9 0.9 0.9 0.9 1A2 Industry 030102 0.8 0.8 0.9 0.9 0.9 1A4a Commercial/ Institutional 020100 0.8 0.8 0.8 0.9 0.9 020103 0.8 0.8 0.8 0.8 0.8 0.9 0.9 0.9 0.9
Indeno(1,2,3-c,d)pyrene BIOMASS BIOGAS 1A1a Electricity and heat production 010105 1.1 1 0.9 0.9 0.8 0.7 0.6 0.6 0.6 010205 0.8 0.7 0.6 0.6 0.6 1A1c Other energy industries 010505 1.1 1 0.9 0.9 0.8 0.7 0.6 0.6 1A2 Industry 030105 1.1 1 0.9 0.9 0.8 0.6 0.6 0.6 1A4a Commercial/ Institutional 020105 1.1 1 0.9 0.9 0.8 0.7 0.6 0.6 0.6 1A4c i Agriculture/ Forestry 020304 1.1 1 0.9 0.9 0.8 0.7 0.6 0.6 0.6 WOOD 1A4b i Residential 020200 110462 99570 95544 95023 94398 90846 87681 87784 82722 GAS NATURAL GAS 1A1a Electricity and heat production 010105 6 5.4 4.8 4.2 3.6 3 2.4 1.8 1.8 010205 6 5.4 4.8 4.2 3.6 3 2.4 1.8 1.8 1A1c Other energy industries 010505 6 5.4 4.8 4.2 3.6 3 2.4 1.8 1.8 1A2 Industry 030105 6 5.4 4.8 4.2 3.6 3 2.4 1.8 1.8 1A4a Commercial/ Institutional 020105 6 5.4 4.8 4.2 3.6 3 2.4 1.8 1.8 1A4b i Residential 020204 6 5.4 4.8 4.2 3.6 3 2.4 1.8 1.8 1A4c i Agriculture/ Forestry 020304 6 5.4 4.8 4.2 3.6 3 2.4 1.8 1.8 WASTE MUNICIP. WASTES 1A1a Electricity and heat production 010102 0.9 0.9 0.9 0.9 1 1 1.1 1.1 1.1 010103 0.9 0.9 0.9 0.9 1 1 1.1 1.1 1.1 010104 0.9 0.9 1.1 010203 0.9 0.9 0.9 0.9 1 1 1.1 1.1 1.1 1A2 Industry 030102 0.9 1 1 1.1 1.1 1A4a Commercial/ Institutional 020100 0.9 0.9 1 1 1.1 020103 0.9 0.9 0.9 0.9 1 1 1.1 1.1 1.1
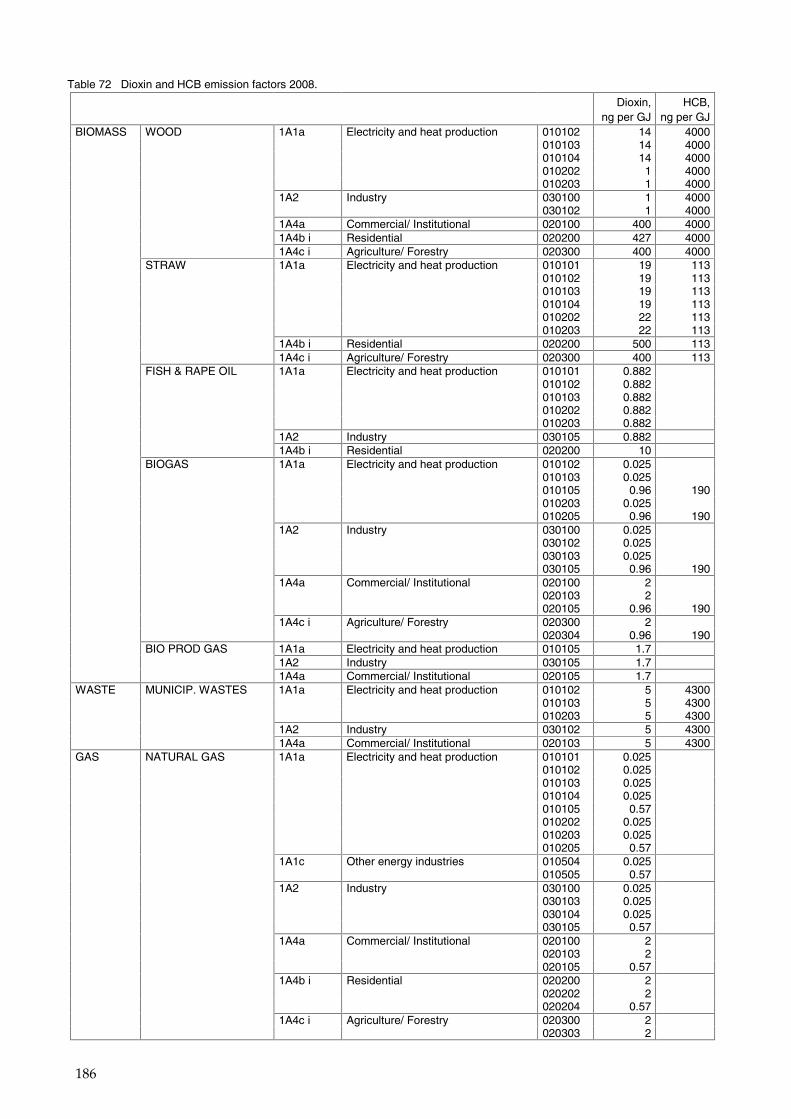
186
Table 72 Dioxin and HCB emission factors 2008.
Dioxin,
ng per GJ HCB,
ng per GJ BIOMASS WOOD 1A1a Electricity and heat production 010102 14 4000 010103 14 4000 010104 14 4000 010202 1 4000 010203 1 4000 1A2 Industry 030100 1 4000 030102 1 4000 1A4a Commercial/ Institutional 020100 400 4000 1A4b i Residential 020200 427 4000 1A4c i Agriculture/ Forestry 020300 400 4000 STRAW 1A1a Electricity and heat production 010101 19 113 010102 19 113 010103 19 113 010104 19 113 010202 22 113 010203 22 113 1A4b i Residential 020200 500 113 1A4c i Agriculture/ Forestry 020300 400 113 FISH & RAPE OIL 1A1a Electricity and heat production 010101 0.882 010102 0.882 010103 0.882 010202 0.882 010203 0.882 1A2 Industry 030105 0.882 1A4b i Residential 020200 10 BIOGAS 1A1a Electricity and heat production 010102 0.025 010103 0.025 010105 0.96 190 010203 0.025 010205 0.96 190 1A2 Industry 030100 0.025 030102 0.025 030103 0.025 030105 0.96 190 1A4a Commercial/ Institutional 020100 2 020103 2 020105 0.96 190 1A4c i Agriculture/ Forestry 020300 2 020304 0.96 190 BIO PROD GAS 1A1a Electricity and heat production 010105 1.7 1A2 Industry 030105 1.7 1A4a Commercial/ Institutional 020105 1.7 WASTE MUNICIP. WASTES 1A1a Electricity and heat production 010102 5 4300 010103 5 4300 010203 5 4300 1A2 Industry 030102 5 4300 1A4a Commercial/ Institutional 020103 5 4300 GAS NATURAL GAS 1A1a Electricity and heat production 010101 0.025 010102 0.025 010103 0.025 010104 0.025 010105 0.57 010202 0.025 010203 0.025 010205 0.57 1A1c Other energy industries 010504 0.025 010505 0.57 1A2 Industry 030100 0.025 030103 0.025 030104 0.025 030105 0.57 1A4a Commercial/ Institutional 020100 2 020103 2 020105 0.57 1A4b i Residential 020200 2 020202 2 020204 0.57 1A4c i Agriculture/ Forestry 020300 2 020303 2
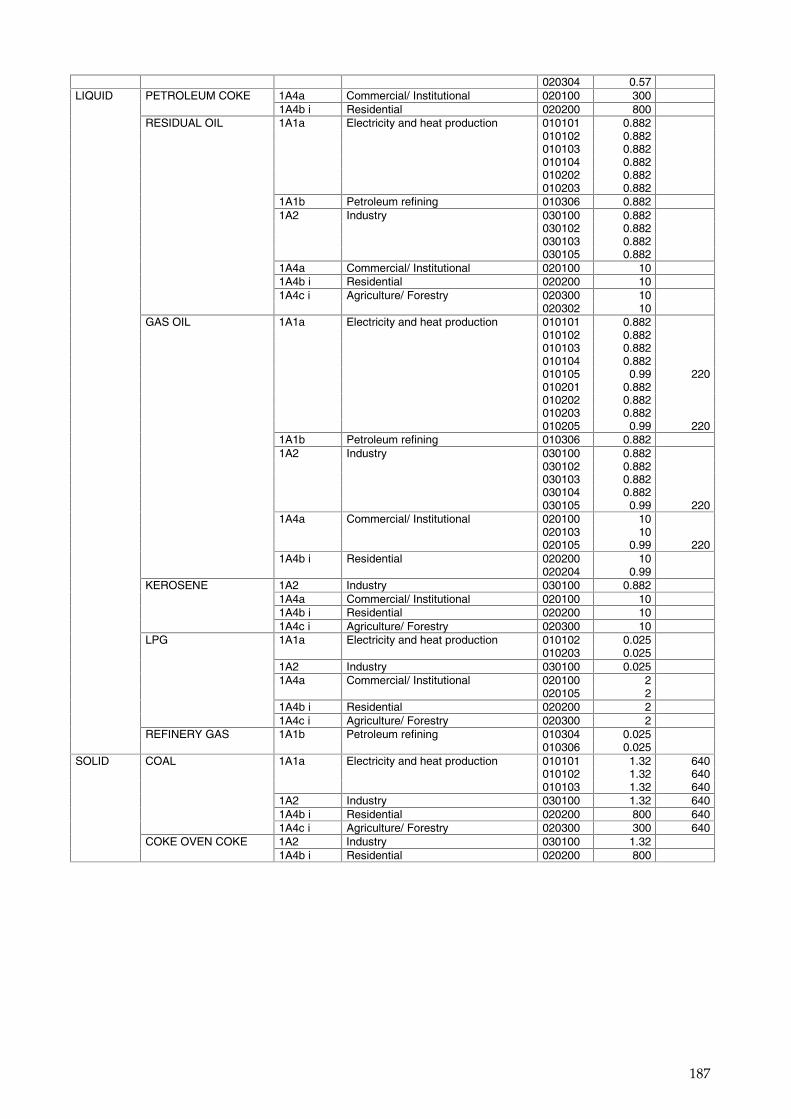
187
020304 0.57 LIQUID PETROLEUM COKE 1A4a Commercial/ Institutional 020100 300 1A4b i Residential 020200 800 RESIDUAL OIL 1A1a Electricity and heat production 010101 0.882 010102 0.882 010103 0.882 010104 0.882 010202 0.882 010203 0.882 1A1b Petroleum refining 010306 0.882 1A2 Industry 030100 0.882 030102 0.882 030103 0.882 030105 0.882 1A4a Commercial/ Institutional 020100 10 1A4b i Residential 020200 10 1A4c i Agriculture/ Forestry 020300 10 020302 10 GAS OIL 1A1a Electricity and heat production 010101 0.882 010102 0.882 010103 0.882 010104 0.882 010105 0.99 220 010201 0.882 010202 0.882 010203 0.882 010205 0.99 220 1A1b Petroleum refining 010306 0.882 1A2 Industry 030100 0.882 030102 0.882 030103 0.882 030104 0.882 030105 0.99 220 1A4a Commercial/ Institutional 020100 10 020103 10 020105 0.99 220 1A4b i Residential 020200 10 020204 0.99 KEROSENE 1A2 Industry 030100 0.882 1A4a Commercial/ Institutional 020100 10 1A4b i Residential 020200 10 1A4c i Agriculture/ Forestry 020300 10 LPG 1A1a Electricity and heat production 010102 0.025 010203 0.025 1A2 Industry 030100 0.025 1A4a Commercial/ Institutional 020100 2 020105 2 1A4b i Residential 020200 2 1A4c i Agriculture/ Forestry 020300 2 REFINERY GAS 1A1b Petroleum refining 010304 0.025 010306 0.025 SOLID COAL 1A1a Electricity and heat production 010101 1.32 640 010102 1.32 640 010103 1.32 640 1A2 Industry 030100 1.32 640 1A4b i Residential 020200 800 640 1A4c i Agriculture/ Forestry 020300 300 640 COKE OVEN COKE 1A2 Industry 030100 1.32 1A4b i Residential 020200 800
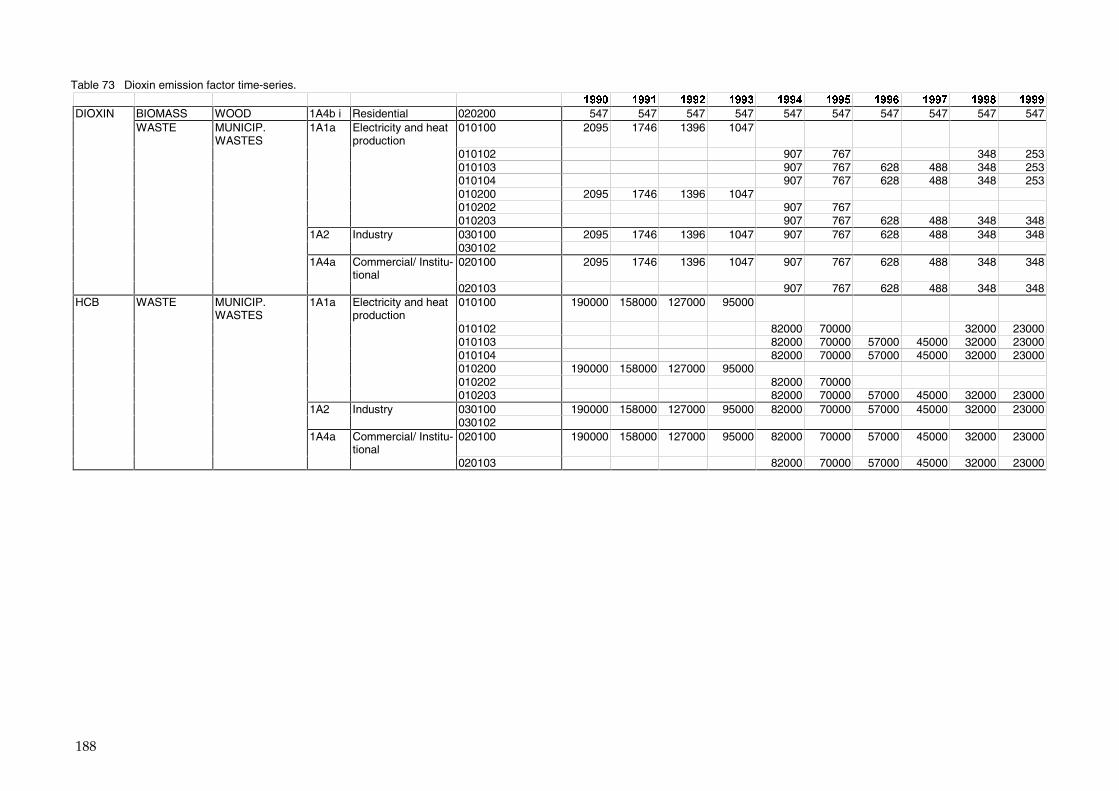
188
Table 73 Dioxin emission factor time-series. � � � � � � ����� ����� ����� ����� ����� ����� ����� ���� ���� �����
DIOXIN BIOMASS WOOD 1A4b i Residential 020200 547 547 547 547 547 547 547 547 547 547 WASTE MUNICIP.
WASTES 1A1a Electricity and heat
production 010100 2095 1746 1396 1047
010102 907 767 348 253 010103 907 767 628 488 348 253 010104 907 767 628 488 348 253 010200 2095 1746 1396 1047 010202 907 767 010203 907 767 628 488 348 348 1A2 Industry 030100 2095 1746 1396 1047 907 767 628 488 348 348 030102 1A4a Commercial/ Institu-
tional 020100 2095 1746 1396 1047 907 767 628 488 348 348
020103 907 767 628 488 348 348 HCB WASTE MUNICIP.
WASTES 1A1a Electricity and heat
production 010100 190000 158000 127000 95000
010102 82000 70000 32000 23000 010103 82000 70000 57000 45000 32000 23000 010104 82000 70000 57000 45000 32000 23000 010200 190000 158000 127000 95000 010202 82000 70000 010203 82000 70000 57000 45000 32000 23000 1A2 Industry 030100 190000 158000 127000 95000 82000 70000 57000 45000 32000 23000 030102 1A4a Commercial/ Institu-
tional 020100 190000 158000 127000 95000 82000 70000 57000 45000 32000 23000
020103 82000 70000 57000 45000 32000 23000
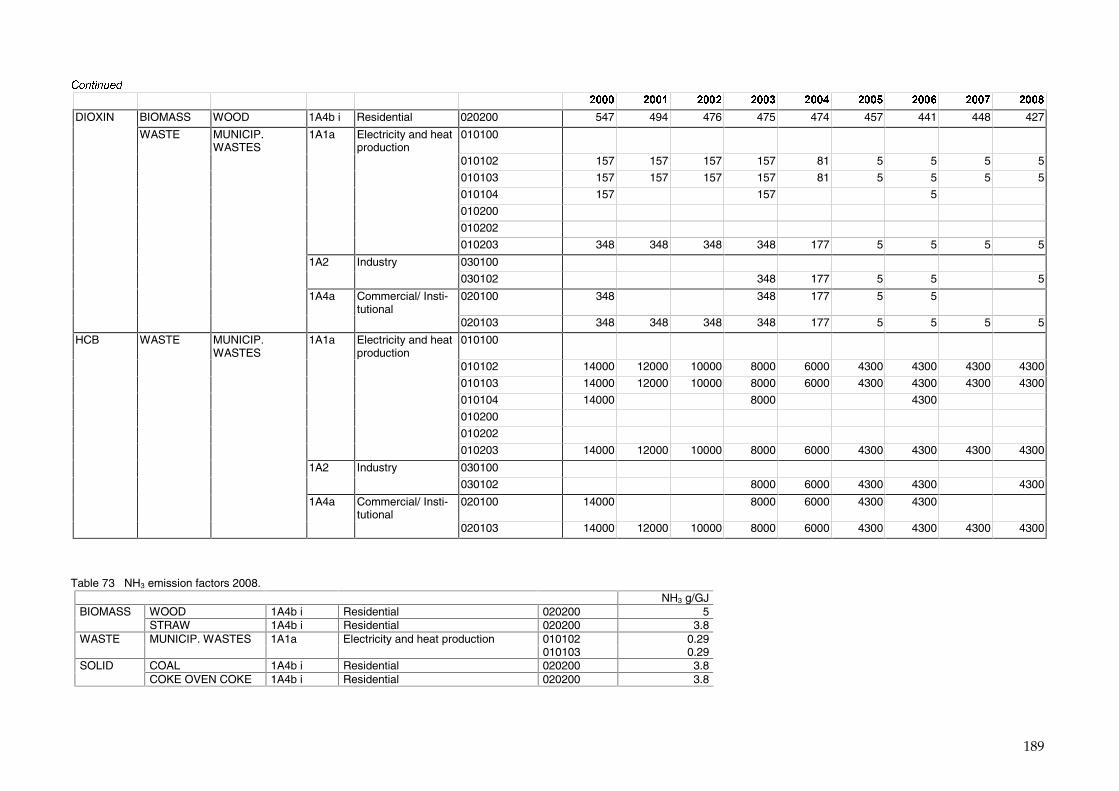
189
����������
� � � � � � ����� ����� ����� ����� ����� ����� ����� ���� ����
DIOXIN BIOMASS WOOD 1A4b i Residential 020200 547 494 476 475 474 457 441 448 427
WASTE MUNICIP. WASTES
1A1a Electricity and heat production
010100
010102 157 157 157 157 81 5 5 5 5
010103 157 157 157 157 81 5 5 5 5
010104 157 157 5
010200
010202
010203 348 348 348 348 177 5 5 5 5
1A2 Industry 030100
030102 348 177 5 5 5
1A4a Commercial/ Insti-tutional
020100 348 348 177 5 5
020103 348 348 348 348 177 5 5 5 5
HCB WASTE MUNICIP. WASTES
1A1a Electricity and heat production
010100
010102 14000 12000 10000 8000 6000 4300 4300 4300 4300
010103 14000 12000 10000 8000 6000 4300 4300 4300 4300
010104 14000 8000 4300
010200
010202
010203 14000 12000 10000 8000 6000 4300 4300 4300 4300
1A2 Industry 030100
030102 8000 6000 4300 4300 4300
1A4a Commercial/ Insti-tutional
020100 14000 8000 6000 4300 4300
020103 14000 12000 10000 8000 6000 4300 4300 4300 4300
Table 73 NH3 emission factors 2008. NH3 g/GJ BIOMASS WOOD 1A4b i Residential 020200 5 STRAW 1A4b i Residential 020200 3.8 WASTE MUNICIP. WASTES 1A1a Electricity and heat production 010102 0.29 010103 0.29 SOLID COAL 1A4b i Residential 020200 3.8 COKE OVEN COKE 1A4b i Residential 020200 3.8
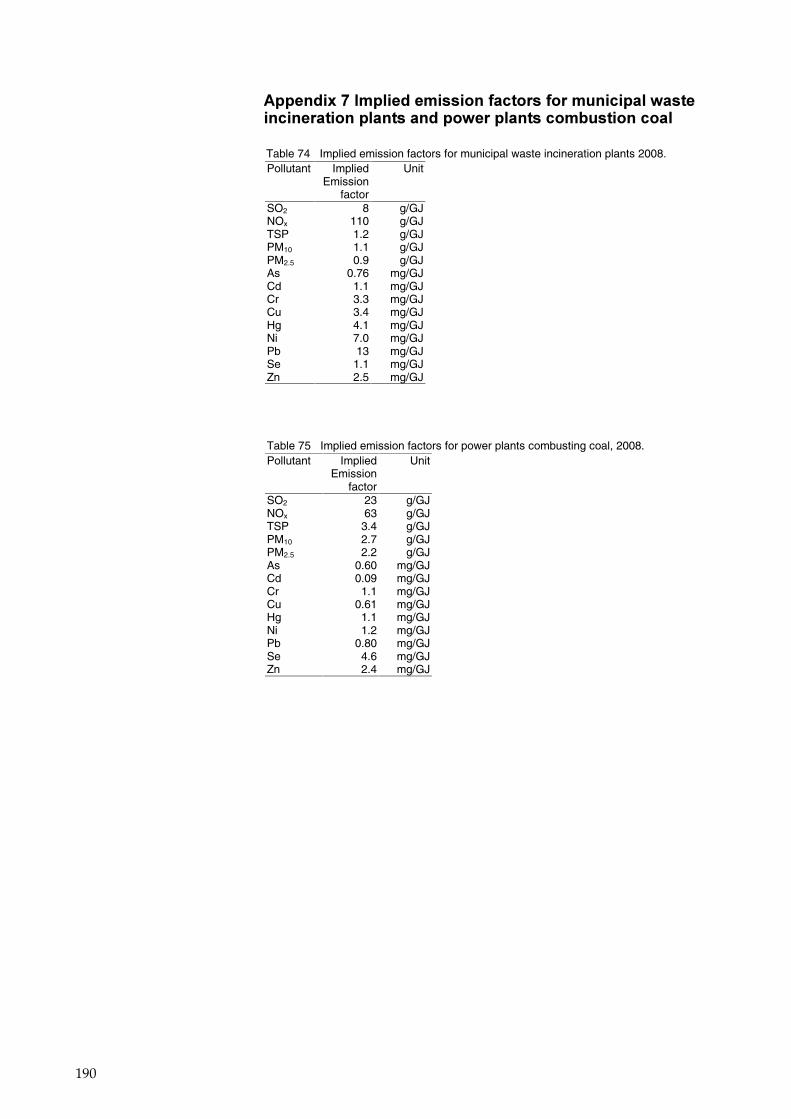
190
�������������������� ���������� ����������������� ��������������������� ���������������� ������ ����������
Table 74 Implied emission factors for municipal waste incineration plants 2008. Pollutant Implied
Emission factor
Unit
SO2 8 g/GJ NOx 110 g/GJ TSP 1.2 g/GJ PM10 1.1 g/GJ PM2.5 0.9 g/GJ As 0.76 mg/GJ Cd 1.1 mg/GJ Cr 3.3 mg/GJ Cu 3.4 mg/GJ Hg 4.1 mg/GJ Ni 7.0 mg/GJ Pb 13 mg/GJ Se 1.1 mg/GJ Zn 2.5 mg/GJ
�
Table 75 Implied emission factors for power plants combusting coal, 2008. Pollutant Implied
Emission factor
Unit
SO2 23 g/GJ NOx 63 g/GJ TSP 3.4 g/GJ PM10 2.7 g/GJ PM2.5 2.2 g/GJ As 0.60 mg/GJ Cd 0.09 mg/GJ Cr 1.1 mg/GJ Cu 0.61 mg/GJ Hg 1.1 mg/GJ Ni 1.2 mg/GJ Pb 0.80 mg/GJ Se 4.6 mg/GJ Zn 2.4 mg/GJ
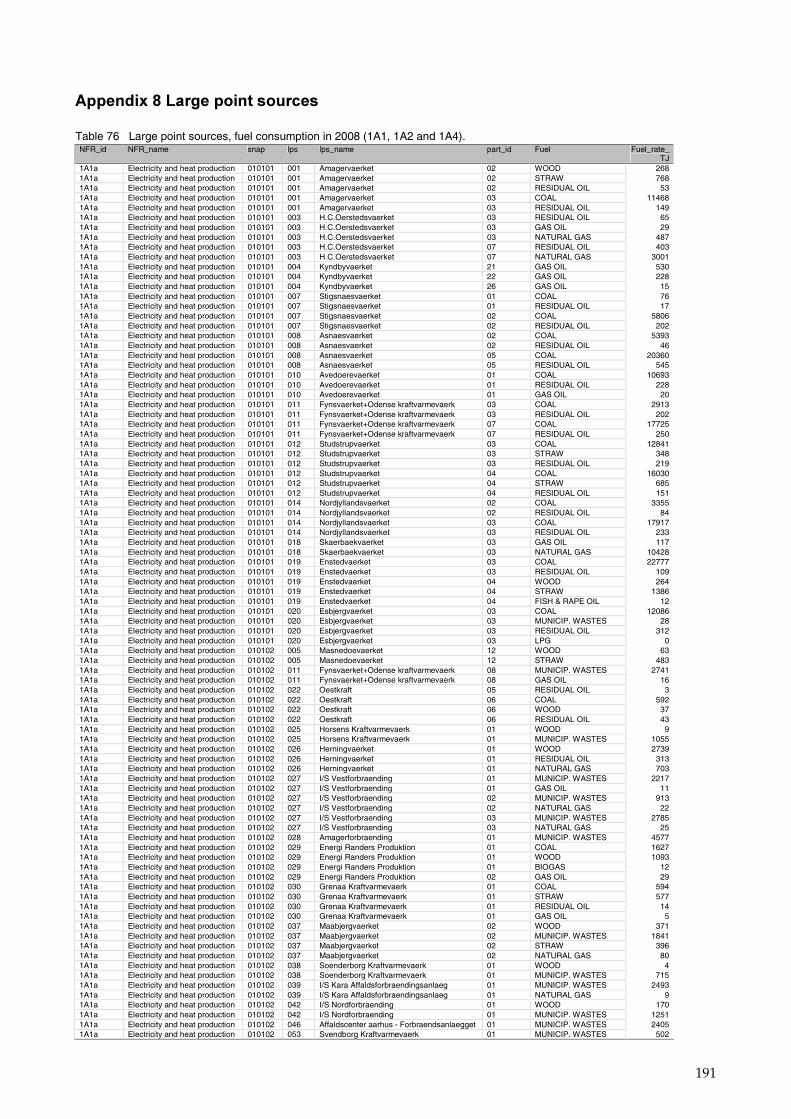
191
����������������������� ����� �
Table 76 Large point sources, fuel consumption in 2008 (1A1, 1A2 and 1A4). NFR_id NFR_name snap lps lps_name part_id Fuel Fuel_rate_
TJ 1A1a Electricity and heat production 010101 001 Amagervaerket 02 WOOD 268 1A1a Electricity and heat production 010101 001 Amagervaerket 02 STRAW 768 1A1a Electricity and heat production 010101 001 Amagervaerket 02 RESIDUAL OIL 53 1A1a Electricity and heat production 010101 001 Amagervaerket 03 COAL 11468 1A1a Electricity and heat production 010101 001 Amagervaerket 03 RESIDUAL OIL 149 1A1a Electricity and heat production 010101 003 H.C.Oerstedsvaerket 03 RESIDUAL OIL 65 1A1a Electricity and heat production 010101 003 H.C.Oerstedsvaerket 03 GAS OIL 29 1A1a Electricity and heat production 010101 003 H.C.Oerstedsvaerket 03 NATURAL GAS 487 1A1a Electricity and heat production 010101 003 H.C.Oerstedsvaerket 07 RESIDUAL OIL 403 1A1a Electricity and heat production 010101 003 H.C.Oerstedsvaerket 07 NATURAL GAS 3001 1A1a Electricity and heat production 010101 004 Kyndbyvaerket 21 GAS OIL 530 1A1a Electricity and heat production 010101 004 Kyndbyvaerket 22 GAS OIL 228 1A1a Electricity and heat production 010101 004 Kyndbyvaerket 26 GAS OIL 15 1A1a Electricity and heat production 010101 007 Stigsnaesvaerket 01 COAL 76 1A1a Electricity and heat production 010101 007 Stigsnaesvaerket 01 RESIDUAL OIL 17 1A1a Electricity and heat production 010101 007 Stigsnaesvaerket 02 COAL 5806 1A1a Electricity and heat production 010101 007 Stigsnaesvaerket 02 RESIDUAL OIL 202 1A1a Electricity and heat production 010101 008 Asnaesvaerket 02 COAL 5393 1A1a Electricity and heat production 010101 008 Asnaesvaerket 02 RESIDUAL OIL 46 1A1a Electricity and heat production 010101 008 Asnaesvaerket 05 COAL 20360 1A1a Electricity and heat production 010101 008 Asnaesvaerket 05 RESIDUAL OIL 545 1A1a Electricity and heat production 010101 010 Avedoerevaerket 01 COAL 10693 1A1a Electricity and heat production 010101 010 Avedoerevaerket 01 RESIDUAL OIL 228 1A1a Electricity and heat production 010101 010 Avedoerevaerket 01 GAS OIL 20 1A1a Electricity and heat production 010101 011 Fynsvaerket+Odense kraftvarmevaerk 03 COAL 2913 1A1a Electricity and heat production 010101 011 Fynsvaerket+Odense kraftvarmevaerk 03 RESIDUAL OIL 202 1A1a Electricity and heat production 010101 011 Fynsvaerket+Odense kraftvarmevaerk 07 COAL 17725 1A1a Electricity and heat production 010101 011 Fynsvaerket+Odense kraftvarmevaerk 07 RESIDUAL OIL 250 1A1a Electricity and heat production 010101 012 Studstrupvaerket 03 COAL 12841 1A1a Electricity and heat production 010101 012 Studstrupvaerket 03 STRAW 348 1A1a Electricity and heat production 010101 012 Studstrupvaerket 03 RESIDUAL OIL 219 1A1a Electricity and heat production 010101 012 Studstrupvaerket 04 COAL 16030 1A1a Electricity and heat production 010101 012 Studstrupvaerket 04 STRAW 685 1A1a Electricity and heat production 010101 012 Studstrupvaerket 04 RESIDUAL OIL 151 1A1a Electricity and heat production 010101 014 Nordjyllandsvaerket 02 COAL 3355 1A1a Electricity and heat production 010101 014 Nordjyllandsvaerket 02 RESIDUAL OIL 84 1A1a Electricity and heat production 010101 014 Nordjyllandsvaerket 03 COAL 17917 1A1a Electricity and heat production 010101 014 Nordjyllandsvaerket 03 RESIDUAL OIL 233 1A1a Electricity and heat production 010101 018 Skaerbaekvaerket 03 GAS OIL 117 1A1a Electricity and heat production 010101 018 Skaerbaekvaerket 03 NATURAL GAS 10428 1A1a Electricity and heat production 010101 019 Enstedvaerket 03 COAL 22777 1A1a Electricity and heat production 010101 019 Enstedvaerket 03 RESIDUAL OIL 109 1A1a Electricity and heat production 010101 019 Enstedvaerket 04 WOOD 264 1A1a Electricity and heat production 010101 019 Enstedvaerket 04 STRAW 1386 1A1a Electricity and heat production 010101 019 Enstedvaerket 04 FISH & RAPE OIL 12 1A1a Electricity and heat production 010101 020 Esbjergvaerket 03 COAL 12086 1A1a Electricity and heat production 010101 020 Esbjergvaerket 03 MUNICIP. WASTES 28 1A1a Electricity and heat production 010101 020 Esbjergvaerket 03 RESIDUAL OIL 312 1A1a Electricity and heat production 010101 020 Esbjergvaerket 03 LPG 0 1A1a Electricity and heat production 010102 005 Masnedoevaerket 12 WOOD 63 1A1a Electricity and heat production 010102 005 Masnedoevaerket 12 STRAW 483 1A1a Electricity and heat production 010102 011 Fynsvaerket+Odense kraftvarmevaerk 08 MUNICIP. WASTES 2741 1A1a Electricity and heat production 010102 011 Fynsvaerket+Odense kraftvarmevaerk 08 GAS OIL 16 1A1a Electricity and heat production 010102 022 Oestkraft 05 RESIDUAL OIL 3 1A1a Electricity and heat production 010102 022 Oestkraft 06 COAL 592 1A1a Electricity and heat production 010102 022 Oestkraft 06 WOOD 37 1A1a Electricity and heat production 010102 022 Oestkraft 06 RESIDUAL OIL 43 1A1a Electricity and heat production 010102 025 Horsens Kraftvarmevaerk 01 WOOD 9 1A1a Electricity and heat production 010102 025 Horsens Kraftvarmevaerk 01 MUNICIP. WASTES 1055 1A1a Electricity and heat production 010102 026 Herningvaerket 01 WOOD 2739 1A1a Electricity and heat production 010102 026 Herningvaerket 01 RESIDUAL OIL 313 1A1a Electricity and heat production 010102 026 Herningvaerket 01 NATURAL GAS 703 1A1a Electricity and heat production 010102 027 I/S Vestforbraending 01 MUNICIP. WASTES 2217 1A1a Electricity and heat production 010102 027 I/S Vestforbraending 01 GAS OIL 11 1A1a Electricity and heat production 010102 027 I/S Vestforbraending 02 MUNICIP. WASTES 913 1A1a Electricity and heat production 010102 027 I/S Vestforbraending 02 NATURAL GAS 22 1A1a Electricity and heat production 010102 027 I/S Vestforbraending 03 MUNICIP. WASTES 2785 1A1a Electricity and heat production 010102 027 I/S Vestforbraending 03 NATURAL GAS 25 1A1a Electricity and heat production 010102 028 Amagerforbraending 01 MUNICIP. WASTES 4577 1A1a Electricity and heat production 010102 029 Energi Randers Produktion 01 COAL 1627 1A1a Electricity and heat production 010102 029 Energi Randers Produktion 01 WOOD 1093 1A1a Electricity and heat production 010102 029 Energi Randers Produktion 01 BIOGAS 12 1A1a Electricity and heat production 010102 029 Energi Randers Produktion 02 GAS OIL 29 1A1a Electricity and heat production 010102 030 Grenaa Kraftvarmevaerk 01 COAL 594 1A1a Electricity and heat production 010102 030 Grenaa Kraftvarmevaerk 01 STRAW 577 1A1a Electricity and heat production 010102 030 Grenaa Kraftvarmevaerk 01 RESIDUAL OIL 14 1A1a Electricity and heat production 010102 030 Grenaa Kraftvarmevaerk 01 GAS OIL 5 1A1a Electricity and heat production 010102 037 Maabjergvaerket 02 WOOD 371 1A1a Electricity and heat production 010102 037 Maabjergvaerket 02 MUNICIP. WASTES 1841 1A1a Electricity and heat production 010102 037 Maabjergvaerket 02 STRAW 396 1A1a Electricity and heat production 010102 037 Maabjergvaerket 02 NATURAL GAS 80 1A1a Electricity and heat production 010102 038 Soenderborg Kraftvarmevaerk 01 WOOD 4 1A1a Electricity and heat production 010102 038 Soenderborg Kraftvarmevaerk 01 MUNICIP. WASTES 715 1A1a Electricity and heat production 010102 039 I/S Kara Affaldsforbraendingsanlaeg 01 MUNICIP. WASTES 2493 1A1a Electricity and heat production 010102 039 I/S Kara Affaldsforbraendingsanlaeg 01 NATURAL GAS 9 1A1a Electricity and heat production 010102 042 I/S Nordforbraending 01 WOOD 170 1A1a Electricity and heat production 010102 042 I/S Nordforbraending 01 MUNICIP. WASTES 1251 1A1a Electricity and heat production 010102 046 Affaldscenter aarhus - Forbraendsanlaegget 01 MUNICIP. WASTES 2405 1A1a Electricity and heat production 010102 053 Svendborg Kraftvarmevaerk 01 MUNICIP. WASTES 502
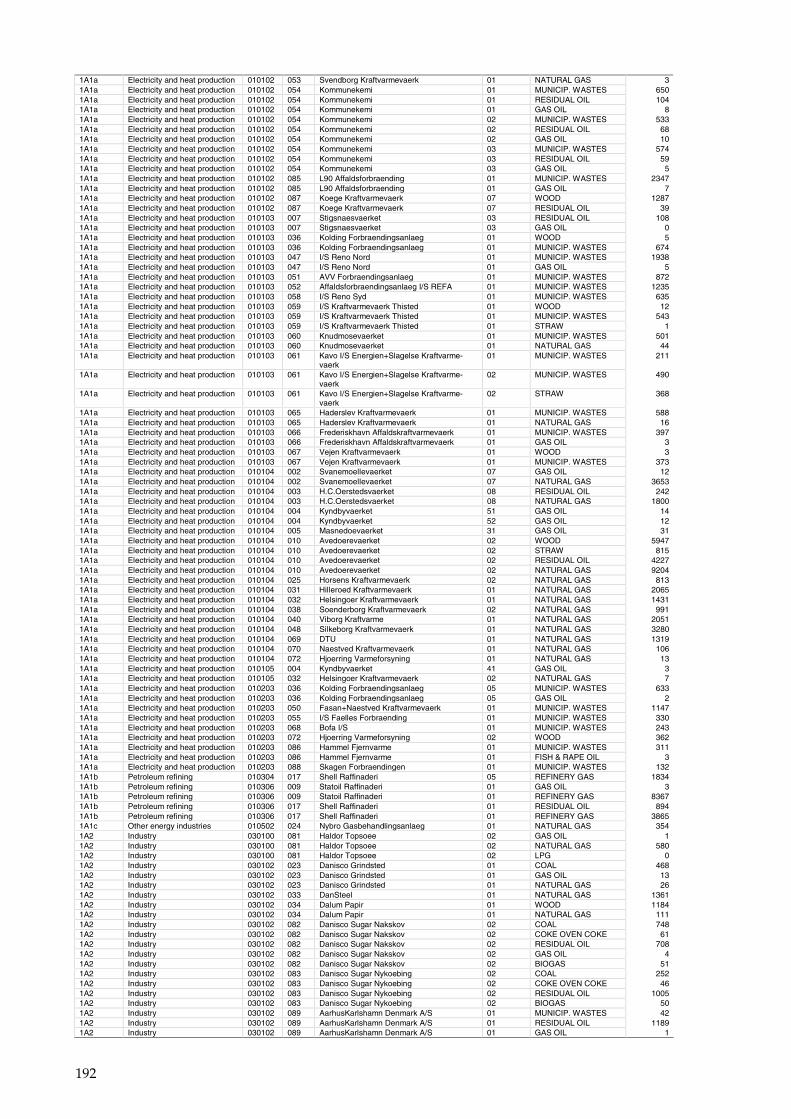
192
1A1a Electricity and heat production 010102 053 Svendborg Kraftvarmevaerk 01 NATURAL GAS 3 1A1a Electricity and heat production 010102 054 Kommunekemi 01 MUNICIP. WASTES 650 1A1a Electricity and heat production 010102 054 Kommunekemi 01 RESIDUAL OIL 104 1A1a Electricity and heat production 010102 054 Kommunekemi 01 GAS OIL 8 1A1a Electricity and heat production 010102 054 Kommunekemi 02 MUNICIP. WASTES 533 1A1a Electricity and heat production 010102 054 Kommunekemi 02 RESIDUAL OIL 68 1A1a Electricity and heat production 010102 054 Kommunekemi 02 GAS OIL 10 1A1a Electricity and heat production 010102 054 Kommunekemi 03 MUNICIP. WASTES 574 1A1a Electricity and heat production 010102 054 Kommunekemi 03 RESIDUAL OIL 59 1A1a Electricity and heat production 010102 054 Kommunekemi 03 GAS OIL 5 1A1a Electricity and heat production 010102 085 L90 Affaldsforbraending 01 MUNICIP. WASTES 2347 1A1a Electricity and heat production 010102 085 L90 Affaldsforbraending 01 GAS OIL 7 1A1a Electricity and heat production 010102 087 Koege Kraftvarmevaerk 07 WOOD 1287 1A1a Electricity and heat production 010102 087 Koege Kraftvarmevaerk 07 RESIDUAL OIL 39 1A1a Electricity and heat production 010103 007 Stigsnaesvaerket 03 RESIDUAL OIL 108 1A1a Electricity and heat production 010103 007 Stigsnaesvaerket 03 GAS OIL 0 1A1a Electricity and heat production 010103 036 Kolding Forbraendingsanlaeg 01 WOOD 5 1A1a Electricity and heat production 010103 036 Kolding Forbraendingsanlaeg 01 MUNICIP. WASTES 674 1A1a Electricity and heat production 010103 047 I/S Reno Nord 01 MUNICIP. WASTES 1938 1A1a Electricity and heat production 010103 047 I/S Reno Nord 01 GAS OIL 5 1A1a Electricity and heat production 010103 051 AVV Forbraendingsanlaeg 01 MUNICIP. WASTES 872 1A1a Electricity and heat production 010103 052 Affaldsforbraendingsanlaeg I/S REFA 01 MUNICIP. WASTES 1235 1A1a Electricity and heat production 010103 058 I/S Reno Syd 01 MUNICIP. WASTES 635 1A1a Electricity and heat production 010103 059 I/S Kraftvarmevaerk Thisted 01 WOOD 12 1A1a Electricity and heat production 010103 059 I/S Kraftvarmevaerk Thisted 01 MUNICIP. WASTES 543 1A1a Electricity and heat production 010103 059 I/S Kraftvarmevaerk Thisted 01 STRAW 1 1A1a Electricity and heat production 010103 060 Knudmosevaerket 01 MUNICIP. WASTES 501 1A1a Electricity and heat production 010103 060 Knudmosevaerket 01 NATURAL GAS 44 1A1a Electricity and heat production 010103 061 Kavo I/S Energien+Slagelse Kraftvarme-
vaerk 01 MUNICIP. WASTES 211
1A1a Electricity and heat production 010103 061 Kavo I/S Energien+Slagelse Kraftvarme-vaerk
02 MUNICIP. WASTES 490
1A1a Electricity and heat production 010103 061 Kavo I/S Energien+Slagelse Kraftvarme-vaerk
02 STRAW 368
1A1a Electricity and heat production 010103 065 Haderslev Kraftvarmevaerk 01 MUNICIP. WASTES 588 1A1a Electricity and heat production 010103 065 Haderslev Kraftvarmevaerk 01 NATURAL GAS 16 1A1a Electricity and heat production 010103 066 Frederiskhavn Affaldskraftvarmevaerk 01 MUNICIP. WASTES 397 1A1a Electricity and heat production 010103 066 Frederiskhavn Affaldskraftvarmevaerk 01 GAS OIL 3 1A1a Electricity and heat production 010103 067 Vejen Kraftvarmevaerk 01 WOOD 3 1A1a Electricity and heat production 010103 067 Vejen Kraftvarmevaerk 01 MUNICIP. WASTES 373 1A1a Electricity and heat production 010104 002 Svanemoellevaerket 07 GAS OIL 12 1A1a Electricity and heat production 010104 002 Svanemoellevaerket 07 NATURAL GAS 3653 1A1a Electricity and heat production 010104 003 H.C.Oerstedsvaerket 08 RESIDUAL OIL 242 1A1a Electricity and heat production 010104 003 H.C.Oerstedsvaerket 08 NATURAL GAS 1800 1A1a Electricity and heat production 010104 004 Kyndbyvaerket 51 GAS OIL 14 1A1a Electricity and heat production 010104 004 Kyndbyvaerket 52 GAS OIL 12 1A1a Electricity and heat production 010104 005 Masnedoevaerket 31 GAS OIL 31 1A1a Electricity and heat production 010104 010 Avedoerevaerket 02 WOOD 5947 1A1a Electricity and heat production 010104 010 Avedoerevaerket 02 STRAW 815 1A1a Electricity and heat production 010104 010 Avedoerevaerket 02 RESIDUAL OIL 4227 1A1a Electricity and heat production 010104 010 Avedoerevaerket 02 NATURAL GAS 9204 1A1a Electricity and heat production 010104 025 Horsens Kraftvarmevaerk 02 NATURAL GAS 813 1A1a Electricity and heat production 010104 031 Hilleroed Kraftvarmevaerk 01 NATURAL GAS 2065 1A1a Electricity and heat production 010104 032 Helsingoer Kraftvarmevaerk 01 NATURAL GAS 1431 1A1a Electricity and heat production 010104 038 Soenderborg Kraftvarmevaerk 02 NATURAL GAS 991 1A1a Electricity and heat production 010104 040 Viborg Kraftvarme 01 NATURAL GAS 2051 1A1a Electricity and heat production 010104 048 Silkeborg Kraftvarmevaerk 01 NATURAL GAS 3280 1A1a Electricity and heat production 010104 069 DTU 01 NATURAL GAS 1319 1A1a Electricity and heat production 010104 070 Naestved Kraftvarmevaerk 01 NATURAL GAS 106 1A1a Electricity and heat production 010104 072 Hjoerring Varmeforsyning 01 NATURAL GAS 13 1A1a Electricity and heat production 010105 004 Kyndbyvaerket 41 GAS OIL 3 1A1a Electricity and heat production 010105 032 Helsingoer Kraftvarmevaerk 02 NATURAL GAS 7 1A1a Electricity and heat production 010203 036 Kolding Forbraendingsanlaeg 05 MUNICIP. WASTES 633 1A1a Electricity and heat production 010203 036 Kolding Forbraendingsanlaeg 05 GAS OIL 2 1A1a Electricity and heat production 010203 050 Fasan+Naestved Kraftvarmevaerk 01 MUNICIP. WASTES 1147 1A1a Electricity and heat production 010203 055 I/S Faelles Forbraending 01 MUNICIP. WASTES 330 1A1a Electricity and heat production 010203 068 Bofa I/S 01 MUNICIP. WASTES 243 1A1a Electricity and heat production 010203 072 Hjoerring Varmeforsyning 02 WOOD 362 1A1a Electricity and heat production 010203 086 Hammel Fjernvarme 01 MUNICIP. WASTES 311 1A1a Electricity and heat production 010203 086 Hammel Fjernvarme 01 FISH & RAPE OIL 3 1A1a Electricity and heat production 010203 088 Skagen Forbraendingen 01 MUNICIP. WASTES 132 1A1b Petroleum refining 010304 017 Shell Raffinaderi 05 REFINERY GAS 1834 1A1b Petroleum refining 010306 009 Statoil Raffinaderi 01 GAS OIL 3 1A1b Petroleum refining 010306 009 Statoil Raffinaderi 01 REFINERY GAS 8367 1A1b Petroleum refining 010306 017 Shell Raffinaderi 01 RESIDUAL OIL 894 1A1b Petroleum refining 010306 017 Shell Raffinaderi 01 REFINERY GAS 3865 1A1c Other energy industries 010502 024 Nybro Gasbehandlingsanlaeg 01 NATURAL GAS 354 1A2 Industry 030100 081 Haldor Topsoee 02 GAS OIL 1 1A2 Industry 030100 081 Haldor Topsoee 02 NATURAL GAS 580 1A2 Industry 030100 081 Haldor Topsoee 02 LPG 0 1A2 Industry 030102 023 Danisco Grindsted 01 COAL 468 1A2 Industry 030102 023 Danisco Grindsted 01 GAS OIL 13 1A2 Industry 030102 023 Danisco Grindsted 01 NATURAL GAS 26 1A2 Industry 030102 033 DanSteel 01 NATURAL GAS 1361 1A2 Industry 030102 034 Dalum Papir 01 WOOD 1184 1A2 Industry 030102 034 Dalum Papir 01 NATURAL GAS 111 1A2 Industry 030102 082 Danisco Sugar Nakskov 02 COAL 748 1A2 Industry 030102 082 Danisco Sugar Nakskov 02 COKE OVEN COKE 61 1A2 Industry 030102 082 Danisco Sugar Nakskov 02 RESIDUAL OIL 708 1A2 Industry 030102 082 Danisco Sugar Nakskov 02 GAS OIL 4 1A2 Industry 030102 082 Danisco Sugar Nakskov 02 BIOGAS 51 1A2 Industry 030102 083 Danisco Sugar Nykoebing 02 COAL 252 1A2 Industry 030102 083 Danisco Sugar Nykoebing 02 COKE OVEN COKE 46 1A2 Industry 030102 083 Danisco Sugar Nykoebing 02 RESIDUAL OIL 1005 1A2 Industry 030102 083 Danisco Sugar Nykoebing 02 BIOGAS 50 1A2 Industry 030102 089 AarhusKarlshamn Denmark A/S 01 MUNICIP. WASTES 42 1A2 Industry 030102 089 AarhusKarlshamn Denmark A/S 01 RESIDUAL OIL 1189 1A2 Industry 030102 089 AarhusKarlshamn Denmark A/S 01 GAS OIL 1
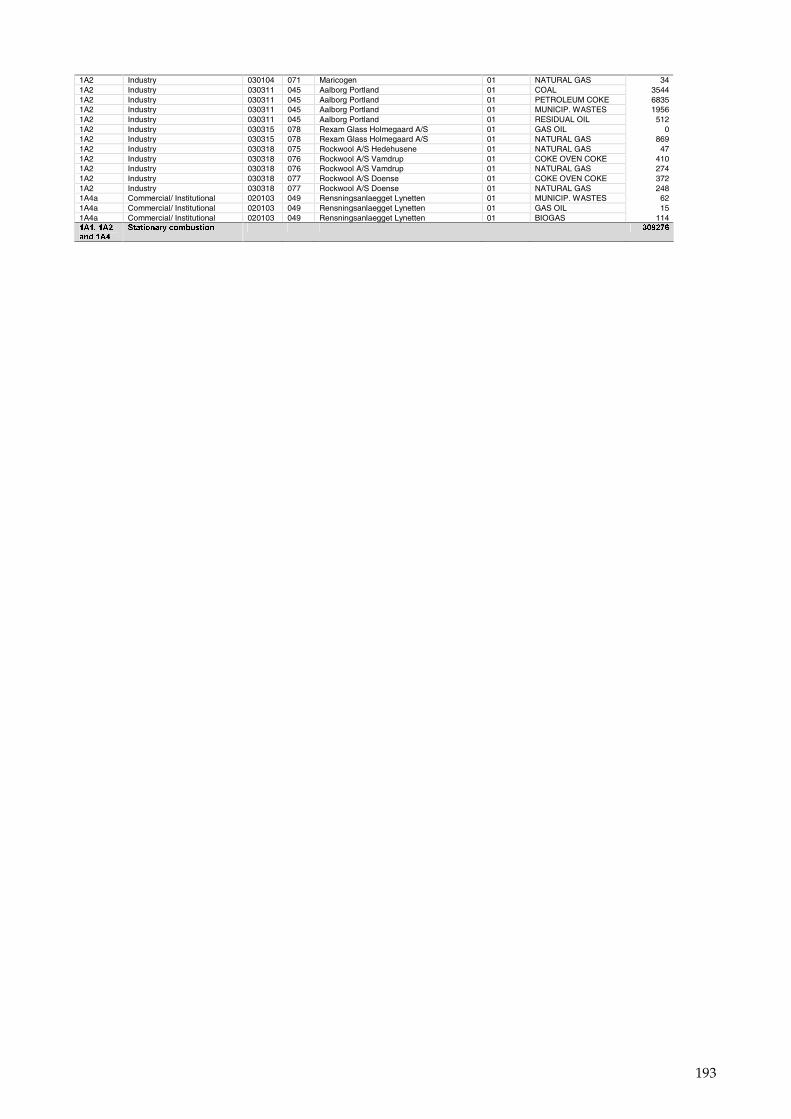
193
1A2 Industry 030104 071 Maricogen 01 NATURAL GAS 34 1A2 Industry 030311 045 Aalborg Portland 01 COAL 3544 1A2 Industry 030311 045 Aalborg Portland 01 PETROLEUM COKE 6835 1A2 Industry 030311 045 Aalborg Portland 01 MUNICIP. WASTES 1956 1A2 Industry 030311 045 Aalborg Portland 01 RESIDUAL OIL 512 1A2 Industry 030315 078 Rexam Glass Holmegaard A/S 01 GAS OIL 0 1A2 Industry 030315 078 Rexam Glass Holmegaard A/S 01 NATURAL GAS 869 1A2 Industry 030318 075 Rockwool A/S Hedehusene 01 NATURAL GAS 47 1A2 Industry 030318 076 Rockwool A/S Vamdrup 01 COKE OVEN COKE 410 1A2 Industry 030318 076 Rockwool A/S Vamdrup 01 NATURAL GAS 274 1A2 Industry 030318 077 Rockwool A/S Doense 01 COKE OVEN COKE 372 1A2 Industry 030318 077 Rockwool A/S Doense 01 NATURAL GAS 248 1A4a Commercial/ Institutional 020103 049 Rensningsanlaegget Lynetten 01 MUNICIP. WASTES 62 1A4a Commercial/ Institutional 020103 049 Rensningsanlaegget Lynetten 01 GAS OIL 15 1A4a Commercial/ Institutional 020103 049 Rensningsanlaegget Lynetten 01 BIOGAS 114 �����������������
����� ������������ �� �� �� �� �� �������
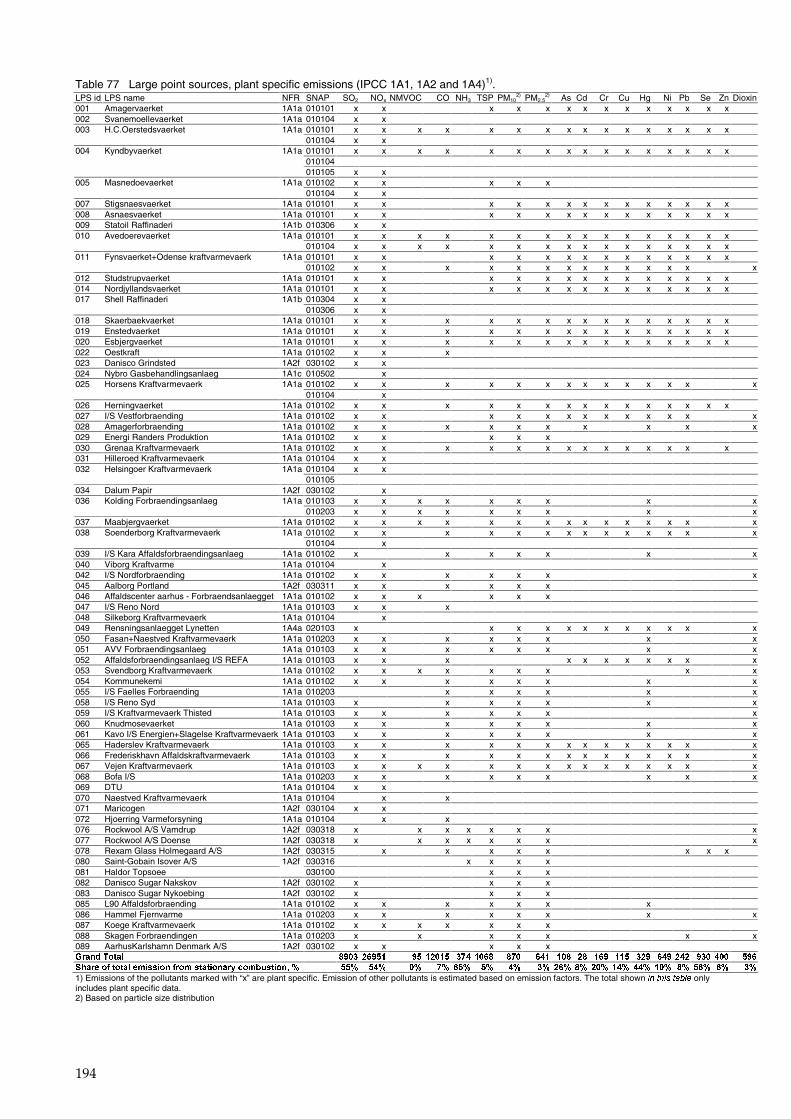
194
Table 77 Large point sources, plant specific emissions (IPCC 1A1, 1A2 and 1A4)1). LPS id LPS name NFR SNAP SO2 NOx NMVOC CO NH3 TSP PM10
2) PM2.52)
As Cd Cr Cu Hg Ni Pb Se Zn Dioxin 001 Amagervaerket 1A1a 010101 x x x x x x x x x x x x x x 002 Svanemoellevaerket 1A1a 010104 x x
010101 x x x x x x x x x x x x x x x x 003 H.C.Oerstedsvaerket 1A1a 010104 x x 010101 x x x x x x x x x x x x x x x x 010104
004 Kyndbyvaerket 1A1a
010105 x x 010102 x x x x x 005 Masnedoevaerket 1A1a 010104 x x
007 Stigsnaesvaerket 1A1a 010101 x x x x x x x x x x x x x x 008 Asnaesvaerket 1A1a 010101 x x x x x x x x x x x x x x 009 Statoil Raffinaderi 1A1b 010306 x x
010101 x x x x x x x x x x x x x x x x 010 Avedoerevaerket 1A1a 010104 x x x x x x x x x x x x x x x x 010101 x x x x x x x x x x x x x x 011 Fynsvaerket+Odense kraftvarmevaerk
1A1a
010102 x x x x x x x x x x x x x x 012 Studstrupvaerket 1A1a 010101 x x x x x x x x x x x x x x 014 Nordjyllandsvaerket 1A1a 010101 x x x x x x x x x x x x x x
010304 x x 017 Shell Raffinaderi 1A1b 010306 x x
018 Skaerbaekvaerket 1A1a 010101 x x x x x x x x x x x x x x x 019 Enstedvaerket 1A1a 010101 x x x x x x x x x x x x x x x 020 Esbjergvaerket 1A1a 010101 x x x x x x x x x x x x x x x 022 Oestkraft 1A1a 010102 x x x 023 Danisco Grindsted 1A2f 030102 x x 024 Nybro Gasbehandlingsanlaeg 1A1c 010502 x
010102 x x x x x x x x x x x x x x 025 Horsens Kraftvarmevaerk 1A1a 010104 x
026 Herningvaerket 1A1a 010102 x x x x x x x x x x x x x x x 027 I/S Vestforbraending 1A1a 010102 x x x x x x x x x x x x x 028 Amagerforbraending 1A1a 010102 x x x x x x x x x x 029 Energi Randers Produktion 1A1a 010102 x x x x x 030 Grenaa Kraftvarmevaerk 1A1a 010102 x x x x x x x x x x x x x x 031 Hilleroed Kraftvarmevaerk 1A1a 010104 x x
010104 x x 032 Helsingoer Kraftvarmevaerk 1A1a 010105
034 Dalum Papir 1A2f 030102 x 010103 x x x x x x x x x 036 Kolding Forbraendingsanlaeg 1A1a 010203 x x x x x x x x x
037 Maabjergvaerket 1A1a 010102 x x x x x x x x x x x x x x x 010102 x x x x x x x x x x x x x x 038 Soenderborg Kraftvarmevaerk 1A1a 010104 x
039 I/S Kara Affaldsforbraendingsanlaeg 1A1a 010102 x x x x x x x 040 Viborg Kraftvarme 1A1a 010104 x 042 I/S Nordforbraending 1A1a 010102 x x x x x x x 045 Aalborg Portland 1A2f 030311 x x x x x x 046 Affaldscenter aarhus - Forbraendsanlaegget 1A1a 010102 x x x x x x 047 I/S Reno Nord 1A1a 010103 x x x 048 Silkeborg Kraftvarmevaerk 1A1a 010104 x 049 Rensningsanlaegget Lynetten 1A4a 020103 x x x x x x x x x x x x 050 Fasan+Naestved Kraftvarmevaerk 1A1a 010203 x x x x x x x x 051 AVV Forbraendingsanlaeg 1A1a 010103 x x x x x x x x 052 Affaldsforbraendingsanlaeg I/S REFA 1A1a 010103 x x x x x x x x x x x 053 Svendborg Kraftvarmevaerk 1A1a 010102 x x x x x x x x x 054 Kommunekemi 1A1a 010102 x x x x x x x x 055 I/S Faelles Forbraending 1A1a 010203 x x x x x x 058 I/S Reno Syd 1A1a 010103 x x x x x x x 059 I/S Kraftvarmevaerk Thisted 1A1a 010103 x x x x x x x 060 Knudmosevaerket 1A1a 010103 x x x x x x x x 061 Kavo I/S Energien+Slagelse Kraftvarmevaerk 1A1a 010103 x x x x x x x x 065 Haderslev Kraftvarmevaerk 1A1a 010103 x x x x x x x x x x x x x x 066 Frederiskhavn Affaldskraftvarmevaerk 1A1a 010103 x x x x x x x x x x x x x x 067 Vejen Kraftvarmevaerk 1A1a 010103 x x x x x x x x x x x x x x x 068 Bofa I/S 1A1a 010203 x x x x x x x x x 069 DTU 1A1a 010104 x x 070 Naestved Kraftvarmevaerk 1A1a 010104 x x 071 Maricogen 1A2f 030104 x x 072 Hjoerring Varmeforsyning 1A1a 010104 x x 076 Rockwool A/S Vamdrup 1A2f 030318 x x x x x x x x 077 Rockwool A/S Doense 1A2f 030318 x x x x x x x x 078 Rexam Glass Holmegaard A/S 1A2f 030315 x x x x x x x x 080 Saint-Gobain Isover A/S 030316 x x x x 081 Haldor Topsoee
1A2f 030100 x x x
082 Danisco Sugar Nakskov 1A2f 030102 x x x x 083 Danisco Sugar Nykoebing 1A2f 030102 x x x x 085 L90 Affaldsforbraending 1A1a 010102 x x x x x x x 086 Hammel Fjernvarme 1A1a 010203 x x x x x x x x 087 Koege Kraftvarmevaerk 1A1a 010102 x x x x x x x 088 Skagen Forbraendingen 1A1a 010203 x x x x x x x 089 AarhusKarlshamn Denmark A/S 1A2f 030102 x x x x x ����������� � � �� � ������ ��� ������ ��� ���� ��� ���� ��� �� ���� ���� ��� �������� � �� ���� ����
��������������������������������������������������� � �� � �� � � � � � �� � � � � � � �� � � �� ��� � �� � �� � � �� � � � �
1) Emissions of the pollutants marked with “x” are plant specific. Emission of other pollutants is estimated based on emission factors. The total shown������������� only includes plant specific data. 2) Based on particle size distribution
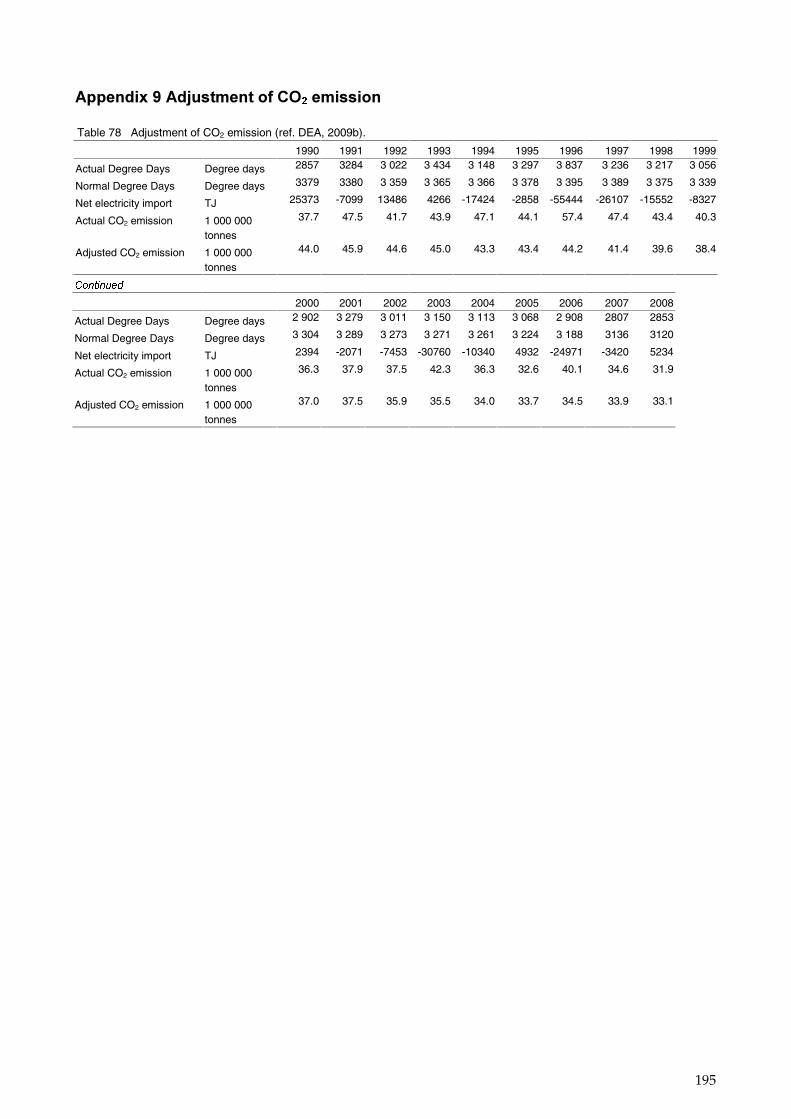
195
�������������� ��� �����������������
Table 78 Adjustment of CO2 emission (ref. DEA, 2009b).
1990 1991 1992 1993 1994 1995 1996 1997 1998 1999
Actual Degree Days Degree days 2857 3284 3 022 3 434 3 148 3 297 3 837 3 236 3 217 3 056
Normal Degree Days Degree days 3379 3380 3 359 3 365 3 366 3 378 3 395 3 389 3 375 3 339
Net electricity import TJ 25373 -7099 13486 4266 -17424 -2858 -55444 -26107 -15552 -8327
Actual CO2 emission 1 000 000 tonnes
37.7 47.5 41.7 43.9 47.1 44.1 57.4 47.4 43.4 40.3
Adjusted CO2 emission 1 000 000 tonnes
44.0 45.9 44.6 45.0 43.3 43.4 44.2 41.4 39.6 38.4
����������
2000 2001 2002 2003 2004 2005 2006 2007 2008
Actual Degree Days Degree days 2 902 3 279 3 011 3 150 3 113 3 068 2 908 2807 2853
Normal Degree Days Degree days 3 304 3 289 3 273 3 271 3 261 3 224 3 188 3136 3120
Net electricity import TJ 2394 -2071 -7453 -30760 -10340 4932 -24971 -3420 5234
Actual CO2 emission 1 000 000 tonnes
36.3 37.9 37.5 42.3 36.3 32.6 40.1 34.6 31.9
Adjusted CO2 emission 1 000 000 tonnes
37.0 37.5 35.9 35.5 34.0 33.7 34.5 33.9 33.1
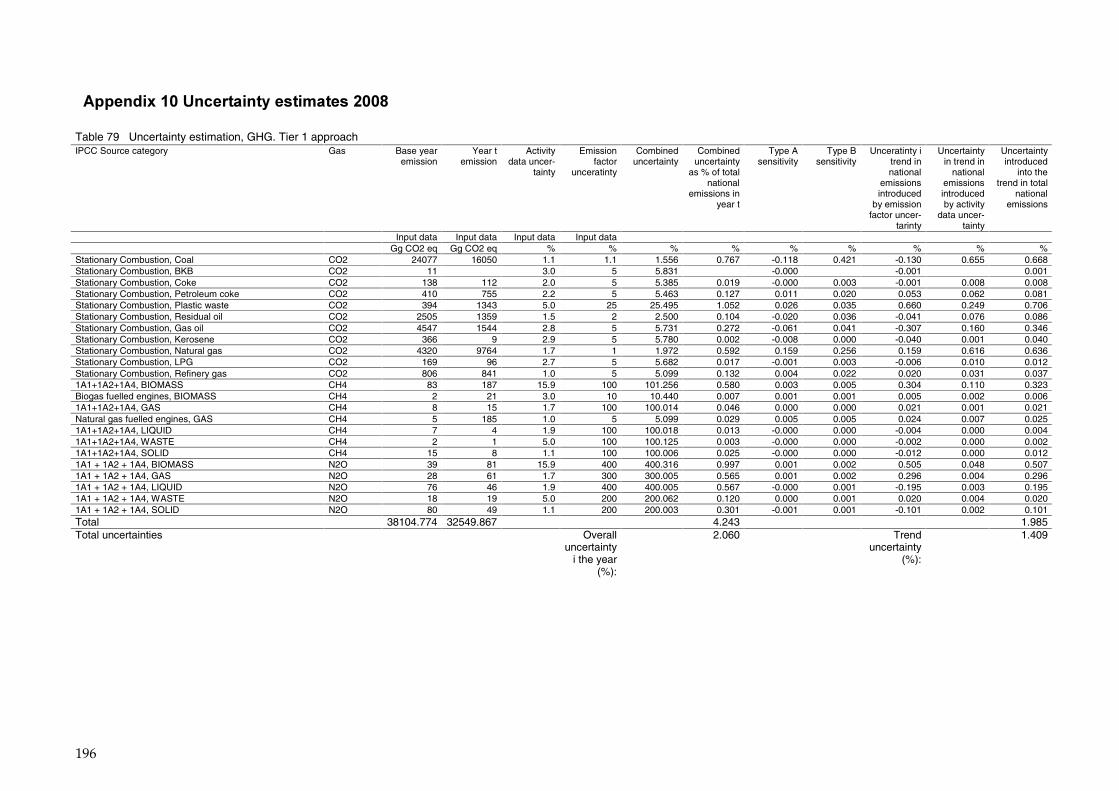
196
�������������� ��������������������
Table 79 Uncertainty estimation, GHG. Tier 1 approach IPCC Source category Gas Base year
emission Year t
emission Activity
data uncer-tainty
Emission factor
unceratinty
Combined uncertainty
Combined uncertainty
as % of total national
emissions in year t
Type A sensitivity
Type B sensitivity
Unceratinty i trend in national
emissions introduced
by emission factor uncer-
tarinty
Uncertainty in trend in
national emissions introduced by activity
data uncer-tainty
Uncertainty introduced
into the trend in total
national emissions
Input data Input data Input data Input data Gg CO2 eq Gg CO2 eq % % % % % % % % % Stationary Combustion, Coal CO2 24077 16050 1.1 1.1 1.556 0.767 -0.118 0.421 -0.130 0.655 0.668 Stationary Combustion, BKB CO2 11 3.0 5 5.831 -0.000 -0.001 0.001 Stationary Combustion, Coke CO2 138 112 2.0 5 5.385 0.019 -0.000 0.003 -0.001 0.008 0.008 Stationary Combustion, Petroleum coke CO2 410 755 2.2 5 5.463 0.127 0.011 0.020 0.053 0.062 0.081 Stationary Combustion, Plastic waste CO2 394 1343 5.0 25 25.495 1.052 0.026 0.035 0.660 0.249 0.706 Stationary Combustion, Residual oil CO2 2505 1359 1.5 2 2.500 0.104 -0.020 0.036 -0.041 0.076 0.086 Stationary Combustion, Gas oil CO2 4547 1544 2.8 5 5.731 0.272 -0.061 0.041 -0.307 0.160 0.346 Stationary Combustion, Kerosene CO2 366 9 2.9 5 5.780 0.002 -0.008 0.000 -0.040 0.001 0.040 Stationary Combustion, Natural gas CO2 4320 9764 1.7 1 1.972 0.592 0.159 0.256 0.159 0.616 0.636 Stationary Combustion, LPG CO2 169 96 2.7 5 5.682 0.017 -0.001 0.003 -0.006 0.010 0.012 Stationary Combustion, Refinery gas CO2 806 841 1.0 5 5.099 0.132 0.004 0.022 0.020 0.031 0.037 1A1+1A2+1A4, BIOMASS CH4 83 187 15.9 100 101.256 0.580 0.003 0.005 0.304 0.110 0.323 Biogas fuelled engines, BIOMASS CH4 2 21 3.0 10 10.440 0.007 0.001 0.001 0.005 0.002 0.006 1A1+1A2+1A4, GAS CH4 8 15 1.7 100 100.014 0.046 0.000 0.000 0.021 0.001 0.021 Natural gas fuelled engines, GAS CH4 5 185 1.0 5 5.099 0.029 0.005 0.005 0.024 0.007 0.025 1A1+1A2+1A4, LIQUID CH4 7 4 1.9 100 100.018 0.013 -0.000 0.000 -0.004 0.000 0.004 1A1+1A2+1A4, WASTE CH4 2 1 5.0 100 100.125 0.003 -0.000 0.000 -0.002 0.000 0.002 1A1+1A2+1A4, SOLID CH4 15 8 1.1 100 100.006 0.025 -0.000 0.000 -0.012 0.000 0.012 1A1 + 1A2 + 1A4, BIOMASS N2O 39 81 15.9 400 400.316 0.997 0.001 0.002 0.505 0.048 0.507 1A1 + 1A2 + 1A4, GAS N2O 28 61 1.7 300 300.005 0.565 0.001 0.002 0.296 0.004 0.296 1A1 + 1A2 + 1A4, LIQUID N2O 76 46 1.9 400 400.005 0.567 -0.000 0.001 -0.195 0.003 0.195 1A1 + 1A2 + 1A4, WASTE N2O 18 19 5.0 200 200.062 0.120 0.000 0.001 0.020 0.004 0.020 1A1 + 1A2 + 1A4, SOLID N2O 80 49 1.1 200 200.003 0.301 -0.001 0.001 -0.101 0.002 0.101 Total 38104.774 32549.867 4.243 1.985 Total uncertainties Overall
uncertainty i the year
(%):
2.060 Trend uncertainty
(%):
1.409
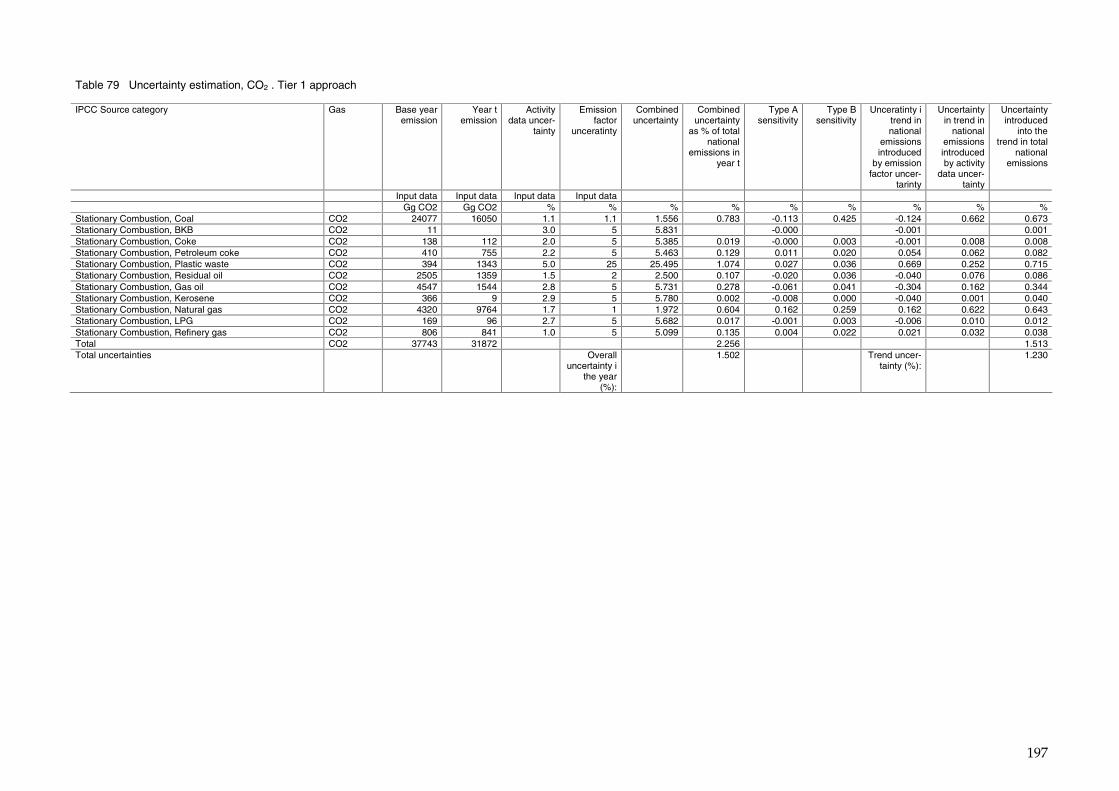
197
Table 79 Uncertainty estimation, CO2 . Tier 1 approach IPCC Source category Gas Base year
emission Year t
emission Activity
data uncer-tainty
Emission factor
unceratinty
Combined uncertainty
Combined uncertainty
as % of total national
emissions in year t
Type A sensitivity
Type B sensitivity
Unceratinty i trend in national
emissions introduced
by emission factor uncer-
tarinty
Uncertainty in trend in
national emissions introduced by activity
data uncer-tainty
Uncertainty introduced
into the trend in total
national emissions
Input data Input data Input data Input data Gg CO2 Gg CO2 % % % % % % % % % Stationary Combustion, Coal CO2 24077 16050 1.1 1.1 1.556 0.783 -0.113 0.425 -0.124 0.662 0.673 Stationary Combustion, BKB CO2 11 3.0 5 5.831 -0.000 -0.001 0.001 Stationary Combustion, Coke CO2 138 112 2.0 5 5.385 0.019 -0.000 0.003 -0.001 0.008 0.008 Stationary Combustion, Petroleum coke CO2 410 755 2.2 5 5.463 0.129 0.011 0.020 0.054 0.062 0.082 Stationary Combustion, Plastic waste CO2 394 1343 5.0 25 25.495 1.074 0.027 0.036 0.669 0.252 0.715 Stationary Combustion, Residual oil CO2 2505 1359 1.5 2 2.500 0.107 -0.020 0.036 -0.040 0.076 0.086 Stationary Combustion, Gas oil CO2 4547 1544 2.8 5 5.731 0.278 -0.061 0.041 -0.304 0.162 0.344 Stationary Combustion, Kerosene CO2 366 9 2.9 5 5.780 0.002 -0.008 0.000 -0.040 0.001 0.040 Stationary Combustion, Natural gas CO2 4320 9764 1.7 1 1.972 0.604 0.162 0.259 0.162 0.622 0.643 Stationary Combustion, LPG CO2 169 96 2.7 5 5.682 0.017 -0.001 0.003 -0.006 0.010 0.012 Stationary Combustion, Refinery gas CO2 806 841 1.0 5 5.099 0.135 0.004 0.022 0.021 0.032 0.038 Total CO2 37743 31872 2.256 1.513 Total uncertainties Overall
uncertainty i the year
(%):
1.502 Trend uncer-tainty (%):
1.230
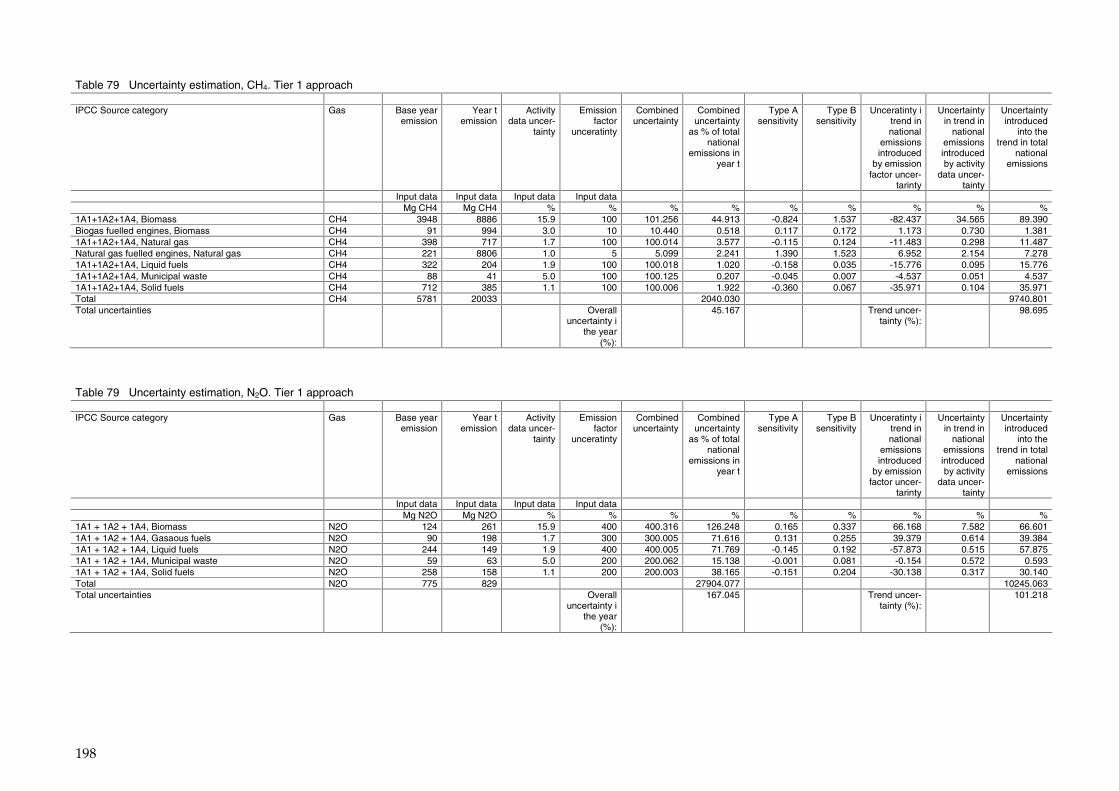
198
Table 79 Uncertainty estimation, CH4. Tier 1 approach IPCC Source category Gas Base year
emission Year t
emission Activity
data uncer-tainty
Emission factor
unceratinty
Combined uncertainty
Combined uncertainty
as % of total national
emissions in year t
Type A sensitivity
Type B sensitivity
Unceratinty i trend in national
emissions introduced
by emission factor uncer-
tarinty
Uncertainty in trend in
national emissions introduced by activity
data uncer-tainty
Uncertainty introduced
into the trend in total
national emissions
Input data Input data Input data Input data Mg CH4 Mg CH4 % % % % % % % % % 1A1+1A2+1A4, Biomass CH4 3948 8886 15.9 100 101.256 44.913 -0.824 1.537 -82.437 34.565 89.390 Biogas fuelled engines, Biomass CH4 91 994 3.0 10 10.440 0.518 0.117 0.172 1.173 0.730 1.381 1A1+1A2+1A4, Natural gas CH4 398 717 1.7 100 100.014 3.577 -0.115 0.124 -11.483 0.298 11.487 Natural gas fuelled engines, Natural gas CH4 221 8806 1.0 5 5.099 2.241 1.390 1.523 6.952 2.154 7.278 1A1+1A2+1A4, Liquid fuels CH4 322 204 1.9 100 100.018 1.020 -0.158 0.035 -15.776 0.095 15.776 1A1+1A2+1A4, Municipal waste CH4 88 41 5.0 100 100.125 0.207 -0.045 0.007 -4.537 0.051 4.537 1A1+1A2+1A4, Solid fuels CH4 712 385 1.1 100 100.006 1.922 -0.360 0.067 -35.971 0.104 35.971 Total CH4 5781 20033 2040.030 9740.801 Total uncertainties Overall
uncertainty i the year
(%):
45.167 Trend uncer-tainty (%):
98.695
Table 79 Uncertainty estimation, N2O. Tier 1 approach IPCC Source category Gas Base year
emission Year t
emission Activity
data uncer-tainty
Emission factor
unceratinty
Combined uncertainty
Combined uncertainty
as % of total national
emissions in year t
Type A sensitivity
Type B sensitivity
Unceratinty i trend in national
emissions introduced
by emission factor uncer-
tarinty
Uncertainty in trend in
national emissions introduced by activity
data uncer-tainty
Uncertainty introduced
into the trend in total
national emissions
Input data Input data Input data Input data Mg N2O Mg N2O % % % % % % % % % 1A1 + 1A2 + 1A4, Biomass N2O 124 261 15.9 400 400.316 126.248 0.165 0.337 66.168 7.582 66.601 1A1 + 1A2 + 1A4, Gasaous fuels N2O 90 198 1.7 300 300.005 71.616 0.131 0.255 39.379 0.614 39.384 1A1 + 1A2 + 1A4, Liquid fuels N2O 244 149 1.9 400 400.005 71.769 -0.145 0.192 -57.873 0.515 57.875 1A1 + 1A2 + 1A4, Municipal waste N2O 59 63 5.0 200 200.062 15.138 -0.001 0.081 -0.154 0.572 0.593 1A1 + 1A2 + 1A4, Solid fuels N2O 258 158 1.1 200 200.003 38.165 -0.151 0.204 -30.138 0.317 30.140 Total N2O 775 829 27904.077 10245.063 Total uncertainties Overall
uncertainty i the year
(%):
167.045 Trend uncer-tainty (%):
101.218
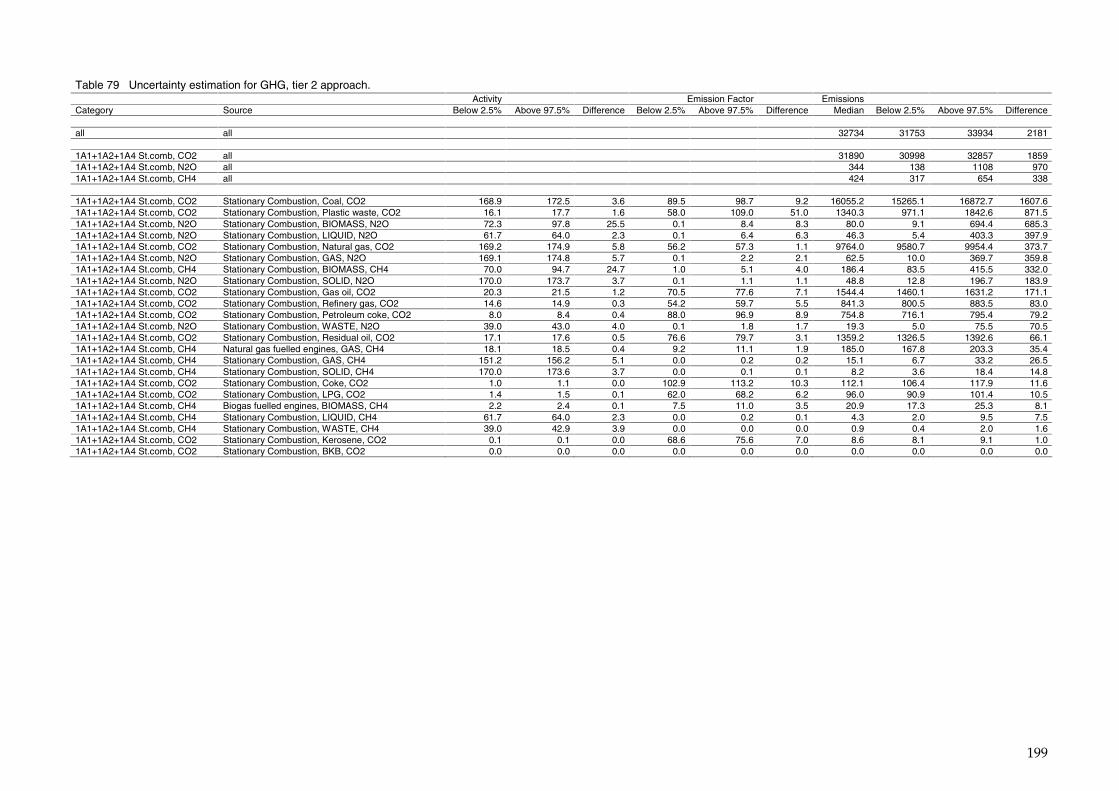
199
Table 79 Uncertainty estimation for GHG, tier 2 approach. Activity Emission Factor Emissions Category Source Below 2.5% Above 97.5% Difference Below 2.5% Above 97.5% Difference Median Below 2.5% Above 97.5% Difference all all 32734 31753 33934 2181 1A1+1A2+1A4 St.comb, CO2 all 31890 30998 32857 1859 1A1+1A2+1A4 St.comb, N2O all 344 138 1108 970 1A1+1A2+1A4 St.comb, CH4 all 424 317 654 338 1A1+1A2+1A4 St.comb, CO2 Stationary Combustion, Coal, CO2 168.9 172.5 3.6 89.5 98.7 9.2 16055.2 15265.1 16872.7 1607.6 1A1+1A2+1A4 St.comb, CO2 Stationary Combustion, Plastic waste, CO2 16.1 17.7 1.6 58.0 109.0 51.0 1340.3 971.1 1842.6 871.5 1A1+1A2+1A4 St.comb, N2O Stationary Combustion, BIOMASS, N2O 72.3 97.8 25.5 0.1 8.4 8.3 80.0 9.1 694.4 685.3 1A1+1A2+1A4 St.comb, N2O Stationary Combustion, LIQUID, N2O 61.7 64.0 2.3 0.1 6.4 6.3 46.3 5.4 403.3 397.9 1A1+1A2+1A4 St.comb, CO2 Stationary Combustion, Natural gas, CO2 169.2 174.9 5.8 56.2 57.3 1.1 9764.0 9580.7 9954.4 373.7 1A1+1A2+1A4 St.comb, N2O Stationary Combustion, GAS, N2O 169.1 174.8 5.7 0.1 2.2 2.1 62.5 10.0 369.7 359.8 1A1+1A2+1A4 St.comb, CH4 Stationary Combustion, BIOMASS, CH4 70.0 94.7 24.7 1.0 5.1 4.0 186.4 83.5 415.5 332.0 1A1+1A2+1A4 St.comb, N2O Stationary Combustion, SOLID, N2O 170.0 173.7 3.7 0.1 1.1 1.1 48.8 12.8 196.7 183.9 1A1+1A2+1A4 St.comb, CO2 Stationary Combustion, Gas oil, CO2 20.3 21.5 1.2 70.5 77.6 7.1 1544.4 1460.1 1631.2 171.1 1A1+1A2+1A4 St.comb, CO2 Stationary Combustion, Refinery gas, CO2 14.6 14.9 0.3 54.2 59.7 5.5 841.3 800.5 883.5 83.0 1A1+1A2+1A4 St.comb, CO2 Stationary Combustion, Petroleum coke, CO2 8.0 8.4 0.4 88.0 96.9 8.9 754.8 716.1 795.4 79.2 1A1+1A2+1A4 St.comb, N2O Stationary Combustion, WASTE, N2O 39.0 43.0 4.0 0.1 1.8 1.7 19.3 5.0 75.5 70.5 1A1+1A2+1A4 St.comb, CO2 Stationary Combustion, Residual oil, CO2 17.1 17.6 0.5 76.6 79.7 3.1 1359.2 1326.5 1392.6 66.1 1A1+1A2+1A4 St.comb, CH4 Natural gas fuelled engines, GAS, CH4 18.1 18.5 0.4 9.2 11.1 1.9 185.0 167.8 203.3 35.4 1A1+1A2+1A4 St.comb, CH4 Stationary Combustion, GAS, CH4 151.2 156.2 5.1 0.0 0.2 0.2 15.1 6.7 33.2 26.5 1A1+1A2+1A4 St.comb, CH4 Stationary Combustion, SOLID, CH4 170.0 173.6 3.7 0.0 0.1 0.1 8.2 3.6 18.4 14.8 1A1+1A2+1A4 St.comb, CO2 Stationary Combustion, Coke, CO2 1.0 1.1 0.0 102.9 113.2 10.3 112.1 106.4 117.9 11.6 1A1+1A2+1A4 St.comb, CO2 Stationary Combustion, LPG, CO2 1.4 1.5 0.1 62.0 68.2 6.2 96.0 90.9 101.4 10.5 1A1+1A2+1A4 St.comb, CH4 Biogas fuelled engines, BIOMASS, CH4 2.2 2.4 0.1 7.5 11.0 3.5 20.9 17.3 25.3 8.1 1A1+1A2+1A4 St.comb, CH4 Stationary Combustion, LIQUID, CH4 61.7 64.0 2.3 0.0 0.2 0.1 4.3 2.0 9.5 7.5 1A1+1A2+1A4 St.comb, CH4 Stationary Combustion, WASTE, CH4 39.0 42.9 3.9 0.0 0.0 0.0 0.9 0.4 2.0 1.6 1A1+1A2+1A4 St.comb, CO2 Stationary Combustion, Kerosene, CO2 0.1 0.1 0.0 68.6 75.6 7.0 8.6 8.1 9.1 1.0 1A1+1A2+1A4 St.comb, CO2 Stationary Combustion, BKB, CO2 0.0 0.0 0.0 0.0 0.0 0.0 0.0 0.0 0.0 0.0
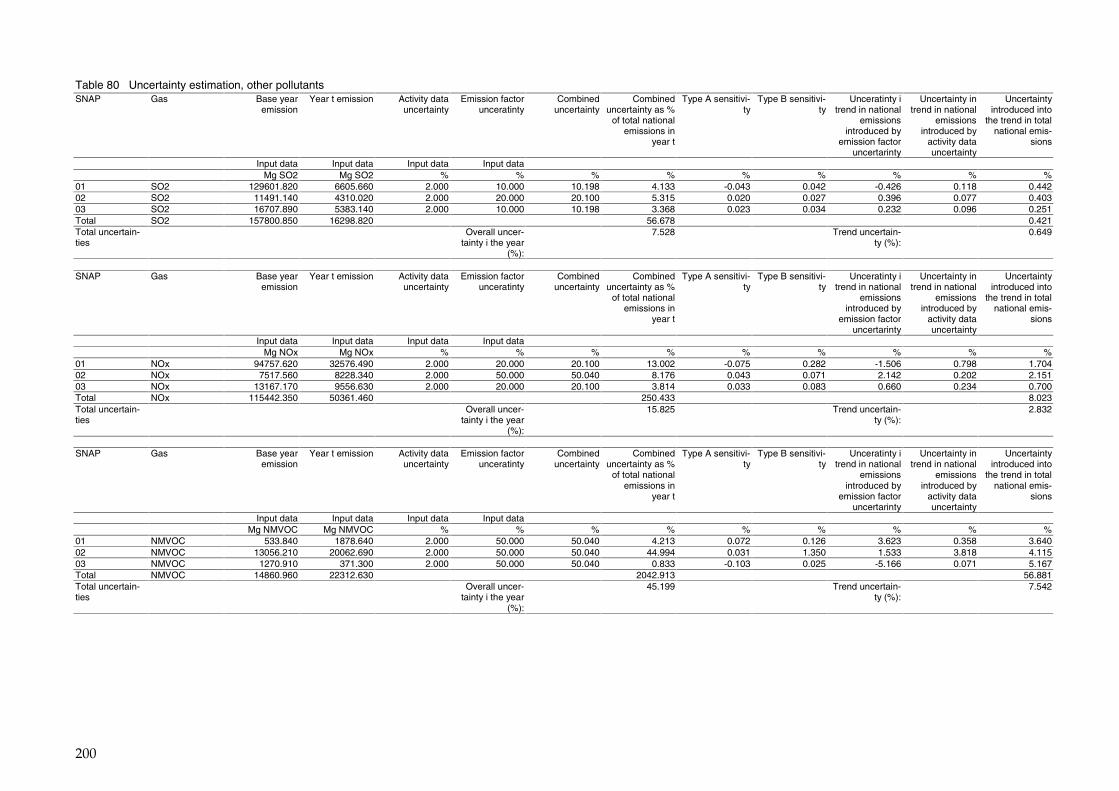
200
Table 80 Uncertainty estimation, other pollutants SNAP Gas Base year
emission Year t emission Activity data
uncertainty Emission factor
unceratinty Combined
uncertainty Combined
uncertainty as % of total national
emissions in year t
Type A sensitivi-ty
Type B sensitivi-ty
Unceratinty i trend in national
emissions introduced by
emission factor uncertarinty
Uncertainty in trend in national
emissions introduced by
activity data uncertainty
Uncertainty introduced into
the trend in total national emis-
sions
Input data Input data Input data Input data Mg SO2 Mg SO2 % % % % % % % % % 01 SO2 129601.820 6605.660 2.000 10.000 10.198 4.133 -0.043 0.042 -0.426 0.118 0.442 02 SO2 11491.140 4310.020 2.000 20.000 20.100 5.315 0.020 0.027 0.396 0.077 0.403 03 SO2 16707.890 5383.140 2.000 10.000 10.198 3.368 0.023 0.034 0.232 0.096 0.251 Total SO2 157800.850 16298.820 56.678 0.421 Total uncertain-ties
Overall uncer-tainty i the year
(%):
7.528 Trend uncertain-ty (%):
0.649
SNAP Gas Base year
emission Year t emission Activity data
uncertainty Emission factor
unceratinty Combined
uncertainty Combined
uncertainty as % of total national
emissions in year t
Type A sensitivi-ty
Type B sensitivi-ty
Unceratinty i trend in national
emissions introduced by
emission factor uncertarinty
Uncertainty in trend in national
emissions introduced by
activity data uncertainty
Uncertainty introduced into
the trend in total national emis-
sions
Input data Input data Input data Input data Mg NOx Mg NOx % % % % % % % % % 01 NOx 94757.620 32576.490 2.000 20.000 20.100 13.002 -0.075 0.282 -1.506 0.798 1.704 02 NOx 7517.560 8228.340 2.000 50.000 50.040 8.176 0.043 0.071 2.142 0.202 2.151 03 NOx 13167.170 9556.630 2.000 20.000 20.100 3.814 0.033 0.083 0.660 0.234 0.700 Total NOx 115442.350 50361.460 250.433 8.023 Total uncertain-ties
Overall uncer-tainty i the year
(%):
15.825 Trend uncertain-ty (%):
2.832
SNAP Gas Base year
emission Year t emission Activity data
uncertainty Emission factor
unceratinty Combined
uncertainty Combined
uncertainty as % of total national
emissions in year t
Type A sensitivi-ty
Type B sensitivi-ty
Unceratinty i trend in national
emissions introduced by
emission factor uncertarinty
Uncertainty in trend in national
emissions introduced by
activity data uncertainty
Uncertainty introduced into
the trend in total national emis-
sions
Input data Input data Input data Input data Mg NMVOC Mg NMVOC % % % % % % % % % 01 NMVOC 533.840 1878.640 2.000 50.000 50.040 4.213 0.072 0.126 3.623 0.358 3.640 02 NMVOC 13056.210 20062.690 2.000 50.000 50.040 44.994 0.031 1.350 1.533 3.818 4.115 03 NMVOC 1270.910 371.300 2.000 50.000 50.040 0.833 -0.103 0.025 -5.166 0.071 5.167 Total NMVOC 14860.960 22312.630 2042.913 56.881 Total uncertain-ties
Overall uncer-tainty i the year
(%):
45.199 Trend uncertain-ty (%):
7.542
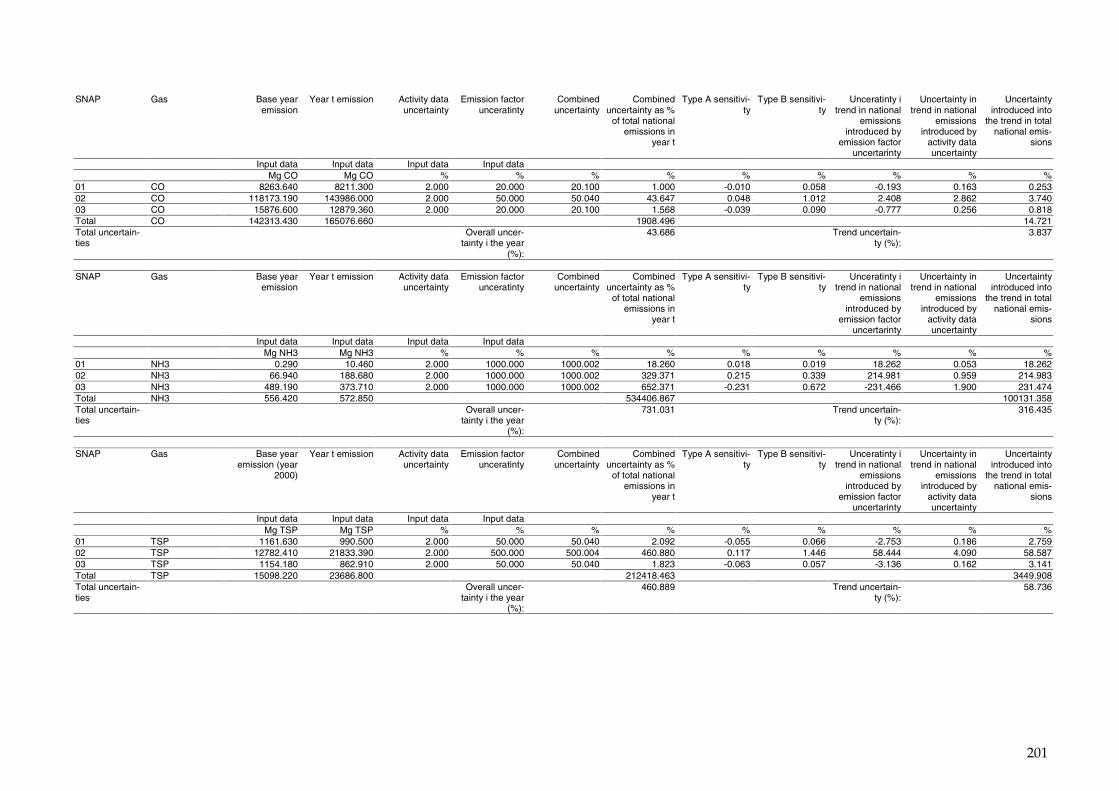
201
SNAP Gas Base year
emission Year t emission Activity data
uncertainty Emission factor
unceratinty Combined
uncertainty Combined
uncertainty as % of total national
emissions in year t
Type A sensitivi-ty
Type B sensitivi-ty
Unceratinty i trend in national
emissions introduced by
emission factor uncertarinty
Uncertainty in trend in national
emissions introduced by
activity data uncertainty
Uncertainty introduced into
the trend in total national emis-
sions
Input data Input data Input data Input data Mg CO Mg CO % % % % % % % % % 01 CO 8263.640 8211.300 2.000 20.000 20.100 1.000 -0.010 0.058 -0.193 0.163 0.253 02 CO 118173.190 143986.000 2.000 50.000 50.040 43.647 0.048 1.012 2.408 2.862 3.740 03 CO 15876.600 12879.360 2.000 20.000 20.100 1.568 -0.039 0.090 -0.777 0.256 0.818 Total CO 142313.430 165076.660 1908.496 14.721 Total uncertain-ties
Overall uncer-tainty i the year
(%):
43.686 Trend uncertain-ty (%):
3.837
SNAP Gas Base year
emission Year t emission Activity data
uncertainty Emission factor
unceratinty Combined
uncertainty Combined
uncertainty as % of total national
emissions in year t
Type A sensitivi-ty
Type B sensitivi-ty
Unceratinty i trend in national
emissions introduced by
emission factor uncertarinty
Uncertainty in trend in national
emissions introduced by
activity data uncertainty
Uncertainty introduced into
the trend in total national emis-
sions
Input data Input data Input data Input data Mg NH3 Mg NH3 % % % % % % % % % 01 NH3 0.290 10.460 2.000 1000.000 1000.002 18.260 0.018 0.019 18.262 0.053 18.262 02 NH3 66.940 188.680 2.000 1000.000 1000.002 329.371 0.215 0.339 214.981 0.959 214.983 03 NH3 489.190 373.710 2.000 1000.000 1000.002 652.371 -0.231 0.672 -231.466 1.900 231.474 Total NH3 556.420 572.850 534406.867 100131.358 Total uncertain-ties
Overall uncer-tainty i the year
(%):
731.031 Trend uncertain-ty (%):
316.435
SNAP Gas Base year
emission (year 2000)
Year t emission Activity data uncertainty
Emission factor unceratinty
Combined uncertainty
Combined uncertainty as %
of total national emissions in
year t
Type A sensitivi-ty
Type B sensitivi-ty
Unceratinty i trend in national
emissions introduced by
emission factor uncertarinty
Uncertainty in trend in national
emissions introduced by
activity data uncertainty
Uncertainty introduced into
the trend in total national emis-
sions
Input data Input data Input data Input data Mg TSP Mg TSP % % % % % % % % % 01 TSP 1161.630 990.500 2.000 50.000 50.040 2.092 -0.055 0.066 -2.753 0.186 2.759 02 TSP 12782.410 21833.390 2.000 500.000 500.004 460.880 0.117 1.446 58.444 4.090 58.587 03 TSP 1154.180 862.910 2.000 50.000 50.040 1.823 -0.063 0.057 -3.136 0.162 3.141 Total TSP 15098.220 23686.800 212418.463 3449.908 Total uncertain-ties
Overall uncer-tainty i the year
(%):
460.889 Trend uncertain-ty (%):
58.736
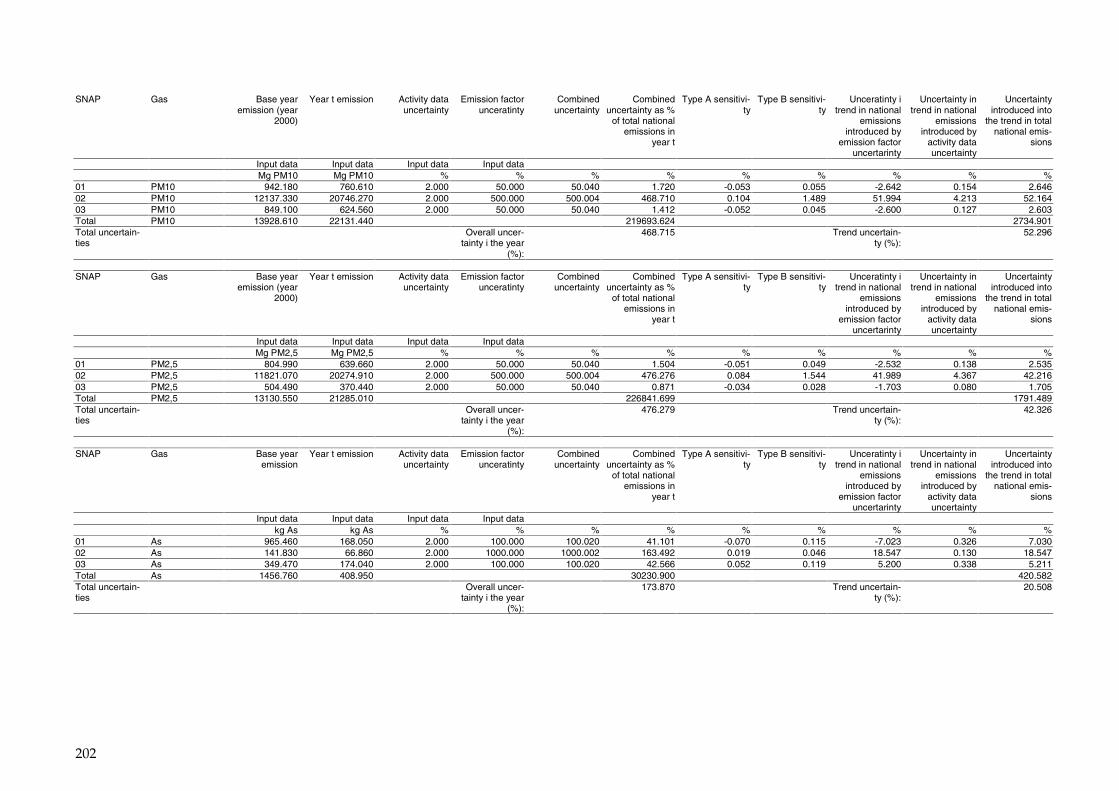
202
SNAP Gas Base year
emission (year 2000)
Year t emission Activity data uncertainty
Emission factor unceratinty
Combined uncertainty
Combined uncertainty as %
of total national emissions in
year t
Type A sensitivi-ty
Type B sensitivi-ty
Unceratinty i trend in national
emissions introduced by
emission factor uncertarinty
Uncertainty in trend in national
emissions introduced by
activity data uncertainty
Uncertainty introduced into
the trend in total national emis-
sions
Input data Input data Input data Input data Mg PM10 Mg PM10 % % % % % % % % % 01 PM10 942.180 760.610 2.000 50.000 50.040 1.720 -0.053 0.055 -2.642 0.154 2.646 02 PM10 12137.330 20746.270 2.000 500.000 500.004 468.710 0.104 1.489 51.994 4.213 52.164 03 PM10 849.100 624.560 2.000 50.000 50.040 1.412 -0.052 0.045 -2.600 0.127 2.603 Total PM10 13928.610 22131.440 219693.624 2734.901 Total uncertain-ties
Overall uncer-tainty i the year
(%):
468.715 Trend uncertain-ty (%):
52.296
SNAP Gas Base year
emission (year 2000)
Year t emission Activity data uncertainty
Emission factor unceratinty
Combined uncertainty
Combined uncertainty as %
of total national emissions in
year t
Type A sensitivi-ty
Type B sensitivi-ty
Unceratinty i trend in national
emissions introduced by
emission factor uncertarinty
Uncertainty in trend in national
emissions introduced by
activity data uncertainty
Uncertainty introduced into
the trend in total national emis-
sions
Input data Input data Input data Input data Mg PM2,5 Mg PM2,5 % % % % % % % % % 01 PM2,5 804.990 639.660 2.000 50.000 50.040 1.504 -0.051 0.049 -2.532 0.138 2.535 02 PM2,5 11821.070 20274.910 2.000 500.000 500.004 476.276 0.084 1.544 41.989 4.367 42.216 03 PM2,5 504.490 370.440 2.000 50.000 50.040 0.871 -0.034 0.028 -1.703 0.080 1.705 Total PM2,5 13130.550 21285.010 226841.699 1791.489 Total uncertain-ties
Overall uncer-tainty i the year
(%):
476.279 Trend uncertain-ty (%):
42.326
SNAP Gas Base year
emission Year t emission Activity data
uncertainty Emission factor
unceratinty Combined
uncertainty Combined
uncertainty as % of total national
emissions in year t
Type A sensitivi-ty
Type B sensitivi-ty
Unceratinty i trend in national
emissions introduced by
emission factor uncertarinty
Uncertainty in trend in national
emissions introduced by
activity data uncertainty
Uncertainty introduced into
the trend in total national emis-
sions
Input data Input data Input data Input data kg As kg As % % % % % % % % % 01 As 965.460 168.050 2.000 100.000 100.020 41.101 -0.070 0.115 -7.023 0.326 7.030 02 As 141.830 66.860 2.000 1000.000 1000.002 163.492 0.019 0.046 18.547 0.130 18.547 03 As 349.470 174.040 2.000 100.000 100.020 42.566 0.052 0.119 5.200 0.338 5.211 Total As 1456.760 408.950 30230.900 420.582 Total uncertain-ties
Overall uncer-tainty i the year
(%):
173.870 Trend uncertain-ty (%):
20.508
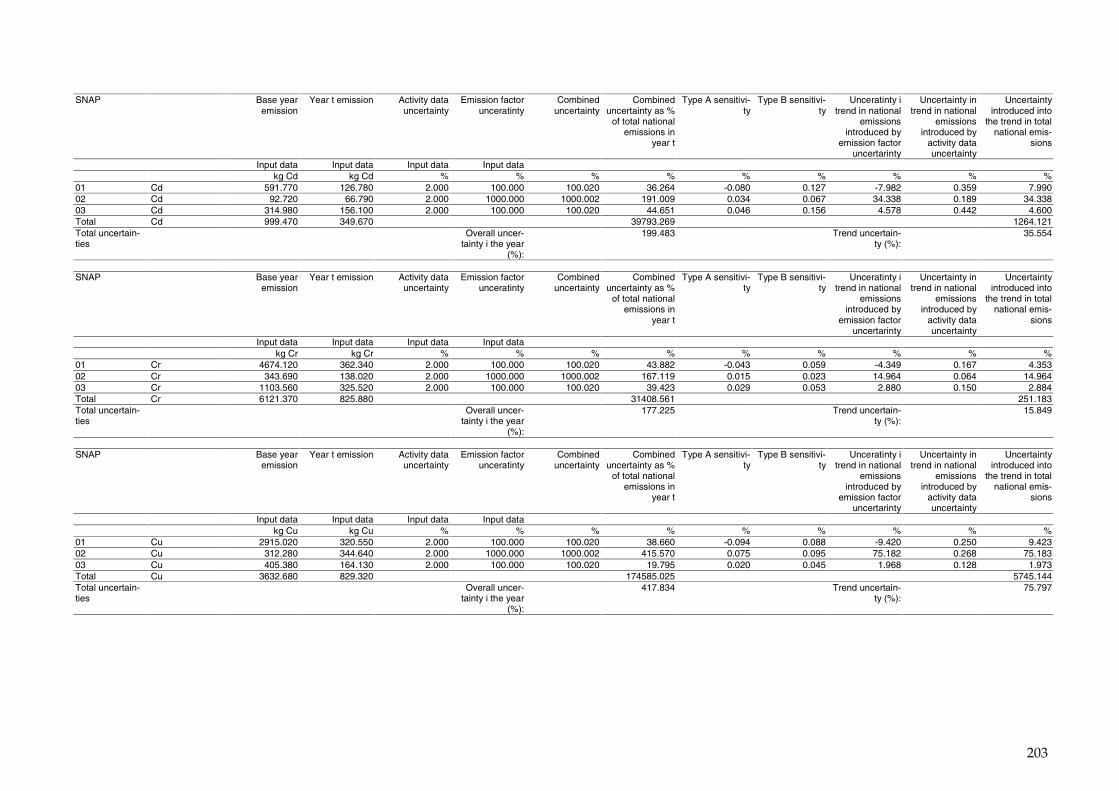
203
SNAP Base year
emission Year t emission Activity data
uncertainty Emission factor
unceratinty Combined
uncertainty Combined
uncertainty as % of total national
emissions in year t
Type A sensitivi-ty
Type B sensitivi-ty
Unceratinty i trend in national
emissions introduced by
emission factor uncertarinty
Uncertainty in trend in national
emissions introduced by
activity data uncertainty
Uncertainty introduced into
the trend in total national emis-
sions
Input data Input data Input data Input data kg Cd kg Cd % % % % % % % % % 01 Cd 591.770 126.780 2.000 100.000 100.020 36.264 -0.080 0.127 -7.982 0.359 7.990 02 Cd 92.720 66.790 2.000 1000.000 1000.002 191.009 0.034 0.067 34.338 0.189 34.338 03 Cd 314.980 156.100 2.000 100.000 100.020 44.651 0.046 0.156 4.578 0.442 4.600 Total Cd 999.470 349.670 39793.269 1264.121 Total uncertain-ties
Overall uncer-tainty i the year
(%):
199.483 Trend uncertain-ty (%):
35.554
SNAP Base year
emission Year t emission Activity data
uncertainty Emission factor
unceratinty Combined
uncertainty Combined
uncertainty as % of total national
emissions in year t
Type A sensitivi-ty
Type B sensitivi-ty
Unceratinty i trend in national
emissions introduced by
emission factor uncertarinty
Uncertainty in trend in national
emissions introduced by
activity data uncertainty
Uncertainty introduced into
the trend in total national emis-
sions
Input data Input data Input data Input data kg Cr kg Cr % % % % % % % % % 01 Cr 4674.120 362.340 2.000 100.000 100.020 43.882 -0.043 0.059 -4.349 0.167 4.353 02 Cr 343.690 138.020 2.000 1000.000 1000.002 167.119 0.015 0.023 14.964 0.064 14.964 03 Cr 1103.560 325.520 2.000 100.000 100.020 39.423 0.029 0.053 2.880 0.150 2.884 Total Cr 6121.370 825.880 31408.561 251.183 Total uncertain-ties
Overall uncer-tainty i the year
(%):
177.225 Trend uncertain-ty (%):
15.849
SNAP Base year
emission Year t emission Activity data
uncertainty Emission factor
unceratinty Combined
uncertainty Combined
uncertainty as % of total national
emissions in year t
Type A sensitivi-ty
Type B sensitivi-ty
Unceratinty i trend in national
emissions introduced by
emission factor uncertarinty
Uncertainty in trend in national
emissions introduced by
activity data uncertainty
Uncertainty introduced into
the trend in total national emis-
sions
Input data Input data Input data Input data kg Cu kg Cu % % % % % % % % % 01 Cu 2915.020 320.550 2.000 100.000 100.020 38.660 -0.094 0.088 -9.420 0.250 9.423 02 Cu 312.280 344.640 2.000 1000.000 1000.002 415.570 0.075 0.095 75.182 0.268 75.183 03 Cu 405.380 164.130 2.000 100.000 100.020 19.795 0.020 0.045 1.968 0.128 1.973 Total Cu 3632.680 829.320 174585.025 5745.144 Total uncertain-ties
Overall uncer-tainty i the year
(%):
417.834 Trend uncertain-ty (%):
75.797
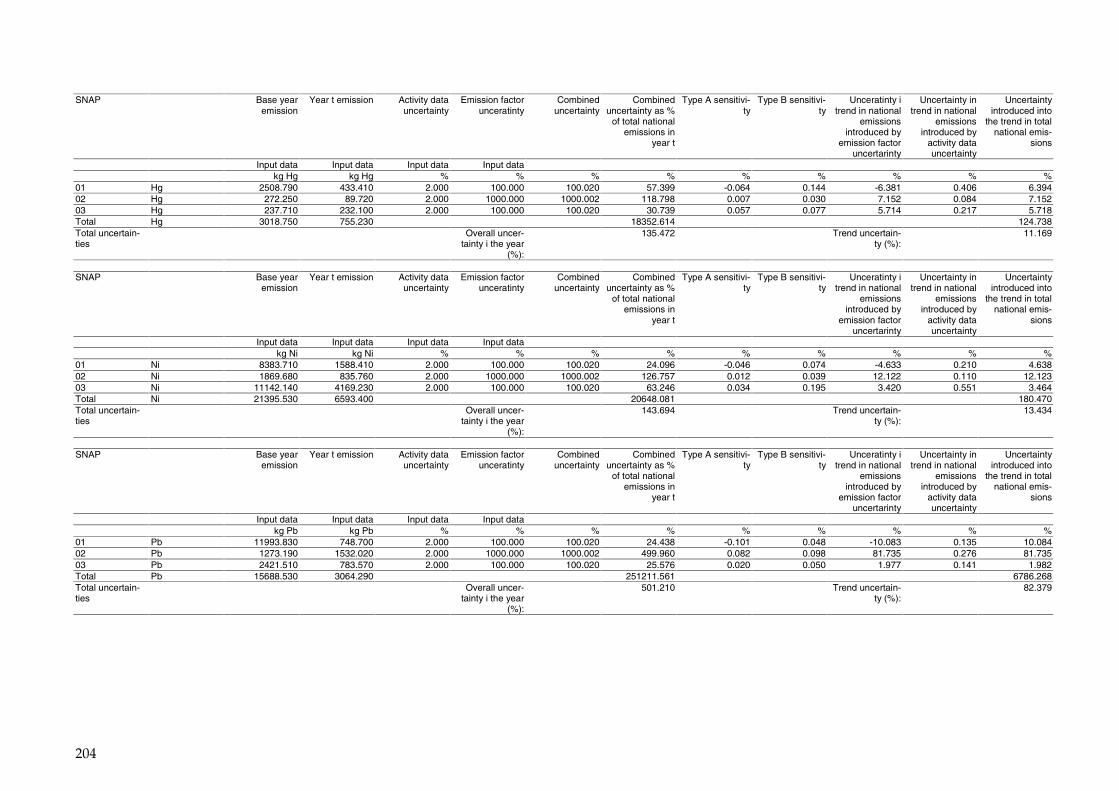
204
SNAP Base year
emission Year t emission Activity data
uncertainty Emission factor
unceratinty Combined
uncertainty Combined
uncertainty as % of total national
emissions in year t
Type A sensitivi-ty
Type B sensitivi-ty
Unceratinty i trend in national
emissions introduced by
emission factor uncertarinty
Uncertainty in trend in national
emissions introduced by
activity data uncertainty
Uncertainty introduced into
the trend in total national emis-
sions
Input data Input data Input data Input data kg Hg kg Hg % % % % % % % % % 01 Hg 2508.790 433.410 2.000 100.000 100.020 57.399 -0.064 0.144 -6.381 0.406 6.394 02 Hg 272.250 89.720 2.000 1000.000 1000.002 118.798 0.007 0.030 7.152 0.084 7.152 03 Hg 237.710 232.100 2.000 100.000 100.020 30.739 0.057 0.077 5.714 0.217 5.718 Total Hg 3018.750 755.230 18352.614 124.738 Total uncertain-ties
Overall uncer-tainty i the year
(%):
135.472 Trend uncertain-ty (%):
11.169
SNAP Base year
emission Year t emission Activity data
uncertainty Emission factor
unceratinty Combined
uncertainty Combined
uncertainty as % of total national
emissions in year t
Type A sensitivi-ty
Type B sensitivi-ty
Unceratinty i trend in national
emissions introduced by
emission factor uncertarinty
Uncertainty in trend in national
emissions introduced by
activity data uncertainty
Uncertainty introduced into
the trend in total national emis-
sions
Input data Input data Input data Input data kg Ni kg Ni % % % % % % % % % 01 Ni 8383.710 1588.410 2.000 100.000 100.020 24.096 -0.046 0.074 -4.633 0.210 4.638 02 Ni 1869.680 835.760 2.000 1000.000 1000.002 126.757 0.012 0.039 12.122 0.110 12.123 03 Ni 11142.140 4169.230 2.000 100.000 100.020 63.246 0.034 0.195 3.420 0.551 3.464 Total Ni 21395.530 6593.400 20648.081 180.470 Total uncertain-ties
Overall uncer-tainty i the year
(%):
143.694 Trend uncertain-ty (%):
13.434
SNAP Base year
emission Year t emission Activity data
uncertainty Emission factor
unceratinty Combined
uncertainty Combined
uncertainty as % of total national
emissions in year t
Type A sensitivi-ty
Type B sensitivi-ty
Unceratinty i trend in national
emissions introduced by
emission factor uncertarinty
Uncertainty in trend in national
emissions introduced by
activity data uncertainty
Uncertainty introduced into
the trend in total national emis-
sions
Input data Input data Input data Input data kg Pb kg Pb % % % % % % % % % 01 Pb 11993.830 748.700 2.000 100.000 100.020 24.438 -0.101 0.048 -10.083 0.135 10.084 02 Pb 1273.190 1532.020 2.000 1000.000 1000.002 499.960 0.082 0.098 81.735 0.276 81.735 03 Pb 2421.510 783.570 2.000 100.000 100.020 25.576 0.020 0.050 1.977 0.141 1.982 Total Pb 15688.530 3064.290 251211.561 6786.268 Total uncertain-ties
Overall uncer-tainty i the year
(%):
501.210 Trend uncertain-ty (%):
82.379
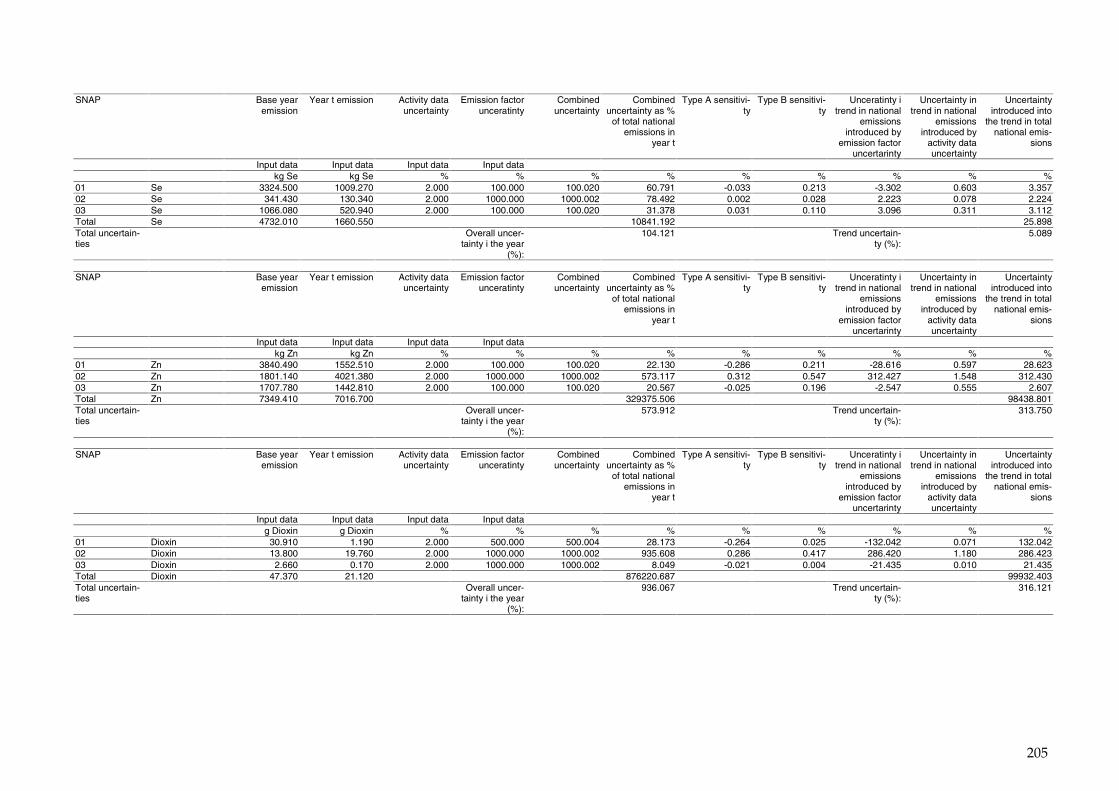
205
SNAP Base year
emission Year t emission Activity data
uncertainty Emission factor
unceratinty Combined
uncertainty Combined
uncertainty as % of total national
emissions in year t
Type A sensitivi-ty
Type B sensitivi-ty
Unceratinty i trend in national
emissions introduced by
emission factor uncertarinty
Uncertainty in trend in national
emissions introduced by
activity data uncertainty
Uncertainty introduced into
the trend in total national emis-
sions
Input data Input data Input data Input data kg Se kg Se % % % % % % % % % 01 Se 3324.500 1009.270 2.000 100.000 100.020 60.791 -0.033 0.213 -3.302 0.603 3.357 02 Se 341.430 130.340 2.000 1000.000 1000.002 78.492 0.002 0.028 2.223 0.078 2.224 03 Se 1066.080 520.940 2.000 100.000 100.020 31.378 0.031 0.110 3.096 0.311 3.112 Total Se 4732.010 1660.550 10841.192 25.898 Total uncertain-ties
Overall uncer-tainty i the year
(%):
104.121 Trend uncertain-ty (%):
5.089
SNAP Base year
emission Year t emission Activity data
uncertainty Emission factor
unceratinty Combined
uncertainty Combined
uncertainty as % of total national
emissions in year t
Type A sensitivi-ty
Type B sensitivi-ty
Unceratinty i trend in national
emissions introduced by
emission factor uncertarinty
Uncertainty in trend in national
emissions introduced by
activity data uncertainty
Uncertainty introduced into
the trend in total national emis-
sions
Input data Input data Input data Input data kg Zn kg Zn % % % % % % % % % 01 Zn 3840.490 1552.510 2.000 100.000 100.020 22.130 -0.286 0.211 -28.616 0.597 28.623 02 Zn 1801.140 4021.380 2.000 1000.000 1000.002 573.117 0.312 0.547 312.427 1.548 312.430 03 Zn 1707.780 1442.810 2.000 100.000 100.020 20.567 -0.025 0.196 -2.547 0.555 2.607 Total Zn 7349.410 7016.700 329375.506 98438.801 Total uncertain-ties
Overall uncer-tainty i the year
(%):
573.912 Trend uncertain-ty (%):
313.750
SNAP Base year
emission Year t emission Activity data
uncertainty Emission factor
unceratinty Combined
uncertainty Combined
uncertainty as % of total national
emissions in year t
Type A sensitivi-ty
Type B sensitivi-ty
Unceratinty i trend in national
emissions introduced by
emission factor uncertarinty
Uncertainty in trend in national
emissions introduced by
activity data uncertainty
Uncertainty introduced into
the trend in total national emis-
sions
Input data Input data Input data Input data g Dioxin g Dioxin % % % % % % % % % 01 Dioxin 30.910 1.190 2.000 500.000 500.004 28.173 -0.264 0.025 -132.042 0.071 132.042 02 Dioxin 13.800 19.760 2.000 1000.000 1000.002 935.608 0.286 0.417 286.420 1.180 286.423 03 Dioxin 2.660 0.170 2.000 1000.000 1000.002 8.049 -0.021 0.004 -21.435 0.010 21.435 Total Dioxin 47.370 21.120 876220.687 99932.403 Total uncertain-ties
Overall uncer-tainty i the year
(%):
936.067 Trend uncertain-ty (%):
316.121
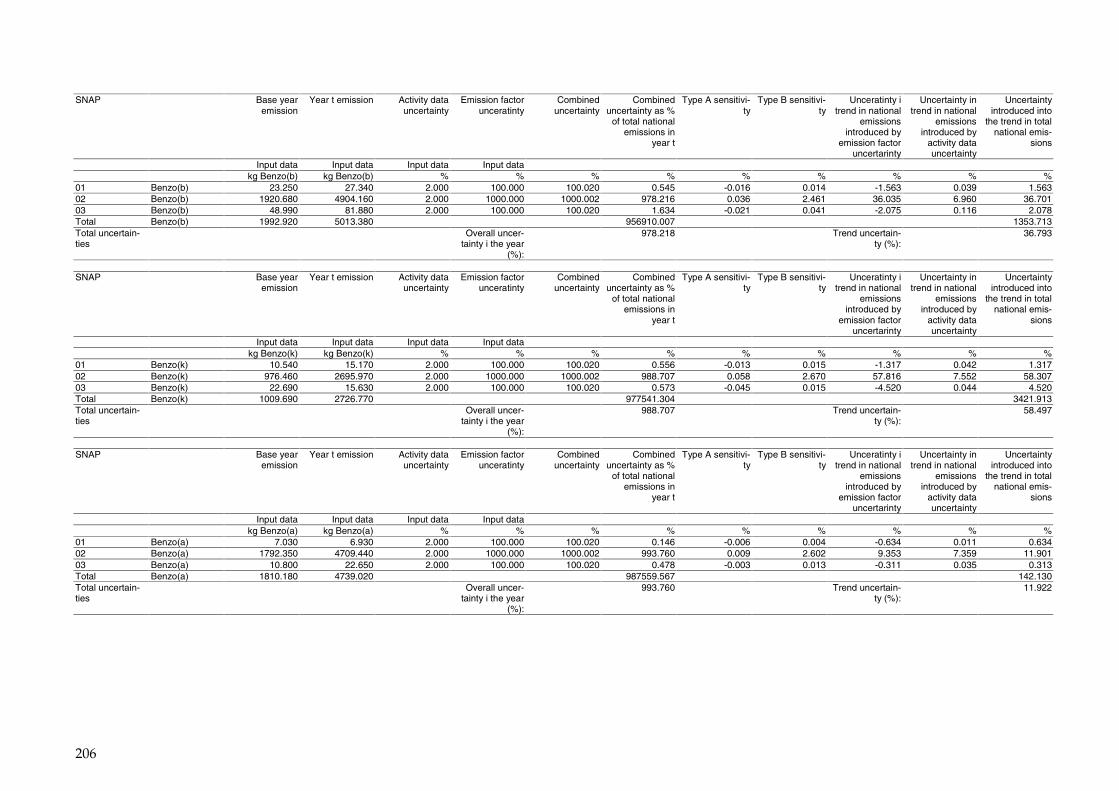
206
SNAP Base year
emission Year t emission Activity data
uncertainty Emission factor
unceratinty Combined
uncertainty Combined
uncertainty as % of total national
emissions in year t
Type A sensitivi-ty
Type B sensitivi-ty
Unceratinty i trend in national
emissions introduced by
emission factor uncertarinty
Uncertainty in trend in national
emissions introduced by
activity data uncertainty
Uncertainty introduced into
the trend in total national emis-
sions
Input data Input data Input data Input data kg Benzo(b) kg Benzo(b) % % % % % % % % % 01 Benzo(b) 23.250 27.340 2.000 100.000 100.020 0.545 -0.016 0.014 -1.563 0.039 1.563 02 Benzo(b) 1920.680 4904.160 2.000 1000.000 1000.002 978.216 0.036 2.461 36.035 6.960 36.701 03 Benzo(b) 48.990 81.880 2.000 100.000 100.020 1.634 -0.021 0.041 -2.075 0.116 2.078 Total Benzo(b) 1992.920 5013.380 956910.007 1353.713 Total uncertain-ties
Overall uncer-tainty i the year
(%):
978.218 Trend uncertain-ty (%):
36.793
SNAP Base year
emission Year t emission Activity data
uncertainty Emission factor
unceratinty Combined
uncertainty Combined
uncertainty as % of total national
emissions in year t
Type A sensitivi-ty
Type B sensitivi-ty
Unceratinty i trend in national
emissions introduced by
emission factor uncertarinty
Uncertainty in trend in national
emissions introduced by
activity data uncertainty
Uncertainty introduced into
the trend in total national emis-
sions
Input data Input data Input data Input data kg Benzo(k) kg Benzo(k) % % % % % % % % % 01 Benzo(k) 10.540 15.170 2.000 100.000 100.020 0.556 -0.013 0.015 -1.317 0.042 1.317 02 Benzo(k) 976.460 2695.970 2.000 1000.000 1000.002 988.707 0.058 2.670 57.816 7.552 58.307 03 Benzo(k) 22.690 15.630 2.000 100.000 100.020 0.573 -0.045 0.015 -4.520 0.044 4.520 Total Benzo(k) 1009.690 2726.770 977541.304 3421.913 Total uncertain-ties
Overall uncer-tainty i the year
(%):
988.707 Trend uncertain-ty (%):
58.497
SNAP Base year
emission Year t emission Activity data
uncertainty Emission factor
unceratinty Combined
uncertainty Combined
uncertainty as % of total national
emissions in year t
Type A sensitivi-ty
Type B sensitivi-ty
Unceratinty i trend in national
emissions introduced by
emission factor uncertarinty
Uncertainty in trend in national
emissions introduced by
activity data uncertainty
Uncertainty introduced into
the trend in total national emis-
sions
Input data Input data Input data Input data kg Benzo(a) kg Benzo(a) % % % % % % % % % 01 Benzo(a) 7.030 6.930 2.000 100.000 100.020 0.146 -0.006 0.004 -0.634 0.011 0.634 02 Benzo(a) 1792.350 4709.440 2.000 1000.000 1000.002 993.760 0.009 2.602 9.353 7.359 11.901 03 Benzo(a) 10.800 22.650 2.000 100.000 100.020 0.478 -0.003 0.013 -0.311 0.035 0.313 Total Benzo(a) 1810.180 4739.020 987559.567 142.130 Total uncertain-ties
Overall uncer-tainty i the year
(%):
993.760 Trend uncertain-ty (%):
11.922
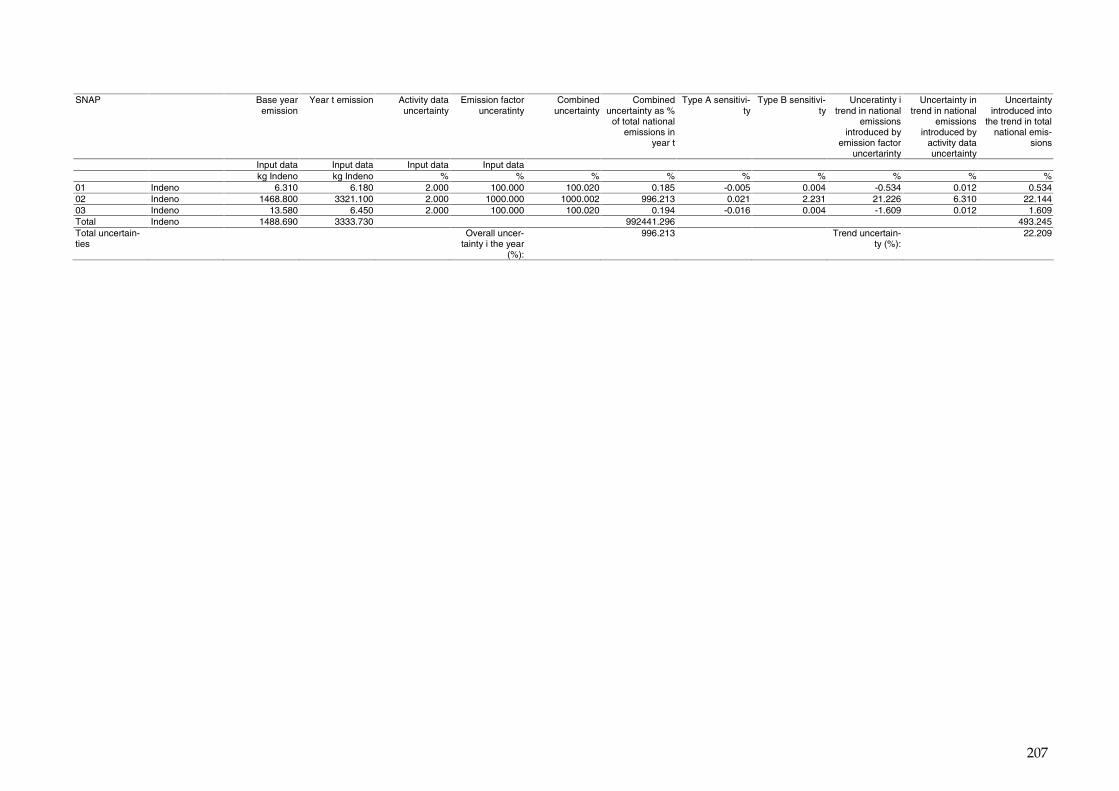
207
SNAP Base year
emission Year t emission Activity data
uncertainty Emission factor
unceratinty Combined
uncertainty Combined
uncertainty as % of total national
emissions in year t
Type A sensitivi-ty
Type B sensitivi-ty
Unceratinty i trend in national
emissions introduced by
emission factor uncertarinty
Uncertainty in trend in national
emissions introduced by
activity data uncertainty
Uncertainty introduced into
the trend in total national emis-
sions
Input data Input data Input data Input data kg Indeno kg Indeno % % % % % % % % % 01 Indeno 6.310 6.180 2.000 100.000 100.020 0.185 -0.005 0.004 -0.534 0.012 0.534 02 Indeno 1468.800 3321.100 2.000 1000.000 1000.002 996.213 0.021 2.231 21.226 6.310 22.144 03 Indeno 13.580 6.450 2.000 100.000 100.020 0.194 -0.016 0.004 -1.609 0.012 1.609 Total Indeno 1488.690 3333.730 992441.296 493.245 Total uncertain-ties
Overall uncer-tainty i the year
(%):
996.213 Trend uncertain-ty (%):
22.209
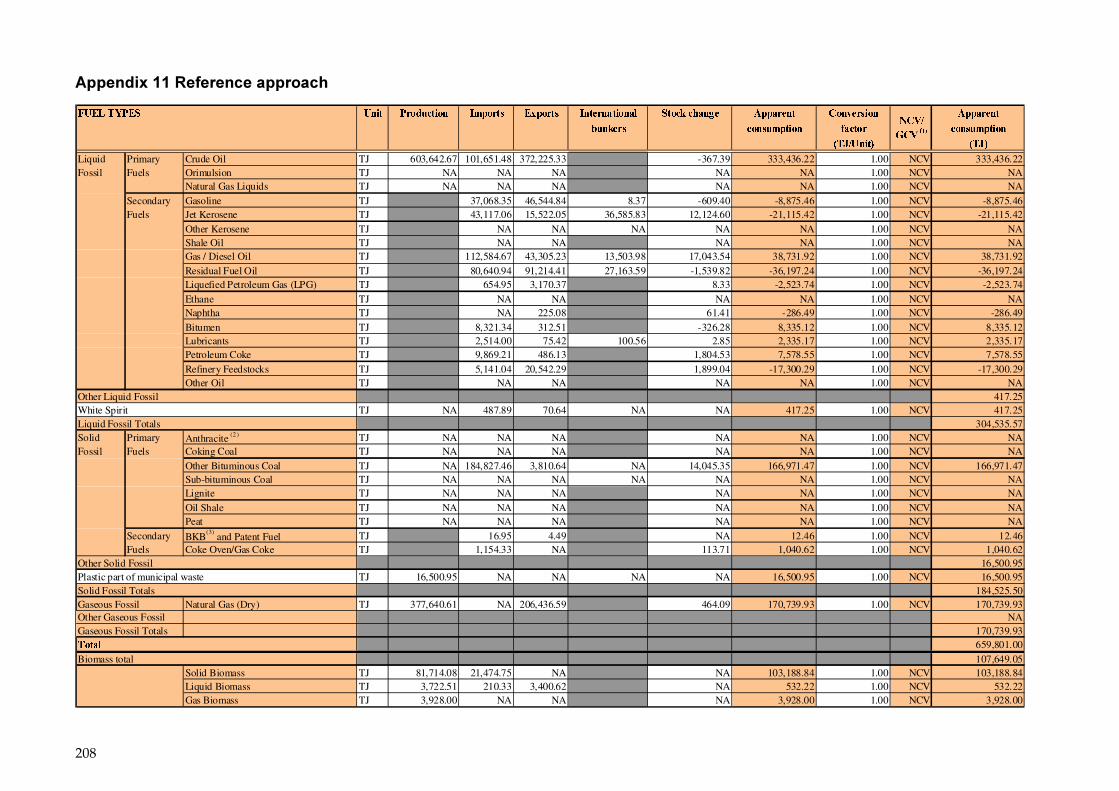
208
���������������� �������� ��
���������� �� �� ���� ��� ��� ��� ��� ������ �� �� �������� ������� � ���� �������
������ � ����� ��� ����������� � �����
!�"#��$ !�"$
Liquid Primary Crude Oil TJ 603,642.67 101,651.48 372,225.33 -367.39 333,436.22 1.00 NCV 333,436.22Fossil Fuels Orimulsion TJ NA NA NA NA NA 1.00 NCV NA
Natural Gas Liquids TJ NA NA NA NA NA 1.00 NCV NASecondary Gasoline TJ 37,068.35 46,544.84 8.37 -609.40 -8,875.46 1.00 NCV -8,875.46Fuels Jet Kerosene TJ 43,117.06 15,522.05 36,585.83 12,124.60 -21,115.42 1.00 NCV -21,115.42
Other Kerosene TJ NA NA NA NA NA 1.00 NCV NAShale Oil TJ NA NA NA NA 1.00 NCV NAGas / Diesel Oil TJ 112,584.67 43,305.23 13,503.98 17,043.54 38,731.92 1.00 NCV 38,731.92Residual Fuel Oil TJ 80,640.94 91,214.41 27,163.59 -1,539.82 -36,197.24 1.00 NCV -36,197.24Liquefied Petroleum Gas (LPG) TJ 654.95 3,170.37 8.33 -2,523.74 1.00 NCV -2,523.74Ethane TJ NA NA NA NA 1.00 NCV NANaphtha TJ NA 225.08 61.41 -286.49 1.00 NCV -286.49Bitumen TJ 8,321.34 312.51 -326.28 8,335.12 1.00 NCV 8,335.12Lubricants TJ 2,514.00 75.42 100.56 2.85 2,335.17 1.00 NCV 2,335.17Petroleum Coke TJ 9,869.21 486.13 1,804.53 7,578.55 1.00 NCV 7,578.55Refinery Feedstocks TJ 5,141.04 20,542.29 1,899.04 -17,300.29 1.00 NCV -17,300.29Other Oil TJ NA NA NA NA 1.00 NCV NA
Other Liquid Fossil 417.25White Spirit TJ NA 487.89 70.64 NA NA 417.25 1.00 NCV 417.25Liquid Fossil Totals 304,535.57Solid Primary Anthracite (2 ) TJ NA NA NA NA NA 1.00 NCV NAFossil Fuels Coking Coal TJ NA NA NA NA NA 1.00 NCV NA
Other Bituminous Coal TJ NA 184,827.46 3,810.64 NA 14,045.35 166,971.47 1.00 NCV 166,971.47Sub-bituminous Coal TJ NA NA NA NA NA NA 1.00 NCV NALignite TJ NA NA NA NA NA 1.00 NCV NAOil Shale TJ NA NA NA NA NA 1.00 NCV NAPeat TJ NA NA NA NA NA 1.00 NCV NA
Secondary BKB(3)
and Patent Fuel TJ 16.95 4.49 NA 12.46 1.00 NCV 12.46Fuels Coke Oven/Gas Coke TJ 1,154.33 NA 113.71 1,040.62 1.00 NCV 1,040.62
Other Solid Fossil 16,500.95Plastic part of municipal waste TJ 16,500.95 NA NA NA NA 16,500.95 1.00 NCV 16,500.95Solid Fossil Totals 184,525.50Gaseous Fossil Natural Gas (Dry) TJ 377,640.61 NA 206,436.59 464.09 170,739.93 1.00 NCV 170,739.93Other Gaseous Fossil NAGaseous Fossil Totals 170,739.93� ��� 659,801.00Biomass total 107,649.05
Solid Biomass TJ 81,714.08 21,474.75 NA NA 103,188.84 1.00 NCV 103,188.84Liquid Biomass TJ 3,722.51 210.33 3,400.62 NA 532.22 1.00 NCV 532.22Gas Biomass TJ 3,928.00 NA NA NA 3,928.00 1.00 NCV 3,928.00
%�&#�
'�&����
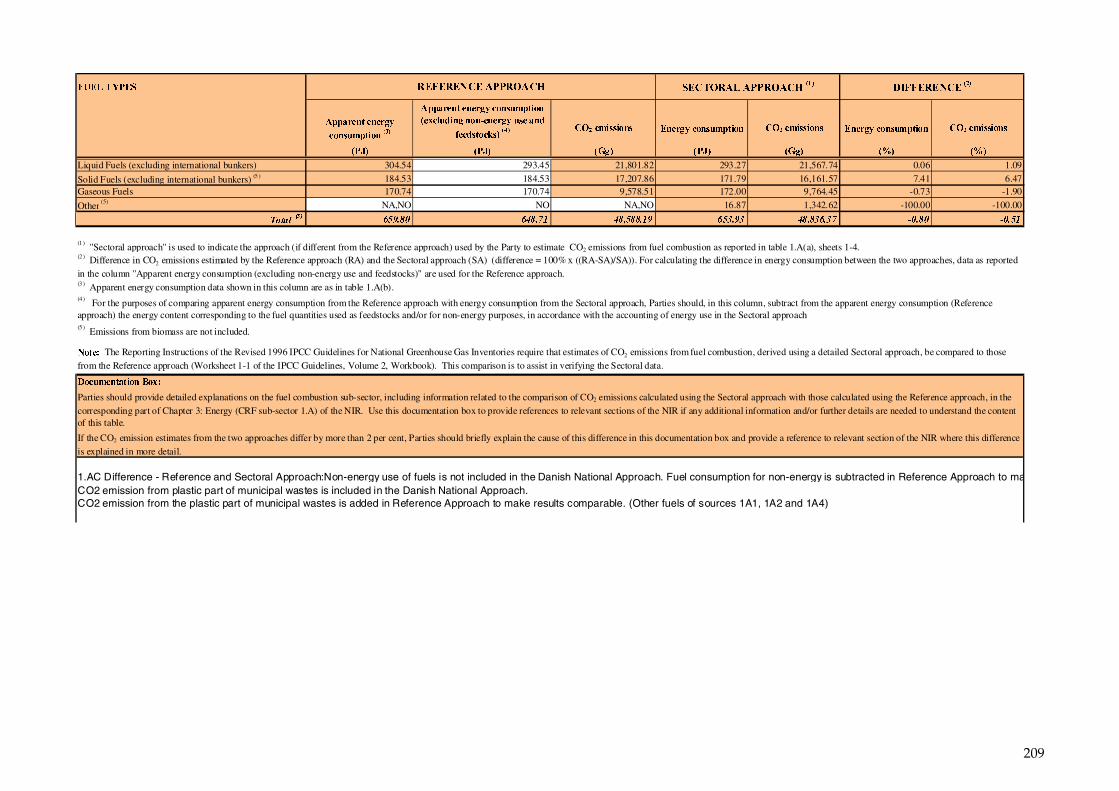
209
����������
�� ��� � ����
�������������� ���� ��������� �� ��������������� ���� ��������� �� ��������������� ���� ���������
���� ���� ���� ���� ���� ��� ���
Liquid Fuels (excluding international bunkers) 304.54 293.45 21,801.82 293.27 21,567.74 0.06 1.09
Solid Fuels (excluding international bunkers) (5 ) 184.53 184.53 17,207.86 171.79 16,161.57 7.41 6.47Gaseous Fuels 170.74 170.74 9,578.51 172.00 9,764.45 -0.73 -1.90
Other (5) NA,NO NO NA,NO 16.87 1,342.62 -100.00 -100.00
�������� �
���� �� � ����� ����� ����� ��� ����
(1) "Sectoral approach" is used to indicate the approach (if different from the Reference approach) used by the Party to estimate CO2 emissions from fuel combustion as reported in table 1.A(a), sheets 1-4.
(3) Apparent energy consumption data shown in this column are as in table 1.A(b).
(5) Emissions from biomass are not included.
����� �������� �!"
Parties should provide detailed explanations on the fuel combustion sub-sector, including information related to the comparison of CO2 emissions calculated using the Sectoral approach with those calculated using the Reference approach, in the corresponding part of Chapter 3: Energy (CRF sub-sector 1.A) of the NIR. Use this documentation box to provide references to relevant sections of the NIR if any additional information and/or further details are needed to understand the content of this table.
If the CO2 emission estimates from the two approaches differ by more than 2 per cent, Parties should briefly explain the cause of this difference in this documentation box and provide a reference to relevant section of the NIR where this difference is explained in more detail.
(2) Difference in CO2 emissions estimated by the Reference approach (RA) and the Sectoral approach (SA) (difference = 100% x ((RA-SA)/SA)). For calculating the difference in energy consumption between the two approaches, data as reported in the column "Apparent energy consumption (excluding non-energy use and feedstocks)" are used for the Reference approach.
#�� " The Reporting Instructions of the Revised 1996 IPCC Guidelines for National Greenhouse Gas Inventories require that estimates of CO2 emissions from fuel combustion, derived using a detailed Sectoral approach, be compared to those from the Reference approach (Worksheet 1-1 of the IPCC Guidelines, Volume 2, Workbook). This comparison is to assist in verifying the Sectoral data.
(4) For the purposes of comparing apparent energy consumption from the Reference approach with energy consumption from the Sectoral approach, Parties should, in this column, subtract from the apparent energy consumption (Reference approach) the energy content corresponding to the fuel quantities used as feedstocks and/or for non-energy purposes, in accordance with the accounting of energy use in the Sectoral approach
1.AC Difference - Reference and Sectoral Approach:Non-energy use of fuels is not included in the Danish National Approach. Fuel consumption for non-energy is subtracted in Reference Approach to maCO2 emission from plastic part of municipal wastes is included in the Danish National Approach. CO2 emission from the plastic part of municipal wastes is added in Reference Approach to make results comparable. (Other fuels of sources 1A1, 1A2 and 1A4)
����������������� �������������������
�������������
�� ��� � ���������������
� !�$�%�������& � ������ ���%�
' %����(������
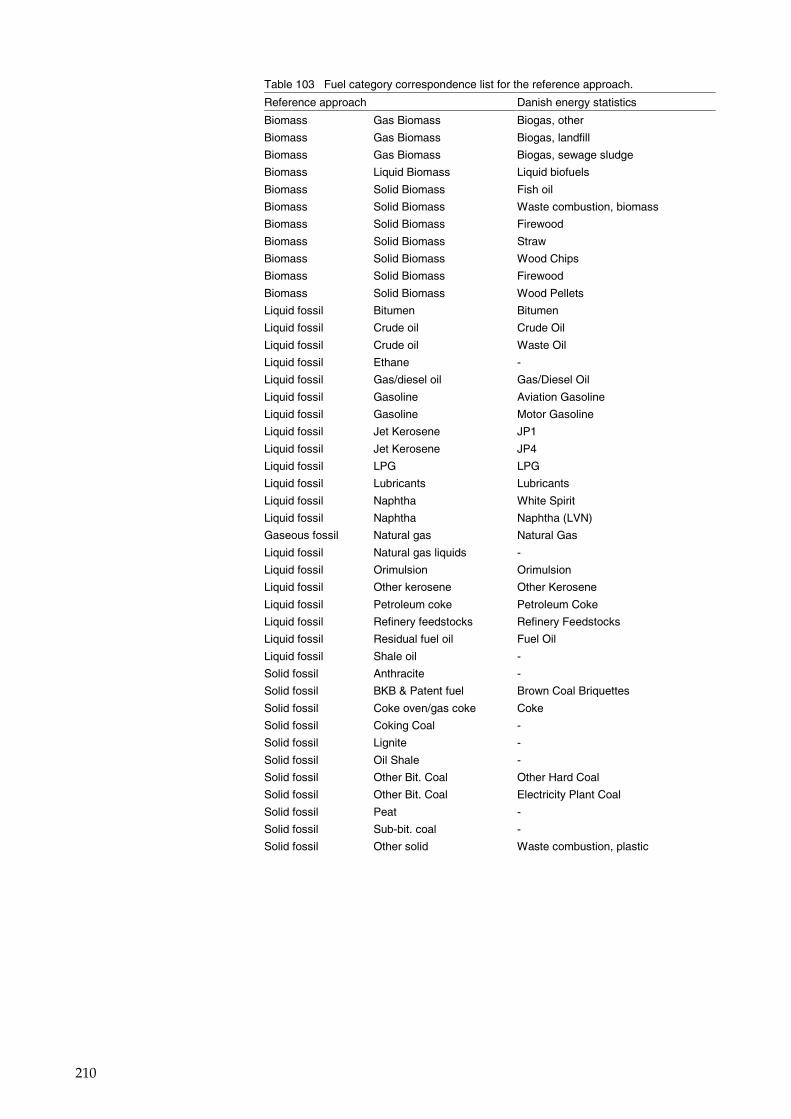
210
Table 103 Fuel category correspondence list for the reference approach.
Reference approach Danish energy statistics
Biomass Gas Biomass Biogas, other
Biomass Gas Biomass Biogas, landfill
Biomass Gas Biomass Biogas, sewage sludge
Biomass Liquid Biomass Liquid biofuels
Biomass Solid Biomass Fish oil
Biomass Solid Biomass Waste combustion, biomass
Biomass Solid Biomass Firewood
Biomass Solid Biomass Straw
Biomass Solid Biomass Wood Chips
Biomass Solid Biomass Firewood
Biomass Solid Biomass Wood Pellets
Liquid fossil Bitumen Bitumen
Liquid fossil Crude oil Crude Oil
Liquid fossil Crude oil Waste Oil
Liquid fossil Ethane -
Liquid fossil Gas/diesel oil Gas/Diesel Oil
Liquid fossil Gasoline Aviation Gasoline
Liquid fossil Gasoline Motor Gasoline
Liquid fossil Jet Kerosene JP1
Liquid fossil Jet Kerosene JP4
Liquid fossil LPG LPG
Liquid fossil Lubricants Lubricants
Liquid fossil Naphtha White Spirit
Liquid fossil Naphtha Naphtha (LVN)
Gaseous fossil Natural gas Natural Gas
Liquid fossil Natural gas liquids -
Liquid fossil Orimulsion Orimulsion
Liquid fossil Other kerosene Other Kerosene
Liquid fossil Petroleum coke Petroleum Coke
Liquid fossil Refinery feedstocks Refinery Feedstocks
Liquid fossil Residual fuel oil Fuel Oil
Liquid fossil Shale oil -
Solid fossil Anthracite -
Solid fossil BKB & Patent fuel Brown Coal Briquettes
Solid fossil Coke oven/gas coke Coke
Solid fossil Coking Coal -
Solid fossil Lignite -
Solid fossil Oil Shale -
Solid fossil Other Bit. Coal Other Hard Coal
Solid fossil Other Bit. Coal Electricity Plant Coal
Solid fossil Peat -
Solid fossil Sub-bit. coal -
Solid fossil Other solid Waste combustion, plastic
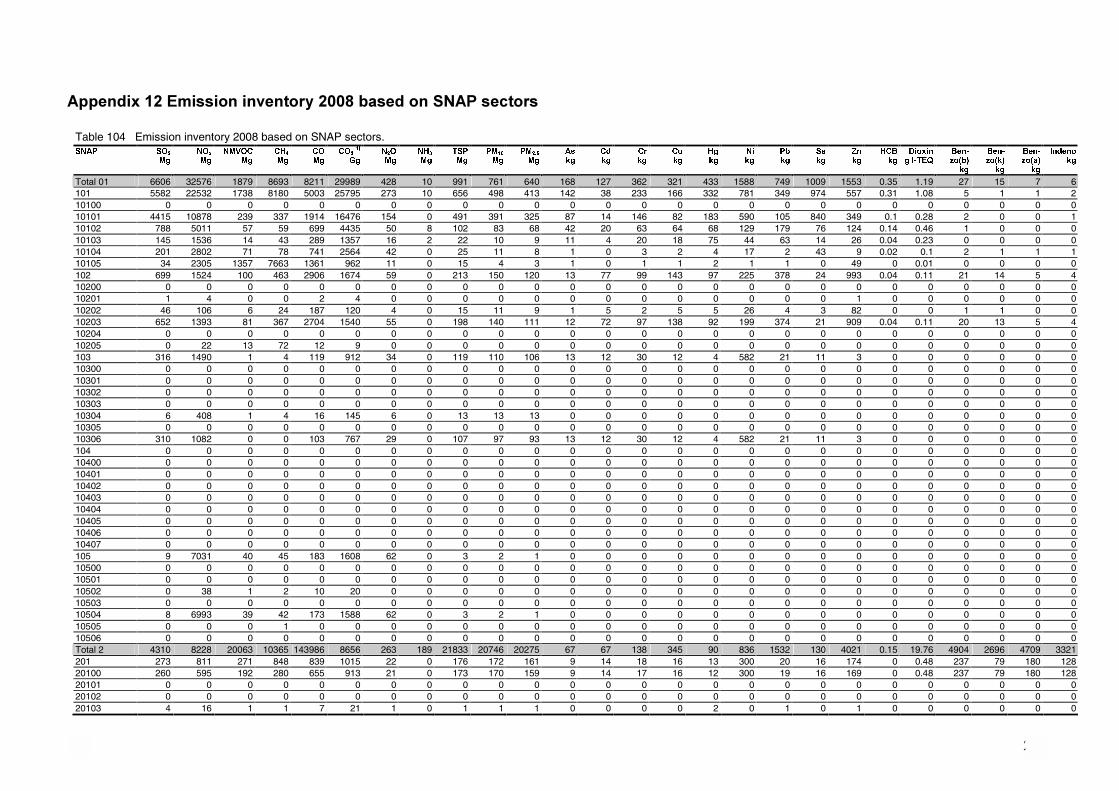
211
������������� �������������������� ����������� ����� �
Table 104 Emission inventory 2008 based on SNAP sectors. ����� ����
����������
��������
�����
�����
������
����������
������
�������
��������
���������
� ����
�����
�����
�����
�����
������
������
������
������
�����
���������������
������ �!�
���
������ �!�
���
������ "!�
���
����������
Total 01 6606 32576 1879 8693 8211 29989 428 10 991 761 640 168 127 362 321 433 1588 749 1009 1553 0.35 1.19 27 15 7 6 101 5582 22532 1738 8180 5003 25795 273 10 656 498 413 142 38 233 166 332 781 349 974 557 0.31 1.08 5 1 1 2 10100 0 0 0 0 0 0 0 0 0 0 0 0 0 0 0 0 0 0 0 0 0 0 0 0 0 0 10101 4415 10878 239 337 1914 16476 154 0 491 391 325 87 14 146 82 183 590 105 840 349 0.1 0.28 2 0 0 1 10102 788 5011 57 59 699 4435 50 8 102 83 68 42 20 63 64 68 129 179 76 124 0.14 0.46 1 0 0 0 10103 145 1536 14 43 289 1357 16 2 22 10 9 11 4 20 18 75 44 63 14 26 0.04 0.23 0 0 0 0 10104 201 2802 71 78 741 2564 42 0 25 11 8 1 0 3 2 4 17 2 43 9 0.02 0.1 2 1 1 1 10105 34 2305 1357 7663 1361 962 11 0 15 4 3 1 0 1 1 2 1 1 0 49 0 0.01 0 0 0 0 102 699 1524 100 463 2906 1674 59 0 213 150 120 13 77 99 143 97 225 378 24 993 0.04 0.11 21 14 5 4 10200 0 0 0 0 0 0 0 0 0 0 0 0 0 0 0 0 0 0 0 0 0 0 0 0 0 0 10201 1 4 0 0 2 4 0 0 0 0 0 0 0 0 0 0 0 0 0 1 0 0 0 0 0 0 10202 46 106 6 24 187 120 4 0 15 11 9 1 5 2 5 5 26 4 3 82 0 0 1 1 0 0 10203 652 1393 81 367 2704 1540 55 0 198 140 111 12 72 97 138 92 199 374 21 909 0.04 0.11 20 13 5 4 10204 0 0 0 0 0 0 0 0 0 0 0 0 0 0 0 0 0 0 0 0 0 0 0 0 0 0 10205 0 22 13 72 12 9 0 0 0 0 0 0 0 0 0 0 0 0 0 0 0 0 0 0 0 0 103 316 1490 1 4 119 912 34 0 119 110 106 13 12 30 12 4 582 21 11 3 0 0 0 0 0 0 10300 0 0 0 0 0 0 0 0 0 0 0 0 0 0 0 0 0 0 0 0 0 0 0 0 0 0 10301 0 0 0 0 0 0 0 0 0 0 0 0 0 0 0 0 0 0 0 0 0 0 0 0 0 0 10302 0 0 0 0 0 0 0 0 0 0 0 0 0 0 0 0 0 0 0 0 0 0 0 0 0 0 10303 0 0 0 0 0 0 0 0 0 0 0 0 0 0 0 0 0 0 0 0 0 0 0 0 0 0 10304 6 408 1 4 16 145 6 0 13 13 13 0 0 0 0 0 0 0 0 0 0 0 0 0 0 0 10305 0 0 0 0 0 0 0 0 0 0 0 0 0 0 0 0 0 0 0 0 0 0 0 0 0 0 10306 310 1082 0 0 103 767 29 0 107 97 93 13 12 30 12 4 582 21 11 3 0 0 0 0 0 0 104 0 0 0 0 0 0 0 0 0 0 0 0 0 0 0 0 0 0 0 0 0 0 0 0 0 0 10400 0 0 0 0 0 0 0 0 0 0 0 0 0 0 0 0 0 0 0 0 0 0 0 0 0 0 10401 0 0 0 0 0 0 0 0 0 0 0 0 0 0 0 0 0 0 0 0 0 0 0 0 0 0 10402 0 0 0 0 0 0 0 0 0 0 0 0 0 0 0 0 0 0 0 0 0 0 0 0 0 0 10403 0 0 0 0 0 0 0 0 0 0 0 0 0 0 0 0 0 0 0 0 0 0 0 0 0 0 10404 0 0 0 0 0 0 0 0 0 0 0 0 0 0 0 0 0 0 0 0 0 0 0 0 0 0 10405 0 0 0 0 0 0 0 0 0 0 0 0 0 0 0 0 0 0 0 0 0 0 0 0 0 0 10406 0 0 0 0 0 0 0 0 0 0 0 0 0 0 0 0 0 0 0 0 0 0 0 0 0 0 10407 0 0 0 0 0 0 0 0 0 0 0 0 0 0 0 0 0 0 0 0 0 0 0 0 0 0 105 9 7031 40 45 183 1608 62 0 3 2 1 0 0 0 0 0 0 0 0 0 0 0 0 0 0 0 10500 0 0 0 0 0 0 0 0 0 0 0 0 0 0 0 0 0 0 0 0 0 0 0 0 0 0 10501 0 0 0 0 0 0 0 0 0 0 0 0 0 0 0 0 0 0 0 0 0 0 0 0 0 0 10502 0 38 1 2 10 20 0 0 0 0 0 0 0 0 0 0 0 0 0 0 0 0 0 0 0 0 10503 0 0 0 0 0 0 0 0 0 0 0 0 0 0 0 0 0 0 0 0 0 0 0 0 0 0 10504 8 6993 39 42 173 1588 62 0 3 2 1 0 0 0 0 0 0 0 0 0 0 0 0 0 0 0 10505 0 0 0 1 0 0 0 0 0 0 0 0 0 0 0 0 0 0 0 0 0 0 0 0 0 0 10506 0 0 0 0 0 0 0 0 0 0 0 0 0 0 0 0 0 0 0 0 0 0 0 0 0 0 Total 2 4310 8228 20063 10365 143986 8656 263 189 21833 20746 20275 67 67 138 345 90 836 1532 130 4021 0.15 19.76 4904 2696 4709 3321 201 273 811 271 848 839 1015 22 0 176 172 161 9 14 18 16 13 300 20 16 174 0 0.48 237 79 180 128 20100 260 595 192 280 655 913 21 0 173 170 159 9 14 17 16 12 300 19 16 169 0 0.48 237 79 180 128 20101 0 0 0 0 0 0 0 0 0 0 0 0 0 0 0 0 0 0 0 0 0 0 0 0 0 0 20102 0 0 0 0 0 0 0 0 0 0 0 0 0 0 0 0 0 0 0 0 0 0 0 0 0 0 20103 4 16 1 1 7 21 1 0 1 1 1 0 0 0 0 2 0 1 0 1 0 0 0 0 0 0
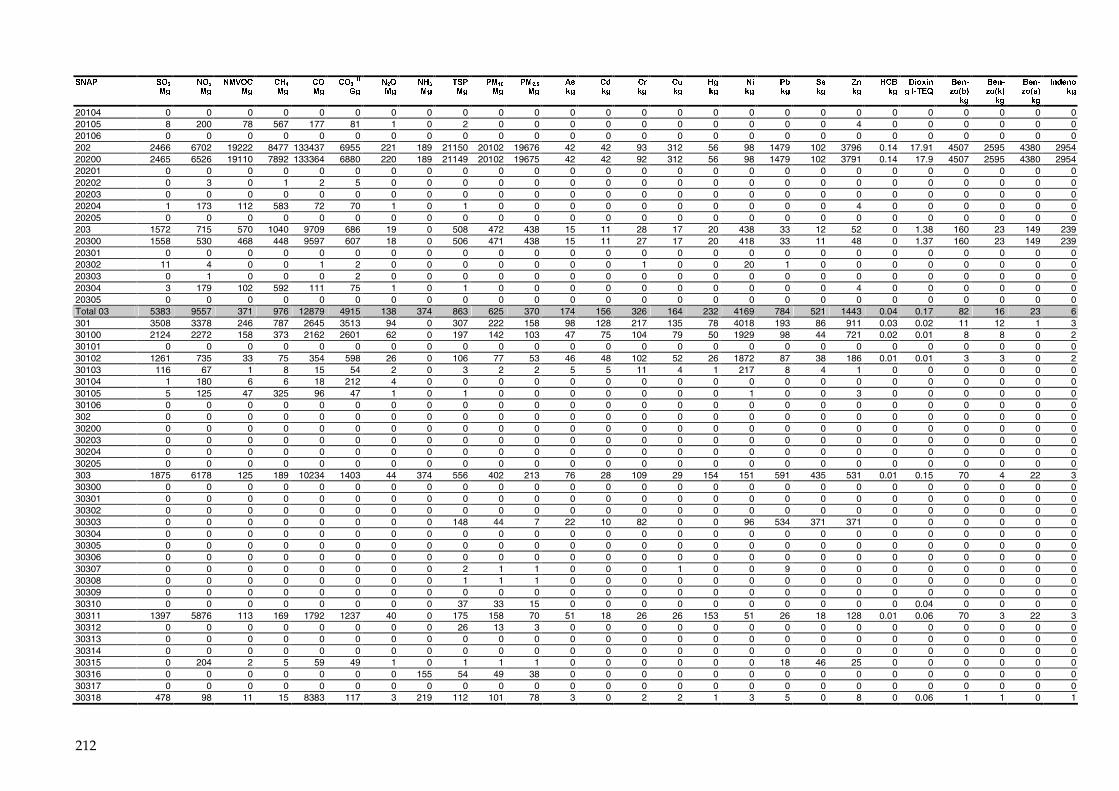
212
����� �������
�������
��������
�����
�����
������
����������
������
�������
��������
���������
� ����
�����
�����
�����
�����
������
������
������
������
�����
���������������
������ �!�
���
������ �!�
���
������ "!�
���
����������
20104 0 0 0 0 0 0 0 0 0 0 0 0 0 0 0 0 0 0 0 0 0 0 0 0 0 0 20105 8 200 78 567 177 81 1 0 2 0 0 0 0 0 0 0 0 0 0 4 0 0 0 0 0 0 20106 0 0 0 0 0 0 0 0 0 0 0 0 0 0 0 0 0 0 0 0 0 0 0 0 0 0 202 2466 6702 19222 8477 133437 6955 221 189 21150 20102 19676 42 42 93 312 56 98 1479 102 3796 0.14 17.91 4507 2595 4380 2954 20200 2465 6526 19110 7892 133364 6880 220 189 21149 20102 19675 42 42 92 312 56 98 1479 102 3791 0.14 17.9 4507 2595 4380 2954 20201 0 0 0 0 0 0 0 0 0 0 0 0 0 0 0 0 0 0 0 0 0 0 0 0 0 0 20202 0 3 0 1 2 5 0 0 0 0 0 0 0 0 0 0 0 0 0 0 0 0 0 0 0 0 20203 0 0 0 0 0 0 0 0 0 0 0 0 0 0 0 0 0 0 0 0 0 0 0 0 0 0 20204 1 173 112 583 72 70 1 0 1 0 0 0 0 0 0 0 0 0 0 4 0 0 0 0 0 0 20205 0 0 0 0 0 0 0 0 0 0 0 0 0 0 0 0 0 0 0 0 0 0 0 0 0 0 203 1572 715 570 1040 9709 686 19 0 508 472 438 15 11 28 17 20 438 33 12 52 0 1.38 160 23 149 239 20300 1558 530 468 448 9597 607 18 0 506 471 438 15 11 27 17 20 418 33 11 48 0 1.37 160 23 149 239 20301 0 0 0 0 0 0 0 0 0 0 0 0 0 0 0 0 0 0 0 0 0 0 0 0 0 0 20302 11 4 0 0 1 2 0 0 0 0 0 0 0 1 0 0 20 1 0 0 0 0 0 0 0 0 20303 0 1 0 0 0 2 0 0 0 0 0 0 0 0 0 0 0 0 0 0 0 0 0 0 0 0 20304 3 179 102 592 111 75 1 0 1 0 0 0 0 0 0 0 0 0 0 4 0 0 0 0 0 0 20305 0 0 0 0 0 0 0 0 0 0 0 0 0 0 0 0 0 0 0 0 0 0 0 0 0 0 Total 03 5383 9557 371 976 12879 4915 138 374 863 625 370 174 156 326 164 232 4169 784 521 1443 0.04 0.17 82 16 23 6 301 3508 3378 246 787 2645 3513 94 0 307 222 158 98 128 217 135 78 4018 193 86 911 0.03 0.02 11 12 1 3 30100 2124 2272 158 373 2162 2601 62 0 197 142 103 47 75 104 79 50 1929 98 44 721 0.02 0.01 8 8 0 2 30101 0 0 0 0 0 0 0 0 0 0 0 0 0 0 0 0 0 0 0 0 0 0 0 0 0 0 30102 1261 735 33 75 354 598 26 0 106 77 53 46 48 102 52 26 1872 87 38 186 0.01 0.01 3 3 0 2 30103 116 67 1 8 15 54 2 0 3 2 2 5 5 11 4 1 217 8 4 1 0 0 0 0 0 0 30104 1 180 6 6 18 212 4 0 0 0 0 0 0 0 0 0 0 0 0 0 0 0 0 0 0 0 30105 5 125 47 325 96 47 1 0 1 0 0 0 0 0 0 0 1 0 0 3 0 0 0 0 0 0 30106 0 0 0 0 0 0 0 0 0 0 0 0 0 0 0 0 0 0 0 0 0 0 0 0 0 0 302 0 0 0 0 0 0 0 0 0 0 0 0 0 0 0 0 0 0 0 0 0 0 0 0 0 0 30200 0 0 0 0 0 0 0 0 0 0 0 0 0 0 0 0 0 0 0 0 0 0 0 0 0 0 30203 0 0 0 0 0 0 0 0 0 0 0 0 0 0 0 0 0 0 0 0 0 0 0 0 0 0 30204 0 0 0 0 0 0 0 0 0 0 0 0 0 0 0 0 0 0 0 0 0 0 0 0 0 0 30205 0 0 0 0 0 0 0 0 0 0 0 0 0 0 0 0 0 0 0 0 0 0 0 0 0 0 303 1875 6178 125 189 10234 1403 44 374 556 402 213 76 28 109 29 154 151 591 435 531 0.01 0.15 70 4 22 3 30300 0 0 0 0 0 0 0 0 0 0 0 0 0 0 0 0 0 0 0 0 0 0 0 0 0 0 30301 0 0 0 0 0 0 0 0 0 0 0 0 0 0 0 0 0 0 0 0 0 0 0 0 0 0 30302 0 0 0 0 0 0 0 0 0 0 0 0 0 0 0 0 0 0 0 0 0 0 0 0 0 0 30303 0 0 0 0 0 0 0 0 148 44 7 22 10 82 0 0 96 534 371 371 0 0 0 0 0 0 30304 0 0 0 0 0 0 0 0 0 0 0 0 0 0 0 0 0 0 0 0 0 0 0 0 0 0 30305 0 0 0 0 0 0 0 0 0 0 0 0 0 0 0 0 0 0 0 0 0 0 0 0 0 0 30306 0 0 0 0 0 0 0 0 0 0 0 0 0 0 0 0 0 0 0 0 0 0 0 0 0 0 30307 0 0 0 0 0 0 0 0 2 1 1 0 0 0 1 0 0 9 0 0 0 0 0 0 0 0 30308 0 0 0 0 0 0 0 0 1 1 1 0 0 0 0 0 0 0 0 0 0 0 0 0 0 0 30309 0 0 0 0 0 0 0 0 0 0 0 0 0 0 0 0 0 0 0 0 0 0 0 0 0 0 30310 0 0 0 0 0 0 0 0 37 33 15 0 0 0 0 0 0 0 0 0 0 0.04 0 0 0 0 30311 1397 5876 113 169 1792 1237 40 0 175 158 70 51 18 26 26 153 51 26 18 128 0.01 0.06 70 3 22 3 30312 0 0 0 0 0 0 0 0 26 13 3 0 0 0 0 0 0 0 0 0 0 0 0 0 0 0 30313 0 0 0 0 0 0 0 0 0 0 0 0 0 0 0 0 0 0 0 0 0 0 0 0 0 0 30314 0 0 0 0 0 0 0 0 0 0 0 0 0 0 0 0 0 0 0 0 0 0 0 0 0 0 30315 0 204 2 5 59 49 1 0 1 1 1 0 0 0 0 0 0 18 46 25 0 0 0 0 0 0 30316 0 0 0 0 0 0 0 155 54 49 38 0 0 0 0 0 0 0 0 0 0 0 0 0 0 0 30317 0 0 0 0 0 0 0 0 0 0 0 0 0 0 0 0 0 0 0 0 0 0 0 0 0 0 30318 478 98 11 15 8383 117 3 219 112 101 78 3 0 2 2 1 3 5 0 8 0 0.06 1 1 0 1
213
����� �������
�������
��������
�����
�����
������
����������
������
�������
��������
���������
� ����
�����
�����
�����
�����
������
������
������
������
�����
���������������
������ �!�
���
������ �!�
���
������ "!�
���
����������
30319 0 0 0 0 0 0 0 0 0 0 0 0 0 0 0 0 0 0 0 0 0 0 0 0 0 0 30320 0 0 0 0 0 0 0 0 0 0 0 0 0 0 0 0 0 0 0 0 0 0 0 0 0 0 30321 0 0 0 0 0 0 0 0 0 0 0 0 0 0 0 0 0 0 0 0 0 0 0 0 0 0 30322 0 0 0 0 0 0 0 0 0 0 0 0 0 0 0 0 0 0 0 0 0 0 0 0 0 0 30323 0 0 0 0 0 0 0 0 0 0 0 0 0 0 0 0 0 0 0 0 0 0 0 0 0 0 30324 0 0 0 0 0 0 0 0 0 0 0 0 0 0 0 0 0 0 0 0 0 0 0 0 0 0 30325 0 0 0 0 0 0 0 0 0 0 0 0 0 0 0 0 0 0 0 0 0 0 0 0 0 0 30326 0 0 0 0 0 0 0 0 0 0 0 0 0 0 0 0 0 0 0 0 0 0 0 0 0 0 30327 0 0 0 0 0 0 0 0 0 0 0 0 0 0 0 0 0 0 0 0 0 0 0 0 0 0 1) Including CO2 emission from biomass 2) SNAP sector codes are shown in appendix 3
214
������������� ������������������������������������� ��
This description of the Danish energy statistics has been prepared by Denmark’s National Environmental Research Institute (NERI) in coop-eration with the Danish Energy Agency (DEA) as background informa-tion to the Danish National Inventory Report (NIR).
���������������� � � ���� ���
DEA is responsible for the Danish energy balance. Main contributors to the energy statistics outside DEA are Statistics Denmark and Danish En-ergy Association (before Association of Danish Energy Companies). The statistics is performed using an integrated statistical system building on an Access database and Excel spreadsheets.
The DEA follows the recommendations of the International Energy Agency as well as Eurostat.
The national energy statistics is updated annually and all revisions are immediately included in the published statistics, which can be found at: http://www.ens.dk/en-US/Info/FactsAndFigures/Energy_statistics_and_indicators/Annual%20Statistics/Sider/Forside.aspx (2010-04-27). It is an easy task to check for breaks in a series because the statistics is 100% time-series oriented.
The national energy statistics does not include Greenland and Faroe Is-lands.
For historical reasons, DEA receive monthly information from the Dan-ish oil companies regarding Danish deliveries of oil products to Greenland and Faroe Islands. But the monthly (MOS) and annual (AOS) reporting of oil statistics to Eurostat and IEA exclude Greenland and Faroe Islands. For all other energy products the Danish figures are also excluding Greenland and Faroe Islands.
���� ���� �� ����������������������
The Danish Energy Agency receives monthly statistics for the following fuel groups:
• Crude oil and oil products • Monthly data from 46 oil companies, the main purpose is
monitoring oil stocks according to the oil preparedness sys-tem
• Natural gas • Fuel/flare from platforms in the North Sea • Natural gas balance from the regulator Energinet.dk (Na-
tional monopoly) • Coal and coke
• Power plants (94 %) • Industry companies (4 %) • Coal and coke traders (2 %)
• Electricity
215
• Monthly reporting by e-mail from the regulator Energinet.dk (National monopoly)
The statistics covers: • Production by type of producer • Own use of electricity • Import and export by country • Domestic supply (consumption + distribution loss)
• Town gas (quarterly) from two town gas producers The large central power plants also report monthly consumption of bio-mass.
Annual data includes renewable energy including waste. The DEA con-ducts a biannual survey on wood pellets and wood fuel. Statistics Den-mark conducts biannual surveys on the energy consumption in the ser-vice and industrial sectors. Statistics Denmark prepares annual surveys on forest (wood fuel) & straw.
Other annual data sources include:
• DEA • Survey on production of electricity and heat and fuels used • Survey on end use of oil • Survey on end use of natural gas • Survey on end use of coal and coke
• National Environmental Research Institute (NERI), Aarhus Univer-sity • Energy consumption for domestic air transport
• Danish Energy Association (Association of Danish Energy compa-nies) • Survey on electricity consumption
• Ministry of Taxation • Border trade
• Centre for Biomass Technology • Annual estimates of final consumption of straw and wood chips
��������������
In general, DEA follows the same procedures as in the Danish national account. This means that normally only figures for the last two years are revised.
������ ���� ��������� � � �����������������
As part of the data delivery agreement between the DEA and NERI, the DEA supplies a version of the official energy statistics aggregated on SNAP level to be used in the emission calculation. In cooperation be-tween DEA and NERI a fuel correspondence table has been developed mapping the fuels used by the DEA in the official energy statistics with the fuel codes used in the Danish national emission database. Similarly the sectors used in the official energy statistics have been mapped to SNAP categories, used in the Danish emission database. The fuel corre-spondence table between fuel categories used by the DEA, NERI and IPCC is presented in Appendix 3.
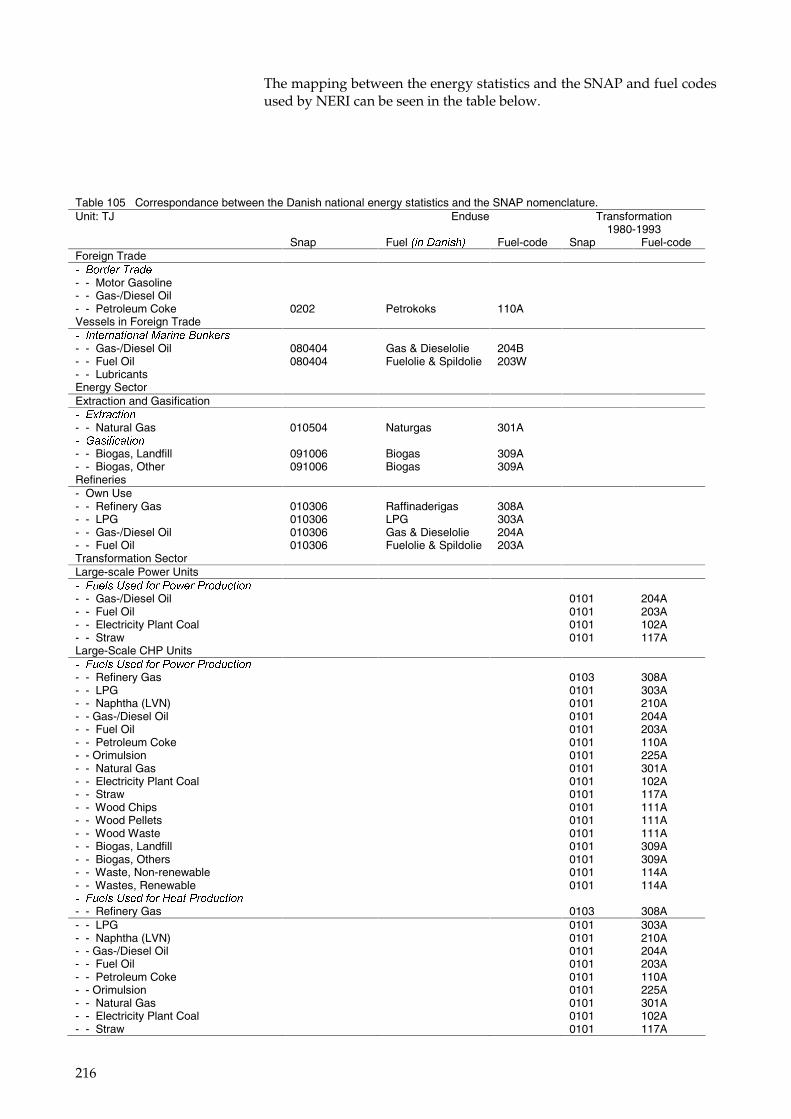
216
The mapping between the energy statistics and the SNAP and fuel codes used by NERI can be seen in the table below.
Table 105 Correspondance between the Danish national energy statistics and the SNAP nomenclature. Unit: TJ Enduse Transformation
1980-1993 Snap Fuel ����������� Fuel-code Snap Fuel-code Foreign Trade ���� ������ �� - - Motor Gasoline - - Gas-/Diesel Oil - - Petroleum Coke 0202 Petrokoks 110A Vessels in Foreign Trade ������������������������������ - - Gas-/Diesel Oil 080404 Gas & Dieselolie 204B - - Fuel Oil 080404 Fuelolie & Spildolie 203W - - Lubricants Energy Sector Extraction and Gasification ������������� - - Natural Gas 010504 Naturgas 301A ��������������� - - Biogas, Landfill 091006 Biogas 309A - - Biogas, Other 091006 Biogas 309A Refineries - Own Use - - Refinery Gas 010306 Raffinaderigas 308A - - LPG 010306 LPG 303A - - Gas-/Diesel Oil 010306 Gas & Dieselolie 204A - - Fuel Oil 010306 Fuelolie & Spildolie 203A Transformation Sector Large-scale Power Units ����������� �������������� ������� - - Gas-/Diesel Oil 0101 204A - - Fuel Oil 0101 203A - - Electricity Plant Coal 0101 102A - - Straw 0101 117A Large-Scale CHP Units ����������� �������������� ������� - - Refinery Gas 0103 308A - - LPG 0101 303A - - Naphtha (LVN) 0101 210A - - Gas-/Diesel Oil 0101 204A - - Fuel Oil 0101 203A - - Petroleum Coke 0101 110A - - Orimulsion 0101 225A - - Natural Gas 0101 301A - - Electricity Plant Coal 0101 102A - - Straw 0101 117A - - Wood Chips 0101 111A - - Wood Pellets 0101 111A - - Wood Waste 0101 111A - - Biogas, Landfill 0101 309A - - Biogas, Others 0101 309A - - Waste, Non-renewable 0101 114A - - Wastes, Renewable 0101 114A ����������� ������������� ������� - - Refinery Gas 0103 308A - - LPG 0101 303A - - Naphtha (LVN) 0101 210A - - Gas-/Diesel Oil 0101 204A - - Fuel Oil 0101 203A - - Petroleum Coke 0101 110A - - Orimulsion 0101 225A - - Natural Gas 0101 301A - - Electricity Plant Coal 0101 102A - - Straw 0101 117A
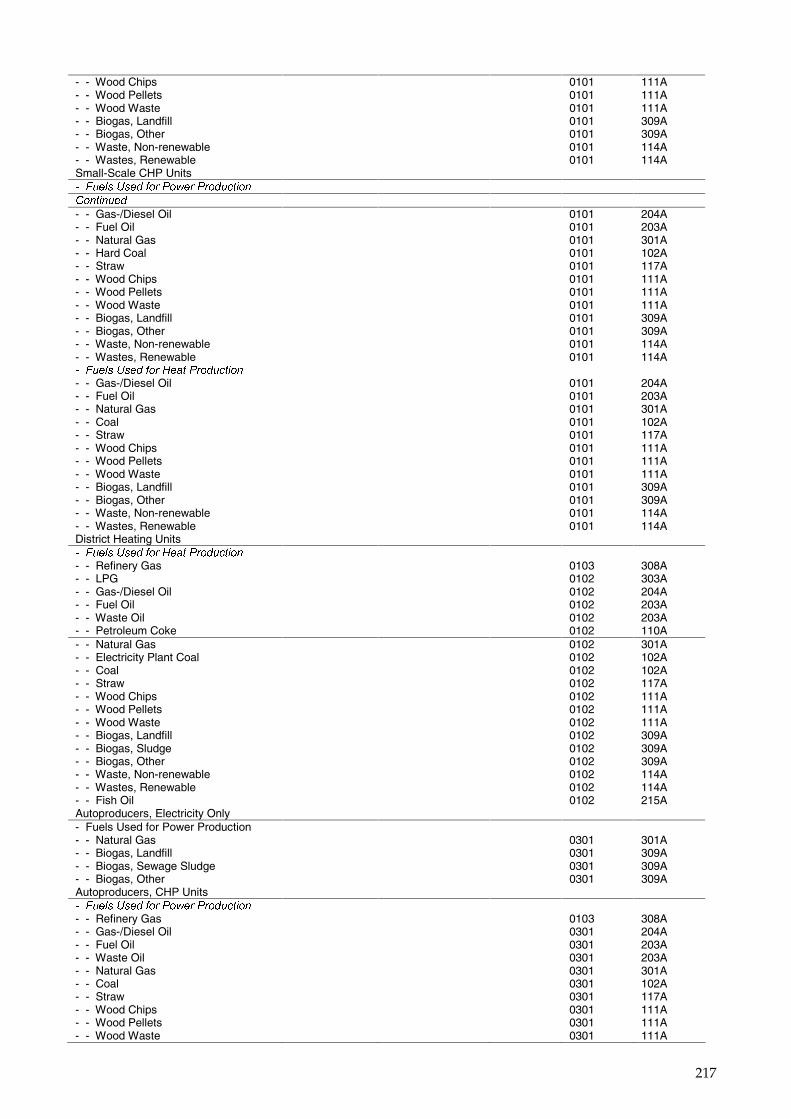
217
- - Wood Chips 0101 111A - - Wood Pellets 0101 111A - - Wood Waste 0101 111A - - Biogas, Landfill 0101 309A - - Biogas, Other 0101 309A - - Waste, Non-renewable 0101 114A - - Wastes, Renewable 0101 114A Small-Scale CHP Units ����������� �������������� ������� ������� � - - Gas-/Diesel Oil 0101 204A - - Fuel Oil 0101 203A - - Natural Gas 0101 301A - - Hard Coal 0101 102A - - Straw 0101 117A - - Wood Chips 0101 111A - - Wood Pellets 0101 111A - - Wood Waste 0101 111A - - Biogas, Landfill 0101 309A - - Biogas, Other 0101 309A - - Waste, Non-renewable 0101 114A - - Wastes, Renewable 0101 114A ����������� ������������� ������� - - Gas-/Diesel Oil 0101 204A - - Fuel Oil 0101 203A - - Natural Gas 0101 301A - - Coal 0101 102A - - Straw 0101 117A - - Wood Chips 0101 111A - - Wood Pellets 0101 111A - - Wood Waste 0101 111A - - Biogas, Landfill 0101 309A - - Biogas, Other 0101 309A - - Waste, Non-renewable 0101 114A - - Wastes, Renewable 0101 114A District Heating Units ����������� ������������� ������� - - Refinery Gas 0103 308A - - LPG 0102 303A - - Gas-/Diesel Oil 0102 204A - - Fuel Oil 0102 203A - - Waste Oil 0102 203A - - Petroleum Coke 0102 110A - - Natural Gas 0102 301A - - Electricity Plant Coal 0102 102A - - Coal 0102 102A - - Straw 0102 117A - - Wood Chips 0102 111A - - Wood Pellets 0102 111A - - Wood Waste 0102 111A - - Biogas, Landfill 0102 309A - - Biogas, Sludge 0102 309A - - Biogas, Other 0102 309A - - Waste, Non-renewable 0102 114A - - Wastes, Renewable 0102 114A - - Fish Oil 0102 215A Autoproducers, Electricity Only - Fuels Used for Power Production - - Natural Gas 0301 301A - - Biogas, Landfill 0301 309A - - Biogas, Sewage Sludge 0301 309A - - Biogas, Other 0301 309A Autoproducers, CHP Units ����������� �������������� ������� - - Refinery Gas 0103 308A - - Gas-/Diesel Oil 0301 204A - - Fuel Oil 0301 203A - - Waste Oil 0301 203A - - Natural Gas 0301 301A - - Coal 0301 102A - - Straw 0301 117A - - Wood Chips 0301 111A - - Wood Pellets 0301 111A - - Wood Waste 0301 111A
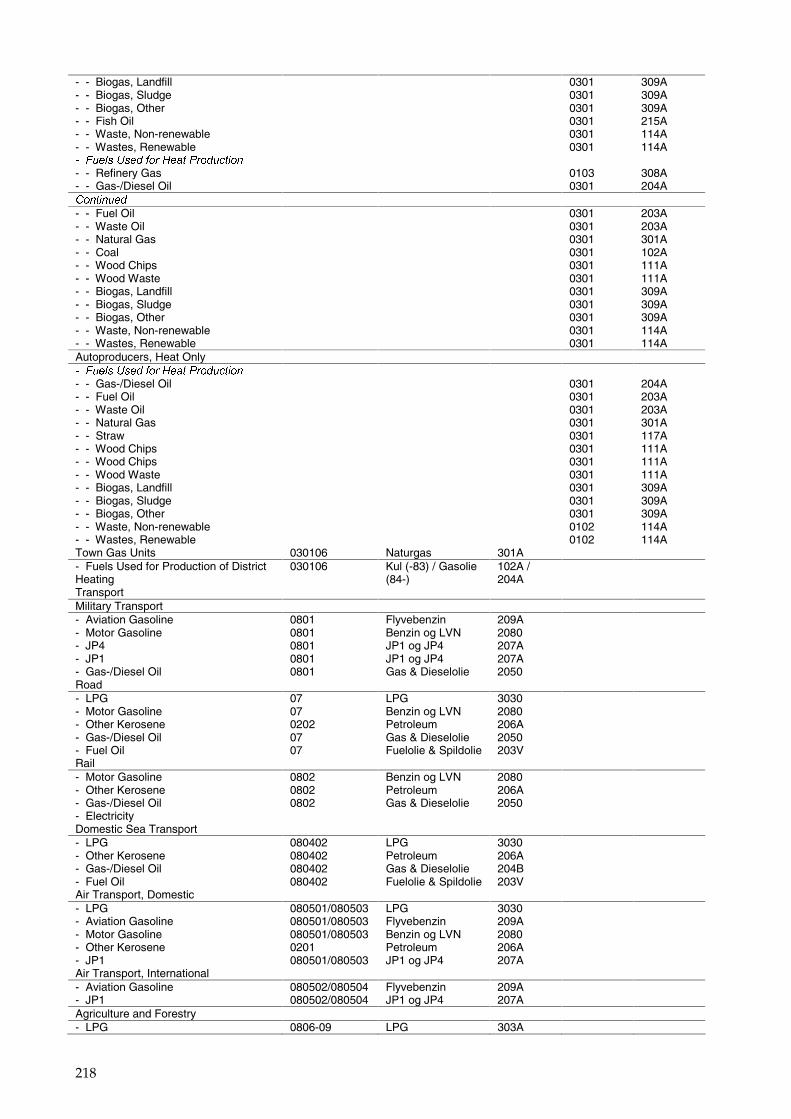
218
- - Biogas, Landfill 0301 309A - - Biogas, Sludge 0301 309A - - Biogas, Other 0301 309A - - Fish Oil 0301 215A - - Waste, Non-renewable 0301 114A - - Wastes, Renewable 0301 114A ����������� ������������� ������� - - Refinery Gas 0103 308A - - Gas-/Diesel Oil 0301 204A ������� � - - Fuel Oil 0301 203A - - Waste Oil 0301 203A - - Natural Gas 0301 301A - - Coal 0301 102A - - Wood Chips 0301 111A - - Wood Waste 0301 111A - - Biogas, Landfill 0301 309A - - Biogas, Sludge 0301 309A - - Biogas, Other 0301 309A - - Waste, Non-renewable 0301 114A - - Wastes, Renewable 0301 114A Autoproducers, Heat Only ����������� ������������� ������� - - Gas-/Diesel Oil 0301 204A - - Fuel Oil 0301 203A - - Waste Oil 0301 203A - - Natural Gas 0301 301A - - Straw 0301 117A - - Wood Chips 0301 111A - - Wood Chips 0301 111A - - Wood Waste 0301 111A - - Biogas, Landfill 0301 309A - - Biogas, Sludge 0301 309A - - Biogas, Other 0301 309A - - Waste, Non-renewable 0102 114A - - Wastes, Renewable 0102 114A Town Gas Units 030106 Naturgas 301A - Fuels Used for Production of District Heating
030106 Kul (-83) / Gasolie (84-)
102A / 204A
Transport Military Transport - Aviation Gasoline 0801 Flyvebenzin 209A - Motor Gasoline 0801 Benzin og LVN 2080 - JP4 0801 JP1 og JP4 207A - JP1 0801 JP1 og JP4 207A - Gas-/Diesel Oil 0801 Gas & Dieselolie 2050 Road - LPG 07 LPG 3030 - Motor Gasoline 07 Benzin og LVN 2080 - Other Kerosene 0202 Petroleum 206A - Gas-/Diesel Oil 07 Gas & Dieselolie 2050 - Fuel Oil 07 Fuelolie & Spildolie 203V Rail - Motor Gasoline 0802 Benzin og LVN 2080 - Other Kerosene 0802 Petroleum 206A - Gas-/Diesel Oil 0802 Gas & Dieselolie 2050 - Electricity Domestic Sea Transport - LPG 080402 LPG 3030 - Other Kerosene 080402 Petroleum 206A - Gas-/Diesel Oil 080402 Gas & Dieselolie 204B - Fuel Oil 080402 Fuelolie & Spildolie 203V Air Transport, Domestic - LPG 080501/080503 LPG 3030 - Aviation Gasoline 080501/080503 Flyvebenzin 209A - Motor Gasoline 080501/080503 Benzin og LVN 2080 - Other Kerosene 0201 Petroleum 206A - JP1 080501/080503 JP1 og JP4 207A Air Transport, International - Aviation Gasoline 080502/080504 Flyvebenzin 209A - JP1 080502/080504 JP1 og JP4 207A Agriculture and Forestry - LPG 0806-09 LPG 303A
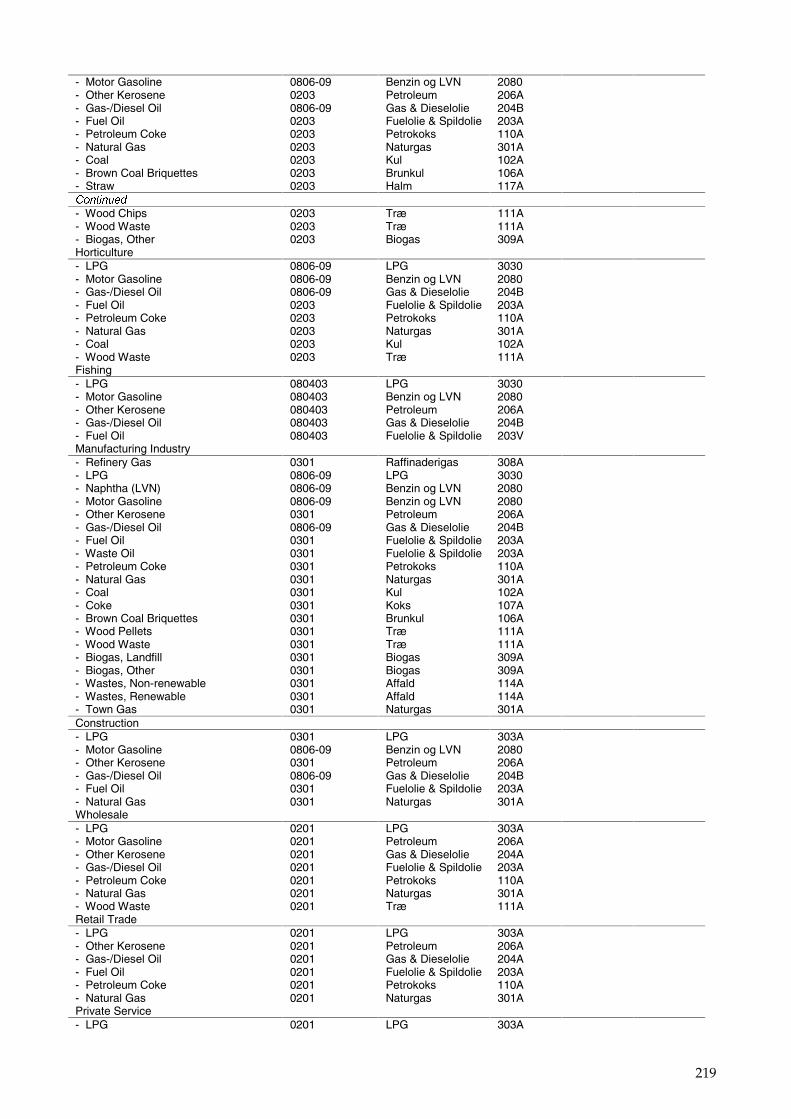
219
- Motor Gasoline 0806-09 Benzin og LVN 2080 - Other Kerosene 0203 Petroleum 206A - Gas-/Diesel Oil 0806-09 Gas & Dieselolie 204B - Fuel Oil 0203 Fuelolie & Spildolie 203A - Petroleum Coke 0203 Petrokoks 110A - Natural Gas 0203 Naturgas 301A - Coal 0203 Kul 102A - Brown Coal Briquettes 0203 Brunkul 106A - Straw 0203 Halm 117A ������� � - Wood Chips 0203 Træ 111A - Wood Waste 0203 Træ 111A - Biogas, Other 0203 Biogas 309A Horticulture - LPG 0806-09 LPG 3030 - Motor Gasoline 0806-09 Benzin og LVN 2080 - Gas-/Diesel Oil 0806-09 Gas & Dieselolie 204B - Fuel Oil 0203 Fuelolie & Spildolie 203A - Petroleum Coke 0203 Petrokoks 110A - Natural Gas 0203 Naturgas 301A - Coal 0203 Kul 102A - Wood Waste 0203 Træ 111A Fishing - LPG 080403 LPG 3030 - Motor Gasoline 080403 Benzin og LVN 2080 - Other Kerosene 080403 Petroleum 206A - Gas-/Diesel Oil 080403 Gas & Dieselolie 204B - Fuel Oil 080403 Fuelolie & Spildolie 203V Manufacturing Industry - Refinery Gas 0301 Raffinaderigas 308A - LPG 0806-09 LPG 3030 - Naphtha (LVN) 0806-09 Benzin og LVN 2080 - Motor Gasoline 0806-09 Benzin og LVN 2080 - Other Kerosene 0301 Petroleum 206A - Gas-/Diesel Oil 0806-09 Gas & Dieselolie 204B - Fuel Oil 0301 Fuelolie & Spildolie 203A - Waste Oil 0301 Fuelolie & Spildolie 203A - Petroleum Coke 0301 Petrokoks 110A - Natural Gas 0301 Naturgas 301A - Coal 0301 Kul 102A - Coke 0301 Koks 107A - Brown Coal Briquettes 0301 Brunkul 106A - Wood Pellets 0301 Træ 111A - Wood Waste 0301 Træ 111A - Biogas, Landfill 0301 Biogas 309A - Biogas, Other 0301 Biogas 309A - Wastes, Non-renewable 0301 Affald 114A - Wastes, Renewable 0301 Affald 114A - Town Gas 0301 Naturgas 301A Construction - LPG 0301 LPG 303A - Motor Gasoline 0806-09 Benzin og LVN 2080 - Other Kerosene 0301 Petroleum 206A - Gas-/Diesel Oil 0806-09 Gas & Dieselolie 204B - Fuel Oil 0301 Fuelolie & Spildolie 203A - Natural Gas 0301 Naturgas 301A Wholesale - LPG 0201 LPG 303A - Motor Gasoline 0201 Petroleum 206A - Other Kerosene 0201 Gas & Dieselolie 204A - Gas-/Diesel Oil 0201 Fuelolie & Spildolie 203A - Petroleum Coke 0201 Petrokoks 110A - Natural Gas 0201 Naturgas 301A - Wood Waste 0201 Træ 111A Retail Trade - LPG 0201 LPG 303A - Other Kerosene 0201 Petroleum 206A - Gas-/Diesel Oil 0201 Gas & Dieselolie 204A - Fuel Oil 0201 Fuelolie & Spildolie 203A - Petroleum Coke 0201 Petrokoks 110A - Natural Gas 0201 Naturgas 301A Private Service - LPG 0201 LPG 303A
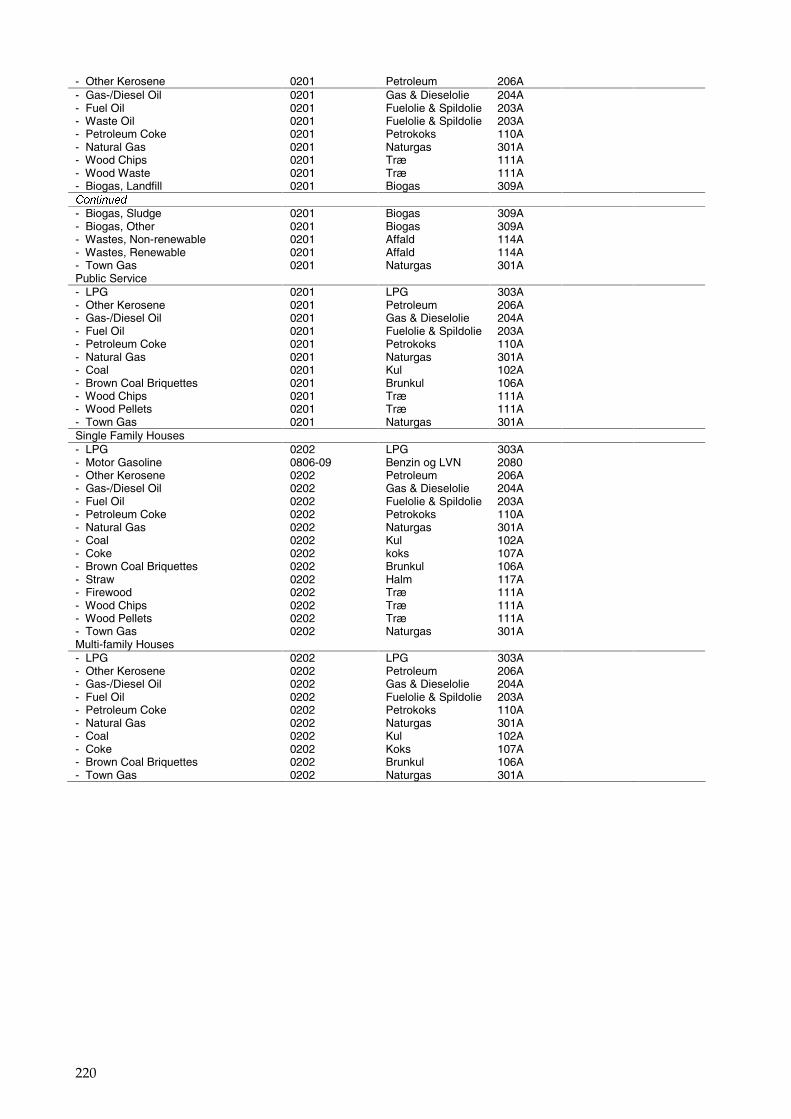
220
- Other Kerosene 0201 Petroleum 206A - Gas-/Diesel Oil 0201 Gas & Dieselolie 204A - Fuel Oil 0201 Fuelolie & Spildolie 203A - Waste Oil 0201 Fuelolie & Spildolie 203A - Petroleum Coke 0201 Petrokoks 110A - Natural Gas 0201 Naturgas 301A - Wood Chips 0201 Træ 111A - Wood Waste 0201 Træ 111A - Biogas, Landfill 0201 Biogas 309A ������� � - Biogas, Sludge 0201 Biogas 309A - Biogas, Other 0201 Biogas 309A - Wastes, Non-renewable 0201 Affald 114A - Wastes, Renewable 0201 Affald 114A - Town Gas 0201 Naturgas 301A Public Service - LPG 0201 LPG 303A - Other Kerosene 0201 Petroleum 206A - Gas-/Diesel Oil 0201 Gas & Dieselolie 204A - Fuel Oil 0201 Fuelolie & Spildolie 203A - Petroleum Coke 0201 Petrokoks 110A - Natural Gas 0201 Naturgas 301A - Coal 0201 Kul 102A - Brown Coal Briquettes 0201 Brunkul 106A - Wood Chips 0201 Træ 111A - Wood Pellets 0201 Træ 111A - Town Gas 0201 Naturgas 301A Single Family Houses - LPG 0202 LPG 303A - Motor Gasoline 0806-09 Benzin og LVN 2080 - Other Kerosene 0202 Petroleum 206A - Gas-/Diesel Oil 0202 Gas & Dieselolie 204A - Fuel Oil 0202 Fuelolie & Spildolie 203A - Petroleum Coke 0202 Petrokoks 110A - Natural Gas 0202 Naturgas 301A - Coal 0202 Kul 102A - Coke 0202 koks 107A - Brown Coal Briquettes 0202 Brunkul 106A - Straw 0202 Halm 117A - Firewood 0202 Træ 111A - Wood Chips 0202 Træ 111A - Wood Pellets 0202 Træ 111A - Town Gas 0202 Naturgas 301A Multi-family Houses - LPG 0202 LPG 303A - Other Kerosene 0202 Petroleum 206A - Gas-/Diesel Oil 0202 Gas & Dieselolie 204A - Fuel Oil 0202 Fuelolie & Spildolie 203A - Petroleum Coke 0202 Petrokoks 110A - Natural Gas 0202 Naturgas 301A - Coal 0202 Kul 102A - Coke 0202 Koks 107A - Brown Coal Briquettes 0202 Brunkul 106A - Town Gas 0202 Naturgas 301A
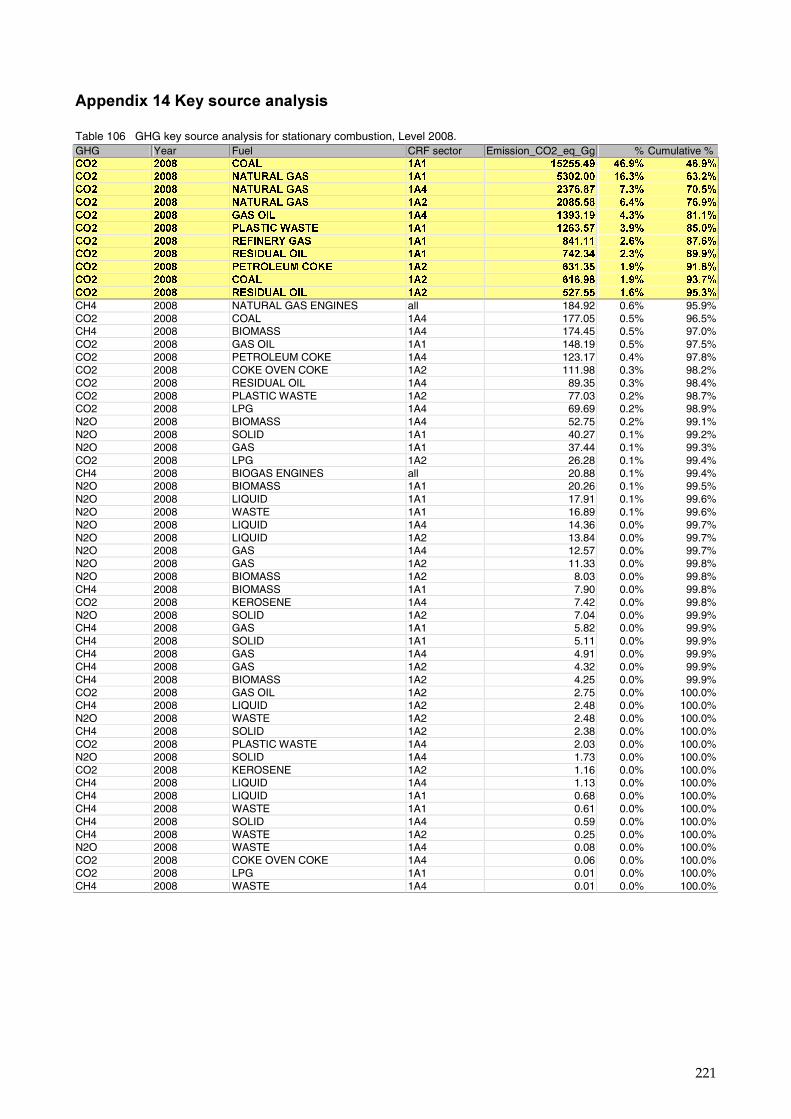
221
������������������� �����������
Table 106 GHG key source analysis for stationary combustion, Level 2008. GHG Year Fuel CRF sector Emission_CO2_eq_Gg % Cumulative % ���� ����� ����� ���� ����� � ��� � ���
���� ����� ������������ ���� ������ � ��� ����
���� ����� ������������ ���� ��� ��� ���� ����
���� ����� ������������ ���� ����� ��� � ���
���� ����� �������� ���� ������� ���� �����
���� ����� �������������� ���� �� ��� ���� ����
���� ����� ������������� ���� ������ � �� �� ��
���� ����� ������������� ���� ������ ���� �����
���� ����� ��������������� ���� ���� ���� �����
���� ����� ����� ���� � ��� ���� �����
���� ����� ������������� ���� ��� � �� ����
CH4 2008 NATURAL GAS ENGINES all 184.92 0.6% 95.9% CO2 2008 COAL 1A4 177.05 0.5% 96.5% CH4 2008 BIOMASS 1A4 174.45 0.5% 97.0% CO2 2008 GAS OIL 1A1 148.19 0.5% 97.5% CO2 2008 PETROLEUM COKE 1A4 123.17 0.4% 97.8% CO2 2008 COKE OVEN COKE 1A2 111.98 0.3% 98.2% CO2 2008 RESIDUAL OIL 1A4 89.35 0.3% 98.4% CO2 2008 PLASTIC WASTE 1A2 77.03 0.2% 98.7% CO2 2008 LPG 1A4 69.69 0.2% 98.9% N2O 2008 BIOMASS 1A4 52.75 0.2% 99.1% N2O 2008 SOLID 1A1 40.27 0.1% 99.2% N2O 2008 GAS 1A1 37.44 0.1% 99.3% CO2 2008 LPG 1A2 26.28 0.1% 99.4% CH4 2008 BIOGAS ENGINES all 20.88 0.1% 99.4% N2O 2008 BIOMASS 1A1 20.26 0.1% 99.5% N2O 2008 LIQUID 1A1 17.91 0.1% 99.6% N2O 2008 WASTE 1A1 16.89 0.1% 99.6% N2O 2008 LIQUID 1A4 14.36 0.0% 99.7% N2O 2008 LIQUID 1A2 13.84 0.0% 99.7% N2O 2008 GAS 1A4 12.57 0.0% 99.7% N2O 2008 GAS 1A2 11.33 0.0% 99.8% N2O 2008 BIOMASS 1A2 8.03 0.0% 99.8% CH4 2008 BIOMASS 1A1 7.90 0.0% 99.8% CO2 2008 KEROSENE 1A4 7.42 0.0% 99.8% N2O 2008 SOLID 1A2 7.04 0.0% 99.9% CH4 2008 GAS 1A1 5.82 0.0% 99.9% CH4 2008 SOLID 1A1 5.11 0.0% 99.9% CH4 2008 GAS 1A4 4.91 0.0% 99.9% CH4 2008 GAS 1A2 4.32 0.0% 99.9% CH4 2008 BIOMASS 1A2 4.25 0.0% 99.9% CO2 2008 GAS OIL 1A2 2.75 0.0% 100.0% CH4 2008 LIQUID 1A2 2.48 0.0% 100.0% N2O 2008 WASTE 1A2 2.48 0.0% 100.0% CH4 2008 SOLID 1A2 2.38 0.0% 100.0% CO2 2008 PLASTIC WASTE 1A4 2.03 0.0% 100.0% N2O 2008 SOLID 1A4 1.73 0.0% 100.0% CO2 2008 KEROSENE 1A2 1.16 0.0% 100.0% CH4 2008 LIQUID 1A4 1.13 0.0% 100.0% CH4 2008 LIQUID 1A1 0.68 0.0% 100.0% CH4 2008 WASTE 1A1 0.61 0.0% 100.0% CH4 2008 SOLID 1A4 0.59 0.0% 100.0% CH4 2008 WASTE 1A2 0.25 0.0% 100.0% N2O 2008 WASTE 1A4 0.08 0.0% 100.0% CO2 2008 COKE OVEN COKE 1A4 0.06 0.0% 100.0% CO2 2008 LPG 1A1 0.01 0.0% 100.0% CH4 2008 WASTE 1A4 0.01 0.0% 100.0%
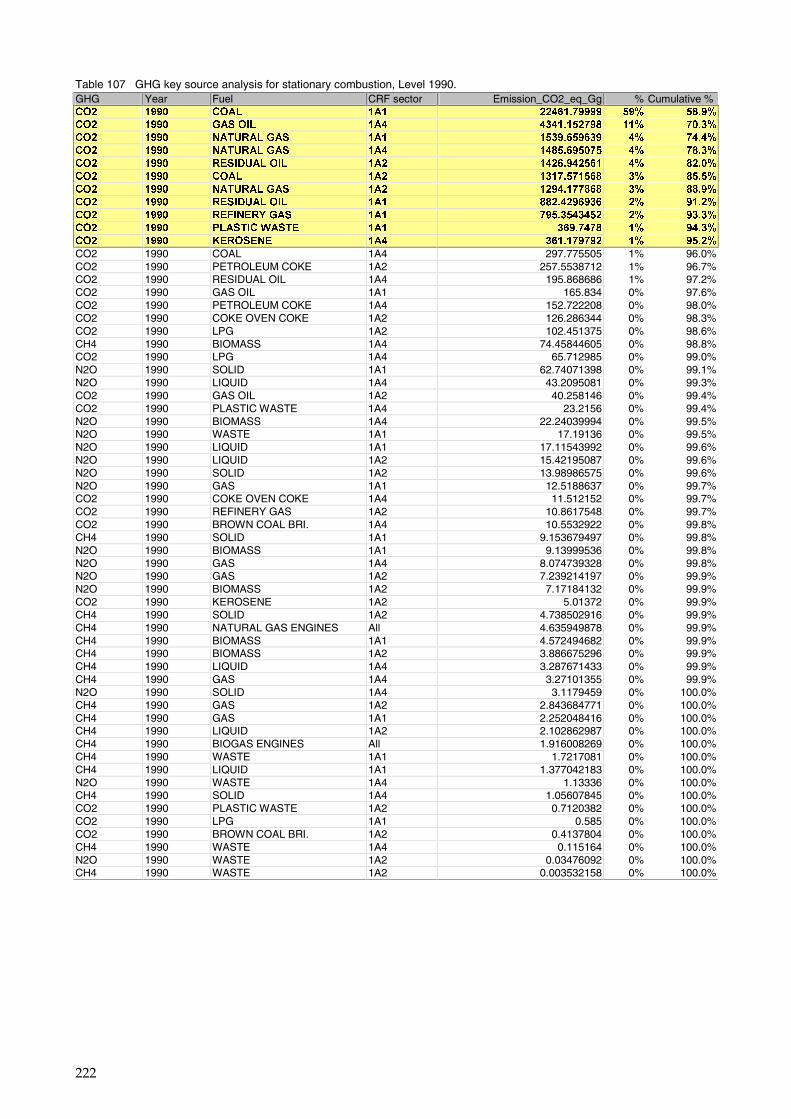
222
Table 107 GHG key source analysis for stationary combustion, Level 1990. GHG Year Fuel CRF sector Emission_CO2_eq_Gg % Cumulative % ���� ����� ����� ���� ��� ������� ��� ����
���� ����� �������� ���� ���������� ���� �����
���� ����� ������������ ���� ��� � ��� ��� �����
���� ����� ������������ ���� ��� ���� ��� �����
���� ����� ������������� ���� ��� ��� �� ��� �����
���� ����� ����� ���� ������ �� ��� ���
���� ����� ������������ ���� �������� �� ��� �����
���� ����� ������������� ���� ������ �� � ��� �����
���� ����� ������������� ���� �������� ��� �����
���� ����� �������������� ���� � ������ ��� �����
���� ����� ��������� ���� � �������� ��� ����
CO2 1990 COAL 1A4 297.775505 1% 96.0% CO2 1990 PETROLEUM COKE 1A2 257.5538712 1% 96.7% CO2 1990 RESIDUAL OIL 1A4 195.868686 1% 97.2% CO2 1990 GAS OIL 1A1 165.834 0% 97.6% CO2 1990 PETROLEUM COKE 1A4 152.722208 0% 98.0% CO2 1990 COKE OVEN COKE 1A2 126.286344 0% 98.3% CO2 1990 LPG 1A2 102.451375 0% 98.6% CH4 1990 BIOMASS 1A4 74.45844605 0% 98.8% CO2 1990 LPG 1A4 65.712985 0% 99.0% N2O 1990 SOLID 1A1 62.74071398 0% 99.1% N2O 1990 LIQUID 1A4 43.2095081 0% 99.3% CO2 1990 GAS OIL 1A2 40.258146 0% 99.4% CO2 1990 PLASTIC WASTE 1A4 23.2156 0% 99.4% N2O 1990 BIOMASS 1A4 22.24039994 0% 99.5% N2O 1990 WASTE 1A1 17.19136 0% 99.5% N2O 1990 LIQUID 1A1 17.11543992 0% 99.6% N2O 1990 LIQUID 1A2 15.42195087 0% 99.6% N2O 1990 SOLID 1A2 13.98986575 0% 99.6% N2O 1990 GAS 1A1 12.5188637 0% 99.7% CO2 1990 COKE OVEN COKE 1A4 11.512152 0% 99.7% CO2 1990 REFINERY GAS 1A2 10.8617548 0% 99.7% CO2 1990 BROWN COAL BRI. 1A4 10.5532922 0% 99.8% CH4 1990 SOLID 1A1 9.153679497 0% 99.8% N2O 1990 BIOMASS 1A1 9.13999536 0% 99.8% N2O 1990 GAS 1A4 8.074739328 0% 99.8% N2O 1990 GAS 1A2 7.239214197 0% 99.9% N2O 1990 BIOMASS 1A2 7.17184132 0% 99.9% CO2 1990 KEROSENE 1A2 5.01372 0% 99.9% CH4 1990 SOLID 1A2 4.738502916 0% 99.9% CH4 1990 NATURAL GAS ENGINES All 4.635949878 0% 99.9% CH4 1990 BIOMASS 1A1 4.572494682 0% 99.9% CH4 1990 BIOMASS 1A2 3.886675296 0% 99.9% CH4 1990 LIQUID 1A4 3.287671433 0% 99.9% CH4 1990 GAS 1A4 3.27101355 0% 99.9% N2O 1990 SOLID 1A4 3.1179459 0% 100.0% CH4 1990 GAS 1A2 2.843684771 0% 100.0% CH4 1990 GAS 1A1 2.252048416 0% 100.0% CH4 1990 LIQUID 1A2 2.102862987 0% 100.0% CH4 1990 BIOGAS ENGINES All 1.916008269 0% 100.0% CH4 1990 WASTE 1A1 1.7217081 0% 100.0% CH4 1990 LIQUID 1A1 1.377042183 0% 100.0% N2O 1990 WASTE 1A4 1.13336 0% 100.0% CH4 1990 SOLID 1A4 1.05607845 0% 100.0% CO2 1990 PLASTIC WASTE 1A2 0.7120382 0% 100.0% CO2 1990 LPG 1A1 0.585 0% 100.0% CO2 1990 BROWN COAL BRI. 1A2 0.4137804 0% 100.0% CH4 1990 WASTE 1A4 0.115164 0% 100.0% N2O 1990 WASTE 1A2 0.03476092 0% 100.0% CH4 1990 WASTE 1A2 0.003532158 0% 100.0%
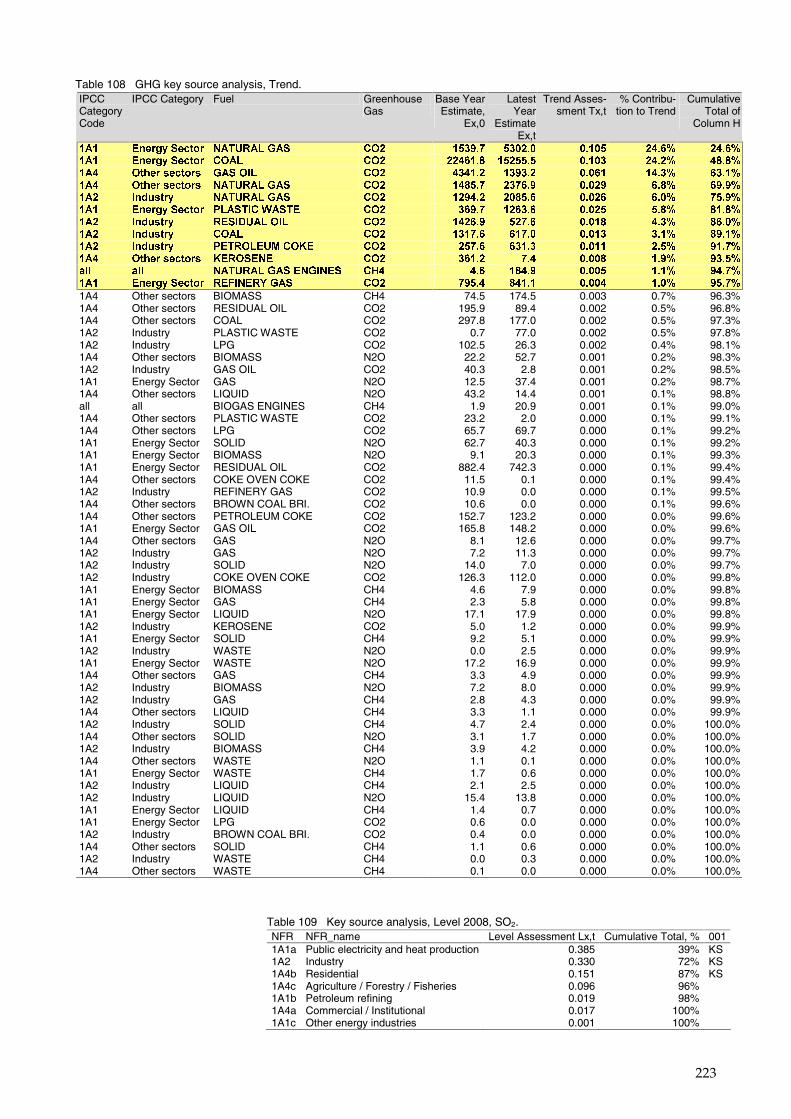
223
Table 108 GHG key source analysis, Trend. IPCC Category Code
IPCC Category Fuel Greenhouse Gas
Base Year Estimate,
Ex,0
Latest Year
Estimate Ex,t
Trend Asses-sment Tx,t
% Contribu-tion to Trend
Cumulative Total of
Column H
���� � !"#$��!%&'"� ������������ ���� ����� ����� ���� �� �� �� ������ � !"#$��!%&'"� ����� ���� ��� ��� ��� ����� ����� ��������� �&(!"�)!%&'")� �������� ���� ������ ������ �� �� ����� �������� �&(!"�)!%&'")� ������������ ���� ����� ��� �� ����� ��� �������� � *+)&"$� ������������ ���� ������ ��� � ��� � ��� �������� � !"#$��!%&'"� �������������� ���� � ��� �� � � ���� ��� ��������� � *+)&"$� ������������� ���� ��� �� �� � ����� ���� � ������� � *+)&"$� ����� ���� ���� � ���� ����� ���� ��������� � *+)&"$� ��������������� ���� �� � ���� ����� ��� ��������� �&(!"�)!%&'")� ��������� ���� � ��� ��� ����� ���� ����,--� ,--� �������������������� �.�� � � ����� ���� ���� ��������� � !"#$��!%&'"� ������������� ���� ���� ����� ����� ���� ����
1A4 Other sectors BIOMASS CH4 74.5 174.5 0.003 0.7% 96.3% 1A4 Other sectors RESIDUAL OIL CO2 195.9 89.4 0.002 0.5% 96.8% 1A4 Other sectors COAL CO2 297.8 177.0 0.002 0.5% 97.3% 1A2 Industry PLASTIC WASTE CO2 0.7 77.0 0.002 0.5% 97.8% 1A2 Industry LPG CO2 102.5 26.3 0.002 0.4% 98.1% 1A4 Other sectors BIOMASS N2O 22.2 52.7 0.001 0.2% 98.3% 1A2 Industry GAS OIL CO2 40.3 2.8 0.001 0.2% 98.5% 1A1 Energy Sector GAS N2O 12.5 37.4 0.001 0.2% 98.7% 1A4 Other sectors LIQUID N2O 43.2 14.4 0.001 0.1% 98.8% all all BIOGAS ENGINES CH4 1.9 20.9 0.001 0.1% 99.0% 1A4 Other sectors PLASTIC WASTE CO2 23.2 2.0 0.000 0.1% 99.1% 1A4 Other sectors LPG CO2 65.7 69.7 0.000 0.1% 99.2% 1A1 Energy Sector SOLID N2O 62.7 40.3 0.000 0.1% 99.2% 1A1 Energy Sector BIOMASS N2O 9.1 20.3 0.000 0.1% 99.3% 1A1 Energy Sector RESIDUAL OIL CO2 882.4 742.3 0.000 0.1% 99.4% 1A4 Other sectors COKE OVEN COKE CO2 11.5 0.1 0.000 0.1% 99.4% 1A2 Industry REFINERY GAS CO2 10.9 0.0 0.000 0.1% 99.5% 1A4 Other sectors BROWN COAL BRI. CO2 10.6 0.0 0.000 0.1% 99.6% 1A4 Other sectors PETROLEUM COKE CO2 152.7 123.2 0.000 0.0% 99.6% 1A1 Energy Sector GAS OIL CO2 165.8 148.2 0.000 0.0% 99.6% 1A4 Other sectors GAS N2O 8.1 12.6 0.000 0.0% 99.7% 1A2 Industry GAS N2O 7.2 11.3 0.000 0.0% 99.7% 1A2 Industry SOLID N2O 14.0 7.0 0.000 0.0% 99.7% 1A2 Industry COKE OVEN COKE CO2 126.3 112.0 0.000 0.0% 99.8% 1A1 Energy Sector BIOMASS CH4 4.6 7.9 0.000 0.0% 99.8% 1A1 Energy Sector GAS CH4 2.3 5.8 0.000 0.0% 99.8% 1A1 Energy Sector LIQUID N2O 17.1 17.9 0.000 0.0% 99.8% 1A2 Industry KEROSENE CO2 5.0 1.2 0.000 0.0% 99.9% 1A1 Energy Sector SOLID CH4 9.2 5.1 0.000 0.0% 99.9% 1A2 Industry WASTE N2O 0.0 2.5 0.000 0.0% 99.9% 1A1 Energy Sector WASTE N2O 17.2 16.9 0.000 0.0% 99.9% 1A4 Other sectors GAS CH4 3.3 4.9 0.000 0.0% 99.9% 1A2 Industry BIOMASS N2O 7.2 8.0 0.000 0.0% 99.9% 1A2 Industry GAS CH4 2.8 4.3 0.000 0.0% 99.9% 1A4 Other sectors LIQUID CH4 3.3 1.1 0.000 0.0% 99.9% 1A2 Industry SOLID CH4 4.7 2.4 0.000 0.0% 100.0% 1A4 Other sectors SOLID N2O 3.1 1.7 0.000 0.0% 100.0% 1A2 Industry BIOMASS CH4 3.9 4.2 0.000 0.0% 100.0% 1A4 Other sectors WASTE N2O 1.1 0.1 0.000 0.0% 100.0% 1A1 Energy Sector WASTE CH4 1.7 0.6 0.000 0.0% 100.0% 1A2 Industry LIQUID CH4 2.1 2.5 0.000 0.0% 100.0% 1A2 Industry LIQUID N2O 15.4 13.8 0.000 0.0% 100.0% 1A1 Energy Sector LIQUID CH4 1.4 0.7 0.000 0.0% 100.0% 1A1 Energy Sector LPG CO2 0.6 0.0 0.000 0.0% 100.0% 1A2 Industry BROWN COAL BRI. CO2 0.4 0.0 0.000 0.0% 100.0% 1A4 Other sectors SOLID CH4 1.1 0.6 0.000 0.0% 100.0% 1A2 Industry WASTE CH4 0.0 0.3 0.000 0.0% 100.0% 1A4 Other sectors WASTE CH4 0.1 0.0 0.000 0.0% 100.0%
Table 109 Key source analysis, Level 2008, SO2. NFR NFR_name Level Assessment Lx,t Cumulative Total, % 001 1A1a Public electricity and heat production 0.385 39% KS 1A2 Industry 0.330 72% KS 1A4b Residential 0.151 87% KS 1A4c Agriculture / Forestry / Fisheries 0.096 96% 1A1b Petroleum refining 0.019 98% 1A4a Commercial / Institutional 0.017 100% 1A1c Other energy industries 0.001 100%
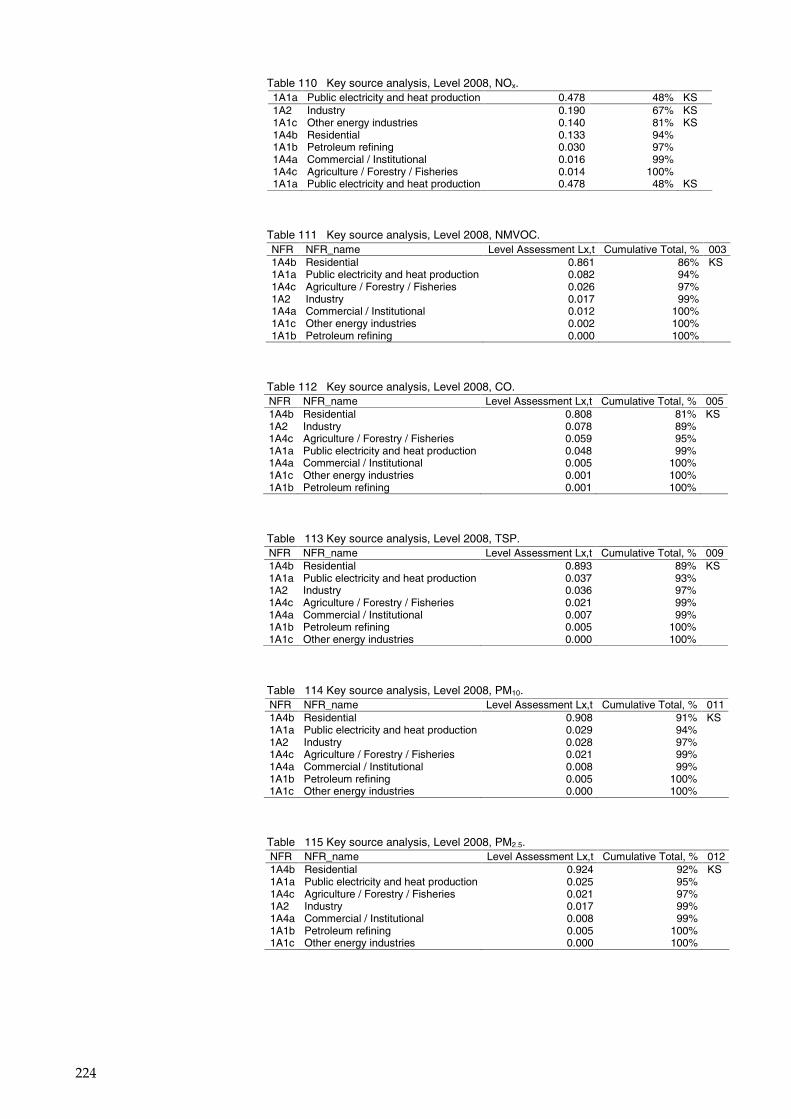
224
Table 110 Key source analysis, Level 2008, NOx. 1A1a Public electricity and heat production 0.478 48% KS 1A2 Industry 0.190 67% KS 1A1c Other energy industries 0.140 81% KS 1A4b Residential 0.133 94% 1A1b Petroleum refining 0.030 97% 1A4a Commercial / Institutional 0.016 99% 1A4c Agriculture / Forestry / Fisheries 0.014 100% 1A1a Public electricity and heat production 0.478 48% KS
Table 111 Key source analysis, Level 2008, NMVOC. NFR NFR_name Level Assessment Lx,t Cumulative Total, % 003 1A4b Residential 0.861 86% KS 1A1a Public electricity and heat production 0.082 94% 1A4c Agriculture / Forestry / Fisheries 0.026 97% 1A2 Industry 0.017 99% 1A4a Commercial / Institutional 0.012 100% 1A1c Other energy industries 0.002 100% 1A1b Petroleum refining 0.000 100%
Table 112 Key source analysis, Level 2008, CO. NFR NFR_name Level Assessment Lx,t Cumulative Total, % 005 1A4b Residential 0.808 81% KS 1A2 Industry 0.078 89% 1A4c Agriculture / Forestry / Fisheries 0.059 95% 1A1a Public electricity and heat production 0.048 99% 1A4a Commercial / Institutional 0.005 100% 1A1c Other energy industries 0.001 100% 1A1b Petroleum refining 0.001 100%
Table 113 Key source analysis, Level 2008, TSP. NFR NFR_name Level Assessment Lx,t Cumulative Total, % 009 1A4b Residential 0.893 89% KS 1A1a Public electricity and heat production 0.037 93% 1A2 Industry 0.036 97% 1A4c Agriculture / Forestry / Fisheries 0.021 99% 1A4a Commercial / Institutional 0.007 99% 1A1b Petroleum refining 0.005 100% 1A1c Other energy industries 0.000 100%
Table 114 Key source analysis, Level 2008, PM10. NFR NFR_name Level Assessment Lx,t Cumulative Total, % 011 1A4b Residential 0.908 91% KS 1A1a Public electricity and heat production 0.029 94% 1A2 Industry 0.028 97% 1A4c Agriculture / Forestry / Fisheries 0.021 99% 1A4a Commercial / Institutional 0.008 99% 1A1b Petroleum refining 0.005 100% 1A1c Other energy industries 0.000 100%
Table 115 Key source analysis, Level 2008, PM2.5. NFR NFR_name Level Assessment Lx,t Cumulative Total, % 012 1A4b Residential 0.924 92% KS 1A1a Public electricity and heat production 0.025 95% 1A4c Agriculture / Forestry / Fisheries 0.021 97% 1A2 Industry 0.017 99% 1A4a Commercial / Institutional 0.008 99% 1A1b Petroleum refining 0.005 100% 1A1c Other energy industries 0.000 100%
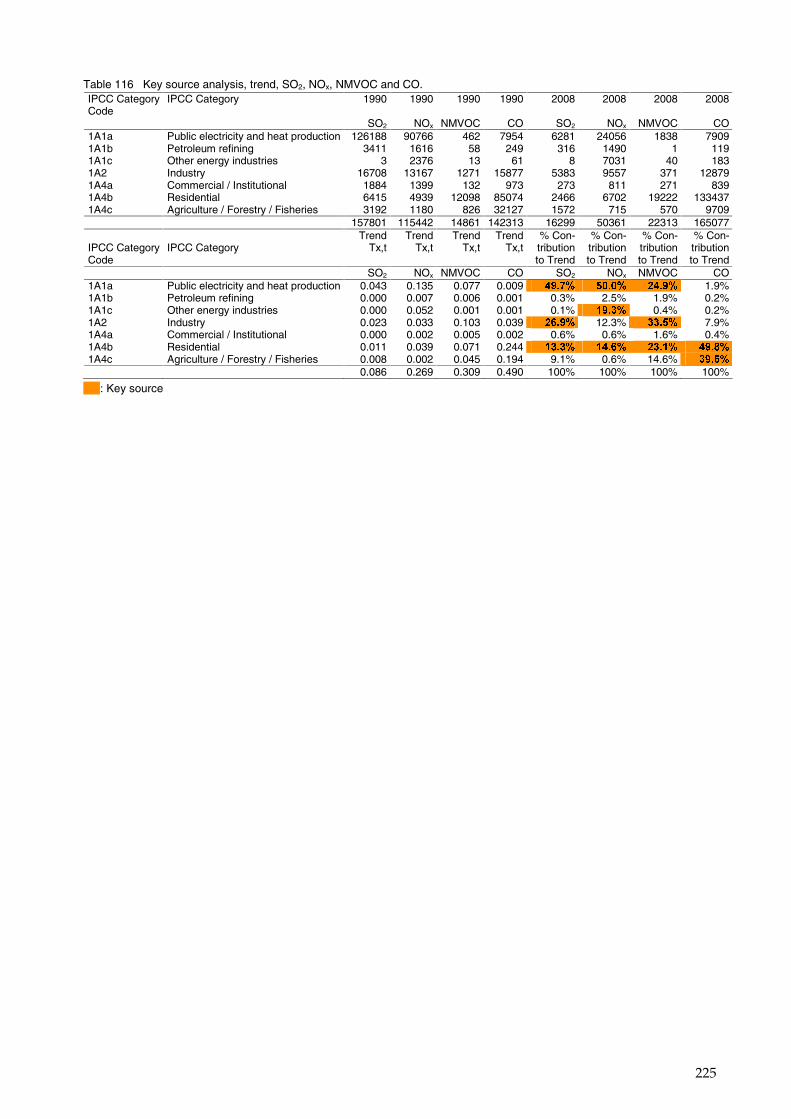
225
Table 116 Key source analysis, trend, SO2, NOx, NMVOC and CO. IPCC Category Code
IPCC Category 1990 1990 1990 1990 2008 2008 2008 2008
SO2 NOx NMVOC CO SO2 NOx NMVOC CO 1A1a Public electricity and heat production 126188 90766 462 7954 6281 24056 1838 7909 1A1b Petroleum refining 3411 1616 58 249 316 1490 1 119 1A1c Other energy industries 3 2376 13 61 8 7031 40 183 1A2 Industry 16708 13167 1271 15877 5383 9557 371 12879 1A4a Commercial / Institutional 1884 1399 132 973 273 811 271 839 1A4b Residential 6415 4939 12098 85074 2466 6702 19222 133437 1A4c Agriculture / Forestry / Fisheries 3192 1180 826 32127 1572 715 570 9709 157801 115442 14861 142313 16299 50361 22313 165077 IPCC Category Code
IPCC Category
Trend Tx,t
Trend Tx,t
Trend Tx,t
Trend Tx,t
% Con-tribution to Trend
% Con-tribution to Trend
% Con-tribution to Trend
% Con-tribution to Trend
SO2 NOx NMVOC CO SO2 NOx NMVOC CO 1A1a Public electricity and heat production 0.043 0.135 0.077 0.009 ����� ���� ����� 1.9% 1A1b Petroleum refining 0.000 0.007 0.006 0.001 0.3% 2.5% 1.9% 0.2% 1A1c Other energy industries 0.000 0.052 0.001 0.001 0.1% ����� 0.4% 0.2% 1A2 Industry 0.023 0.033 0.103 0.039 � ��� 12.3% ���� 7.9% 1A4a Commercial / Institutional 0.000 0.002 0.005 0.002 0.6% 0.6% 1.6% 0.4% 1A4b Residential 0.011 0.039 0.071 0.244 ����� �� �� ����� �����1A4c Agriculture / Forestry / Fisheries 0.008 0.002 0.045 0.194 9.1% 0.6% 14.6% ����
0.086 0.269 0.309 0.490 100% 100% 100% 100%
xxx: Key source
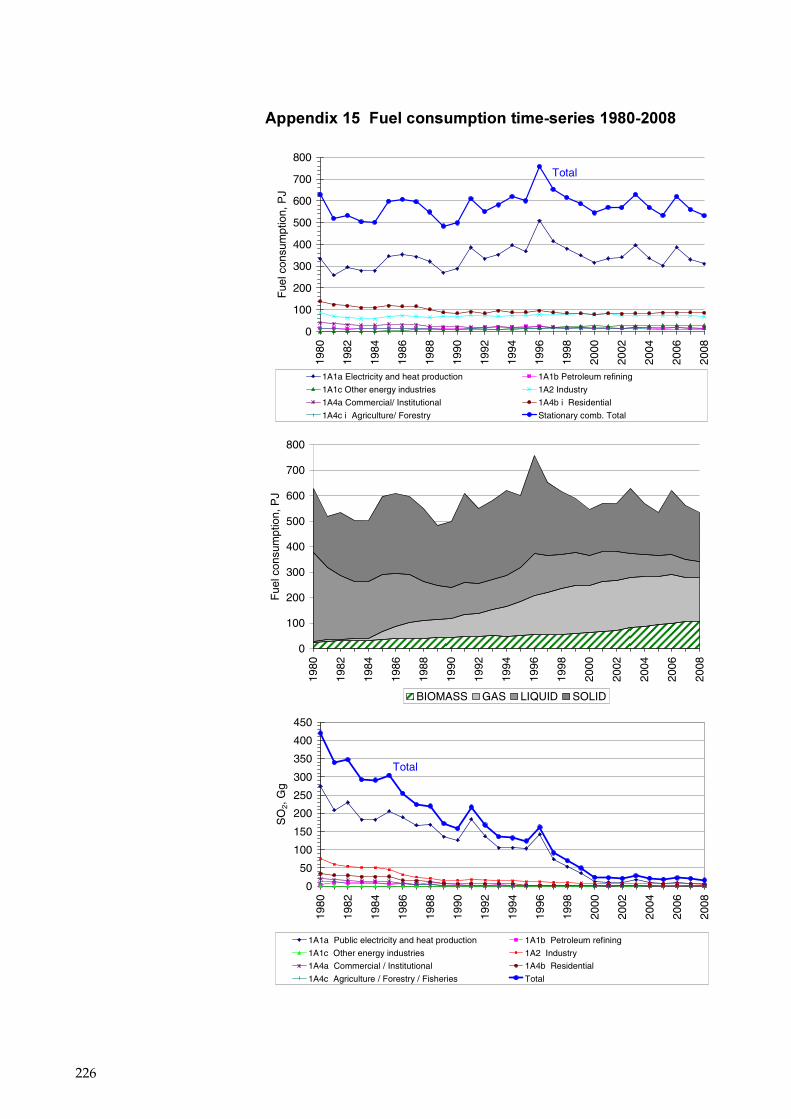
226
����������������� ������������������������� �! ��
0
100
200
300
400
500
600
700
800
1980
1982
1984
1986
1988
1990
1992
1994
1996
1998
2000
2002
2004
2006
2008
Fue
l con
sum
ptio
n, P
J
1A1a Electricity and heat production 1A1b Petroleum refining
1A1c Other energy industries 1A2 Industry
1A4a Commercial/ Institutional 1A4b i Residential
1A4c i Agriculture/ Forestry Stationary comb. Total
Total
0
100
200
300
400
500
600
700
800
1980
1982
1984
1986
1988
1990
1992
1994
1996
1998
2000
2002
2004
2006
2008
Fue
l con
sum
ptio
n, P
J
BIOMASS GAS LIQUID SOLID
0
50
100
150
200
250
300
350
400
450
1980
1982
1984
1986
1988
1990
1992
1994
1996
1998
2000
2002
2004
2006
2008
SO
2, G
g
1A1a Public electricity and heat production 1A1b Petroleum refining
1A1c Other energy industries 1A2 Industry
1A4a Commercial / Institutional 1A4b Residential
1A4c Agriculture / Forestry / Fisheries Total
Total
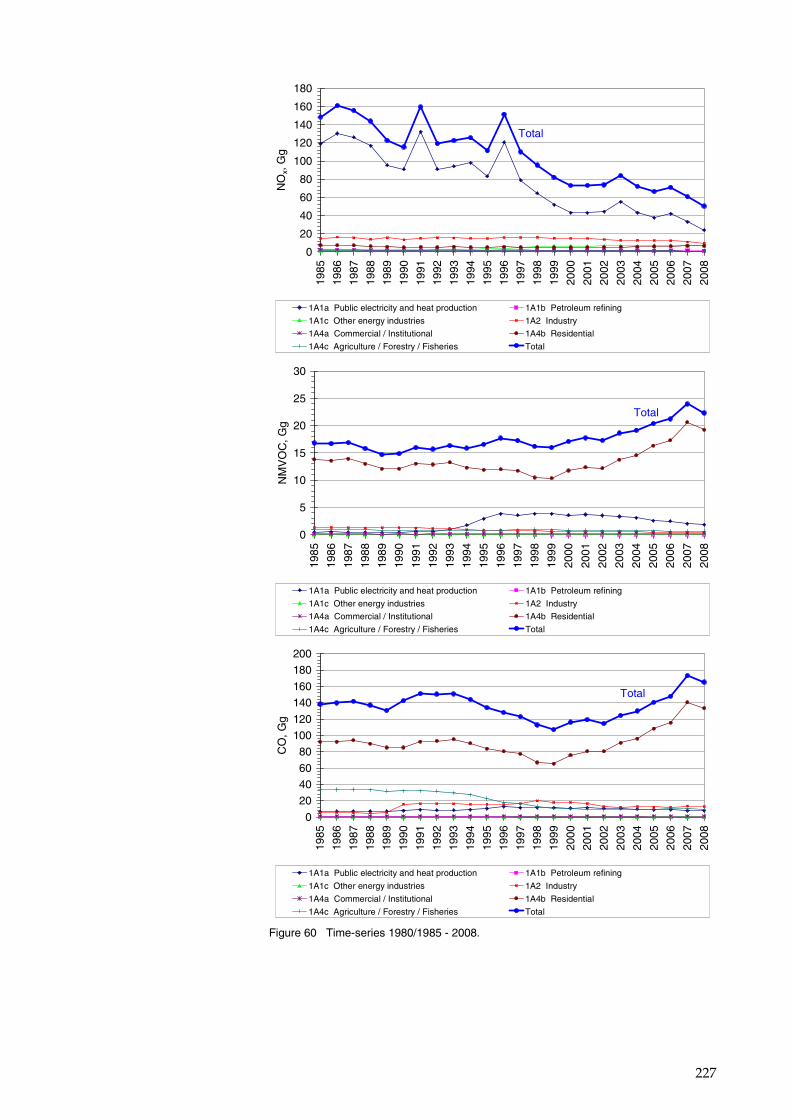
227
0
20
40
60
80
100
120
140
160
180
1985
1986
1987
1988
1989
1990
1991
1992
1993
1994
1995
1996
1997
1998
1999
2000
2001
2002
2003
2004
2005
2006
2007
2008
NO
x, G
g
1A1a Public electricity and heat production 1A1b Petroleum refining
1A1c Other energy industries 1A2 Industry
1A4a Commercial / Institutional 1A4b Residential
1A4c Agriculture / Forestry / Fisheries Total
Total
0
5
10
15
20
25
30
1985
1986
1987
1988
1989
1990
1991
1992
1993
1994
1995
1996
1997
1998
1999
2000
2001
2002
2003
2004
2005
2006
2007
2008
NM
VO
C, G
g
1A1a Public electricity and heat production 1A1b Petroleum refining
1A1c Other energy industries 1A2 Industry
1A4a Commercial / Institutional 1A4b Residential
1A4c Agriculture / Forestry / Fisheries Total
Total
0
20
40
60
80
100
120
140
160
180
200
1985
1986
1987
1988
1989
1990
1991
1992
1993
1994
1995
1996
1997
1998
1999
2000
2001
2002
2003
2004
2005
2006
2007
2008
CO
, Gg
1A1a Public electricity and heat production 1A1b Petroleum refining
1A1c Other energy industries 1A2 Industry
1A4a Commercial / Institutional 1A4b Residential
1A4c Agriculture / Forestry / Fisheries Total
Total
Figure 60 Time-series 1980/1985 - 2008.
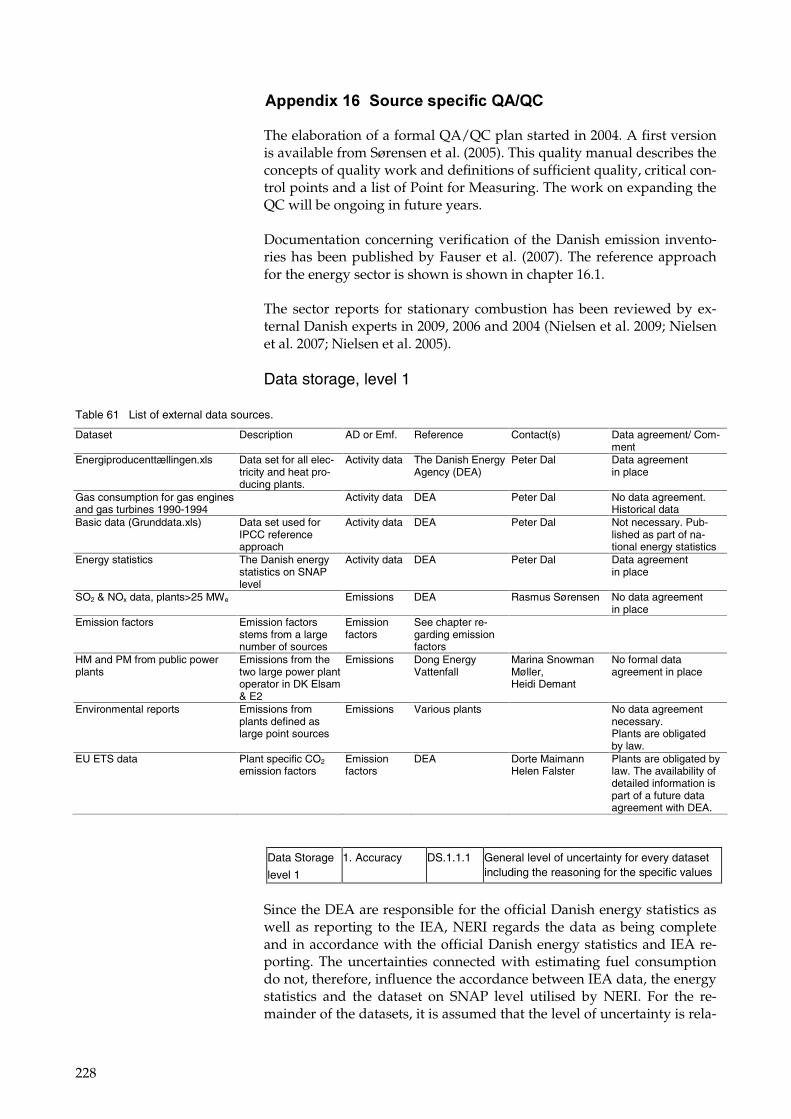
228
���������"��#��� ����� ��� �$�%$&�
The elaboration of a formal QA/QC plan started in 2004. A first version is available from Sørensen et al. (2005). This quality manual describes the concepts of quality work and definitions of sufficient quality, critical con-trol points and a list of Point for Measuring. The work on expanding the QC will be ongoing in future years.
Documentation concerning verification of the Danish emission invento-ries has been published by Fauser et al. (2007). The reference approach for the energy sector is shown is shown in chapter 16.1.
The sector reports for stationary combustion has been reviewed by ex-ternal Danish experts in 2009, 2006 and 2004 (Nielsen et al. 2009; Nielsen et al. 2007; Nielsen et al. 2005).
Data storage, level 1
Table 61 List of external data sources.
Data Storage
level 1
1. Accuracy DS.1.1.1 General level of uncertainty for every dataset including the reasoning for the specific values
Since the DEA are responsible for the official Danish energy statistics as well as reporting to the IEA, NERI regards the data as being complete and in accordance with the official Danish energy statistics and IEA re-porting. The uncertainties connected with estimating fuel consumption do not, therefore, influence the accordance between IEA data, the energy statistics and the dataset on SNAP level utilised by NERI. For the re-mainder of the datasets, it is assumed that the level of uncertainty is rela-
Dataset Description AD or Emf. Reference Contact(s) Data agreement/ Com-ment
Energiproducenttællingen.xls Data set for all elec-tricity and heat pro-ducing plants.
Activity data The Danish Energy Agency (DEA)
Peter Dal Data agreement in place
Gas consumption for gas engines and gas turbines 1990-1994
Activity data DEA Peter Dal No data agreement. Historical data
Basic data (Grunddata.xls) Data set used for IPCC reference approach
Activity data DEA Peter Dal Not necessary. Pub-lished as part of na-tional energy statistics
Energy statistics The Danish energy statistics on SNAP level
Activity data DEA Peter Dal Data agreement in place
SO2 & NOx data, plants>25 MWe Emissions DEA Rasmus Sørensen No data agreement in place
Emission factors Emission factors stems from a large number of sources
Emission factors
See chapter re-garding emission factors
HM and PM from public power plants
Emissions from the two large power plant operator in DK Elsam & E2
Emissions Dong Energy Vattenfall
Marina Snowman Møller, Heidi Demant
No formal data agreement in place
Environmental reports Emissions from plants defined as large point sources
Emissions Various plants No data agreement necessary. Plants are obligated by law.
EU ETS data Plant specific CO2 emission factors
Emission factors
DEA Dorte Maimann Helen Falster
Plants are obligated by law. The availability of detailed information is part of a future data agreement with DEA.
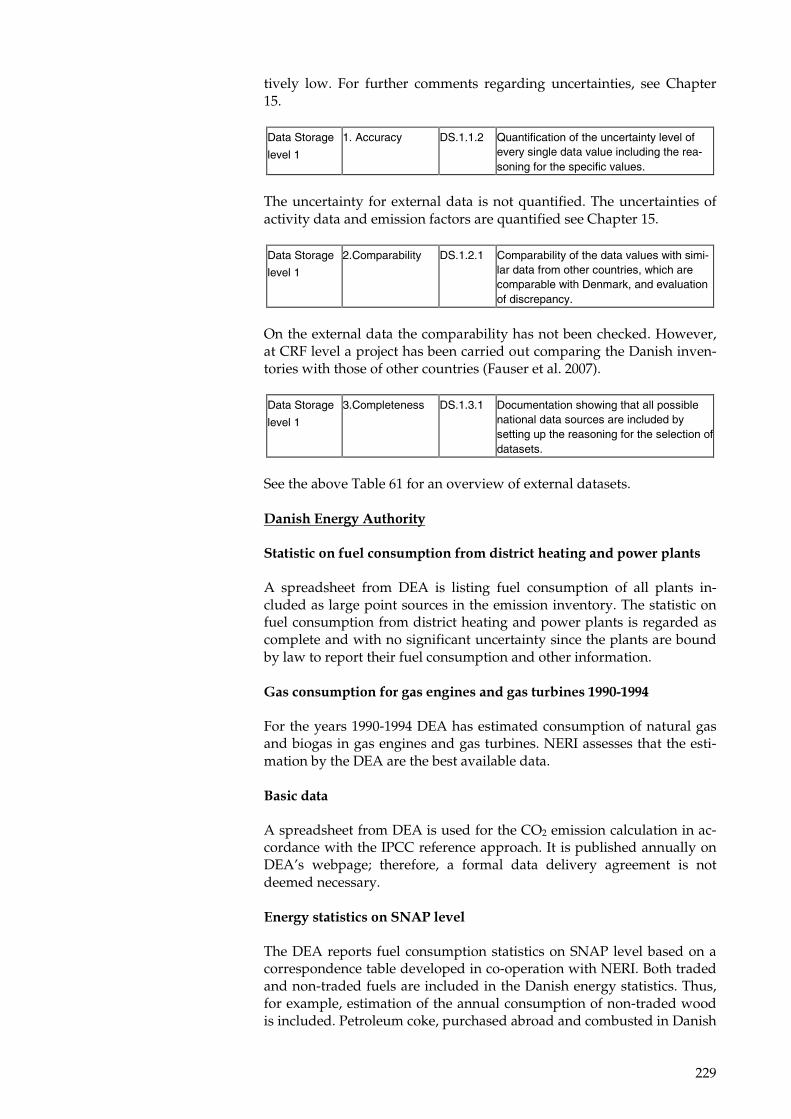
229
tively low. For further comments regarding uncertainties, see Chapter 15.
Data Storage
level 1
1. Accuracy DS.1.1.2 Quantification of the uncertainty level of every single data value including the rea-soning for the specific values.
The uncertainty for external data is not quantified. The uncertainties of activity data and emission factors are quantified see Chapter 15.
Data Storage
level 1
2.Comparability DS.1.2.1 Comparability of the data values with simi-lar data from other countries, which are comparable with Denmark, and evaluation of discrepancy.
On the external data the comparability has not been checked. However, at CRF level a project has been carried out comparing the Danish inven-tories with those of other countries (Fauser et al. 2007).
Data Storage
level 1
3.Completeness DS.1.3.1 Documentation showing that all possible national data sources are included by setting up the reasoning for the selection of datasets.
See the above Table 61 for an overview of external datasets.
�������������� ��� ��
� � � ����������������� ���������� �� ���� ����������������� �
A spreadsheet from DEA is listing fuel consumption of all plants in-cluded as large point sources in the emission inventory. The statistic on fuel consumption from district heating and power plants is regarded as complete and with no significant uncertainty since the plants are bound by law to report their fuel consumption and other information.
��������� ������������������������ ������ !!"# !!$�
For the years 1990-1994 DEA has estimated consumption of natural gas and biogas in gas engines and gas turbines. NERI assesses that the esti-mation by the DEA are the best available data.�
%������ ��
A spreadsheet from DEA is used for the CO2 emission calculation in ac-cordance with the IPCC reference approach. It is published annually on DEA’s webpage; therefore, a formal data delivery agreement is not deemed necessary.
������ � � ������������������
The DEA reports fuel consumption statistics on SNAP level based on a correspondence table developed in co-operation with NERI. Both traded and non-traded fuels are included in the Danish energy statistics. Thus, for example, estimation of the annual consumption of non-traded wood is included. Petroleum coke, purchased abroad and combusted in Danish
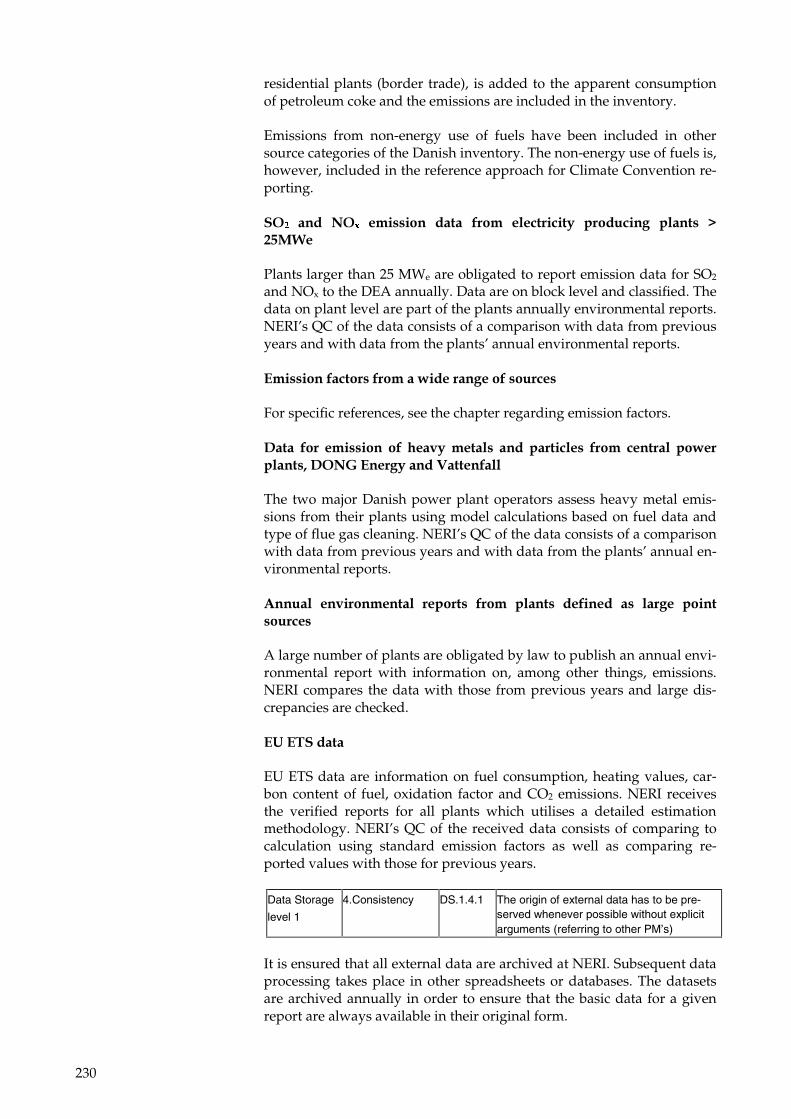
230
residential plants (border trade), is added to the apparent consumption of petroleum coke and the emissions are included in the inventory.�
Emissions from non-energy use of fuels have been included in other source categories of the Danish inventory. The non-energy use of fuels is, however, included in the reference approach for Climate Convention re-porting.
�&�� ���� �&�� ������� �� �� ���� ���� ��� �� ��������� ���� � '�()*+��
Plants larger than 25 MWe are obligated to report emission data for SO2 and NOx to the DEA annually. Data are on block level and classified. The data on plant level are part of the plants annually environmental reports. NERI’s QC of the data consists of a comparison with data from previous years and with data from the plants’ annual environmental reports.
���������� ��������������������������
For specific references, see the chapter regarding emission factors.
�� �� ��� ������� ��� �������� ��� ���� �� ����� ���� ��� ��� ��������� ,��&�������������-� �������
The two major Danish power plant operators assess heavy metal emis-sions from their plants using model calculations based on fuel data and type of flue gas cleaning. NERI’s QC of the data consists of a comparison with data from previous years and with data from the plants’ annual en-vironmental reports.
������� ��������� ��� ��� � ���� ���� � �������� �� ����� ���� ������
A large number of plants are obligated by law to publish an annual envi-ronmental report with information on, among other things, emissions. NERI compares the data with those from previous years and large dis-crepancies are checked.
�.������� ��
EU ETS data are information on fuel consumption, heating values, car-bon content of fuel, oxidation factor and CO2 emissions. NERI receives the verified reports for all plants which utilises a detailed estimation methodology. NERI’s QC of the received data consists of comparing to calculation using standard emission factors as well as comparing re-ported values with those for previous years.��
Data Storage
level 1
4.Consistency DS.1.4.1 The origin of external data has to be pre-served whenever possible without explicit arguments (referring to other PM’s)
It is ensured that all external data are archived at NERI. Subsequent data processing takes place in other spreadsheets or databases. The datasets are archived annually in order to ensure that the basic data for a given report are always available in their original form.
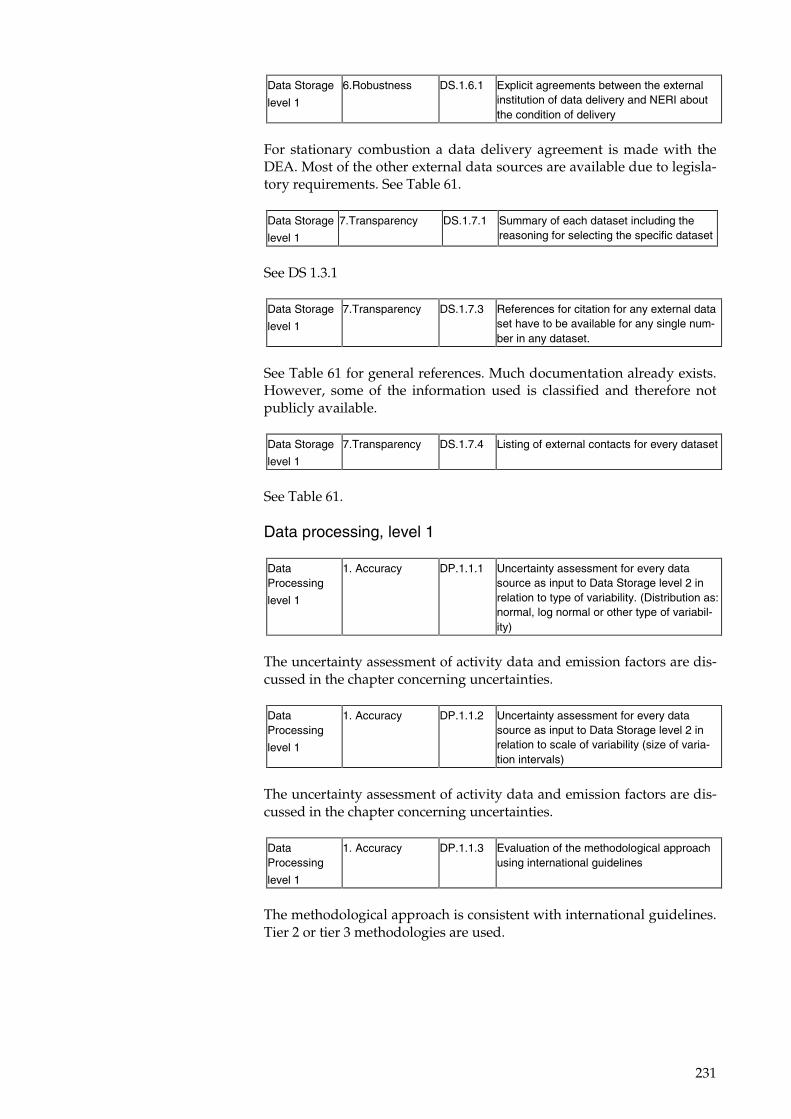
231
Data Storage
level 1
6.Robustness DS.1.6.1 Explicit agreements between the external institution of data delivery and NERI about the condition of delivery
For stationary combustion a data delivery agreement is made with the DEA. Most of the other external data sources are available due to legisla-tory requirements. See Table 61.
Data Storage
level 1
7.Transparency DS.1.7.1 Summary of each dataset including the reasoning for selecting the specific dataset
See DS 1.3.1
Data Storage
level 1
7.Transparency DS.1.7.3 References for citation for any external data set have to be available for any single num-ber in any dataset.
See Table 61 for general references. Much documentation already exists. However, some of the information used is classified and therefore not publicly available.
Data Storage
level 1
7.Transparency DS.1.7.4 Listing of external contacts for every dataset
See Table 61.
Data processing, level 1
Data Processing
level 1
1. Accuracy DP.1.1.1 Uncertainty assessment for every data source as input to Data Storage level 2 in relation to type of variability. (Distribution as: normal, log normal or other type of variabil-ity)
The uncertainty assessment of activity data and emission factors are dis-cussed in the chapter concerning uncertainties.
Data Processing
level 1
1. Accuracy DP.1.1.2 Uncertainty assessment for every data source as input to Data Storage level 2 in relation to scale of variability (size of varia-tion intervals)
The uncertainty assessment of activity data and emission factors are dis-cussed in the chapter concerning uncertainties.
Data Processing
level 1
1. Accuracy DP.1.1.3 Evaluation of the methodological approach using international guidelines
The methodological approach is consistent with international guidelines.�Tier 2 or tier 3 methodologies are used.
232
Data Processing
level 1
1. Accuracy DP.1.1.4 Verification of calculation results using guideline values
Calculated emission factors are compared with guideline emission fac-tors to ensure that they are within reason.�
Data Processing
level 1
2.Comparability DP.1.2.1 The inventory calculation has to follow the international guidelines suggested by UNFCCC and IPCC.
The calculations follow the principle in international guidelines.
Data Processing
level 1
3.Completeness DP.1.3.1 Assessment of the most important quantita-tive knowledge which is lacking.
Regarding the distribution of energy consumption for industrial sources (CRF sector 1A2), a more detailed and frequently updated data material would be preferred. There is ongoing work to increase the accuracy and completeness of this IPCC source category. It is not assessed that this has any influence on the overall emission level of greenhouse gases.
Data Processing
level 1
3.Completeness DP.1.3.2 Assessment of the most important cases where accessibility to critical data sources that could improve quantitative knowledge is missing.
There is no missing accessibility to critical data sources.
Data Processing
level 1
4.Consistency DP.1.4.1 In order to keep consistency at a higher level, an explicit description of the activities needs to accompany any change in the calculation procedure.
A change in calculation procedure would entail that an updated descrip-tion would be elaborated.
Data Processing
level 1
5.Correctness DP.1.5.1 Show at least once, by independent calcula-tion, the correctness of every data manipula-tion.
During data processing it is checked that calculations are done correctly. This is to a wide degree documented in the data processing spread-sheets.
Data Processing
level 1
5.Correctness DP.1.5.2 Verification of calculation results using time-series
Time-series for activity data on SNAP level, as well as emission factors, are used to identify possible errors in the calculation procedure.
233
Data Processing
level 1
5.Correctness DP.1.5.3 Verification of calculation results using other measures
The IPCC reference approach validates the fuel consumption rates and CO2 emissions of fuel combustion. Fuel consumption rates and CO2 emissions differ by less than 1.9 % (1990-2008). The reference approach is further discussed in chapter 16.1.
Data Processing
level 1
5.Correctness DP.1.5.4 Show one-to-one correctness between external data sources and the databases at Data Storage level 2.
There is a direct line between the external datasets, the calculation proc-ess and the input data used to Data Storage level 2. During the calcula-tion process numerous controls are conducted to ensure correctness, e.g. sum checks of the various stages in the calculation procedure.
Data Processing
level 1
7.Transparency DP.1.7.1 The calculation principle and equations used must be described.
Data Processing
level 1
7.Transparency DP.1.7.2 The theoretical reasoning for all methods must be described.
Data Processing
level 1
7.Transparency DP.1.7.3 Explicit listing of assumptions behind all methods
Where appropriate, this is included in the present report with annexes.
Data Processing
level 1
7.Transparency DP.1.7.4 Clear reference to dataset at Data Storage level 1
There is a clear line between the external data and the data processing.
Data Processing
level 1
7.Transparency DP.1.7.5 A manual log to collect information about recalculations
At present, a manual log table is not in place at this level. However, this feature will be implemented in the future. A manual log table is incorpo-rated in the national emission database, Data Storage level 2.
Data storage, level 2
Data Storage level 2
5.Correctness DS.2.5.1 Documentation of a correct connection be-tween all data types at level 2 to data at level 1
To ensure a correct connection between data on level 2 and data on level 1, different controls are in place, e.g. control of sums and random tests.
234
Data Storage level 2
5.Correctness DS.2.5.2 Check if a correct data import to level 2 has been made.
Data import is checked by use of sum control and random testing. The same procedure is applied every year in order to minimise the risk of data import errors.
'�����$&���� �������The emission from each large point source is compared with the emis-sion reported the previous year.
Some automated checks have been prepared for the emission databases:
• Check of units for fuel rate, emission factors and plant-specific emis-sions.
• Check of emission factors for large point sources. Emission factors for pollutants that are not plant-specific should be the same as those defined for area sources.
• Additional checks on database consistency. • Most emission factor references are now incorporated in the emis-
sion database, itself. All references are included in this report (Chap-ter 14.7 and Appendix 6).
• Annual environmental reports are kept for subsequent control of plant-specific emission data.
• QC checks of the country-specific emission factors have not been performed, but most factors are based on input from companies that have implemented some QA/QC work. The major power plant owner/operator in Denmark, DONG Energy has obtained the ISO 14001 certification for an environmental management system. The Danish Gas Technology Centre and Force Technology both run ac-credited laboratories for emission measurements.
#���������$�%$&��������������������� ��(�������The following points make up the list of QA/QC tasks to be carried out directly in relation to the stationary combustion part of the Danish emis-sion inventories. The time plan for the individual tasks has not yet been made.�
����������������
A comparison with external data from other countries in order to evalu-ate discrepancies.
����� �������������
Documentation list of model and independent calculations to test every single mathematical relation.
National Environmental Research Institute, NERI, is a part of Aarhus University.
NERI undertakes research, monitoring and consultancy
within environment and nature.
At NERI’s website www.neri.dk you’ll fi nd information regarding ongoing research and development projects.
Furthermore the website contains a database of publications including scientifi c articles, reports, conference contributions etc. produced by NERI staff members.
National Environmental Research InstituteDanmarks Miljøundersøgelser
NERIDMU
Further information: www.neri.dk
National Environmental Research Institute Management Frederiksborgvej 399 Department of Arctic Environment PO Box 358 Department of Atmospheric Environ ment DK-4000 Roskilde Department of Environmental Chemistry and Microbiology Denmark Department of Marine Ecology Tel: +45 4630 1200 Department of Policy Analysis Fax: +45 4630 1114 National Environmental Research Institute Department of Freshwater Ecology Vejlsøvej 25 Department of Terrestrial Ecology PO Box 314 DK-8600 Silkeborg Denmark Tel: +45 8920 1400 Fax: +45 8920 1414
National Environmental Research Institute Department of Wildlife Ecology and Biodiversity Grenåvej 14, Kalø DK-8410 Rønde Denmark Tel: +45 8920 1700 Fax: +45 8920 1514
NERI Technical Reports
NERI’s website www.neri.dk contains a list of all published technical reports along with other NERI publications. All recent reports can be downloaded in electronic format (pdf) without charge. Some of the Danish reports include an English summary.
Nr./No. 2010
789 Forekomst og regulering af fritlevende mink i Danmark i jagtsæsonen 2007/08.Af Asferg, T. 28 s.
788 Forekomst af antikoagulante rodenticider i danske rovfugle, ugler og små rovpattedyr. En basisundersøgelse.Af Christensen, T.K., Elmeros, M. & Lassen, P. 84 s.
787 Effekter af øgede kvælstoftilførsler på miljøet i danske fjorde. Af Markager, S., Carstensen, J., Krause-Jensen, D., Windolf, J. & Timmermann, K. 54 s.
786 Emissions from decentralised CHP plants 2007 – Energinet.dk Environmental project no. 07/1882. Project report 5 – Emission factors and emission inventory for decentralised CHP production. By Nielsen, M., Nielsen, O.-K. & Thomsen, M. 113 pp.
785 Guidelines to environmental impact assessment of seismic activities in Greenland waters. 2nd edition. By Boertmann, D., Tougaard, J., Johansen, K. & Mosbech, A. 42 pp.
784 Denmark’s National Inventory Report 2010. Emission Inventories 1990-2008 – Submitted under the United Nations Framework Convention on Climate Change and the Kyoto Protocol. By Nielsen, O.-K., Lyck, E., Mikkelsen, M.H., Hoffmann, L., Gyldenkærne, S., Winther, M., Nielsen, M., Fauser, P., Thomsen, M., Plejdrup, M.S., Albrektsen, R., Hjelgaard, K., Johannsen, V.K., Vesterdal, L., Rasmussen, E., Arfaoui, K. & Baunbæk, L. 1178 pp.
783 Miljøøkonomiske beregningspriser for emissioner. Af Andersen, M.S. 33 s.
782 Screening for kloralkaner i sediment. Relevans for NOVANA. Af Larsen, M.M., Hjorth, M. & Sortkjær, O. 22 s.
781 Emissionskortlægning for decentral kraftvarme 2007 – Energinet.dk miljøprojekt nr. 07/1882. Delrapport 5 Emissionsfaktorer og emissionsopgørelse for decentral kraftvarme, 2006. Af Nielsen, M., Nielsen, O.-K. & Thomsen, M. 105 s.
780 Heavy Metal Emissions for Danish Road Transport. By Winther, M. & Slentø, E. 99 pp.
779 Brændefyrings bidrag til luftforurening. Nogle resultater fra projektet WOODUSE. Af Olesen, H.R., Wåhlin, P. & Illerup, J.B. 71 s.
778 Ynglefugle i Tøndermarsken og Margrethe Kog 1975-2009. En analyse af udviklingen i fuglenes antal og fordeling med anbefalinger til forvaltningstiltag. Af Clausen, P. & Kahlert, J. (red.) 206 s.
777 Air pollution from residential wood combustion in a Danish village. Measuring campaign and analysis of results. By Wåhlin, P., Olesen, H.R., Bossi, R. & Stubkjær, J. 49 pp.
776 Annual Danish Informative Inventory Report to UNECE. Emission inventories from the base year of the protocols to year 2008. By Nielsen, O-K., Winther, M., Mikkelsen, M.H., Hoffmann, L., Nielsen, M., Gyldenkærne, S., Fauser, P., Plejdrup, M.S., Albrektsen, R. & Hjelgaard, K. 565 pp.
775 Environmental monitoring at the former lead-zinc mine in Maarmorilik, Northwest Greenland, in 2009. By Johansen, P., Asmund, G., Rigét, F., Johansen, K. & Schledermann, H. 32 pp.
774 Kvælstofbelastningen ved udvalgte terrestriske habitatområder i Sønderborg kommune. Af Frohn, L. M., Skjøth, C. A., Becker, T., Geels, C. & Hertel, O. 30 s.
773 Geese, seabirds and mammals in North and Northeast Greenland. Aerial surveys in summer 2009. By Boertmann, D. & Nielsen, R.D. 66 pp.
772 Environmental monitoring at the Nalunaq Gold Mine, South Greenland, 2009. By Glahder, C.M., Asmund, G. & Riget, F. 32 pp.
771 OMLHighway within the framework of SELMAGIS. Final Report. By Jensen, S.S., Becker, T., Ketzel, M., Løfstrøm, P., Olesen, H.R. & Lorentz, H. 26 pp.
770 Road pricing, luftforurening og eksternalitetsomkostninger. Af Jensen, S.S., Ketzel, M. & Andersen, M.S. 48 s.

[Blank page]
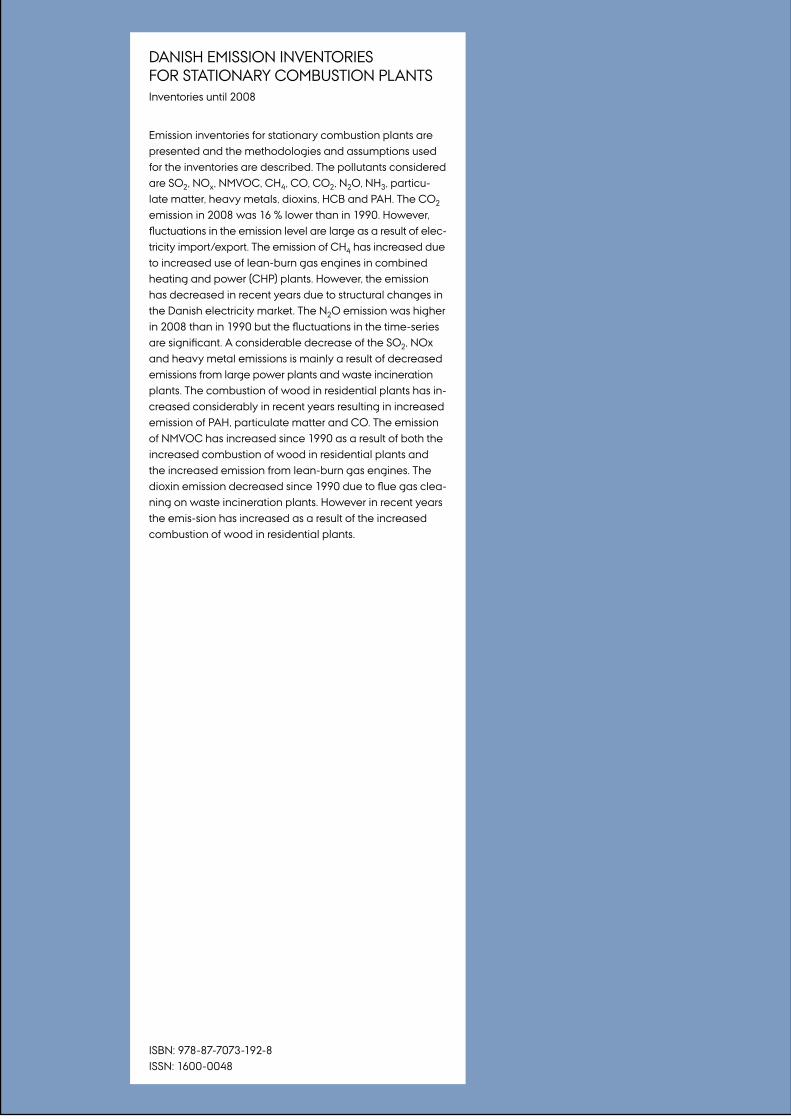
Danish emission inventories for stationary combustion plantsinventories until 2008
emission inventories for stationary combustion plants are presented and the methodologies and assumptions used for the inventories are described. the pollutants considered are so2, nox, nmvoc, ch4, co, co2, n2o, nh3, particu-late matter, heavy metals, dioxins, hcb and pah. the co2 emission in 2008 was 16 % lower than in 1990. however, fluctuations in the emission level are large as a result of elec-tricity import/export. the emission of ch4 has increased due to increased use of lean-burn gas engines in combined heating and power (chp) plants. however, the emission has decreased in recent years due to structural changes in the Danish electricity market. the n2o emission was higher in 2008 than in 1990 but the fluctuations in the time-series are significant. A considerable decrease of the SO2, nox and heavy metal emissions is mainly a result of decreased emissions from large power plants and waste incineration plants. the combustion of wood in residential plants has in-creased considerably in recent years resulting in increased emission of pah, particulate matter and co. the emission of nmvoc has increased since 1990 as a result of both the increased combustion of wood in residential plants and the increased emission from lean-burn gas engines. the dioxin emission decreased since 1990 due to flue gas clea-ning on waste incineration plants. however in recent years the emis-sion has increased as a result of the increased combustion of wood in residential plants.
isbn: 978-87-7073-192-8issn: 1600-0048