
Uncertainty Analysis in Emission Inventories Simon Eggleston.pdfINTERGOVERNMENTAL PANEL ON CLIMATE...
44
INTERGOVERNMENTAL PANEL ON CLIMATE CHANGE Task Force on Inventories me Programm Uncertainty Analysis in Emission nventory Uncertainty Analysis in Emission Inventories use Gas In Simon Eggleston Greenhou Head, Technical Support Unit, IPCC Task Force on Inventories National G IPCC N
Transcript of Uncertainty Analysis in Emission Inventories Simon Eggleston.pdfINTERGOVERNMENTAL PANEL ON CLIMATE...

INTERGOVERNMENTAL PANEL ON CLIMATE CHANGETask Force on Inventories
me
Prog
ram
m
Uncertainty Analysis in Emission
nven
tory
Uncertainty Analysis in Emission Inventories
use
Gas
In
Simon Eggleston
Gre
enho
u ggHead, Technical Support Unit,
IPCC Task Force on Inventories
Nat
iona
l GIP
CC
N

NG
ERemember…
ATE
CH
AN Remember…
M t i t t i d i hi h lit “G d
N C
LIM
A • Most important is producing high quality “Good Practice” emission and removal estimates
• Effort on uncertainty analysis should be small in
AN
EL
ON Effort on uncertainty analysis should be small in
comparison to effort on inventory estimates themselves
EN
TAL
PA • Data collection activities should consider data uncertainties
This will ensure the best data is collected & ensures good
VE
RN
ME – This will ensure the best data is collected & ensures good
practice estimates– As you collect data you should assess how “good” it is
TER
GO
Vce
on
es
• At its simplest a well planned uncertainty assessment should only take a few extra hours!
INT
Task
For
cIn
vent
orie

NG
EWhy are you making an inventory?
ATE
CH
AN Why are you making an inventory?
A t f l ti ( NC)
N C
LIM
A • As part of compulsory reporting (e.g. NC)• Policy development
Mitigation
AN
EL
ON – Mitigation
– Adaption• Monitoring impacts of mitigation policies
EN
TAL
PA
g p g p• Look for co-benefits (or impacts of non-climate
policies on GHG emissions/removals)U b i l i lit
VE
RN
ME – Urban or regional air quality
– Energy efficiency
TER
GO
Vce
on
esIN
TTa
sk F
orc
Inve
ntor
ie

NG
EAs part of compulsory reporting
ATE
CH
AN As part of compulsory reporting
N A I ti h t d i t i
N C
LIM
A • Non Annex I parties have to produce inventories as part of their National Communications
• Uncertainty assessment is part of any inventory that
AN
EL
ON Uncertainty assessment is part of any inventory that
complies with Good Practice Guidance• Uncertainty assessment should be part of any
EN
TAL
PA
y p yscientific estimate
• Reducing uncertainties means making the estimates better reflect the specific national circumstances
VE
RN
ME better reflect the specific national circumstances
• You may wish to do the minimum necessary but remember – others will use your inventory to
TER
GO
Vce
on
es
remember others will use your inventory to develop their policies…– Its always best for everyone to use the best figures
INT
Task
For
cIn
vent
orie

NG
EPolicy development
ATE
CH
AN Policy development
N C
LIM
A • Inventories form the basis of any rational policy development.
They indicate the major sectors where abatement will have
AN
EL
ON – They indicate the major sectors where abatement will have
a real impact– They can be used to predict the impact of proposed policies
EN
TAL
PA – They are used to chose cost-effective options
• However, the results are only as reliable as the
VE
RN
ME emission inventories uncertainty
Minimising uncertainty improves resultsKnowledge of uncertainty tells users the limits of the results
TER
GO
Vce
on
es
Knowledge of uncertainty tells users the limits of the results (i.e. their uncertainty)
INT
Task
For
cIn
vent
orie

NG
EMonitor impacts of mitigation policies
ATE
CH
AN Monitor impacts of mitigation policies
P li k d t k if li i ki
N C
LIM
A • Policy makers need to know if policies are working• Inventory methods should be chosen to reflect
mitigation measures
AN
EL
ON mitigation measures
• Uncertainty will indicate the minimum changes that can be seen by the emission inventory
EN
TAL
PA
y y– reducing uncertainties enables smaller effects to be
detected• Improving uncertainties will ensure the inventory
VE
RN
ME • Improving uncertainties will ensure the inventory
better reflects the real situation in a country
TER
GO
Vce
on
esIN
TTa
sk F
orc
Inve
ntor
ie

NG
E Look for co-benefits:I t f li t li i
ATE
CH
AN Impacts of non-climate policies:
Many policy areas have multiple benefitsMany policy areas have multiple benefits
N C
LIM
A ENERGY EFFICIENCYENERGY EFFICIENCY
•Reduced Costs
SOIL CARBON IN CROPLANDSSOIL CARBON IN CROPLANDS
•Improved water availability
AN
EL
ON
•Energy Security
•Reduced Air Pollution
•Improved drought tolerance
•Improved soil fertility (biodiversity)
EN
TAL
PA •Reduced CO2 Emissions •Carbon sequestration
• Emission Inventories enable policy choices to be
VE
RN
ME Emission Inventories enable policy choices to be
based on an proper understanding of these issues• Emission Inventories enable GHG benefits to be
TER
GO
Vce
on
es
Emission Inventories enable GHG benefits to be claimed and acknowledged– Uncertainty assessment is an important part to add
INT
Task
For
cIn
vent
orie credibility to this process
NG
EBenefits of Uncertainty Analysis
ATE
CH
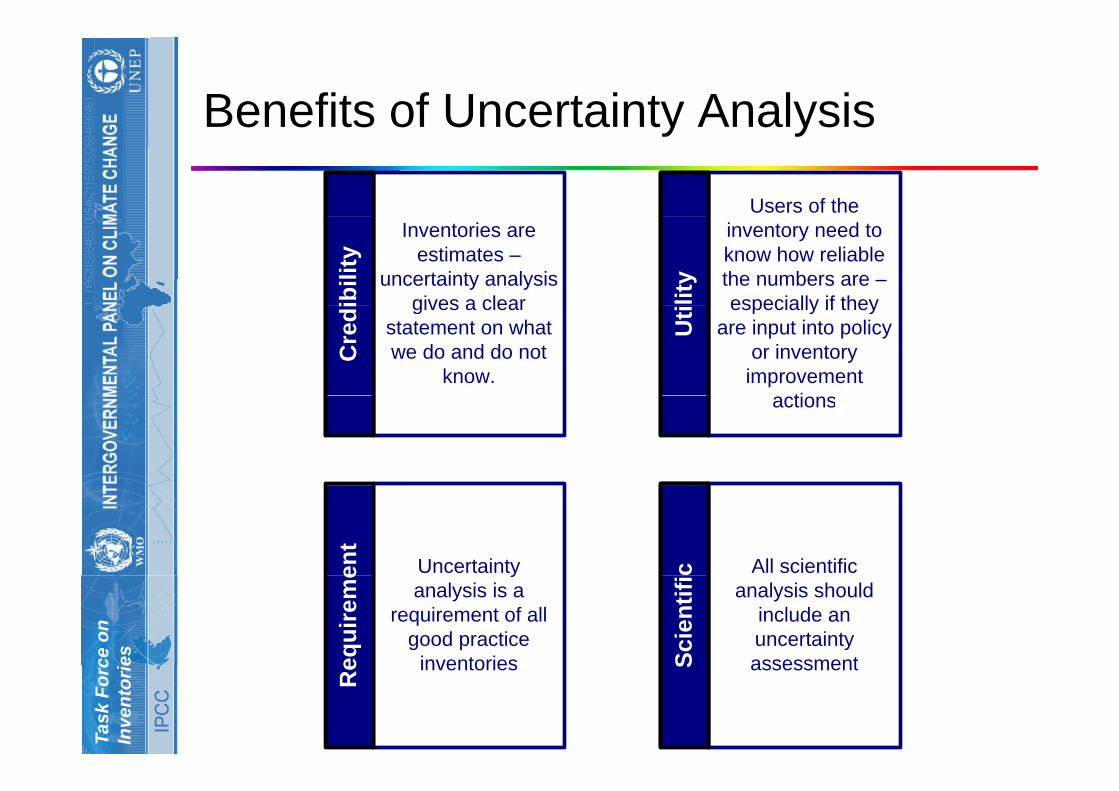
AN Benefits of Uncertainty Analysis
Users of the
N C
LIM
A inventory need to know how reliable the numbers are –especially if theylit
y
Inventories are estimates –
uncertainty analysis gives a clearib
ility
AN
EL
ON especially if they
are input into policy or inventory improvement
ti
Utigives a clear
statement on what we do and do not
know.C
redi
EN
TAL
PA actions
VE
RN
ME
Uncertainty ent
All scientific c
TER
GO
Vce
on
es
yanalysis is a
requirement of all good practice
inventoriesequi
rem
e
analysis should include an uncertainty assessmentSc
ient
ifi
INT
Task
For
cIn
vent
orie inventories
Re assessmentS

NG
EComparable Inventories
ATE
CH
AN Comparable Inventories
Thi i th i f th IPCC id li
N C
LIM
A • This is the aim of the IPCC guidelines• They allow for choice of methods by inventory
compilers
AN
EL
ON compilers
• Methods have to be demonstrably consistent• GPG is way to ensure comparable inventories and
EN
TAL
PA
GPG is way to ensure comparable inventories and uncertainty assesment is a part of this
• Inventory should be
VE
RN
ME – Transparent
– Complete– Consistent
TER
GO
Vce
on
es
Consistent– Comparable– Accurate
INT
Task
For
cIn
vent
orie

NG
EInventory Cycle
ATE
CH
AN Inventory Cycle
N C
LIM
AA
NE
L O
NE
NTA
L PA
VE
RN
ME
TER
GO
Vce
on
esIN
TTa
sk F
orc
Inve
ntor
ie

NG
EInventory Cycle
ATE
CH
AN Inventory Cycle
N C
LIM
A Start New Estimate
Building on experience of previous inventory (if
Identify Key t iReport Inventory
AN
EL
ON p y (
any)Setup and
Implement Quality Control
categoriesp y
EN
TAL
PA
Make necessary revisions (if any)
Check Inventory through QA
Select Methods & Data considering uncertainty & time series consistency
record uncertainty
VE
RN
ME
Uncertainty:
record uncertainty
Collect data and ti t i i
TER
GO
Vce
on
es
Uncertainty: Evaluate input data and assess overall
inventory
Conduct Key Source Analysis Compile Inventory
estimate emissions and removals. EF uncertainty from
guidelines
Si lINT
Task
For
cIn
vent
orie Simple
Uncertainty Assessment

INTERGOVERNMENTAL PANEL ON CLIMATE CHANGETask Force on Inventories
me
Prog
ram
mnv
ento
ry
Some Concepts
use
Gas
InG
reen
hou
Nat
iona
l GIP
CC
N

NG
EAccuracy & Precision
ATE
CH
AN Accuracy & Precision
N C
LIM
AA
NE
L O
NE
NTA
L PA
VE
RN
ME
TER
GO
Vce
on
esIN
TTa
sk F
orc
Inve
ntor
ie
Precise Imprecise

NG
ESpecifying Uncertainty
ATE
CH
AN Specifying Uncertainty
N C
LIM
A • Uncertainty is quoted as the 2.5 and 97.5 percentile i.e. bounds around a 95% confidence interval
AN
EL
ON
• This can be expressed as234 ± 23%
EN
TAL
PA – 234 ± 23%– 26400 (- 50%, + 100%)– 2000 (a factor of 2) (i.e. - 50%, + 100%)
VE
RN
ME 2000 (a factor of 2) (i.e. 50%, 100%)
– 10 an order of magnitude (i.e. 1 to 100)
TER
GO
Vce
on
esIN
TTa
sk F
orc
Inve
ntor
ie

NG
EProbability Density
ATE
CH
AN Probability Density
N C
LIM
A
y
97.5th
Percentile2.5th
Percentile
AN
EL
ON
y D
ensi
ty 95%Probability
Range
EN
TAL
PA
obab
ility
Mean-30% +30%
Range
VE
RN
ME
Pro Mean
TER
GO
Vce
on
es
0 1 2 3
INT
Task
For
cIn
vent
orie Example Emission Factor

NG
EProbability Density
ATE
CH
AN Probability Density
97 5th2 5th
N C
LIM
A
sity 95% Probability Range
97.5th
Percentile2.5th
Percentile
AN
EL
ON
ty D
ens
Mean-50% +100%
EN
TAL
PA
roba
bili
VE
RN
ME P
TER
GO
Vce
on
es
0 1 2 3Example Emission Factor
INT
Task
For
cIn
vent
orie Example Emission Factor

INTERGOVERNMENTAL PANEL ON CLIMATE CHANGETask Force on Inventories
me
Prog
ram
mnv
ento
ry
Determining Data Uncertainties
use
Gas
In
Simplified Approach
Gre
enho
u p pp
Nat
iona
l GIP
CC
N

NG
ESources of Uncertainty
ATE
CH
AN Sources of Uncertainty
N C
LIM
A • Assumptions and methods– These method may not accurately reflect the
AN
EL
ON emission. Good Practice requires that biases be
reduced as much as possible. Guidelines aim to be as unbiased and complete as possible
EN
TAL
PA be as unbiased and complete as possible.• Input Data
M d l h d i i
VE
RN
ME – Measured values have errors and emission
factors may not be truly representativeC l l ti
TER
GO
Vce
on
es
• Calculation errors– Good QA/QC to stop these
INT
Task
For
cIn
vent
orie

NG
EUncertainties arise in Input Data…
ATE
CH
AN Uncertainties arise in Input Data…
L k f d t
N C
LIM
A • Lack of data– Use of proxies, extrapolation etc.
Mi i d t
AN
EL
ON – Missing data
• Data not truly representative
EN
TAL
PA • Statistical Random Sampling Error• Measurement error
VE
RN
ME
• Misreporting
TER
GO
Vce
on
es
• Consideration of these during data collection phase will minimise errors
INT
Task
For
cIn
vent
orie p

NG
ESources of data
ATE
CH
AN Sources of data
• National Statistics Agencies
N C
LIM
A • National Statistics Agencies • Sectoral experts, stakeholder organisations • Other national experts • IPCC Emission Factor Database
AN
EL
ON • IPCC Emission Factor Database
• Other international experts• International organisations publishing statistics e.g., United
Nations, Eurostat or the International Energy Agency, OECD and
EN
TAL
PA
, gy g y,the IMF (which maintains international activity as well as economic data)
• Reference libraries (National Libraries)• Scientific and technical articles in environmental books journals
VE
RN
ME • Scientific and technical articles in environmental books, journals
and reports.• Universities • Web search for organisations & specialists
TER
GO
Vce
on
es
Web search for organisations & specialists • National Inventory Reports from Parties to the United Nations
Framework Convention on Climate Change
INT
Task
For
cIn
vent
orie

NG
EUncertainty Information
ATE
CH
AN Uncertainty Information
s s
N C
LIM
A
Cen
su
delin
es
l Sta
tistic
s
AN
EL
ON
urve
y
Gui
Offi
cia
EN
TAL
PA Sual
VE
RN
ME
Empi
rica
Dat
a
vity
Dat
a
TER
GO
Vce
on
es xper
t ge
men
t Act
iv
INT
Task
For
cIn
vent
orie Ex
Judg

NG
EExpert Judgement
ATE
CH
AN Expert Judgement
N C
LIM
A • In many cases empirical data are not available.
AN
EL
ON
• A practical solution is using well-informed judgements from experts.
EN
TAL
PA
j g– Possible biases: Availability bias,
representativeness bias, anchoring and
VE
RN
ME adjustment bias, motivational bias, managerial
bias…S l ti f l t li it ti t l
TER
GO
Vce
on
es
– Solution: use formal expert elicitation protocols• Expert elicitation
INT
Task
For
cIn
vent
orie

NG
EExpert judgement
ATE
CH
AN Expert judgement
• Expert judgement on methodological choice and choice of input data to use is ultimately
N C
LIM
A • Expert judgement on methodological choice and choice of input data to use is ultimately the basis of all inventory development and sector specialists can be of particular use to fill gaps in the available data, to select data from a range of possible values or make judgements about uncertainty ranges as described in Section 3.2.2.3. Experts with suitable backgrounds can be found in government, industrial trade associations, technical institutes industry and universities
AN
EL
ON institutes, industry and universities.
The goal of expert judgement may be choosing the proper methodology; the parameter value from ranges provided; the most appropriate activity data to use; the most appropriate way to apply a methodology; or determining the appropriate mix of technologies in use. A degree of expert judgement is required even when applying classical statistical techniques to data sets since one must judge whether the data are a
EN
TAL
PA classical statistical techniques to data sets, since one must judge whether the data are a representative random sample and, if so, what methods to use to analyze the data. This requires both technical and statistical judgement. Interpretation is especially needed for data sets that are small, highly skewed or incomplete[1]. In all cases the aim is to be as representative as possible in order to reduce possible bias and increase accuracy. Formal methods for obtaining (or eliciting) data from experts are known as expert elicitation see
VE
RN
ME methods for obtaining (or eliciting) data from experts are known as expert elicitation, see
Annex 2A.1 for details.
[1] Methods for characterising sampling distributions for the mean are described by Cullen and Frey (1999), Frey and Rhodes (1996), and Frey and Burmaster (1999).
TER
GO
Vce
on
esIN
TTa
sk F
orc
Inve
ntor
ie

NG
EAT
E C
HA
N
• Wherever possible expert judgement should be elicited using an appropriate protocol An
N C
LIM
A • Wherever possible, expert judgement should be elicited using an appropriate protocol. An example of a well-known protocol for expert elicitation, Stanford/SRI protocol, has been adapted and is described below.Motivating: Establish a rapport with the expert, and describe the context of the elicitation. Explain the elicitation method to be used and the reason it was designed that way. The elicitor should also try to explain the most commonly occurring biases to the expert and to
AN
EL
ON elicitor should also try to explain the most commonly occurring biases to the expert, and to
identify possible biases in the expert.Structuring: Clearly define the quantities for which judgements are to be sought, including, for example, the year and country, the source/sink category, the averaging time to be used (one year), the focus activity data, emission factor or, for uncertainty, the mean value of emission factors or other estimation parameter and the structure of the inventory model
EN
TAL
PA emission factors or other estimation parameter, and the structure of the inventory model. Clearly identify conditioning factors and assumptions (e.g., resulting emissions or removals should be for typical conditions averaged over a one-year period).Conditioning: Work with the expert to identify and record all relevant data, models, and theory relating to the formulation of the judgements.Encoding: Request and quantify the expert’s judgement The specific qualification will
VE
RN
ME Encoding: Request and quantify the expert s judgement. The specific qualification will
differ for different elements and be present in the form of a probability distribution for uncertainty, and an activity or emission factor estimate for activity data and emission factors. If appropriately managed, information on uncertainty (probability density function) can be gathered at the same time as gathering estimates of activity or emission factor. The section on encoding in Chapter 3 describes some alternative methods to use for
TER
GO
Vce
on
es
The section on encoding in Chapter 3 describes some alternative methods to use for encoding uncertainty.Verification: Analyze the expert’s response and provide the expert with feedback as to what has been concluded regarding his or her judgement. Is what has been encoded really what the expert meant? Are there inconsistencies in the expert’s judgement?
INT
Task
For
cIn
vent
orie

NG
EUncertainty Analysis
ATE
CH
AN Uncertainty Analysis
N C
LIM
AA
NE
L O
NE
NTA
L PA
VE
RN
ME
TER
GO
Vce
on
esIN
TTa
sk F
orc
Inve
ntor
ie

NG
EMethods to combine uncertainties
ATE
CH
AN Methods to combine uncertainties
N C
LIM
A 1. Error PropagationSimple - Standard Spreadsheet can be used
Guidelines give explanation and equations
AN
EL
ON Guidelines give explanation and equations
Difficult to deal with correlationsStrictly (standard deviation/mean) < 0.3
EN
TAL
PA
y ( )A simple solution is provided
2. Monte-Carlo Simulation
VE
RN
ME More complex - Use specialised softwareNeeds shape of pdfSuitable where uncertainties large non Gaussian
TER
GO
Vce
on
es
Suitable where uncertainties large, non-Gaussian, complex algorithms, correlations exist and uncertainties vary with time
INT
Task
For
cIn
vent
orie

NG
EFrom 2006 Guidelines:
ATE
CH
AN
N C
LIM
A TABLE 3.2 APPROACH 1 UNCERTAINTY CALCULATION
A B C D E F G H I J K L M
IPCC category
Gas Base year emissions
l
Year t emissions or
l
Activity data
t i t
Emission factor /
ti ti
Combined uncertainty
Contribution to Variance b C t
Type A sensitivity
Type B sensitivity
Uncertainty in trend in national emissions i t d d b
Uncertainty in trend in national emissions i t d d b ti it
Uncertainty introduced into th t d i t t l
AN
EL
ON or removals
removals
uncertainty
estimation parameter uncertainty
by Category in Year t
introduced by emission factor / estimation parameter uncertainty
introduced by activity data uncertainty
the trend in total national emissions
Input data Input data Input data Note A
Input data Note A
22 FE +
( )( )2
2
D
DG
∑
•
Note B
∑CD
FI •
Note C 2EJ ••
Note D
22 LK +
EN
TAL
PA ( )D∑ ∑
Gg CO2 equivalent
Gg CO2 equivalent % % % % % % % %
E.g., 1.A.1. Energy
CO2
VE
RN
MEgy
Industries Fuel 1
E.g., 1.A.1. Energy Industries Fuel 2
CO2
TER
GO
Vce
on
es
Fuel 2
Etc... …
Total ∑C ∑D ∑H ∑M
Percentage uncertainty in total inventory: ∑H Trend uncertainty: ∑M
INT
Task
For
cIn
vent
orie

NG
E
A B C D E F G H I J K L MIPCC category Gas Base year
emissions or removals
Year t emissions or removals
Activity data uncertainty
Emission factor / estimation parameter uncertainty
Combined uncertainty
Contribution to Variance by Category in Year t
Type A sensitivity
Type B sensitivity
Uncertainty in trend in national emissions introduced by emission factor /
i i
Uncertainty in trend in national emissions introduced by activity data
i
Uncertainty introduced into the trend in total national emissions
Approach 1 uncertainty calculation
ATE
CH
AN estimation
parameter uncertainty
uncertainty
Input data Input data Input data Input data Note B
Gg CO2 Gg CO2
22 FE +( )( )2
2
D
DG
∑
•
∑ CD
FI • 2EJ •• 22 LK +
N C
LIM
A Gg CO2
equivalentGg CO2
equivalent % % % % % % % %
1.A.1. Energy Industries CH4 35.5346662 32.9951217 5 25 25.50 0.0 3.20506E-05 0.00010495 0.000801264 0.000742109 1.19275E-06
1.A.2. Manufacturing Industries and ConstructionCH4 57.0302899 51.8776096 5 25 25.50 0.0 4.80131E-05 0.000165011 0.001200328 0.001166804 2.80222E-06
1.A.3. Transport CH4 81.7067834 37.1466612 5 25 25.50 0.0 -4.94664E-05 0.000118155 -0.00123666 0.000835483 2.22736E-06
1.A.4. Other Sectors CH4 1041.24025 428.554682 5 25 25.50 0.0 -0.000772946 0.001363136 -0.019323647 0.009638828 0.00046631
1.A.5. Other CH4 330.338228 97.5658895 5 25 25.50 0.0 -0.000367351 0.000310335 -0.009183772 0.002194401 8.91571E-05
1 B 1 S lid F l CH4 2486 6834 12364 38
AN
EL
ON1.B.1. Solid Fuels CH4 24867.6834 12364.38 10 25 26.93 2.7 -0.011678579 0.039328314 -0.291964463 0.556186352 0.394586505
1.B.2. Oil and Natural Gas CH4 12570.348 4022.34735 10 25 26.93 0.3 -0.012988732 0.012794183 -0.324718297 0.180937071 0.138180196
2.B. Chemical Industry . CH4 40.53 37.5018 10 25 26.93 0.0 3.61373E-05 0.000119285 0.000903433 0.001686942 3.66196E-06
4.A. Enteric Fermentation. CH4 14054.9863 7346.85 15 30 33.54 1.5 -0.005462727 0.023368679 -0.163881819 0.495724537 0.272600067
4.B. Manure Management. CH4 1903.28061 1199.63088 15 30 33.54 0.0 -8.88245E-05 0.003815756 -0.002664735 0.080944413 0.006559099
4.C. Rice Cultivation. CH4 522.9 338.94 10 30 31.62 0.0 5.3609E-06 0.001078092 0.000160827 0.015246523 0.000232482
4.F. Field Burning of Agricultural Residues. CH4 64.3314 37.59 20 30 36.06 0.0 -1.24107E-05 0.000119565 -0.000372321 0.003381819 1.15753E-05
EN
TAL
PA6.A. Solid Waste Disposal on Land. CH4 1959.72 3738.63 15 30 33.54 0.4 0.00787088 0.011891742 0.236126385 0.252261939 0.119391756
6.B. Wastewater Handling. CH4 787.08 747.18 15 30 33.54 0.0 0.000761896 0.002376612 0.022856865 0.050415547 0.003064164
1.A.1. Energy Industries CO2 102607.31 95966.95 5 5 7.07 11.2 0.094441853 0.305249301 0.472209267 2.158438506 4.881838378
1.A.2. Manufacturing Industries and ConstructionCO2 33991.06 30164.34 5 5 7.07 1.1 0.02618491 0.095945987 0.130924551 0.678440577 0.477422855
1.A.3. Transport CO2 23987.07 8406.48 5 5 7.07 0.1 -0.022453294 0.026739124 -0.11226647 0.189074157 0.048352797
1.A.4. Other Sectors CO2 44532.52 11784.04 5 5 7.07 0.2 -0.053800014 0.037482383 -0.269000072 0.265040472 0.14260749
1 A 5 Other CO2 8370 16 4124 19 5 5 7.07 0.0 -0.004052209 0.013118122 -0.020261045 0.092759127 0.009014766
VE
RN
ME1.A.5. Other CO2 8370.16 4124.19
1.B.2. Oil and Natural Gas CO2 3408.21 5171.49583 10 15 18.03 0.2 0.009456387 0.016449366 0.141845811 0.232629165 0.074236563
2.A. Mineral Products. CO2 5744.63 2507.20146 10 15 18.03 0.0 -0.003809586 0.007974844 -0.057143788 0.112781331 0.015985041
2.B. Chemical Industry . CO2 1355.56 171.93456 10 15 18.03 0.0 -0.002233954 0.000546885 -0.033509311 0.007734125 0.001182691
2.C. Metal Production. CO2 12932.6799 10507.4715 10 15 18.03 0.9 0.006887639 0.033421905 0.103314586 0.47265712 0.234078657
5.A. Changes in Forest and Other Woody BiomaCO2 97.19 50 80 94.34 0.0 -0.000199385 0 -0.015950798 0 0.000254428
5.A. Changes in Forest and Other Woody BiomaCO2 -7810.79 -7721.7341 50 80 94.34 12.9 -0.008539362 0.024561101 -0.683148991 1.736732102 3.482930938
5 B Forest and Grassland Conversion CO2 6 26 280 43888 25 75 79 06 0 0 0 00087917 0 000892013 0 065937785 0 031537424 0 005342401
TER
GO
Vce
on
es
5.B. Forest and Grassland Conversion. CO2 6.26 280.43888 25 75 79.06 0.0 0.00087917 0.000892013 0.065937785 0.031537424 0.005342401
1.A.1. Energy Industries N2O 388.516902 328.741673 5 50 50.25 0.0 0.000248607 0.001045653 0.012430334 0.007393886 0.000209183
1.A.2. Manufacturing Industries and ConstructionN2O 112.709781 114.844426 5 50 50.25 0.0 0.000134069 0.000365294 0.006703468 0.002583021 5.16085E-05
1.A.3. Transport N2O 57.3319301 21.6195922 5 50 50.25 0.0 -4.88495E-05 6.87671E-05 -0.002442474 0.000486257 6.20212E-06
1.A.4. Other Sectors N2O 194.497577 46.1816455 5 50 50.25 0.0 -0.000252117 0.000146893 -0.01260587 0.001038693 0.000159987
1.A.5. Other N2O 27.4386549 13.5195061 5 50 50.25 0.0 -1.3288E-05 4.30025E-05 -0.000664398 0.000304074 5.33886E-07
4.B. Manure Management. N2O 375.1 198.4 15 30 33.54 0.0 -0.000138451 0.000631066 -0.004153541 0.013386927 0.000196462
INT
Task
For
cIn
vent
orie4.D. Agricultural Soils(2). N2O 25217.694 9798.17 20 30 36.06 3.0 -0.020551916 0.031165777 -0.616557485 0.881501284 1.157187646
4.F. Field Burning of Agricultural Residues. N2O 24.304 21.297 20 30 36.06 0.0 1.78812E-05 6.7741E-05 0.000536437 0.001916004 3.95884E-06
6.B. Wastewater Handling. N2O 452.6 384.4 15 30 33.54 0.0 0.000294175 0.00122269 0.008825264 0.025937172 0.000750622
Keep Blank! … 0Total 314388.7626 202771.1719 34.6 11.4670044
5.880740472Trend uncertainty: 3.386296561
Percentage uncertainty in total inventory:
∑ H ∑M

NG
EExample Results
ATE
CH
AN Example Results
800,000
N C
LIM
A
700,000
800,000
AN
EL
ON
500 000
600,000
Bolivia
EN
TAL
PA
400,000
500,000
g C
O2 e
q.
VE
RN
ME
200 000
300,000
Gg
Kazakhstan
TER
GO
Vce
on
es
100,000
200,000
INT
Task
For
cIn
vent
orie
0Start Year End Year

NG
EResults
ATE
CH
AN Results
Kazakhstan Bolivia
N C
LIM
A Changes in Forest and Other Woody Biomass Stocks. CO2
Enteric FermentationCH4
Energy Industries Forest and Grassland ions
AN
EL
ON Energy Industries
CO2 Conversion N2OAgricultural Soils N2O Agricultural Soils N2O
Solid FuelsForest and Grassland Em
iss 95%86%
EN
TAL
PA Solid Fuels CH4 Conversion CO2Energy Industries CO2 Enteric Fermentation CH4Manufacturing Industries and C CO
Agricultural SoilsOnc
e
72%69%
VE
RN
ME Construction CO2
Agricultural SoilsN2O
Solid Fuels CH4 N2OOther Sectors CO2 CO2
Var
ien 72%69%
Forest and Grassland Conversion
TER
GO
Vce
on
esIN
TTa
sk F
orc
Inve
ntor
ie

NG
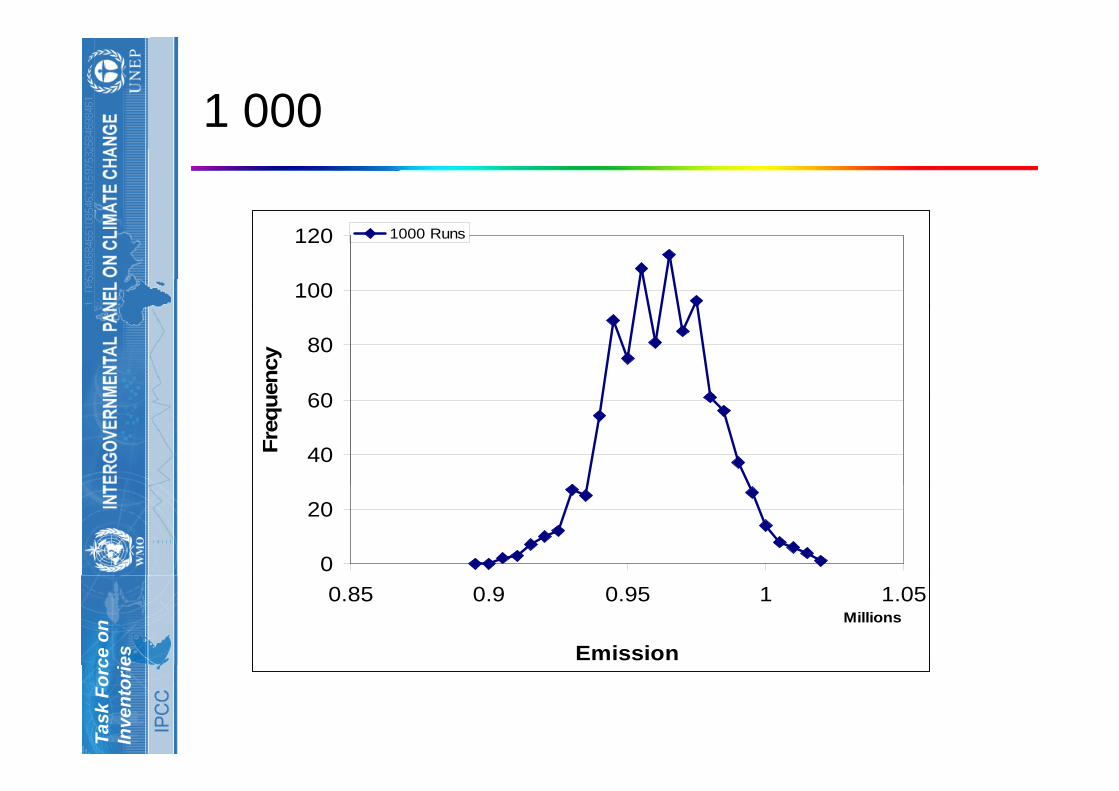
EMonte-Carlo Method
ATE
CH
AN Monte Carlo Method
N C
LIM
A • Key Requirements– Not just uncertainties but also probability density function
(pdf)
AN
EL
ON (pdf)
• Mean• Width
EN
TAL
PA • Shape (e.g. Normal, Log-normal, Weibul, Gamma, Uniform, Triangular, Fractile, …)
VE
RN
ME
• Principal– Select random values of input parameters form their pdf
d l l h di i i R
TER
GO
Vce
on
es
and calculate the corresponding emission. Repeat many times and the distribution of the results is the pdf of the result, from which mean and uncertainty can be estimated
INT
Task
For
cIn
vent
orie

NG
EMonte-Carlo Method
ATE
CH
AN
Emission Activity Data Emission Activity Data
Monte Carlo MethodN
CLI
MA Emission
FactorActivity Data Emission
FactorActivity Data
AN
EL
ON
Value Value Value Value
EN
TAL
PA
Select Random Value from distribution
Select Random Value from distribution
Select Random Value from distribution
Select Random Value from distribution
VE
RN
ME
Repeat
TER
GO
Vce
on
es
Emission = Emission Factor * Activity Data
Emission = Emission Factor * Activity Data
TotalCalculate Mean andStore in
d t bMean
C t t? Finish
INT
Task
For
cIn
vent
orie Total Mean and
Uncertaintydatabase Constant? Finish

NG
E1
ATE
CH
AN 1
N C
LIM
A
1
1.2 1 Runs
AN
EL
ON
0 6
0.8
uenc
y
EN
TAL
PA
0.4
0.6
Freq
u
VE
RN
ME
0
0.2
TER
GO
Vce
on
es
0.85 0.9 0.95 1 1.05Millions
Emission
INT
Task
For
cIn
vent
orie

NG
E10
ATE
CH
AN 10
N C
LIM
A
3 5
4
4.5 10 Runs
AN
EL
ON
2.5
3
3.5
uenc
y
EN
TAL
PA
1
1.5
2
Freq
u
VE
RN
ME
0
0.5
1
TER
GO
Vce
on
es
0.85 0.9 0.95 1 1.05Millions
Emission
INT
Task
For
cIn
vent
orie

NG
E20
ATE
CH
AN 20
N C
LIM
A
3
3.5 20 Runs
AN
EL
ON
2
2.5
uenc
y
EN
TAL
PA
1
1.5
Freq
u
VE
RN
ME
0
0.5
TER
GO
Vce
on
es
0.85 0.9 0.95 1 1.05Millions
Emission
INT
Task
For
cIn
vent
orie

NG
E50
ATE
CH
AN 50
N C
LIM
A
7
8 50 Runs
AN
EL
ON
4
5
6
uenc
y
EN
TAL
PA
2
3
4
Freq
u
VE
RN
ME
0
1
2
TER
GO
Vce
on
es
0.85 0.9 0.95 1 1.05Millions
Emission
INT
Task
For
cIn
vent
orie

NG
E100
ATE
CH
AN 100
N C
LIM
A
12
14 100 Runs
AN
EL
ON
8
10
uenc
y
EN
TAL
PA
4
6
Freq
u
VE
RN
ME
0
2
TER
GO
Vce
on
es
0.85 0.9 0.95 1 1.05Millions
Emission
INT
Task
For
cIn
vent
orie

NG
E500
ATE
CH
AN 500
N C
LIM
A
50
60 500 Runs
AN
EL
ON
30
40
uenc
y
EN
TAL
PA
20
30
Freq
u
VE
RN
ME
0
10
TER
GO
Vce
on
es
0.85 0.9 0.95 1 1.05Millions
Emission
INT
Task
For
cIn
vent
orie
NG
E1 000
ATE
CH
AN 1 000
N C
LIM
A
100
120 1000 Runs
AN
EL
ON
60
80
uenc
y
EN
TAL
PA
40
60
Freq
u
VE
RN
ME
0
20
TER
GO
Vce
on
es
0.85 0.9 0.95 1 1.05Millions
Emission
INT
Task
For
cIn
vent
orie

NG
E5 000
ATE
CH
AN 5 000
N C
LIM
A
500
600 5000 Runs
AN
EL
ON
300
400
uenc
y
EN
TAL
PA
200
300
Freq
u
VE
RN
ME
0
100
TER
GO
Vce
on
es
0.85 0.9 0.95 1 1.05Millions
Emission
INT
Task
For
cIn
vent
orie

NG
E10 000
ATE
CH
AN 10 000
N C
LIM
A
1000
1200 10000 Runs
AN
EL
ON
600
800
uenc
y
EN
TAL
PA
400
600
Freq
u
VE
RN
ME
0
200
TER
GO
Vce
on
es
0.85 0.9 0.95 1 1.05Millions
Emission
INT
Task
For
cIn
vent
orie

NG
ESummary Results
ATE
CH
AN Summary Results
1020000
N C
LIM
A
1000000
AN
EL
ON
980000
EN
TAL
PA
940000
960000
Em
issi
on
VE
RN
ME
920000
TER
GO
Vce
on
es
900000Mean2.5 percentile97.5 percentile
INT
Task
For
cIn
vent
orie
8800001 10 20 50 100 500 1000 5000 10000
Number of Runs

NG
ESummary
ATE
CH
AN Summary
E i l t i t ti t i f l i f ti
N C
LIM
A • Even simple uncertainty estimates give useful information• Good QA/QC and careful consideration of methods can reduce
uncertainty
AN
EL
ON
• Assessment of uncertainty in the input parameters should be part of the standard data collection QA/QC
• There are two approaches to combining uncertainty - or a
EN
TAL
PA
pp g yhybrid approach can be used
• For simple estimates– Uncertainty in activity data assesssed as data collected
VE
RN
ME Uncertainty in activity data assesssed as data collected
– Uncertainty in emission factors from guidelines– Aggregate categories to independent groups of sources/sinks
Use Approach 1 spreadsheet requires little statistical knowledge
TER
GO
Vce
on
es
– Use Approach 1 - spreadsheet requires little statistical knowledge
INT
Task
For
cIn
vent
orie

INTERGOVERNMENTAL PANEL ON CLIMATE CHANGETask Force on Inventories
me
Prog
ram
m
Thank-you
nven
tory
y
Any Questions?
use
Gas
In Any Questions?
Gre
enho
uN
atio
nal G
IPC
C N