Emission Inventories in South America - HTAP · Emission Inventories in South America Workshop on...
34
Emission Inventories in South America Workshop on Global Air Pollutant Emissions Scenarios 11-13 February 2015 IIASA - Laxemburg - Austria Laura Dawidowski Department of Chemistry Atomic Energy Commission of Argentina
Transcript of Emission Inventories in South America - HTAP · Emission Inventories in South America Workshop on...
Emission Inventories inSouth America
Workshop on Global Air Pollutant Emissions Scenarios
11-13 February 2015IIASA - Laxemburg - Austria
Laura DawidowskiDepartment of Chemistry
Atomic Energy Commission of Argentina

Outline• Greenhouse inventories of South American
countries submitted to the UNFCCC
• Emissions from the 6 cities of the SAEMC project
• Reconciliation and related activities
• Final remarks

Latin American countries
Dominican RepublicTrinidad & TobagoBarbadosGuyanaBahamasGrenadaSt. LuciaAntigua & BarbudaSt. Vincent & GrenadinesSt. Kitts & NevisDominica
French overseas territories in LA:French Guiana, Martinique, Guadeloupe,Saint Barthélem and Saint Martin
Reported under US emissionsPuerto Rico
Small countries notindicated in the map
Caribbean
Central American
South American
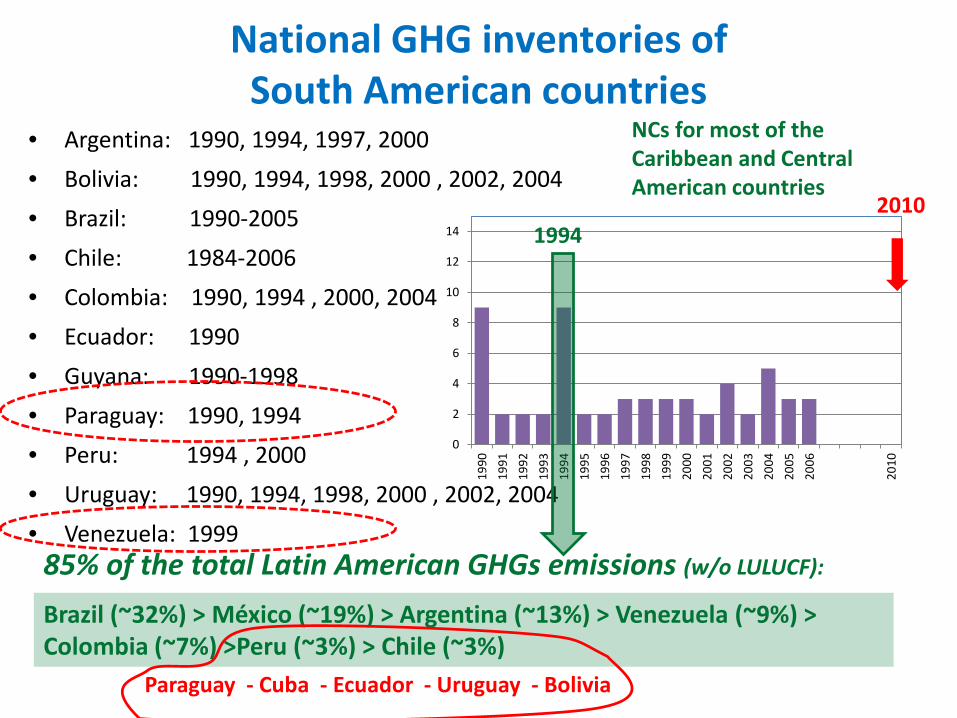
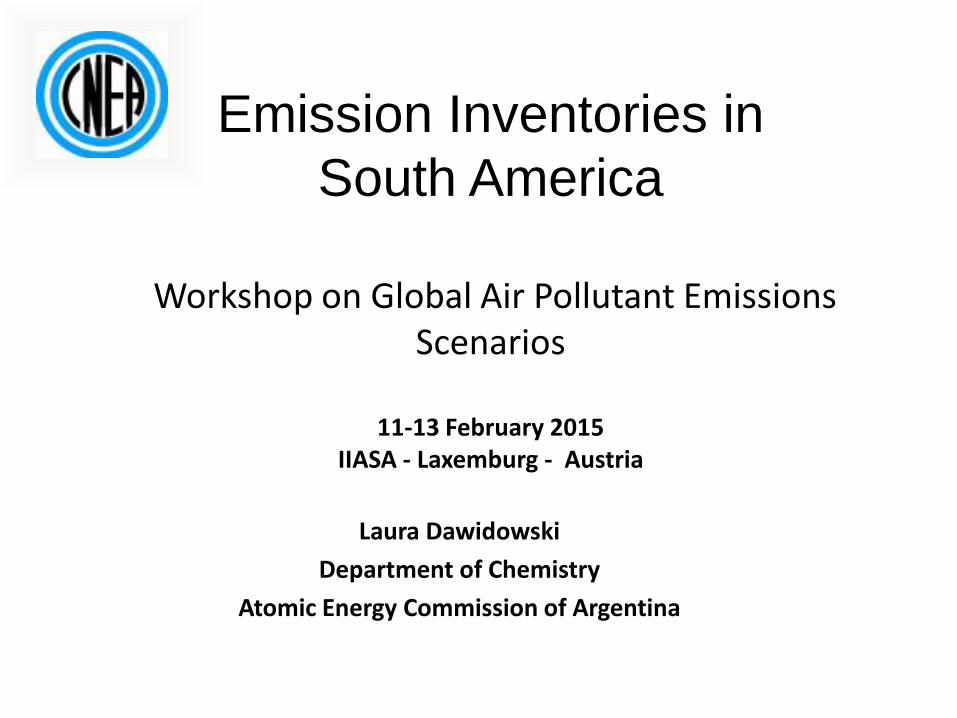
National GHG inventories of South American countries
• Argentina: 1990, 1994, 1997, 2000• Bolivia: 1990, 1994, 1998, 2000 , 2002, 2004• Brazil: 1990-2005• Chile: 1984-2006• Colombia: 1990, 1994 , 2000, 2004• Ecuador: 1990• Guyana: 1990-1998• Paraguay: 1990, 1994• Peru: 1994 , 2000• Uruguay: 1990, 1994, 1998, 2000 , 2002, 2004• Venezuela: 1999
0
2
4
6
8
10
12
14
1990
1991
1992
1993
1994
1995
1996
1997
1998
1999
2000
2001
2002
2003
2004
2005
2006
2010
Brazil (~32%) > México (~19%) > Argentina (~13%) > Venezuela (~9%) > Colombia (~7%) >Peru (~3%) > Chile (~3%)
NCs for most of the Caribbean and Central American countries
85% of the total Latin American GHGs emissions (w/o LULUCF):
1994
Paraguay - Cuba - Ecuador - Uruguay - Bolivia
2010

National GHGs emissions by gases in SA(Gg CO2 eq)
0% 20% 40% 60% 80% 100%
Argentina
Brazil
Colombia
Perú
Chile
Bolivia
Ecuador
Uruguay
CO2CH4N2O
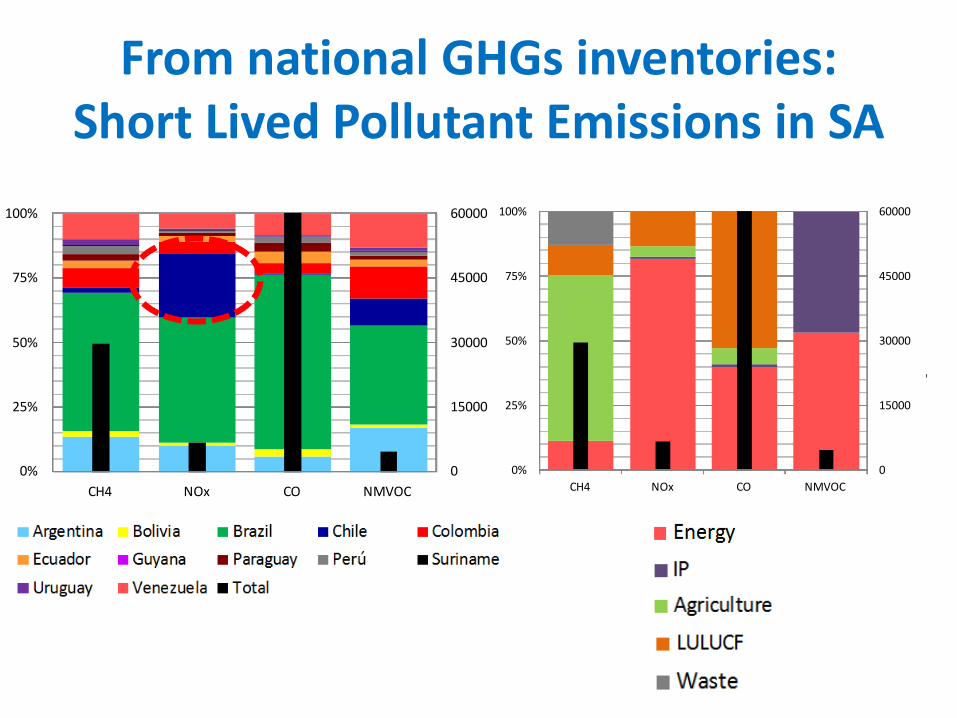
From national GHGs inventories:Short Lived Pollutant Emissions in SA
0
15000
30000
45000
60000
0%
25%
50%
75%
100%
CH4 NOx CO NMVOC
Argentina Bolivia Brazil Chile ColombiaEcuador Guyana Paraguay Perú SurinameUruguay Venezuela Total
0
15000
30000
45000
60000
0%
25%
50%
75%
100%
CH4 NOx CO NMVOC
Energy IP Agriculture LULUCF Waste Total

Emissions from the 6 sixties of the SAEMC project
Sâo Paulo
Buenos AiresSantiago
Lima
BogotáMedellín

Integrating local emission inventories into global emissions databases
• Construction of regional on-road emissions inventory
– Analysis of local inventories
– Correlation with appropriate drivers
– Extrapolation of local information to other cities without inventories
– Spatial distribution of estimated and extrapolated emissions
• Verification
– Modeled (CCAT-BRAMS) and observed concentrations of CO, NOx and O3
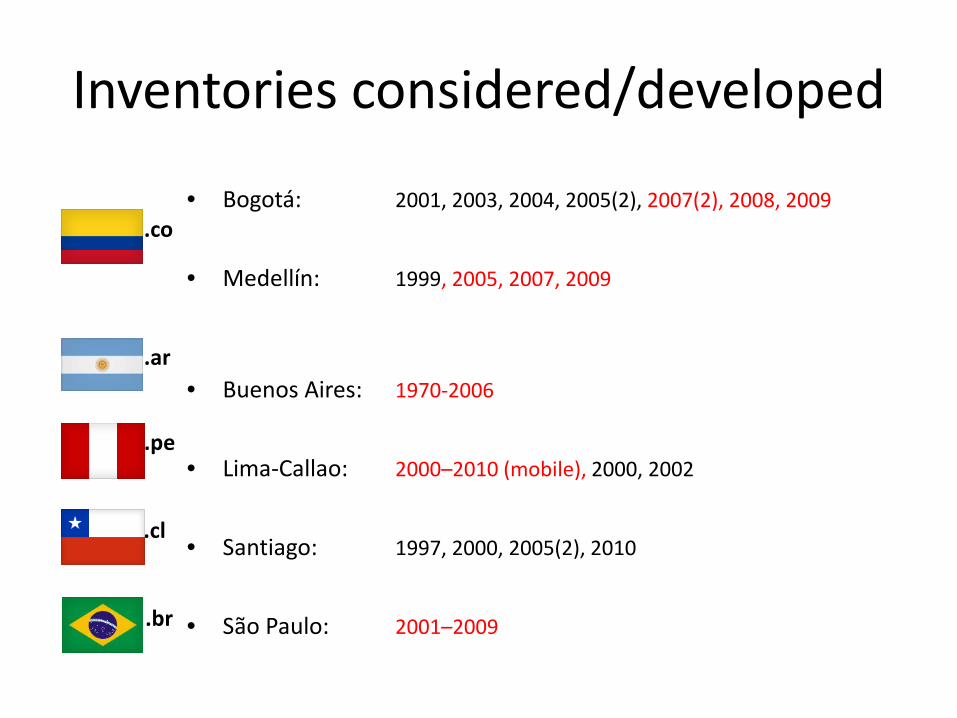
Inventories considered/developed
• Bogotá: 2001, 2003, 2004, 2005(2), 2007(2), 2008, 2009
• Medellín: 1999, 2005, 2007, 2009
• Buenos Aires: 1970-2006
• Lima-Callao: 2000–2010 (mobile), 2000, 2002
• Santiago: 1997, 2000, 2005(2), 2010
• São Paulo: 2001–2009
.co
.ar
.pe
.cl
.br

Gases & particles
NOx CO VOC SO2 PM10 CO2 CH4 N2O Other
Bogotá 1 1 NE NE
Medellín (1) (2) (3)
Buenos Aires (5)
Lima NE NE NE NE
Santiago (4) NE NE NE (5)
São Paulo NE NE NE NE
(1) Disaggregated in > 30 species(2) TSPM emissions have been also estimated and reported(3) HCl, HF and > 20 chemical elements(4) PM2.5 emissions have been also estimated and reported(5) NH3
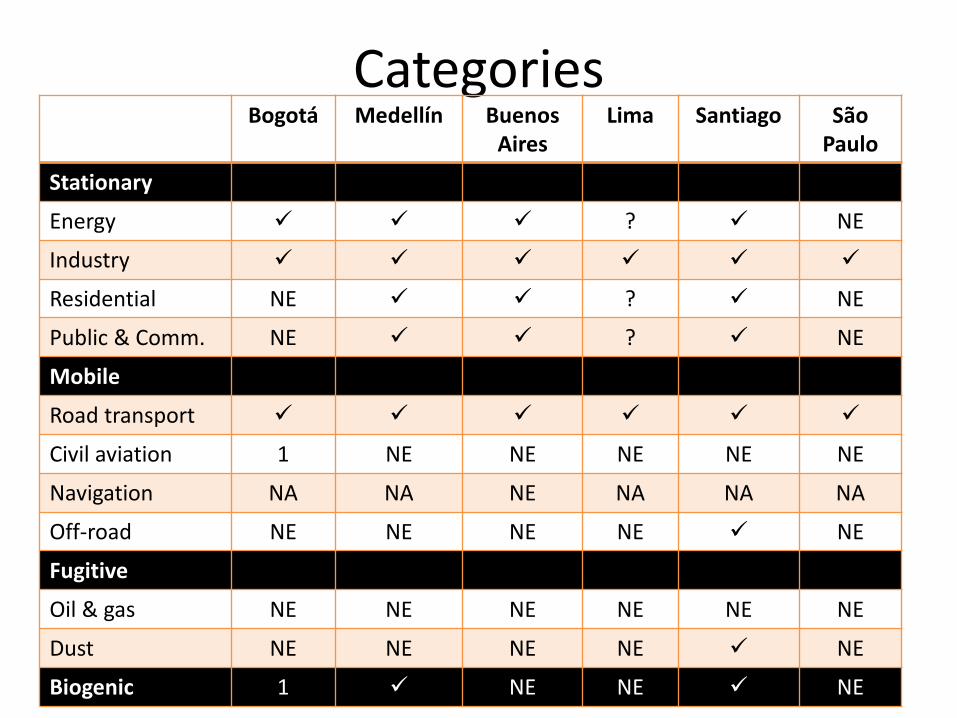
CategoriesBogotá Medellín Buenos
AiresLima Santiago São
Paulo
Stationary
Energy ? NE
Industry
Residential NE ? NE
Public & Comm. NE ? NE
Mobile
Road transport
Civil aviation 1 NE NE NE NE NE
Navigation NA NA NE NA NA NA
Off-road NE NE NE NE NE
Fugitive
Oil & gas NE NE NE NE NE NE
Dust NE NE NE NE NE
Biogenic 1 NE NE NE
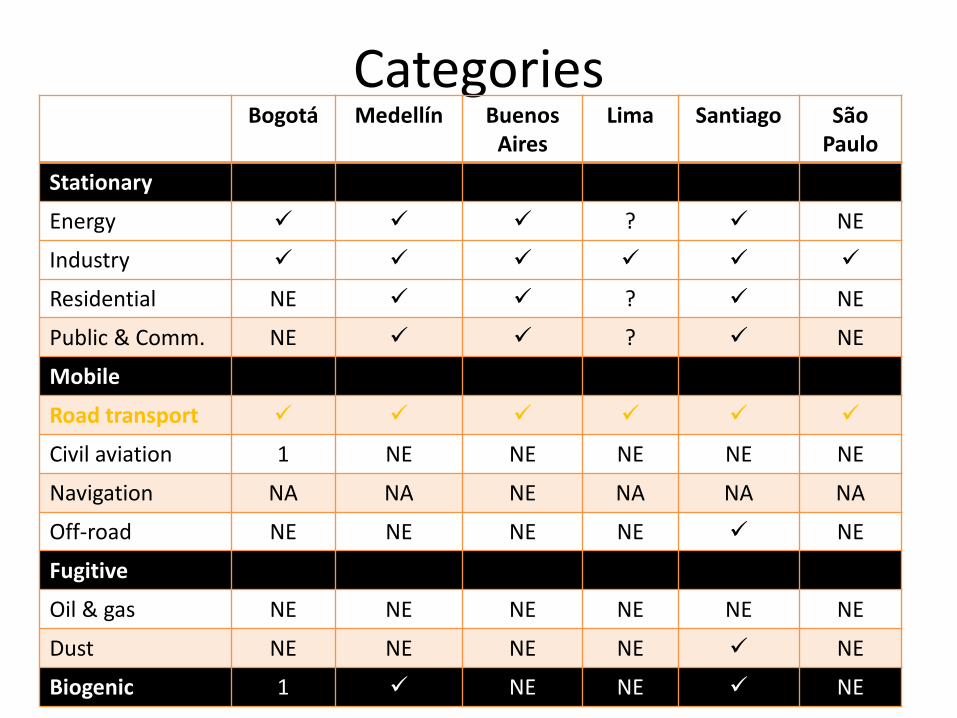

0
1
2
3
4
5
6
7
8
9
10
1990
1991
1992
1993
1994
1995
1996
1997
1998
1999
2000
2001
2002
2003
2004
2005
2006
0
50
100
150
200
250
300
1990
1991
1992
1993
1994
1995
1996
1997
1998
1999
2000
2001
2002
2003
2004
2005
2006
0
500
1000
1500
2000
2500
1990
1991
1992
1993
1994
1995
1996
1997
1998
1999
2000
2001
2002
2003
2004
2005
2006
0
20
40
60
80
100
120
140
160
1990
1991
1992
1993
1994
1995
1996
1997
1998
1999
2000
2001
2002
2003
2004
2005
2006
Megacities emissionsBuenos Aires - NOx
Buenos Aires - VOC Buenos Aires - PM10
Stationary sources Road transportation
Buenos Aires - CO
0
5
10
15
20
25
1990
1991
1992
1993
1994
1995
1996
1997
1998
1999
2000
2001
2002
2003
2004
2005
2006
Buenos Aires - SO2
PE: pre-euro vehicles (older)EU: euro (news)

0
1
2
3
4
5
6
7
8
9
10
1990
1991
1992
1993
1994
1995
1996
1997
1998
1999
2000
2001
2002
2003
2004
2005
2006
0
5
10
15
20
25
1990
1991
1992
1993
1994
1995
1996
1997
1998
1999
2000
2001
2002
2003
2004
2005
2006
0
50
100
150
200
250
300
1990
1991
1992
1993
1994
1995
1996
1997
1998
1999
2000
2001
2002
2003
2004
2005
2006
0
500
1000
1500
2000
2500
1990
1991
1992
1993
1994
1995
1996
1997
1998
1999
2000
2001
2002
2003
2004
2005
2006
0
20
40
60
80
100
120
140
160
1990
1991
1992
1993
1994
1995
1996
1997
1998
1999
2000
2001
2002
2003
2004
2005
2006
Buenos Aires - NOx
Buenos Aires - VOC Buenos Aires - SO2Buenos Aires - PM10
Stationary sources Road transportation
Buenos Aires - CO
0
5
10
15
20
25
30
35
1998
1999
2000
2001
2002
2003
2004
2005
2006
2007
2008
2009
2010
0
20
40
60
80
100
120
140
160
180
1998
1999
2000
2001
2002
2003
2004
2005
2006
2007
2008
2009
2010
Medellín- CO
Medellín- VOCs
Megacities emissions

Argentina: National emissions from fuel combustion
• Net heating value: country specific, variable
• NOx emission factors: country specific for electricity generation
• Emission factors: 1996 IPCC Guidelines
.ar

0
20000
40000
60000
80000
100000
120000
140000
1970
1972
1974
1976
1978
1980
1982
1984
1986
1988
1990
1992
1994
1996
1998
2000
2002
2004
2006
CO2
(Gg)
Stationary Sources - Biogenic Fuels Stationary souces - Solid FuelsMobile Sources - Compress Natural Gas Mobile Sources - Liquid FuelsStationary Sources - Natural Gas Stationary Sources - Liquid Fuels
Country and MABA CO2 emissions
0
20
40
60
80
100
120
140
160
180
0
100
200
300
400
500
60019
70
1972
1974
1976
1978
1980
1982
1984
1986
1988
1990
1992
1994
1996
1998
2000
2002
2004
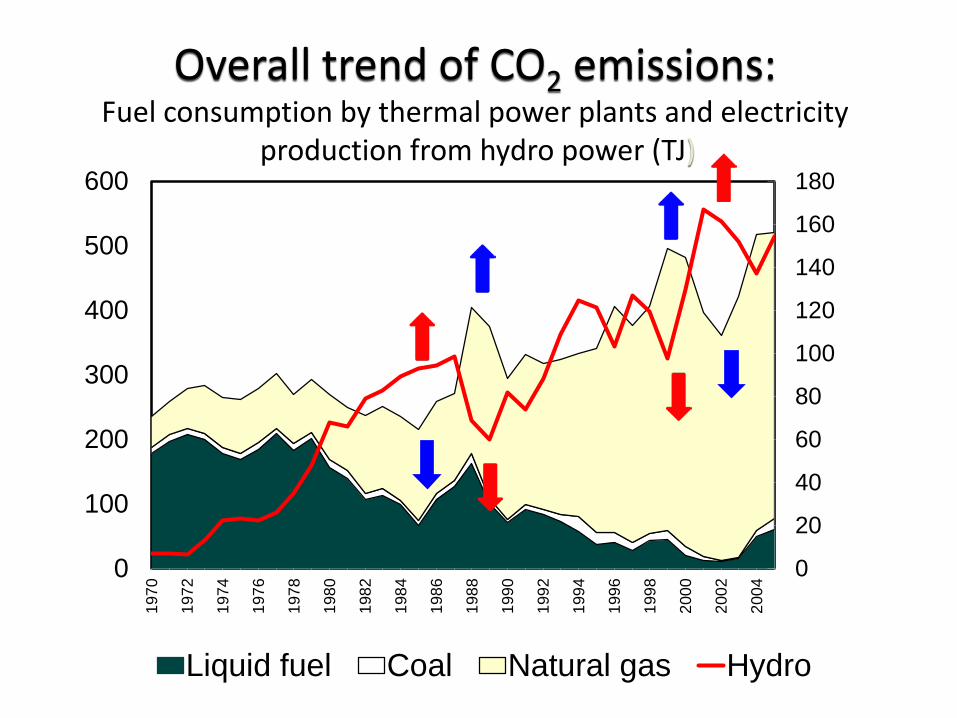
Liquid fuel Coal Natural gas Hydro
Overall trend of CO2 emissions:Fuel consumption by thermal power plants and electricity
production from hydro power (TJ)

National and local emission estimates: Buenos Aires and the rest of Argentina
0
10
20
30
40
50
60
70
80
90
100
0%
10%
20%
30%
40%
50%
60%
70%
80%
90%
100%19
7019
7119
7219
7319
7419
7519
7619
7719
7819
7919
8019
8119
8219
8319
8419
8519
8619
8719
8819
8919
9019
9119
9219
9319
9419
9519
9619
9719
9819
9920
0020
0120
0220
0320
0420
0520
06
SO2 Gg
Buenos Aires
Argentina Stationary
Buenos Aires
Argentina On-road
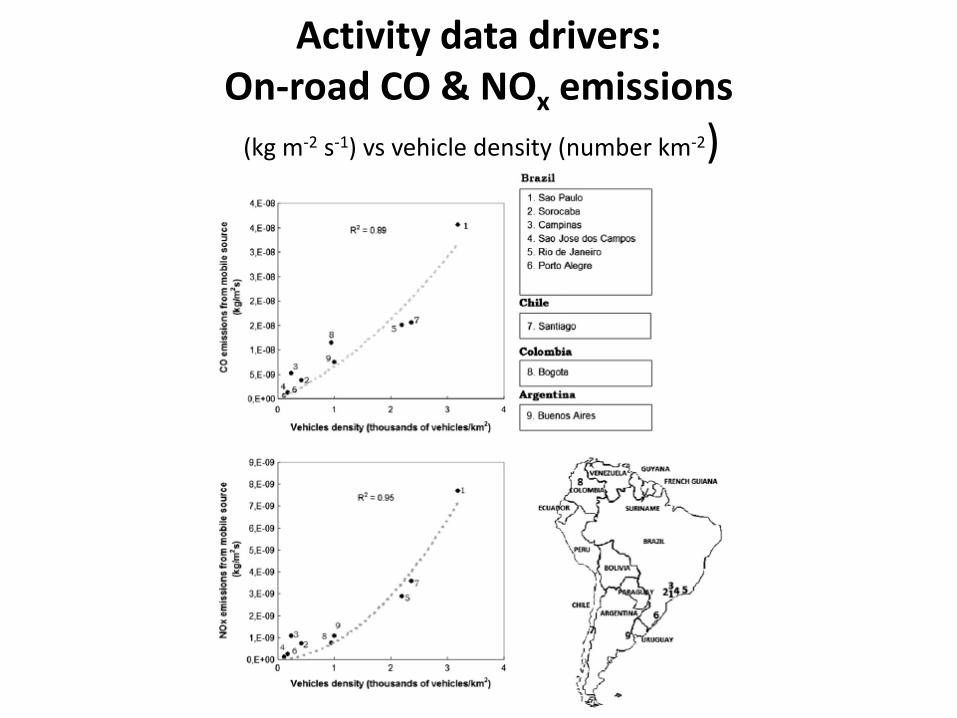
Activity data drivers:On-road CO & NOx emissions
(kg m-2 s-1) vs vehicle density (number km-2)
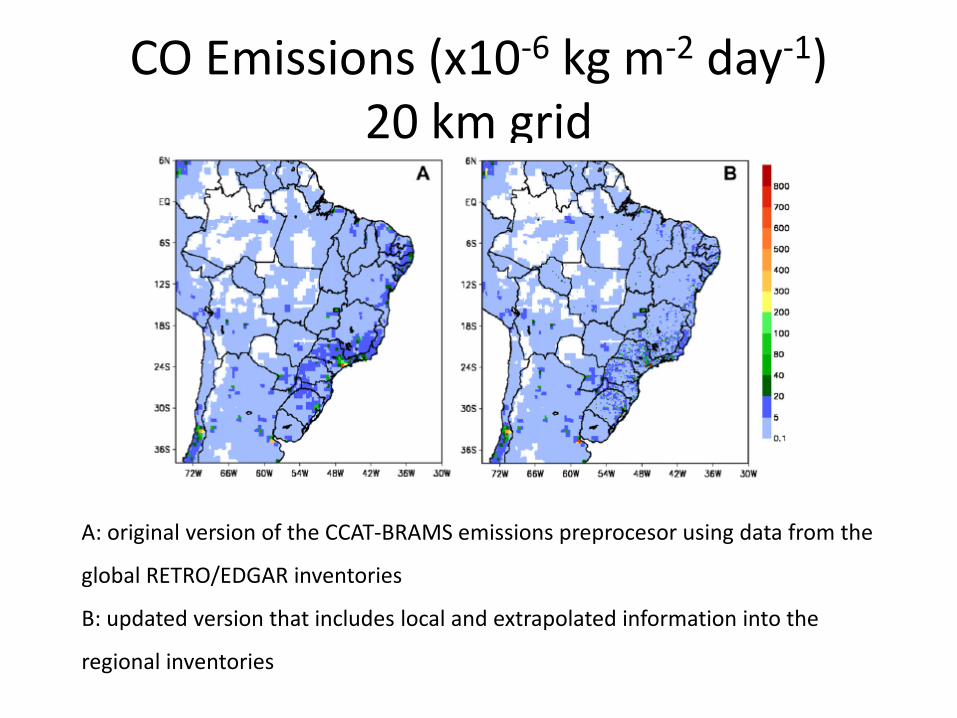
CO Emissions (x10-6 kg m-2 day-1)20 km grid
A: original version of the CCAT-BRAMS emissions preprocesor using data from the
global RETRO/EDGAR inventories
B: updated version that includes local and extrapolated information into the
regional inventories
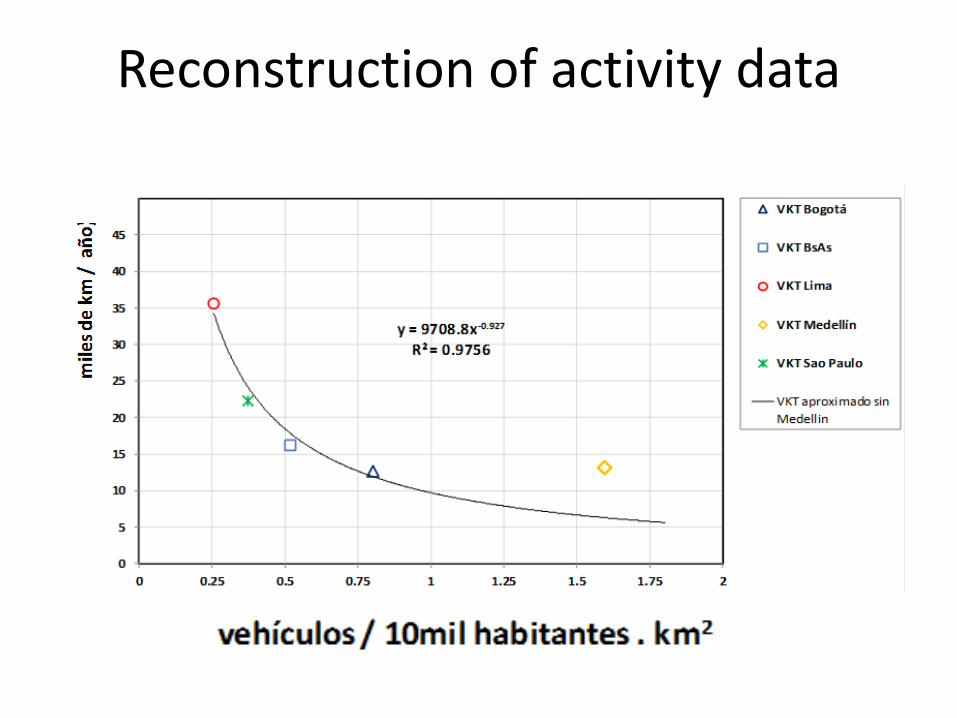
Reconstruction of activity data

Improving global BB emission estimations3BEM regional model - Similar approach GFED
Longo et al, Atmos. Chem. Phys, 2010
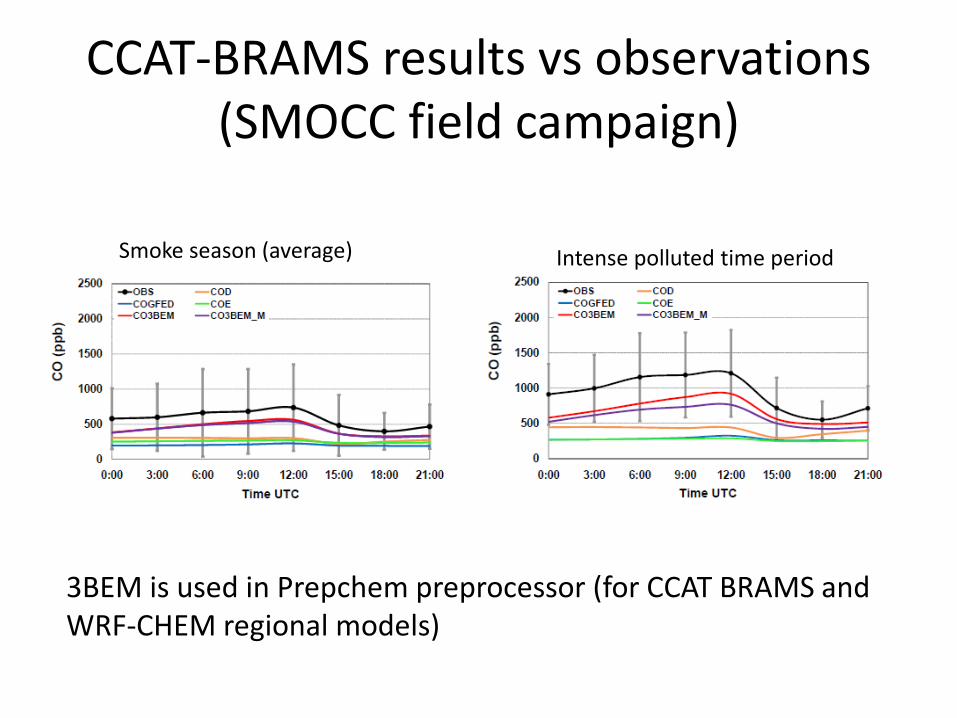
CCAT-BRAMS results vs observations(SMOCC field campaign)
Intense polluted time periodSmoke season (average)
3BEM is used in Prepchem preprocessor (for CCAT BRAMS and WRF-CHEM regional models)

Evaluation of on-road vehicle emission inventories for CO and NOx for Bogotá, Buenos
Aires, Santiago, and São Paulo
L. Gallardo et al., Atmos Environ, 47 (2012) 12–19
Inventories for 2005 and 2007 exhibited CO/NOx ratios fairly consistent with observed trend. This consistency was not kept when evaluating total CO and NOxemissions.
None of the emission inventories is able to reproduce the observed CO/NOx molar ratios for Santiago.Potential overestimation of NOx emissions by a factor of 2-3

Estimating prospective emissions for Brazil (2011-2030)
• National fuel consumption projections: using the supply-demand model
MESSAGE (model for energy supply strategy alternatives and their
environmental impacts)
• Vehicular fleet: using the estimated fuel consumption, the relationship
between the Brazilian vehicular fleet and GDP and other considerations
regarding share of biofuels and natural gas conversion
• National emissions: considering the implementation of the PROCONVE
program relative to emission reductions from road transportation
• Regional emissions
M.F. Alonso. Previsão de tempo químico para a América do Sul: impacto relativo das emissões urbanas nas escalas loca e regional. Tese de Doutorado, INPE, Sao José dos Campos (2011)

On roal vehiclesProjected national emissions for Brazil
(2003 – 2035) NOx
VOC
CO
Gasoline to Biofuel
Emission reductionprogram(PROCONVE)

Regional emissions for COV and NOX in 2007 and 2030 (kk m-2 y-1)
NOx
VOC

Commited electricity genertion in Buenos Aires- Power plants
End of life of oneSteam turbine
Revamping of a steam turbine
Maximum power of all units
All the units after a revamping
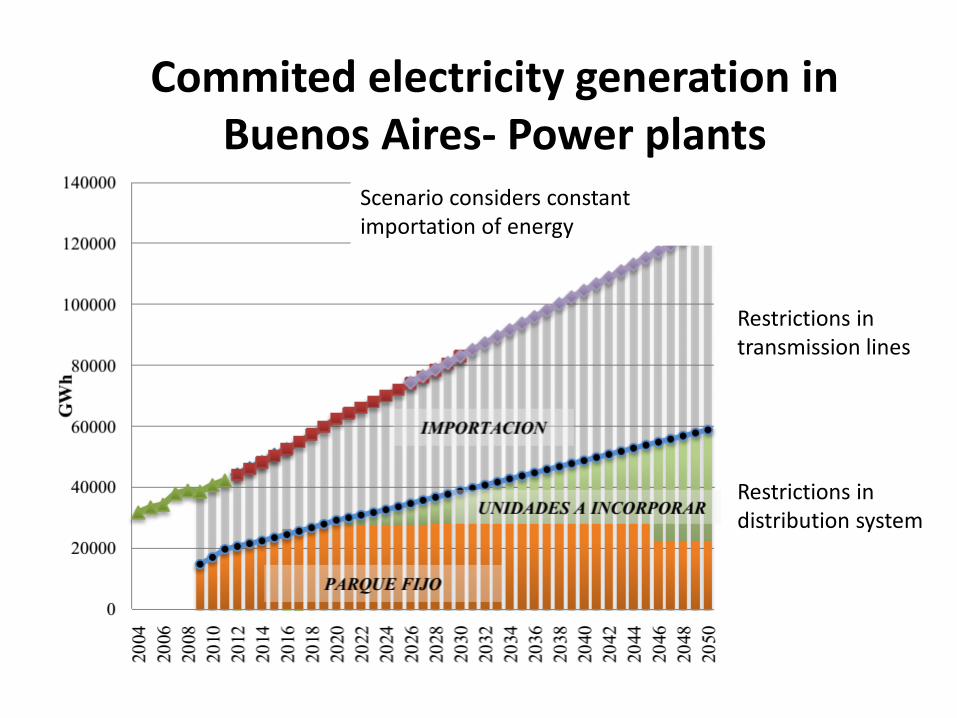
Commited electricity generation in Buenos Aires- Power plants
Scenario considers constantimportation of energy
Restrictions in transmission lines
Restrictions in distribution system
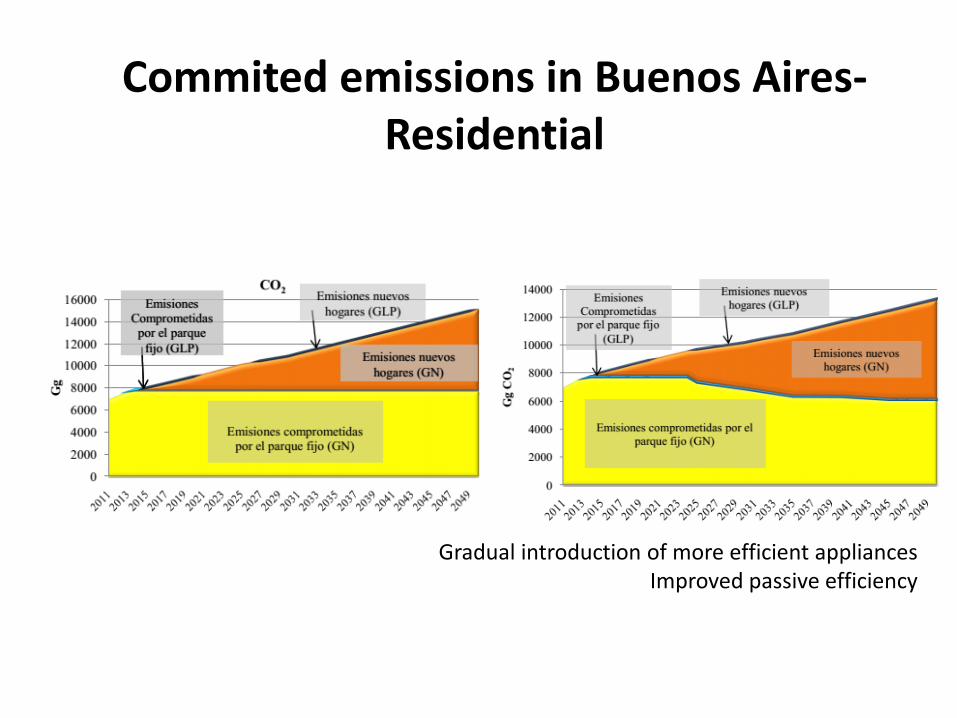
Commited emissions in Buenos Aires-Residential
Gradual introduction of more efficient appliancesImproved passive efficiency

South America BC emissions (ACCMIP)
0
0.1
0.2
0.3
0.4
0.5
0.619
97
1998
1999
2000
2001
2002
2003
2004
2005
2006
2007
2008
2009
2010
2011
2012
2013
Tg/y
ear
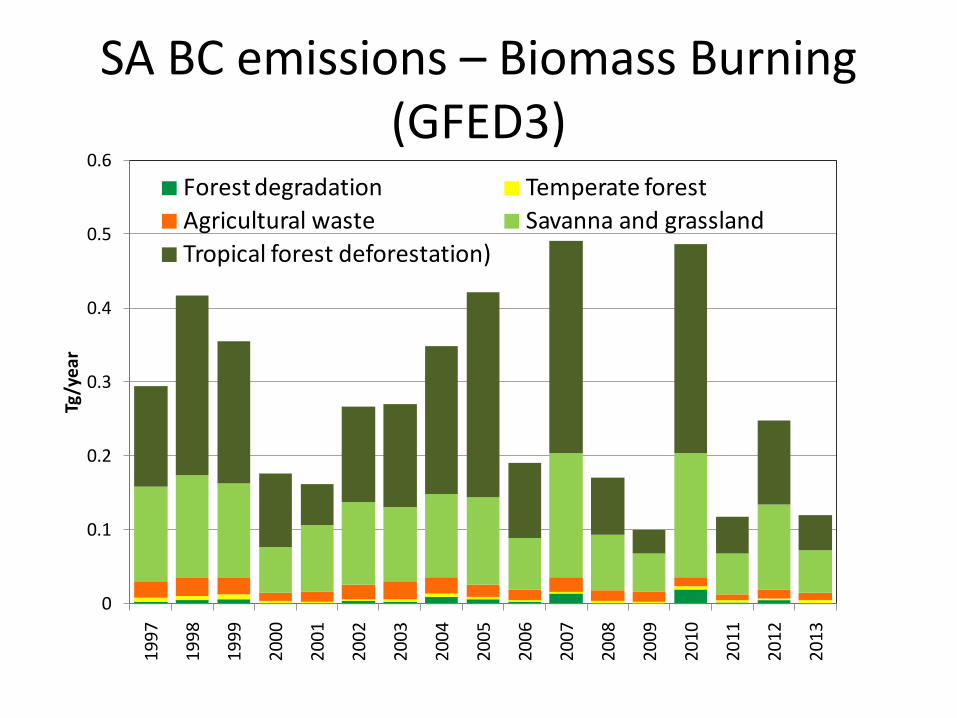
Forest degradation Temperate forestAgricultural waste Savanna and grasslandTropical forest deforestation)
SA BC emissions – Biomass Burning(GFED3)
0
10000
20000
30000
0
0.1
0.2
0.3
2000 2001 2002 2003 2004 2005 2006 2007 2008 2009 2010 2011
Defo
rest
atio
n (k
m2
year
-1)
BC e
mis
sion
s (Tg
yea
r-1)
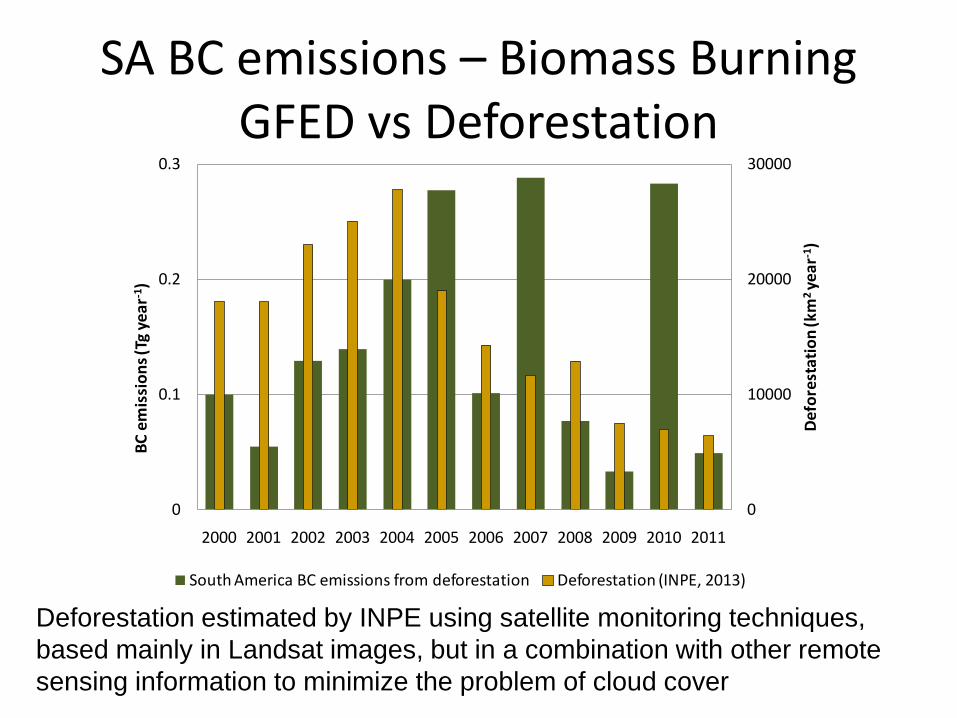
South America BC emissions from deforestation Deforestation (INPE, 2013)
SA BC emissions – Biomass BurningGFED vs Deforestation
Deforestation estimated by INPE using satellite monitoring techniques, based mainly in Landsat images, but in a combination with other remote sensing information to minimize the problem of cloud cover

Final remarks• Adequate level of expertise for the development of
national and local emission inventories
• Local inventories are generally incomplete and reported with different degrees of transparency (documentation, uncertainties)
• Ample space for “reconciliations”
– Interaction between inventory communities
– Different objectives and uses of policy oriented and scientific inventories
– Validation and verification