
daiwa_carbonforecasts_2008
28
★ FOR IMPORTANT COMPANY DISCLOSURE INFORMATION, PLEASE GO TO http://www.daiwausa.com/report_disclosure.html Carbon Report 1 European Equity Research Industry Report 8 December 2008 (No. of pages: 28) Utilities Carbon forecasts – ETS supply / demand and price forecasts to 2020 Equity Research Dept Ashley Thomas Summary Delegates from 190 countries will meet during December to discuss combating climate change at the UN COP14 meeting in Poznan (1-12 Dec), with EU members meeting separately at the Environment Council (4-5 Dec) and EU Summit in Brussels (11-12 De c). Given the change in priorities since the economic slowdown we do not expect any material progress at these meetings with regard to firm commitments for CO2 reduction targets. The balance of evidence suggests a significant human influence on climate change. Over the medium term we expect an increasing emphasis on emission reduction, however in the short term budgetary control and corporate wellbeing are likely to take precedence. The Kyoto Protocol has been ratified by countries representing only about 30% of the world’s greenhouse gas (GHG) emissions and does not include China and the US, the world’s two largest emitters. Even for those that have ratified the treaty, currently around half of the countries are scheduled to miss their 2012 emission reduction targets. The EU Emission Trading Scheme (ETS) r epresents installations accounting for less than 10% of global GHG. Although scheme wide 2012 targets should be achieved, there is significant individual country divergence and a large proportion of the emission reduction will be achieved through international offset schemes and the decline of Eastern European output in the 1990s. The recessionary impact in Europe is likely to result in lower domestic emissions and a shift in emphasis to less costly international offsets. We see the Phase II EU ETS scheme as being oversupplied by over 800mt of allowances and the shortfall during 2008-2020 being only 73mt per annum – small enough to be met through fuel switching and other low cost abatement. We believe the international price of carbon will remain relatively low, restraining the price within the EU ETS. CER prices could decline as international competition for the supply of credits widens outside of China. Whilst we are likely to see emission targets and trading schemes from the US, Canada, Australia and New Zealand, all of these countries have less onerous reduction targets and suggested carbon price caps below current EUA trading levels. We forecast a 2012 EUA price of €16/tonne rising to €25/tonne in 2020, both below consensus.
-
Upload
sachinbabu8 -
Category
Documents
-
view
215 -
download
0
Transcript of daiwa_carbonforecasts_2008
8/3/2019 daiwa_carbonforecasts_2008
http://slidepdf.com/reader/full/daiwacarbonforecasts2008 1/28
★ FOR IMPORTANT COMPANY DISCLOSURE INFORMATION, PLEASE GO TO
http://www.daiwausa.com/report_disclosure.html Carbon Report 1
European EquityResearch
Industry Report
8 December 2008 (No. of pages: 28)
Utilities
Carbon forecasts – ETS supply / demand and price forecasts to 2020
Equity Research Dept
Ashley Thomas
Summary
Delegates from 190 countries will meet during December to discuss combating climate change
at the UN COP14 meeting in Poznan (1-12 Dec), with EU members meeting separately at theEnvironment Council (4-5 Dec) and EU Summit in Brussels (11-12 Dec). Given the change inpriorities since the economic slowdown we do not expect any material progress at thesemeetings with regard to firm commitments for CO2 reduction targets.
The balance of evidence suggests a significant human influence on climate change. Over themedium term we expect an increasing emphasis on emission reduction, however in the shortterm budgetary control and corporate wellbeing are likely to take precedence.
The Kyoto Protocol has been ratified by countries representing only about 30% of the world’s
greenhouse gas (GHG) emissions and does not include China and the US, the world’s twolargest emitters. Even for those that have ratified the treaty, currently around half of thecountries are scheduled to miss their 2012 emission reduction targets.
The EU Emission Trading Scheme (ETS) represents installations accounting for less than 10%of global GHG. Although scheme wide 2012 targets should be achieved, there is significantindividual country divergence and a large proportion of the emission reduction will be achievedthrough international offset schemes and the decline of Eastern European output in the 1990s.
The recessionary impact in Europe is likely to result in lower domestic emissions and a shift in
emphasis to less costly international offsets. We see the Phase II EU ETS scheme as beingoversupplied by over 800mt of allowances and the shortfall during 2008-2020 being only 73mtper annum – small enough to be met through fuel switching and other low cost abatement.
We believe the international price of carbon will remain relatively low, restraining the pricewithin the EU ETS. CER prices could decline as international competition for the supply ofcredits widens outside of China. Whilst we are likely to see emission targets and tradingschemes from the US, Canada, Australia and New Zealand, all of these countries have lessonerous reduction targets and suggested carbon price caps below current EUA trading levels.
We forecast a 2012 EUA price of €16/tonne rising to €25/tonne in 2020, both below consensus.

8/3/2019 daiwa_carbonforecasts_2008
http://slidepdf.com/reader/full/daiwacarbonforecasts2008 2/28
Contents
Summary Page 3
Evidence of climate change Page 4
Kyoto Protocol Page 6
EU emission targets Page 8
EU ETS carbon trading scheme Page 10
EU ETS emission forecasts Page 14
EU ETS use of offset mechanisms Page 15
Phase II CER/ERU supply Page 16
EUA, CER and ERU pricing trends Page 19
Non-Kyoto power sector abatement costs Page 20
Post Kyoto and International targets Page 22
Carbon Report 2

8/3/2019 daiwa_carbonforecasts_2008
http://slidepdf.com/reader/full/daiwacarbonforecasts2008 3/28
Carbon Report 3
Carbon – not immune to recession
Summary
We have forecast EU ETS supply and demand to 2020 taking into account the likelyimpact on emissions as a result of economic sensitivity, the slowdown in renewable
investment and the supply of international offset credits.
We estimate that during Phase II (2008-2012) of the EU ETS a surplus of over 800mtof allowances will be built up. With emission allowance shortfalls largely met byCertified Emission Reductions (CER) or Emission Reduction Units (ERU), we believethe EUA price will trade at a tight spread with the CER price, which itself may comeunder pressure. We forecast a 2012 EU Emission Allowance (EUA) price of €16/tonne.
During Phase III (2013-2020) forecast emissions exceed allowances and additionalabatement will be required. However for the cumulative period 2008-2020 we estimatethis shortfall amounts to just 73mt per annum, which we believe can be met throughsummer fuel switching or other low cost (<€25/tonne) abatement techniques. We
forecast a 2020 EUA price of €25/tonne in 2020.
On balance we see downside risk to our demand forecasts given the potential foreconomic conditions to deteriorate further or nuclear lifetimes to be extended.
We plot below our carbon price forecasts to 2020 against current futures prices forEUAs and CERs and their future path based on a 4% cost of carry (given the scope tocarry forward allowances into Phase III).
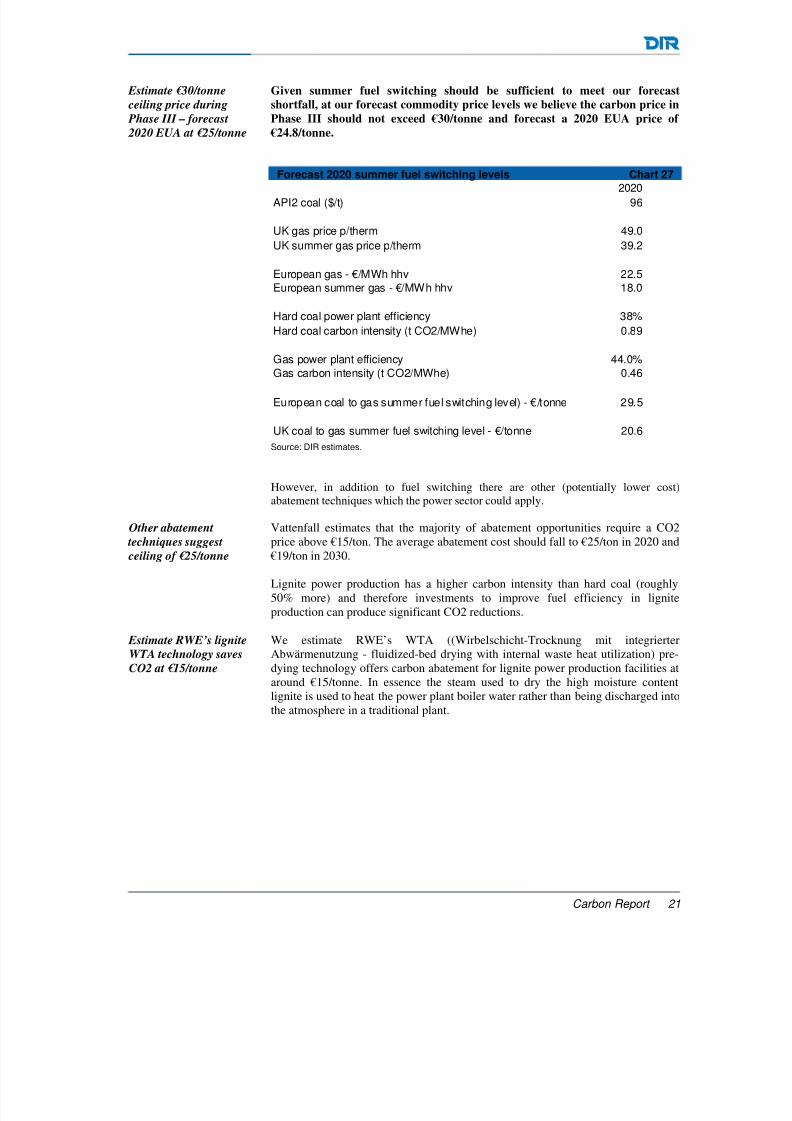
Forecast EUA price vs futures and implied EUA and CER prices Chart 1
10
12
14
16
18
20
22
24
26
28
30
2 0 0 8
2 0 0 9
2 0 1 0
2 0 1 1
2 0 1 2
2 0 1 3
2 0 1 4
2 0 1 5
2 0 1 6
2 0 1 7
2 0 1 8
2 0 1 9
2 0 2 0
€ / t o n n e
CER CER implied EUA EUA implied DIR EUA
Source: DIR, ECX ICE, Bloomberg.
Our forecasts are based on the following DIR commodity price assumptions:
DIR commodity price forecasts Chart 22007 2008 2009 2010 2011 2012 2013 2014 2015 2016 2017 2018 2019 2020
Oil Price ($/bbl) 73 99 67 87 102 100 100 100 100 100 100 100 100 100
API2 Coal price ($/t) 89 140 105 105 105 96 96 96 96 96 96 96 96 96
UK Gas price (p/therm) 30 62 55 50 50 49 49 49 49 49 49 49 49 49
European Gas hhv price (€/MWh) 21 28 25 23 23 23 23 23 23 23 23 23 23 22
ETS CO2 certificates 19 22 13 14 15 16 17 19 20 21 22 23 24 25
UK Summer fuel switching level - coal to gas (€/t) 7 36 26 18 18 22 22 22 21 21 21 21 21 21
European summer fuel switching level - coal to gas (€/t) 36 41 36 26 27 31 31 30 30 31 31 31 31 29 Source: DIR
8/3/2019 daiwa_carbonforecasts_2008
http://slidepdf.com/reader/full/daiwacarbonforecasts2008 4/28
Greenhouse gases, global warming and sea levels
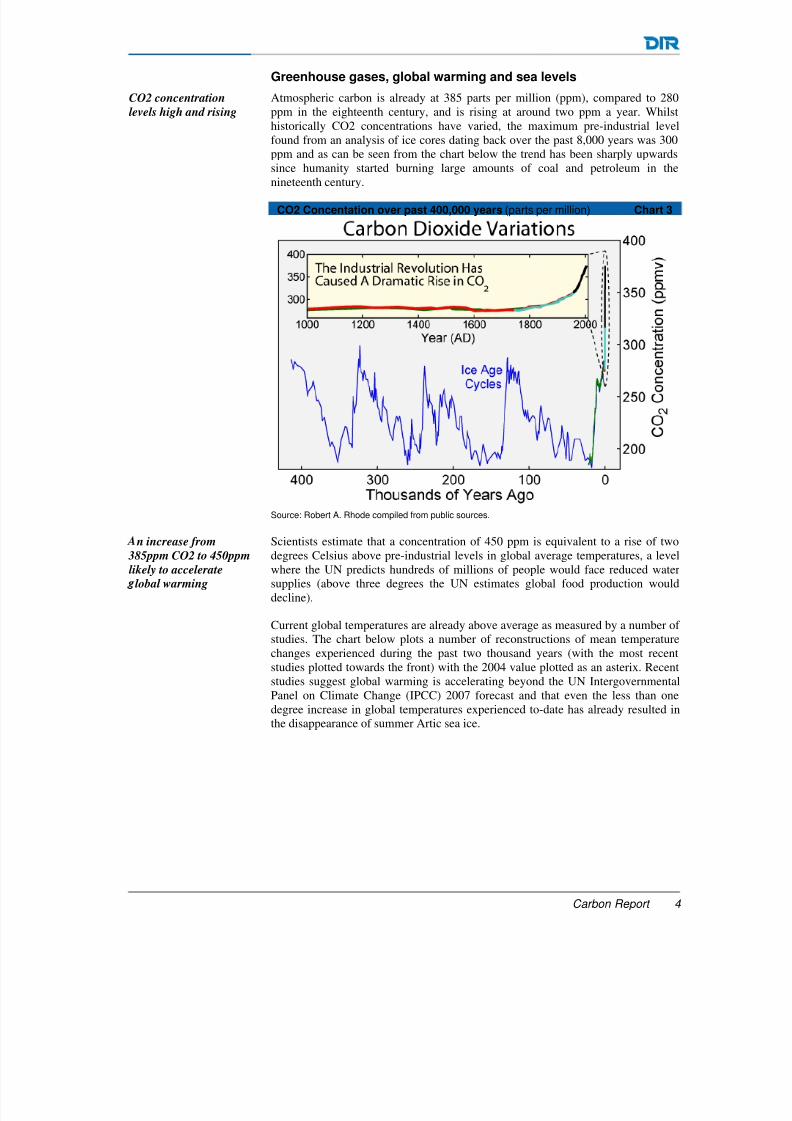
CO2 concentration
levels high and rising
Atmospheric carbon is already at 385 parts per million (ppm), compared to 280ppm in the eighteenth century, and is rising at around two ppm a year. Whilsthistorically CO2 concentrations have varied, the maximum pre-industrial levelfound from an analysis of ice cores dating back over the past 8,000 years was 300ppm and as can be seen from the chart below the trend has been sharply upwards
since humanity started burning large amounts of coal and petroleum in thenineteenth century.
CO2 Concentation over past 400,000 years (parts per million) Chart 3
Source: Robert A. Rhode compiled from public sources.
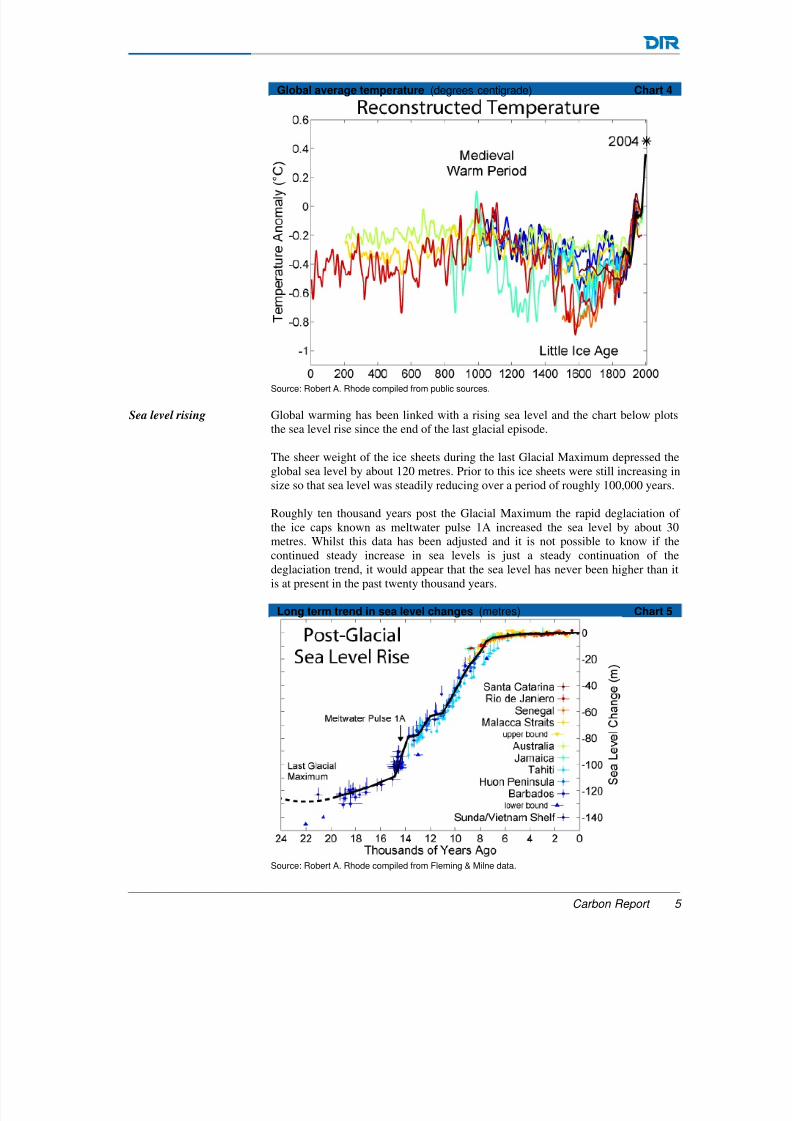
n increase from
385ppm CO2 to 450ppm
likely to accelerate
lobal warming
Scientists estimate that a concentration of 450 ppm is equivalent to a rise of twodegrees Celsius above pre-industrial levels in global average temperatures, a levelwhere the UN predicts hundreds of millions of people would face reduced watersupplies (above three degrees the UN estimates global food production woulddecline).
Current global temperatures are already above average as measured by a number of studies. The chart below plots a number of reconstructions of mean temperaturechanges experienced during the past two thousand years (with the most recentstudies plotted towards the front) with the 2004 value plotted as an asterix. Recentstudies suggest global warming is accelerating beyond the UN IntergovernmentalPanel on Climate Change (IPCC) 2007 forecast and that even the less than onedegree increase in global temperatures experienced to-date has already resulted inthe disappearance of summer Artic sea ice.
Carbon Report 4
8/3/2019 daiwa_carbonforecasts_2008
http://slidepdf.com/reader/full/daiwacarbonforecasts2008 5/28
Global average temperature (degrees centigrade) Chart 4
Source: Robert A. Rhode compiled from public sources.
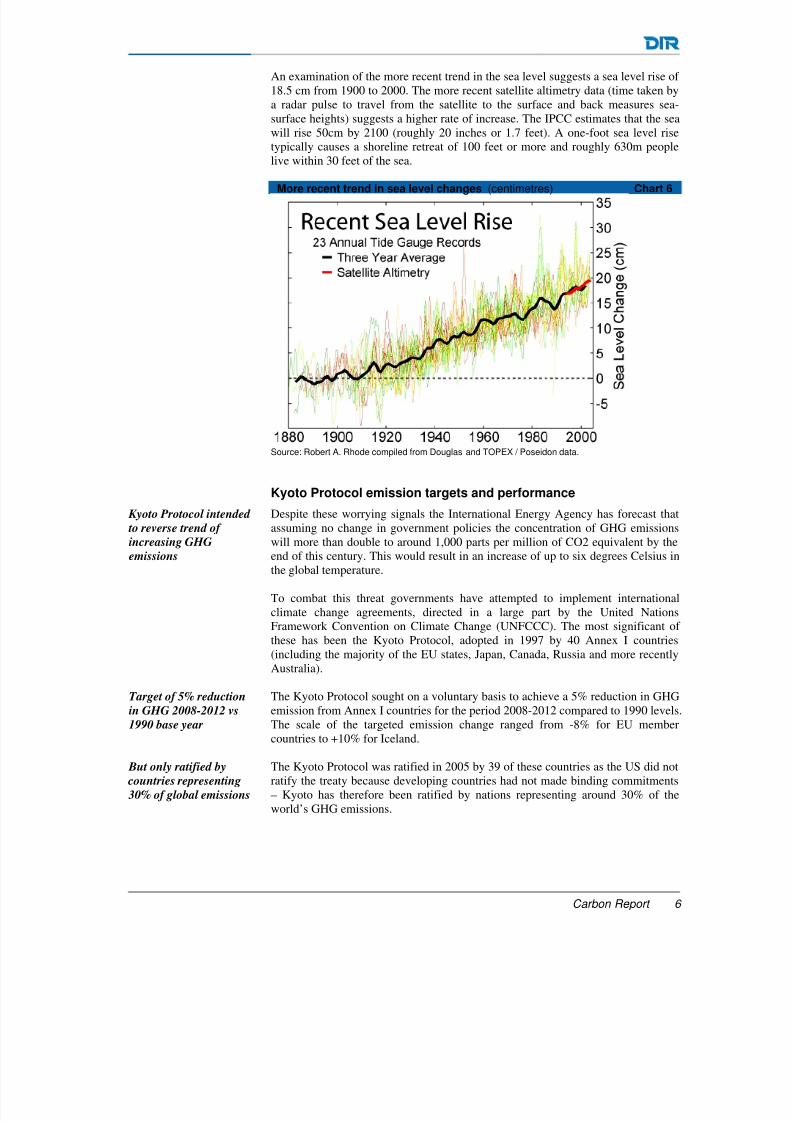
Sea level rising Global warming has been linked with a rising sea level and the chart below plotsthe sea level rise since the end of the last glacial episode.
The sheer weight of the ice sheets during the last Glacial Maximum depressed theglobal sea level by about 120 metres. Prior to this ice sheets were still increasing insize so that sea level was steadily reducing over a period of roughly 100,000 years.
Roughly ten thousand years post the Glacial Maximum the rapid deglaciation of the ice caps known as meltwater pulse 1A increased the sea level by about 30metres. Whilst this data has been adjusted and it is not possible to know if thecontinued steady increase in sea levels is just a steady continuation of thedeglaciation trend, it would appear that the sea level has never been higher than itis at present in the past twenty thousand years.
Long term trend in sea level changes (metres) Chart 5
Source: Robert A. Rhode compiled from Fleming & Milne data.
Carbon Report 5
8/3/2019 daiwa_carbonforecasts_2008
http://slidepdf.com/reader/full/daiwacarbonforecasts2008 6/28
An examination of the more recent trend in the sea level suggests a sea level rise of 18.5 cm from 1900 to 2000. The more recent satellite altimetry data (time taken bya radar pulse to travel from the satellite to the surface and back measures sea-surface heights) suggests a higher rate of increase. The IPCC estimates that the seawill rise 50cm by 2100 (roughly 20 inches or 1.7 feet). A one-foot sea level risetypically causes a shoreline retreat of 100 feet or more and roughly 630m people
live within 30 feet of the sea.
More recent trend in sea level changes (centimetres) Chart 6
Source: Robert A. Rhode compiled from Douglas and TOPEX / Poseidon data.
Kyoto Protocol emission targets and performance Kyoto Protocol intended
to reverse trend of
increasing GHG
emissions
Despite these worrying signals the International Energy Agency has forecast thatassuming no change in government policies the concentration of GHG emissionswill more than double to around 1,000 parts per million of CO2 equivalent by theend of this century. This would result in an increase of up to six degrees Celsius inthe global temperature.
To combat this threat governments have attempted to implement internationalclimate change agreements, directed in a large part by the United NationsFramework Convention on Climate Change (UNFCCC). The most significant of these has been the Kyoto Protocol, adopted in 1997 by 40 Annex I countries
(including the majority of the EU states, Japan, Canada, Russia and more recentlyAustralia).
Target of 5% reduction
in GHG 2008-2012 vs
1990 base year
The Kyoto Protocol sought on a voluntary basis to achieve a 5% reduction in GHGemission from Annex I countries for the period 2008-2012 compared to 1990 levels.The scale of the targeted emission change ranged from -8% for EU membercountries to +10% for Iceland.
But only ratified by
countries representing
30% of global emissions
The Kyoto Protocol was ratified in 2005 by 39 of these countries as the US did notratify the treaty because developing countries had not made binding commitments– Kyoto has therefore been ratified by nations representing around 30% of theworld’s GHG emissions.
Carbon Report 6

8/3/2019 daiwa_carbonforecasts_2008
http://slidepdf.com/reader/full/daiwacarbonforecasts2008 7/28
Carbon Report 7
Kyoto Protocol GHG Emission Targets 2008-2012 vs 1990 (%) Chart 7Target
(2008/2012 vs base year)EU15, Bulgaria, Czech, Estonia, Latvia,Liechtenstein, Lithuania, Monaco,Romania, Slovakia, Slovenia, Switzerland -8%US (not ratified) -7%Canada, Hungary, Japan, Poland -6%Croatia -5%New Zealand, Russian Federation, Ukraine 0%Norway 1%Australia 8%Iceland 10%
Source: UNFCCC; compiled by DIR.
The reductions are planned to be achieved through both domestic emission
reductions and (from 2008) through the use of international offset mechanismssuch as the purchase of Joint Initiative (JI) and Clean Development Mechanism(CDM) credits and the purchase of Annual Allowance Units (AAUs) bygovernments. Limits have been set as to the participation of JI/CDM credits on anational basis to ensure a focus on domestic emission reduction.
Overall, emissions in 2006 for the 41 Annex I countries (40 above including USplus Australia) decreased by 5% compared to 1990. This was driven by the 37%decline (-2,184mt CO2) in emissions from the Economies in Transition (EIT)countries, largely former Soviet Union states, whose energy intensive industriesdeclined post USSR dissolution in 1990. Emissions from the developed non-EITcountries rose by 10% (1,290mt CO2) during the period.
Emissions in 2006 were roughly level with 2005 but benefited from a warm winterin Northern Europe which reduced gas and electricity demand. Emissions between2000 and 2006 rose by 2.3%, driven by the former Soviet Union states whereemissions increased by 7.4% over this period.
Kyoto Protocol Annex I countries GHG emissions vs 1990 base (mt CO2 equivalent) Chart 8Annex I (GT 000) 1990 2000 2005 2006 2006 vs 1990 2006 vs 2000
Economies in Transition (EIT) 5.9 3.5 3.6 3.7 -37% 7%Non-EIT 13 14.2 14.4 14.3 10% 1%Total Annex I 18.9 17.7 18 18 -5% 2%
Source: UNFCCC; compiled by DIR.
As can be seen from the table below, roughly half of the countries that have ratifiedthe treaty are exceeding their Kyoto targets in 2006, including Canada (162mtover), Japan (154mt over), Spain (100mt over) and Italy (84mt over). Most of thesecountries have already indicated they will not meet their Kyoto targets.
Total targeted
reductions have been
achieved but only as a
result of cuts in Eastern
Europe during 1990s
Kyoto emissions during
2000-2006 rose by 2%,
with Eastern European
rowth of 7%
Half of the countries
that ratified Kyoto likely
to miss targets

8/3/2019 daiwa_carbonforecasts_2008
http://slidepdf.com/reader/full/daiwacarbonforecasts2008 8/28
Carbon Report 8
2006 emission levels compared to Kyoto targets (% vs 1990) Chart 9Change in 2006 emissions Emission reduction target
vs base year under Kyoto Protocol DifferenceSpain 50% 15% 35%Luxembourg 1% -28% 29%Austria 15% -13% 28%Canada 21% -6% 27%Liechtenstein 19% -8% 27%New Zealand 26% 0% 26%Denmark 2% -21% 23%Italy 10% -7% 16%Iceland 26% 10% 16%Finland 13% 0% 13%Ireland 26% 13% 13%Japan 6% -6% 12%Portugal 38% 27% 11%Slovenia 1% -8% 9%Switzerland 1% -8% 9%Norway 8% 1% 7%EC -3% -8% 5%Netherlands -3% -6% 3%Germany -19% -21% 3%Belgium -6% -8% 2%Greece 24% 25% -1%United Kingdom -16% -13% -3%France -4% 0% -4%Monaco -13% -8% -5%Sweden -9% 4% -13%Czech Republic -24% -8% -16%Poland -29% -6% -23%Slovakia -32% -8% -24%Hungary -32% -6% -26%Russian Federation -34% 0% -34%Romania -44% -8% -36%Bulgaria -46% -8% -38%Lithuania -53% -8% -45%Latvia -55% -8% -47%Estonia -56% -8% -48%Ukraine -52% 0% -52%
Australia NA 8% NABelarus NA -8% NACroatia NA -5% NA Source: UNFCCC; compiled by DIR.
The countries that are significantly below their Kyoto limits are dominated by theformer Soviet Union states and include Russia (1,100mt) and Ukraine (477mt).
These countries are most likely to sell surplus Assigned Amount Units (AAUs) toother Annex B governments, although Russia may wait until post 2012 to makesuch disposals. To counter criticisms of “hot air” sales, the proceeds from AAUsales are ring-fenced into Green Investment Schemes (GISs) which are then used tofund energy efficiency projects.
EU emission targets to 2012 and performance to-date
Against the target of an 8% reduction in GHG emissions compared to 1990, 2006EU15 GHG emissions reduced by approximately 3% from the base-date, as can beseen from the chart below.
EU 15 GHG emissions 1990-2006 (mt CO2 equivalent) Chart 10
Source: European Environment Agency; compiled by DIR.
Eastern European states
have significant excess
allowances which they may sell to other
overnments
EU15 emissions -3% in
2006 vs target of -8%

8/3/2019 daiwa_carbonforecasts_2008
http://slidepdf.com/reader/full/daiwacarbonforecasts2008 9/28
Carbon Report 9
However there has been a significant divergence within the individual countryperformance and a significant component of the EU15 reduction has been achievedthrough the reduction in German (East Germany industry declined postreunification in 1990) and UK emissions (shift from coal to gas production andmanufacturing closure). Whilst emissions in 2006 from Germany and UK have
declined by 18% and 16% respectively compared to 1990, total emissions from theremaining EU15 members have increased by 11%.
Total EU27 GHG emissions in 2006 fell by 8% compared to 1990, largely as aresult of the 24% decline in emissions from the 12 new member states (EasternEuropean decline as described earlier).
EU27 GHG emissions vs 1990 base (mt CO2 equivalent) Chart 11tCO2 m 1990 2005 % vs 1990 2006 % vs 1990EU15 (excluding Germany and UK) 2257 2558 13% 2494 11%Germany and UK 2009 1652 -18% 1657 -18%EU 15 4266 4210 -1% 4151 -3%
EU 12 1307 1028 -21% 992 -24%EU 27 5572 5238 -6% 5143 -8%
Source: European Environment Agency; compiled by DIR.
The following table details individual EU27 base year emissions, their Kyoto target(where applicable) and the European Environment Agency (EEA) forecasts for2010 emissions (proxy for average of 2008-2012) based on: existing policies;governmental use of Kyoto Mechanisms (international offset schemes such asJI/CDM); the use of carbon sinks (e.g. additional forestation) and the use of additional carbon measures that have been announced but not yet implemented.
EU27 GHG emission forecasts (mt CO2 equivalent) Chart 122010 change vs base year 2010 change vs base year 2010 change vs base year 2010 change vs base year 2010 change vs base yearCountry Base Year Emissions Kyoto target with existing policies with Kyoto Mechanisms with Carbon Sinks with Additional Measures Total
MtCO2 %Austria 79 -13% 17% -11% -1% -18% -13%Belgium 146 -8% -4% -5% 0% -9%Bulgaria 133 -8% -30% -5% -35%Cyprus 6 NA 44% -3% 41%Czech Republic 194 -8% -25% -1% -3% -29%Denmark 69 -21% -2% -6% -3% 0% -12%Estonia 43 -8% -63% -3% -66%Finland 71 0% 20% -2% -1% -17% 0%France 564 0% 1% -1% -4% -4%Germany 1,232 -21% -23% 0% -3% -26%Greece 107 25% 24% -1% -2% 21%Hungary 115 -6% -25% -1% -25%Ireland 56 13% 23% -7% -4% 0% 12%Italy 517 -7% 8% -4% -5% -3% -5%Latvia 26 -8% -46% 0% -46%Lithuania 49 -8% -30% 0% -30%Luxembourg 13 -28% 3% -30% -1% -28%Malta 2 NA 62% 0% 62%Netherlands 213 -6% -2% -6% 0% 0% -8%Poland 563 -6% -28% -1% 0% -29%Portugal 60 27% 44% -10% -8% -4% 23%Romania 278 -8% -31% -4% -35%Slovakia 72 -8% -18% -3% -22%Slovenia 20 -8% 7% -3% -8% -9% -13%Spain 290 15% 52% -20% -2% -10% 21%Sweden 72 4% -3% -3% 0% -6%UK 776 -13% -19% -1% 0% -20%EU-15 4,266 -8% -4% -3% -1% -3% -11%EU-27 5,572 NA -7% NA NA -3% -10%
Source: European Environment Agency; compiled by DIR.
Whilst not every EU27 member has adopted the Kyoto Protocol, the expected 10%reduction in emissions by 2010 would be significantly better than a combined
target (EU -8%, Poland -6%, Croatia -5%, Russia & Ukraine 0%).
Overall the EU15 should be on target to achieve the 2008-2012 target of an 8%reduction, but only because roughly half of the emissions reduction is likely to be
Germany / UK emissions
down 18%/ 16%
respectively. Other EU15
countries +11%
EU27 on track to
achieve 2008-2012
targets
EU15 to achieve targets
through use of internal
offsets
8/3/2019 daiwa_carbonforecasts_2008
http://slidepdf.com/reader/full/daiwacarbonforecasts2008 10/28
derived from governmental and private sector use of international offset credits(JI/CDM), in line with the maximum JI/CDM cap set by the EU. In addition, thedivergence of performance is likely to result in countries such as Finland, France,Germany, Sweden and the UK outperforming their targets whilst countries such asDenmark, Italy, Netherlands and Spain are likely to underperform.
EU emission targets to 2020 and beyond 20% reduction in EU
emissions targeted for
2020 and targets on
energy efficiency and
renewables
In March 2007 the EU adopted more stringent targets for carbon reductions by2020. The Integrated Energy and Climate Change package (dubbed “20/20/20 by2020”) is targeting a 20% reduction in GHG emissions vs 1990 levels, an increasein energy efficiency of 20% and an increase in the share of renewable energy to atleast 20% by the year 2020.
We expect EU ETS
emissions target to be
missed with 2,025mt
CO2 forecast for 2020 vs
1,720mt target
With regard to emissions, the 2020 target equates to a 14% reduction in emissionscompared to 2005. This is split between a 19% reduction (to 1,720mt by 2020 or anaverage of 1,847mt 2012-2020) for EU ETS compared to 2005 and a 10%reduction for non-ETS sectors compared to 2005. We forecast that the EU ETStarget will be missed with 2,052mt tonnes forecast for 2020 and average of 2,079mt forecast for 2012-2020.
We expect energy
efficiency target to be
missed
Member states are also behind schedule with regard to the energy efficiency target.The EU estimates that measures already adopted by the EU should achieve energysaving of only 13% by 2020.
We expect renewables
target to be missed
The renewable target is also likely to be missed as we estimate renewableelectricity will contribute around 25% of total electricity by 2020, lower than the40% required to meet the 20% renewable energy target by 2020.
Targets would tighten in
event of international accord but we view this
as unlikely
In the event of a global agreement by other developed countries (e.g. the US) to
make comparable emission reduction targets and for developing countries (e.g.China) to also contribute (extent unquantified) to this initiative, the EU will target a30% reduction in GHG emissions by 2020 compared to the 1990 level. This wouldrepresent a 37% reduction vs 2005 levels for EU ETS sectors and a 16% reductionfor non-ETS sectors. In this scenario the amount of international offsetCERs/ERUs permissible in the EU ETS scheme would be increased.
However international 2020 reduction targets have so far been more conservativethan EU targets – the US and Canada are only targeting a return to 1990 levels by2020, rather than a reduction and Japan may target a 4% reduction vs 1990.
Given we believe the EU will miss its base case targets and that reaching an
international accord on 2020 targets will be difficult (when even EU members areresisting the base case targets) we view the 30% reduction target as very unlikely tobe adopted.
EU carbon trading mechanisms – EU ETS, CDM and JI
EU ETS scheme covers
45% of EU CO2
emissions
The EU European Trading Scheme (EU ETS) was established in October 2003 andentered into force in January 2005. The scheme applied to five carbon intensiveindustries (electric utilities, oil, building materials, metals and paper) whichaccount for 45% of total EU CO2 emissions and covered over 12,000 individualinstallations.
Installations are allocated a certain amount of EU Allowance Units (EUAs) whichare also organised under a National Allocation Plan (NAP) for each country (likelyto develop into an EU-wide plan in the future). Each EUA permits the emission of
Carbon Report 10
8/3/2019 daiwa_carbonforecasts_2008
http://slidepdf.com/reader/full/daiwacarbonforecasts2008 11/28
Carbon Report 11
one tonne of CO2 which can be retired against actual emissions or traded within acompany, through a broker or on an exchange.
The EUA is fungible with the equivalent Assigned Amount Unit (AAU) definedunder Kyoto. This means that countries can trade AAUs between one another, withgovernmental sellers including Russia, Ukraine, Poland, Hungary and Czech
Republic and governmental buyers including Japan, Spain, Denmark, Portugal andAustria.
There is also a link with international Kyoto mechanisms such as the CleanDevelopment Mechanism (CDM), which grants Certified Emission Reductioncredits (CERs) for emission reduction projects in developing countries (largelyChina) and the Joint Implementation (JI) mechanism which grants EmissionReduction Units (ERUs) for carbon reduction projects in other developed (AnnexI) countries such as Russia.
Because of this transferability there is a close relationship between the price of EUAs and the price of secondary CERs, although EUAs can trade at a premium
because the maximum use of CERs/ERUs is fixed on a national basis and may notbe sufficient to meet all demand (therefore marginal price set by cost of otherabatement techniques).
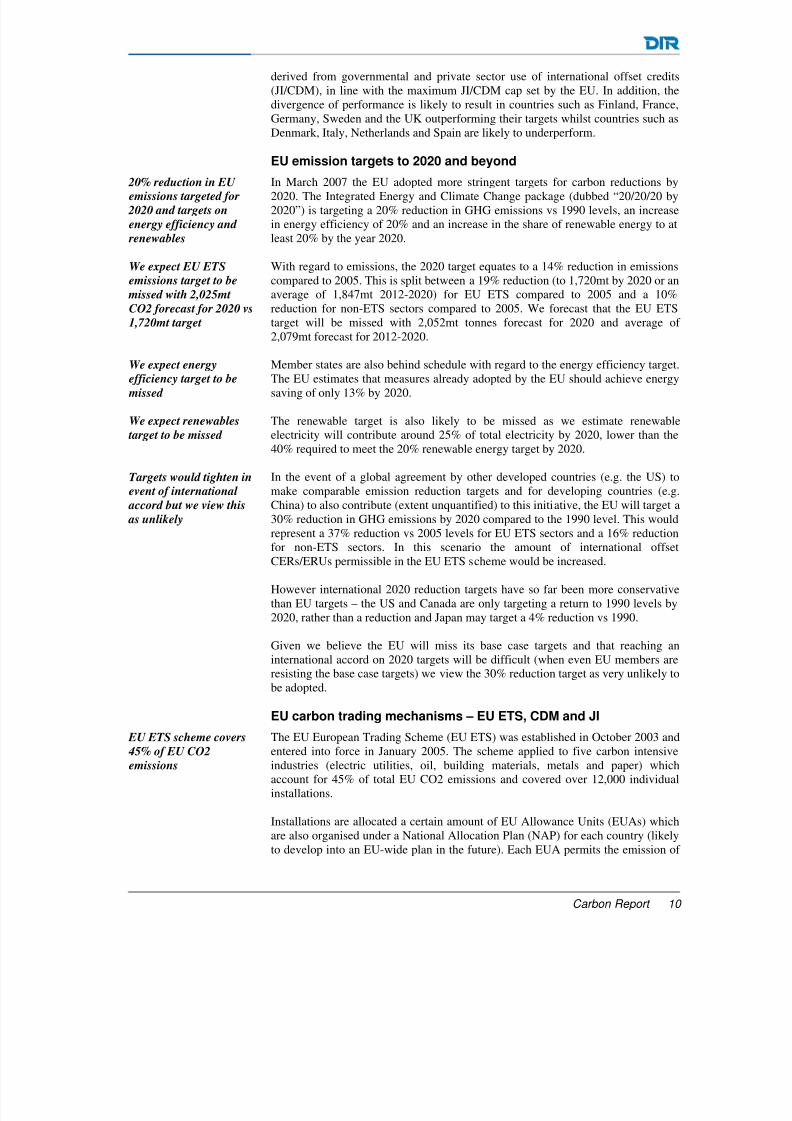
Phase I of the EU ETS covered an introductory period of 2005-2007. The price of Phase I allowances initialled rallied to €30/tonne, however the publication of verified 2005 emissions in early 2006 revealed that the level of free allowancesgiven to installations would be more than enough to cover requirements. Verifiedemissions for the 2005/2006 period totalled 2,130mt against a Phase I periodallocation of 2,299mt – a surplus of 169mt.
Phase I EU ETS allocations vs verified emissions (000 tonnes) Chart 13
Absolute difference between allocation & verfied emissions
-10,000
-5,000
0
5,000
10,000
15,000
20,000
25,000
30,000
1 2 3 4 5 6 7 8 9 99ETS Sector
1 0 0 0 E U A
/ k t C O 2
© EEA/ETC-ACC/Öko-Institut e.V.
1 Combustion installations
2 Mineral oil refineries
3 Coke ovens
4 Metal ore roasting or sintering installations
5 Production of pig iron or steel
6 Production of cement clinker or lime
7 Manufacture of glass including glass fibre
8 Manufacture of ceramic products by firing
9 Production of pulp, paper and board
99 Other activity opted-in
Source: EEA; compiled by DIR.
The allowances were given out for free and with more allowances than required therewas no need for installation to purchase additional Phase I allowances and therefore themarket price fell to zero.
Cap-and-trade scheme
allowing installations
and countries to trade
Linkage with Kyoto
mechanisms offers scope
or international offsets
in developed and
developing nations
Phase I period of
scheme (2005-2007)
ailed due to over-
allocation of allowances

8/3/2019 daiwa_carbonforecasts_2008
http://slidepdf.com/reader/full/daiwacarbonforecasts2008 12/28

8/3/2019 daiwa_carbonforecasts_2008
http://slidepdf.com/reader/full/daiwacarbonforecasts2008 13/28
The weekly correlation between coal and carbon is 0.81 – similar to the 0.84correlation between the ETS price and the oil price. This correlation has increasedas commodity markets have fallen.
EU ETS €/tonne and API2 Dec $/tonne 2008 weekly correlation Chart 16
Source: Bloomberg; compiled by DIR.
Carbon price relatively
stable compared to oil
and coal price
Whilst the direction of the carbon move has been closely linked with the coal pricethe quantum of the move has not, with carbon volatility remaining relatively limited compared to other commodities. As the chart below shows during thesummer of 2008 the price of coal increased at nearly double the rate of the price of carbon, but has subsequently fallen back by a similar amount.
API2 coal price vs EU ETS carbon price (rebased to 100) Chart 17
Source: Bloomberg; compiled by DIR.
Carbon price not
dictated by commodity
rices alone and CER
rice has element of
rice regulation
However, as already noted with the fuel switching level, the carbon price is notdictated by the coal price alone and fuel switching levels depend upon the absolutedifference between the cost of coal and the cost of gas, the average efficiency of the coal and gas plant production and the carbon intensity of the different powerproduction. In addition, because of the links with international markets such asCERs where there is a degree of government price regulation, market forces alonedo not dictate the price.
Whilst we believe fuel switching levels will support carbon prices over the mediumterm (deeper emission cuts will require a higher carbon price driven by long termabatement cost), in the short term the carbon price could be distorted by apolitically driven supply/demand imbalance.
Carbon Report 13
8/3/2019 daiwa_carbonforecasts_2008
http://slidepdf.com/reader/full/daiwacarbonforecasts2008 14/28
Carbon Report 14
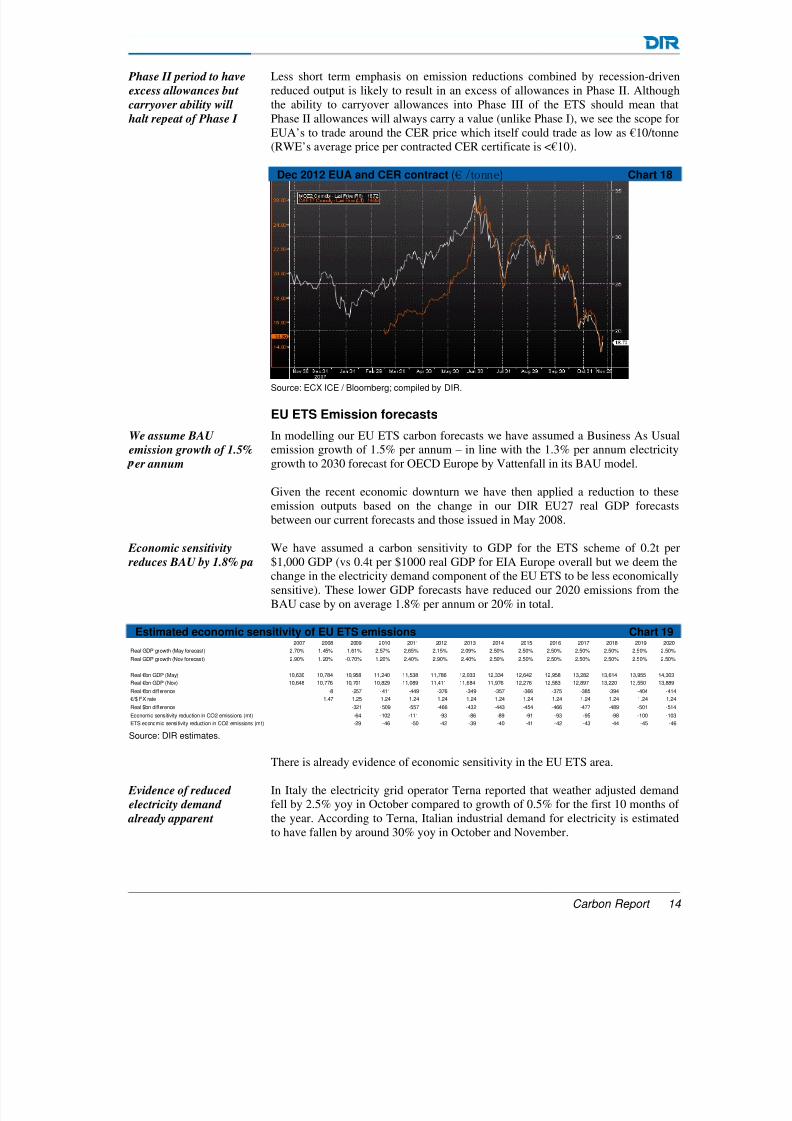
Less short term emphasis on emission reductions combined by recession-drivenreduced output is likely to result in an excess of allowances in Phase II. Althoughthe ability to carryover allowances into Phase III of the ETS should mean thatPhase II allowances will always carry a value (unlike Phase I), we see the scope forEUA’s to trade around the CER price which itself could trade as low as €10/tonne(RWE’s average price per contracted CER certificate is <€10).
Dec 2012 EUA and CER contract (€ /tonne) Chart 18
Source: ECX ICE / Bloomberg; compiled by DIR.
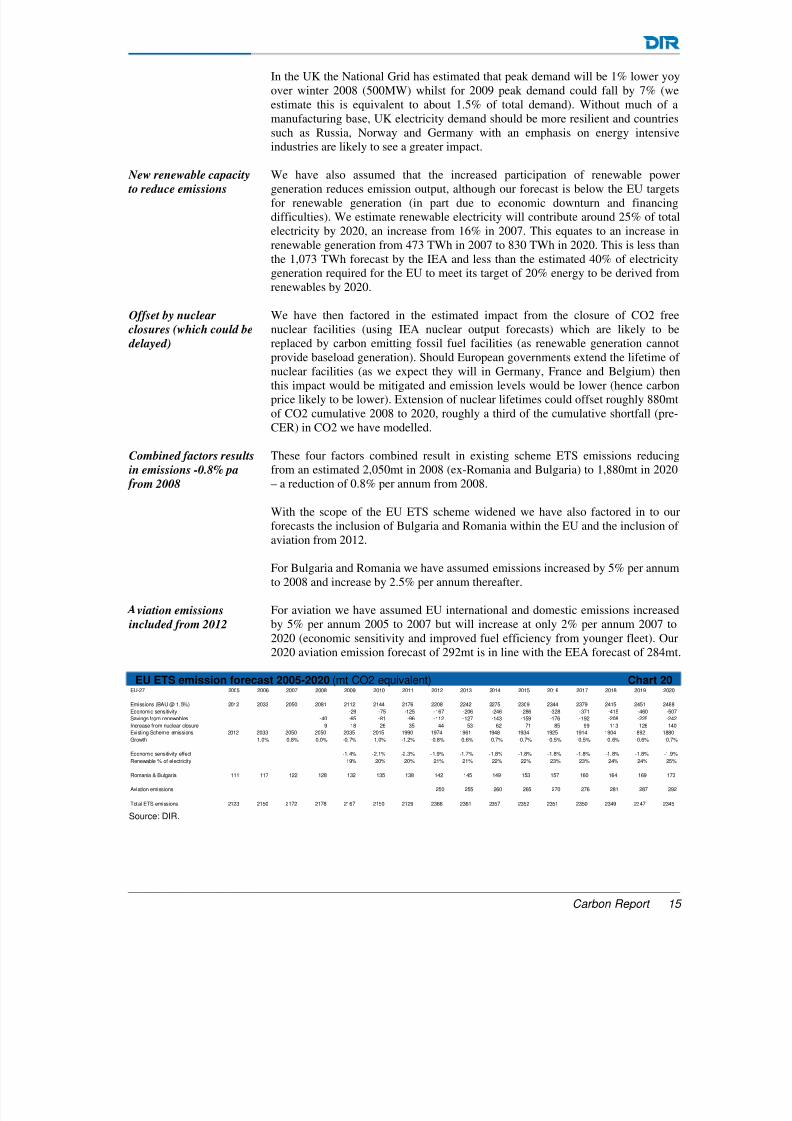
EU ETS Emission forecasts
In modelling our EU ETS carbon forecasts we have assumed a Business As Usualemission growth of 1.5% per annum – in line with the 1.3% per annum electricitygrowth to 2030 forecast for OECD Europe by Vattenfall in its BAU model.
Given the recent economic downturn we have then applied a reduction to theseemission outputs based on the change in our DIR EU27 real GDP forecastsbetween our current forecasts and those issued in May 2008.
We have assumed a carbon sensitivity to GDP for the ETS scheme of 0.2t per$1,000 GDP (vs 0.4t per $1000 real GDP for EIA Europe overall but we deem thechange in the electricity demand component of the EU ETS to be less economicallysensitive). These lower GDP forecasts have reduced our 2020 emissions from theBAU case by on average 1.8% per annum or 20% in total.
Estimated economic sensitivity of EU ETS emissions Chart 192007 2008 2009 2010 2011 2012 2013 2014 2015 2016 2017 2018 2019 2020
Real GDP growth (May forecast) 2.70% 1.45% 1.61% 2.57% 2.65% 2.15% 2.09% 2.50% 2.50% 2.50% 2.50% 2.50% 2.50% 2.50%
Real GDP growth (Nov forecast) 2.90% 1.20% -0.70% 1.20% 2.40% 2.90% 2.40% 2.50% 2.50% 2.50% 2.50% 2.50% 2.50% 2.50%
Real €bn GDP (May) 10,630 10,784 10,958 11,240 11,538 11,786 12,033 12,334 12,642 12,958 13,282 13,614 13,955 14,303
Real €bn GDP (Nov) 10,648 10,776 10,701 10,829 11,089 11,411 11,684 11,976 12,276 12,583 12,897 13,220 13,550 13,889
Real €bn difference -8 -257 -411 -449 -376 -349 -357 -366 -375 -385 -394 -404 -414
€/$ FX rate 1.47 1.25 1.24 1.24 1.24 1.24 1.24 1.24 1.24 1.24 1.24 1.24 1.24
Real $bn difference -321 -509 -557 -466 -432 -443 -454 -466 -477 -489 -501 -514
Economic sensitivity reduction in CO2 emissions (mt) -64 -102 -111 -93 -86 -89 -91 -93 -95 -98 -100 -103
ETS economic sensitivity reduction in CO2 emissions (mt) -29 -46 -50 -42 -39 -40 -41 -42 -43 -44 -45 -46 Source: DIR estimates.
There is already evidence of economic sensitivity in the EU ETS area.
In Italy the electricity grid operator Terna reported that weather adjusted demandfell by 2.5% yoy in October compared to growth of 0.5% for the first 10 months of the year. According to Terna, Italian industrial demand for electricity is estimatedto have fallen by around 30% yoy in October and November.
Phase II period to have
excess allowances but
carryover ability will
halt repeat of Phase I
We assume BAU
emission growth of 1.5%
er annum
Economic sensitivity
reduces BAU by 1.8% pa
Evidence of reduced
electricity demand
already apparent
8/3/2019 daiwa_carbonforecasts_2008
http://slidepdf.com/reader/full/daiwacarbonforecasts2008 15/28
Carbon Report 15
In the UK the National Grid has estimated that peak demand will be 1% lower yoyover winter 2008 (500MW) whilst for 2009 peak demand could fall by 7% (weestimate this is equivalent to about 1.5% of total demand). Without much of amanufacturing base, UK electricity demand should be more resilient and countriessuch as Russia, Norway and Germany with an emphasis on energy intensiveindustries are likely to see a greater impact.
We have also assumed that the increased participation of renewable powergeneration reduces emission output, although our forecast is below the EU targetsfor renewable generation (in part due to economic downturn and financingdifficulties). We estimate renewable electricity will contribute around 25% of totalelectricity by 2020, an increase from 16% in 2007. This equates to an increase inrenewable generation from 473 TWh in 2007 to 830 TWh in 2020. This is less thanthe 1,073 TWh forecast by the IEA and less than the estimated 40% of electricitygeneration required for the EU to meet its target of 20% energy to be derived fromrenewables by 2020.
We have then factored in the estimated impact from the closure of CO2 free
nuclear facilities (using IEA nuclear output forecasts) which are likely to bereplaced by carbon emitting fossil fuel facilities (as renewable generation cannotprovide baseload generation). Should European governments extend the lifetime of nuclear facilities (as we expect they will in Germany, France and Belgium) thenthis impact would be mitigated and emission levels would be lower (hence carbonprice likely to be lower). Extension of nuclear lifetimes could offset roughly 880mtof CO2 cumulative 2008 to 2020, roughly a third of the cumulative shortfall (pre-CER) in CO2 we have modelled.
These four factors combined result in existing scheme ETS emissions reducingfrom an estimated 2,050mt in 2008 (ex-Romania and Bulgaria) to 1,880mt in 2020– a reduction of 0.8% per annum from 2008.
With the scope of the EU ETS scheme widened we have also factored in to ourforecasts the inclusion of Bulgaria and Romania within the EU and the inclusion of aviation from 2012.
For Bulgaria and Romania we have assumed emissions increased by 5% per annumto 2008 and increase by 2.5% per annum thereafter.
For aviation we have assumed EU international and domestic emissions increasedby 5% per annum 2005 to 2007 but will increase at only 2% per annum 2007 to2020 (economic sensitivity and improved fuel efficiency from younger fleet). Our2020 aviation emission forecast of 292mt is in line with the EEA forecast of 284mt.
EU ETS emission forecast 2005-2020 (mt CO2 equivalent) Chart 20EU-27 2005 2006 2007 2008 2009 2010 2011 2012 2013 2014 2015 2016 2017 2018 2019 2020
Emissions (BAU @ 1.5%) 2012 2033 2050 2081 2112 2144 2176 2208 2242 2275 2309 2344 2379 2415 2451 2488Economic sensitivity -29 -75 -125 -167 -206 -246 -286 -328 -371 -415 -460 -507Savings from renewables -40 -65 -81 -96 -112 -127 -143 -159 -176 -192 -208 -225 -242Increase from nuclear closure 9 18 26 35 44 53 62 71 85 99 113 126 140Existing Scheme emissions 2012 2033 2050 2050 2035 2015 1990 1974 1961 1948 1934 1925 1914 1904 1892 1880Growth 1.0% 0.8% 0.0% -0.7% -1.0% -1.2% -0.8% -0.6% -0.7% -0.7% -0.5% -0.5% -0.6% -0.6% -0.7%
Economic sensitivity effect -1.4% -2.1% -2.3% -1.9% -1.7% -1.8% -1.8% -1.8% -1.8% -1.8% -1.8% -1.9%Renewable % of electricity 19% 20% 20% 21% 21% 22% 22% 23% 23% 24% 24% 25%
Romania & Bulgaria 111 117 122 128 132 135 138 142 145 149 153 157 160 164 169 173
Aviation emissions 250 255 260 265 270 276 281 287 292
Total ETS emissions 2123 2150 2172 2178 2167 2150 2129 2366 2361 2357 2352 2351 2350 2349 2347 2345 Source: DIR.
New renewable capacity
to reduce emissions
Offset by nuclear
closures (which could be delayed)
Combined factors results
in emissions -0.8% pa
rom 2008
viation emissions
included from 2012
8/3/2019 daiwa_carbonforecasts_2008
http://slidepdf.com/reader/full/daiwacarbonforecasts2008 16/28
Carbon Report 16
Total EU27 emissions are forecast at 2,345mt in 2020 (1,880mt EU25 plus 173mtRomania & Bulgaria plus 292mt aviation). However this forecasted emission levelstill represents an excess compared to the 1,915mt targeted by the EU under itsemission allowances (1,720mt EU27 plus 195mt aviation). The balance thereforehas to be met through CER/JI usage and/or additional abatement techniques (e.g.fuel switching). The pricing and availability of CER/JI credits and the cost of
abatement will therefore dictate the EU ETs price.
EU ETS use of Kyoto mechanisms
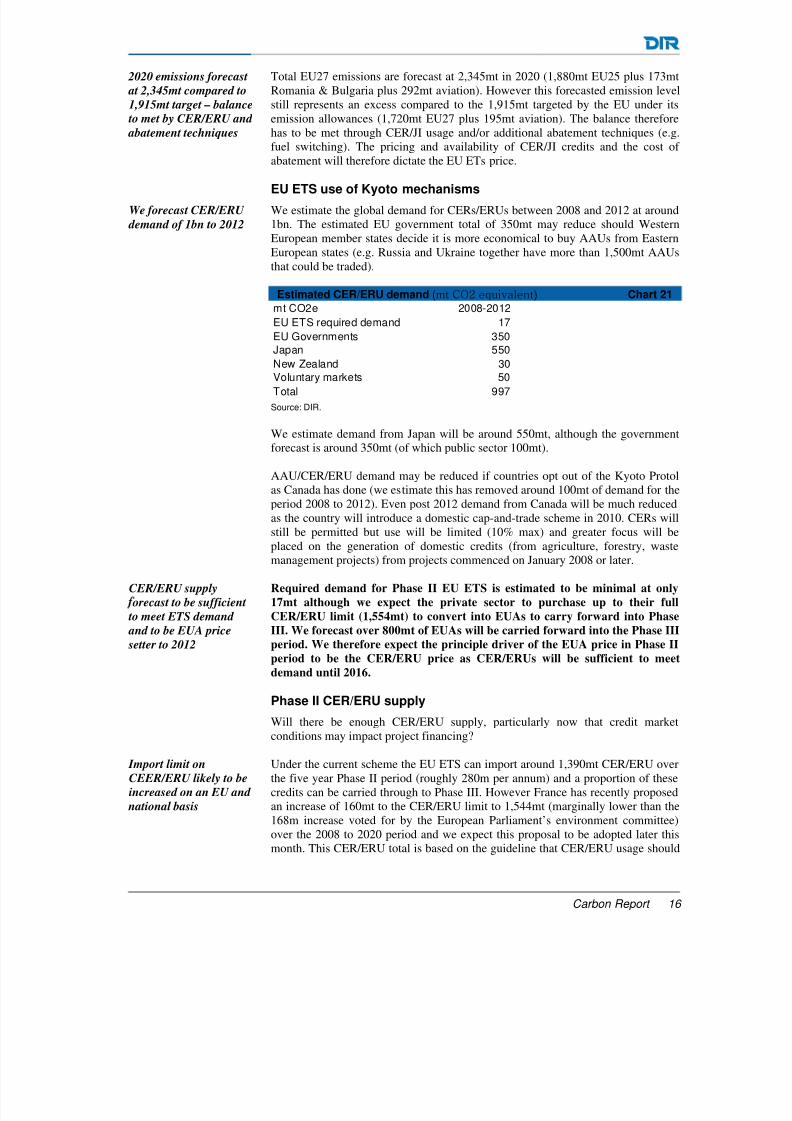
We estimate the global demand for CERs/ERUs between 2008 and 2012 at around1bn. The estimated EU government total of 350mt may reduce should WesternEuropean member states decide it is more economical to buy AAUs from EasternEuropean states (e.g. Russia and Ukraine together have more than 1,500mt AAUsthat could be traded).
Estimated CER/ERU demand (mt CO2 equivalent) Chart 21
mt CO2e 2008-2012EU ETS required demand 17EU Governments 350Japan 550New Zealand 30Voluntary markets 50Total 997 Source: DIR.
We estimate demand from Japan will be around 550mt, although the governmentforecast is around 350mt (of which public sector 100mt).
AAU/CER/ERU demand may be reduced if countries opt out of the Kyoto Protol
as Canada has done (we estimate this has removed around 100mt of demand for theperiod 2008 to 2012). Even post 2012 demand from Canada will be much reducedas the country will introduce a domestic cap-and-trade scheme in 2010. CERs willstill be permitted but use will be limited (10% max) and greater focus will beplaced on the generation of domestic credits (from agriculture, forestry, wastemanagement projects) from projects commenced on January 2008 or later.
Required demand for Phase II EU ETS is estimated to be minimal at only
17mt although we expect the private sector to purchase up to their full
CER/ERU limit (1,554mt) to convert into EUAs to carry forward into Phase
III. We forecast over 800mt of EUAs will be carried forward into the Phase III
period. We therefore expect the principle driver of the EUA price in Phase II
period to be the CER/ERU price as CER/ERUs will be sufficient to meetdemand until 2016.
Phase II CER/ERU supply
Will there be enough CER/ERU supply, particularly now that credit marketconditions may impact project financing?
Under the current scheme the EU ETS can import around 1,390mt CER/ERU overthe five year Phase II period (roughly 280m per annum) and a proportion of thesecredits can be carried through to Phase III. However France has recently proposedan increase of 160mt to the CER/ERU limit to 1,544mt (marginally lower than the
168m increase voted for by the European Parliament’s environment committee)over the 2008 to 2020 period and we expect this proposal to be adopted later thismonth. This CER/ERU total is based on the guideline that CER/ERU usage should
2020 emissions forecast
at 2,345mt compared to
1,915mt target – balance
to met by CER/ERU and
abatement techniques
We forecast CER/ERU
demand of 1bn to 2012
CER/ERU supply
orecast to be sufficient
to meet ETS demand
and to be EUA price
setter to 2012
Import limit on
CEER/ERU likely to be
increased on an EU and
national basis
8/3/2019 daiwa_carbonforecasts_2008
http://slidepdf.com/reader/full/daiwacarbonforecasts2008 17/28
Carbon Report 17
represent a maximum 50% of the reduction in emissions below 2005 levels (whichcould mean an increase to 1,893mt if targeted aviation reductions are included).
There is also likely to be a change to the national import limit of CER/JI credits,with a minimum import limit of 11% to be set. Countries such as Germany andSpain who have a higher (20%) limit set in Phase II of the scheme are likely to
retain this upper limit but operators in countries such as the UK (8% limit) willbenefit from higher CER/JI availability.
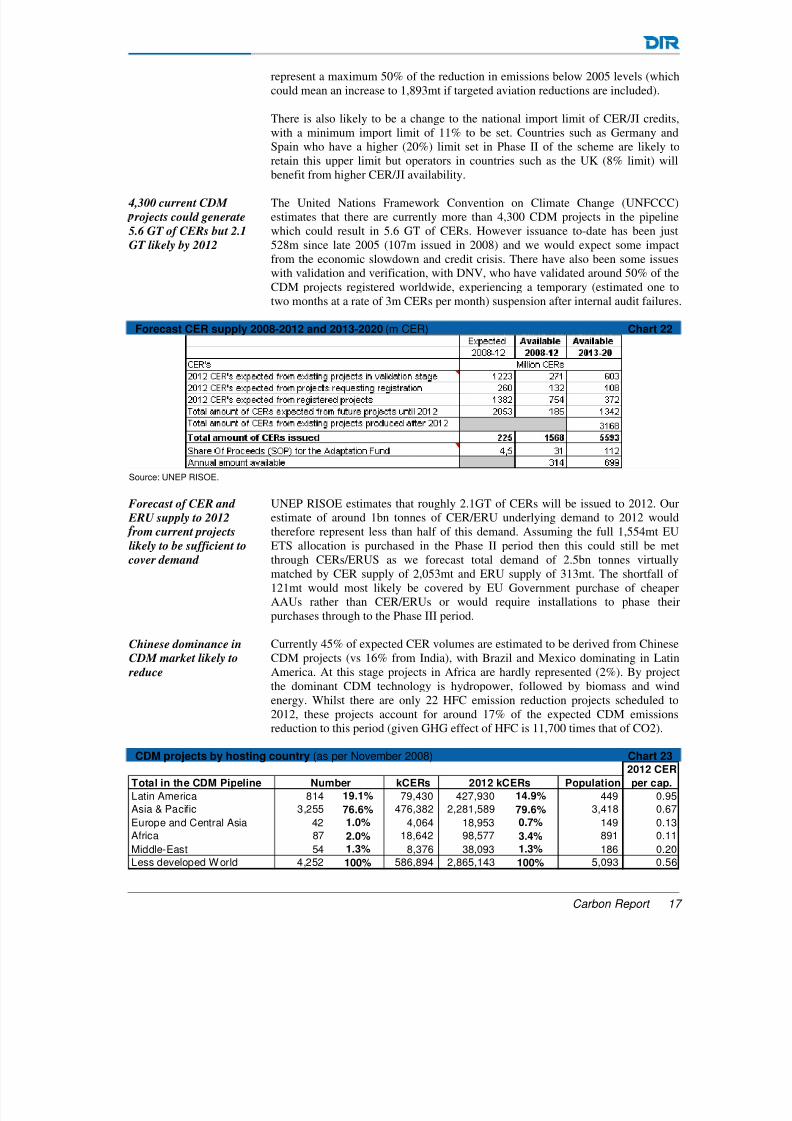
The United Nations Framework Convention on Climate Change (UNFCCC)estimates that there are currently more than 4,300 CDM projects in the pipelinewhich could result in 5.6 GT of CERs. However issuance to-date has been just528m since late 2005 (107m issued in 2008) and we would expect some impactfrom the economic slowdown and credit crisis. There have also been some issueswith validation and verification, with DNV, who have validated around 50% of theCDM projects registered worldwide, experiencing a temporary (estimated one totwo months at a rate of 3m CERs per month) suspension after internal audit failures.
Forecast CER supply 2008-2012 and 2013-2020 (m CER) Chart 22
Source: UNEP RISOE.
UNEP RISOE estimates that roughly 2.1GT of CERs will be issued to 2012. Ourestimate of around 1bn tonnes of CER/ERU underlying demand to 2012 wouldtherefore represent less than half of this demand. Assuming the full 1,554mt EUETS allocation is purchased in the Phase II period then this could still be metthrough CERs/ERUS as we forecast total demand of 2.5bn tonnes virtuallymatched by CER supply of 2,053mt and ERU supply of 313mt. The shortfall of 121mt would most likely be covered by EU Government purchase of cheaperAAUs rather than CER/ERUs or would require installations to phase theirpurchases through to the Phase III period.
Currently 45% of expected CER volumes are estimated to be derived from Chinese
CDM projects (vs 16% from India), with Brazil and Mexico dominating in LatinAmerica. At this stage projects in Africa are hardly represented (2%). By projectthe dominant CDM technology is hydropower, followed by biomass and windenergy. Whilst there are only 22 HFC emission reduction projects scheduled to2012, these projects account for around 17% of the expected CDM emissionsreduction to this period (given GHG effect of HFC is 11,700 times that of CO2).
CDM projects by hosting country (as per November 2008) Chart 232012 CER
Total in the CDM Pipeline kCERs Population per cap.
Latin America 814 19.1% 79,430 427,930 14.9% 449 0.95Asia & Pacific 3,255 76.6% 476,382 2,281,589 79.6% 3,418 0.67
Europe and Central Asia 42 1.0% 4,064 18,953 0.7% 149 0.13Africa 87 2.0% 18,642 98,577 3.4% 891 0.11Middle-East 54 1.3% 8,376 38,093 1.3% 186 0.20Less developed World 4,252 100% 586,894 2,865,143 100% 5,093 0.56
Number 2012 kCERs
4,300 current CDM
rojects could generate
5.6 GT of CERs but 2.1
GT likely by 2012
Forecast of CER and
ERU supply to 2012
rom current projects
likely to be sufficient to
cover demand
Chinese dominance in
CDM market likely to reduce
8/3/2019 daiwa_carbonforecasts_2008
http://slidepdf.com/reader/full/daiwacarbonforecasts2008 18/28
Carbon Report 18
Source: UNEP RISOE.
In contrast to the CDM market there are currently only around 166 JI projects inexistence. However this is largely because the market is less mature (JI credits onlypermissible from 2008 compared to 2000 for CDM). It is estimated that JI schemeswill produce around 312mt tonnes of ERUs between 2008 and 2012.
In addition, the supply of CER credits supply could also increase if the EUmodified its qualitative restrictions on CERs. At the moment no forestry or nuclearCERs are permitted and large hydro projects (>20MW) require compliance withthe World Commission on Dams report 2000 which has reduced hydro-relatedCER demand (which is why they trade at a discount).
Deforestation accounts for an estimated 20% of rising GHG emissions yet it isexcluded from the EU CDM mechanism. However the EU has proposed a numberof forestry initiatives to try to cut deforestation in half by 2020 and reduce netforest loss to zero by 2030, including the Global Forest Carbon Mechanism (whichwould use the proceeds from EU ETS auctions to pay for forest preservation in
developing countries).
The EU Environment Council meeting on 4-5 December is likely to propose a pilotphase to “test the inclusion of deforestation credits in carbon markets”. Whilst fullinclusion in the EU ETS is only likely post 2020, should forestry ever be linked tothe EU ETS scheme we believe the volume of credits would increase markedly andthe CER/ERU price would materially decline (the Forest Carbon Index estimatesthere are significant areas of the world where carbon reductions could be made for<$6/tonne).
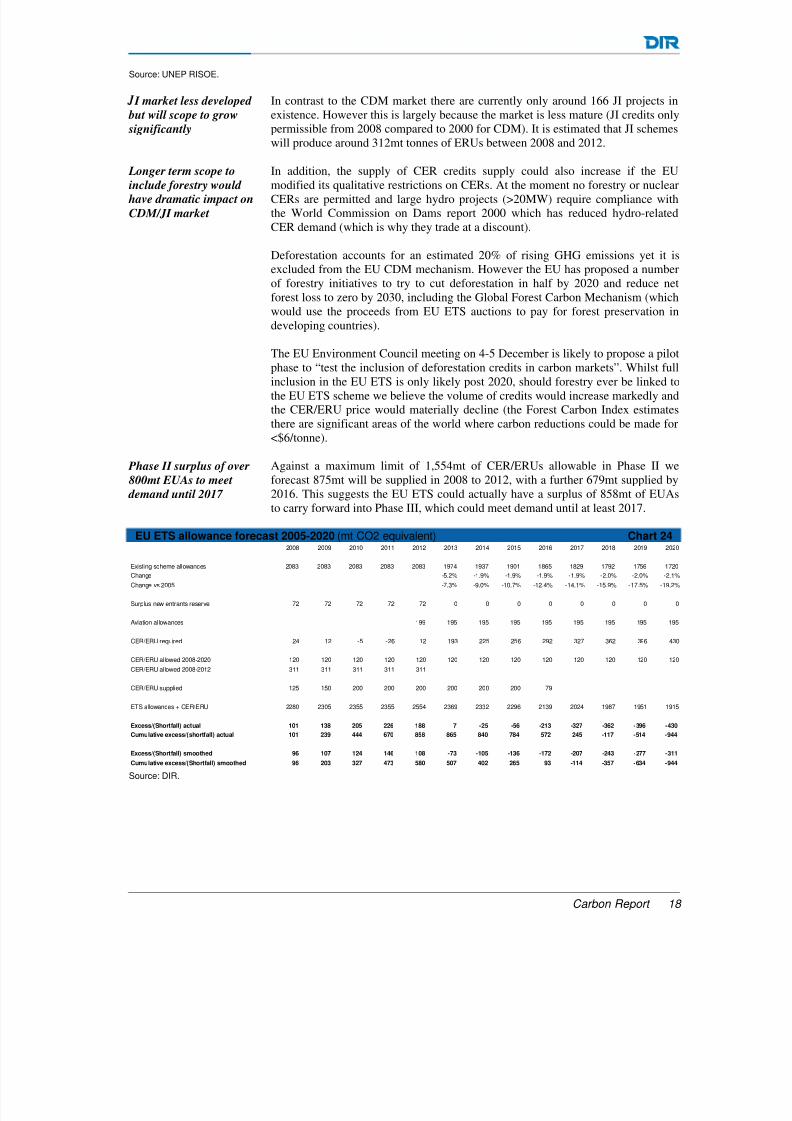
Against a maximum limit of 1,554mt of CER/ERUs allowable in Phase II weforecast 875mt will be supplied in 2008 to 2012, with a further 679mt supplied by
2016. This suggests the EU ETS could actually have a surplus of 858mt of EUAsto carry forward into Phase III, which could meet demand until at least 2017.
EU ETS allowance forecast 2005-2020 (mt CO2 equivalent) Chart 242008 2009 2010 2011 2012 2013 2014 2015 2016 2017 2018 2019 2020
Existing scheme allowances 2083 2083 2083 2083 2083 1974 1937 1901 1865 1829 1792 1756 1720
Change -5.2% -1.9% -1.9% -1.9% -1.9% -2.0% -2.0% -2.1%
Change vs 2005 -7.3% -9.0% -10.7% -12.4% -14.1% -15.9% -17.5% -19.2%
Surplus new entrants reserve 72 72 72 72 72 0 0 0 0 0 0 0 0
Aviation allowances 199 195 195 195 195 195 195 195 195
CER/ERU required 24 12 -5 -26 12 193 225 256 292 327 362 396 430
CER/ERU allowed 2008-2020 120 120 120 120 120 120 120 120 120 120 120 120 120CER/ERU allowed 2008-2012 311 311 311 311 311
CER/ERU supplied 125 150 200 200 200 200 200 200 79
ETS allowances + CER/ERU 2280 2305 2355 2355 2554 2369 2332 2296 2139 2024 1987 1951 1915
Excess/(Shortfall) actual 101 138 205 226 188 7 -25 -56 -213 -327 -362 -396 -430
Cumulative excess/(shortfall) actual 101 239 444 670 858 865 840 784 572 245 -117 -514 -944
Excess/(Shortfall) smoothed 96 107 124 146 108 -73 -105 -136 -172 -207 -243 -277 -311
Cumulative excess/(Shortfall) smoothed 96 203 327 473 580 507 402 265 93 -114 -357 -634 -944 Source: DIR.
I market less developed
but will scope to grow
significantly
Longer term scope to
include forestry would
have dramatic impact on
CDM/JI market
Phase II surplus of over
800mt EUAs to meet
demand until 2017
8/3/2019 daiwa_carbonforecasts_2008
http://slidepdf.com/reader/full/daiwacarbonforecasts2008 19/28
Carbon Report 19
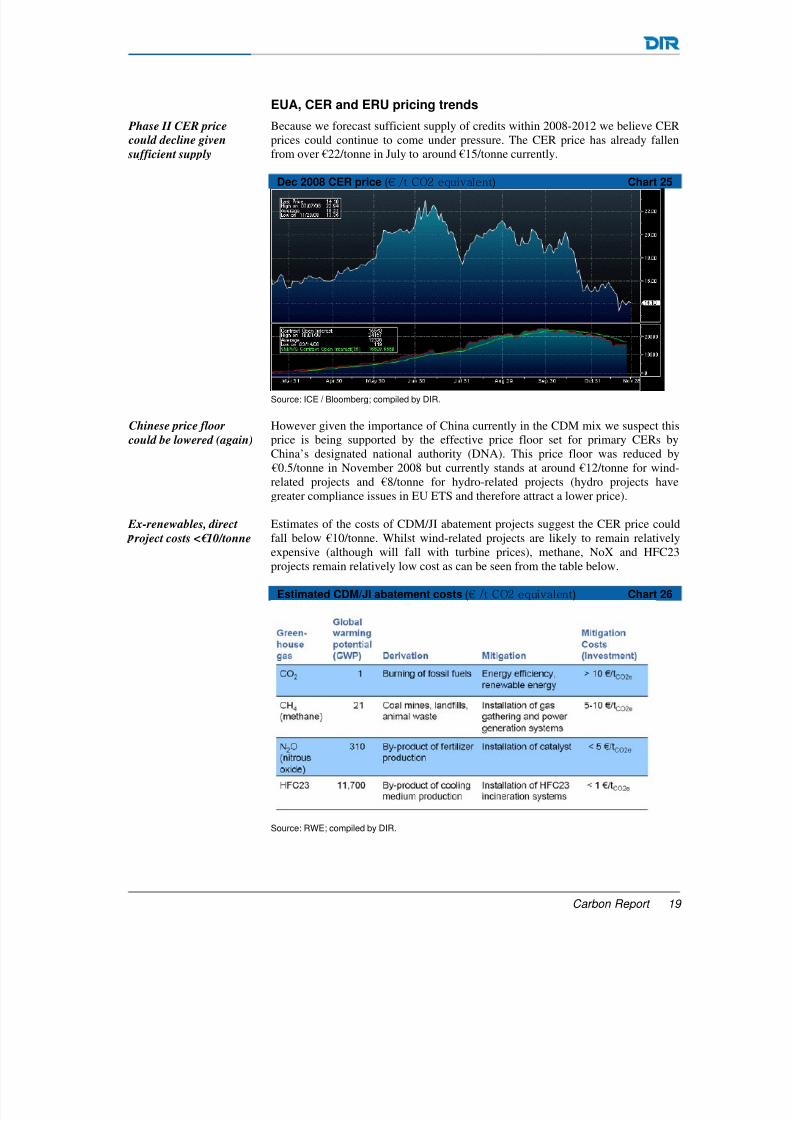
EUA, CER and ERU pricing trends
Because we forecast sufficient supply of credits within 2008-2012 we believe CERprices could continue to come under pressure. The CER price has already fallenfrom over €22/tonne in July to around €15/tonne currently.
Dec 2008 CER price (€ /t CO2 equivalent) Chart 25
Source: ICE / Bloomberg; compiled by DIR.
However given the importance of China currently in the CDM mix we suspect thisprice is being supported by the effective price floor set for primary CERs byChina’s designated national authority (DNA). This price floor was reduced by
€0.5/tonne in November 2008 but currently stands at around €12/tonne for wind-related projects and €8/tonne for hydro-related projects (hydro projects have
greater compliance issues in EU ETS and therefore attract a lower price).
Estimates of the costs of CDM/JI abatement projects suggest the CER price couldfall below €10/tonne. Whilst wind-related projects are likely to remain relativelyexpensive (although will fall with turbine prices), methane, NoX and HFC23projects remain relatively low cost as can be seen from the table below.
Estimated CDM/JI abatement costs (€ /t CO2 equivalent) Chart 26
Source: RWE; compiled by DIR.
Phase II CER price
could decline given
sufficient supply
Chinese price floor
could be lowered (again)
Ex-renewables, direct
roject costs <€10/tonne
8/3/2019 daiwa_carbonforecasts_2008
http://slidepdf.com/reader/full/daiwacarbonforecasts2008 20/28
Price regulation has
meant carbon cost
significantly higher than
investment cost –
articularly with HFC
However, China’s price regulation has meant that historically the price of CERshas not always reflected the project costs. According to the scientific journalNature, it would have been nearly €5bn cheaper to directly fund the equipment todestroy HFC-23 emissions at refrigeration manufacturing plants rather thanallocating CDM credits to these projects. Should China not reduce these prices we
suspect other countries will and the geographic mix of CDM projects will shift.
ERU prices significantly
below CER prices –
unlikely to be sustained
JI/ERU prices are currently below those of CDM/CER (e.g. Slovakia recently soldaround 10mt of JI credits for around €6/tonne), although we expect prices toconverge (likely CER down) given the similar fungibility into EUAs.
Russia offers significant low cost JI project potential. The refurbishment of gasdistribution pipelines to reduce the emission of methane through leakage isestimated to equate to a CO2 saving of between €0.5-€2.5/tonne.
Non-Kyoto power sector abatement costs
We believe the EUA price is likely to track the CER/ERU price for as long as thereare sufficient allowances to not require other abatement techniques such as fuelswitching or domestic emission reduction investments.
Phase II EUA price
likely to trade at small
(premium) spread to
CER
Whilst we expect the spread to narrow, the EUA price should always trade at apremium to the CER price as there are always likely to be some restriction as to theextent of CERs permissable in Phase III whereas there are no restrictions onexchanging EUAs into Phase III. In addition, whilst delivery can be guaranteed bythe seller, CERs are also often sold by companies with a lower credit rating thanEUA sellers so there is a greater counterparty risk.
Whilst we estimate sufficient CER/ERU allowances until 2017, given electricitycompanies sell forward their output (generally up to 4 years in advance) weestimate the EUA price will trade at a tight spread with the CER/ERU price until2013, from which time we expect additional buying to be based against domesticabatement costs rather than the CER/ERU price.
Phase III pricing more
ocused on abatement
cost
On the basis of a smoothed usage of CER/ERUs throughout the 2008-2020, weestimate additional emission reductions of 73mt per annum will be required to meetthe EU ETS allowance ceiling (944mt cumulative shortfall over 13 years). Howinstallations can achieve this 73mt additional abatement will determine the EUETS price for much of the Phase III trading period.
Scope for 100mt to150mt summer fuel
switching at costs of
between €21/tonne to
€30/tonne
Probably the easiest abatement method available in the power sector is fuelswitching, achieved by substituting higher carbon coal-fuelled generation with lesscarbon intense gas-fuelled generation. GDF Suez estimates there is scope foraround 100mt to 150mt of CO2 reduction from summer fuel switching and scopefor 250mt to 300mt from all year switching (at a higher gas cost and thereforehigher CO2 price). GDF’s estimate of the fuel switching potential is higher thanthat of Vattenfall who believe there is scope for roughly 170 TWh of additional gasproduction in Europe from existing assets using higher utilisation rates (wouldsuggest roughly 80mt fuel switching potential).
Using the DIR full year 2020 forecasts of 49p/therm UK gas and €22.5/MWh forEuropean gas, applying a 20% discount for summer gas prices and an API2 coal
price of $96/tonne, we estimate summer fuel switching costs of between €20.6/tonne (UK) and €29.5/tonne (Continental Europe).
Carbon Report 20
8/3/2019 daiwa_carbonforecasts_2008
http://slidepdf.com/reader/full/daiwacarbonforecasts2008 21/28
8/3/2019 daiwa_carbonforecasts_2008
http://slidepdf.com/reader/full/daiwacarbonforecasts2008 22/28
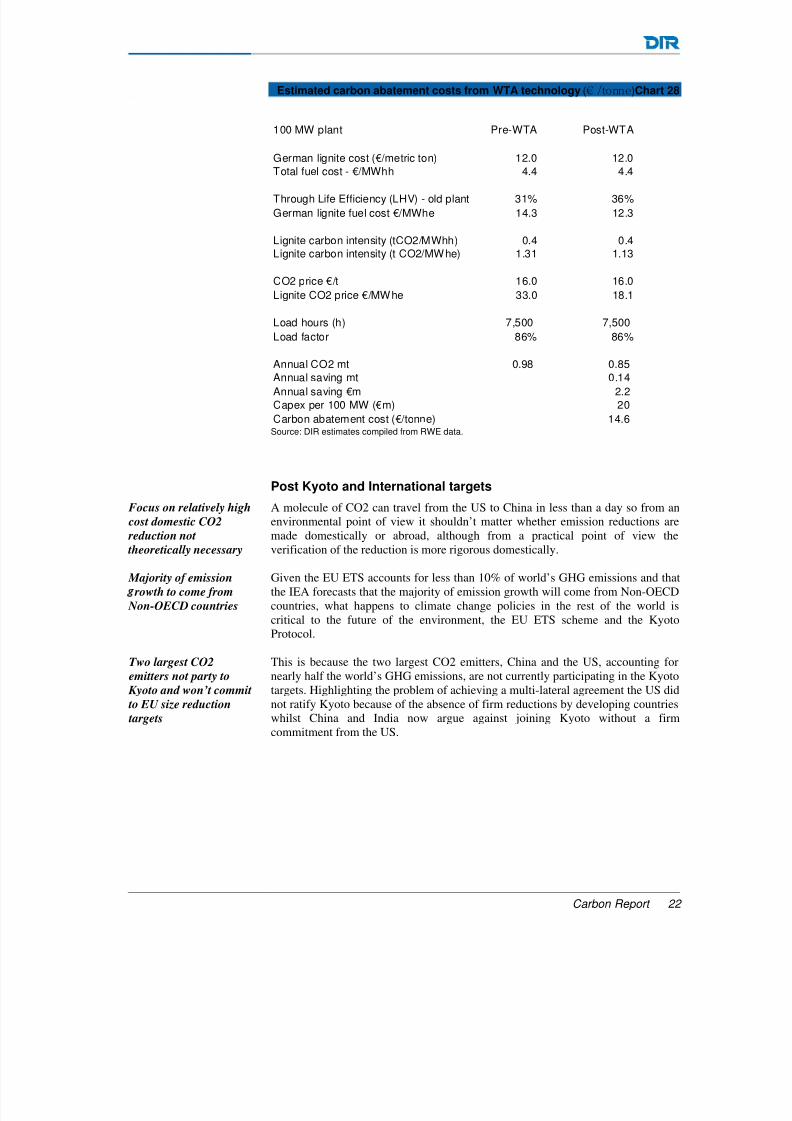
Estimated carbon abatement costs from WTA technology (€ /tonne)Chart 28
100 MW plant Pre-WTA Post-WTA
German lignite cost (€/metric ton) 12.0 12.0Total fuel cost - €/MWhh 4.4 4.4
Through Life Efficiency (LHV) - old plant 31% 36%German lignite fuel cost €/MWhe 14.3 12.3
Lignite carbon intensity (tCO2/MWhh) 0.4 0.4Lignite carbon intensity (t CO2/MWhe) 1.31 1.13
CO2 price €/t 16.0 16.0Lignite CO2 price €/MWhe 33.0 18.1
Load hours (h) 7,500 7,500 Load factor 86% 86%
Annual CO2 mt 0.98 0.85 Annual saving mt 0.14 Annual saving €m 2.2 Capex per 100 MW (€m) 20 Carbon abatement cost (€/tonne) 14.6 Source: DIR estimates compiled from RWE data.
Post Kyoto and International targets
Focus on relatively high
cost domestic CO2
reduction not
theoretically necessary
A molecule of CO2 can travel from the US to China in less than a day so from anenvironmental point of view it shouldn’t matter whether emission reductions aremade domestically or abroad, although from a practical point of view theverification of the reduction is more rigorous domestically.
Majority of emission
rowth to come from
Non-OECD countries
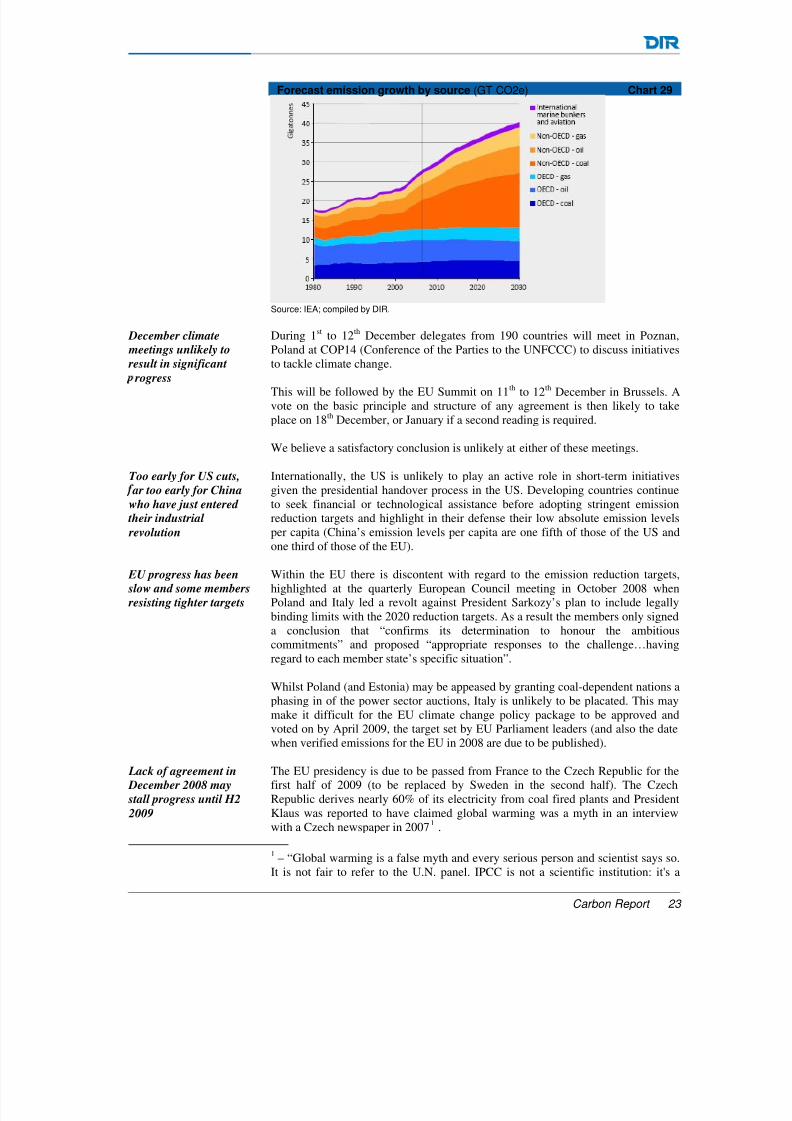
Given the EU ETS accounts for less than 10% of world’s GHG emissions and thatthe IEA forecasts that the majority of emission growth will come from Non-OECDcountries, what happens to climate change policies in the rest of the world iscritical to the future of the environment, the EU ETS scheme and the KyotoProtocol.
Two largest CO2emitters not party to
Kyoto and won’t commit
to EU size reduction
targets
This is because the two largest CO2 emitters, China and the US, accounting fornearly half the world’s GHG emissions, are not currently participating in the Kyototargets. Highlighting the problem of achieving a multi-lateral agreement the US didnot ratify Kyoto because of the absence of firm reductions by developing countrieswhilst China and India now argue against joining Kyoto without a firmcommitment from the US.
Carbon Report 22
8/3/2019 daiwa_carbonforecasts_2008
http://slidepdf.com/reader/full/daiwacarbonforecasts2008 23/28
Carbon Report 23
Forecast emission growth by source (GT CO2e) Chart 29
Source: IEA; compiled by DIR.
During 1st to 12th December delegates from 190 countries will meet in Poznan,Poland at COP14 (Conference of the Parties to the UNFCCC) to discuss initiativesto tackle climate change.
This will be followed by the EU Summit on 11th to 12th December in Brussels. Avote on the basic principle and structure of any agreement is then likely to takeplace on 18th December, or January if a second reading is required.
We believe a satisfactory conclusion is unlikely at either of these meetings.
Internationally, the US is unlikely to play an active role in short-term initiatives
given the presidential handover process in the US. Developing countries continueto seek financial or technological assistance before adopting stringent emissionreduction targets and highlight in their defense their low absolute emission levelsper capita (China’s emission levels per capita are one fifth of those of the US andone third of those of the EU).
Within the EU there is discontent with regard to the emission reduction targets,highlighted at the quarterly European Council meeting in October 2008 whenPoland and Italy led a revolt against President Sarkozy’s plan to include legallybinding limits with the 2020 reduction targets. As a result the members only signeda conclusion that “confirms its determination to honour the ambitiouscommitments” and proposed “appropriate responses to the challenge…having
regard to each member state’s specific situation”.
Whilst Poland (and Estonia) may be appeased by granting coal-dependent nations aphasing in of the power sector auctions, Italy is unlikely to be placated. This maymake it difficult for the EU climate change policy package to be approved andvoted on by April 2009, the target set by EU Parliament leaders (and also the datewhen verified emissions for the EU in 2008 are due to be published).
The EU presidency is due to be passed from France to the Czech Republic for thefirst half of 2009 (to be replaced by Sweden in the second half). The CzechRepublic derives nearly 60% of its electricity from coal fired plants and PresidentKlaus was reported to have claimed global warming was a myth in an interview
with a Czech newspaper in 20071 .
1 – “Global warming is a false myth and every serious person and scientist says so.It is not fair to refer to the U.N. panel. IPCC is not a scientific institution: it's a
December climate
meetings unlikely to
result in significant
rogress
Too early for US cuts,
ar too early for Chinawho have just entered
their industrial
revolution
EU progress has been
slow and some members
resisting tighter targets
Lack of agreement in
December 2008 may
stall progress until H2
2009

8/3/2019 daiwa_carbonforecasts_2008
http://slidepdf.com/reader/full/daiwacarbonforecasts2008 24/28
Carbon Report 24
This suggests much work may have to be done by the Swedish presidency duringthe second half of 2009, ahead of the COP15 meeting in Copenhagen in December2009 when a new agreement to run to 2020 is supposed to replace the KyotoProtocol.
It may also be difficult for the US to have passed legislation in both the House andSenate by December 2009. Whilst President-elect Obama has already declaredemission reduction targets, passing legislation on the reduction target, extent of free auction and potential price caps could be a tall order given the restricted timeframe.
Given US emission levels have risen by 14% since 1990, Obama’s current targetsinclude a return to 1990 emission levels by 2020 and a further 80% reduction by2050. He has also called for a cap-and-trade system with 100% auctioning of allowances and has proposed a 10% contribution in the share of electricity fromrenewables by 2012 and 25% by 2025.
Whilst the Democrats are likely to be more in favour of environmental controlsthan the Republicans, the historic voting experience for environmental control hasbeen poor with the renewal of the wind production tax credit only passing throughSenate and Congress this year as an amendment to the TARP bail-out legislation.
In 1997 the Senate voted on whether the US should sign up to the internationaltreaty on GHG emissions that would eventually become the Kyoto Protocol, withthe result 95 to zero against unless it included targets for developing countries (41Democrat votes including vide president elect Joe Biden and Barbara Boxer, chairof the Senate environment committee).
The legislative process may be accelerated as in January Senator Barbara Boxer
(Democrat) is expected to introduce two pieces of carbon related legislation. Thefirst should create a grant programme to fund $15bn of clean energy technology (inline with Obama’s target of spending $150bn over 10 years on clean energy) whilstthe second would direct the US Environmental Protection Agency (EPA) todevelop a GHG cap-and-trade scheme by amending the existing Clean Air Act.
However the cap-and-trade scheme is expected to be based upon the proposedBingaman-Specter Low Carbon Economy Act of 2007, which proposed a price cap(“safety valve”) which started a $12/tonne (€9.2/tonne) increasing by 5% real perannum (about €19/tonne after 10 years).
This price cap would be in line with that proposed by Canada for its large finalemitters (LFE) trading system (C$15/tonne or €9.5/tonne) but is significantlybelow the current EUA or CER/ERU price, which would make linking the variousinternational schemes difficult. After abandoning the Kyoto Protocol in 2006Canada has proposed a 20% reduction in 2007 emissions by 2020, which wouldreturn emissions to around 1990 levels (compared to a Kyoto target of a 6%reduction from 1990 levels by 2012).
North America already operates a number of emission trading schemes, some of which are voluntary. Prices for Gold Standard Verified Emission Reduction credits
political body, a sort of non-government organization of green flavor. It's neither aforum of neutral scientists nor a balanced group of scientists. These people arepoliticized scientists who arrive there with a one-sided opinion and a one-sidedassignment. “
Obama targets less ambitious than EU but
will still be difficult to
enact
US and Canada likely to
have carbon price caps
around €9/tonne
US voluntary carbon
schemes trade at around
€10/tonne
8/3/2019 daiwa_carbonforecasts_2008
http://slidepdf.com/reader/full/daiwacarbonforecasts2008 25/28
(VERs), which are high quality CDM offsets which can be used in markets such asthe US without an emissions cap, currently trade at around €11/tonne, whilst theCalifornia Climate Action Registry (CCAR) VERs trade at around €8/tonne.
Ten Northeastern and Mid-Atlantic states have also established a mandatory cap-and-trade emission system, the Regional Greenhouse Gas Initiative (RGGI).
However, as with Phase I of the EU ETS, the cap for the period 2009-2014 of 188m short tons per annum looks to be in excess of existing emissions of some160m short tons. Although RGGI allowances have been oversupplied they stilltrade (presently $4/short ton) as their value reflects the optionality of conversioninto a wider federal scheme. However it is unclear at this stage on what basis thispotential fungibility will be allowed (e.g. one-for-one or two-for-one).
Japan trialling cap-and-
trade schemes and
reviewing €20/tonne
carbon tax
Japan is trialling a voluntary emissions trading scheme and is targeting a 60% to80% reduction in GHG emissions by 2050. Tokyo will introduce a cap-and-tradescheme in 2010 which will target a CO2 reduction of 25% vs 2000 by 2020. InNovember 2008 the Environment Ministry proposed a carbon tax equivalent toaround €20/tonne. GHG emissions in Japan in 2007 were 1,371mt an increase of
2.3% (31mt) vs 2006 and 8.7% higher than the Kyoto base of 1,261mt, although anestimated 63mt of the 2007 emissions resulted from lower nuclear availability (inlarge part due to the earthquake).
ustralia and New
Zealand may introduce
carbon trading in 2010
but targets less
ambitious than EU
Australia has delayed the announcement of its 2020 emission targets until after thePoznan meeting, but is expected to announce a cut of between 5% and 15%compared to 2000 levels by 2020, a lower reduction and a later base year than theEU reductions. Australia is also targeting a reduction of 60% in its emissions by2050. Australia is due to introduce a carbon cap-and-trade scheme in 2010.
New Zealand’s proposed carbon cap-and-trade scheme is also being reviewed bythe new government and its implementation may be delayed until 2010 (or could
be replaced with a carbon tax). Under the Kyoto Protocol New Zealand emissionswere targeted to be level compared to 1990 but have instead increased by 26%. Aunique problem for New Zealand is that half of the country’s GHG emissionsoriginate from agriculture where abatement techniques are currently less widelyavailable. Animal methane accounts for around 18% of global GHG emissions andscientists are attempting to come up with a solution (GM, vaccine, feedstuff) toreduce the output.
Carbon Report 25
8/3/2019 daiwa_carbonforecasts_2008
http://slidepdf.com/reader/full/daiwacarbonforecasts2008 26/28
Glossary
Additionality: A key eligibility test designed to generate carbon credits under the CDM and JIprogrammes. This test dictates that projects are only eligible for carbon credits if the resultingemission reductions were going to happen anyway (i.e. are additional to what would haveoccurred without the carbon credit incentive).
Assigned Amount Units (AAU): Scheme which allows the trading of assigned amount unitsbetween countries. AAUs can be used for compliance with the Kyoto treaty. Not valid for use inthe EU ETS or to meet EU targets in the non-traded sector.
Certified Emission Reduction unit (CER): Certified emission reduction unit represents onetoone of CO2 equivalent reduced under Joint Implementation.
Clean Development Mechanism (CDM): Scheme which allows credits to be issued from
projects reducing GHG gases in Kyoto non-Annex 1 countries (developing countries). Credits arevalid in the EU ETS and to meet EU targets in the non-traded sector, up to certain limits
Emission Reduction Unit (ERU): Emission Reduction Unit represents one tonne of CO2equivalent reduced under Joint Implementation.
Green Investment Schemes (GIS): Some countries are attaching Green Investment Schemesto AAUs in order to overcome buyers’ concerns about additionality. Examples of GIS includedirect investment in projects or policies to encourage non-fossil energy use, improvement inenergy efficiency or projects to slow the rate of deforestation.
Joint Implementation (JI): Scheme which allows credits to be issued from projects that reduceemissions of GHGs in Kyoto Annex I countries. Credit are valid in the EU ETS up to certain limits.
Voluntary Credits: Credits generated by a wide variety of projects and sold to companies orindividuals wishing to offset their emissions. No mandatory regulation. Currently no credits fromthese schemes can be used in the EU ETS or to meet EU targets.
Source: Climate Change Committee, carbonpositive
Carbon Report 26

8/3/2019 daiwa_carbonforecasts_2008
http://slidepdf.com/reader/full/daiwacarbonforecasts2008 27/28
Risks associated with our valuation and financial forecasts
There are risks associated with the share price reaching our Fair Value target and ourfinancial forecasts. Commodity prices, volumes and costs may not match our forecasts;as with any utility company, there are operating risks involved with power production;foreign currency exchange rate changes may impact the company’s revenues and costs;tax rates, industry regulation and legislation may be changed. There are also a large
number of technical and environmental risks associated with a utility company thatcould have an impact upon the company’s valuation and financial forecasts.
DIREL’s distribution of stock ratings
DIREL’s European ratings distribution is
Rating 1 (Buy) 1.5%Rating 2 (Outperform) 23.1%Rating 3 (Neutral) 55.4%Rating 4 (Under perform) 18.5%Rating 5 (Sell) 1.5%
DIREL’s distribution of stock ratings for investment banking clientsDIREL’s European ratings distribution is
Rating 1 (Buy) 1.5%Rating 2 (Outperform) 23.1%Rating 3 (Neutral) 55.4%Rating 4 (Under perform) 18.5%Rating 5 (Sell) 1.5%
Recommendation history
Carbon Report 27
8/3/2019 daiwa_carbonforecasts_2008
http://slidepdf.com/reader/full/daiwacarbonforecasts2008 28/28
DISCLAIMERThis material was produced by Daiwa Institute of Research Europe Limited for and on behalf of Daiwa Securities SMBC Europe Limited. Daiwa Institute of Research is thetrading name of Daiwa Institute of Research Europe Limited. Daiwa Institute of Research Europe Limited is an appointed representative of Daiwa Securities SMBC EuropeLimited which is authorised and regulated by The Financial Services Authority and is a member of the London Stock Exchange. This material is distributed in the UnitedStates by Daiwa Securities America, in Japan by Daiwa Securities SMBC Co. Ltd, Tokyo, and elsewhere in the world by Daiwa Securities SMBC Europe Limited, or another authorized affiliate of Daiwa Securities SMBC Europe Limited (such entities and their associated persons, the “Companies”). The Companies may, from time totime, to the extent permitted by law, participate or invest in other financing transactions with the issuers of the securities referred to herein (the “Securities”), performservices for or solicit business from such issuers, and/or have a position or effect transactions in the Securities or options therefore and/or may have acted as anunderwriter during the past three years for the issuer of such securities. In addition, employees of the Companies and of Daiwa Institute of Research and its affiliates mayhave positions and effect transactions in such securities or options and may serve as Directors of such issuers. Daiwa Securities SMBC Europe Limited may, to the extentpermitted by applicable UK law and other applicable law or regulation, effect transactions in the Securities before this material is published to recipients.
This document is intended for investors who are not retail customers within the meaning of the Rules of The Financial Services Authority and should not, therefore, bedistributed to retail customers in the United Kingdom. This document is not to be used or considered as an offer to sell or solicitation of an offer to buy any securities.Information and opinions contained herein have been compiled or arrived at from sources believed to be reliable, but none of the Companies, Daiwa Institute of Researchand/or its affiliates accepts liability for any loss arising from the use hereof or makes any representation as to their accuracy or completeness. Any information to which nosource has been attributed should be taken as an estimate by Daiwa Institute of Research. This document is not to be relied upon as such or used in substitution for theexercise of independent judgement. Should you enter into investment business with Daiwa Securities SMBC Europe’s affiliates outside the United Kingdom, we areobliged to advise that the protection afforded by the United Kingdom regulatory system may not apply; in particular, the benefits of the Financial Services CompensationScheme may not be available.
The analysts hereby certify that their views about the companies and their securities discussed in this report are accurately expressed and that they have not received andwill not receive direct or indirect compensation in exchange for expressing specific recommendations or views in this report. Daiwa Institute of Research Europe Limitedhas in place organisational arrangements for the prevention and avoidance of conflicts of interest. These include the requirement that the remuneration of Analysts must
not be linked to specific transactions carried out by underwriting or investment banking departments, nor may any decisions on remunerations of Analysts involve the saiddepartments directly. Additionally Daiwa Institute of Research Europe Limited requires that analysts must not make representations that are different from his/her ownindependent opinion in order to take account of interests of specific clients. Daiwa Institute of Research Europe Limited research has been published in accordance withour conflict management policy, which is available at<www.daiwasmbc.co.uk/pdfs/ResearchConflictsPolicy.pdf>
Additional note to our U.S. readers: Daiwa Securities America is distributing this document in the United States and, in connection therewith, accepts responsibility for itscontents. Any U.S. customer wishing to effect a transaction in any Security should do so only by contacting a representative at Daiwa Securities America in the U.S.
Recommendation GuidanceRecommendations, relative to the DJ STOXX 600 index, are based on the views of the author of the report.
1 - expected to outperform by more than 15%, 2 - expected to outperform by between 5% and 15%, 3 - expected to deviate no more than plus or minus 5%, 4 - expectedto underperform by between 5% and 15%, 5 - expected to underperform by more than 15%.
All DIR recommendations are made on a 6 months basis.
Hong KongThis publication is produced by Daiwa Institute of Research Europe Limited, and distributed by Daiwa Institute of Research (Hong Kong) Limited and/or its affiliates. Thispublication and the contents hereof are intended for information purposes only, and may be subject to change without further notice. Any use, disclosure, distribution,dissemination, copying, printing or reliance on this publication for any other purpose without our prior consent or approval is strictly prohibited. Neither Daiwa Institute of Research (Hong Kong) Limited, nor any of its affiliates, nor any of its or their respective directors, officers, servants and employees, represent nor warrant the accuracy or completeness of the information contained herein or as to the existence of other facts which might be significant, and will not accept any responsibility or liabilitywhatsoever for any use of or reliance upon this publication or any of the contents hereof. Neither this publication, nor any content hereof, constitute, or are to be construedas, an offer or solicitation of an offer to buy or sell any of the securities or investments mentioned herein in any country or jurisdiction nor, unless expressly provided, anyrecommendation or investment opinion or advice. Any view, recommendation, opinion or advice expressed in this publication may not necessarily reflect those of DaiwaInstitute of Research (Hong Kong) Limited, except where the publication states otherwise.
Daiwa Institute of Research (Hong Kong) Limited, its parent, holding, subsidiaries or affiliates, or its or their respective directors, officers, servants and employees mayhave positions in or may be materially interested in the securities in any of the markets mentioned or may have also performed investment banking and other services for the issuers of such securities.
Singapore
IN SINGAPORE, THIS RESEARCH REPORT IS DISTRIBUTED TO ACCREDITED INVESTORS, EXPERT INVESTORS AND INSTITUTIONAL INVESTORS ONLY.RECIPIENTS OF THIS RESEARCH REPORT IN SINGAPORE MAY CONTACT DAIWA INSTITUTE OF RESEARCH (SINGAPORE) PTE LTD IN RESPECT OF ANYMATTER ARISING FROM OR IN CONNECTION WITH THIS RESEARCH.
GermanyThis document is distributed in Germany by Daiwa Securities SMBC Europe Ltd, Niederlassung Frankfurt which is regulated by BaFin (Bundesanstalt fuer Finanzdienstleistungsaufsicht) for the conduct of business in Germany.
UAEDaiwa Securities SMBC Europe Limited, Dubai Branch is regulated by the DFSA for the conduct of business in the DIFC.
Additional inform ation may be available upon request.


