Daily FAS.L Line, FAS.L, Trade Price(Last), 13/05/2021 ...
47
Disclaimer: This research has been paid for by the company. Please read the important disclaimers at the end of this document. FIDELITY ASIAN VALUES Grabbing hold of the tiger’s tail Fidelity Asian Values (FAV) gives investors liquid access to the attractive small-cap Asian market (ex-Japan). Its long-term returns have beaten UK markets, Asian benchmarks, listed peers and open-ended fund comparators. This performance is driven by i) superior GDP growth, demographics, cherry-picking from 18,000 potential investments and markets with pricing anomalies, and ii) the value added by Fidelity, with i ts rigorous investment process, flexible mandate and active management. Risks include geopolitical and economic tensions, volatility and the market’s appetite for small-cap value stocks. FAV trades at a modest discount to NAV. ► Asia’s attractiveness: In addition to the above, new cross-border agreements could increase trade volumes and cut costs by $90bn and, across the region, governments are introducing business-friendly policies. After a period of underperformance, average Asian value P/Es are two-thirds growth ones. ► Fidelity adds value: Fidelity adds value by using locally-based analysts researching 1,000 companies in detail to identify where market expectations or valuations are wrong. These are mainly under-researched, high-return, well- managed, smaller-cap names. FAV has all the closed-ended-vehicle advantages. ► Valuation: Going into COVID-19, FAV was trading at a 4% discount to NAV and, following a strong share price performance in April 2021, it is back to this level. This rating is above that of most peers, and FAV has delivered superior long-term performance. The primary goal is capital growth, but there is a 2% dividend yield. ► Risks: Geopolitical and economic tensions may affect investments, and also sentiment. If growth/momentum stocks are in favour (as they have been for much of the period since 2016), FAV faces a relative headwind, which it has usually, but not always, overcome. Volatility of returns is likely to be high. ► Investment summary: FAV has delivered superior long-term returns by being in attractive growth markets and adding incremental value using structured, in- depth analysis to identify mis-priced investments. Its “value” investments have actually delivered higher earnings growth than the average Asian “growth” company, as well as being lower-rated and providing a higher return on equity. FAV is actively managed, and divergence from the benchmark performance, often for sustained periods, is to be expected. Financial summary and valuation Year-end Jul (£m) 2017 2018 2019 2020 2021E 2022E Investment income 8.4 8.7 11.5 10.6 8.4 11.9 Gains/losses on fin. instr. FV 44.9 4.1 16.6 -66.7 91.7 30.7 Inv. management fees -2.5 -2.6 -2.3 -1.7 -2.1 -1.7 Other expenses -0.9 -0.7 -0.8 -0.8 -0.8 -0.8 PBT 46.6 7.4 24.6 -54.5 97.3 40.1 Investments 264.1 273.7 312.7 241.3 340.2 372.7 Cash 14.8 11.5 5.8 21.3 13.7 13.7 NAV 280.2 288.0 323.0 269.4 356.8 389.3 NAV per share (p) 4.15 4.19 4.47 3.64 4.88 5.32 Discount to NAV -7% -2% 2% -8% -7% -15% Dividend (p) 5.00 5.50 8.80 8.50 9.00 9.50 Yield 1.1% 1.2% 1.9% 1.9% 2.0% 2.1% Source: Hardman & Co Research 14 May 2021 Closed End Investments Source: Refinitiv Market data EPIC/TKR FAS Price (p) 452 12m high (p) 500 12m low (p) 285 Shares (m) 73.2 Mkt cap (£m) 331 NAV (p, 12 May’21) 470 Premium /Discount to NAV -4% Country of listing UK Market Main (SSMM) Description FAV’s investment objective is to achieve long-term capital growth, principally from the stock markets of the Asian region, excluding Japan. Its performance is measured against the (net) sterling total return of the MSCI AC Asia ex Japan Small Cap Index. Company information Chair Kate Bolsover Snr. Ind. Clare Brady Chair Audit Cttee. Grahame Stott NED Tim Scholefield Michael Warren, Fund Manager Nitin Bajaj (PM), Ajinkya Dhavale (asst. PM) Contact FIL- [email protected] https://investment-trusts.fidelity.co.uk/fidelity- asian-values/?p=0&c=10 Key shareholders Fidelity/HL/II platforms 28.3% Charles Stanley 5.5% Brewin Dolphin 4.2% Rathbones 3.8% Smith and Williamson 3.1% Diary Mid-May April monthly summary Daily FAS.L 14/05/2019 - 13/05/2021 (LON) Line, FAS.L, Trade Price(Last), 13/05/2021, 456, -7, (-1.40%) Price GBp Auto 270 300 330 360 390 420 450 480 456 J J A S O N D J F M A M J J A S O N D J F M A M Q2 19 Q3 2019 Q4 2019 Q1 2020 Q2 2020 Q3 2020 Q4 2020 Q1 2021 Analyst Mark Thomas 020 3693 7075 [email protected]
Transcript of Daily FAS.L Line, FAS.L, Trade Price(Last), 13/05/2021 ...
Disclaimer: This research has been paid for by the company. Please read the important disclaimers at the end of this document.
FIDELITY ASIAN VALUES Grabbing hold of the tiger’s tail Fidelity Asian Values (FAV) gives investors liquid access to the attractive small-cap Asian market (ex-Japan). Its long-term returns have beaten UK markets, Asian benchmarks, listed peers and open-ended fund comparators. This performance is driven by i) superior GDP growth, demographics, cherry-picking from 18,000 potential investments and markets with pricing anomalies, and ii) the value added by Fidelity, with its rigorous investment process, flexible mandate and active management. Risks include geopolitical and economic tensions, volatility and the market’s appetite for small-cap value stocks. FAV trades at a modest discount to NAV.
► Asia’s attractiveness: In addition to the above, new cross-border agreements could increase trade volumes and cut costs by $90bn and, across the region, governments are introducing business-friendly policies. After a period of underperformance, average Asian value P/Es are two-thirds growth ones.
► Fidelity adds value: Fidelity adds value by using locally-based analysts researching 1,000 companies in detail to identify where market expectations or valuations are wrong. These are mainly under-researched, high-return, well-managed, smaller-cap names. FAV has all the closed-ended-vehicle advantages.
► Valuation: Going into COVID-19, FAV was trading at a 4% discount to NAV and, following a strong share price performance in April 2021, it is back to this level. This rating is above that of most peers, and FAV has delivered superior long-term performance. The primary goal is capital growth, but there is a 2% dividend yield.
► Risks: Geopolitical and economic tensions may affect investments, and also sentiment. If growth/momentum stocks are in favour (as they have been for much of the period since 2016), FAV faces a relative headwind, which it has usually, but not always, overcome. Volatility of returns is likely to be high.
► Investment summary: FAV has delivered superior long-term returns by being in attractive growth markets and adding incremental value using structured, in-depth analysis to identify mis-priced investments. Its “value” investments have actually delivered higher earnings growth than the average Asian “growth” company, as well as being lower-rated and providing a higher return on equity. FAV is actively managed, and divergence from the benchmark performance, often for sustained periods, is to be expected.
Financial summary and valuation Year-end Jul (£m) 2017 2018 2019 2020 2021E 2022E Investment income 8.4 8.7 11.5 10.6 8.4 11.9 Gains/losses on fin. instr. FV 44.9 4.1 16.6 -66.7 91.7 30.7 Inv. management fees -2.5 -2.6 -2.3 -1.7 -2.1 -1.7 Other expenses -0.9 -0.7 -0.8 -0.8 -0.8 -0.8 PBT 46.6 7.4 24.6 -54.5 97.3 40.1 Investments 264.1 273.7 312.7 241.3 340.2 372.7 Cash 14.8 11.5 5.8 21.3 13.7 13.7 NAV 280.2 288.0 323.0 269.4 356.8 389.3 NAV per share (p) 4.15 4.19 4.47 3.64 4.88 5.32 Discount to NAV -7% -2% 2% -8% -7% -15% Dividend (p) 5.00 5.50 8.80 8.50 9.00 9.50 Yield 1.1% 1.2% 1.9% 1.9% 2.0% 2.1%
Source: Hardman & Co Research
14 May 2021
Closed End Investments
Source: Refinitiv
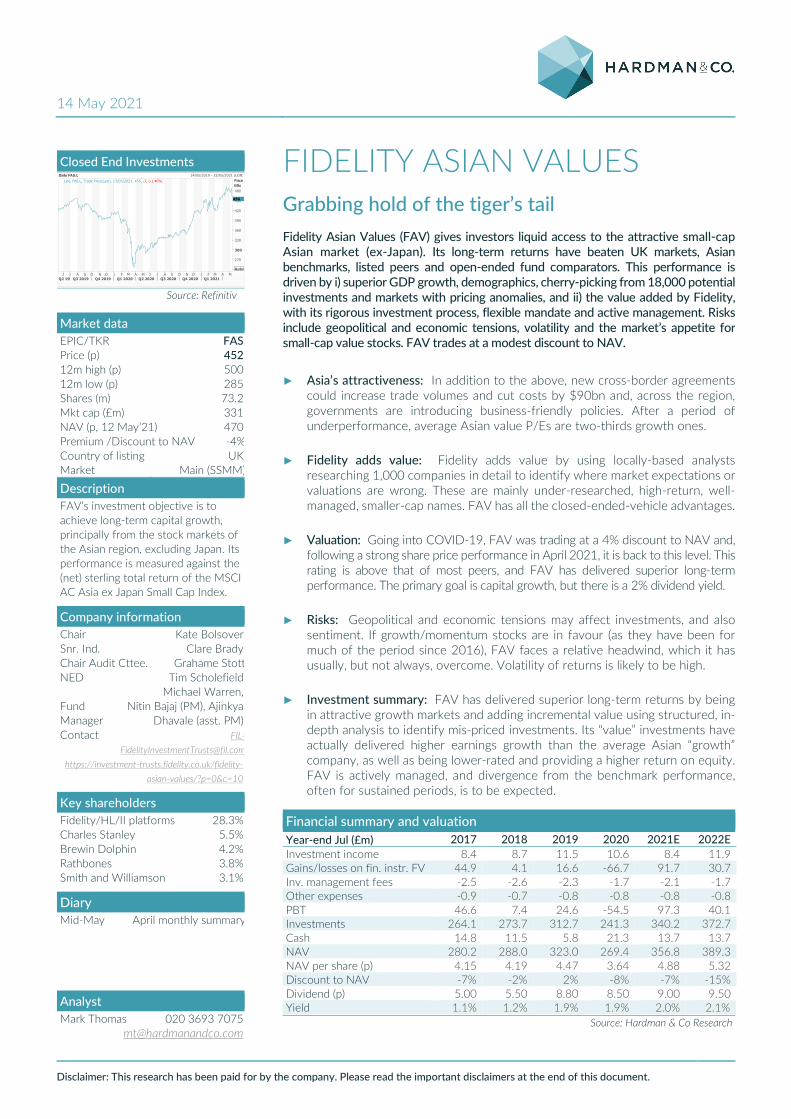
Market data EPIC/TKR FAS Price (p) 452 12m high (p) 500 12m low (p) 285 Shares (m) 73.2 Mkt cap (£m) 331 NAV (p, 12 May’21) 470 Premium /Discount to NAV -4% Country of listing UK Market Main (SSMM)
Description FAV’s investment objective is to achieve long-term capital growth, principally from the stock markets of the Asian region, excluding Japan. Its performance is measured against the (net) sterling total return of the MSCI AC Asia ex Japan Small Cap Index.
Company information Chair Kate Bolsover Snr. Ind. Clare Brady Chair Audit Cttee. Grahame Stott NED Tim Scholefield
Michael Warren, Fund Manager
Nitin Bajaj (PM), Ajinkya Dhavale (asst. PM)
Contact [email protected]
https://investment-trusts.fidelity.co.uk/fidelity-asian-values/?p=0&c=10
Key shareholders Fidelity/HL/II platforms 28.3% Charles Stanley 5.5% Brewin Dolphin 4.2% Rathbones 3.8% Smith and Williamson 3.1%
Diary Mid-May April monthly summary
Daily FAS.L 14/05/2019 - 13/05/2021 (LON)Line, FAS.L, Trade Price(Last), 13/05/2021, 456, -7, (-1.40%) Price
GBp
Auto
270
300
330
360
390
420
450
480
456
J J A S O N D J F M A M J J A S O N D J F M A MQ2 19 Q3 2019 Q4 2019 Q1 2020 Q2 2020 Q3 2020 Q4 2020 Q1 2021
Analyst Mark Thomas 020 3693 7075
Fidelity Asian Values
14 May 2021 2
Table of contents
Summary .................................................................................................................................4 Investment attractions .........................................................................................................8
1) FAV: superior long-term performance ......................................................................... 8 2) ASIA: superior GDP growth ......................................................................................... 10 3) ASIA: positive demographic trends ............................................................................ 10 4) ASIA: more business-friendly policies across region ............................................. 12 5) ASIA: opportunities from global trade growth ........................................................ 13 6) ASIA: 18,000 potential investments from which to cherry-pick ....................... 15 7) ASIA: stock market anomalies ..................................................................................... 16 8) ASIA: value vs. growth valuation gap ........................................................................ 17 9) ASIA: long-term “value” outperformed “growth” companies .............................. 17 10) ASIA: underweight in global funds .......................................................................... 18 11) FAV: investment process ........................................................................................... 19 12) FAV: flexible mandate ................................................................................................. 21 13) FAV: active manager ................................................................................................... 22 14) FAV: closed-ended structure .................................................................................... 24 15) FAV: good liquidity in shares .................................................................................... 25 16) FAV: strong (relative) ESG credentials ................................................................... 26
Investment-neutral issues ................................................................................................ 27 1) FAV: discount control mechanisms ........................................................................... 27 2) FAV: gearing ..................................................................................................................... 27 3) FAV: currency exposure ............................................................................................... 27 4) FAV: fees in line with peers ......................................................................................... 28 5) FAV: other KID disclosure ............................................................................................ 29 6) FAV: variable correlation with benchmark............................................................... 29 7) FAV: dividend policy ...................................................................................................... 30
Investment risks ................................................................................................................. 31 1) ASIA: geopolitical risk .................................................................................................... 31 2) ASIA: economic risk ....................................................................................................... 32 3) ASIA: ESG behind western developed countries ................................................... 34 4) FAV: market appetite for small-cap, Asian, value .................................................. 35 5) FAV: July 2019 to July 2020 – “annus horribilis” .................................................. 36 6) FAV: volatility of returns ............................................................................................... 38 7) FAV: cash holdings/limited gearing ........................................................................... 39
Portfolio ............................................................................................................................... 40 Valuation .............................................................................................................................. 41 Financials ............................................................................................................................. 42 Appendix 1: company matters ........................................................................................ 43 Disclaimer ............................................................................................................................ 46
Status of Hardman & Co’s research under MiFID II .................................................. 46

Fidelity Asian Values
14 May 2021 3
FAV has delivered long-term outperformance vs. UK benchmarks, local benchmarks, listed and open-ended funds
► Over five years, FAV’s total return has been ca.3x UK markets, delivering outperformance to its UK investor base.
► Over five years, Asia has outperformed world indices, despite not having any of the tech heavyweights making up the latter’s constituents.
► Despite a turbulent 2020, since inception in 1996, FAV has, on average, outperformed its benchmark by 1.4% p.a.
► Over five years, FAV has been the best-performing UK listed fund investing in Asian small-cap, and has outperformed open-ended funds materially.
IMF forecast of superior Asian real GDP growth going forward (chart indexed to 2018 at 100)
► Emerging Asia GDP performed better through COVID-19 and is expected to show faster growth going forward.
► It is driven by demographics – large, growing, urbanised populations, with increasing discretionary spending power.
► New trade agreements should reduce tariffs, increase volumes and lower costs.
► For FAV, Fidelity can cherry-pick from the 18,000 listed companies that fall into its mandate – more than the rest of world combined.
Breakdown of end-March 2021 portfolio by market capitalisation, and comparison with benchmark (%)
► Fidelity invests after detailed analysis by locally-based analysts.
► The focus on high-margin, well-managed, lowly-rated, businesses, which the market has under-researched leads to a small-cap bias.
► Average earnings growth has been ahead of “growth” classified companies.
► FAV avoids companies with high debt, margins above historical averages and concentrations of revenue. It also avoids companies that are not understandable or run by managements with questionable integrity.
NAV, ordinary share price and index total return by year to end-July, 2011-20 (%)
► FAV’s value approach can be out of favour for a number of years (e.g. FY’18-20), creating a performance headwind. Generally, the value added by Fidelity has overcome such pressures – but not always.
► The long-term trend of outperformance can still see periods of short-term underperformance and volatility.
► The investment process leads to a portfolio that bears a modest resemblance to any benchmark. Investors should expect performance to vary from the benchmark and indices.
Source: Company data, Hardman & Co Research
050
100150200250
FAV UK market
UK value UK small
90
140
2018 2019 2020E 2021P 2022PEmerging AsiaGlobal
-40
-20
0
20
40
60
>£10bn £5bn - £1bn £1bn -£5bn <£1bn
FAV Index Relative
-30
-20
-10
0
10
20
30
40
NAV (undiluted) Ord SP in year
Index (£) NAV vs index

Fidelity Asian Values
14 May 2021 4
Summary Investment positives FAV is a UK-listed vehicle offering investors exposure to the attractive small-cap Asian market (ex-Japan). It has delivered investor returns significantly above UK market averages (ca.2x since 2010 and 3x since 2016 – see left-hand chart below). Importantly, it has also outperformed over the long term against its local benchmark (1.4% since inception in 1996). Short-term performance can be more variable – on average, it outperformed its benchmark by 2.4% p.a. over FY’10-FY’19, and, despite specific headwinds in FY’20 (detailed below), by 0.2% p.a. over FY’10–FY’20 (see right-hand chart below). On the AIC website, at the time of writing, FAV is the best-performing Asia Pacific Smaller Company over one, five and 10 years. Against open-ended funds of a similar size in Asia, it has outperformed by 1% p.a. over five years.
FAV and UK benchmark’s total return, indexed to Annual NAV, SP, index total returns, FY’10-FY’20 January 2010 (100)
Source: Refinitiv, FAV report and accounts, Hardman & Co Research
The factors leading to this outperformance are twofold.
Firstly, it is in an attractive market, and we note:
► FAV operates in superior GDP growth markets.
► This is driven partially by the positive demographics of large, growing and young populations, which are increasingly urbanised and have growing discretionary spending power. China is a case study, with a 13.4% CAGR in consumer discretionary spend over 2000-20. The figure for Indonesia is 12%. India is expected to have 200m more urban dwellers by 2030.
► Governments across the region are adopting more business-friendly policies, with multiple capital markets de-regulation in China and government support in India, including Production Linked Incentives (PLI) schemes, lower taxes and infrastructure plans. India moved from 132 in 2013 to 63 in 2020, in the World Bank’s ease of doing business index. Indonesia enacted the Omnibus Law, inter alia, aiming to funnel investments into key industries. In addition, there are new international trade agreements that could reduce costs across Asia by $90bn.
► FAV’s Chinese companies are focused on domestic demand, with relatively modest exposure to a trade war with US. Across other countries, the impact of this tension is complex but, on balance, may see a net gain.
0
50
100
150
200
250
300
350
FAV UK market UK value UK small
-30
-20
-10
0
10
20
30
40
2011 2012 2013 2014 2015 2016 2017 2018 2019 2020
NAV (undiluted) Ord SP in year Index (£) NAV vs index
Superior returns for investors
Asia is attractive, because of: i) superior
GDP growth, ii) positive demographics, iii)
more business-friendly government
policies, inter alia, fostering global trade
growth, iv) 18,000 potential investments
from which to cherry-pick, v) stock market
pricing anomalies, vi) the value vs. growth
valuation gap, vii) “value” company
earnings growth ahead of “growth” ones
long term, vi) fund weightings
Fidelity Asian Values
14 May 2021 5
► FAV has a huge range of potential investment opportunities from which to cherry-pick as 18,000 listed companies fall into its mandate – more than the rest of world combined. FAV sources new ideas from its analytical model, peer comparisons, analyst and manager contacts, and external recommendations. The final portfolio is usually around 150, i.e. ca.1% of potential investments.
► Across Asian markets, there are pricing anomalies, with, for example, Chinese exchange trading dominated by retail, even though retail investors hold only 23% of shares.
► Asian value stocks, the focus of FAV’s portfolio, are historically cheap compared with growth companies.
► Over time, in Asia, value companies grow earnings faster than growth ones.
► Global investors are underweight the region. As China becomes an increasing part of global indices, it is likely to see an increasing number of buyers. Indian foreign ownership restrictions are easing, as is also the case in Indonesia.
Second, the outperformance reflects the value that Fidelity adds in this attractive market. FAV has delivered superior returns, because of this investment process, with a focus on finding good businesses, which are run by good people, and buying them at a good price. The objective is an absolute return of 50% over a three-year period. It has a competitive advantage in doing this – from the length of time the team has been locally-based, the size of the team and having a disciplined, structured approach to analysis. FAV avoids companies with high debt and high margins, compared with historical averages and concentrations of revenue, and ones that are not “understandable” or are run by managements with questionable integrity. FAV does not buy distressed companies that are very cheap, believing that, over a reasonable hold period, the compounding returns offered by strong companies offer a better option. The cheap, bombed-out companies’ investment approach can add value, but incurs all the risks from having to constantly renew the portfolio.
In addition, we note that:
► FAV has a broad mandate, with flexibility to take the best opportunities available to it. It has been an active user of derivatives – exposure is usually around 5%-7% of investments – but this rose to over 10% at end-FY’19 and nearly 15% at end-FY’20.
► It is an active manager, with average turnover over FY’16-FY’20 of 59%, as the manager is “selling what has gone up and recycling into new ideas”. The top five positions and the biggest conviction ideas, in normal times, have a longer-than-average hold period. Given this rapid turnover in the portfolio, investors should focus on the structured investment process, not the specific portfolio on any given date.
► FAV benefits from being a closed-ended vehicle. This structure we believe outperforms open-ended ones, as they have less cash drag, can invest long term, offer more favourable trading options, have a board of directors to supervise, and allow gearing. We estimate FAV’s performance at 1% p.a. above the average of the closest open-ended funds over five years.
► There is good liquidity in FAV shares, and its register has little concentration.
► Relative to its market, FAV is well ahead on Environmental, Social and Corporate Governance (ESG) issues. FAV has 2.3x the proportion of its portfolio in the top three MSCI ESG ratings compared with the index.
Fidelity adds value through rigorous,
structured investment process, using
detailed analysis to identify mis-priced
investments and avoid high-risk ones
Also adds value through i) flexible
mandate, ii) active position and portfolio
management, iii) closed-ended structure.
Investors should focus on value-added
process, rather than portfolio, on any
given date.

Fidelity Asian Values
14 May 2021 6
Investment-neutral factors
In terms of investment-neutral factors, we note:
► The discount can be helped by buybacks, but this can create liquidity issues, worsen expense ratios and send mixed messages regarding growth prospects. The overall discount management policy of FAV is to selectively issue shares when at a premium, and buy them back when the discount is above-average.
► While there has been some gearing, its use has been modest.
► Currency exposure is complex and unhedged. We believe investors are partially buying into this exposure.
► FAV’s fees have been on a steadily declining trend, and the performance-related variable fee element can reduce or increase managers’ charges by nearly a quarter. Overall, though, FAV is in line with its peers on Association of Investment Companies (AIC) and Key Information Document (KID) bases.
► KIDs need to be treated with caution, but, against its closest peers, FAV’s KID appears to indicate a slightly wider spread of potential performance.
► Given the management approach outlined above it is not surprising that FAV’s share price is not closely correlated to indices. The general direction of travel is similar, but just because the Asian markets may be rising or falling, this does not mean FAV will track these movements. Over time, FAV has delivered outperformance.
► FAV’s objective is long-term capital growth, so there is a modest dividend (2% yield). Despite FAV’s income being more robust than the market as a whole, for FY’20, there was a 3.5% reduction in the dividend. This reflected market uncertainties at the time. The dividend doubled over FY’11 to FY’15, doubled again in FY’16, and more than doubled again over FY’16 to FY’18.
Investment risks/downsides The key investment risks are:
► Geopolitical risk, including the broadening of US/China tensions, where we note that the rivalry may be less overt but no less intense than under the previous US administration. These risks also have an impact on sentiment.
► Economic risks include China, where private debt has risen sharply, where almost a quarter of the banking system would fail a stress test where non-performing double. A potential housing bubble has developed in some parts of China, and it is country going through major structural changes, which may not be smooth. Indian inflation consistently remained above the upper end of the 2%-6% target range through 2020 and has only recently returned to this range. Across the region, COVID-19 second and third waves have been seen (again, most notably in India), and the tourism outlook is uncertain. We conclude, though, that the markets are structurally different from the situation in the past, making a 1997 type of crisis unlikely to recur.
► On average, Asian ESG is below that of other regions. Climate change is an important factor, and the IMF reports that Southeast Asia could suffer bigger losses than most regions in the world, as well as unknown economic effects from reducing emissions.
FAV has a number of investment-specific risks, including:
Investment-neutral issues include i)
discount control mechanisms, ii) gearing,
iii) currency exposure, iv) fees, v) other
KID disclosure, vi) variable correlation
with benchmark, vii) dividend policy
We believe key risks are i) geopolitical risk
across Asia, ii) economic uncertainty from
COVID-19 and structural changes in the
Asian market, iii) market appetite for
Fidelity’s investment style (i.e. value vs.
growth/ momentum), iv) impact of FY’20
“annus horribilis” on sentiment, v)
volatility of returns, vi) FAV cash and large
company holdings, vi) Asia’s relatively
slow development of ESG
Fidelity Asian Values
14 May 2021 7
► FAV’s value approach can be out of favour for a number of years (e.g. FY’18-FY’20). This creates a headwind against performance, which, generally, FAV’s value-added approach has overcome, but, in other periods, it has led to material underperformance.
► There was underperformance FY’20, which will impact the track record for a number of years to come. That period saw market appetite for growth over value reaching record highs. Fidelity’s modelling did not capture all the growth in tech-enabled businesses that was accelerated from years/decades into months. There was a severe impact of COVID-19 on some long-term, high-conviction holdings, which FAV, with hindsight, proved slow to sell, and it impacted business models like airlines. Bottom-up stock-picking also resulted in exposures to countries with an above-average COVID-19 impact. We believe the important issue for investors is the lessons that were learnt. The fundamental approach, which has delivered long-term outperformance, is likely to be unchanged, but we do expect more diversification and an awareness of short-term noise.
► FAV’s investment style is likely to generate high volatility in both absolute terms and relative to benchmarks.
► Arguably, FAV does not fully exploit the advantages of being a closed-ended fund with relatively limited gearing.
Portfolio As we noted above, FAV is an active manager of its portfolio, and has a bottom-up stock selection approach. The portfolio metrics below are the results of this policy and are not the objective in themselves. We believe investors are buying into the model, not the specific portfolio, at any given time. Noting this caveat, the latest portfolio is always available on the FAV website. At the time of publication (and so the end-March 2021 portfolio), some of the key highlights were:
► The portfolio was not fully invested (net equity exposure was 98.2% of total NAV).
► By country, it was relatively overweight China (22.5% vs. 13.0%), Australia (6.2% vs. nil), India (24.1% vs. 19.2%) and Indonesia (6.6% vs. 2.0%). It was underweight Taiwan (8.4% vs. 24.3%), South Korea (10.2% vs 20.3%) and Singapore (2.4% vs. 5.4%). We detail the reasons for these exposures below.
► By sector, the big overweight positions are consumer discretionary (20.8% vs. 12.7%) and financials (15.6% vs. 9.0%), and the underweights are real estate (3.4% vs. 10.0%) and IT (14.3% vs. 19.9%).
► Against its small-cap index comparator, FAV was overweight in companies with market capitalisations of over £10bn (17.6% vs. index 0.4%) and in the £0-1bn range (54% vs. index 42%), and underweight the £1bn-5bn range. We explore the incremental liquidity advantages of large-cap holdings in the section below, but they meet FAV’s hurdle return requirements, reflecting, again, where market research has failed to identify pricing anomalies.
Valuation In terms of valuation, FAV trades at small discount to NAV (4%), compared with a small premium rating ahead of the COVID-19 crisis. It has used buybacks to manage unusually large discounts, and it has the authority to issue shares from Treasury when trading at a premium. Most listed comparators trade at much larger discounts, and we note that FAV has delivered superior investment returns to them.
Bottom-up stock selection means
portfolio concentrations are result of not
being driver to investment decisions. Long
term, investors are buying into that
process.
Small discount, in line with pre-COVID-19
levels
Fidelity Asian Values
14 May 2021 8
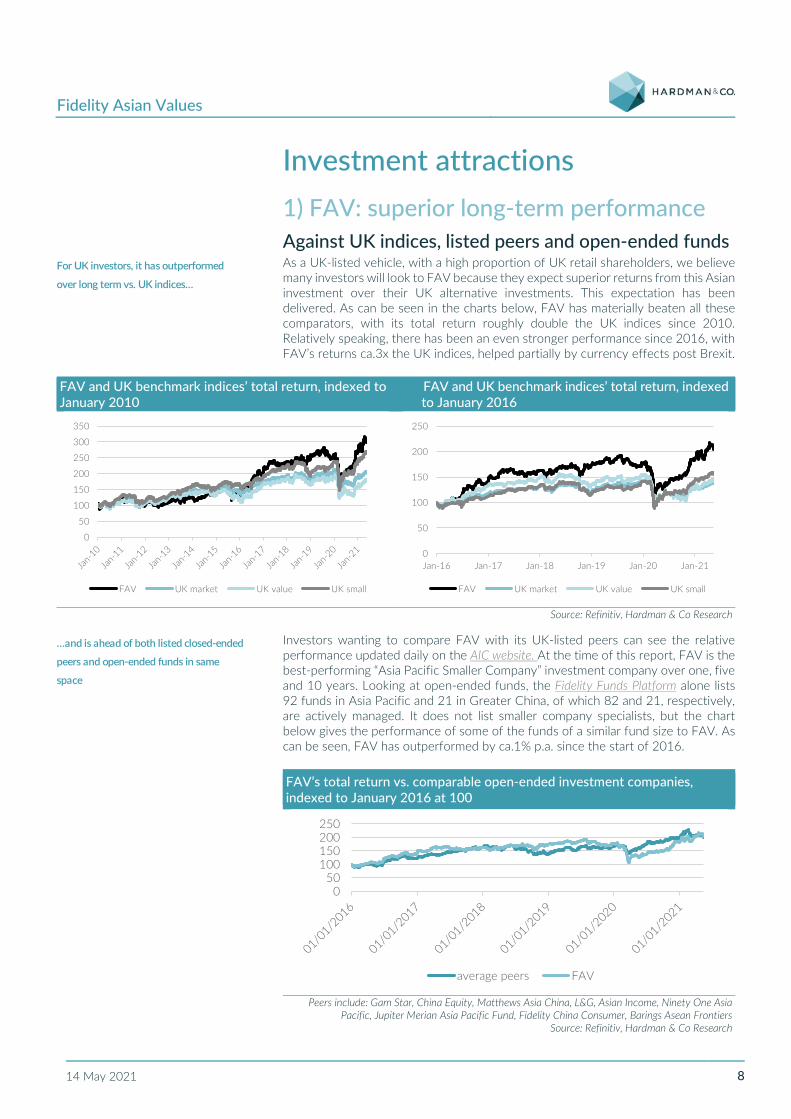
Investment attractions 1) FAV: superior long-term performance Against UK indices, listed peers and open-ended funds As a UK-listed vehicle, with a high proportion of UK retail shareholders, we believe many investors will look to FAV because they expect superior returns from this Asian investment over their UK alternative investments. This expectation has been delivered. As can be seen in the charts below, FAV has materially beaten all these comparators, with its total return roughly double the UK indices since 2010. Relatively speaking, there has been an even stronger performance since 2016, with FAV’s returns ca.3x the UK indices, helped partially by currency effects post Brexit.
FAV and UK benchmark indices’ total return, indexed to FAV and UK benchmark indices’ total return, indexed January 2010 to January 2016
Source: Refinitiv, Hardman & Co Research
Investors wanting to compare FAV with its UK-listed peers can see the relative performance updated daily on the AIC website. At the time of this report, FAV is the best-performing “Asia Pacific Smaller Company” investment company over one, five and 10 years. Looking at open-ended funds, the Fidelity Funds Platform alone lists 92 funds in Asia Pacific and 21 in Greater China, of which 82 and 21, respectively, are actively managed. It does not list smaller company specialists, but the chart below gives the performance of some of the funds of a similar fund size to FAV. As can be seen, FAV has outperformed by ca.1% p.a. since the start of 2016.
FAV’s total return vs. comparable open-ended investment companies, indexed to January 2016 at 100
Peers include: Gam Star, China Equity, Matthews Asia China, L&G, Asian Income, Ninety One Asia
Pacific, Jupiter Merian Asia Pacific Fund, Fidelity China Consumer, Barings Asean Frontiers Source: Refinitiv, Hardman & Co Research
0
50
100
150
200
250
300
350
FAV UK market UK value UK small
0
50
100
150
200
250
Jan-16 Jan-17 Jan-18 Jan-19 Jan-20 Jan-21
FAV UK market UK value UK small
050
100150200250
average peers FAV
For UK investors, it has outperformed
over long term vs. UK indices…
…and is ahead of both listed closed-ended
peers and open-ended funds in same
space

Fidelity Asian Values
14 May 2021 9
Against emerging market indices The charts below show the performance of the Asia markets ex-Japan compared with a range of emerging market benchmarks.
► Asia ex-Japan’s performance has been slightly above that of emerging markets over the longer time scale, and has seen just over 1% outperformance over the past five years.
► We note that, compared with some emerging markets (and we have included Brazil in the right-hand chart below to illustrate the effect), the Asian index has been relatively less volatile.
Emerging markets, Asia and World indices, Emerging markets, Asia, Brazil indexed to January 2010 and World indices, indexed to January 2016
Note: shown in US$ terms. Source: Refinitiv, Hardman & Co Research
FAV’s long-term outperformance against its Asian benchmark Investors want not only to be in an attractive market, but also want the best investment in that market. Again, FAV has delivered on this expectation. As can be seen in the chart below, in six of the years 2011-20, FAV outperformed its benchmark. From FY’11 to FY’19, the average outperformance was 2.4%. Including the year to March 2020, which we explore in more detail in a section below, FAV has, on average, outperformed its benchmark by 0.2% p.a. over FY’10 to FY’20. We show the chart below, not only to demonstrate the outperformance, but also the volatility of returns – an issue we also address a little later in the report.
Performance total return for FAV’s NAV and share price, its sterling index, and comparison of NAV to the index (%)
Source: FAV 2020 Report and Accounts, Hardman & Co Research
050
100150200250300
Emerging Market Asia ex Japan
World Brazil
050
100150200250
Jan-16 Jan-17 Jan-18 Jan-19 Jan-20 Jan-21
Emerging Market Asia ex Japan
World Brazil
-30
-20
-10
0
10
20
30
40
2011 2012 2013 2014 2015 2016 2017 2018 2019 2020
NAV (undiluted) Ord SP in year Index (£) NAV vs index
Asia been above-average-return emerging
market…
…and FAV has outperformed local
benchmark indices by average of 2.4%
p.a. FY’11 to FY’20 and, despite an
“annus horribilis”, by 0.2% p.a. FY’11 to
FY’20
Fidelity Asian Values
14 May 2021 10
The following sections explore why Asia is an attractive market, delivering superior returns, and also how Fidelity has added value. GDP growth is not always related to rising equity prices but provides a helpful following wind.
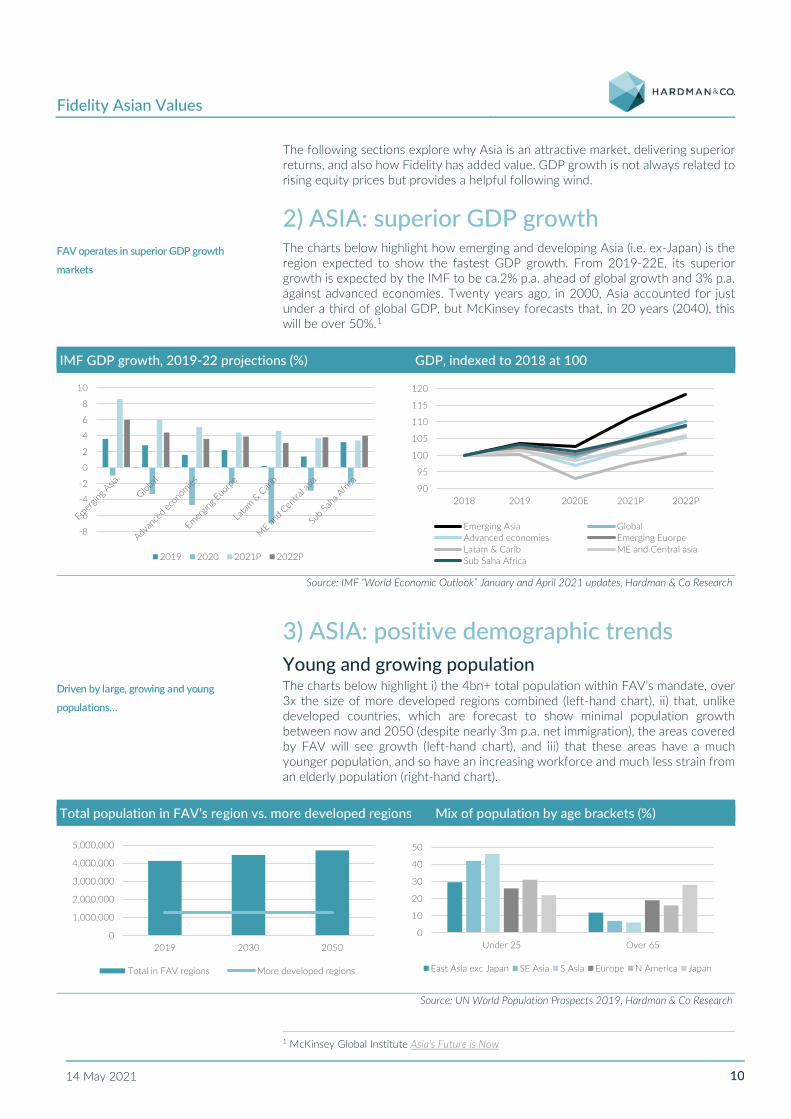
2) ASIA: superior GDP growth The charts below highlight how emerging and developing Asia (i.e. ex-Japan) is the region expected to show the fastest GDP growth. From 2019-22E, its superior growth is expected by the IMF to be ca.2% p.a. ahead of global growth and 3% p.a. against advanced economies. Twenty years ago, in 2000, Asia accounted for just under a third of global GDP, but McKinsey forecasts that, in 20 years (2040), this will be over 50%.1
IMF GDP growth, 2019-22 projections (%) GDP, indexed to 2018 at 100
Source: IMF “World Economic Outlook” January and April 2021 updates, Hardman & Co Research
3) ASIA: positive demographic trends Young and growing population The charts below highlight i) the 4bn+ total population within FAV’s mandate, over 3x the size of more developed regions combined (left-hand chart), ii) that, unlike developed countries, which are forecast to show minimal population growth between now and 2050 (despite nearly 3m p.a. net immigration), the areas covered by FAV will see growth (left-hand chart), and iii) that these areas have a much younger population, and so have an increasing workforce and much less strain from an elderly population (right-hand chart).
Total population in FAV’s region vs. more developed regions Mix of population by age brackets (%)
Source: UN World Population Prospects 2019, Hardman & Co Research
1 McKinsey Global Institute Asia’s Future is Now
-8
-6
-4
-2
0
2
4
6
8
10
2019 2020 2021P 2022P
90
95
100
105
110
115
120
2018 2019 2020E 2021P 2022P
Emerging Asia GlobalAdvanced economies Emerging EuorpeLatam & Carib ME and Central asiaSub Saha Africa
0
1,000,000
2,000,000
3,000,000
4,000,000
5,000,000
2019 2030 2050
Total in FAV regions More developed regions
0
10
20
30
40
50
Under 25 Over 65
East Asia exc Japan SE Asia S Asia Europe N America Japan
FAV operates in superior GDP growth
markets
Driven by large, growing and young
populations…

Fidelity Asian Values
14 May 2021 11
Urbanisation and discretionary income growth The growth in population is also seeing a shift to more urban living and the greater associated infrastructure investment. As the young population moves into urban-related work, the average disposable income is expected to increase, leading to even faster growth in discretionary consumer spending. The left-had chart below shows the expected growth in the urban population over the next 10 years (the world figure is, of course, inflated by having large, higher growth in the Asian countries). We note, by way of example, that in China, the five-year plan communique noted that under the last plan “55.75 million rural poor people have been lifted out of poverty and more than 60 million new jobs have been created in urban areas….must continue their efforts and work together to ensure that the fight against poverty is won”2. Put simply, in China, the equivalent of the people of the entire population of the UK have become urban dwellers in just five years. The relative growth of the Asia-wide middle class is dramatic (EY, citing the Brookings Institution3, noted that the Asian share of global middle classes will rise to 60% in 2025, from 54% 2020).
The left-hand chart below shows the expected growth in urban populations, and the right-hand chart below shows the proportion of the population who are urban dwellers. The starting position is very low relative to more developed economies. India has less than half its population in urban centres than is the case for the developed world, and China is around three quarters of that level.
Annual growth in urban population (%) 2019 proportion of population in urban centres (%)
Source: UN Word Urbanisation Prospects 2018, Hardman & Co Research
The Kearney Consumer Wealth and Spending Study concurs with our view that, as consumers’ income and wealth rise, their spending habits change, with a much greater proportion of income spent on discretionary items, rather than basic necessities. It may be expected that this growth in spending will be focused in sectors such as financial services, consumer discretionary and leisure. In addition, China will see a huge increase in the number of older people requiring more healthcare. Page 21 of the MacKinsey report, Meet the 2020 Chinese Consumer, noted that it expected that the proportion of household income spent on food would fall from 43% in 2000 to just 20% in 2020 (CAGR nominal spend of 7.2%). In contrast, it saw a CAGR in semi-necessities of 10.9% and discretionary spend of 13.4% over the same period. By way of further example, the Global Demographics piece, The Growing demand for Healthcare in China, indicated that people over the age of 45 would rise from 271m to 412m over 10 years, and that healthcare would rise from 5.3% of GDP in 2018 to 5.9% by 2028 (still well below “old” Asian countries, such as Japan, where the spend is 7%-10%).
2 http://www.gov.cn/xinwen/2020-10/29/content_5555877.htm 3 https://www.ey.com/en_gl/geostrategy/how-to-reframe-your-asian-growth-strategy
0.0
0.5
1.0
1.5
2.0
2.5
World S Asia SE Asia India
2020-2025 2025-20300
10
20
30
40
50
60
70
80
90
S Asia India E Asia andPacific
China EU N America
…which are increasingly urbanised and
with growing discretionary spending
power
Proportion of population in urban centres
in India below half EU/ North America.
China around three quarters.
China case study: 2000-20 discretionary
spend CAGR 13.4%

Fidelity Asian Values
14 May 2021 12
Number of urban households by annual household income (m) and CAGR rate, 2000-20E (%)
Source: p.14 MacKinsey report, Meet the 2020 Chinese Consumer, Hardman & Co Research
The UN is forecasting an additional ca.200m urban population in India by 2030 (up by nearly half), and that there will be an estimated shortfall of 110m homes by 20224. The Indian real estate market is currently worth $180bn. By 2025, it is expected to reach $650bn, and, by 2030, $1tr5. This would make it the third-largest real estate market globally. It is expected to contribute ca.13% to GDP by 2025. Cushman and Wakefield estimate that it currently contributes 6% (possibly on a slightly narrower definition). India’s overall population is growing by ca.25m a year. This creates an enormous demand for infrastructure, as well consumer-related projects – all fuelling GDP growth.
India now has 650m smartphone users, and 99% of all digital transactions take place over the phone, as most citizens have sidestepped the laptop/desktop journey. The smartphone caters for every need, and India has one of the lowest data costs globally (13 US cents per GB per month). Reflecting strong mobile penetration, the government launched its United Payments Interface (UPI), which acts as a gateway through which all digital transactions pass, catching both Mastercard and Visa off guard, and enabling enterprises and individuals to transact with each other through a single portal. Currently, UPI processes $2bn transactions daily, but this is expected to grow significantly, as digital transactions increasingly gain market share.
As a reflection of the way that India is changing, there are now ca.450m bank accounts in India, which is more than one bank account per family. It is through these bank accounts that all subsidy payments are now delivered, and internet banking is rapidly replacing the need to form an orderly queue.
According to the 2020 World Bank report, Aspiring Indonesia —Expanding the Middle Class, i) over the past 20 years, the majority of the poor and vulnerable in Indonesia have climbed out of poverty and into the aspiring middle class, where there are now ca.115m people who belong in this category, and ii) the Indonesian middle class has been a major driver of economic growth, as the group’s consumption has grown at 12% p.a. since 2002, and now represents close to half of all household consumption in Indonesia.
4) ASIA: more business-friendly policies across region We note that the general trend has been for de-regulation and more business-friendly policies across the region. Some of the more notable examples include:
4 Source: India Brand Equity Foundation (IBEF) a trust established by the Department of Commerce,
Ministry of Commerce and Industry, Government of India) 5 Source: IBEF, KPMG, Colliers International, Economic Times
0
50
100
150
200
<6k $6k to $16k $16k to $34k >$34k2000 2010 2020
CAGR -3.8% 1.2% 26.6% 20.4%
India case study: forecast to have extra
200m urban dwellers by 2030
650m smartphone users
Now ca.450m bank accounts in India
Indonesia middle class consumption
CAGR 12% 2002-20

Fidelity Asian Values
14 May 2021 13
The Chinese five-year plan communique emphasised the strategic intent for more openness. Capital market reforms in China include i) the loosening of short-selling restrictions, ii) the lowering of foreign investment restrictions, iii) the implementation of a registration-based IPO mechanism, launched in July 2020 on the STAR Board and now being employed on ChiNext, iv) more flexible listing criteria, allowing variable interest entity (VIE) structured companies to list, which could see more tech/new economy companies listing on the A-share market, and v) the May 2020 removal of the Qualified Foreign Institutional Investor (QFII) investment quota, where QFIIs used to be required to apply for any investment quotas from the State Administration of Foreign Exchange6.
The Indian government has initiated a bold incentive programme, with the aim of making India a global manufacturing hub. The government’s PLI schemes, totalling US$27bn thus far, mark a distinct shift in the country’s industrial policy. While earlier policies tended to spray incentives thinly across industries, PLI schemes focus on building select domestic champions in each industry. PLI 1.0, entailing US$7bn over five years, aimed to create manufacturing hubs for mobile phones, APIs (Active Pharmaceutical Ingredients) and medical devices. Government targets call for India to emerge as the second-largest hub for smartphone manufacturing, with US$100bn of exports over the next five years. Following early success with PLI 1.0, the government has launched PLI 2.0, worth US$20bn, covering 10 industries, including automotive, storage batteries, food processing and networking equipment. On 5 November 2020, Prime Minister Modi held a meeting with the top 20 global investment funds to attract investment into the infrastructure space. India’s government is offering tax-free status to the long-term infrastructure projects in which these funds invest (no capital gains tax, income tax or dividend-related tax liabilities). In 2017, the statutory corporate tax rate was reduced from 30% to 22% – a lower rate than the global average corporate tax of 23.8% (Source: Funds-europe.com). The government has also embarked on a marked programme of de-monetisation of bank notes. It has made many simplifying changes to the administration of taxes, while aiming to increase compliance.
The government’s related measures also saw India move from 132 in 2013 to 63 in 2020, in the World Bank’s ease of doing business index. Interestingly, it has gone from 182 to 27 for dealing with construction permits, from 49 to 13 for protecting minority shareholders, and from 116 to 52 for resolving insolvency.
Indonesia enacted an Omnibus Law that consolidated a raft of measures, including the Jobs Creation Bill. This more liberal regime could be a game-changer in funnelling foreign investments into a myriad of industries, ranging from communications and technology to energy and tourism. More broadly, the EY report, How to reframe your Asian growth strategy7, noted that several Asian governments are “intervening heavily to foster domestic industries”, especially in the digital and fintech space.
5) ASIA: opportunities from global trade growth The CPTPP is a trade agreement between Australia, Brunei, Canada, Chile, Japan, Malaysia, Mexico, New Zealand, Peru, Singapore, and Vietnam, signed on 8 March 2018, which came into force on 30 December 2018. In addition, the UK has applied to become part of this agreement, and Colombia, Thailand and the Republic of Korea (RoK) are also considering joining the bloc. There is the added potential that President Biden may be more willing to join the CPTPP, not least as he commented about its predecessor, “TPP wasn’t perfect but the idea behind it was a good one”.
6 https://www.safe.gov.cn/en/2020/0507/1677.html 7 https://www.ey.com/en_gl/geostrategy/how-to-reframe-your-asian-growth-strategy
Multiple capital markets de-regulation in
China, with stated objective of increasing
openness
In India, government support, including
PLI schemes, lower taxes and focus on
helping infrastructure
India moved from 132 in 2013 to 63 in
2020, in the World Bank’s ease of doing
business index
Indonesia enacted Omnibus Law
Comprehensive and Progressive
Agreement for Trans-Pacific Partnership
(CPTPP), with main beneficiaries within
FAV mandate

Fidelity Asian Values
14 May 2021 14
According to a BBC report, citing The Peterson Institute for International Economics,8 a number of countries could expect 2%+ incremental GDP by 2030 (Malaysia, Singapore, Brunei and Vietnam). For countries largely outside FAV’s mandate (New Zealand, Chile, Canada, Mexico, Japan and Australia), the benefits are more muted (estimated 1% or less by that date).
On 15 November 2020, the RCEP, a multi-lateral free trade agreement between China, Japan, South Korea, New Zealand and Australia, and the 10 countries in the Association of South-East Asian Nations (ASEAN: Vietnam, Laos, Myanmar, Thailand, Malaysia, Indonesia, Brunei, Cambodia, Singapore and the Philippines) was signed, and is likely to be effective by end-2021. For most countries, the RCEP consolidates and updates existing arrangements, but it is incrementally beneficial to China, Japan and South Korea. It also reduces non-tariff barriers by creating a common rule of origin, easing supply chains and transaction costs. Allianz Research9 puts the reduced costs at $90bn p.a. (4% on 2019 intra-regional trade and 0.5% on global merchandise trade).
Average potential gains in annual intra-zone merchandise Trade, thanks to RCEP common rule of origin (USD bn)
Source:
https://www.eulerhermes.com/content/dam/onemarketing/ehndbx/eulerhermes_com/en_gl/erd/publications/pdf/2020_11_17_RCEPrulesoforigin.pdf, citing UNCTAD, World Bank and Allianz Research,
Hardman & Co Research
US/China trade wars – little direct impact, and may be net positive FAV’s exposure to trade wars, between, say, China and the US, is complex. With over a third of the portfolio in Greater China, some investors may be concerned that FAV investee companies could be affected directly. We believe the direct effect will be modest. The chart below shows the exposure to Greater China by sector and geography, with 41% of that region’s exposure to consumer discretionary and a further 12% to consumer staples. The bias of the portfolio in Greater China is to domestic-demand-driven businesses, not exporters. In broad sectors, like industrials, we understand that the bias is also weighted to domestic demand. Clearly, slower exports could slow domestic demand, but the Chinese authorities appear to be taking action to mitigate this. Given this domestic focus, and bearing in mind the opportunities from the new trade agreements for intra-regional trade, we conclude that FAV’s direct Chinese exposure to trade wars is modest.
8 https://www.bbc.co.uk/news/business-43326314 9
https://www.eulerhermes.com/content/dam/onemarketing/ehndbx/eulerhermes_com/en_gl/erd/publications/pdf/2020_11_17_RCEPrulesoforigin.pdf
05
1015202530
Regional Comprehensive Economic
Partnership (RCEP) potentially reducing
costs across Asia by $90bn
FAV’s Chinese companies focused on
domestic demand with relatively modest
exposure to trade war with US

Fidelity Asian Values
14 May 2021 15
Great China sector exposure as percentage of total shareholder funds
Source: July 2020, FAV 2020 Report and Accounts, Hardman & Co Research
For the rest of Asia, we see the risks and opportunities as
► Global supply chains may be strained and, where any of the links are weakened, this could create pressure through the whole manufacturing chain.
► Importers and exporters unable to source from China/the US may look to other Asian countries. For many years, there has been a trend of manufacturing to countries such as Vietnam, as China migrates from being a low-cost production site into a more developed economy. Any trade war between the US and China may further accelerate this long-term trend.
► Freight rates (currently unusually high) could fall if there is less global trade, thus reducing costs of exporting to the US.
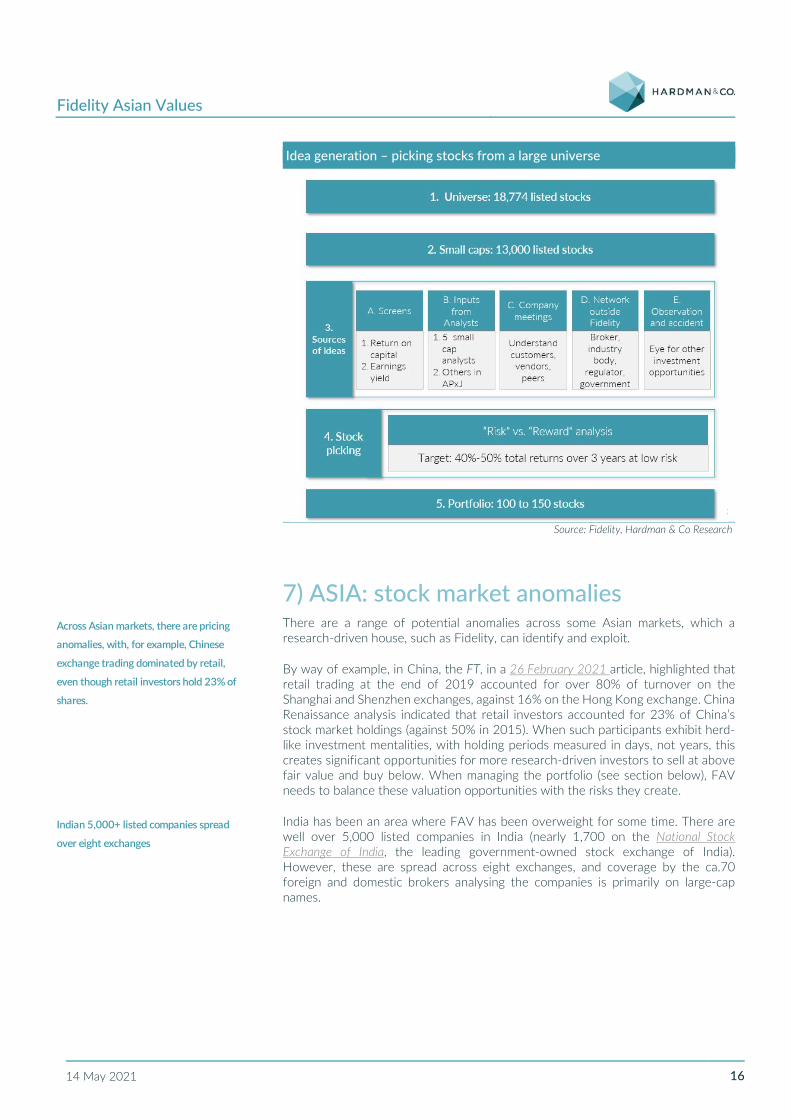
6) ASIA: 18,000 potential investments from which to cherry-pick With more than 18,000 listed companies in Asia – which is more than the rest of the world put together – there is a huge opportunity for a fundamentally-driven stock picker that can fully utilise Fidelity's extensive locally-based analyst team. Ideas are generated from on-the-ground analyst input, including peer, competitor and supplier reviews from company meetings. This is complemented by Fidelity’s global reach and input from external research providers, alongside the manager’s own market network, and joining the dots via multiple information sources.
0
2
4
6
8
10
12
14
16
Cons discret. Financials IT Industrials Healthcare Cons staples Others
China HK Taiwan
Across other countries, situation is
complex but, on balance, may see net gain
18,000 companies fall in FAV’s Asian
mandate – more than rest of world
combined
Fidelity Asian Values
14 May 2021 16
Idea generation – picking stocks from a large universe
Source: Fidelity, Hardman & Co Research
7) ASIA: stock market anomalies There are a range of potential anomalies across some Asian markets, which a research-driven house, such as Fidelity, can identify and exploit.
By way of example, in China, the FT, in a 26 February 2021 article, highlighted that retail trading at the end of 2019 accounted for over 80% of turnover on the Shanghai and Shenzhen exchanges, against 16% on the Hong Kong exchange. China Renaissance analysis indicated that retail investors accounted for 23% of China’s stock market holdings (against 50% in 2015). When such participants exhibit herd- like investment mentalities, with holding periods measured in days, not years, this creates significant opportunities for more research-driven investors to sell at above fair value and buy below. When managing the portfolio (see section below), FAV needs to balance these valuation opportunities with the risks they create.
India has been an area where FAV has been overweight for some time. There are well over 5,000 listed companies in India (nearly 1,700 on the National Stock Exchange of India, the leading government-owned stock exchange of India). However, these are spread across eight exchanges, and coverage by the ca.70 foreign and domestic brokers analysing the companies is primarily on large-cap names.
Across Asian markets, there are pricing
anomalies, with, for example, Chinese
exchange trading dominated by retail,
even though retail investors hold 23% of
shares.
Indian 5,000+ listed companies spread
over eight exchanges

Fidelity Asian Values
14 May 2021 17
8) ASIA: value vs. growth valuation gap For much of the period from 2002 to the end of 2014, the P/E valuation discount of Asian small-cap companies to larger peers was in the range of 10%-30%. Since the end of 2014, this discount has widened every year, so that, by end-March 2021, it was nearly 60%, i.e. double the peak discount generally seen in the previous period. This level of discount was last seen at the time of the tech bubble in 2000. The driver to the wider discount has been the increase in the ratings applied to growth businesses, as the P/E of small-cap value has generally been quite stable and in the range of 8x-12x over the past 20 years. At the end of March 2021, it was slightly above the average for the period, at ca.11x, but still within the long-term range. The valuation discount presents a near unique opportunity to acquire small-cap value businesses cheaply relative to large-cap names. We explore, in the next section, how, over time, small-cap value stocks have actually delivered faster average earnings growth than their larger alternatives.
9) ASIA: long-term “value” outperformed “growth” companies We note the manager’s comments from the 2020 Report and Accounts (page 7): “The most interesting fact for me is that over time “value” companies in Asia normally grow earnings faster than “growth” companies. Not only do these stocks provide you with a better starting margin of safety but these businesses are also able to grow earnings faster. Hence, it’s not surprising that over the long-term it has paid to be invested in small cap value stocks. They have outperformed growth companies by a significant margin over the last 20 years”.
There will be some definitional issues (for example, a successful small-cap name will, in due course, become a large-cap one), but we believe the logical key drivers to this operational outperformance are:
► Smaller companies have more options for both organic and inorganic growth – the latter especially relevant for transformational deals.
► Smaller companies are growing into economies of scale, while many large-cap businesses face dis-economies of scale.
► Smaller companies can typically be more flexible in adjusting to market conditions.
We note that a number of funds believe getting into tech businesses a couple of years ahead of IPO provides optimal returns, as both the optimised growth and rating increase are captured. This is the area where FAV would consider private investments, albeit, at present, they represent a minimal proportion of the portfolio.
Asian value stocks, the focus of FAV’s
portfolio, are historically cheap compared
with growth companies
Over time, value companies in Asia grow
earnings faster than growth companies

Fidelity Asian Values
14 May 2021 18
10) ASIA: underweight in global funds Across the region, we see structural imbalances between the allocation by global investors in Asian funds, compared with what may be considered a fair weight. Looking at China, in addition to demand from domestic savers (as the population becomes wealthier, it should have more savings), there appears to be the opportunity for material potential demand from foreign investors re-weighting portfolios to the relative importance of the Chinese economy. Historically, this has been impractical, given the regulatory constraints on foreign ownership (e.g. only a carefully chosen few, such as FAV, could invest in China “A” shares) but, as the economy shows greater openness, this is likely to include share ownership. We note the following as illustrative of the opportunity:
► While China accounts for between a sixth and a fifth of the global purchasing power, and stocks delivering 15% or better average returns and global market capitalisation, it only accounts for 2.5% of allocation in global funds.10
► In the Willis Towers Watson review, The merits of a standalone equity allocation to China, foreign holders accounted for just 2.4% of the Chinese stock markets, against ca.16%-17% in India or Japan and 33%-37% in Korea and the US.
► The same report noted that, on a full market capitalisation basis, China would account for 20% of global indices, against ca.5% now. The trend to a higher weighting in index weightings has started (it was just 2% in 2010), but has a long way to go.
In India, foreign ownership has been subject to a number of restrictions set by the Securities and Exchange Board of India. In essence, foreign holders are restricted to less than 10% of the paid-up share capital of the Indian investee company by a single foreign portfolio investor (FPI), 24% on a collective basis, and less than 50% of any issue of corporate bonds.11 India eased the rules in April 2020, so that the ceiling of 24% for foreign institutional investors (FII) investment could be raised up to a sectoral cap/statutory ceiling, subject to the approval of the board and the general body of the company passing a special resolution to that effect. The historical restrictions have led to global investors being underweight India relative to GDP/ economic activity.
Indonesia historically had foreign investor restrictions but, in 1Q’21, as one part of the Omnibus Law referred to above, it enacted a Presidential regulation, which stated that all business sectors were open for capital investment activities, with some restrictions and conditions for certain aspects – replacing a current negative list. Commentators (e.g. Baker Mckenzie)12 have stated, “It appears that this new list is trying to significantly reduce the number of sectors that are subject to foreign ownership restriction. This Indonesian government’s policy is seen to be in line with their intention to encourage more foreign investments in Indonesia and create jobs to offset the impact from Covid-19.”
10 Baillie Gifford September 2020 article RE-FOCUSING ON THE FUTURE: CHINA
https://www.bailliegifford.com/en/uk/individual-investors/funds/baillie-gifford-china-growth-trust/ic-article/2020-q3-re-focusing-on-the-future-china-ind-we-1770?p=24349
11 https://www.rbi.org.in/fiilist/index.html#:~:text=The%20ceiling%20for%20overall%20investment,the%20State%20Bank%20of%20India.
12 https://foreigninvestment.bakermckenzie.com/2021/03/16/indonesias-new-investment-list-
increases-fdi-opportunities-for-foreign-investors/
Global investors are underweight the
region. Relative to GDP and market
capitalisation, international investors are
underweight China. As China becomes an
increasing part of global indices, likely to
see increasing number of buyers.
Indian foreign ownership restrictions
easing, but international investors are
underweight
Also seeing some easing of restrictions in
Indonesia

Fidelity Asian Values
14 May 2021 19
11) FAV: investment process We detailed, in an earlier section, the filters that narrow down the ca.18,000 investable opportunities to the portfolio of around 150 stocks. In this section, we detail the investment process that results in FAV providing shareholders with a differentiated equity exposure to Asian markets. FAV looks to capitalise on the market growth we have identified above by finding good businesses, run by good people and buying them at a good price. Management encapsulates this by saying that it “buys” a business with its characteristics, valuations and expectations, and that it is not buying a “stock”. FAV works to an absolute return perspective, trying to identify investments that can earn a return of 50% over a three-year period, while looking to avoid capital losses. The objective of the fund is to use research to find these mispriced companies before others do.
We also note that i) Fidelity has had research based locally across the region – in contrast, one major competitor did not open its Shanghai office until the end of 2019, and ii) the portfolio is focused on smaller-sized companies, as this section of the market tends to be less well researched, and where the “winners of tomorrow” are more likely to be found.
Type of company favoured Fidelity’s analytically-driven approach gets under the bonnet of both the industry and the potential investment – inter alia, looking at business models, customers, products, growth opportunities and management quality. Both the market and company need to be understandable, with identifying drivers to performance and clarity in disclosure. The aim is to have high RoE businesses (both historically and prospectively), which can grow their business. A good management team is one that has strong operational know-how, makes good capital allocators and shows integrity with all stakeholders. We understand that the average portfolio company return on equity is more than a third above the average for the small-cap index. For the portfolio, returns have been rising since 2018, while, for the index, they have been stable, and the gap has increased from ca.1.5% in June 2018 to its current level of over 4%.
“Well-priced” companies We believe valuation is an art, not a science, and that different approaches to valuation need to be used at different times. A fund manager looking at a simple two-year prospective P/E is highly likely to miss the long-term value created by some growth models. One well-known UK-based growth manager (James Anderson at Baillie Gifford’s Scottish Mortgage Trust) is emphatic that the fund manager’s approach is value-driven, but just that it looks at value in a different way from the market. The average P/E of FAV’s portfolio companies is ca.11x; this is around two-thirds the small-cap index average, and the gap has widened by a third since 2018.
At any given time, FAV is likely to be 85%-90% invested in small-cap, value companies. The other 10%-15% will be cash and large-cap names, which are still chosen with a value bias, but which give FAV more liquidity overall (see section below, where we discuss cash and large company holdings).
FAV’s focus is finding good businesses, run
by good people and buying them at a
good price, with objective of absolute
return of 50% over three-year period
Competitive advantage from length of
time team has been locally-based, and
size of team
This leads to focus on high RoE
businesses, with strong management, and
clearly understandable business and
market
FAV stocks are cheap – defined as low
P/E (portfolio average ca. two-thirds
small-cap index)
Around 85% of portfolio likely to be in
small-cap value names

Fidelity Asian Values
14 May 2021 20
Types of company avoided There are some characteristics that Fidelity finds unappealing. These include i) businesses that cannot be understood, even with analysis, ii) high valuations compared with history, iii) high debt, iv) high margins compared with historical averages, v) high concentrations of revenues, and vi) very importantly, a management team that is viewed as lacking integrity. This is a very judgemental filter, with both objective and subjective factors as play, but, for FAV, lack of integrity is a deal breaker.
FAV sees that there is enough alpha in picking good companies at a fair price, rather than bombed-out ones very cheaply. Multi-year conviction holdings generate compounding returns and reduce re-investment risk. The table below gives an illustration of how this may work. We have taken a 15% growth company whose P/E increases from 1x to 14x (i.e. up by 17%) over a specific period. This still represents a PEG below 1, and £100 of investment would be worth £204 by year 5. In contrast, buying the same earnings at a P/E of 5x is worth only £182 over five years, assuming 5% earnings growth and a much sharper (50%) increase in that rating (where the PEG is now 1.5x).
Theoretical example of value created by compounding in quality companies vs. buying deeply-discounted, low-growth businesses (£) Year 1 2 3 4 5 Option 1: Compounding quality Earnings 100 115 132 152 175 Growth rate 15.0% 15.0% 15.0% 15.0% 15.0% Rating (x) 12.0 12.5 13.0 13.5 14.0 Indexed rating 100 104 108 113 117 Value 1,200 1,438 1,719 2,053 2,449 Indexed return 100 120 143 171 204 PEG (x) 0.80 0.83 0.87 0.90 0.93 Option 2: Cheap, low-growth Earnings 100.0 105.0 110.3 115.8 121.6 Growth rate 5.0% 5.0% 5.0% 5.0% 5.0% Rating (x) 5.0 7.5 7.5 7.5 7.5 Indexed rating 100 150 150 150 150 Value 500 788 827 868 912 Indexed return 100 158 165 174 182 PEG (x) 1.00 1.50 1.50 1.50 1.50
Source: Hardman & Co Research
In an ideal, theoretical world, one would, of course, buy the cheap, low-growth business, sell it once it had risen, and buy the next cheap, low-growth opportunity (in the table above, this would represent getting the sharp uplift in the year 1 valuation, repeated every year). Such an approach is critically dependent on being able to continually re-invest for the higher returns, and we characterise it as a trading philosophy, rather than as a long-term investment culture. It also incurs trading costs which stack the odds against an investor in the same way as a roulette wheel does.
When compared with growth stock investing, the manager highlights that value company valuations are lower, expectations are lower, there is more scope for multiple expansion, and financial returns in the short term are better.
FAV avoids companies with high debt,
margins against history, concentrations of
revenue. Also avoids companies that are
not understandable or run by
managements with questionable integrity.
FAV does not invest in bombed-out
companies that are very cheap, believing
that, for reasonable hold period, good,
strong growth companies offer better
returns
Cheap, bombed-out companies’ approach
can add value, but necessitates constant
renewal of portfolio, with all risks this
introduces
Fidelity Asian Values
14 May 2021 21
Hardman & Co comment We do not view any of the criteria above as rocket science, and it is very transparent what investors are buying. We do not believe Fidelity’s is the only approach to add value, but the rigour with which it has been implemented can be judged with long-term outperformance. You get “what is on the tin”.
12) FAV: flexible mandate One of FAV’s features is its flexible mandate, which means it can optimise returns by investing in the full range of alternatives, including listing, market capitalisation and derivatives.
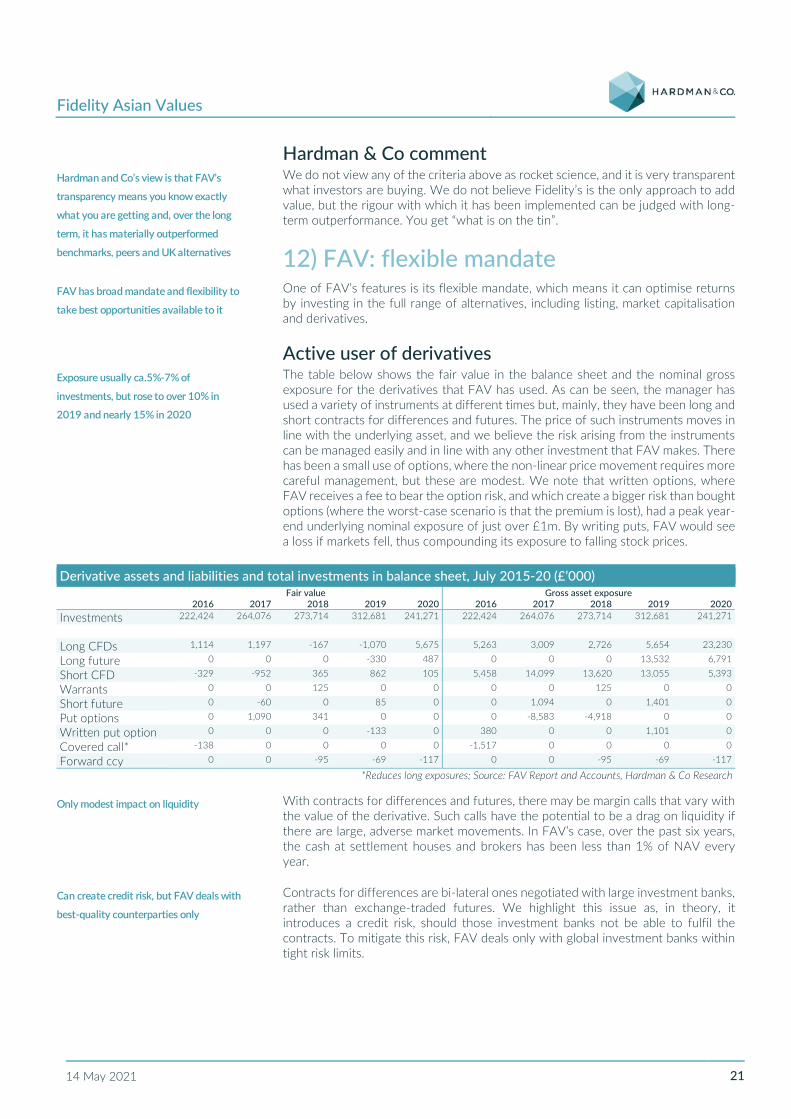
Active user of derivatives The table below shows the fair value in the balance sheet and the nominal gross exposure for the derivatives that FAV has used. As can be seen, the manager has used a variety of instruments at different times but, mainly, they have been long and short contracts for differences and futures. The price of such instruments moves in line with the underlying asset, and we believe the risk arising from the instruments can be managed easily and in line with any other investment that FAV makes. There has been a small use of options, where the non-linear price movement requires more careful management, but these are modest. We note that written options, where FAV receives a fee to bear the option risk, and which create a bigger risk than bought options (where the worst-case scenario is that the premium is lost), had a peak year-end underlying nominal exposure of just over £1m. By writing puts, FAV would see a loss if markets fell, thus compounding its exposure to falling stock prices.
Derivative assets and liabilities and total investments in balance sheet, July 2015-20 (£’000) Fair value Gross asset exposure
2016 2017 2018 2019 2020 2016 2017 2018 2019 2020 Investments 222,424 264,076 273,714 312,681 241,271 222,424 264,076 273,714 312,681 241,271
Long CFDs 1,114 1,197 -167 -1,070 5,675 5,263 3,009 2,726 5,654 23,230
Long future 0 0 0 -330 487 0 0 0 13,532 6,791
Short CFD -329 -952 365 862 105 5,458 14,099 13,620 13,055 5,393
Warrants 0 0 125 0 0 0 0 125 0 0
Short future 0 -60 0 85 0 0 1,094 0 1,401 0
Put options 0 1,090 341 0 0 0 -8,583 -4,918 0 0
Written put option 0 0 0 -133 0 380 0 0 1,101 0
Covered call* -138 0 0 0 0 -1,517 0 0 0 0
Forward ccy 0 0 -95 -69 -117 0 0 -95 -69 -117
*Reduces long exposures; Source: FAV Report and Accounts, Hardman & Co Research
With contracts for differences and futures, there may be margin calls that vary with the value of the derivative. Such calls have the potential to be a drag on liquidity if there are large, adverse market movements. In FAV’s case, over the past six years, the cash at settlement houses and brokers has been less than 1% of NAV every year.
Contracts for differences are bi-lateral ones negotiated with large investment banks, rather than exchange-traded futures. We highlight this issue as, in theory, it introduces a credit risk, should those investment banks not be able to fulfil the contracts. To mitigate this risk, FAV deals only with global investment banks within tight risk limits.
Hardman and Co’s view is that FAV’s
transparency means you know exactly
what you are getting and, over the long
term, it has materially outperformed
benchmarks, peers and UK alternatives
FAV has broad mandate and flexibility to
take best opportunities available to it
Exposure usually ca.5%-7% of
investments, but rose to over 10% in
2019 and nearly 15% in 2020
Only modest impact on liquidity
Can create credit risk, but FAV deals with
best-quality counterparties only

Fidelity Asian Values
14 May 2021 22
In terms of the balance sheet, the market value of the derivatives is shown above. Thus, on day one, a derivative futures contract (assuming no price move), which was long the index by £100m, would be shown at zero in the balance sheet. As the index moves, and the market value of the derivative changes, it will be reflected as either an asset or liability, and the corresponding gain/loss would show in the income statement. The balance sheet is likely to be below the gross exposure (in this case, above £100m).
We note that ca.90% of FAV’s derivatives are Level 2 fair-value-hierarchy accounted. This is a rather technical issue, but it means that they are valued by reference to observable inputs, other than directly quoted prices (which would be Level 1-accounted) or valued by reference to valuation techniques using inputs that are not based on observable market data (which would be Level 3-accounted). The Level 1 derivatives (in 2020, £487k) are the futures that are traded on the exchange. The Level 3 instruments are the options whose value is driven by modelling assumptions.
13) FAV: active manager Turnover of portfolio The chart below shows turnover calculated by taking the aggregate value of purchases and sales divided by two, and dividing this amount by the average total exposure (the fixed asset investments, plus the exposure of the underlying securities within the contracts for difference). From 2016-20, it has averaged 59%, after a significantly larger turnover in 2015, when the current manager was appointed. We understand that turnover by name is lower (42%) over this period. While the investment process considers returns over three to five years, if the share price of the investments rises quickly, then it will be sold, and this accounts for the shorter average actual hold period.
Turnover of portfolio, 2015-20 (%)
Source: FAV Report and Accounts, Hardman & Co Research
The cost of this turnover is modest. In 2020, for a purchase of £174m, FAV incurred transaction costs of £268k. A further £360k was incurred on sales.
020406080
100120140160
2015 2016 2017 2018 2019 2020 average(2016-'20)
Market value shown in balance sheet
Primarily Level 2-accounted (i.e. valued by
reference to observable inputs, not quoted
prices) as largely bi-lateral agreements
with global investment banks
Average turnover FY’16-FY’20 59%, as
manager “selling what has gone up and
recycling into new ideas’
FAV incurred £268k of purchase costs on
£174m of purchases – so churn costs
modest

Fidelity Asian Values
14 May 2021 23
Changes in top five positions To consider how the biggest positions have turned over, we looked at the top five holdings in each year 2016-20 and looked at how the holding had evolved over the five years. As the table below shows, five of the names were top five holdings in each of those years, and another two were for four of the five years. Perhaps, unsurprisingly, end-July 2020 was a year of big changes, but, otherwise, there has been some stability in these high-conviction calls, and the turnover of the portfolio has been concentrated in smaller names and derivatives.
Top five holdings at end of each year 2016-20 (% gross asset exposure) 2016 2017 2018 2019 2020 Granules India 0.0 n/d n/d n/d 2.5 Power Grid Corporation of India 4.1 3.1 3.2 4.0 2.5 HDFC Bank 1.7 1.6 1.8 1.0 2.3 Redington India 0.6 2.2 1.2 2.2 2.0 Fufeng Group* 0.0 n/d 1.3 2.7 2.0 LIC Housing Finance 0.0 n/d 2.1 2.5 n/d BOC Aviation 0.0 n/d 2.5 1.9 n/d China Mobile* 0.0 n/d 3.0 1.1 n/d Housing Development Finance Corporation
2.3 2.7 2.1 1.7 n/d
WPG Holdings 2.5 3.0 n/d n/d n/d Taiwan Semiconductor Manufacturing*
4.0 2.7 1.8 1.2 n/d
LT Group 0.0 2.6 1.7 1.3 0.8 Tisco Financial Group 3.2 1.2 0.8 n/d n/d RHT Health Trust 2.7 n/d n/d n/d n/d
*includes CFDs, as well as shares; Source: FAV Report and Accounts (details on top 40 holdings only available from 2017), Hardman & Co Research
Increasingly diversified portfolio At end-March 2021, FAV’s top 10 holdings made up 20.6% of the portfolio, and the portfolio typically comprises around 100-150 holdings. This compared with 30.6% at The Scottish Oriental Smaller Companies Trust Plc and 33.5% at Aberdeen Standard Asia Focus PLC. The chart below shows the top 10 positions as a percentage of the total portfolio at the year-ends from 2015 to 2020 (the current manager was appointed in 2015).
Top 10 positions as percentage of portfolio, FY’15-FY’20 and Mar’21 (%)
Source: FAV Report and Accounts, Latest Factsheet, Hardman & Co Research
0
5
10
15
20
25
30
35
Jul'15 Jul'16 Jul'17 Jul'18 Jul'19 Jul'20 Mar-21
In normal times, top five positions – the
biggest conviction ideas – have longer-
than-average hold period
FAV less concentrated in top 10 names
compared with peers
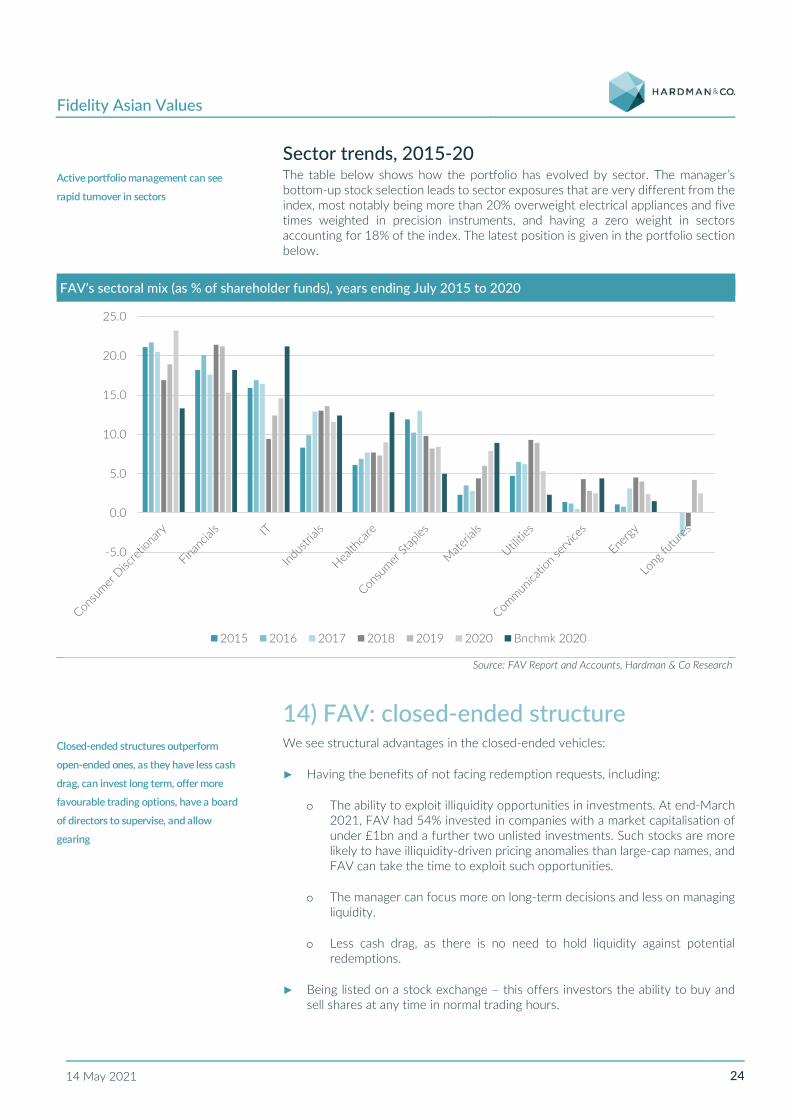
Fidelity Asian Values
14 May 2021 24
Sector trends, 2015-20 The table below shows how the portfolio has evolved by sector. The manager’s bottom-up stock selection leads to sector exposures that are very different from the index, most notably being more than 20% overweight electrical appliances and five times weighted in precision instruments, and having a zero weight in sectors accounting for 18% of the index. The latest position is given in the portfolio section below.
FAV’s sectoral mix (as % of shareholder funds), years ending July 2015 to 2020
Source: FAV Report and Accounts, Hardman & Co Research
14) FAV: closed-ended structure We see structural advantages in the closed-ended vehicles:
► Having the benefits of not facing redemption requests, including:
o The ability to exploit illiquidity opportunities in investments. At end-March 2021, FAV had 54% invested in companies with a market capitalisation of under £1bn and a further two unlisted investments. Such stocks are more likely to have illiquidity-driven pricing anomalies than large-cap names, and FAV can take the time to exploit such opportunities.
o The manager can focus more on long-term decisions and less on managing liquidity.
o Less cash drag, as there is no need to hold liquidity against potential redemptions.
► Being listed on a stock exchange – this offers investors the ability to buy and sell shares at any time in normal trading hours.
-5.0
0.0
5.0
10.0
15.0
20.0
25.0
2015 2016 2017 2018 2019 2020 Bnchmk 2020
Active portfolio management can see
rapid turnover in sectors
Closed-ended structures outperform
open-ended ones, as they have less cash
drag, can invest long term, offer more
favourable trading options, have a board
of directors to supervise, and allow
gearing

Fidelity Asian Values
14 May 2021 25
► Having a board of directors providing an additional layer of oversight, protecting investors’ interests. We note that the board normally carries out bi-annual due diligence trips to Asia, visiting a number of sites, companies and analysts. We also note the trend in costs, which (as we detail below) are kept under regular review and have been on a steady downward trend, reflecting an active board.
► The ability to introduce gearing, which, with an investment approach that adds value, means that the closed-ended funds should be able to perform better over the long term.
► Depending on the price, investors may be able to sell their shares at a premium to NAV, or buy them at a discount.
► Closed-ended funds can manage their dividend and revenue reserves to smooth dividend payments over time.
The AIC has indicated that, across all closed-ended vehicles, it believes the incremental return is over 1% p.a. Looking at FAV over the past 10 years, as we noted above, FAV has delivered a performance well above the open-ended peer average.
15) FAV: good liquidity in shares FAV’s share trading has been very liquid, even in challenging market conditions. The chart below illustrates the number of trades and average monthly trading volume through both 2019 and 2020, and shows that liquidity was strong through the early stages of the pandemic. In 2019, the value traded was £104m, rising to £145m in the more active 2020 – broadly speaking, a third of the current market capitalisation of £331m. As we show on the front page of this report, there are no material holders that could lead to a share overhang against this level of daily trading.
Monthly trading by number of shares and average value (RHS £)
Source: LSE, Hardman & Co Research
0
500
1,000
1,500
2,000
2,500
0
2
4
6
8
10
12
14
16
18
Jan-
19Fe
b-19
Mar
-19
Apr-
19M
ay-1
9Ju
n-19
Jul-1
9Au
g-19
Sep-
19O
ct-1
9N
ov-1
9D
ec-1
9Ja
n-20
Feb-
20M
ar-2
0Ap
r-20
May
-20
Jun-
20Ju
l-20
Aug-
20Se
p-20
Oct
-20
Nov
-20
Dec
-20
Jan-
21Fe
b-21
Mar
-21
Value traded in month (£m, LHS) Number of Bargains in month (RHS)
There is good liquidity in FAV shares, and
its register has little concentration

Fidelity Asian Values
14 May 2021 26
16) FAV: strong (relative) ESG credentials We note that, in its 2020 Report and Accounts, FAV commented, “Fidelity believes that businesses which flout laws or do not respect their employees, customers or communities will not be able to sustain high returns over time. It is simply not a sustainable way to do business. Fidelity is encouraged that the investment community in general is paying more attention to these issues. Adherence by corporates to the principles of sustainability will have a growing impact on the demand for those companies’ goods and services. Monitoring the actions of the corporates and engaging with them to improve, is a core pillar of Fidelity’s strategy and embedded into the research methodology which we use to assess companies.” We believe this leads to engagement over exclusion, as positive influences on corporate behaviour can add value for companies, investors and society.
FAV also discloses its portfolio on the MSCI ESG ratings scale. The proportion in the top five ratings is nearly double the index (30.0% vs. 17.3%) and, in the top three ratings, it is 2.3x the index (13.0% vs. 5.6%). Fidelity has been a signatory to the United Nations Principles for Responsible Investment (UNPRI) since 2012, and submits an annual report detailing how it incorporates ESG into its investment analysis. In practice, we understand that Fidelity employs a proprietary sustainability rating process, leveraging its internal research and interactions with corporates. Analysts assign an overall A to E rating (C being understood as the sector average) for each rated name on a sector-relative basis.
FAV’s portfolio distribution by MSCI ESG ratings (%) FAV Index Relative AAA 0.0 0.1 -0.1 AA 4.4 1.0 3.4 A 8.6 4.5 4.1 BBB 7.8 4.9 0.2 BB 9.2 6.8 2.4 B 5.9 6.5 -0.6 CCC 1.2 1.2 0.0 Not rated 50.7 72.2 -21.5 Cash & other 12.2 0.1 12.1
Source: FAV website accessed April 2021, Hardman & Co Research
For FAV, ESG is simply good business
practice
FAV has 2.3x proportion of its portfolio in
top three MSCI ESG ratings compared
with index

Fidelity Asian Values
14 May 2021 27
Investment-neutral issues 1) FAV: discount control mechanisms The stated discount policy is “The Board recognises the importance of the relationship between the Company’s share price and the NAV per share and monitors this closely. It seeks authority from shareholders each year to issue shares at a premium or to repurchase shares at a discount to the NAV, either for cancellation or for holding in Treasury. The Board will only exercise these authorities if deemed to be in the best interests of shareholders at the time.”13
When FAV was trading at its widest discount in over a decade, the board initiated a buyback programme in March 2020. The company has bought back 1.65m shares through to July, and largely stopped its programme at end-October, by which stage it had 2.4m shares held in Treasury. There was a small further transaction (26 February 2021, NAV 464p, 11k shares bought at 419p).
2) FAV: gearing The manager maintains strong balance sheet liquidity (see section below on cash) and has some liquid large company holdings, and introduces some gearing through the use of derivatives. The current manager has generally kept this relatively small, although it was increased materially in 2019, reflecting the market opportunities seen at the time.
Gearing* (% gross asset exposure) 2011 2012 2013 2014 2015 2016 2017 2018 2019 2020
3.5 5.7 7.4 11.3 -9.0 -2.3 -2.3 -1.0 7.5 2.7 *Gearing defined as gross asset exposure in excess of/(less than) total shareholders’ funds;
Source: FAV Report and Accounts, Hardman & Co Research
We characterise gearing as an investment-neutral because:
► In an attractive market, it increases the long-term return.
► However, it also introduces further volatility in markets that are already volatile (see section below).
► Given FAV’s conservative approach to cash, we are not concerned that gearing through derivatives will produce any liquidity issues.
3) FAV: currency exposure FAV’s currency exposure is complex, with its portfolio companies spread across over more than a dozen currencies, and a highly active approach to investment, meaning that exposures are constantly changing. Fidelity has the advantages of economies of scale, and so can invest in risk management tools, which smaller firms could not justify. For FAV, it may manage the exposure by using forward and spot foreign exchange contracts but, as we noted in the derivative section above, their use is limited. There is a real cash cost in hedging, which increases with less liquid currencies, and this is a key factor when considering whether or not to hedge.
13 2020 Report and Accounts p27
Issue at premium and buyback when
discount significant
While there has been some gearing, its use
has been modest
Currency exposure is complex
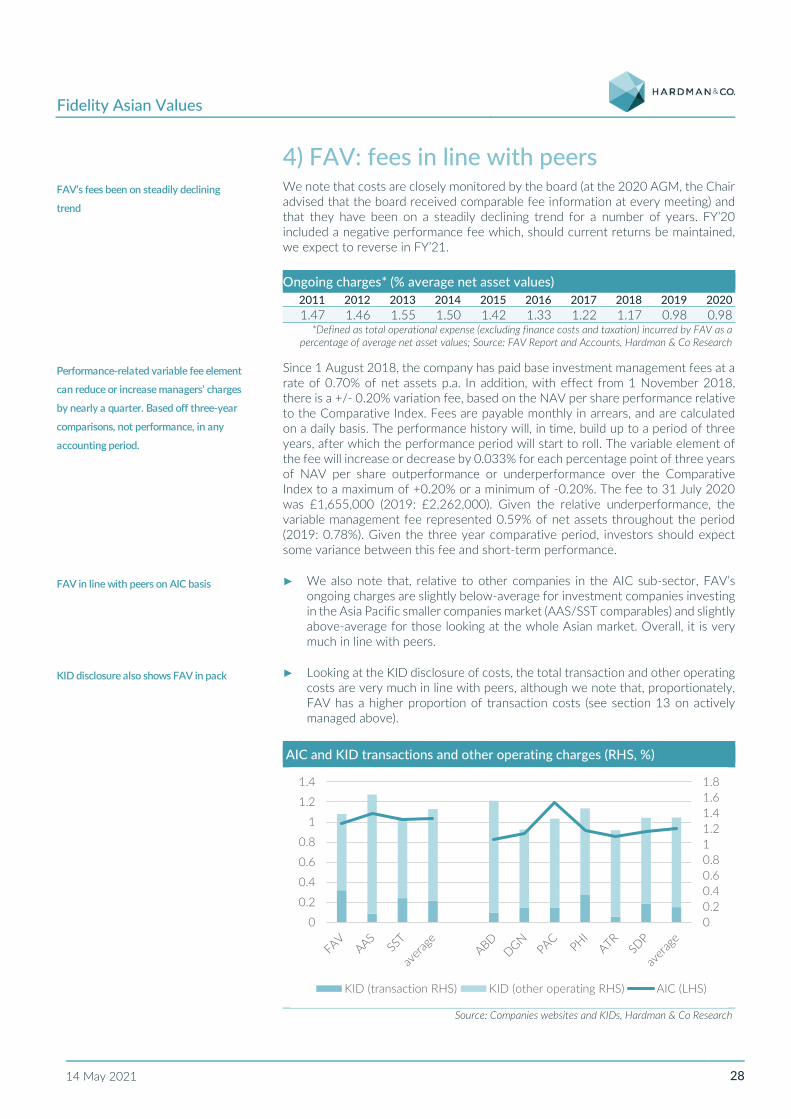
Fidelity Asian Values
14 May 2021 28
4) FAV: fees in line with peers We note that costs are closely monitored by the board (at the 2020 AGM, the Chair advised that the board received comparable fee information at every meeting) and that they have been on a steadily declining trend for a number of years. FY’20 included a negative performance fee which, should current returns be maintained, we expect to reverse in FY’21.
Ongoing charges* (% average net asset values) 2011 2012 2013 2014 2015 2016 2017 2018 2019 2020 1.47 1.46 1.55 1.50 1.42 1.33 1.22 1.17 0.98 0.98
*Defined as total operational expense (excluding finance costs and taxation) incurred by FAV as a percentage of average net asset values; Source: FAV Report and Accounts, Hardman & Co Research
Since 1 August 2018, the company has paid base investment management fees at a rate of 0.70% of net assets p.a. In addition, with effect from 1 November 2018, there is a +/- 0.20% variation fee, based on the NAV per share performance relative to the Comparative Index. Fees are payable monthly in arrears, and are calculated on a daily basis. The performance history will, in time, build up to a period of three years, after which the performance period will start to roll. The variable element of the fee will increase or decrease by 0.033% for each percentage point of three years of NAV per share outperformance or underperformance over the Comparative Index to a maximum of +0.20% or a minimum of -0.20%. The fee to 31 July 2020 was £1,655,000 (2019: £2,262,000). Given the relative underperformance, the variable management fee represented 0.59% of net assets throughout the period (2019: 0.78%). Given the three year comparative period, investors should expect some variance between this fee and short-term performance.
► We also note that, relative to other companies in the AIC sub-sector, FAV’s ongoing charges are slightly below-average for investment companies investing in the Asia Pacific smaller companies market (AAS/SST comparables) and slightly above-average for those looking at the whole Asian market. Overall, it is very much in line with peers.
► Looking at the KID disclosure of costs, the total transaction and other operating costs are very much in line with peers, although we note that, proportionately, FAV has a higher proportion of transaction costs (see section 13 on actively managed above).
AIC and KID transactions and other operating charges (RHS, %)
Source: Companies websites and KIDs, Hardman & Co Research
00.20.40.60.811.21.41.61.8
0
0.2
0.4
0.6
0.8
1
1.2
1.4
KID (transaction RHS) KID (other operating RHS) AIC (LHS)
FAV’s fees been on steadily declining
trend
Performance-related variable fee element
can reduce or increase managers’ charges
by nearly a quarter. Based off three-year
comparisons, not performance, in any
accounting period.
FAV in line with peers on AIC basis
KID disclosure also shows FAV in pack

Fidelity Asian Values
14 May 2021 29
5) FAV: other KID disclosure We, like many others, have concerns about some of the methodologies in calculating KID information (for example, likely performance under different scenarios is based off share price performance, which makes it very sensitive to the date of the KID. With that large caveat, our May 2019 report, understanding the deepest discounts, did find correlations between extreme discounts and the KID stress scenarios. Against the closest peers, FAV has a slightly higher downside stress loss, but a higher positive return in the moderate and favourable scenarios. Against the wider peer group, again, there is one outlier (PHI), which distorts the average. Excluding this name, FAV has a slightly higher stress scenario in line returns. Given the vagaries within the calculation, we again characterise FAV’s KID disclosure as indicative of and in line with peers.
KID disclosure by FAV and peers Risk factor 1 year stress Moderate Favourable Date of KID FAV 5.0 -90.4 9.4 41.5 Oct AAS 4.0 -72.0 6.9 33.1 Oct SST 5.0 -86.7 0.5 31.6 Sep Average 4.7 -83.0 5.6 35.4 ABD 5.0 -79.8 12.2 46.1 Oct DGN 5.0 -85.6 11.9 43.8 Oct PAC 5.0 -74.8 3.7 37.3 Aug PHI 5.0 -88.4 25.5 71.9 Oct ATR 5.0 -93.1 10.4 47.8 July SDP 5.0 -85.0 9.4 42.4 July Avg. (excl. PHI) 5.0 -83.7 9.5 43.5 Avg. overall 5.0 -84.4 12.2 48.2
Source: Companies’ KIDs, Hardman & Co Research
6) FAV: variable correlation with benchmark The chart below shows the correlation between the weekly move in FAV’s share price (in sterling) against i) the Japanese small cap index, and ii) the whole Asia Pacific market ex-Japan – both in $. If we take the period January 2011-16 (taking us to a time shortly after the appointment of the current manager on 1 April 2015, to allow time for him to change positions), there was a statistically significant correlation between FAV’s share price and the small-cap index (slightly weaker against the All- Share Index). In contrast, if we take the period after his appointment, this has fallen to a statistically insignificant level. With the stock selection process identified above, investors should not expect the sterling share price to move in line with its index. It is also interesting to note that, since the start of the pandemic, the correlation has moved much more in line.
KIDs need to be treated with caution, but,
against closest peers, FAV’s KID appears
to indicate a wider spread of potential
performance
Given management approach outlined
above, not surprising that FAV’s share
price not closely correlated to indices.
General direction of travel similar but, just
because Asian markets may be rising or
falling, does not mean FAV will track.
Over time, FAV has delivered
outperformance.

Fidelity Asian Values
14 May 2021 30
Correlation co-efficient between FAV share price and indices
Source: Refinitiv, Hardman & Co Research
7) FAV: dividend policy FAV reports that the dividend is a function of what it receives in income and that income is a by-product of, not the driver to, the investment process, whose primary objective is long-term capital growth. In 2020, the dividend was reduced from 8.8p to 8.5p (a cut of 3.5%) – just under half the fall in investment income (7.6%) that year. The Janus Henderson Global Dividend Index indicates an 11.9% underlying, and 18.3% headline, fall in dividends across Asia Pacific ex-Japan – so FAV’s income was more robust than average. With the market uncertainties, the board felt it prudent to re-set to the lower base, despite having revenue reserves of £9.7m, ca. 1.5x the total cost of the dividend. The yield (1.8%) is the highest in the Asia Pacific Smaller Companies and Asia Pacific AIC sub-sector, but we do not believe that it is why most investors would buy FAV, as it represents around one quarter of the average annual NAV return over the past 10 years. The FY’20 3.5% dividend reduction reflected market uncertainties at the time. The dividend was doubled over FY’11 to FY’15, doubled again in FY’16, and more than doubled again over FY’16 to FY’18.
00.10.20.30.40.50.60.70.80.9
1
CorrelationJan 2011-
'16
Correlationsince Jan
2016
Correlationsince Jan
2017
Correlationsince Jan
2018
Correlationsince Jan
2019
Correlationsince Jan
2020
Asia Ex Japan small cap ($) Asia ex Japan whole market ($)
FAV’s objective is long-term capital
growth. Despite FAV’s income being more
robust than market as a whole, 2020
3.5% reduction in dividend reflected
market uncertainties.
Fidelity Asian Values
14 May 2021 31
Investment risks 1) ASIA: geopolitical risk International tensions We note that the Eurasia Group’s top risks for 202114 highlight not only the effects of an extended COVID-19 impact, but also that US/China tensions will be impacted by three new spill-over effects: i) the extension to US allies, as well as the US itself; ii) competition to “heal” the world; and iii) competition to “green” the world. While conflict may not be as overtly confrontational, it concludes that the rivalry will be as intense as under the Trump administration. We also note continued tension over data control, cyber risk and a range of other factors, any of which could affect the Asian markets and FAV’s investments.
In addition to US/China tensions, there are a range of other international political risks associated with the region, including, for example, the global response to i) the coup in Myanmar, ii) the drive to change the monarchy in Thailand, iii) Hong Kong’s position within China, iv) alleged human rights violations, and v) the Indian/Chinese/ Pakistan border issues. Some of these issues are, with social media, becoming more international in themselves. The “Milk Tea Alliance” is a loose coalition of young people from Hong Kong, Thailand, Taiwan and Myanmar, and encapsulates a sense of change and disturbance across the region.
Added to the impact on the operating environment for FAV’s investee companies, these tensions may affect investor sentiment to Asian markets, generally, and FAV as a share, in particular. In terms of this risk, as we noted above, FAV’s Chinese exposure is significantly to companies driven by growing domestic discretionary spend and related areas.
Domestic regulatory changes As well as the issues above, there have been some signs of increased domestic regulation, which goes against the positive government trend to the more business-friendly policies that we identified above; again, these factors may impact not only the operating environment, but also sentiment to FAV. We note, by way of example:
► In early November 2020, after unexpected Chinese regulatory pressure, Alibaba was forced to pull the IPO of its fintech business, Ant Group. Alibaba’s shares fell by ca.8% – a fall in market capitalisation of nearly 8% – resulting in the delay of the Ant IPO, draft regulation in the fintech space and antitrust in the technology space. We do not sense that these issues will change the outlook significantly for the large technology companies, but developments here do need to be monitored.
► There are signs of greater protectionism, with, for example, India restricting vaccine exports.
14 https://www.eurasiagroup.net/issues/top-risks-2021
Broadening of US/China tensions – rivalry
may be less overt, but no less intense
Tensions across whole region
Could impact sentiment, as well as
operating environment
ANT Group IPO reminds investors China
still a closely regulated market, even
though direction of travel is for more
openness

Fidelity Asian Values
14 May 2021 32
2) ASIA: economic risk We note the October 2020 COFACE (a credit insurance and risk management services provider) report, Country and sector risks barometer (page 17), that, within FAV’s remit, only Australia, Taiwan, Hong Kong and South Korea are rated satisfactory or above in terms of business-defaulting risk. Laos, Myanmar and Pakistan are all very high-risk, as are India, Bangladesh and Cambodia, and the rest are either fairly high- or reasonable-risk. Across the region (page 11 of the COFACE report), construction is regarded as high-risk, as is the automotive sector.
Bursting debt bubble in China China’s government debt to GDP has been on a rising trend since 2012 and, as a percentage of GDP, is ca.1.5x the level it was in that year (see table below) – albeit, at ca.53% of GDP in 2019, it is well below that of many global peers.
China government debt to GDP 2008 2009 2010 2011 2012 2013 2014 2015 2016 2017 2018 2019 27.0 34.3 33.7 33.6 34.3 37.0 40.0 41.5 44.3 46.4 50.5 52.6
Source: Trading economics.com, IMF, Hardman & Co Research
Private debt has also risen sharply. The 2020 central bank Financial Stability Review stress test scenarios indicated that almost a quarter of the banking system would fail a stress test where non-performing loans double. Loss-making, state-owned enterprises are a potential drag, but the government appears open to their reform. There is increasing regulation of the shadow banking market (e.g. peer to peer), which was an important funder of SMEs and those unable to access mainstream credit. How the greater financial stability from this regulation impacts on growth remains to be seen.
A specific risk comes from rapid house price appreciation, which introduces the danger of a correction. We note that the government is already taking preventative action to mitigate this. As China evolves into a more developed economy, it faces decreasing manufacturing competitiveness and a long-term narrowing current account surplus, and so it needs to transition smoothly to a modern economy. At the same time, over the long term, China faces an ageing population, as do many other countries. While it has more time to adapt, and can learn lessons from other countries, it is a major structural issue to be addressed. A sustained period of unemployment, which the government is clearly trying to avoid, could undermine some of the positive points about consumer demand. The impacts of controlling pollution and improving ESG on GDP growth are also unclear.
India There is a well-reported current exposure to the human cost and the economic impact of restrictions on growth, given the high incidence of COVID-19 in India. In addition to direct effects, there may be a knock-on effect to sentiment, especially for UK- based investors reading adverse headlines. The chart below shows the Indian market, which is now 5% below the peak of early March 2021 but still 87% up on the mid-March 2020 low level. FAV itself has continued to rise (ca.5% up on early March 2021) in recent trading, which suggests that, if there are to be any sentiment effects, they have yet to be felt.
Credit insurer COFACE has number of
countries rated high-risk
Government debt rising sharply
Private debt has also risen sharply, and
nearly a quarter of banking system would
fail stress test where non-performing
loans double
Potential housing bubble has developed in
some parts of China, a country going
through major structural changes, which
may not be smooth
Uncertainty over COVID-19, and impact
on Indian economy and sentiment to the
region

Fidelity Asian Values
14 May 2021 33
Sensex index (LHS) and FAV share price (p, RHS) since January 2020
Source: Refinitiv, Hardman & Co Research
From 2014 to late 2018, the rate of inflation moderated slightly from previous rates, but it has since accelerated again, and, in most of 2020, it was above the official target to 2%-6%. To address this issue, Indian real interest rates have been roughly double the US equivalent over the past five years.15
Indian Consumer Price Inflation (%)
Source: Ministry of Statistics and Programme Implementation, Hardman & Co Research
15 The World Bank https://data.worldbank.org/indicator/FR.INR.RINR?locations=IN-US-GB
020406080
100120140
15/0
1/20
20
15/0
2/20
20
15/0
3/20
20
15/0
4/20
20
15/0
5/20
20
15/0
6/20
20
15/0
7/20
20
15/0
8/20
20
15/0
9/20
20
15/1
0/20
20
15/1
1/20
20
15/1
2/20
20
15/0
1/20
21
15/0
2/20
21
15/0
3/20
21
15/0
4/20
21
Indian market FAV
0
1
2
3
4
5
6
7
8Target range 2-
Inflation consistently remained above
upper end of 2%-6% target range through
2020, and real interest rates have been
high to address this issue
Fidelity Asian Values
14 May 2021 34
Other countries We note that the impact of COVID-19 remains a material uncertainty. Two countries representing 46% of the region’s population (India and Indonesia) have mostly unchecked pandemics. This will weaken growth in 2021 and over 2022-25. In addition, five territories representing 9% of Asia’s population did well for much of 2020, but are struggling with a third wave of infections (South Korea, Japan, Hong Kong, Malaysia and the Philippines). A new round of activity restrictions over the next few months will cut their 2021 growth.16 The bleak outlook on international travel will continue to weigh on the tourism-dependent countries, including Cambodia and Thailand, and, in the Philippines, a recovery in remittance inflows is required help to boost domestic demand.17
No repeat of the 1997 Asian crisis The Asian crisis of 1997 had traumatic effects (the Indonesian economy shrank 85% in US$ terms). It was triggered by a collapse in confidence in the foreign exchange markets (initially Thailand in July, but spreading quickly to Malaysia, Indonesia, the Philippines, Singapore and South Korea). Ahead of the crisis, companies had borrowed in dollars but did not have the dollar earnings to service the debt, and many countries had become dependent on continued inward flows of foreign currency. Large current account deficits (driven by excess demand and speculation) were funded by foreign capital. When credit availability paused, the knock-on effect was the collapse of the financial system. Today, there are structural differences that make a repeat of the crisis improbable: i) short-term debt to foreign reserves is materially lower; ii) many countries have swung from current account deficits to surpluses; iii) businesses are run more conservatively; and iv) governments have been more pro-active in heading off speculative bubbles much earlier. The dependence on short-term dollar debt, uncovered by reserves, to fund speculative development, rather than productive infrastructure, is simply not there.
3) ASIA: ESG behind western developed countries We believe ESG is an increasing area of focus for investors, creating both a following wind for ESG-complaint models and also a headwind for the less robust ones. To measure how the Asia region, as a whole, adheres to ESG principles, we note that the UN reports signatories to its Principles for Responsible Investment (PRI) by region. As can be seen in the tables below, there were 146 (China 39, Rest of Asia 107) net new signatories in FAV’s countries in FY’19-FY’20. This is around a third of the level of UK/Ireland alone, and only a quarter of the US’s increase, and is evidence of the relatively slow take-up to date across the region. It is, however, encouraging that the rate of growth, from the low base, is much higher-than-average (see right-hand chart).
16 https://www.imaasia.com/ima-asia-brief-dec2020/. The IMA Asia is peer group forum for Asia
CEOs and senior executives. 17 The World Economic Situation and Prospects 2021: https://www.unescap.org/news/east-and-
south-asia-growth-recover-downside-risks-are-high
COVID-19 second/third waves seen
across region, and tourism outlook
uncertain
We conclude markets are structurally
different, making 1997 type of crisis
unlikely to recur
On average, Asian ESG below average
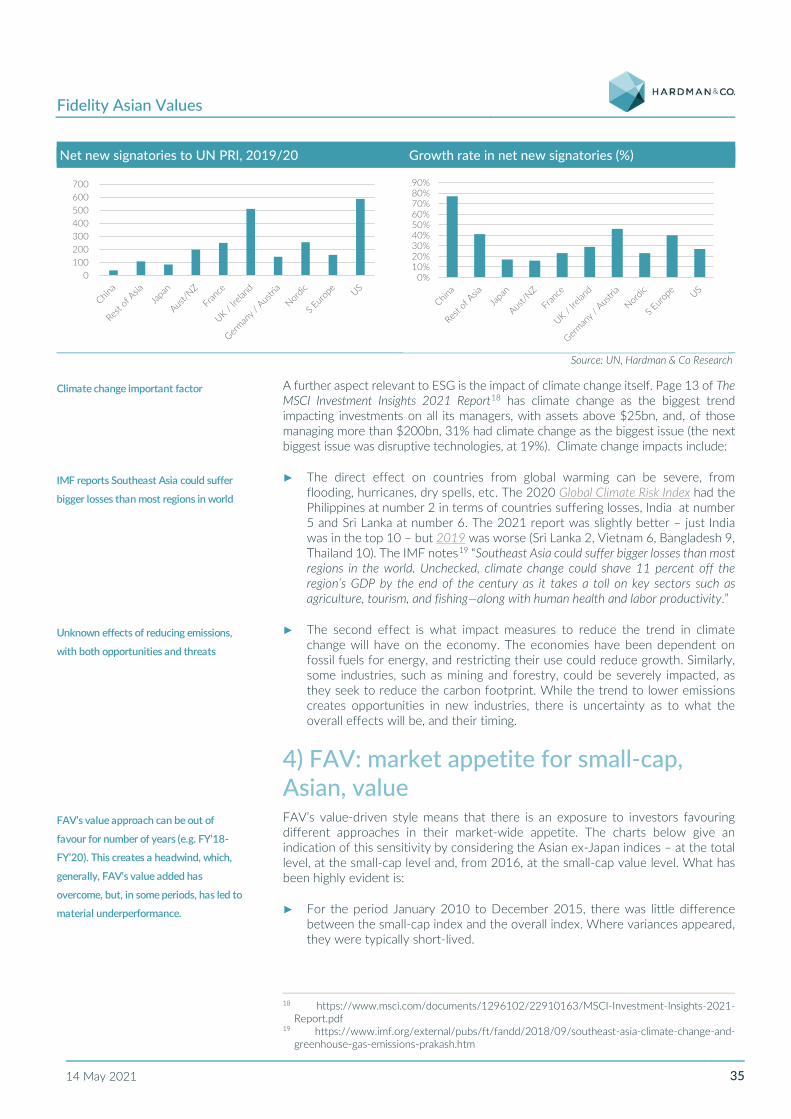
Fidelity Asian Values
14 May 2021 35
Net new signatories to UN PRI, 2019/20 Growth rate in net new signatories (%)
Source: UN, Hardman & Co Research
A further aspect relevant to ESG is the impact of climate change itself. Page 13 of The MSCI Investment Insights 2021 Report18 has climate change as the biggest trend impacting investments on all its managers, with assets above $25bn, and, of those managing more than $200bn, 31% had climate change as the biggest issue (the next biggest issue was disruptive technologies, at 19%). Climate change impacts include:
► The direct effect on countries from global warming can be severe, from flooding, hurricanes, dry spells, etc. The 2020 Global Climate Risk Index had the Philippines at number 2 in terms of countries suffering losses, India at number 5 and Sri Lanka at number 6. The 2021 report was slightly better – just India was in the top 10 – but 2019 was worse (Sri Lanka 2, Vietnam 6, Bangladesh 9, Thailand 10). The IMF notes19 “Southeast Asia could suffer bigger losses than most regions in the world. Unchecked, climate change could shave 11 percent off the region’s GDP by the end of the century as it takes a toll on key sectors such as agriculture, tourism, and fishing—along with human health and labor productivity.”
► The second effect is what impact measures to reduce the trend in climate change will have on the economy. The economies have been dependent on fossil fuels for energy, and restricting their use could reduce growth. Similarly, some industries, such as mining and forestry, could be severely impacted, as they seek to reduce the carbon footprint. While the trend to lower emissions creates opportunities in new industries, there is uncertainty as to what the overall effects will be, and their timing.
4) FAV: market appetite for small-cap, Asian, value FAV’s value-driven style means that there is an exposure to investors favouring different approaches in their market-wide appetite. The charts below give an indication of this sensitivity by considering the Asian ex-Japan indices – at the total level, at the small-cap level and, from 2016, at the small-cap value level. What has been highly evident is:
► For the period January 2010 to December 2015, there was little difference between the small-cap index and the overall index. Where variances appeared, they were typically short-lived.
18 https://www.msci.com/documents/1296102/22910163/MSCI-Investment-Insights-2021-
Report.pdf 19 https://www.imf.org/external/pubs/ft/fandd/2018/09/southeast-asia-climate-change-and-
greenhouse-gas-emissions-prakash.htm
0100200300400500600700
0%10%20%30%40%50%60%70%80%90%
Climate change important factor
IMF reports Southeast Asia could suffer
bigger losses than most regions in world
Unknown effects of reducing emissions,
with both opportunities and threats
FAV’s value approach can be out of
favour for number of years (e.g. FY’18-
FY’20). This creates a headwind, which,
generally, FAV’s value added has
overcome, but, in some periods, has led to
material underperformance.
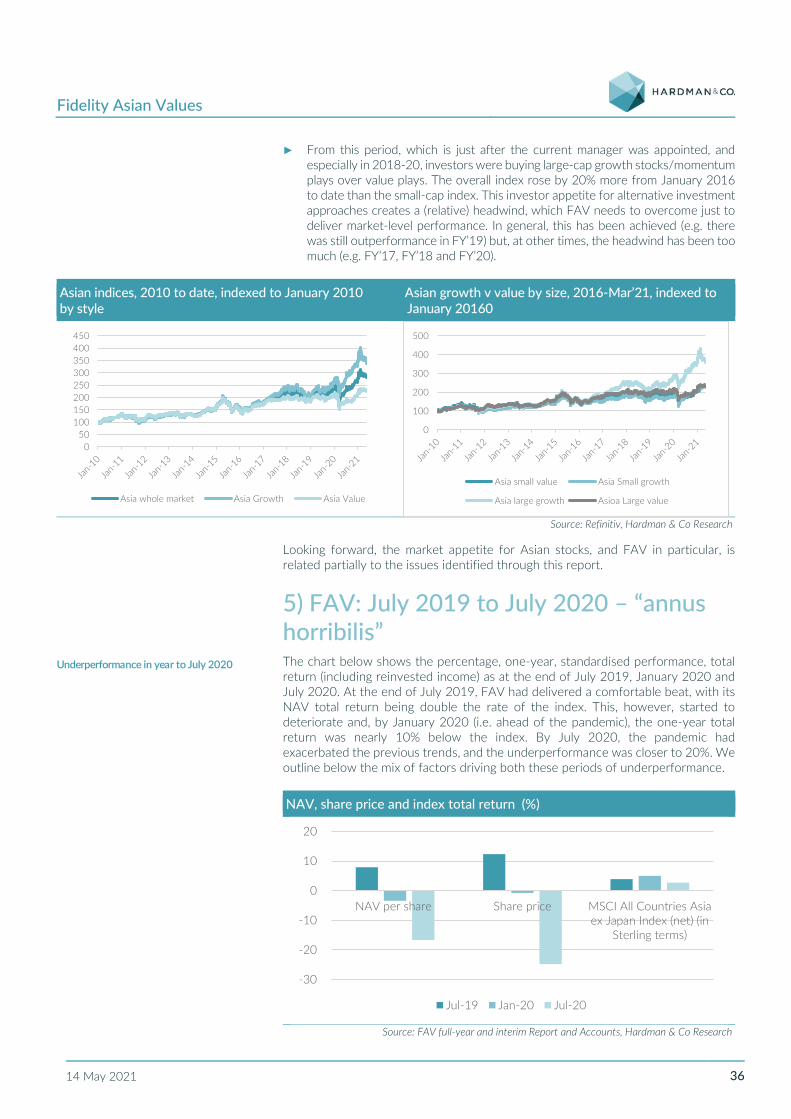
Fidelity Asian Values
14 May 2021 36
► From this period, which is just after the current manager was appointed, and especially in 2018-20, investors were buying large-cap growth stocks/momentum plays over value plays. The overall index rose by 20% more from January 2016 to date than the small-cap index. This investor appetite for alternative investment approaches creates a (relative) headwind, which FAV needs to overcome just to deliver market-level performance. In general, this has been achieved (e.g. there was still outperformance in FY’19) but, at other times, the headwind has been too much (e.g. FY’17, FY’18 and FY’20).
Asian indices, 2010 to date, indexed to January 2010 Asian growth v value by size, 2016-Mar’21, indexed to by style January 20160
Source: Refinitiv, Hardman & Co Research
Looking forward, the market appetite for Asian stocks, and FAV in particular, is related partially to the issues identified through this report.
5) FAV: July 2019 to July 2020 – “annus horribilis” The chart below shows the percentage, one-year, standardised performance, total return (including reinvested income) as at the end of July 2019, January 2020 and July 2020. At the end of July 2019, FAV had delivered a comfortable beat, with its NAV total return being double the rate of the index. This, however, started to deteriorate and, by January 2020 (i.e. ahead of the pandemic), the one-year total return was nearly 10% below the index. By July 2020, the pandemic had exacerbated the previous trends, and the underperformance was closer to 20%. We outline below the mix of factors driving both these periods of underperformance.
NAV, share price and index total return (%)
Source: FAV full-year and interim Report and Accounts, Hardman & Co Research
050
100150200250300350400450
Asia whole market Asia Growth Asia Value
0
100
200
300
400
500
Asia small value Asia Small growth
Asia large growth Asioa Large value
-30
-20
-10
0
10
20
NAV per share Share price MSCI All Countries Asiaex Japan Index (net) (in
Sterling terms)
Jul-19 Jan-20 Jul-20
Underperformance in year to July 2020
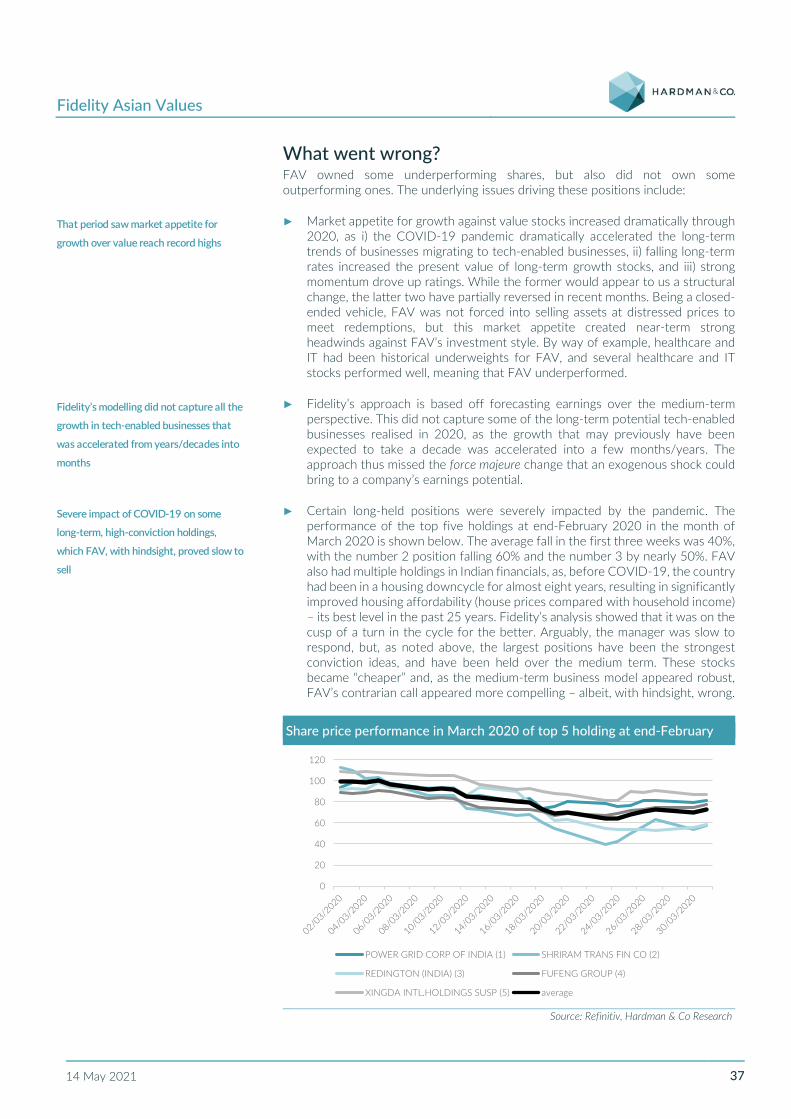
Fidelity Asian Values
14 May 2021 37
What went wrong? FAV owned some underperforming shares, but also did not own some outperforming ones. The underlying issues driving these positions include:
► Market appetite for growth against value stocks increased dramatically through 2020, as i) the COVID-19 pandemic dramatically accelerated the long-term trends of businesses migrating to tech-enabled businesses, ii) falling long-term rates increased the present value of long-term growth stocks, and iii) strong momentum drove up ratings. While the former would appear to us a structural change, the latter two have partially reversed in recent months. Being a closed-ended vehicle, FAV was not forced into selling assets at distressed prices to meet redemptions, but this market appetite created near-term strong headwinds against FAV’s investment style. By way of example, healthcare and IT had been historical underweights for FAV, and several healthcare and IT stocks performed well, meaning that FAV underperformed.
► Fidelity’s approach is based off forecasting earnings over the medium-term perspective. This did not capture some of the long-term potential tech-enabled businesses realised in 2020, as the growth that may previously have been expected to take a decade was accelerated into a few months/years. The approach thus missed the force majeure change that an exogenous shock could bring to a company’s earnings potential.
► Certain long-held positions were severely impacted by the pandemic. The performance of the top five holdings at end-February 2020 in the month of March 2020 is shown below. The average fall in the first three weeks was 40%, with the number 2 position falling 60% and the number 3 by nearly 50%. FAV also had multiple holdings in Indian financials, as, before COVID-19, the country had been in a housing downcycle for almost eight years, resulting in significantly improved housing affordability (house prices compared with household income) – its best level in the past 25 years. Fidelity’s analysis showed that it was on the cusp of a turn in the cycle for the better. Arguably, the manager was slow to respond, but, as noted above, the largest positions have been the strongest conviction ideas, and have been held over the medium term. These stocks became “cheaper” and, as the medium-term business model appeared robust, FAV’s contrarian call appeared more compelling – albeit, with hindsight, wrong.
Share price performance in March 2020 of top 5 holding at end-February
Source: Refinitiv, Hardman & Co Research
0
20
40
60
80
100
120
POWER GRID CORP OF INDIA (1) SHRIRAM TRANS FIN CO (2)
REDINGTON (INDIA) (3) FUFENG GROUP (4)
XINGDA INTL.HOLDINGS SUSP (5) average
That period saw market appetite for
growth over value reach record highs
Fidelity’s modelling did not capture all the
growth in tech-enabled businesses that
was accelerated from years/decades into
months
Severe impact of COVID-19 on some
long-term, high-conviction holdings,
which FAV, with hindsight, proved slow to
sell

Fidelity Asian Values
14 May 2021 38
► COVID-19 also impacted certain business models that had been robust before the pandemic. By way of example, Cebu Air is a low-cost airline with a 55% market share in the Philippines. It has an almost insurmountable lead on its competition in terms of its cost structure, but it clearly suffered, like all airlines. This medium-term competitive advantage proved meaningless as the pandemic hit, and all airlines saw revenue, earnings and share price collapses.
► Similarly, Fidelity’s bottom-up approach saw it overweight in India, Indonesia and the Philippines (39% of assets at end-February 2020) – all countries that are densely populated and suffered an above-regional-average impact from the pandemic.
Lessons learnt What has happened in the past will obviously impact FAV’s performance record and, potentially, sentiment for a while to come. More fundamentally important, though, is what lessons have been learnt and how the portfolio management will change going forward. We believe the fundamental approach, which has delivered significant outperformance over the long term, will not change. However, the experience is likely to lead to:
► A more diversified portfolio – as we detailed above, the concentration in the top holdings has reduced. This should moderate the impact of a high-conviction holding being knocked off course by external events. In March 2021, the top five positions accounted for 11.8% of total net assets, vs. 13.5% in February 2020.
► We also believe the experience of 2020 means that the manager will respond more quickly to external force majeure shocks, which may, over the near term, change the outlook, even when the medium-term outlook is unchanged. We do not expect FAV to become a trading stock (as we noted above, it was already an active manager) – rather just for there to be more sensitivity to the near term.
Strong recovery since FAV’s approach over the long term has delivered superior returns, but it did not work well in 2020. Looking forward, we do not sense that the fundamental approach will change – why should it, given the long-term outperformance? However, we note the closer correlation to the index, which we believe reflects the manager, at least in the short term, being less willing to take positions. We note that, in 1Q’21, FAV beat its index by nearly 2%, with strong stock selection and a slight weakening in growth vs. value appetite. Against UK indices, there has been the relatively strong performance of Asia through COVID-19.
6) FAV: volatility of returns FAV has achieved long-term outperformance, but it is operating in markets that are volatile. In addition, its investment approach, leading to divergence from the benchmarks, is likely to generate further swings in performance. The chart below shows the volatility of returns in the NAV, share price and index for FY’11-FY’20. While, over this period, the NAV average return was 8.6%, it ranged from -17% to +34%. In eight of the past 10 years, it has shown more volatility than the benchmark index, and, in one year, it moved in the opposite direction.
COVID-19 impacted business models like
airlines
Bottom-up stock-picking saw exposures
to countries with above-average COVID-
19 impact
Important issue for investors is what
lessons were learnt. Fundamental
approach, which has delivered long-term
outperformance, unchanged, but now will
see i) more diversification, ii) more
awareness of short-term noise.
Strong recovery since, driven by stock
selection, slight weakening in growth vs.
value appetite, and relatively strong
performance of Asia through COVID-19
FAV investment style likely to generate
incremental volatility to markets that are
already volatile
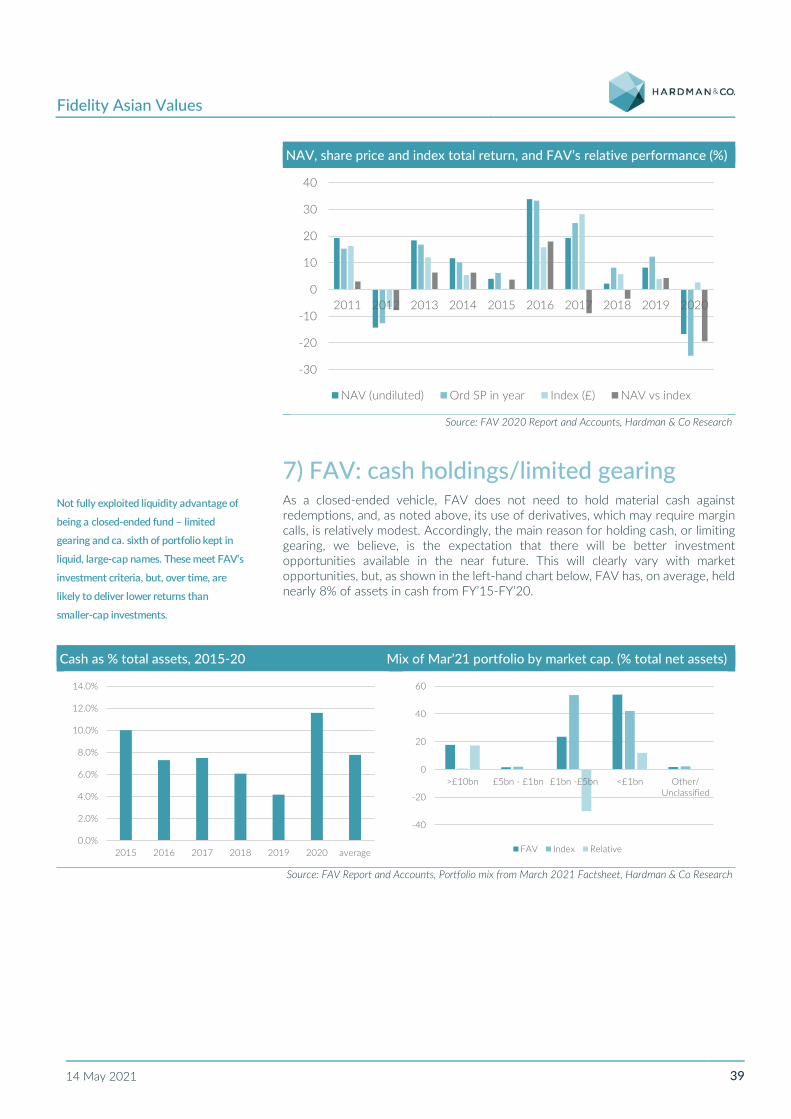
Fidelity Asian Values
14 May 2021 39
NAV, share price and index total return, and FAV’s relative performance (%)
Source: FAV 2020 Report and Accounts, Hardman & Co Research
7) FAV: cash holdings/limited gearing As a closed-ended vehicle, FAV does not need to hold material cash against redemptions, and, as noted above, its use of derivatives, which may require margin calls, is relatively modest. Accordingly, the main reason for holding cash, or limiting gearing, we believe, is the expectation that there will be better investment opportunities available in the near future. This will clearly vary with market opportunities, but, as shown in the left-hand chart below, FAV has, on average, held nearly 8% of assets in cash from FY’15-FY’20.
Cash as % total assets, 2015-20 Mix of Mar’21 portfolio by market cap. (% total net assets)
Source: FAV Report and Accounts, Portfolio mix from March 2021 Factsheet, Hardman & Co Research
-30
-20
-10
0
10
20
30
40
2011 2012 2013 2014 2015 2016 2017 2018 2019 2020
NAV (undiluted) Ord SP in year Index (£) NAV vs index
0.0%
2.0%
4.0%
6.0%
8.0%
10.0%
12.0%
14.0%
2015 2016 2017 2018 2019 2020 average
-40
-20
0
20
40
60
>£10bn £5bn - £1bn £1bn -£5bn <£1bn Other/Unclassified
FAV Index Relative
Not fully exploited liquidity advantage of
being a closed-ended fund – limited
gearing and ca. sixth of portfolio kept in
liquid, large-cap names. These meet FAV’s
investment criteria, but, over time, are
likely to deliver lower returns than
smaller-cap investments.

Fidelity Asian Values
14 May 2021 40
Portfolio Geography The table below shows FAV‘s portfolio compared with its two closest peers based off latest information at the date of publication – updates can be found on the companies’ websites (FAV, ASI Asia Focus and Scottish Oriental Smaller companies). Comparisons need to be treated with a degree of caution, as each of the businesses has a different focus and index. We note that FAV has a much greater exposure to Greater China than either of its peers, is in the middle in terms of India, and is the only one with exposure to Australia and the US.
Geographic portfolio summary of FAV and immediate peers (taken from latest Factsheet disclosure, %)
Country FAV Index FAV vs. Index
ASI Asia Focus
Index vs. FAV Scottish Oriental
Index vs. FAV
India 24.1 19.2 4.9 16.4 14.5 -7.7 39.4 10.9 15.3 China 22.5 13.0 9.5 2.1 9.2 -20.4 11.5 42.7 -11.0 Korea (South) 10.2 20.3 -10.1 7.4 15.4 -2.8 2.4 15.0 -7.8 Taiwan 8.4 24.3 -15.9 10.9 18.3 2.5 6.0 15.5 -2.4 Hong Kong 8.1 6.6 1.5 6.6 5.4 -1.5 5.0 7.7 -3.1 Indonesia 6.6 2.0 4.6 7.4 1.5 0.8 16,3 1.4 9.7 Australia 6.2 0.0 6.2 0.0 22.0 -6.2 n/d n/d n/d US 2.7 0.0 2,7 0.0 0.0 -2.7 n/d n/d n/d Singapore 2.4 5.4 -3.0 10.2 4.6 7.8 2.9 2.5 0.5 Philippines 2.3 0.8 1.5 4.8 0.6 2.5 10.2 0.7 7.9 Thailand n/d n/d n/d 10.1 3.1 n/d 1.4 2.1 n/d Malaysia n/d n/d n/d 7.0 2.6 n/d 1.0 1.5 n/d Vietnam n/d n/d n/d 4.2 0.0 n/d 1.7 0.0 n/d NZ n/d n/d n/d 3.3 2.4 n/d n/d n/d n/d Sri Lanka n/d n/d n/d 2.5 0.0 n/d 0.0 0.0 n/d UK n/d n/d n/d 2.3 0.0 n/d n/d n/d n/d Myanmar n/d n/d n/d 1.1 0.0 n/d n/d n/d n/d Pakistan n/d n/d n/d 0.2 0.4 n/d 1.3 0.0 n/d Others 4.9 8.4 -3.5 3.5 0.0 -1.4 n/d n/d n/d
Source: Factsheets end-March 2021, Hardman & Co Research
Sector exposure FAV’s sectoral mix (as % of total net assets), March 2021
Source: FAV March 2021 Factsheet, Hardman & Co Research
0
5
10
15
20
25
FAV Index
FAV more concentrated in Greater China

Fidelity Asian Values
14 May 2021 41
Valuation FAV trades at a small discount to NAV. As noted above, its performance has been better than that of its peers over the long term, and they trade at much higher discounts.
FAV and peers – discounts/premiums to NAV (%)
Source: LSE, priced on 12 May 2021, Hardman & Co Research
As can be seen from the chart below, at the end of FY’11-FY’16, FAV typically traded at a double-digit discount. This changed in 2016, driven primarily by the strong performance of the trust (average NAV total return 2016-17 27% vs. 8% 2011-15). By July 2019, the trust was trading at a premium to NAV.
Historical discount to NAV at end-July each year
Source: FAV Report and Accounts, NAV announcement, dated 13 May 2021, LSE,
Hardman & Co Research
-16.0%
-14.0%
-12.0%
-10.0%
-8.0%
-6.0%
-4.0%
-2.0%
0.0%
2.0%
4.0%
6.0%
FAV AAS SST average ABD DGN PAC PHI ATR SDP average
-14%
-12%
-10%
-8%
-6%
-4%
-2%
0%
2%
4%
Strong performance in 2016-17 saw
discount to NAV reduce sharply. Share
price was at premium to NAV.

Fidelity Asian Values
14 May 2021 42
Financials Income statement (£000) Year-end Jul 2020 2021E 2022E Revenue Capital Total Revenue Capital Total Revenue Capital Total Gains/losses on derivatives -66,743 -66,743 91,683 91,683 30,615 30,615 Gains/losses on investments 6,285 6,285 671 671 671 671 Investment income 10,602 10,602 8,444 8,444 11,906 11,906 Investment management fees -1,967 312 -1,655 -2,051 -2,051 -1,677 -1,677 Other expenses -797 -797 -774 -774 -774 -774 Foreign exchange gains/losses -1,532 -1,532 0 0 0 0 Profit/(loss) before fin. costs & taxation 7,838 -61,678 -53,840 6,394 91,581 97,974 10,228 30,512 40,741 Finance costs -686 0 -686 -686 -686 -686 -686 Profit/(loss) before taxation 7,152 -61,678 -54,526 5,708 91,581 97,288 9,542 30,512 40,055 Taxation -731 7 -724 -571 -571 -954 -954 Profit/(loss) after taxation for the year 6,421 -61,671 -55,250 5,137 91,581 96,718 8,588 30,512 39,101 Earnings/(loss) per ordinary share (p) 8.64 -82.95 -74.31 7.02 125.15 132.17 11.74 41.70 53.43
Source: FAV Report and Accounts, Hardman & Co Research
Balance sheet @ 31 July (£000) 2015 2016 2017 2018 2019 2020E 2021E 2022E Investments 162,858 222,424 264,076 273,714 312,681 241,271 340,163 372,678 Current assets Derivative instruments 0 1,139 2,829 1,529 1,537 7,299 2,389 2,389 Other receivables 3,737 1,018 1,766 2,307 3,325 1,886 2,340 2,340 Amounts held at futures clearing houses & brokers
0 991 1,937 2,363 2,905 1,115 1,552 1,552
Cash and cash equivalents 14,366 14,324 14,822 11,468 5,796 21,262 13,673 13,673 Total current assets 18,103 17,472 21,354 17,667 13,563 31,562 19,954 19,954 Total assets 180,961 239,896 285,430 291,381 326,244 272,833 360,117 392,632 Current liabilities Derivative instruments 0 -542 -1,554 -960 -2,192 -1,149 -1,066 -1,066 Bank loans -2,024 -1,809 -3,685 -2,447 -1,053 -2,284 -2,217 -2,217 Other payables -2,024 -2,351 -5,239 -3,407 -3,245 -3,433 -3,283 -3,283 Total current liabilities 178,937 237,545 280,191 287,974 322,999 269,400 356,833 389,348 Net assets 178,937 237,545 280,191 287,974 322,999 269,400 356,833 389,348 NAV per share (p) 2.651 3.520 4.152 4.194 4.472 3.644 4.876 5.320
Source: FAV Report and Accounts, Hardman & Co Research
Fidelity Asian Values
14 May 2021 43
Appendix 1: company matters Registered in England and Wales, registration number 3183919.
Registered office: FIL Investments International, Beech Gate, Millfield Lane, Lower Kingswood, Tadworth, Surrey, KT20 6RP.
Investment objective The investment objective of the company is to achieve long-term capital growth, principally from the stock markets of the Asian region, excluding Japan. The company's performance will be measured against the return of the MSCI AC Asia ex Japan Small Cap Index’s (net) total return (in Sterling terms).
The portfolio manager invests in securities of companies that he considers to have fundamental value, which has not been recognised by the market. The company is not restricted in terms of size or industry of companies included in the portfolio, and may invest in unlisted securities. The company may also invest into other transferable securities, collective investment schemes, money market instruments, cash and deposits, and is also able to use derivatives for efficient portfolio management, to gain additional market exposure (gearing) and for investment purposes. The company has adopted a variable management fee, which is calculated by referencing performance relative to the MSCI AC Asia ex Japan (net) Small Cap Index.
Board of directors All the directors are non-executive directors, and all are independent.
Kate Bolsover – Chair Kate Bolsover serves as a Director of TR Property Investment Trust PLC, Baillie Gifford & Company Limited and is Chairman of Invesco Enhanced Investment Trust. She worked for Cazenove Group plc and J.P. Morgan Cazenove between 1995 and 2005, where she was managing director of the mutual fund business, and latterly director of Corporate Communications. Prior to this, her work involved business development and mutual funds experience, covering countries in the Far East. She was appointed as Director of FAV on 1 January 2010 and Chairman on 9 December 2014. Kate will step down at the 2023 AGM.
Clare Brady – Senior Independent Director Clare Brady is a governance professional, with 30 years’ experience in banking and financial services. In the private sector, she headed audit and oversight functions at Barclays Capital, HSBC and Republic National Bank of New York. She was a Managing Director at Deutsche Bank in London and Singapore. In the public sector, she was the Head of Audit at the Bank of England, representing the UK on the European Systems of Central Banks (“ESCB”) and also at the G10 meetings of Central Banks. She was Auditor General at the World Bank, and held the position of Non-Executive Director of the Institute of Internal Auditors (“IIA”), and was also a Director of the International Monetary Fund (“IMF”), both in Washington D.C. She was appointed as Director of FAV on 1 August 2019 and SID on 22 April 2021.
Tim Scholefield – non-executive director Tim Scholefield is a non-executive Director of BMO Capital and Income Investment Trust PLC, Jupiter Unit Trust Manager Ltd and Standard Life UK Smaller Companies PLC. He is Chairman of City Merchants High Yield Trust Ltd and a member of the Investment Management Certificate Panel. He has had over 30 years’ experience in investment management, latterly as Head of Equities at Baring Asset Management

Fidelity Asian Values
14 May 2021 44
until April 2014. He was appointed as non-executive director of FAV on 30 September 2015, and appointed as Senior Independent Director on 22 April 2020 (stood down as SID on 22 April 2021).
Grahame Stott – Chairman of the Audit Committee Grahame Stott is a non-executive Director and Chairman of the Remuneration Committee of China Motor Bus Company Limited. He is a Fellow of the Institute and Faculty of Actuaries, and an Affiliate of the ACCA. He spent 20 years at Watson Wyatt in Hong Kong, during which time he became the regional director for 12 countries across Asia Pacific. He also served as the head of Watson Wyatt’s Global Investment Consulting Business. His background is working with fast-growing listed companies. He was appointed as Director and Chairman of the Audit Committee of FAV on 24 September 2013. Grahame will step down at the 2022 AGM.
Michael Warren – non-executive director Michael Warren is a non-executive director of Carrington Investments and a non-executive board member of Rathbone Unit Trust Management Limited. He worked for Thames River Capital from 2007 until 2012 as Investment Director. Prior to that, he worked at HSBC Investments, where he was responsible for Institutional and Retail distribution, and, before that, at Deutsche Asset Management, where he was a main board member. Latterly, he has served as managing director of the UK mutual fund business, DWS. He was a appointed as non-executive director of FAV on 29 September 2014.
Investment managers Nitin Bajaj – Portfolio Manager Nitin Bajaj joined Fidelity in 2003 in London as a research analyst, covering European food & tobacco and large-cap Italian and Spanish banks. In 2007, after a very successful and highly rated period in research, Nitin became an Assistant Portfolio Manager for the Fidelity Global Special Situations Fund in the UK. Nitin subsequently moved to Fidelity’s Mumbai office in 2009 to manage FIL’s domestic Indian equity funds. He moved to Singapore in early 2013, and manages the Fidelity Asian Values PLC and Fidelity Asian Smaller Companies Fund from there. Nitin has a MBA from INSEAD, and is a Chartered accountant
Ajinkya Dhavale – Assistant Portfolio Manager Ajinkya joined Fidelity in 2011 as an investment analyst in the Mumbai office and, in 2014, he relocated to the Singapore office to take up the role of a shorting analyst, covering the whole Asia ex-Japan region. In 2018, he rotated into the small-cap space, covering equities in Korea and Taiwan. Ajinkya is a CFA and Chartered Accountant from the Institute of Chartered Accountants of India, and holds a B. Com. from the University of Pune. Prior to Fidelity, Ajinkya had six years of experience as a research/equity analyst at other firms.
Investment restrictions20 “The Company will invest and manage its assets with an objective of spreading risk with the following investment restrictions:
► No single or aggregate investment in any one company or other investment entity shall represent more than 10% of its Gross Assets, measured at the time of any investment.
► Up to 5% of its Gross Assets, at the time of investment, in securities which are not listed on any stock exchange. However the Portfolio Manager will not normally make
20 2020 Report and Accounts p19
Fidelity Asian Values
14 May 2021 45
any such investment, except where it is expected that the securities will become listed on a stock exchange in the foreseeable future.
► Up to 15% of its Gross Assets, at the time of investment, in other investment funds (whether listed or unlisted) where such funds offer the only practicable means of gaining exposure to a particular market in the Asian Region* excluding Japan. Within this limit, no more than 10% of Gross Assets, at the time of investment, may be invested in funds that do not have stated policies to invest more than 15% of their Gross Assets in other listed closed-ended funds.
► Up to 5% of its Gross Assets, at the time of investment, in securities which are not listed or domiciled in the Asian Region*, provided the investments have a strong Asian Region* rationale.
The Company is permitted to invest in Non-Voting Depositary Receipts, American Depositary Receipts, Global Depositary Receipts and Equity Linked Notes. Any such investment will be included in the relevant aggregate country weightings.
* Asian Region means the continent of Asia (including Hong Kong, South Korea, Thailand, Singapore, Malaysia, Taiwan, Indonesia, Philippines, China, India, Pakistan and Sri Lanka, but excluding Japan, the countries comprising the former U.S.S.R. and the Middle East), together with Australasia.”

Fidelity Asian Values
14 May 2021 46
Disclaimer Hardman & Co provides professional independent research services and all information used in the publication of this report has been compiled from publicly available sources that are believed to be reliable. However, no guarantee, warranty or representation, express or implied, can be given by Hardman & Co as to the accuracy, adequacy or completeness of the information contained in this research and they are not responsible for any errors or omissions or results obtained from use of such information. Neither Hardman & Co, nor any affiliates, officers, directors or employees accept any liability or responsibility in respect of the information which is subject to change without notice and may only be correct at the stated date of their issue, except in the case of gross negligence, fraud or wilful misconduct. In no event will Hardman & Co, its affiliates or any such parties be liable to you for any direct, special, indirect, consequential, incidental damages or any other damages of any kind even if Hardman & Co has been advised of the possibility thereof.
This research has been prepared purely for information purposes, and nothing in this report should be construed as an offer, or the solicitation of an offer, to buy or sell any security, product, service or investment. The research reflects the objective views of the analyst(s) named on the front page and does not constitute investment advice. However, the companies or legal entities covered in this research may pay us a fixed fee in order for this research to be made available. A full list of companies or legal entities that have paid us for coverage within the past 12 months can be viewed at http://www.hardmanandco.com/legals/research-disclosures. Hardman may provide other investment banking services to the companies or legal entities mentioned in this report.
Hardman & Co has a personal dealing policy which restricts staff and consultants’ dealing in shares, bonds or other related instruments of companies or legal entities which pay Hardman & Co for any services, including research. No Hardman & Co staff, consultants or officers are employed or engaged by the companies or legal entities covered by this document in any capacity other than through Hardman & Co.
Hardman & Co does not buy or sell shares, either for their own account or for other parties and neither do they undertake investment business. We may provide investment banking services to corporate clients. Hardman & Co does not make recommendations. Accordingly, they do not publish records of their past recommendations. Where a Fair Value price is given in a research note, such as a DCF or peer comparison, this is the theoretical result of a study of a range of possible outcomes, and not a forecast of a likely share price. Hardman & Co may publish further notes on these securities, companies and legal entities but has no scheduled commitment and may cease to follow these securities, companies and legal entities without notice.
The information provided in this document is not intended for distribution to, or use by, any person or entity in any jurisdiction or country where such distribution or use would be contrary to law or regulation or which would subject Hardman & Co or its affiliates to any registration requirement within such jurisdiction or country.
Some or all alternative investments may not be suitable for certain investors. Investments in small and mid-cap corporations and foreign entities are speculative and involve a high degree of risk. An investor could lose all or a substantial amount of his or her investment. Investments may be leveraged and performance may be volatile; they may have high fees and expenses that reduce returns. Securities or legal entities mentioned in this document may not be suitable or appropriate for all investors. Where this document refers to a particular tax treatment, the tax treatment will depend on each investor’s particular circumstances and may be subject to future change. Each investor’s particular needs, investment objectives and financial situation were not taken into account in the preparation of this document and the material contained herein. Each investor must make his or her own independent decisions and obtain their own independent advice regarding any information, projects, securities, tax treatment or financial instruments mentioned herein. The fact that Hardman & Co has made available through this document various information constitutes neither a recommendation to enter into a particular transaction nor a representation that any financial instrument is suitable or appropriate for you. Each investor should consider whether an investment strategy of the purchase or sale of any product or security is appropriate for them in the light of their investment needs, objectives and financial circumstances.
This document constitutes a ‘financial promotion’ for the purposes of section 21 Financial Services and Markets Act 2000 (United Kingdom) (‘FSMA’) and accordingly has been approved by Capital Markets Strategy Ltd which is authorised and regulated by the Financial Conduct Authority (FCA).
No part of this document may be reproduced, stored in a retrieval system or transmitted in any form or by any means, mechanical, photocopying, recording or otherwise, without prior permission from Hardman & Co. By accepting this document, the recipient agrees to be bound by the limitations set out in this notice. This notice shall be governed and construed in accordance with English law. Hardman Research Ltd, trading as Hardman & Co, is an appointed representative of Capital Markets Strategy Ltd and is authorised and regulated by the FCA under registration number 600843. Hardman Research Ltd is registered at Companies House with number 8256259.
(Disclaimer Version 8 – Effective from August 2018)
Status of Hardman & Co’s research under MiFID II Some professional investors, who are subject to the new MiFID II rules from 3rd January 2018, may be unclear about the status of Hardman & Co research and, specifically, whether it can be accepted without a commercial arrangement. Hardman & Co’s research is paid for by the companies, legal entities and issuers about which we write and, as such, falls within the scope of ‘minor non-monetary benefits’, as defined in the Markets in Financial Instruments Directive II.
In particular, Article 12(3) of the Directive states: ‘The following benefits shall qualify as acceptable minor non-monetary benefits only if they are: (b) ‘written material from a third party that is commissioned and paid for by a corporate issuer or potential issuer to promote a new issuance by the company, or where the third party firm is contractually engaged and paid by the issuer to produce such material on an ongoing basis, provided that the relationship is clearly disclosed in the material and that the material is made available at the same time to any investment firms wishing to receive it or to the general public…’
The fact that Hardman & Co is commissioned to write the research is disclosed in the disclaimer, and the research is widely available.
The full detail is on page 26 of the full directive, which can be accessed here: https://ec.europa.eu/transparency/regdoc/rep/3/2016/EN/3-2016-2031-EN-F1-1.PDF
In addition, it should be noted that MiFID II’s main aim is to ensure transparency in the relationship between fund managers and brokers/suppliers, and eliminate what is termed ‘inducement’, whereby free research is provided to fund managers to encourage them to deal with the broker. Hardman & Co is not inducing the reader of our research to trade through us, since we do not deal in any security or legal entity.