Cyclone Warning in India - India Meteorological Department · Cyclone Warning in India : ... 1.3....
204
Transcript of Cyclone Warning in India - India Meteorological Department · Cyclone Warning in India : ... 1.3....


Cyclone Warning in IndiaStandard Operation Procedure
July 2013
INDIA METEOROLOGICAL DEPARTMENTMinistry of Earth Sciences
Govt. of India

Cyclone Warning in India : Standard Operation Procedure
A publication of:India Meteorological DepartmentMinistry of Earth SciencesGovernment of IndiaMausam BhawanLodi RoadNew Delhi-110003
July, 2013
When citing these guidelines the following citation should be used:Cyclone Warning in India : Standard Operation ProcedurePublished by India Meteorological Department, Ministry of Earth Sciences, Government of India, Mausam Bhawan, Lodi Road, New Delhi-110003, SOP No. 10/2013, 200pp.

iii
Contents Page No.
List of Figures ....................................................................................................... xi
List of Tables ...................................................................................................... xv
List of Acronyms .................................................................................................... xvii
Preface ................................................................................................... xxiii
Acknowledgements .................................................................................................... xxv
1 Introduction ........................................................................................................ 1
1.1. ClassificationofCyclonicDisturbances .................................................................. 1
1.2. Structure of Tropical Cyclone ................................................................................. 2
1.2.1. Eye ........................................................................................................ 3
1.2.2. Wall Cloud Region or Eye Wall .................................................................. 3
1.2.3. Rain/Spiral Bands ....................................................................................... 4
1.2.4. Outer Storm Area ........................................................................................ 5
1.2.5. Vertical Structure ......................................................................................... 5
1.3. Life Cycle of Tropical Cyclone ................................................................................ 6
1.3.1 Formative Stage .......................................................................................... 7
1.3.2. Immature Stage ........................................................................................... 7
1.3.3. Mature Stage ............................................................................................... 7
1.3.4. Decaying Stage .......................................................................................... 8
1.4. Hazard due to Cyclone ........................................................................................... 8
1.4.1. Winds ...................................................................................................... 10
1.4.2. Marine Impact ............................................................................................ 13
1.4.3. Rainfall ...................................................................................................... 13
1.4.4. Storm Surge ............................................................................................... 14

iv
CyClone Warning in india - Standard operation proCedure
1.5 Historical Cyclones and their Impact: ................................................................... 20
1.6. Climatology of Tropical Cyclones ........................................................................ 20
1.6.1. Frequency of Disturbances ....................................................................... 20
1.6.2. Location of Genesis ................................................................................... 20
1.6.3. Intensification ............................................................................................. 23
1.6.4. Movement ................................................................................................. 23
1.6.5. Landfall ..................................................................................................... 26
1.7. Naming of Cyclones .............................................................................................. 29
1.8. Early Warning System ........................................................................................... 30
2 Cyclone Warning Organisation ................................................................................. 32
2.1 Milestones ...................................................................................................... 32
2.2. Organizational Structure ........................................................................................ 34
2.2.1. Regional Specialized Meteorological Centre (RSMC)- Tropical Cyclones, New Delhi ................................................................... 34
2.2.2. Cyclone Warning Division ......................................................................... 36
2.2.3. ACWCs/CWCs .......................................................................................... 36
2.2.4. OtherOffices ............................................................................................ 37
3 Needs for Monitoring and Prediction ....................................................................... 39
3.1. Data and Products ................................................................................................ 39
3.2. Intensive Observational Phases (IOP) ................................................................. 44
3.3. Manpower Needed ................................................................................................ 45
4 Observational Aspects of Cyclone Warning System ............................................. 46
4.1. Introduction ...................................................................................................... 46
4.2. Surface (Land, Ocean) Based Observations ....................................................... 47
4.2.1. Land Based Conventional Surface Observatories ................................... 48
4.2.2. Cooperative Cyclone Reporting Network of Stations ............................... 49
4.2.3. Time of Observations ................................................................................ 49

v
ContentS
4.3. Ship Observations ................................................................................................. 50
4.3.1. Voluntary Observing Fleet (VOF) .............................................................. 50
4.3.2. Recording and Reporting of Ship Observations ...................................... 50
4.4. Data Buoy Network ............................................................................................... 51
4.5. Tide Gauges ...................................................................................................... 52
4.6. Reports fromAirportMeteorologicalOffices ........................................................ 52
4.7. Special Observations from Coastal Stations ........................................................ 54
4.7.1. Need for Special Observations ................................................................. 54
4.7.2. General Instructions ................................................................................... 54
4.7.3. DiscretionofStormWarningOfficer ......................................................... 55
4.7.4. Role of Special Observations in Determining the Period of Landfall ..... 55
4.7.5 Importance of 24 hr Pressure Change (P24P24) ....................................... 55
4.7.6. Discontinuance of Special Observations .................................................. 55
4.8. Automatic Weather Stations .................................................................................. 56
4.9. Upper Air Observations ........................................................................................... 57
4.9.1. Pilot Balloon Observatories ........................................................................ 57
4.9.2. Radiosonde/Radiowind Observations ...................................................... 57
4.9.3.WindProfilers ............................................................................................ 58
4.10. Microseism Observations ...................................................................................... 60
4.11. Quality Control of Observations ............................................................................ 60
4.12. Radar Observations ............................................................................................... 61
4.12.1. Tracking by S-band Radars and Doppler Radars ................................... 61
4.12.2. Radars in Neighbouring Countries ............................................................ 65
4.12.3. X-Band Radars.......................................................................................... 65
4.12.4. Operation of Radar and Availability of Radar Observations ................. 66
4.12.5. Radar Bulletin .......................................................................................... 67
4.13. Satellite Cloud Imagery Data and Derived Products Useful in Cyclone Warning ................................................................................................... 67

vi
CyClone Warning in india - Standard operation proCedure
4.13.1. Cloud Imagery Data .................................................................................. 67
4.13.2. Derived Products Used for Diagonising a Tropical Cyclone ................... 69
4.13.3. Tropical Cyclone Bulletins Based on Satellite Cloud Imagery Data and Derived Products ................................................................................ 71
Appendix 4.1. List of Coastal stations in India .................................................................. 73
Appendix 4.2. List of Foreign Coastal stations .................................................................. 76
Appendix 4.3. List of Co-operative Cyclone Reporting Network of Stations (Andhra Pradesh & Orissa) ......................................................................... 78
5 Monitoring and Prediction Technique ...................................................................... 79
5.1. Monitoring and Prediction of Cyclogenesis .......................................................... 79
5.1.1. Road Map .................................................................................................. 79
5.1.2. Tools to Use for Tropical Activity Daily Watch ......................................... 82
5.1.3. Methodology for Tropical Activity Daily Watch ......................................... 83
5.2. Monitoring of Cyclonic Disturbances (Depression and Above) ........................... 83
5.2.1. Synoptic Analysis ....................................................................................... 85
5.2.2. Satellite Analysis ........................................................................................ 85
5.2.2.1. Position and Intensity of a Tropical Cyclone by Dvorak Technique ...................................................................................... 86
5.2.3. Radar Techniques for Fixing Centre and Intensity of Cyclone ............... 89
5.3. Characteristics of Cyclonic Disturbance ................................................................. 91
5.3.1. Maximum Wind .......................................................................................... 91
5.3.2. Estimated Central Pressure (ECP) ........................................................... 91
5.3.3. Pressure Drop ∆P ...................................................................................... 91
5.3.4. Radius of Maximum Wind (RMW) ............................................................ 91
5.3.5. Heavy Rain ................................................................................................ 91
5.3.6. State of Sea ............................................................................................... 91
5.4. Prediction of Characteristics of Cyclonic Disturbances ....................................... 92
5.4.1. TC Analysis Tools and Techniques ........................................................... 93
5.4.2. Cyclone Track Forecasting ...................................................................... 95

vii
ContentS
5.4.3. Cone of Uncertainty in Track Forecast .................................................... 98
5.4.4. Intensity Forecasting .................................................................................. 99
5.4.4.1. Statistical Dynamical Model for Cyclone Intensity Prediction .. 100
5.4.5. Quadrant Wind Forecasting .................................................................... 100
5.4.6. Prediction of Heavy Rainfall .................................................................... 102
5.4.7. Prediction of Gale Wind at Landfall ......................................................... 103
5.4.8. Storm Surge .............................................................................................. 104
5.4.8.1. Nomograms ................................................................................. 104
5.4.8.2. IIT Delhi Storm Surge Model ................................................... 104
5.5. Check List for Decision Making ........................................................................ 106
6 Bulletins and Warnings .............................................................................................113
6.1 Introduction .....................................................................................................113
6.2. Bulletins Issued by RSMC, New Delhi ................................................................113
6.2.1. Tropical Weather Outlook ..........................................................................114
6.2.2. Tropical Cyclone Advisories .......................................................................115
6.2.3. Tropical Cyclone Advisories for Civil Aviation .............................. 117
6.3. Global Maritime Distress Safety System (GMDSS) ............................................118
6.3.1. Transmission of GMDSS Bulletin .............................................................118
6.3.2. Frequency of Broadcasts ........................................................................118
6.3.3. Modality of Transfer of GMDSS Bulletin to CES ARVI .........................118
6.3.4. Sample of GMDSS Bulletin ................................................................... 121
6.4. Bulletin for India Coasts ....................................................................................... 121
6.4.1. Four Stage Warning Bulletin Issued by Cyclone Warning Division ...... 121
6.4.2.DGM’sBulletin forHighGovt.Officials ................................................... 122
6.4.3. Bulletin through SMS ................................................................................ 122
6.4.4.PersonalBriefing ....................................................................................... 124
6.4.5. Press Conference ..................................................................................... 124

viii
CyClone Warning in india - Standard operation proCedure
6.5. UserSpecificBulletins IssuedbyACWCs/CWCs ............................................. 124
6.5.1. Four Stage Warning Bulletin ................................................................... 124
6.5.2. Sea Area Bulletin ..................................................................................... 126
6.5.3. Coastal Weather Bulletins ....................................................................... 129
6.5.4. Fleet Forecast for Indian Navy ............................................................... 130
6.5.4.1. Items in Fleet Forecast .............................................................. 131
6.5.4.2. Mode of Transmission of Fleet Forecast to Naval W/T Mumbai ............................................................................... 132
6.5.5. Warnings to Ports .................................................................................... 132
6.5.5.1. Hoisting of Signals .................................................................... 132
6.5.5.2. Frequency of Issue and Contents of Port Warning Bulletin .... 134
6.5.5.3. Format for Port Warning .......................................................... 134
6.5.6. Warnings for Fisheries ............................................................................ 135
6.5.6.1. Criteria for Warnings ................................................................ 135
6.5.6.2. Warnings through FAX ............................................................... 135
6.5.6.3. Format for Fisheries Warning .................................................. 135
6.5.7. Bulletins for All India Radio (AIR) ........................................................... 136
6.5.7.1. Format for Cyclone Alert/Warning Bulletin for AIR/Press/Public ........................................................................ 136
6.5.8. Coastal Bulletins for AIR News Cycle .................................................... 136
6.5.9. Registered/Designated Warnees ........................................................... 137
6.5.10. Press Bulletins ........................................................................................ 137
6.5.11. Aviation Warnings ................................................................................... 137
6.5.12. Bulletin through Satellite Based Cyclone Warning Dissemination System (CWDS) ...................................................................................... 137
6.5.13.PersonalBriefing .................................................................................... 137
6.5.14. Bulletin through SMS ............................................................................... 138

ix
ContentS
6.6. Other Products Generated by Cyclone Warning Division, New Delhi .............. 138
6.6.1. Track and Cone of Uncertainty ............................................................... 139
6.6.2. Ship Avoidance Guidance ....................................................................... 139
6.6.3. Tropical Cyclone (TC) Vitals ................................................................... 139
6.6.3.1. Format of TC Vitals ................................................................... 139
6.6.4. Storm Surge Warning .............................................................................. 140
6.6.5. Heavy Rainfall Warning ........................................................................... 140
6.6.6. Gale Waind Warning .............................................................................. 142
6.6.7. Crucial Observations ............................................................................... 142
6.6.8. Satellite and Radar Features .................................................................. 142
6.6.9. Prognosis and Diagnosis ......................................................................... 143
6.6.10.SignificantPastWeather ......................................................................... 143
6.7. Damage Potential and Action Suggested in the Bulletin .................................. 143
6.8. Time of Issue of Bulletins ................................................................................... 143
6.9. Numbering of Bulletins ........................................................................................ 143
6.10. Reference Time ................................................................................................... 143
6.11. Terminologies in the Bulletins ............................................................................. 143
6.12. Check List for Procedures ................................................................................ 147
7 Cyclone Warning Dissemination ............................................................................. 149
7.1. Cyclone Warning Dissemination ......................................................................... 149
7.1.1. Cyclone Warning Dissemination System (CWDS) .................................. 152
7.1.2. Digital Meteorological Data Dissemination............................................... 152
8 Pre-cyclone Exercise ................................................................................................ 154
8.1. Telecommunications ........................................................................................... 154
8.2. Publicity and Broadcast of Warnings ................................................................ 154
8.3. Observational Data and Organisation ............................................................... 155
8.4. Reference Publications and Forms ................................................................... 155

x
CyClone Warning in india - Standard operation proCedure
8.5. Cyclone Manual ................................................................................................. 156
8.6. Telephone Fax and E-mail Address ................................................................... 156
8.7. Staff Matters .................................................................................................... 156
8.8. Circular Letter to Warnees ................................................................................ 156
8.9. Ports .................................................................................................... 157
8.10 Meeting with the Chief Secretaries of the Maritime States ............................. 158
8.11. Visit to Coastal Radio Station ........................................................................... 159
8.12. User’s Workshop ................................................................................................. 159
9 Post Cyclone Action ................................................................................................. 160
9.1. Preliminary and Final Reports ........................................................................... 160
9.2. Press Bulletin .................................................................................................... 162
9.3. Final Report .................................................................................................... 162
9.4. Scrutiny of Action Taken by ACWC/CWC ......................................................... 163
9.5. Visit ofOfficer toCycloneAffectedAreas ........................................................ 163
9.5.1. Assessment of Damage ......................................................................... 163
9.5.2. Purpose of Survey ................................................................................. 163
9.5.3. Annual Cyclone Review Meeting ........................................................... 164
9.5.4 Back-plotting and Re-analysis ............................................................... 165
Appendix A: (Preliminary Report) ...................................................................................... 166
Appendix B: (FINAL REPORT) ......................................................................................... 167
10 Management of Cyclone and Common Man ......................................................... 169
10.1. Steps to be Taken Before the Cyclone ............................................................ 169
10.2. Steps to be Taken During the Cyclone ............................................................. 169
10.3. Steps to be Taken After Cyclone ....................................................................... 170
10.4. Linkage of IMD with Cyclone Disaster Management ........................................ 171
11 Conclusions and Future Scope ................................................................................ 172

xi
List of Figures Page No.
Fig.1.1. Schematic diagram of a cyclone ....................................................................2
Fig.1.2. Composite structure of cyclone as seen in Radar imagery ..........................3
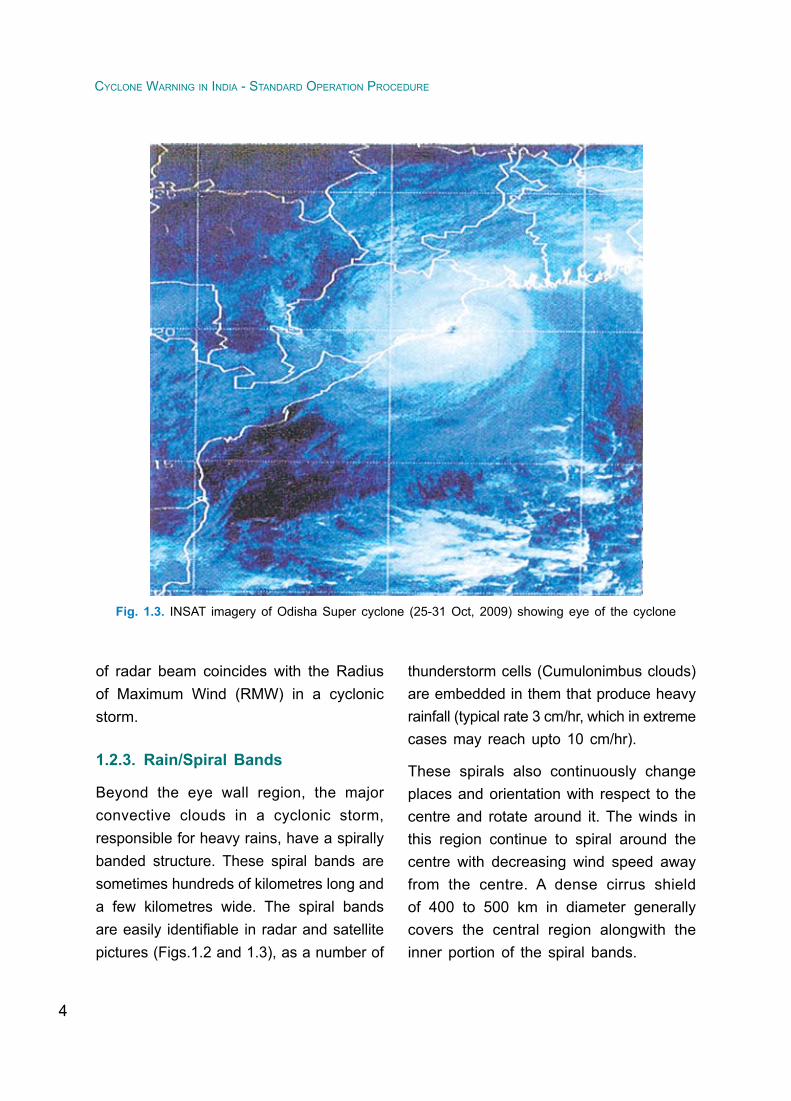
Fig.1.3. INSAT imagery of Odisha Super cyclone (25-31 Oct, 2009) showing eye of the cyclone ............................................................................4
Fig.1.4. Vertical structure of a cyclone ........................................................................5
Fig.1.5. Longest life period cyclone over the NIO ......................................................6
Fig.1.6. Types of Potential Damages accompanying Tropical Cyclones ...................8
Fig.1.7. Damage caused by very severe cyclonic storm ‘Nargis’ ............................ 11
Fig.1.8. Flood caused by Odisha super cyclone, 25-31 October 1999 ...................13
Fig.1.9. Impact of storm surge caused by Very severe cyclonic storm ‘Nargis’ ...........................................................................................................14
Fig.1.10. Probable maximum storm surge (PMSS) above tide levels (In metres) over maritime districts of east and west coasts of India .........15
Fig.1.11(a). Monthly frequency of cyclonic disturbances over NIO during 1891-2011 ......................................................................................................21
Fig.1.11(b). Monthly frequency of cyclonic disturbances over the BOB during 1891-2011...........................................................................................21
Fig.1.11(c). Monthly frequency of cyclonic disturbances over Arabian Sea during 1891-2011...........................................................................................22
Fig.1.11(d). Monthly frequency of total cyclonic disturbances (depression and above) and total cyclones (Cyclonic storms and above) during 1891-2011 over NIO ......................................................................................22
Fig.1.12(a). Frequency of genesis of cyclonic disturbances over the NIO during pre-monsoon season .....................................................................................23
xii
CyClone Warning in india - Standard operation proCedure
Fig.1.12(b). Frequency of genesis of cyclonic disturbances over the NIO during monsoon season ...........................................................................................24
Fig.1.12(c). Frequency of genesis of cyclonic disturbances over the NIO during post-monsoon season ........................................................................24
Fig.1.13(a). MonthlyProbability of intensificationof depression into a cyclone ............25
Fig.1.13(b). MonthlyProbability of intensificationof depression into a severe cyclonic storm ................................................................................................25
Fig.1.13(c). MonthlyProbability of intensificationof cyclonic storm into a severe cyclonic storm ...................................................................................26
Fig.1.14(a). Tracks of cyclones over the NIO during 1891-2009 ...................................27
Fig.1.14(b). Probability of direction of movement of cyclonic disturbances over the NIO ..................................................................................................27
Fig.1.15(a). Frequency of cyclone/ severe cyclone over the Bay of Bengal landfalling over different coastal states during 1891-2007. .........................28
Fig.1.15(b). Frequency of cyclone/severe cyclone over the Arabian Sea landfalling over different coastal states during 1891-2007 ..........................28
Fig.1.16. Early Warning system of cyclone over NIO ................................................31
Fig.2.1. Area of responsibility of different RSMCs and TCWCs ..............................35
Fig.2.2. Area of responsibility of RSMC- Tropical Cyclones, New Delhi .................35
Fig.2.3. Cyclone Warning Organisational Structure of IMD ......................................36
Fig.4.1(a). Classificationof observations .......................................................................46
Fig.4.1(b). Observational network for cyclone monitoring .............................................47
Fig.4.2. Picture of a Data Buoy deployed at Sea ....................................................51
Fig.4.3(a-b). Schematic acoustic tide gauge and Tide Gauge Network in India ............53
Fig.4.4. Typical coastal observations taken during cyclone monitoring ...................54
Fig.4.5. Schematic diagram of an AWS ....................................................................56
Fig.4.6. Pilot balloon observatory network of India ...................................................58

xiii
liSt of figureS
Fig.4.7. RS/RW network of India ...............................................................................59
Fig.4.8. A schematic representationof aWindProfiler ..........................................60
Fig.4.9. S-band Cyclone Detection Radar Network ..................................................62
Fig.4.10. Typical DWR products (Maxz and UWT) used for cyclone monitoring ......62
Fig.4.11. Realtime PPZ, MAXZ & PPV images of cyclone THANE ..........................63
Fig.4.12. Wind data available through satellites .........................................................70
Fig.4.13. Microwave imageries of TC THANE ............................................................71
Fig.5.1 SST as on 25th March, 2009 .......................................................................80
Fig.5.2. Real-time MJO-OLR forecast ........................................................................81
Fig.5.3. Position and Intensity of a tropical cyclone by Dvorak Technique .............84
Fig.5.4. Model of tropical cyclone development used in Intensity analysis .............86
Fig.5.5 (a) EIR analysis diagram for determining the Intensity (b) Vis analysis diagram for determining the Intensity ................................87
Fig.5.6. Utility of modernised cyclone analysis and forecasting system ..................94
Fig.5.7(a). Track prediction of TC, RASHMI by NWP models ......................................96
Fig.5.7(b). Track prediction of TC, JAL by EPS ............................................................97
Fig.5.8. Observed and forecast track of Cyclonic Storm NILAM with cone of uncertainty .................................................................................................98
Fig. 5.9. A typical graphical presentation of quadrant wind forecast during cyclonic storm GIRI .....................................................................................102
Fig.5.10. Typical rainfall prediction by NWP model ..................................................103
Fig.5.11. Typical storm surge prediction by IITD model in case of VSCS ‘THANE’ .......................................................................................................105
Fig.6.1. Area of responsibility and designated national meteorological services for the issue of warnings and weather and sea bulletins for the gmdss ..............................................................................................120
Fig.6.2. Transmission of GMDSS Bulletin ...............................................................120

xiv
CyClone Warning in india - Standard operation proCedure
Fig.6.3. Area of coverage for issue of coastal weather bulletin and sea area bulletin .................................................................................................127
Fig.6.4. Map showingareas for fleet forecast issuedby IMD ..............................131
Fig.6.5. Typical example of track alongwith cone of uncertainty forecast issued by IMD .............................................................................................138
Fig.6.6. Typical example of radii of quadrant wind forecast issued by IMD .........................................................................................................141
Fig.6.7. Storm surge guidance during cyclone AILA ...............................................141
Fig.6.8. A typical example of heavy rainfall warning graphics issued by IMD ......142
Fig.7.1. Interactive Voice Response system ...........................................................149
Fig.7.2. (a) CWDS network and (b) block diagram of typical CWDS site at a coastal station .....................................................................................151

xv
List of Tables Page No.
Table1.1. Criteria for classificationof cyclonic disturbancesover theNorth Indian Ocean ............................................................................................. 1
Table 1.2. Storm Intensity, Expected Damage and Suggested Actions ................... 9
Table 1.3. Marine impact of cyclonic disturbances ................................................. 12
Table 1.4.(a) Historical records of 12 most devastating cyclonic storms, which formed in the Bay of Bengal and made landfall on the East coast of India ........................................................................................... 16
Table 1.4.(b) Historical records of 11 most devastating cyclonic storms, which formed in the Arabian Sea and made landfall on the West coast of India .......................................................................... 18
Table 1.5. Naming of Tropical Cyclones .................................................................. 29
Table 2.1. Area of Responsibility of ACWC/CWC ................................................... 37
Table 3.1. Check list of Required Products ............................................................. 42
Table 4.1. List of active buoys ................................................................................. 51
Table 4.2. Cyclone Warning Radars in the neighbouring countries ....................... 65
Table 4.3. X-Band 3- cm radars along the coast line of India .............................. 66
Table 4.4. Example of Radar based Cyclone Bulletin ............................................ 68
Table5.1. Dvorak’s classificationof cyclonic disturbances .................................... 89
Table 5.2. Distribution of rainfall .............................................................................. 92
Table 5.3. Intensity of rainfall ................................................................................... 92
Table 5.4. Sea Condition .......................................................................................... 93
Table 6.1. Stations issuing cyclone warnings for ships on the high seas ............119
Table6.2. PrefixofCodeWord toSeaAreaBulletin for coastalRadio Stations .................................................................................................. 128

xvi
CyClone Warning in india - Standard operation proCedure
Table6.3. Areaof responsibility for fleet forecast ................................................ 130
Table 6.4. Port Warning Signals (General System) used in India ....................... 133
Table 6.5. Radius of circle to construct cone of uncertainty ................................ 139
Table 6.6. Radius of circle to construct the cone of ship avoidance guidance ................................................................................................ 139
Table 6.7. Damage potential and action suggested in Bulletin for India coast ...................................................................................................... 144
Table 6.8. Time of issue of bulletin when the system is depression/deep depression ............................................................................................. 145
Table 6.9. Time (UTC) of issue of bulletin when the system is cyclonic storm ...................................................................................................... 145
Table 6.10. State of Sea .......................................................................................... 146
Table 6.11. Distribution of Rainfall ........................................................................... 146
Table 6.12. Intensity of Rainfall ................................................................................ 146
Table 6.13.(a) Check list of dissemination of bulletin by Cyclone Warning Division .................................................................................................. 147
Table 6.13.(b) Cyclone Warning Check List for ACWCs/CWCs ................................. 148
Table 7.1 Dissemination of the Cyclone Warnings .............................................. 150

xvii
List of Acronyms
ACWC Area Cyclone Warning Centre
ADT Advanced Dvorak Technique
AIR All India Radio
AMSS Automatic Message Switching System
AMSU Advanced Microwave Sounder Unit
ARB Arabian Sea
ARG’s Automatic Rain Gauge Stations
AWS Automatic Weather Station
BoB Bay of Bengal
BoM Bureau of Meteorology
C.I. No. Current Intensity Number
CAPE Convective Available Potential Energy
CCD Charge Coupled Device
CDMC Cyclone Distress Mitigation Committee
CDO Central Dense Overcast
CDR Cyclone Detection RADAR
CDs Cyclonic Disturbances
CIMSS Cooperative Institute for Meteorological Satellite Studies
CINE Convective Inhibition Energy
CIPS Cooperative Institute for Precipitation Systems
CLIPER Model Climatology and Persistence Model
CMV Cloud Motion Vectors
COU Cone of Uncertainty
CPC Climate Prediction Centre
CRC Cyclone Review Committee

xviii
CyClone Warning in india - Standard operation proCedure
CTT Cloud Top Temperature
CWC Cyclone Warning Centre
CWD Cyclone Warning Division
CWRC Cyclone Warning Research Centre
DMDD Digital Meteorological Data Dissemination
DMSP Defence Met. Satellite Programme of U.S.A.
DPE Direct Position Error
DRMS District-wise Rainfall Monitoring Scheme
DWR Doppler Weather RADAR
ECMWF European Centre for Medium-Range Weather Forecasts
EEC Radars Enterprise Electronics Corporation Radars
EIR Enhanced Infrared
EPS Ensemble Prediction System
FNMOC Fleet Numerical Meteorology and Oceanography Centre
GEFS Global Ensemble Forecast System
GFS Global Forecast System
GMDSS Global Maritime Distress Safety System
GPP Genesis Potential Parameter
GTS Global Telecommunication System
HFRT High Frequency Radio Transmission
HSDT High Speed Data Terminals
HWRF Hurricane Weather Research and Forecasting
IADP Intensive Agricultural Development Programme
IAF Indian Air Force
ICAO International Civil Aviation Organisation
IITD Indian Institute of Technology Delhi
IMD India Meteorological Department
IMDPS Indian Meteorological Data Processing System
INCOIS Indian National Centre for Ocean Information Services

xix
liSt of aCronymS
INOSHAC Indian Ocean & South Hemispheric Centre
INSAT Indian National Satellite System
IOP Intense Observation Period
IR Infrared Red
IST India Standard Time
ITCZ Inter-Tropical Convergence Zone
IVRS Interactive Voice Response System
JMA Japan Meteorological Agency
JTWC Joint Typhoon Warning Center
LES Local Earth Station
LLCCs Low level circulation centres
Max (Z) Maximum reflectivity
MFI Meteo France International
MHA Ministry of Home Affairs
MJO Madden-Julian oscillation
MM5 Fifth-Generation Penn State/NCAR Mesoscale Model
MME Multi Model Ensemble
MSLP Mean Sea Level Pressure
MSW Maximum Sustained Wind
MW Microwave
NASA GHCC National Aeronautics and Space Administration- Global Hydrology and Climate Center.
NBDP Narrow Band Direct Printing
NCMRWF National Centre for Medium Range Weather Forecast
NDBP National Data Buoy Programme
NDM National Disaster Management
NDMA National Disaster Management Authority
NDRF National Disaster Response Force
NIDM National Institute of Disaster Management

xx
CyClone Warning in india - Standard operation proCedure
NIO North Indian Ocean
NIOT National Institute of Ocean Technology
NOAA National Oceanic and Atmospheric Administration
NRL Naval Research Laboratory
NSDC National Satellite Data Centre
NWFC National Weather Forecasting Centre
NWP Numerical Weather Prediction
OLR Outgoing Longwave Radiation
PBO Pilot Balloon Observatories
PMSS Probable Maximum Storm Surge
PPI(Z) Plan Position Indicator
PRBS Pseudo-Random Burst Technique
QPE Quantitative Precipitation Estimation
RMC Regional Meteorological Centre
RMR RadiusofMaximumReflectivity
RMW Radius of Maximum Wind
RS/RW Radio sonde/ Radio wind
RSMC Regional Specialized Meteorological Centre
RSS Remote Sensing Systems
RTH Regional Telecommunication Hub
SAARC South Asian Association for Regional Cooperation
SCIP Statistical-Dynamical Model for Cyclone Intensity Prediction
SDMC SAARC Disaster Management Centre
SLP Sea Level Pressure
SRI Surface Rainfall Intensity
SST Sea Surface Temperature
STDS Satellite Tropical Disturbance Summary
TB Brightness Temperature
TC Tropical Cyclones

xxi
liSt of aCronymS
TCAC Tropical Cyclone Advisory Centre
THORPEX The Observing System Research and Predictability Experiment
TIGGE THORPEX Interactive Grand Global Ensemble
TMI TRMM Microwave Imager
TPC Tropical Prediction Centre
TPW Total Precipitable Water
TRMM Tropical Rainfall Measuring Mission
UKMO UKMeteorologicalOffice
UTC Coordinated Universal Time
UWT Uniform Wind Technique
VHRR Very High Resolution Radiometer
VIS Visible
VOF Voluntary Observing Fleet
VVP(Z) Volume Velocity Processing
WMO World Meteorological Organisation
WRF Weather Research and Forecasting Model
WV Water Vapour
WVWs Water Vapour Winds


xxiii
Preface
A tropical cyclone (TC) unleashes its highest destructive potential as it makes landfall in the coastal belt. Violent winds, torrential rains and storm surge are the three major causes of destruction. Though fewer tropical cyclones occur in the north Indian Ocean (NIO) compared to the other basins, the shallow depth of the Bay of Bengal and the low flat coastal terrain produce muchlarger storm surge and take a very heavy toll of life.
Among all the natural disasters related to water and weather, tropical cyclones are the only ones which allow two to three days time for preparedness measures and advance actions to be taken. Over the years, the India Meteorological Department (IMD) has built up a credible Cyclone Warning System for the country which uses advanced technologies like Automatic Weather Stations (AWS), Satellites, Radars, Numerical Weather Prediction (NWP) models and telecommunication systems. In the event of an approaching TC, IMD informs and warns all the concerned sectors in the government, the local population and media, through a variety of communicational channels.
Various components of early warning system for TC include (i) monitoring and prediction, (ii) warning organization, (iii) warning generation, presentation & dissemination, (iv) co-ordination with disaster management agencies, (vii) public education & reaching out and (viii) post-event review. All these aspects oftheearlywarningsystemofTCarestandardizedtoimprovetheefficiencyofwarning operation. Cyclone Warning Division of IMD has prepared this document on “Cyclone Warning in India: Standard Operation Procedure” incorporating all the above aspects. It is hoped that the information it contains will be useful to officials,agenciesandNGOsengagedindisastermitigationworkforlong-termplanning, crisis management and the enlightenment of the public.
LS Rathore
July 2013 Director General of Meteorology


xxv
Acknowledgements
I am thankful to the authors for their unrelenting cooperation in the extensive effort that went into the formulation of the Manual entitled “Cyclone Warning in India-Standard Operation Procedure”. I would like toplaceon record thesignificant contributionsmadeby theCycloneWarning Division, IMD to bring out this document.
I put my appreciation on record for the valuable contributions made by Dr. M. Mohapatra towards preparation, compilation, edition, review and publication of this manual. I express my sincere thanks and appreciationtoDr.SathiDeviandDr.NareshKumarfortheirsignificantcontribution as resource persons in preparation of this manual. I am thankful to Sh. B. K. Bandyopadhyay, Dr. Y. E. A. Raj and Dr. A. B. Majumdar for reviewing and adding values to the manuscript. I express my gratitude to (AVM) Dr. Ajit Tyagi (Retd. DGM) for his valuable initiative in preparation of this document. I also thank Mrs. Monica Sharma, Shri R.P.Sharma, Shri D.P. Nayak and Sh.R.G.Bali for their technical support in publication of this document.
L.S.Rathore
July 2013 Director General of Meteorology


1
introduCtion
1 Introduction
A “Cyclonic Storm’ or a “Cyclone” is an intense vortex or a whirl in the atmosphere with very strong winds circulating around it in anti-clockwise direction in the Northern Hemisphere and in clockwise direction in the Southern Hemisphere. The word “Cyclone” is derived from the Greek word ‘Cyclos” meaning the coil of a snake. To Henri Paddington, the tropical storms in the Bay of Bengal and in the Arabian Sea appeared like the coiled serpents of the Sea and he named these storms as “Cyclones”. Tropical cyclones are also referred to as ‘Hurricanes’ over Atlantic
Ocean, ‘Typhoons’ over Pacific Ocean,‘Willy-Willies’ over Australian Seas and simply as ‘Cyclones’ over north Indian Ocean (NIO).
1.1. ClassificationofCyclonicDisturbances
Cyclones are intense low pressure areas - from the center of which pressure increases outwards. The amount of the pressure drop in the center and the rate at which it increases outwards gives the intensity of the cyclones and the strength of winds. The
Table1.1.Criteria for classificationof cyclonicdisturbancesover the North Indian Ocean
Type of disturbance Associated maximum sustained wind (MSW)
1. Low Pressure Area Not exceeding 17 knots (<31 kmph )
2. Depression 17 to 27 knots (31-49 kmph)
3. Deep Depression 28 to 33 knots (50-61 kmph )
4. Cyclonic Storm 34 to 47 knots (62-88 kmph )
5. Severe Cyclonic Storm 48 to 63 knots (89-117 kmph )
6. Very Severe Cyclonic Storm 64 to 119 knots (118-221 kmph )
7. Super Cyclonic Storm 120knotsandabove(≥222kmph)

2
CyClone Warning in india - Standard operation proCedure
criteria followed by the India Meteorological Department (IMD) to classify the low pressure systems in the Bay of Bengal and in the Arabian Sea as adopted by the World Meteorological Organisation (W.M.O.) are given in Table 1.1.
1.2. Structure of Tropical Cyclone
Tropical Cyclones are warm core low pressure systems having a large vortex in the atmos phere, which is maintained by the release of latent heat by convective clouds that form over warm oceans. In the northern hemisphere, the winds in a cyclone blow anticlockwise in the lower troposphere and clockwise in the upper
tropo sphere. However, in the southern hemisphere, the winds of the cyclone blow in the opposite direction i.e. clockwise in the lower levels and anticlockwise in the upper levels.
A full-grown cyclone is a violent whirl in the atmosphere with 150 to 1000 km diameter and 10 to 15 km height. Gale winds of 150 to 250 kmph or more spiral around the center of very low pressure area with 30 to 100 hPa below the normal sea level pressure. In a fully developed cyclonic storm, there are four major components of horizontal structure viz. Eye, Wall cloud region, Rain/Spiral bands and Outer storm area. A schematic diagram is given in Fig. 1.1.
Fig.1.1. Schematic diagram of a cyclone
Rain Band Rain Band Rain Band Rain BandEyewall EyewallEye

3
introduCtion
1.2.1. Eye
A typical imagery of cyclone showing eye is given in fig.1.2. The most spectacularpart of a matured cyclonic storm is its ‘eye’, which forms at the centre of the storm inside a Central Dense Overcast (CDO) region. The eye has a di ameter of about 10 to 50 km, which is generally cloud free and is surrounded by thick wall clouds around it. It resembles an ‘eye’ when viewed in a satellite picture. It is a calm region with practically no rain. It is warmer than the surrounding region. The lowest estimated central pressure of 911 hPa was observed in case of Andhra cyclone of November 1977 followed by 919 hPa in the False Point cyclone (Odisha) in September 1885. The eye is generally seen when the storm is severe and the surface pressure falls below 980 hPa in the
Fig.1.2. Composite structure of cyclone as seen in Radar imagery
OUTER CONVECTIVEACTIVITY
SPIRALBANDS
SPIRALBANDS
RAINSHIELD
SPIRALBANDS
INNEREYEWALL
100 km
200 km
300 km
400 km
500 km
600 km
OUTEREYEWALL
PRE CYCLONESQUALL LINE
700 km
ARROW AT STORM CENTRE SHOWS DIRECTION OF MOTION OF STORM
Indian Ocean areas. Sometimes, a double eye wall structure can also be seen when the storm becomes very intense.
1.2.2. Wall Cloud Region or Eye Wall
The eye is surrounded by a 10-15 km thick wall of convective clouds where the maximum winds oc cur. This is the most dangerous part of a cyclonic storm. The height of the wall goes up to 10 to 15 km. The intense convection in this wall cloud region produces torrential rain, sometimes of the order of 50 cm in 24 hrs. The ‘Storm surge’ associated with a cyclonic storm, responsible for 80% loss of human lives, occurs in the eye wall region. The exact positionofthiseyewallisidentifiablewiththe Cyclone Detection Radars (CDR), as theRadiusofMaximumReflectivity(RMR)
4
CyClone Warning in india - Standard operation proCedure
Fig. 1.3. INSAT imagery of Odisha Super cyclone (25-31 Oct, 2009) showing eye of the cyclone
of radar beam coincides with the Radius of Maximum Wind (RMW) in a cyclonic storm.
1.2.3. Rain/Spiral Bands
Beyond the eye wall region, the major convective clouds in a cyclonic storm, responsible for heavy rains, have a spirally banded structure. These spiral bands are sometimes hundreds of kilometres long and a few kilometres wide. The spiral bands areeasily identifiable inradarandsatellitepictures (Figs.1.2 and 1.3), as a number of
thunderstorm cells (Cumulonimbus clouds) are embedded in them that produce heavy rainfall (typical rate 3 cm/hr, which in extreme cases may reach upto 10 cm/hr).
These spirals also continuously change places and orientation with respect to the centre and rotate around it. The winds in this region continue to spiral around the centre with decreasing wind speed away from the centre. A dense cirrus shield of 400 to 500 km in diameter generally covers the central region alongwith the inner portion of the spiral bands.

5
introduCtion
1.2.4. Outer Storm Area
This region is beyond 250 km from the
centre, where the wind is cyclonic but
wind speed decreases slowly outside. The
typical 10 metre horizontal wind distribution
with a cyclone is shown in fig1.4. The
weather conditions in the outer storm area
Fig. 1.4. Vertical structure of a cyclone
are better with scattered cumulus growth interspersed with spiral bands.
1.2.5. Vertical Structure
The vertical structure of a cyclonic storm (Fig.1.4) can be divided into three layers viz. Inflow layer,middle layerandoutflowlayer.

6
CyClone Warning in india - Standard operation proCedure
i) The lowest layer from the surface to about 3 km is called the ‘Inflow layer’wherewindflow is towards thecentreand contains a pronounced component of radial wind (-Vr).Mostof this inflowlayer occurs in the planetary boundary layer where friction plays a great role.
ii) The layer between 3 to 7.6 km is called the ‘Middle layer’ where the flow ismostly tangential with little or no radial component (inflow).
iii) The layer above 7.6 km upto the top of the storm is called the ‘Outflow layer’
where wind is anticyclonic (clockwise). Outflow is most pronounced around12 km level. Maximum warming occurs in the upper troposphere around 10 km where temperature at times may be 150 C warmer than the environment.
1.3. Life Cycle of Tropical Cyclone
The average life span of a cyclonic storm over the NIO is about 4 to 5 days which can be divided into four stages:
a) Formative Stage
b) Immature Stage
Fig. 1.5. Longest life period cyclone over the NIO
7
introduCtion
c) Mature Stage
d) Decaying Stage
The track of longest ever recorded cyclone overtheNIOisshowninfig.1.5.Itoriginatedover the South China Sea, moved west-northwestwards across Vietnam, Bay of Bengal, South India and Arabian Sea to Oman during Oct. 1924.
1.3.1 Formative Stage
The Formative Stage covers the period from the genesis of a cyclonic circulation to the cyclonic storm stage through low pressure, depression and deep depression stages. Following factors are con sidered favourable for cyclogenesis.
i. Coriolis Parameter
ii. Low level positive vorticity
iii. Weak vertical wind shear of horizontal winds
iv. Warm Sea surface temperature (> 26.5° Celsius)
v. Large convective instability
vi. Large relative humidity at lower and middle troposphere
In general, cyclogenesis occurs over the warm oceanic regions away from the equator, where the moist air converges and weak vertical wind shear prevails. The cyclonic storm does not form near the equator, where the Coriolis force is zero. A little Coriolis force which is directly
proportional to the sine of latitude angle (º), is required for turning of winds and hence formation of cyclonic storm. Pressure falls gradually during formative stage. Unusual pressure fall near the easterly wave, asym-metric strengthening of wind, elliptic or circular wind circulation over Inter-Tropical Convergence Zone (ITCZ - a region near equator where surface winds from both the hemispheres converge), isolated solid cloud mass in the satellite pictures are some of the indications of the cyclogenesis.
1.3.2. Immature Stage
In the Immature Stage, the central pressure of the system continues to fall till the lowest pres sure is attained. The wind speed increases and usually at a distance of about 30-50 km from the centre a well developed eye wall is seen. Duration of this stage can be as long as 3 days. At times, it may be an explosive occurrence in which pressure fall of 40 to 50 hPa in a day may occur. The cloud and rain pattern changes from disorganised squalls to narrow organised bands spiraling inward.
1.3.3. Mature Stage
During the Mature Stage, no further fall of pressure and increase of wind speed occur. In some cases, winds of very severe cyclonic storm can extend upto several hundreds of kilometres from the storm centre to the right of the direction of motion of the storm in the northern hemisphere.

8
CyClone Warning in india - Standard operation proCedure
Fig. 1.6. Types of Potential Damages accompanying Tropical Cyclones
1.3.4. Decaying Stage
In the Decaying Stage, the tropical storms begin to lose their intensity when they move over to land, over colder water or lie under an unfavourable large-scale flow aloft. In some cases, they come under the influenceofanupperairtroughandrecurvetowards northeast. The storms weaken over land because of sharp reduction of moisture supply and increase in surface friction.
1.4. Hazard due to Cyclone
Disturbed weather occurs generally in association with low pressure systems that are seen over different parts of the globe. Areas of high pressure are characterized by fair weather. The severity of weather increases with the intensity of the low pressure. The cyclonic storms cause heavy rains, strong winds and also high seas and devastate coastal areas at the time of landfall, leading to loss of life and property.

9
introduCtion
Table 1.2. Storm Intensity, Expected Damage and Suggested Actions
Intensity Damage expected Action Suggested
Deep Depression50 – 61 kmph(28-33 knots)
Minor damage to loose and unsecured structures
Fishermen advised not to venture into the open seas.
Cyclonic Storm62 – 87 kmph(34-47 knots)
Damage to thatched huts. Breaking of tree branches causing minor damage to power and communication lines
Totalsuspensionoffishingoperations
Severe Cyclonic Storm
88-117 kmph(48-63 knots)
Extensive damage to thatched roofs and huts. Minor damage to power and communication lines due to uprooting of large avenue trees. Flooding of escape routes.
Totalsuspensionoffishingoperations. Coastal hutment dwellers to be moved to safer places. People in affected areas to remain indoors.
Very Severe Cyclonic Storm118-167 kmph(64-90 knots)
Extensive damage to kutcha houses. Partial disruption of power and communication line. Minor disruption ofrailandroadtraffic.Potentialthreatfromflyingdebris.Floodingofescaperoutes.
Totalsuspensionoffishingoperations. Mobilise evacuation from coastal areas. Judicious regulationofrailandroadtraffic.People in affected areas to remain indoors.
Very Severe Cyclonic
Storm168-221 kmph(91-119 knots)
Extensive damage to kutcha houses. Some damage to old buildings. Large-scale disruption of power and communication lines. Disruption of railandroadtrafficduetoextensiveflooding.Potentialthreatfromflyingdebris.
Totalsuspensionoffishingoperations. Extensive evacuation from coastal areas. Diversion or suspension of rail and road traffic.Peopleinaffectedareasto remain indoors.
Super Cyclone222 kmph and more
(120 knots and more)
Extensive structural damage to residential and industrial buildings. Total disruption of communication and power supply. Extensive damage to bridges causing large-scale disruption of rail and roadtraffic.Large-scalefloodingandinundation of sea water. Air full of flyingdebris.
Totalsuspensionoffishingoperations. Large-scale evacuation of coastal population. Total suspension of rail and road trafficinvulnerableareas.Peoplein affected areas to remain indoors.

10
CyClone Warning in india - Standard operation proCedure
The expected damage associated with the cyclonic disturbances of different intensities alongwith action suggested to disaster managers is given in Table 1.2. Types of damages associated with a tropical cyclone arealsoshowninfig.1.6.Detailedimpactsof wind, rainfall and storm surge as well as marine impact are discussed in Section 1.4.1-1.4.4.
1.4.1. Winds
The damages produced by winds are extensive and cover areas occasionally greater than the areas of heavy rains and storm surges which are in general localized in nature. The impact of the passage of the cyclone eye, directly over a place is quite different from that of a cyclone that does not hit the place directly. The latter affects the location with relatively unidirectional winds i.e. winds blowing from only one side, and the lee side is somewhat protected. An eye passage brings with it rapid changes in wind direction, which imposes torques and can twist the vegetation or even structures. Parts of structures that were loosened or weakened by the winds from one direction are subsequently severely damaged or blown down when hit upon by the strong winds from the opposite direction. A partial eye passage can also do considerable damage, but it is less than a total eye passage.
As tropical cyclones have a circular shape, an eye passage over a location exposes it to the maximum possible duration of
destructive winds. The higher wind is also associated with convectively active eye-wall region and has higher wind gusts than outside it. The gustiness effect is amplifiedoverlandwherefrictionreducessustainable wind but not the peak gust. This widens the gap between the peak and the lull of the gusts even more, creating strong negative pressure forces on lee-side of buildings especially damaging metal sheet and wooden structures. Strong wind also exposes roofs to strong lifting forces. The typical damage to buildings is due to failure of roofing systems. Lossof roof irrespective of the material used, leads to water damage of the walls. When the roofs get blown off, the exterior walls lose the support provided by the roofingsystems and collapse even in lesser wind intensity.
Winds are stronger in the right semi-circle with reference to the direction of motion of the cyclonic storm in the Northern Hemisphere. Occasionally, very strong winds are also encountered to the left side of the storm with respect to its motion. The total damage is significantly greater thanthat from the relatively unidirectional winds of a near miss with comparable intensity.
Under the action of wind flow, structuresexperience aerodynamic forces that include the drag force acting in the direction of the mean wind, and the lift force acting perpendicular to that direction. The structural response induced by the wind drag is commonly referred to as the ‘along

11
introduCtion
Fig. 1.7. Damage caused by very severe cyclonic storm ‘Nargis’
(a)
(b)

12
CyClone Warning in india - Standard operation proCedure
Table 1.3. Marine impact of cyclonic disturbances
S. N.
Intensity Strength of wind(kmph/knots)
Satellite ‘T’ No.
Condition of Sea
Wave height (m)
1. Depression (i)(31- 40)/(17-21)(ii)(41- 49)/(22-27)
1.5 Moderate Rough
1.25-2.52.5-4.0
2. Deep Depression (50–61)/(28-33) 2.0 Very Rough 4.0-6.0
3. Cyclonic Storm (62–87)/(34-47) 2.5-3.0 High 6.0-9.0
4. Severe Cyclonic Storm
(88-117)/(48-63) 3.5 Very High 9.0-14.0
5. Very Severe Cyclon-ic Storm
(i)(118-167)/(64-90)(ii)(168-221)/(91-119)
4.0-4.55.0–6.0
PhenomenalPhenomenal
Over 14.0
6. Super Cyclonic Storm
(222/120 and more) 6.5 and more
Phenomenal Over 14.0
wind’ response. It has been recognized that in the case of modern tall buildings which are more flexible, lower in damping, andlighter in weight than older structures, the natural frequency of vibration may be in the same range as the average frequency of occurrence of powerful gusts and therefore large resonant motions induced by the wind may occur. This must be taken into consideration in design of cyclone resistant buildings.
Many of the overhead communication networks are susceptible to damage when the winds reach 85 kts (158 kmph), This is especially the case for secondary telephone lines. Microwave towers are susceptible to misalignment when winds reach 85 kts (158 kmph). This affects
local telephone, cellular service and long distance service. Microwave and radio towers are susceptible to destruction when winds reach 100 kts (186 kmph). At higher wind speed even larger antennas are also vulnerable and are blown off. Even large satellite communication dishes can be damaged in cyclones with sustained wind speeds of 135 kts (251 kmph). Coastal roads/locations are vulnerable to damage from inundation/waves run-up. The most detrimental hazards to roadways are uprooted trees, power poles and lines, and debris falling on roads and blocking them. This becomes a serious problem when winds reach 80 kts (149 kmph) or more. The typical examples of damage due to cyclone, Nagis in April-May 2008 are shown in fig.1.7

13
introduCtion
1.4.2. Marine Impact
The wind speed, condition of Sea and wave height associated with ‘T’ numbers of various categories of cyclonic disturbances, are given in Table 1.3. Condition of the sea becomes high to Phenomenal with wave height of 6 metre or more during cyclone period.
1.4.3. Rainfall
Rainfall is generally very heavy and spread over a large area thus leading to excessive amount of water. Rains (sometimes even
Fig. 1.8. Flood caused by Odisha super cyclone, 25-31 October 1999
more than 30 cm per 24 hrs) occur in association with cyclones. Unabated rains give rise to unprecedented floods. Rainwater on the top of storm surge may add to the fury of the storm. Rain is an annoying problem for the people who become shelterless due to a cyclone. It creates problems in post cyclone relief operations also. A typical example of flood due to cyclone is show in fig. 1.8.
On the infrastructure front, the most critical problem after passage of any cyclone is the restoration of water distribution system. Strong winds along with heavy

14
CyClone Warning in india - Standard operation proCedure
rainsaccompaniedwithfloods/stormsurgeassociated with the cyclone, devastate the critical parts of the power generation and distribution systems. Even the strongest port and airport facilities, fuel and water storage tanks, high voltage transmission tower, etc., are vulnerable to damage.
Soil erosion also occurs on a large scale. Heavy rains log the ground and cause softening of the ground due to soaking. This contributes to weakening of the embankments, the leaning over of utility poles or collapse of pole type structures.
1.4.4. Storm Surge
Storm surge is the major cause of devastation from tropical storms. Though, the deaths and destruction are caused directly by the winds in a tropical cyclone as mentioned above, these winds also lead to massive piling of Sea water in the form of what is known as storm surge that
leadtosuddeninundationandfloodingofcoastal regions.
The surge is generated due to interaction of air, sea and land. When the cyclone approaches near the coast, it provides the additional force in the form of very high horizontal atmospheric pressure gradient which leads to strong surface winds. As a result, sea level rises. It continues to rise, as the cyclone moves over shallower waters and reaches a maximum on the coast near the point of landfall. Storm surge is inversely proportional to the depth of Sea water. The depth varies from about 500 m at about 200 N in the north central Bay to about 5 m along the West Bengal-north Odisha coast. Because of the vast shallow continental shelf, the storm surges get amplified significantly in these areas.The northward converging shape of the Bay of Bengal provides another reason for the enhanced storm surge in these areas. There is another cause of sea level rise,
Fig. 1.9. Impact of storm surge caused by Very severe cyclonic storm ‘Nargis’

15
introduCtion
Fig. 1.10. Probable maximum storm surge (PMSS) above tide levels (In metres) over maritime districts
of east and west coasts of India
viz., astronomical tide, which is well known. The rise due to high tide may be as high as 4.5 m above the mean sea level at some parts of Indian coast. The worst devastation is caused when the peak surge occurs at the time of high tide. As the leading edge of the storm surge crashes against the coastline, the speed of the surge puts great stress on the walls.
The debris like uprooted trees, fences and parts of broken houses, act as battering rams and cause further damage. The sand
and gravel carried by the moving currents at the bottom of the surge can cause sand papering action of the foundations. The huge volume of water can cause such pressure difference that the house “floats” and once the house is lifted fromthe foundations, water enters the structure that eventually collapses.
The Probable Maximum Storm Surge (PMSS) for east and west coasts of India are shown in Fig. 1.10.
4.3
70° 75° 80° 85° 90°
Koteshwar
MandviNaliya
Dwaraka
Porbondor
Veraval
Bovlion
Jafarabad
Mahuva
Surat
Bharuch
Anand
PMSS ABOVE TIDE LEVEL (IN METERS) OVER MATIRIME DISTRICTS OF
EAST AND WEST COAST OF INDIA
ValsadNavasari
Dahanu
Mumbai
Alibog
Rathnagiri
Vengurla
Hannovar
Mangalore
Kasargod
Kazhikoda
Guruvayur
Ponnani
Cochin
Alapuzha
Trivandrum
KanyakumariThisayanvilai
Manamalkudi
MuthupetAdiramapotinam
Nagapattinam
CuddalorePondicherry
Thiruvakkarai
Mahabalipuram
ChennaiPulicat
Nellore
OngoleBapatla
Machilipatnam
Bay of BengalArabian Sea
Narasopur
Kakinada
Visakhapatnam
VizianagoramSrikakulam
Gopalpur
GonjomPuri
Paradip
Bhadrak
BaleshwarSagar Island
Madhabkati
Haldia
Tuticorin
Tondi
Kollom
Kannur
Udupi
Panaji
4.3
4.3
4.3
4.6
5.57.2
7.2 3.4
3.4
3.2
3.2
2.9
2.7
2.2
2.5
2.7
2.7
2.7
2.2
2.4
2.9
2.42.3
2.4
2.4
2.31.8
2.43.0
3.7
8.38.5
8.35.4
4.2
2.92.9 2.9
2.9
2.9
3.6
4.9
8.2
8.28.2 5.3
5.1
4.4
4.54.4
4.0
3.8 4.3
6.3
10.3
13.113.7
13.7 12.8
3.4
3.4
3.4
3.4

16
CyClone Warning in india - Standard operation proCedure
Table 1.4(a). Historical records of 12 most devastating cyclonic storms, which formed in the Bay of Bengal and made landfall on the East coast of India
S. N. Date/Year Category of Cyclone Landfall and Relevant information
1 7–12 October, 1737
Super Cyclonic Storm Crossed West Bengal coast over SunderbansSurge height : 12 MLoss of life : 300,000
2 31 October, 1831
Very Severe Cyclonic Storm
Crossed Odisha coast near BalasoreSurge height : 2 – 5 mLoss and damage: People killed - 22,000Cattle heads lost - 50,000
3. 2–5 October, 1864
Very Severe Cyclonic Storm
Crossed West Bengal coast near Contai Surge height: The maximum height of the waves reached 12 m.Loss and damage, People killed - 50,000 (mostly due to drowning), and 30,000 (due to diseases as a result of inundation)
4. 1–2 November, 1864
Severe Cyclonic Storm
Crossed Andhra Pradesh coast near MachilipatnamSurge height: 4 m.Loss and damage : People killed - 30,000
5. 22 September, 1885
Super Cyclonic Storm Crossed Odisha coast near False Point,Central pressure : 919 hPa,Surge height: 7 m.Loss of life : 5000
6. 14–16 October, 1942
Severe Cyclonic Storm
Crossed West Bengal coast near ContaiSurge height : 3 – 5 mLoss and damage : People killed – 19,000Cattle heads killed - 60,000
7. 8–11 October, 1967
Severe Cyclonic Storm
Crossed Odisha coast between Puri and Paradip on the morning of 9 October and then crossed Bangladesh coast during the night of 10 – 11 October.Loss and damage: People killed - 1,000, Cattle heads lost 50,000.
8. 26–30 October, 1971
Severe Cyclonic Storm
Crossed Odisha coast near Paradip early morning of 30 OctoberMaximum wind: 150-170 kmph (81-92 kts.)Surge height : 4 – 5 m, north of ChandbaliLoss and damage: People killed – 10,000; Cattleheads lost – 50,000; Houses damaged – 8,00,000

17
introduCtion
S. N. Date/Year Category of Cyclone Landfall and Relevant information
9. 14-20 November, 1977
Super Cyclonic Storm Crossed Andhra Pradesh coast Nizampatnam at 1730 IST on 19 November.Maximum wind : Ongole: 102 kmph (55 kts.) Machilipatnam: 120 kmph (65 kts); Gannavaram: 139 kmph (75 kts.)Surge height : 5 mIntensity : T 7.0Maximum estimated wind speed: 260 kmph (140 kts) Loss and damage: People killed - 10,000; Cattleheads – 27,000; Damage to crops and other property were estimated to be around Rs. 350 crores.
10. 4 – 11 May, 1990
Super Cyclonic Storm*
Crossed Andhra Pradesh coast at about 40 km south west of Machilipatnam around 1900 IST of 9 MayMaximum wind : Machilipatnam: 102 kmph (55 kts); Gannavaram: 93 kmph (50 kts) Maximum estimated wind speed : 235 kmph (126 kts) Surge height : 4 – 5 mIntensity : T 6.5Loss and damage : People killed – 967; the estimated cost of the damages to crops and properties - Rs. 2,248 crores.
11. 5 – 6 November, 1996
Very Severe Cyclonic Storm
Crossed Andhra Pradesh coast near Kakinada at midnight of 6 NovemberMaximum wind:200 kmph (108 kts)Surge height : 3 – 4 mLoss and damage : People killed – 2000;People missing - 900; crops destroyed in 3,20,000 hectares of land; house destroyed – 10,000 Estimate of the loss for crops - Rs. 150 crores
12. 25 – 31 October, 1999
Super Cyclonic Storm Crossed Odisha coast near Paradip at noon of 29 October.Maximum wind : 260 kmph (140 kts); Bhubaneshwar: 148 kmph (80 kts)Surge height : 6 – 7 mIntensity : T 7.0Loss and damage : People killed = 9,885;People injured - 2,142; cattleheads perished - 3,70,297, Paddy crops in 16,17,000 hectares and other crop in 33,000 hectares damaged.

18
CyClone Warning in india - Standard operation proCedure
Table 1.4(b). Historical records of 11 most devastating cyclonic storms, which formed in the Arabian Sea and made landfall on the West coast of India
S. No. Date/Year Category of Cyclone Landfall and Relevant information
1. 16 May 1618 Severe Cyclonic Storm
Crossed near Bombay (Mumbai) coastLoss and damage : People killed - 2,000
2. 30 October – 2 November, 1854
Severe Cyclonic Storm
Crossed near Bombay (Mumbai) coast on 1 NovemberLoss and damage : People killed - 1,000Property worth crores of rupees perished within four hours.
3. 18 – 23 November, 1948
Severe Cyclonic Storm
Crossed Maharashtra coast near Virar, 72 km north of Bombay (Mumbai) at about 0830 hrs. IST on 22 November. Maximum wind : Colaba: 120 kmph (65 kts) and Juhu: 151 kmph ( 81 kts.)Loss and damage : Great havoc and heavy loss of life andpropertyandallmeansoftrafficandcommunicationwere completely paralysed for two days. A number of small vessels and crafts capsized in the water of Bombay (Mumbai) harbour. Thousands of big trees uprooted and hundreds of buildings and hutments were rendered uninhabitable.
4. 23 – 25 May, 1961 Severe Cyclonic Storm
Crossed Maharashtra coast near Devgad on the night of 24 to 25 May.Loss and damage: 5 Lakhs fruit trees were reported to have been razed to the ground. 1,700 houses completely and 25,000 houses partially damaged.
5. 9 – 13 June, 1964 Severe Cyclonic Storm
Crossed Gujarat coast just west of Naliya during the late forenoon on 12 June.Maximum wind : Naliya: 135 kmph ( 73 kts); Dwarka: 105 kmph ( 57 kts); Porbandar: 74 kmph (40 kts) and Veraval: 83 kmph (45 kts.) Surge height : 2 m at KandlaLoss and damage: People killed – 27
6. 19 – 24 October, 1975
Very Severe Cyclonic Storm
Cossed Saurashtra coast about 15 km to the northwest of Porbandar at 1500 hours IST of 22 OctoberMaximum wind : Jamnagar: 160 – 180 kmph (86-97 kts) Porbandar: 110 kmph (59 kts)Surge height : 4 – 6 m at Porbandar and OkhaIntensity : T 6.0

19
introduCtion
S. No. Date/Year Category of Cyclone Landfall and Relevant information
Loss and damage: People killed – 85; Several thousands of houses were damaged, Many trees/ electric/telephone poles/roof tops blew; A train was also blown off its rails; loss of property was estimated to be Rs. 75 crores.
7. 31 May – 5 June, 1976
Severe Cyclonic Storm
Crossed Saurashtra coast near Bhavnagar on 3 June. Maximum wind : Ship HAKKON MAGNUS: 167 kmph (90 kts)Loss and damage : People killed - 70Cattleheads lost – 4500; Houses damaged - 25000 ; Damage estimated to be Rs. 3 crores.
8 14–20 November, 1977
Very Severe Cyclonic Storm *
Crossed Karnataka between Mangalore and Honavar in the early morning on 22 November.Intensity: T 5.5Loss and damages : People killed - 72; 8,400 houses totally and 19,000 houses partially damaged; Loss estimated to be Rs. 10 Crores.
9. 4–9 November, 1982
Very Severe cyclonic Storm
Crossed Saurashtra coast, about 45 km east of Veraval on 8 NovemberLoss and damage: People killed - 507Livestock perished – 1.5 Lakh; Thousands of houses collapsed
10. 17-20 June, 1996 Severe Cyclonic Storm
Crossed south Gujarat coast between Veraval and Diu in the early morning of 19 JuneIntensity : T 3.5Maximum wind : Veraval recorded 86 kmph (46 kts) at 0430 hrs IST of 19 JuneStorm surge : 5-6 m near BharuchLoss and damage: People killed – 46Cattle heads perished- 2113; No. of houses damaged – 29,595, loss of property - Rs. 18.05 Crore
11 4 – 10 June 1998 Very Severe Cyclonic Storm
Crossed Gujarat coast near Porbandar between 0630 and 0730 hrs IST of 9 JuneIntensity : T5.0Maximum wind : Jamnagar : 183 kmph (98 kts) at 0730 hrs IST of 9 JuneSurge height : 2 – 3 m above the astronomical tide of 3.2 m;Loss and damage: People killed – 1173; People missing – 1774Loss of property worth to be Rs. 18.65. Crore

20
CyClone Warning in india - Standard operation proCedure
1.5 Historical Cyclones and their Impact
The Indian Seas have historically been the deadliest basin with several cyclones responsible for more than 1 lakh of casualities. The 1970 Bhola cyclone killed about 3 lakhs people, perhaps, the maximum number as per the recorded history. Recently, cyclone, Nargis caused loss of 1,40,000 human lives in Myanmar in May 2008. After the availability of satellites for monitoring of cyclones, Odisha super cyclone of 1999 over the Bay of Bengal could be rated as the most intense tropical cyclone (TC) crossing Indian coast. Tables 1.4 (a) & 1.4(b) list some of the most intense TCs that had affected Indian coasts.
1.6. Climatology of Tropical Cyclones
1.6.1. Frequency of Disturbances
It is now a well known fact of climatology that nearly 7 % of the global TCs form in the NIO. About 5 to 6 TCs occur in the NIO annually. However, they prominently occur during the pre-monsoon Season (March-April-May) and the post-monsoon Season (October-November-December). The monthwise distribution of cyclonic disturbances over the NIO, Bay of Bengal and Arabian Sea are shown in Fig.1.11. The TCs develop in the ratio of 4:1 over the Bay of Bengal and the Arabian Sea.
It is seen that the annual number of distur-
bances has ranged from 8 to 23. The number of cyclonic storms has varied from a minimum of 1 in 1949 to a maximum of 10 each in the years 1893, 1926 and 1930. The average number of cyclonic disturbances and cyclonic storms per year is about 13.5 and 5 respectively. More than 80% of all cyclonic disturbances occur during the months of June to November with a maximum in August. The monthly frequency of cyclonic storms shows two maxima, i.e. in May and November.
The Bay of Bengal (BoB) is more prone for intense systems. Higher cyclonic disturbances (depressions and above) over the BoB is mainly due to the depressions/deep depressions during the monsoon season developed over this region and the remnants of the systems formed over the south China Sea and emerging into BOB after moving west-northwestwards across southeast Asia.
1.6.2. Location of Genesis
The frequency is very less over the west Arabian Sea mainly due to colder Sea Surface Temperature (SST). The genesis of cyclonic disturbances varies with respect to season. While genesis mostly takes place in lower latitudes in association with inter-tropical convergence zone (ITCZ) during pre-monsoon (March-May) and post-monsoon (October-December) seasons, it occurs over northerly latitude during monsoon season (June-September). This fact is illustrated in Fig.1.12.

21
introduCtion
Fig. 1.11(a). Monthly frequency of cyclonic disturbances over NIO during 1891-2011
Fig. 1.11(b). Monthly frequency of cyclonic disturbances over the BOB during 1891-2011

22
CyClone Warning in india - Standard operation proCedure
Fig. 1.11 (c). Monthly frequency of cyclonic disturbances over Arabian Sea during 1891-2011
Fig.1.11 (d). Monthly frequency of total cyclonic disturbances (depression and above) and total
cyclones (Cyclonic storms and above) during 1891-2011 over NIO

23
introduCtion
Fig. 1.12 (a). Frequency of genesis of cyclonic disturbances over the NIO during pre-monsoon season
1.6.3. Intensification
The probabilities of intensification of a depression into a cyclonic storm and severe cyclonic storm and cyclonic storm into a severe cyclonic storm in different months are shown in Fig.1.13. The probability is maximum in the month of April followed by March, May and November in case of depression to cyclone and in the month of May followed by April and November in case of depressions to severe cyclonic storm.
More than 50% of the cyclonic disturbances (CDs) that form in the months of March, April, May, November and December intensify into storms. A third of the Bay
CDs and half the number of the Arabian Sea CDs intensify into cyclones.
1.6.4. Movement
The tracks of cyclones over the NIO during 1891-2009 are shown in Fig 1.14(a). Recently an electronic atlas has been published for tracks of CDs over the Bay of Bengal and Arabian Sea. Analyses of storm tracks with reference to their genesis, recurvature and landfall points on 1°x1° scale along the Indian coasts have also been produced. Mostly the system developing over the NIO move in a northwesterly direction (Fig 1.14(a)). However, there are cases of recurvature

24
CyClone Warning in india - Standard operation proCedure
Fig. 1.12 (c). Frequency of genesis of cyclonic disturbances over the NIO during post-monsoon season
Fig. 1.12 (b). Frequency of genesis of cyclonic disturbances over the NIO during monsoon season

25
introduCtion
Fig. 1.13(b).MonthlyProbability of intensificationof depression into a severe cyclonic storm
Fig. 1.13(a).MonthlyProbability of intensificationof depression into a cyclone

26
CyClone Warning in india - Standard operation proCedure
Fig. 1.13 (c). MonthlyProbability of intensificationof cyclonic storm into a severe cyclonic storm
towards the northeast or east to the southwest. The frequency of recurvature is higher towards the northeast compared to southwest or east. It is found that the probability of recurvature is higher over the Arabian Sea when the system moves to the north of 150N leading to more landfalls over Gujarat coast. Over the Bay of Bengal, there is no such preferred latitude/longitude for the recurvature of the system. However the probability of recurvature towards the northeast is higher during the pre-monsoon Season.
The probability of direction of movement of cyclonic disturbances over the north Indian Ocean based on cyclone e-Atlas is shown in Fig.1.14(b).
1.6.5. Landfall
The Bay of Bengal TCs more often strike Odisha-West Bengal coast in October, Andhra coast in November and the Tamilnadu coast in December. Over 62 percent of the TCs in the Bay of Bengal strike different parts of the east coast of India, 25 percent strike coasts of Bangladesh and Myanmar and about 13 percent dissipate over the sea itself. The cyclones crossing different coastal states are shown in Fig.1.15. Considering Arabian Sea, a significant number of cyclones dissipate over the sea itself before making any landfall (about 48.5%). Gujarat coast is most prone for the cyclones developing over the Arabian Sea, with about 23% of

27
introduCtion
Fig. 1.14(b). Probability of direction of movement of cyclonic disturbances over the NIO
Fig. 1.14(a). Tracks of cyclones over the NIO during 1891-2009

28
CyClone Warning in india - Standard operation proCedure
total cyclones developing over Arabian Sea cross Gujarat coast and 11% each cross Pakistan and Oman coasts.
The CDs mostly dissipate when they move over the land. Also, when a CD over the sea comes across the unfavourable conditions like colder SST and high vertical wind shear, it dissipates over the sea itself. The frequency of dissipation is significantly higherover theWestArabianSea, mainly due to colder SST. There are also significant numbers of cases ofdissipation along the east cost of India, Bangladesh and Myanmar coasts.
The climatology of cyclonic disturbances presented here is based on data available in e-Atlas published by IMD. The limitation and scope of this Atlas have been discussed also by IMD (2008). One of the important limitations is that it does not include the short lived disturbances (life period < 12 hours).
Further, the climatology depends on the monitoring capability to detect the disturbances. The monitoring system over the region has undergone several changes with augmentation of surface observatories, introduction of RS/RW observations during 1930’s, use of
Fig. 1.15 (a). Frequency of cyclone/ severe cyclone over the Bay of Bengal landfalling
over different coastal states during 1891-2007.
Fig. 1.15 (b). Frequency of cyclone/severe cyclone over the Arabian Sea landfalling
over different coastal states during 1891-2007

29
introduCtion
Table 1.5. Naming of Tropical Cyclones
Panel Member
Column one Column two Column three Column four
Names Pron’ Names Pron’ Names Pron’ Names Pron’
Bangladesh Onil Onil Ogni Og-ni Nisha Ni-sha Giri Gi-ri
India Agni Ag’ni Akash Aakaa’sh Bijli Bij’li Jal Jal
Maldives Hibaru -- Gonu -- Aila -- Keila --
Myanmar Pyarr Pyarr Yemyin Ye-myin Phyan Phyan Thane Thane
Oman Baaz Ba-az Sidr Sidr’ Ward War’d Murjan Mur’jaan
Pakistan Fa-noos
Fanoos Nargis Nar gis Laila Lai la Nilam Ni lam
Sri Lanka Mala -- Rashmi Rash’mi Bandu -- Mahasen --
Thailand Mukda Muuk-dar Khai Muk Ki-muuk Phet Pet Phailin Pi-lin
PanelMember
Columnfive Column six Column seven Column eight
Names Pron’ Names Pron’ Names Pron’ Names Pron’
Bangla-desh
Helen Helen Chapala Cho-po-la Ockhi Ok-khi Fani Foni
India Lehar Le’har Megh Me’gh Sagar Saa’gar Vayu Vaa’yu
Maldives Madi -- Roanu -- Mekunu -- Hikaa --
Myanmar Nanauk Na-nauk Kyant Kyant Daye Da-ye Kyarr Kyarr
Oman Hudhud Hud’hud Nada N’nada Luban L’luban Maha M’maha
Pakistan Nilofar Ni lofar Vardah Var dah Titli Titli Bulbul Bul bul
Sri Lanka Priya -- Asiri Aa’siri Gigum Gi’gum Soba --
Thailand Komen Goh-men Mora Moh-rar Phethai Pay-ti Amphan Um-pun
satellite since 1960s and implementation of meteorlogical buoys since 1997. Hence all these facts should be taken into consideration while analyzing the climatological characteristics of cyclonic disturbances over the NIO.
1.7. Naming of Cyclones
The WMO/ESCAP Panel on Tropical
Cyclones at its twenty-seventh Session
held in 2000 in Muscat, Sultanate of Oman
agreed in principle to assign names to the

30
CyClone Warning in india - Standard operation proCedure
tropical cyclones in the Bay of Bengal and Arabian Sea. After long deliberations among the member countries, the naming of the tropical cyclones over NIO commenced from September 2004. RSMC, New Delhi is continuing the naming of Tropical Cyclones formed over NIO since October 2004. The first name was ‘ONIL’ which developedover the Arabian Sea (30 September to 03 October, 2004). According to approved principle, a list of 64 names in eight columns has been prepared. The name has been contributed by Panel members. The RSMC-tropical cyclones, New Delhi gives a tropical cyclone an identificationname from the above name list. The Panel member’s name is listed alphabetically country-wise in each column. The names areusedsequentiallycolumn-wise.Thefirstname starts from the first row of columnone and continues sequentially to the last row in column eight. The identification system covers both the Arabian Sea and the Bay of Bengal. These lists are used sequentially, and they are not rotated every few years unlike the Atlantic and Eastern Pacific lists. Out of 64 approved names,29 names have been utilized till the end of year 2011 (Table 1.5).
A system will be named as per the Table once it intensifies into a cyclonic storm.During the stage of depression and deep depression, it will be named as per the serial number of the system for a given Ocean basin (e.g. Bay of Bengal and Arabian Sea). Hence the first system forming over the Bay of Bengal (BOB)
and Arabian Sea (ARB) will be named as BOB/01 and ARB/01 respectively.
If public wants to suggest the name of a cyclone to be included in the list, the proposed name must meet some fundamental criteria. The name should be short and readily understood when broadcast. Further the names must not be culturally sensitive and not convey some unintended and potentially inflammatorymeaning. A storm causes so much death and destruction that its name is considered for retirement and hence is not used repeatedly. The suggested name pertaining to India may be communicated to Director General of Meteorology, India Meteorological Department, Mausam Bhawan, Lodi Road, New Delhi-110003 for consideration.
1.8. Early Warning SystemAs tropical cyclone cannot be tamed to reduce their adverse effects, one has to learn to live with them. Effective Cyclone Disaster Prevention and Mitigation Plan requires:
Hazard analysis
Vulnerability analysis.
Early Warning and Mitigation
Community preparedness and planning at all levels to meet the exigencies.
Out of these early warning is a major component as evident from a survey conducted for the south Asian region.
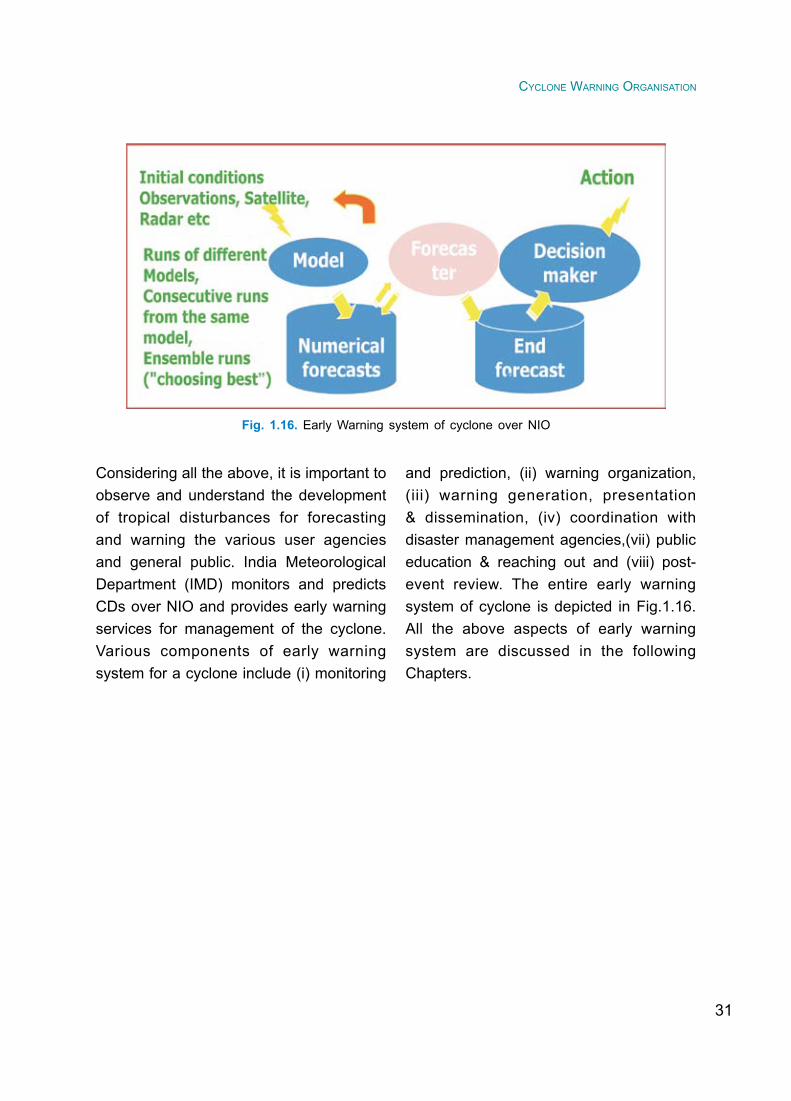
31
CyClone Warning organiSation
Fig. 1.16. Early Warning system of cyclone over NIO
Considering all the above, it is important to observe and understand the development of tropical disturbances for forecasting and warning the various user agencies and general public. India Meteorological Department (IMD) monitors and predicts CDs over NIO and provides early warning services for management of the cyclone. Various components of early warning system for a cyclone include (i) monitoring
and prediction, (ii) warning organization, (iii) warning generation, presentation & dissemination, (iv) coordination with disaster management agencies,(vii) public education & reaching out and (viii) post-event review. The entire early warning system of cyclone is depicted in Fig.1.16. All the above aspects of early warning system are discussed in the following Chapters.
32
CyClone Warning in india - Standard operation proCedure
Cyclone warning is one of the most important functions of the India Meteorological Department and it was the first serviceundertaken by the Department as early as in 1865 and thus the service started before the establishment of the department in 1875.
2.1 Milestones
1864: Two severe cyclonic storms in quick succession hit the east coast of India, causing enormous loss of human lives and property – the first one struck Kolkata inOctober and the second one struck Machilipatnam in November.
1865: Concerned with these disasters, the Government appointed a committee in 1865 to formulate a scheme to develop a system of cyclone warnings. On the recommendations of the committee, Kolkata became thefirstportwhereastormwarningsystem was organised in the same year.
1880: The storm warning scheme for west coast ports (Mumbai, Karachi, Ratnagiri, Vengurla, Karwar and Kumta) came into force.
2 Cyclone Warning Organisation
1882: The ports at Sagar Islands, Mud Port and Diamond Harbour were also included in the list of ports getting storm warning messages.
1886: system of early warnings against cyclones was extended to cover all Indian ports.
1898: Two different systems of storm warning signals (one for the east coast ports and another for west coast ports) were in use. A uniform system of storm warning signals was introduced at all the Indian ports.Kolkataofficewasresponsiblefor issuing storm warning to all the ports (including those of Burma) around the Bay of Bengal, while the west coast ports were served by the Bombay Meteorological Reporter initially and later from Simla which was then the headquarters of the Department.
1928: After the shift of the HQ of the Department from Simla to Pune in 1928, the storm warning work for west coast was done from Pune.
1945: With the formation of Regional Meteorological Centres, the storm warning work for the Bay ports on the east coast from Kalingapatnam

33
CyClone Warning organiSation
southwards was transferred to Chennai (Meenambakkam).
1947: Responsibility for the Arabian Sea ports was taken over by the MeteorologicalOfficeatSantacruz(Mumbai).
1956: As the combina t ion o f the meteorological activities for aviation and marine interests in the same office had somedrawbacks, thesetwo activities were bifurcated to achieveamoreefficientfunctioningof the storm warning service. Separate storm warning centres came to be established at Colaba (Mumbai)
1969: (i) Separate storm warning centres came to be established at Nungambakkam (Chennai).
(ii) The responsibility for the ports on the west coast from Karwar southwards was also transferred from Mumbai to Chennai.
(iii) Government of India appointed a committee called the Cyclone Distress Mitigation committee (CDMC) for Andhra Pradesh to examine various measures to mitigate human suffering and reduce loss of life and property due to cyclonic storms. Subsequently similar committees were set up for Odisha and West Bengal.
1971: CDMC fo r Andhra Pradesh recommended IMD to establish storm warning centre at Visakhapatnam for issuing cyclone warnings to coastal Andhra Pradesh.
1972: CDMC for Odisha recommended IMD to establish storm warning centre at Bhubaneshwar for issuing cyclone warnings to coastal Odisha.
1973: (i) Storm warning centre was set up at Bhubaneshwar for catering to the needs of Odisha.
(ii) Regional Meteorological Centre (RMC) for Tropical Cyclones, New Delhi came into existence with the formation of WMO/ESCAP Panel.
1974: Storm warning centre was set up at Visakhapatnam for catering to the needs of Andhra Pradesh.
1988 : (i) I n p u r s u a n c e o f t h e recommendation of Cyclone Review Committee, Storm Warning Centre was established at Ahmedabad for catering the needs of Gujarat, Union Territory of Diu, Daman, Dadra and Nagar Haveli.
(ii) Reg iona l Me teo ro l og i ca l Centre (RMC) New Delhi was redesignated as Regional Specialized Meteorological Cen t re (RSMC) Trop ica l Cyclones, New Delhi with effect

34
CyClone Warning in india - Standard operation proCedure
from 1st July 1988 and assigned the responsibility of issuing Tropical Weather Outlooks and Tropical Cyclone Advisories for the benefit of the countriesin the WMO/ESCAP Panel region bordering the Bay of Bengal and the Arabian Sea, namely, Bangladesh, Maldives, Myanmar, Oman, Pakistan, Sri Lanka and Thailand.
1990 : (i) A s p e r o n e o f t h e recommendations of the Cyclone Review Committee (CRC), a Cyclone Warning Directorate was established in 1990 in the Office of the Director Generalof Meteorology, New Delhi to co-ordinate the cyclone warning work in the country in totality.
(ii) Establ ishment of Cyclone Warning Research Centre at Regional Meteorological Centre, Chennai to carry out research as per operational requirement
2003 : Cyclone Warning Division acted as Tropical Cyclone Advisory Centre (TCAC), New Delhi as per the requirement of International Civil Aviation Organisation (ICAO)
2.2. Organizational StructureAt present, the cyclone warning organization of the India Meteorological Department (IMD) has three-tier system to cater to the
needs of the maritime states. There are Area Cyclone Warning Centres (ACWCs) at Chennai, Mumbai and Kolkata and Cyclone Warning Centre (CWCs) at Visakhapatnam, Ahmedabad and Bhubaneswar. The co-ordination of cyclone warning operations at the national level is done by the “Weather Central” at Pune whereas the international coordination and liaison with the Central Government organizations and other agencies as well as co-ordination and supervision of cyclone warning activities are done by Cyclone Warning Division (CWD) at New Delhi. CWD, New Delhi is also functioning as Regional Specialised Meteorological Centre - Tropical Cyclones (RSMC - Tropical Cyclones), New Delhi.
2.2.1. Regional Specialized Meteorological Centre (RSMC)-Tropical Cyclones, New Delhi
There are five tropical cyclones regionalbodies, i .e. ESCAP/WMO Typhoon Committee, WMO/ESCAP Panel on Tropical Cyclones, RA I Tropical Cyclone Committee, RA IV Hurricane Committee, and RA V Tropical Cyclone Committee. Under these regional bodies, there are six RSMCs as shown in Fig.2.1. The areas of responsibility of different RSMCs are shown in Fig.2.1. The RSMC is responsible for monitoring and prediction of tropical cyclones over their respective regions.
The area of responsibility of RSMC- New Delhi covers Sea areas of north Indian Ocean north of equator between 450 E

35
CyClone Warning organiSation
Fig. 2.2. Area of responsibility of RSMC- Tropical Cyclones, New Delhi
ISLAMABAD
DELHI
KARACHI
MUMBAI
NAGPUR
CHENNAI
COLOMBO
MALE
DACCAKOLKATA
YANGON
MUSCAT
33N
30N
27N
24N
21N
18N
15N
12N
9N
6N
3N
EQ45E 50E 55E 60E 65E 70E 75E 80E 85E 90E 95E 100E
Fig. 2.1. Area of responsibility of different RSMCs and TCWCs
20ºW 0 20ºE 40ºE 60ºE 80ºE 100ºE 120ºE 140ºE 160ºE 180º 160ºW 140ºW 120ºW 100ºW 80ºW 60ºW 40ºW 20ºW
60ºN
40ºN
20ºN
EQ
20ºS
40ºS
60ºS20ºW40ºW60ºW80ºW100ºW120ºW140ºW160ºW180º160ºE140ºE120ºE100ºE80ºE60ºE40ºE20ºE20ºW
60ºS
40ºS
20ºS
20ºN
40ºN
60ºN
EQ
0
RSMCNew Delhi RSMC
TokyoRSMCHonolulu RSMC
Miami
RSMCNadi
Wellington
BrisbanePerth
DarwinRSMCLa Réunion
Port Moresby
and 1000 E and includes the member countries of WMO/ESCAP Panel on Tropical Cyclones viz, Bangladesh, India,
Maldives, Myanmar, Pakistan, Sri Lanka, Sultanate of Oman and Thailand as shown in Fig.2.2

36
CyClone Warning in india - Standard operation proCedure
Fig. 2.3. Cyclone Warning Organisational Structure of IMD
NEW DELHI
AHMEDABAD
MUMBAI
PUNE
CHENNAI
VISHAKHAPATTINAM
BHUBANESHWAR
KOLKATA
DDGM (Cyclone Warning)DDGM (Weather Forecasting)ACWS (Area Cyclone Warning Centers)CWCs (Cyclone Warning Centers)
IndIa MeteorologIcal departMentCYCLONE WARNING
ORGANISATIONAL STRUCTURE
2.2.2. Cyclone Warning Division
As per one of the recommendations of the Cyclone Review Committee (CRC), a Cyclone Warning Directorate co-located with RSMC Tropical Cyclones New Delhi was established in 1990 in the Office ofthe Director General of Meteorology, New Delhi to co-ordinate the cyclone warning work in the country in totality.
2.2.3. ACWCs/CWCs
With the establishment of the additional C e n t r e s a t B h u b a n e s h w a r a n d
Visakhapatnam, the Storm Warning Centres at Kolkata, Chennai and Mumbai were named as Area Cyclone Warning Centres (ACWC) and the Storm Warning Centres at Visakhapatnam, Bhubaneshwar and Ahmedabad as Cyclone Warning Centres (CWC). CWCs Visakhapatnam, Bhubaneshwar and Ahmedabad function under the control of the ACWCs-Chennai, Kolkata and Mumbai respectively (Fig.2.3 & Table 2.1). M.C. Hyderabad liaises between CWC Visakhapatnam and Andhra Pradesh Government officials; warningsissued by CWC Visakhapatnam are sent

37
CyClone Warning organiSation
Table 2.1. Area of Responsibility of ACWC/CWC
Area of Responsibility
Centre Sea area # Coastal area Maritime State
ACWC Kolkata Bay of Bengal
West Bengal, Andaman & Nicobar Islands.
West Bengal & Andaman & Nicobar Islands.
ACWC Chennai Tamil Nadu, Pondicherry, Kerala & Karnataka
Tamil Nadu, Puducherry, Kerala, Karnataka & Lakshadweep.
ACWC Mumbai Arabian Sea
Maharashtra, Goa Maharashtra, Goa.
CWC Bhubaneshwar - Odisha Odisha
CWC Visakhapatnam - Andhra Pradesh Andhra Pradesh
CWC Ahmedabad - Gujarat, Diu, Daman, Dadra & Nagar Haveli
Gujarat, Diu, Daman, Dadra & Nagar Haveli
# Coastal strip of responsibility extends upto 75 km. from the coast line.
to M. C. Hyderabad also for briefing theAndhra Pradesh Government officials atthe State Capital.
The present organisational structure for cyclone warnings is a three-tier one, with the ACWCs/CWCs actually performing the operational work of issuing the bulletins and warnings to the various user interests, while the CWD New Delhi and the Deputy Director General of Meteorology (Weather Forecasting), through Weather Central, Pune co ordinates and guide the work of the ACWCs/CWCs, exercise supervision over their work and takes necessary measures forcontinuedimprovementandefficiencyofthe storm warnings system of the country as a whole. The ultimate responsibility for operational storm warning work for the
respective areas however, rests with the ACWCs and CWCs.
2.2.4. Otheroffices
The co-ordination of the cyclone warning work is done through exchange of bulletins and personal discussions, internet, mobile and STD calls and fax messages between O/o DDGM(WF) Pune - Weather Central, Cyclone Warning Division, New Delhi and concerned ACWCs/CWCs on days of disturbed weather over the sea areas. In addition, on occasions of cyclonic storms affecting the coastal areas, the weather bulletins issued by the ACWCs/CWCs for inclusion in the All India Radio (A.I.R) news cycles are consolidated and edited by O/o DDGM(WF) Pune - Weather Central,

38
CyClone Warning in india - Standard operation proCedure
before they are passed on to AIR New Delhi through NWFC, New Delhi.
The storm warning work at the ACWCs/CWCs is supervised by DDGM(WF) through a scrutiny of the warnings issued for their adequacy and timeliness and remedial action is advised whenever necessary. To improve the service and to bring about uniformity of practices, forecasting circulars and technical instructions are issued from time to time by O/o DDGM(WF) Pune. O/o DDGM (WF) Pune also arranges Annual Cyclone Review meetings for an appraisal of the action taken during the cyclones of the previous years as postmortem examination of this nature
is of considerable benefit to operationalforecasters. This enables them to correct past mistakes, if any, and to improve the performance in future.
DDGM (Satellite Meteorology) prepares satellite account on cyclones within one month and sends to O/o DDGM (WF) Pune. The Annual storm accounts and other reports regarding cyclones for supply to national and international agencies are prepared at CWD, New Delhi and O/o DDGM(WF), Pune. Cyclone Warning Research Centre (CWRC) at Chennai has the responsibility to carry out the research required for improvement of cyclone warning in the country.

39
needS for monitoring and prediCtion
3 Needs for Monitoring and Prediction
3.1. Data and ProductsThe following inputs are needed for monitoring and prediction of cyclonic disturbances over the north Indian Ocean
Surface observational data and synoptic analysis products
- Rea l t ime AWS/ARG da ta , Conventional Synoptic Observations, Coastal hourly observations, High Wind Speed Recorders (HWSR), ship and buoy data.
- Three hourly synoptic analysis charts
Upper air observational data and analysis products
- Real time observation from pilot bal loon and RS/RW or GPS sonde
- Upper air analysis charts
- Tephigrams
Satellite products from IMD and international centres
Visible imagery
- Tracking (locating the centre)
- Intensity analysis by Dvorak Technique
Infra-Red imagery
- Tracking (locating the centre)
- Structure analysis
- Intensity analysis by Dvorak technique
Water Vapour imagery
- Synoptic assessment of the storm environment)
Micro-wave imagery
- Microwave (MW) Radiometer estimates of the following Parameters from Brightness Temperature (TB)
- Rain rate, total precipitable water (TPW), surface wind speed, sea surface temperature (SST), Salinity etc
- Estimates of Sea Surface Wind through backscattering based on MW Scatterometer
- Est imates of ra in rate f rom backscattering of raindrops based on MW Rain Radar
- Estimates of Temperature/MoistureProfile basedonMWSounder (Source: http://www.nrlmry.navy.mil/tc_pages/tc_home.html)

40
CyClone Warning in india - Standard operation proCedure
Bulletins
- Satellite fix (IMDandothercentres)
- Cloud top temperature
- Special cyclone bulletin
Radar data and products
i. Maximum reflectivity (Max (Z))
ii. Plan Position Indicator (PPI(Z))
iii. Volume velocity processing (VVP(Z))
iv. PPI (V)
v. Surface rainfall intensity (SRI)
vi. 24 hours Precipitation accumulation at 0300 UTC
vii. Track prediction products
viii. Uniform Wind Technique (UWT)
ix. Full resolution imagery of PPI(Z)/Max(Z)
x. Hourly radar bulletin
Dynamical and statistical Model products from various national and international centres
NWP division makes the arrangement to provide all NWP model products and derived products. Additionally the NWP model products are also obtained from NCMRWF, IIT Delhi, Indian Air Force (IAF) etc.
Useful web sites for TC forecasting
a. Tropical cyclone (TC) SITES
Monterey Tropical Cyclones
CIMSS Tropical Cyclones
Winds from satellites (CIMSS)
MIMIC-Total Precipitable Water (CIMSS)
Currently Active Tropical Cyclones
Tropical Cyclone Intensity and Track Forecasts
ECMWF-LatestTropicalCycones
Tropical prediction center links
b. Tropical waves
OLR map from BoM
CPC - Climate Weather Linkage: Madden - Julian Oscillation
OLR animations NOAA
Modes of variability seen in OLR-BoM
CDC Map Room Climate Products
Probability of a Tropical Cyclone
Animation using Javascript Animation Player
c. Satellite data
Monterey
L i s t o f i m a g e s f r o m N R L Monterey

41
needS for monitoring and prediCtion
CIMSS Tropical Cyclones
TPC Polar Orbiting Satellite Data Links
TRMM
Interactive Weather Satellite Imagery Viewers from NASA GHCC
Satellite INSAT
Geostationaries from DUNDEE
FNMOC Satellite Data Tropical Cyclone Homepage
RSS / Tropical Cyclone Microwave Data Archive
NOAA CoastWatch: Recent TMI SST Data
d. AMSU
AMSU-A _ NASA
AMSU _ UW-CIMSS
. Satellite derived winds based on scatterometry (SCAT)
OSCAT
WindSat
ASCAT
EARS ERS-2 product viewer
f. SST and Heat Potential
Tropical Cyclone Heat Potential
Maximum Potential Hurricane Intensity
Anomalies of SST (Nesdis_Noaa)
Anomalies of SST (FNMOC)
g. Numerical Models
Amer ican mode ls NOGAPS (FNMOC)
Cyclone phase evolution: Analyses & Forecasts
ECMWF-MSLP, wind speed at 850 hPa and geopotential 500 hPa
h. TC FORECAST BULLETINS
Tropical Cyclone Three Day Outlook for the Central Indian Ocean
Bulletins from SAB (Tropical Bulletins)
Met Office: Tropical cyclones warnings and guidance
Bulletins from JTWC
Bulletins from JMA
Archived_bulletins from_JTWC
La Reunion / Tropical Cyclone Centre / RSMC for SWIO
Mauritius Meteorological Services
TCWC-Jakarta
The check list for required products are given in Table 3.1

42
CyClone Warning in india - Standard operation proCedure
Table 3.1. Check list of Required Products
SN Time Product Source
Observation
1 MSLP Chart synergie work station
2 Change chart synergie work station
3 Departure Chart Manually plotted chart
4 10 m wind chart synergie work station
5 Scatometry wind (Windsat, ASCAT & OSCAT)
http://manati.orbit.nesdis.noaa.gov/data-sets/WindSATData.php/http://www.knmi.nl/scatterometer/ascat_osi_25_prod/ascat_app.cgihttp://www.knmi.nl/scatterometer/ascat_osi_12_prod/ascat_app.cgi
http://manati.orbit.nesdis.noaa.gov/data-sets/OSCATData.php/http://www.knmi.nl/scatterometer/oscat_50_prod/http://218.248.0.134:8080/OCMWebSCAT/html/controller.jsp
6 Hourly observation chart (mannually plotted)
Data from ACWC/CWC
7 Hourly chart (AWS & metar) from synergie When required
synergie work station
8 850 , 500, 200 hpa wind Chart synergie work station
9 Quadrant Wind Chart (threshold of 28,34, 50 & 64 kts) winds
Synergie, NWP Division
10 Rainfall chart synerie work station
11 INSAT imagery (VIS, IR, water va-pour, QPE, OLR, lower level wind & upper level wind)
synerie work station, www.imd.gov.in
12 Meteosat imageries(Vorticity, lower level convergence, upper level divergence, vertical wind shear, wind shear tendency, low level wind & upper level wind)
http://tropic.ssec.wisc.edu/
13 Micowave imagery (i)synergie, (ii)(NOAA) http://www.nrlmry.navy.mil/tc_pages/tc_home.html
14 SST and Ocean thermal energy http://www.aoml.noaa.gov/phod/cyclone/data/ni.html
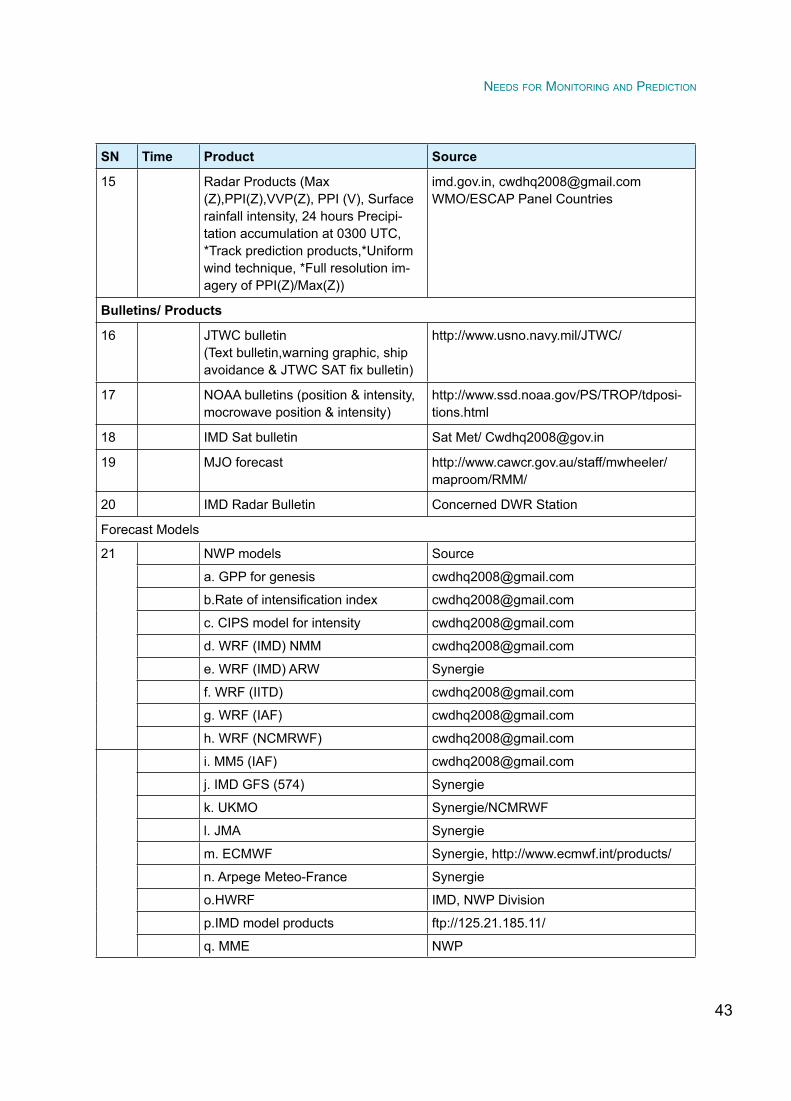
43
needS for monitoring and prediCtion
SN Time Product Source
15 Radar Products (Max (Z),PPI(Z),VVP(Z), PPI (V), Surface rainfall intensity, 24 hours Precipi-tation accumulation at 0300 UTC, *Track prediction products,*Uniform wind technique, *Full resolution im-agery of PPI(Z)/Max(Z))
imd.gov.in, [email protected]/ESCAP Panel Countries
Bulletins/ Products
16 JTWC bulletin(Text bulletin,warning graphic, ship avoidance&JTWCSATfixbulletin)
http://www.usno.navy.mil/JTWC/
17 NOAA bulletins (position & intensity, mocrowave position & intensity)
http://www.ssd.noaa.gov/PS/TROP/tdposi-tions.html
18 IMD Sat bulletin Sat Met/ [email protected]
19 MJO forecast http://www.cawcr.gov.au/staff/mwheeler/maproom/RMM/
20 IMD Radar Bulletin Concerned DWR Station
Forecast Models
21 NWP models Source
a. GPP for genesis [email protected]
b.Rateofintensificationindex [email protected]
c. CIPS model for intensity [email protected]
d. WRF (IMD) NMM [email protected]
e. WRF (IMD) ARW Synergie
f. WRF (IITD) [email protected]
g. WRF (IAF) [email protected]
h. WRF (NCMRWF) [email protected]
i. MM5 (IAF) [email protected]
j. IMD GFS (574) Synergie
k. UKMO Synergie/NCMRWF
l. JMA Synergie
m. ECMWF Synergie, http://www.ecmwf.int/products/
n. Arpege Meteo-France Synergie
o.HWRF IMD, NWP Division
p.IMD model products ftp://125.21.185.11/
q. MME NWP
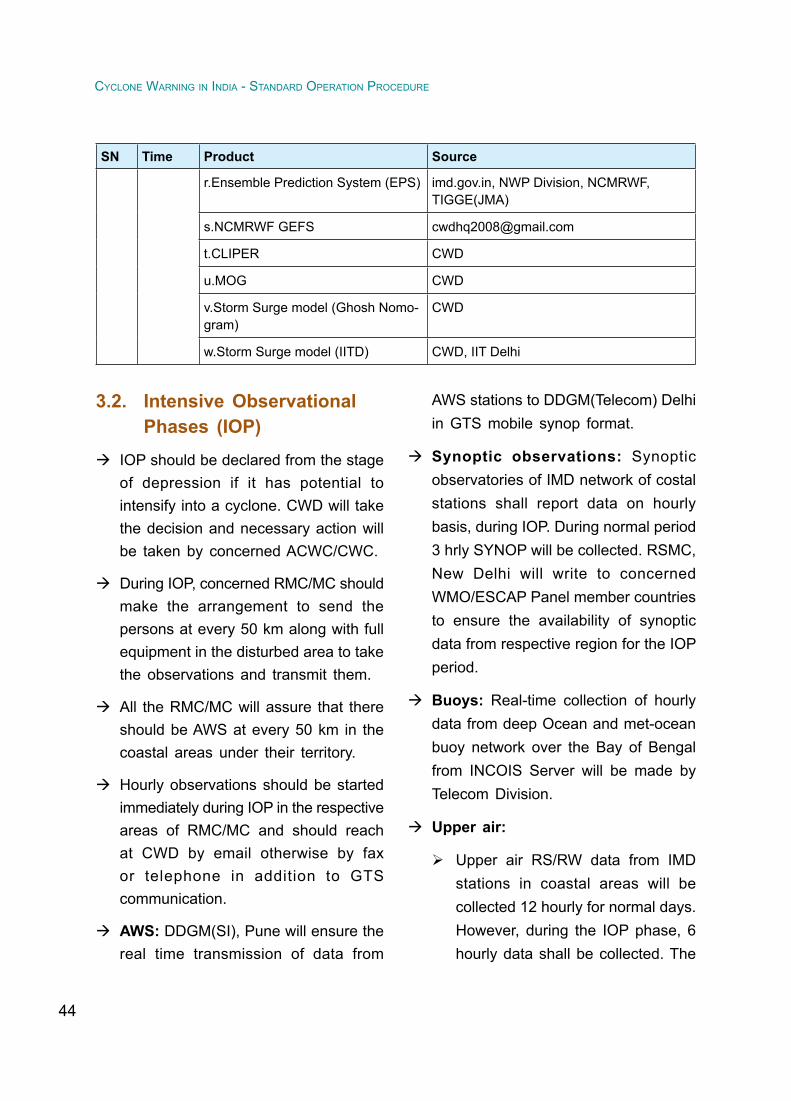
44
CyClone Warning in india - Standard operation proCedure
3.2. Intensive Observational Phases (IOP)
IOP should be declared from the stage of depression if it has potential to intensify into a cyclone. CWD will take the decision and necessary action will be taken by concerned ACWC/CWC.
During IOP, concerned RMC/MC should make the arrangement to send the persons at every 50 km along with full equipment in the disturbed area to take the observations and transmit them.
All the RMC/MC will assure that there should be AWS at every 50 km in the coastal areas under their territory.
Hourly observations should be started immediately during IOP in the respective areas of RMC/MC and should reach at CWD by email otherwise by fax or telephone in addition to GTS communication.
AWS: DDGM(SI), Pune will ensure the real time transmission of data from
AWS stations to DDGM(Telecom) Delhi in GTS mobile synop format.
Synoptic observations: Synoptic observatories of IMD network of costal stations shall report data on hourly basis, during IOP. During normal period 3 hrly SYNOP will be collected. RSMC, New Delhi will write to concerned WMO/ESCAP Panel member countries to ensure the availability of synoptic data from respective region for the IOP period.
Buoys: Real-time collection of hourly data from deep Ocean and met-ocean buoy network over the Bay of Bengal from INCOIS Server will be made by Telecom Division.
Upper air:
Upper air RS/RW data from IMD stations in coastal areas will be collected 12 hourly for normal days. However, during the IOP phase, 6 hourly data shall be collected. The
SN Time Product Source
r.Ensemble Prediction System (EPS) imd.gov.in, NWP Division, NCMRWF, TIGGE(JMA)
s.NCMRWF GEFS [email protected]
t.CLIPER CWD
u.MOG CWD
v.Storm Surge model (Ghosh Nomo-gram)
CWD
w.Storm Surge model (IITD) CWD, IIT Delhi

45
needS for monitoring and prediCtion
flight terminating below 200 hPaare to be repeated.
Due arrangements to receive all available Pilot Balloon data sets (twice daily) from the IAF will be made by Telecom Division
Wind profiler support from the existing Gadanki and SHAR is to be activated so as to receive hourly profiles in the lower troposphere.CWD will request Director NARL Gadanki and Met I/C SHAR with copy to Principal Scientist, ISRO for organizing necessary observational support during IOP.
DWR : DWR support from various coastal Radars with uniform storm scanning strategy will be ensured prior to the cyclone season.
NWP : It shall make all necessary arrangements for the generation of global and regional analysis fields data at 4 analysis times (00, 06,12,18 UTC) during IOP. Efforts will be made to bring out the Model forecast within three hours of the observation time.
Coordination with International Agencies: Director RSMC, New Delhi shall request the WMO/ESCAP Panel
countries about the IOP and solicit their cooperation in the real time exchange of data (surface, upper air and special observations) for their utilization in the generation of most representative meso-scale analysis fieldsforgeneratingimprovedqualityoftrack, intensity and landfall of tropical cyclones.
3.3. Manpower Needed
Following manpower is needed during IOP along with the supporting staff.
o CWD, New Delhi: Two Group A officerswillwork round the clock.
o Satmet Division, New Delhi: One GroupAofficerwillworkroundtheclock.
o Radar Division, New Delhi: One GroupAofficerwillworkroundtheclock.
o NWP Division, New Delhi: One GroupAofficerwillworkroundtheclock.
o ACWC/CWC: OneGroupAofficerwill work round the clock
o CDR/DWR Station: One Group A officerwillworkaround the clock

46
CyClone Warning in india - Standard operation proCedure
4 Observational Aspects of Cyclone Warning System
4.1. Introduction
Observational network for cyclone forecasting is aimed at continuous monitoring of the horizontal and vertical structure of the atmosphere. Surface and upper air observations from various oceanic and land platforms are the basic data required by a cyclone forecaster. The latest technological advances like Satellites, Radar and computers provide invaluable support to the cyclone warning system, complementing the conventional observing system. The observational aspects of cyclone warning system include different
types of observations (Fig. 4.1a-b).
The types of observations relevant to storm warning work are:
A. Surface observations from:
i) Land synoptic stations
ii) Ships
iii) Buoys
iv) Tide gauges
v) Aviationmeteorological offices
vi) Automatic Weather Stations (AWSs)
Fig. 4.1(a). Classificationof observations

47
obServational aSpeCtS of CyClone Warning SyStem
B. Upper air observations from:
(i) Pilot balloon stations
(ii) GPS Sonde/ Radiosonde /Radiowind
stations
(iii)Windprofiler stations
C. Radar Observations
D. Satellite observations
E. Aircraft observations
F. Microseism observations.
Each of the above observational systems
is discussed in detail in the following
sections.
4.2. Surface (Land, Ocean) Based Observations
Surface data is the foundation over which theedificeofsynopticmeteorologyisbuilt.Their horizontal coverage is generally good over populated land, and marginal to poor over oceanic or desert areas, although oceanic buoys and AWSs are being deployed and installed in large numbers and the situation has improved to a great extent in recent period.
Over land surface, data from an increasing number of AWSs contain information on wind, temperature, moisture and mean sea level pressure, with weather elements
Fig. 4.1(b). Observational network for cyclone monitoring

48
CyClone Warning in india - Standard operation proCedure
such as cloud cover or visibility mostly available from manned and aeronautical stations. Regional efforts are underway to collect, standardise and have quality control of data from observing networks from non-departmental government and non-government agencies.
Over the oceans, winds, SST and MSLP, measured on ships, buoys and island stations are important parameters used in cyclone forecasting. Even very isolated stations may play an important role in cyclone forecasting, especially when their input is used for NWP model output.
Apart from the surface observations of Voluntary Observing Fleet (VOF) ships, Array of buoys and tide gauge network form an integral part of ocean observing system. According to recent WMO report, 1250 surface drifting buoys are deployed. 6700 ships have been registered world wide, yet less than 2300 ships report regularly. Observations from buoys and ships are vital indeed in estimation of position, intensity and track of cyclones and all efforts should be made to maximise the reception of ships’ data.
4.2.1. Land Based Conventional Surface Observatories
There are at present 559 surface observatories in India for recording meteorological parameters such as surface air pressure, temperature, humidity, wind, clouds, visibility and rainfall etc. Appendix-4.I & 4.2 give the list of all the
coastal and island observatories of India and in neighbouring countries. IMD has classified the observatories as class I toClass VI, depending upon the Observatory setup and its purpose. The coastal observatories mentioned in the table are mostly Class I and Class II observatories. ThecorrespondingWMOclassificationforClass I observatories are Principal Climate Observatories with 3 to 8 observations per day. It should have three autographic charts and should take observations for pressure, temperature, wind and rainfall. Class II observatories should take and communicate 2 sets of observations per day. Class V stations measure precipitation only and WMO has classified them asPrecipitation stations.
In addition, the acquisition of surface data from the departmental and part time observatories, rainfall data from stations under District-wise rainfall monitoring scheme (DRMS), Intensive Agricultural Development Programme (IADP) and All India General Scheme (AIGS) form an integral part of the cyclone warning observational network. As most of the stations in DRMS, IADP and AIGS function under the respective state governments, effective interaction with the concerned agencies is essential for maximising reception of real time data from these stations. During 2007 Tamil Nadu government and IMD signed an MOU for exchange of rainfall data in real time. Similar arrangements in other coastal states are desirable.

49
obServational aSpeCtS of CyClone Warning SyStem
Proposed installation of AWS by various agencies of the Central and State governments along the coast is expected to give the required density to locate sub-synoptic scale systems.
4.2.2 Cooperative Cyclone Reporting Network of Stations
As the regular coastal network is not dense enough to discern cyclonic storms of smaller dimensions, Co-operative Cyclone Reporting network of stations have been started along the coast on the recommendations of Cyclone Distress Mitigation committees (CDMCs). In Andhra Pradesh, there are 13 Cooperative Cyclone Reporting stations while Odisha state has 16 CDMC stations. The list of such CDMC stations is given in Appendix-4.3. These are all police stations and they collect rainfall and wind data and the information ispassedon to IMDoffice throughpolicewireless network and telephone. In most of these centres, it has been proposed to set up either AWS or telemetric rain gauge. The Cooperative network of observatories in the state of Andhra Pradesh will send the information to Cyclone Warning Centre at Vishakapatnam through Phone/e-mail/Police Wireless. These stations record only 03 and 12UTC observations during cyclone season and only 03UTC during non-cyclone season. Hourly observations can be obtained from these stations during cyclone situations. The reports are in plain language. There is a proposal by the
concerned CDMC authorities to convert the 16 CDMC stations in Odisha into AWS stations.
In Maharashtra State, a special wireless network between IMD, Revenue Secretary, Mantralaya, Director of fisheries, policecontrol room and collector’s office is functioning during monsoon season. This network should be activated during cyclone situations by appropriate liaison with the Chief Secretary’s Office. Similarly, thereis wireless connectivity between CWC Bhubaneswar and Odisha State Control Room.
4.2.3. Time of Observations
The standard time for all observations is UTC. WMO recommendations state that the observation should be made in as short a time as possible just prior to the nominal time of observation. These observations are typically started by (HH-10) and pressure reading is taken last at the exact hour. The observation is to be transmitted before the hour is complete. As per national practice, 03 and 12UTC observations report Minimum and Maximum temperatures recorded on that day and 03UTC report also includes 24 hours total rainfall. Synoptic observation is the coded synoptic summary of the current weather at each of the large number of synoptic stations. These observations when plotted on a chart give the complete picture of the atmosphere as though from a bird’s eye view and hence the word ‘synoptic’

50
CyClone Warning in india - Standard operation proCedure
is used to describe these simultaneous observations. The observations taken at 00, 06, 12 and 18 UTC are called main synoptic observations and those taken at 03, 09, 15 and 21 are called auxiliary synoptic observation.
4.3. Ship ObservationsInternational Meteorological Organisation, the predecessor of World Meteorological Organisation was primarily started to serve the Marine community. Before the advent of satellite, ships observations were the major source for locating cyclones. Observations from ships provide vital data about disturbances over sea areas. Though land stations along the coast supply much valuable information as the storm approaches the coast, ships reports from thecyclonefield form themainsourceofconventional observations while the storm is still out at sea. Even with the advent of radars and satellites, ships observations are still very vital in cyclone forecasting.
4.3.1 Voluntary Observing Fleet (VOF)
The number of ships under Voluntary Observing Fleet is 203. It has merchant’s ships of Indian as well as foreign ships and ships belonging to Indian navy. These ships are equipped with instruments to record meteorological parameters and some of the crew on board are trained in taking and recording the observations. These ships are categorised as selected
ships, supplementary ships and auxiliary ships. Selected ships are equipped with sufficient certified meteorological instruments for making observations and report in the full SHIP code form (WMO FM 21V). In addition, these observations are recorded in the meteorological logbooks. The supplementary ships are equipped with limited number of certifiedmeteorological instruments for making observations and they transmit reports in abbreviated code form (WMO SHIP Code Fm.22V). The observations are recorded in the meteorological logbooks. The auxiliary ships are normally without certified meteorological instruments andthey transmit reports in reduced code form (WMO SHARED FM.23V) or in plain language during disturbed condition. The WMO publication International List of Selected, Supplementary and Auxiliary ships (WMO No.47 T.P 18) which gives information about all voluntary observing ships including the equipments on board and the call sign (Alpha numeric characters for ships identification) should be kept inall forecastingoffices.
4.3.2. Recording and Reporting of Ship Observations
Observations are taken both at main standard times (00, 06, 12 and 18 UTC) and supplementary observations (03, 09, 15 and 21 UTC) subject to non-interference in their navigational duties. Additional observations should be taken during sudden and dangerous weather

51
obServational aSpeCtS of CyClone Warning SyStem
Table 4.1. List of active buoys
Basin Buoy ID Latitude LongitudeArabian sea AD02 15.0 69.0
AD03 12.0 69.0
AD04 8.5 73.0
AD05 10.5 72.3
SW02 17.4 70.7
Bay of Bengal BD02 18.0 90.0
BD07 6.2 85.9
BD08 18.2 89.7
BD10 16.5 88.0
BD11 14.2 82.9
BD12 14.5 94.0
BD13 11.0 86.5
Andaman CB01 11.6 92.6
Lakshadweep CB02 10.9 72.2
CB: Coastal buoy, SW: Shallow water buoy, AD: Arabian
sea data buoy, BD: Bay of Bengal data buoy
developments and transmitted immediately, regardless of standard time.
4.4. Data Buoy NetworkDepartment of Ocean Development, Government of India has established the National Data Buoy Programme (NDBP) in 1997 at National Institute of Ocean Technology (NIOT) Chennai. A network of fourteen data buoys (Table 4.1.) has been established both in Arabian Sea and Bay of Bengal during the implementation period of 1997-2002, which has subsequently been increased to twenty-fiveandpoisedfor further growth.
The moored data buoys are floating platforms, which carry sensors to measure
Fig. 4.2. Picture of a Data Buoy deployed at Sea

52
CyClone Warning in india - Standard operation proCedure
Wind Speed & Direction, Atmospheric Pressure, Air Temperature, Humidity, Conductivity, Sea Surface Temperature, Current Speed & Direction and Wave Parameters. The wave parameters that are measured include significant waveheight, average wave period, average wave direction, Swell wave height and Swell wave period. Maximum wave height and Period of the highest Wave are also measured. The buoys are equipped with global positioning system, beacon light & satellite transceiver. They have solar panels to charge the battery pack during daytime. The recorded observations are collected by Indian National Centre for Ocean Information Services (INCOIS), Hyderabad and sent as email to the forecasting offices apartfrom GTS transmission through IMD.
4.5. Tide Gauges
Tide gauges (Fig.4.3) have been installed at Chennai, Cochin, Tuticorin, Mangalore and Port Blair along the Indian Coasts. Under the Tsunami Observation Network Programme, the network is expanded further at Vizhinjam, Kavaratti, Nagapattinam, Haldia and Kakinada. All the tide gauges are linked with satellite and online data reception at NIOT is established with password protection. These tide gauges would give vital information about the tidal and swell waves.
4.6. Reports from Airport MeteorologicalOffices
Airport Meteorological Offices record halfhourly/hourly meteorological reports and they are known by their acronym METAR. Those airports having round the clock air traffic control watch prepare reportsat half hourly interval. In other airports they prepare half hourly reports during watch hours and hourly reports during other periods. In the event of occurrence of significant changes in wind, visibility,cloud and weather, special reports are prepared and are known as SPECI. These Meteorological reports would supplement the data already obtained from other sources.Aircraftsduringflight,reportwindand temperature at the cruising level at certain places designated as meteorological reporting points. These observations known as AIREPS/PIREPS are transmitted by High Frequency Radio Transmission (HFRT) to communication unit of Airport Authority for onward transmission to airport meteorologicaloffice.Sometimes, landingpilots debrief the airport meteorological office. In vast data sparse ocean areas,these observations are invaluable. These data are plotted in the appropriate upper level chart (depending upon the cruise level).

53
obServational aSpeCtS of CyClone Warning SyStem
Fig. 4.3 (a-b). Schematic acoustic tide gauge and Tide Gauge Network in India
(b)

54
CyClone Warning in india - Standard operation proCedure
4.7. Special Observations from Coastal Stations
4.7.1. Need for Special Observations
Except for 03 and 12 UTC charts, the network of coastal observations at the other hours isnotsufficient forcyclonewarningwork. During periods of disturbed weather out at sea, observations from all the coastal and island observatories may be required at synoptic hours other than 03 and 12 UTC also. Therefore, it will be necessary to call for special observations on such occasions from observatories at some of the synoptic hours at which they may not take routine observations. Requisitions for special observations can be sent both by ACWCs & CWCs. Sometimes hourly observations are also required.
4.7.2. General Instructions
The following are the general instructions for calling special observations from surface observatories:
Special observations are to be called from coastal and island stations for the preparation of 3 hourly synoptic charts (00, 03, 06, 09, 12, 15 and 21 UTC) from the depression stage onwards or even when a depression is expected to form for the preparation of special charts for the issue of three hourly bulletins.
When landfall is expected within 48 hrs
However, if a cyclonic storm is within striking distance from the coast and the landfall is expected within the next 48 hrs, hourly special observations may be called from a restricted coastal area towards which the storm is heading, for determining the position of the storm, its intensity as well the place and time of landfall etc., from the sequence of hourly changes at these coastal stations. The usefulness of these observations is given with an illustration in the next section. These messages are cryptic coded messages giving date, time, cloud cover, wind speed & direction and
Fig. 4.4. Typical coastal observations taken during cyclone monitoring
Time (UTC)Station 1200 1300 1400 1500 1600 1700 1800 1900 2900 2100
Kakinada(43189)
Machili-patnam(43185)
Bapatla(43189)

55
obServational aSpeCtS of CyClone Warning SyStem
mean sea level pressure. They also include rainfall and pressure change during past 24 hours if available. The message does have the provision of indicating the wind speed in plain text if it exceeds 20 Knots. These messages are obtained at present through HFRT (High Frequency Radio Telephony), E-mail, Automatic message switching systems and through telephone.
4.7.3. Discretion of Storm Warning Officer
It is left to the discretion of the Storm WarningOfficer to decide how frequentlythe special observations are to be called. He should consider each case on its merits.
4.7.4. Role of Special Observations in Determining the Period of Landfall
Special observations (Fig.4.4) are coastal observations from Indian stations reported at one-hour interval. The code used for the observations is YYGG Nddff pppWW 4RRP24 P24. The symbols have the usual meaning. In order to show the importance of these observations the special observations of three stations viz., Kakinada, Machilipatnam and Bapatla are plotted for the period 12UTC to 21UTC of 16th December 2003. The time of landfall could be discerned to be around 18UTC near Machlipatnam. The veering of wind at Machlipatnam and backing of winds at Bapatla reveals movement of the
system between these two stations. The southeasterly winds at 19UTC indicate that system has entered the land. The highest value of 24 hours Pressure change also occurred in this period and clearly shows that landfall has occurred around this period.
4.7.5 Importance of 24 hr Pressure Change (P24P24)
In the previous section the importance of P24P24 observation is amply illustrated in determining the land fall period.. In this section the importance of Isallobars is given. Lines passing through areas of equal pressure changes are known as Isallobars. An Isallobaric low is as good as a pressure low. The area of highest pressure fall (Isallobaric low) indicates the direction in which the system is heading. So Isallobars play a major role in prognosis of cyclone movement.
4.7.6. Discontinuance of Special Observations
After the system has crossed coast and special observations are no longer needed, the observatories concerned should be informed immediately to discontinue the special observations. Special care should be taken to see that the observations are not received after instructions to discontinue them have been issued. Further messages to stop the observations have to be issued to such observatories which still continue to send the special observations.

56
CyClone Warning in india - Standard operation proCedure
4.8. Automatic Weather Stations
Presently, about 675 Automatic Weather Stations (AWS) are located all over India. Data are being received at the Central Earth Receiving station located at Pune. In addition, 1350 Automatic Rain gauge stations (ARG’s) are also planned. 500 ARG’s will have sensors for air temperatures, relative humidity and rainfall. The remaining 850 ARG’s will have only rainfall sensors. Out of 1350, about 450 AWSs have been installed till the end of 2011.
AWSs (Fig.4.5) use state-of-art data logger and transmitter with sensors interfaced for data sampling and recording.
Meteorological sensors for Air Temperature, Relative Humidity, Atmospheric Pressure, Rainfall, Wind Speed and Wind Direction are interfaced with both Sutron and Astra make AWS. Apart from these parameters, at few selected Sutron-make AWSs have additional sensors for Global Solar Radiation, Soil Temperature and Soil Moisture.
AWS transmit data in UHF frequency 402.75 MHz, every hour in their allocated time slots which are received by the Data Relay Transponder of the geostationary satellite Kalpana-1 and are retransmitted by the satellite at a downlink frequency of 4506.05 MHz to the Central Receiving Earth Station located at Pashan, Pune. The technique utilized for transmission is
Fig. 4.5. Schematic diagram of an AWS

57
obServational aSpeCtS of CyClone Warning SyStem
called Pseudo-Random Burst Technique (PRBS)whereadefinednumberofAWStransmit three times in a 10-minute window allocated to them.
The raw data received from all AWS is processed at the Earth Station and the synoptic data in WMO Synop Mobile FM-14 Ext format is transmitted to AMSS Mumbai via ftp through 64 kbps leased line which is then put to the Global Telecommunication System (GTS) by AMSS Mumbai every hour. The processed data is archived at Earth Station, Pune. Synoptic charts plotted in synergie system using data from AWS are available for forecasters
4.9. Upper Air ObservationsWind and temperature data of the upper atmosphere is collected by using Pilot balloons and Radiosonde/Radiowind.
4.9.1. Pilot Balloon Observatories
Meteorological conditions in the upper air have an important bearing on the expected weather. Observations for measurement of wind speed and direction alone are made 2 to 4 times a day at Pilot Balloon Observatories (PBO), which use optical theodolites. Upper wind measurements made at PBO are limited to a few km heights.
These observations are vital in determining whether the system would dissipate due to entrainment of dry land air, in locating the ridge and to know about the
steering currents for determining Cyclone movement. But in overcast Sky conditions with low clouds, it may not be possible to take the observation as the balloon may disappear in the cloud. In that situation Radiosonde/ Radiowind provide the upper air data. There are 62 pilot balloon observatories spread all over the country (Fig.4.6). WMO has established standard times for conducting upper air observations and the four synoptic hours of 00, 06, 12 and 18 UTC are the designated hours. Most balloons are released actually 30 to 45 minutes before these times and the scheduled observation period coincides with the middle of the observation. If only two observations are taken, it is taken at 00 and 12UTC. Under international practice, if only one observation is taken, it is taken at 00 or 12 UTC, whichever is closest to the local sunrise time.
4.9.2. Radiosonde/Radiowind Observations
Radiosondes serve as main observing system for determination of detailed vertical structure of the atmosphere. This is due to their excellent vertical resolution (provided full resolution data are being transmitted insteadof standard/significantlevel data only). Vertical stability analyses which require data in great details are not necessarily captured by NWP models; but can be obtained from, radiosonde data. Moreover, radiosonde data are very essential in NWP analyses and model assessment. Radiosondes are of primary

58
CyClone Warning in india - Standard operation proCedure
importance in synoptic forecasting also for identifying the position of the ridge, steering current and thermal advection
IMD is at present using GPS sonde at 11 places and Mark IV radiosonde in other 28 places of its upper air network (Fig. 4.7). The computation is fully automated with a data resolution of two seconds. Usually 00 and 12 UTC observations are taken. For 06 and 18 UTC observations,
Pilot balloons are used. When a cyclonic storm is coming closer, taking Pilot balloon observations may be difficult. In that event special Radio sonde/Radar wind observations are taken.
4.9.3. Wind Profilers
Under modernization plan (Phase-I) of IMD , four nos. of wind profilers are likely to be installed in IMD’s upper air
Fig. 4.6. Pilot balloon observatory network of India
AMRITSAR SUNDERNAGAR
AMBALA DEHRADUN
BAREILLYDELHICHURU
BIKANERJAISALMER
JODHPURBARMER
UDAIPUR KOTA
DEESABHUJ
AHMEDABAD BHOPAL JABALPUR
ALLAHABAD PATNABHAGALPUR
BANKURAGAYARANCHI
JAMSHEDPUR CALCUTTABALASORE
BHUBANESHWAR
VISHAKHAPATNAM
MACHILIPATNAMHYDERABAD
JAGDALPUR
RAIPURNAGPURAURANGABAD
PUNEMUMBAI
RATNAGIRI
GADAGANATAPUR
CHENNAI PORT BLAIRBANGALORE
TIRUCHIRAPALIKARAIKAL
MANGALORE
AMINI
THIRUVANANTHAPURAMMINICOY
VERAVAL SURATJHARSUGUDA
GOPALPUR
JAIPURGWALIOR
LUCKNOW GORAKHPUR
GANGTOK
SILIGURIGUWAHATI
AGARTALA IMPHAL
MOHAHBARI
BAHRAICH
SRI GANGANAGAR

59
obServational aSpeCtS of CyClone Warning SyStem
network. A profiler is an all-weather, unattended, vertically pointing clear-air Doppler radar. It comprises of a ground system for measuring the atmospheric wind parameters.Wind profiler system iscapable of continuously measuring vertical profilesofwindspeedandwinddirection.IMD is planning to install systems, which
will operate at a fixed frequency in 420-435 MHz (tropospheric type with height coverage of around 10 kms) and 1200 to 1375 MHz band (boundary layer type with height coverage up to around 3 kms). The system includes all items necessary to measure, process, output, archive and display the atmospheric wind data. The
Fig. 4.7. RS/RW network of India

60
CyClone Warning in india - Standard operation proCedure
data received from profilers can be usedobjectively by the assimilation of profilerobservations into routine NWP model runs. At present there are two wind profilersoperating from Pune and Gadanki. A typical windprofiler is shown inFig.4.8
4.10. Microseism ObservationsThe seismological observatories are equipped with micro seismographs to record microseisms due to disturbed weather at sea. The seismographs at the coastal and island stations could be utilised during storm period. Microseism
observations could be differentiated as monsoon type, storm type etc. As far as operational use is concerned, it is restricted to detection of the presence of cyclonic storm. Large Microseism amplitudes are recorded, when the cyclonic storm is within 320 km from the coast. The forecasters seldom use microseism observations due to rapid strides made in Satellite and Radar meteorology.
4.11. Quality Control of Observations
In the forecasting offices, after the
Fig. 4.8.A schematic representationof aWindProfiler

61
obServational aSpeCtS of CyClone Warning SyStem
reception of data from the field stations,discrepancies could be detected during the plotting of chart. The concerned observatory is asked to check and repeat the observation. The automatic message switching system installed at the regional telecommunication hub and at most of the regional meteorological centres has also a validation menu. Validation is done to check the format, header and text. Format validation checks the sequence number of message, whether “=”sign comes at end of the message etc. Header validation checks whether proper header is given for the message. Origin of the observation is also validated. A particular observation is expected only from its regional correction centre and if it comes from another centre, validation of the same is required.
Then the message is validated for text. Whether each group contains five digitnumbers is checked and whether mandatory groups are included in the message. Then each group is validated. For example, if IR were indicated as 2, system would check whether rainfall group is included. The system itself contains the extreme value limit for different weather elements for each station. Checking is done for each element. In some cases, provision for autocorrection is there. While running the Numerical weather prediction models, all the synoptic and upper air observations are used. These observations are once again checked before interpolation for generating the grid point values.
4.12. Radar ObservationsTen cyclone detection radars (10 cm –S band) are at present in operation in the country along the east and west coasts. The S-band radars at Chennai, Kolkata, Machlipatnam and Visakhapatnam have been replaced by Doppler Weather Radars (DWR). In addition a special DWR has been installed at Sriharikotta (A.P). Along the west coast the installation of DWR at Mumbai has been completed.
4.12.1.Tracking by S-band Radars and Doppler Radars
The S-band radars operate at 10 cm wave length and give a good coverage for tracking the cyclones over the sea. Although the maximum range for cyclone detection radar is 500 km, the effective range is limited to 400 km mainly due to earth’s curvature at long ranges. When a disturbance is approaching the coastal radar station directly, with the normal speed of about 10 – 15 km per hour, this range provides roughly a 24 hour tracking time betweenthefirstdetectionoftheeyeandthefinal landfall.Afurtherperiodofa fewhours may also be gained if well developed spiral band ahead of the centre of the cyclone appears first on the radar scopeenabling determination of the centre with the help of spiral overlay technique.
Doppler Weather Radars provide vital information on radial velocity and spectral width, in addition to reflectivity which isalso available from conventional (analog

62
CyClone Warning in india - Standard operation proCedure
Fig. 4.10. Typical DWR products (Max Z and UWT) used for cyclone monitoring
Fig. 4.9. S-band Cyclone Detection Radar Network
68°E 72° 76° 80° 84° 88° 92° 96°E
36°N
32°
28°
24°
20°
16°
12°
08°N
92°E88°84°80°76°72°E
08°N
12°
16°
20°
BHUJ
MUMBAI
GOAARABIAN SEA
KOCHI
CHENNAI
KARAIKAL
LEGENDDOPPLER WEATHER RADARINDIGENOUS DOPPLER RADARCONVENTIONAL RADAR
SRIHARIKOTA
MACHLIPATNAM
VISAKHAPATNAM
BAY OF BENGAL
PARADIP
KOLKATA
INDIA METEOROLOGICAL DEPARTMENT CYCLONE DETECTION RADAR NETWORK
(S-BAND)REFLECTIVITY RANGE 400 KMVELOCITY RANGE 250 KM
24°
28°
32°
36°N

63
obServational aSpeCtS of CyClone Warning SyStem
type) of radars. However, the radial velocity information is restricted to 250 km only. Also the surface rainfall intensity estimation is possible and is restricted to a maximum of 150 km range due to the Earth curvature. Typical products are shown in Fig.4.10 and 4.11. Reflectivityestimates obtained from these radars are more accurate in comparison to those from conventional radars as the Doppler Weather Radars have capability for correcting the
values for clutters, partial beam filling,beam blockage and bright band. The Doppler Weather Radars generate various derived products in addition to primary PPI and RHI displays. Surface Rainfall Intensity (second level product derived from reflectivity) and other hydrologicalproducts like Precipitation Accumulation (PAC), Vertical Integrated Liquid (VIL) are very important for issuing warnings for heavy rain, flash flood and hail. The
Fig. 4.11. Realtime PPZ, MAXZ & PPV images of cyclone THANE

64
CyClone Warning in india - Standard operation proCedure
algorithms for generation of these products employ some adaptable parameters which depend on drop size distribution (DSD) present in the precipitation. The DSD is different for different seasons, geographical location and type of precipitation. There are following three base data products, which are generated dire ctly by the Doppler Weather Radar.
Reflectivity (Z)
Radial Velocity (V)
Spectrum Width (W)
These base data products are displayed in website in the following format.
(a) Basic image products
MAX(Z) Product
Plan Position Indicator(Z)
Plan Position Indicator, PPI(Z)-Close Range
Volume Velocity Processing(2)
Plan Position Indicator(V)
Surface Rainfall Intensity
Precipitation Accumulation (PAC) 24 hrs at 0300 UTC
PCAPPI-1km
Wind-1km
(b) RADAR animation
MAX(Z) Product
Plan Position Indicator(Z)
Plan Position Indicator(V)
Surface Rainfall Intensity
Pseudo Constant Altitude PPI (PCAPPI)
(c) RADAR mosaic products
Still image
Animation 3 Hrs.
(d) Radar products in GIS
Pseudo constant altitude PPI (PCAPPI)-1km
Plan Position Indicator(Z)
MaX(Z) Product
Plan Position Indicator(Z)
Volume Velocity Processing
Wind-1km
Primary products
The products not available in website, but generated by the DWR include the following:
(a) Standard Met. Products:
CAPPI -Constant Altitude PPI
VCUT -Vertical Cut
ETOP -Echo Top
EBAS -Echo Base
(b) Extended Met. Products
VAD -Velocity Azimuth Display
UWT -Uniform Wind Technique

65
obServational aSpeCtS of CyClone Warning SyStem
(c) Hydrological Products
VIL -Vertical Integrated Liquid
(d) Shear Products
RDS -Radial Shear
AZS -Azimuthal Shear
ELS -Elevation Shear
RAS -Radial Azimuthal Shear
RES -Radial Elevation Shear
3DS -3 D Shear
HZS -Horizontal Shear
VCS -Vertical Shear
LTB -Layer Turbulence
(e) Warning & Forecasting Products
HHW -Hail Warning
TRK -Storm Tracking
4.12.2. Radars in Neighbouring Countries
Available information about cyclone warning radars in the neighbouring countries is given in Table 4.2 as a matter of interest. Occasionally, radar reports may be received from these radar centres. Also the radar products available from their concerned National Meteorological Services may be referred.
4.12.3. X-Band Radars
X-band radars along Coastal Belt
The details of X-Band 3- cm radars that are functioning along the coast line of India are given in Table 4.3. X-Band EEC radars are Computer controlled state of art radars which provide product through software and pictures of cloud are presented in different colours according to the intensity
Table 4.2. Cyclone Warning Radars in the neighbouring countries
S. No. Station Coast Wave length Remarks
1. Kyaukpyu Myanmar 10 cm Operational since 1979
2. Cox’z Bazar Bangladesh 10 cm Operational since 1990
3. Dhaka - do - 10 cm - do -
4. Khepupara -do-(21.59ºN/90.14ºE)
10 cm Operational since 1982
5. Rangpur - do - 10 cm Operational since 1999
6. Trincomalee SriLanka 10 cm Operational since 1982
7. Karachi Pakistan 5.6 cm Functioning since 1991.
8. Bangkok Thailand 10 cm Operational since 1992

66
CyClone Warning in india - Standard operation proCedure
of the cloud. X-band EEC radars generate algorithm based derived products similar to reflectivity based products of Dopplerweather Radar. EECWind finding radarshave capability of being used as storm detection radars also.
The coastal X-band radars at Mangalore and Thiruvananthapuram may be used in storm situations affecting Karnataka and Kerala coasts; those at Mumbai, Goa, Chennai, Visakhapatnam and Kolkata will also be useful as a standby if the cyclone detection radars at these places become temporarily unserviceable. In case of unserviceability of the cyclone detection radar at Paradip, X-band radar at Bhubaneswar can serve as a standby.
4.12.4.Operation of Radar and Availability of Radar Observations
In undisturbed weather:
The cyclone detection radar will be operated as a routine at 0600 UTC every day for checking the overall performance of the radar. This will be the daily routine during undisturbed weather. There is no need to operate the radar beyond its routine operation when any system is more than 800 km. away from the radar station. The Doppler Weather Radar will be in continuous operation in all seasons.
When disturbances are developing:
Whenever a depression or cyclonic storm
Table 4.3. X-Band 3- cm radars along the coast line of India
S.No. Station name Coast Remarks
1. Kolkata West Bengal EEC X-Band ,Weather Radar
2. Bhubaneshwar Odisha EEC X-Band ,Wind Finding Radar
3. Visakhapatnam Andhra Pradesh EEC X-Band, Wind Finding Radar
4. Chennai Tamil Nadu EEC X-Band ,Weather Radar
5. Thiruvananthapuram Kerala BEL X-Band, Wind Finding cum, Weather Radar
6. Mangalore Karnataka EEC X- Band, Wind Finding Radar
7. Panaji Goa EEC X-Band ,Wind Finding Radar
8. Mumbai Maharashtra BEL X-Band ,Weather Radar
9. Karaikal Tamil Nadu BEL X-Band ,Weather Radar
10. Machilipatnam Andhra Pradesh BEL X-Band, Weather Radar
67
obServational aSpeCtS of CyClone Warning SyStem
lies between 400 and 800 km from the station and this information is conveyed to the radar station by ACWC/CWC or when precipitation echoes suggestive of development of a storm are observed on the radar-scope, the radar will be operated once every 3 hours (at full hours UTC).
Deep depressions and depressions
Hourly observations are adequate in the case of deep depressions and three hourly in the case of depressions within the range of the radar.
When storm is within the radar range
The radar is operated every hour or more frequently depending on the requirements concerned when the storm is within the radar range. The radar station will revert to routine only when the above conditions have ceased to be valid.
When eye is located
When the eye is located between 200 and 400 km. from the station, the radar is operated hourly, but more frequent observations (half hourly, or every 10 minutes) are made as required by the situation.
Continuous operation
The radar will be operated continuously, if necessary, when the cyclone center is at a distance of 200 km. or less from the radar station over the sea and until such time as the disturbance continues as a cyclone over land even after crossing coast.
The above paragraph refers to emergency measures and will apply only in the case of cyclonic storms. “Frequency of radar reports (RAREPs) is hourly and close co-ordination betweenofficersof theRadarstationandthe associated Cyclone Warning Centre(s) is maintained for getting more frequent observations, if found necessary”.
4.12.5. Radar Bulletin
Three hourly/hourly bulletins are prepared by Radar Centres and transmitted to concerned ACWCs/CWCs and CWD for use in Cyclone Warning. An example of such a bulletin in standard format is given in Table 4.4. The Radar stations can provide the location of cyclone to All India Radio (AIR) Stations when cyclone is trackedwith confidence.
4.13. Satellite Cloud Imagery Data and Derived Products Useful in Cyclone Warning
4.13.1. Cloud Imagery Data
At present IMD is receiving and processing meteorological data from two Indian satellites namely Kalpana-1 and INSAT-3A. Kalpana-1 was launched on 12th September, 2002 and is located at 740 E. INSAT-3A was launched on 10 April, 2003 and is located at 93.50 E. Kalpana-1 and INSAT-3A both have three channel Very High Resolution Radiometer (VHRR) for imaging the Earth in Visible (0.55-0.75 um),

68
CyClone Warning in india - Standard operation proCedure
Table 4.4. Example of Radar based Cyclone Bulletin
Radar based Cyclone Bulletin
Date : 30th Dec. 2011 Time: 06:00 UTC
Name of reporting Radar Doppler Weather Radar, Chennai
Geo-coordinates of Radar 13.0728 N; 80.2883 E
Name of Cyclone THANE
Main features visible at this time indicating:
Centre Eye not visible. Convergence of spiral bands indicates Vortex centre near11.73N78.97E(Azimuth223.8deg.Range205.5km).Confidencepoor.
Intensity Maxreflectivityseenaroundthesystemcentreisabout32dBZ23 dBZ echoes reach up to 9 km.
VelocityMaximum radial velocity observed in the eye-wall region is around 28 mps on NW and -28 mps on SE sectors at about 206 km range /3.2 km height.
Other features, if anySystem is moving WSWward at the rate of 19 kmph, during the past three hours
Remarks 40th Bulletin on Thane. 201112300555_Real-time_PPZ , 300556_MAXZ, 300602_PPZ and 300556_ PPV images attached.Hourly radar based bulletin is being discontinued as the system has weakened beyond reasonable estimation of features.
Infra-Red (10.5-12.5um) and Water vapour (5.7-7.1um) channels having resolution of 2X2 km. in visible and 8X8 km. in Water vapour (WV) and Infra red (IR) channels. In addition, the INSAT-3A has a three channel Charge Coupled Device (CCD) payload for imaging the earth in Visible (0.62-0.69um), Near IR (0.77-0.86um) and Short Wave IR (1.55-1.77um) bands of Spectrum. The Resolution of CCD payload in all the three channels is 1kmx 1 km. At present about 48 nos. of satellite images are taken daily from Kalpana-1
which is the main operational satellite and 9 images are taken from INSAT-3A. Imaging from CCD is done 5 times during daytime only. All received data from the satellite are processed and archived in National Satellite Data Centre (NSDC), New Delhi.
Indian Meteorological Data Processing S y s t e m ( I M D P S ) i s p r o c e s s i n g meteorological data from INSAT VHRR and CCD data and supports all operational activities of the Satellite Meteorology Division on round the clock basis. Cloud

69
obServational aSpeCtS of CyClone Warning SyStem
Imagery Data are processed and transmitted to forecasting offices of the IMD as wellas to the other users in India and foreign countries.
To supplement these observations, cloud imagery data from METEOSAT-5 satellite, which is also located to observe Indian region, from 63 deg E long, are also being received in VIS (0.4-1.1mm), IR (10.5-12.5mm) and Water Vapour channels(5.7-7.1mm). Since all these satellites are geostationary satellites, cloud imagery data from these satellites are frequently ingested. It is 3 hourly in case of INSAT and half hourly in case of Kalpana-1 and ranges from half to one and half-hourly in case of METEOSAT-5 satellite. In addition to above mentioned geostationary satellites, cloud imagery data from the NOAA and METOP satellite are being received at HRPT stations at New Delhi, Chennai and at Guwahati whenever these satellites pass over Indian region. NOAA satellites pass over near local noon and near mid night at pre-assigned hours and normallyimagerydatainfive/fourchannelsare being received twice from each satellite during day/night pass. Apart from these six channel imagery data from NOAA AVHRR payload, TOVS data are also received from NOAA satellite for deriving temperature andmoisture profiles. The cloud imageryradiance data from Kalpana geostationary satellite are used for making cloud Imageries and for deriving various Satellite Derived Products i.e., OLR, CMV, QPE &
SST. Cloud imageries are very useful for locating the tropical Cyclone position, its intensity by Dvorak Technique and speed and direction of movement and track of cyclone from sequence of imageries and the amount of convection associated with the tropical cyclone. The derived products help further in knowing these aspects of a cyclone. Both cloud imagery and the Derived Products help in diagonising and forecasting the tropical cyclone intensity and position.
4.13.2.Derived Products Used for Diagonising a Tropical Cyclone
Several products, which can be used in meteorology in general, are derived from satellite cloud imagery radiance data. Following products are available with Kalpana cloud imagery data. Apart from generating half hourly cloud imagery, IMDPS produces derived products from the processed data as follows:
Cloud Motion Vectors (CMV) are derived with 2.50 resolution using three consecutive half hourly images from the operational Kalpana-I Satellite. CMVs are generated at 00, 03, 06, 09, 12, 15, 18 and 21 UTC using IR imagery daily.
Water Vapour Winds (WVWs) are derived with 12.50 resolution using three consecutive half hourly images from the operational Kalpana-I Satellite. WVWs are generated at 00, 03, 06, 09, 12,

70
CyClone Warning in india - Standard operation proCedure
15, 18 and 21 UTC using water vapour imageries data.
These CMV’s/WVWs are being transmitted on MDD for utilization by other forecasting stations. These wind data are useful in monitoring tropical cyclones location and intensity (Fig.4.12).
Sea Surface Temperatures (SST) are computed at 10 x 10 grid intervals from all Kalpana-I data on half hourly /daily /weekly/monthly basis. These SST are available on nearly cloud free regions. Unfortunately, where there is a tropical cyclone, SSTs are not available due to heavy cloudiness. Yet SST before the TC formation are helpful in deciding the probable region for generation of a TC.
Outgoing Longwave Radiation (OLR) are computed at 0.250 x 0.250 grid
intervals from all Kalpana-I data on half hourly /daily /weekly/monthly basis. OLR patterns are being derived from IR cloud imagery Radiance data and the same are also transmitted for use at other forecasting centres. These OLR patterns although useful for forecasting TC intensity, also find application in numerical models and for rough estimation of direction of movement and intensity of convection present. OLRs are averaged daily, weekly and monthly.
Quantitative Precipitation Estimation (QPE) is generated at 10 x 10 Grid from Kalpana-1 imagery on half hourly/daily/weekly/monthly basis. These are also transmitted on MDD. The QPE areuseableinfindingtheprecipitationpotential of a TC.
Fig. 4.12. Wind data available through satellites

71
obServational aSpeCtS of CyClone Warning SyStem
At present Dvorak technique is widely used but manually applied. Recently efforts have been made for automation of this technique. Automated Dvorak technique is running in experimental mode at Satellite Meteorology Division of IMD.
4.13.3.Tropical Cyclone Bulletins Based on Satellite Cloud Imagery Data and Derived Products
During normal weather 3-hourly Bulletins called Satellite Bulletins based on satellite cloud imagery data and derived products are made at Satellite Meteorology Division of IMD, New Delhi. These 3-hourly bulletins are transmitted through MDD for utilization byforecastingoffices.Butwhenthereisatropical cyclone over the Bay of Bengal or the Arabian Sea, these Satellite Bulletins are prepared each hour and transmitted
through MDD. In these bulletins, the centre and intensity of cyclone as estimated by Dvorak Technique, its past motion and amount of convection associated with tropical cyclones and other characteristic features are described.
Based on different satellite cloud imagery data and their derived products, the US Weather Bureau, Washington, issues daily bulletins called “Satellite Tropical Disturbance Summary”(STDS) for the different oceanic areas, describing the major cloud system and disturbed weather area. The information contained in the STDS includes location and intensity of the tropical systems, if any, in the area, their past movement, associated cloud bands etc. The intensity and related details are given in Dvorak’s T-code form. The summary for the Indian Ocean covers
Fig. 4.13. Microwave imageries of TC THANE

72
CyClone Warning in india - Standard operation proCedure
Arabaian Sea and Bay of Bengal also. These bulletins are received at New Delhi on the GTS and retransmitted to the ACWCs/CWCs, Weather Central Pune andotherForecastingOfficesinIndia.Asthese are received only after a lapse of some hours after the picture time, they may not be useful for immediate operational purposes. However, they are utilized for comparing our assessment of the centre and intensity of the system with that of the U.S. Weather Bureau.
Satellite information about disturbances
over the Indian seas is also available in the storm warning bulletins issued from U.S. Fleet Weather Central (Joint Typhoon Warning Centre-JTWC). This is based on the pictures received through the satellites of the Defence Met. Satellite Programme (DMSP) of U.S.A. These bulletins are also received at New Delhi on the GTS and distributed to the concerned offices.Recenty the microwave imageries are also used to monitor the TCs especially their genesis, location and intensity. A typical microwave imagery of a TC is shown in Fig. 4.13

73
obServational aSpeCtS of CyClone Warning SyStem
Appendix 4.1. List of Coastal stations in India
Station Index Station Latitude(deg/min.)
Longitude(deg/min.)
Class 00Z 03Z 06Z 09Z 12Z 15Z 18Z 21Z
42903 Sagar Islands 21º45'N 88º03'E IIb 0 X 0 0 X 0 0 0
42807 Kolkota(Alipore) 22º32'N 88º20'E I X X X X X X X X
42809 Kolkota(DumDum) 22º39'N 88º20'E I X X X X X X X X
42812 Canning 22º15'N 88º40'E 0 X 0 0 X 0 0 0
42811 Diamond harbour 22º11'N 88º12'E X X X X X X X* X*
42803 Midnapore 22º25'N 87º19'E IIb 0 X 0 0 X 0 0 0
42901 Digha 21º50'N 87º47'E X X X X X X X* X*
42810 Basirhat 22º39'N 87º52'E IIb 0 X 0 0 X 0 0 0
42900 Contai 21º47'N 87º45'E IIb 0 X 0 0 X 0 0 0
42895 Balasore 21º31'N 86º56'E I 0 X X X X X 0 0
42973 Chandbali 20º47'N 86º44'E I 0 X X X X X X X
42971 Cuttack 20º28'N 85º56'E IIb 0 X 0 0 X 0 0 0
42976 Paradip 20º18'N 86º41'E IIa 0 X 0 0 X 0 0 0
42971 Bubaneshwar 20º15'N 85º50'E I X X X X X X X X
43053 Puri 19º48'N 85º49'E I X X X X X X X X
43049 Gopalpur 19º16'N 84º53'E I X X X X X X X X
43105 Kalingapatnam 18º20'N 84º08'E I X X X X X X X X
43149/150 Vishakapatnam 17º43'N 83º14'E I X X X X X X X X
43189 Kakinada 16º57'N 82º14'E I X X X X X X X X
43147 Tuni 17º21'N 82º33'E I X X X X X X X X
43243 Kavali 14º54'N 79º59'E I X X X X X X X X
43184 Nidadavole 16º50'N 81º35'E IIb 0 X 0 X X 0 0 0
43187 Narsapur 16º26'N 81º42'E I X X X X X X X X
43181 Gannavaram 16º42'N 80º48'E I X X X X X X X X
43180 Vijayawada 16º31'N 80º37'E IIb 0 X 0 0 X 0 0 0
43185 Machlipatnam 16º12'N 81º09'E I X X X X X X X X
43220 Bapatla 15º54'N 80º28'E I 0 X X X X 0 0 0
Vadaveru 15º48'N 80º25'E IIb 0 X 0 0 X 0 0 0
43221 Ongole 15º30'N 80º05'E I X X X X X X X X
43245 Nellore 14º27'N 79º59'E I X X X X X X X X
43279 Minambakkam 13º00'N 80º12'E I X X X X X X X X

74
CyClone Warning in india - Standard operation proCedure
Station Index Station Latitude(deg/min.)
Longitude(deg/min.)
Class 00Z 03Z 06Z 09Z 12Z 15Z 18Z 21Z
43278 Nungambakkam 13º04'N 80º11'E I 0 X X X X 0 0 0
43328 Pondicherry 11º58'N 79º49'E I X X X X X X X X
43329 Cuddalore 11º46'N 79º46'E I X X X X X X X X
43207 Parangipettai 11º30'N 79º46'E IIb 0 X 0 0 X 0 0 0
43346 Karaikal 10º55'N 79º50'E I X X X X X X X X
43347 Nagapattinam 10º46'N 79º51'E I X X X X X X X X
43249 Vedaranyam 10º22'N 79º51'E IIb 0 X 0 0 X 0 0 0
43348 Adiramapattinam 10º20'N 79º23'E I X X X X X X X X
43361 Tondi 09º44'N 79º02'E I X X X X X X X X
43363 Pamban 09º16'N 78º18'E I X X X X X X X X
Valinokam 09º10'N 78º39'E IIb 0 X 0 0 X 0 0 0
43379 Tuticorin 08º45'N 78º11'E I 0 X X X X 0 0 0
43376 Palayamkottai 08º44'N 77º45'E IIb 0 X 0 0 X 0 0 0
Manalmelkudi 10º03'N 79º14'E IIb 0 X 0 0 X 0 0 0
43377 Kanniyakumari 08º05'N 77º30'E IIa 0 X X 0 X 0 0 0
43371 Thiruvanathapuram 08º29'N 76º57'E I X X X X X X X X
43354 Punalur 09º00'N 76º55'E IIb 0 X 0 0 X 0 0 0
43352 Alappuzha 09º33'N 76º25'E IIa 0 X 0 0 X 0 0 0
43355 Kottayam 09º32'N 76º36'E IIb 0 X 0 0 X 0 0 0
43314 Kozhikode 11º15'N 75º47'E I X X X X X X X X
43315 Cannur 11º50'N 75º20'E IIa 0 X 0 0 X 0 0 0
43285 Mangalore 12º57'N 74º53'E IIa 0 X 0 0 X 0 0 0
43284 Bajpe 12º55'N 74º53'E I X X X X X X X X
43226 Honavar 14º17'N 74º27'E I X X X X X X X X
43225 Karwar 14º47'N 74º08'E I 0 X X X X 0 0 0
43196 Mormugoa 15º25'N 73º47'E I 0 X X X X 0 0 0
43192 Panjim 15º29'N 73º49'E I X X X X X X X X
43193 Vengurla 15º52'N 73º38'E IIc 0 X 0 0 X 0 0 0
43153 Devgarh 16º23'N 73º21'E IIb 0 X 0 0 X 0 0 0
43110 Ratnagiri 16º59'N 73º20'E I X X X X X X X X
43109 Harnai 17º49'N 73º06'E IIa 0 X X X X 0 0 0
43058 Alibagh 18º38'N 72º52'E IIa 0 X 0 0 X 0 0 0

75
obServational aSpeCtS of CyClone Warning SyStem
Station Index Station Latitude(deg/min.)
Longitude(deg/min.)
Class 00Z 03Z 06Z 09Z 12Z 15Z 18Z 21Z
43057 Mumbai(coloba) 18º54'N 72º49'E I 0 X X 0 X 0 0 0
43003 Mumbai(Santacruz) 19º07'N 72º51'E I X X X X X X X X
42001 Dahanu 19º58'N 72º43'E I X X X 0 X 0 X 0
42840 Surat 21º12'N 72º50'E IIb X X X X X X X X
42838 Bhavnagar 21º45'N 72º12'E I 0 X X 0 X 0 0 0
42909 Veraval 20º54'N 70º22'E I X X X X X X X X
42830 Porbander 21º39'N 69º40'E I X X X X X X X X
42832 Keshod 21º19'N 70º19'E IIa X X X X X X X X
42730 Okha 22º29'N 69º05'E I X X X X X X X X
42731 Dwarka 22º22'N 69º05'E I X X X X X X X X
42639 New kandla 23º00'N 70º13'E IIb 0 X 0 0 X 0 0 0
42631 Naliya 23º15'N 68º51'E I X X X X X X X X
42634 Bhuj 23º15'N 69º40'E I X X X X X X X X
43226 Agathi 10º51'N 72º28'E IIb 0 X 0 0 X 0 0 0
43311 Amini 11º07'N 92º56'E I X X X X X X X X
43334 Androth 10º48'N 73º59'E IIb 0 X 0 0 X 0 0 0
43369 Minicoy 08º18'N 73º09'E I X X X X X X X X
43385 Kondul 07º13'N 93º44'E IIb 0 X 0 0 X 0 0 0
43382 Nancowri 07º59'N 93º32'E IIb 0 X 0 0 X 0 0 0
43367 Carnicobar 09º09'N 92º49'E IIb X X X X X X X X
43364 Hut bay 10º35'N 92º33'E IIb 0 X 0 0 X 0 0 0
43333 Portblair 11º40'N 92º43'E I X X X X X X X X
43310 Longisland 12º25'N 92º56'E IIb 0 X 0 0 X 0 0 0
43309 Mayabandar 12º55'N 92º55'E IIb 0 X 0 0 X 0 0 0

76
CyClone Warning in india - Standard operation proCedure
Appendix 4.2. List of Foreign Coastal stations
Station Index Station Latitude(deg/min.)
Longitude(deg/min.)
00Z 03Z 06Z 09Z 12Z 15Z 18Z 21Z
41756 Jiwani 25º04'N 61º48'E X X X X X X X X
41759 Pasni 25º16'N 63º29'E X X 0 0 X 0 0 0
41782 Karachi 24º48'N 66º59'E X X X X X X X X
43413 Mannar 08º59'N 79º55'E X X X X X X X X
43424 Puttalam 08º02'N 79º50'E X X X X X X X X
43495 Galle 06º02'N 80º13'E X X X X X 0 X 0
43466 Colombo 06º54'N 79º52'E X X X X X X X X
43497 Hambantota 06º07'N 81º08'E X X X X X X X X
43436 Batticloa 07º43'N 81º42'E X X X X X X X X
43418 Trincomalee 08º35'N 81º15'E X X X X X X X X
43404 Jaffna 09º39'N 88º01'E X X X X X 0 X 0
43400 Kankasanturai 09º48'N 80º04'E X X X X X X X X
41941 Chandpur 20º16'N 90º42'E X X X X X X X X
41950 Barisal 22º45'N 90º22'E X X X X X X X X
41953 Majidcourt 22º52'N 91º06'E X X X X X X X X
41960 Patuakhali 22º20'N 90º20'E X X X X X X X X
41963 Hatia 22º26'N 91º06'E X X X X X X X X
41964 Sandwip 22º29'N 91º26'E X X X X X X X X
41984 Khepura 21º59'N 90º14'E X X X X X X X X
41977 Chittagong 22º21'N 91º49'E X X X X X X X X
41992 Cox’sBazzar 21º26'N 91º56'E X X X X X X X X
41989 Kutubdia 21º49'N 91º51'E X X X X X X X X
41998 Teknaf 20º52'N 92º18'E X X X X X X X X
48062 Sittwe 20º08'N 92º53'E X X X X X 0 X 0
48071 Kyaukpyu 19º25'N 93º33'E X X X X X 0 X 0
48080 Sandoway 18º28'N 94º21'E X X X X X 0 X 0
48094 Pathein 16º46'N 94º46'E X X X X X 0 X 0
48097 Yangon 16º46'N 96º10'E X X X X X X X X

77
obServational aSpeCtS of CyClone Warning SyStem
Station Index Station Latitude(deg/min.)
Longitude(deg/min.)
00Z 03Z 06Z 09Z 12Z 15Z 18Z 21Z
48103 Moulmein 16º30'N 97º37'E X X X X X 0 X 0
48107 Ye 15º15'N 97º52'E X X X X X 0 X 0
48108 Dawei 14º06'N 98º13'E X X X X X 0 X 0
48109 Coco Island 14º07'N 93º22'E X X X X X 0 X 0
48110 Mergui 12º26'N 98º36'E X X X X X 0 X 0
48112 Victoria Ponit 09º58'N 98º35'E X X X X X 0 X 0
48565 Phuket Airport 08º07'N 98º19'E X X X X X X X X
Kawthaung 09º58'N 98º35'E X X X X X 0 X 0
41240 Khasab 26º20'N 56º23'E 0 X X X X X X 0
41246 Sohar majis 24º28'N 56º38'E X X X X X X X X
41256 Seeb 23º35'N 58º17'E X X X X X X X X
41268 Sur 22º32'N 59º28'E X X X X X X X X
41288 Masirah 20º40'N 58º54'E X X X X X X X X
41316 Salalah 17º02'N 54º05'E X X X X X X X X

78
CyClone Warning in india - Standard operation proCedure
Appendix 4.3. List of Co-operative Cyclone Reporting Network of Stations (Andhra Pradesh & Orissa)
S.No. Station District Nearest TelegraphicOffice
Distance FromStation
Andhra Pradesh
1 Palasa Srikakulam Palasa 2 km
2 Sompeta Srikakulam Sompeta 100 meters
3 Anakapalli Vishakapatnam Anakapalli 1.5 km
4 Rajamundry East Godavari Rajamundry 2.5 km
5 Yanam East Godavari Yanam 1.0 km
6 Razaole East Godavari Razaole 200 meters
7 Eluru West Godavari Eluru 1.0 km
8 Challapalli Krishna Challapalli 0.5 km
9 Avani Gadda Krishna Avani Gadda 200 meters
10 Nagayalanka Krishna Nagayalanka 1.0 km
11 Bantimalli Krishna Bantimalli 1.0 km
12 Kothapatnam Prakasam Kothapatnam 200 meters
13 Narasapuram Nellore Narasapuram 0.5 km
Odisha
1 Bhograi Balasore Bhograi 2 km
2 Basta Balasore Basta 1 km
3 Bhadrak Balasore Bhadrak 2 km
4 Bansara Balasore Bansara 2 km
5 Rajkanika Cuttack Rajkanika 2 km
6 Aul Cuttack Aul 2 km
7 Rajnagar Cuttack Rajnagar 1 km
8 Kendrapara Cuttack Kendrapara 2 km
9 Mahakalpara Cuttack Mahakalpara 2 km
10 Jagatsingnpur Cuttack Jagatsinghpur 1 km
11 Ersama Cuttack Ersama 2 km
12 Nimapara Puri Nimapara 0.5 km
13 Brahmagiri Puri Brahmagiri 1 km
14 Krishnaprasad Puri Krishnaprasad 0.5 km
15 Chatrapur Ganjam Chatrapur 0.5 km
16 Berhampur Ganjam Berhampur 3 km

79
monitoring and prediCtion teChnique
5 Monitoring and Prediction Technique
5.1. Monitoring and Prediction of Cyclogenesis
Following steps are followed for monitoring and prediction of cyclogenesis (formation of depression) over the north Indian Ocean.
5.1.1. Road Map
Step I
Location of deep convection areas on geostationnary satellite imagery (on Synergie)
Presence of a pre-existing disturbance in the lower atmosphere : analysis of pre-extisting lows in the ITCZ (their location, organization, intensity)
Animated visible and IR geostationnary imagery on Synergie : estimation of the areas of organizing deep convection, their evolution during the last 24 hours; first estimation of associated LLCCs(low level circulation centers); analysis of exposed LLCCs (when out of deep convection).
Micro-Wave imagery over suspected convective areas (Monterey website, or Synergie Cyclone), to see the low or mid-level improving cyclonic
organization, under Cirrus clouds. (http://www.nrlmry.navy.mil/tc_pages/tc_home.html)
Step II
Ocean surface winds derived from satellite:
OSCAT : http://manati.orbit.nesdis.noaa.gov/oscat/ Ocean Surface Winds derived from the SeaWinds Scatterometer aboard the Ocean Sat II satellite
ASCAT : http://manati.orbit.nesdis.noaa.gov/ascat/ Ocean Surface Vector Winds derived from the Advanced Scatterometer (ASCAT - 50km) aboard the EUMETSAT METOP satellite
WINDSAT : http://manati.orbit.nesdis.noaa.gov/windsat/ Ocean Surface Winds derived from WindSat/Coriolis Measurements
Step III
SST exceeding 26°C and a deep thermocline (50 m)
Analysis of SST in models available in Synergie
h t tp: / /www.aoml.noaa.gov/phod/cyclone/data/ni.html

80
CyClone Warning in india - Standard operation proCedure
IMD (Satellite)
Depth of the 26°C isotherm. SST field provided on a daily basis fromTMI measurements (Tropical Rainfall Measuring Mission’s Microwave Imager).
SST f rom TMI (F ig .5 .1 as an example)
Estimation derived from See Height Anomaly on a l t imeter sate l l i te observation.
Ocean Thermal Energy
Step IV
Conditional instability through a deep atmospheric layer
Area of deep convection on satellite imagery
Favorable synoptic scale conditions for development of deep convection (Madden Jullian Oscillation (MJO)/Outgoing Longwave Radiation (OLR)) : http://www.bom.gov.au/bmrc/clfor/cfstaff/matw/maproom/OLR_modes/
Maps of the MJO real-time filtered OLR anomalies, each averaged for a period of 7 days. The firstmap is forthe most recent 7 days of observed data (Fig.5.2). 3 subsequent maps are the forecasts of the MJO OLR anomalies. Blue shading is an indication of enhanced convection and rainfall.Orange shading is an indication of suppressed conditions Tropical lows
Fig. 5.1. SST as on 25th March, 2009
40°E
30°N
20°N
10°N
10°S40°E 50°E 60°E 70°E 80°E 90°E 100°E
10°S
0°
10°N
20°N
30°N 32
30
28
26
24
22
20
S S T
0°C
Developed at NOAA/AOML
0°
50°E 60°E 70°E 80°E 90°E 100°E25/Mar/2009

81
monitoring and prediCtion teChnique
mainly develop during enhanced or
neutral convection phase.
Forecast of (Poor or No) risk of
development up to 7 days possible
when dry phase is forecast.
Step V
Large values of relative humidity in the lower and middle troposphere.
Step VI
Significant value of planetary vorticity
Fig. 5.2. Real-time MJO-OLR forecast

82
CyClone Warning in india - Standard operation proCedure
(Coriolis force) ~5 degrees distance from Equator.
Tropical storm has been observed at 2.5° distance from equator sometimes also
Weak vertical shear of the horizontal winds
Upper level winds at 200/300 hPa (http://cimss.ssec.wisc.edu/tropic2/)
Wind Shear based on satellite observation is definedas follows.
Wind Shear = (150-300) hpa layer mean minus (700-925) hpa layer mean
Wind shear is c lassi f ied as follows:
5-10 kt : weak (favorable for development)
10-20 kt : moderate (unfavorable for weak system, or neutral for mature cyclone)
>20 kt : strong (unfavorable)
Goodupper level outflow
Models analysis
Good low level inflow
Models analysis
Low level winds data (Ocean Sat-II)
5.1.2. Tools to Use for Tropical Activity Daily Watch
VIS and IR geostationary animation over the last 24 hours
Superimposed with EIR in Dvorak colors
Observations data
Synergie Macro for each avalaible numerical models
SLP (Sea Level Pressure)
Absolute Vorticity at 850 hPa (only negative values) : measures the rotation of air over itself. A minimum of Ta850 shows deep convection organizing with circulation.
Low level winds (Favorable low level surges, or inflows,with tradewindor monsoon wind)
Upper level winds (200 hPa) : upperleveloutflows,highorridgesfavorable for good divergence, vertical wind sheared areas etc.
Internet data :
Scatterometry winds
Micro-wave imagery for developing lows
CIMSS maps (vertical wind shear, upper level divergence etc.)
MJO/OLR dry or enhanced convection phases.

83
monitoring and prediCtion teChnique
5.1.3. Methodology for Tropical Activity Daily Watch
(i) First step is rapid analysis of the tropical convective activity
Is it poor, moderate or strong?
What is its evolution during the last 24 hours?
Thedeepconvectionhasintensifiedor not (in geographical extension, in intensity, coldness of Cb’s top and in cyclonic organization)?
Comparison must be done with the days before at the same hours, to avoidtobeinfluencedbythediurnaleffect over ocean. Deep convection naturally intensifies(deepnessandextension) during the night, between 15 UTC and 02 UTC (maximum of deep convective activity at the end of the night, near 23 UTC-01UTC).
(ii) Whether existence of deep convection clusters since more than 24 hours?
(iii) Is there one (or several) associated low level circulation center(s) (LLCCs)? Estimation of their location, motion and intensity (MSLP and associated max mean winds) by :
Satellite imagery (classical and Micro-wave), scatterometry data, surface observations.
Estimation of their potential for intensification :
Numerical models forecasts
Analysis of the environment : SST, OLR,Windshear,lowlevelinflows,upper level outflows, Potential vorticity, Potential temperature
(iv) Estimation of the risk for development of a depression
No risk, risk poor, moderate, or high?
At least for the next 24 hours
Beyond, if possible :
If all the NWP models develop a significant low in the same areaand at the same range and show the formation of depression in 36-48 hrs : “for the next 24 hours, the risk for development of a Depression is poor, but it becomes moderate near…. for the next 36 to 48 hours”
If all the NWP models do not develop anything, in a dry phase of MJO : “there is no risk for development of a Depression during the next 3 days”
5.2. Monitoring of Cyclonic Disturbances (Depression and Above)
The cyclone monitoring and forecasting aims at providing information to the public and disaster management agencies on the following aspects:
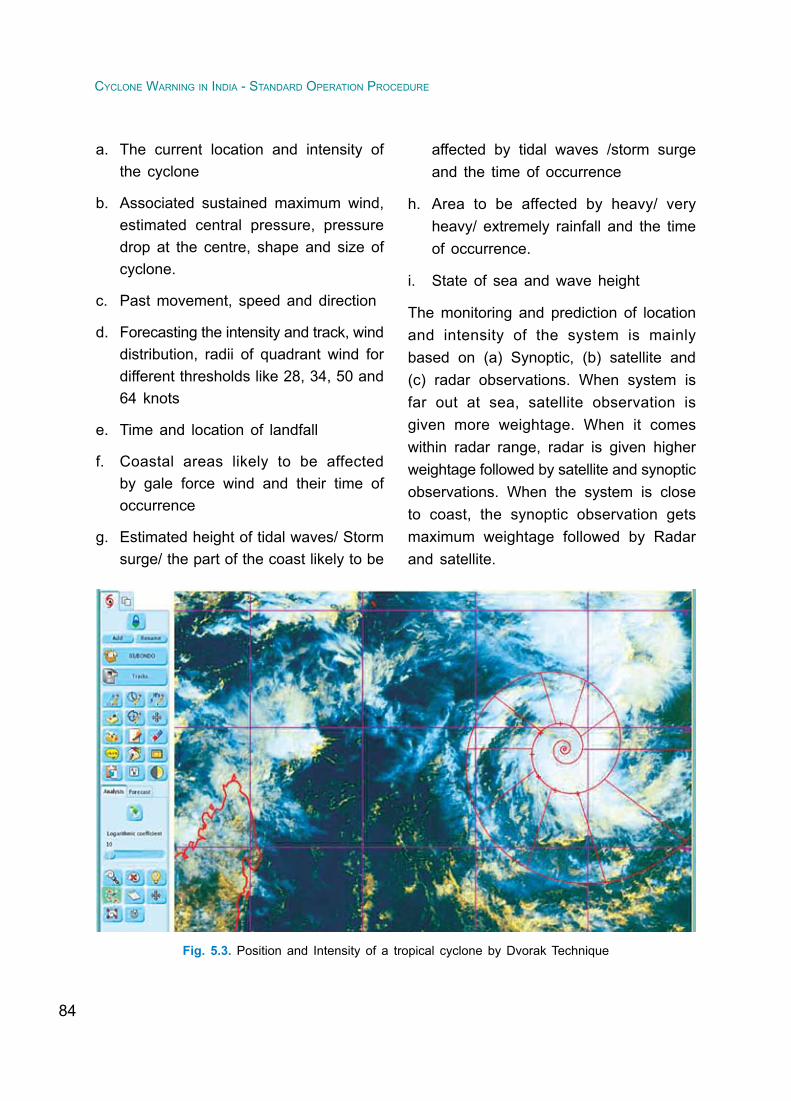
84
CyClone Warning in india - Standard operation proCedure
a. The current location and intensity of the cyclone
b. Associated sustained maximum wind, estimated central pressure, pressure drop at the centre, shape and size of cyclone.
c. Past movement, speed and direction
d. Forecasting the intensity and track, wind distribution, radii of quadrant wind for different thresholds like 28, 34, 50 and 64 knots
e. Time and location of landfall
f. Coastal areas likely to be affected by gale force wind and their time of occurrence
g. Estimated height of tidal waves/ Storm surge/ the part of the coast likely to be
affected by tidal waves /storm surge and the time of occurrence
h. Area to be affected by heavy/ very heavy/ extremely rainfall and the time of occurrence.
i. State of sea and wave height
The monitoring and prediction of location and intensity of the system is mainly based on (a) Synoptic, (b) satellite and (c) radar observations. When system is far out at sea, satellite observation is given more weightage. When it comes within radar range, radar is given higher weightage followed by satellite and synoptic observations. When the system is close to coast, the synoptic observation gets maximum weightage followed by Radar and satellite.
Fig. 5.3. Position and Intensity of a tropical cyclone by Dvorak Technique

85
monitoring and prediCtion teChnique
The average confidence level of locatingthe centre of the system over the NIO is about 50 km. It should , however, be borne in mind that in the case of relatively weaker system, the available radar and satellite pictures are much less decisive and it is more difficult to locate and estimate theintensity of the system.
There can be small differences in the location of the centres by the different methods, such as radar, satellite, synoptic observations etc. However, if the system isintenseandwelldefinedeyeisreportedby radar, then the radar center should be taken in view of its greater accuracy. Even here, several workers have reported systematic differences upto about 50 km between the eye seen in the radar and that reported by aircraft reconnaissance flight.
5.2.1. Synoptic Analysis
The analysis of synoptic observations is performed four times daily at 00, 06, 12, and 18 UTC. During cyclonic disturbances (depression and above intensity), synoptic charts are prepared and analysed every three hour to monitor the tropical cyclones over the north Indian Ocean. The centre of the cyclonic disturbance is synoptically definedasthepointof lowestpressure inthepressure fieldand the centroidof thecyclonic wind field. In the 10meter windfield, a perpendicular is drawn from thedirection of the wind. The meeting point of these perpendiculars determines the
centre of the disturbance. In case there are two or more meeting points, the centroid determines the centre of disturbance.
When the system comes closer to the coastline, the system location and intensity are determined based on hourly observations from CDR and DWR stations as well as coastal observatories. The AWS stations along coast are also very useful as they provide hourly observations on real time basis. The WVWV and CMV in addition to the conventional wind vectors observed by Radio Wind (RW) instruments are very useful for monitoring and prediction of cyclonic disturbance, especially over the Sea region.
A new weather analysis and forecasting system has been installed at IMD, New Delhi, which has the capability to plot and analyse different weather parameters, INSAT & radar imagery and NWP products using PC software known as SYNERGIE procured from Meteo France International (MFI). It has a tropical cyclone module, to deal with various aspects of cyclonic disturbance.
The direction and speed of the movement of a tropical cyclone are determined primarily from the three hourly displacement vectors of the centre of the system and by analyzing satellite imageries.
5.2.2. Satellite Analysis
Dvorak technique with its international algorithm has been the mainstay of

86
CyClone Warning in india - Standard operation proCedure
analysis, particularly of intensity of TCs. Cloud imageries from Geostationary Meteorological Satellites INSAT-3A and METSAT (KALPANA-1) are the main sources of information for the analysis of tropical cyclones over the data-sparse region of north Indian Ocean. Data from Ocean buoys also provide vital information. Ship observations are also used critically during the cyclonic disturbance period.
5.2.2.1.Position and Intensity of a Tropical Cyclone by Dvorak Technique
Dvorak Technique is basically a pattern recognition technique. The technique relies
on four distinct geographical properties that relate organized cloud pattern to cyclone intensity.Two are kinematic namely vorticity and vertical wind shear and the other two are thermodynamical viz. convection and core temperature. The strength and distribution of circular winds (by implication vorticity) in a cyclone organizes the cloud into the patterns that Dvorak relates to maximum sustained surface wind (MSW). External/environmental shear is a kinematic force that works to distort the vorticity and hence the cloud pattern. Dvorak found that degree of distortion was also related to maximum sustained wind.
Fig. 5.4. Model of tropical cyclone development used in Intensity analysis
T8 –890mb170kts
T7 –921mb140kts
T6 –940mb115kts
T5 –970mb90kts
T4 –987mb65kts
T3 –1000mb45kts
T2 –1009mb30kts
T1 –25kts
PRE STORM
TROPICAL STORM
HURRICANE
T0.5
T1.5
T2.5
T3.5
T4.5
T5.5
DAY 1
DAY 2
DAY 3
DAY 4
DAY 5DAY OFEXPECTEDMAXIMUMINTENSITY
TROPICAL CYCLONEDEVELOPMENT(A SATELLITE VIEW)
INTENSITYT-NUMBER

87
monitoring and prediCtion teChnique
Fig. 5.5(a). EIR analysis diagram for determining the Intensity. (b). Vis analysis diagram for determining the
Intensity
(a) EIR Analysis Diagram-2
(b) VIS Analysis Diagram-2
“Central Cold Cover” Pattern
“Central Cold (Dense) Cover” Pattern
Rules:WhenpastT-no. ≤T3,maintainmodel trend for 12hours; thenholdsame.WhenpastT-no. ≥T35holdT-no. same.Useas finalT-no. : thengo to Step 9.
Rules:WhenpastT-no. ≤T3,maintainmodel trend for 12hours; thenholdsame.WhenpastT-no. ≥T35holdT-no. same.Useas finalT-no. : thengo to Step 9.
*When hatched part of these patterns is white or colder, add .5 to pattern number.
When clouds cover is extremely small (<2½° lat). subtract 1 from pattern number.
PT 1.5±.5
PT 1.5±.5
PT 2.5
PT 2.5
CDD TYPE
1°
1°
1½° 1¾° 2½°
PT 3.5
PT 3.5
PT 4
PT 4
PT 5
PT 5
PT 6
PT 6
Determine past 24-hour trend. Is Development, Weakening, or Same indicated in a change of :(a) center or eye characteristics,
or(b) center’s involvement with
the cold overcast.
Determine past 24-hour trend. Is Development, Weakening, or Same indicated in a change of :(a) center or eye characteristics,
or(b) center’s involvement with
desnse overcast.
Determine Model Expected T-no. (MET).
Determine Model Expected T-no. (MET).
Determine pattern T-no. Select pattern in diagram that best matches your storm picture within one coloumn of the MET. Adjust MET ± .5 when indicated.
Determine pattern T-no. Select pattern in diagram that best matches your storm picture within one column of the MET. Adjust MET .5 when indicated.
T-no. Determination:
1. Use data T-no. from Step 2 when coloud features are clearcut
2. Use Pattern T-no. when DT is not clear and adjustment to MET is made.
3. For all other cases, use the MET.
T-no. Determination:
1. Use data T-no. from Step 2 when coloud features are clearcut
2. Use Pattern T-no. when DT is not clear and adjustment to MET is made.
3. For all other cases, use the MET.
Final T-number Constraints:1. Initial classificationmust beT1or
T1.5.2. During first 48hoursof
development, T-no. cannot be lowered at night.
3. 24 hrs after initial T1, storm’s T-no. must be <T2.5.
4. Final T-no. limits: <T4: change of 1/2 over 6 hrs. >T4: change of 1 over 6 hrs, T.5 over 12 hrs, 2 over 18 hrs. and 2.5 over 24 hrs.
5. Final T-no. must MET ±1.
Final T-number Constraints:
1. Initial classificationmust beT1orT1.5.
2. During first 48hoursofdevelopment, T-no. cannot be lowered at night.
3. 24 hrs after initial T1, storm’s T-no. must be <T2.5.
4. Final T-no. limits: <T4: change of 1/2 over 6 hrs. >T4: change of 1 over 6 hrs, T.5 over 12 hrs, 2 over 18 hrs. and 2.5 over 24 hrs.
5. Final T-no. must MET ±1.
Current Intensity (CI) Number Rules:
1. UseCI= finalT-no. exceptwhen finalT-no. shows changeto weakening trend, or when redevelopment is indicated.
2. For initial weakening, hold CI same for 12 hours, then hold CI ½ or 1 higher than T-no. as storm weakens.
Current Intensity (CI) Number Rules:
1. UseCI= finalT-no. exceptwhen finalT-no. shows changeto weakening trend, or when redevelopment is indicated.
2. For initial weakening, hold CI same for 12 hours, then hold CI ½ or 1 higher than T-no. as storm weakens.
24-Hr Forecast:
Extrapolate past trend unless one of the five rulesin the instructions applies.
24-Hr Forecast:
Extrapolate past trend unless one of the five rulesin the instructions applies.
3.
4.a.
a.
b.
b.
c.
c.
5.
6.
7.
3.
4.
5.
6.
7.
8. 9. 10.
8. 9. 10.
CURVED BAND TYPE
88
CyClone Warning in india - Standard operation proCedure
Both visible and IR imageries are used is Dvorak pattern recognition technique. Detailed methodology for determining the intensity is shown in fig. 5.4 and 5.5(a-b).
Dvorak Technique uses a scale from T1 to T8 in the interval of 0.5.
Thisclassificationof intensity isbasedontwo parameters arrived at on an analysis of the cloud features as seen in the satellite pictures of the disturbance. These are 1) thecentralfeatureswhichdefinethecloudsystem centre and its relation to dense overcast clouds (CF) and 2) the outer banding features (BF). The intensity of the tropical system is indicated by a code figure calledTNumberwhich is the sumof the central feature (CF) and banding features (BF).
In curved band pattern convection in the bands of outer core of the cyclone is used in pattern recognition by Dvorak Technique using satellite measured IR cloud temperature in the cyclone inner core. Dvorak Technique relates convective vigour to the intensity of the system.
In central dense overcast (CDO) pattern, size and temperature of the CDO dtermines the intensity. In shear pattern, the distance between the LLCC and the sharp boundary of the connective clud determines the intensity of the system.
In case of cyclones with eyes, the technique determines the temperature of the eye and the surrounding eye wall clouds using
IR data and relates to the intensity with warmer/cooler eye/wall cloud temperatures respectively indicating greater intensity.
Another feature of the technique is the Current Intensity number (C.I.) which relates directly to the intensity (in term of wind speed) of the cyclone. The C.I. number may differ from the T number on some occasions to account for certain factors which are not directly related to cloud features. The empirical relationship between C.I .number and the maximum wind speeds (according to Dvorak) are given in Table 5.1. Col. 3 of the Table 5.1 gives the pressure depths (peripheral pressure minus central pressure in hPa) as applicable for Indian Sea area using the relation Vmax = 14.2 X SQRT (Pn-Po).
The centre of the low level cyclonic circulation as evident from the low cloud lines is considered as the centre of the system. As during night the visible imagery is not available, the low cloud lines cannot be detected. As a result, the location of the centre during night time cannot be determined correctly. It is more so when it is a low intensity system like depression/cyclonicstorm.Whenthesystemintensifiesinto a severe cyclone with appearance of eye feature, the location of the centre becomes most accurate and it is the centre of the eye. The eye can be detected in both visible and IR imageries. Further in case of curved band pattern or CDO pattern centre can be more accurately determined compared to shear pattern. The centre

89
monitoring and prediCtion teChnique
determined by logarithmic spirals fittedto the curved band pattern determines the centre of the system. The centre of the CDO pattern similarly is taken as the centre of cyclone. The centre of low cloud lines is the only solution to determine the centre of cyclone in case of shear pattern and hence, the error in determining the location of the centre at night is maximum in case of shear pattern.
To overcome the above problems, the microwave imageries can be utilized. Microwave imageries at night can detect
the cloud features and hence the centre of cyclone as the microwave radiation can penetrate through the clouds associated with the cyclone. Example of determination of centre and intensity of the cyclone using logarithmic spirals in statellite imagery is shown in Fig.5.3
5.2.3. Radar Techniques for Fixing Centre and Intensity of Cyclone
Thetechniquesforfixingthecentreisgivenbriefly below to serve as a background
Table5.1.Dvorak’sclassificationof cyclonicdisturbances
C.I. Number Max. Wind Speed (MSW) (knots) Pressure drop (hPa)
1.0 25 3.1
1.5 25 3.1
2 0 30 4.5
2.5 35 6.1
3.0 45 10.0
3.5 55 15.0
4.0 65 20.9
4.5 77 29.4
5.0 90 40.2
5.5 102 51.6
6.0 115 65.6
6.5 127 80.0
7.0 140 97.2
7.5 155 119.1
8.0 170 143.3

90
CyClone Warning in india - Standard operation proCedure
material to the forecaster in interpreting the radar pictures, or sketches or RAREP messages received at the forecasting centers. The eye or the centre of the cyclone can be derived from a continuous and logical sequence of observations. The geometric centre of the echo-free area will be reported as the eye location. If the wall cloud is not completely closed, it is still usually possible to derive an eye locationwithahighdegreeofconfidenceby sketching the smallest circle or oval that can be superimposed on the inner edge of the existing portion of the wall cloud. When the wall cloud is not developed fully but a centreofcirculationisidentifiable,thenthisfeature should be observed and reported similar to the eye. When the eye or centre is indistinct or outside the range or the radar beam overshoots the inner eyewall when it does not extend very high, spiral band overlays are used to estimate the location of the centre. Use of logarithmic spirals has been described in detail in the Appendix II of Chapter 5 of instructions for Cyclone Detection Radar stations in I. Met. D. Weather Radar Observations Manual – 1976. At times, instead of fully closed eye, only an arc of an eye wall may be seen which is reported as open eye.
Information on various characteristics of the eye wall cloud and changes thereof, is often useful to the meteorologist in assessing the intensity of the cyclone.
Thus the decrease in size of a closed eye with time is usually an indication of intensification.Changesinthedefinitionofthe eye wall, improvement in its symmetry, the angle of arc visible, the radar echo intensity and the heights of echo tops in the eye wall are usually associated with changes in intensity of the storm.
Hence when an eye is seen on radar, the radar meteorologist should try to give as much information as possible on the above parameters. When the wall cloud is within a range of 200 km from the radar, the echo intensity and the echo top heights at various points should also be objectively evaluated using the isoecho/attenuator facilities and the RHI scope and applying necessary corrections. The information may be included in the appropriate code in the radar reports. Wherever necessary, additional information in plain language can be given. The polar diagrams may also be annotated to give this information.
This information should however be used with caution by the forecaster. There can be appreciable measurement errors in echo heights and intensities. The changes in anyone parameter may be only poorly correlated with storm intensity. There can also be considerable time-lag between the observed changes in eye characteristics and the changes in the winds and pressure associated with the system.

91
monitoring and prediCtion teChnique
5.3. Characteristics of Cyclonic Disturbance
5.3.1. Maximum Wind
Maximum wind is determined basically from Dvoark’s technique. However the following technique is followed for better accuracy:
1. Wind reported by ships and buoys.
2. Wind observed by scatteometry i.e. OCEANSAT & ASCAT.
3. Radar
4. CMV/ AMV reduced to 10 meter wind
5.3.2. Estimated Central Pressure (ECP)
Estimated Central Pressure is derived basically by Dvorak’s technique as given in Table 5.1. Also the pressure reported by ship, buoy, coastal/island observation is taken into consideration.
5.3.3. Pressure Drop ∆P
Pressure drop at the centre is given by difference of central pressure and pressure of outermost closed isobar.
∆P = Pressure of Outer most closed isobar (Po) - Central pressure (Pc)
Relation between maximum wind and pressure drop is given by:
Vmax = 14.2 X Sqrt (∆P)
From the value of Vmax, ∆P is calculated. Once ∆P and Po are known, Pc can be
calculated. The Table 5.1 can be used to calculate Vmax and ∆P.
5.3.4. Radius of Maximum Wind (RMW)
There is no direct observation of Radius of Maximum Wind (RMW). It is the distance of location of maximum wind from the centre of the cyclone. It is estimated from maximum wind and place of occurrence as discussed above. In addition RMW can be calculated from satellite and radar. In radar the radius of maximum reflectivity is considered asRMW. In satellite the radius of maximum reflectivityinvisibleimageryandtheradiusof lowest cloud temperature in IR imagery is considered as RMW. In the absence of reliable observations climatology may be referred to estimate RMW.
5.3.5. Heavy Rain
Realised heavy rain can be analised from (1) Actual observations. (2) Quantitative Precipitation Estimate (QPE) from satellite (3) Surface Rainfall Intensity (SRI) from Radar. (4) Tropical Rainfall Measurement Mission (TRMM). The distribution and intensity of rainfall is described as given in Table 5.2 and 5.3 respectively.
5.3.6. State of Sea
State of sea is described in bulletin in qualitative terms as given in Table 5.4. The sea condition is described based on the prevailing wind condition. Though it is qualitative, it corresponds to the height of

92
CyClone Warning in india - Standard operation proCedure
the wave as mentioned in the table. Further
the sea condition may be analised based
on NWP models. The following websites
should be followed for this purpose.
1. INCOIS: http://www.incois.gov.in
2. NCMRWF: http://www.ncmrwf.gov.in/
3. ECMWF: http://www.ecmwf.int
Table 5.2. Distribution of rainfall
Distribution No. Of places Description
Isolated One or two places <25% of area gets rainfall
Scattered A few places (26 –50)% of area gets rainfall
Fairly Widespread Many places (51 – 75)% of area gets rainfall
Wide Spread Most places (76 – 100)% of area gets rainfall
Table 5.3. Intensity of rainfall
Descriptive term used Rainfall amount in mm
No rain 0.0
Very light rain 0.1- 2.4
Light rain 2.5 – 7.5
Moderate rain 7.6 – 35.5
Rather heavy 35.6 – 64.4
Heavy rain 64.5 – 124.4
Very heavy rain 124.5 – 244.4
Extremely heavy rain 244.5 or more
Exceptionally heavy rain When the amount is a value near about highest recorded rainfall at or near the station for the month or season. However, this term will be used only when the actual rainfall amount exceeds 12 cm.
5.4. Prediction of Characteristics of Cyclonic Disturbances
Following elements are predicted.
(i) Track
(ii) Intensity (Maximum wind)
(iii) Radius of maximum wind

93
monitoring and prediCtion teChnique
(iv) Radii of 28, 34, 50 and 64 knots wind in four quadrants
(v) Heavy rainfall (Time of occurrence, area of occurrence, intensity)
(iv) Squally/Gale wind at the time of landfall (Time of occurrence, area of occurrence, intensity)
(vii)Storm surge (Time of occurrence, area of occurrence, height and area to be inundated)
5.4.1. TC Analysis Tools and Techniques
Various kinds of analytical procedure are described in Cyclone Manual (IMD, 2003). A systematic check list is prepared for identification of location and intensity ofTC and also for the prediction of track and intensity. The procedure necessarily deals
with determination of location and intensity along with other characteristics of the TC like associated sustained maximum wind, estimated central pressure and pressure drop at the centre, shape and size, radius of outermost closed isobar, point and time of landfall, if any or area of dissipation etc. with the available observations in the storm region.
To ensure the availability of the data and forecast products from various national and international sources at Cyclone Warning Division, IMD, New Delhi, an institutional mechanism has been developed in consultation with all the stake holders.
The TC analys is , pred ic t ion and decision-making process is made by blending scientifically based conceptualmodels, dynamical & statistical models,
Table 5.4. Sea Condition
Descriptive Term Height in metres Wind Speed in Knots (kmph) Beaufort Scale
Calm (glassy) 0 0 0
Calm (rippled) 0 - 0.1 1 - 3 (2 - 6) 1
Smooth (waveless) 0.1 - 0.5 4 - 10 (7 - 19) 2 - 3
Slight 0.5 - 1.25 11 - 16 (20 - 30) 4
Moderate 1.25 - 2.5 17 - 21 (31 - 39) 5
Rough 2.5 - 4.0 22 - 27 (41 - 50) 6
Very rough 4.0 - 6.0 28 - 33 (52 - 61) 7
High 6.0 - 9.0 34 - 40 (63 - 74) 8
Very high 9.0 - 14.0 41 - 63 (76 - 117) 9 - 11
Phenomenal Over 14 64 or above (119 or above) 12

94
CyClone Warning in india - Standard operation proCedure
Fig. 5.6. Utility of modernised cyclone analysis and forecasting system
meteorological datasets, technology and expertise. Data from conventional observational network, AWS, buoy & ship observations, cyclone detection radars and satellites are used for this purpose. A weather analysis and forecasting system in a digital environment is used to plot and analyse different weather parameters, satellite, Radar and numerical weather prediction (NWP) model products. The manual synoptic weather forecasting has been replaced by hybrid systems in which synoptic method could be overlaid on NWP models supported by modern graphical and GIS applications to produce high quality analyses and forecast products. The automation of the process has increased the efficiency of system, visibility of IMDand utility of warning products. The TC Module installed in this forecasting system has the following facilities.
Analysis of all synoptic, satellite and NWP model products for genesis,
intensity and track monitoring and prediction
Preparation of past and forecast tracks upto 120 hrs
Depiction of uncertainty in track forecast
Structure forecasting (Forecast of wind in different sectors of cyclone)
A few examples on the products of TC Module are shown in Figure 5.6. However all the data are not still available in TC Module through synergie system. For better monitoring and prediction, additional help is taken of ftp and websites to collect and analyse:
Radar data and products from IMD’s radar network and neighbouring countries
Satellite imageries and products from IMD and international centres
95
monitoring and prediCtion teChnique
Data, analysis and forecast products from various national and international centres
5.4.2. Cyclone Track Forecasting
Currently following methods are used by IMD for TC track forecasting.
i) Statistical Techniques
Analogue
Persistence
Climatology
Climatology and Persistence (CLIPER)
Chaos theory and Generic Algorithm method) developed by Indian Space Research Organisation (ISRO)
ii) Synoptic Techniques – Empirical techniques
iii) Satellite Techniques- Empirical techniques
iv) Radar Techniques- Empirical techniques
v) NWP Models
Individual models (Global and regional)
IMDGFS (382, 574), ARP (Meteo-France), ECMWF, JMA, UKMO, NCEP, WRF (IMD, IITD, IAF), HWRF (IMD), Quasi-Lagrangian model (QLM)
Multimodel ensemble (MME)-(IMD) and MME based on TC Module (TCM)
Ensemble prediction system (EPS) (Strikeprobability,Locationspecificprobability) based on GFS, UKMO, ECMWF models etc.
TIGGE EPS products
Following NWP products from deterministic models are considered useful for cyclone warning apart from track and intensity forecast.
Analysedandforecastgridpointfieldsof basic flow variables at different pressure levels:
Sea level pressure
Geopotential
Wind
Temperature
Humidity
Forecast rainfall
Derived fields :
Vorticity
Divergence
Vertical motion
Integratedmoisture fluxdivergence
Precipitable water
Vertical wind shear
Equivalent potential temperature and its lapse rate.

96
CyClone Warning in india - Standard operation proCedure
Convective Available Potential Energy (CAPE) and Convective Inhibition Energy (CINE)
Apart from the above models, the model products from INCOIS/NCMRWF and storm surge models of IIT, Delhi are considered for wave forecasting and storm surge prediction. Examples of track prediction by individual models in case of TC, Rashmi and EPS product in case of TC, Jal are ashown in Fig.5.7(a) and Fig.5.7(b) respectively.
Unlike National Hurricane Centre (NHC), USA, IMD does not use the interpolated track forecasts from the late models. All
the NWP models as mentioned above except QLM are late models as the model output is available to forecasters as late as six to twelve hrs. The QLM is a near real time model and the statistical models like CLIPER and ISRO model are real time models. Similarly all the NWP models as mentioned above do not use synthetic vortex and vortex relocation. While QLM, NCEP use synthetic vortex, global model like ECMWF does not use these processes.
In the synoptic method, prevail ing environmental conditions like wind shear, low to upper level wind and other characteristics
Fig. 5.7 (a). Track prediction of TC, RASHMI by NWP models
TRACK PREDICTION BY NWP MODELS BASED ON 00UTC OF 25-10-2008
26N
24N
22N
20N
18N
16N
82E 84E 86E 88E 90E 92E 94EOBSJMA ECMWF T254 UKMO
MM5
2700
27002800
27002700
27002700
27002800
2800
2500
25002500
2500
2500
250025002500
2502
2802
28002800
28002800
2600
2700
2800
GFS QLM

97
monitoring and prediCtion teChnique
Fig. 5.7 (b). Track prediction of TC, JAL by EPS
as mentioned in cyclone manaual and check list (IMD, 2003) are considered. All these fields in the NWP model analysesand forecasts are also considered. The development of characteristic features in satellite and radar observations is also taken into consideration for predicting the track. While, the synoptic, statistical and satellite/radar guidances help in short range track forecast (upto 12 hrs), the NWP guidance is mainly used for 24-72 hr forecasts. Hence, the RSMC forecast tracks result from a manually analyzed
forecasting process, which relies on output from several NWP models (RSMC, 2010) as discussed above. Consensus forecasts that gather all or part of the numerical forecast tracks and uses synoptic and statistical guidance are utilised to issue official forecast.
IMD introduced the objective TC track forecast valid for next 24 hrs over the NIO in 2003. It further extended the validity period upto 72 hrs in 2009. The track forecast has been issued by RSMC, New
JAL JAL30N 30N
0.9
0.8
0.7
0.6
0.5
0.4
0.3
0.2
0.1
0
240
216
192
168
96
144
72
48
24
0
120
25N 25N
20N20N
15N15N
10N10N
5N
5N
EQ
EQ
60E
60E
65E
65E
0.05 0.2 0.4 0.6 0.870E
70E
75E
75E
80E
80E
85E
85E
90E
90E
95E
95E
ECMWF ECMWF ECMWF
Strik
e Pr
obab
ility
(Bar
)
Distance to TC (Lines) in km
NELLORE(INDIA)0 3 6 9
00Z6NOV2010
00Z7NOV
00Z8NOV
00Z9NOV
00Z10NOV
122 122 122 122
12 15 18 21 24 27 30 33 36 39 42 45 48 51 54 57 60 63 66 69 72 73 76 81 84 87 90 93 942010110600 INIT 2 0 1 0 11 0 6 0 0 I N I T
JAL JAL30N 30N
0.9
0.8
0.7
0.6
0.5
0.4
0.3
0.2
0.1
0
240
216
192
168
96
144
72
48
24
0
120
25N 25N
20N20N
15N15N
10N
10N
5N
5N
EQ
EQ
60E
60E
65E
65E
0.05 0.2 0.4 0.6 0.870E
70E
75E
75E
80E
80E
85E
85E
90E
90E
95E
95E
UKMO NCEP ECMWF
Strik
e Pr
obab
ility
(Bar
)
Distance to TC (Lines) in km
CHENNAI(INDIA)0 3 6 9
00Z6NOV2010
00Z7NOV
00Z8NOV
00Z9NOV
00Z10NOV
122 122 122 122
12 15 18 21 24 27 30 33 36 39 42 45 48 51 54 57 60 63 66 69 72 73 76 81 84 87 90 93 94
2010110600 INIT 2 0 1 0 11 0 6 0 0 I N I T
JAL JAL30N 30N
0.9
0.8
0.7
0.6
0.5
0.4
0.3
0.2
0.1
0
240
216
192
168
96
144
72
48
24
0
120
25N 25N
20N20N
15N15N
10N
10N
5N
5N
EQ
EQ
60E
60E
65E
65E
0.05 0.2 0.4 0.6 0.870E
70E
75E
75E
80E
80E
85E
85E
90E
90E
95E
95E
NCEP UKMO ECMWF
Strik
e Pr
obab
ility
(Bar
)
Distance to TC (Lines) in km
SHAR(INDIA)0 3 6 9
00Z6NOV2010
00Z7NOV
00Z8NOV
00Z9NOV
00Z10NOV
122 122 122 122
12 15 18 21 24 27 30 33 36 39 42 45 48 51 54 57 60 63 66 69 72 73 76 81 84 87 90 93 94
2010110600 INIT 2 0 1 0 11 0 6 0 0 I N I T
Ensemble track forecast of cyclone JAL

98
CyClone Warning in india - Standard operation proCedure
Delhi from deep depression stage onwards since 2009 for 12, 24, 36, 48, 60 and 72 hr forecast periods. The TC forecast is issued 6 times a day at the interval of three hours, i.e. based on 00, 03, 06, 09, 12, 15, 18 and 21 UTC observations. The forecasts are issued about three hours after the above mentioned observation time. An example of the product during cyclone Nilam is shown in Figure 5.8. It may be mentioned that the RSMC, Tokyo introduced 24 hr objective forecast in 1982, 48 hr forecast in 1988, 72 hr forecast in 1997 and 96 & 120 hr forecast in 2009 for northwestPacificOcean.Similarly,National
Hurricane Centre and RSMC, Miami, USA introduced 24 hr objective forecast in 1954, 48 hr forecast in 1961, 72 hr forecast in 1972 and 96 & 120 hr forecast in 2001 for Atlantic Ocean. Prior to 2003, the TC forecasts issued by IMD for the NIO were subjective and textual in form without mentioning expected location of the TC in 12 and 24 hr forecast period.
5.4.3. Cone of Uncertainty in Track Forecast
The “Cone of Uncertainty (COU)”-also known colloquially as the “cone of death,” “cone of probability,” and “cone of error”-
Fig.5.8. Observed and forecast track of Cyclonic Storm NILAM with cone of uncertainty
Forecast and Observed Track of Cyclonic Storm, NILAM based on 1200 UTC of 31 October 2012
DATE/TIME: IN UTC IST = UTC + 0530 HRS
D : DepressionDD : Deep DepressionCS : Cyclonic Storm
D
DDD
DD
DDDD DD
DD
01/00
31/18
31/12NILAM
31/09
31/06
31/03
31/00
30/18
30/12
30.29/18 29/12 29/06
29/03 29/00 29/18 28/12 28/06
75E 80E 85E 90
10N
NILAM
CSCS
CS
Area of intense convection
OBSERVED TRACKFORECAST TRACKCONE OF UNCERTAINTY IN TRACK FORECAST
15N

99
monitoring and prediCtion teChnique
represents the forecast track of the centre of a TC and the likely error in the forecast track based on predictive skill of past years. Most World meteorological Organisation (WMO) designated RSMCs for TCs including Miami, Florida; Tokyo, Japan; and Hawaii, USA and TC Warning Centers (TCWCs) currently display COU aroundtheirofficialtrackforecasts,usingaclimatological method based on their area of responsibility. For each forecast lead time, an uncertainty circle is built whose radius is taken as a fixed quantile (e.g.,67% for Miami, 70% for Tokyo) of the distribution of direct position error (DPE) computed over several previous seasons. The Joint Typhoon Warning Centre (JTWC) in Hawaii produces COU for TCs over Pacific Ocean and Indian Ocean, whoseradii are the sum of the climatological average DPE and the predicted 34-knot wind radius.
The COU in the forecast has been introduced with effect from the cyclone, ‘WARD’ during December, 2009. It is helpful to the decision makers as it indicates the standard forecast errors in the forecast for different periods like 12, 24, 36, 48, 60 and 72 hrs. The radii of circles used to construct the COU are 75, 150, 200, 250, 300 and 350 km respectively for 12, 24, 36, 48, 60 and 72 hrs forecasts based on past average errors of officialforecasts for 12 and 24 hrs forecast and of QLM for 36-72 hr forecasts. It is found that the observed track lies within the
forecast COU in about 60% of the cases. It is in agreement with those over other Ocean basins. The entire track of the TC remains within the COU roughly 60-70% of the time over the northern Atlantic Ocean andPacificOceans.
5.4.4. Intensity Forecasting
The intensity forecast has been issued by RSMC, New Delhi from deep depression stage onwards since 2009 for 12, 24, 36, 48, 60 and 72 hr forecast periods. It has been issued during CS stage onwards during 2003-2008 and for 12 and 24 hrs forecast periods only. The TC intensity forecast is issued 4 times a day at the interval of six hours, i.e. based on 00, 06, 12 and 18 UTC observations valid upto 24 hrs during 2003-2008 and upto 72 hrs since 2009 in every three hourly intervals. The forecasts are issued about three hours after the above mentioned observation time. Following methods are used by IMD for intensity forecasting of TCs over the NIO.
i) Statistical Techniques
a. Analogue
b. Persistence
c. Climatology
ii) Synoptic Technique – Empirical Techniques
iii) Satel l i te Technique – Empir ical technique
iv) Radar Techn ique – Emp i r i ca l

100
CyClone Warning in india - Standard operation proCedure
technique
v) NWP Models
• Individual models (Global andregional)
• IMDGFS (382, 574),ARP (Meteo-France), ECMWF, JMA, UKMO, NCEP
• WRF (IMD, IITD, IAF), HWRF(IMD)
vi) Dynamical Statistical Model (Statistical Cyclone Intensity Prediction-SCIP).
5.4.4.1. Statistical Dynamical Model for Cyclone Intensity Prediction
A statistical-dynamical model for cyclone intensity prediction (SCIP) has been implemented for real time forecasting of 12 hourly intensity upto 72 hours. The model parameters are derived based on model analysis fields of past cyclones.The parameters selected as predictors are: Initial storm intensity, Intensity changes during past 12 hours, Storm motion speed, Initial storm latitude position, Vertical wind shear averaged along the storm track, Vorticity at 850 hPa, Divergence at 200 hPa and Sea Surface Temperature (SST). For the real-time forecasting, model parameters arederivedbasedontheforecastfieldsofECMWF model. The method is found to be promising for the operational use.
There is no CLIPER model for intensity prediction unlike the Atlantic and Pacificbasins. In the synoptic method, prevailing
environmental conditions like wind shear, sea surface temperature, Ocean thermal energy,lowlevelinflow,upperleveloutflowetc as mentioned in the section 5.1.1 for genesis are considered for intensificationalso. All these fields in the NWP modelanalysis and forecasts are also considered. The development of characteristic features in satellite and radar observations is also taken into consideration for predicting the intensity. While, the synoptic, statistical and satellite/radar guidances help in short range intensity forecast (upto 12/24 hrs), the NWP guidance is mainly used for 24-72 hr forecasts. Hence, the RSMC, New Delhiofficialforecastintensityresultsfroma manually analyzed forecasting process, which relies on output from several NWP models as mentioned above. Consensus forecasts that gather all or part of the numerical forecast intensities and uses synoptic and statistical guidance are utilised to issueofficial forecast.
5.4.5. Quadrant Wind Forecasting
The TC wind radii forecasts are generated in terms of the radii of 34kts, 50kts and 64kts (1kt = 0.52 ms-1 or 1.85 kmph) winds in four geographical quadrants around the TC (thereafter referred to individually as R34, R50 and R64 for 34kts, 50kts and 64kts wind thresholds respectively or collectively as wind radii in units of nautical miles (1nm=1.85km)). These wind radii represent the maximum radial extent of winds reaching 34kts, 50kts and 64kts in

101
monitoring and prediCtion teChnique
each quadrant. The initial estimation and forecast of the wind radii of TC is rather subjective and strongly dependent on the data availability, climatology and analysis methods. The subjectivity and reliance on climatology is amplified in NIO in theabsence of aircraft observations. However, recently with the advent of easily accessible remote sensing derived surface and near surface winds (e.g. Ocean Sat., Special Sensor Microwave Imager (SSMI), low level atmospheric motion vectors and Advanced Microwave Sounder Unit (AMSU) retrival methods) and advances in real time data analysis capabilities, IMD introduced TC wind radii monitoring and prediction product in Oct.,2010. The inputs for monitoring are obtained from following observations
Ship
Buoy
OceanSat.
Lower level Atmospheric Motion Vectors
Cloud Motion Vectors
Water vapour based wind vectors
Special Sensor Microwave Imager (SSMI) data
Advanced Microwave Sounder Unit (AMSU)
Latest advances in real time data analysis capabilities
DWR(when system is within the radar range
Coastal wind observations
The initial wind radii estimates have become less subjective due to the tools and products mentioned above. While better initial estimates of R34, R50 and R64 are becoming available, forecasting thesewindradiiremainsadifficult task.Itis mainly because of the fact that we do not have any objective wind radii forecast methods and current NWP models fail to produce forecasts that are better than climatology.
The road map for monitoring and prediction of quadrant wind radii is given below.
(a) Date and time of initial condition
(b)OfficiallocationandIntensity(T/C.I.No.,maximum wind and centre position)
(c) Initial TC wind radii estimation
Wind radii based on Oceansat/ASCAT/Windsat wind
SSMI based wind radii
Wind radii based on lower level atmospheric motion vectors
Wind radii by AMSU retrieval method
Wind radii based on global and regional NWP model analyses
Wind radii based on DWR wind retrieval
Value addition based on coastal, ship and buoy observations
Climatological consideration
(d)Official forecast of TC intensity andtrack upto 72 hrs.

102
CyClone Warning in india - Standard operation proCedure
(e) Persistence forecast based on initial wind radii and past 12 hrs trend.
(f) Climatological forecast of TC wind radii.
(g) NWP Model forecasts of 10 metre wind radii
Select the model most appropriate to initial condition
Comparethewindfielddistributionto the actual wind
Calculate the wind radii in four quadrants for the threshold of 34kts, 50kts and 64kts surface wind
Make corrections based on actual
wind, climatology, intensity of the system and radius of maximum wind
(h)Official TC wind radii forecast in fourquadrants for the threshold of 34kts, 50kts and 64kts based on S.N. (b-g)
A typical example of the quadrant wind radii product is shown in Fig.5.9.
5.4.6. Prediction of Heavy Rainfall
The following are the parameters for prediction of rainfall
Time of commencement
Duration
Fig. 5.9. A typical graphical presentation of quadrant wind forecast during cyclonic storm GIRI

103
monitoring and prediCtion teChnique
Area
Intensity
The followings are the methods for prediction of heavy rainfall
Synoptic method
Climatology method
Satellite method
Radar technique
NWP technique
Typical rainfall prediction by NWP model in association with cyclone Phyan is shown in Fig. 5.10. While NWP technique provides prediction for different lead period, Satellite and radar provides quantitative precipitation estimates during past 3/12/24 hrs. The intensity and spatial distribution of rainfall estimated by satellite and radar are extrapolated to issue forecast. In synoptic and climatology method, synoptic
climatology of rainfall, intensity and spatial distribution are used. In this method the forecast depends on the expertise of the forecaster. The final forecast is theconsensus arrived from various methods as mentioned above.
5.4.7. Prediction of Gale Wind at Landfall
The followings are the parameters for prediction of gale wind
Time of commencement
Duration
Area
Intensity
The following methods are utilised for prediction of gale wind
Synoptic method
Fig. 5.10. Typical rainfall prediction by NWP model
ECMWF 48 Hr. RAINFALL (mm) FORECAST based on 00 UTC 10-11-2009 valid for 00 UTC of 12-11-2009
ECMWF 24 Hr. RAINFALL (mm) FORECAST based on 00 UTC 10-11-2009 valid for 00 UTC of 11-11-2009
200
130
70
40
20
10
1
40N
35N
30NDe
25N
20N
15N
10N
5N
40N
35N
30N
25N
20N
15N
10N
5N
EQ EQ60E 60E
(Background does not depict political boundary) (Background does not depict political boundary)
65E 65E70E 70E75E 75E80E 80E85E 85E90E 90E95E 95E100E 100E
De

104
CyClone Warning in india - Standard operation proCedure
Climatological method
Satellite method (T number, region of maximumreflectivityandmesoscalevortices)
Radar technique (Uniform wind technique, PPV2 and Radial Velocity)
NWP technique (10 meter wind forecast)
Dynamical statistical model
In the satellite method region of maximum reflectivity and mesoscale vortices are assumed to be associated with higher wind. In radar technique, the direct wind observation are available though uniform IMD technique, PPV2 product and radii velocity measurements. The wind estimates from satellite and radar and other observations are extrapolated to forecast the wind. Maximum sustained wind are also available from other sources like Scatteometry wind (Oceansat, Wind sat, ASCAT), Buoy and Ship apart from that estimated by Dvorak technique.
Though the wind forecasts by the models are mostly underestimated, the initial condition of wind from the model can be corrected based on actual observations and accordingly model forecast wind can be derived. The forecast based on dynamical statistical model also can be utilised in the similar manner.
5.4.8. Storm Surge
The followings are the parameters for prediction of storm surge.
Time of commencement
Duration
Area
Intensity
The followings are the methods used for prediction of storm surge
IMD Nomogram (Ghosh model)
IIT Delhi Model
Probable maximum storm surge
Nomogram and IIT Delhi model are used to calculate the storm surge. The probable maximum storm surge should be referred while issuing storm surge forecast for comparison.
5.4.8.1. Nomograms
Ghosh model nomograms are based on the numerical solution to the hydrodynamical equations governing motion of the Sea. The nomograms are prepared relating peak surge with various parameters such as pressure drop, radius of maximum wind, vector motion of the cyclone and offshore bathymetry.
5.4.8.2. IIT Delhi Storm Surge Model
The dynamical model of IIT Delhi is fully non-linear and is forced by wind stress and quadratic bottom friction following the method of numerical solution to the

105
monitoring and prediCtion teChnique
vertically integrated mass continuity and momentum equations. The updated version of the model currently in operational use covers an analysis area lying between lat. 2.00 N and 22.250 N and long. 65.00
E & 100.00 E. The meteorological, hydro-dynamical and bathymetry parameters are the inputs for this model.
The method uses a conditionally Table semi-implicit finite difference stair stepscheme with staggered grid for numerical solution of the model equation. The bottom stress is computed from the depth-
integrated current using conventional quadratic equation. The bathymetry of the model is derived from Naval Hydrographic charts applying cubic spline technique. The storm surge models developed by IIT, Delhi (IITD) for different Panel member countries have been installed at RSMC, New Delhi. It is providing storm surge guidance to member countries in tropical cyclone advisory bulletin since April, 2009. An example of storm Surge Prediction by IITD model is shown in Fig. 5.11. The storm surge prediction is largely dependent on
Fig. 5.11. Typical storm surge prediction by IITD model in case of VSCS ‘THANE’

106
CyClone Warning in india - Standard operation proCedure
the predicted characteristics of the cyclones like, track, intensity and point of landfall.
5.5. Check List for Decision Making
The very process of the detection and forecasting of the cyclonic storm should be made logical, all technical features should be identified and given due placein reaching conclusions so that no snap decisions based on preconceived notions are taken. The conclusions should be arrived at step by step. It is essential therefore that a check list for decision making should be devised and the forecaster meticulously fills in all the technical details available and skillfully draws conclusions.
The check list should be prepared for all steps of cyclone monitoring and prediction as mentioned below.
Genesis
Monitoring of location shape, size, intensity and wind distribution
Forecast location, intensity, movement, wind distribution and sea conditions.
Landfall processes
Heavy rain
Gale wind
Storm surge
The detailed check list for this purpose is given below. For further details about the physical features, the Forecasting Manual/Cyclone Manual can be referred to.

107
monitoring and prediCtion teChnique
Check list for monitoring and prediction of CDs over the North Indian Ocean
Dated………………... Time……………............
1. Satellite features :
Convection
a. Region and intensity of convection
b. Cloud Top Temperature
c. Current organisation of convection (Convective cloud
cluster/ Low Level Circulation/ Vortex)
d. If it is a vortex, location and intensity of vortex
e. Tendency of organization :
f. Number of days the convection is persisting as
i. Cloud cluster
ii. Low level circulation
iii. Vortex (T1.0, T1.5)
2. Mean sea level pressure (MSLP)
Central pressure: …....................... Outer most closed isobar Pressure:….....................
Radiusof outermost closed isobar…….........….Pressuredeficit…………....................
No. of closed isobar (within 6 deg):
Shape of isobar (circular/elliptical)…………, Size of the system (lat./long.)…………......
3. Number of days the low pressure area is persisting :………………................................
4. Region of occurrence of low pressure area :…………………...........................................
5. 24 hrs pressure change …………………...........................................................................
a. General description :……………...................................................................................
b. Maximum fall and station/buoy : …………………........................................................
6. Pressure departure from normal
a. General description :………………................................................................................
b. Maximum negative departure and station…………………............................................

108
CyClone Warning in india - Standard operation proCedure
7. Circulation: ………………….................................................................................................
a. Vertical extension : ……………….................................................................................
b. Tilting ……………….........................................................………………….....................
c. Wind speed (sector):west/ east/ north/ south …………………....................................
Surface ……………...., 0.9 km amsl………………......…,1.5 km amsl.......................
d. Maximum wind
Surface…………….., 0.9 km amsl ……………….........................................................
e. Region of occurrence of maximum wind
Surface……………………….................., 0.9 km amsl ………………….......................
f. Distance of maximum wind from centre of circulation at
Surface ……………………...........................................................................…………..
Lower level ……………………...................................................................................…
8. Upper Tropospheric Ridge (200 hPa level) position :………………..................................
9. Location of upper tropospheric anti-cyclonic circulation :…………………..........................
10. Location of upper Tropospheric Westerly Trough (Latitude and Longitude)………..........
11. (a)- SST (based on satellie, buoy and ship observation) :……………............................
(b)- Ocean thermal Energy :-………………........................................................................
12. Rainfall/QPE
a. Rainfall during past 12 hrs (Maximum value and region of occurrence) ……..........
b. Rainfall during past 24 hrs (Maximum value and region of occurrence) ……..........
c. Tendency (Increasing/decreasing) :……………….........................................................
13. OLR :
a. Daily mean (Maximum value and region of occurrence) :………………….................
b. 3 hourly mean (Maximum value and region of occurrence) :………………...............
c. Tendency (Increasing/decreasing) : …………………...................................................

109
monitoring and prediCtion teChnique
14. Cloud : ………………….........................................................…………………...................
15.Significantweather (Thunderstorm/squall report) :…………………..................................
16.AnyotherlowpressuresysteminneighbourhoodincludingsystemsinNothwestPacificOcean and south Indian Ocean
a. Location ....…………….........................................................…………….......................
b. Intensity …………….........................................................………………........................
c. Tendencyofintensification(Intensifying/weakening)…………………............................
d. Movement : ………………….........................................................................................
17. Lower level convergence :
a. Maximum value and region of occurrence : …………................................................
b. Convergence in forward sector ………….....................................................................
c. Tendency during past 06/12/24 hrs ……………………................................................
18. Upper level divergence :
a. Maximum value and region of occurrence : …………….............................................
b. Divergence in forward sector ………………….............................................................
c. Tendency during past 06/12/24 hrs …………………...................................................
19. Lower level vorticity
a. Maximum value and region of occurrence) :…………….............................................
b. Vorticity in forward sector ……………….......................................................................
c. Tendency during past 06/12/24 hrs …………………...................................................
20. Vertical wind shear
a. Minimum value and region of occurrence) :………………….......................................
b. Wind shear in forward sector ………………………......................................................
21. Wind shear tendency
a. Minimum value and region of occurrence :…………………….....................................
b. Wind shear tendency in forward sector :……………………........................................
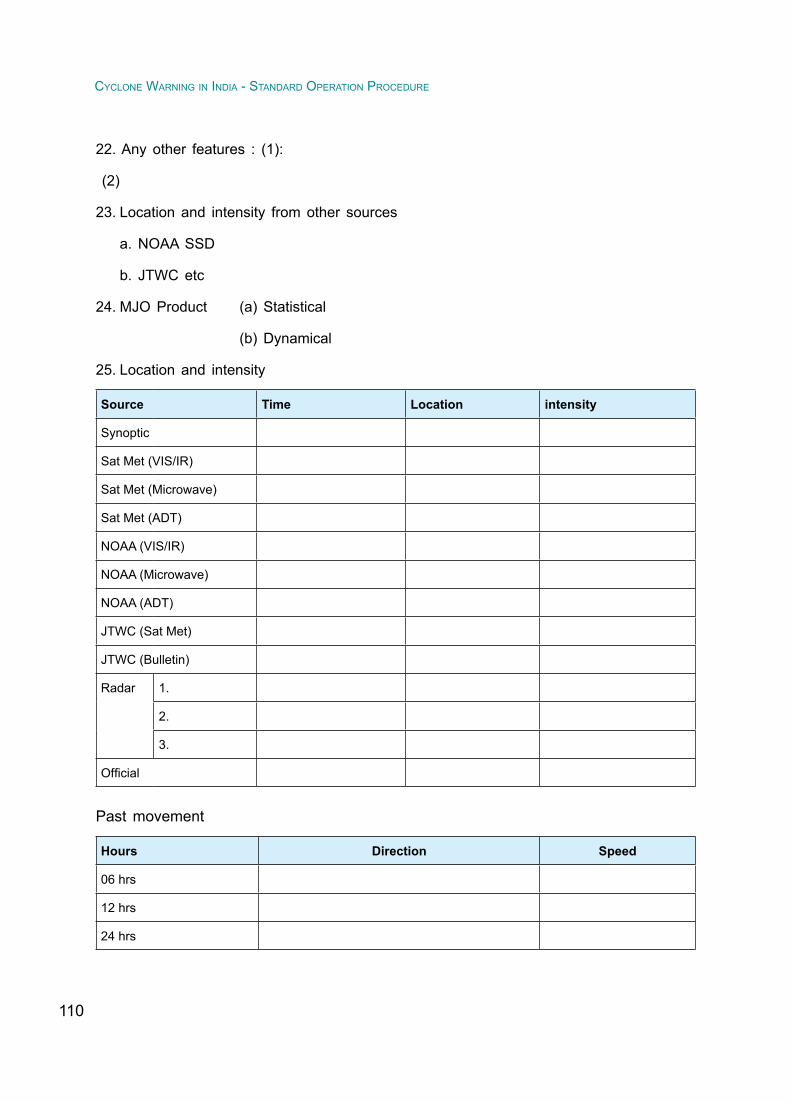
110
CyClone Warning in india - Standard operation proCedure
22. Any other features : (1):
(2)
23. Location and intensity from other sources
a. NOAA SSD
b. JTWC etc
24. MJO Product (a) Statistical
(b) Dynamical
25. Location and intensity
Source Time Location intensity
Synoptic
Sat Met (VIS/IR)
Sat Met (Microwave)
Sat Met (ADT)
NOAA (VIS/IR)
NOAA (Microwave)
NOAA (ADT)
JTWC (Sat Met)
JTWC (Bulletin)
Radar 1.
2.
3.
Official
Past movement
Hours Direction Speed
06 hrs
12 hrs
24 hrs

111
monitoring and prediCtion teChnique
26. Forecast based on Statistical and NWP models
Model 00 06 12 18 24 36 48 60 72
a. GPP
b. ARPEG (FRANCE)
c. HWRF (IMD)
d. WRF (IMD)
e. WRF (IITD)
f. WRF (NCMRWF)
g. MM5 (IAF)
h. T579
i. UKMO
j. JMA
k. NCEP GFS
l. ECMWF
m. MME
n. Dynamical Staistical Model (IMD)
o. EPS
p. CLIPER
q. MOG
r. Storm Surge model (Ghosh Nomogram)
s. Storm Surge model (IITD)
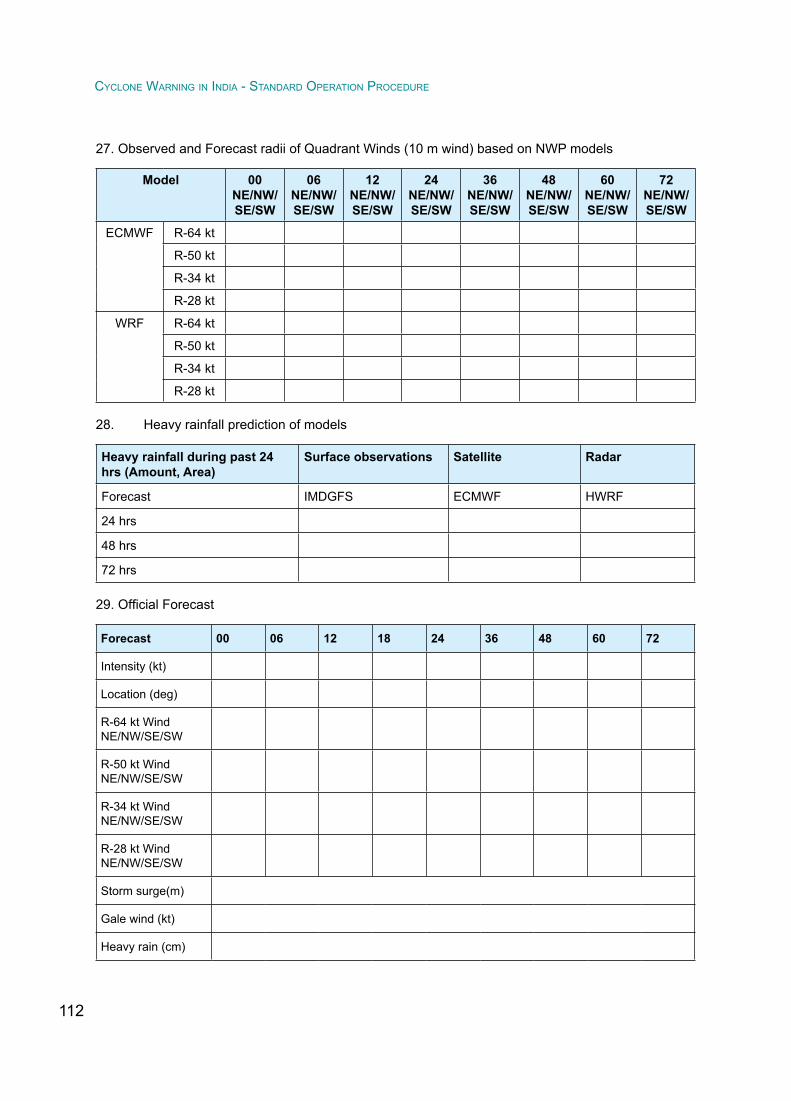
112
CyClone Warning in india - Standard operation proCedure
27. Observed and Forecast radii of Quadrant Winds (10 m wind) based on NWP models
Model 00NE/NW/SE/SW
06NE/NW/SE/SW
12NE/NW/SE/SW
24NE/NW/SE/SW
36NE/NW/SE/SW
48NE/NW/SE/SW
60NE/NW/SE/SW
72NE/NW/SE/SW
ECMWF R-64 kt
R-50 kt
R-34 kt
R-28 kt
WRF R-64 kt
R-50 kt
R-34 kt
R-28 kt
28. Heavy rainfall prediction of models
Heavy rainfall during past 24 hrs (Amount, Area)
Surface observations Satellite Radar
Forecast IMDGFS ECMWF HWRF
24 hrs
48 hrs
72 hrs
29.OfficialForecast
Forecast 00 06 12 18 24 36 48 60 72
Intensity (kt)
Location (deg)
R-64 kt WindNE/NW/SE/SW
R-50 kt WindNE/NW/SE/SW
R-34 kt WindNE/NW/SE/SW
R-28 kt WindNE/NW/SE/SW
Storm surge(m)
Gale wind (kt)
Heavy rain (cm)
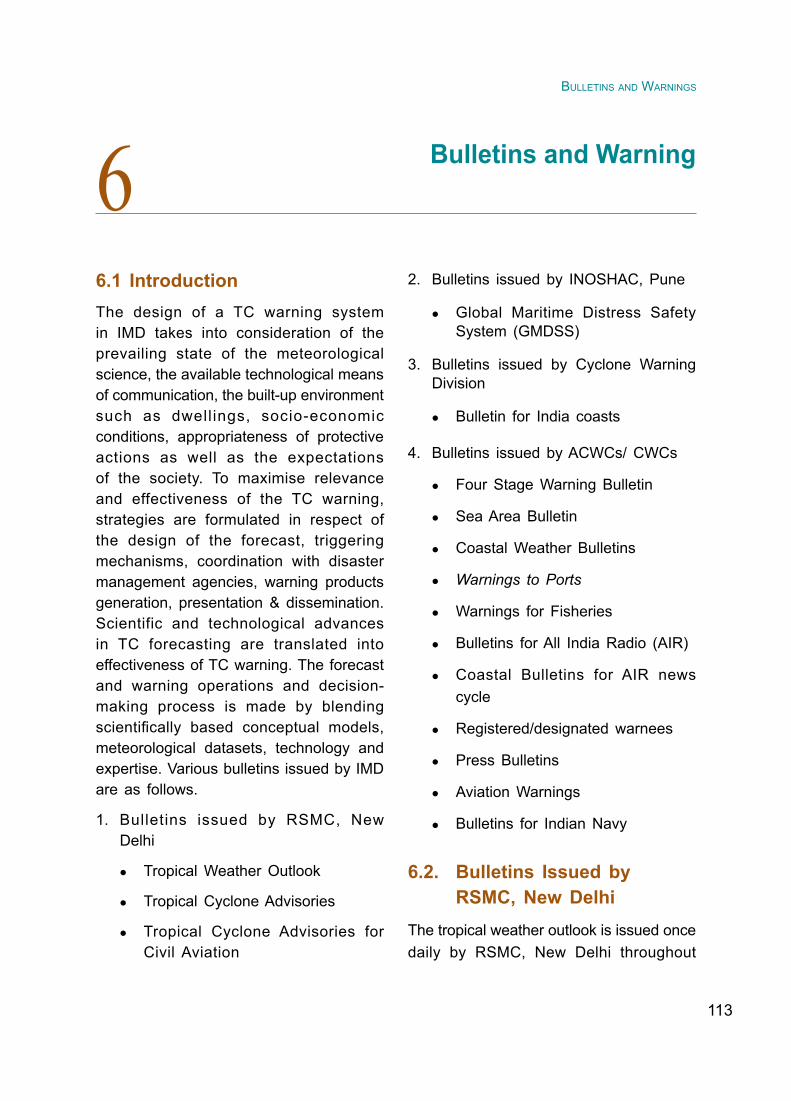
113
bulletinS and WarningS
6 Bulletins and Warning
6.1 IntroductionThe design of a TC warning system in IMD takes into consideration of the prevailing state of the meteorological science, the available technological means of communication, the built-up environment such as dwell ings, socio-economic conditions, appropriateness of protective actions as well as the expectations of the society. To maximise relevance and effectiveness of the TC warning, strategies are formulated in respect of the design of the forecast, triggering mechanisms, coordination with disaster management agencies, warning products generation, presentation & dissemination. Scientific and technological advances in TC forecasting are translated into effectiveness of TC warning. The forecast and warning operations and decision-making process is made by blending scientifically based conceptual models,meteorological datasets, technology and expertise. Various bulletins issued by IMD are as follows.
1. Bulletins issued by RSMC, New Delhi
Tropical Weather Outlook
Tropical Cyclone Advisories
Tropical Cyclone Advisories for Civil Aviation
2. Bulletins issued by INOSHAC, Pune
Global Maritime Distress Safety System (GMDSS)
3. Bulletins issued by Cyclone Warning Division
Bulletin for India coasts
4. Bulletins issued by ACWCs/ CWCs
Four Stage Warning Bulletin
Sea Area Bulletin
Coastal Weather Bulletins
Warnings to Ports
Warnings for Fisheries
Bulletins for All India Radio (AIR)
Coastal Bulletins for AIR news cycle
Registered/designated warnees
Press Bulletins
Aviation Warnings
Bulletins for Indian Navy
6.2. Bulletins Issued by RSMC, New Delhi
The tropical weather outlook is issued once daily by RSMC, New Delhi throughout

114
CyClone Warning in india - Standard operation proCedure
the year under normal weather conditions based on 0300 UTC observations. An additional Special Tropical Weather outlook is issued again based on 1200 UTC observations when a depression is located over the north Indian Ocean region. When a system reaches the cyclonic storm stage, Cyclonic Storm Advisories will be issued at 00, 03, 06, 09, 12, 15, 18 and 21 UTC. Supplementary advisories may also be issued as necessitated by circumstances e.g., change in intensity or movement. The bulletins issued by RSMC, New Delhi are brieflydescribedbelow:
6.2.1. Tropical Weather Outlook
Tropical Weather Outlook is issued daily at 0600 UTC based one 0300 UTC observations in normal weather for use of the member countries of WMO/ESCAP Panel. Description of Tropical Weather Outlook Bulletin contains the following
- convective activity;
- meteorological situation over the basin;
- observed lows;
- their potential of intensification atshort range (risk for development of a depression (T 1.5) within the next 24 hours) or beyond.
A special weather outlook is issued at 1500 UTC based on 1200 UTC observations when a tropical depression lies over north Indian Ocean. The special tropical outlook indicates discussion on various diagnostic
and prognostic parameters apart from the 72 hours track and intensity forecast from the stage of deep depression. The track and intensity forecast are issued for +06, +12, +18, +24, +36, +48, +60 and +72 hours or till the system is likely to weaken into a low pressure area. It also includes the description of current location & intensity and past movement description of satellite imageries. The time of issue of this bulletin is HH+ 3 hours.
The Special Tropical Weather Outlook Bulletin, to be issued five times a day(based on 00, 03, 06, 12, 18 UTC) contains the following.
- Current location and intensity
- Past movement
- Convective activity ;
- T number, est imated central pressure and Maximum sustained surface wind (MSW)
- Sea condition
- 72 hrs (00, 06, 12, 18, 24, 36, 48, 60 and 72 hrs) forecast track, intensity and quadrant winds for thresholds of ≥ 28, 34, 50 and 64 kts (Textand graph) from deep depression stage onwards till the weakening of the system.
- Storm surge guidance ( if any)
- Meteorological situation over the basin (Diagnosis and prognosis)

115
bulletinS and WarningS
6.2.2. Tropical Cyclone Advisories
Tropical cyclone advisories are issued at 3 hourly intervals based on 00, 03, 06, 09, 12, 15, 18 and 21 UTC observations. The time of issue is HH+03 hrs. Tropical cyclone advisories are transmitted to panel member Countries through global telecommunication system (GTS) and are also made available on real time basis through internet at IMD’s website: http://www.imd.gov.in. and e-mail. RSMC, New Delhi can also be contacted through e-mail [email protected]) for any real time information on cyclonic disturbances over north India Ocean.
Tropical Cyclone Advisory Bulletin for Panel countries (RSMC Bulletin), contains the following.
- Current Location and Intensity
- Past movement
- Convective activity ;
- T number, est imated central pressure and Maximum sustained surface wind (MSW)
- Sea condition
- 72 hrs (00, 06, 12, 18, 24, 36, 48 and 72 hrs) forecast track, intensity and quadrant w i n d s for thresholds of ≥ 28, 34, 50 and64 kts (Text and graph)
- Storm surge guidance (if any)
- Meteorological situation over the basin (Diagnosis and prognosis) Format of Tropical Cyclone Advisoy bulletin issued by RSMC is discussed on next page.

116
CyClone Warning in india - Standard operation proCedure
Format of Bulletins:
Format of Tropical Cyclone Advisory Bulletin issued by RSMC, New Delhi
FROM: RSMC – TROPICAL CYCLONES, NEW DELHITO: ALL WMO/ESCAP PANEL MEMBER COUNTRIESTROPICAL CYCLONE ADVISORY
SYSTEM NAME…………… ADVISORY NO …….. ISSUED AT ……UTC OF ………..(DATE) BASED ON ….. UTC ………..(DATE).
THE CYCLONIC STORM ……….. OVER …………….. (LOCATION AND MOVEMENT) AND DISTANCE FROM TWO/THREE COASTAL STATIONS (INDEX NUMBER). …….LIKELY MOVEMENT AND INTENSITY
INTERPRETATION OF SATELLITE IMAGERY (T. No., CLOUD TOP TEMPERATURE (CTT) AND ASSOCIATED CONVECTION ETC.).
SUSTAINED MAXIMUM SURFACE WIND SPEED IN KNOTS AROUND SYSTEM CENTRE, THE STATE OF THE SEA .AROUND THE SYSTEM CENTRE AND THE ESTIMATED CENTRAL PRESSURE IN…..hPa ETC.
72 HOURS FORECAST OF POSITION AND INTENSITY BASED ON LATEST ANALYSIS WITH NWP MODELS
AND OTHER CONVENTIONAL TECHNIQUES IN TABULAR FORM,
DATE/TIME(UTC) POSITION (LAT. 0N/ LONG. 0E)
SUSTAINED MAXIMUM SURFACE WIND SPEED (KMPH)
CATEGORY
DD-MM-YYYY/TTTT ……/…… …….. gusting to …….. DEPRESSION/DEEP DEPRESSION/CYCLONIC STORM ETC
REMARKS: Synopticguidancetoexplainmovementandintensification/weakeningofthe
system. Dynamical-statistical model guidance with respect to track/intensity Conclusion based on synoptic and NWP model guidance. Supporting observations Consensus decision
Time of Origin …………..HRS IST
GRAPHICS ON CURRENT & FORECAST TRACK ALONGWITH CONE OF UNCERTAINTY AND QUADRANT WIND DISTRIBUTION ARE GIVEN AS APPENDIX

117
bulletinS and WarningS
6.2.3. Tropical Cyclone Advisories for Civil Aviation
Tropical Cyclone Advisories for civil aviation are issued for international aviation as soon as any disturbance over the north Indian Ocean attains or likely to attain the intensity of cyclonic storm (sustained surface wind speed ≥ 34 knots) within next six hours.These bulletins are issued at six hourly intervals based on 00, 06, 12 and 18 UTC synoptic charts and the time of issue is HH+03 hrs. These bulletins contains present location of cyclone in lat./long., max sustained surface wind (in knots), direction of past movement and estimated central pressure, forecast position in Lat./
Long and forecast winds in knots valid at HH+6, HH+12, HH+18 and HH+24 hrs in coded form. The tropical cyclone advisories are transmitted on real time basis through GTS and AFTN channels to designated International Airports of the region prescribed by ICAO.
The Tropical cyclone advisory centre (TCAC) bulletin has following characteristics.
It is a text cum graphical bulletin.
Issued from cyclone stage till it weakens into a deep depression
The format of bulletin is given below.
FORMAT OF TCAC BULETIN
OBSERVED &FORECAST TRACKFOR 72 HRS ALONGWITH CONE OFUNCERTAINTY(GRAPHICS)
DTG:
TCAC:
TC:
NR:
PSN:
MOV:
C:
Max Wind: KT GUSTING TO KT
FC ST PSN + 6 Hrs : (DDTTTT) N E
Max Wind + 6 Hrs: KT GUSTING TO KT
FC ST [PSN + 12 Hrs: (DDTTTT) N E
Max Wind + 12Hrs: KT GUSTING TO KT
FC ST PSN + 18 Hrs: (DDTTTT) N E
Max Wind + 18 Hrs: KT GUSTING TO KT
FC ST PSN + 24 Hrs: (DDTTTT) N E
Max Wind + 24 Hrs: KT GUSTING TO KT
NEXT MSG: YYMMDD/TTTTZ
(SIGNATURE OF D.O.)
TOO: Hrs.IST
Telecom Section for Transmission

118
CyClone Warning in india - Standard operation proCedure
6.3. Global Maritime Distress Safety System (GMDSS)
Under Global Maritime Distress Safety System (GMDSS) scheme, India has been designated as one of the 16 services in the world for issuing Sea area bulletins for broadcast through GMDSS for MET AREA VIII (N), which covers a large portion of north Indian Ocean. As a routine, two GMDSS bulletins are issued at 0900 and 1800 UTC. During cyclone situations, additional bulletins (up to 4) are issued for GMDSS broadcast. The area of responsibility and designated National Meterological Services for issue of weather and sea area bulletins is shown in Fig.6.1. List of stations issuing cyclone warnings for ships on the high seas is given in table 6.1.
6.3.1. Transmission of GMDSS bulletin
India is one of the issuing services of Met area VIII (N) among the 16 issuing services of WMO Marine broadcast system under the GMDSS. In India, the weather forecast and warning bulletin is prepared by ACWC (Area Cyclone Warning Centre) Mumbai for the Arabian Sea, by ACWC, Calcutta for the Bay of Bengal and INOSHAC (Indian Ocean & South Hemispheric Centre), Pune for Indian Ocean, North of equator upto 5°N, for their areas of responsibility. The bulletins are compiled by INOSHAC, Pune and transmitted to RSMC, New Delhi. RSMC, New Delhi edits the final bulletin if required and transmitsto Tele-communication Division (Regional Telecommunication Hub (RTH), New Delhi)
for further transmission through local earth station (LES), Arvi as shown in Fig.6.2.
6.3.2. Frequency of Broadcasts
To start with as a routine only, one GMDSS bulletin for METAREA VIII (N) was broadcast at 0900 UTC. From October 1998, a second bulletin is also broadcast at 1800 UTC. During Cyclone situations, additional bulletins (up to 4) are also being issued for GMDSS broadcast depending on the requirement.
In addition, India is also issuing weather and warning bulletins to the NAVTEX transmitting stations located at Mumbai and Chennai.
6.3.3. Modality of Transfer of GMDSS Bulletin to CES ARVI
GMDSS BULLETIN is transferred to CES ARVI in manual mode using a dedicated telex terminal connected to the “store and forward switching computer” of the CES ARVI. The procedure involves dialing, login, entering C codes, Start of the message (BT), text and end of the message characters. On an average, it takes 5 minutes to transmit the message to CES ARVI at the normal telex speed of 50 baud. It takes another 2-3 minutes for the message to be received at the monitoring terminal to check its correctness and clarity.
The operational GMDSS broadcast is currently operating smoothly without any noticeable problems. The feedback response received from a few shipping companies are very encouraging.

119
bulletinS and WarningS
Table 6.1. Stations issuing cyclone warnings for ships on the high seas
Station Call sign of Coastal Area covered Radio Station
Area covered
Bangladesh, Chittagong
ASC Bay of Bengal north of 18°N Lat.
India, Mumbai Arabian Sea north of Lat. 5°N and east of Long. 60°E excluding the area north of Lat. 20°N and west of Long. 68°E. The eastern boundary of the Arabian Sea for which these bulletins are issued by Mumbai is Long. 80°E meridian excluding the Gulf of Mannar.
India, Kolkata Bay of Bengal north of Lat. 5°N except the area between the coastline on the east and the line drawn through the points 18°N 94.5°E, 18°N 92°E, 13.5°N 92°E, 13.5°N 94°E, 10°N 94°E, 10°N 95°E and 5°N 95°E. The western boundary of the sea area for which bulletins are issued by Kolkata is up to and inclusive of the Gulf of Mannar (i.e., 77.5°E meridian).
*India, Chennai Bay of Bengal bulletins issued by ACWC Kolkata are being broadcast through Navtex, Chennai by Narrow Band Direct Printing ( NBDP )
Myanmar, Yangon XYR Bay of Bengal except area west of Long. 92°E and South of 10°N Lat.
Oman (Sultanate of) A4M Muscat Coastal Radio Station
**Pakistan, Karachi ASK Arabian Sea north of 20°N, Gulf of Oman and Persian Gulf.
Sri Lanka, Colombo 4PB Indian Ocean, Arabian Sea and Bay of Bengal from the equator to 10°N between 60°E and 95°E. The area 5°N to 10°N between 60°E and 95°E is an overlap with India.
Thailand, Bangkok HSA
HSS
Gulf of Thailand, west of southern Thailand. Strait of Malacca and South China Sea.
* Under the new Marine Meteorological Broadcast system, GMDSS (Global Marine Distress Safety System) of IMO/WMO, India issues two bulletins at 0900 and 1800 UTC everyday for broadcast through INMARSAT SAFETY SYSTEM. Additional bulletins are broadcast during Cyclone period.
** To comply IMO/WMO GMDSS and marine Meteorological Broadcast System Pakistan issues the high seas forecast / Marine bulletins for met area-IX daily at 0700 UTC for broadcast through INMARSAT SAFEYNET SYSTEM. These bulletins are issued at 1900 UTC if so required.

120
CyClone Warning in india - Standard operation proCedure
Fig. 6.1. Area of responsibility and designated national meteorological services for
the issue of warnings and weather and sea bulletins for the GMDSS
Fig. 6.2. Transmission of GMDSS Bulletin
ARB-A2MUMBAI
BOB-A4CALCUTTA
ARB-A1BOB-A3
RSMCNew Delhi
RTHNew Delhi
LESARVI

121
bulletinS and WarningS
6.3.4. Sample of GMDSS Bulletin
Shipping bulletin for met area VII North of Equator Valid for 24 hours from 2002 07 18 0900 UTC: 18 July 2002
PART I: No storm warning
Part II: Yesterdays low pressure area now lies over NW Bay and adjoining Odisha (.)
The off-shore trough over the Arabian Sea now runs from Saurashtra coast to Kerala coast (.)
Weather seasonal over rest metarea VIII (N)
Part III: ARB-A1 Arabian Sea Eq to 10 deg north and west of 80 deg E i. Wind :- SW/W 15/20 KTS gusting to
25/30 KTS in RA/TS ii. Weather :- SCT RA/TS iii. Visiblity :- Poor in rain iv. State of sea :- MOD
ARB-A2 Arabian Sea north of lat 10 deg Ni. Wind :- SW/W 20/25 KTS gusting to
30/35 KTS in RA/TS ii. Weather :- SCT RA/TS iii. Visibility :- Poor in rain iv. State of sea :- MOD to RGH
BOB-A3 Bay of Bengal between Eg to 10 deg N and east of 80 deg Ei. Wind :- W/SW 15-20 KTS gusting to
25/30 KTS in RA/TS ii. Weather :- FWDS RA/TS
iii. Visibility :- Poor in rain iv. State of sea :- MOD
BOB-A4 Bay of Bengal north of lat 10 deg N i. Wind :- W/SW 20/25 KTS bec cyclonic to
the N of 17 deg N and W of 88 deg E. Wind gusting to 30/35 KTS in RA/TS
ii. Weather :- WDS RA/TS iii. Visibility :- Poor in rain iv. State of sea :- MOD to RGH
Issued by India Meteorological Department
MOD : Moderate, RGH : Rough, WDS : Widespread, FWDS : Fairly widespread, SCT : Scattered, RA : Rain, TS : Thundershower, KT : Knot, DEG N : Degree North, BEC: Becoming, W/SW : West/southwest,
6.4. Bulletin for India Coasts6.4.1. Four Stage Warning Bulletin
Issued by Cyclone Warning Division
Bulletin for India coast is issued in different stages as mentioned below.
Pre-cyclone watch,
Cyclone alert,
Cyclone warning,
Post landfall outlook
De-warning
These bulletins are issued from the stage of depression onwards. During the stage of depression/deep depression; it is issued based on 00, 03, 06, 12, and 18 UTC observations.Whenthesystemintensifiesinto a cyclonic storm over north Indian Ocean, these bulletins are issued at 00, 03, 06, 09, 12, 15, 18 and 21 UTC (every

122
CyClone Warning in india - Standard operation proCedure
three hourly interval) based on previous observations. This bulletin contains present status of the system i.e. location, intensity; past movement and forecast intensity & movement for next 72 hours or till the system weaken into a low pressure area, likely landfall point & time and likely adverse weather including heavy rain, gale wind & storm surge. Expected damage and action suggested are also included in the bulletins. This bulletin is completely meant for national users.
At national level, cyclone warning is furnished on a real time basis to the Control Room in the Ministry of Home Affairs, Government of India, besides other Ministries & Departments of the Central Government. This Division provides cyclone warning bulletins to Doordarshan and All India Radio (AIR) at New Delhi for inclusion in the National broadcast/telecast. Bulletins are also provided to other electronic and print media and concerned state Governments.
Different colour codes are being used since post monsoon season of 2006 at different stages of the cyclone warning bulletins (cyclone alert-yellow, cyclone warning-orange and post landfall outlook-red), as desired by the National Disaster Management.
Description of this bulletin contains the following: - Date and time of issue- Current Location and Intensity- Past movement - Maximum sustained surface wind
(MSW)
- 72 hrs (00, 06, 12, 18, 24, 36, 48 and 72 hrs) forecast track and intensity (Text and graph) from deep depression stage onwards till the weakening of the system.
- Forecast track and intensity as mentioned above.
- Adverse weather (Text and graph)
- Advisory and action suggested
- Time of issue of next bulletin
In case of depression, only plain language forecast will be given without the quantitative 72 hr forecast track and intensity as mentioned above.
6.4.2. DGM’s Bulletin for High Govt. Officials
DGM’s Bulletin for high Govt officials isissued as follows.
It is issued once a day.
It summarises past 24 hrs development in terms of track and intensity.
It contains past 24 hrs weather
Other contents are same as that of bulletin for India coast as discussed in Sec.6.3.1
The format of this bulletin is same as the format of ‘Bulletin for India coast incorporating all the above features.
6.4.3. Bulletin Through SMS
The bulletins are sent through various national disaster management agencies and the concerned chief secretary of the likely to be affected states in case of a landfalling cyclone.

123
bulletinS and WarningS
Format of Bulletin for India Coast issued by Cyclone Warning Division, New Delhi
FROM: INDIA METEOROLOGICAL DEPARTMENT
TO: NATIONAL DISASTER MANAGEMENT/SENIOR GOVERNMENT FUNCTIONARIES / STATE RELIEF COMMISSIONERS OF MARITIME STATES/ALL INDIA RADIO/ DOOR DARSHAN
Bulletin No…….
Dated: Time of issue: hours IST
SUB: CYCLONIC STORM `X’ OVER ………..: CYCLONE ALERT/WARNING FOR ……… COAST - YELLOW/ORANGE / RED MESSAGE
The cyclonic storm ……….. over …………….. (location and movement) and distance from two/three coastal stations (name). …….likely movement and intensity
Based on latest analysis with numerical weather prediction (NWP) models and other conventional techniques, estimated track and intensity of the system are given in the table below:
DATE/TIME(UTC) POSITION (LAT. 0N/ LONG. 0E)
SUSTAINED MAXIMUM SURFACE WIND SPEED (KMPH)
CATEGORY
DD-MM-YYYY/TTTT ……/…… …….. gusting to …….. DEPRESSION/DEEP DEPRESSION/CYCLONIC STORM ETC
Adverse weather due to heavy rain, Gale Wind and Storm Surge:
State of sea:
Damage expected:
Advice and action suggested:
Time of issue of next bulletin: hrs. IST
GRAPHICS ON CONE OF UNCERTAINTY, CURRENT & FORECAST TRACK AND QUADRANT WIND DISTRIBUTION ARE GIVEN AS APPENDIX

124
CyClone Warning in india - Standard operation proCedure
6.4.4.PersonalBriefing
Atthenationallevel,thepersonalbriefingsare provided by Cyclone Warning Division to national disaster management agencies including cabinet secretariat, MHA, NDRF and NDMA and press and electronic media.
6.4.5. Press Conference
A press conference is held under the chairmanship of Director General of Meteorology, IMD at New Delhi well in advance for the press and electronic media. All the details about the cyclonic storm and associated adverse weather, likely impact and action suggested to public and disaster management agencies are provided in this conference
6.5. UserSpecificBulletinsIssued by ACWCs/CWCs
The ACWCs/CWCs issue warnings to ships in the high seas, ships in coastal waters, ports, fishermen, government officials and the general public regardingadverse weather likely to be experienced in their respective areas. The bulletins and warnings issued by ACWCs/CWCs for their respective areas of responsibility include
Four stage warning bulletin
Sea area bulletins for ships plying in High Seas
Coastal weather bulletins for ships plying in coastal waters
Bulletins for Indian Navy
Port Warnings
Fisheries Warnings
Four stage warnings for Central and StateGovt.Officials
Bulletins for broadcast through AIRs for general public
Warning for registered users
Bulletins for press
Warnings for Aviation (issued by concerned Aviation Meteorological Offices)
6.5.1. Four Stage Warning Bulletin
The most important warning for disaster management is the one issued to government officialsunderafour-stagewarningsystem.The First Stage warning known as “PRE CYCLONE WATCH” issued 72 hours in advance of commencement of adverse weather contains early warning about the development of a cyclonic disturbance in theNIO, its likely intensification intoaTCand the coastal belt likely to experience adverse weather. The Second Stage warning known as “CYCLONE ALERT” is issued at least 48 hrs in advance of the expected commencement of adverse weather over the coastal areas. It contains information on the location and intensity of the storm, likely direction of its movement, intensification, coastal districts likely toexperience adverse weather and advice

125
bulletinS and WarningS
to fishermen, general public, media anddisaster managers. The Third Stage warning known as “CYCLONE WARNING” is issued at least 24 hours in advance of the expected commencement of adverse weather over the coastal areas. These warnings give the latest position of cyclone and its intensity, likely point and time of landfall, associated heavy rainfall, strong wind and storm surge alongwith their impact and advice to general public, media,fishermenanddisastermanagers.The Fourth Stage of warning known as “POST LANDFALL OUTLOOK” is issued at least 12 hours in advance of expected time of landfall. It gives likely direction of movement of the cyclone after its landfall and adverse weather likely to be experienced in the interior areas. All the above warnings are issued by ACWCs/CWCs/and CWD. Format for Alert/Warning bulletin and Post Landfall Outlook are shown below:
FormatforState/CentralGovt.Officials/Vital installations / Registered Users Cyclone Alert/ Cyclone Warning Bulletin
Cyclone Alert/ Cyclone Warning Bulletin No.:
Date and Time of Issue:
(i) Information on cyclone : The cyclonic storm lay over.. . . . . . . . . . . . Bay of Bengal/Arabian Sea Center ........... kms. ........................ (Direction) of ..................... place at IST.
(ii) Forecast Further intensification: Direction of Movement: Expected landfall area: Expected time of landfall:
(iii) Weather Warning
(a) Rainfall .................................. in ............................ Districts (Names)
(b) Gales reaching ...................... in ........................... Districts (Names)
(c) Gale force winds reaching 35 knots in ................... Districts
(d) Tidal waves ............... in coastal areas of .................. Districts (Names)
(e) Sea condition:
(f) Damage (As per IMD instruction) ........................... Districts (Names)
(g) Likely impacts as per IMD Monograph on “Damage Potential of Tropical
[Depending on Intensity of Storm (T-No)]
(a) Fishermen not to venture into open sea.
(b) Evacuation of people from low lying areas to safer places/Cyclone Shelters.
(c) General public in the threat area advised to be indoors.
(d) Rai l & road transport to be regulated.

126
CyClone Warning in india - Standard operation proCedure
FORMAT FOR POST LANDFALL OUTLOOK
(To be appended at the end of the Cyclone Bulletin issued 12 hrs before estimated landfall time)
POST LANDFALL OUTLOOK FOR MCs/RMCs ………………………..
Even after landfall, the system is likely to maintain its intensity for …………………. Hours and weaken graduallyAAAUnderitsinfluence,rainsat most/many places with heavy to very heavy falls at ……………………………… likely to commence/continue in …………………… (coastal districts) from …………… (time)……………………. (day) ……………………… (dates) causing inundation of low-lying areas AAA Gale winds/squal ly winds speed reaching ……………. kmph l ikely commence/continue i n …………………………………..(coastal districts) from ………(time)on……………………(day)…………… ( d a t e ) c a u s i n g d a m a g e s t o …………………………. ( property as indicated in IMD monograph on “DAMAGE POTENTIAL OF TROPICAL CYCLONE”) and …………………… (vegetation) and general disruption of communication and power supply for ……………………………
2. As the cyc lone moves in land ……………….. Interior districts may also experience heavy/very heavy
rain accompanied with gale with speed reaching ……………. kmph commencing from ……………… (time) on ………………. (day) …………………. (date) for ………….. hrs, causing floodingoflowlyingareasanddamageto property as indicated in IMD monograph on “DAMAGE POTENTIAL OF TROPICAL CYCLONE” (as per IMD instruction)
3. People are advised to remain indoors/in safe places and cooperate with stategovernmentofficialsanddisastermanagement agencies.
6.5.2. Sea Area Bulletin
Sea area bulletins for Bay of Bengal are issued by ACWC Kolkata and are broadcast by the coastal radio stations at Kolkata (VWC) and Chennai (VWM) and those for Arabian Sea are issued by ACWC Mumbai and are broadcast by the coastal radio station at Mumbai (VWB). The area covered by these bulletins which is the area of responsibility assigned to India by the World Meteorological Organisation (WMO), is shown in Fig.6.3.
During undisturbed weather, only two bulletins are issued per day, known as Daily bulletins. In the event of disturbed weather, a third bulletin known as extra is broadcast, if considered necessary. However, when a depression has actually formed, the Extra bulletin must be issued. When a cyclonic storm has developed,

127
bulletinS and WarningS
every attempt should be made to broadcast three additional bulletins a day. The three additional bulletins are known as Storm bulletins which together with the three bulletins mentioned earlier, make up a total of six bulletins a day. Storm three i.e. GASBAG bulletin (1500 UTC) should be issued on routine basis during cyclone situation. These bulletins are broadcast at fixed hours according to aschedule. In addition, if any unexpected
development of weather warrants urgent communication to ships, in between scheduled broadcasts, it is broadcast in the form of a special bulletin, called Hexagon which should be issued immediately after the development is noticed. A code word (which isnot forbroadcast) isprefixed toeach of the bulletins as a preamble for easy identification by the coastal radiostations on receipt. These are given in the table 6.2.
Fig. 6.3. Area of coverage for issue of coastal weather bulletin and sea area bulletin

128
CyClone Warning in india - Standard operation proCedure
Table6.2.PrefixofCodeWord toSeaArea Bulletin for coastal Radio Stations
Code word Type of bulletin
Chart on which based (UTC)
ELECTRON Storm-One 0000
AURORA Daily-One 0300
FORMULA Storm-Two 0900
BALLOON Daily-Two 1200
GASBAG Storm-Three 1500
DEW DROP Extra 1800
HEXAGON Special Anytime
Format of ‘daily’ bulletin
The formats for the three messages are as follows:
i) Aurora/ Balloon OBS Date…………….. Part One etc……………… Part Two etc. …………..
ii) OBS Date…… Part Three Area Forecast etc. ……….. Part Four Analysis etc. ……………
iii) OBS Date …Part Five Ships’ Broadcast etc. …..Part Six 0300 Z synop etc. …
In case of ‘extra’, ‘storm’ and ‘special’ type, bulletin consists of only Part I
Format of Part – I
When a depression or a cyclonic storm has formed or is expected to form or when gales are expected, Part I of the bulletin will contain the following items in the order mentioned below:
(1) International Safety Call sign (TTT).
(2) Statement of type of warning (Warning, gale warning, cyclone warning etc.)
(3) Date and time of reference in UTC in the international six figure date-timegroup.
(4) Type of disturbance (low, when it is expected to intensify into a depression before broadcast of the next bulletin, depression, monsoon gale, cyclonic storm etc.) with central pressure in hPa in the case of disturbances of cyclonic storm intensity and above.
(5) Location of disturbance in terms of latitude and longitude.
(6) Direction and speed of movement of disturbance. (The direction may be given in 16 points of compass or in degrees to the nearest ten; the speed is given in knots.) The departmental practice is to give the direction in sixteen points of the compass.
(7) Extent of area affected.
(8) Speed and direction of wind in various sections of the affected area. (Wind speeds are given, if possible, for different distances from the centre, in different sectors of the storm area. Wind speeds are given in knots and distances in nautical miles.)
(9) Further indications, if any
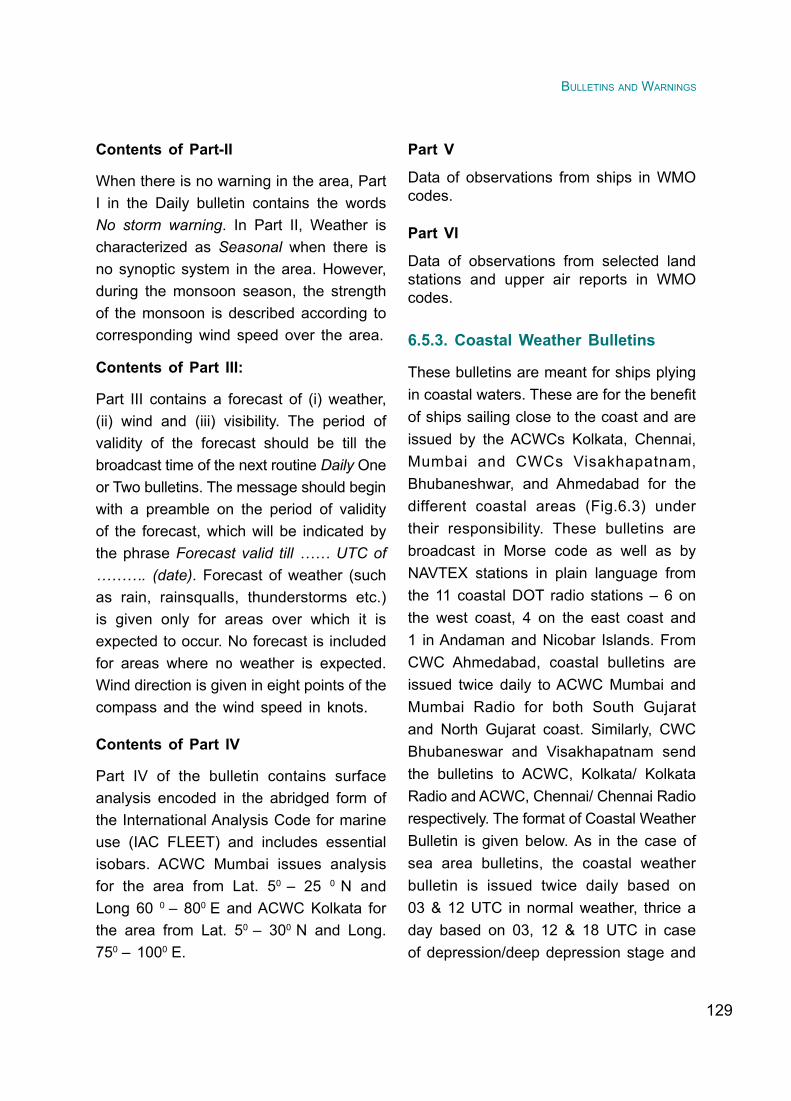
129
bulletinS and WarningS
Contents of Part-II
When there is no warning in the area, Part I in the Daily bulletin contains the words No storm warning. In Part II, Weather is characterized as Seasonal when there is no synoptic system in the area. However, during the monsoon season, the strength of the monsoon is described according to corresponding wind speed over the area.
Contents of Part III:
Part III contains a forecast of (i) weather, (ii) wind and (iii) visibility. The period of validity of the forecast should be till the broadcast time of the next routine Daily One or Two bulletins. The message should begin with a preamble on the period of validity of the forecast, which will be indicated by the phrase Forecast valid till …… UTC of ………. (date). Forecast of weather (such as rain, rainsqualls, thunderstorms etc.) is given only for areas over which it is expected to occur. No forecast is included for areas where no weather is expected. Wind direction is given in eight points of the compass and the wind speed in knots.
Contents of Part IV
Part IV of the bulletin contains surface analysis encoded in the abridged form of the International Analysis Code for marine use (IAC FLEET) and includes essential isobars. ACWC Mumbai issues analysis for the area from Lat. 50 – 25 0 N and Long 60 0 – 800 E and ACWC Kolkata for the area from Lat. 50 – 300 N and Long. 750 – 1000 E.
Part V
Data of observations from ships in WMO codes.
Part VI
Data of observations from selected land stations and upper air reports in WMO codes.
6.5.3. Coastal Weather Bulletins
These bulletins are meant for ships plying incoastalwaters.Theseareforthebenefitof ships sailing close to the coast and are issued by the ACWCs Kolkata, Chennai, Mumbai and CWCs Visakhapatnam, Bhubaneshwar, and Ahmedabad for the different coastal areas (Fig.6.3) under their responsibility. These bulletins are broadcast in Morse code as well as by NAVTEX stations in plain language from the 11 coastal DOT radio stations – 6 on the west coast, 4 on the east coast and 1 in Andaman and Nicobar Islands. From CWC Ahmedabad, coastal bulletins are issued twice daily to ACWC Mumbai and Mumbai Radio for both South Gujarat and North Gujarat coast. Similarly, CWC Bhubaneswar and Visakhapatnam send the bulletins to ACWC, Kolkata/ Kolkata Radio and ACWC, Chennai/ Chennai Radio respectively. The format of Coastal Weather Bulletin is given below. As in the case of sea area bulletins, the coastal weather bulletin is issued twice daily based on 03 & 12 UTC in normal weather, thrice a day based on 03, 12 & 18 UTC in case of depression/deep depression stage and

130
CyClone Warning in india - Standard operation proCedure
5/6 times a day at 00, 03, 06, 09, 12 & 21 UTC in cyclone stage. In undisturbed weather, the two bulletins issued are based on 0300 and 1200 UTC charts and they are called Daily One and Daily Two, corresponding to Aurora and Balloon sea area bulletins. However, during periods of disturbed weather, when Extra, Storm or Special sea area bulletins are issued, corresponding coastal bulletins are also to be issued for the particular coast which is likely to be affected, necessitating the hoisting of signals of LC-III and above at the ports. If local weather along a coast is not affected by the disturbance, additional coastal bulletins for the coast need not be issued. Each bulletin (Daily, Extra, Storm and Special) contains the following information in the order given below :
(1) Name of coastal Strip
(2) Synoptic system, if any, affecting the weather over the coastal strip and its movement in the case of depressions and cyclonic storms.
(3) Period of validity of forecast.
(4) Forecast of wind, weather, visibility and state of sea for the coastal strip.
(5) Information about storm warning signals, if any, hoisted at ports on the coastal strip concerned.
(6) Information on storm surges/tidal waves (whenever necessary).
6.5.4. Fleet Forecast for Indian Navy
Since Naval ships normally do not keep watch on commercial W/T wavelengths and hence do not listen to the broadcasts from the coastal radio stations, separate weather bulletins for broadcast to the ships of the Indian Navy are issued to the Naval W/T stations. The bulletins that are issued exclusively for broadcast to Indian Naval ships are called the Fleet Forecasts. Fleet Forecasts are issued exclusively for broadcast to Indian Naval ships through Naval W/T stations. They are issued twice daily, corresponding to Aurora and Balloon seaareabulletins.Theofficeswhichissuethe Fleet forecasts and their areas of responsibility are shown in Fig. 6.4 and Table 6.3.
Table6.3.Areaof responsibility forfleet forecast
S. No. Officeofissue Area of responsibility Sub-areas
1. ACWC Mumbai Arabian Sea to the north of Lat. 5oN and East of Long.60oE, Gulf of Oman and Persian Gulf
B 00, 20, 25, 30, 35, 40, 55 & E 00, 05
2. ACWC Kolkata Bay of Bengal and Andaman Sea to the north of Lat. 5oN
C 65, 70, 75, 80, 85 E10 and West half of E 15.
3. INOSHAC, Pune
Indian Ocean between Lat.5oN and 10oS and Long.60oE and 100oE
E 20, 25, 30, 35, 40,45, 50, 55, 60, 65, 70,75.

131
bulletinS and WarningS
6.5.4.1. Items in Fleet Forecast
The Fleet Forecast is in plain language and contains a brief general inference for the area including warnings. In the case of Bay of Bengal and Arabian Sea, the inference will conform to the Aurora and Balloon bulletins issued by ACWCs Mumbai and Kolkata. The forecast covers surface wind, visibility and state of sea and an outlook for the next 12 hours. Fixed times of origin are given to the Fleet Forecast messages – 0800 UTC in
the case of day bulletin and 1700 UTC in the case of the night bulletin. These Fleet forecasts are broadcast by Naval W/T station, Mumbai, during weather broadcast periods commencing from 0930 UTC and 1830 UTC respectively. Fleet Forecast messages should be brief with the view that the requirements of ships at sea are principally wind (direction and speed) and visibility and hence the area forecasts must contain only these two elements and their variations. The central pressure is given
Fig. 6.4. Mapshowingareas for fleet forecast issuedby IMD
B20
B25
B30
B00
B35
B40
E00
E05
E20
E25
E45
E50
E30
E35
E15
E10
C65
C85
C80
C70
C75
E70
E75
E55
E40
E60
E65
B5515º
20º
10º
5º
0º
5º
S 10º
60º 65º
AREAS FOR INOSHAC: E-20, 25, 30, 35, 40, 45, 50, 55, 60, 65, 70 AND 75. CALCUTTA: C-65, 70, 75, 80, 85, E-10 AND WEST HALF OF E-15 BOMBAY: B-00, 20, 25, 30, 35, 40, 55, E-00, AND E-05.
70º 75º 80º 85º 90º 95º 100º

132
CyClone Warning in india - Standard operation proCedure
from Storm stage upwards. The two daily forecasts are valid for 12 hours from 1000 UTC and 2200 UTC respectively. Outlook for next 12 hours in clear terms from the termination of the forecast period should be appended to both day and night bulletins as a routine. When weather conditions are reasonably stable, the evening forecast may be abbreviated with reference to the previous morning forecast.
6.5.4.2. Mode of Transmission of Fleet Forecast to Naval W/T Mumbai
ACWC Kolkata and INOSHAC Pune send their Fleet Forecasts to RCC Mumbai through Departmental telecommunication channels. These Fleet Forecasts together with the one issued by ACWC Mumbai are transmitted to Naval W/T Station, Mumbai, through theNavalMet.Office,Mumbai.
6.5.5. Warnings to Ports
6.5.5.1. Hoisting of Signals
A uniform system of storm warning signals was introduced at all the ports in India from 1st April 1898 and it is still in vogue with very little changes. The salient features of the system are described below :
(i) General System
A General System with eleven signals (Table6.4), thefirst twoofwhich (signalsNo. I and II) indicate the existence of distant disturbed weather, the next eight (signals III to X) indicate that the port
itself is threatened by bad weather and the last one (signal No. XI) indicates that the communication with the ACWC/CWC had broken down and that in the opinion ofthelocalPortOfficer,thereisdangerofbad weather. Signals No. I and II are called Distant Signals and the rest Local signals. The ports where this system of signals is in use are called General Ports.
(ii) Extended System
An Extended System which in addition to the eleven signals of the General System, has six Section signals (Details are given in Cyclone Manual) to indicate the location of the disturbance. These additional signals are hoisted along with Distant Signals. This system is a special case of the General System and is in use only at a few ports on the east coast (Bay of Bengal). These ports are: Sagar Island, Kakinada, Chennai, Cuddalore and Nagapattinam. These ports are called Extended Ports. There is no port under the Extended System on the west coast.
(iii) Brief System
ABriefSystemsconsistingofonlyfiveofthe signals of the General Systems (viz. Signal Nos. III, IV, VII, X and XI). These are hoisted in association with prospects of bad weather at the port itself caused by disturbances out at sea. This system of signals is in use in ports frequented mainly bysmallervesselsengagedinlocaltrafficand these ports are called Brief Ports.

133
bulletinS and WarningS
Table 6.4. Port Warning Signals (General System) used in India
Signal/ Flag No.
NAME Symbols DescriptionDay Night
1 DISTANT BAD WEATHER
DC1
Depression far at sea.
Port NOT affected.
2 DW2 Cyclone far at sea.
Warning for vessels leaving port.
3 LOCAL BAD WEATHER
LC3 Port Threatened by local bad weather like squally winds.
4 LW4 Cyclone at sea. Likely to affect the port later.
5
DANGER
D5 Cyclone likely to cross coast keeping port to its left.
6. D6 Cyclone likely to cross coast keeping port to its right.
7. D7 Cyclone likely to cross coast over/near to the port.
8.
GREAT DANGER
GD8 Severe cyclone to cross coast keeping port to its left.
9. GD9 Severe cyclone to cross coast keeping port to its right.
10. GD10 Severe cyclone to cross coast over or very near to the port.
11.
XI Communication failed with cyclone warningoffice.

134
CyClone Warning in india - Standard operation proCedure
(iv) Ports without Signals
In addition, there are some minor ports where no signals are hoisted but which get a special type of warning message; they are called Ports without signals. For purposes of warning, these ports are treated as Brief ports and corresponding port warnings are issued when adverse weather threatens them although no signals are advised to be hoisted. These warning messages will contain information on the location, intensity and direction of movement of the disturbance and the expected weather over the port.
The India Meteorological Department (through the ACWCs/CWCs) maintains a port warning service by which the port officers are warned by telefax about disturbed weather likely to affect their ports. On receipt of the warning bulletin from the ACWC/CWC, the port officershoist appropriate visual signals prominently on signal masts so that they are visible from a distance. Mariners and other sea-faring people, including fishermen who may not be literate, are generally aware of the meaning of these signals and the port authorities are always ready to explain them whenever necessary. At some ports, the meanings of the signals are displayed in English as well as in the local languages prominently on a notice board. While the India Meteorological Department is responsible for issuing the warnings, the port authorities arrange the display of signals. In addition to hoisting
thesignals,theportofficersinmostcases,make arrangements for disseminating the warnings received by them, to country craft and sailing vessels in the harbours. The port warning signals (general system) used in India are shown in Table 6.4
6.5.5.2. Frequency of Issue and Contents of Port Warning Bulletin
Ports in the maritime States are warned 5 to 6 times a day during periods of cyclonic storm by telefax. The warnings contain information about the location, intensity and expected direction of movement of the storm or depression, the part of the coast where it is expected to strike and the type of signal which the port should hoist. As landline communication between the port and the CWC may break down during a cyclone, provision exists for using state and inter-state police W/T channels wherever available for passing on the warnings.
6.5.5.3. Format for Port Warning
Port Warning No.
Date and Time for Issue
(i) Information on cyclone: The cyclonic storm lay over Bay of Bengal/Arabian Sea near Lat._____/Long. _______ at a distance _______ km. from __________ at ________ IST ________ Estimated Central Pressure _________ hPa.
(ii) Forecast:
Further intensification:
Direction of Movement:

135
bulletinS and WarningS
Expected Landfall Area :
Expected Time of Landfall :
Advice for hoisting Storm Warning Signals:
Likely impacts and actions : Depending on intensity of the storm as per IMD Monograph on “Damage Potential of Tropical cyclones.
6.5.6. Warnings for Fisheries
6.5.6.1. Criteria for Warnings
Warnings for fishing interests are issuedby the ACWCs/CWCs whenever the wind speed is expected to exceed 45 kmph (i.e. for squally weather, gales, strong monsoon and off shore winds) and state of sea very rough or above. These warnings are transmitted by landline telegram or over telephone to the AIR stations (about 30 in number) in the maritime states. These warnings are broadcast as a routine four times a day (morning, mid-day, evening and night) from the AIR stations in the local language. During a cyclonic storm, such warnings are covered in the cyclone bulletins sent to the AIR stations at hourly or 3 hourly intervals for frequent broadcast. The fishermen can listen tothese broadcasts through portable radio receiving sets.
6.5.6.2. Warnings through FAX
In addition to warnings broadcast by AIR stations, direct warning messages are also
sentbytelefaxtoalargenumberofofficialsbelonging to the fisheries departments inmaritime states.
6.5.6.3. Format for Fisheries Warning
Fisheries warning No. _______________
Date and Time of Issue _____________
Information on Cyclone:
Cyclonic Storm lay over ________________ Bay of Bengal / Arabian Sea at a distance ___________ kms. _______________ from _________ at ____________ IST on ______________ (date)
Forecast:
Further intensification
Direction of Movement
Expected landfall area
Expected time of landfall
Warnings : Wind, Sea Condition and Tidal Waves
Storm Warning Signals at ports
Advice and Action:
i) Fishermen not to venture into open seas
ii) Fishermen at Sea not to come to the ports (names)_____ in coast.
iii) Fishermen to be cautious while going out in the sea
iv) Fishermen are advised to return to coast

136
CyClone Warning in india - Standard operation proCedure
6.5.7. Bulletins for All India Radio (AIR)
The cyclone warnings are also broadcast through AIR stations. After issuing the Cyclone Alert to the Chief Secretary and Collectors by FAX/mobile, the Cyclone Warning is also passed on to the concerned AIR stations for broadcast. In the Cyclone Alert message, the recipients are informed that the subsequent cyclone warnings will be broadcast from the concerned AIR station. When the cyclone is beyond the range of the coastal cyclone detection radar, that is, more than 400 km away from the coast, cyclone warnings are issued 6 times a day to the AIR stations and each warning is broadcast at frequent intervals interrupting the routine programme. When the cyclone comes within the radar range and is tracked by the radar hour to hour, cyclone warnings are issued every hour to AIR stations. During cyclone periods, the concerned AIR stations keep round the clock watch for broadcasting cyclone warnings.
6.5.7.1. Format for Cyclone Alert/Warning Bulletin for AIR/Press/Public :
Cyclone Alert / Warning Bulletin No. ______ issued by _____ at _____ Hrs. IST on _________ (Date) for repeated broadcast at hourly / half hourly intervals. Cyclone Alert / Warning for _______ Districts. Cyclone centred at _____ hrs. IST of ________ (date) about ____________ kms. ________ of (direction) _______(Place). Expected to
intensify further and move in a _________ direction and cross _______ coast near / between ____________ (Place)________ (day/time). Under its influence heavy to very heavy rain likely cause floods in _______ districts commencing from _________ (time/day). Gales speed reaching ______ kmph causing _______ damage ________in districts commencing from ____________ (Date/Time) Gale force winds reaching 70 kmph likely extend into _________ Districts, causing damage ___________ in ________ districts. Tidal wave of ________ m Likely inundate low lying area of _______ Districts at the time of crossing coast.
Advice to Fishermen :
Public advised to cooperate with the State authorities in disaster management efforts.
6.5.8. Coastal Bulletins for AIR News Cycle
In addition, arrangement has also been made with AIR New Delhi for broadcast of coastal weather bulletins for the different coastal belts, in Hindi, English and the local languages in the AIR news cycles three times a day, viz., in the morning, mid-day and at night. These bulletins contain information on the location, intensity and expected direction of movement of the cyclone, state of sea off the coast and expected adverse weather (heavy rain, gales and tidal waves) in the coastal districts.

137
bulletinS and WarningS
6.5.9.Registered/Designated Warnees
Warnings for heavy rain and gales are also issued by FAX/ e-mail/mobile to officersof the Revenue, P.W.D., Irrigation and Highways, DOT., Railways etc., who are on the warning list of the ACWCs/CWCs. For Andhra Pradesh, CWC Visakhapatnam gives these warnings from depression stage while MC Hyderabad issues during other periods. In addition, the warnings are kept in the Website for information.
6.5.10. Press Bulletins
Special press bulletins are issued during periods of cyclonic storms to local newspapers for giving publicity to the warnings.
6.5.11. Aviation Warnings
Warningsforairportsandflightoperationslikely to be affected by tropical cyclones are issued by the concerned Aviation MeteorologicalOffices.
6.5.12.Bulletin through Satellite Based Cyclone Warning Dissemination System (CWDS)
For quick dissemination of warning against impending disaster from approaching cyclones, IMD has installed specially designed receivers within the vulnerable coastal areas for transmission of warnings totheconcernedofficialsandpeopleusingbroadcast capacity of INSAT satellite. This is a direct broadcast service of cyclone warning in the regional languages meant for the areas affected or likely to be affected
by the cyclone. There are 352 Cyclone Warning Dissemination System (CWDS) stations along the Indian coast; out of these 101 digital CWDS are located along Andhra coast. The IMD’s Area Cyclone Warning Centres (ACWCs) at Chennai, Mumbai & Kolkata and Cyclone Warning Centre (CWCs) at Bhubaneswar, Visakhapatnam & Ahmedabad are responsible for originating and disseminating the cyclone warnings through CWDS. The bulletins are generated and transmitted every hour in three languages viz English, Hindi and regional language. The cyclone warning bulletin is up-linked to the INSAT in C band. For this service, the frequency of transmission from ground to satellite (uplink) is 5859.225 MHz and downlink is at 2559.225 MHz. The warning is selective and will be received only by the affected or likely to be affected stations. The service is unique in the world and helps the public in general and the administration, in particular, during the cyclone season. It is a very useful system and has saved millions of lives and enormous amount of property from the fury of cyclones. The digital CWDS have shown good results and working satisfactorily.
6.5.13.PersonalBriefing
In addition to the FAX message, the Chief Secretary of the concerned state is also kept informed over telephone/mobile/fax/internet by the ACWC/CWC about the location, movement and intensity of the storm and the areas expected to experience severe weather.

138
CyClone Warning in india - Standard operation proCedure
6.5.14. Bulletin through SMS
The bulletins are sent through SMS to various state disaster management agencies and the chief secretary, relief commissioner etc in case of a landfalling cyclone.
6.6. Other Products Generated by Cyclone Warning Division, New Delhi
Following graphical products are developed every six hours based on 00, 06,12 & 18
UTC by the CWD and sent to users. These products are also uploaded on the cyclone page of IMD website. The examples of these products are shown in Fig.6.5-6.8.
(i) Past and 72 hrs (00, 06, 12, 18, 24, 36, 48 and 72 hrs) forecast track and intensity with cone of uncertainty
(ii) Past and 72 hrs (00, 06, 12, 18, 24, 36, 48 and 72 hrs) forecast track with quadrant winds
(iii) TCAC bulletin in graphical format
(iv) Storm surge guidance
(v) Adverse weather warning graphics
Fig. 6.5. Typical example of track alongwith cone of uncertainty forecast issued by IMD
OBSERVED & FORECAST TRACK IN ASSOCIATION WITH CSTHANE OVER BOB BASED ON 0600UTC OF 28TH DEC.,2011
DATE & TIME IN UTCIST = UTC+05:30 HRS
CONE OF UNCERTAINITY
D : DEPRESSIONDD : DEEP DEPRESSIONCS : CYCLONIC STORMSCS : SEVERE CYCLONIC STORM
DD
31/0630/18 30/06 29/18 29/06 29/00 28/18
28/12 28/06 28/0027/12
27/06
27/00
26/18
26/12
26/06
26/00
25/18
25/12
75F 85F80F
THANE THANE
DDDDDD
D
D
CSCS CS CS
CS
CSCSCS
SCS SCS SCS SCS SCS
90F

139
bulletinS and WarningS
6.6.1.Track and Cone of Uncertainty
Cone of Uncertainty has been introduced since Dec 2009, with effect from cyclone, WARD. It is based on the standard errors of lastfiveyearsofdifferentforecastperiods.The standard errors are given in table 6.5 and an example of the uncertainty forecast is shown in the Fig. 6.5.The standard error for a given forecast time is considered as radius of the circle (R) with forecast latitude & longitude point as the centre of the circle. The cone of uncertainty is the tangent line constructed from the circles drawn for all forecast points.
Table 6.5. Radius of circle to construct cone of uncertainty
F/C Period Radius of the circle to construct cone of uncertainty
(km/nm)
12 hr 75/40
24 hr 150/80
36 hr 200/105
48 hr 250/135
60 hr 300/165
72 hr 350/190
96 hr 450/245
120 hr 550/300
6.6.2. Ship Avoidance Guidance
Radius of circle to construct the area of ship avoidance guidance is given in Table 6.6. The radius of this circle is the combination of radius of cone of uncertainty and the radius of gale wind (34 kts or more).
6.6.3 Tropical Cyclone (TC) Vitals
The TC vital contains the vital components required to describe a TC. It contains the location, intensity, radius of maximum wind, radii of 28, 34, 50 and 60 knots wind threshold in four different quadrants of the system (northeast, northwest, southeast and southwest) at the initial state and forecast states upto 72 hrs. The quadrant wind forecast is issued from the deep depression stage only and when the system is over sea. Issued 4 times a day based on 00, 06, 12 and 18 UTC observation and analyses. It is issued within 3 hrs of time of observation.
6.6.3.1. Format of TC Vitals
Q U A D R A N T W I N D D I S T R I B U T I O N I N
ASSOCIATION WITH______________(Name of
the system) over ___________(area and basin)
DATE AND TIME BASED UPON WHICH FORECAST
IS PREPARED:
PRESENT DATE AND TIME: ________ UTC
Table 6.6. Radius of circle to construct the cone of ship avoidance guidance
F/C Period
Radius (km/nm) of circle to construct cone of ship avoidance
12 hr Radius of 34 kts wind + 75/40
24 hr Radius of 34 kts wind + 150/80
36 hr Radius of 34 kts wind + 200/105
48 hr Radius of 34 kts wind + 250/135
60 hr Radius of 34 kts wind + 300/165
72 hr Radius of 34 kts wind + 350/190

140
CyClone Warning in india - Standard operation proCedure
PRESENT POSITION: _ _._0N/ _ _ ._0 E
POSITION ACCURATE TO 50 KM
MOVEMENT (DDD/FF) DURING PAST SIX HOURS:
_ _ _ /_ _KT
PRESENT WIND DISTRIBUTION:
MAX SUSTAINED WINDS: _ _ KT, GUSTS _ _
KT
RADIUS OF MAXIMUM WIND :
FORECASTS:
06 HRS, VALID AT:
DDHHMM Z(Time in UTC) _ _ .
_0N/_ _._0 E (F/C position in latitude/Longitude)
MAX SUSTAINED WINDS: _ _ KT, GUSTS _ _ KT
(Maximum sustained wind and gust in knots)
RADIUS OF 064 KT WINDS:
— NM NORTHEAST QUADRANT
— NM SOUTHEAST QUADRANT
— NM SOUTHWEST QUADRANT
— NM NORTHWEST QUADRANT
RADIUS OF 050 KT WINDS:
— NM NORTHEAST QUADRANT
— NM SOUTHEAST QUADRANT
— NM SOUTHWEST QUADRANT
— NM NORTHWEST QUADRANT
RADIUS OF 034 KT WINDS:
— NM NORTHEAST QUADRANT
— NM SOUTHEAST QUADRANT
— NM SOUTHWEST QUADRANT
— NM NORTHWEST QUADRANT
RADIUS OF 028 KT WINDS:
— NM NORTHEAST QUADRANT
— NM SOUTHEAST QUADRANT
— NM SOUTHWEST QUADRANT
— NM NORTHWEST QUADRANT
Forecast is similarly prepared for 12, 18, 24, 36, 48, 60 and 72 hrs. A graphics version of this bulletin is also prepared and sent to users as well as put up in website. A typical example is shown in Fig.6.6.
6.6.4. Storm Surge Warning
In the bulletin for India coast storm surge guidance is provided. It depicts the height of storm surge expected aboved the astronomical tide along the coast. Storm surge guidance for WMO/ESCAP Panel countries is being issued as and when necessary from April, 2009 onwards as per their requirement. It is added in the Tropical Cyclone Advisory Bulletin for WMO/ESCAP Panel Member countries. An example of storm surge guidance based on IIT, Delhi model is shown in Fig.6.7.
The storm surge guidance is provided in both text and graphic format. The guidance in text form is added in the bulletin for India coast. The storm surge warning in graphics is uploaded in website of IMD.
6.6.5. Heavy Rainfall Warning
In the bulletin for India coast heavy rainfall warning is provided. It describes the area of occurrence, time of occurrence and intensity of heavy rainfall. The heavy rainfall is provided in three categories, viz., heavy rainfall (7-12 cm), very heavy rainfall (13-24 cm) and extremely heavy rainfall (25 cm or more) expected in next 24 hrs. A graphical product is also given indicating the heavy rainfall warning. An example of heavy rainfall warning graphics is shown

141
bulletinS and WarningS
Observed and forecast track of cyclonic storm ‘Thane’over the Bay of Bengal based on 1800 UTC of 29Decmber, 2011
Date/Time in UTCIST=05:30+UTC
28-33 Knots34-50 Knots51-63 Knots>64 Knots
31/06THANE
30/18 30/12/06 30/00 29/18 29/12 29/099/06
29/00
THANE
28/21 28/18 28/12 28/06 28/00 27/12
27/06
27/00
26/18
26/12
26/06
26/00
25/18
75F70F 80F
- 0N
- 5N
25.
27/18
Fig. 6.6. Typical example of radii of quadrant wind forecast issued by IMD
Fig. 6.7. Storm surge guidance during cyclone AILA
Surge contour (m)–2009 Aila cyclone (RSMC Track)
22°
21°
20°
19°
18°84° 85° 86° 87° 88° 89° 90° 91° 92° 93° 94°
0.0 0.2 0.4 0.6 0.8 1.0 1.2 1.4 1.6 1.8

142
CyClone Warning in india - Standard operation proCedure
Fig. 6.8. A typical example of heavy rainfall warning graphics issued by IMD
in Fig.6.8. This product is available in website of IMD.
6.6.6. Gale Wind Warning
In the bulletin for India coast gale wind warning is provided. It describes the area of occurrence, time of occurrence and intensity of gale/squally wind along and off coastal districts. Depending upon the expected gale wind speed, the expected damage is indicated in the bulletin.
6.6.7. Crucial Observations
Crucial observations leading to decision of location and intensity is also mentioned in the bulletin issued for WMO ESCAP Panel countries.
6.6.8. Satellite and Radar Features
The characteristic features as observed in satellite and radar are included in the bulletin issued for WMO ESCAP Panel countries.

143
bulletinS and WarningS
6.6.9. Prognosis and Diagnosis
The prognostic and diagnostic features based on the prepared check list and decision making process is written at the end of the bulletin issued for WMO ESCAP Panel countries.
6.6.10.SignificantPastWeather
SignificantpastweatherismentionedintheBulletin for India coast. It is helpful for disaster management. It usually includes past 24 hr heavy rainfall recorded in different stations and also the gale wind observed in different places.
6.7. Damage Potential and Action Suggested in the Bulletin
The bulletin for India coast gives the expected damage and action suggested as given in Table 6.7.
6.8. Time of Issue of BulletinsThe time of issue of bulletin when the system is depression/cyclonic storm is given in Table 6.8 and 6.9.
In addition to the above mentioned table, the time of issue of Special Tropical Weather outlook may be issued at any time depending upon the formation/landfall of depression. For example, if the depression forms/crosses coast/dissipates over the sea at 0900 UTC, then the special tropical weather outlook can be issued based on 0900 UTC observation.
6.9. Numbering of Bulletins
The bulletins for India coast are numbered as follows. The first bulletin issued in connection with the second cyclonic disturbance over the Arabian Sea is given a number as ARB/2/1. The bulletin is further numbered from the issue of cyclone alert as cyclone alert No. 1, 2 etc., Cyclone warning No 1, 2, … etc.
6.10. Reference Time
The reference time mentioned in the bulletin has the following meaning.
Early Hours 0000 - 0400 Hrs. IST
Morning 0400 - 0800 Hrs. IST
Forenoon 0800 - 1200 Hrs. IST
Afternoon 1200 - 1600 Hrs. IST
Evening 1600 - 2000 Hrs. IST
Night 2000 - 2400 Hrs. IST
Early Morning 0400 - 0600 Hrs. IST
Around Noon 1100 - 1300 Hrs. IST
6.11. Terminologies in the Bulletins
Some of the important terminology used in the bulletin pertain to description of sea condition, amount/ intensity of heavy rainfall, distribution of rainfall etc. These are presented in following Tables.

144
CyClone Warning in india - Standard operation proCedure
Table 6.7. Damage potential and action suggested in Bulletin for India coast
Intensity Damage expected Action Suggested
Deep Depression50 – 61 kmph(28-33 knots)
Minor damage to loose and unsecured structures
Fishermen advised not to venture into the open seas.
Cyclonic Storm62 – 87 kmph(34-47 knots)
Damage to thatched huts. Breaking of tree branches causing minor damage to power and communication lines
Totalsuspensionoffishingoperations
Severe Cyclonic Storm88-117 kmph(48-63 knots)
Extensive damage to thatched roofs and huts. Minor damage to power and communication lines due to uprooting of large avenue trees. Flooding of escape routes.
Totalsuspensionoffishingoperations. Coastal hutment dwellers to be moved to safer places. People in affected areas to remain indoors.
Very Severe Cyclonic Storm118-167 kmph (64-90 knots)
Extensive damage to kutcha houses. Partial disruption of power and communication line. Minor disruption of rail and road traffic.Potential threatfrom flying debris. Flooding of escaperoutes.
Totalsuspensionoffishingoperations. Mobilise evacuation from coastal areas. Judicious regulationofrailandroadtraffic.People in affected areas to remain indoors.
Very Severe Cyclonic Storm 168-221 kmph (91-119 knots)
Extensive damage to kutcha houses. Some damage to old buildings. Large-scale disruption of power and communication lines. Disruption of rail androadtrafficduetoextensiveflooding.Potentialthreatfromflyingdebris.
Totalsuspensionoffishingoperations. Extensive evacuation from coastal areas. Diversion or suspensionofrailandroadtraffic.People in affected areas to remain indoors.
Super Cyclone222 kmph and more (120 knots and more)
Extensive structural damage to residential and industrial buildings. Total disruption of communication and power supply.
Extensive damage to bridges causing large-scale disruption of rail and road traffic. Large-scale flooding andinundationofseawater.Airfullofflyingdebris.
Totalsuspensionoffishingoperations. Large-scale evacuation of coastal population.
Total suspension of rail and road trafficinvulnerableareas.Peopleinaffected areas to remain indoors.

145
bulletinS and WarningS
Table 6.8. Time of issue of bulletin when the system is depression/deep depression
Bulletin BaseTime
IssueTime
BaseTime
IssueTime
BaseTime
IssueTime
BaseTime
IssueTime
BaseTime
IssueTime
BaseTime
IssueTime
BaseTime
IssueTime
BaseTime
IssueTime
Bulletin for Indiancoast
0000 0300 0300 0600 0600 0900 0900 1200 1200 1500 1500 1800 1800 2100 2100 0000
SpecialTropical WeatherOutlook
0300 0600 1200 1500
**DGM’s 0300 0600
***TC Vital 0000 0300 0600 0900 1200 1500 1800 2100
* In addition to the above mentioned table, the time of issue of TCAC Bulletin may be issued at any time depending upon the formation of cyclonic storm/landfall of cyclone. For example if cyclonic storm forms/crosses the coast at 0900 UTC then the bulletin may be issued based on 0900 UTC observations.
** DGM bulletin may be issued at any time on the change of intensity/landfall of the system.
*** TC vital is issued from Deep Depression stage onwards.
Table 6.9. Time (UTC) of issue of bulletin when the system is cyclonic storm
Bulletin BaseTime
IssueTime
BaseTime
IssueTime
BaseTime
IssueTime
BaseTime
IssueTime
BaseTime
IssueTime
BaseTime
IssueTime
BaseTime
IssueTime
BaseTime
IssueTime
Bulletin for Indiancoast
0000 0300 0300 0600 0600 0900 0900 1200 1200 1500 1500 1800 1800 2100 2100 0000
RSMC 0000 0300 0300 0600 0600 0900 0900 1200 1200 1500 1500 1800 1800 2100 2100 0000
*TCAC 0000 0300 0600 0900 1200 1500 1800 2100
TC Vital 0000 0300 0600 0900 1200 1500 1800 2100
**DGM’s 0300 0600

146
CyClone Warning in india - Standard operation proCedure
Table 6.10.: State of Sea
Descriptive Term Height Metres Wind Speed Knots (kmph) In Beaufort Scale
CALM (GLASSY) 0 0 0
CALM (RIPPLED) 0 - 0.1 1 - 3 (2 - 6) 1
SMOOTH (WAVELESS) 0.1 - 0.5 4 - 10 (7 - 19) 2 - 3
SLIGHT 0.5 - 1.25 11 - 16 (20 - 30) 4
MODERATE 1.25 - 2.5 17 - 21 (31 - 39) 5
ROUGH 2.5 - 4.0 22 - 27 (41 - 50) 6
VERY ROUGH 4.0 - 6.0 28 - 33 (52 - 61) 7
HIGH 6.0 - 9.0 34 - 40 (63 - 74) 8
VERY HIGH 9.0 - 14.0 41 - 63 (76 - 117) 9 - 11
PHENOMENAL OVER 14 64 or above (119 or above) 12
Table 6.11. Distribution of Rainfall
Distribution No. of Places Description
Isolated Isolated/One or two places <25% of area gets rainfall
Scattered A few places (26 –50)% of area gets rainfall
Fairly Widespread Many places (51 – 75)% of area gets rainfall
Widespread Most places (76 – 100)% of area gets rainfall
Table 6.12. Intensity of Rainfall
Descriptive term used Rainfall amount in mm
No rain 0.0
Very light rain 0.1- 2.4
Light rain 2.5 – 7.5
Moderate rain 7.6 – 35.5
Rather heavy rain 35.6 – 64.4
Heavy rain 64.5 – 124.4
Very heavy rain 124.5 – 244.4
Extremely heavy rain ≥244.5
Exceptionally heavy rain When the amount is a value near about highest recorded rainfall at or near the station for the month or season. However, this term will be used only when the actual rainfall amount exceeds 12 cm.

147
bulletinS and WarningS
Table 6.13(a). Check list of dissemination of bulletin by Cyclone Warning Division
Date Time (UTC)
S.N. Name of the bulletin Mode of dissemination
Time of issue
Time of dissemination
Remark Initial
1 Bulletin for Indian coast FAX
2 RSMC bulletin GTS
3 TCAC text bulletin GTS
4 Bulletin for Indian coast email
5 RSMC bulletin email
6 SMS(IMDoffials) SMS
7 SMS (Disaster management officersatDelhi)
SMS
8 SMS (State disaster managementofficersandACWC/CWCofficers)State:
SMS
9 SMS (State disaster managementofficersandACWC/CWCofficersState:
SMS
10 TCAC Bulletin (Honkong website)
ftp
11 TCAC graphical bulletin (ftp) ftp
6.12. Check list for procedures Due to the very heavy work load at the time of cyclone situations, utmost care should be taken not to miss any aspect of storm warning work. It is therefore essential
to have a check list so that warnings
issued, etc., are systematically checked.
Format given below is used as check list
to ensure issue of appropriate warnings
(Table 6.13).

148
CyClone Warning in india - Standard operation proCedure
Table 6.13(b). Cyclone Warning Check List for ACWCs/CWCs
S. No.
Item Bulletin based on
15UTC
Bulletin based
on 18UTC
Bulletin based
on 00UTC
Bulletin based
on 03UTC
Bulletin based
on 09UTC
Bulletin based on
12UTC
Special Bulletin, (if reqd. based on 2100 & 0600 UTC)
1. Inference
2. Coastal Bulletin
3. Port Warnings
4. 4Stage Warnings
5. AIR Bulletins
6. Gale Warnings (designated/ registered page)
7. HRW (Designated/ registred page)
8. Request for special observation or their discontinuance
9. Fisheries bulletin to AIR
10. Bulletin for AIR News cycle
11. CQ for OBS from ships
12. Tentative Aurora
13. Daily weather Report
14. Routine midday AIR Bulletin
15. Press Bulletin
16. Modification of localforecast
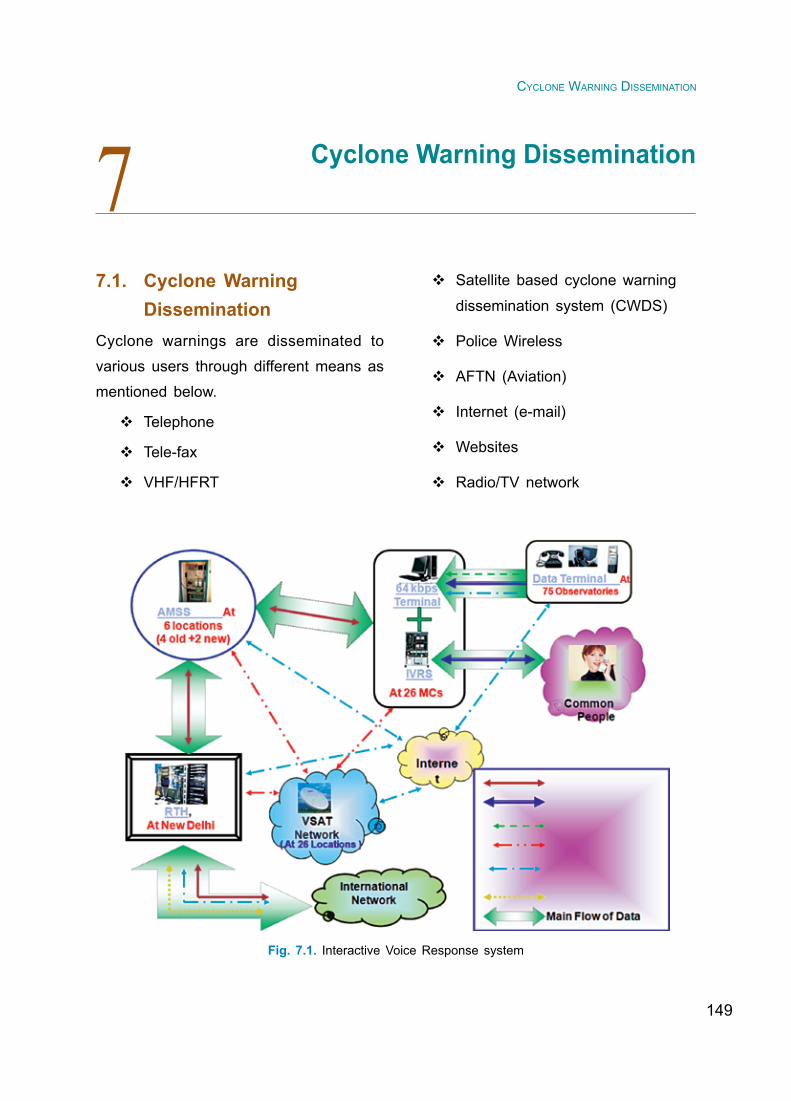
149
CyClone Warning diSSemination
7 Cyclone Warning Dissemination
7.1. Cyclone Warning Dissemination
Cyclone warnings are disseminated to various users through different means as mentioned below.
Telephone
Tele-fax
VHF/HFRT
Satellite based cyclone warning
dissemination system (CWDS)
Police Wireless
AFTN (Aviation)
Internet (e-mail)
Websites
Radio/TV network
Fig. 7.1. Interactive Voice Response system

150
CyClone Warning in india - Standard operation proCedure
Tabl
e 7.
1 D
isse
min
atio
n of
the
Cyc
lone
War
ning
s

151
CyClone Warning diSSemination
Mobile Phones
Interactive Voice Response System (IVRS)
SMS
These warnings/advisories are put in the website, www.imd.gov.in of IMD. In IVRS (Fig.7.1), the requests for weather information and forecasts from general public are automatically answered. For this purpose, the person has to dial a toll free number “18001801717” from anywhere in the country. This system has been installed at 26 Meteorological Centres/ Regional Meteorological Centres. High Speed Data Terminals (HSDT) are installed at almost all MCs and RMCs. HSDTs are capable of sending short warning message as SMS and the whole warning message as email.
As telephonic communication often breaks down during cyclones, the warnings meant for the Chief Secretary and Collectors of coastal districts are passed on to these officialsthroughpoliceW/Tchannels,FAXor by telephone to ensure that the warnings reach these officials quickly to enable them to take precautionary measures promptly.
In addition, as a part of State Level Disaster Management Plan, VHF set is installed at ACWC, Mumbai and CWC, Bhubaneswar for quick communication to State Control Room. Police W/T personnel are made available with their equipments installed at ACWC Kolkata for transmission of warning messages to State Govt. authorities during cyclone and monsoon seasons every year.
(a) (b)
Fig. 7.2 (a). CWDS network and (b). block diagram of typical CWDS site at a coastal station
35º
70º 75º 80º 85º 90º 95º
35º
30º
25º
20º
15º
10º
30º
25º
20º 8 35
31
1 6
81
100 (DIGITAL)
635
22
15º
10º
70º
2005 Feb 23 11:35:10 C W D S Network
75º 80º 85º 90º 95º
GMT
AREA CYCLONE WARNING CENTRE(ACWC)
FOR ORIGINATING CYCLONEWARNINGS VIA INSAT
CWDS AT CHENNAL CALCUTTA &MUMBAI
... ... ... Deptt of Telecom.............
Typical CWDS site at Coastal Station
Indoor unit + 24 V Batary
ALARMSIREN
3.8m
5859.225 Mhz
INSAT
IMD
END
LINKS
Cyclonewarning
TapeRecorder
Codetrans-mitter
DOT EARTHSTATIONFORUPLINKING
3.66m
2559.225 Mhz
C B
AN
D
FEC
AUDIOOUTPUT(CYCLONEWARNING)
POWERSUPPLY
RECEIVEOUTDOORUNITS
S
BAND
Areacode

152
CyClone Warning in india - Standard operation proCedure
7.1.1. Cyclone Warning Dissemination System (CWDS)
In addition to the above network, for quick dissemination of warning against impending disaster from approaching cyclones, IMD has installed specially designed receivers within the vulnerable coastal areas for transmission of warnings to the concerned officials and people using broadcast capacity of INSAT satellite. This is a direct broadcast service of cyclone warning in the regional languages meant for the areas affected or likely to be affected by the cyclone. There are 352 Cyclone Warning Dissemination System (CWDS) stations along the Indian coast; out of these 101 digital CWDS are located along Andhra coast. The IMD’s Area Cyclone Warning Centres (ACWCs) at Chennai, Mumbai & Kolkata and Cyclone Warning Centre (CWCs) at Bhubaneswar, Visakhapatnam & Ahmedabad are responsible for originating and disseminating the cyclone warnings through CWDS. The bulletins are generated and transmitted every hour. The cyclone warning bulletin is up-linked to the INSAT in C band (Fig.7.2).
For this service, the frequency of transmission from ground to satellite (uplink) is 5859.225 MHz and downlink is at 2559.225 MHz. The warning is selective and will be received only by the affected or likely to be affected stations. The service is
unique in the world and helps the public in general and the administration, in particular, during the cyclone season. Warning messages are received in local languages directly by CWDS receivers located in areas likely to be affected by the cyclone. It is a very useful system and has saved millions of lives and enormous amount of property from the fury of cyclones. The digital CWDS have shown good results and working satisfactorily.
7.1.2. Digital Meteorological Data Dissemination
IMD transmits processed imagery, meteorological and facsimile weather charts tofieldforecastingofficesdistributedoverthe country using the Digital Meteorological Data Dissemination (DMDD) facility, through INSAT in broadcast mode. The bulletins providing description of the cloud organization and coverage are also sent as advisory to forecasting officesevery synoptic hour. When cyclones are detected in satellite imagery, these bulletins are sent every hour. Such advisories are also transmitted to the neighbouring countries.
Processed satellite imagery, analyzed weather charts and conventional synoptic data are up-linked to the satellite in C-band. Satellite broadcasts these data to DMDD receiving stations in S-band. DMDD receiving stations analyze weather

153
CyClone Warning diSSemination
imagery and other data to generate required forecast. There are 37 no. of DMDD stations installed in India. Three DMDD receiving stations are also operating in neighbouring SAARC countries at Sri Lanka, Nepal and Maldives. These
stations are receiving direct broadcast of cloud imagery, weather facsimile charts and meteorological data on an operational basis. The frequency of transmission from ground to satellite (uplink) is 5886 MHz and that of downlink is 2586 MHz.

154
CyClone Warning in india - Standard operation proCedure
8 Pre-cyclone Exercise
The following are the instructions for action to be taken in the months preceding the pre and post -monsoon cyclone seasons (i.e. by about April and September) of each year.
8.1. Telecommunications (1) The Director in-charge at the ACWC/
CWC will contact personally the General Manager-Telephones, General Manager-Maintenance and Senior officials in-charge of telefax/mobile/internet communication systems at their respective stations and ensure that :
a) the local communication links at the ACWC/CWC consisting of Telephone/Telefax/mobile/internet connections are maintained in good working condition, especially during the days of cyclonic storms.
b) the telecommunication circuits connecting the station to other Me teo ro log i ca l O f f i ces a re maintained at highest efficiency. They may also be requested to designate local officers to serveas liaison officers for this purposeso that they can be contacted at times of breakdown to ensure quick service.
(2) Telefax machines at the stations should be maintained in good working condition. Essential spare parts should be requisitioned well in time and kept in store so that no breakdown occurs in the crucial time for want of these; maintenance staff also should be available on the spot during days of disturbed weather for immediate rectificationof faults.
(3) Police W/T: Any action required in connection with the issue of warnings through Police W/T should be completed. In particular, any shortcomings in this mode of communications noticed in the previous storm season should be discussed with the State Government authorities and remedial action should be taken.
8.2. Publicity and Broadcast of Warnings
Posters and Films
The ACWCs/CWCs should write to the State Government officials concerned for giving publicity to the people in the coastal districts about cyclones through cyclone posters and exhibition of the filmon cyclones.

155
pre-CyClone exerCiSe
Radio and TV Talks
Talks on radio and television should be arranged by the ACWCs and CWCs on the hazards of cyclones and precautionary measures to be taken before, during and after the storms. The system of warnings should be explained.
All India Radio
The station Directors of All India Radio station in the concerned State(s) should be alerted about the broadcast of cyclone warnings through AIR and to ensure that the stations keep extended watch for broadcast of additional weather bulletins whenever required. They should be requested to include storm warning bulletins in their Vividh Bharati broadcasts and FM Channel also at frequent intervals as these have popular appeal.
Newspapers
Proper liaison should be established with local newspapers for prompt publication of latest warnings.
8.3. Observational Data and Organisation
Inspection of Coastal Observatories
All the coastal observatories and co-operative cyclone reporting network of stations (as well as Police W/T stations in Tamil Nadu) should be inspected once in a year during April or September to ensure
that the instruments at these stations are in good condition and the observers are familiar with correct recording and reporting of observations. If any persistent error is noticed in the recording or reporting, the observer should be immediately instructed. Similarly, where the observatory sends its observations to the MC/RMC through W/T, telephone/FAX/e-mail, the communication aspects should also be checked up.
Radar and DMDD
Any deficiency in the operation of thecyclone detection radars, RS/RW and DMDD stations in the region should be immediately brought to the notice of DDGM (UI)/ DDGM (Satellite Meteorology) by the MC/RC concerned for immediate rectification. Maintenance of SDUC equipment and satellite equipment should be done by DDGM (Sat. Met.) New Delhi.
8.4. Reference Publications and Forms
Relevant reference publications, such as, Code of storm warning signals for use at Indian maritime ports, Weather services to shipping, fishing vessels andmaritimeinterests , the tide tables for the year, storm track atlas, code books, cyclone manual and required nomograms and T-classification tables for interpreting andassessing storm intensity from satellite pictures, etc., should be made readily availableforstormwarningwork.Sufficient

156
CyClone Warning in india - Standard operation proCedure
stock of all special type of charts and forms required for cyclone work should be kept at the ACWCs/CWCs/CWD.
8.5. Cyclone Manual As a part of the pre-storm season exercise, the officers and staff of ACWCs/CWCs/CWD engaged in storm warning work may go through the chapters of Cyclone Manual before each storm season and refresh themselves with the various procedures, so that procedural mistakes are totally avoided in operational work. A few informal classes should also be conducted for the benefit of persons newly posted to stormwarningwork.Alltheofficersandmembersof staff should make themselves familiar with the list of various types of warnees to be warned and the formats in which these warnings are to be issued. The Action Books may be checked up to ensure that all the items listed there are updated. The formats of the various warnings should also be kept ready for reference.
8.6. Telephone Fax and E-mail Address
The telephone, V-Sat, Fax, E-mail, mobile nos., addresses etc. of different ACWCs/CWCs/ Radar stations and other concerned offices such as local Doordarshan, AIR,Chief Secretary, Revenue Secretary, SRC, State Disaster Mitigation Authority, Port offices, Fisheries officials should bereadily available. In addition to above, the CWD should also maintain above updated
information in respect of national level disaster management agencies including NDM, NDMA etc.
8.7. Staff Matters
For relieving the heavy stress and strain on the forecasters in storm warning centres during storm period, CWD/ACWCs/CWCs should build up a reserve of personnel in the cadre of officers at these centres bytraining personnel working in the other units in storm warning work. For this purpose, all these persons may attend the forecasting work one day in a week by turn. Similar steps may be taken in CDRs to train reserve personnel wherever possible.
It is also essential that the staff posted at ACWCs/CWCs and coastal observatories are quite familiar with the various procedures connected with the cyclone warning work. The best available staff may be utilised in connection with storm warning work in view of its importance to the public. Sanctioning of leave to the staff engaged in operational forecasting work may be regulated to ensure availability of required number of trained and experienced persons for storm warning work.
8.8. Circular Letter to Warnees
Warnees to Listen to AIR
A circular letter is issued every year by about March or April and September by the ACWC/CWC informing the warnees

157
pre-CyClone exerCiSe
thatwhenevertheyreceivethefirstwarningfor cyclone, they may commence listening to the regional All India Radio Stations for latest information about the storm and its furthermovement and intensification.
Action Taken by Warnees
The action taken by the warnees on receipt of our warning messages should also be obtained from them by asking them through a circular letter to send the monthly statements in the required proforma (OBS 213 forms). Such action as may be necessary on these statements has to be taken by the concerned ACWC/CWC. The warnees have to be supplied with the forms every year.
Circular Letter to Chief Secretaries
A circular letter may be sent to the Chief Secretaries of maritime states for designating officers of these states forliaison with the storm warning centres on behalf of the State Government during cyclone periods.
CircularLetter to thePortOfficers
In the beginning of each cyclone season, the port officers are informed through acircular letter that they would be getting port warning messages from the ACWC/CWC whenever occasion demands. After the receipt of the first message at theport, the ports are expected to get at least one message in 24 hours in the case of
distant signals or more frequently whenever local signals are hoisted, till the advice for lowering the signals is received. In case, a port officer fails to receive suchmessages in time after the receipt of the firstmessage,hehastotaketheinitiativein contacting theACWC/CWC to find outthe actual position.
8.9. Ports
Visit to Ports
The ports are visited at least once in two yearsbyofficerswhoarewellconversantwith storm warning work. Usually, one of the officers of theACWC/CWC proceedson these tours as he will be in the best position to keep liaison with ports receiving storm warnings. He will also examine the arrangement for display of storm warning signals and also find out how effectivelythe storm warning system functioned particularly during periods of depressions orstorms.Thevisitingofficerwillseethatall the day and night signals are available and in proper condition, ready to be hoisted when warning telegrams to hoist them are received.Aftereachvisit,theofficersubmitsa report about his visit incorporating his suggestions for the improvement of the warning system. The form of Hand-book of Ports is also filled up by the Officerand these reports are to be sent to the concerned ACWC for consolidation and submission to DDGM(WF) with suitable recommendations for further action.

158
CyClone Warning in india - Standard operation proCedure
Guidelines
The following guidelines in connection with the visits to ports may be followed:
i) Every port exhibiting signals should normally be visited once in two years.
ii) The visits to the ports without signals are to be undertaken primarily to ensure that (a) satisfactory arrangements exist at these ports for the reception of warnings and (b) their prompt communication to the people concerned. It may, therefore, be useful to visit these ports also, say at least once in four or five years.
(iii) Ports affected by a storm may also be specially visited as and when considered necessary in order to ascertain how the warning system functioned during the storm.
(v) The visits to ports are to be treated more or less on a par with the inspection of observatories and may therefore be arranged for by the DDGM at their discretion.
(vi) The programme of visit to ports may be forwarded to CWD and DDGM (WF)’s office before the tours are actually undertaken.
(vii) In case, DDGM (WF)’s office at any time considers that a particular port should be visited for a special reason, the R.M.C. concerned will be advised.
Early Action
Actionassuggestedbythevisitingofficersin their inspection reports should be examined for early implementation as may be found necessary.
8.10 Meeting with the Chief Secretaries of the Maritime States
Participation in the Annual Conference of Collectors
The Officer-in-charge of the ACWCs/
CWCs/MCs connected with storm warning
work will meet the Chief Secretaries of the
concerned States every year to apprise
them of our storm warning service. The
Chief Secretaries of the maritime States
may also be requested to invite the DDGM
(RMCs) of Mumbai, Kolkata and Chennai
for participating in the Annual conference
of Collectors so that they can explain to
the Collectors the functioning of the storm
warning organisation and other details
regarding the issue of warnings, etc.,
There can also be discussions between
the Storm Warning Officers on the one
hand and the State Government officials
on the other for a better understanding and
improvement of the storm warning system
particularly regarding the dissemination of
storm warning messages.

159
pre-CyClone exerCiSe
Meeting Chief Secretary
The officers-in-charge of ACWCs/CWCs/MCs connected with storm warning work should also meet the Chief Secretary whenever a new incumbent takesoffice.
8.11. Visit to Coastal Radio Station
When an official proceeds on tour to observatories, they may visit the coastal radio stations (if it functions there) and impress on the staff, the need to receive as
many ship’s observations as possible and to pass them promptly to the Meteorological offices.
8.12. User’s Workshop
The ACWC’s and CWC’s should organize the User’s Workshop, preferably once in two years to apprise the User’s about the cyclone warning activity of IMD and collect their comments and feedback for further improvement of cyclone warning services in the country.
160
CyClone Warning in india - Standard operation proCedure
9 Post Cyclone Action
The present procedures and instructions on the various items of post-cyclone action are described in this chapter.
9.1. Preliminary and Final Reports
Immediately after a storm crosses coast and weakens into a depression, a preliminary report is prepared and put up in the website within a week by CWD, New Delhi. The finalreportwhichwillbepreparedwithinamonth will be arranged under the following heading:
(1) Brief history of the storm.
(2) Weather and damage caused.
(3) Warnings to State Government officials.
(4) Broadcasts of warnings over AIR (and T.V.).
(5) Port warnings.
(6) Fisheries warnings.
(7) Adequacy and timeliness of warnings.
(8) Performance of NWP and statistical models.
(9) Forecast and Warning verificationresults
The brief history will contain an account of the system from the depression stage onwards including its intensification intoastorm/ severe storm, landfall and subsequent weakening. Crucial observations, if any, should be briefly referred to. A tentativetrack of the cyclone as well as the path as tracked by the Cyclone Detection Radar (if the cyclone was under radar surveillance) should also be included.
The important points under Weather and damage caused to be covered under this heading are:
i) Areas affected by severe weather associated with the storm-tidal waves, gales, heavy rainfall including floods.Districts, taluks, towns or villages worst affected may be specifically mentioned.
ii) Extent of damage caused to (a) agricultural and garden crops (b) buildings, (c) railway tracks and stations, (d)Telegraphic and electrical poles and installations (e) highways, avenue trees etc. (f) Dams and minor irrigation (g) estimated loss of life (human as well as cattle), loss of property and people rendered homeless. (h) Damage to ships at ports and port installations. This should be based on available reports in newspapers, from

161
poSt CyClone aCtion
Touring Officer’s report as well as from Government sources. However, the preliminary report should not be unduly delayed awaiting the Touring Officers’ return to Head Quarters. Under Warning to State Government Officials,four Stage Warnings including pre-cyclone watch and post land fall outlook to State Government officialssuch as Chief Secretary, Collectors of Coastal Districts etc., should be given in this parabriefly.
Specificmention should bemadeas to:
(i) When the information about the cyclonic storm (viz., Pre-cyclone watch and “Cyclone Alert”) was first conveyed to the Chief Secretary (ies) of the concerned State Government(s) and the coastal District Collectors.
(ii)Whenthefirstnumberedwarningunderthe Four Stage Warning System was sent to theaboveofficials
(iii) The elements for which the warnings were issued and the number of times warnings were sent to them during the storm period.
Under Broadcasts of Warnings over A.I.R., the information given here should cover:
i) Special AIR Bulletins under the Four Stage warning system and the times of issue of the first and subsequentcrucial bulletins as well as the total number of bulletins issued.
ii) The number of hourly bulletins issued after the storm came within the range of cyclone detection radar and tracked withahighdegreeof confidence
iii) Whether the watch hours of the A.I.R. station were extended and if so the period of extension.
iv) The time of issue of the first coastalweather bulletin for broadcast in AIR news cycle from New Delhi and total number of such bulletins issued.
Under Port Warnings, the progression of signals hoisted at the various ports may begiven.Thefirsthoistingandsubsequentlowering of Great Danger / Danger Signals should be mentioned.
Report on Fisheries Warnings should contain
i) Whether appropr ia te warn ings commensurate with the intensity of the system were included in the four routinedailyAIRbulletinsforfishermenandinthewarningsforfisheriesofficialsin the designated / registered pages.
ii) Whether advice to fishermen not toventure into the sea was conveyed sufficiently early.
Under Adequacy and timeliness of warnings, it should include the verification report offorecasts issued by IMD. How far the warnings were timely and adequate should be mentioned. The effectiveness of the storm warning system has to be assessed

162
CyClone Warning in india - Standard operation proCedure
from the user’s point of view by having personal discussion with the recipients of the different warnings. For this purpose, the DDGM should meet the Chief Secretary of the concerned state. The DDGM can travel by air without making a reference to H.Q. to meet the Chief Secretary and the concernedportofficials,fisheriesofficials,etc. immediately after a cyclonic storm has hitthecoastalareas.ThetouringOfficer’sreport if available by this time should also be utilised. Newspaper comments and/or extracts of appreciation expressed by public/officialswhowere recipients of thewarnings should be included.
To facilitate the preparation of the preliminary report the particulars of all warnings issued are to be tabulated by the ACWC/CWC in the format given in Appendix A.
9.2. Press Bulletin
Immediately after the system has crossed the coast, a special press bulletin highlighting the timely warnings given by the Department should be issued. The press bulletin may be issued by the DDGM and a copy sent to DDGM(WF) and DDGM(S).
9.3. Final Report
The preliminary report will be followed by a detailedfinalreporttobepreparedbytheACWC and sent to DDGM(WF), Pune with a copy to DDGM(S), New Delhi. Whenever
necessary, the CWC will send the relevant material in the required format to the parent ACWC for preparing the report.The finalreport will have 9 statements with the following contents;
1. History of the storm, its track, crucial observations that helped in assessing the intensity of the storm and details of damage caused.
2. Port warnings
3. Cyclone bulletins to local AIR stations and AIR New Delhi for News cycle.
4. Four Stage Warnings including pre-cyclone watch and post landfall outlook toStateGovt.officialsandwarningstofishermen.
5. Statement of special observations called for
6. Statement of air fieldwarnings.
7. List of FAX messages.
8. In addition, a statement giving copies of log book entries indicating the action taken by the Meteorologist for alerting highrankingStateGovernmentofficialsresponsible for taking precautions may also be sent as Statement VIII. Verification of forecast of rainfall andlandfall (May be sent alongwith the brief report with Appendix B in case of cyclonic storm which do not cause any damage/serious damage.

163
poSt CyClone aCtion
9.4. Scrutiny of Action Taken by ACWC/CWC
It is also desirable that DDGM scrutinise the action taken by the ACWCs/ CWCs and bring to the notice of the persons concerned any major omissions or discrepancies either in the text of the warnings issued or the procedure followed. Such instances should also be brought to the notice of DDGM (WF) by the DDGM RMC while forwarding the reports together with their assessment on the timeliness and adequacy of the warnings issued by the ACWCs/CWCs. The final scrutiny will becarried out by DDGM (WF) Pune and the remarks will be sent to the ACWCs with a copy to DDGM(S) New Delhi. ACWC will send the relevant portions of DDGM (WF)’s remarks to the CWC whenever necessary. DDGM will also arrange to check up whether all the Designated / Registered warnees concerned have been warned in connection with the storm and point out omission, if any, in this regard to ACWC/CWC, as warnings issued to Designated / Registered warnees are not included in any of the statements in the final reportsent to DDGM (WF).
9.5. VisitofOfficer toCycloneAffected Areas
9.5.1. Assessment of Damage
Whenever a cyclonic storm/severe cyclonic storm, on striking coast, causes
considerable damage to life and property, anofficerfromtheconcernedregionshouldbe sent on tour to visit the affected areas to assess the nature and extent of the damage caused, both from the economic andscientificpointsofview.DDGM(WF)Pune and DDGM (S) New Delhi should be informed by FAX about the tour. The touring officer shouldvisit thecrucial locations inthe storm-affected area, contact various StateandCentralGovernmentofficersandinterview people to examine how effectively the storm warning system worked. He will submit his report to the DDGM immediately after his return from tour.
9.5.2. Purpose of Survey
The main purpose of a survey of the damage caused by the cyclones is to assess in greater detail than is possible with the available synoptic observations and press reports, the track, intensity and other characteristics of the storm and to evaluate the effectiveness of the warnings issued.Thetouringofficer’sreportshould,therefore, include the following:
(i) Track followed by the storm.
(ii) The ‘eye’ or calm centre and its characteristics
(iv) Duration of the lull period
(v) Areas affected by gales and relative strength of winds in the different quadrants.

164
CyClone Warning in india - Standard operation proCedure
(vi) Estimate of the maximum wind speed
(vii) Recession of the sea
(viii) Storm surges
(ix) Rainfall associated with the storm
(x) Comments from the recipients of the warnings about accuracy and timeliness of the warnings;
(xi) Suggestions and recommendations for the improvement of the storm warning system/ observational network, etc.
Keeping the above in view, the touring officer should try to obtain and keep arecord of such information which will enable him to estimate, as quantitatively and objectively as possible, the above features associated with the storm. In order to assist theMeteorological Officerwho goes for such a survey, detailed guidelines are available in SOP for Post-event Survey (SOP No.1/2013). It is also advisable that the officers at CWC andACWCs go through the reports of such past surveys made earlier, to familiarise themselves with the work. The offices should also keep these touring officer’sreports bound as permanent records as they contain valuable scientific data onstorms, collected with great effort, which may be required in the future.
9.5.3. Annual Cyclone Review Meeting
The primary aim of these meetings is to recommend steps for further improvements in the storm warning service on the basis of the actual working of the system during the storm season of the previous year. Towards this end, discussions should centre around the following points regarding the storms of the year under review:
1 Accuracy and timeliness of the warnings issued by the different ACWCs/ CWCs.
2 Notable successes and failures.
3 Comments on unsat isfactory warnings, if any, and where possible, the manner in which they could be improved.
4 Adequacy or otherwise of data in each case, including ships observations, radar and satellite observations and aircraft reports.
5 Adequacy or otherwise of telecomm-unication facilities, both for receipt of data and dissemination of warnings.
6 Deficiencies, if any, in any otheraspects of the organisation which require improvement.
7 Major synoptic problems, from the standpoint of analysis and prognosis, experienced in the different cases.
165
poSt CyClone aCtion
These may include steering, intensificationandweakeningofthesystems, estimation of wind speed, storm surges, heavy rainfall etc.
9.5.4 Back-plotting and Re-analysis
After the storm is over, all the working charts have to be completed by back plotting the late data, ships’ log etc. and the charts re-analysed in all the Storm Warning Centres.
Based on the re-analysis after back-plotting of charts and utilising additional information
available through touringofficers’ reports,radar and satellite pictures etc., the centres will be refixed and the tracks ofthestormsfinalisedatDDGM(WF)’sofficeand be presented in ACR meeting. It will be reviewedbyatrackfinalizationcommittee.The finalized track will be considered forofficial purposes and future records. Thefinal storm accounts will be prepared byDDGM(WF)’sofficeandsentbyMarch/Aprilfor publication in the July issue of ‘Mausam” and the same will be considered by CWRC, Chennai for modifying the e-Atlas.

166
CyClone Warning in india - Standard operation proCedure
APPENDIX: A (Preliminary Report)
Action taken by ACWC/ CWC ________________________ on the __________________ cyclonic storm of __________ (date)
Date Time of
chart UTC.
System, its intensity
Port Warnings
Four stage warnings
(including Pre-cyclone
Serially numbered cyclone bulletins to local AIR
stations and coastal weather
Warnings to fishermen.
location & expected movement
watch and post land fall outlook) to State Government officials
bulletins for News Cycle
1. 2 3 4 5 6 7 This column will show the ports warned, the signals at these ports and the time of issue of the warnings.
This column will show the collectors and Chief Secretaries warned, the elements for which they are warned and the area covered by the warnings (in terms of districts.) Time of issue______ IST to____________ IST
This column will show the local AIR stations to whom the cyclone bulletins were sent, their serial number, the elements and area covered (The elements and area need not be repeated in this column if they are the same as in column 5). (Time of issue _____ IST to _________ IST) Also indicate whether coastal weather bulletins sent to AIR New Delhi for News Cycle and the times of issue.
This column will show the coastal areas warned (in terms of districts), the elements, AIR stations to which sent (Time of issue___ IST to _____ IST)

167
poSt CyClone aCtion
APPENDIX – B (FINAL REPORT)
STATEMENT – 1
A BRIEF ACCOUNT OF THE STORM WITH TRACK OF THE STORM
STATEMENT – II
STATEMENT OF PORT WARNING MESSAGES
Date Time of issue of telegram IST Chart on which based UTC. Ports to which sent Text of messages
STATEMENT – III
SPECIAL BULLETINS (INCLUDING COASTAL WEATHER) TO A.I.R. STATIONS
Date Time of issue of telegram IST
Chart on which based UTC.
A.I.R. Station to which sent
Text of messages
STATEMENT – IV
FISHERIES AND FOUR STAGE WARNINGS
Date Time of issue (IST) Chart on which based UTC Text of warning To whom sent
STATEMENT - V
SPECIAL OBSERVATIONS CALLED FOR
Date and time of requisition IST Station Observations called for Frequency of observations From To
Example:
140640 Puri 150600Z 181500 Z Hourly 160850 Cuddalore 171500Z 190000 Z 3 Hourly
STATEMENT – VI
AIR FIELD WARNINGS
Date Time of issue UTC/IST Text Issuedby(ForecastingOffice)

168
CyClone Warning in india - Standard operation proCedure
STATEMENT – VII
LIST OF FAX MESSAGES AND STD CALLS HIGHER THAN URGENT
Date To whom Purpose Remarks
STATEMENT – VIII
COPIES OF LOG BOOK ENTRIES FOR ALERTING HIGH RANKING STATE GOVERNMENT OFFICIALS
Date Time Officialcontacted Text of Message Mode of contact (telephone etc.) By whom
STATEMENT – IX
VERIFICATION OF FORECAST OF RAINFALL
ADate/time Name of District Forecast of heavy / very heavy rainfall/ex-
tremely heavy rainfall Actual Percentage of ac-
curacy
Total :
Note : For verificationof rainfall forecastDRMSdatamaybeutilised.
VERIFICATION OF FORECAST OF GALE WIND
BDate/time Name of District Forecast of gale wind (kts/kmph) Actual wind (kts/kmph) Error
VERIFICATION OF FORECAST OF STORM SURGE
C Date/time Name of
DistrictForecast of Storm surge height(m)
Actual Storm surge height(m)
Error
169
management of CyClone and Common man
10 Management of Cyclone and Common Man
Inundations caused by storm surge, uprooting of trees and damage caused by that, flooding of low lying areas dueto heavy rain and damage to houses and communication due to very strong winds are the devastations due to cyclone, which can not be protected by a common man and has to be mentally prepared to accept the loss. However, a common man can take many important precautionary steps to save life and property. Some of these steps are mentioned below.
10.1. Steps to be Taken Before the Cyclone
(i) Check houses, secure loose tiles by cementing wherever necessary, repair doors and windows.
(ii) Check the area around the house -remove dead or dying trees, anchor removable objects like lumber piles, loose bricks, garbage cans, sign-boards, loose zinc sheets etc.
(iii) Keep some wooden boards ready so that glass windows can be boarded.
(iv)Keep a hurricane Lantern filled withkerosene, flash light and enough drycells.
(v) Prompt ly demol ish condemned buildings.
(vi) Those who have radio sets should ensure that the radio is fully serviceable. In the case of transistors an extra set of batteries should be kept handy.
10.2. Steps to be Taken During the Cyclone
(i) Keep your radio on and listen to latest weather warnings and advisories from the nearest AIR station. Pass the information to others.
(ii) Avoid being misled by rumours. Pass only the official information you havegot from the radio to others.
(iii) Get away from low lying beaches or other locations which may be swept by high tides or storm waves. Leave sufficiently early before your way tohighgroundgetsflooded.Donotdelayand run the risk of being marooned.
(iv) If your house is out of danger from high tides and flooding from the river,and it is well built, it is then probably the best place. However, please act promptly if asked to evacuate.
(v) Be alert for high water in areas where streams of rivers may flood due toheavy rains.
170
CyClone Warning in india - Standard operation proCedure
(vi) Board up glass windows or put storm shutters in place. Use good wooden planks Securely fastened. Make-shift boarding may do more damage than none at all. Provide strong suitable support for outside doors.
(vii) If you do not have wooden boards handy, paste paper strips on glasses to prevent splinters flying into the house.
(viii)Get extra food, especially things which can be eaten without cooking or with very little preparation. Store extra drinking water in suitably covered vessel.
(ix) If you are in one of the evacuation areas, move your valuable articles to upper floors to minimise flood damage.
(x)Havecyclonelantern,flashlightsand/or other emergency light in working condition and keep them handy.
(xi) Check on everything that might blow away or be torn loose. Kerosene tins, cans, agricultural implements, garden tools, road signs and other objects become weapon of destruction in strong winds. Remove them and store them in a covered room.
(xii) Be sure that a window or door can be opened on the lee side of the house i.e. the side opposite the one facing the wind.
(xiii)Make provisions for children and adults requiring special diets.
(xiv)If the centre of’ ‘eye’ of the storm passes directly over your place, there will be a lull in the wind and rain, lasting for half an hour or more. During this period stay in safe place. Make emergency repairs during the lull period if necessary, but remember that strong wind will return suddenly from the opposite direction, frequently with even greater violence.
(xv) Be calm. Your ability to meet emergency will inspire and help others.
10.3. Steps to be Taken After Cyclone
(i) They should remain in shelters until informed by those in charge that they may return home.
(ii) Any loose and dangling wire from the lamp post should be strictly avoided.
(iii) People should keep away from disaster areas unless they are required to assist.
(iv) Anti-social elements should be prevented from doing mischief and reported to the police.
(v) Cars, buses lorries and carts should be driven carefully.
(vi) The houses and dwellings should be cleared of debris.
(vii) The losses should be reported to the appropriate authorities.

171
management of CyClone and Common man
(viii)Relatives should be promptly informed about the safety of persons in the disaster area.
10.4. Linkage of IMD with Cyclone Disaster Management
IMD has established linkages/institutional arrangements with disaster management agencies both at the centre and in the states. During normal weather conditions four bulletins are transmitted to Control Room of National Disaster Management Division (NDM). In a case of depression developing over north Indian Ocean which has the potential to affect Indian coast, special bulletins at-least five timesa day. When the system intensifies intoa cyclonic storm, the cyclone warning bulletins are issued every three hourly. At present 4 stage warning procedure as discussed earlier is followed for issuing bulletins to NDM Control Room. When the system weakens or not going to affect Indian coast, a dewarning message is also issued to NDM Control Room. The cyclone warning bulletins are also passed
on to State Government Authorities/District Collectors who are in constant touch with Cyclone Warning Centres. The centres and local committees consisting of various departments dealing with disaster management issues meet at the time of crisis and take necessary follow up actions with the input on warning from IMD.
The linkage between IMD and disaster management agencies exists in all stages, viz.,
(i) Pre-cyclone preparedness during season
(ii) Dyring occurrence of cyclone
(iii) Post-cyclone action stage
Further l inkage also exists in the following
(i) Capacity building through research and development, training and infrastructure development including construction of cyclone shelter etc and preparation of guideline for management of cyclone
(ii) Hazard, vulnerability and risk analysis for cyclone disaster mitigation

172
CyClone Warning in india - Standard operation proCedure
11 Conclusions and Future Scope
The design of a TC warning system in IMD takes into consideration of the prevailing state of the meteorological science, the available technological means of communication, the built-up environment such as dwell ings, socio-economic conditions, appropriateness of protective actions as well as the expectations of the society. To maximise relevance and effectiveness of the TC warning, strategies are formulated in respect of the design of the forecast, triggering mechanisms, coordination with disaster management agencies, warning products generation, presentation & dissemination. Scientific and technological advances in TC forecasting are translated into
effectiveness of TC warning. The forecast and warning operations and decision-making process is made by blending scientifically based conceptual models,meteorological datasets, technology and expertise.
IMD continuously expands and strengthens its activities in relation to observing strategies, forecasting techniques, disseminating methods and research relating to different aspects of TC to ensure most critical meteorological support through observations, analysis, predictions and warnings to disaster managers and decision makers not only in the country but also to the NIO rim countries.


For more information contact
CYCLONE WARNING DIVISIONINDIA METEOROLOGICAL DEPARTMENT
MAUSAM BHAVAN, LODI ROADNEW DELHI-110003
TEL : (011) 24652484FAX : (011) 24623220
Email : [email protected]. : www.imd.gov.in