Tropical Cyclone Report Tropical Storm Bret (AL022011) National
Queensland Fire and Emergency Services
Emergency Management
Tr o p i c a l Cy c l o n e S t o r m T i d e Wa r n i n g
Response System Handbook
12th Edit ion
3 Tropical Cyclone Storm Tide Warning Response System HandbookE D I T I O N 12 2 0 1 6
Contents
Preface 2
Contents 3
Acronyms 4
Tidal Levels 5
Storm Surge, Storm Tide 6
Agency Responsibility in Storm Tide Warning and Response 8
Storm Tide Warning Response System 11Overview 11
Storm Tide Warning 11
Standard Emergency Warning Signal (SEWS) 14
Technical considerations and local effects 14
Storm Tide Warning - Response System 15
Storm Tide Warning Graphic 16
An example of a Storm Tide Warning 17
Disaster Management Response 19Overview 19
Queensland Evacuation Guidelines 20
Roles during a storm tide response 21
Emergency Response Maps 24
Appendices 25
Appendix A: Tidal Planes 25
Appendix B: Storm Tide Gauge Network 26
Appendix C: Tropical Cyclone Warning Service 27
Appendix D: Storm Tide Effects on Coastal Centres and Accompanying Maps and Tables 31
Appendix E: Storm Tide Warning and Graphic Locations 86
Appendix F: Useful Storm Tide References 88
Appendix G: Useful Web Sites 92
Appendix H: Maps and Figures Contained in this Document 93
Appendix I: Storm Tide Warning Quick Reference Guide 95
1.
2.
3.
4.
5.
6.
4Tropical Cyclone Storm Tide Warning Response System Handbook E D I T I O N 122 0 1 6
Bureau Bureau of Meteorology
DDC District Disaster Coordinator
district group(s) district disaster management group(s)
DDMG Disaster District Management Group
DDO Declared Disaster Officer
DEM Digital Elevation Model
DSITI Department of Science, Information Technology and Innovation
the Act Disaster Management Act 2003
IGEM Inspector-General Emergency Management
LDMG Local Disaster Management Group
POCC Protecting our Coastal Communities Project
QEG Queensland Evacuation Guidelines (refer to guidelines at http://www.disaster.qld.gov.au/Disaster-Resources/
Documents/2907EMQ_SDMG_QLD_Evac%20Guide_web.pdf)
QDMA Queensland Disaster Management Arrangements
QDMC Queensland Disaster Management Committee
QFES Queensland Fire and Emergency Services
QPS Queensland Police Service
QTCCC Queensland Tropical Cyclone Consultative Committee
SDC State Disaster Coordinator
SDCC State Disaster Coordination Centre
SDMP State Disaster Management Plan
SES State Emergency Service
SEWS Standard Emergency Warning Signal
(refer to guidelines at http://www.disaster.qld.gov.au/Disaster-Resources/Documents/
Standard%20Emergency%20Warning%20Signal%20SEWS.pdf)
TCWC Tropical Cyclone Warning Centre
TMST Theoretical Maximum Storm Tide
Acronyms
5 Tropical Cyclone Storm Tide Warning Response System HandbookE D I T I O N 12 2 0 1 6
HAT Highest Astronomical Tide The highest water level that can be predicted to occur at a particular site under average weather conditions. This level may not be reached every year.
LAT Lowest Astronomical Tide The lowest water level that can be predicted to occur at aparticular site under average weather conditions. This level may not be reached every year.
LWD Low Water Datum Low Water Datum was superseded by the Lowest Astronomical Tide Datum in 1994.
AHD Australian Height Datum Australia’s vertical datum which approximates mean sea level.
PD Port Datum Predicted heights of the Astronomical Tide found in Tide Tables are referenced to Port Datum which is equivalent to LAT.
MSL Mean Sea Level The average level of the sea over a long period (preferably 18.6 years) or the level of the sea in the absence of tides.
MWL Mean Water Level The mean surface level as determined by averaging the heights of the water at equal intervals of time. At the shoreline this includes wave setup and storm surge.
SWL Still Water Level The surface of the water if all wave and wind action were to cease.
Tidal Levels
6Tropical Cyclone Storm Tide Warning Response System Handbook E D I T I O N 122 0 1 6
1.1 The main threats from tropical cyclones come specifically from storm surge, high winds and torrential rain. Potentially the most dangerous of these phenomena is the ‘storm surge’.
1.2 As a major cyclone approaches the coast, high winds whip up the sea generating currents which push a raised mound of seawater (referred to as a ‘storm surge’) onto the shore. This could be up to 50 kilometres or more across – and up to several metres high.
1.3 It is important to understand that a storm surge is not merely a travelling wave of short duration - but a massive three-dimensional movement of seawater that can last several hours. The storm surge comes across the shoreline like a rapidly rising tide. The danger lies in the fact that the sea level could exceed high water mark by some metres and flood coastal land.
1.4 The highest storm surges along Queensland’s east coast usually occur on the immediate left hand side (relative to the direction of movement) of a land falling cyclone centre – just outside the eye and within the belt of strongest onshore winds. On Queensland’s east coast, this is usually on the southern side of a land-falling cyclone. In the Gulf of Carpentaria this is usually on the eastern or northern side.
1.5 The storm surge height depends on a range of factors including: (a) intensity and size of the cyclone – the stronger the winds the higher the surge; (b) shape of the seafloor – the more gentle the slope the greater the surge; and (c) speed and angle of approach of the cyclone to the coast. The height can be worsened by funnelling effects of bays and estuaries, and river and local flooding caused by torrential rain.
1.6 Of most significance is the wind stress on the ocean surface. This produces an elevation of seawater level in areas of onshore winds and a depression in areas of offshore winds. The low pressure in the cyclone has a smaller affect.
1.7 Records of Queensland storm surges are very incomplete. The Bathurst Bay cyclone of 1899 allegedly produced a storm surge in excess of 10 metres with 307 lives lost at sea. Note that some recent surveys question this great height. Other notable surges include 3.7 metres at Mackay (1918); 3.6 metres just north of Townsville (Althea 1971); 3.3 metres in Upstart Bay near Ayr (Aivu 1989); 3 metres in the Gulf of Carpentaria (Barry 1996); 2.3 metres at Clump Point (Larry 2006); and 5.3 metres at Cardwell (Yasi 2011).
1.8 Storm surges up to 7 metres have been recorded in the eastern Gulf of Carpentaria, but could also occur (rarely) around most of the Gulf and in some east coastal areas with shallow gently sloping seabeds and bays.
1.9 Elevated sea levels are also the result of wave action, which is caused by the onshore mass transport of seawater. Note that wave action can have a battering effect on vulnerable structures near the shoreline.
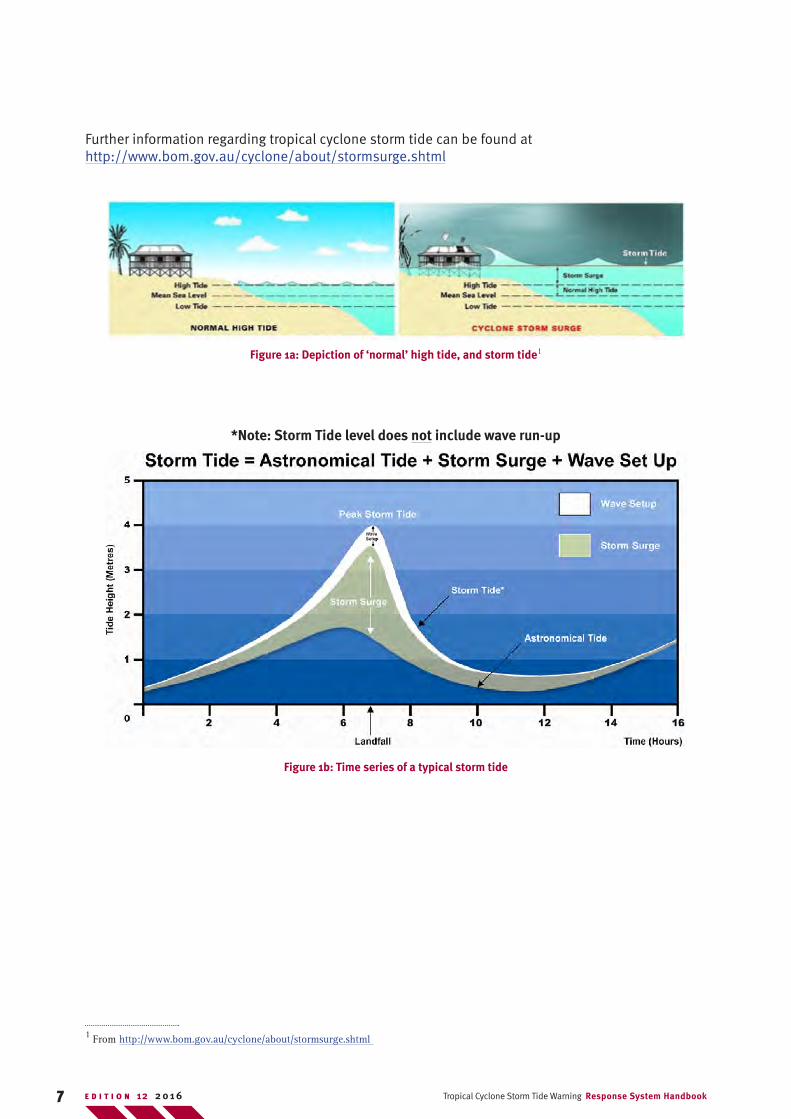
1.10 The storm tide is the total water level obtained by adding the storm surge and wave setup to the height of the astronomical tide (refer Figure 1a and 1b below).
1.11 The Theoretical Maximum Storm Tide is determined by considering the worst-case scenario of the maximum potential storm surge coinciding with HAT.
1. Storm Surge, Storm Tide
7 Tropical Cyclone Storm Tide Warning Response System HandbookE D I T I O N 12 2 0 1 6
Further information regarding tropical cyclone storm tide can be found at http://www.bom.gov.au/cyclone/about/stormsurge.shtml
Figure 1a: Depiction of ‘normal’ high tide, and storm tide1
*Note: Storm Tide level does not include wave run-up
Figure 1b: Time series of a typical storm tide
1 From http://www.bom.gov.au/cyclone/about/stormsurge.shtml
8Tropical Cyclone Storm Tide Warning Response System Handbook E D I T I O N 122 0 1 6
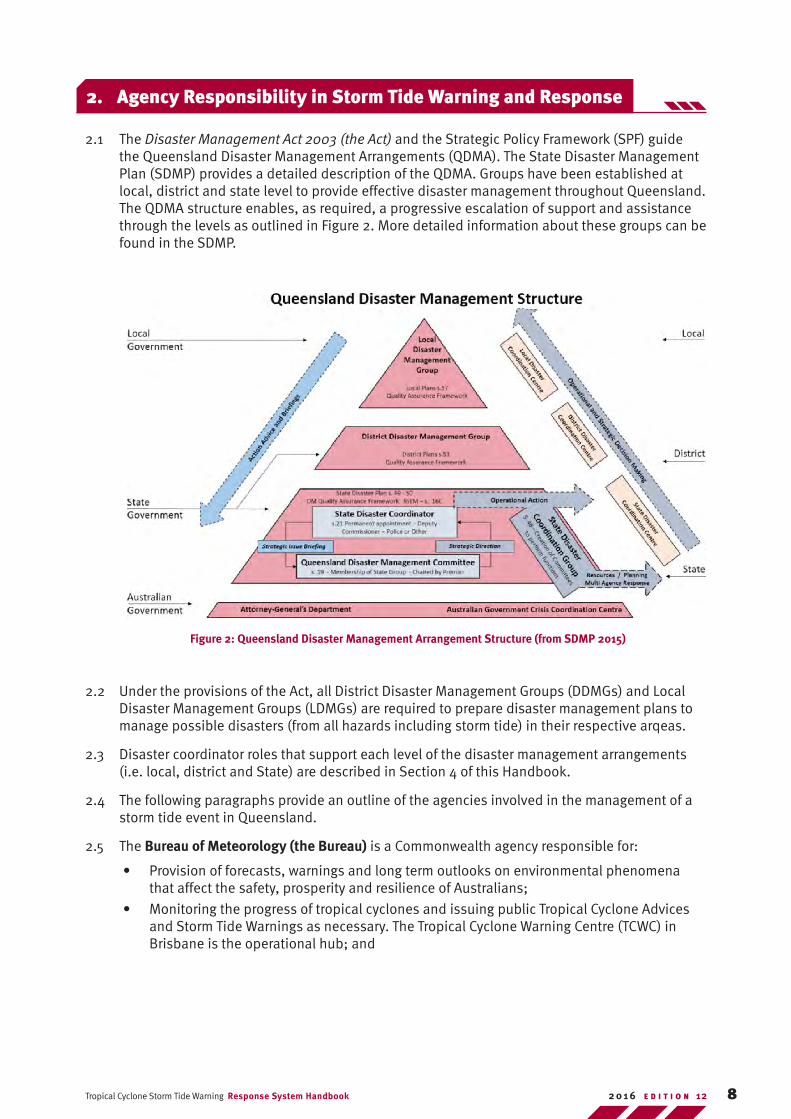
2.1 The Disaster Management Act 2003 (the Act) and the Strategic Policy Framework (SPF) guide the Queensland Disaster Management Arrangements (QDMA). The State Disaster Management Plan (SDMP) provides a detailed description of the QDMA. Groups have been established at local, district and state level to provide effective disaster management throughout Queensland. The QDMA structure enables, as required, a progressive escalation of support and assistance through the levels as outlined in Figure 2. More detailed information about these groups can be found in the SDMP.
Figure 2: Queensland Disaster Management Arrangement Structure (from SDMP 2015)
2.2 Under the provisions of the Act, all District Disaster Management Groups (DDMGs) and Local Disaster Management Groups (LDMGs) are required to prepare disaster management plans to manage possible disasters (from all hazards including storm tide) in their respective arqeas.
2.3 Disaster coordinator roles that support each level of the disaster management arrangements (i.e. local, district and State) are described in Section 4 of this Handbook.
2.4 The following paragraphs provide an outline of the agencies involved in the management of a storm tide event in Queensland.
2.5 The Bureau of Meteorology (the Bureau) is a Commonwealth agency responsible for:
• Provision of forecasts, warnings and long term outlooks on environmental phenomena that affect the safety, prosperity and resilience of Australians;
• Monitoring the progress of tropical cyclones and issuing public Tropical Cyclone Advices and Storm Tide Warnings as necessary. The Tropical Cyclone Warning Centre (TCWC) in Brisbane is the operational hub; and
2. Agency Responsibility in Storm Tide Warning and Response
9 Tropical Cyclone Storm Tide Warning Response System HandbookE D I T I O N 12 2 0 1 6
• Being available to provide technical warning advice to the local, district and State groups before and during a storm tide event.
2.6 The Department of Science, Information Technology and Innovation (DSITI) is responsible for:
• Monitoring water levels using a network of storm tide gauges;
• Liaising with the Bureau to confirm information in Storm Tide Warnings; and
• Being available to provide technical advice on storm tide to the local, district and State groups before and during a storm tide event.
2.7 The Queensland Fire and Emergency Services (QFES) are responsible for providing advice and support to the local, district and State groups as per the role and responsibilities in the SDMP. Responsibilities include, but are not limited to:
• Establish and maintain arrangements between the state and Commonwealth about matters relating to effective disaster management.
• Ensure that disaster management and disaster operations in the State are consistent with the State group’s strategic policy framework; the State Disaster Management Plan, the disaster management standards and the disaster management guidelines.
• Ensure that persons performing functions under the Act in relation to disaster operations are appropriately trained.
• Provide advice and support to the State group and local and district groups in relation to disaster management and disaster operations.
• Provide situational monitoring of events and incidents across the State via the SDCC Watchdesk.
2.8 The Queensland Police Service (QPS) responsibilities include, but are not limited to:
• Coordinate evacuation operations.
• Coordinate the review and renewal of the SDMP.
• Command the SDCC on activation.
• Command the SDCC capabilities of operations and intelligence on activation.
• Coordinate the review and renewal of the SDMP.
2.9 The Inspector-General Emergency Management (IGEM) is responsible for providing the Premier, Government and people of Queensland an assurance of public safety, through the establishment and implementation of an assurance framework to direct, guide and focus work of all agencies, across all tiers of Government to the desired outcomes of the disaster and emergency management arrangements for Queensland. The functions of the Inspector-General Emergency Management and the Office of the Inspector-General Emergency Management are prescribed in the Disaster Management Act 2003.
10Tropical Cyclone Storm Tide Warning Response System Handbook E D I T I O N 122 0 1 6
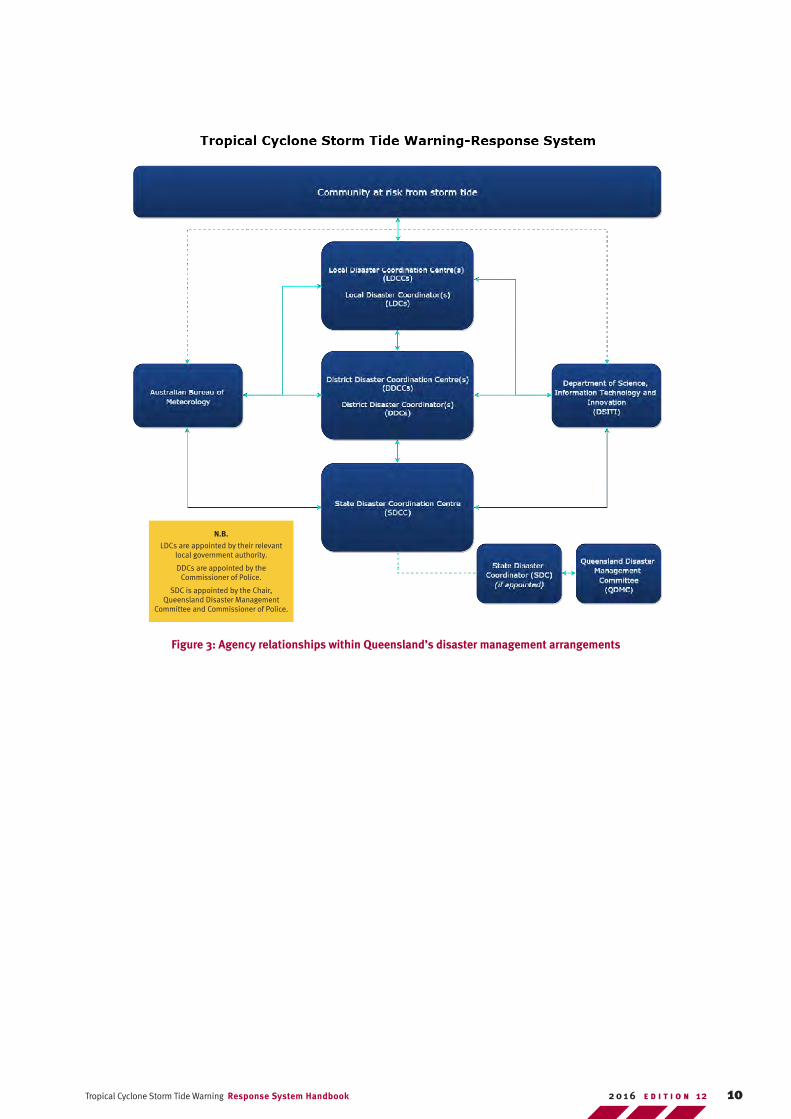
Figure 3: Agency relationships within Queensland’s disaster management arrangements
N.B.
LDCs are appointed by their relevant local government authority.
DDCs are appointed by the Commissioner of Police.
SDC is appointed by the Chair, Queensland Disaster Management
Committee and Commissioner of Police.
11 Tropical Cyclone Storm Tide Warning Response System HandbookE D I T I O N 12 2 0 1 6
Overview
3.1 Storm Tide Warnings are issued for the restricted information of disaster management authorities. Copies of these warnings are not issued to the media or the general community due to the technical expertise needed to interpret them. Unauthorised dissemination could adversely affect public safety. Any person with access to Storm Tide Warnings is not to pass copies to the media or the general community, who will be kept informed of any storm tide threat as necessary in Tropical Cyclone Advices. However, release of selected details of the warnings may be made in exceptional circumstances with prior agreement of the issuing authorities if considered to be in the public interest.
3.2 The Bureau activates the Storm Tide Warning Response System if it is anticipated that a storm tide could occur which would result in a total water level in excess of the Highest Astronomical Tide (HAT) in the area under threat. Estimates of the storm tide associated with the forecast cyclone track are provided for agreed locations. In addition, warnings provide estimates of storm tide under the ‘worst case’ assumption should the cyclone centre cross the coast near any of the locations near the time of high tide.
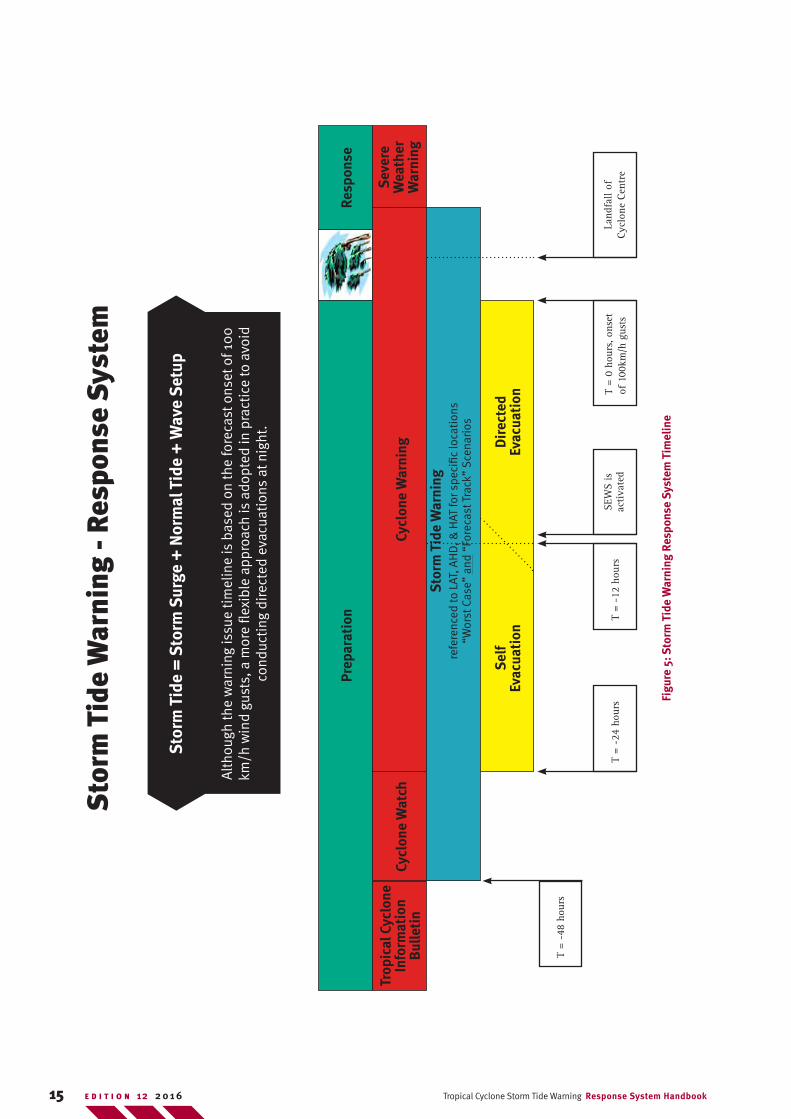
3.3 The Storm Tide Warning Response System is linked directly to the Tropical Cyclone Warning Response System. Refer to Figure 5 for a diagram of the Storm Tide Warning Response System and its linkage to the Tropical Cyclone Warning System.
3.4 During the Cyclone Information phase and prior to the declaration of a Cyclone Watch zone, if the forecast track map or text products show a cyclone crossing the coast, verbal briefings will be held with SDCC and DSITI Storm Tide Advisers. No additional storm tide products will be issued at this stage.
3.5 During a Cyclone Watch phase if the forecast track shows a cyclone crossing the coast, verbal briefings will continue as in the Cyclone Information phase. If the forecast track shows a tropical cyclone crossing the coast and there is a possibility that HAT will be exceeded, a Storm Tide Warning will be provided to the SDCC and to the DSITI Storm Tide Adviser. Storm Tide Warnings will be updated at 6 hourly intervals during the Cyclone Watch phase.
3.6 During a Cyclone Warning phase, if there is a possibility of HAT being exceeded, Storm Tide Warnings will be updated at 3 hourly intervals.
3.7 Storm Tide Warnings will, where possible, be issued at least 24 hours prior to the forecast onset of 100 km/h wind gusts affecting coastal and island communities with consideration given, where possible, to issuing Evacuation Orders during daylight hours.
Storm Tide Warning
3.8 A STORM TIDE WARNING is issued during a Cyclone Watch or Cyclone Warning phase when a chance of a storm tide risk exceeding HAT is identified.
3.9 The warning specifies “worst case” scenario storm tide estimates for key locations, based on the locations in question experiencing a combination of conditions, within the bounds of forecast uncertainty, to produce a larger storm tide from a slightly more intense cyclone with a centre within the range of possibilities as depicted by the grey area on the most recent TC Forecast Track Map. Generally this would mean the cyclone impacting close to the location, such that it experiences maximum onshore winds at a time near to or at the local high tide. The storm surge and storm tide figures presented in this table generally do not represent the most likely outcome, which is represented by the “Forecast Track Scenario”. Storm tide heights in the warnings are referenced to Lowest Astronomical Tide (LAT), Australian Height Datum (AHD) and Highest Astronomical Tide (HAT).
3. Storm Tide Warning Response System
12Tropical Cyclone Storm Tide Warning Response System Handbook E D I T I O N 122 0 1 6
3.10 The warning also specifies additional “forecast track” scenario estimates of the predicted storm tide for key locations, based on the most recent forecast track, and expected tide conditions at the forecast time of coastal crossing. Storm tide heights in the warnings are referenced to each of LAT, AHD and HAT.
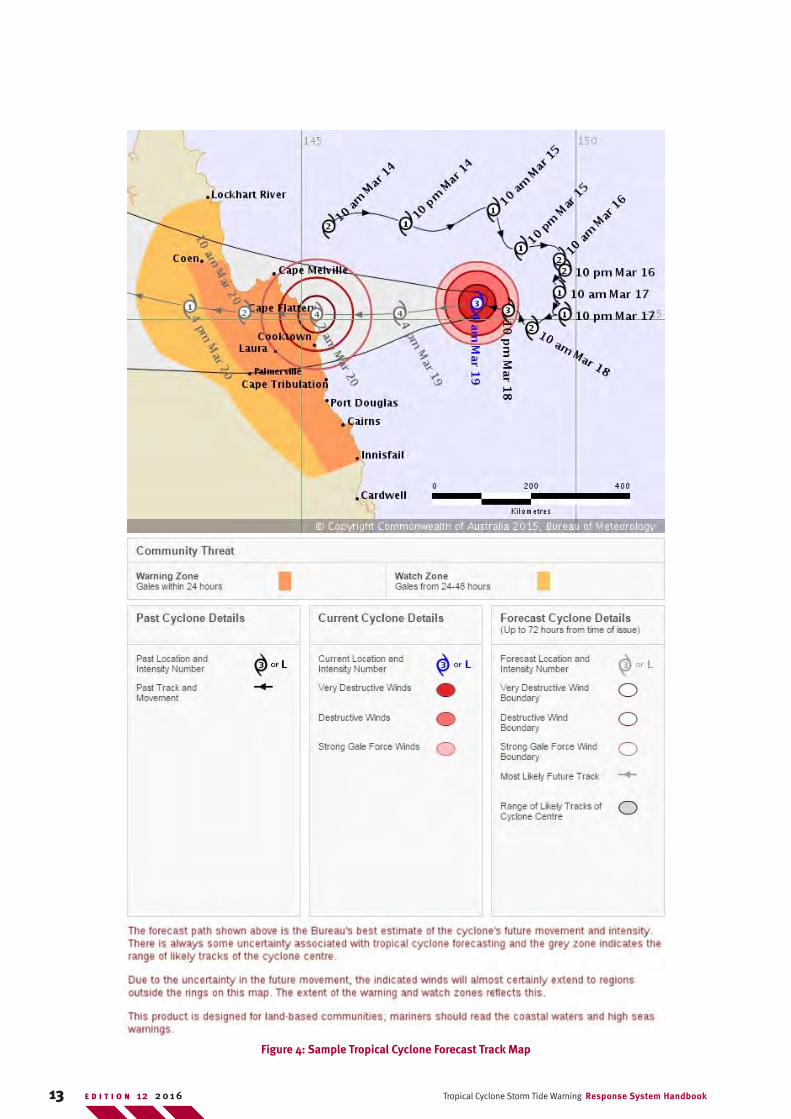
3.11 The warnings also specify estimates of the time of onset of 100km/h winds at each of the locations. An estimate is provided of the time of onset based on the most likely forecast track, and in addition an estimate of the earliest possible time based on forecast track uncertainty. The outer ring (Strong Gale Force Wind Boundary) on the forecast track maps encloses the area in which wind gusts are estimated at 100 km/h or more (refer to sample forecast track map at Figure 4).
3.12 The warning will generally be updated with each update of the Tropical Cyclone Advice (see Appendix C) but at no more frequently than 3 hourly. This could vary if the danger of a storm tide is advanced in time or the portion of coastline under threat has significantly changed.
3.13 A FINAL STORM TIDE WARNING will be issued after the cyclone has crossed the coast or the chance of exceeding HAT has ceased.
3.14 It should be noted that whenever a threat exists, the Bureau would include a qualitative description of the expected storm tide impact in the routine Tropical Cyclone Advices to the general community. If tides are not expected to exceed HAT a statement to the effect that ‘tides could be higher than normal’ may be included in Tropical Cyclone Advices but no Storm Tide Warnings issued.
3.15 If a total water level above HAT is expected a Storm Tide Warning is issued to disaster management authorities before a qualitative description of the storm tide threat is given in Tropical Cyclone Advices.
3.16 Storm Tide Warning Graphics will be issued for key locations in conjunction with the Storm Tide Warning to assist with interpretation of the Storm Tide Warning. Refer to Figure 6 and to paragraphs 3.27 to 3.30 for further details. The Storm Tide Warning graphics are available via the Bureau’s registered user webpage for the SDCC (http://reg.bom.gov.au/reguser/, username and password are available to emergency management officials from the SDCC Watchdesk).
3.17 Evacuation advice should be based on the official Storm Tide Warnings and associated Storm Tide Warning Graphics. Any other graphical or mapping products derived directly from surge model outputs may not have had the same quality control applied and are to be treated with caution.
3.18 A sample Storm Tide Warning is shown in Figure 7.
13 Tropical Cyclone Storm Tide Warning Response System HandbookE D I T I O N 12 2 0 1 6
Figure 4: Sample Tropical Cyclone Forecast Track Map
14Tropical Cyclone Storm Tide Warning Response System Handbook E D I T I O N 122 0 1 6
Standard Emergency Warning Signal (SEWS2)
3.19 The STANDARD EMERGENCY WARNING SIGNAL (SEWS) alerts the community to the broadcast of an urgent safety message relating to a major disaster or emergency. SEWS will be heard:
• if destructive wind gusts (greater than 125 km/h) are expected on the coast or islands during the following 12 hours;
• if a storm tide greater than 0.5 metres above HAT is expected in the forecast track scenario; and/or
• the evacuation of a significant number of people has been authorised during a Disaster Situation.
Technical considerations and local effects
3.20 The storm tide height given in official warnings is based on calculation of the open coast storm tide with appropriate allowance made for: (a) amplification in large bays and estuaries; (b) wave action; and (c) where possible, river flooding.
3.21 The possible increase of the storm tide in smaller bays and estuaries, and the effect of local flooding, will generally not be included in the storm tide height estimate because of inadequate information on what the impacts might be in particular cases.
3.22 Because the height of the storm tide depends upon the intensity of the cyclone, its forward velocity and the time and place of landfall, errors in estimating any of these parameters may result in errors in the forecast storm tide height.
3.23 The height of the storm tide is very much dependent on the phase of the astronomical tide and therefore on the time of landfall of the cyclone. In Queensland, tides are mainly semi-diurnal and tidal range can be quite large. This tidal range means a difference of a few hours in time of landfall can have a major influence on the storm tide height.
3.24 The accuracy of the forecast time of landfall is usually the most significant uncertainty, and may vary by as much as 6 hours when a cyclone centre is still 12 to 24 hours from the coastline. To provide a realistic safety margin, the Bureau provides storm tide predictions based on both the ‘worst case’ scenario and ‘forecast track’ scenario. If possible, the forecast storm tide height is refined with every issue of the Tropical Cyclone Advice.
3.25 Individual waves associated with the cyclone may run up the foreshore slope to levels well above the mean waterline. This swash ‘wave run-up’ depends on the wave height, wave period, beach slope and the nature of the foreshore and can locally increase water levels periodically by up to several metres near the shoreline above the storm tide level.
3.26 Storm tides will penetrate the coast to different extents in different locations depending on the depth of inundation; the obstruction to flow by buildings; and vegetation and other factors. Storm Tide Emergency Response Maps (e.g. those produced under the National Storm Tide Mapping Model project) assume the storm tide water level remains horizontal. Of particular concern is the damage potential of both wave action and a significant backwash as the water retreats. Channelling of seawater through canal developments may further exaggerate the impact. Shoaling of navigational channels may impede vessel traffic and hamper harbour operations.
2 QFES are working on the review of disaster management guidelines in line with government priorities.This includes SEWS.
15 Tropical Cyclone Storm Tide Warning Response System HandbookE D I T I O N 12 2 0 1 6
Figu
re 5
: Sto
rm T
ide
War
ning
Res
pons
e Sy
stem
Tim
elin
e
Sto
rm T
ide
War
ning
- R
espo
nse
Sys
tem
Sto
rm T
ide
= S
torm
Sur
ge +
Nor
mal
Tid
e +
Wav
e S
etup
Alt
houg
h th
e w
arni
ng is
sue
tim
elin
e is
bas
ed o
n th
e fo
reca
st o
nset
of 1
00
km
/h w
ind
gust
s, a
mor
e fle
xibl
e ap
proa
ch is
ado
pted
in p
ract
ice
to a
void
co
nduc
ting
dir
ecte
d ev
acua
tion
s at
nig
ht.
Prep
arat
ion
Resp
onse
Cycl
one
War
ning
Cycl
one
Wat
chTr
opic
al C
yclo
ne
Info
rmat
ion
Bul
leti
n
Sev
ere
Wea
ther
W
arni
ng
Sto
rm T
ide
War
ning
refe
renc
ed to
LAT
, AH
D, &
HAT
for s
peci
fic lo
cati
ons
“W
orst
Cas
e” a
nd “
Fore
cast
Tra
ck”
Sce
nari
os
Sel
f Ev
acua
tion
Dir
ecte
d Ev
acua
tion
Land
fall
of
Cycl
one
Cent
reT
= 0
hour
s, o
nset
of
100
km/h
gus
tsT
= -1
2 ho
urs
SEW
S is
ac
tivat
edT
= -2
4 ho
urs
T =
-48
hour
s
16Tropical Cyclone Storm Tide Warning Response System Handbook E D I T I O N 122 0 1 6
Storm Tide Warning Graphic
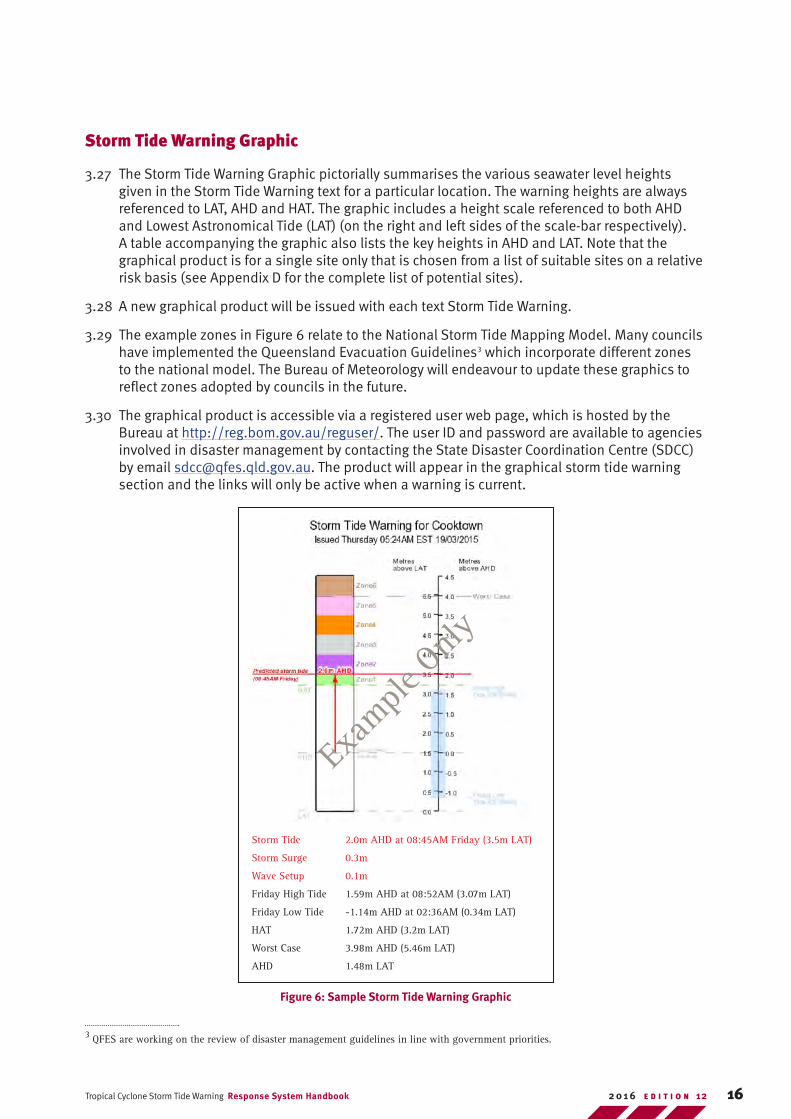
3.27 The Storm Tide Warning Graphic pictorially summarises the various seawater level heights given in the Storm Tide Warning text for a particular location. The warning heights are always referenced to LAT, AHD and HAT. The graphic includes a height scale referenced to both AHD and Lowest Astronomical Tide (LAT) (on the right and left sides of the scale-bar respectively). A table accompanying the graphic also lists the key heights in AHD and LAT. Note that the graphical product is for a single site only that is chosen from a list of suitable sites on a relative risk basis (see Appendix D for the complete list of potential sites).
3.28 A new graphical product will be issued with each text Storm Tide Warning.
3.29 The example zones in Figure 6 relate to the National Storm Tide Mapping Model. Many councils have implemented the Queensland Evacuation Guidelines3 which incorporate different zones to the national model. The Bureau of Meteorology will endeavour to update these graphics to reflect zones adopted by councils in the future.
3.30 The graphical product is accessible via a registered user web page, which is hosted by the Bureau at http://reg.bom.gov.au/reguser/. The user ID and password are available to agencies involved in disaster management by contacting the State Disaster Coordination Centre (SDCC) by email [email protected]. The product will appear in the graphical storm tide warning section and the links will only be active when a warning is current.
3 QFES are working on the review of disaster management guidelines in line with government priorities.
Storm Tide 2.0m AHD at 08:45AM Friday (3.5m LAT)
Storm Surge 0.3m
Wave Setup 0.1m
Friday High Tide 1.59m AHD at 08:52AM (3.07m LAT)
Friday Low Tide -1.14m AHD at 02:36AM (0.34m LAT)
HAT 1.72m AHD (3.2m LAT)
Worst Case 3.98m AHD (5.46m LAT)
AHD 1.48m LAT
Figure 6: Sample Storm Tide Warning Graphic
Exam
ple O
nly
17 Tropical Cyclone Storm Tide Warning Response System HandbookE D I T I O N 12 2 0 1 6
Example
Only
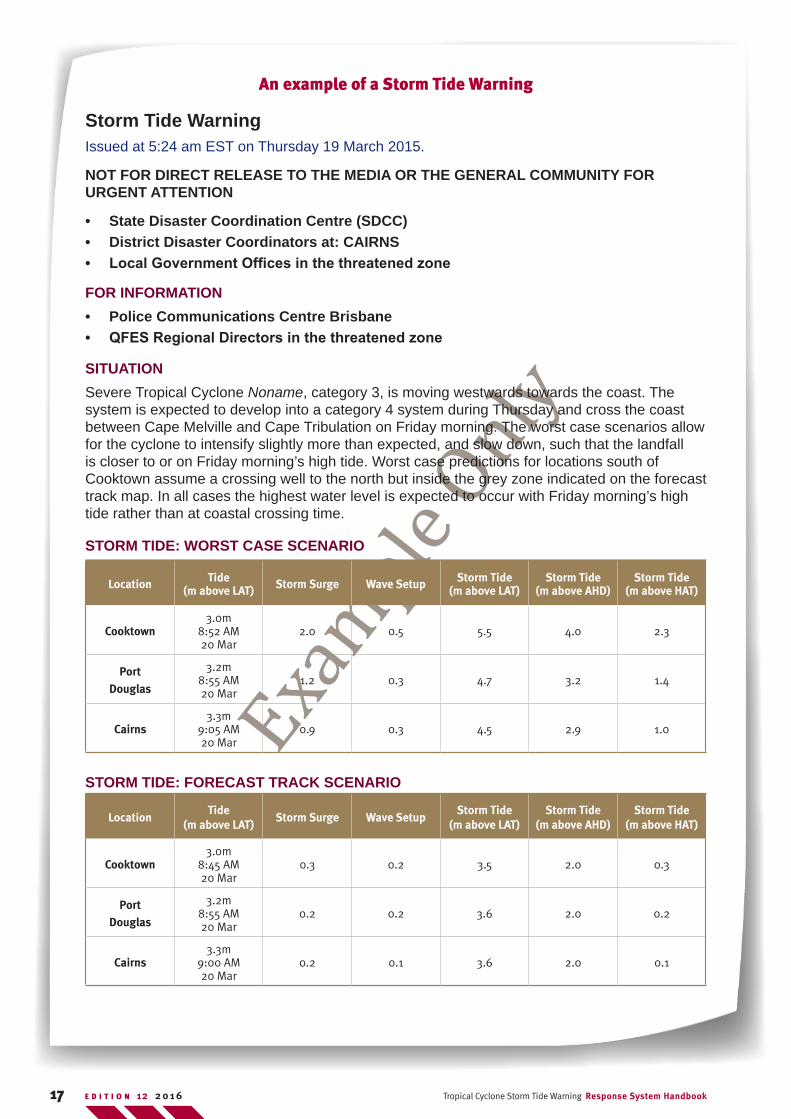
An example of a Storm Tide Warning
Storm Tide WarningIssued at 5:24 am EST on Thursday 19 March 2015.
NOT FOR DIRECT RELEASE TO THE MEDIA OR THE GENERAL COMMUNITY FOR URGENT ATTENTION
• State Disaster Coordination Centre (SDCC)• District Disaster Coordinators at: CAIRNS• Local Government Offices in the threatened zone
FOR INFORMATION• Police Communications Centre Brisbane• QFES Regional Directors in the threatened zone
SITUATIONSevere Tropical Cyclone Noname, category 3, is moving westwards towards the coast. The system is expected to develop into a category 4 system during Thursday and cross the coast between Cape Melville and Cape Tribulation on Friday morning. The worst case scenarios allow for the cyclone to intensify slightly more than expected, and slow down, such that the landfall is closer to or on Friday morning’s high tide. Worst case predictions for locations south of Cooktown assume a crossing well to the north but inside the grey zone indicated on the forecast track map. In all cases the highest water level is expected to occur with Friday morning’s high tide rather than at coastal crossing time.
STORM TIDE: WORST CASE SCENARIO
Location Tide (m above LAT) Storm Surge Wave Setup Storm Tide
(m above LAT)Storm Tide
(m above AHD)Storm Tide
(m above HAT)
Cooktown3.0m
8:52 AM20 Mar
2.0 0.5 5.5 4.0 2.3
Port Douglas
3.2m8:55 AM 20 Mar
1.2 0.3 4.7 3.2 1.4
Cairns3.3m
9:05 AM20 Mar
0.9 0.3 4.5 2.9 1.0
STORM TIDE: FORECAST TRACK SCENARIO
LocationTide
(m above LAT)Storm Surge Wave Setup
Storm Tide (m above LAT)
Storm Tide (m above AHD)
Storm Tide (m above HAT)
Cooktown3.0m
8:45 AM20 Mar
0.3 0.2 3.5 2.0 0.3
Port Douglas
3.2m8:55 AM 20 Mar
0.2 0.2 3.6 2.0 0.2
Cairns3.3m
9:00 AM20 Mar
0.2 0.1 3.6 2.0 0.1
18Tropical Cyclone Storm Tide Warning Response System Handbook E D I T I O N 122 0 1 6
Example
Only
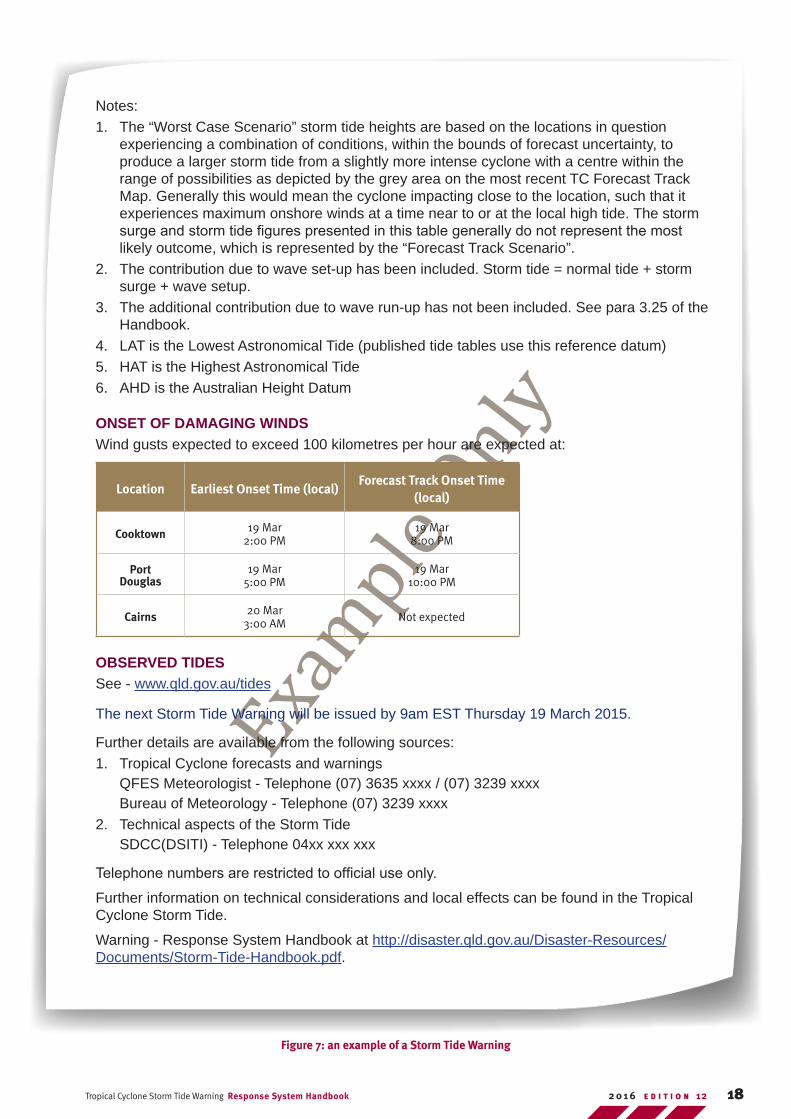
Notes:1. The “Worst Case Scenario” storm tide heights are based on the locations in question
experiencing a combination of conditions, within the bounds of forecast uncertainty, to produce a larger storm tide from a slightly more intense cyclone with a centre within the range of possibilities as depicted by the grey area on the most recent TC Forecast Track Map. Generally this would mean the cyclone impacting close to the location, such that it experiences maximum onshore winds at a time near to or at the local high tide. The storm surge and storm tide figures presented in this table generally do not represent the most likely outcome, which is represented by the “Forecast Track Scenario”.
2. The contribution due to wave set-up has been included. Storm tide = normal tide + storm surge + wave setup.
3. The additional contribution due to wave run-up has not been included. See para 3.25 of the Handbook.
4. LAT is the Lowest Astronomical Tide (published tide tables use this reference datum)5. HAT is the Highest Astronomical Tide6. AHD is the Australian Height Datum
ONSET OF DAMAGING WINDSWind gusts expected to exceed 100 kilometres per hour are expected at:
Location Earliest Onset Time (local)Forecast Track Onset Time
(local)
Cooktown 19 Mar2:00 PM
19 Mar8:00 PM
Port Douglas
19 Mar5:00 PM
19 Mar10:00 PM
Cairns 20 Mar3:00 AM Not expected
OBSERVED TIDES See - www.qld.gov.au/tides
The next Storm Tide Warning will be issued by 9am EST Thursday 19 March 2015.
Further details are available from the following sources:1. Tropical Cyclone forecasts and warnings
QFES Meteorologist - Telephone (07) 3635 xxxx / (07) 3239 xxxx Bureau of Meteorology - Telephone (07) 3239 xxxx
2. Technical aspects of the Storm Tide SDCC(DSITI) - Telephone 04xx xxx xxx
Telephone numbers are restricted to official use only.
Further information on technical considerations and local effects can be found in the Tropical Cyclone Storm Tide.
Warning - Response System Handbook at http://disaster.qld.gov.au/Disaster-Resources/Documents/Storm-Tide-Handbook.pdf.
Figure 7: an example of a Storm Tide Warning
19 Tropical Cyclone Storm Tide Warning Response System HandbookE D I T I O N 12 2 0 1 6
Overview
4.1 Distribution of the Bureau Storm Tide Warnings is restricted to disaster management authorities. The storm tide warning will indicate the coastal zones, which may be affected, the approximate time of occurrence of the Storm Tide, and the estimated storm tide height above each of LAT, AHD and HAT.
4.2 Based on the information provided in the Storm Tide Warnings, consideration may be given to directed evacuation4 as an option if it is reasonably likely that the event may pose a threat to human life or risk of illness or injury. In these situations persons may also decide to self evacuate5.
4.3 A Local Disaster Coordinator (LDC), after consultation with the District Disaster Coordinator (DDC), may advise people in threatened areas to undertake a voluntary evacuation while consideration is being given to whether directed evacuation is required. A Voluntary Evacuation Advice is distributed through the media without the SEWS. The option of voluntary evacuation must be included in local evacuation plans.
4.4 A directed evacuation under the Disaster Management Act 2003, is conducted using empowerments provided by a disaster situation declaration under the Act. A DDC may declare a disaster situation if satisfied that the requirements of section 64 of the Act have been met. The declaration of a disaster situation requires the approval of the Minister responsible for Police, Fire and Emergency Services, and must be made in accordance with section 65 of the Act. During a disaster situation, the DDC and Declared Disaster Officers(DDOs) are provided with additional powers under sections 77-78 of the Act. These powers may be required to give effect to a directed evacuation. An LDC, as part of the LDMG, may make a recommendation to a DDC that a directed evacuation is required based on their situational awareness in the preparation for an imminent disaster. However, as the LDMG/LDC has no legislative power to effect a directed evacuation, the responsibility for authorising a directed evacuation remains with the DDC.
4.5 The declaration of a disaster situation will provide the DDC and DDOs with the necessary powers to effect a directed evacuation. If this measure is required, the DDC is to keep the QDMC informed, through sitreps to the SDCC, of areas evacuated and areas likely to be evacuated.
4.6 Once a declaration of a disaster situation has been made the DDC or DDO may direct persons to evacuate (a directed evacuation) from the declared area. In conducting directed evacuations, the DDC or DDOs may require persons to give them reasonable help in conducting evacuations. This may include persons from the Local Group including the State Emergency Service (SES).
4.7 TCWC Senior Forecasters and DSITI Storm Tide Advisers will be available for consultation. DDCs and LDCs can dial the access numbers provided in the Storm Tide Warnings.
4.8 For further information on evacuation planning consult the Queensland Evacuation Guidelines for Disaster Management Groups available at http://www.disaster.qld.gov.au/Disaster-Resources/Documents/2907EMQ_SDMG_QLD_Evac%20Guide_web.pdf
4.9 For further information on functions, roles and responsibilities of disaster coordinators across the QDMA see the Disaster Management Act 2003 and the SDMP.
4 Directed Evacuation: The planned movement of persons from an unsafe or potentially unsafe location to a safer location and their eventual return.
5 Self Evacuation: Individuals proactively make their own decision to evacuate prior to any direction from authorities.
4. Disaster Management Response
20Tropical Cyclone Storm Tide Warning Response System Handbook E D I T I O N 122 0 1 6
Queensland Evacuation Guidelines6
4.10 The Queensland Evacuation Guidelines are based on agreed emergency management principles anqqqd reflects an all hazards approach to evacuation within Queensland. The aim of the document is to assist disaster management groups during the planning and implementation of thenevacuation process within Queensland.
4.11 Some important considerations when devising local evacuation plans for storm tide include:
• Accuracy of predictions: In the early stages of a storm tide event, storm tide estimates are a rough approximation due to the limitations of the science behind predicting these events. As the cyclone moves closer to the coast, it is possible to obtain a higher degree of precision in predicting the storm tide. As the forecast accuracy increases, the time available to evacuate diminishes rapidly.
• Time available: Any evacuation should be completed before wind conditions prohibit outside movement (i.e. regular wind gusts to 100 kilometres per hour). For planning purposes, the winds reaching this threshold are most likely to occur 3 to 12 hours before the cyclone centre crosses the coast, though earlier onsets are possible depending on the size and speed of the cyclone. For a particular cyclone, the outer ellipse on Tropical Cyclone Track Maps shows the distance of 100 kilometre per hour wind gusts from coastal centres.
• Associated Flooding: Coincidental river flooding may increase the height and extent of tidal penetration in some localities.
4.12 LDMGs should ensure local communities are prepared through providing evacuation maps, with identified evacuation zones so that they can be used to guide evacuations. Local knowledge will aid in determining the evacuation zones.
4.13 Low offshore islands may be completely inundated. The short prediction lead-time for storm tides may eliminate the ability to evacuate such locations in the face of a cyclone. The decision to evacuate such islands should be based on public Tropical Cyclone Warnings rather than Storm Tide Warnings.
4.14 The Evacuation Guidelines should be used in conjunction with this Handbook when devising storm tide evacuation zones and arrangements for evacuating communities vulnerable to storm tide.
6 QFES are working on the review of disaster management guidelines in line with government priorities.
21 Tropical Cyclone Storm Tide Warning Response System HandbookE D I T I O N 12 2 0 1 6
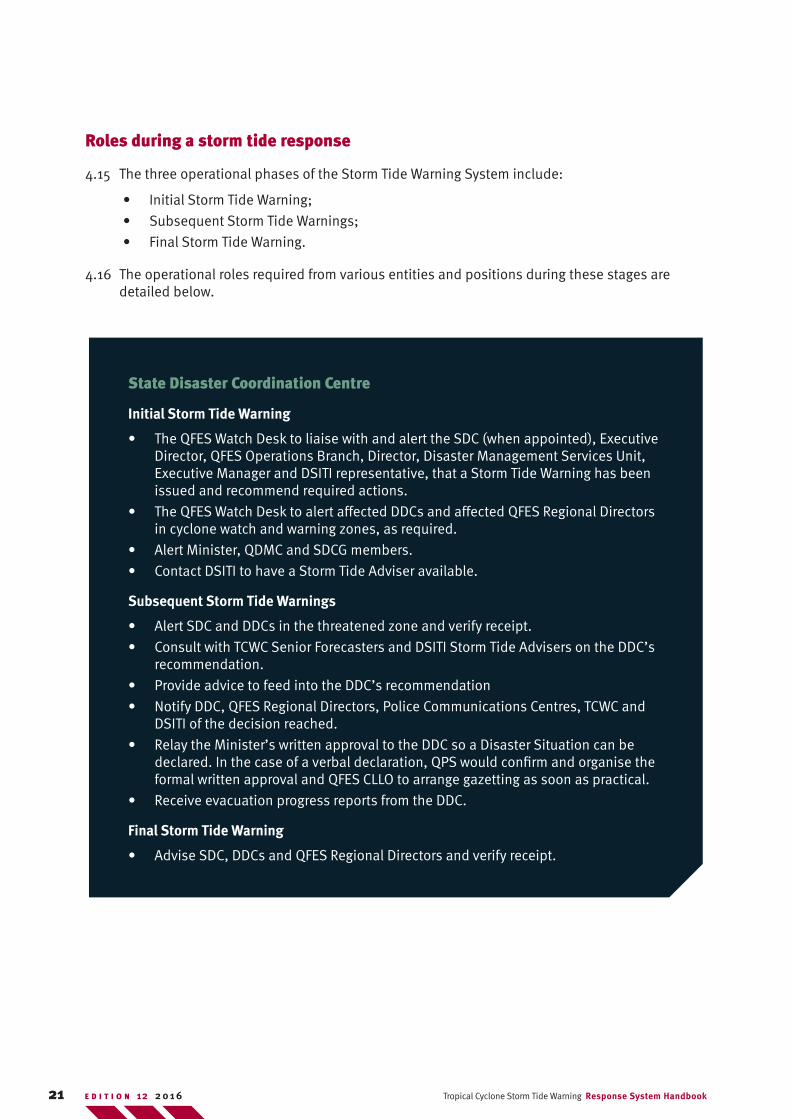
Roles during a storm tide response
4.15 The three operational phases of the Storm Tide Warning System include:
• Initial Storm Tide Warning;
• Subsequent Storm Tide Warnings;
• Final Storm Tide Warning.
4.16 The operational roles required from various entities and positions during these stages are detailed below.
State Disaster Coordination Centre
Initial Storm Tide Warning
• The QFES Watch Desk to liaise with and alert the SDC (when appointed), Executive Director, QFES Operations Branch, Director, Disaster Management Services Unit, Executive Manager and DSITI representative, that a Storm Tide Warning has been issued and recommend required actions.
• The QFES Watch Desk to alert affected DDCs and affected QFES Regional Directors in cyclone watch and warning zones, as required.
• Alert Minister, QDMC and SDCG members.
• Contact DSITI to have a Storm Tide Adviser available.
Subsequent Storm Tide Warnings
• Alert SDC and DDCs in the threatened zone and verify receipt.
• Consult with TCWC Senior Forecasters and DSITI Storm Tide Advisers on the DDC’s recommendation.
• Provide advice to feed into the DDC’s recommendation
• Notify DDC, QFES Regional Directors, Police Communications Centres, TCWC and DSITI of the decision reached.
• Relay the Minister’s written approval to the DDC so a Disaster Situation can be declared. In the case of a verbal declaration, QPS would confirm and organise the formal written approval and QFES CLLO to arrange gazetting as soon as practical.
• Receive evacuation progress reports from the DDC.
Final Storm Tide Warning
• Advise SDC, DDCs and QFES Regional Directors and verify receipt.
22Tropical Cyclone Storm Tide Warning Response System Handbook E D I T I O N 122 0 1 6
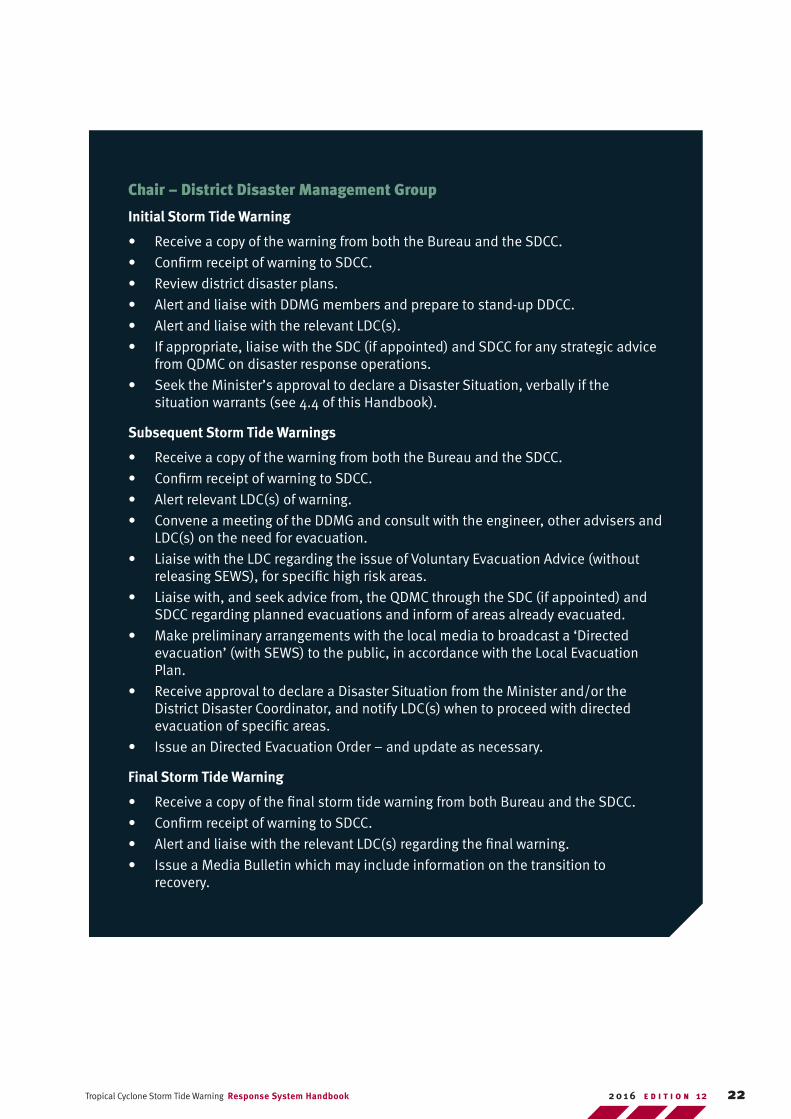
Chair – District Disaster Management Group
Initial Storm Tide Warning
• Receive a copy of the warning from both the Bureau and the SDCC.
• Confirm receipt of warning to SDCC.
• Review district disaster plans.
• Alert and liaise with DDMG members and prepare to stand-up DDCC.
• Alert and liaise with the relevant LDC(s).
• If appropriate, liaise with the SDC (if appointed) and SDCC for any strategic advice from QDMC on disaster response operations.
• Seek the Minister’s approval to declare a Disaster Situation, verbally if the situation warrants (see 4.4 of this Handbook).
Subsequent Storm Tide Warnings
• Receive a copy of the warning from both the Bureau and the SDCC.
• Confirm receipt of warning to SDCC.
• Alert relevant LDC(s) of warning.
• Convene a meeting of the DDMG and consult with the engineer, other advisers and LDC(s) on the need for evacuation.
• Liaise with the LDC regarding the issue of Voluntary Evacuation Advice (without releasing SEWS), for specific high risk areas.
• Liaise with, and seek advice from, the QDMC through the SDC (if appointed) and SDCC regarding planned evacuations and inform of areas already evacuated.
• Make preliminary arrangements with the local media to broadcast a ‘Directed evacuation’ (with SEWS) to the public, in accordance with the Local Evacuation Plan.
• Receive approval to declare a Disaster Situation from the Minister and/or the District Disaster Coordinator, and notify LDC(s) when to proceed with directed evacuation of specific areas.
• Issue an Directed Evacuation Order – and update as necessary.
Final Storm Tide Warning
• Receive a copy of the final storm tide warning from both Bureau and the SDCC.
• Confirm receipt of warning to SDCC.
• Alert and liaise with the relevant LDC(s) regarding the final warning.
• Issue a Media Bulletin which may include information on the transition to recovery.

23 Tropical Cyclone Storm Tide Warning Response System HandbookE D I T I O N 12 2 0 1 6
Local Disaster Coordinator
Initial Storm Tide Warning
• Receive a copy of the warning from the Bureau.
• Review relevant disaster plans including the local evacuation plan.
• Liaise with DDC regarding specific high risk areas that may need voluntary evacuation, as detailed in the local evacuation plan.
• Advise LDMG members, consulting engineer and other advisers.
• Activate local evacuation plan.
Subsequent Storm Tide Warnings
• Receive a copy of the warning from the Bureau.
• Liaise with the Chair of the LDMG and convene a meeting.
• Liaise with the consulting engineer to local government and other advisers on the need for evacuation.
• Liaise, if necessary, with the TCWC Senior Forecasters and DSITI Storm Tide Advisers.
• Advise DDC of recommendations for evacuations.
• Receive DDC notification to proceed with Directed evacuation of specific areas.
• Release local evacuation information to public.
• Keep DDC informed of evacuation progress.
Final Storm Tide Warning
• Receive a copy of the warning from the Bureau.
24Tropical Cyclone Storm Tide Warning Response System Handbook E D I T I O N 122 0 1 6
5.1 It is essential that all authorities engaged in disaster management activities have maps that are relevant to their area of responsibility.
5.2 Most local authorities at risk from storm tide inundation now operate geographic information systems (GIS) in which data on roads, properties and lifeline infrastructure are held digitally. The data available in these information systems is ideal for use in all aspects of disaster management. Many of these systems also contain very detailed digital elevation model (DEM) data (i.e. topographic). This data is typically far more accurate and detailed than traditional mapping products. For example, 0.25 metre elevation contours referenced to the Australian Height Datum (AHD) are available for the majority of coastal communities. These DEMs are
5.3 The Protecting our Coastal Communities Project (POCC) acquired high resolution elevation data over coastal communities. This data was captured for majority of coastal communities and is available to local governments and other state government agencies through the Department of Natural Resources and Mines (DNRM). A link to a map showing latest elevation data coverage is available through the DNRM website: https://www.dnrm.qld.gov.au/__data/assets/pdf_file/0003/109344/lidar-capture-projects.pdf).
5.4 Storm tide maps throughout Australia have been produced to a variety of standards and the Queensland Tropical Cyclone Consultative Committee (QTCCC)7 identified this factor as a potential risk during disaster management operations, particularly where cyclones are likely to affect multiple jurisdictions simultaneously.
5.5 To assist evacuation planning the POCC project has published elevation zones in half metre increments from HAT up to an extreme event. These zones are an indication of potential storm tide inundation for particular events using the bath tub approach. Please be aware that this approach assumes water levels remain horizontal and for many communities local government may have better information based on detailed modelling techniques. The information provided by POCC is available via an interactive mapping site from the Public Sector Business Agency ‘Situational Awareness Map’ portal (SAM) (http://mapping.psba.qld.gov.au/hath5/, username and password required).
5.6 The Total Operational Mapping system (TOM) currently available to the SDCC should and is recognised as the “situational awareness” tool for the SDCC and DDCCs (State Disaster Coordination Centre: Room for Improvement Strategy Report June 2014). The Public Safety Business Agency (PSBA) is responsible for providing mapping services to the SDCC during operations to support the SDCC and QDMC decision making (2015 State Disaster Management Plan, Role and Responsibility Table, Public Safety Business Agency, p44). As an application TOM is a web-based mapping application that uses the GeoCortex Essentials (Silverlight) technology to allow users to view and interact with spatial information in an easy-to-use interface. It is a visualisation tool used for planning and situational awareness before and during emergency events. TOM contributes to delivering a Common Operating Picture (COP) where all users are able to access a consistent,
7 The QTCCC is a joint initiative between the Queensland Fire and Emergency Services and the Queensland Regional Office of the Australian Bureau of Meteorology. The Committee provides a means of reviewing tropical cyclone information from a variety of sources and recommending practical measures for cyclone impact reduction in Queensland.
5. Emergency Response Maps
25 Tropical Cyclone Storm Tide Warning Response System HandbookE D I T I O N 12 2 0 1 6
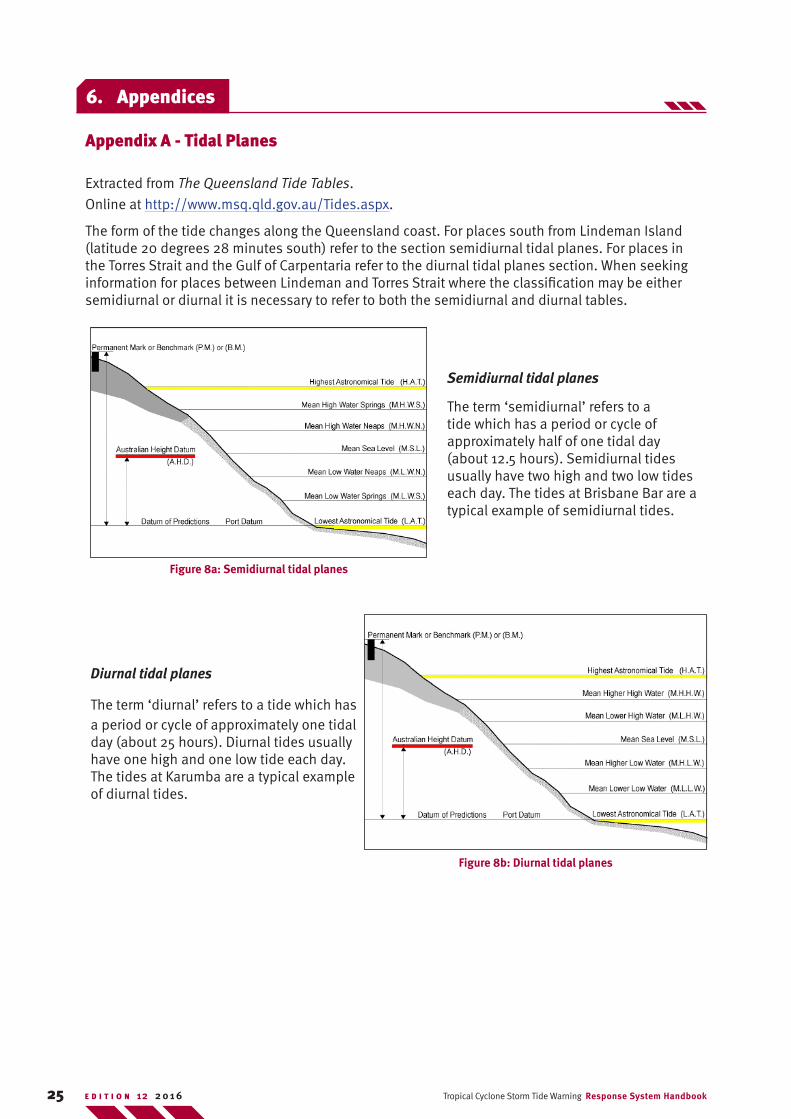
Appendix A - Tidal Planes
Extracted from The Queensland Tide Tables.
Online at http://www.msq.qld.gov.au/Tides.aspx.
The form of the tide changes along the Queensland coast. For places south from Lindeman Island (latitude 20 degrees 28 minutes south) refer to the section semidiurnal tidal planes. For places in the Torres Strait and the Gulf of Carpentaria refer to the diurnal tidal planes section. When seeking information for places between Lindeman and Torres Strait where the classification may be either semidiurnal or diurnal it is necessary to refer to both the semidiurnal and diurnal tables.
Semidiurnal tidal planes
The term ‘semidiurnal’ refers to a tide which has a period or cycle of approximately half of one tidal day (about 12.5 hours). Semidiurnal tides usually have two high and two low tides each day. The tides at Brisbane Bar are a typical example of semidiurnal tides.
Diurnal tidal planes
The term ‘diurnal’ refers to a tide which has a period or cycle of approximately one tidal day (about 25 hours). Diurnal tides usually have one high and one low tide each day. The tides at Karumba are a typical example of diurnal tides.
Figure 8a: Semidiurnal tidal planes
Figure 8b: Diurnal tidal planes
6. Appendices
26Tropical Cyclone Storm Tide Warning Response System Handbook E D I T I O N 122 0 1 6
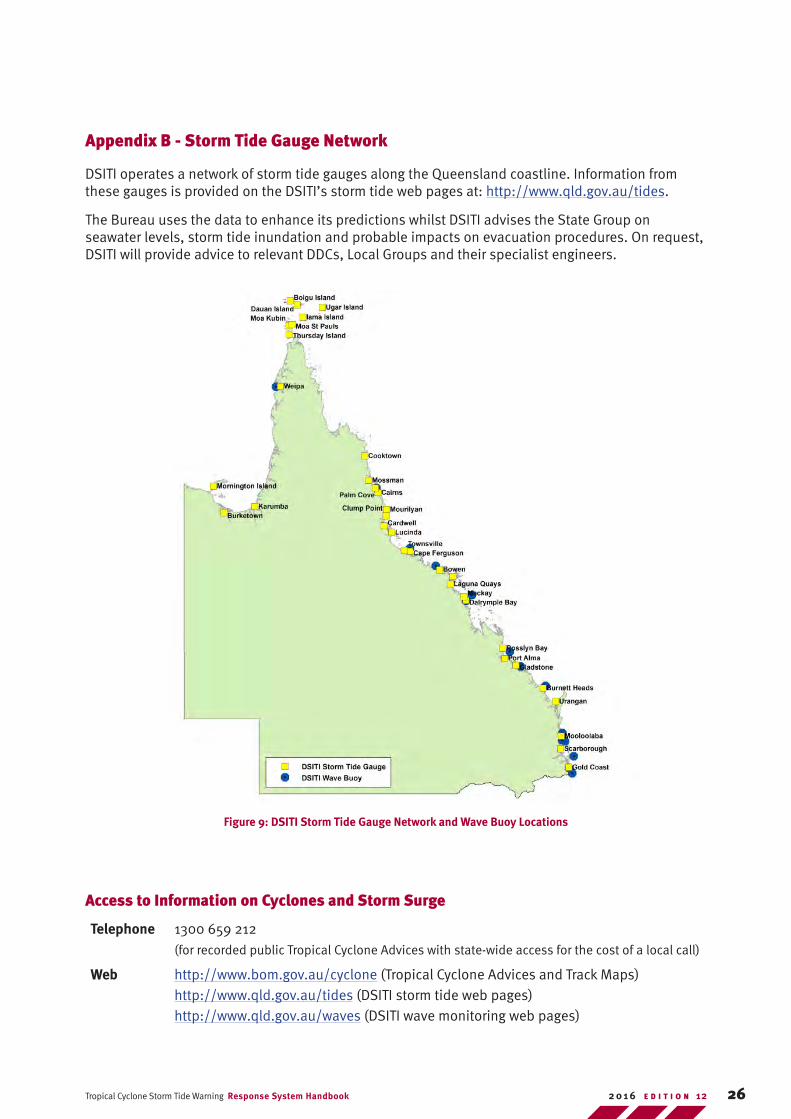
Appendix B - Storm Tide Gauge Network
DSITI operates a network of storm tide gauges along the Queensland coastline. Information from these gauges is provided on the DSITI’s storm tide web pages at: http://www.qld.gov.au/tides.
The Bureau uses the data to enhance its predictions whilst DSITI advises the State Group on seawater levels, storm tide inundation and probable impacts on evacuation procedures. On request, DSITI will provide advice to relevant DDCs, Local Groups and their specialist engineers.
Figure 9: DSITI Storm Tide Gauge Network and Wave Buoy Locations
Access to Information on Cyclones and Storm Surge
Telephone 1300 659 212 (for recorded public Tropical Cyclone Advices with state-wide access for the cost of a local call)
Web http://www.bom.gov.au/cyclone (Tropical Cyclone Advices and Track Maps) http://www.qld.gov.au/tides (DSITI storm tide web pages) http://www.qld.gov.au/waves (DSITI wave monitoring web pages)
27 Tropical Cyclone Storm Tide Warning Response System HandbookE D I T I O N 12 2 0 1 6
Appendix C - Tropical Cyclone Warning Service
Tropical Cyclone Outlooks - are issued daily during the cyclone season and give the likelihood of a tropical cyclone developing in the Eastern region (Coral Sea) and Northern region (including the Gulf of Carpentaria) in the following 3 days.
Tropical Cyclone Information Bulletins - are issued every 6 hours when a cyclone exists in Queensland waters, or when a low threatens to develop into a cyclone.
Tropical Cyclone Technical Bulletins - are issued every 6 hours when a cyclone exists in Queensland waters, or when a low threatens to develop into a cyclone. These are in text format and provide forecast track positions extending out to 120 hours (these will be available to the public on the Bureau’s web site).
Tropical Cyclone Advices - are messages referring to specific cyclone threats. These messages are sequentially numbered from 1 upwards for each cyclone.
Tropical Cyclone Advices contain messages detailing 2 levels of threat to coastal and island communities, namely Cyclone Watch and Cyclone Warning.
• Cyclone Watch - this message will be issued for localities where a cyclone centre is expected to make landfall and/or wind gusts of 100 kilometres an hour or more are likely within the next 1-2 days.
• Cyclone Warning - this message will be issued for localities where a cyclone centre is expected to make landfall and/or wind gusts of 100 kilometres an hour or more are likely within the next 24 hours.
Tropical Cyclone Advices are issued 6-hourly when the threat is more than 24 hours away from the
coast and islands, increasing to 3 hourly and then hourly as the urgency of the messages increases. Hourly updates may be issued for Category 2 (or greater) cyclones. The Bureau of Meteorology aims to dispatch Advices at least 10 minutes before the hour they are due so that the media can broadcast them close to the hour.
Each Cyclone Warning will commence with a headline statement designed to summarise the essence of the message. It will cover the area threatened and the level and timing of the threat.
Severe weather warnings - are issued (generally after landfall) when the system is no longer a cyclone but severe weather and/or flooding rains are still being experienced.
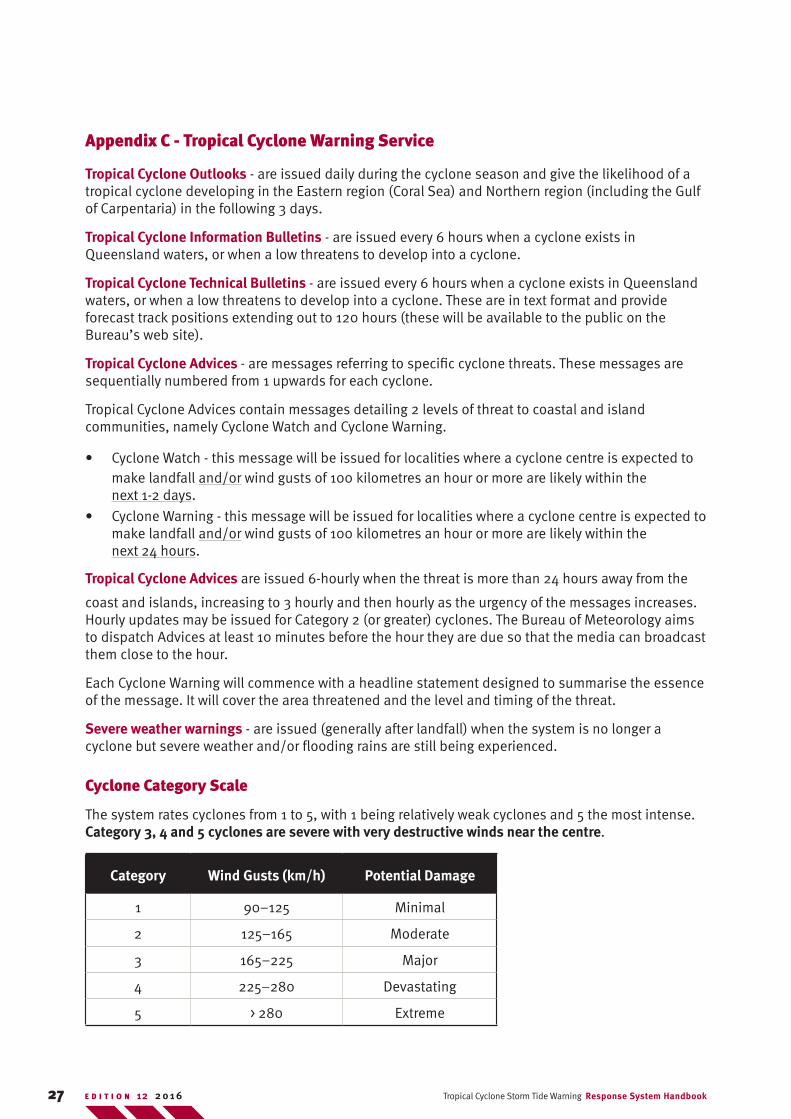
Cyclone Category Scale
The system rates cyclones from 1 to 5, with 1 being relatively weak cyclones and 5 the most intense. Category 3, 4 and 5 cyclones are severe with very destructive winds near the centre.
Category Wind Gusts (km/h) Potential Damage
1 90–125 Minimal
2 125–165 Moderate
3 165–225 Major
4 225–280 Devastating
5 > 280 Extreme
28Tropical Cyclone Storm Tide Warning Response System Handbook E D I T I O N 122 0 1 6
Standard Emergency Warning Signal8
In the case of tropical cyclones, use of the Standard Emergency Warning Signal (SEWS) will be limited to those warnings where destructive winds are expected on the coast or islands in the next 12 hours and/or a damaging Storm Surge is predicted. Authorisation for the electronic media to use the signal will be contained near the top of the Tropical Cyclone Advice. The SEWS may also be used very infrequently for other serious and large-scale weather and flood events.
Networking stations have been asked to pay particular attention to the isolation of transmitters so that undue alarm is not created by transmission of the signal into areas that are not seriously threatened. It may not always be possible however to totally confine the transmissions.
8 QFES is currently reviewing the SEWS Guideline.
29 Tropical Cyclone Storm Tide Warning Response System HandbookE D I T I O N 12 2 0 1 6
Tropical Cyclone Forecast Track Map
The Tropical Cyclone Forecast Track Map (see sample at Figure 4) includes both the past track and the forecast positions and intensities in 6-hourly time-steps out to 72 hours. It is important to note however that this product does not contain all the information in the Tropical Cyclone Advice, especially important details on the cyclone impact, such as the potentially dangerous threat of storm tide. It is also unsuitable for mariners who are advised to refer to coastal waters and ocean wind warnings.
A Tropical Cyclone Technical Bulletin is also available to the public on the Bureau’s web site. This will generally include tropical cyclone forecast track positions extending out to 120 hours.
Detailed below are the main features of the Tropical Cyclone Forecast Track Map.
Forecast Track
• Distinctive colours are used to depict the Watch and Warning zones and the area of very destructive winds (gusts >170 km/h), destructive winds (gusts >125 km/h) and strong gales (gusts >100 km/h).
• The forecast track is the most likely path of the cyclone.
• The past track is shown along with the forecast positions out to 72 hours in 6-hourly time steps.
• The numbers in the circles at the centre locations show the Category, or if the system is expected to significantly weaken, an “L” is used to indicate a low pressure centre.
Grey Zone of Uncertainty (otherwise known as the Cone of Uncertainty)
• The grey zone is the area within which the cyclone centre is expected to be in the following 72 hours.
• This covers most scenarios but occasionally the cyclone may move outside this area.
• Importantly, the impact of the cyclone will almost certainly extend well beyond the grey zone.
Wind Thresholds
• Solid coloured ellipses surround the current cyclone position, representing winds of various strengths.
• The open ellipses surrounding the forecast positions represent the outer extent of each category of wind strength, assuming the cyclone follows the official forecast track.
• Note that the ellipses may be omitted from the intermediate forecast positions to minimise clutter.
• The winds are likely to extend beyond these areas as the cyclone will almost certainly not follow the forecast track precisely. The coastal extent of the Warning zone reflects this uncertainty.
30Tropical Cyclone Storm Tide Warning Response System Handbook E D I T I O N 122 0 1 6
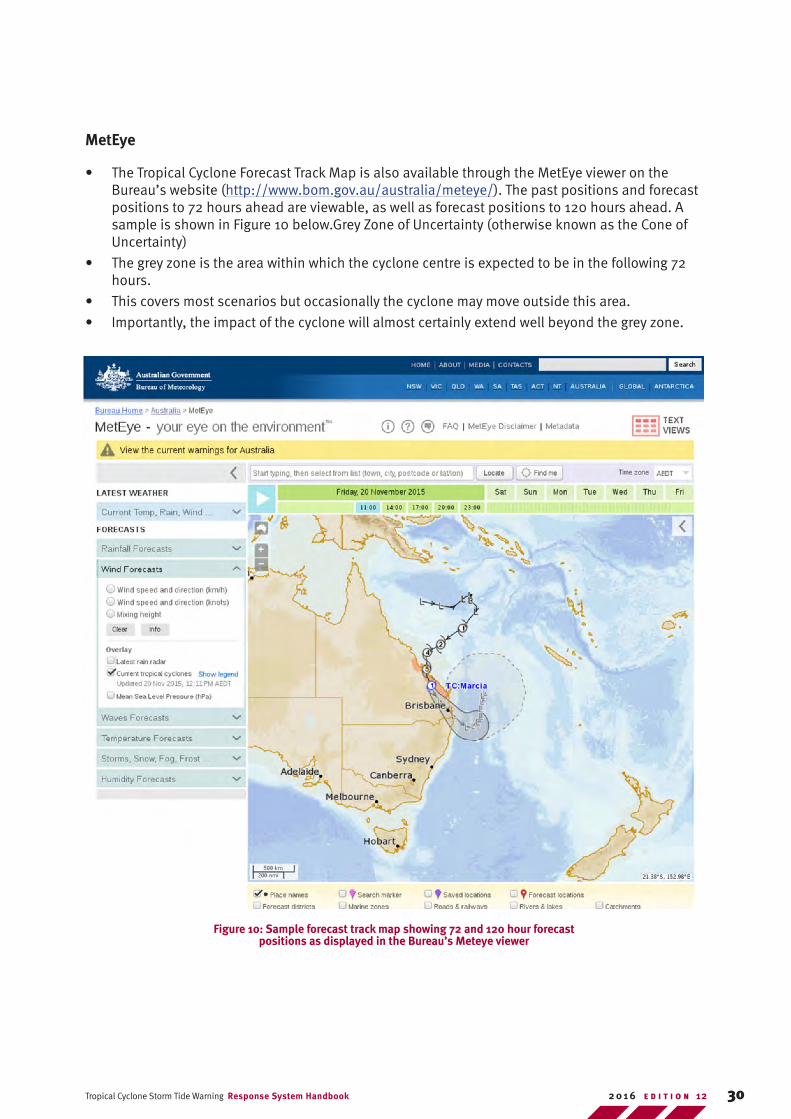
MetEye
• The Tropical Cyclone Forecast Track Map is also available through the MetEye viewer on the Bureau’s website (http://www.bom.gov.au/australia/meteye/). The past positions and forecast positions to 72 hours ahead are viewable, as well as forecast positions to 120 hours ahead. A sample is shown in Figure 10 below.Grey Zone of Uncertainty (otherwise known as the Cone of Uncertainty)
• The grey zone is the area within which the cyclone centre is expected to be in the following 72 hours.
• This covers most scenarios but occasionally the cyclone may move outside this area.
• Importantly, the impact of the cyclone will almost certainly extend well beyond the grey zone.
Figure 10: Sample forecast track map showing 72 and 120 hour forecast positions as displayed in the Bureau’s Meteye viewer
31 Tropical Cyclone Storm Tide Warning Response System HandbookE D I T I O N 12 2 0 1 6
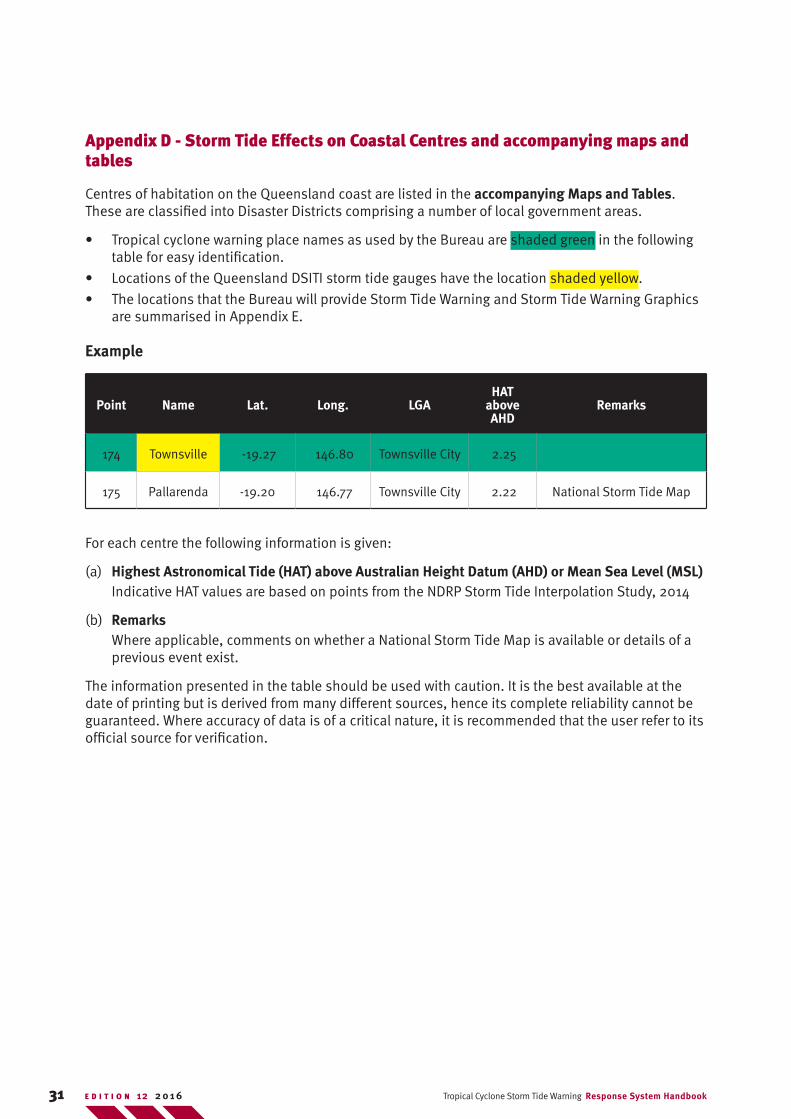
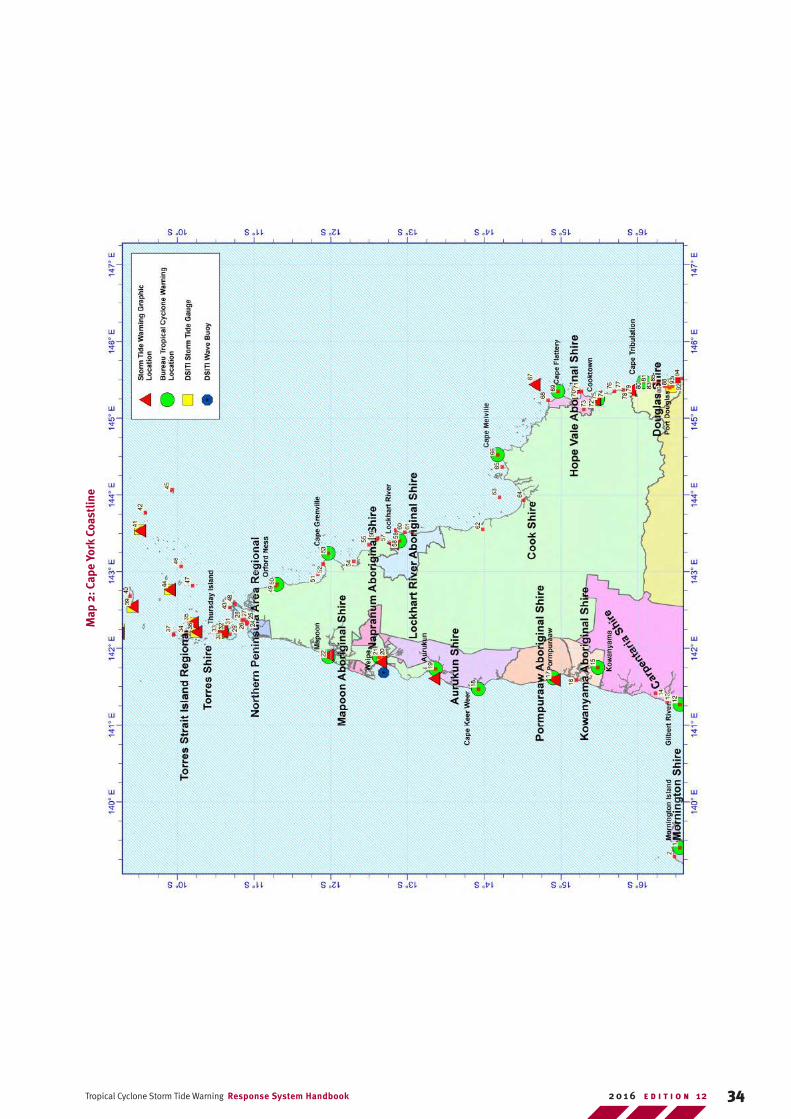
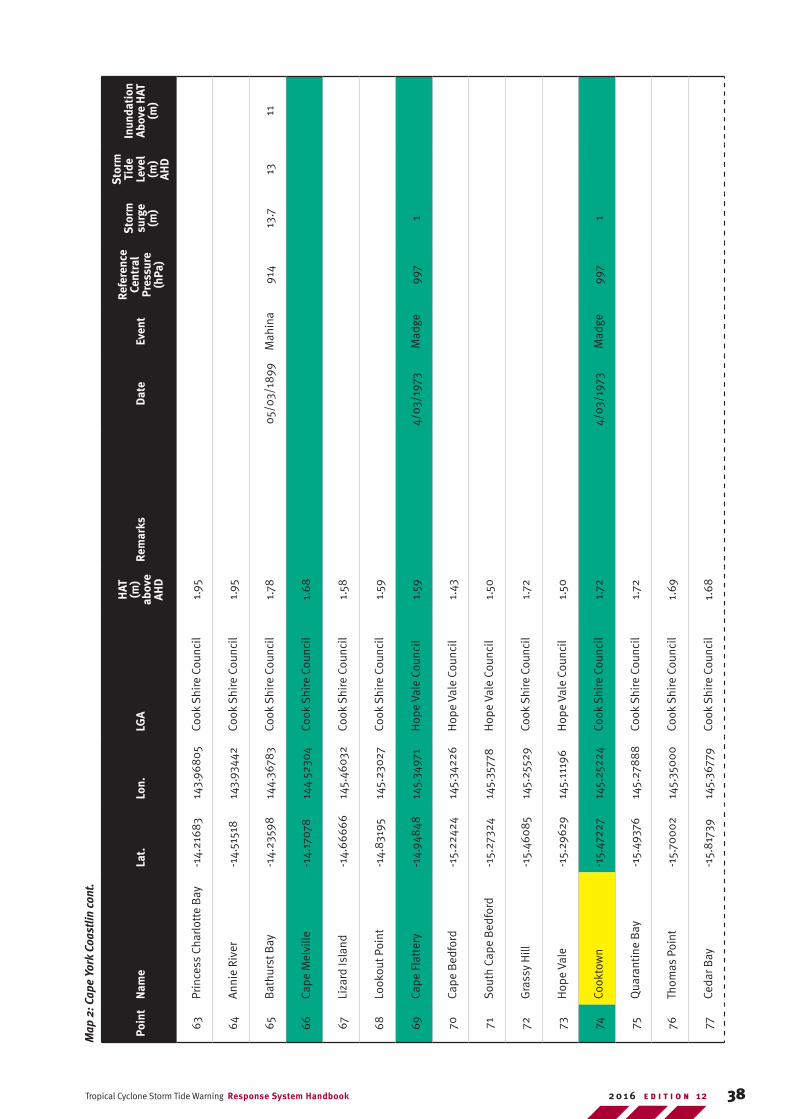
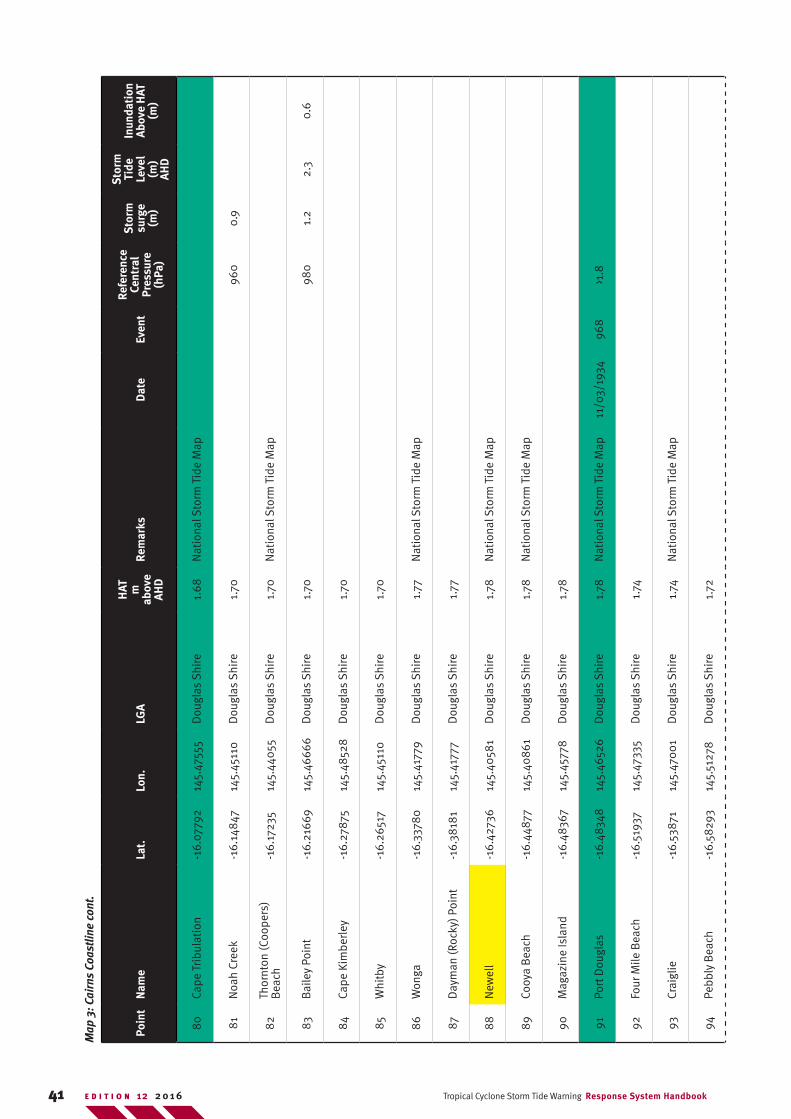
Appendix D - Storm Tide Effects on Coastal Centres and accompanying maps and tables
Centres of habitation on the Queensland coast are listed in the accompanying Maps and Tables. These are classified into Disaster Districts comprising a number of local government areas.
• Tropical cyclone warning place names as used by the Bureau are shaded green in the following table for easy identification.
• Locations of the Queensland DSITI storm tide gauges have the location shaded yellow.
• The locations that the Bureau will provide Storm Tide Warning and Storm Tide Warning Graphics are summarised in Appendix E.
Example
Point Name Lat. Long. LGAHAT
above AHD
Remarks
174 Townsville -19.27 146.80 Townsville City 2.25
175 Pallarenda -19.20 146.77 Townsville City 2.22 National Storm Tide Map
For each centre the following information is given:
(a) Highest Astronomical Tide (HAT) above Australian Height Datum (AHD) or Mean Sea Level (MSL) Indicative HAT values are based on points from the NDRP Storm Tide Interpolation Study, 2014
(b) Remarks Where applicable, comments on whether a National Storm Tide Map is available or details of a previous event exist.
The information presented in the table should be used with caution. It is the best available at the date of printing but is derived from many different sources, hence its complete reliability cannot be guaranteed. Where accuracy of data is of a critical nature, it is recommended that the user refer to its official source for verification.
32Tropical Cyclone Storm Tide Warning Response System Handbook E D I T I O N 122 0 1 6
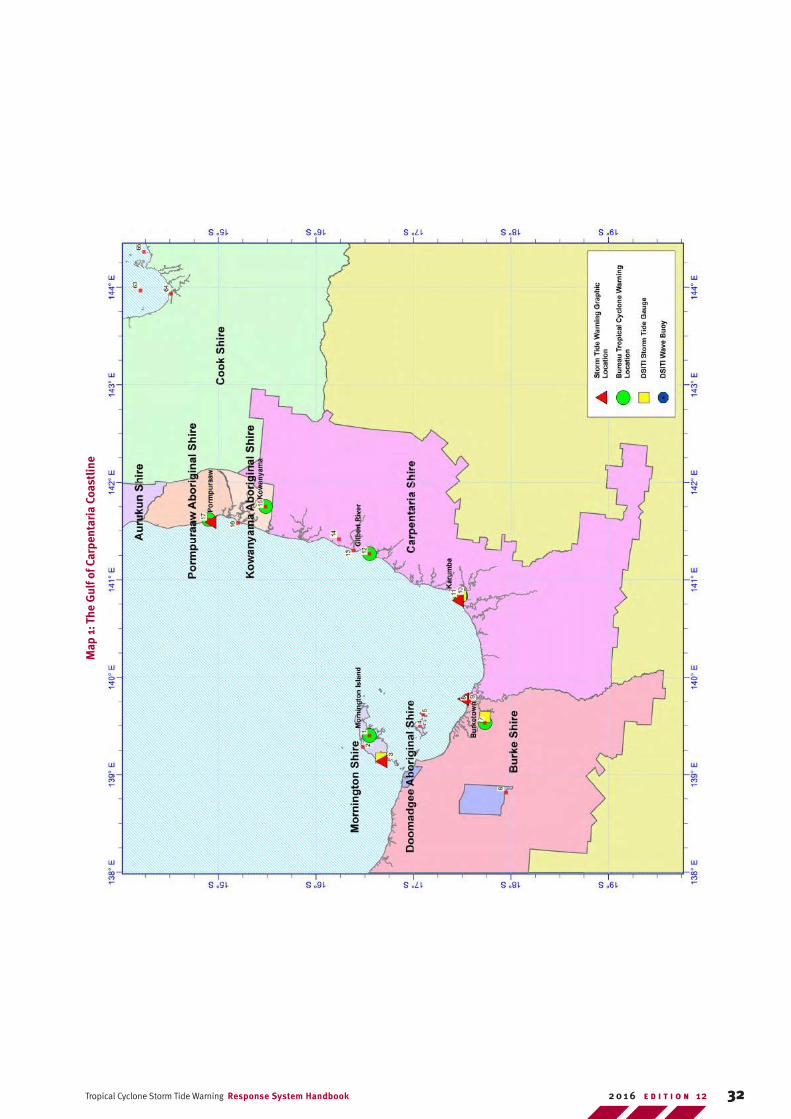
Map
1: T
he G
ulf o
f Car
pent
aria
Coa
stlin
e
33 Tropical Cyclone Storm Tide Warning Response System HandbookE D I T I O N 12 2 0 1 6
Poin
tN
ame
Lat.
Lon.
LGA
HAT
(m
)ab
ove
AHD
Rem
arks
Dat
eEv
ent
Refe
renc
e Ce
ntra
l Pr
essu
re
(hPa
)
Sto
rm
surg
e (m
)
Sto
rm
Tide
Le
vel
(m)
AHD
Inun
dati
on
Abov
e H
AT
(m)
1M
orni
ngto
n Is
land
-16.
5485
013
9.40
115
Mor
ning
ton
1.98
Nat
iona
l Sto
rm T
ide
Map
19/1
2/19
76Te
d95
01.
71.
8
2B
irri
Bea
ch-1
6.47
917
139.
2868
1M
orni
ngto
n1.
65
3D
enha
m Is
land
-16.
7145
313
9.15
979
Mor
ning
ton
1.98
4B
enti
nck
Is-1
7.0
670
013
9.50
00
0M
orni
ngto
n2.
5923
/02/
1948
996
>3.7
4.7
3.2
5S
wee
rs Is
(Ins
crip
tion
poi
nt)
-17.
1022
513
9.61
892
Mor
ning
ton
2.63
6D
oom
adge
e-1
7.94
434
138.
830
09D
oom
adge
e Co
unci
l2.
80
7B
urke
tow
n-1
7.74
08
013
9.54
780
Bur
ke2.
80
19/1
2/19
76Te
d95
03
3.2
8A
lber
t Riv
er-1
7.56
700
139.
750
00
Bur
ke2.
80
19/1
2/19
76Te
d95
04.
66.
33.
6
9A
lber
t Riv
er H
eads
-17.
5730
013
9.75
80
0B
urke
2.8
00
5/03
/18
875.
57.
85.
1
10Ka
rum
ba-1
7.48
386
140.
8397
6Ca
rpen
tari
a2.
7019
/12/
1976
Ted
950
23.
6
11Ka
rum
ba P
oint
-17.
4650
114
0.82
926
Carp
enta
ria
2.70
12G
ilber
t Riv
er-1
6.54
849
141.
2678
4Ca
rpen
tari
a2.
326/
01/
1996
Bar
ry95
04.
56
3.4
13S
taat
en R
iver
Off
shor
e-1
6.38
300
141.
300
00
Carp
enta
ria
2.28
6/0
1/19
96B
arry
950
3.7
14In
kerm
an S
tati
on-1
6.23
334
141.
4166
7Ca
rpen
tari
a2.
2419
/02/
1971
Fion
a96
0>4
15Ko
wan
yam
a-1
5.47
960
141.
7420
2Ko
wan
yam
a Co
unci
l2.
00
16M
itche
ll Ri
ver
-15.
198
4914
1.58
444
Kow
anya
ma
Coun
cil
1.94
17Po
rmpu
raaw
-14.
8979
414
1.61
921
Porm
pura
aw C
ounc
il1.
86
Nat
iona
l Sto
rm T
ide
Map
3/02
/196
4D
ora
974
5
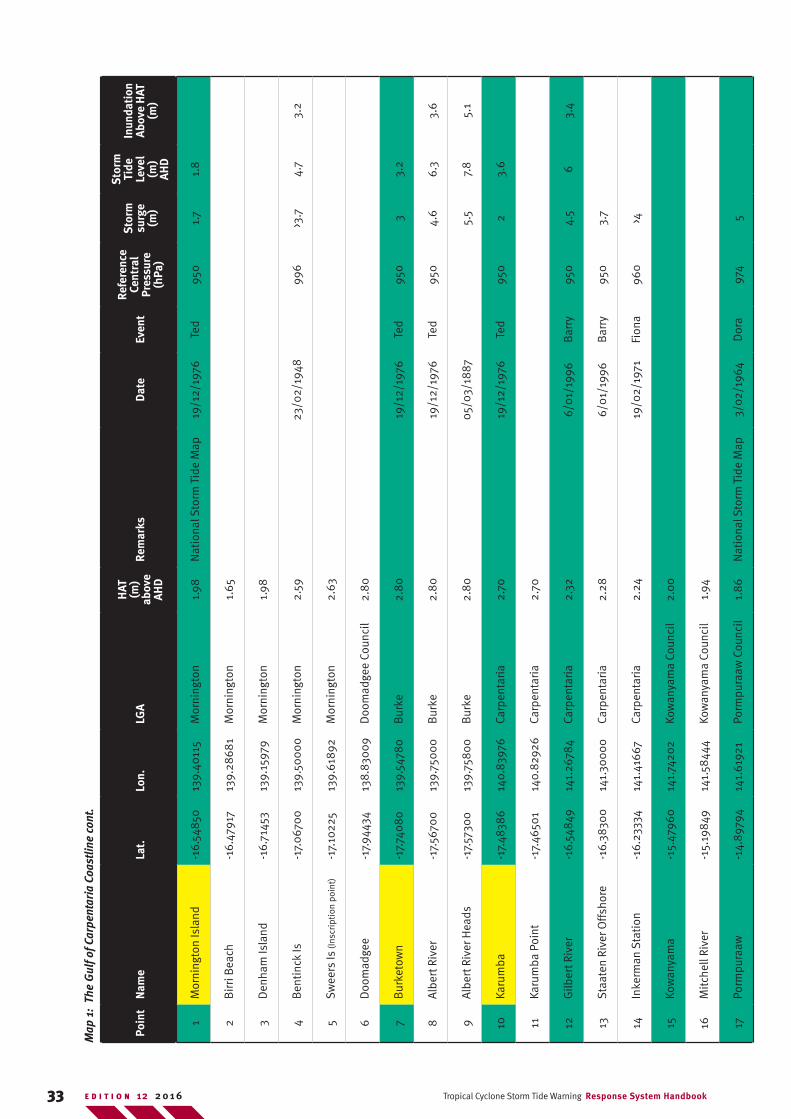
Map
1:
The
Gul
f of C
arpe
ntar
ia C
oast
line
cont
.
34Tropical Cyclone Storm Tide Warning Response System Handbook E D I T I O N 122 0 1 6
Map
2: C
ape
York
Coa
stlin
e
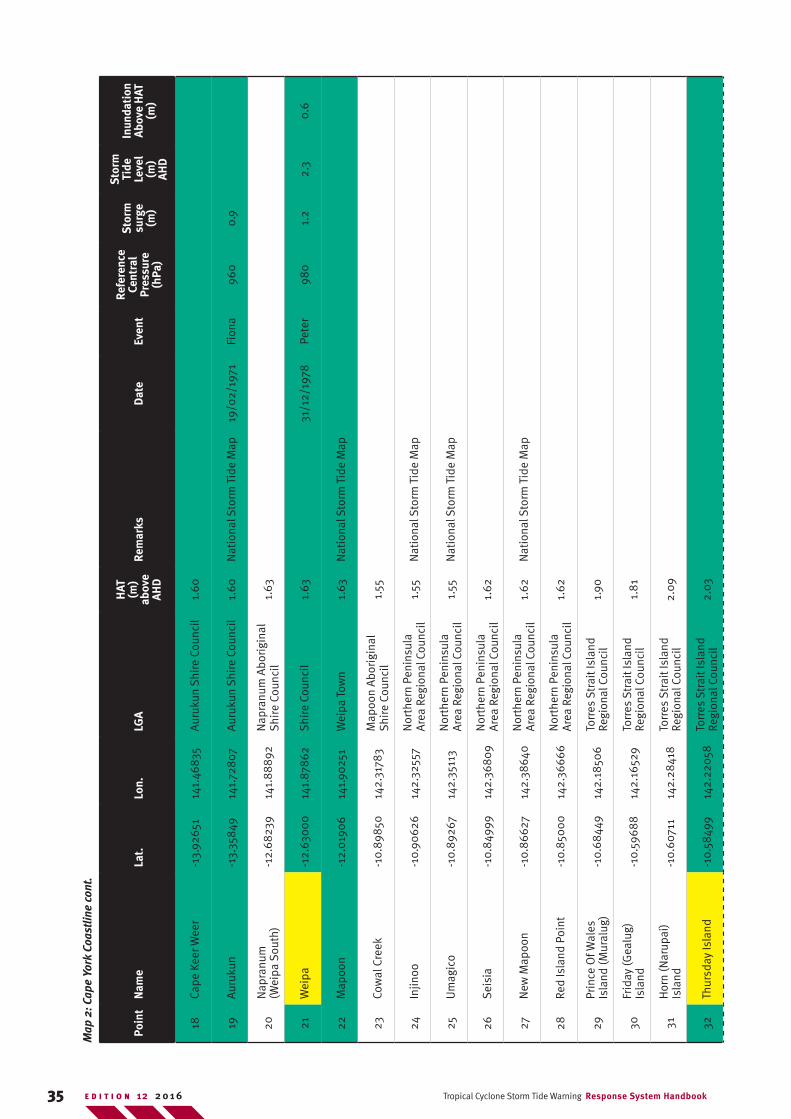
35 Tropical Cyclone Storm Tide Warning Response System HandbookE D I T I O N 12 2 0 1 6
Poin
tN
ame
Lat.
Lon.
LGA
HAT
(m
) ab
ove
AHD
Rem
arks
Dat
eEv
ent
Refe
renc
e Ce
ntra
l Pr
essu
re
(hPa
)
Sto
rm
surg
e (m
)
Sto
rm
Tide
Le
vel
(m)
AHD
Inun
dati
on
Abov
e H
AT
(m)
18Ca
pe K
eer W
eer
-13.
9265
114
1.46
835
Aur
ukun
Shi
re C
ounc
il1.
60
19A
uruk
un-1
3.35
849
141.
728
07A
uruk
un S
hire
Cou
ncil
1.60
Nat
iona
l Sto
rm T
ide
Map
19/0
2/19
71Fi
ona
960
0.9
20N
apra
num
(W
eipa
Sou
th)
-12.
6823
914
1.8
889
2N
apra
num
Abo
rigi
nal
Shi
re C
ounc
il1.
63
21W
eipa
-12.
630
00
141.
878
62S
hire
Cou
ncil
1.63
31/1
2/19
78Pe
ter
980
1.2
2.3
0.6
22M
apoo
n-1
2.0
190
614
1.90
251
Wei
pa T
own
1.63
Nat
iona
l Sto
rm T
ide
Map
23Co
wal
Cre
ek-1
0.89
850
142.
3178
3M
apoo
n A
bori
gina
l S
hire
Cou
ncil
1.55
24In
jinoo
-10.
9062
614
2.32
557
Nor
ther
n Pe
nins
ula
Are
a Re
gion
al C
ounc
il1.
55N
atio
nal S
torm
Tid
e M
ap
25U
mag
ico
-10.
8926
714
2.35
113
Nor
ther
n Pe
nins
ula
Are
a Re
gion
al C
ounc
il1.
55N
atio
nal S
torm
Tid
e M
ap
26S
eisi
a-1
0.8
4999
142.
368
09N
orth
ern
Peni
nsul
a A
rea
Regi
onal
Cou
ncil
1.62
27N
ew M
apoo
n-1
0.8
6627
142.
3864
0N
orth
ern
Peni
nsul
a A
rea
Regi
onal
Cou
ncil
1.62
Nat
iona
l Sto
rm T
ide
Map
28Re
d Is
land
Poi
nt-1
0.85
00
014
2.36
666
Nor
ther
n Pe
nins
ula
Are
a Re
gion
al C
ounc
il1.
62
29Pr
ince
Of W
ales
Is
land
(Mur
alug
)-1
0.68
449
142.
1850
6To
rres
Str
ait I
slan
d Re
gion
al C
ounc
il1.
90
30Fr
iday
(Gea
lug)
Is
land
-10.
5968
814
2.16
529
Torr
es S
trai
t Isl
and
Regi
onal
Cou
ncil
1.8
1
31H
orn
(Nar
upai
) Is
land
-10.
6071
114
2.28
418
Torr
es S
trai
t Isl
and
Regi
onal
Cou
ncil
2.09
32Th
ursd
ay Is
land
-10.
5849
914
2.22
058
Torr
es S
trai
t Isl
and
Regi
onal
Cou
ncil
2.03
Map
2: C
ape
York
Coa
stlin
e co
nt.
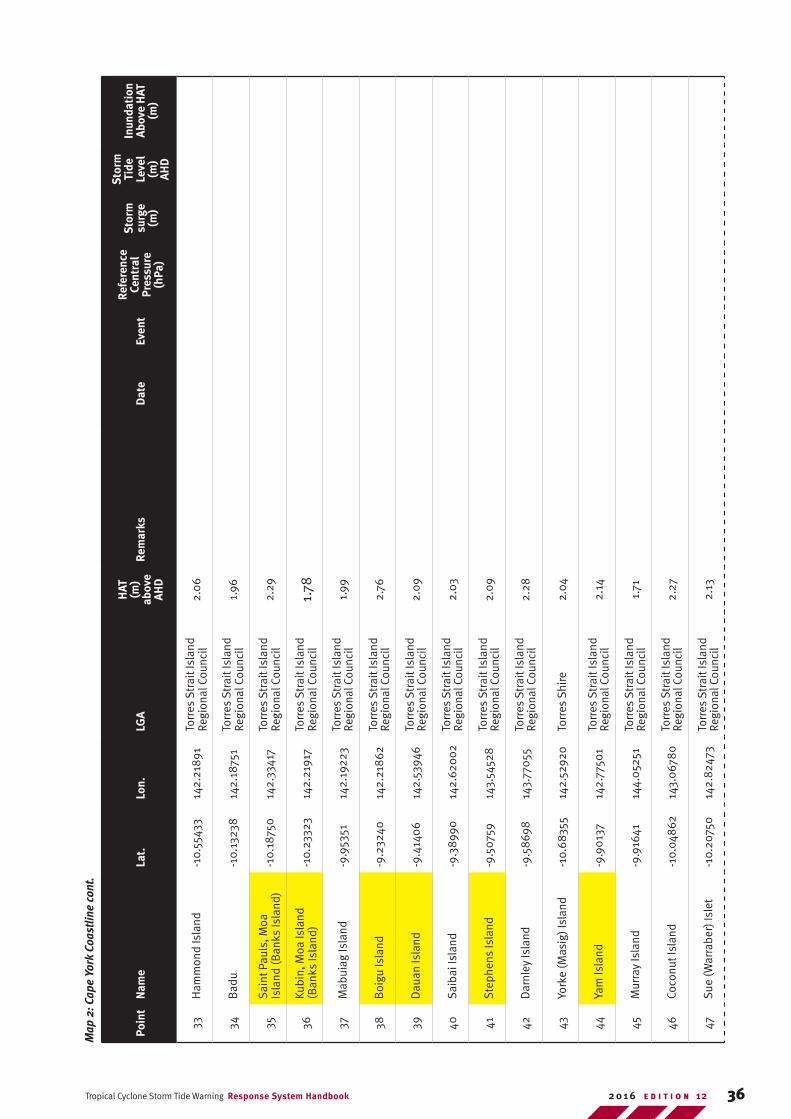
36Tropical Cyclone Storm Tide Warning Response System Handbook E D I T I O N 122 0 1 6
Poin
tN
ame
Lat.
Lon.
LGA
HAT
(m
) ab
ove
AHD
Rem
arks
Dat
eEv
ent
Refe
renc
e Ce
ntra
l Pr
essu
re
(hPa
)
Sto
rm
surg
e (m
)
Sto
rm
Tide
Le
vel
(m)
AHD
Inun
dati
on
Abov
e H
AT
(m)
33H
amm
ond
Isla
nd-1
0.55
433
142.
2189
1To
rres
Str
ait I
slan
d Re
gion
al C
ounc
il2.
06
34B
adu
-10.
1323
814
2.18
751
Torr
es S
trai
t Isl
and
Regi
onal
Cou
ncil
1.96
35S
aint
Pau
ls, M
oa
Isla
nd (B
anks
Isla
nd)
-10.
1875
014
2.33
417
Torr
es S
trai
t Isl
and
Regi
onal
Cou
ncil
2.29
36Ku
bin,
Moa
Isla
nd
(Ban
ks Is
land
)-1
0.23
323
142.
2191
7To
rres
Str
ait I
slan
d Re
gion
al C
ounc
il1.
78
37M
abui
ag Is
land
-9.9
5351
142.
1922
3To
rres
Str
ait I
slan
d Re
gion
al C
ounc
il1.
99
38B
oigu
Isla
nd-9
.232
4014
2.21
862
Torr
es S
trai
t Isl
and
Regi
onal
Cou
ncil
2.76
39D
auan
Isla
nd-9
.414
06
142.
5394
6To
rres
Str
ait I
slan
d Re
gion
al C
ounc
il2.
09
40S
aiba
i Isl
and
-9.3
8990
142.
620
02To
rres
Str
ait I
slan
d Re
gion
al C
ounc
il2.
03
41S
teph
ens
Isla
nd-9
.507
5914
3.54
528
Torr
es S
trai
t Isl
and
Regi
onal
Cou
ncil
2.09
42D
arnl
ey Is
land
-9.5
869
814
3.77
055
Torr
es S
trai
t Isl
and
Regi
onal
Cou
ncil
2.28
43Yo
rke
(Mas
ig) I
slan
d-1
0.68
355
142.
5292
0To
rres
Shi
re2.
04
44Ya
m Is
land
-9.9
013
714
2.77
501
Torr
es S
trai
t Isl
and
Regi
onal
Cou
ncil
2.14
45M
urra
y Is
land
-9.9
1641
144.
052
51To
rres
Str
ait I
slan
d Re
gion
al C
ounc
il1.
71
46Co
conu
t Isl
and
-10.
048
6214
3.0
678
0To
rres
Str
ait I
slan
d Re
gion
al C
ounc
il2.
27
47Su
e (W
arra
ber)
Isle
t-1
0.20
750
142.
8247
3To
rres
Str
ait I
slan
d Re
gion
al C
ounc
il2.
13
Map
2: C
ape
York
Coa
stlin
e co
nt.
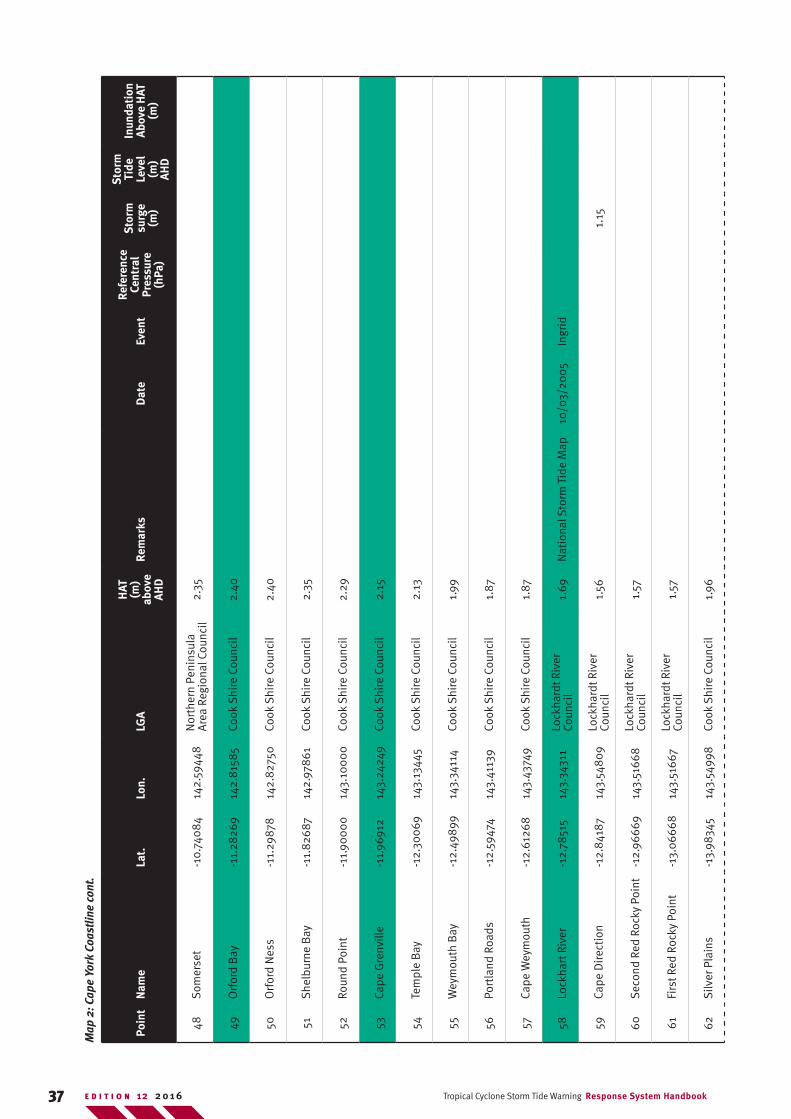
37 Tropical Cyclone Storm Tide Warning Response System HandbookE D I T I O N 12 2 0 1 6
Poin
tN
ame
Lat.
Lon.
LGA
HAT
(m
) ab
ove
AHD
Rem
arks
Dat
eEv
ent
Refe
renc
e Ce
ntra
l Pr
essu
re
(hPa
)
Sto
rm
surg
e (m
)
Sto
rm
Tide
Le
vel
(m)
AHD
Inun
dati
on
Abov
e H
AT
(m)
48S
omer
set
-10.
740
84
142.
5944
8N
orth
ern
Peni
nsul
a A
rea
Regi
onal
Cou
ncil
2.35
49O
rfor
d B
ay-1
1.28
269
142.
815
85Co
ok S
hire
Cou
ncil
2.40
50O
rfor
d N
ess
-11.
2987
814
2.82
750
Cook
Shi
re C
ounc
il2.
40
51S
helb
urne
Bay
-11.
8268
714
2.97
861
Cook
Shi
re C
ounc
il2.
35
52Ro
und
Poin
t-1
1.90
00
014
3.10
00
0Co
ok S
hire
Cou
ncil
2.29
53Ca
pe G
renv
ille
-11.
9691
214
3.24
249
Cook
Shi
re C
ounc
il2.
15
54Te
mpl
e B
ay-1
2.30
069
143.
1344
5Co
ok S
hire
Cou
ncil
2.13
55W
eym
outh
Bay
-12.
4989
914
3.34
114
Cook
Shi
re C
ounc
il1.
99
56Po
rtla
nd R
oads
-12.
5947
414
3.41
139
Cook
Shi
re C
ounc
il1.
87
57Ca
pe W
eym
outh
-12.
6126
814
3.43
749
Cook
Shi
re C
ounc
il1.
87
58Lo
ckha
rt R
iver
-12.
7851
514
3.34
311
Lock
hard
t Riv
er
Coun
cil
1.69
Nat
iona
l Sto
rm T
ide
Map
10/0
3/20
05
Ingr
id
59Ca
pe D
irec
tion
-12.
841
8714
3.54
809
Lock
hard
t Riv
er
Coun
cil
1.56
1.15
60S
econ
d Re
d Ro
cky
Poin
t-1
2.96
669
143.
5166
8Lo
ckha
rdt R
iver
Co
unci
l1.
57
61Fi
rst R
ed R
ocky
Poi
nt-1
3.0
6668
143.
5166
7Lo
ckha
rdt R
iver
Co
unci
l1.
57
62S
ilver
Pla
ins
-13.
9834
514
3.54
998
Cook
Shi
re C
ounc
il1.
96
Map
2: C
ape
York
Coa
stlin
e co
nt.
38Tropical Cyclone Storm Tide Warning Response System Handbook E D I T I O N 122 0 1 6
Poin
tN
ame
Lat.
Lon.
LGA
HAT
(m
) ab
ove
AHD
Rem
arks
Dat
eEv
ent
Refe
renc
e Ce
ntra
l Pr
essu
re
(hPa
)
Sto
rm
surg
e (m
)
Sto
rm
Tide
Le
vel
(m)
AHD
Inun
dati
on
Abov
e H
AT
(m)
63Pr
ince
ss C
harl
otte
Bay
-14.
2168
314
3.96
80
5Co
ok S
hire
Cou
ncil
1.95
64A
nnie
Riv
er-1
4.51
518
143.
9344
2Co
ok S
hire
Cou
ncil
1.95
65B
athu
rst B
ay-1
4.23
598
144.
3678
3Co
ok S
hire
Cou
ncil
1.78
05/
03/1
899
Mah
ina
914
13.7
1311
66Ca
pe M
elvi
lle-1
4.17
078
144.
5230
4Co
ok S
hire
Cou
ncil
1.68
67Li
zard
Isla
nd-1
4.66
666
145.
4603
2Co
ok S
hire
Cou
ncil
1.58
68Lo
okou
t Poi
nt-1
4.83
195
145.
2302
7Co
ok S
hire
Cou
ncil
1.59
69Ca
pe F
latt
ery
-14.
948
4814
5.34
971
Hop
e Va
le C
ounc
il1.
594/
03/1
973
Mad
ge99
71
70Ca
pe B
edfo
rd-1
5.22
424
145.
3422
6H
ope
Vale
Cou
ncil
1.43
71S
outh
Cap
e B
edfo
rd-1
5.27
324
145.
3577
8H
ope
Vale
Cou
ncil
1.50
72G
rass
y H
ill-1
5.46
085
145.
2552
9Co
ok S
hire
Cou
ncil
1.72
73H
ope
Vale
-15.
2962
914
5.11
196
Hop
e Va
le C
ounc
il1.
50
74Co
okto
wn
-15.
4722
714
5.25
224
Cook
Shi
re C
ounc
il1.
724/
03/1
973
Mad
ge99
71
75Q
uara
ntin
e B
ay-1
5.49
376
145.
278
88
Cook
Shi
re C
ounc
il1.
72
76Th
omas
Poi
nt-1
5.70
002
145.
350
00
Cook
Shi
re C
ounc
il1.
69
77Ce
dar B
ay-1
5.8
1739
145.
3677
9Co
ok S
hire
Cou
ncil
1.68
Map
2: C
ape
York
Coa
stlin
con
t.
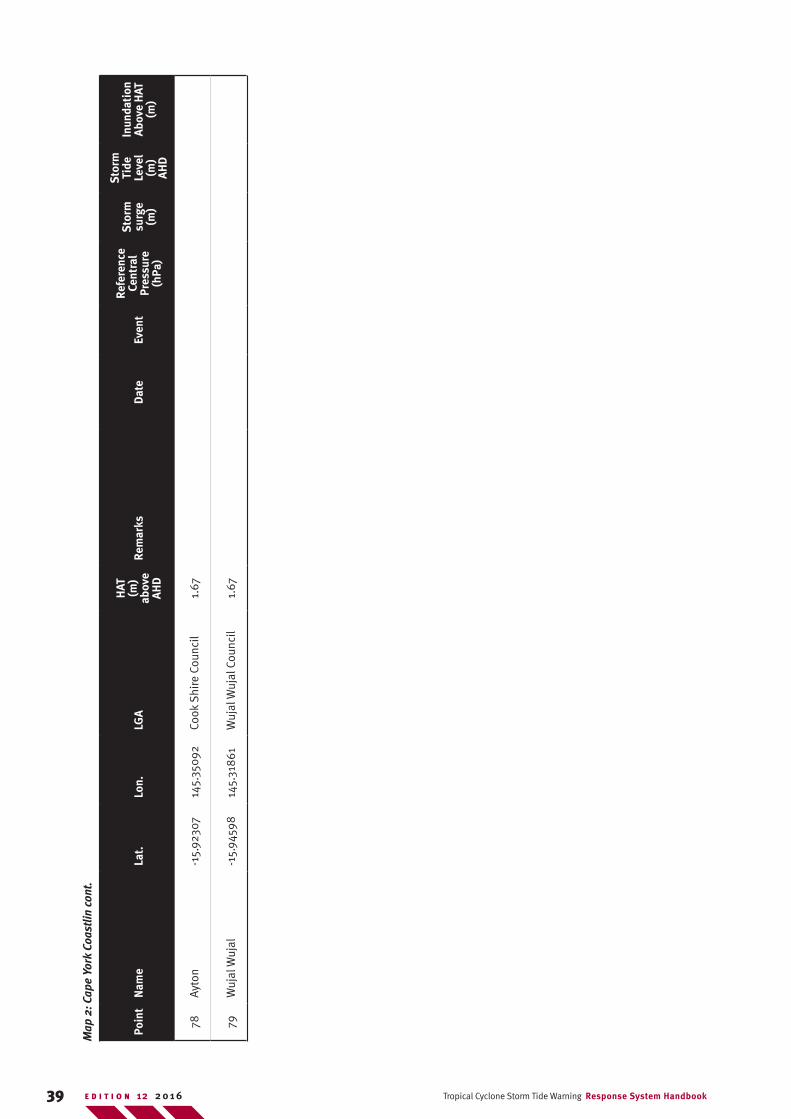
39 Tropical Cyclone Storm Tide Warning Response System HandbookE D I T I O N 12 2 0 1 6
Poin
tN
ame
Lat.
Lon.
LGA
HAT
(m
) ab
ove
AHD
Rem
arks
Dat
eEv
ent
Refe
renc
e Ce
ntra
l Pr
essu
re
(hPa
)
Sto
rm
surg
e (m
)
Sto
rm
Tide
Le
vel
(m)
AHD
Inun
dati
on
Abov
e H
AT
(m)
78A
yton
-15.
9230
714
5.35
092
Cook
Shi
re C
ounc
il1.
67
79W
ujal
Wuj
al-1
5.94
598
145.
318
61W
ujal
Wuj
al C
ounc
il1.
67
Map
2: C
ape
York
Coa
stlin
con
t.
40Tropical Cyclone Storm Tide Warning Response System Handbook E D I T I O N 122 0 1 6
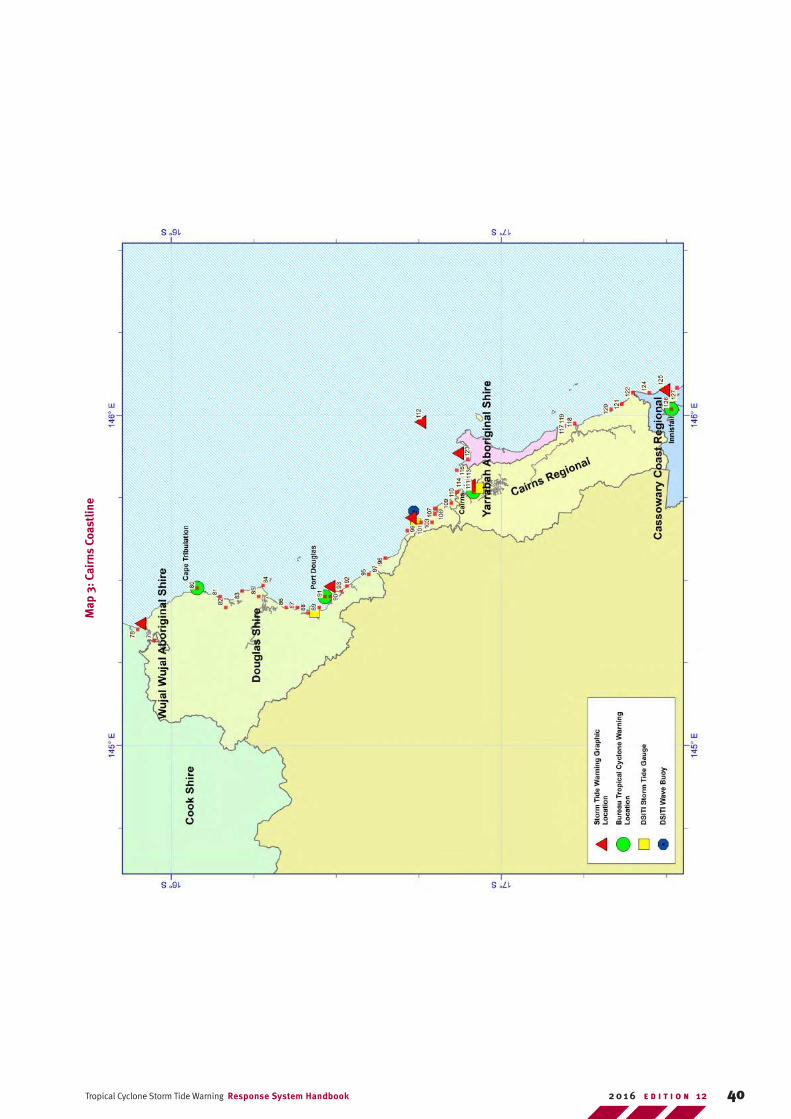
Map
3: C
airn
s Co
astl
ine
41 Tropical Cyclone Storm Tide Warning Response System HandbookE D I T I O N 12 2 0 1 6
Poin
tN
ame
Lat.
Lon.
LGA
HAT
m
ab
ove
AHD
Rem
arks
Dat
eEv
ent
Refe
renc
e Ce
ntra
l Pr
essu
re
(hPa
)
Sto
rm
surg
e (m
)
Sto
rm
Tide
Le
vel
(m)
AHD
Inun
dati
on
Abov
e H
AT
(m)
80
Cape
Tri
bula
tion
-16.
0779
214
5.47
555
Dou
glas
Shi
re1.
68N
atio
nal S
torm
Tid
e M
ap
81
Noa
h Cr
eek
-16.
148
4714
5.45
110
Dou
glas
Shi
re1.
7096
00.
9
82Th
ornt
on (C
oope
rs)
Bea
ch-1
6.17
235
145.
440
55D
ougl
as S
hire
1.70
Nat
iona
l Sto
rm T
ide
Map
83B
aile
y Po
int
-16.
2166
914
5.46
666
Dou
glas
Shi
re1.
7098
01.
22.
30.
6
84
Cape
Kim
berl
ey-1
6.27
875
145.
4852
8D
ougl
as S
hire
1.70
85W
hitb
y-1
6.26
517
145.
4511
0D
ougl
as S
hire
1.70
86
Won
ga-1
6.33
780
145.
4177
9D
ougl
as S
hire
1.77
Nat
iona
l Sto
rm T
ide
Map
87D
aym
an (R
ocky
) Poi
nt-1
6.38
181
145.
4177
7D
ougl
as S
hire
1.77
88
New
ell
-16.
4273
614
5.40
581
Dou
glas
Shi
re1.
78N
atio
nal S
torm
Tid
e M
ap
89Co
oya
Bea
ch-1
6.44
877
145.
408
61D
ougl
as S
hire
1.78
Nat
iona
l Sto
rm T
ide
Map
90M
agaz
ine
Isla
nd-1
6.48
367
145.
4577
8D
ougl
as S
hire
1.78
91Po
rt D
ougl
as-1
6.48
348
145.
4652
6D
ougl
as S
hire
1.78
Nat
iona
l Sto
rm T
ide
Map
11/0
3/19
3496
8>1
.8
92Fo
ur M
ile B
each
-16.
5193
714
5.47
335
Dou
glas
Shi
re1.
74
93Cr
aigl
ie-1
6.53
871
145.
470
01
Dou
glas
Shi
re1.
74N
atio
nal S
torm
Tid
e M
ap
94Pe
bbly
Bea
ch-1
6.58
293
145.
5127
8D
ougl
as S
hire
1.72
Map
3: C
airn
s Co
astli
ne c
ont.
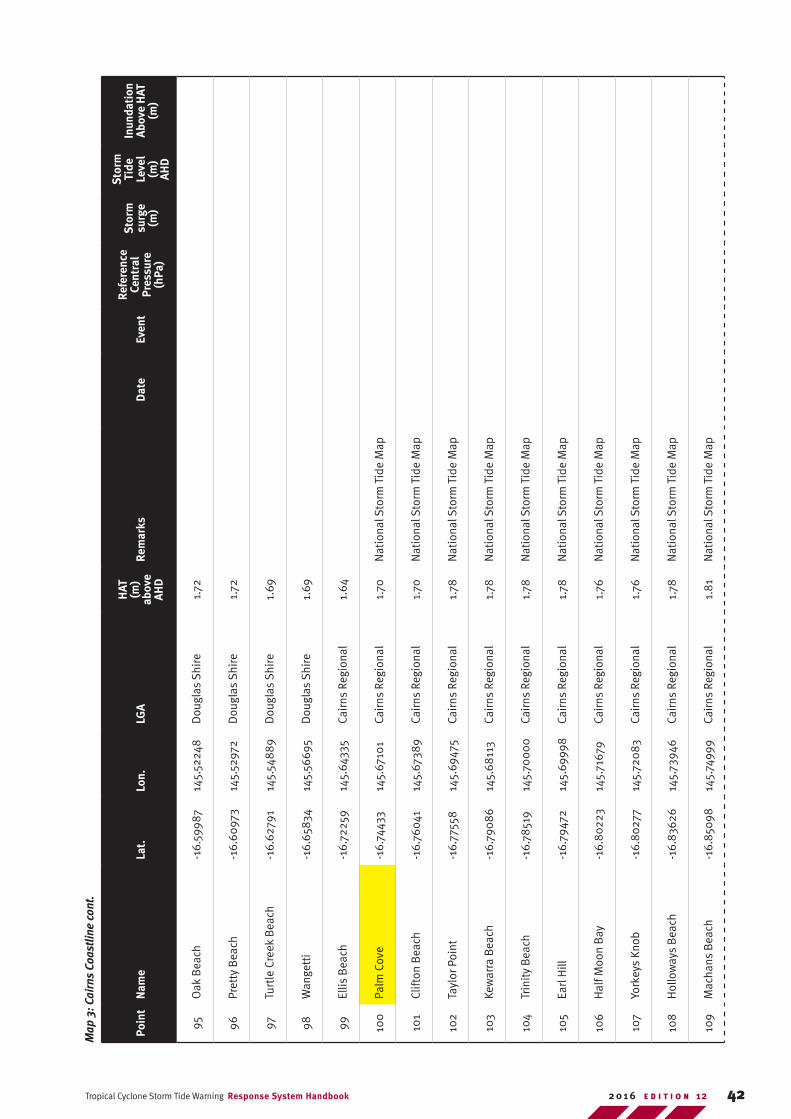
42Tropical Cyclone Storm Tide Warning Response System Handbook E D I T I O N 122 0 1 6
Poin
tN
ame
Lat.
Lon.
LGA
HAT
(m
) ab
ove
AHD
Rem
arks
Dat
eEv
ent
Refe
renc
e Ce
ntra
l Pr
essu
re
(hPa
)
Sto
rm
surg
e (m
)
Sto
rm
Tide
Le
vel
(m)
AHD
Inun
dati
on
Abov
e H
AT
(m)
95O
ak B
each
-16.
5998
714
5.52
248
Dou
glas
Shi
re1.
72
96Pr
etty
Bea
ch-1
6.60
973
145.
5297
2D
ougl
as S
hire
1.72
97Tu
rtle
Cre
ek B
each
-16.
6279
114
5.54
889
Dou
glas
Shi
re1.
69
98W
ange
tti
-16.
6583
414
5.56
695
Dou
glas
Shi
re1.
69
99El
lis B
each
-16.
7225
914
5.64
335
Cair
ns R
egio
nal
1.64
100
Palm
Cov
e-1
6.74
433
145.
6710
1Ca
irns
Reg
iona
l1.
70N
atio
nal S
torm
Tid
e M
ap
101
Clift
on B
each
-16.
7604
114
5.67
389
Cair
ns R
egio
nal
1.70
Nat
iona
l Sto
rm T
ide
Map
102
Tayl
or P
oint
-16.
7755
814
5.69
475
Cair
ns R
egio
nal
1.78
Nat
iona
l Sto
rm T
ide
Map
103
Kew
arra
Bea
ch-1
6.79
08
614
5.68
113
Cair
ns R
egio
nal
1.78
Nat
iona
l Sto
rm T
ide
Map
104
Trin
ity
Bea
ch-1
6.78
519
145.
700
00
Cair
ns R
egio
nal
1.78
Nat
iona
l Sto
rm T
ide
Map
105
Earl
Hill
-16.
7947
214
5.69
998
Cair
ns R
egio
nal
1.78
Nat
iona
l Sto
rm T
ide
Map
106
Hal
f Moo
n B
ay-1
6.8
0223
145.
7167
9Ca
irns
Reg
iona
l1.
76N
atio
nal S
torm
Tid
e M
ap
107
York
eys
Knob
-16.
802
7714
5.72
083
Cair
ns R
egio
nal
1.76
Nat
iona
l Sto
rm T
ide
Map
108
Hol
low
ays
Bea
ch-1
6.83
626
145.
7394
6Ca
irns
Reg
iona
l1.
78N
atio
nal S
torm
Tid
e M
ap
109
Mac
hans
Bea
ch-1
6.85
098
145.
7499
9Ca
irns
Reg
iona
l1.
81
Nat
iona
l Sto
rm T
ide
Map
Map
3: C
airn
s Co
astli
ne c
ont.
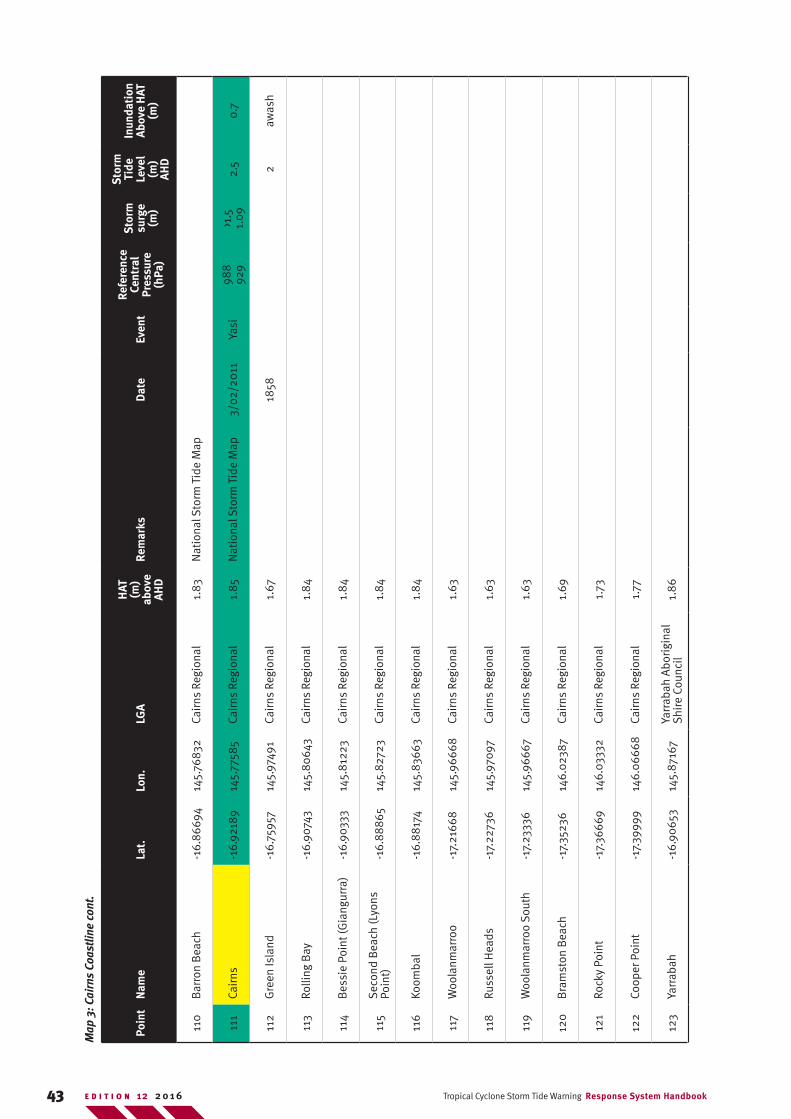
43 Tropical Cyclone Storm Tide Warning Response System HandbookE D I T I O N 12 2 0 1 6
Poin
tN
ame
Lat.
Lon.
LGA
HAT
(m
) ab
ove
AHD
Rem
arks
Dat
eEv
ent
Refe
renc
e Ce
ntra
l Pr
essu
re
(hPa
)
Sto
rm
surg
e (m
)
Sto
rm
Tide
Le
vel
(m)
AHD
Inun
dati
on
Abov
e H
AT
(m)
110
Bar
ron
Bea
ch-1
6.8
6694
145.
7683
2Ca
irns
Reg
iona
l1.
83N
atio
nal S
torm
Tid
e M
ap
111
Cair
ns-1
6.92
189
145.
7758
5Ca
irns
Reg
iona
l1.
85N
atio
nal S
torm
Tid
e M
ap3/
02/2
011
Yasi
988
929
>1.5
1.
092.
50.
7
112
Gre
en Is
land
-16.
7595
714
5.97
491
Cair
ns R
egio
nal
1.67
1858
2aw
ash
113
Rolli
ng B
ay-1
6.90
743
145.
80
643
Cair
ns R
egio
nal
1.8
4
114
Bes
sie
Poin
t (G
iang
urra
)-1
6.90
333
145.
812
23Ca
irns
Reg
iona
l1.
84
115
Sec
ond
Bea
ch (L
yons
Po
int)
-16.
88
865
145.
8272
3Ca
irns
Reg
iona
l1.
84
116
Koom
bal
-16.
88
174
145.
8366
3Ca
irns
Reg
iona
l1.
84
117
Woo
lanm
arro
o-1
7.21
668
145.
9666
8Ca
irns
Reg
iona
l1.
63
118
Russ
ell H
eads
-17.
2273
614
5.97
097
Cair
ns R
egio
nal
1.63
119
Woo
lanm
arro
o S
outh
-17.
2333
614
5.96
667
Cair
ns R
egio
nal
1.63
120
Bra
mst
on B
each
-17.
3523
614
6.02
387
Cair
ns R
egio
nal
1.69
121
Rock
y Po
int
-17.
3666
914
6.03
332
Cair
ns R
egio
nal
1.73
122
Coop
er P
oint
-17.
3999
914
6.0
6668
Cair
ns R
egio
nal
1.77
123
Yarr
abah
-16.
9065
314
5.87
167
Yarr
abah
Abo
rigi
nal
Shi
re C
ounc
il1.
86
Map
3: C
airn
s Co
astli
ne c
ont.
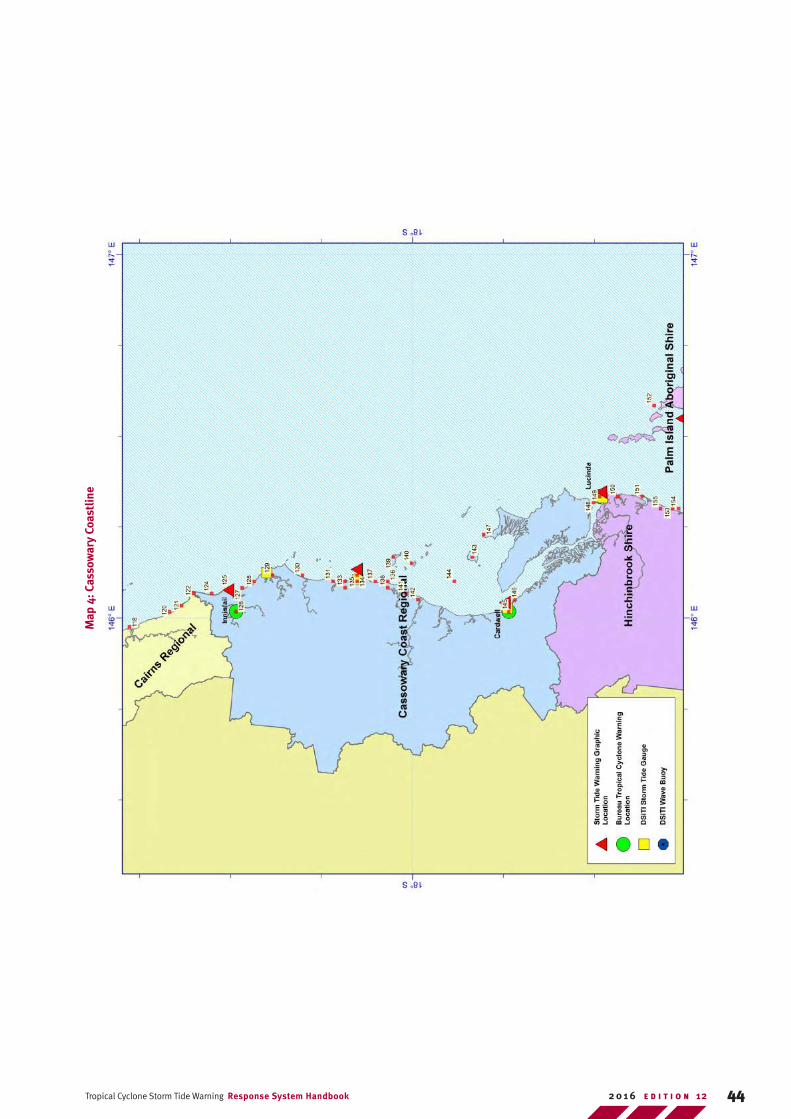
44Tropical Cyclone Storm Tide Warning Response System Handbook E D I T I O N 122 0 1 6
Map
4: C
asso
war
y Co
astl
ine
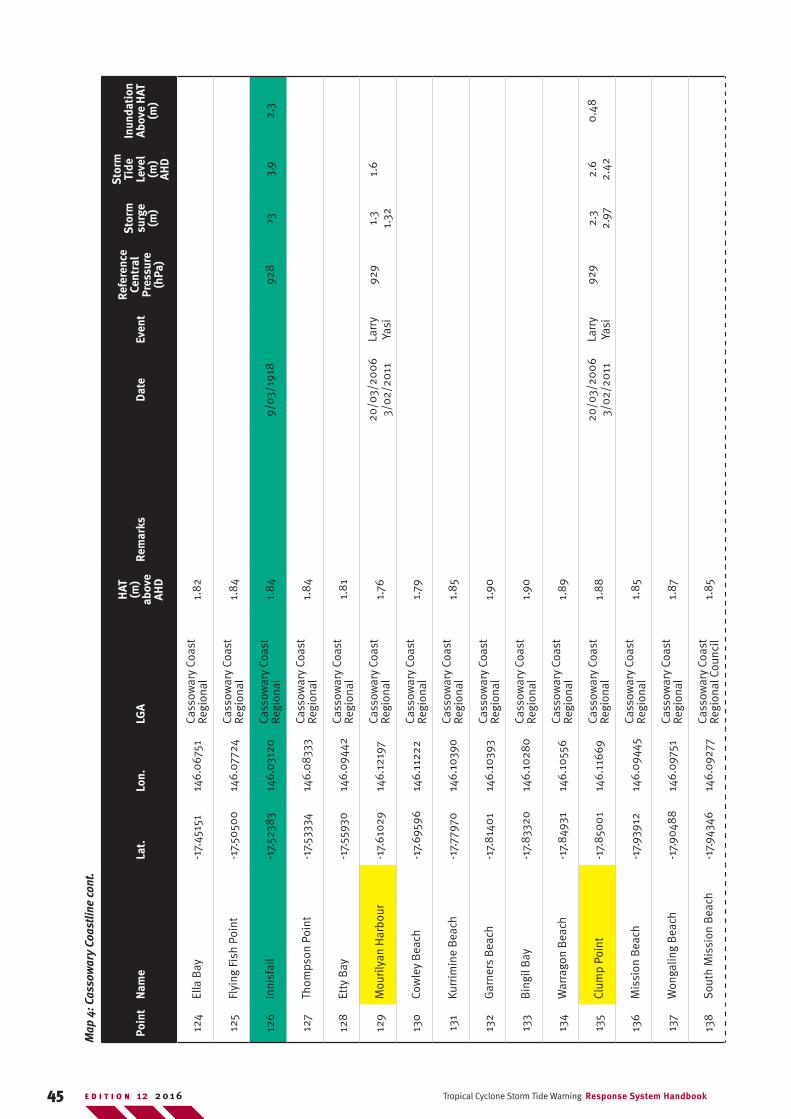
45 Tropical Cyclone Storm Tide Warning Response System HandbookE D I T I O N 12 2 0 1 6
Poin
tN
ame
Lat.
Lon.
LGA
HAT
(m
) ab
ove
AHD
Rem
arks
Dat
eEv
ent
Refe
renc
e Ce
ntra
l Pr
essu
re
(hPa
)
Sto
rm
surg
e (m
)
Sto
rm
Tide
Le
vel
(m)
AHD
Inun
dati
on
Abov
e H
AT
(m)
124
Ella
Bay
-17.
4515
114
6.0
6751
Cass
owar
y Co
ast
Regi
onal
1.82
125
Flyi
ng F
ish
Poin
t-1
7.50
500
146.
0772
4Ca
ssow
ary
Coas
t Re
gion
al1.
84
126
Inni
sfai
l-1
7.52
383
146.
0312
0Ca
ssow
ary
Coas
t Re
gion
al1.
84
9/03
/191
892
8>3
3.9
2.3
127
Thom
pson
Poi
nt-1
7.53
334
146.
083
33Ca
ssow
ary
Coas
t Re
gion
al1.
84
128
Etty
Bay
-17.
5593
014
6.09
442
Cass
owar
y Co
ast
Regi
onal
1.8
1
129
Mou
rily
an H
arbo
ur-1
7.61
029
146.
1219
7Ca
ssow
ary
Coas
t Re
gion
al1.
7620
/03/
200
63/
02/2
011
Larr
y Ya
si92
9 1.
31.
321.
6
130
Cow
ley
Bea
ch-1
7.69
596
146.
1122
2Ca
ssow
ary
Coas
t Re
gion
al1.
79
131
Kurr
imin
e B
each
-17.
7797
014
6.10
390
Cass
owar
y Co
ast
Regi
onal
1.85
132
Gar
ners
Bea
ch-1
7.8
140
114
6.10
393
Cass
owar
y Co
ast
Regi
onal
1.90
133
Bin
gil B
ay-1
7.83
320
146.
1028
0Ca
ssow
ary
Coas
t Re
gion
al1.
90
134
War
rago
n B
each
-17.
849
3114
6.10
556
Cass
owar
y Co
ast
Regi
onal
1.89
135
Clum
p Po
int
-17.
850
01
146.
1166
9Ca
ssow
ary
Coas
t Re
gion
al1.
88
20/0
3/20
06
3/02
/20
11La
rry
Yasi
929
2.3
2.97
2.6
2.42
0.48
136
Mis
sion
Bea
ch-1
7.93
912
146.
0944
5Ca
ssow
ary
Coas
t Re
gion
al1.
85
137
Won
galin
g B
each
-17.
9048
814
6.09
751
Cass
owar
y Co
ast
Regi
onal
1.87
138
Sou
th M
issi
on B
each
-17.
9434
614
6.09
277
Cass
owar
y Co
ast
Regi
onal
Cou
ncil
1.85
Map
4: C
asso
war
y Co
astli
ne c
ont.
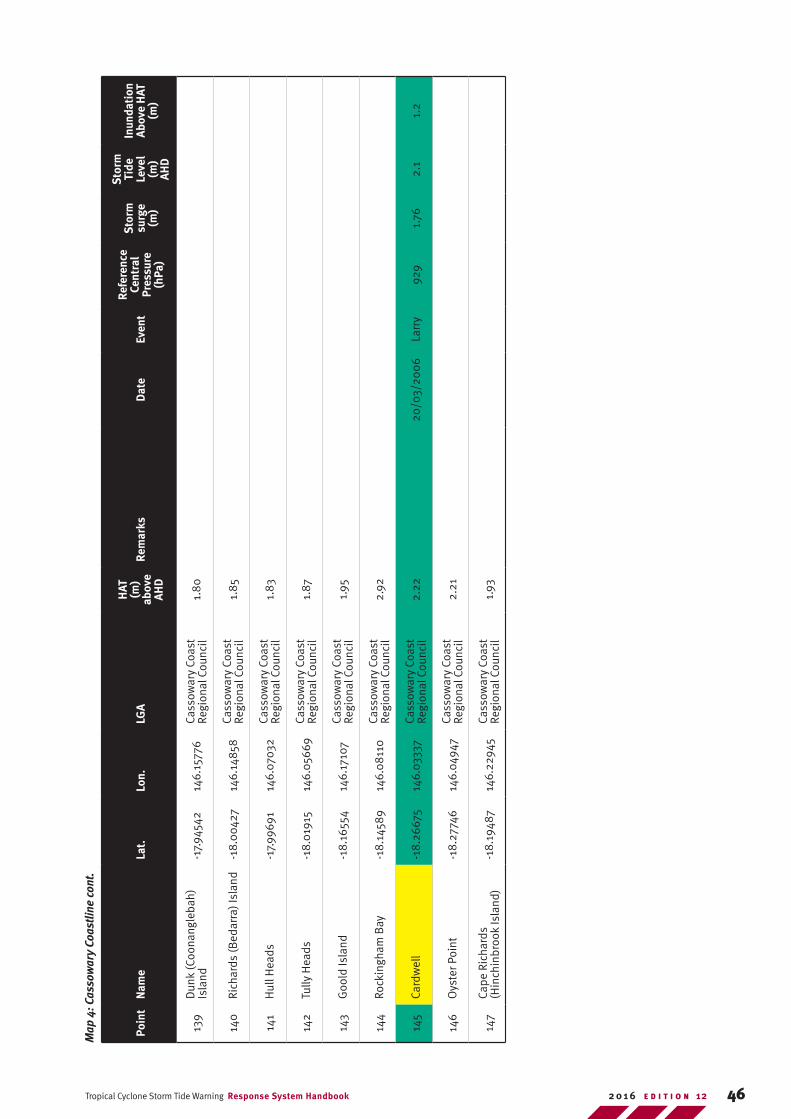
46Tropical Cyclone Storm Tide Warning Response System Handbook E D I T I O N 122 0 1 6
Poin
tN
ame
Lat.
Lon.
LGA
HAT
(m
) ab
ove
AHD
Rem
arks
Dat
eEv
ent
Refe
renc
e Ce
ntra
l Pr
essu
re
(hPa
)
Sto
rm
surg
e (m
)
Sto
rm
Tide
Le
vel
(m)
AHD
Inun
dati
on
Abov
e H
AT
(m)
139
Dun
k (C
oona
ngle
bah)
Is
land
-17.
9454
214
6.15
776
Cass
owar
y Co
ast
Regi
onal
Cou
ncil
1.8
0
140
Rich
ards
(Bed
arra
) Isl
and
-18.
004
2714
6.14
858
Cass
owar
y Co
ast
Regi
onal
Cou
ncil
1.85
141
Hul
l Hea
ds-1
7.99
691
146.
0703
2Ca
ssow
ary
Coas
t Re
gion
al C
ounc
il1.
83
142
Tully
Hea
ds-1
8.0
1915
146.
056
69Ca
ssow
ary
Coas
t Re
gion
al C
ounc
il1.
87
143
Goo
ld Is
land
-18.
1655
414
6.17
107
Cass
owar
y Co
ast
Regi
onal
Cou
ncil
1.95
144
Rock
ingh
am B
ay-1
8.14
589
146.
08
110
Cass
owar
y Co
ast
Regi
onal
Cou
ncil
2.92
145
Card
wel
l-1
8.26
675
146.
0333
7Ca
ssow
ary
Coas
t Re
gion
al C
ounc
il2.
2220
/03/
200
6La
rry
929
1.76
2.1
1.2
146
Oys
ter P
oint
-18.
2774
614
6.04
947
Cass
owar
y Co
ast
Regi
onal
Cou
ncil
2.21
147
Cape
Ric
hard
s (H
inch
inbr
ook
Isla
nd)
-18.
1948
714
6.22
945
Cass
owar
y Co
ast
Regi
onal
Cou
ncil
1.93
Map
4: C
asso
war
y Co
astli
ne c
ont.
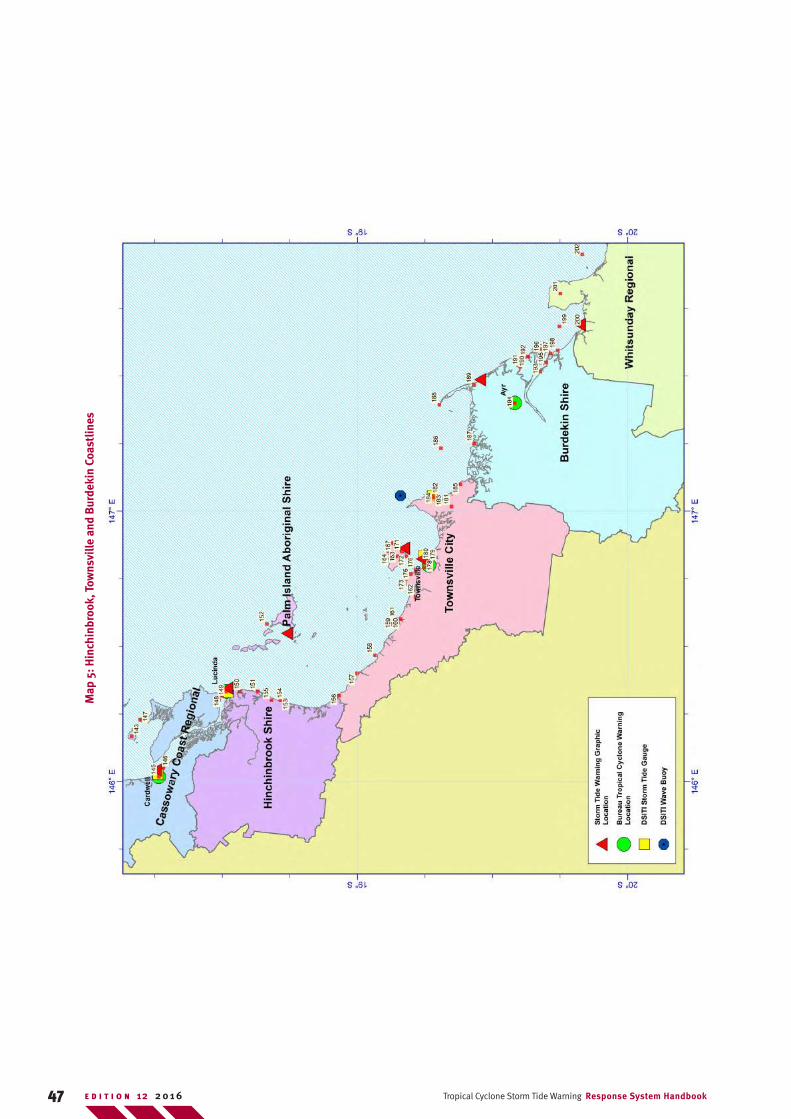
47 Tropical Cyclone Storm Tide Warning Response System HandbookE D I T I O N 12 2 0 1 6
Map
5: H
inch
inbr
ook,
Tow
nsvi
lle a
nd B
urde
kin
Coas
tlin
es
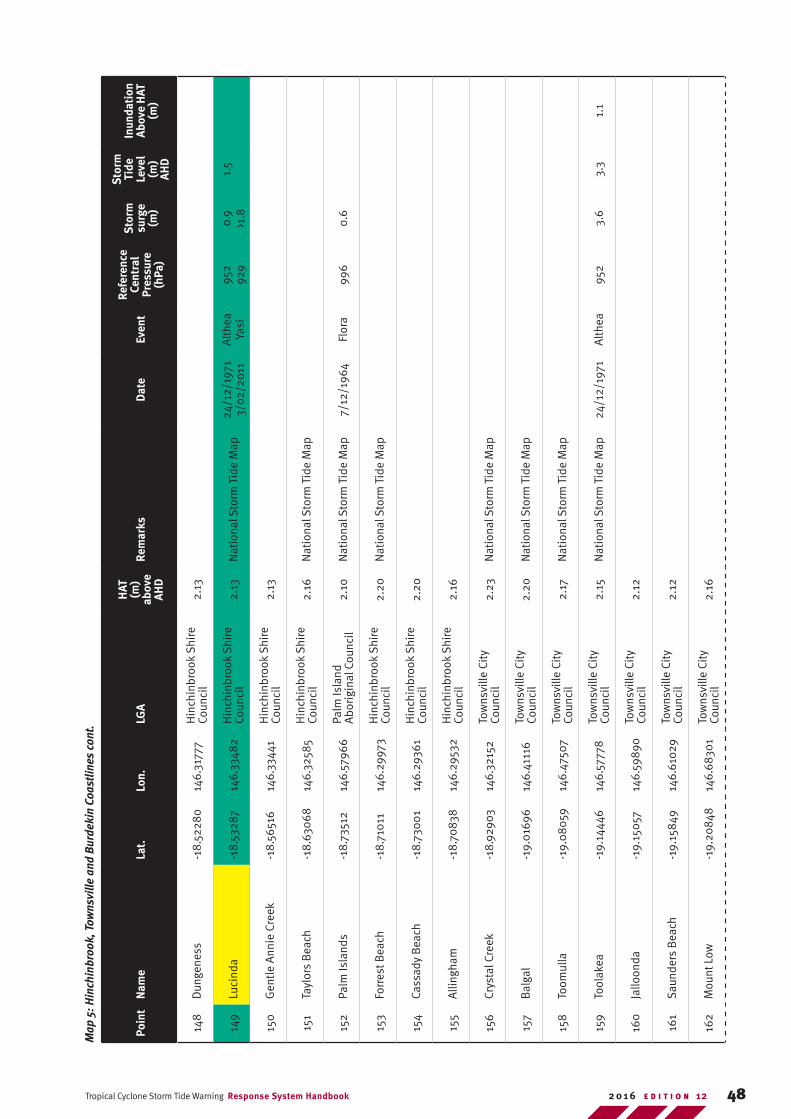
48Tropical Cyclone Storm Tide Warning Response System Handbook E D I T I O N 122 0 1 6
Poin
tN
ame
Lat.
Lon.
LGA
HAT
(m
) ab
ove
AHD
Rem
arks
Dat
eEv
ent
Refe
renc
e Ce
ntra
l Pr
essu
re
(hPa
)
Sto
rm
surg
e (m
)
Sto
rm
Tide
Le
vel
(m)
AHD
Inun
dati
on
Abov
e H
AT
(m)
148
Dun
gene
ss-1
8.52
280
146.
3177
7H
inch
inbr
ook
Shi
re
Coun
cil
2.13
149
Luci
nda
-18.
5328
714
6.33
482
Hin
chin
broo
k S
hire
Co
unci
l2.
13N
atio
nal S
torm
Tid
e M
ap24
/12/
1971
3/
02/2
011
Alt
hea
Yasi
952
929
0.9
>1.8
1.5
150
Gen
tle A
nnie
Cre
ek-1
8.56
516
146.
3344
1H
inch
inbr
ook
Shi
re
Coun
cil
2.13
151
Tayl
ors
Bea
ch-1
8.63
068
146.
3258
5H
inch
inbr
ook
Shi
re
Coun
cil
2.16
Nat
iona
l Sto
rm T
ide
Map
152
Palm
Isla
nds
-18.
7351
214
6.57
966
Palm
Isla
nd
Abo
rigi
nal C
ounc
il2.
10N
atio
nal S
torm
Tid
e M
ap7/
12/1
964
Flor
a99
60.
6
153
Forr
est B
each
-18.
710
1114
6.29
973
Hin
chin
broo
k S
hire
Co
unci
l2.
20N
atio
nal S
torm
Tid
e M
ap
154
Cass
ady
Bea
ch-1
8.73
00
114
6.29
361
Hin
chin
broo
k S
hire
Co
unci
l2.
20
155
Alli
ngha
m-1
8.70
838
146.
2953
2H
inch
inbr
ook
Shi
re
Coun
cil
2.16
156
Crys
tal C
reek
-18.
9290
314
6.32
152
Tow
nsvi
lle C
ity
Coun
cil
2.23
Nat
iona
l Sto
rm T
ide
Map
157
Bal
gal
-19.
016
9614
6.41
116
Tow
nsvi
lle C
ity
Coun
cil
2.20
Nat
iona
l Sto
rm T
ide
Map
158
Toom
ulla
-19.
08
059
146.
4750
7To
wns
ville
Cit
y Co
unci
l2.
17N
atio
nal S
torm
Tid
e M
ap
159
Tool
akea
-19.
1444
614
6.57
778
Tow
nsvi
lle C
ity
Coun
cil
2.15
Nat
iona
l Sto
rm T
ide
Map
24/1
2/19
71A
lthe
a95
23.
63.
31.
1
160
Jallo
onda
-19.
150
5714
6.59
890
Tow
nsvi
lle C
ity
Coun
cil
2.12
161
Sau
nder
s B
each
-19.
158
4914
6.61
029
Tow
nsvi
lle C
ity
Coun
cil
2.12
162
Mou
nt L
ow-1
9.20
848
146.
6830
1To
wns
ville
Cit
y Co
unci
l2.
16
Map
5: H
inch
inbr
ook,
Tow
nsvi
lle a
nd B
urde
kin
Coas
tline
s co
nt.
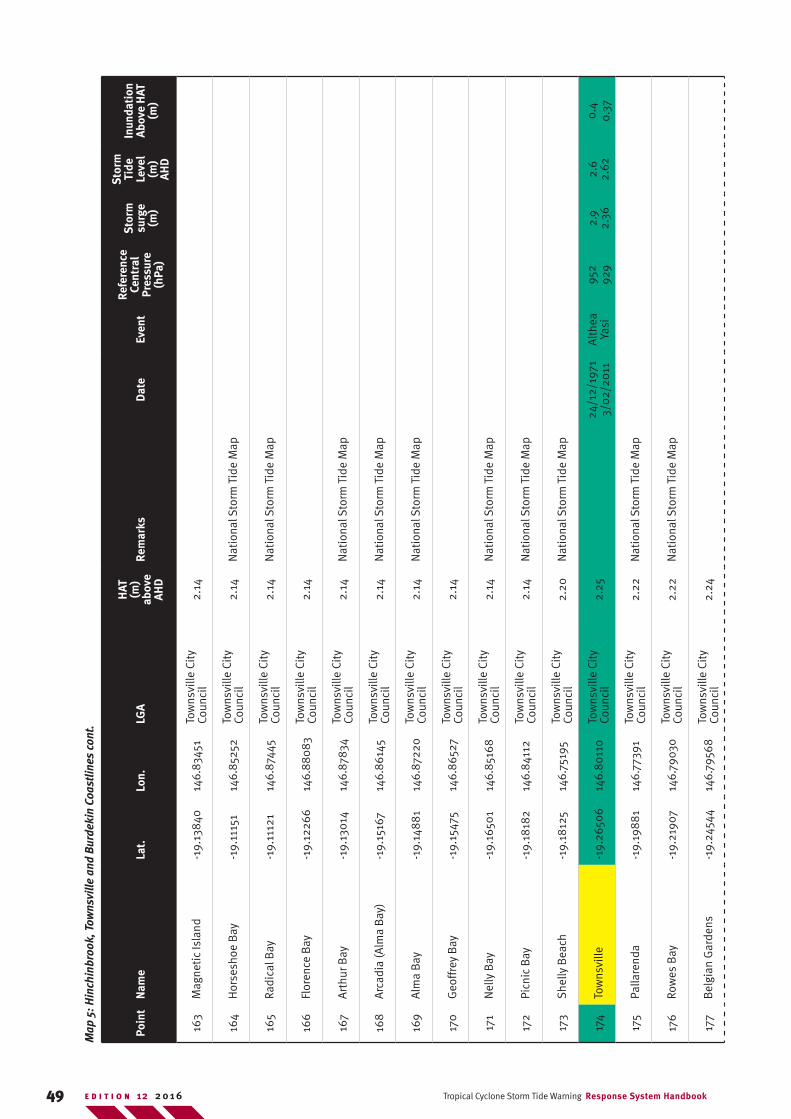
49 Tropical Cyclone Storm Tide Warning Response System HandbookE D I T I O N 12 2 0 1 6
Poin
tN
ame
Lat.
Lon.
LGA
HAT
(m
) ab
ove
AHD
Rem
arks
Dat
eEv
ent
Refe
renc
e Ce
ntra
l Pr
essu
re
(hPa
)
Sto
rm
surg
e (m
)
Sto
rm
Tide
Le
vel
(m)
AHD
Inun
dati
on
Abov
e H
AT
(m)
163
Mag
neti
c Is
land
-19.
138
4014
6.83
451
Tow
nsvi
lle C
ity
Coun
cil
2.14
164
Hor
sesh
oe B
ay-1
9.11
151
146.
8525
2To
wns
ville
Cit
y Co
unci
l2.
14N
atio
nal S
torm
Tid
e M
ap
165
Radi
cal B
ay-1
9.11
121
146.
8744
5To
wns
ville
Cit
y Co
unci
l2.
14N
atio
nal S
torm
Tid
e M
ap
166
Flor
ence
Bay
-19.
1226
614
6.8
80
83To
wns
ville
Cit
y Co
unci
l2.
14
167
Art
hur B
ay-1
9.13
014
146.
8783
4To
wns
ville
Cit
y Co
unci
l2.
14N
atio
nal S
torm
Tid
e M
ap
168
Arc
adia
(Alm
a B
ay)
-19.
1516
714
6.8
6145
Tow
nsvi
lle C
ity
Coun
cil
2.14
Nat
iona
l Sto
rm T
ide
Map
169
Alm
a B
ay-1
9.14
88
114
6.87
220
Tow
nsvi
lle C
ity
Coun
cil
2.14
Nat
iona
l Sto
rm T
ide
Map
170
Geo
ffre
y B
ay-1
9.15
475
146.
865
27To
wns
ville
Cit
y Co
unci
l2.
14
171
Nel
ly B
ay-1
9.16
501
146.
8516
8To
wns
ville
Cit
y Co
unci
l2.
14N
atio
nal S
torm
Tid
e M
ap
172
Picn
ic B
ay-1
9.18
182
146.
841
12To
wns
ville
Cit
y Co
unci
l2.
14N
atio
nal S
torm
Tid
e M
ap
173
She
lly B
each
-19.
1812
514
6.75
195
Tow
nsvi
lle C
ity
Coun
cil
2.20
Nat
iona
l Sto
rm T
ide
Map
174
Tow
nsvi
lle-1
9.26
506
146.
80
110
Tow
nsvi
lle C
ity
Coun
cil
2.25
24/1
2/19
71
3/02
/20
11A
lthe
a Ya
si95
2 92
92.
9 2.
362.
6 2.
620.
4 0.
37
175
Palla
rend
a-1
9.19
88
114
6.77
391
Tow
nsvi
lle C
ity
Coun
cil
2.22
Nat
iona
l Sto
rm T
ide
Map
176
Row
es B
ay-1
9.21
907
146.
7903
0To
wns
ville
Cit
y Co
unci
l2.
22N
atio
nal S
torm
Tid
e M
ap
177
Bel
gian
Gar
dens
-19.
2454
414
6.79
568
Tow
nsvi
lle C
ity
Coun
cil
2.24
Map
5: H
inch
inbr
ook,
Tow
nsvi
lle a
nd B
urde
kin
Coas
tline
s co
nt.
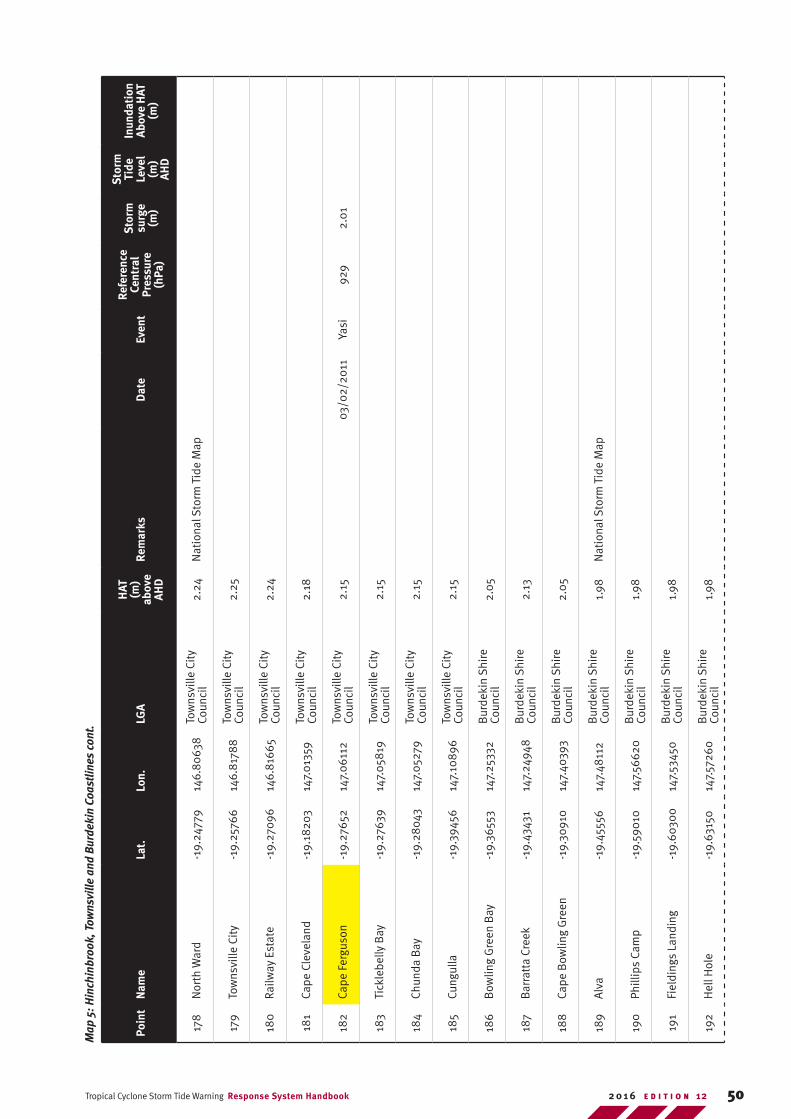
50Tropical Cyclone Storm Tide Warning Response System Handbook E D I T I O N 122 0 1 6
Poin
tN
ame
Lat.
Lon.
LGA
HAT
(m
) ab
ove
AHD
Rem
arks
Dat
eEv
ent
Refe
renc
e Ce
ntra
l Pr
essu
re
(hPa
)
Sto
rm
surg
e (m
)
Sto
rm
Tide
Le
vel
(m)
AHD
Inun
dati
on
Abov
e H
AT
(m)
178
Nor
th W
ard
-19.
2477
914
6.8
063
8To
wns
ville
Cit
y Co
unci
l2.
24N
atio
nal S
torm
Tid
e M
ap
179
Tow
nsvi
lle C
ity
-19.
2576
614
6.8
178
8To
wns
ville
Cit
y Co
unci
l2.
25
180
Railw
ay E
stat
e-1
9.27
096
146.
816
65To
wns
ville
Cit
y Co
unci
l2.
24
181
Cape
Cle
vela
nd-1
9.18
203
147.
013
59To
wns
ville
Cit
y Co
unci
l2.
18
182
Cape
Fer
guso
n-1
9.27
652
147.
061
12To
wns
ville
Cit
y Co
unci
l2.
1503
/02/
2011
Yasi
929
2.0
1
183
Tick
lebe
lly B
ay-1
9.27
639
147.
058
19To
wns
ville
Cit
y Co
unci
l2.
15
184
Chun
da B
ay-1
9.28
043
147.
052
79To
wns
ville
Cit
y Co
unci
l2.
15
185
Cung
ulla
-19.
3945
614
7.10
896
Tow
nsvi
lle C
ity
Coun
cil
2.15
186
Bow
ling
Gre
en B
ay-1
9.36
553
147.
2533
2B
urde
kin
Shi
re
Coun
cil
2.0
5
187
Bar
ratt
a Cr
eek
-19.
4343
114
7.24
948
Bur
deki
n S
hire
Co
unci
l2.
13
188
Cape
Bow
ling
Gre
en-1
9.30
910
147.
4039
3B
urde
kin
Shi
re
Coun
cil
2.0
5
189
Alv
a-1
9.45
556
147.
4811
2B
urde
kin
Shi
re
Coun
cil
1.98
Nat
iona
l Sto
rm T
ide
Map
190
Phill
ips
Cam
p-1
9.59
010
147.
5662
0B
urde
kin
Shi
re
Coun
cil
1.98
191
Fiel
ding
s La
ndin
g-1
9.60
300
147.
5345
0B
urde
kin
Shi
re
Coun
cil
1.98
192
Hel
l Hol
e-1
9.63
150
147.
5726
0B
urde
kin
Shi
re
Coun
cil
1.98
Map
5: H
inch
inbr
ook,
Tow
nsvi
lle a
nd B
urde
kin
Coas
tline
s co
nt.
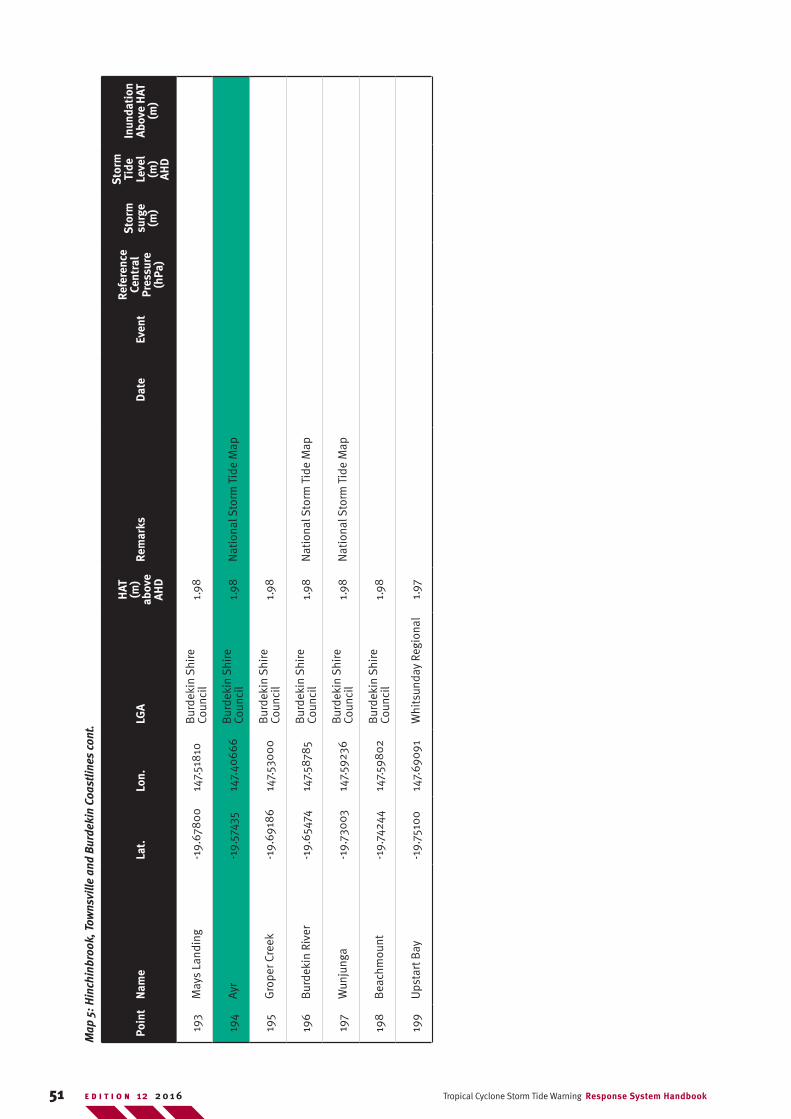
51 Tropical Cyclone Storm Tide Warning Response System HandbookE D I T I O N 12 2 0 1 6
Poin
tN
ame
Lat.
Lon.
LGA
HAT
(m
) ab
ove
AHD
Rem
arks
Dat
eEv
ent
Refe
renc
e Ce
ntra
l Pr
essu
re
(hPa
)
Sto
rm
surg
e (m
)
Sto
rm
Tide
Le
vel
(m)
AHD
Inun
dati
on
Abov
e H
AT
(m)
193
May
s La
ndin
g-1
9.67
80
014
7.51
810
Bur
deki
n S
hire
Co
unci
l1.
98
194
Ayr
-19.
5743
514
7.40
666
Bur
deki
n S
hire
Co
unci
l1.
98N
atio
nal S
torm
Tid
e M
ap
195
Gro
per C
reek
-19.
6918
614
7.53
00
0B
urde
kin
Shi
re
Coun
cil
1.98
196
Bur
deki
n Ri
ver
-19.
6547
414
7.58
785
Bur
deki
n S
hire
Co
unci
l1.
98N
atio
nal S
torm
Tid
e M
ap
197
Wun
jung
a-1
9.73
003
147.
5923
6B
urde
kin
Shi
re
Coun
cil
1.98
Nat
iona
l Sto
rm T
ide
Map
198
Bea
chm
ount
-19.
7424
414
7.59
802
Bur
deki
n S
hire
Co
unci
l1.
98
199
Ups
tart
Bay
-19.
7510
014
7.69
091
Whi
tsun
day
Regi
onal
1.97
Map
5: H
inch
inbr
ook,
Tow
nsvi
lle a
nd B
urde
kin
Coas
tline
s co
nt.
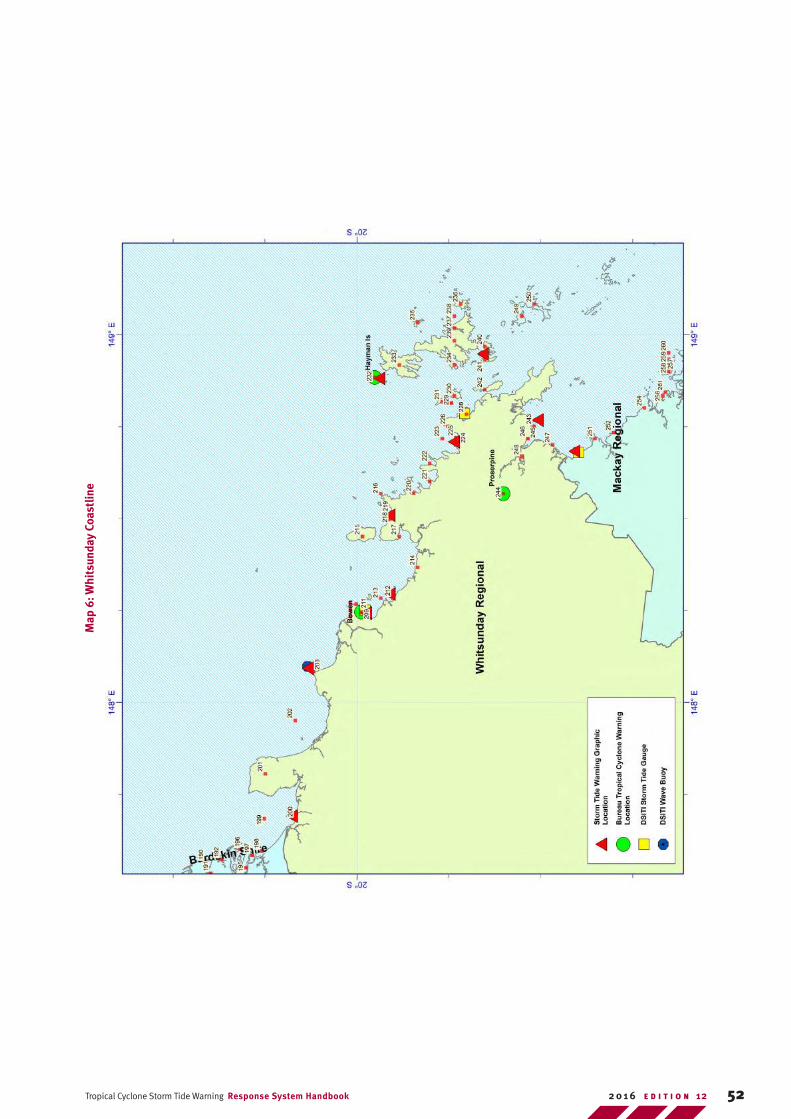
52Tropical Cyclone Storm Tide Warning Response System Handbook E D I T I O N 122 0 1 6
Map
6: W
hits
unda
y Co
astl
ine
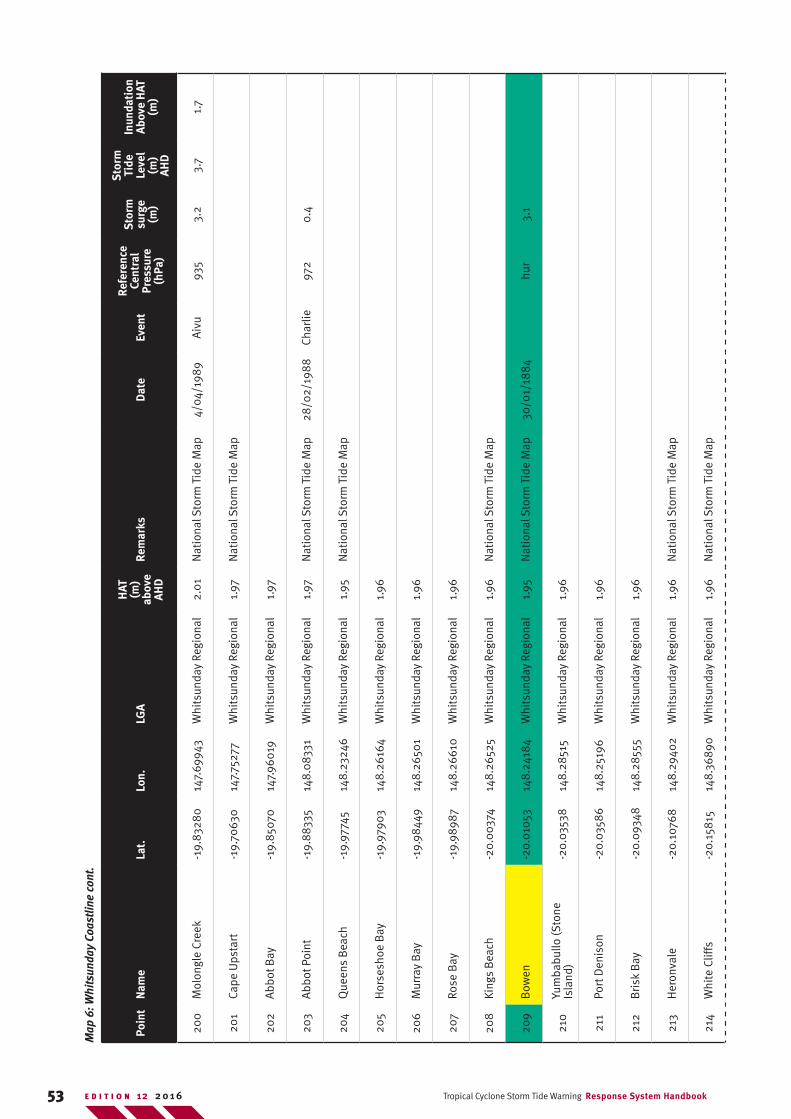
53 Tropical Cyclone Storm Tide Warning Response System HandbookE D I T I O N 12 2 0 1 6
Poin
tN
ame
Lat.
Lon.
LGA
HAT
(m
) ab
ove
AHD
Rem
arks
Dat
eEv
ent
Refe
renc
e Ce
ntra
l Pr
essu
re
(hPa
)
Sto
rm
surg
e (m
)
Sto
rm
Tide
Le
vel
(m)
AHD
Inun
dati
on
Abov
e H
AT
(m)
200
Mol
ongl
e Cr
eek
-19.
8328
014
7.69
943
Whi
tsun
day
Regi
onal
2.0
1N
atio
nal S
torm
Tid
e M
ap4/
04/1
989
Aiv
u93
53.
23.
71.
7
201
Cape
Ups
tart
-19.
7063
014
7.75
277
Whi
tsun
day
Regi
onal
1.97
Nat
iona
l Sto
rm T
ide
Map
202
Abb
ot B
ay-1
9.85
070
147.
960
19W
hits
unda
y Re
gion
al1.
97
203
Abb
ot P
oint
-19.
883
3514
8.0
8331
Whi
tsun
day
Regi
onal
1.97
Nat
iona
l Sto
rm T
ide
Map
28/0
2/19
88
Char
lie97
20.
4
204
Que
ens
Bea
ch-1
9.97
745
148.
2324
6W
hits
unda
y Re
gion
al1.
95N
atio
nal S
torm
Tid
e M
ap
205
Hor
sesh
oe B
ay-1
9.97
903
148.
2616
4W
hits
unda
y Re
gion
al1.
96
206
Mur
ray
Bay
-19.
9844
914
8.26
501
Whi
tsun
day
Regi
onal
1.96
207
Rose
Bay
-19.
9898
714
8.26
610
Whi
tsun
day
Regi
onal
1.96
208
King
s B
each
-20.
003
7414
8.26
525
Whi
tsun
day
Regi
onal
1.96
Nat
iona
l Sto
rm T
ide
Map
209
Bow
en-2
0.0
1053
148.
2418
4W
hits
unda
y Re
gion
al1.
95N
atio
nal S
torm
Tid
e M
ap30
/01/
188
4hu
r3.
1
210
Yum
babu
llo (S
tone
Is
land
)-2
0.03
538
148.
2851
5W
hits
unda
y Re
gion
al1.
96
211
Port
Den
ison
-20.
0358
614
8.25
196
Whi
tsun
day
Regi
onal
1.96
212
Bris
k B
ay-2
0.09
348
148.
2855
5W
hits
unda
y Re
gion
al1.
96
213
Her
onva
le-2
0.10
768
148.
2940
2W
hits
unda
y Re
gion
al1.
96N
atio
nal S
torm
Tid
e M
ap
214
Whi
te C
liffs
-20.
158
1514
8.36
890
Whi
tsun
day
Regi
onal
1.96
Nat
iona
l Sto
rm T
ide
Map
Map
6: W
hits
unda
y Co
astli
ne c
ont.
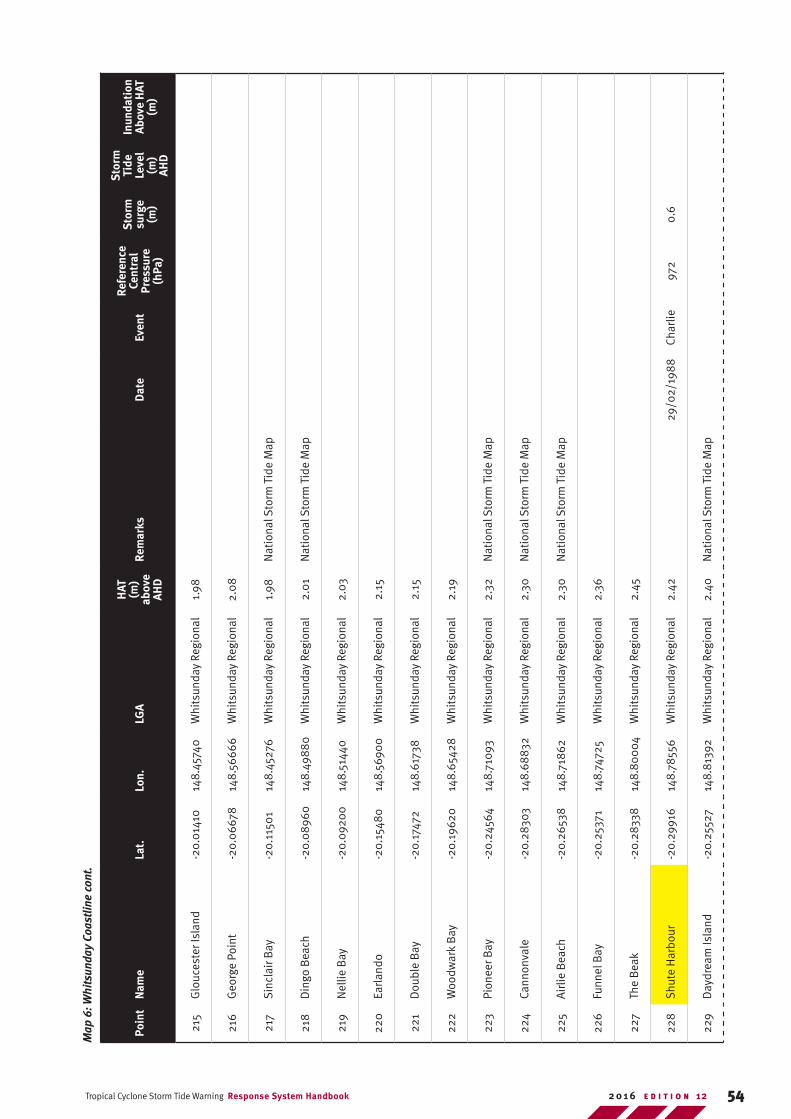
54Tropical Cyclone Storm Tide Warning Response System Handbook E D I T I O N 122 0 1 6
Poin
tN
ame
Lat.
Lon.
LGA
HAT
(m
) ab
ove
AHD
Rem
arks
Dat
eEv
ent
Refe
renc
e Ce
ntra
l Pr
essu
re
(hPa
)
Sto
rm
surg
e (m
)
Sto
rm
Tide
Le
vel
(m)
AHD
Inun
dati
on
Abov
e H
AT
(m)
215
Glo
uces
ter I
slan
d-2
0.0
1410
148.
4574
0W
hits
unda
y Re
gion
al1.
98
216
Geo
rge
Poin
t-2
0.0
6678
148.
5666
6W
hits
unda
y Re
gion
al2.
08
217
Sin
clai
r Bay
-20.
1150
114
8.45
276
Whi
tsun
day
Regi
onal
1.98
Nat
iona
l Sto
rm T
ide
Map
218
Din
go B
each
-20.
089
6014
8.49
88
0W
hits
unda
y Re
gion
al2.
01
Nat
iona
l Sto
rm T
ide
Map
219
Nel
lie B
ay-2
0.09
200
148.
5144
0W
hits
unda
y Re
gion
al2.
03
220
Earla
ndo
-20.
1548
014
8.56
900
Whi
tsun
day
Regi
onal
2.15
221
Dou
ble
Bay
-20.
1747
214
8.61
738
Whi
tsun
day
Regi
onal
2.15
222
Woo
dwar
k B
ay-2
0.19
620
148.
6542
8W
hits
unda
y Re
gion
al2.
19
223
Pion
eer B
ay-2
0.24
564
148.
7109
3W
hits
unda
y Re
gion
al2.
32N
atio
nal S
torm
Tid
e M
ap
224
Cann
onva
le-2
0.28
303
148.
6883
2W
hits
unda
y Re
gion
al2.
30N
atio
nal S
torm
Tid
e M
ap
225
Air
lie B
each
-20.
2653
814
8.71
862
Whi
tsun
day
Regi
onal
2.30
Nat
iona
l Sto
rm T
ide
Map
226
Funn
el B
ay-2
0.25
371
148.
7472
5W
hits
unda
y Re
gion
al2.
36
227
The
Bea
k-2
0.28
338
148.
80
004
Whi
tsun
day
Regi
onal
2.45
228
Shu
te H
arbo
ur-2
0.29
916
148.
7855
6W
hits
unda
y Re
gion
al2.
4229
/02/
198
8Ch
arlie
972
0.6
229
Day
drea
m Is
land
-20.
2552
714
8.8
1392
Whi
tsun
day
Regi
onal
2.40
Nat
iona
l Sto
rm T
ide
Map
Map
6: W
hits
unda
y Co
astli
ne c
ont.
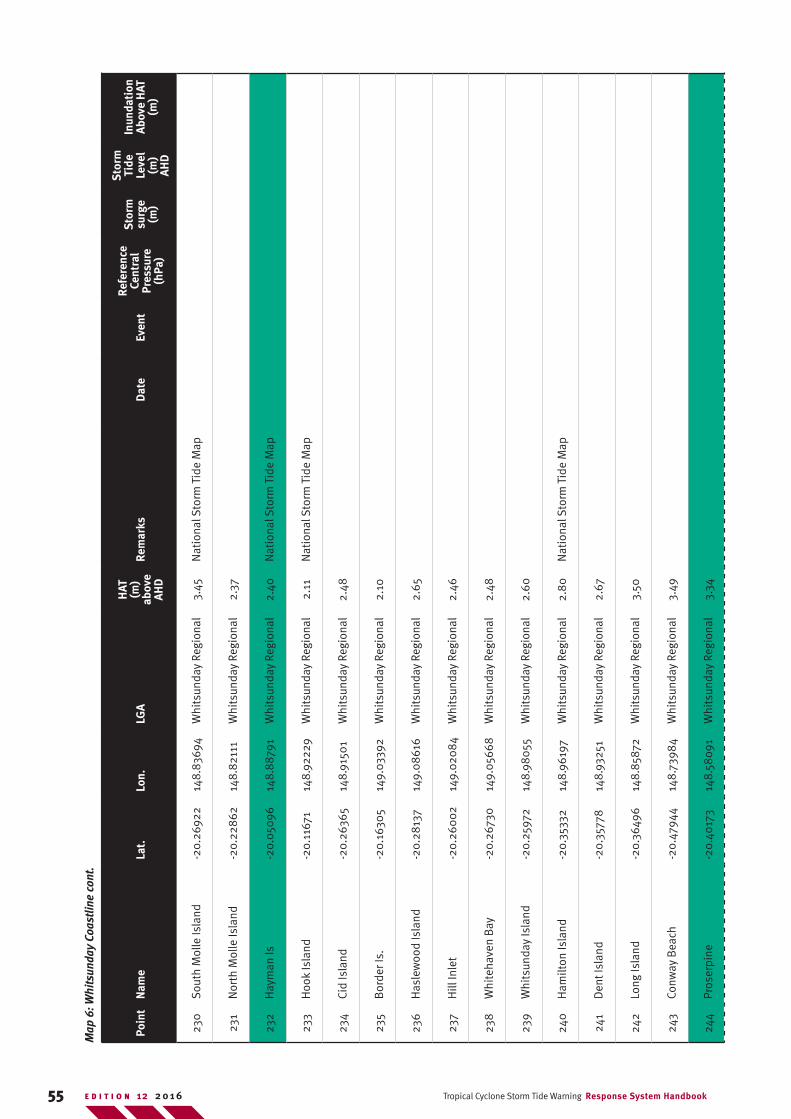
55 Tropical Cyclone Storm Tide Warning Response System HandbookE D I T I O N 12 2 0 1 6
Poin
tN
ame
Lat.
Lon.
LGA
HAT
(m
) ab
ove
AHD
Rem
arks
Dat
eEv
ent
Refe
renc
e Ce
ntra
l Pr
essu
re
(hPa
)
Sto
rm
surg
e (m
)
Sto
rm
Tide
Le
vel
(m)
AHD
Inun
dati
on
Abov
e H
AT
(m)
230
Sou
th M
olle
Isla
nd-2
0.26
922
148.
8369
4W
hits
unda
y Re
gion
al3.
45N
atio
nal S
torm
Tid
e M
ap
231
Nor
th M
olle
Isla
nd-2
0.22
862
148.
8211
1W
hits
unda
y Re
gion
al2.
37
232
Hay
man
Is-2
0.0
5096
148.
887
91W
hits
unda
y Re
gion
al2.
40N
atio
nal S
torm
Tid
e M
ap
233
Hoo
k Is
land
-20.
1167
114
8.92
229
Whi
tsun
day
Regi
onal
2.11
Nat
iona
l Sto
rm T
ide
Map
234
Cid
Isla
nd-2
0.26
365
148.
9150
1W
hits
unda
y Re
gion
al2.
48
235
Bor
der I
s.-2
0.16
305
149.
0339
2W
hits
unda
y Re
gion
al2.
10
236
Has
lew
ood
Isla
nd-2
0.28
137
149.
08
616
Whi
tsun
day
Regi
onal
2.65
237
Hill
Inle
t-2
0.26
002
149.
020
84
Whi
tsun
day
Regi
onal
2.46
238
Whi
teha
ven
Bay
-20.
2673
014
9.0
5668
Whi
tsun
day
Regi
onal
2.48
239
Whi
tsun
day
Isla
nd-2
0.25
972
148.
980
55W
hits
unda
y Re
gion
al2.
60
240
Ham
ilton
Isla
nd-2
0.35
332
148.
9619
7W
hits
unda
y Re
gion
al2.
80
Nat
iona
l Sto
rm T
ide
Map
241
Den
t Isl
and
-20.
3577
814
8.93
251
Whi
tsun
day
Regi
onal
2.67
242
Long
Isla
nd-2
0.36
496
148.
8587
2W
hits
unda
y Re
gion
al3.
50
243
Conw
ay B
each
-20.
4794
414
8.73
984
Whi
tsun
day
Regi
onal
3.49
244
Pros
erpi
ne-2
0.40
173
148.
5809
1W
hits
unda
y Re
gion
al3.
34
Map
6: W
hits
unda
y Co
astli
ne c
ont.
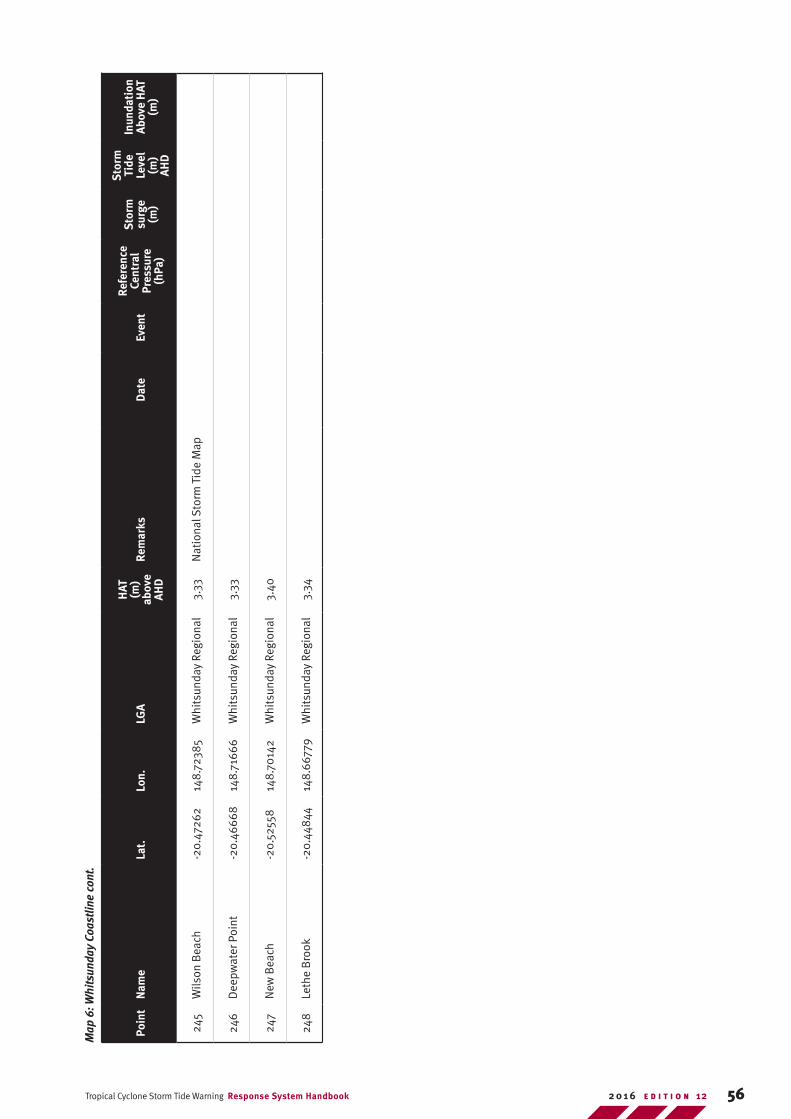
56Tropical Cyclone Storm Tide Warning Response System Handbook E D I T I O N 122 0 1 6
Poin
tN
ame
Lat.
Lon.
LGA
HAT
(m
) ab
ove
AHD
Rem
arks
Dat
eEv
ent
Refe
renc
e Ce
ntra
l Pr
essu
re
(hPa
)
Sto
rm
surg
e (m
)
Sto
rm
Tide
Le
vel
(m)
AHD
Inun
dati
on
Abov
e H
AT
(m)
245
Wils
on B
each
-20.
4726
214
8.72
385
Whi
tsun
day
Regi
onal
3.33
Nat
iona
l Sto
rm T
ide
Map
246
Dee
pwat
er P
oint
-20.
4666
814
8.71
666
Whi
tsun
day
Regi
onal
3.33
247
New
Bea
ch-2
0.52
558
148.
7014
2W
hits
unda
y Re
gion
al3.
40
248
Leth
e B
rook
-20.
448
4414
8.66
779
Whi
tsun
day
Regi
onal
3.34
Map
6: W
hits
unda
y Co
astli
ne c
ont.
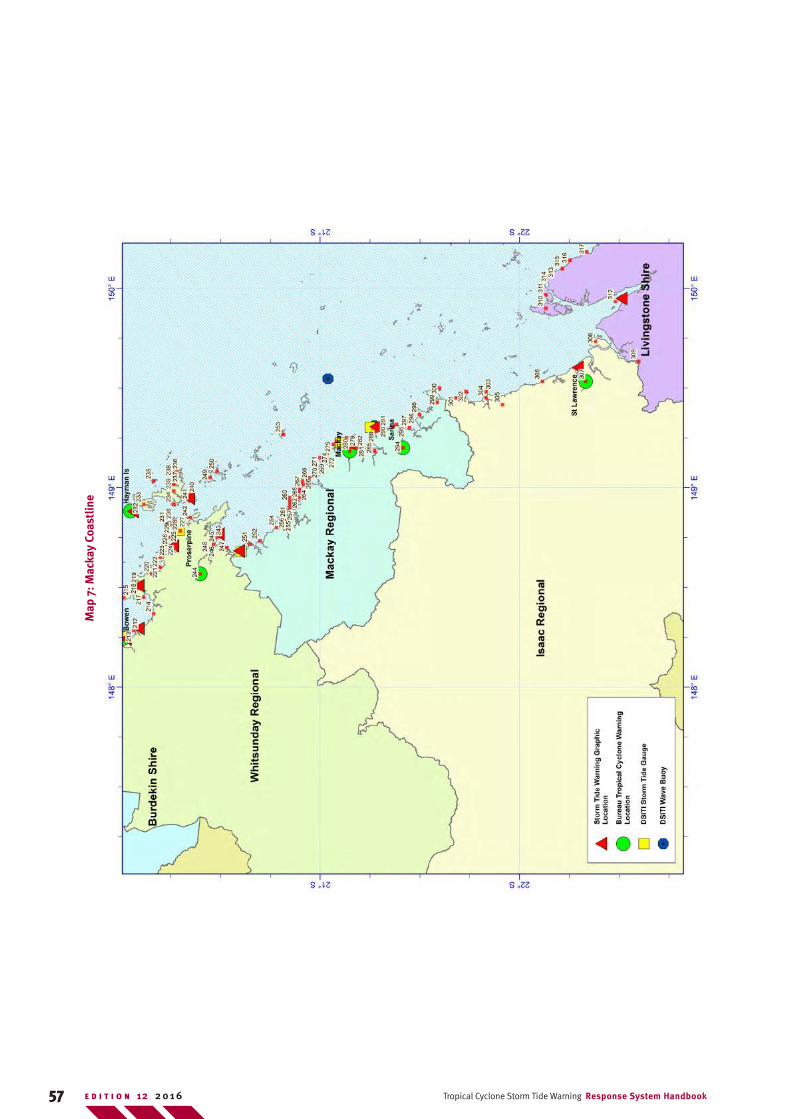
57 Tropical Cyclone Storm Tide Warning Response System HandbookE D I T I O N 12 2 0 1 6
Map
7: M
acka
y Co
astl
ine
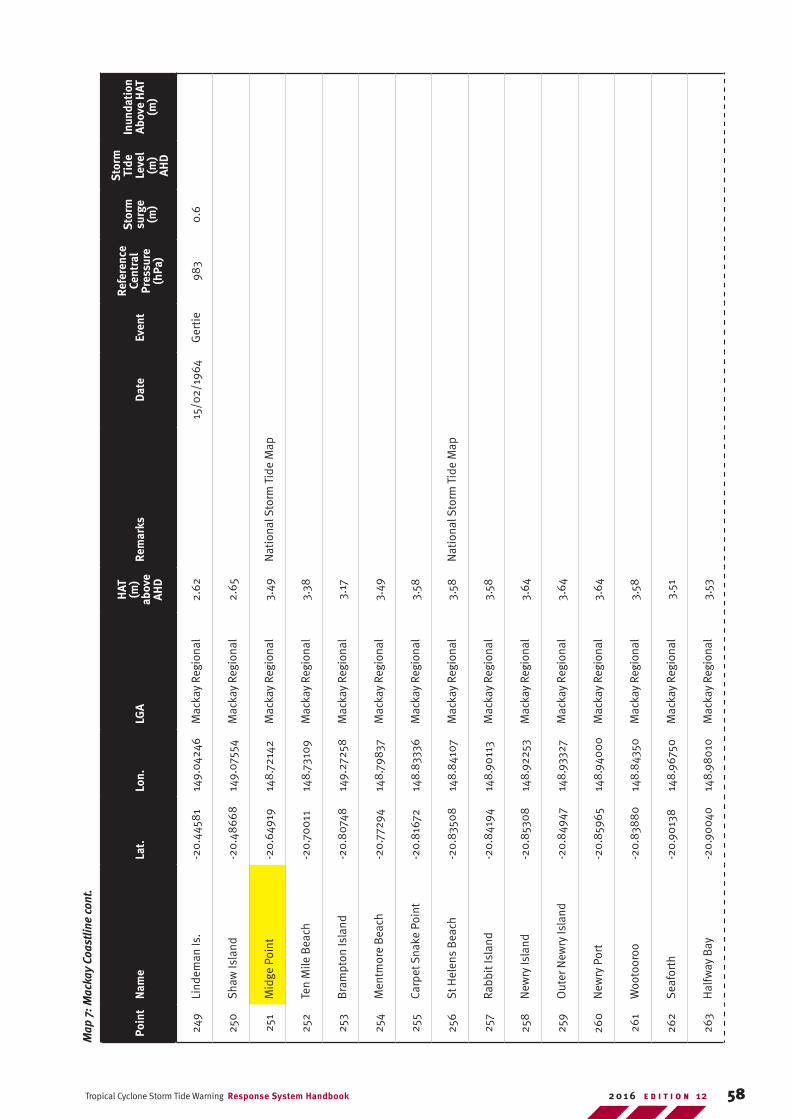
58Tropical Cyclone Storm Tide Warning Response System Handbook E D I T I O N 122 0 1 6
Poin
tN
ame
Lat.
Lon.
LGA
HAT
(m
) ab
ove
AHD
Rem
arks
Dat
eEv
ent
Refe
renc
e Ce
ntra
l Pr
essu
re
(hPa
)
Sto
rm
surg
e (m
)
Sto
rm
Tide
Le
vel
(m)
AHD
Inun
dati
on
Abov
e H
AT
(m)
249
Lind
eman
Is.
-20.
4458
114
9.04
246
Mac
kay
Regi
onal
2.62
15/0
2/19
64G
erti
e98
30.
6
250
Sha
w Is
land
-20.
4866
814
9.07
554
Mac
kay
Regi
onal
2.65
251
Mid
ge P
oint
-20.
6491
914
8.72
142
Mac
kay
Regi
onal
3.49
Nat
iona
l Sto
rm T
ide
Map
252
Ten
Mile
Bea
ch-2
0.70
011
148.
7310
9M
acka
y Re
gion
al3.
38
253
Bra
mpt
on Is
land
-20.
807
4814
9.27
258
Mac
kay
Regi
onal
3.17
254
Men
tmor
e B
each
-20.
7729
414
8.79
837
Mac
kay
Regi
onal
3.49
255
Carp
et S
nake
Poi
nt-2
0.8
1672
148.
8333
6M
acka
y Re
gion
al3.
58
256
St H
elen
s B
each
-20.
8350
814
8.8
4107
Mac
kay
Regi
onal
3.58
Nat
iona
l Sto
rm T
ide
Map
257
Rabb
it Is
land
-20.
841
9414
8.90
113
Mac
kay
Regi
onal
3.58
258
New
ry Is
land
-20.
8530
814
8.92
253
Mac
kay
Regi
onal
3.64
259
Out
er N
ewry
Isla
nd-2
0.8
4947
148.
9332
7M
acka
y Re
gion
al3.
64
260
New
ry P
ort
-20.
8596
514
8.94
00
0M
acka
y Re
gion
al3.
64
261
Woo
toor
oo-2
0.83
88
014
8.8
4350
Mac
kay
Regi
onal
3.58
262
Sea
fort
h-2
0.90
138
148.
9675
0M
acka
y Re
gion
al3.
51
263
Hal
fway
Bay
-20.
9004
014
8.98
010
Mac
kay
Regi
onal
3.53
Map
7: M
acka
y Co
astli
ne c
ont.
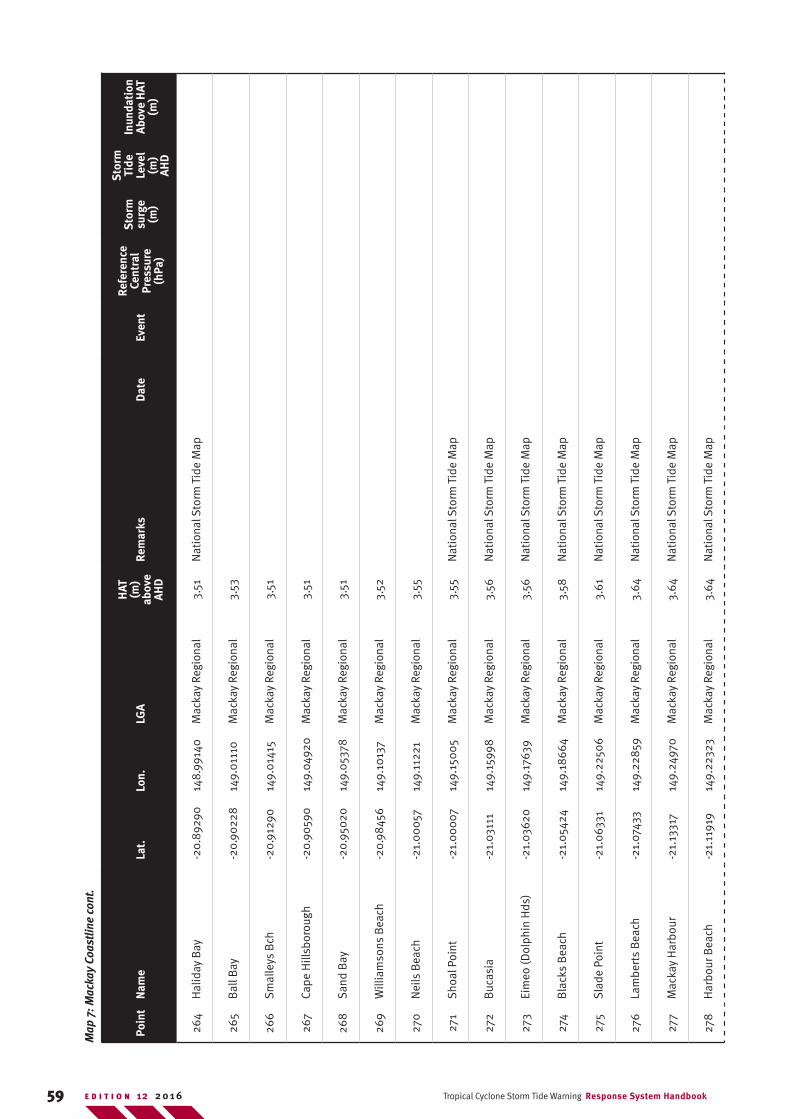
59 Tropical Cyclone Storm Tide Warning Response System HandbookE D I T I O N 12 2 0 1 6
Poin
tN
ame
Lat.
Lon.
LGA
HAT
(m
) ab
ove
AHD
Rem
arks
Dat
eEv
ent
Refe
renc
e Ce
ntra
l Pr
essu
re
(hPa
)
Sto
rm
surg
e (m
)
Sto
rm
Tide
Le
vel
(m)
AHD
Inun
dati
on
Abov
e H
AT
(m)
264
Hal
iday
Bay
-20.
8929
014
8.99
140
Mac
kay
Regi
onal
3.51
Nat
iona
l Sto
rm T
ide
Map
265
Bal
l Bay
-20.
9022
814
9.0
1110
Mac
kay
Regi
onal
3.53
266
Sm
alle
ys B
ch-2
0.91
290
149.
014
15M
acka
y Re
gion
al3.
51
267
Cape
Hill
sbor
ough
-20.
9059
014
9.04
920
Mac
kay
Regi
onal
3.51
268
San
d B
ay-2
0.95
020
149.
053
78M
acka
y Re
gion
al3.
51
269
Will
iam
sons
Bea
ch-2
0.98
456
149.
1013
7M
acka
y Re
gion
al3.
52
270
Nei
ls B
each
-21.
00
057
149.
1122
1M
acka
y Re
gion
al3.
55
271
Sho
al P
oint
-21.
00
007
149.
150
05
Mac
kay
Regi
onal
3.55
Nat
iona
l Sto
rm T
ide
Map
272
Buc
asia
-21.
0311
114
9.15
998
Mac
kay
Regi
onal
3.56
Nat
iona
l Sto
rm T
ide
Map
273
Eim
eo (D
olph
in H
ds)
-21.
0362
014
9.17
639
Mac
kay
Regi
onal
3.56
Nat
iona
l Sto
rm T
ide
Map
274
Bla
cks
Bea
ch-2
1.0
5424
149.
1866
4M
acka
y Re
gion
al3.
58N
atio
nal S
torm
Tid
e M
ap
275
Sla
de P
oint
-21.
063
3114
9.22
506
Mac
kay
Regi
onal
3.61
Nat
iona
l Sto
rm T
ide
Map
276
Lam
bert
s B
each
-21.
0743
314
9.22
859
Mac
kay
Regi
onal
3.64
Nat
iona
l Sto
rm T
ide
Map
277
Mac
kay
Har
bour
-21.
1331
714
9.24
970
Mac
kay
Regi
onal
3.64
Nat
iona
l Sto
rm T
ide
Map
278
Har
bour
Bea
ch-2
1.11
919
149.
2232
3M
acka
y Re
gion
al3.
64N
atio
nal S
torm
Tid
e M
ap
Map
7: M
acka
y Co
astli
ne c
ont.
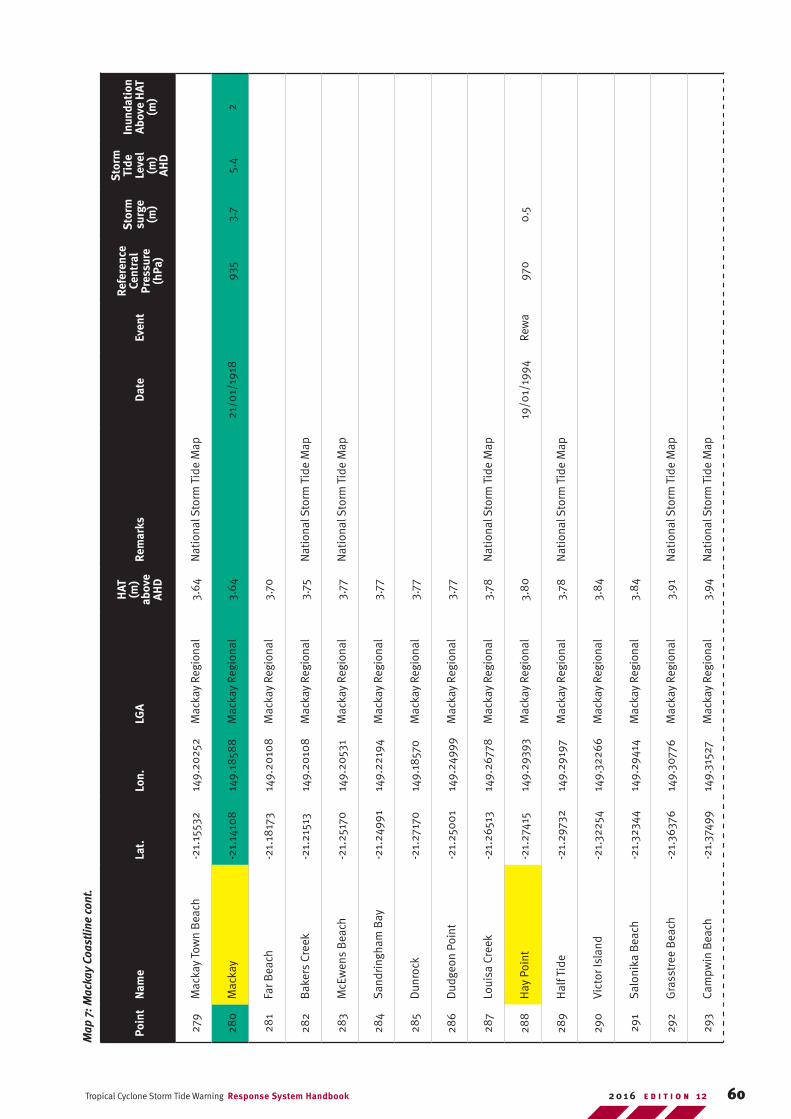
60Tropical Cyclone Storm Tide Warning Response System Handbook E D I T I O N 122 0 1 6
Poin
tN
ame
Lat.
Lon.
LGA
HAT
(m
) ab
ove
AHD
Rem
arks
Dat
eEv
ent
Refe
renc
e Ce
ntra
l Pr
essu
re
(hPa
)
Sto
rm
surg
e (m
)
Sto
rm
Tide
Le
vel
(m)
AHD
Inun
dati
on
Abov
e H
AT
(m)
279
Mac
kay
Tow
n B
each
-21.
1553
214
9.20
252
Mac
kay
Regi
onal
3.64
Nat
iona
l Sto
rm T
ide
Map
280
Mac
kay
-21.
1410
814
9.18
588
Mac
kay
Regi
onal
3.64
21/0
1/19
1893
53.
75.
42
281
Far B
each
-21.
1817
314
9.20
108
Mac
kay
Regi
onal
3.70
282
Bak
ers
Cree
k-2
1.21
513
149.
2010
8M
acka
y Re
gion
al3.
75N
atio
nal S
torm
Tid
e M
ap
283
McE
wen
s B
each
-21.
2517
014
9.20
531
Mac
kay
Regi
onal
3.77
Nat
iona
l Sto
rm T
ide
Map
284
San
drin
gham
Bay
-21.
2499
114
9.22
194
Mac
kay
Regi
onal
3.77
285
Dun
rock
-21.
2717
014
9.18
570
Mac
kay
Regi
onal
3.77
286
Dud
geon
Poi
nt-2
1.25
00
114
9.24
999
Mac
kay
Regi
onal
3.77
287
Loui
sa C
reek
-21.
2651
314
9.26
778
Mac
kay
Regi
onal
3.78
Nat
iona
l Sto
rm T
ide
Map
288
Hay
Poi
nt-2
1.27
415
149.
2939
3M
acka
y Re
gion
al3.
80
19/0
1/19
94Re
wa
970
0.5
289
Hal
f Tid
e-2
1.29
732
149.
2919
7M
acka
y Re
gion
al3.
78N
atio
nal S
torm
Tid
e M
ap
290
Vict
or Is
land
-21.
3225
414
9.32
266
Mac
kay
Regi
onal
3.8
4
291
Sal
onik
a B
each
-21.
3234
414
9.29
414
Mac
kay
Regi
onal
3.8
4
292
Gra
sstr
ee B
each
-21.
3637
614
9.30
776
Mac
kay
Regi
onal
3.91
Nat
iona
l Sto
rm T
ide
Map
293
Cam
pwin
Bea
ch-2
1.37
499
149.
3152
7M
acka
y Re
gion
al3.
94N
atio
nal S
torm
Tid
e M
ap
Map
7: M
acka
y Co
astli
ne c
ont.
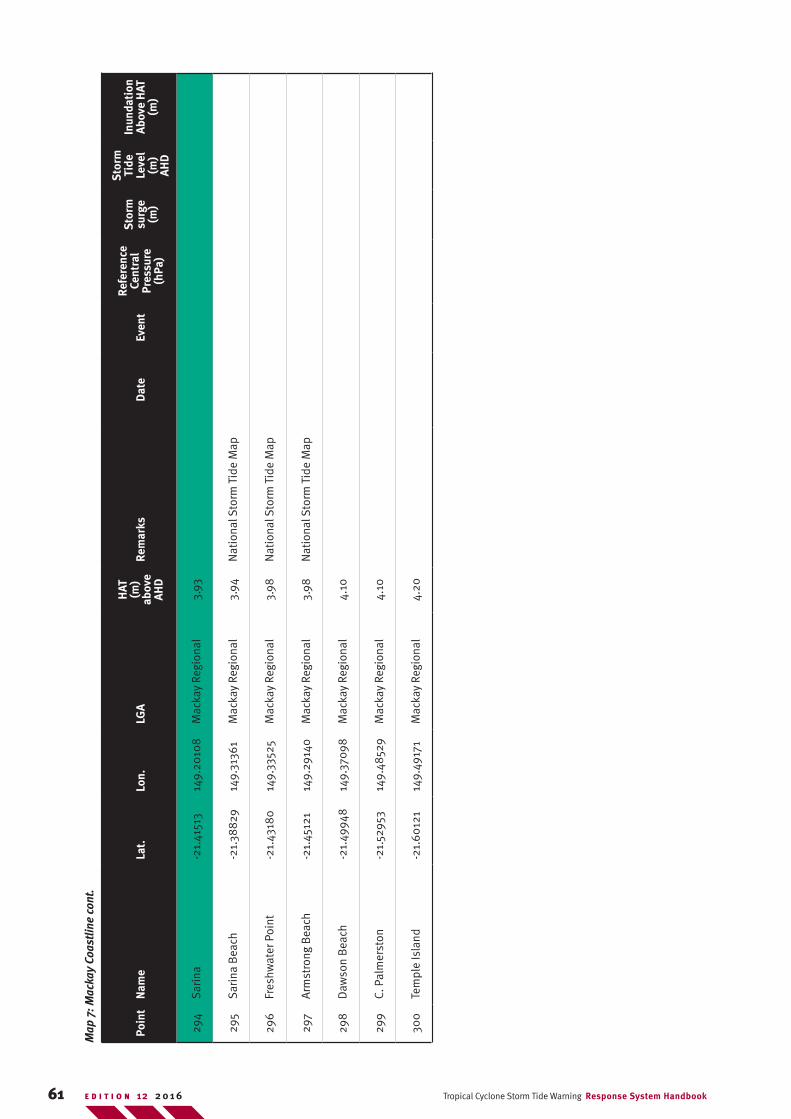
61 Tropical Cyclone Storm Tide Warning Response System HandbookE D I T I O N 12 2 0 1 6
Poin
tN
ame
Lat.
Lon.
LGA
HAT
(m
) ab
ove
AHD
Rem
arks
Dat
eEv
ent
Refe
renc
e Ce
ntra
l Pr
essu
re
(hPa
)
Sto
rm
surg
e (m
)
Sto
rm
Tide
Le
vel
(m)
AHD
Inun
dati
on
Abov
e H
AT
(m)
294
Sar
ina
-21.
4151
314
9.20
108
Mac
kay
Regi
onal
3.93
295
Sar
ina
Bea
ch-2
1.38
829
149.
3136
1M
acka
y Re
gion
al3.
94N
atio
nal S
torm
Tid
e M
ap
296
Fres
hwat
er P
oint
-21.
4318
014
9.33
525
Mac
kay
Regi
onal
3.98
Nat
iona
l Sto
rm T
ide
Map
297
Arm
stro
ng B
each
-21.
4512
114
9.29
140
Mac
kay
Regi
onal
3.98
Nat
iona
l Sto
rm T
ide
Map
298
Daw
son
Bea
ch-2
1.49
948
149.
3709
8M
acka
y Re
gion
al4.
10
299
C. P
alm
erst
on-2
1.52
953
149.
4852
9M
acka
y Re
gion
al4.
10
300
Tem
ple
Isla
nd-2
1.60
121
149.
4917
1M
acka
y Re
gion
al4.
20
Map
7: M
acka
y Co
astli
ne c
ont.
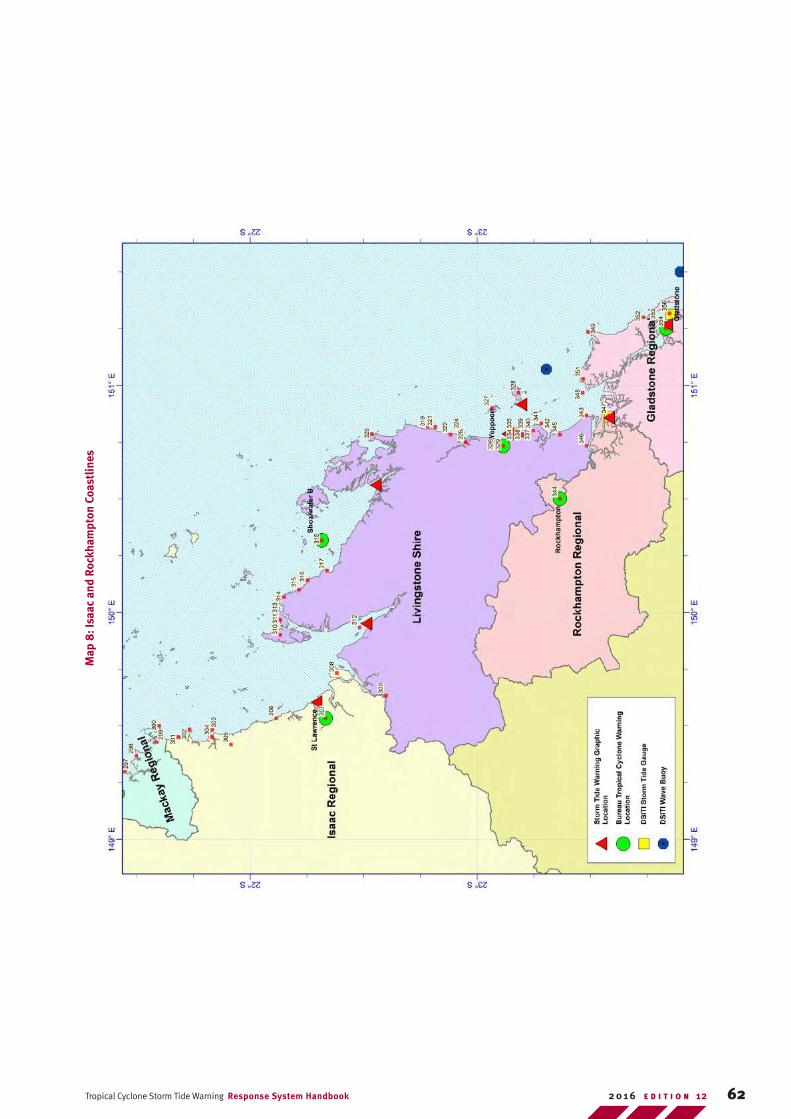
62Tropical Cyclone Storm Tide Warning Response System Handbook E D I T I O N 122 0 1 6
Map
8: I
saac
and
Roc
kham
pton
Coa
stlin
es
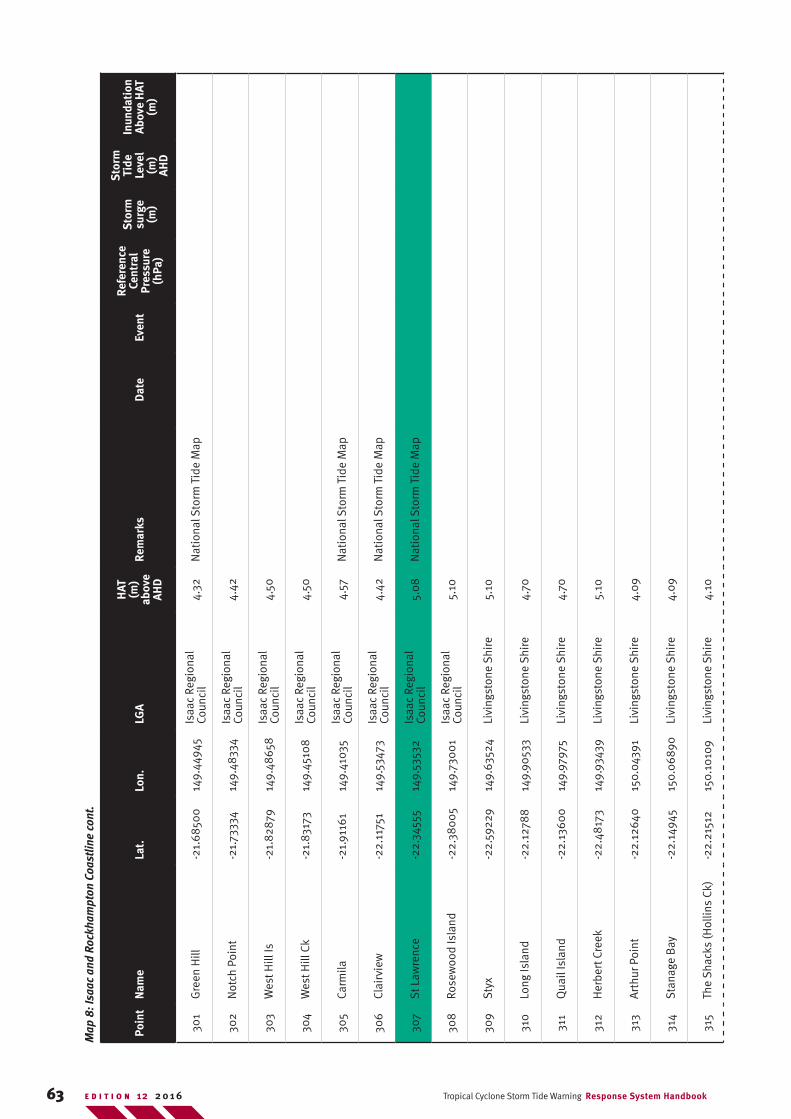
63 Tropical Cyclone Storm Tide Warning Response System HandbookE D I T I O N 12 2 0 1 6
Poin
tN
ame
Lat.
Lon.
LGA
HAT
(m
) ab
ove
AHD
Rem
arks
Dat
eEv
ent
Refe
renc
e Ce
ntra
l Pr
essu
re
(hPa
)
Sto
rm
surg
e (m
)
Sto
rm
Tide
Le
vel
(m)
AHD
Inun
dati
on
Abov
e H
AT
(m)
301
Gre
en H
ill-2
1.68
500
149.
4494
5Is
aac
Regi
onal
Co
unci
l4.
32N
atio
nal S
torm
Tid
e M
ap
302
Not
ch P
oint
-21.
7333
414
9.48
334
Isaa
c Re
gion
al
Coun
cil
4.42
303
Wes
t Hill
Is-2
1.82
879
149.
4865
8Is
aac
Regi
onal
Co
unci
l4.
50
304
Wes
t Hill
Ck
-21.
8317
314
9.45
108
Isaa
c Re
gion
al
Coun
cil
4.50
305
Carm
ila-2
1.91
161
149.
4103
5Is
aac
Regi
onal
Co
unci
l4.
57N
atio
nal S
torm
Tid
e M
ap
306
Clai
rvie
w-2
2.11
751
149.
5347
3Is
aac
Regi
onal
Co
unci
l4.
42N
atio
nal S
torm
Tid
e M
ap
307
St L
awre
nce
-22.
3455
514
9.53
532
Isaa
c Re
gion
al
Coun
cil
5.0
8N
atio
nal S
torm
Tid
e M
ap
308
Rose
woo
d Is
land
-22.
380
05
149.
730
01
Isaa
c Re
gion
al
Coun
cil
5.10
309
Sty
x-2
2.59
229
149.
6352
4Li
ving
ston
e S
hire
5.10
310
Long
Isla
nd-2
2.12
788
149.
9053
3Li
ving
ston
e S
hire
4.70
311
Qua
il Is
land
-22.
1360
014
9.97
975
Livi
ngst
one
Shi
re4.
70
312
Her
bert
Cre
ek-2
2.48
173
149.
9343
9Li
ving
ston
e S
hire
5.10
313
Art
hur P
oint
-22.
1264
015
0.04
391
Livi
ngst
one
Shi
re4.
09
314
Sta
nage
Bay
-22.
1494
515
0.0
6890
Livi
ngst
one
Shi
re4.
09
315
The
Sha
cks
(Hol
lins
Ck)
-22.
2151
215
0.10
109
Livi
ngst
one
Shi
re4.
10
Map
8: I
saac
and
Roc
kham
pton
Coa
stlin
e co
nt.
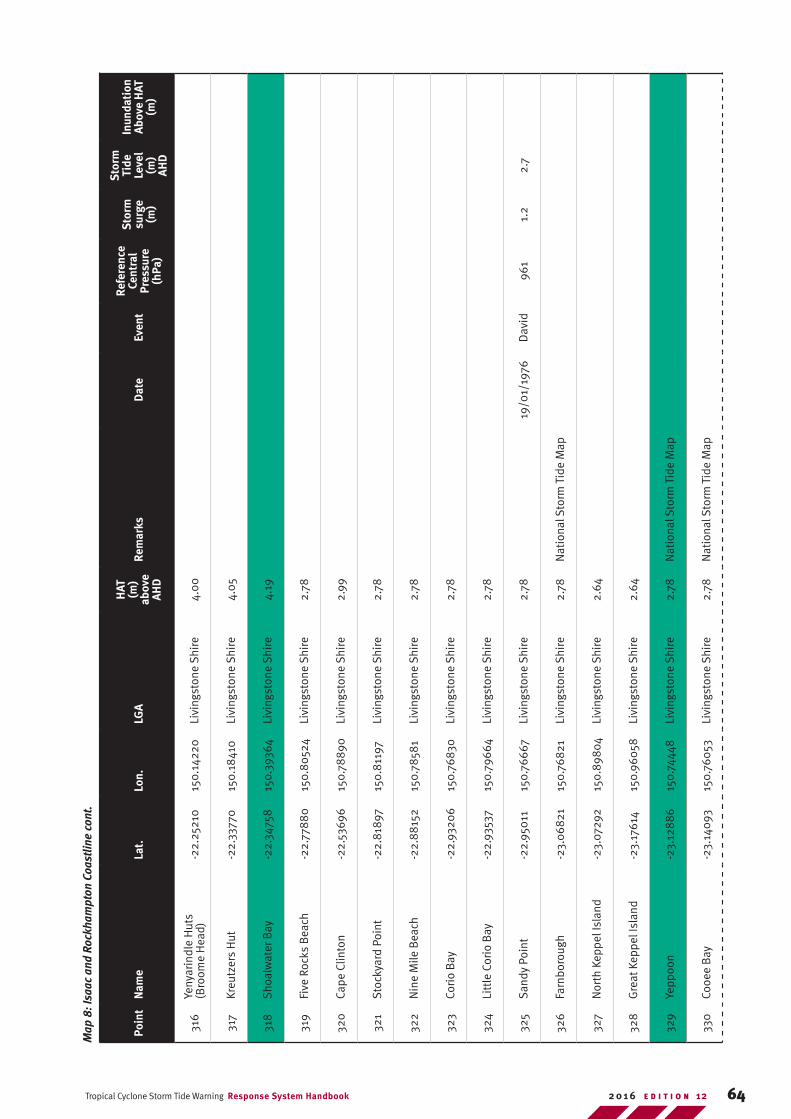
64Tropical Cyclone Storm Tide Warning Response System Handbook E D I T I O N 122 0 1 6
Poin
tN
ame
Lat.
Lon.
LGA
HAT
(m
) ab
ove
AHD
Rem
arks
Dat
eEv
ent
Refe
renc
e Ce
ntra
l Pr
essu
re
(hPa
)
Sto
rm
surg
e (m
)
Sto
rm
Tide
Le
vel
(m)
AHD
Inun
dati
on
Abov
e H
AT
(m)
316
Yeny
arin
dle
Hut
s (B
room
e H
ead)
-22.
2521
015
0.14
220
Livi
ngst
one
Shi
re4.
00
317
Kreu
tzer
s H
ut-2
2.33
770
150.
1841
0Li
ving
ston
e S
hire
4.0
5
318
Sho
alw
ater
Bay
-22.
3475
815
0.39
364
Livi
ngst
one
Shi
re4.
19
319
Five
Roc
ks B
each
-22.
778
80
150.
80
524
Livi
ngst
one
Shi
re2.
78
320
Cape
Clin
ton
-22.
5369
615
0.78
890
Livi
ngst
one
Shi
re2.
99
321
Sto
ckya
rd P
oint
-22.
818
9715
0.8
1197
Livi
ngst
one
Shi
re2.
78
322
Nin
e M
ile B
each
-22.
88
152
150.
7858
1Li
ving
ston
e S
hire
2.78
323
Cori
o B
ay-2
2.93
206
150.
7683
0Li
ving
ston
e S
hire
2.78
324
Litt
le C
orio
Bay
-22.
9353
715
0.79
664
Livi
ngst
one
Shi
re2.
78
325
San
dy P
oint
-22.
950
1115
0.76
667
Livi
ngst
one
Shi
re2.
7819
/01/
1976
Dav
id96
11.
22.
7
326
Farn
boro
ugh
-23.
068
2115
0.76
821
Livi
ngst
one
Shi
re2.
78N
atio
nal S
torm
Tid
e M
ap
327
Nor
th K
eppe
l Isl
and
-23.
0729
215
0.89
804
Livi
ngst
one
Shi
re2.
64
328
Gre
at K
eppe
l Isl
and
-23.
1761
415
0.96
058
Livi
ngst
one
Shi
re2.
64
329
Yepp
oon
-23.
128
86
150.
7444
8Li
ving
ston
e S
hire
2.78
Nat
iona
l Sto
rm T
ide
Map
330
Cooe
e B
ay-2
3.14
093
150.
760
53Li
ving
ston
e S
hire
2.78
Nat
iona
l Sto
rm T
ide
Map
Map
8: I
saac
and
Roc
kham
pton
Coa
stlin
e co
nt.
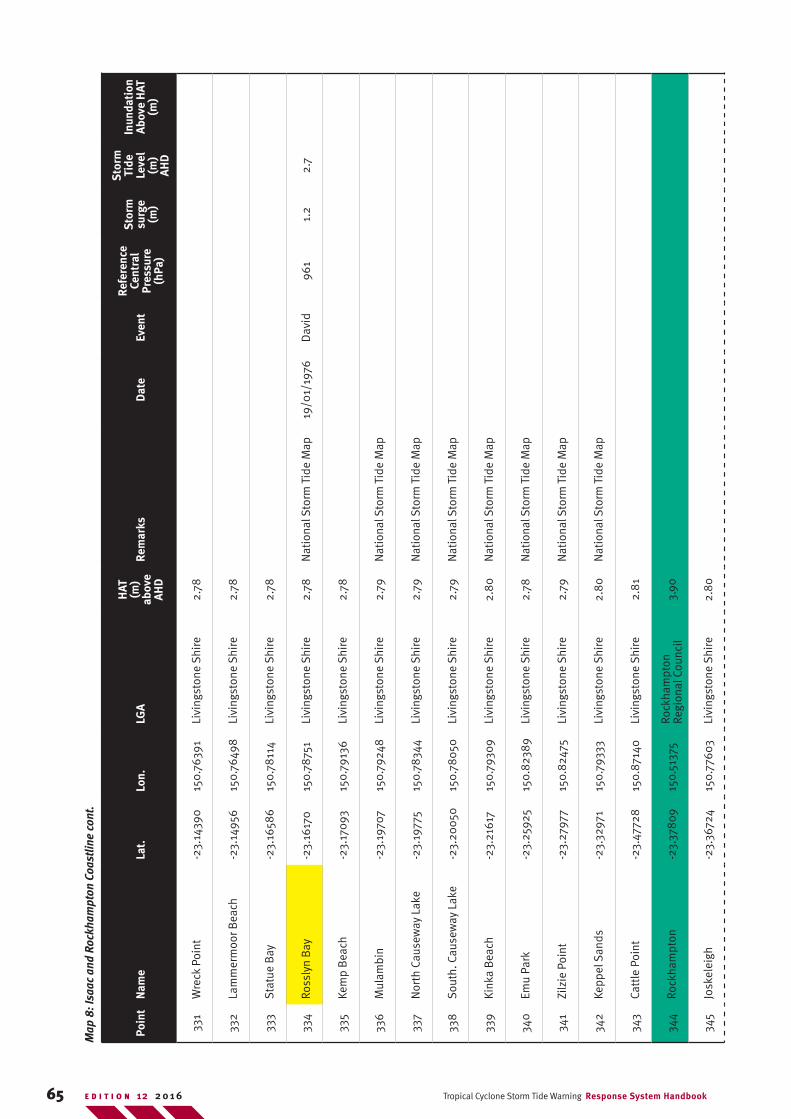
65 Tropical Cyclone Storm Tide Warning Response System HandbookE D I T I O N 12 2 0 1 6
Poin
tN
ame
Lat.
Lon.
LGA
HAT
(m
) ab
ove
AHD
Rem
arks
Dat
eEv
ent
Refe
renc
e Ce
ntra
l Pr
essu
re
(hPa
)
Sto
rm
surg
e (m
)
Sto
rm
Tide
Le
vel
(m)
AHD
Inun
dati
on
Abov
e H
AT
(m)
331
Wre
ck P
oint
-23.
1439
015
0.76
391
Livi
ngst
one
Shi
re2.
78
332
Lam
mer
moo
r Bea
ch-2
3.14
956
150.
7649
8Li
ving
ston
e S
hire
2.78
333
Sta
tue
Bay
-23.
1658
615
0.78
114
Livi
ngst
one
Shi
re2.
78
334
Ross
lyn
Bay
-23.
1617
015
0.78
751
Livi
ngst
one
Shi
re2.
78N
atio
nal S
torm
Tid
e M
ap19
/01/
1976
Dav
id96
11.
22.
7
335
Kem
p B
each
-23.
1709
315
0.79
136
Livi
ngst
one
Shi
re2.
78
336
Mul
ambi
n-2
3.19
707
150.
7924
8Li
ving
ston
e S
hire
2.79
Nat
iona
l Sto
rm T
ide
Map
337
Nor
th C
ause
way
Lak
e-2
3.19
775
150.
7834
4Li
ving
ston
e S
hire
2.79
Nat
iona
l Sto
rm T
ide
Map
338
Sou
th. C
ause
way
Lak
e-2
3.20
050
150.
780
50Li
ving
ston
e S
hire
2.79
Nat
iona
l Sto
rm T
ide
Map
339
Kink
a B
each
-23.
2161
715
0.79
309
Livi
ngst
one
Shi
re2.
80
Nat
iona
l Sto
rm T
ide
Map
340
Emu
Park
-23.
2592
515
0.82
389
Livi
ngst
one
Shi
re2.
78N
atio
nal S
torm
Tid
e M
ap
341
Zilz
ie P
oint
-23.
2797
715
0.82
475
Livi
ngst
one
Shi
re2.
79N
atio
nal S
torm
Tid
e M
ap
342
Kepp
el S
ands
-23.
3297
115
0.79
333
Livi
ngst
one
Shi
re2.
80
Nat
iona
l Sto
rm T
ide
Map
343
Catt
le P
oint
-23.
4772
815
0.87
140
Livi
ngst
one
Shi
re2.
81
344
Rock
ham
pton
-23.
378
0915
0.51
375
Rock
ham
pton
Re
gion
al C
ounc
il3.
90
345
Josk
elei
gh-2
3.36
724
150.
7760
3Li
ving
ston
e S
hire
2.8
0
Map
8: I
saac
and
Roc
kham
pton
Coa
stlin
e co
nt.
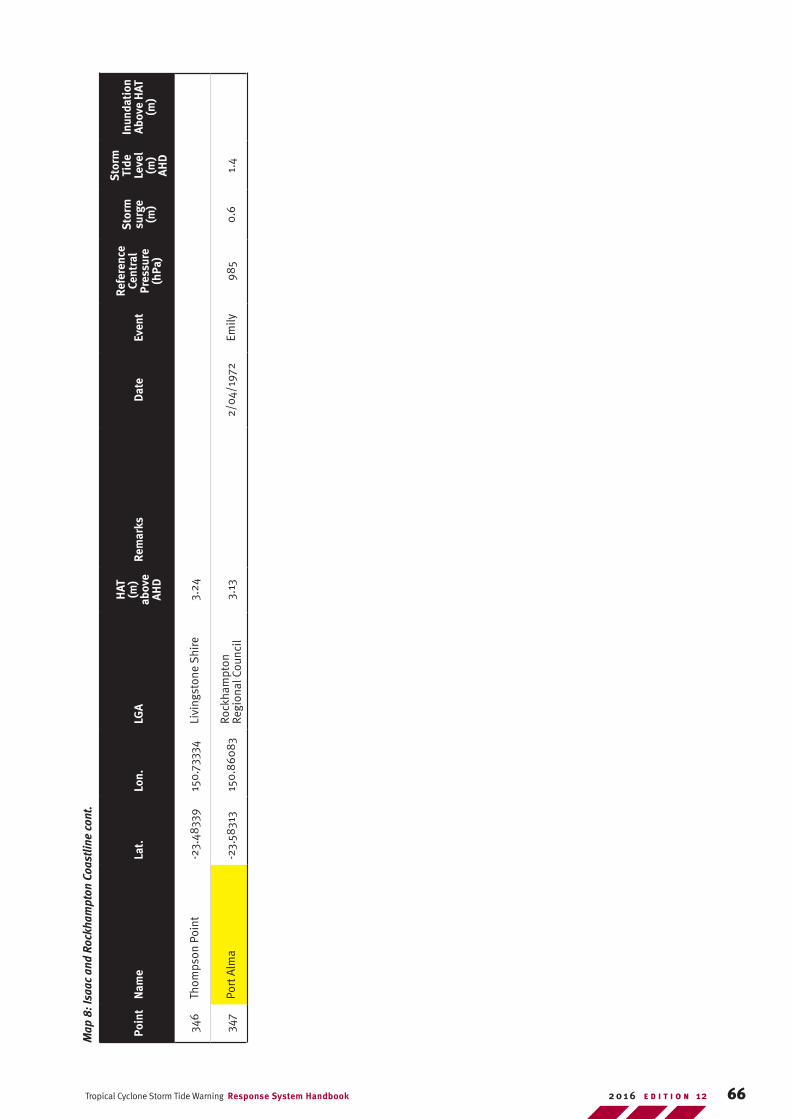
66Tropical Cyclone Storm Tide Warning Response System Handbook E D I T I O N 122 0 1 6
Poin
tN
ame
Lat.
Lon.
LGA
HAT
(m
) ab
ove
AHD
Rem
arks
Dat
eEv
ent
Refe
renc
e Ce
ntra
l Pr
essu
re
(hPa
)
Sto
rm
surg
e (m
)
Sto
rm
Tide
Le
vel
(m)
AHD
Inun
dati
on
Abov
e H
AT
(m)
346
Thom
pson
Poi
nt-2
3.48
339
150.
7333
4Li
ving
ston
e S
hire
3.24
347
Port
Alm
a-2
3.58
313
150.
860
83Ro
ckha
mpt
on
Regi
onal
Cou
ncil
3.13
2/04
/197
2Em
ily98
50.
61.
4
Map
8: I
saac
and
Roc
kham
pton
Coa
stlin
e co
nt.
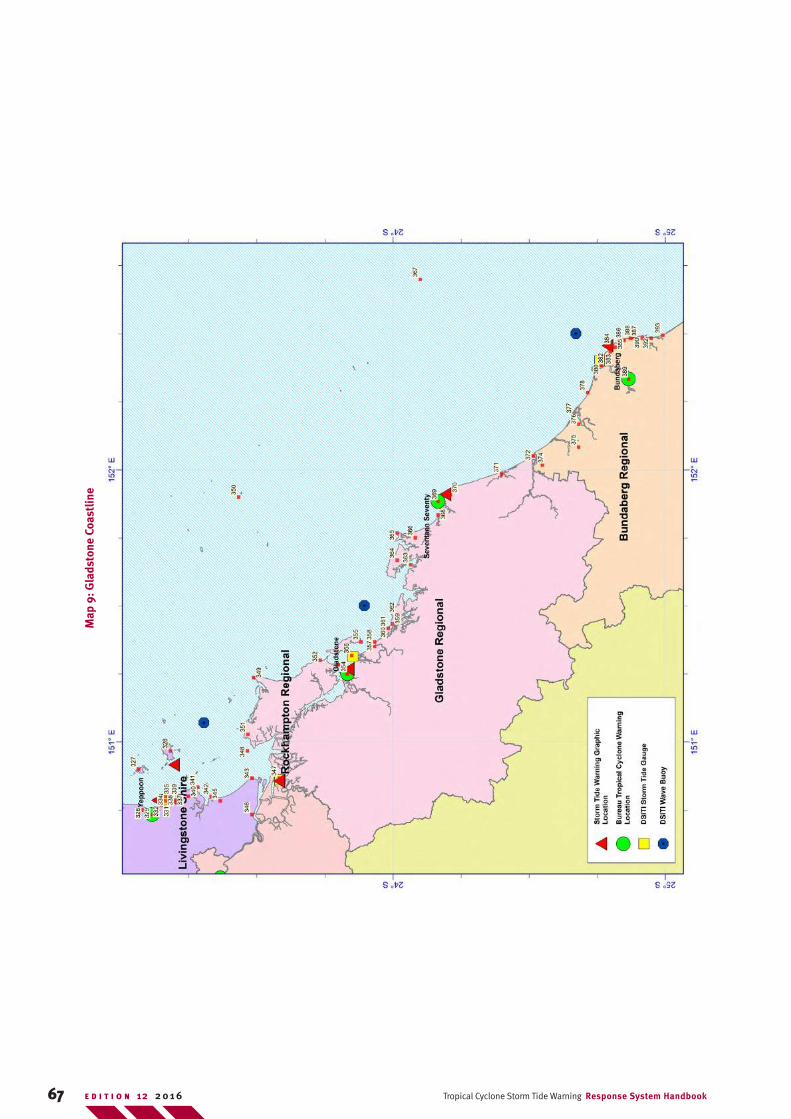
67 Tropical Cyclone Storm Tide Warning Response System HandbookE D I T I O N 12 2 0 1 6
Poin
tN
ame
Lat.
Lon.
LGA
HAT
(m
) ab
ove
AHD
Rem
arks
Dat
eEv
ent
Refe
renc
e Ce
ntra
l Pr
essu
re
(hPa
)
Sto
rm
surg
e (m
)
Sto
rm
Tide
Le
vel
(m)
AHD
Inun
dati
on
Abov
e H
AT
(m)
346
Thom
pson
Poi
nt-2
3.48
339
150.
7333
4Li
ving
ston
e S
hire
3.24
347
Port
Alm
a-2
3.58
313
150.
860
83Ro
ckha
mpt
on
Regi
onal
Cou
ncil
3.13
2/04
/197
2Em
ily98
50.
61.
4
Map
9: G
lads
tone
Coa
stlin
e
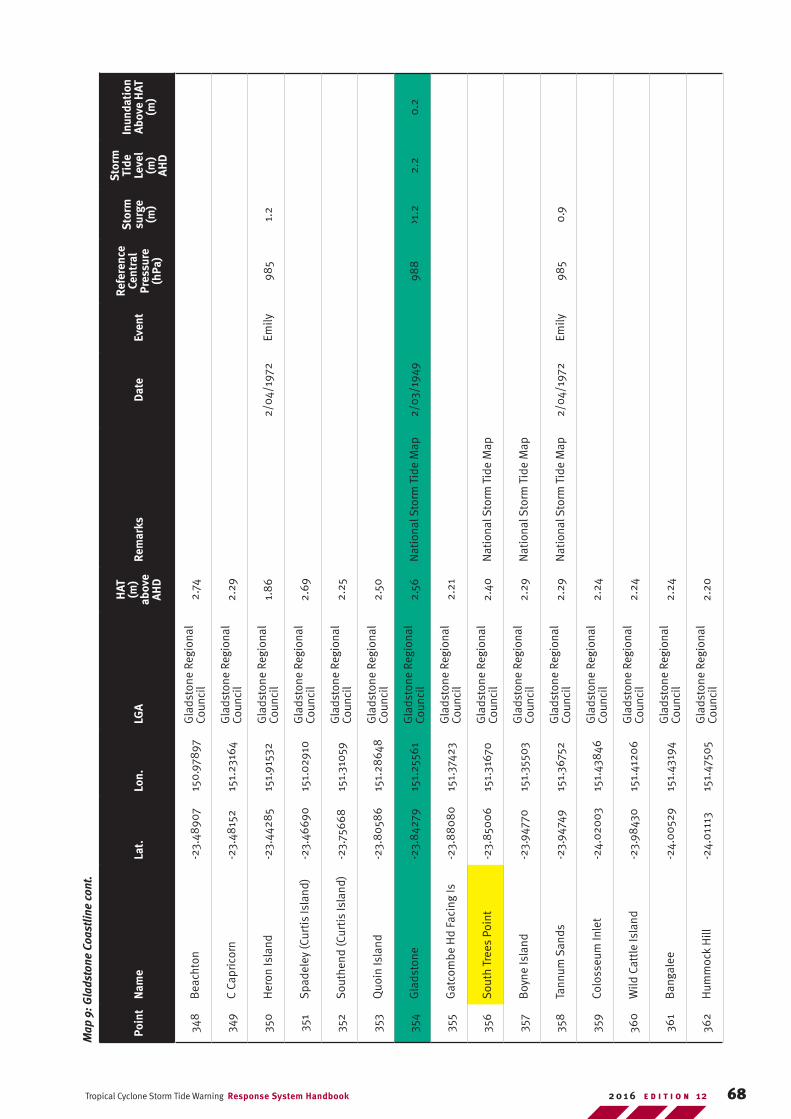
68Tropical Cyclone Storm Tide Warning Response System Handbook E D I T I O N 122 0 1 6
Poin
tN
ame
Lat.
Lon.
LGA
HAT
(m
) ab
ove
AHD
Rem
arks
Dat
eEv
ent
Refe
renc
e Ce
ntra
l Pr
essu
re
(hPa
)
Sto
rm
surg
e (m
)
Sto
rm
Tide
Le
vel
(m)
AHD
Inun
dati
on
Abov
e H
AT
(m)
348
Bea
chto
n-2
3.48
907
150.
9789
7G
lads
tone
Reg
iona
l Co
unci
l2.
74
349
C Ca
pric
orn
-23.
4815
215
1.23
164
Gla
dsto
ne R
egio
nal
Coun
cil
2.29
350
Her
on Is
land
-23.
4428
515
1.91
532
Gla
dsto
ne R
egio
nal
Coun
cil
1.8
62/
04/1
972
Emily
985
1.2
351
Spad
eley
(Cur
tis Is
land
)-2
3.46
690
151.
0291
0G
lads
tone
Reg
iona
l Co
unci
l2.
69
352
Sou
then
d (C
urtis
Isla
nd)
-23.
7566
815
1.31
059
Gla
dsto
ne R
egio
nal
Coun
cil
2.25
353
Quo
in Is
land
-23.
80
586
151.
2864
8G
lads
tone
Reg
iona
l Co
unci
l2.
50
354
Gla
dsto
ne-2
3.8
4279
151.
2556
1G
lads
tone
Reg
iona
l Co
unci
l2.
56N
atio
nal S
torm
Tid
e M
ap2/
03/1
949
988
>1.2
2.2
0.2
355
Gat
com
be H
d Fa
cing
Is-2
3.8
80
80
151.
3742
3G
lads
tone
Reg
iona
l Co
unci
l2.
21
356
Sou
th T
rees
Poi
nt-2
3.85
00
615
1.31
670
Gla
dsto
ne R
egio
nal
Coun
cil
2.40
Nat
iona
l Sto
rm T
ide
Map
357
Boy
ne Is
land
-23.
9477
015
1.35
503
Gla
dsto
ne R
egio
nal
Coun
cil
2.29
Nat
iona
l Sto
rm T
ide
Map
358
Tann
um S
ands
-23.
9474
915
1.36
752
Gla
dsto
ne R
egio
nal
Coun
cil
2.29
Nat
iona
l Sto
rm T
ide
Map
2/04
/197
2Em
ily98
50.
9
359
Colo
sseu
m In
let
-24.
020
0315
1.43
846
Gla
dsto
ne R
egio
nal
Coun
cil
2.24
360
Wild
Cat
tle Is
land
-23.
9843
015
1.41
206
Gla
dsto
ne R
egio
nal
Coun
cil
2.24
361
Ban
gale
e-2
4.0
052
915
1.43
194
Gla
dsto
ne R
egio
nal
Coun
cil
2.24
362
Hum
moc
k H
ill-2
4.0
1113
151.
4750
5G
lads
tone
Reg
iona
l Co
unci
l2.
20
Map
9: G
lads
tone
Coa
stlin
e co
nt.
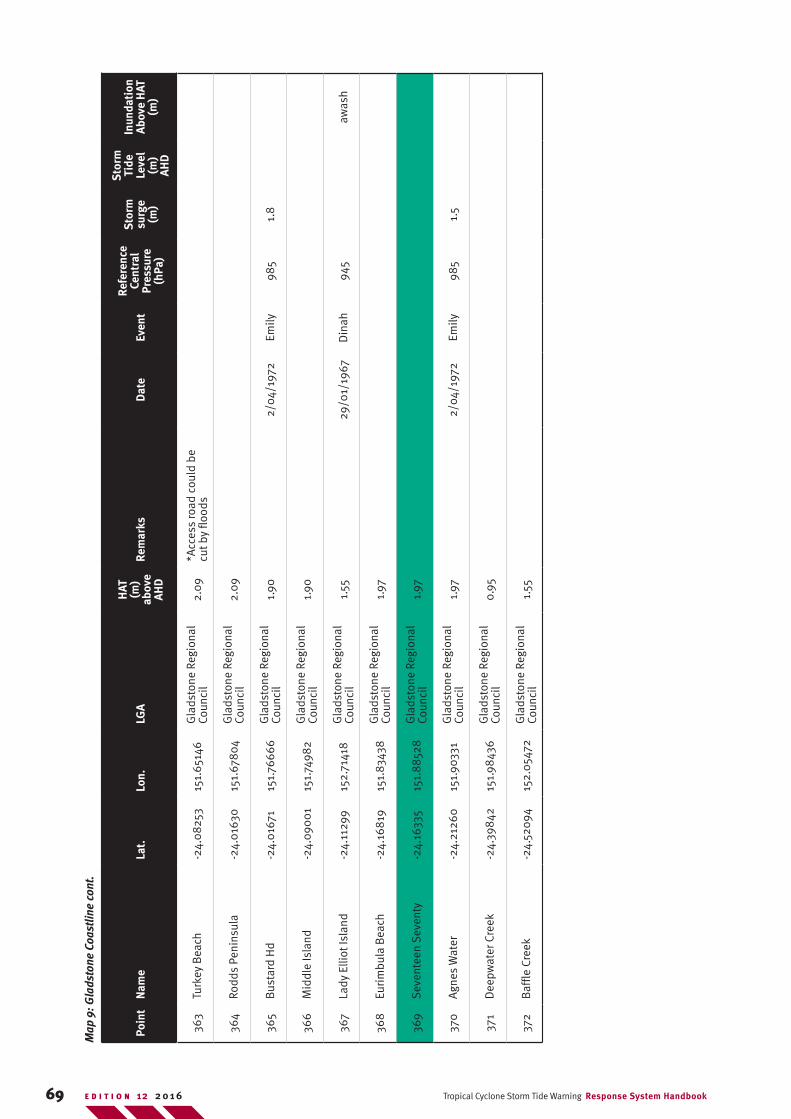
69 Tropical Cyclone Storm Tide Warning Response System HandbookE D I T I O N 12 2 0 1 6
Poin
tN
ame
Lat.
Lon.
LGA
HAT
(m
) ab
ove
AHD
Rem
arks
Dat
eEv
ent
Refe
renc
e Ce
ntra
l Pr
essu
re
(hPa
)
Sto
rm
surg
e (m
)
Sto
rm
Tide
Le
vel
(m)
AHD
Inun
dati
on
Abov
e H
AT
(m)
363
Turk
ey B
each
-24.
082
5315
1.65
146
Gla
dsto
ne R
egio
nal
Coun
cil
2.09
*Acc
ess
road
cou
ld b
e cu
t by
flood
s
364
Rodd
s Pe
nins
ula
-24.
016
3015
1.67
804
Gla
dsto
ne R
egio
nal
Coun
cil
2.09
365
Bus
tard
Hd
-24.
016
7115
1.76
666
Gla
dsto
ne R
egio
nal
Coun
cil
1.90
2/04
/197
2Em
ily98
51.
8
366
Mid
dle
Isla
nd-2
4.09
00
115
1.74
982
Gla
dsto
ne R
egio
nal
Coun
cil
1.90
367
Lady
Elli
ot Is
land
-24.
1129
915
2.71
418
Gla
dsto
ne R
egio
nal
Coun
cil
1.55
29/0
1/19
67D
inah
945
awas
h
368
Euri
mbu
la B
each
-24.
168
1915
1.83
438
Gla
dsto
ne R
egio
nal
Coun
cil
1.97
369
Sev
ente
en S
even
ty-2
4.16
335
151.
885
28G
lads
tone
Reg
iona
l Co
unci
l1.
97
370
Agn
es W
ater
-24.
2126
015
1.90
331
Gla
dsto
ne R
egio
nal
Coun
cil
1.97
2/04
/197
2Em
ily98
51.
5
371
Dee
pwat
er C
reek
-24.
398
4215
1.98
436
Gla
dsto
ne R
egio
nal
Coun
cil
0.95
372
Baf
fle C
reek
-24.
5209
415
2.0
5472
Gla
dsto
ne R
egio
nal
Coun
cil
1.55
Map
9: G
lads
tone
Coa
stlin
e co
nt.
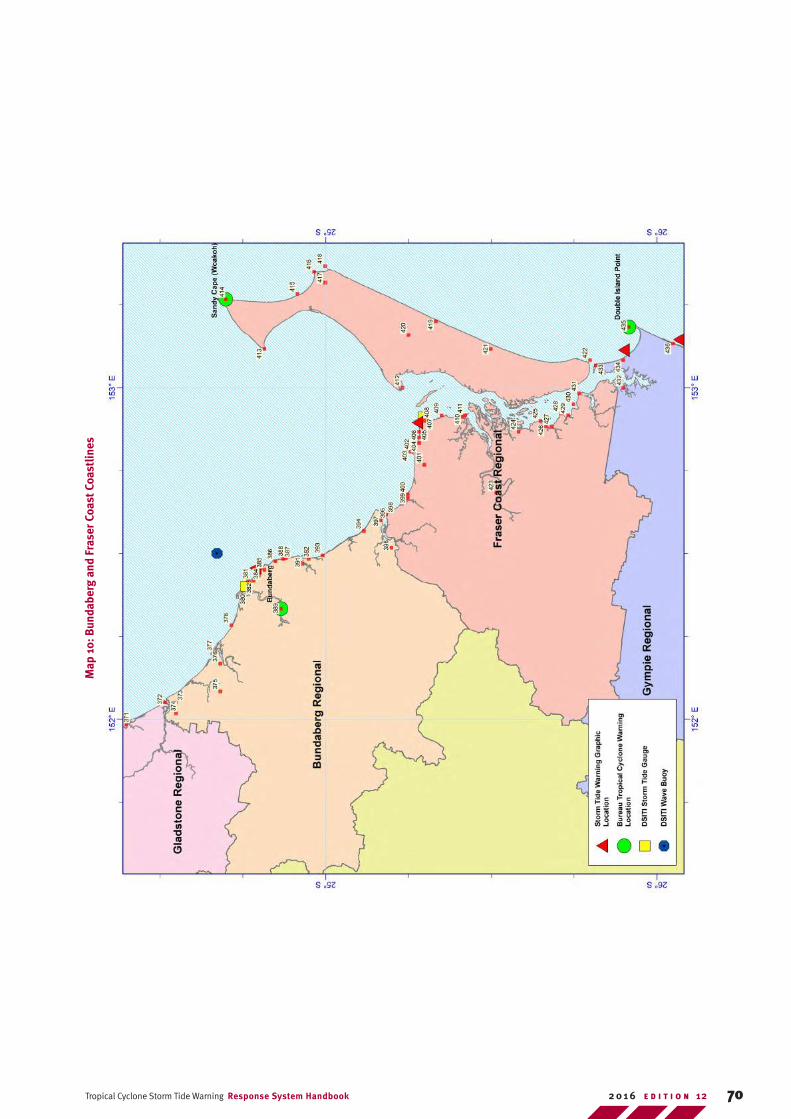
70Tropical Cyclone Storm Tide Warning Response System Handbook E D I T I O N 122 0 1 6
Map
10:
Bun
dabe
rg a
nd F
rase
r Coa
st C
oast
lines
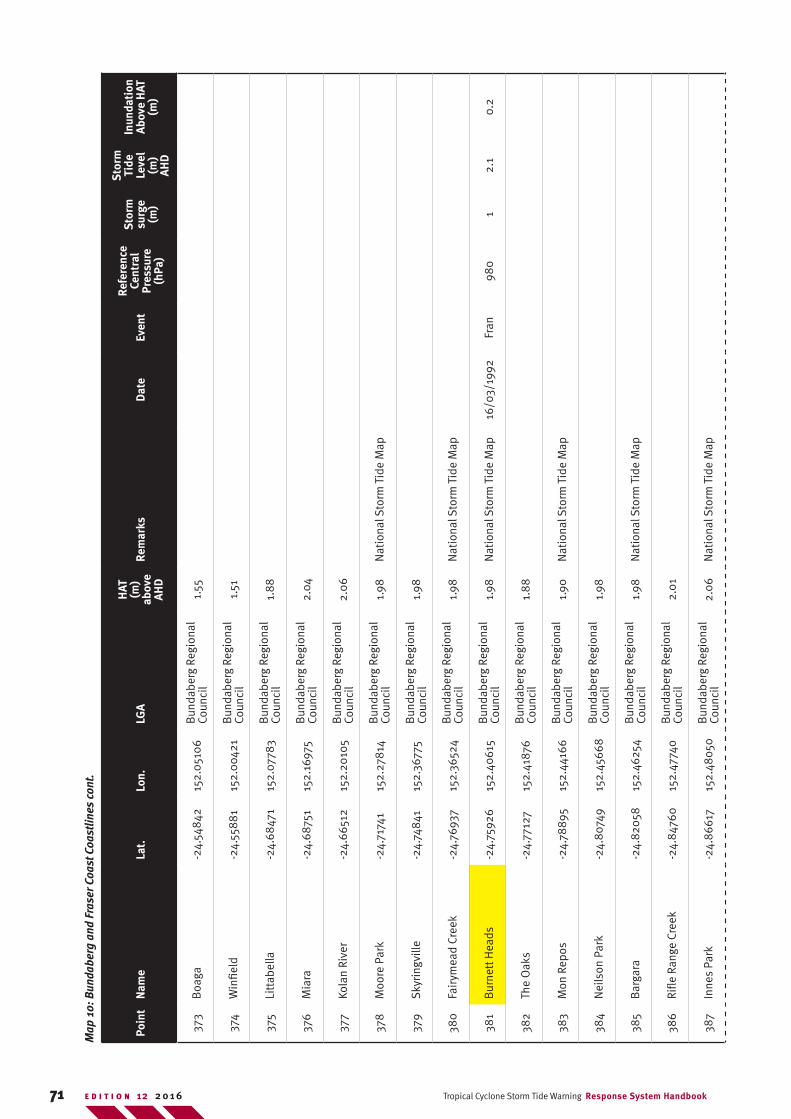
71 Tropical Cyclone Storm Tide Warning Response System HandbookE D I T I O N 12 2 0 1 6
Poin
tN
ame
Lat.
Lon.
LGA
HAT
(m
) ab
ove
AHD
Rem
arks
Dat
eEv
ent
Refe
renc
e Ce
ntra
l Pr
essu
re
(hPa
)
Sto
rm
surg
e (m
)
Sto
rm
Tide
Le
vel
(m)
AHD
Inun
dati
on
Abov
e H
AT
(m)
373
Boa
ga-2
4.54
842
152.
051
06
Bun
dabe
rg R
egio
nal
Coun
cil
1.55
374
Win
field
-24.
558
81
152.
004
21B
unda
berg
Reg
iona
l Co
unci
l1.
51
375
Litt
abel
la-2
4.68
471
152.
0778
3B
unda
berg
Reg
iona
l Co
unci
l1.
88
376
Mia
ra-2
4.68
751
152.
1697
5B
unda
berg
Reg
iona
l Co
unci
l2.
04
377
Kola
n Ri
ver
-24.
6651
215
2.20
105
Bun
dabe
rg R
egio
nal
Coun
cil
2.0
6
378
Moo
re P
ark
-24.
7174
115
2.27
814
Bun
dabe
rg R
egio
nal
Coun
cil
1.98
Nat
iona
l Sto
rm T
ide
Map
379
Sky
ring
ville
-24.
748
4115
2.36
775
Bun
dabe
rg R
egio
nal
Coun
cil
1.98
380
Fair
ymea
d Cr
eek
-24.
7693
715
2.36
524
Bun
dabe
rg R
egio
nal
Coun
cil
1.98
Nat
iona
l Sto
rm T
ide
Map
381
Bur
nett
Hea
ds-2
4.75
926
152.
4061
5B
unda
berg
Reg
iona
l Co
unci
l1.
98N
atio
nal S
torm
Tid
e M
ap16
/03/
1992
Fran
980
12.
10.
2
382
The
Oak
s-2
4.77
127
152.
4187
6B
unda
berg
Reg
iona
l Co
unci
l1.
88
383
Mon
Rep
os-2
4.78
895
152.
4416
6B
unda
berg
Reg
iona
l Co
unci
l1.
90N
atio
nal S
torm
Tid
e M
ap
384
Nei
lson
Par
k-2
4.8
0749
152.
4566
8B
unda
berg
Reg
iona
l Co
unci
l1.
98
385
Bar
gara
-24.
820
5815
2.46
254
Bun
dabe
rg R
egio
nal
Coun
cil
1.98
Nat
iona
l Sto
rm T
ide
Map
386
Rifle
Ran
ge C
reek
-24.
847
6015
2.47
740
Bun
dabe
rg R
egio
nal
Coun
cil
2.0
1
387
Inne
s Pa
rk-2
4.8
6617
152.
480
50B
unda
berg
Reg
iona
l Co
unci
l2.
06
Nat
iona
l Sto
rm T
ide
Map
Map
10:
Bun
dabe
rg a
nd F
rase
r Coa
st C
oast
lines
con
t.
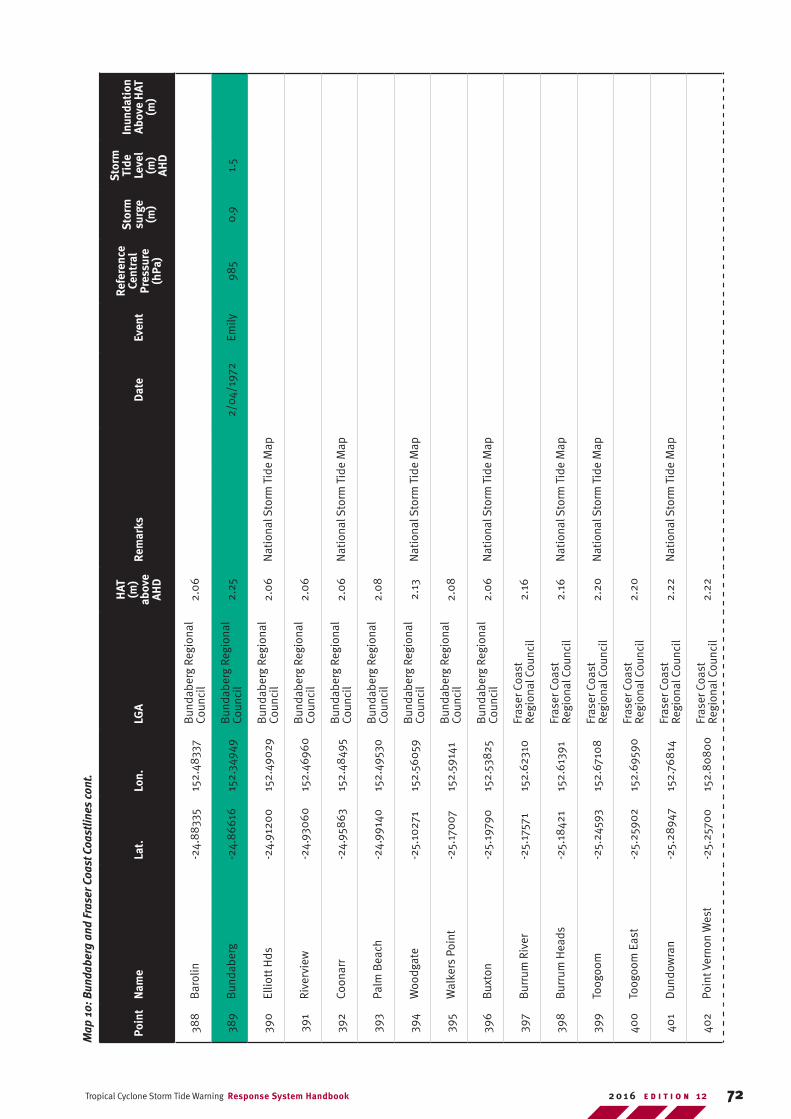
72Tropical Cyclone Storm Tide Warning Response System Handbook E D I T I O N 122 0 1 6
Poin
tN
ame
Lat.
Lon.
LGA
HAT
(m
) ab
ove
AHD
Rem
arks
Dat
eEv
ent
Refe
renc
e Ce
ntra
l Pr
essu
re
(hPa
)
Sto
rm
surg
e (m
)
Sto
rm
Tide
Le
vel
(m)
AHD
Inun
dati
on
Abov
e H
AT
(m)
388
Bar
olin
-24.
883
3515
2.48
337
Bun
dabe
rg R
egio
nal
Coun
cil
2.0
6
389
Bun
dabe
rg-2
4.8
6616
152.
3494
9B
unda
berg
Reg
iona
l Co
unci
l2.
252/
04/1
972
Emily
985
0.9
1.5
390
Ellio
tt H
ds-2
4.91
200
152.
4902
9B
unda
berg
Reg
iona
l Co
unci
l2.
06
Nat
iona
l Sto
rm T
ide
Map
391
Rive
rvie
w-2
4.93
060
152.
4696
0B
unda
berg
Reg
iona
l Co
unci
l2.
06
392
Coon
arr
-24.
958
6315
2.48
495
Bun
dabe
rg R
egio
nal
Coun
cil
2.0
6N
atio
nal S
torm
Tid
e M
ap
393
Palm
Bea
ch-2
4.99
140
152.
4953
0B
unda
berg
Reg
iona
l Co
unci
l2.
08
394
Woo
dgat
e-2
5.10
271
152.
560
59B
unda
berg
Reg
iona
l Co
unci
l2.
13N
atio
nal S
torm
Tid
e M
ap
395
Wal
kers
Poi
nt-2
5.17
007
152.
5914
1B
unda
berg
Reg
iona
l Co
unci
l2.
08
396
Bux
ton
-25.
1979
015
2.53
825
Bun
dabe
rg R
egio
nal
Coun
cil
2.0
6N
atio
nal S
torm
Tid
e M
ap
397
Bur
rum
Riv
er-2
5.17
571
152.
6231
0Fr
aser
Coa
st
Regi
onal
Cou
ncil
2.16
398
Bur
rum
Hea
ds-2
5.18
421
152.
6139
1Fr
aser
Coa
st
Regi
onal
Cou
ncil
2.16
Nat
iona
l Sto
rm T
ide
Map
399
Toog
oom
-25.
2459
315
2.67
108
Fras
er C
oast
Re
gion
al C
ounc
il2.
20N
atio
nal S
torm
Tid
e M
ap
400
Toog
oom
Eas
t-2
5.25
902
152.
6959
0Fr
aser
Coa
st
Regi
onal
Cou
ncil
2.20
401
Dun
dow
ran
-25.
2894
715
2.76
814
Fras
er C
oast
Re
gion
al C
ounc
il2.
22N
atio
nal S
torm
Tid
e M
ap
402
Poin
t Ver
non
Wes
t-2
5.25
700
152.
80
80
0Fr
aser
Coa
st
Regi
onal
Cou
ncil
2.22
Map
10:
Bun
dabe
rg a
nd F
rase
r Coa
st C
oast
lines
con
t.
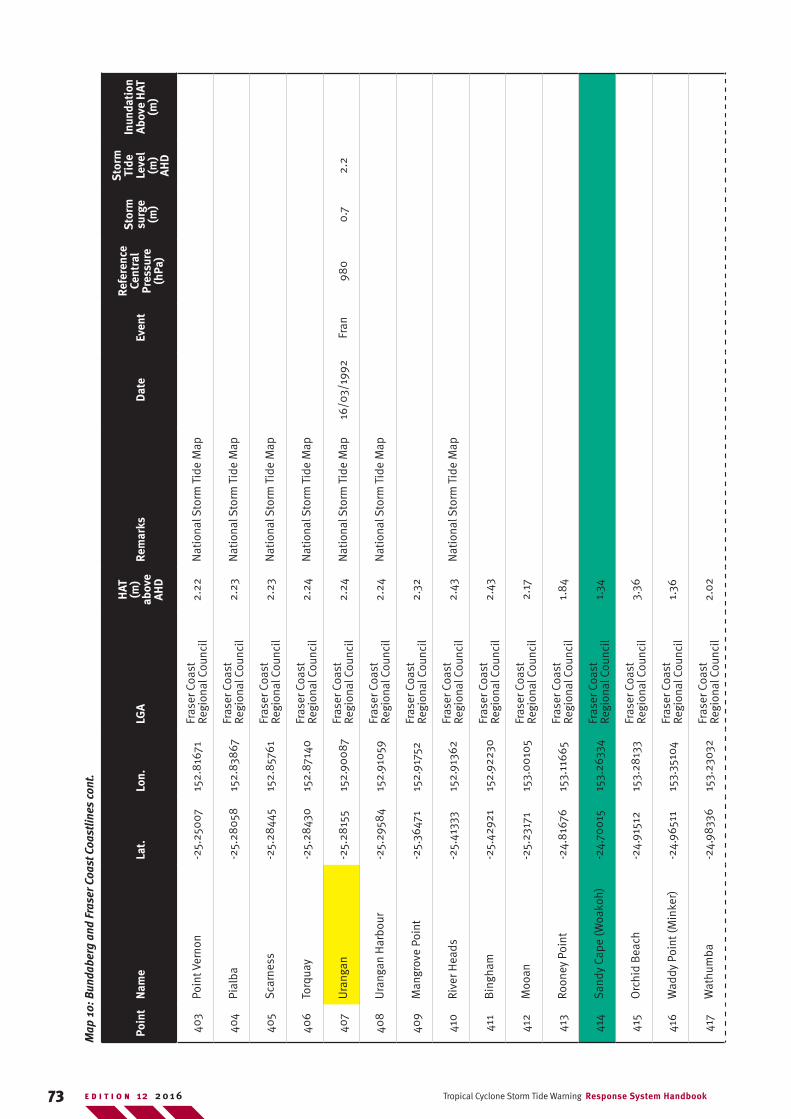
73 Tropical Cyclone Storm Tide Warning Response System HandbookE D I T I O N 12 2 0 1 6
Poin
tN
ame
Lat.
Lon.
LGA
HAT
(m
) ab
ove
AHD
Rem
arks
Dat
eEv
ent
Refe
renc
e Ce
ntra
l Pr
essu
re
(hPa
)
Sto
rm
surg
e (m
)
Sto
rm
Tide
Le
vel
(m)
AHD
Inun
dati
on
Abov
e H
AT
(m)
403
Poin
t Ver
non
-25.
250
0715
2.8
1671
Fras
er C
oast
Re
gion
al C
ounc
il2.
22N
atio
nal S
torm
Tid
e M
ap
404
Pial
ba-2
5.28
058
152.
838
67Fr
aser
Coa
st
Regi
onal
Cou
ncil
2.23
Nat
iona
l Sto
rm T
ide
Map
405
Sca
rnes
s-2
5.28
445
152.
8576
1Fr
aser
Coa
st
Regi
onal
Cou
ncil
2.23
Nat
iona
l Sto
rm T
ide
Map
406
Torq
uay
-25.
2843
015
2.87
140
Fras
er C
oast
Re
gion
al C
ounc
il2.
24N
atio
nal S
torm
Tid
e M
ap
407
Ura
ngan
-25.
2815
515
2.90
087
Fras
er C
oast
Re
gion
al C
ounc
il2.
24N
atio
nal S
torm
Tid
e M
ap16
/03/
1992
Fran
980
0.7
2.2
408
Ura
ngan
Har
bour
-25.
2958
415
2.91
059
Fras
er C
oast
Re
gion
al C
ounc
il2.
24N
atio
nal S
torm
Tid
e M
ap
409
Man
grov
e Po
int
-25.
3647
115
2.91
752
Fras
er C
oast
Re
gion
al C
ounc
il2.
32
410
Rive
r Hea
ds-2
5.41
333
152.
9136
2Fr
aser
Coa
st
Regi
onal
Cou
ncil
2.43
Nat
iona
l Sto
rm T
ide
Map
411
Bin
gham
-25.
4292
115
2.92
230
Fras
er C
oast
Re
gion
al C
ounc
il2.
43
412
Moo
an-2
5.23
171
153.
00
105
Fras
er C
oast
Re
gion
al C
ounc
il2.
17
413
Roon
ey P
oint
-24.
816
7615
3.11
665
Fras
er C
oast
Re
gion
al C
ounc
il1.
84
414
San
dy C
ape
(Woa
koh)
-24.
700
1515
3.26
334
Fras
er C
oast
Re
gion
al C
ounc
il1.
34
415
Orc
hid
Bea
ch-2
4.91
512
153.
2813
3Fr
aser
Coa
st
Regi
onal
Cou
ncil
3.36
416
Wad
dy P
oint
(Min
ker)
-24.
9651
115
3.35
104
Fras
er C
oast
Re
gion
al C
ounc
il1.
36
417
Wat
hum
ba-2
4.98
336
153.
2303
2Fr
aser
Coa
st
Regi
onal
Cou
ncil
2.02
Map
10:
Bun
dabe
rg a
nd F
rase
r Coa
st C
oast
lines
con
t.
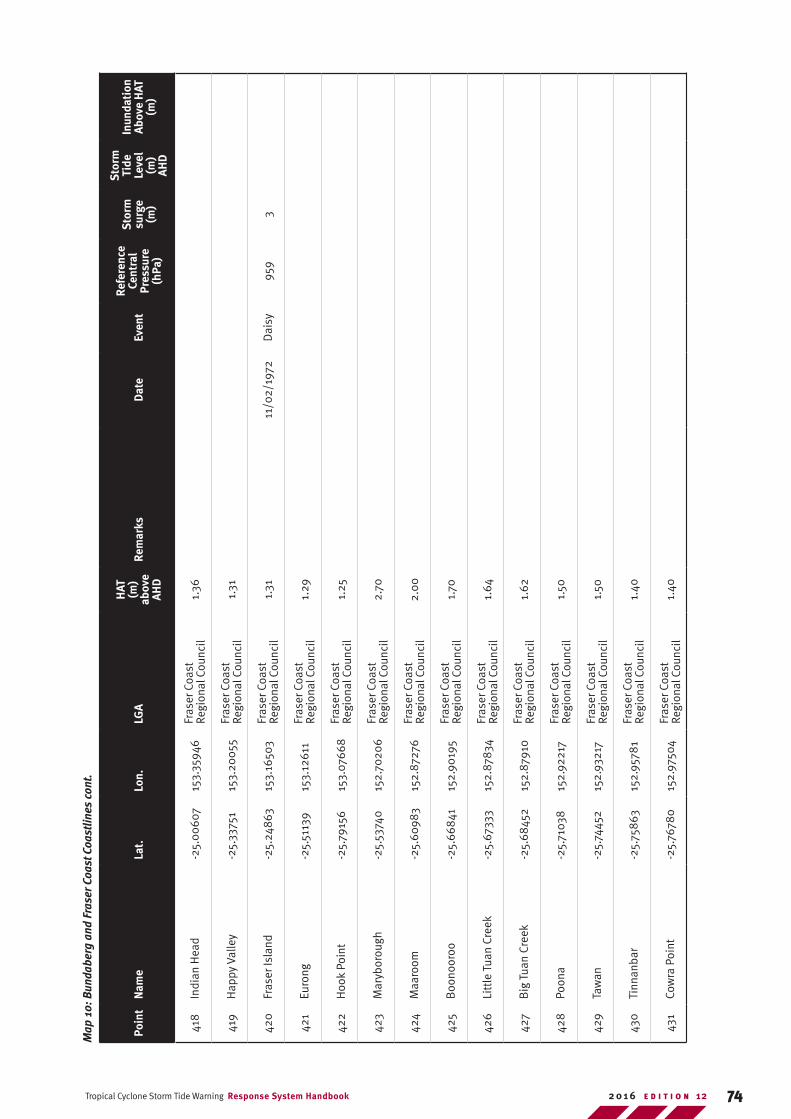
74Tropical Cyclone Storm Tide Warning Response System Handbook E D I T I O N 122 0 1 6
Poin
tN
ame
Lat.
Lon.
LGA
HAT
(m
) ab
ove
AHD
Rem
arks
Dat
eEv
ent
Refe
renc
e Ce
ntra
l Pr
essu
re
(hPa
)
Sto
rm
surg
e (m
)
Sto
rm
Tide
Le
vel
(m)
AHD
Inun
dati
on
Abov
e H
AT
(m)
418
Indi
an H
ead
-25.
00
607
153.
3594
6Fr
aser
Coa
st
Regi
onal
Cou
ncil
1.36
419
Hap
py V
alle
y-2
5.33
751
153.
200
55Fr
aser
Coa
st
Regi
onal
Cou
ncil
1.31
420
Fras
er Is
land
-25.
248
6315
3.16
503
Fras
er C
oast
Re
gion
al C
ounc
il1.
3111
/02/
1972
Dai
sy95
93
421
Euro
ng-2
5.51
139
153.
1261
1Fr
aser
Coa
st
Regi
onal
Cou
ncil
1.29
422
Hoo
k Po
int
-25.
7915
615
3.07
668
Fras
er C
oast
Re
gion
al C
ounc
il1.
25
423
Mar
ybor
ough
-25.
5374
015
2.70
206
Fras
er C
oast
Re
gion
al C
ounc
il2.
70
424
Maa
room
-25.
6098
315
2.87
276
Fras
er C
oast
Re
gion
al C
ounc
il2.
00
425
Boo
noor
oo-2
5.66
841
152.
9019
5Fr
aser
Coa
st
Regi
onal
Cou
ncil
1.70
426
Litt
le T
uan
Cree
k-2
5.67
333
152.
8783
4Fr
aser
Coa
st
Regi
onal
Cou
ncil
1.64
427
Big
Tua
n Cr
eek
-25.
6845
215
2.87
910
Fras
er C
oast
Re
gion
al C
ounc
il1.
62
428
Poon
a-2
5.71
038
152.
9221
7Fr
aser
Coa
st
Regi
onal
Cou
ncil
1.50
429
Taw
an-2
5.74
452
152.
9321
7Fr
aser
Coa
st
Regi
onal
Cou
ncil
1.50
430
Tinn
anba
r-2
5.75
863
152.
9578
1Fr
aser
Coa
st
Regi
onal
Cou
ncil
1.40
431
Cow
ra P
oint
-25.
7678
015
2.97
504
Fras
er C
oast
Re
gion
al C
ounc
il1.
40
Map
10:
Bun
dabe
rg a
nd F
rase
r Coa
st C
oast
lines
con
t.
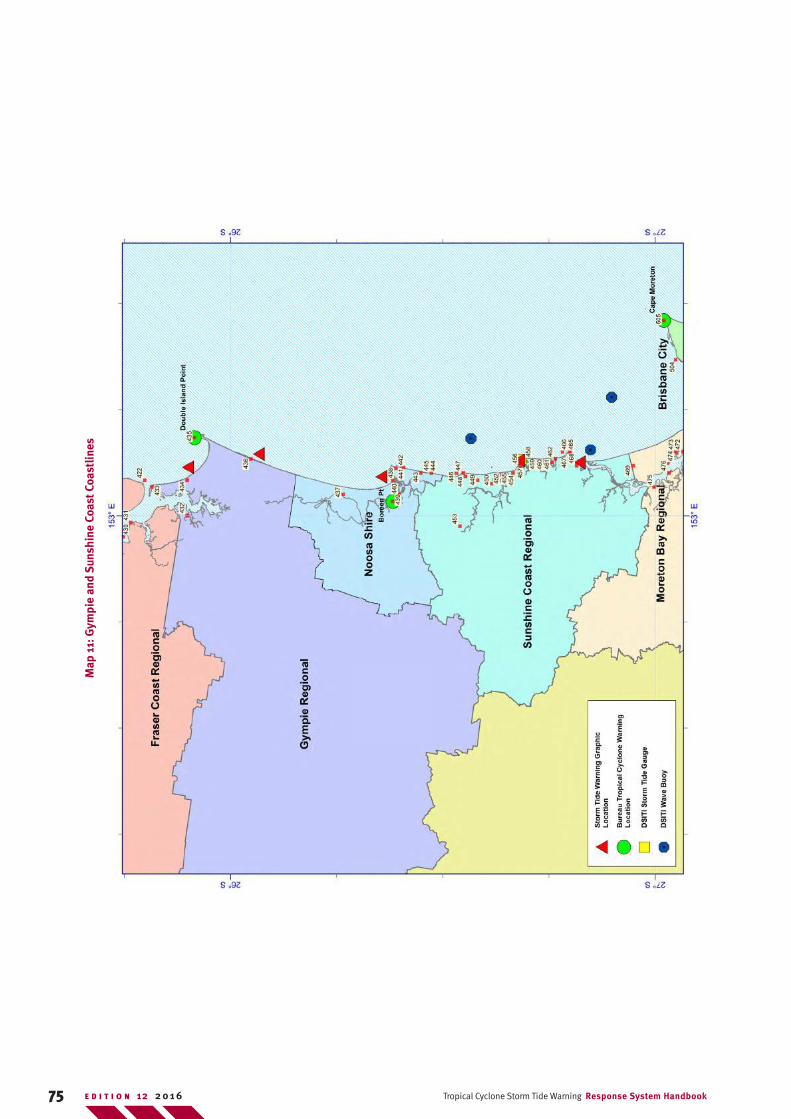
75 Tropical Cyclone Storm Tide Warning Response System HandbookE D I T I O N 12 2 0 1 6
Map
11:
Gym
pie
and
Suns
hine
Coa
st C
oast
lines
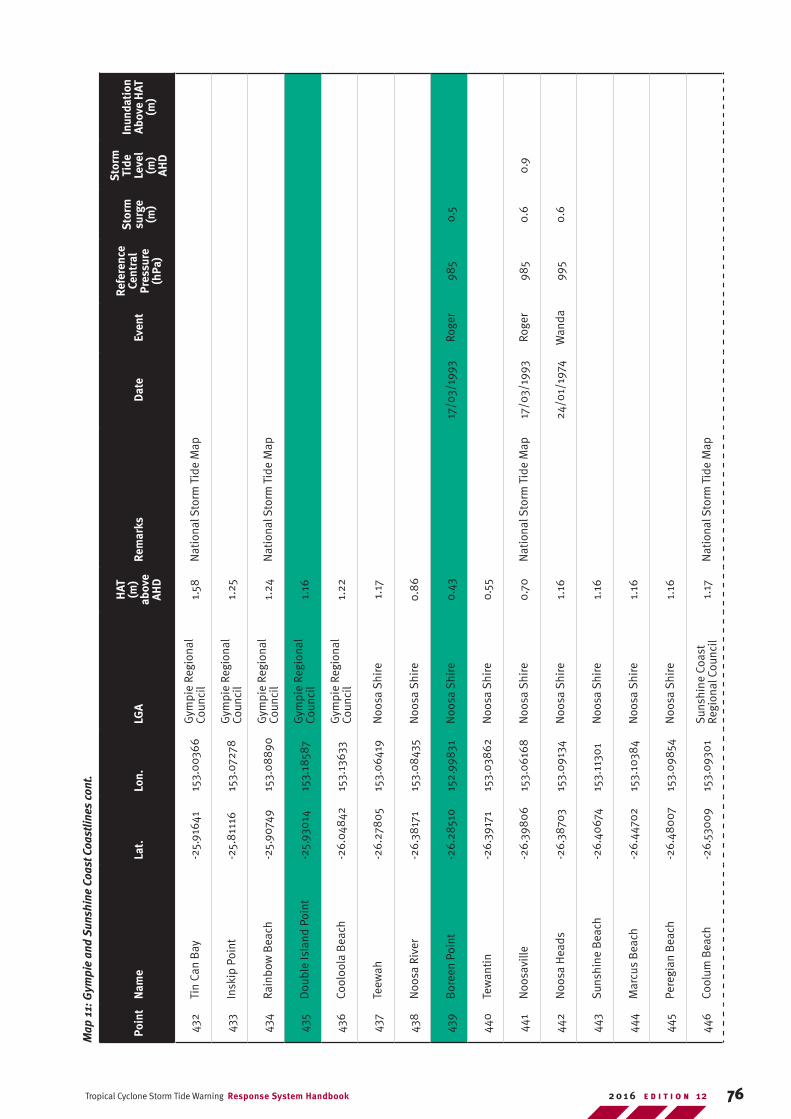
76Tropical Cyclone Storm Tide Warning Response System Handbook E D I T I O N 122 0 1 6
Poin
tN
ame
Lat.
Lon.
LGA
HAT
(m
) ab
ove
AHD
Rem
arks
Dat
eEv
ent
Refe
renc
e Ce
ntra
l Pr
essu
re
(hPa
)
Sto
rm
surg
e (m
)
Sto
rm
Tide
Le
vel
(m)
AHD
Inun
dati
on
Abov
e H
AT
(m)
432
Tin
Can
Bay
-25.
9164
115
3.0
0366
Gym
pie
Regi
onal
Co
unci
l1.
58N
atio
nal S
torm
Tid
e M
ap
433
Insk
ip P
oint
-25.
811
1615
3.07
278
Gym
pie
Regi
onal
Co
unci
l1.
25
434
Rain
bow
Bea
ch-2
5.90
749
153.
08
890
Gym
pie
Regi
onal
Co
unci
l1.
24N
atio
nal S
torm
Tid
e M
ap
435
Dou
ble
Isla
nd P
oint
-25.
930
1415
3.18
587
Gym
pie
Regi
onal
Co
unci
l1.
16
436
Cool
oola
Bea
ch-2
6.04
842
153.
1363
3G
ympi
e Re
gion
al
Coun
cil
1.22
437
Teew
ah-2
6.27
80
515
3.0
6419
Noo
sa S
hire
1.17
438
Noo
sa R
iver
-26.
3817
115
3.0
843
5N
oosa
Shi
re0.
86
439
Bor
een
Poin
t-2
6.28
510
152.
9983
1N
oosa
Shi
re0.
4317
/03/
1993
Roge
r98
50.
5
440
Tew
anti
n-2
6.39
171
153.
038
62N
oosa
Shi
re0.
55
441
Noo
savi
lle-2
6.39
80
615
3.0
6168
Noo
sa S
hire
0.70
Nat
iona
l Sto
rm T
ide
Map
17/0
3/19
93Ro
ger
985
0.6
0.9
442
Noo
sa H
eads
-26.
3870
315
3.09
134
Noo
sa S
hire
1.16
24/0
1/19
74W
anda
995
0.6
443
Suns
hine
Bea
ch-2
6.40
674
153.
1130
1N
oosa
Shi
re1.
16
444
Mar
cus
Bea
ch-2
6.44
702
153.
1038
4N
oosa
Shi
re1.
16
445
Pere
gian
Bea
ch-2
6.48
007
153.
0985
4N
oosa
Shi
re1.
16
446
Cool
um B
each
-26.
530
0915
3.09
301
Suns
hine
Coa
st
Regi
onal
Cou
ncil
1.17
Nat
iona
l Sto
rm T
ide
Map
Map
11:
Gym
pie
and
Sun
shin
e Co
ast C
oast
lines
con
t.
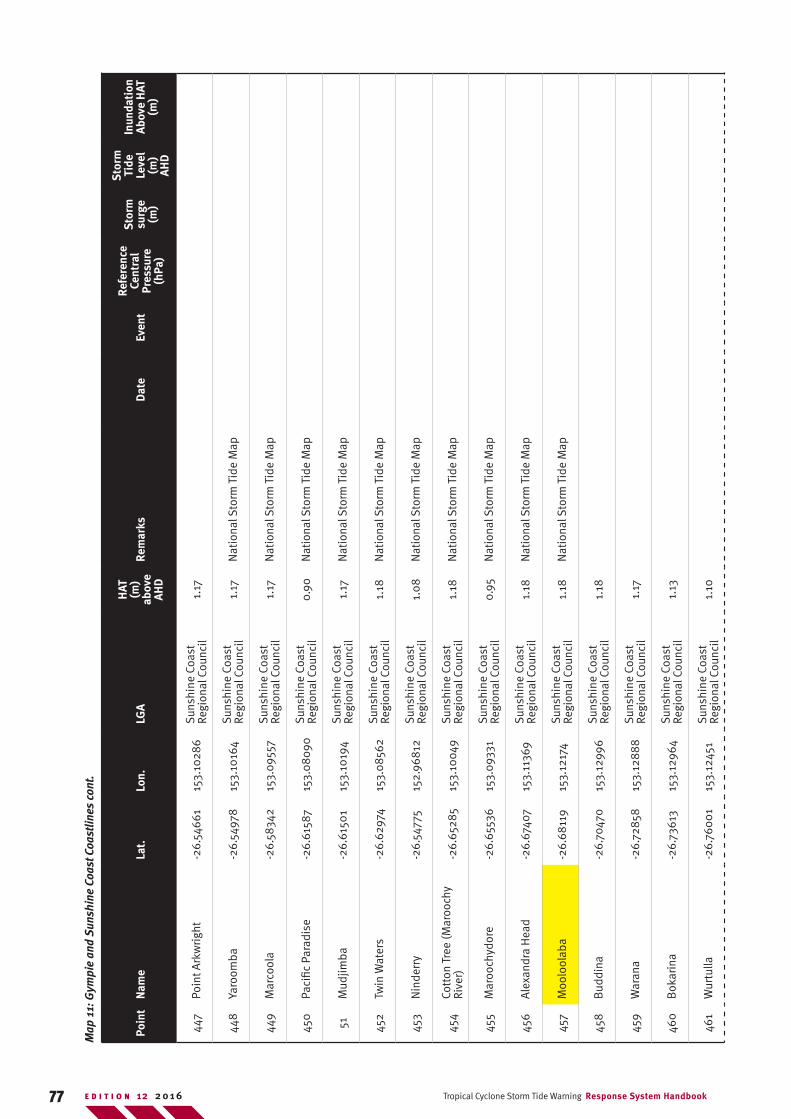
77 Tropical Cyclone Storm Tide Warning Response System HandbookE D I T I O N 12 2 0 1 6
Poin
tN
ame
Lat.
Lon.
LGA
HAT
(m
) ab
ove
AHD
Rem
arks
Dat
eEv
ent
Refe
renc
e Ce
ntra
l Pr
essu
re
(hPa
)
Sto
rm
surg
e (m
)
Sto
rm
Tide
Le
vel
(m)
AHD
Inun
dati
on
Abov
e H
AT
(m)
447
Poin
t Ark
wri
ght
-26.
5466
115
3.10
286
Suns
hine
Coa
st
Regi
onal
Cou
ncil
1.17
448
Yaro
omba
-26.
5497
815
3.10
164
Suns
hine
Coa
st
Regi
onal
Cou
ncil
1.17
Nat
iona
l Sto
rm T
ide
Map
449
Mar
cool
a-2
6.58
342
153.
0955
7Su
nshi
ne C
oast
Re
gion
al C
ounc
il1.
17N
atio
nal S
torm
Tid
e M
ap
450
Paci
fic P
arad
ise
-26.
6158
715
3.0
809
0Su
nshi
ne C
oast
Re
gion
al C
ounc
il0.
90N
atio
nal S
torm
Tid
e M
ap
51M
udjim
ba-2
6.61
501
153.
1019
4Su
nshi
ne C
oast
Re
gion
al C
ounc
il1.
17N
atio
nal S
torm
Tid
e M
ap
452
Twin
Wat
ers
-26.
6297
415
3.0
8562
Suns
hine
Coa
st
Regi
onal
Cou
ncil
1.18
Nat
iona
l Sto
rm T
ide
Map
453
Nin
derr
y-2
6.54
775
152.
968
12Su
nshi
ne C
oast
Re
gion
al C
ounc
il1.
08
Nat
iona
l Sto
rm T
ide
Map
454
Cott
on T
ree
(Mar
ooch
y Ri
ver)
-26.
6528
515
3.10
049
Suns
hine
Coa
st
Regi
onal
Cou
ncil
1.18
Nat
iona
l Sto
rm T
ide
Map
455
Mar
ooch
ydor
e-2
6.65
536
153.
0933
1Su
nshi
ne C
oast
Re
gion
al C
ounc
il0.
95N
atio
nal S
torm
Tid
e M
ap
456
Ale
xand
ra H
ead
-26.
6740
715
3.11
369
Suns
hine
Coa
st
Regi
onal
Cou
ncil
1.18
Nat
iona
l Sto
rm T
ide
Map
457
Moo
lool
aba
-26.
6811
915
3.12
174
Suns
hine
Coa
st
Regi
onal
Cou
ncil
1.18
Nat
iona
l Sto
rm T
ide
Map
458
Bud
dina
-26.
7047
015
3.12
996
Suns
hine
Coa
st
Regi
onal
Cou
ncil
1.18
459
War
ana
-26.
7285
815
3.12
88
8Su
nshi
ne C
oast
Re
gion
al C
ounc
il1.
17
460
Bok
arin
a-2
6.73
613
153.
1296
4Su
nshi
ne C
oast
Re
gion
al C
ounc
il1.
13
461
Wur
tulla
-26.
760
01
153.
1245
1Su
nshi
ne C
oast
Re
gion
al C
ounc
il1.
10
Map
11:
Gym
pie
and
Sun
shin
e Co
ast C
oast
lines
con
t.
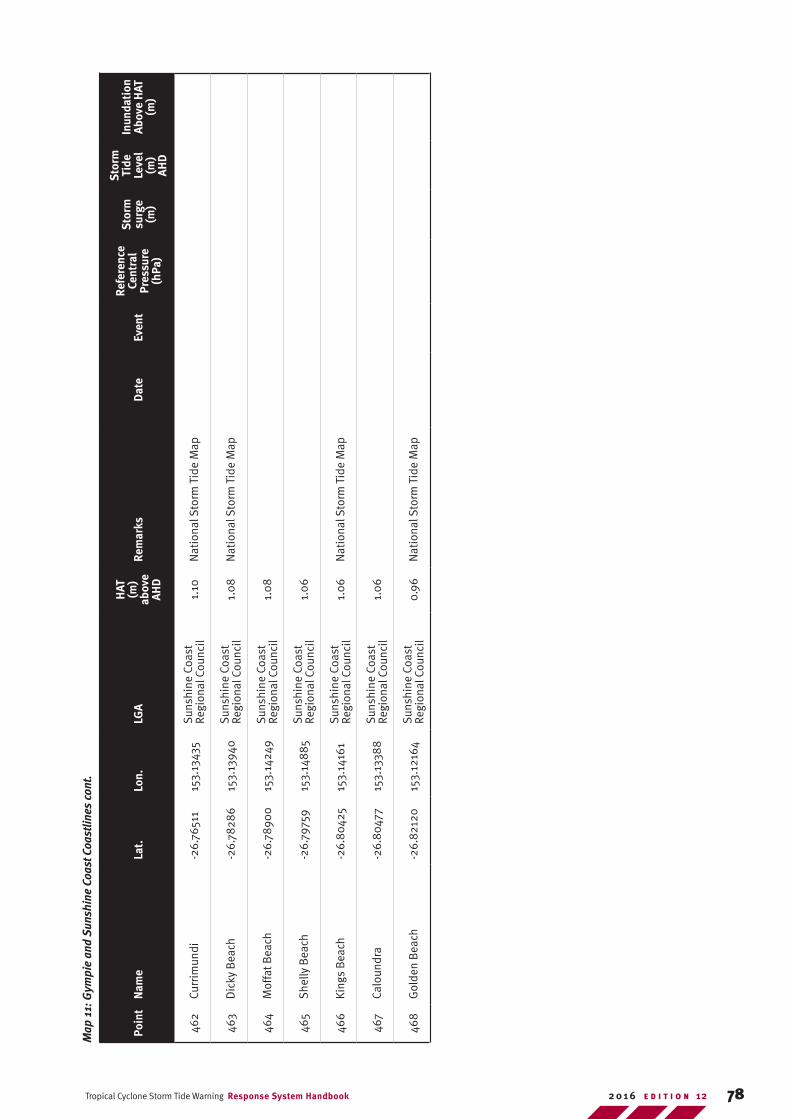
78Tropical Cyclone Storm Tide Warning Response System Handbook E D I T I O N 122 0 1 6
Poin
tN
ame
Lat.
Lon.
LGA
HAT
(m
) ab
ove
AHD
Rem
arks
Dat
eEv
ent
Refe
renc
e Ce
ntra
l Pr
essu
re
(hPa
)
Sto
rm
surg
e (m
)
Sto
rm
Tide
Le
vel
(m)
AHD
Inun
dati
on
Abov
e H
AT
(m)
462
Curr
imun
di-2
6.76
511
153.
1343
5Su
nshi
ne C
oast
Re
gion
al C
ounc
il1.
10N
atio
nal S
torm
Tid
e M
ap
463
Dic
ky B
each
-26.
7828
615
3.13
940
Suns
hine
Coa
st
Regi
onal
Cou
ncil
1.0
8N
atio
nal S
torm
Tid
e M
ap
464
Mof
fat B
each
-26.
7890
015
3.14
249
Suns
hine
Coa
st
Regi
onal
Cou
ncil
1.0
8
465
She
lly B
each
-26.
7975
915
3.14
885
Suns
hine
Coa
st
Regi
onal
Cou
ncil
1.0
6
466
King
s B
each
-26.
804
2515
3.14
161
Suns
hine
Coa
st
Regi
onal
Cou
ncil
1.0
6N
atio
nal S
torm
Tid
e M
ap
467
Calo
undr
a-2
6.8
0477
153.
1338
8Su
nshi
ne C
oast
Re
gion
al C
ounc
il1.
06
468
Gol
den
Bea
ch-2
6.82
120
153.
1216
4Su
nshi
ne C
oast
Re
gion
al C
ounc
il 0.
96N
atio
nal S
torm
Tid
e M
ap
Map
11:
Gym
pie
and
Sun
shin
e Co
ast C
oast
lines
con
t.
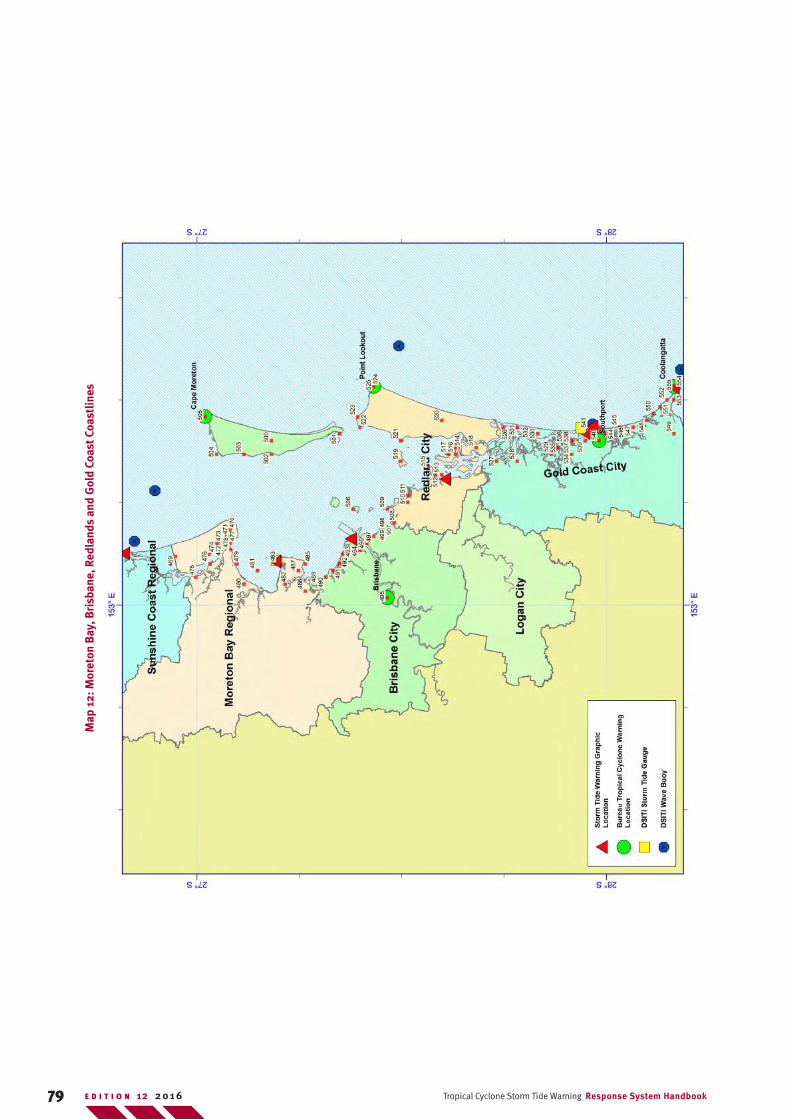
79 Tropical Cyclone Storm Tide Warning Response System HandbookE D I T I O N 12 2 0 1 6
Map
12:
Mor
eton
Bay
, Bri
sban
e, R
edla
nds
and
Gol
d Co
ast C
oast
lines
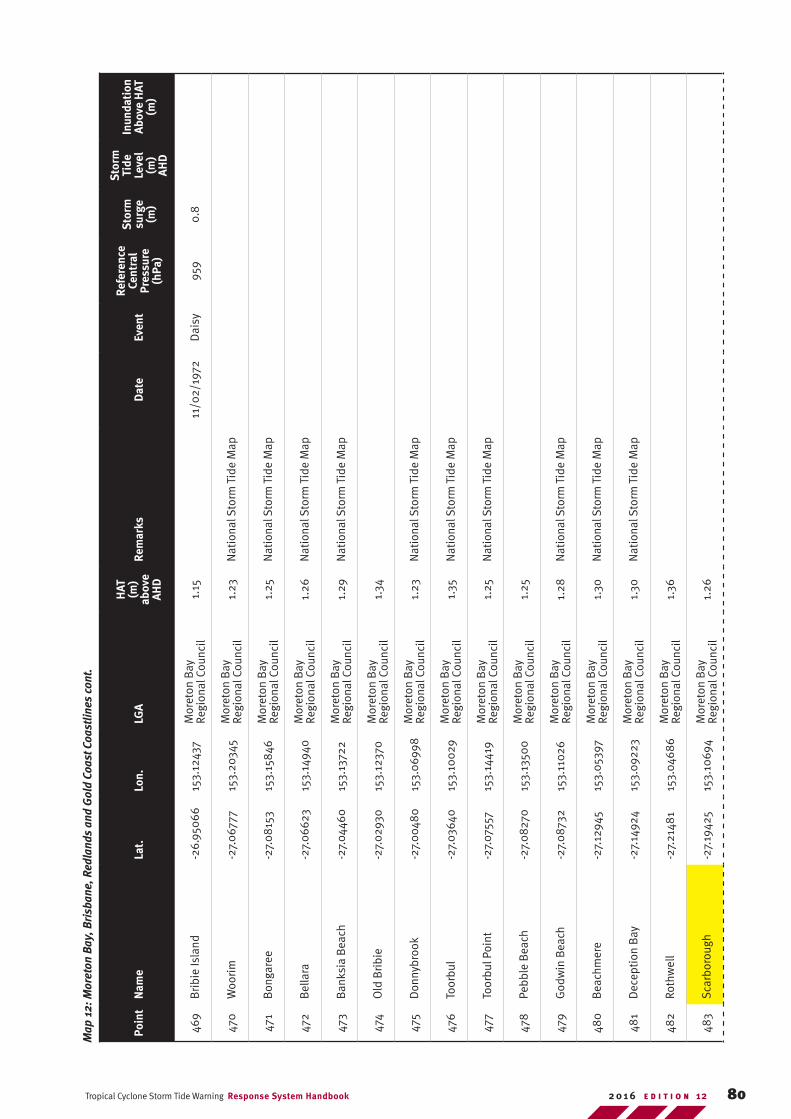
80Tropical Cyclone Storm Tide Warning Response System Handbook E D I T I O N 122 0 1 6
Poin
tN
ame
Lat.
Lon.
LGA
HAT
(m
) ab
ove
AHD
Rem
arks
Dat
eEv
ent
Refe
renc
e Ce
ntra
l Pr
essu
re
(hPa
)
Sto
rm
surg
e (m
)
Sto
rm
Tide
Le
vel
(m)
AHD
Inun
dati
on
Abov
e H
AT
(m)
469
Bri
bie
Isla
nd-2
6.95
066
153.
1243
7M
oret
on B
ay
Regi
onal
Cou
ncil
1.15
11/0
2/19
72D
aisy
959
0.8
470
Woo
rim
-27.
067
7715
3.20
345
Mor
eton
Bay
Re
gion
al C
ounc
il1.
23N
atio
nal S
torm
Tid
e M
ap
471
Bon
gare
e-2
7.0
815
315
3.15
846
Mor
eton
Bay
Re
gion
al C
ounc
il1.
25N
atio
nal S
torm
Tid
e M
ap
472
Bel
lara
-27.
066
2315
3.14
940
Mor
eton
Bay
Re
gion
al C
ounc
il1.
26N
atio
nal S
torm
Tid
e M
ap
473
Ban
ksia
Bea
ch-2
7.04
460
153.
1372
2M
oret
on B
ay
Regi
onal
Cou
ncil
1.29
Nat
iona
l Sto
rm T
ide
Map
474
Old
Bri
bie
-27.
0293
015
3.12
370
Mor
eton
Bay
Re
gion
al C
ounc
il1.
34
475
Don
nybr
ook
-27.
004
80
153.
069
98M
oret
on B
ay
Regi
onal
Cou
ncil
1.23
Nat
iona
l Sto
rm T
ide
Map
476
Toor
bul
-27.
0364
015
3.10
029
Mor
eton
Bay
Re
gion
al C
ounc
il1.
35N
atio
nal S
torm
Tid
e M
ap
477
Toor
bul P
oint
-27.
0755
715
3.14
419
Mor
eton
Bay
Re
gion
al C
ounc
il1.
25N
atio
nal S
torm
Tid
e M
ap
478
Pebb
le B
each
-27.
082
7015
3.13
500
Mor
eton
Bay
Re
gion
al C
ounc
il1.
25
479
God
win
Bea
ch-2
7.0
8732
153.
1102
6M
oret
on B
ay
Regi
onal
Cou
ncil
1.28
Nat
iona
l Sto
rm T
ide
Map
480
Bea
chm
ere
-27.
1294
515
3.0
5397
Mor
eton
Bay
Re
gion
al C
ounc
il1.
30N
atio
nal S
torm
Tid
e M
ap
481
Dec
epti
on B
ay-2
7.14
924
153.
0922
3M
oret
on B
ay
Regi
onal
Cou
ncil
1.30
Nat
iona
l Sto
rm T
ide
Map
482
Roth
wel
l-2
7.21
481
153.
0468
6M
oret
on B
ay
Regi
onal
Cou
ncil
1.36
483
Sca
rbor
ough
-27.
1942
515
3.10
694
Mor
eton
Bay
Re
gion
al C
ounc
il1.
26
Map
12:
Mor
eton
Bay
, Bri
sban
e, R
edla
nds
and
Gol
d Co
ast C
oast
lines
con
t.
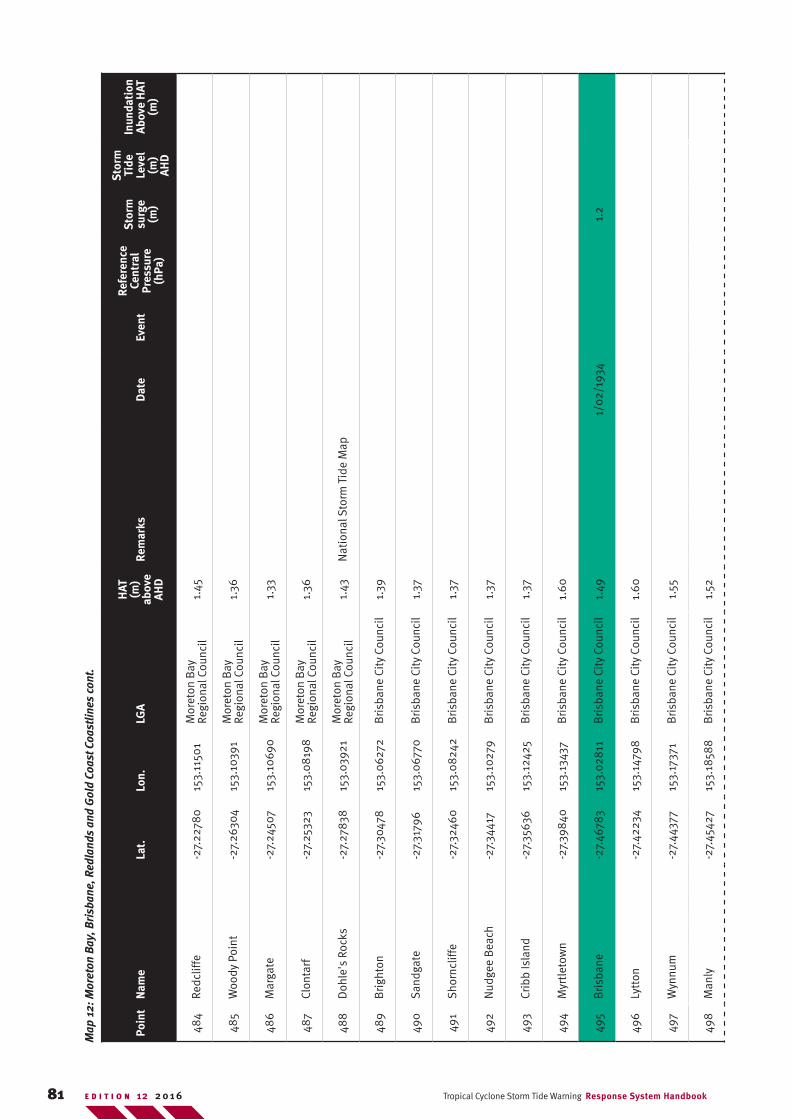
81 Tropical Cyclone Storm Tide Warning Response System HandbookE D I T I O N 12 2 0 1 6
Poin
tN
ame
Lat.
Lon.
LGA
HAT
(m
) ab
ove
AHD
Rem
arks
Dat
eEv
ent
Refe
renc
e Ce
ntra
l Pr
essu
re
(hPa
)
Sto
rm
surg
e (m
)
Sto
rm
Tide
Le
vel
(m)
AHD
Inun
dati
on
Abov
e H
AT
(m)
484
Redc
liffe
-27.
2278
015
3.11
501
Mor
eton
Bay
Re
gion
al C
ounc
il1.
45
485
Woo
dy P
oint
-27.
2630
415
3.10
391
Mor
eton
Bay
Re
gion
al C
ounc
il1.
36
486
Mar
gate
-27.
2450
715
3.10
690
Mor
eton
Bay
Re
gion
al C
ounc
il1.
33
487
Clon
tarf
-27.
2532
315
3.0
819
8M
oret
on B
ay
Regi
onal
Cou
ncil
1.36
488
Doh
le's
Roc
ks-2
7.27
838
153.
0392
1M
oret
on B
ay
Regi
onal
Cou
ncil
1.43
Nat
iona
l Sto
rm T
ide
Map
489
Bri
ghto
n-2
7.30
478
153.
062
72B
risba
ne C
ity
Coun
cil
1.39
490
San
dgat
e-2
7.31
796
153.
067
70B
risba
ne C
ity
Coun
cil
1.37
491
Sho
rncl
iffe
-27.
3246
015
3.0
8242
Bris
bane
Cit
y Co
unci
l1.
37
492
Nud
gee
Bea
ch-2
7.34
417
153.
1027
9B
risba
ne C
ity
Coun
cil
1.37
493
Crib
b Is
land
-27.
3563
615
3.12
425
Bris
bane
Cit
y Co
unci
l1.
37
494
Myr
tleto
wn
-27.
398
4015
3.13
437
Bris
bane
Cit
y Co
unci
l1.
60
495
Bris
bane
-27.
4678
315
3.02
811
Bris
bane
Cit
y Co
unci
l1.
491/
02/1
934
1.2
496
Lytt
on-2
7.42
234
153.
1479
8B
risba
ne C
ity
Coun
cil
1.60
497
Wyn
num
-27.
4437
715
3.17
371
Bris
bane
Cit
y Co
unci
l1.
55
498
Man
ly-2
7.45
427
153.
1858
8B
risba
ne C
ity
Coun
cil
1.52
Map
12:
Mor
eton
Bay
, Bri
sban
e, R
edla
nds
and
Gol
d Co
ast C
oast
lines
con
t.
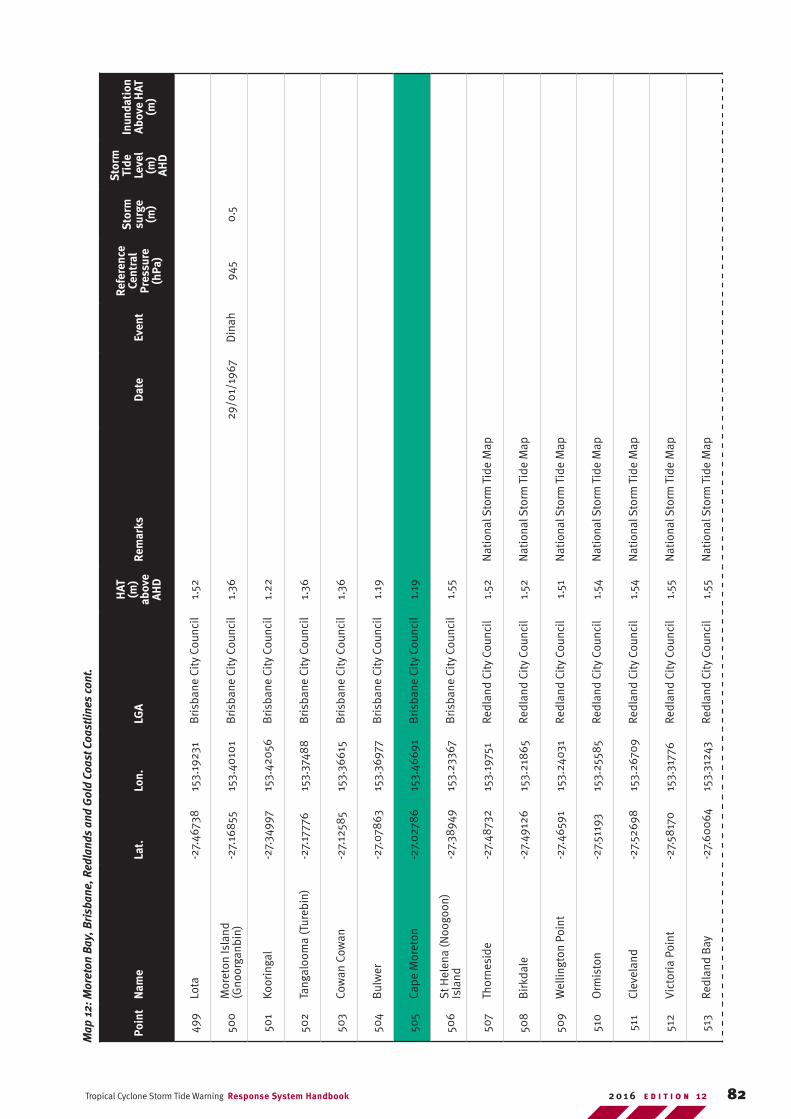
82Tropical Cyclone Storm Tide Warning Response System Handbook E D I T I O N 122 0 1 6
Poin
tN
ame
Lat.
Lon.
LGA
HAT
(m
) ab
ove
AHD
Rem
arks
Dat
eEv
ent
Refe
renc
e Ce
ntra
l Pr
essu
re
(hPa
)
Sto
rm
surg
e (m
)
Sto
rm
Tide
Le
vel
(m)
AHD
Inun
dati
on
Abov
e H
AT
(m)
499
Lota
-27.
4673
815
3.19
231
Bris
bane
Cit
y Co
unci
l1.
52
500
Mor
eton
Isla
nd
(Gno
orga
nbin
)-2
7.16
855
153.
4010
1B
risba
ne C
ity
Coun
cil
1.36
29/0
1/19
67D
inah
945
0.5
501
Koor
inga
l-2
7.34
997
153.
420
56B
risba
ne C
ity
Coun
cil
1.22
502
Tang
aloo
ma
(Tur
ebin
)-2
7.17
776
153.
3748
8B
risba
ne C
ity
Coun
cil
1.36
503
Cow
an C
owan
-27.
1258
515
3.36
615
Bris
bane
Cit
y Co
unci
l1.
36
504
Bul
wer
-27.
078
6315
3.36
977
Bris
bane
Cit
y Co
unci
l1.
19
505
Cape
Mor
eton
-27.
0278
615
3.46
691
Bris
bane
Cit
y Co
unci
l1.
19
506
St H
elen
a (N
oogo
on)
Isla
nd-2
7.38
949
153.
2336
7B
risba
ne C
ity
Coun
cil
1.55
507
Thor
nesi
de-2
7.48
732
153.
1975
1Re
dlan
d Ci
ty C
ounc
il1.
52N
atio
nal S
torm
Tid
e M
ap
508
Bir
kdal
e-2
7.49
126
153.
218
65Re
dlan
d Ci
ty C
ounc
il1.
52N
atio
nal S
torm
Tid
e M
ap
509
Wel
lingt
on P
oint
-27.
4659
115
3.24
031
Redl
and
City
Cou
ncil
1.51
Nat
iona
l Sto
rm T
ide
Map
510
Orm
isto
n-2
7.51
193
153.
2558
5Re
dlan
d Ci
ty C
ounc
il1.
54N
atio
nal S
torm
Tid
e M
ap
511
Clev
elan
d-2
7.52
698
153.
2670
9Re
dlan
d Ci
ty C
ounc
il1.
54N
atio
nal S
torm
Tid
e M
ap
512
Vict
oria
Poi
nt-2
7.58
170
153.
3177
6Re
dlan
d Ci
ty C
ounc
il1.
55N
atio
nal S
torm
Tid
e M
ap
513
Redl
and
Bay
-27.
600
6415
3.31
243
Redl
and
City
Cou
ncil
1.55
Nat
iona
l Sto
rm T
ide
Map
Map
12:
Mor
eton
Bay
, Bri
sban
e, R
edla
nds
and
Gol
d Co
ast C
oast
lines
con
t.
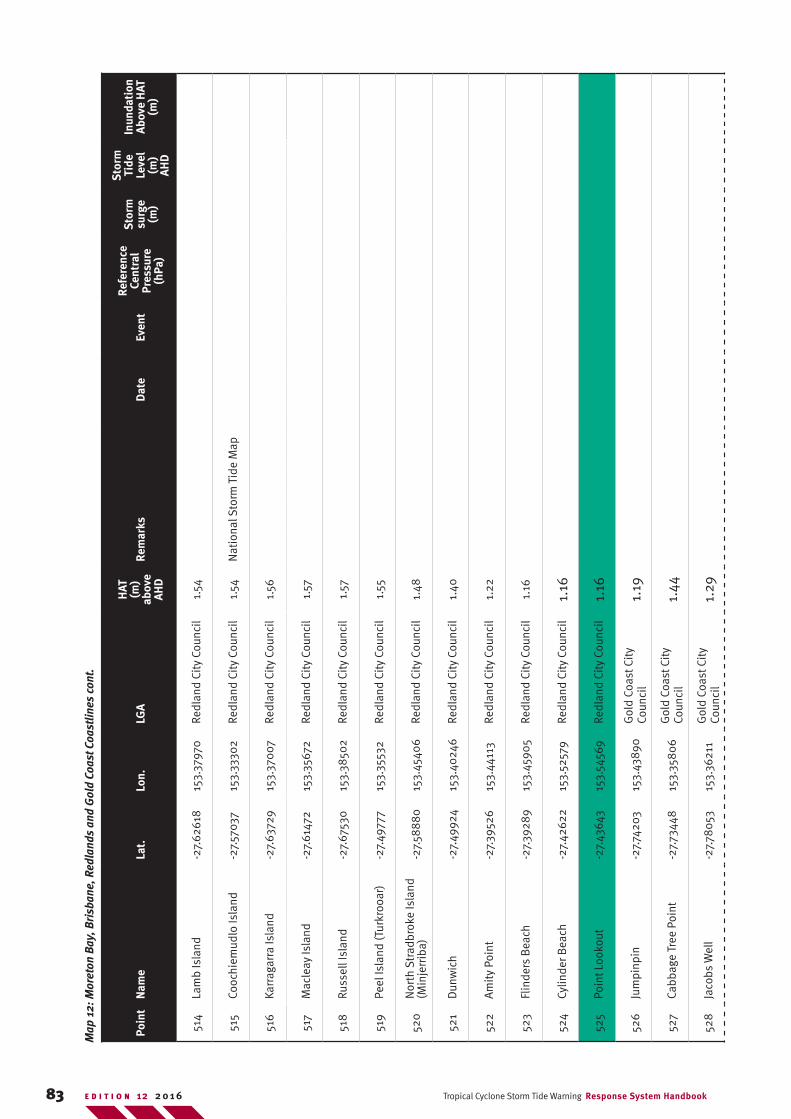
83 Tropical Cyclone Storm Tide Warning Response System HandbookE D I T I O N 12 2 0 1 6
Poin
tN
ame
Lat.
Lon.
LGA
HAT
(m
) ab
ove
AHD
Rem
arks
Dat
eEv
ent
Refe
renc
e Ce
ntra
l Pr
essu
re
(hPa
)
Sto
rm
surg
e (m
)
Sto
rm
Tide
Le
vel
(m)
AHD
Inun
dati
on
Abov
e H
AT
(m)
514
Lam
b Is
land
-27.
6261
815
3.37
970
Redl
and
City
Cou
ncil
1.54
515
Cooc
hiem
udlo
Isla
nd-2
7.57
037
153.
3330
2Re
dlan
d Ci
ty C
ounc
il1.
54N
atio
nal S
torm
Tid
e M
ap
516
Karr
agar
ra Is
land
-27.
6372
915
3.37
007
Redl
and
City
Cou
ncil
1.56
517
Mac
leay
Isla
nd-2
7.61
472
153.
3567
2Re
dlan
d Ci
ty C
ounc
il1.
57
518
Russ
ell I
slan
d-2
7.67
530
153.
3850
2Re
dlan
d Ci
ty C
ounc
il1.
57
519
Peel
Isla
nd (T
urkr
ooar
)-2
7.49
777
153.
3553
2Re
dlan
d Ci
ty C
ounc
il1.
55
520
Nor
th S
trad
brok
e Is
land
(M
inje
rrib
a)-2
7.58
88
015
3.45
406
Redl
and
City
Cou
ncil
1.48
521
Dun
wic
h-2
7.49
924
153.
4024
6Re
dlan
d Ci
ty C
ounc
il1.
40
522
Am
ity
Poin
t-2
7.39
526
153.
4411
3Re
dlan
d Ci
ty C
ounc
il1.
22
523
Flin
ders
Bea
ch-2
7.39
289
153.
4590
5Re
dlan
d Ci
ty C
ounc
il1.
16
524
Cylin
der B
each
-27.
4262
215
3.52
579
Redl
and
City
Cou
ncil
1.16
525
Poin
t Loo
kout
-27.
4364
315
3.54
569
Redl
and
City
Cou
ncil
1.16
526
Jum
pinp
in-2
7.74
203
153.
4389
0G
old
Coas
t Cit
y Co
unci
l1.
19
527
Cabb
age
Tree
Poi
nt-2
7.73
448
153.
358
06
Gol
d Co
ast C
ity
Coun
cil
1.44
528
Jaco
bs W
ell
-27.
780
5315
3.36
211
Gol
d Co
ast C
ity
Coun
cil
1.29
Map
12:
Mor
eton
Bay
, Bri
sban
e, R
edla
nds
and
Gol
d Co
ast C
oast
lines
con
t.
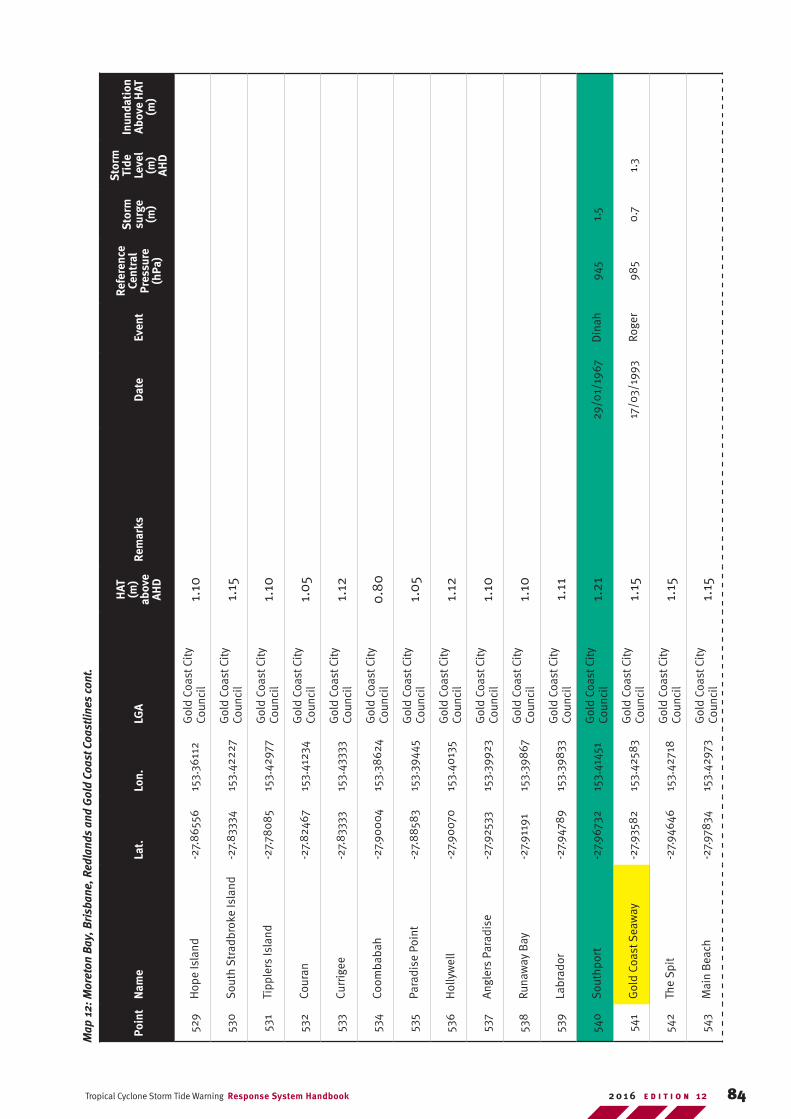
84Tropical Cyclone Storm Tide Warning Response System Handbook E D I T I O N 122 0 1 6
Poin
tN
ame
Lat.
Lon.
LGA
HAT
(m
) ab
ove
AHD
Rem
arks
Dat
eEv
ent
Refe
renc
e Ce
ntra
l Pr
essu
re
(hPa
)
Sto
rm
surg
e (m
)
Sto
rm
Tide
Le
vel
(m)
AHD
Inun
dati
on
Abov
e H
AT
(m)
529
Hop
e Is
land
-27.
865
5615
3.36
112
Gol
d Co
ast C
ity
Coun
cil
1.10
530
Sou
th S
trad
brok
e Is
land
-27.
8333
415
3.42
227
Gol
d Co
ast C
ity
Coun
cil
1.15
531
Tipp
lers
Isla
nd-2
7.78
085
153.
4297
7G
old
Coas
t Cit
y Co
unci
l1.
10
532
Cour
an-2
7.82
467
153.
4123
4G
old
Coas
t Cit
y Co
unci
l1.
05
533
Curr
igee
-27.
8333
315
3.43
333
Gol
d Co
ast C
ity
Coun
cil
1.12
534
Coom
baba
h-2
7.90
004
153.
3862
4G
old
Coas
t Cit
y Co
unci
l0.
80
535
Para
dise
Poi
nt-2
7.8
8583
153.
3944
5G
old
Coas
t Cit
y Co
unci
l1.
05
536
Hol
lyw
ell
-27.
9007
015
3.40
135
Gol
d Co
ast C
ity
Coun
cil
1.12
537
Ang
lers
Par
adis
e-2
7.92
533
153.
3992
3G
old
Coas
t Cit
y Co
unci
l1.
10
538
Runa
way
Bay
-27.
9119
115
3.39
867
Gol
d Co
ast C
ity
Coun
cil
1.10
539
Labr
ador
-27.
9478
915
3.39
833
Gol
d Co
ast C
ity
Coun
cil
1.11
540
Sou
thpo
rt-2
7.96
732
153.
4145
1G
old
Coas
t Cit
y Co
unci
l1.
2129
/01/
1967
Din
ah94
51.
5
541
Gol
d Co
ast S
eaw
ay-2
7.93
582
153.
4258
3G
old
Coas
t Cit
y Co
unci
l1.
1517
/03/
1993
Roge
r98
50.
71.
3
542
The
Spit
-27.
9464
615
3.42
718
Gol
d Co
ast C
ity
Coun
cil
1.15
543
Mai
n B
each
-27.
9783
415
3.42
973
Gol
d Co
ast C
ity
Coun
cil
1.15
Map
12:
Mor
eton
Bay
, Bri
sban
e, R
edla
nds
and
Gol
d Co
ast C
oast
lines
con
t.
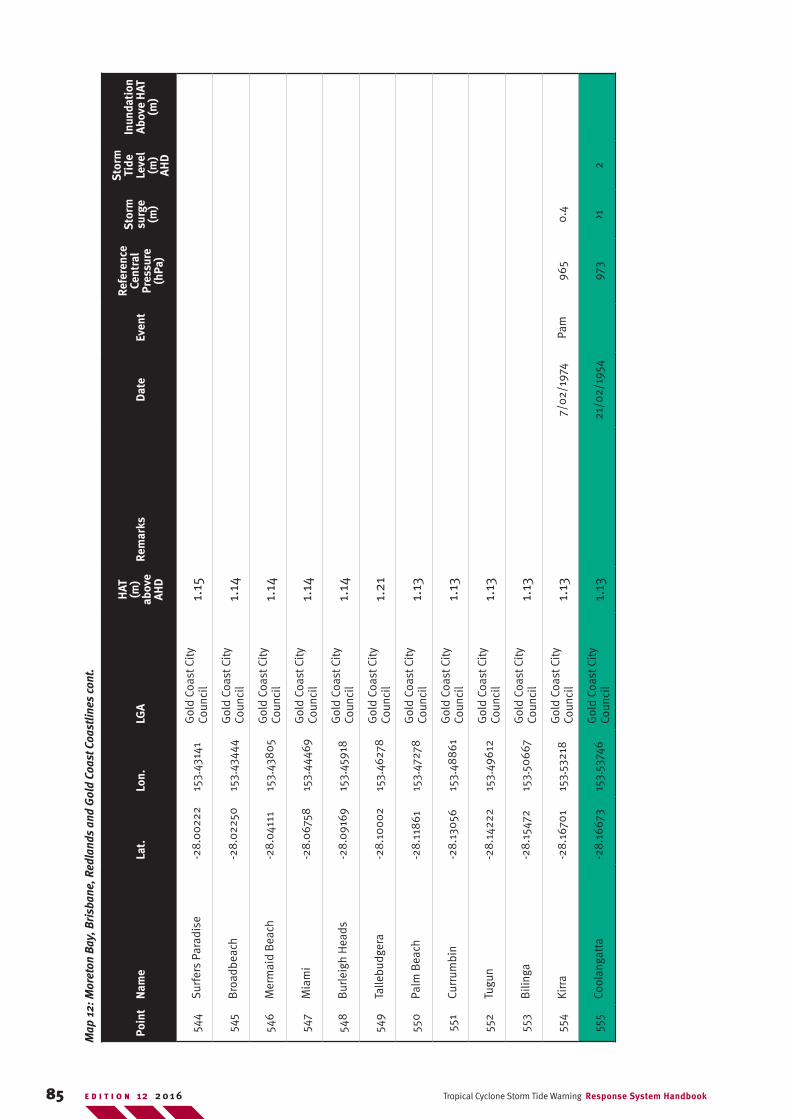
85 Tropical Cyclone Storm Tide Warning Response System HandbookE D I T I O N 12 2 0 1 6
Poin
tN
ame
Lat.
Lon.
LGA
HAT
(m
) ab
ove
AHD
Rem
arks
Dat
eEv
ent
Refe
renc
e Ce
ntra
l Pr
essu
re
(hPa
)
Sto
rm
surg
e (m
)
Sto
rm
Tide
Le
vel
(m)
AHD
Inun
dati
on
Abov
e H
AT
(m)
544
Surf
ers
Para
dise
-28.
002
2215
3.43
141
Gol
d Co
ast C
ity
Coun
cil
1.15
545
Bro
adbe
ach
-28.
0225
015
3.43
444
Gol
d Co
ast C
ity
Coun
cil
1.14
546
Mer
mai
d B
each
-28.
0411
115
3.43
80
5G
old
Coas
t Cit
y Co
unci
l1.
14
547
Mia
mi
-28.
067
5815
3.44
469
Gol
d Co
ast C
ity
Coun
cil
1.14
548
Bur
leig
h H
eads
-28.
0916
915
3.45
918
Gol
d Co
ast C
ity
Coun
cil
1.14
549
Talle
budg
era
-28.
100
0215
3.46
278
Gol
d Co
ast C
ity
Coun
cil
1.21
550
Palm
Bea
ch-2
8.11
861
153.
4727
8G
old
Coas
t Cit
y Co
unci
l1.
13
551
Curr
umbi
n-2
8.13
056
153.
488
61G
old
Coas
t Cit
y Co
unci
l1.
13
552
Tugu
n-2
8.14
222
153.
4961
2G
old
Coas
t Cit
y Co
unci
l1.
13
553
Bili
nga
-28.
1547
215
3.50
667
Gol
d Co
ast C
ity
Coun
cil
1.13
554
Kirr
a-2
8.16
701
153.
5321
8G
old
Coas
t Cit
y Co
unci
l1.
137/
02/1
974
Pam
965
0.4
555
Cool
anga
tta
-28.
1667
315
3.53
746
Gol
d Co
ast C
ity
Coun
cil
1.13
21/0
2/19
5497
3>1
2
Map
12:
Mor
eton
Bay
, Bri
sban
e, R
edla
nds
and
Gol
d Co
ast C
oast
lines
con
t.
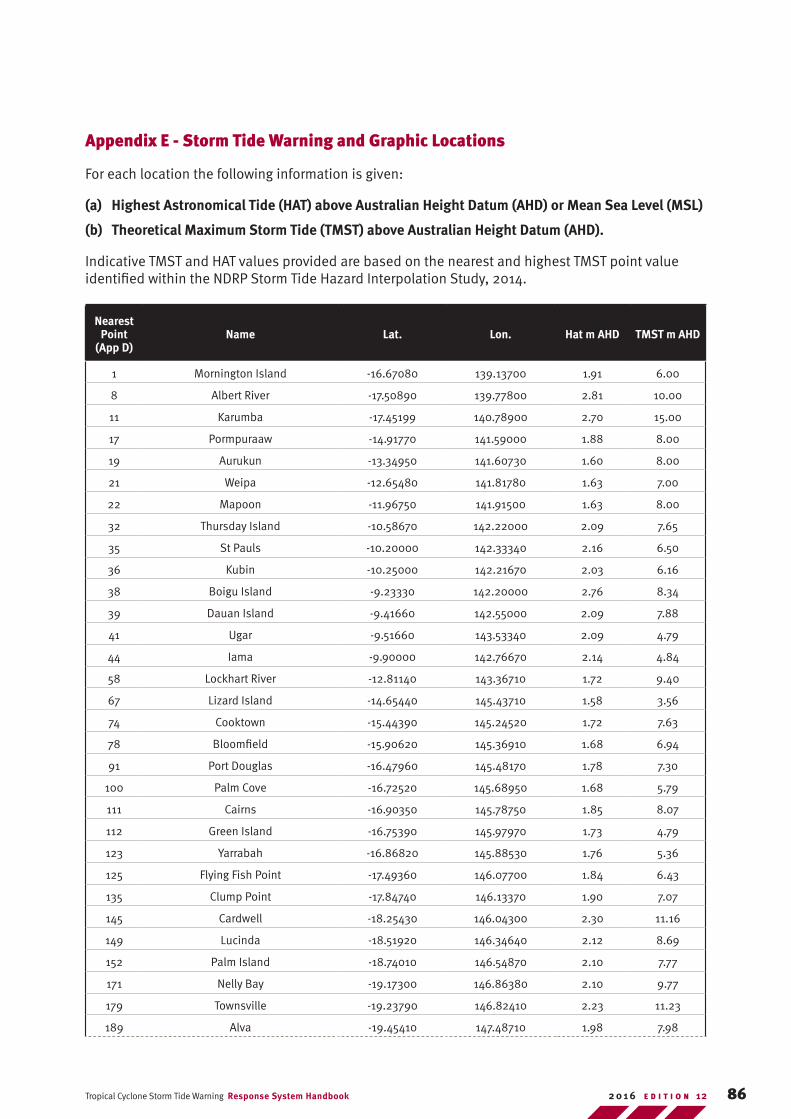
86Tropical Cyclone Storm Tide Warning Response System Handbook E D I T I O N 122 0 1 6
Appendix E - Storm Tide Warning and Graphic Locations
For each location the following information is given:
(a) Highest Astronomical Tide (HAT) above Australian Height Datum (AHD) or Mean Sea Level (MSL)
(b) Theoretical Maximum Storm Tide (TMST) above Australian Height Datum (AHD).
Indicative TMST and HAT values provided are based on the nearest and highest TMST point value identified within the NDRP Storm Tide Hazard Interpolation Study, 2014.
Nearest Point
(App D)Name Lat. Lon. Hat m AHD TMST m AHD
1 Mornington Island -16.67080 139.13700 1.91 6.00
8 Albert River -17.50890 139.77800 2.81 10.00
11 Karumba -17.45199 140.78900 2.70 15.00
17 Pormpuraaw -14.91770 141.59000 1.88 8.00
19 Aurukun -13.34950 141.60730 1.60 8.00
21 Weipa -12.65480 141.81780 1.63 7.00
22 Mapoon -11.96750 141.91500 1.63 8.00
32 Thursday Island -10.58670 142.22000 2.09 7.65
35 St Pauls -10.20000 142.33340 2.16 6.50
36 Kubin -10.25000 142.21670 2.03 6.16
38 Boigu Island -9.23330 142.20000 2.76 8.34
39 Dauan Island -9.41660 142.55000 2.09 7.88
41 Ugar -9.51660 143.53340 2.09 4.79
44 Iama -9.90000 142.76670 2.14 4.84
58 Lockhart River -12.81140 143.36710 1.72 9.40
67 Lizard Island -14.65440 145.43710 1.58 3.56
74 Cooktown -15.44390 145.24520 1.72 7.63
78 Bloomfield -15.90620 145.36910 1.68 6.94
91 Port Douglas -16.47960 145.48170 1.78 7.30
100 Palm Cove -16.72520 145.68950 1.68 5.79
111 Cairns -16.90350 145.78750 1.85 8.07
112 Green Island -16.75390 145.97970 1.73 4.79
123 Yarrabah -16.86820 145.88530 1.76 5.36
125 Flying Fish Point -17.49360 146.07700 1.84 6.43
135 Clump Point -17.84740 146.13370 1.90 7.07
145 Cardwell -18.25430 146.04300 2.30 11.16
149 Lucinda -18.51920 146.34640 2.12 8.69
152 Palm Island -18.74010 146.54870 2.10 7.77
171 Nelly Bay -19.17300 146.86380 2.10 9.77
179 Townsville -19.23790 146.82410 2.23 11.23
189 Alva -19.45410 147.48710 1.98 7.98
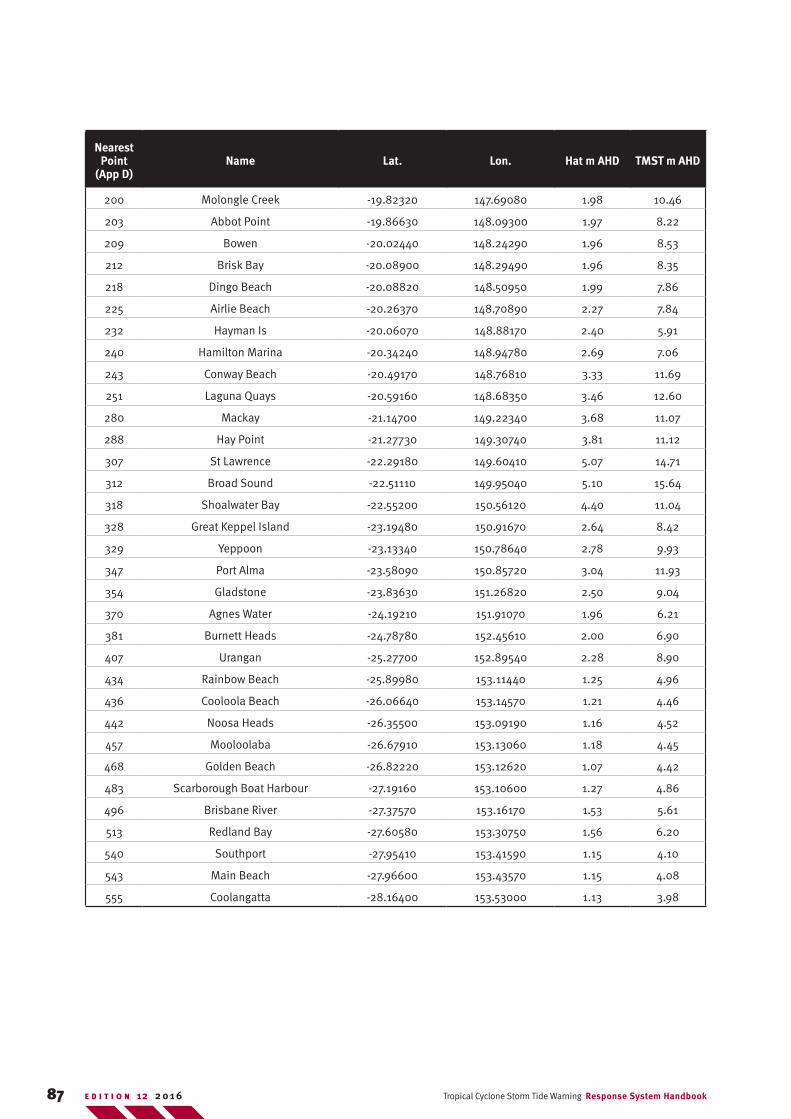
87 Tropical Cyclone Storm Tide Warning Response System HandbookE D I T I O N 12 2 0 1 6
Nearest Point
(App D)Name Lat. Lon. Hat m AHD TMST m AHD
200 Molongle Creek -19.82320 147.69080 1.98 10.46
203 Abbot Point -19.86630 148.09300 1.97 8.22
209 Bowen -20.02440 148.24290 1.96 8.53
212 Brisk Bay -20.08900 148.29490 1.96 8.35
218 Dingo Beach -20.08820 148.50950 1.99 7.86
225 Airlie Beach -20.26370 148.70890 2.27 7.84
232 Hayman Is -20.06070 148.88170 2.40 5.91
240 Hamilton Marina -20.34240 148.94780 2.69 7.06
243 Conway Beach -20.49170 148.76810 3.33 11.69
251 Laguna Quays -20.59160 148.68350 3.46 12.60
280 Mackay -21.14700 149.22340 3.68 11.07
288 Hay Point -21.27730 149.30740 3.81 11.12
307 St Lawrence -22.29180 149.60410 5.07 14.71
312 Broad Sound -22.51110 149.95040 5.10 15.64
318 Shoalwater Bay -22.55200 150.56120 4.40 11.04
328 Great Keppel Island -23.19480 150.91670 2.64 8.42
329 Yeppoon -23.13340 150.78640 2.78 9.93
347 Port Alma -23.58090 150.85720 3.04 11.93
354 Gladstone -23.83630 151.26820 2.50 9.04
370 Agnes Water -24.19210 151.91070 1.96 6.21
381 Burnett Heads -24.78780 152.45610 2.00 6.90
407 Urangan -25.27700 152.89540 2.28 8.90
434 Rainbow Beach -25.89980 153.11440 1.25 4.96
436 Cooloola Beach -26.06640 153.14570 1.21 4.46
442 Noosa Heads -26.35500 153.09190 1.16 4.52
457 Mooloolaba -26.67910 153.13060 1.18 4.45
468 Golden Beach -26.82220 153.12620 1.07 4.42
483 Scarborough Boat Harbour -27.19160 153.10600 1.27 4.86
496 Brisbane River -27.37570 153.16170 1.53 5.61
513 Redland Bay -27.60580 153.30750 1.56 6.20
540 Southport -27.95410 153.41590 1.15 4.10
543 Main Beach -27.96600 153.43570 1.15 4.08
555 Coolangatta -28.16400 153.53000 1.13 3.98
88Tropical Cyclone Storm Tide Warning Response System Handbook E D I T I O N 122 0 1 6
Appendix F - Useful Storm Tide References
Beach Protection Authority Queensland, (1979), Capricorn Coast Beaches: Chapter 8 - Water Level Variations, 12pp
Beach Protection Authority Queensland,(1989), Hervey Bay Beaches: Chapter 7 - Water Level Variations, 14pp
Beach Protection Authority Queensland, (1984), Mulgrave Shire Northern Beaches: Chapter 7- Water Level Variations, Queensland Government 17pp
Blain, Blemner and Williams Pty Ltd, (1985), Storm Tide Statistics: Bowen, Beach Protection Authority Queensland, 53pp
Blain, Blemner and Williams Pty Ltd, (1985), Storm Tide Statistics: Cooktown, Beach Protection Authority Queensland 51pp
Blain, Blemner and Williams Pty Ltd, (1985), Storm Tide Statistics: Lucinda, Beach Protection Authority Queensland 51pp
Blain, Blemner and Williams Pty Ltd, (1985), Storm Tide Statistics: Mackay, Beach Protection Authority Queensland 52pp
Blain, Blemner and Williams Pty Ltd, (1985), Storm Tide Statistics: Mourilyan, Beach Protection Authority Queensland 52pp
Blain, Blemner and Williams Pty Ltd, (1985), Storm Tide Statistics: Surfers Paradise, Beach Protection Authority Queensland 50pp
Blain, Blemner and Williams Pty Ltd, (1985), Storm Tide Statistics: Townsville, Beach Protection Authority Queensland 51pp
Blain, Blemner and Williams Pty Ltd, (1985), Storm Tide Statistics: Yeppoon, Beach Protection Authority Queensland 53pp
Burnett Shire Council, (1997), Burnett Coast Storm Tide Plan, 62pp
Callaghan, J, (2007), Archive; Known Impacts of Tropical Cyclones, Gulf of Carpentaria, 1885 – 2007, Bureau of Meteorology, Brisbane
Callaghan, J, (2011), Archive: Severe East Coast Tropical Cyclones, 1887 – 2011, Bureau of Meteorology, Brisbane
Connell Wagner, Lawson and Treloar, (2004), Bowen Shire Storm Tide Study, Bowen Shire Council, 95pp
Connell Wagner, Lawson and Treloar, (2003), Caloundra City Council Storm Tide Study - Counter Disaster Planning Report, Caloundra City Council 48pp
Connell Wagner, Lawson and Treloar, (2003), Caloundra City Council Storm Tide Study - Development Report, Caloundra City Council 140pp
Connell Wagner, Lawson and Treloar, (2003), Capricorn Coast Storm Tide Hazard Investigation, Livingstone Shire Council 53pp
Connell Wagner, Lawson and Treloar, (2004), Hinchinbrook Storm Surge Study, Hinchinbrook Shire Council 85pp
Connell Wagner, Lawson and Treloar, (2005), Maroochy Shire Storm Tide Study - Counter Disaster Planning Report, Maroochy Shire Council 47pp
89 Tropical Cyclone Storm Tide Warning Response System HandbookE D I T I O N 12 2 0 1 6
Connell Wagner, Lawson and Treloar, (2005), Maroochy Shire Storm Tide Study - Development Report, Maroochy Shire Council 146pp
Connell Wagner, Lawson and Treloar, WS Group, (2003), Storm Tide Risk Management Study for Broadsound Shire Council and Sarina Shire Council, Broadsound Shire Council, Sarina Shire Council 93pp
Department of Public Lands, (1975), Storm Tide Inundation Map: Bowen, Survey Office, Brisbane, Queensland
Department of Public Lands, (1975), Storm Tide Inundation Map: Bundaberg Coast, Survey Office, Brisbane, Queensland
Department of Public Lands, (1975), Storm Tide Inundation Map: Cairns (1), Survey Office, Brisbane, Queensland
Department of Public Lands, (1975), Storm Tide Inundation Map: Cairns (2), Survey Office, Brisbane, Queensland
Department of Public Lands, (1975), Storm Tide Inundation Map: Emu Park, Survey Office, Brisbane, Queensland
Department of Public Lands, (1975), Storm Tide Inundation Map: Gladstone, Survey Office, Brisbane, Queensland
Department of Public Lands, (1975), Storm Tide Inundation Map: Hervey Bay, Survey Office, Brisbane, Queensland
Department of Public Lands, (1975), Storm Tide Inundation Map: Innisfail, Survey Office, Brisbane, Queensland
Department of Public Lands, (1975), Storm Tide Inundation Map: Mackay (1), Survey Office, Brisbane, Queensland
Department of Public Lands, (1975), Storm Tide Inundation Map: Mackay (2), Survey Office, Brisbane, Queensland
Department of Public Lands, (1975), Storm Tide Inundation Map: Townsville, Survey Office, Brisbane, Queensland
Department of Public Lands, (1975), Storm Tide Inundation Map: Yeppon, Survey Office, Brisbane, Queensland
Douglas Shire Council, (2006), Emergency Action Guide, Maps 1-6, 18-23pp
Granger, K, Jones, T, Leiba, M, Scott, G, (1999), Community Risk in Cairns - A Multi-Hazard Assessment, Cities Project, Australian Geological Survey Organisation – Geoscience Australia 231pp
Granger, K, Micheal-Leiba, M (editors), (2001), Community Risk in Gladstone - A Multi-Hazard Risk Assessment, Cities Project, Australian Geological Survey Organisation – Geoscience Australia 169pp
Granger, K, Hayne, M (editors), (2001), Natural Hazards and the Risks They Pose to South-East Queensland, Cities Project, Australian Geological Survey Organisation – Geoscience Australia 403pp
GHD, Systems Engineering Australia Pty Ltd, (2004), Storm Surge Study - Rainbow Beach, Rainbow Shores, Cooloola Cove and Tin Can Bay, Cooloola Shire Council 36pp
GHD and Systems Engineering Australia Pty Ltd, (2003), Storm Tide Modelling Study of the Whitsunday Coast and Resort Islands, Whitsunday Shire Council 166pp
90Tropical Cyclone Storm Tide Warning Response System Handbook E D I T I O N 122 0 1 6
GHD and Systems Engineering Australia Pty Ltd, (2007), Townsville - Thuringowa Storm Tide Study, Townsville City Council, Thuringowa City Council 251pp
GHD, (2014), NDRP Storm Tide Hazard Interpolation, Department of Science Information Technology and Innovation, Brisbane
Hardy, T, Mason, L, Astorquia, A, (2004), The Frequency of Surge Plus Tide During Tropical Cyclones for Selected Open Coast Locations Along the Queensland East Coast, Marine Modelling Unit Report to Australian Bureau of Meteorology and Queensland Environmental Protection Agency, School of Engineering James Cook University, Townsville, Queensland, pp60
Hardy, TA, Mason, LB, Astorquia, A and Harper, BA, (2003), Tropical Cyclone-Induced Water Levels and Waves: Hervey Bay and Sunshine Coast, Marine Modelling Unit Report to Australian Bureau of Meteorology and Queensland Environmental Protection Agency, School of Engineering James Cook University, Townsville, Queensland, pp78
Harper, B.A, (1998), Storm Tide Threat in Queensland: History, Prediction and Relative Risks, Conservation Technical Report No. 10, Department of Environment and Heritage, Queensland Government, 26pp
Harper, B.A, Sobey, R.J, and Stark, K.P, (1977), Numerical Simulation of Tropical Cyclone Storm Surge Along the Queensland Coast: Bowen, Department of Civil and Systems Engineering, James Cook University of North Queensland, 100pp
Harper, B.A, Sobey, R.J, and Stark, K.P, (1977), Numerical Simulation of Tropical Cyclone Storm Surge Along the Queensland Coast: Cairns, Department of Civil and Systems Engineering, James Cook University of North Queensland, 24pp
Harper, B.A, Sobey, R.J, and Stark, K.P, (1977), Numerical Simulation of Tropical Cyclone Storm Surge Along the Queensland Coast: Cooktown, Department of Civil and Systems Engineering, James Cook University of North Queensland, 93pp
Harper, B.A, Sobey, R.J, and Stark, K.P, (1977), Numerical Simulation of Tropical Cyclone Storm Surge Along the Queensland Coast: Gold Coast, Department of Civil and Systems Engineering, James Cook University of North Queensland, 102pp
Harper, B.A, Sobey, R.J, and Stark, K.P, (1977), Numerical Simulation of Tropical Cyclone Storm Surge Along the Queensland Coast: Ingham, Department of Civil and Systems Engineering, James Cook University of North Queensland, 100pp
Harper, B.A, Sobey, R.J, and Stark, K.P, (1977), Numerical Simulation of Tropical Cyclone Storm Surge Along the Queensland Coast: Innisfail, Department of Civil and Systems Engineering, James Cook University of North Queensland, 100pp
Harper, B.A, Sobey, R.J, and Stark, K.P, (1977), Numerical Simulation of Tropical Cyclone Storm Surge Along the Queensland Coast: Mackay, Department of Civil and Systems Engineering, James Cook University of North Queensland, 100pp
Harper, B.A, Sobey, R.J, and Stark, K.P, (1977), Numerical Simulation of Tropical Cyclone Storm Surge Along the Queensland Coast: Rockhampton, Department of Civil and Systems Engineering, James Cook University of North Queensland, 97pp
Harper, B.A, Sobey, R.J, and Stark, K.P, (1977), Numerical Simulation of Tropical Cyclone Storm Surge Along the Queensland Coast: Townsville, Department of Civil and Systems Engineering, James Cook University of North Queensland, 98pp
John Wilson and Partners, Lawson and Treloar, (2004), Pine River/Hays Inlet Storm Surge Study, Pine Rivers Shire Council 56pp
91 Tropical Cyclone Storm Tide Warning Response System HandbookE D I T I O N 12 2 0 1 6
Lawson and Treloar, (2002), Hervey Bay Storm Tide Study, Hervey Bay City Council 76 pp
Maunsell Australia Pty Ltd, DHI Water and Environment, (2003), Burdekin Shire Storm Surge Study - Volume 1, Burdekin Shire Council 236pp
Maunsell Australia Pty Ltd, DHI Water and Environment, (2003), Burdekin Shire Storm Surge Study - Volume 2 Surge Inundation Mapping, Burdekin Shire Council108pp
McInnes, K, Hubbert, G, Oliver, S, Abs, D, (2000), Gold Coast Broadwater Study: Storm Tide Return Periods and 1974 Floodwater Modelling, prepared by CSIRO, Global Environmental Modelling Systems for Gold Coast City Council 45pp
Middelmann, M, Granger, K (editors), (2000), Community Risk in Mackay - A Multi-Hazard Risk Assessment, Cities Project, Australian Geological Survey Organisation – Geoscience Australia 270pp
Mirfenderesk, H, (2008), Investigation of Possible Flooding on the Gold Coast Due to Storm Tide, Gold Coast City Council 14pp
Queensland Government, Maritime Safety Queensland, (2007), The Official Tide Tables and Boating Safety Guide 2007, Maritime Safety Queensland, Mineral House, Australia
Queensland Risk Management Consultants Pty Ltd, Kellogg, Brown and Root Pty Ltd, (2005), Report on Other Water Bases Hazards Phase (Severe Storm, East Coast Low and Storm Tide), Brisbane City Council 143pp
Rusk PPK Pty Ltd, (1995), Numerical Simulation of Tropical Cyclone Storm Surge Along the Queensland Coast: Cardwell, Beach Protection Authority Queensland 208pp
Rusk PPK Pty Ltd, (1995), Storm Tide Statistics: Cardwell, Beach Protection Authority Queensland 53pp
Water Studies Pty Ltd, John Wilson and Partners, Lawson and Treloar, (1995 (updated 2000, 2001)), Flooding in the Noosa River Catchment, prepared for Noosa Shire Council 46p
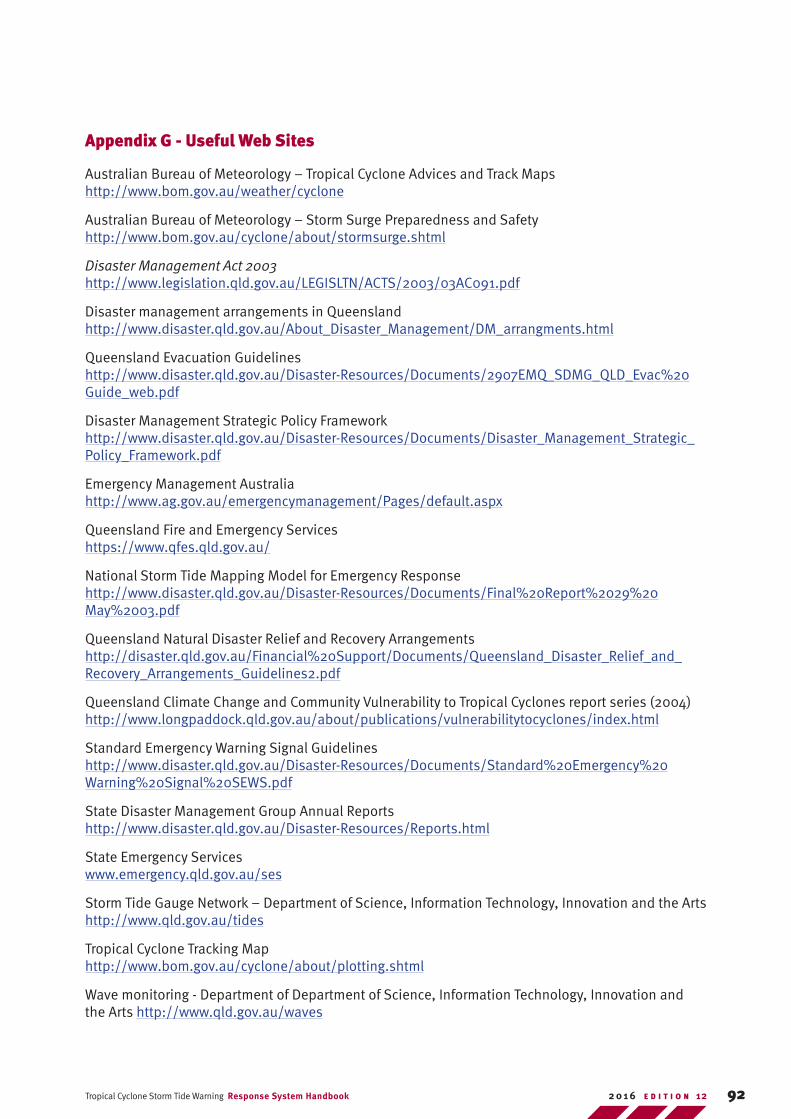
92Tropical Cyclone Storm Tide Warning Response System Handbook E D I T I O N 122 0 1 6
Appendix G - Useful Web Sites
Australian Bureau of Meteorology – Tropical Cyclone Advices and Track Maps http://www.bom.gov.au/weather/cyclone
Australian Bureau of Meteorology – Storm Surge Preparedness and Safety http://www.bom.gov.au/cyclone/about/stormsurge.shtml
Disaster Management Act 2003 http://www.legislation.qld.gov.au/LEGISLTN/ACTS/2003/03AC091.pdf
Disaster management arrangements in Queensland http://www.disaster.qld.gov.au/About_Disaster_Management/DM_arrangments.html
Queensland Evacuation Guidelines http://www.disaster.qld.gov.au/Disaster-Resources/Documents/2907EMQ_SDMG_QLD_Evac%20Guide_web.pdf
Disaster Management Strategic Policy Framework http://www.disaster.qld.gov.au/Disaster-Resources/Documents/Disaster_Management_Strategic_Policy_Framework.pdf
Emergency Management Australia http://www.ag.gov.au/emergencymanagement/Pages/default.aspx
Queensland Fire and Emergency Services https://www.qfes.qld.gov.au/
National Storm Tide Mapping Model for Emergency Response http://www.disaster.qld.gov.au/Disaster-Resources/Documents/Final%20Report%2029%20May%2003.pdf
Queensland Natural Disaster Relief and Recovery Arrangements http://disaster.qld.gov.au/Financial%20Support/Documents/Queensland_Disaster_Relief_and_Recovery_Arrangements_Guidelines2.pdf
Queensland Climate Change and Community Vulnerability to Tropical Cyclones report series (2004) http://www.longpaddock.qld.gov.au/about/publications/vulnerabilitytocyclones/index.html
Standard Emergency Warning Signal Guidelines http://www.disaster.qld.gov.au/Disaster-Resources/Documents/Standard%20Emergency%20Warning%20Signal%20SEWS.pdf
State Disaster Management Group Annual Reports http://www.disaster.qld.gov.au/Disaster-Resources/Reports.html
State Emergency Services www.emergency.qld.gov.au/ses
Storm Tide Gauge Network – Department of Science, Information Technology, Innovation and the Arts http://www.qld.gov.au/tides
Tropical Cyclone Tracking Map http://www.bom.gov.au/cyclone/about/plotting.shtml
Wave monitoring - Department of Department of Science, Information Technology, Innovation and the Arts http://www.qld.gov.au/waves
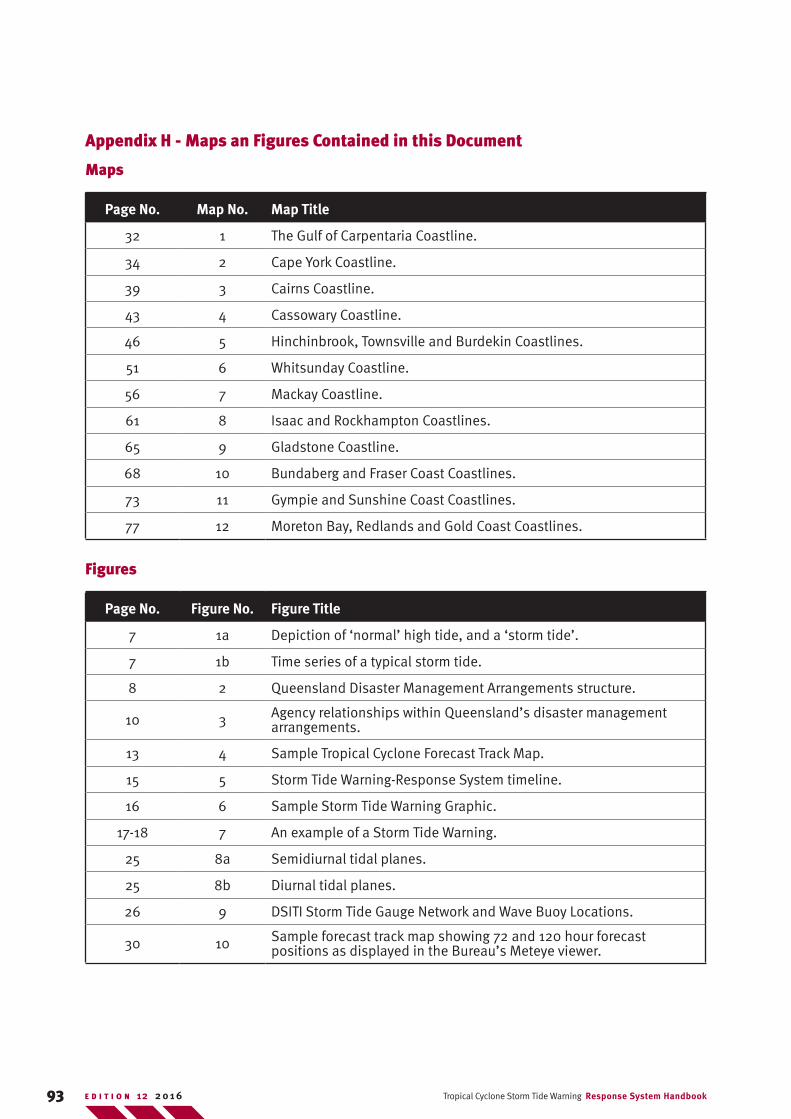
93 Tropical Cyclone Storm Tide Warning Response System HandbookE D I T I O N 12 2 0 1 6
Appendix H - Maps an Figures Contained in this Document
Maps
Page No. Map No. Map Title
32 1 The Gulf of Carpentaria Coastline.
34 2 Cape York Coastline.
39 3 Cairns Coastline.
43 4 Cassowary Coastline.
46 5 Hinchinbrook, Townsville and Burdekin Coastlines.
51 6 Whitsunday Coastline.
56 7 Mackay Coastline.
61 8 Isaac and Rockhampton Coastlines.
65 9 Gladstone Coastline.
68 10 Bundaberg and Fraser Coast Coastlines.
73 11 Gympie and Sunshine Coast Coastlines.
77 12 Moreton Bay, Redlands and Gold Coast Coastlines.
Figures
Page No. Figure No. Figure Title
7 1a Depiction of ‘normal’ high tide, and a ‘storm tide’.
7 1b Time series of a typical storm tide.
8 2 Queensland Disaster Management Arrangements structure.
10 3 Agency relationships within Queensland’s disaster management arrangements.
13 4 Sample Tropical Cyclone Forecast Track Map.
15 5 Storm Tide Warning-Response System timeline.
16 6 Sample Storm Tide Warning Graphic.
17-18 7 An example of a Storm Tide Warning.
25 8a Semidiurnal tidal planes.
25 8b Diurnal tidal planes.
26 9 DSITI Storm Tide Gauge Network and Wave Buoy Locations.
30 10 Sample forecast track map showing 72 and 120 hour forecast positions as displayed in the Bureau’s Meteye viewer.

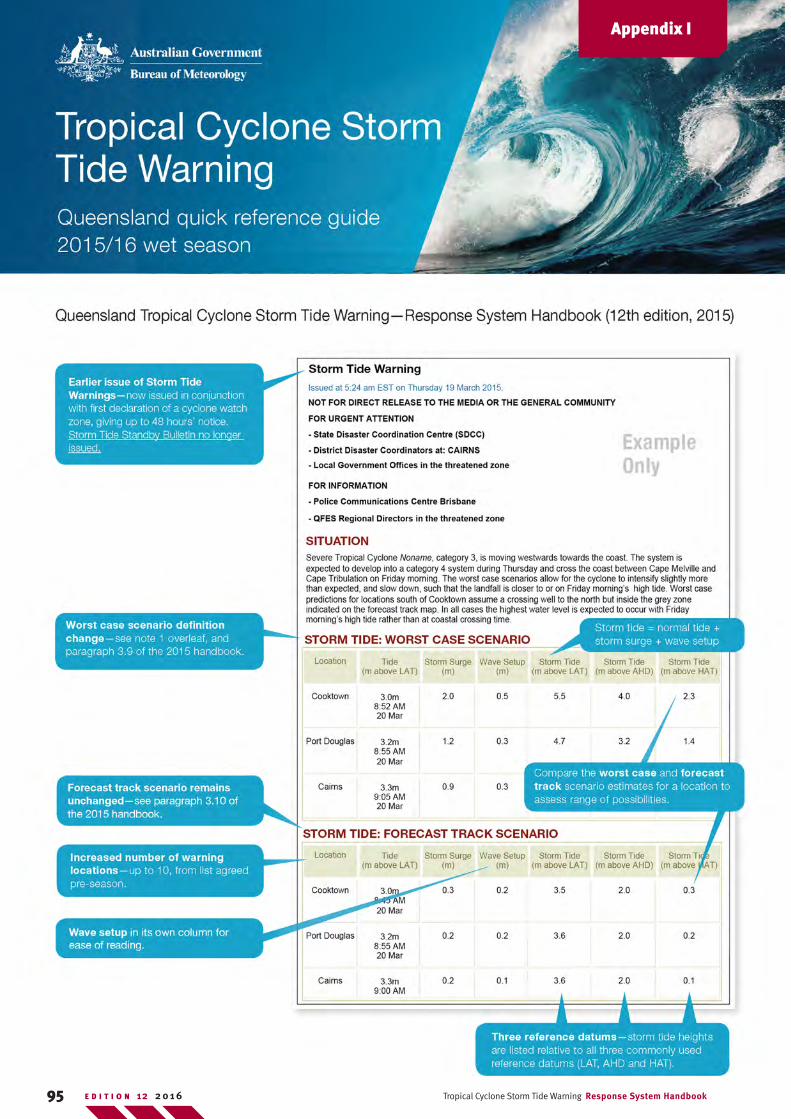
95 Tropical Cyclone Storm Tide Warning Response System HandbookE D I T I O N 12 2 0 1 6
Appendix I
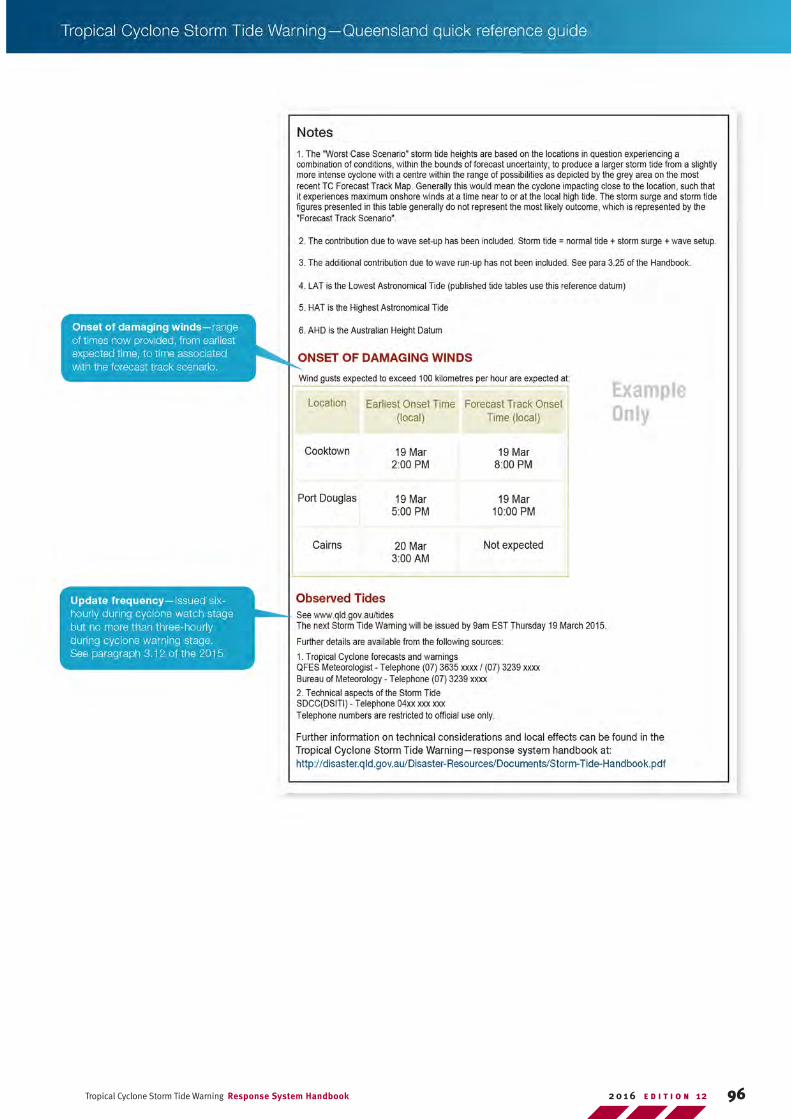
96Tropical Cyclone Storm Tide Warning Response System Handbook E D I T I O N 122 0 1 6
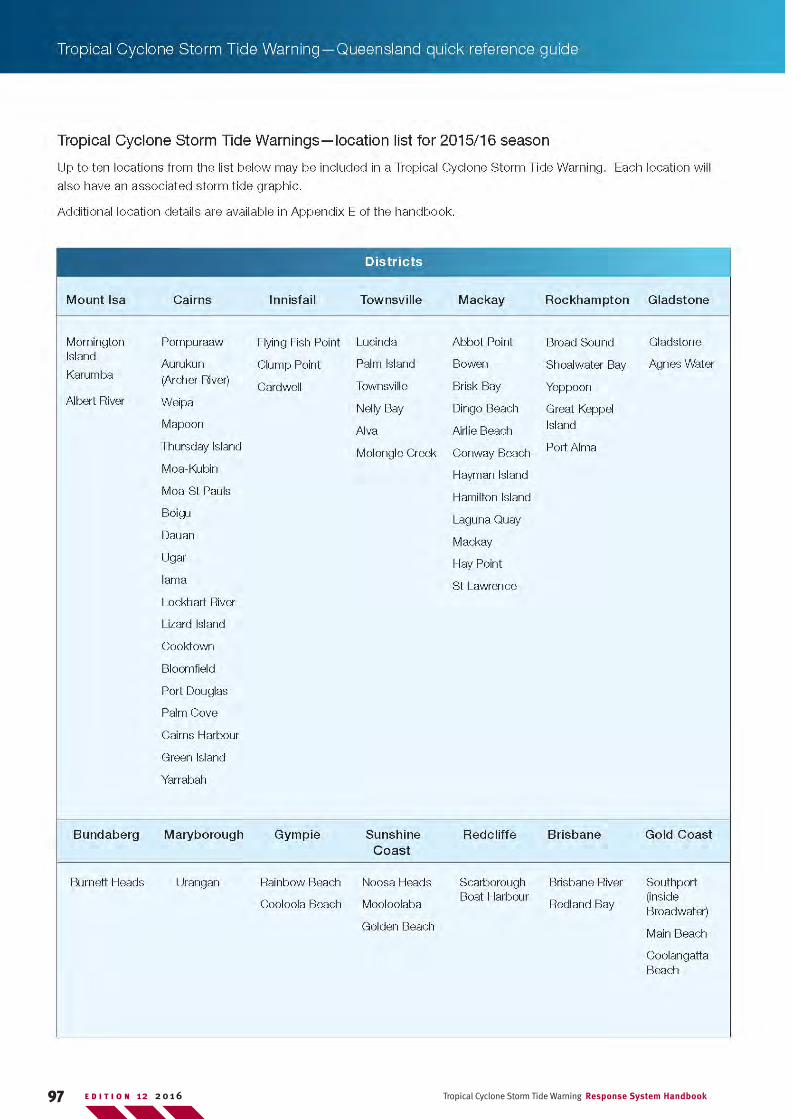
97 Tropical Cyclone Storm Tide Warning Response System HandbookE D I T I O N 12 2 0 1 6
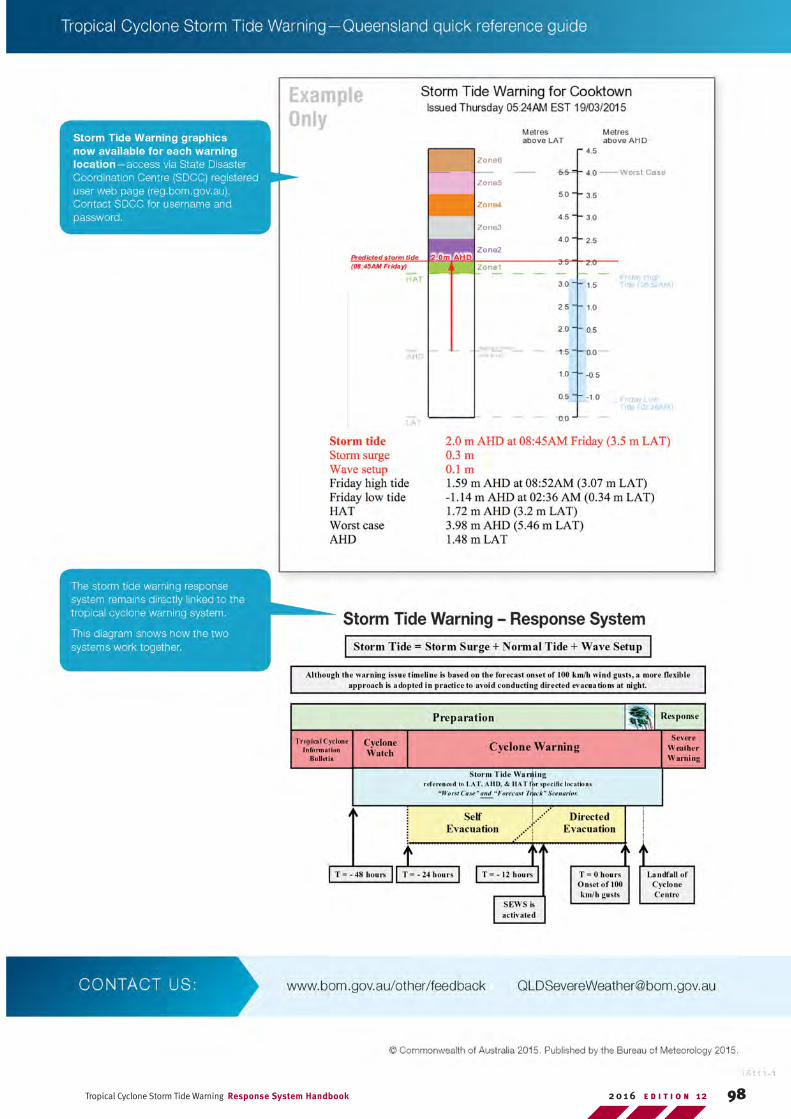
98Tropical Cyclone Storm Tide Warning Response System Handbook E D I T I O N 122 0 1 6