CULTURAL DIFFERENCES IN SELF-SERVING BEHAVIOUR · CULTURAL DIFFERENCES IN SELF-SERVING BEHAVIOUR IN...
22
CULTURAL DIFFERENCES IN SELF-SERVING BEHAVIOUR IN ACCOUNTING NARRATIVES ABSTRACT In the letter to the shareholders management renders account of the activities in the preceding year by providing explanations for the results and, frequently, looks forward to the next year. These are the stories that narrate the successes and failures of individuals (e.g., the CEOs), organisational subunits, and the entire company. Attribution theory hypothesises on the bias in these stories and expects management to be self-serving by attributing positive developments to themselves and negative developments to the environment. Indeed, this so-called “self-serving attributional bias”, though originating from social psychology, has also been shown in the context of organisational outcomes including the letter to the shareholders of Western companies. Recent social psychological research on this self-serving attributional bias, however, has revealed that there are cultural differences in these attributional patterns. More specifically, this cross-cultural research revealed that the self-serving bias is typically found in western, individualistic cultures, but is to a lesser extent present in eastern, collectivistic cultures. Therefore, in line with these findings one would expect this self-serving attributional bias to be more prevalent in annual reports of companies from individualistic countries than those from collectivistic countries. In this paper we will report some results based upon a study of letters to the shareholders of American and Japanese companies. Keywords: culture, accounting narratives, international financial accounting.
Transcript of CULTURAL DIFFERENCES IN SELF-SERVING BEHAVIOUR · CULTURAL DIFFERENCES IN SELF-SERVING BEHAVIOUR IN...

CULTURAL DIFFERENCES IN SELF-SERVING BEHAVIOUR INACCOUNTING NARRATIVES
ABSTRACT
In the letter to the shareholders management renders account of the activities in thepreceding year by providing explanations for the results and, frequently, looksforward to the next year. These are the stories that narrate the successes and failuresof individuals (e.g., the CEOs), organisational subunits, and the entire company.Attribution theory hypothesises on the bias in these stories and expects managementto be self-serving by attributing positive developments to themselves and negativedevelopments to the environment. Indeed, this so-called “self-serving attributionalbias”, though originating from social psychology, has also been shown in the contextof organisational outcomes including the letter to the shareholders of Westerncompanies. Recent social psychological research on this self-serving attributional bias,however, has revealed that there are cultural differences in these attributionalpatterns. More specifically, this cross-cultural research revealed that the self-servingbias is typically found in western, individualistic cultures, but is to a lesser extentpresent in eastern, collectivistic cultures. Therefore, in line with these findings onewould expect this self-serving attributional bias to be more prevalent in annualreports of companies from individualistic countries than those from collectivisticcountries. In this paper we will report some results based upon a study of letters tothe shareholders of American and Japanese companies.
Keywords: culture, accounting narratives, international financial accounting.

2
CULTURAL DIFFERENCES IN SELF-SERVING BEHAVIOURIN ACCOUNTING NARRATIVES
INTRODUCTIONIn the CEO’s letter to the shareholder management renders account of thecompany’s activities of the preceding fiscal year by providing explanations for theobtained results. These are the stories that narrate the successes of the individuals(e.g., the CEO), organisational subunits, and the entire company (Fiol, 1989). It isnot inconceivable that the board will use this opportunity to interpret events to itsown benefit (Hines, 1988; Ginzel, Kramer, and Sutton, 1993), also because theannual report seems to be a public relations instrument aimed at nurturing a certaincorporate image (Hopwood, 1996). For example, Preston, Wright, and Young (1996)suggested that annual reports are designed to send the right message, i.e., to enhancethe story of corporate performance contained in the financial statements or to signalor, maybe more likely, to detract attention away from poor performance. Indeed,historical data from large UK corporations seem to confirm that “corporateexecutives use annual reports as part of an image management function to influenceexternal stakeholders” (Lee, 1994: 215).
Research shows that the explanations offered by individuals (and groups aswell) are self-serving: individuals are willing to take credit for successful outcomes,but are reluctant to take responsibility for unsuccessful outcomes. This so-called“self-serving attributional bias”, though originating from social psychology, has alsobeen shown in the context of organisational outcomes (Johns, 1999) including theletter to the shareholders. The research mainly focused on the United States(Bettman and Weitz, 1983; Staw, McKechnie, and Puffer, 1983; Salancik and Meindl,1984; D’Aveni and MacMillan, 1990; Clapham and Schwenk, 1991), with a notableexception of Belgium (Aerts, 1994). In general these studies showed that self-servingbehaviour is also present found in annual reports, although Aerts only found Belgiancompanies claiming successful results.
Recent research within social psychology, however, suggests that theexplanations that people provide for events may depend upon their culturalbackground and that, as a consequence, the self-serving attributional bias is lessuniversal or robust as it was thought to be. Indeed, some social scientists suggestedthat the self-serving attributional bias might be more typical for western societiesthan for eastern societies (Choi and Nisbett, 1998; Choi, Nisbett, and Norenzayan,1999; Menon, Morris, Chiu, and Hong, 1999). Furthermore, Gray’s (1988) theory andits recent validations seem to suggest that financial reporting to a certain extent is areflection of a nation’s cultural background (for an excellent recent overview seeChanchani and MacGregor, 1999). Therefore, the central research question of thispaper is whether such a cultural difference may also be found in explanatorybehaviour in annual reports. It presents some preliminary findings based on a studyof annual reports of American and Japanese companies.
The remainder of the paper is organised as follows. In the second paragraph,attention is paid to the theoretical background when studying explanatory behaviourin annual reports in general, while also some previous research, mainly using datafrom the Eighties and focussing on western nations, are briefly addressed. The thirdparagraph covers some of the recent findings within social psychology indicating thatthe self-serving attributional bias may be less profound in eastern nations. It also tries

3
to provide possible reasons for this divergence. The fourth paragraph contains thepropositions that will be tested in this paper and, in addition, describes the researchmethod used. Paragraph five contains some of the preliminary results of this study.The paper ends with a short discussion and conclusion section.
ATTRIBUTION THEORY AND IMPRESSION MANAGEMENTAttribution theory provides the basis for studying explanatory behaviour in annualreports. It consists of a number of social psychological ideas that focus on perceivedcausality, i.e., people’s ideas about causes of events. The work of social psychologistas Heider (1958) and Weiner (1971, 1985, 1986) resulted in a taxonomy that can beused to study the explanations people offer. Frequently, a two-dimensional taxonomyis used consisting of “locus of causality” (indicating whether a cause is internal orexternal to the person) on the one hand and “stability” (indicating whether a cause istemporal or might persist over time) on the other. Using this taxonomy, researcherswere able to reveal certain tendencies in people’s explanatory behaviour, not only inexperimental settings but also under more natural conditions, e.g., newspaper stories.People are “self-enhancing” if it involves successful outcomes, implying that they willtake credit for it by saying that they were personally responsible for the outcome.However, if it involves unsuccessful outcomes, i.e., failures, people show “self-protecting” tendencies, implying that the environment or something beyond theircontrol, e.g., bad luck, is held responsible for the outcome.
These tendencies have also been studied and shown in organisationalcontexts in general (Johns, 1999), including accounting narratives as indicatedpreviously. In the mid-Eighties and early-Nineties several American researchers,predominantly from the organisational domain, applied these social psychologicalideas to annual reports. The studies of Bettman and Weitz (1983), Staw, McKechnie,and Puffer (1983), Salancik and Meindl (1984), D’Aveni and MacMillan (1990), andClapham and Schwenk (1991) indicated that managers are very alike ordinary people:they are, generally speaking, inclined to take credit for positive results, e.g., anincrease in profits or sales, while negative outcomes are blamed onto theenvironment. Apart from using such acclaiming (e.g., enhancements) and accountingtactics (e.g., excuses and justifications), managers also are able to obfuscate possiblereasons for an outcome. Aerts (1994) suggested that a cause-effect relation might beexpressed in accounting-technical terms, e.g., “profits declined as results of anincrease of the financial costs”. What is typical of such an explanation is that itremains unclear whom is responsible for the outcome and that it is open to multipleinterpretation. In a sense, these accounting explanations are used to avoid the needof giving explanations. Given these characteristics, it is no surprise that Aerts’ studyrevealed that managers show a preference to explain negative outcomes inaccounting-technical terminology, whereas positive outcomes are explained more inclear-cut causal language where responsibility may be easily assigned. In a sense, thisaccounting bias and the self-serving tendency can be seen as complementary. Firmsshow a preference for using self-enhancing claims when explaining positiveperformance, while they prefer to use technical-accounting language to account fornegative performances – thereby hoping that their responsibility for the failure ismystified (Aerts, 1991, 1994).
By the use of such accounting, acclaiming and obfuscation tactics individualsattempt to control the impressions others form of them (Leary and Kowalski, 1990).Although people are not always aware of the impressions they convey, a certainstrategic behaviour can be assumed. Indeed, the claim that impression management
4
is instrumental (Goffman, 1959; Schlenker and Weigold, 1992) or purposive, goal-directed behaviour (Bozeman and Kacmar, 1997) may be particularly true fororganisations and their members. Within an agency theoretical setting the use ofimpression management, and self-serving explanatory behaviour in particular, may beexpected beforehand. Managers, guided by their self-interests, will highlight thepositive whereas as little attention as possible is paid to negative outcomes. Indeed,Abrahamson and Park (1994) refer to two important motives to use such aconcealment strategy. Firstly, managers do not want others to become aware of suchnegative outcomes not only because this may affect their bonuses, but also because itmay impinge on their reputations. Secondly, as disclosure of this kind of informationusually leads shareholders to sell their share, this results in a decrease in firm’s valueand may make it more vulnerable to a hostile take-over. The use of such impressionmanagement tactics seems especially important if a person’s behaviour is public(Leary, 1996). Indeed, Fiol (1995) revealed such a private-public effect in anorganisational context. She compared managers’ attributions in externalcommunication (i.e., the letter to the shareholders) with those in internalcommunication (i.e., internal planning documents). Using content analysis she foundthat managers’ private and public statements are not necessarily converging. Shefound that threats (i.e., negative, uncontrollable causes) are more frequently used ininternal documents than in external documents, while in the case of opportunities(i.e., positive, controllable causes) more or less the opposite applies. Using a sameline of argument, Aerts and Theunisse (2000) investigated whether listing statusinfluenced attributional behaviour in accounting narratives. Using a recent sample ofBelgian letters to the shareholders, they were able to show that listed companies areboth more self-enhancing and self-protecting than non-public companies whenexplaining positive and negative accounting outcomes, respectively.
However, there are limits to be overly self-serving. The impressionsconveyed have to be credible: “self-serving tendencies can be effective as long as themessage they represent is plausible and the messenger remains credible” (Aerts andTheunisse, 2000: 6). Credibility is one of the most crucial aspects of disclosureeffectiveness (Gibbins et al., 1990). In addition, the financial report is generallyspeaking a publicly available document and is used by many constituencies in theirdecision-making process. These constituencies, such as, e.g., institutional investors,shareholders, employees, creditors, banks, et cetera, are expected to read the financialreport carefully as well that they will confront it with information from other sources,e.g., their own knowledge, press releases, journal articles, and analysts’ forecasts.Because of this public scrutiny gross inaccuracies may be detected quickly (Bettmanand Weitz, 1983). As these constituencies possess other information resources thanthe annual report as well, it may be possible that the explanations offered by themanagement, e.g., a considerable increase in profits due to good strategic policy, areviewed differently by them. So management always runs the risk that a part of theiraudiences may not accept its view of the events.
CULTURAL DIFFERENCES IN SELF-SERVING BEHAVIOURIn the previous paragraph we discussed a tendency that both ordinary people andmanagers have: they prefer to claim positive outcomes, whereas negative outcomesare blamed onto the environment. Although people across cultures generally show aself-serving bias, research also indicates that there is a pervasive difference betweenwestern cultures (notably the United States) and eastern cultures (mostly Japan) (e.g.,Kashima and Triandis, 1986; Morris and Peng, 1994; Smith and Bond, 1996; Lee and

5
Seligman, 1997; Semin and Zwier, 1997). All these studies, using different methodsand subjects, arrived at the same, general conclusion: the self-serving bias was foundmore in western cultures than in eastern cultures. On the one hand, Americans aremore than eastern subjects inclined to explain events in terms of dispositional factors,and typically when it involves successful outcomes implying that people from easterncultures are more modest in the attributions they make. On the other hand, people ineastern cultures are more inclined to assume personal responsibility for a failure thanAmericans do: especially Japanese, but also Indian and Chinese, respondents showeda self-deprecating tendency. For example, Menon and her colleagues (1999) usedactual newspaper stories related to business scandals to establish such culturaldifferences. One of the scandals involved the rogue trading by Nick Leeson leadingto the collapse of Barings, Britain’s oldest bank. Comparison of the attributionsmade in an American newspaper (The New York Times) and in a comparable Japaneseone (Asahi Shimbun), showed the same pattern as previous researchers found inexperimental settings. They found that the American newspaper referred morefrequently to the individual than the organisation as the cause of the financial scandal,the Japanese newspaper, on the other hand, referred more to the organisation as apossible cause.
From the social psychological literature it seems that two interrelated aspects,viz. construal of the self and communication styles are used to explain differences inattributional patterns (e.g., Gudykunst and colleagues, 1986, 1996, 1997; Triandis,1989, 1995; Markus and Kitayama, 1991, 1994; Kagitçibasi, 1997; Semin and Zwier,1997). Both aspects are reflections of differences in individualism, i.e., differences inpatterns of social relationships. In a collectivistic culture as Japan, social ties andgroups are very important. In contrast, in an individualistic culture as the UnitedStates, the person as a separate entity is more important, while the ties betweenindividuals are loose as well (e.g., Hofstede, 1984; Triandis, 1995). These differencesare clearly present in the construal of the self, which defines how a person perceiveshim- or herself vis-à-vis another. Following Markus and Kitayama (1991, 1994) it ispossible to make a distinction between the independent and the interdependentconstrual of the self. The independent construal dictates that a person is independentfrom others and an emphasis is on the expression of one’s unique attributes, and istypical for the individualistic, western cultures. In contrast, in the interdependentconstrual of the self, the person is regarded as not separate from the social contextbut as more connected to and less differentiated from others (Markus and Kitayama,1991: 227). Evidently, this construal predominates in eastern, collectivistic cultures.Differences in the view of the self have implications for people’s verbal behaviours(Markus and Kitayama, 1991) and their definition of self-esteem (Markus andKitayama, 1991, 1994; Nurmi, 1992; Heine and Lehman, 1997). As the focus in theindependent view of the self is on one’s own person it is logical that outcomes areexplained in dispositional terms (Cousins, 1989; Markus and Kitayama, 1991; Morrisand Peng, 1994; Lee, Hallahan, and Herzog, 1996). In addition, self-esteem inindividualistic countries requires that one’s uniqueness is stressed and that innerattributes are expressed (Markus and Kitayama, 1991, 1994). This will lead to self-enhancing behaviours. In collectivistic countries, on the other hand, the focus is onthe social context in which one is operating. Therefore, situational or contextualattributions are expected. Besides, stimulating self-esteem is achieved in a differentway than in individualistic countries. Markus and Kitayama (1991, 1994) note thatpositive feelings about the self should derive from fulfilling the tasks associated withbeing interdependent with relevant others: belonging, fitting in, occupying one’sproper place, engaging in appropriate action, promoting others’ goals, and
6
maintaining harmony. Hence, in these nations there is a “collective self-esteem”(Kagitçibasi, 1997; Crocker and Luhtanen, 1990). Therefore, it should not besurprising that self-enhancement or self-promotion are perceived negatively in theJapanese culture (Markus and Kitayama, 1991). In these cultures modesty is the normreflecting the influence of Confucius (Heine, Takata, and Lehman, 2000). Indeed,Kitayama et al. (1997) and Akimonto and Sanbonmatsu (1999) argue that the fact thatpeople in eastern societies are more sensitive to negative self-relevant informationthan people from western cultures, does not imply that they are low(er) in self-esteem. Rather, such a kind of behaviour has positive consequences in easterncultures: it serves to affirm one’s belongingness to a group and can be seen as part ofa strategy of self-improvement (Meijer and Semin, 1998: 17). Therefore, it may beargued that the modesty and self-deprecating tendency typically found in theJapanese culture is the result of a consideration of others. Otherwise stated, theJapanese seem to make sure not to deny others’ contribution to a success, and savetheir face by not blaming them in any way for a failure, also because blaming otherswould disrupt harmony in a relationship (Meijer and Semin, 1998: 15). Anotherrelated difference between the Americans and the Japanese involves differences inself-evaluations. Whereas the Americans are more prone to information regardingtheir positive characteristics, the Japanese have a more self-critical orientation (Heine,Lehman, Markus, and Kitayama, 1999 and Heine et al., 2000). According to, e.g.,Heine et al. (2000) the main reason for such a focus on one’s weaknesses is thecontinue urge for self-improvement among the Japanese.
The second factor that may explain the differences in the amount of the self-serving attributional bias concerns the communication style. Hall (1977) proposedthat the context is important in understanding the messages people convey and thatthe importance of the context varies across cultures. He distinguished high-contextand low-context communication cultures, although admitting that each culture haselements of both. Following Hall (1977: 91) a high-context communication ormessage is one in which most of the information is either in the psychical context orinternalised in the person, while very little is in the coded, explicit part of the message.Zwier (1998) characterises this high-context style as indirect, implicit, and affective(see also Gudykunst et al., 1996). A low-context communication is according to Hall(1977: 91) just the opposite; i.e., the mass of the information is vested in the explicitcode. Therefore, it can be characterised as a direct, explicit and instrumentalcommunication style (Zwier, 1998; Gudykunst et al., 1996). Following Gudykunstand Ting-Toomey (1988) and Singelis and Brown (1995) it appears that inindividualistic countries, e.g., the United States and most of north-western Europethe use of low-context communication styles predominates. In collectivistic countries,e.g., Japan, southern European and Latin American countries, however, the high-context communication style is more apparent. Ehrenhaus (1983) related Hall’svariations in context to attributional styles. He argued that members in high-contextcultures are attributionally sensitive and predisposed toward situational features andsituationally based explanations. Members of low-context cultures, on the other hand,are attributionally sensitive to and predisposed towards dispositional characteristicsand dispositionally based explanations (1983: 263). In addition it also seems that in ahigh-context culture, e.g., Japan, people in high positions are more prepared toaccept responsibility for a failure than similar people from low-context cultures, suchas the United States and the Netherlands (Hall, 1977). In the latter case frequently alow(er)-ranked scapegoat is offered: Oliver North in the contra’s-Iran scandal is onlyone famous example underscoring this. Finally, Triandis (1994: 184-185) also pointsto several important differences in communication styles between individualistic (or

7
low-context) and collectivistic (or high-context) cultures. First, in individualisticcultures the focus is on the communicator, also evidenced by the fact that the word“I” is used frequently. In these cultures, attributes as credibility, intelligence, andexpert knowledge are important. On the other hand, in collectivistic cultures, thefocus to a larger extent is on the receiver. In addition, the word “we”, stressinginterdependency, is also emphasised, whereas ambiguity, subjectivity, generality, andvagueness in communication is also more common. This could indicate that the useof accounting-technical language (Aerts, 1991, 1994) would be even more prevalentin these cultures than it is in an individualistic culture such as Belgium.
PROPOSITIONS AND RESEARCH DESIGNAs indicated in the introduction the primary aim of this paper is to explore whetherthere is a cultural difference in annual reports regarding the explanations offered inthe CEO’s letter to the shareholders. Notwithstanding the exploratory mode of thispaper, we derived the following propositions based upon the review of the literature.
P1 Both Japanese as well as American companies will show a self-serving tendency to explainorganisational results in their letters to the shareholders, although this tendency is stronger inthe United States than in Japan.
P2 Japanese companies will ascribe positive outcomes (e.g., an increase in profits) to causes externalto the organisation to a larger extent than American companies in the letter to the shareholders(“modesty tendency”).
P3 Japanese companies are more inclined to accept blame for a negative outcome (e.g., a loss ordecreasing profits) by ascribing it to internal causes than American companies (“self-deprecatingtendency” or self-criticism).
P4 The use of accounting-technical language to explain organisational outcomes is more prevalent inJapanese letters to the shareholders (a high communication-context culture) than in those fromthe United States (a low communication-context culture).
In this study we focused on large companies from the United States and Japan.Three reasons justify this choice. First, and foremost, these countries representcultures with significant differences with regard to the individualism-collectivismdimension, which constitute the most important factor influencing culturaldifferences in attributional behaviour as previous research has indicated. Second,previous studies within social psychology indicating such a cultural difference alsopredominantly focused on these two countries. Lastly, the United States and Japanare economically important countries, both in terms of representation of companiesin, e.g., the Fortune Global 500, as well as in terms of size of the stock market.
The selection of the companies from these countries was based on the 1999Fortune Global 500 list, resulting in 30 companies from the United States and Japan(the appendix provides a list of the companies included). Because of their specificnature, we excluded financial companies beforehand. Of the companies included inour study we used the most recent annual report. In large part the US companies hada year-end of 31 December 1999, whereas the Japanese companies predominantlyhad a year-end of 31 March 1999. All the reports included in this study were inEnglish, also for the Japanese companies. A survey distributed among investorrelations department of 70 large Japanese companies (selected from the Fortune
8
Global 500), to which 26 companies responded revealed that 19 or 73% distributedan English annual report only among investors.
In order to be able to provide answers to the propositions posited earlier andas we are dealing with narrative statements in annual reports we used content analysis,which is a research method that uses a set of procedures to make valid inferencesfrom text (Weber, 1990: 9). This technique was also used in related studies by Aerts(1991, 1994, 1996), Bettman and Weitz (1983), Clapham and Schwenk (1991),Salancik and Meindl (1984), and Staw et al. (1983) (see Jones and Shoemaker (1994)for an overview of the application of content analysis in accounting). The objectiveof content analysis here is to establish in what way directors explain organisationalperformances in the letter to the shareholder. Hence, basically we are interested in“causal statements”. A causal statement or attribution refers to one or more coherentsentences or phrases (i.e., part of sentence) in which an organisational outcome (i.e.,profits, sales, revenues, etc.) is connected with a cause or reason (“explanatoryvariable”) for that outcome. Causal statements may be related to past/present orfuture organisational outcomes. The fiscal year under consideration is the point ofreference for deciding on past/present outcomes. Frequently, a causal statement maybe recognised explicitly because connective words or phrases are used, for example:“influenced by”, “is caused by”, “contributed to”, “can be ascribed to”, “because”,“despite”, “notwithstanding”, and so on. However, a sentence or phrase isconsidered a causal statement as well if no such connective words or phrases arepresent, but a causal relationship between an organisational outcome and explanatoryvariable can implicitly be derived from the text. To be considered a causal statement,a cause-effect relationship has to be clearly present. Furthermore, organisationaloutcome (“effect”) and explanatory variable (“cause”) have to appear in proximity,e.g., within one or two sentences, or within the same paragraph. Whenever severalcauses or reasons (“explanatory variable”) are provided to explain one organisationaloutcome, whether or not in the same sentence, each of those combinations aretreated as a separate causal statement.
The identified causal statements are then coded along a number ofdimensions, including the following.1. Valence of effect, indicating whether the outcome explained is to be evaluated
positive (e.g., increase in sales, decrease in loss et cetera) or negative (e.g.,decrease in sales, increase in profits et cetera) from the directors’ point of view.
2. Locus of causality, which aims to measure whether a cause is internal (e.g., due tocorporate strategy, other management’s decisions, quality of personnel et cetera)or is external and beyond management’s control (e.g., general economicconditions, inflation, interest, a natural disaster, et cetera).
3. Direction of cause-effect relationship, revealing whether cause and effect have the samesign (e.g., increase in profits due to a well established corporate strategy) or haveopposite signs (e.g., despite the Asia Crisis we were able to increase our sales).
4. Language of causal statement, a dimension aimed at measuring whether the cause-effect relationship is expressed in clear-cut causal language or in accounting-technical language. An example of the latter is that profits rose as a consequenceof decreasing financial costs.
20% of the letters to the shareholders were independently coded by two coders. Ascan be seen in table I the intercoder reliability, as expressed by the correlationcoefficients, is reasonably high and comparable to previous studies.

9
Take in Table I
RESULTSTable II below contains descriptive data relating to the general financialcharacteristics of the Japanese and American companies included in the sample.Regarding average sales no statistical significant difference is found. The Americancompanies, however, had on average a significant larger net income to report (p =0,000). In that respect, the American companies experienced a better year than thosefrom Japan did. Data obtained from the Worldscope database reveals that theJapanese companies included in our study had a net income decline of approximately64,64% to report, reflecting among others the Asia Crisis. Nevertheless, still 9 of theJapanese companies could report a positive growth in net income. With respect tosales a similar picture emerge: overall they reported a contraction of sales by 6,48%.The American companies included in our study, on the other hand, had goodperformances to report: overall sales increased by 15,21%, while net income rose by17,51% (21 American companies reported an increase in net income).
Take in Table II
Although the American CEOs had, comparatively speaking, good news to reportthey produced only slightly larger letters to the shareholders than their Japanesecounterparts did when measured in number of pages (p = 0,075). However, whenmeasured in terms of standardised lines the Americans did have larger letters (p =0,003): on average their letters counted 126,97 lines, while the Japanese letters onlyhad 96,66 lines (see table III below).
Take in Table III
Despite that the Americans, on average, produced somewhat larger letters to theshareholders than the Japanese CEOs did, no difference was found regarding thenumber of causal statements contained in the letters. On average the letters to theshareholders contained 6 to 7 causal statements each. This figure is quite comparableto the Salancik and Meindl (1984) and the Clapham and Schwenk (1991) studies, inwhich on average 8,5 and 7, respectively causal statement per letter were found. It islarger than the number found in the Bettman and Weitz' study (1983), who onaverage found 2,3 causal statements per letter. However, in this study only explicit,easily identifiable statements were included. Furthermore, the Japanese CEOsaddressed less organisational outcomes in their letters than their colleagues from theUnited States did: 2,43 and 3,53, for Japan and U.S. respectively, although thisdifference was not significant. This slightly more extensive explanatory behaviour bythe Japanese, both in terms of number of causal attributions and number of reasonsto explain one organisational outcome, is in line with previous social psychologicalresearch which suggested that, especially unexpected, negative outcomes arouse thesearch for causal explanations (e.g., Schlenker, 1980; Weiner, 1986). It is also in linewith the previous attributional research on letters to the shareholders (Bettman and

10
Weitz, 1983; Salancik and Meindl, 1984). It seems that CEOs want to give theappearance of being in control by providing reasons for the poor performance. Ingood times, a good strategy seems to let the results speak for themselves to a certainextent.
Table IV presents an indication of the difference between in the countriesregarding the valence of the explained effects. In line with the negative performancetrend that the Japanese companies experienced, 65,3% of the causal attributions hada negative valence from the CEO's or company's point of view. The Americans onthe other hand had mostly positive outcomes to report: only 14,4% of the causalattributions had a negative valence. This difference in valence of evaluated effectsbetween the United States and Japan is statistically significant (χ2 = 93,55 and p =0,000).
Take in Table IV
Table V presents the average scores regarding the ascription of positive andnegative outcomes to internal or external causes for the whole sample, without takinginto account the relative trend in profits. Using a non-parametric test (Mann-Whitney), we found the U.S. companies claiming positive results to a larger extentthan their Japanese counterparts did. Indeed, the Japanese ascribed almost half of thetotal amount of positive effects to factors beyond their control.
Take in Table V
The Japanese CEO's, on the other hand, who on average had to account fordeclining profits, were more willing to assume personal responsibility for this relativefailure than their American colleagues. However, they also blamed the environmentto a larger extent than the CEO's from the United States did. These findings, andparticularly those concerning IP and IN provide some indication that there is adifference in explanatory behaviour between American and Japanese CEOs. Morespecifically, the results seem to support proposition 2 and indicate that JapaneseCEOs are more modest in the ascription of positive outcomes than their Americancolleagues, i.e., also include the environment as a cause. In addition, although theJapanese also lay blame on the environment for the losses incurred, they also acceptblame for them to a larger extent than the American CEOs did. On average, theJapanese CEOs mentioned a internal cause 4 times as much as the Americans toexplain a decline in net income. Therefore, these results also seem to supportproposition 3, indicating that the Japanese are more self-deprecating than theAmericans.
In order to measure self-serving tendencies we compared the average numberof evaluated effects ascribed to internal versus external causes. Self-enhancing ofpositive outcomes implies more taking credit than involving the environment as apossible cause, i.e., IP - EP > 0. Self-protection is just the opposite with respect tonegative outcomes, i.e. EN - IN > 0, implying that people are more likely to blamethe environment for a failure than to assume personal responsibility for it. Below(table VI) the data to establish these tendencies in the United States and Japan arepresented.

11
Take in Table VI
On average the CEOs from the United States show self-enhancing tendencies (i.e.,IP - EP > 0): they claim successes by ascribing them to causes internal to theorganisation, e.g., a well-established strategy, good management, etc. The Japanese,on the other hand, show self-protecting tendencies (EN - IN > 0): on average, theyblamed the environment, e.g., the Asia Crisis, the low exchange rate of yen to the USdollar, etc., for the deterioration in performance they experienced. Furthermore, aMann-Whitney test reveals that the for the whole sample, the Americans are moreself-enhancing than the Japanese (Mann-Whitney U= 183,500 and p-value = 0,000),whereas the Japanese are more self-protecting (Mann-Whitney U = 297,000 and p-value = 0,016) than the Americans. These results seem logical given the difference inperformance (in terms of net income) between the two countries: on average, theAmericans had to account for successes, whereas the Japanese had to explain failures.
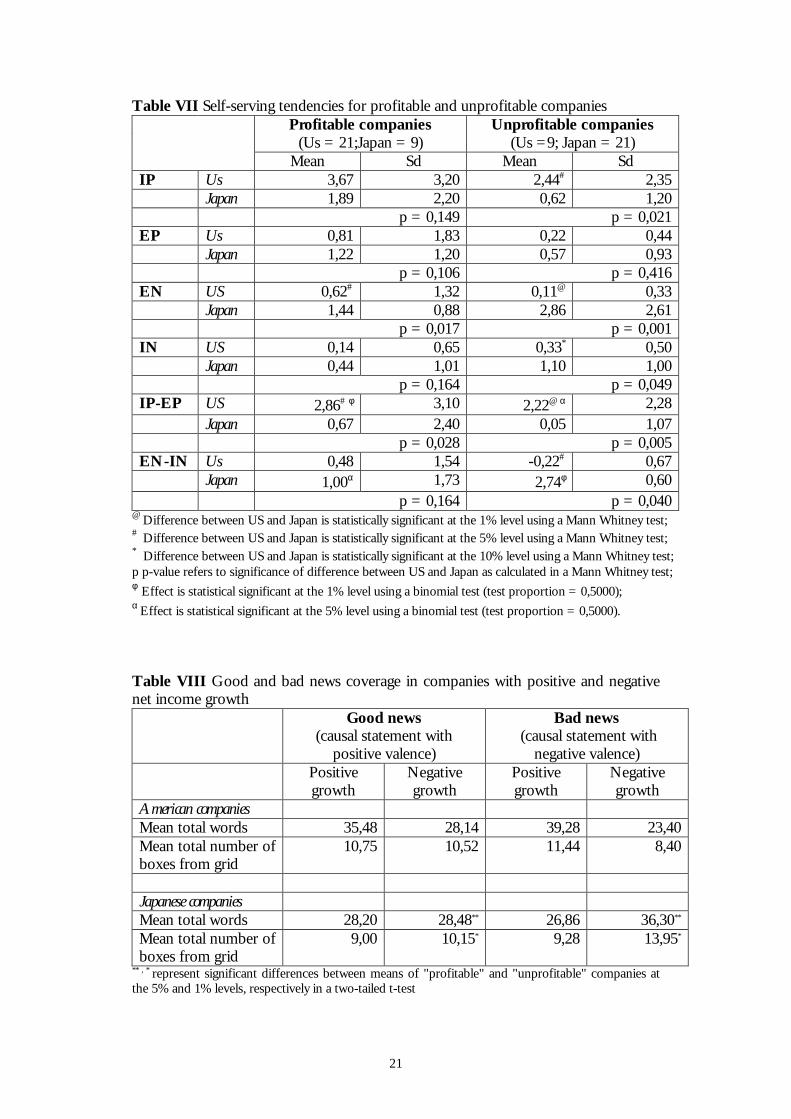
In addition, we also performed separate tests to compare the behaviours ofprofitable and unprofitable American and Japanese firms (i.e., those experiencing apositive and negative income growth, respectively); see table VII below.
Take in Table VII
The results are comparable to the whole sample: both the profitable and unprofitableAmerican firms showed self-enhancing tendencies, whereas no self-protectingtendencies were noticeable. The Japanese, on the other hand, irrespective ofperformance showed self-protecting tendencies, but we could not find any self-enhancing tendencies. Furthermore, although the Japanese attributed positive effectsmore to the environment and are more willing to accept blame for failures than theAmerican CEOs in the case of both profitable and unprofitable firms, this differencewas statistically not significant (except for unprofitable Japanese CEOs acceptingmore blame for negative outcomes than their American colleagues). Given thesedifferences in performances reported, the results seem to support proposition 1:both American and Japanese companies show self-serving tendencies in their letterto the shareholders.
In this study we also looked at more subtle ways of impression management.More specifically we studied whether we could discover variations in language use inthe letters to the shareholders between the two nations. First of all we looked at thelength of causal statements concerning positive and negative outcomes respectively.In a recent study of UK letters to the shareholders Clatworthy and Jones (1998)tested whether managers of 50 profitable and 50 unprofitable companies useddifferential reporting strategies with regard to good and bad news. Their resultsshowed that companies prefer to stress good news: both profitable and unprofitablefirms devoted more space to good news than to bad news. In our study we alsoinvestigated whether the amount of space devoted to good news is larger than thatdevoted to bad news in both Japan and the United States. The length was measuredin two ways: not only did we count the number of words, in addition we alsomeasured the length by using a uniform grid, i.e., a transparent A4-sheet divided into400 boxes of equal size. The results are presented in table VIII. The American
12
companies on average used a balanced coverage strategy: we could not find asignificant difference in the amount of space devoted to good or bad news. A similarresult was obtained by Bettman and Weitz (1983) in their study of American lettersto the shareholders: they were neither able to find any main effects. This is quitedifferent from the results of the Clatworthy and Jones (1998) study. Possibleexplanations for this divergence might be that we focused on causal statements secand used sentences (from one punctuation to another) to measure the amount ofspace, whereas in the Clatworthy and Jones study the individual positive or negativewords were used to measure the amount of space. Furthermore, the items includedas good or bad news in the Clatworthy and Jones study were broader than our study,as we only included causal statements regarding accounting outcomes andshareholder value.
Take in Table VIII
The Japanese companies that reported a positive growth in net income used a similarcoverage strategy as their American counterparts did: the amount of space devoted inthe letter to the shareholders to good and bad news is balanced (i.e., no statisticallysignificant difference could be found). The Japanese companies that experienced abad year, on the other hand, particularly seemed to feel the need of providingexplanations for this results: both in terms of words and boxes the amount of spacedevoted to bad news was larger than that devoted to good news. This finding is inline with previous social psychological research which suggests that the amount ofcausal reasoning will be more extensive if outcomes are unfavourable and/orunexpected (Weiner, 1986).
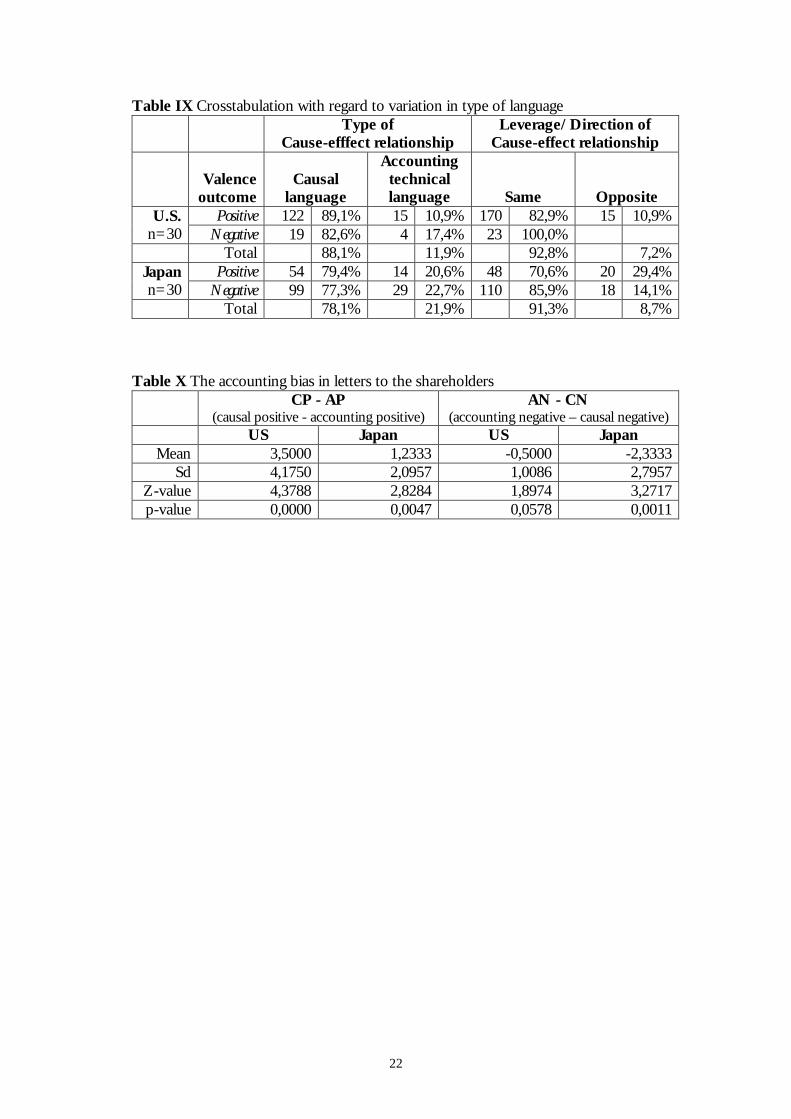
Furthermore, we also looked at the way causal statements are expressed:either in clear-cut causal language or in accounting-technical language whereresponsibility may not easily be assigned. The results are presented in table IX.
Take in Table IX
Although in both the American and Japanese letters to the shareholders accounting-technical language is used more frequently to explain negative outcomes than toexplain positive outcomes, this difference is statistically not significant. However, itseems that the use of accounting-technical language is more prevalent in Japan thanin the United States (χ2 = 3,477 and p = 0,052) and particularly to explain positiveeffects. Regarding negative effects we could not find any significant difference inlanguage use between the two countries (χ2 = 0,316). Overall, i.e., when not takinginto account the valence of the explained effects, the results support proposition 4:the Japanese used accounting-explanations to a larger extent than the Americans didto explain organisational outcomes (χ2 = 5,994 and p-value = 0,010). We alsochecked for the presence of the so-called accounting bias implying that positiveoutcomes are accounted for in causal language, while negative outcomes are moreaccounted for in accounting-technical language (see, Aerts, 1994).
Take in Table X

13
Table X indicates that in both the United States as well as in Japan positive outcomesare predominantly accounted for in causal language as is in line with Aerts' findings.However, contrary to his results, we find that negative outcomes are also explained incausal language, indicating that the CEOs of both countries are not inclined toconceal the reasons for a decline in sales, income etc. by using such accountingexplanations.
Furthermore, we also looked at the direction of the cause-effect relationship(see table IX). Variations in directions may be used as subtle impression managementtechniques: in order to leverage or highlight a certain effect, e.g., "Notwithstandingthe Asia Crisis out net income rose to 4,035 billion". Because of this characteristicthe use of such form of impression management seems particularly logical to explainpositive outcomes, but not to explain negative outcomes. In the letters to theshareholders we examined, such leverage was mostly used to account for positiveoutcomes as expected (US: χ2 = 2,779 and p = 0,087; Japan: χ2 = 6,694 and p =0,009). Furthermore, it seems that the Japanese used it to a larger extent than theAmericans to explain negative outcomes. These outcomes may be seen a furtherindication of the self-deprecating tendencies of the Japanese people.
DISCUSSION AND CONCLUSIONIn this paper we investigated the CEO’s letter to the shareholders of 30 largeAmerican and Japanese companies. The main purpose of this study was to examinepossible variations in attributions of positive and negative organisational outcomes asa function of different cultural backgrounds between the two countries. Wepredicted, in line with the social psychological research, that both Japanese andAmerican CEOs will show self-serving tendencies when explaining outcomes in theirletters to the shareholders. Furthermore, it was also hypothesised that whencompared to the American CEOs, the Japanese CEOs would be more modest inattributing positive outcomes, i.e., also are inclined to ascribe them to external causes,and more self-deprecating with regard to negative outcomes, i.e., accept blame byascribing them to internal causes. The attributional patterns found in the lettersstudied to a large extent supported these propositions. Both the American and theJapanese CEOs show self-serving tendencies: on average, the Americans ascribed thepositive outcomes they experienced to their own efforts (i.e., causes internal to theorganisation). The Japanese, who on average had to account for declining profits,showed a self-protecting tendency: they blamed the environment, e.g., the Asia Crisis,for the bad results. However, they were also more modest in the attribution ofpositive results than the Americans: they referred to external factors as possiblecauses to a larger extent. However, somewhat more surprisingly, they leveragedpositive outcomes also to a larger extent, thereby somewhat weakening their modesty.Regarding negative outcomes, the Japanese CEOs are very alike the ordinary people:they show a strong self-deprecating tendency. Compared to their Americancolleagues they not only referred to internal factors as causes more often, in additionthey leveraged the negative outcomes by using opposite directions between cause andeffect (e.g., despite the expanding economies of the United States and in Europe, wereported a net loss of 5,389 billion). Furthermore, we also looked at the languageused to explain positive and negative outcomes. Aerts (1994) hypothesised and foundthat Belgian firms prefer to explain negative outcomes in ambiguous accounting-technical language in which responsibility is not really addressed, whereas positive

14
outcomes were explained in more clear-cut causal language. In our study, however,we did not find such a bias: both positive and negative outcomes are explained incausal language. However, our study did reveal a cultural difference: as expected, theJapanese used accounting technical language to a larger extent than the AmericanCEOs. In sum, the results found in this study largely concur with those found inearlier social psychological research: CEOs are like ordinary people and show thesame tendencies.
REFERENCESAbrahamson, E. and C. Park (1994). “Concealment of negative organisational
outcomes: An agency theory perspective.” Academy of management journal, vol. 31:1302-1334.
Aerts, W. (1991). “Rekenschap en legitimatie. Studie van het publiek gebruik vanboekhoudkundige informatie in een verhalende context.” Academic PhD-ThesisRUFA. Antwerp.
Aerts, W. (1994). “On the use of accounting logic as an explanatory category innarrative accounting disclosures.” Accounting, organisations and society, vol. 19: 337-353.
Aerts, W. (1996). “Inertia in corporate explanation patterns and annual reporting.”Working paper RUCA/Departement toepgepaste economische wetenschappen 96/18.
Aerts, W. and H. Theunisse (2000). “Listing status of the firm as motivational factorfor attributional search in annual reporting”. Paper presented at the 23rd EAACongres, Munich.
Akimoto, S. A. and D. M. Sanbonmatsu (1999). “Differences in self-effacingbehaviour between European and Japanese Americans.” Journal of cross-culturalpsychology, vol. 30:: 159-177.
Bettman, J. R. and B. A. Weitz (1983). “Attributions in the board room: Causalreasoning in corporate annual reports.” Administrative science quarterly, vol. 28:165-183.
Bozeman, D. P. and K. M. Kacmar (1997). “A cybernetic model of impressionmanagement processes in organisations.” Organisational behaviour and humandecision processes, vol. 69: 9-30.
Chanchani, S. and A. MacGregor (1999). “A synthesis of cultural studies inaccounting”. Journal of accounting literature, vol. 18: 1-30.
Choi, I. and R. E. Nisbett (1998). “Situational salience and cultural differences in thecorrespondence bias and actor-observer bias.” Personality and social psychologybulletin, vol. 24: 949-960.
Choi, I., R. E. Nisbett, and A. Norenzayan (1999). “Causal attribution acrosscultures: Variation and universality.” Psychological bulletin, vol. 125: 47-63.
Clapham, S. E. and C. R. Schwenk (1991). “Self-serving attributions, managerialcognition, and company performance.” Strategic management journal, vol. 12: 219-229.
Clatworthy, M. and M. J. Jones (1999). “The reporting strategies of profitable andunprofitable accounting narratives: Some preliminary findings.” Unpublishedworking paper, Cardiff Business School.
Courtis, J. K. (1998). “Annual report readability variability: Tests of the obfuscationhypothesis.” Accounting, auditing and accountability journal, vol. 11: 459-471.
Cousins, S. D. (1989). “Culture and self-perception in Japan and the United States.”Journal of personality and social psychology, vol. 56: 124-131.
15
Crocker, J. and R. Luhtanen (1990). “Collective self-esteem and ingroup bias.” Journalpersonality and social psychology, vol. 58: 60-67.
D’Aveni, R. A. and I. C. MacMillan (1990). “Crisis and the content of managerialcommunications: A study of the focus of attention of top managers in survivingand failing firms.” Administrative science quarterly, vol. 35: 634-657.
Ehrenhaus, P. (1983). “Culture and the attribution process.” In W. B. Gudykunst(ed.), Intercultural communication theory. Beverly Hills, CA: Sage.
Fiol, C. M. (1989). “A semiotic analysis of corporate language: Organisationalboundaries and joint venturing.” Administrative science quarterly, vol. 34: 277-303.
Fiol, C. M. (1995). “Corporate communications: Comparing executive’s private andpublic statements.” Academy of management journal, vol. 38: 522-536.
Gibbins, M., A. Richardson, and J. Waterhouse. “The management of corporatefinancial disclosure: Opportunism, ritualism, policies, and processes”, Journal ofaccounting research, vol. 28: 121-143.
Goffman, E. (1959). “The presentation of self in everyday life.” New York: AnchorBooks.
Gray, S.J. (1988). “Towards a theory of cultural influence on the development ofaccounting systems internationally.” Abacus, vol. 24: 1-15.
Gudykunst, W. B. (1997). “Cultural variability in communication: An introduction.”Communication research, vol. 24: 327-348.
Gudykunst, W. B., Y. Matsumoto, S. Ting-Toomey et al. (1996). “The influence ofcultural individualism-collectivism, self construals, and individual values oncommunication styles across cultures.” Human communication research, vol. 22: 510-543.
Gudykunst, W. B. and T. Nishida (1986). “Attributional confidence in low- and high-context cultures.” Human communication research, vol. 12: 525-549.
Gudykunst, W. B. and S. Ting-Toomey (1988). “Culture and interpersonalcommunication.” Newbury Park, CA: Sage.
Hall, E. T. (1977). “Beyond culture.” New York: Achor Books.Heider, F. (1958). “The psychology of interpersonal relations.” New York: John
Wiley & Sons.Heine, S. J. and Lehman, D. R. (1997). “The cultural construction of self-
enhancement: An examination of group-serving biases.” Journal of personality andsocial psychology, vol. 72: 1268-1283.
Heine, S.J., D.R. Lehman, H.R. Markus, and S. Kitayama (1999). “Is there a universalneed for positive self-regard?”, Psychological review, vol. 106: 766-794.
Heine, S.J., T. Takata, and D.R. Lehman (2000). “Beyond self-presentation: Evidencefor self-criticism among Japanese.” Personality and social psychology bulletin, vol. 26:71-78.
Hines, R. D. (1988). “Financial accounting: In communicating reality, we constructreality.” Accounting, organisations and society, vol. 13: 251-261.
Hofstede, G. (1980). “Culture’s consequences: International differences in work-related values.” Beverly Hills, CA: Sage.
Hofstede, G. (1984). “Cultural dimensions in management and planning.” Asia Pacificjournal of management, vol. ??: 81-99.
Hopwood, A. G. (1996). “Making visible and the construction of visibilities: Shiftingagendas in the design of the corporate report: An introduction.” Accounting,organisations and society, vol. 21: 54-56.
Johns, G. (1999). “A multi-level theory of self-serving behaviour in and byorganisations.” In B. M. Staw and R. I. Sutton (eds.), Research in organisationalbehaviour, vol. 21. Greenwich, Connecticut: JAI Press.

16
Jones, M. J. and P. A. Shoemaker (1994). “Accounting narratives: A review ofempirical studies of content and readability.” Journal of accounting literature, vol. 13:142-184.
Kagitçibasi, C. (1997). “Individualism and collectivism.” In J. W. Berry et al. (eds.),Handbook of cross-cultural psychology, Volume 3: Social behaviour andapplications. Boston: Allyn and Bacon.
Kashima, Y. and H. C. Triandis (1986). “The self-serving bias in attributions as acoping strategy: A cross-cultural study.” Journal of cross-cultural psychology, vol. 17:83-97.
Kitayama, S., Markus, H. R., Matsumoto, H., and Norasakkunkit, V. (1997).“Individual and collective processes in the construction of the self: Self-enhancement in the United States and self-criticism in Japan.” Journal of personalityand social psychology, vol. 72: 1245-1267.
Leary, M. R. (1996). “Self-presentation: Impression management and interpersonalbehaviour.” Boulder, COL: Westview Press.
Leary, M. R. and R. M. Kowalski (1990). “Impression management: A literaturereview and two-component model.” Psychological bulletin, vol. 107: 34-47.
Lee, F., M. Hallahan, and T. Herzog (1996). “Explaining real-life events: How cultureand domain shape explanations.” Personality and social psychology bulletin, vol. 22:732-741.
Lee, T. (1994). “The changing form of the corporate annual report”. The accountinghistorians journal, vol. 21: 215-232.
Lee, Y. T. and M. E. P. Seligman (1997). “Are Americans more optimistic than theChinese?” Personality and social psychology bulletin, vol. 23: 32-40.
Markus, H. R. and S. Kitayama (1991). “Culture and the self: Implications forcognition, emotion and motivation.” Psychological review, vol. 98: 224-253.
Markus, H. R. and S. Kitayama (1994). “The cultural construction of self andemotion: Implications for social behaviour.” In S. Kitayama and H. R. Markus(eds.), Emotion and culture: Empirical studies of mutual influence. Washington:APA.
Markus, H. R., S. Kitayama, and R. J. Heiman (1996). “Culture and “basic”psychological principles.” In E. T. Higgins and A. W. Kruglanski (eds.), Socialpsychology: Handbook of basic principles, New York: Guilford Press.
Meijer, Z. Y. and G. R. Semin (1998). “When the self-serving bias does not serve theself: Attributions of success and failure in cultural perspective.” Working paperFree University Amsterdam.
Menon, T., M. W. Morris, C. Chiu, and Y. Hong (1999). “Culture and construal ofagency: Attribution to individual versus group dispositions.” Journal of personalityand social psychology, vol. 76: 701-717.
Morris, M. W. and K. Peng (1994). “Culture and cause: American and Chineseattributions for social and physical events.” Journal of personality and social psychology,vol. 67: 949-971.
Nurmi, J. (1992). “Cross-cultural differences in self-serving bias: Responses to theattributional style questionnaire by American and Finnish students.” The journalof social psychology, vol. 132: 69-76.
Preston. A. M., C. Wright, and J. J. Young (1996). “Imag[in]ing annual reports.”Accounting, organisations and society, vol. 21: 113-137.
Salancik, G. R. and J. R. Meindl (1984). “Corporate attributions as strategic illusionsof management control.” Administrative science quarterly, vol. 29: 238-254.
Schlenker, B.R. (1980). “Impression management: The self-concept, social identity,and interpersonal relations.” Montery, CA: Brooks/Cole Publishing Company.

17
Schlenker, B. R. and M. F. Weigold (1992). “Interpersonal processes involvingimpression regulation and management.” Annual review of psychology, vol. 43: 133-168.
Semin, G. R. and S. M. Zwier (1997). “Social cognition.” In J. W. Berry et al. (eds.),Handbook of cross-cultural psychology, Volume 3: Social behaviour andapplications. Boston, MA, Allyn and Bacon.
Singelis, T. M. and W. J. Brown (1995). “Culture, self, and collectivistcommunication: Linking culture to individual behaviour.” Human communicationresearch, vol. 21: 354- 389.
Staw, B. M., P. I. McKechnie, S. M. Puffer (1983). “The justification oforganisational performance.” Administrative science quarterly, vol. 28: 582-600.
Triandis, H. C. (1989). “The self and social behaviour in differing cultural contexts.”Psychological review, vol. 96: 502-520.
Triandis, H. C. (1994). “Culture and social behaviour.” New York: McGraw-Hill.Triandis, H. C. (1995). “Individualism and collectivism.” Boulder: Westview.Weber, R. P. (1990). “Basic content analysis.” Newbury Park, CA: Sage.Weiner, B. (1985). “An attributional theory of achievement motivation and
emotion.” Psychological review, vol. 92: 548-573.Weiner, B. (1986). “An attributional theory of achievement motivation and
emotion.” New York: Springer Verlag.Weiner, B., I. Frieze, A. Kukla, L. Reed, S. Rest, and R. M. Rosenbaum (1971).
“Perceiving the causes of success and failure.” Morristown: General learningpress.
Zwier, S. M. and G. R. Semin (1997). “Culturele verschillen in zelfpresentatie.”Fundamentele sociale psychologie, vol. 11: 135-149.
Zwier, S. M. (1998). “Patterns of language use in individualistic and collectivisticcultures.” Ph.D. Thesis, Free University Amsterdam.

18
APPENDIX: COMPANIES EXAMINED
US JapanGeneral Motors MitsuiWal-Mart ItochuExxon ToyotaGeneral Electric MarubeniFord Motors SumitomoPhilip Morris Nissho IwaiCompaq HitachiBoeing MatsushitaIBM SonyAt&T NissanHewlett Packard HondaK-Mart Mitsubishi ElectricProcter&Gamble Nippon SteelDuPont BridgestoneBellAtlantic FujitsuHomeDepot NECLucent Technologies CanonSears, Roebeck & Co. JuscoIntel Corp. MazdaChevron SharpMerck SuzukiSBC Com. Fuji FilmJC Penney DDIKroger Japan AirlinesLockheed DNPMotorola Kobe SteelTexaco Asahi GlassUSPS ToppanGTE ToshibaUTC Mitsubishi Corporation

19
TABLES
Table I Intercoder reliability of dataCorrelationcoefficient
p-value(one-tailed test)
Valence 1,000 0,000Locus 0,895 0,000Direction 0,767 0,000Language 0,386 0,011
Table II General financial characteristicsU.S. companies Japanese companies
Average sales (in th USD) 60.108.767 45.835.805Average net income(in th USD) 4.001.883 137.995
Sales growth (%)# 15,21% (6,48%)Net income growth (%)# 17,51% (64,64%)
# In the case of Japan the growth % is based on JPY figures
Table III Descriptive data regarding letters to the shareholdersU.S. Companies Japanese companies
Average length in numberof pages
3,93 (2,05)** 3,43 (1,36)
Average length in numberof lines divided by number
of columns per page
126,97 (69,28) * 96,66 (30,40)
Average number of causalstatements in letter
5,50 (5,69) 6,53 (4,02)
Average number ofexplained effects in letter
3,53 (3,45) 2,43 (2,88)
Average number ofexplanations per outcome
3,13 (4,09) 4,43 (3,35)
** , * represent significant differences between means of U.S. and Japanese companies at the 10% and1% levels respectively in two tailed t-tests. The numbers between brackets represent the standarddeviations.

20
Table IV Crosstabulation Country * Valence explained effectValence explained effect
Positive NegativeNumber % Number %
United States 137 85,6% 23 14,4%Japan 68 34,7% 128 65,3%Total 205 57,6% 151 42,4%
Table V Descriptive data regarding causal statementsAmerican companies
(n=30)Japanese companies
(n=30)Mean Sd % Mean Sd %
Internal, positive (IP) 3,30 2,98 83,90% 1,00# 1,64 56,60%External, positive (EP) 0,63 1,56 16,10% 0,77 1,04 43,40%
Internal, negative (IN) 0,20 0,61 31,58% 0,90# 1,03 27,00%External negative (EN) 0,47 1,14 68,42% 2,43# 2,31 73,00%
# Difference between United States and Japan is statistically significant at the 1% level
Table VI Self-serving tendencies in American and Japanese letters to the shareholdersMean Sd Z-value p-value
United States (n=30)IP – EP (self-enhancement) 2,6667 2,8567 -4,3788# 0,0000EN – IN (self-protection) 0,2667 1,3629 -0,6325 0,5271
Japan (n=30)IP – EP (self-enhancement) 0,2333 1,5687 -1,0000 0,3173EN – IN (self-protection) 1,5333 2,4738 -3,5301# 0,0004
# Effect is statistically significant at the 1% level using a (non-parametric) binomial test with test-proportion = 0,50
21
Table VII Self-serving tendencies for profitable and unprofitable companiesProfitable companies Unprofitable companies
(Us = 21;Japan = 9) (Us =9; Japan = 21)Mean Sd Mean Sd
IP Us 3,67 3,20 2,44# 2,35Japan 1,89 2,20 0,62 1,20
p = 0,149 p = 0,021EP Us 0,81 1,83 0,22 0,44
Japan 1,22 1,20 0,57 0,93p = 0,106 p = 0,416
EN US 0,62# 1,32 0,11@ 0,33Japan 1,44 0,88 2,86 2,61
p = 0,017 p = 0,001IN US 0,14 0,65 0,33* 0,50
Japan 0,44 1,01 1,10 1,00p = 0,164 p = 0,049
IP-EP US 2,86# φ 3,10 2,22@ α 2,28Japan 0,67 2,40 0,05 1,07
p = 0,028 p = 0,005EN-IN Us 0,48 1,54 -0,22# 0,67
Japan 1,00α 1,73 2,74φ 0,60p = 0,164 p = 0,040
@ Difference between US and Japan is statistically significant at the 1% level using a Mann Whitney test;# Difference between US and Japan is statistically significant at the 5% level using a Mann Whitney test;* Difference between US and Japan is statistically significant at the 10% level using a Mann Whitney test;p p-value refers to significance of difference between US and Japan as calculated in a Mann Whitney test;φ Effect is statistical significant at the 1% level using a binomial test (test proportion = 0,5000);α Effect is statistical significant at the 5% level using a binomial test (test proportion = 0,5000).
Table VIII Good and bad news coverage in companies with positive and negativenet income growth
Good news(causal statement with
positive valence)
Bad news (causal statement with
negative valence)Positivegrowth
Negativegrowth
Positivegrowth
Negativegrowth
American companiesMean total words 35,48 28,14 39,28 23,40Mean total number ofboxes from grid
10,75 10,52 11,44 8,40
Japanese companiesMean total words 28,20 28,48** 26,86 36,30**
Mean total number ofboxes from grid
9,00 10,15* 9,28 13,95*
** , * represent significant differences between means of "profitable" and "unprofitable" companies atthe 5% and 1% levels, respectively in a two-tailed t-test
22
Table IX Crosstabulation with regard to variation in type of languageType of
Cause-efffect relationshipLeverage/Direction of
Cause-effect relationship
Valenceoutcome
Causallanguage
Accountingtechnicallanguage Same Opposite
Positive 122 89,1% 15 10,9% 170 82,9% 15 10,9%U.S.n=30 Negative 19 82,6% 4 17,4% 23 100,0%
Total 88,1% 11,9% 92,8% 7,2%Positive 54 79,4% 14 20,6% 48 70,6% 20 29,4%Japan
n=30 Negative 99 77,3% 29 22,7% 110 85,9% 18 14,1%Total 78,1% 21,9% 91,3% 8,7%
Table X The accounting bias in letters to the shareholdersCP - AP
(causal positive - accounting positive)AN - CN
(accounting negative – causal negative)US Japan US Japan
Mean 3,5000 1,2333 -0,5000 -2,3333Sd 4,1750 2,0957 1,0086 2,7957
Z-value 4,3788 2,8284 1,8974 3,2717p-value 0,0000 0,0047 0,0578 0,0011