The Self-Serving Bias and Beliefs about...
23
The Self-Serving Bias and Beliefs about Rationality Todd R. Kaplan ∗ Department of Economics University of Exeter Exeter, UK Bradley J. Ruffle † Department of Economics Ben-Gurion University Beer Sheva, Israel December 2002 Abstract Most previous experiments attempting to establish the existence of the self- serving bias have confounded it with strategic behavior. We design an experiment that controls for strategic behavior (Haman effects), and isolates the bias itself. The self-serving bias that we measure concerns beliefs about the rationality of others. We find very limited support for the existence of the bias. To help understand why the bias seems to hold in some settings but not in others, we discuss a distinction between biases that are self-serving and those that are actually self-defeating. Keywords: self-serving bias, beliefs about rationality, Haman effects, p-beauty con- test game, gender effects, field of study effects, self-defeating. Journal of Economic Literature classification number: C92. ∗ We thank Yakov Gilboa for dedicated research assistance, as well as Linda Babcock, Colin Camerer, Robert Kurzban, Orit Tykocinski, seminar participants at the ESA Annual Meetings in Lake Tahoe and the Russell Sage’s behavioral economics reunion and especially an anonymous referee of this journal for valuable comments. Financial support was provided by the Department of Economics at Ben-Gurion University. † Correspondence to: Bradley Ruffle, Department of Economics, Ben-Gurion University, P.O.B. 653, Beer Sheva, 84105, Israel, fax: 972-8-6472941, e-mail: [email protected], websites: http://econ.bgu.ac.il/facultym/bradley and http://www.toddkaplan.com
-
Upload
hoangkhanh -
Category
Documents
-
view
223 -
download
0
Transcript of The Self-Serving Bias and Beliefs about...
The Self-Serving Bias andBeliefs about Rationality
Todd R. Kaplan∗
Department of EconomicsUniversity of Exeter
Exeter, UK
Bradley J. Ruffle†
Department of EconomicsBen-Gurion UniversityBeer Sheva, Israel
December 2002
Abstract
Most previous experiments attempting to establish the existence of the self-serving bias have confounded it with strategic behavior. We design an experimentthat controls for strategic behavior (Haman effects), and isolates the bias itself. Theself-serving bias that we measure concerns beliefs about the rationality of others.We find very limited support for the existence of the bias. To help understand whythe bias seems to hold in some settings but not in others, we discuss a distinctionbetween biases that are self-serving and those that are actually self-defeating.
Keywords: self-serving bias, beliefs about rationality, Haman effects, p-beauty con-test game, gender effects, field of study effects, self-defeating.Journal of Economic Literature classification number: C92.
∗We thank Yakov Gilboa for dedicated research assistance, as well as Linda Babcock, Colin Camerer,Robert Kurzban, Orit Tykocinski, seminar participants at the ESA Annual Meetings in Lake Tahoe andthe Russell Sage’s behavioral economics reunion and especially an anonymous referee of this journal forvaluable comments. Financial support was provided by the Department of Economics at Ben-GurionUniversity.
†Correspondence to: Bradley Ruffle, Department of Economics, Ben-Gurion University, P.O.B.653, Beer Sheva, 84105, Israel, fax: 972-8-6472941, e-mail: [email protected], websites:http://econ.bgu.ac.il/facultym/bradley and http://www.toddkaplan.com

1 Introduction
Now Haman had just entered the outer court of the king’s palace to speak to the king about
having Mordecai hanged on the gallows that he had prepared for him. So the king’s servants told
him, “Haman is there, standing in the court.” And the king said, “Let him come in.” So Haman
came in, and the king said to him, “What shall be done to the man whom the king delights to
honor?” And Haman said to himself, “Whom would the king delight to honor more than me?”
and Haman said to the king, “For the man whom the king delights to honor, let royal robes be
brought which the king has worn, and the horse which the king has ridden, and on whose head
a royal crown is set; and let the robes and the horse be handed over to one of the king’s most
noble princes; let him array the man whom the king delights to honor, and let him conduct the
man on horseback through the open square of the city, proclaiming before him: ‘Thus shall it
be done to the man whom the king delights to honor.’” Then the king said to Haman, “Make
haste, take the robes and the horse, as you have said, and do so to Mordecai the Jew who sits
at the king’s gate. Leave out nothing that you have mentioned.” The Old Testament, Ester
6:4-10.
On the Jewish holiday of Purim, the book of Ester is read to celebrate the foiling of
Haman’s plans to destroy the Jewish people. In the passage above, the king attempts to
elicit Haman’s objective beliefs or assessment about what should be done for the person
the king wishes to honor. Believing that he is that person, Haman responds to the king’s
question not with his true beliefs about the reward such a person deserves, but with
a strategically manipulated answer. The passage illustrates the difficulty in eliciting a
person’s true beliefs: the person may be responding in his own strategic self-interest.
We define a Haman effect as an outcome in which an individual responds strategically
to an attempt to elicit his true beliefs. The individual responds strategically because
he (correctly or incorrectly) perceives that his response will affect his payoff. Thus, the
inquirer obtains strategically manipulated beliefs, rather than the true ones. In the case
of Haman, hindsight reveals that he incorrectly perceived that his response to the king’s
question was relevant to his own payoff: all along the king intended to reward not him
but Mordecai.
1

Experiments in economics and psychology designed to elicit participants’ true beliefs
or true preference for fairness are confronted with the challenge of controlling for Haman
effects. The use of sequential and interdependent decisions, repeated games, or contextu-
ally rich settings in which context has not been introduced one variable at a time are all
sources of the Haman effect and pose difficulty in the interpretation of observed behavior.
More generally, the inability to control completely for strategic considerations often opens
up the data to alternative hypotheses unintended by the researchers.
In the economics literature, self-serving biases are used to explain unusually high
rejection rates in two-player and three-player ultimatum games with differential outside
options (Knez and Camerer, 1995), the high disagreement rates in bargaining games
(Babcock and Loewenstein, 1997), the discrepancy between plaintiffs’ and defendants’
assessments of fair settlements in tort cases (Babcock et al., 1995) and the frequency of
strikes among public school teachers (Babcock et al., 1996).
The main difficulty with these studies is their inability to separate out the uninten-
tional or subconscious alteration of beliefs from the intentional or conscious calculation
for gain. We suggest that the former constitutes the self-serving bias while the latter is a
form of Haman effect not to be included as part of the bias.1
Moreover, all of the above-cited examples concern individuals’ differing perceptions
about what constitutes a fair outcome in settings where multiple focal points exist. In
fact, Babcock and Loewenstein (1997, p. 110) refer to the self-serving bias as a tendency
“to conflate what is fair with what benefits oneself.” We suggest that this definition is
too restrictive, that the self-serving bias need not be related to fairness.2 We offer the
1 Elsewhere (Kaplan and Ruffle, 1998) we have expressed our reservations about the interpretation ofthe results of some of these experimental studies that claim to have found support for the self-serving bias.There, we offer alternative explanations that cannot be ruled out and may explain the data in the two-player and three-player ultimatum games reported by Knez and Camerer (1995), and the bargaining gameresults of Roth and Murnighan (1982) interpreted as evidence of the bias by Babcock and Loewenstein(1997). To avoid repetition and to save space, we refer the interested reader to this reference (or to amore detailed exposition available for download at http://econ.bgu.ac.il/facultym/bradley/ssb.pdf).
2 Babcock and Loewenstein (1998) recognize explicitly that the self-serving bias “extends beyondbiased considerations of fairness” (p. 244) and implicitly through the numerous examples of the bias theycite from the psychology literature (Babcock and Loewenstein, 1997).
2

following more general definition of the self-serving bias, which captures the numerous
examples of the bias in the social psychology and economics literatures as well as the
setting examined in this paper.
Definition A self-serving bias exists where an individual’s preferences affect his beliefs
in an optimistic way, a way that makes things appear better than they are from the
individual’s point of view.
Beliefs may be about one’s own ability, the environment, another player’s type, or
about what constitutes a fair outcome. The appearance that things are better can be
understood as meaning that the individual’s expected utility is higher with self-serving
beliefs than without them for a given set of strategies; namely, E[U(si, s−i)|biased beliefs]
> E[U(si, s−i)|unbiased beliefs]. However, it is often the case that self-serving beliefs lead
the individual or others interacting with the individual to change their strategies. The
change in strategies may increase or decrease the individual’s actual expected utility in
comparison to the person who possesses unbiased beliefs from the outset. In section 4 we
provide examples of both possibilities.
Wishful thinking is a specific type of self-serving bias. It occurs when an individual
overweights the likelihood of a favorable event or underweights the likelihood of an unfa-
vorable one. Extending the domain of wishful thinking beyond favorable events to include
beliefs about ability, player type or a fair outcome would equate wishful thinking with
the self-serving bias. Forsythe, Rietz, and Ross (1999) find evidence of wishful thinking
in a market in which traders increase the prices of state-contingent claims associated with
their preferred outcomes. Bar-Hillel and Budescu (1995), by contrast, conduct a battery
of experiments in contextually rich and contextually sterile environments and find little
to no evidence of wishful thinking in any of their experiments. In one of their experi-
ments (Study 4), subjects were asked each week over a four-week period to estimate the
probability that the Dow Jones Industrial Average (DJIA) would change by more than 20
3

points in a week. Half of the subjects were eligible for a cash prize if the DJIA changed by
more than 20 points, while the other half were eligible if it changed by less than 20 points.
Bar-Hillel and Budescu found no significant differences in the probability judgements of
these two groups in any of the four weeks of their study.
The objective of this paper is to design a simple experimental test of the self-serving
bias that controls for Haman effects. We achieve this control through a number of means.
First, our game is one shot. Second, in order to elicit an individual’s true beliefs, we
design a game in which each individual has an incentive to reveal his true beliefs in
order to win a prize, while at the same time the payoff that each individual receives is
unrelated to his response in the game. We choose a sterile environment to minimize the
chance that individuals might even mistakenly believe that their individual payoffs are
somehow related to their responses in the game. Our test of the bias is unrelated to
fairness perceptions. Instead, our experimental design, a modified one-shot version of
the p-beauty contest game, tests whether individuals hold self-serving beliefs about the
rationality of others.
In the next section, we describe the experiments we conduct and the experimental
hypotheses. We present our results in section 3 followed by a discussion in section 4.
Section 5 concludes.
2 Experimental Design, Procedure and Hypotheses
2.1 Experimental Design
In the guessing game (Moulin, 1986), or p-beauty contest game as it is more frequently
called, players simultaneously choose a number in the closed interval [0, 100]. The player
whose number is closest to p times the mean of all numbers chosen (where p is a parameter
that is common knowledge to all players) wins a predetermined cash prize. All other
4

players earn zero. The unique Nash equilibrium of this game, for p ∈ [0, 1), is for all
players to choose zero. Nagel (1995) first tested this game experimentally to investigate
players’ depth of reasoning. A player will choose a number greater than zero if he is
irrational (zero-order beliefs), if he is rational but believes others are irrational (first-
order beliefs), or, more generally, if at some level in his infinite hierarchy of beliefs, he
specifies some irrationality.
We modify the guessing game in a way that allows us to test for biased beliefs about the
rationality of others.3 In addition to paying a fixed prize of 400 new Israeli shekels (NIS)
(approximately $100 US)4 to the subject whose guess is closest to 2/3 times the average
of all guesses, our design pays a variable payoff to each subject. There are 30 subjects in
each session, each subject with an identity number from 1 to 30. Those subjects with an
odd identity number (hereafter to be frequently referred to as odd subjects, for brevity)
receive as a variable payoff the mean guess of all 29 other chosen numbers divided by
four. All even-numbered subjects (henceforth even subjects) receive 100 minus the mean
guess of all 29 other subjects, this number divided by four.5 Dividing by four renders our
subject payments affordable while at the same time worthwhile for the student subjects.
The payoff structure implies an average variable payoff of 12.5 shekels. Our intention was
to set the expected variable payoff of the same order of magnitude as the expected fixed
payoff. This balance was struck in order that subjects’ elicited preferences as a function
of their identity numbers are over non-trivial amounts of money and so that the incentive
to win the fixed prize is meaningful.
By excluding a subject’s guess from his variable payoff, we control for strategically
manipulated guesses. Furthermore, by playing the game only once, there is no room to
3 With the intent of studying learning behavior, Nagel and Duffy (1997) have tested experimentallyvariations of the p-beauty game in which the winner is the person who chooses the number closest to 1/2the median, mean or maximum of all numbers chosen.
4 At the time the experiments were conducted the exchange rate ranged from $1 US = 3.5 NIS to $1US = 4.09 NIS.
5 Appendix A contains the instructions. The actual instructions used were translated to Hebrew andare available upon request from the authors.
5

manipulate one’s guess in order to influence guesses in the subsequent period. Instead, a
subject’s guess summarizes his beliefs about everyone else’s guesses.
Let us examine now how the self-serving bias comes into play. Recall that the defi-
nition of the bias says that preferences influence beliefs in a way that favors one’s own
payoff. Odd subjects have a preference for a high average to obtain a high variable payoff.
Therefore, according to the bias, they should believe that others will choose high numbers
(i.e. exhibit a relatively low level of rationality). Thus, an odd subject should guess high
in order to maximize his chance of winning the fixed prize. Conversely, the lower the
average, the higher the payoffs to the even subjects. Thus, an even subject who makes
a self-serving guess should assume a higher level of rationality and guess low. Therefore,
the self-serving bias predicts that the guesses of the subjects with odd identity numbers
will be greater than those with even identity numbers.
It is important to emphasize the nature of the psychological mechanism that underlies
the self-serving bias in this design. Previous experiments have confounded the conscious
calculation for gain with the subconscious alteration of beliefs. The former we do not
consider to be a part of a cognitive self-serving bias, but rather a form of (self-)strategy,
as exemplified by Haman in the book of Ester. By excluding a subject’s own guess from
his variable payoff and by conducting this game one shot, we have controlled for such
Haman effects. We also test for subjects’ understanding of the game to identify those
who may incorrectly perceive that their guess affects their variable payoff. Thus, the bias
in our design operates through the subconscious alteration of beliefs.
2.2 Experimental Procedures
We conducted seven sessions, each with 30 subjects. Three sessions consisted of eco-
nomics students and four sessions consisted of psychology students. All subjects were
recruited during various undergraduate classes in economics and psychology. The exper-
6

iment required about 25 minutes with an additional 15 minutes to calculate and count
out subjects’ payments. In each session, one subject earned 400 shekels plus his variable
payoff. The remaining 29 subjects earned their variable payoff only. Variable payoffs
ranged from 7 shekels to 19 shekels.6
We took a few measures to clarify the workings of the experiment to subjects. First,
after reading the instructions, but before making their choice of number, subjects were
presented two examples based on randomly chosen numbers. In both examples, a number
from 0 to 100 was drawn from a plastic bag for each of four imaginary subjects (two odd
subjects and two even subjects). The first example was solved explicitly on the board so
that all subjects could observe how subjects’ variable and fixed payoffs are calculated.7
Clarifying questions were permitted before proceeding to the second example. For the
second example, we again drew four numbers randomly, but now asked the subjects to
solve for the payoffs to the four imaginary subjects. This required subjects to think
through the design and allowed us to test for their understanding by the correctness of
their answers. We provided subjects with calculators to minimize the chance of arithmetic
errors and motivated them by using the most number of correctly answered questions
(payoffs) as a tie-breaker in case two or more subjects in the experiment chose numbers
equidistant from 2/3 of the average.
After writing the four numbers from the second example on the board, subjects cal-
culated the imaginary subjects’ variable and fixed payoffs. Questions were answered and
subjects were given ample time to choose a number. Upon completion the instruction
sheets with the subjects’ choice of number (and their answers to the payments to the four
imaginary subjects) were collected. While waiting for their payments to be computed,
each subject explained on a cue card why he chose the number he did. Subjects were
6 Note that the minimum wage in Israel at the time – the wage earned by most students who workpart-time – was 13 shekels an hour.
7 Only multiples of 10 from 0 to 100 were in the plastic bag. The subjects were told that this wasto simplify the payment calculations and that they were free to choose any real number from 0 to 100inclusive.
7

subsequently called one at a time to collect their payments and submit their cue cards.
From examining subjects’ calculations of the four imaginary subjects’ payoffs, at least
58% of the 210 student subjects demonstrated a full comprehension of the design by
writing down the correct payoffs for all four. Among those subjects who did not write
down the correct payoffs for all four subjects, the most benign error was not dividing the
winner’s payoff by 4 (2.8% of the subjects); 2.4% forgot to include the winner’s variable
payoff; 17.6% did not indicate a winner at all; 10% of the subjects wrote down the
right formulae for the odd and even variable payoffs but made a single arithmetic error;
two (0.95%) subjects simply did not fill in the payoffs to the imaginary subjects. The
remaining 9.5% of the subjects made a systematic error in calculating the variable payoffs
of either the two odd or the two even imaginary subjects.8 These latter subjects (9.5%)
provide a lower bound on the percentage of total subjects whose lack of understanding of
the payoff structure may inhibit them from making a well-informed guess.
2.3 Controlling for Alternative Hypotheses
We settled on this design and the particular variable payoff structure both for the rel-
ative simplicity of the variable payoff structure and its ability to control for alternative
hypotheses. By conducting only one round of this game and by not including one’s own
guess in the calculation of a subject’s variable payoff, strategic play and Haman effects
are eliminated. Additional hypotheses of concern to us were altruism and beliefs about
altruism. Overall altruism is nullified in this design: increasing one’s guess improves the
variable payoff of the odd subjects by the same measure that it reduces that of the evens.
Furthermore, beliefs that others are altruistic should not cause a subject to alter his guess
since, as shown above, the altruistic motive does not affect others’ guesses and therefore
need not affect one’s own. On the other hand, group altruism may cause odd subjects to
8 Three subjects in this group made an additional error associated with the winner, thereby explainingthe fact that the percentages above sum to 101.25.
8

Hypothesis
Identity self-serving beliefs about overall beliefs about group beliefs about insurance
Number bias (ssb) ssb altruism overall altr. altruism group altr.
odd ↑ — — — ↑ — ↓
even ↓ — — — ↓ — ↑
Table 1: The table lists the possible experimental hypotheses and their theoretical effectson the direction of subjects’ guesses with odd and even identity numbers. The possibleeffects are: “↑” (increase), “↓” (decrease), or “—” (no effect or effect cancels out).
guess high and even subjects to guess low to increase the variable payoffs to those sub-
jects of the same type.9 Because group altruism pushes guesses in the same directions
as the self-serving bias, we take several measures to minimize its likelihood and effect. In
this way, in the event that odd guesses are greater than even guesses, the confounding is
minimal. First, we chose a relatively large group size of 30 subjects, in part, so that the
impact of an individual subject’s guess on group averages is diffuse. Second, by seating
subjects well apart from one another, subject anonymity was maintained. Third, we feel
that randomly assigning subjects an odd or even identity number is quite hollow as a
symbol of group identity. Finally, explicit calculation of payoffs on the blackboard for
the first example presents a sterile, calculating environment for the arousal of any such
in-group sentiments.
Even if a subject does not exhibit group altruism, he may believe others do. Yet
beliefs about group altruism leave one’s own guess unaffected, assuming one believes the
odds are equally as likely to exhibit group altruism as the evens. Similar reasoning holds
for beliefs about the self-serving bias: if you believe others may be biased in their beliefs
about the rationality of others in a way that is self-serving, then you believe the odd
subjects will guess high and the evens low. Assuming you believe the self-serving bias
9 The minimalist conditions under which subjects form in-group, out-group distinctions are well doc-umented in the cognitive psychology literature. Consult Tajfel et al. (1971) for the classic reference.
9

to be equally likely among the odds and the evens (and there is no apparent reason why
you should believe one group more susceptible to the bias than the other), then your own
guess should remain unchanged.
The only remaining hypothesis is the insurance motive. The insurance motive works
in the opposite direction as the bias. If an odd subject fears his variable payoff will be
low (a low average of numbers), he will guess low to try to win the fixed prize and if an
even subject fears a low variable payoff due to a high average, he will guess high. Table
1 summarizes the various possible motives and their directions.
3 Results
3.1 Data Analysis
Table 2 presents summary statistics of the guesses of even and odd subjects according
to sample population. A visual representation of the data can be found in Appendix B,
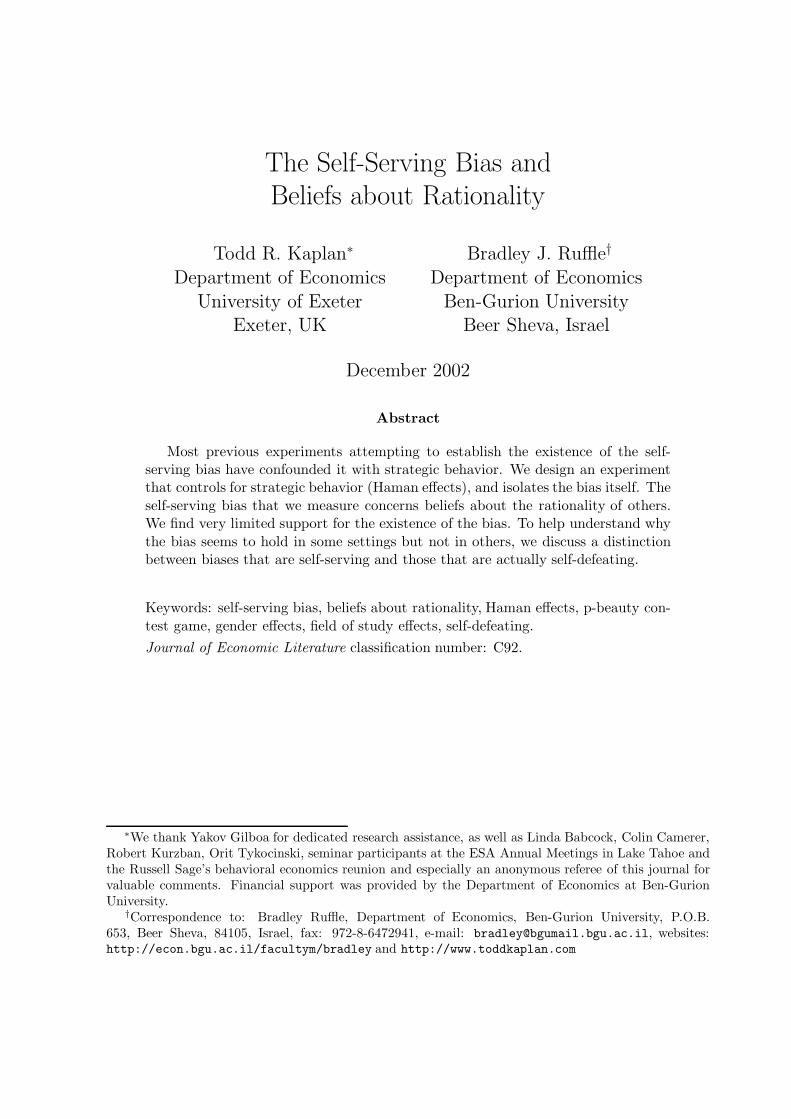
Figures 1 and 2. We choose to display our data in circle plots. The location of a circle
indicates the value of the sample observation. The size of each circle indicates the number
of observations at that value. The diagrams are a compact way of accurately representing
a sample. For our purposes, they provide a quick and accurate impression of the data
and enable us to display many more sample distributions on a single page than is possible
with more standard histograms. The triplet to the right of each circle plot in Figure 2
indicates the (mean, median, sample size) for that sample. In Figure 1, the sample size
is omitted since there are 15 observations of odd and even guesses in each session. The
paper’s first main result follows from a comparison of the last two circle plots in Figure 1
as well row 1 of Table 2.
Observation 1 Subjects with odd identity numbers did not guess significantly higher
than those with even identity numbers. That is, the aggregate data does not support the
10

odd even Mann-Whitney Obs.Population mean, median mean, median test results
33.3, 33.0 32.7, 27 Z=−1.247Overall
(σ = 1.54) (σ = 2.15) (p=.213)210
Female 37.7, 34.0 33.9, 28.0 Z=−2.238
Psychologists (2.02) (3.71) (.025)84
Female 30.3, 33.0 33.5, 27.0 Z=−.011
Economists (2.28) (3.88) (.991)47
Male 31.1, 22.0 27.5, 27.0 Z=−.283
Psychologists (5.12) (5.08) (.777)32
Male 27.0, 25.5 30.1, 26.0 Z=−.496
Economists (3.72) (4.23) (.620)41
Table 2: Summary statistics for the guesses of the even and odd subjects in the overallpopulation (row 1) as well as each of the subpopulations (rows 2-5). In each cell the group’smean guess appears to the left of the median guess with the standard error in parenthesesbelow. The second-to-last column displays the results from two-tailed, Mann-Whitneytests (p-values in parentheses). The last column indicates the number of observations inthe sample population.
11

existence of the self-serving bias.
The mean (median) guess of the odd subjects is 33.3 (33.0) (N=105) compared to
32.7 (27.0) (N=105) for the even subjects. We cannot reject the null hypothesis that the
sample distributions are the same (p-value from Mann-Whitney test=.213).10,11,12
With three sessions involving economics students and four made up of psychology
students, we examined the data on a finer level. It may be the case that the subjects from
one field of study significantly display the bias while the students from the other field
display no bias at all or even a reverse bias, thereby dampening the bias in the aggregate
data. Field of study has been shown to matter in a variety of other contexts.13 We believe
it may matter here as well. For instance, economists may have an easier time ignoring the
variable payoff over which they have no control. The other observable variable that may
be a determinant of the existence of the bias is the subject’s gender. Elsewhere gender
often plays a role in risk-taking behavior, altruism, fairness and trust.14
10 All p-values reported in parentheses in this section are results from two-tailed, Mann-Whitneynonparametric tests and refer to 1 − probability that we can reject the null hypothesis that the two (oddand even) sample distributions are drawn from the same underlying population distribution.
11 Focusing on those subjects who correctly answered the hypothetical, pre-experiment questions doesnot help the bias: we found absolutely no relation between subjects’ ability to answer these questionsand the self-serving bias or their guesses. For instance, the average guess among the 58% of the subjectswho answered all questions correctly was 33.4 compared to 32.5 for those who didn’t.
12 The difference between the mean and median guesses of the even subjects suggests the possiblepresence of outliers. If we exclude all guesses above 66.66 on the basis that they are irrational or weaklydominated by guessing exactly 66.66, then the self-serving bias turns up significant (p=.039). This holdsbecause 9/13 guesses above 66.66 were made by even subjects. Furthermore, the seven highest guesses(above 80) were all made by even subjects. (See Figure 1.) One explanation for these findings is thatthe number “100” that appears in the calculation of the even subjects’ variable payoff of “100 minus theaverage” provides an anchor upon which some evens based their guesses. The processing of the number“100” subconsciously pushes upward some even subjects’ guesses, in the opposite direction of the bias.
13 Frank, Gilovich and Regan (1993) survey the evidence from public goods experiments, ultimatumgames and prisoner’s dilemma experiments in support of the view that economics students act in amore self-interested and less cooperative way than non-economics students. Yezer et al. (1996) showthat economics students are more honest than non-economists in a lost-letter experiment. Ruffle andTykocinski (2000) find that psychologists estimate more accurately than economists the costs of identicalgift items.
14 Eckel and Grossman (2001) survey the experimental results that test for a gender effect in publicgoods games, ultimatum games and dictator games. In trust games, both Croson and Buchan (1999) andChaudhuri and Gangadharan (2001) find that women responders return significantly higher amounts ofmoney to the proposers than men do. Chaudhuri and Gangadharan’s results show that men are moretrusting than women, while Croson and Buchan find no difference between men and women proposers.
12

Observation 2 Among the four subgroups (female economists, male economists, fe-
male psychologists, male psychologists), only female psychologists exhibit the bias.
As Table 2 shows, the guesses of odd female psychologists are significantly higher than
those of their even counterparts. This finding is all the more striking when contrasted with
the female economists who show no sign of a bias whatsoever (p=.991). Male psychologists
similarly show little sign of the bias, while the guesses of odd male economists are actually
slightly lower than those of even male economists (p=.620).15
4 Thoughts on the Relevance of the Self-Serving Bias
We designed an experimental test for the self-serving bias in which the subject’s strategy
space is very simple, namely, choose, one time, a single number between 0 and 100 inclu-
sive. The context we selected is a sterile one. Even in contextually rich environments,
widespread pervasiveness of the bias remains to be shown. Aside from difficulties in ruling
out alternative hypotheses when context is not introduced into the experimental design
one variable at a time, other research in contextually rich settings does not find broad
support for the bias. Dahl and Ransom (1999) find very limited evidence of a financially
motivated self-serving bias among Mormons in their own determination of what consti-
tutes income for the purpose of tithing. Bar-Hillel and Budescu (1995) find little to no
evidence of the bias in their series of contextually rich and contextually sterile experi-
ments. Besides the Haman effect, what other reasons might explain why the self-serving
15 To show that the significant bias found among female psychologists, but not among female economistsis not simply the result of the female psychologists’ larger sample size (i.e., greater statistical power),we randomly sampled 24 (23) female psychologists with odd (even) identity numbers to match the cor-responding sample sizes of the female economists. We then performed the Mann-Whitney test on thisrandom sample. We repeated this exercise 10,000 times and found that the p-value of the female psy-chologists was smaller than that of the female economists 9,989/10,000 times and was significant at the5% level or less 5,028 times (one-tailed test). We repeated this exercise to match the sample sizes of themale psychologists (i.e., 15 odd and 17 even) and again found the p-value of the female psychologists tobe smaller than that of the male psychologists 9,369/10,000 times and significant at the 5% level or less3,433 times (one-tailed test).
13

bias appears to obtain in some settings while not in others?
One clue may be the functionality of the bias. In many contexts the self-serving bias
might be better termed “self-defeating”, since individuals who display the bias do so at
a cost to their own monetary payoff. A historical perspective suggests that evolutionary
forces may drive out self-serving biases that are costly. Examples of maladaptive biases are
ones that lead to complacency, laziness or the unwillingness to take necessary precautions
or to develop oneself further. Legends are all that remain to record the stories of the
countless tribes and individuals who viewed their strength as superior, their foodsources
as assured, or their inventions as invincible. Along these lines, several of the self-serving
bias studies test for a bias that is in actual fact self-defeating. Our p-beauty contest game
scenario and the stock market prediction scenario studied by Bar-Hillel and Budescu are
two such examples. Another example is the high school kid whose self-serving beliefs
motivate him to devote all of his time to playing basketball, rather than studying, despite
having no chance at making the NBA.
On the other hand, there is considerable evidence that some self-serving biases may well
be beneficial. Taylor and Brown (1988) and Taylor (1989) review a large body of research
that suggests that self-serving beliefs about one’s ability, about the degree of control one
possesses over a situation and about one’s future “typically lead to higher motivation,
greater persistence at tasks, more effective performance, and, ultimately, greater success”
(Taylor, p. 64).16 In addition, an individual who processes information self-servingly in
these areas will be “happier, more caring, and more productive than the individual who
perceives this same information accurately” (Taylor and Brown, p. 205).
In negotiations, whether a cognitive bias is self-serving or self-defeating depends on
whether one party observes the other’s self-serving bias and whether the party is willing
to allow his behavior to be influenced by the other’s bias. Heifetz and Segev (2001)
16 Ignoring physiological and psychological benefits from maintaining self-serving beliefs, greater successis still self-defeating if the cost of the additional effort exerted exceeds the benefits from the higherprobability of success.
14

HHHHHHHHHHHH�
�����������
J
J
J
J
J
JJ
J
J
J
J
J
JJ
Adam
Ben Ben
Climb Stay
Stay StayClimb Climb
−1−2
10
01
00
actual payoffs:
Ben’s perceivedpayoffs:
−21/2
10
01
00
Figure 3: Extensive form of the king of the hill game. The actual payoffs appear abovethe horizontal line, while Ben’s self-serving perception of the payoffs are below the line.
develop an evolutionary model of bargaining in which one negotiator displays a self-
serving bias regarding the share of the surplus he deserves. Observing this bias, the
opponent adjusts his behavior to accommodate the toughness of the biased negotiator.
A one-shot, ultimatum game provides a simple illustration of this logic. Suppose the
responder believes that if he rejects the proposer’s offer, his outside option is, say, $3.
Even if the proposer knows this to be false and knows the truth to be that the responder
will receive nothing in the case of rejection, he should offer at least $3 to avoid rejection,
as opposed to offering at least $0 in the absence of the bias. Consequently, the responder’s
self-serving bias functions as a commitment to rejecting low offers.
Another scenario in which the self-serving bias is beneficial is a sequential, two-player
game we introduce, which we call the “king of the hill” game. The first player, Adam,
decides whether to climb the hill or stay at the bottom. Observing Adam’s decision,
the second player, Ben, also decides whether to climb the hill or remain at the bottom.
There is room for only one person at the top of the hill. Adam is the strong, sensitive
type: he is capable of pushing Ben from the hill if they both decide to climb it; however,
he incurs significant negative utility from fighting. Although weaker, Ben self-servingly
15

believes that he is stronger than Adam. Figure 3 displays the extensive form of the game,
including the players’ payoffs. In the absence of the bias, the unique subgame-perfect
equilibrium prescribes that Adam climb the hill and Ben remain at the bottom. With the
bias, Ben’s perception of the payoffs in the event of (Climb, Climb) is (−2, 1/2), when in
fact the true payoffs are given by (−1, −2). Thus, if Ben possesses these biased beliefs,
he will choose to climb the hill if Adam does. As a result, Adam stays at the bottom and
Ben climbs the hill in the unique subgame-perfect equilibrium given the perceived payoffs.
Thus, Ben’s self-serving beliefs about his strength and Adam’s awareness of Ben’s beliefs
lead to an outcome that benefits Ben.
5 Conclusion
We motivated this paper by stating that we wanted to design an experimental test for
the self-serving bias that controls for alternative hypotheses. We chose a contextually
sterile environment to serve this purpose. Such an environment provides a harsh test for
the self-serving bias since it offers little opportunity for subjects to retrieve from memory
in subjective ways previous experiences that are relevant to their play of the p-beauty
contest game. Indeed we find only very limited support for the bias; only one out of four
subgroups exhibited the bias.
The conflicting evidence in the literature concerning the existence of the self-serving
bias in decision problems calls for further research to delineate the boundaries of the bias’
role in decision making. The distinction between self-serving beliefs that are actually
self-defeating and those that are indeed self-serving provides one direction.
References
[1] Babcock, Linda, Xianhong Wang and George Loewenstein (1996) “Choosing the WrongPond: Social Comparisons in Negotiations that Reflect a Self-Serving Bias”, QuarterlyJournal of Economics, 111:1, 1-19.
16

[2] Babcock, Linda and George Loewenstein (1997) “Explaining Bargaining Impasse: The Roleof Self-Serving Biases”, Journal of Economic Perspectives, 11:1, 109-126.
[3] Babcock, Linda and George Loewenstein (1998) “Response from Linda Babcock and GeorgeLoewenstein [letter]”, Journal of Economic Perspectives, 12:2, 244-245.
[4] Babcock, Linda, Loewenstein, George, Samuel Issacharoff and Colin Camerer (1995) “Bi-ased Judgements of Fairness in Bargaining”, American Economic Review, 85:5, 1337-1343.
[5] Bar-Hillel, Maya and David Budescu (1995) “The Elusive Wishful Thinking Effect”, Think-ing and Reasoning, 1:1, 71-103.
[6] Chaudhuri, Ananish and Lata Gangadharan (2002) “Gender Differences in Trust and Reci-procity”, unpublished manuscript, Wellesley College.
[7] Croson, Rachel and Nancy Buchan (1999) “Gender and Culture: International Experi-mental Evidence from Trust Games”, American Economic Review Papers and Proceedings,89:2, 386-391.
[8] Dahl, Gordon B. and Michael R. Ransom (1999) “Does Where You Stand Depend onWhereYou Sit? Tithing Donations and Self-Serving Beliefs”, American Economic Review, 89:4,703-727.
[9] Eckel, Catherine and Philip Grossman (2001) “Differences in the Economic Decisionsof Men and Women: Experimental Evidence”, in Handbook of Experimental Results,eds. V. Smith and C. Plott, Elsevier: Amsterdam.
[10] Forsythe, Robert, Thomas Rietz and Thomas Ross (1999) “Wishes, Expectations, andActions: Price Formation in Election Stock Markets”, Journal of Economic Behavior andOrganization, 39, 83-110.
[11] Frank, Robert, Thomas Gilovich and Donald Regan (1993) “Does Studying EconomicsInhibit Cooperation?”, Journal of Economic Perspectives, 7, 159-171.
[12] Heifetz, Aviad and Ella Segev (2001) “The Evolutionary Role of Toughness in Bargaining”,unpublished manuscript, Tel-Aviv University.
[13] Kaplan, Todd and Bradley Ruffle (1998) “Self-Serving Bias [letter]”, Journal of EconomicPerspectives, 12:2, 243-244.
[14] Knez, Marc and Colin Camerer (1995) “Outside Options and Social Comparison in Three-Player Ultimatum Game Experiments”, Games and Economic Behavior, 10, 65-94.
[15] Moulin, Herve (1986) Game Theory for the Social Sciences, New York: New York Press.
[16] Nagel, Rosemarie (1995) “Unraveling in Guessing Games: An Experimental Study”, Amer-ican Economic Review, 85:5, 1313-1326.
[17] Nagel, Rosemarie and John Duffy (1997) “On the Robustness of Behaviour in ExperimentalBeauty Contest Games”, Economic Journal, 107, 1684-1700.
17

[18] Roth, Alvin and Keith Murnighan (1982) “The Role of Information in Bargaining: AnExperimental Study”, Econometrica, 50, 1123-1142.
[19] Ruffle, Bradley J. and Orit Tykocinski (2000) “The Deadweight Loss of Christmas: Com-ment”, American Economic Review, 90:1, 319-324.
[20] Tajfel, Henri, Billig, M. G., R. P. Bundy and Claude Flament (1971) “Social Categorizationand intergroup behavior”, European Journal of Social Psychology, 1:2, 149-178.
[21] Taylor, Shelley E. (1989) Positive Illusions: Creative Self-Deception and the Healthy Mind,New York: Basic Books.
[22] Taylor, Shelley E. and Jonathon D. Brown (1988) “Illusion and Well-Being: A SocialPsychological Perspective on Mental Health,” Psychological Bulletin, 103:2, 193-210.
[23] Yezer, Anthony, Robert Goldfarb and Paul Poppen (1996) “Does Studying EconomicsDiscourage Cooperation? Watch What We Do, Not What We Say or How We Play”,Journal of Economic Perspectives, 10:1, 177-186.
Appendix A: Instructions for Participants
There are 30 participants in this experiment. You are to choose a number between 0 and 100
inclusive. The participant whose number is closest to 2/3 the average of all numbers chosen
wins 400 shekels. In the case of a tie, the prize is divided equally among the winners who answer
correctly the most number of questions from the example explained below.
In addition, each participant has an identity number which is either even or odd. There are an
equal number of even and odd numbers. Your identity number is written at the top of this page.
Participants with odd numbers receive in shekels the average of all 29 other chosen numbers
divided by four. Participants with even numbers receive in shekels 100 minus the average of all
29 other chosen numbers, this amount divided by four.
To help you to understand the experiment, the monitor will begin with two examples each con-
sisting of four numbers drawn randomly from the bin at the front of the room. The payments
of the first example will be calculated by the monitor and written on the board to demonstrate
how the experiment works. For the second example, the monitor will again draw four num-
bers randomly from the bin. You are asked to indicate the payments to the four imaginary
18

participants at the bottom of this page. This is in order to verify your understanding of the
experiment. Also, in the case that two or more participants’ numbers are equally close to 2/3
the overall average of the chosen numbers, the prize will be divided equally among the winners
with the most number of correctly answered questions in example 2.
After answering the example, please indicate your own choice of number below. After 10 minutes
you will be asked to hand in this form and to return to your seat in order to complete the attached
explanation card. When your identity number is called, hand the card to the monitor in order
to receive your payment.
If you have any questions, please raise your hand and a monitor will come to assist you.
Please fill in the blank with your choice of number
From example 2, indicate the payments to participants:
31 , 32 , 33 , 34

Appendix B: Circle Plots
Figure 1: Distribution of Guesses by Session: Each horizontal line displays the distribution
of guesses from 0 to 100. The location of a circle indicates the value of a guess. The circle’s
size reveals the number of guesses at that value according to the legend at the bottom of the
graph. Within each of the three economics sessions (Econ 1, Econ 2, Econ 3) and each of the
four psychology sessions (Psych 1, Psych 2, Psych 3, Psych 4), the guesses of the odd-numbered
subjects are compared to those of the even-numbered subjects. The pair of numbers to the
right of each distribution indicates the mean and median guess, respectively. There are 15
odd-numbered and 15 even-numbered subjects in each session.
Figure 2: Distribution of Guesses by Gender and Field of Study: The distribution
of guesses of the odd-numbered and even-numbered subjects are displayed according to the
four subpopulations, female psychologists, male psychologists, female economists, and male
economists. The triplet to the right of each distribution reveals the mean, median, and sample
size of the distribution, respectively. The gender of six subjects (4 psychology students and
2 economics students) could not be determined from their first names nor from their written
answers in Hebrew, a language in which certain verb conjugations indicate the author’s gender.
Thus, n=204.

Econ 1 odd
Econ 1 even
Econ 2 odd
Econ 2 even
Econ 3 odd
Econ 3 even
All Econ odd
All Econ even
Psych 1 odd
Psych 1 even
Psych 2 odd
Psych 2 even
Psych 3 odd
Psych 3 even
Psych 4 odd
Psych 4 even
All Psych odd
All Psych even
All odd
All even 1
23
45
67
89
16
26.8, 30
30.6, 32
20.7, 22
33.9, 26
37.5, 37
35.1, 27
28.3, 30
33.2, 27
33.1, 33
41.9, 30
38.2, 37
34.6, 33
41.4, 34
28.8, 26
35.3, 33
24.2, 23
37.0, 33
32.4, 27
33.3, 33
32.7, 27
Psych female odd
Psych female even
Psych male odd
Psych male even
Econ female odd
Econ female even
Econ male odd
Econ male even
All female odd
All female even
All male odd
All male even 1
23
45
67
89
10
11
12
37.7, 34, 42
33.9, 28, 42
31.1, 22, 15
27.5, 27, 17
30.3, 33, 24
33.5, 27, 23
27.0, 25.5, 20
30.1, 26, 21
35.0, 33, 66
33.8, 27, 65
28.7, 22, 35
28.9, 26, 38
![IMPLICIT BIAS EVIDENCE: A COMPENDIUM OF CASES AND ...2020] Implicit Bias Evidence 5 popular beliefs. 12 Greenwald touted the IAT as having the ability to measure and quantify implicit](https://static.fdocuments.net/doc/165x107/5f52cbabfcc457346c20d74b/implicit-bias-evidence-a-compendium-of-cases-and-2020-implicit-bias-evidence.jpg)