COPEX, 2014, Brussels ILI and CP Data Comparison and Usage
26
COPEX, 2014, Brussels ILI and CP Data Comparison and Usage Phil Hopkins David Eyre, Penspen, UK 3 rd April, 2014
Transcript of COPEX, 2014, Brussels ILI and CP Data Comparison and Usage
COPEX, 2014, BrusselsILI and CP Data Comparison and
Usage
Phil Hopkins
David Eyre, Penspen, UK
3rd April, 2014
Presentation
Introduction
CP Data Sources
ILI Data
Case Study 1
Case Study 2
Case Study 1
Case Study 3
Conclusions

Penspen Ltd.
� Penspen is an international engineering consultancy.
� We are in the oil and gas business, specialising in pipelines and facilities.
� Our headquarters are in Richmond, Surrey, UK, but we Richmond, Surrey, UK, but we have offices in USA, Mexico, UAE, Bangkok, Greece, Qatar, Libya, Saudi Arabia, France, etc..
� £110 million/annum business.
� We have >1000 staff around the world.
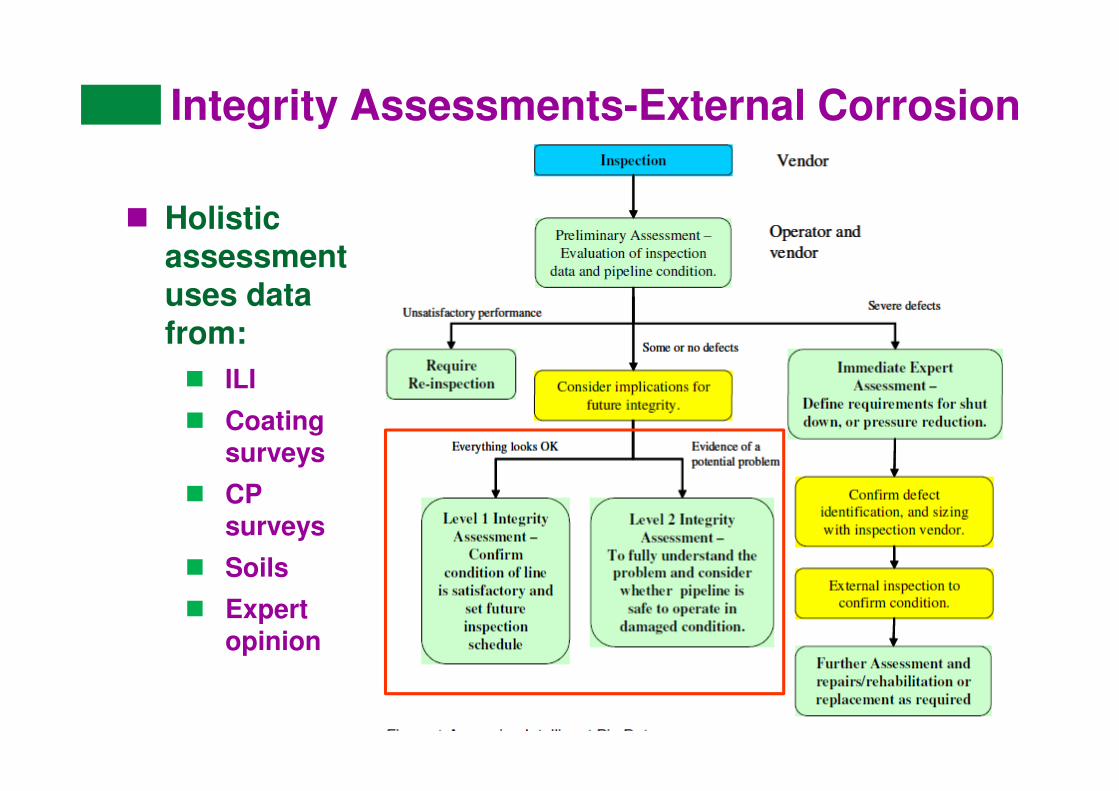
Integrity Assessments-External Corrosion
� Holistic assessment uses data from:
� ILI
� Coating surveys
� CP surveys
� Soils
� Expert opinion

Niels Bohr(1885 – 1962)
Nobel Prize in Physics 1922
“Prediction is very difficult,
especially about the future”

ILI Data
� Generally good for external corrosion
� Primarily used for remaining strength strength assessment
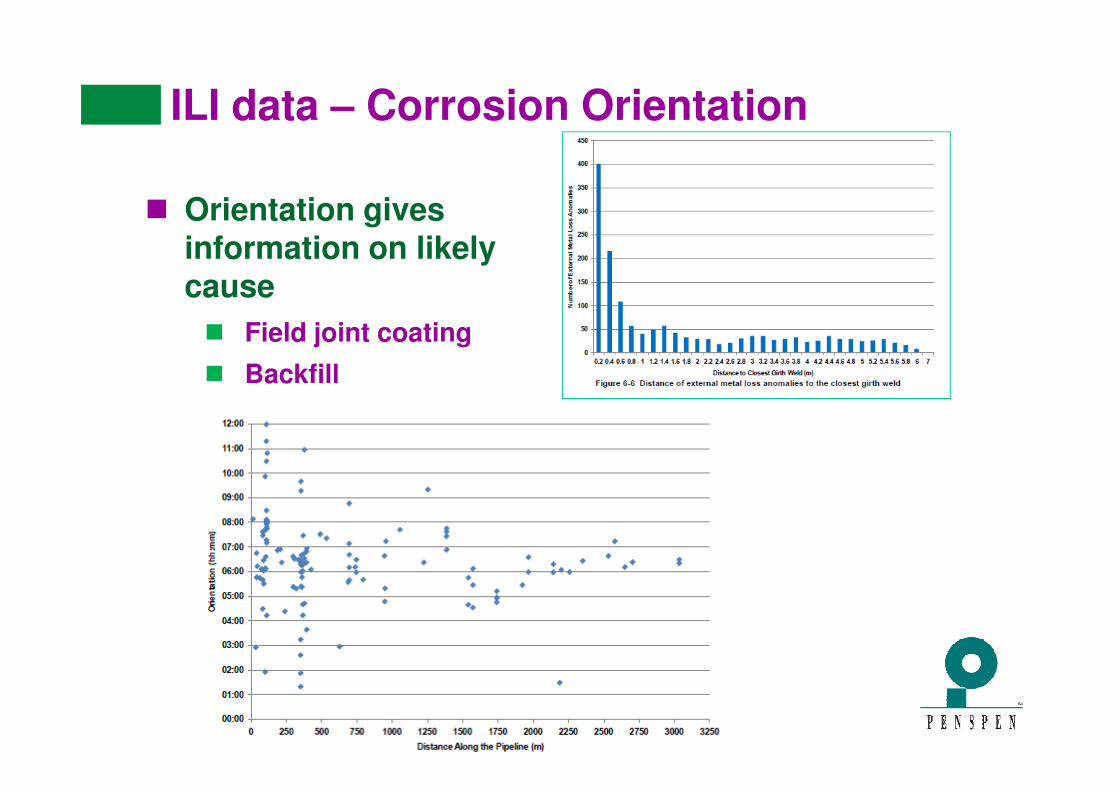
ILI data – Corrosion Orientation
� Orientation gives information on likely cause
� Field joint coating
� Backfill

ILI Data - Corrosion Rates
� Multiple defect matching from two sets of ILI data
� Tolerances can have a big impact at low corrosion ratescorrosion rates
� Statistician needs to be confident in the results
� Used to determine repair dates and next inspection
Cumulative probabilites of failure for individual defects
0%
10%
20%
30%
40%
50%
60%
70%
80%
90%
100%
2000 2010 2020 2030 2040 2050 2060 2070 2080 2090 2100
Date
Pro
ba
bil
ity
Defect 1 Defect 2 Defect 3 Defect 4 Defect 5
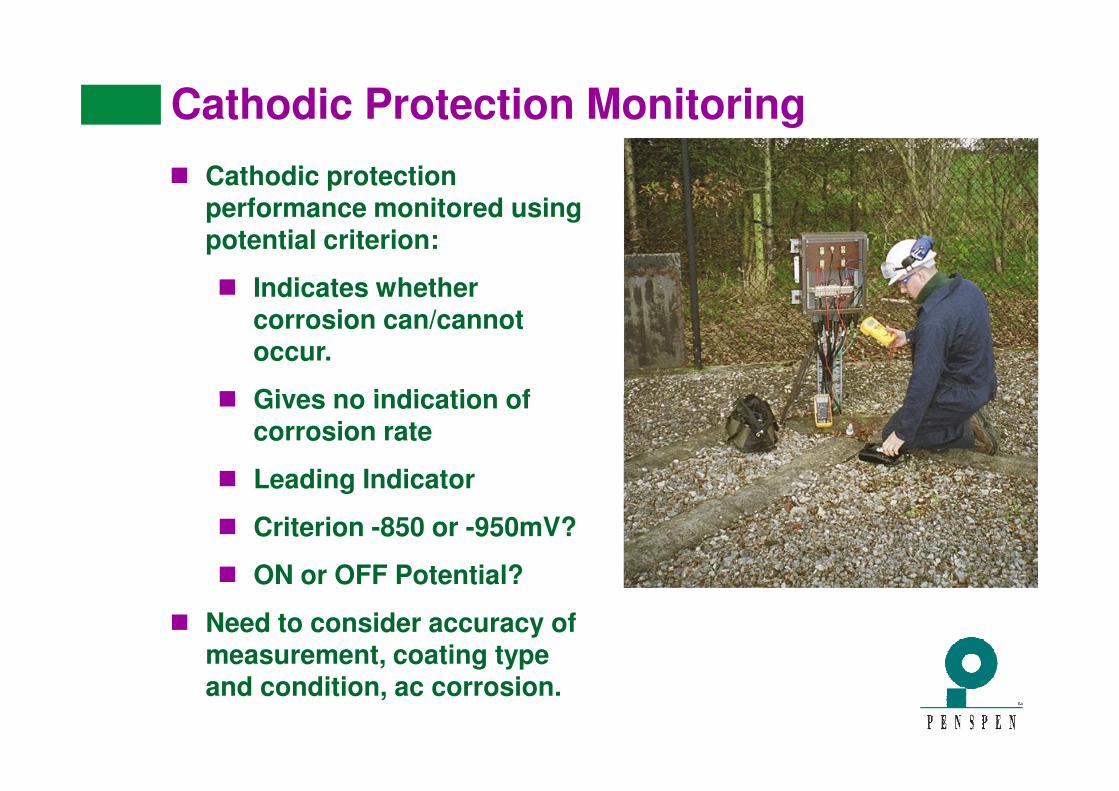
Cathodic Protection Monitoring
� Cathodic protection performance monitored using potential criterion:
� Indicates whether corrosion can/cannot occur.
� Gives no indication of � Gives no indication of corrosion rate
� Leading Indicator
� Criterion -850 or -950mV?
� ON or OFF Potential?
� Need to consider accuracy of measurement, coating type and condition, ac corrosion.
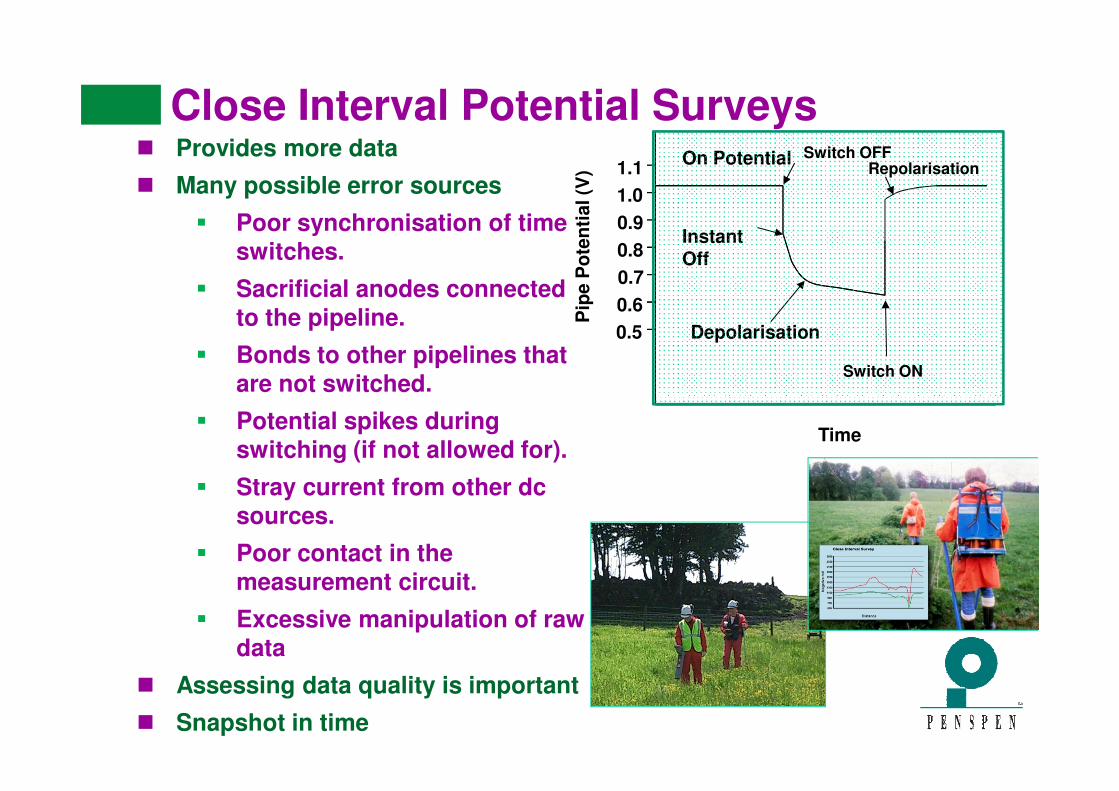
Close Interval Potential Surveys� Provides more data
� Many possible error sources
� Poor synchronisation of time switches.
� Sacrificial anodes connected to the pipeline.
� Bonds to other pipelines that are not switched.
1.1
1.0
0.9
0.8
0.7
0.6
0.5
Pip
e P
ote
nti
al (V
)
Instant Off
On Potential
Depolarisation
Switch ON
Switch OFFRepolarisation
are not switched.
� Potential spikes during switching (if not allowed for).
� Stray current from other dc sources.
� Poor contact in the measurement circuit.
� Excessive manipulation of raw data
� Assessing data quality is important
� Snapshot in time
Time
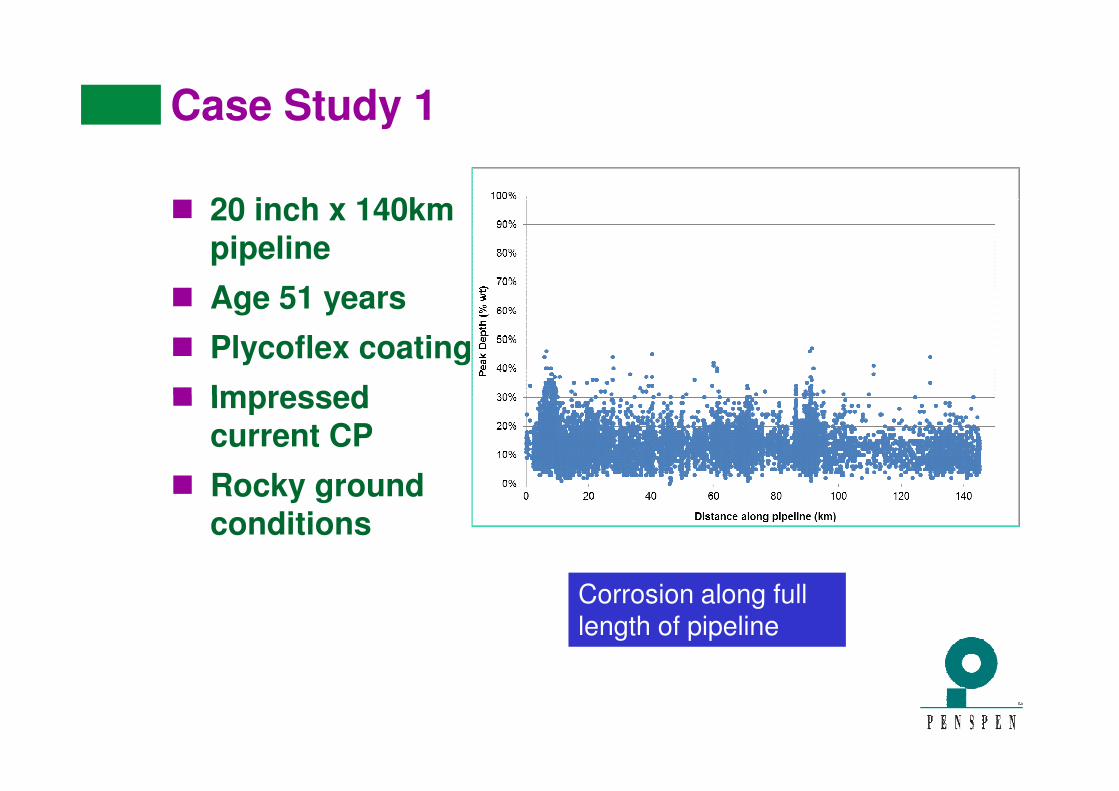
Case Study 1
� 20 inch x 140km pipeline
� Age 51 years
� Plycoflex coating
� Impressed � Impressed current CP
� Rocky ground conditions
Corrosion along full length of pipeline
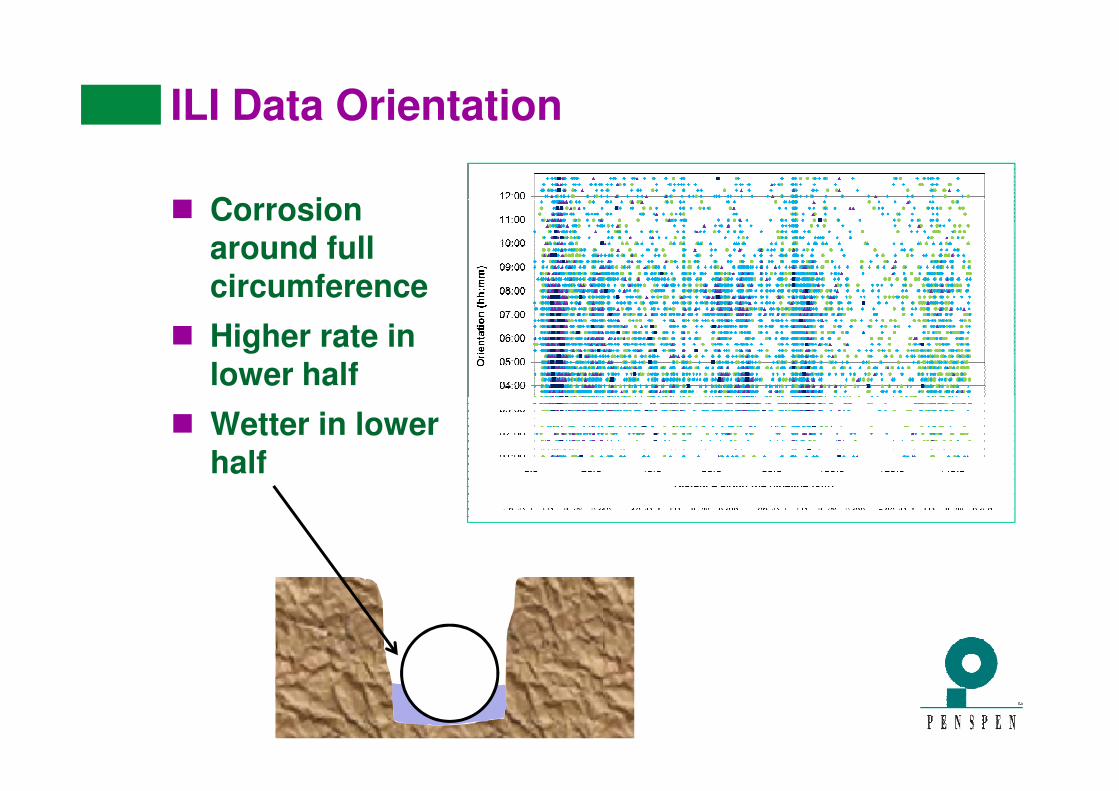
ILI Data Orientation
� Corrosion around full circumference
� Higher rate in lower half
� Wetter in lower half
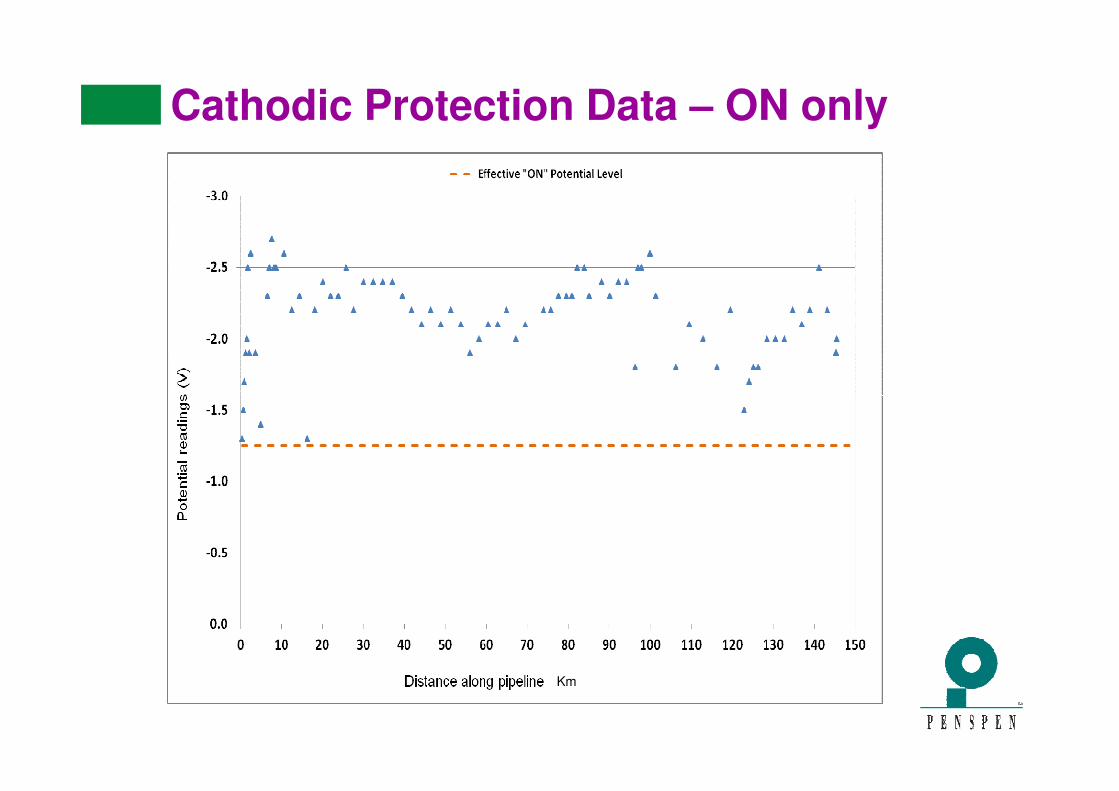
Cathodic Protection Data – ON only
Km

Tape Coating Failure Mode
� Early type PE butyl rubber tape
� Poor adhesion at the overlap
� Soil stresses cause � Soil stresses cause wrinkling and sagging
� Moisture ingress around full circumference
Conclusion:
•Verification digs to confirm assessment
• CIPS survey to better assess CP
• CP will always struggle due to shielding
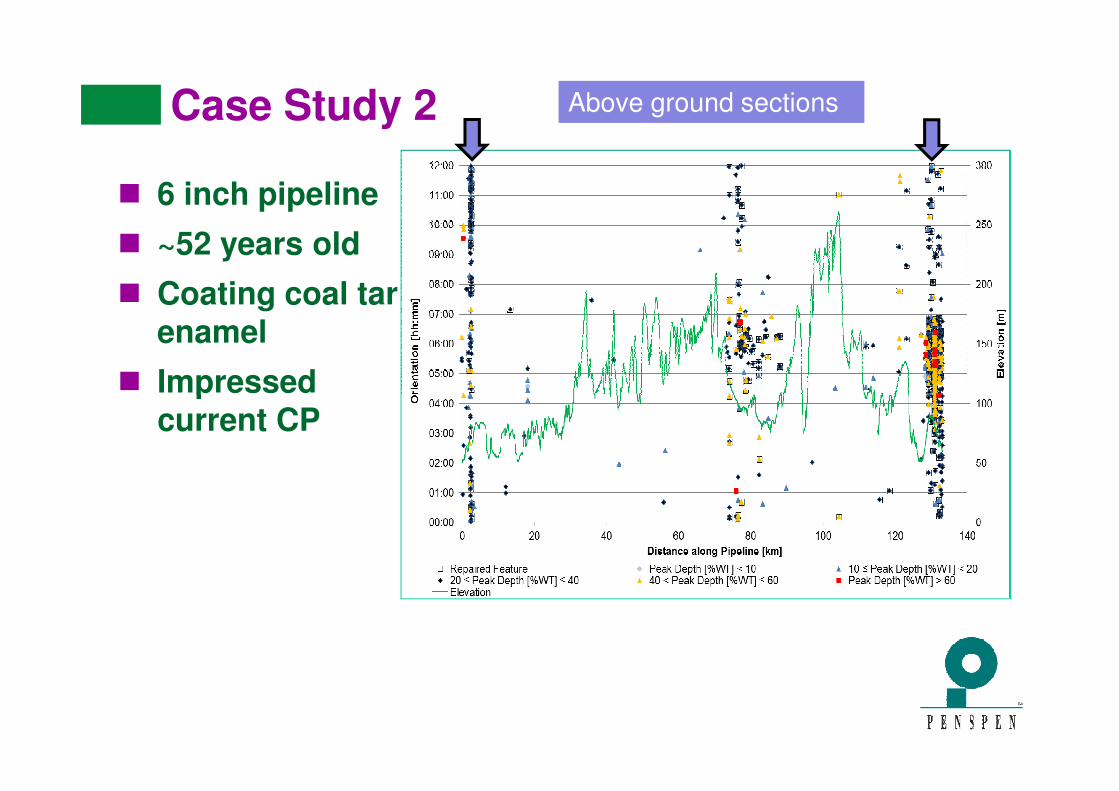
Case Study 2
� 6 inch pipeline
� ~52 years old
� Coating coal tar enamel
� Impressed
Above ground sections
� Impressed current CP
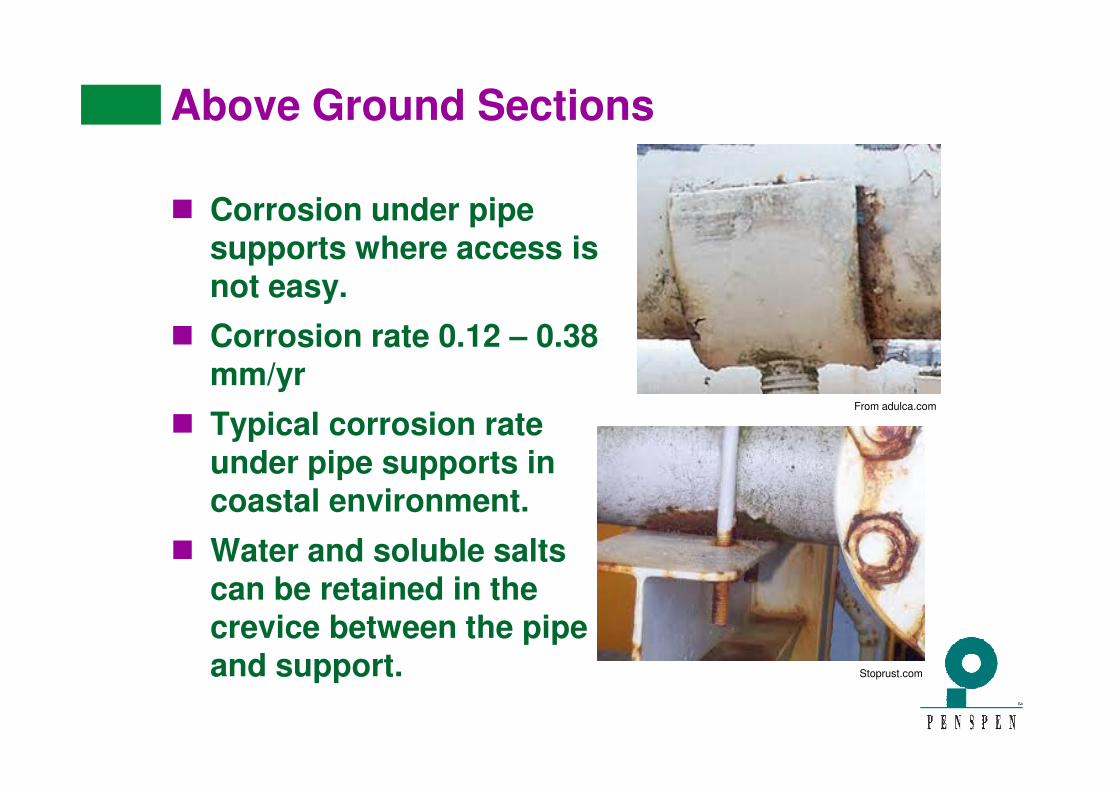
Above Ground Sections
� Corrosion under pipe supports where access is not easy.
� Corrosion rate 0.12 – 0.38 mm/yr
� Typical corrosion rate under pipe supports in coastal environment.
� Water and soluble salts can be retained in the crevice between the pipe and support.
From adulca.com
Stoprust.com

Below Ground Sections
� Corrosion rate low 0.04 -0.07mm/yr
� Only ON potential data available
� Look OK but
Area of corrosion anomalies
� Look OK but misleading.
� Corresponds with low elevation on pipeline with chalk high points either side
� Between CP stations
Conclusions:
•Move and recoat under pipe supports
•Verification digs
•CIP Survey needed
•CP needs adjustment
•OFF potentials should be routine

Case Study 3
� 10 inch pipeline
� ~70 years old
� Coating asphalt enamel – site applied
� Impressed current � Impressed current CP – 13 stations over 33km
� Shared same trench with other pipelines

Field Joint Coating
� Concentration of external corrosion features at field joints
� Field joint coated hand applied hot hand applied hot enamel
� Still significant number of defects elsewhere
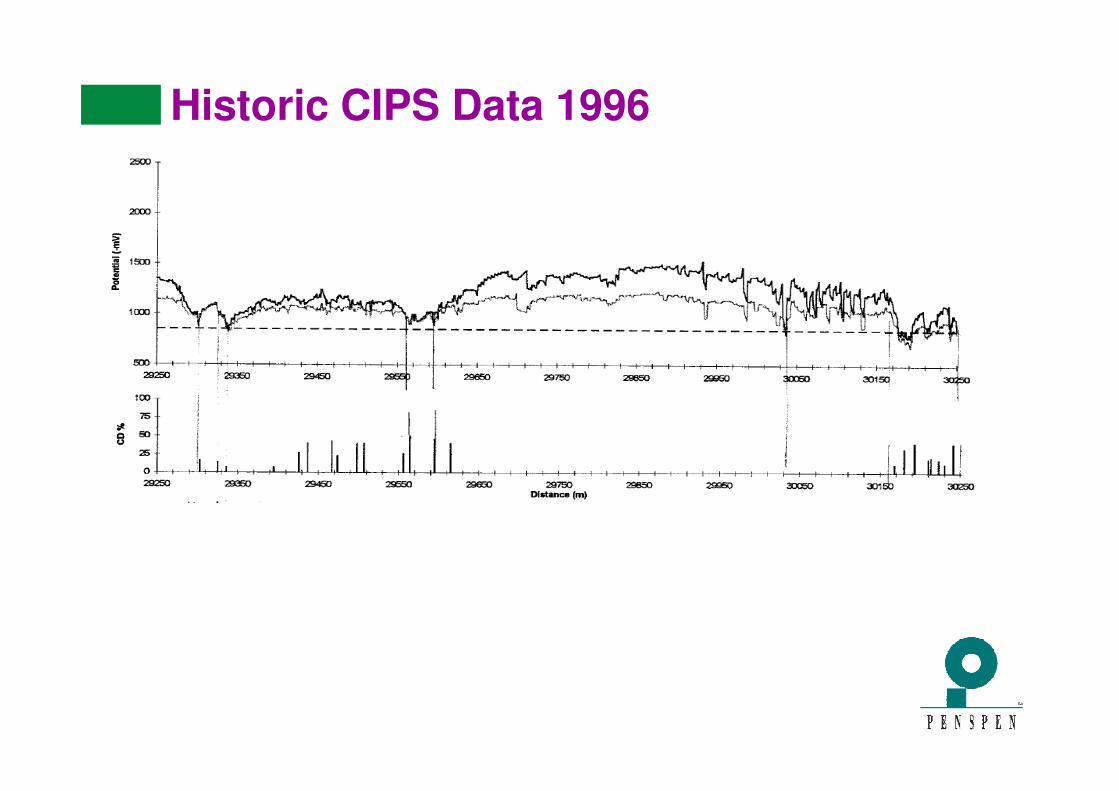
Historic CIPS Data 1996

CIPS Data 2007 and 2013
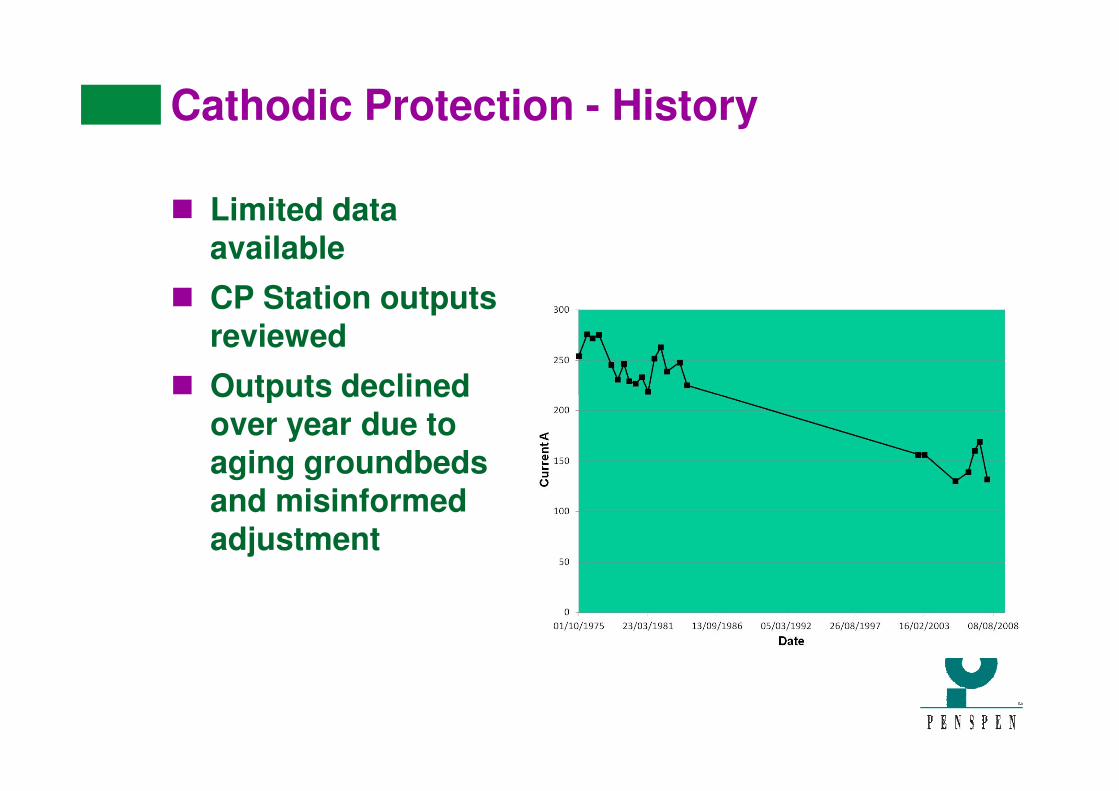
Cathodic Protection - History
� Limited data available
� CP Station outputs reviewed
� Outputs declined � Outputs declined over year due to aging groundbedsand misinformed adjustment

Overlaying ILI Defect Data and CP Station Outputs
CP
S 1
CP
S 2
CP
S 3
CP
S 4
CP
S 5
CP
S 7
CP
S 8
CP
S 6
CP
S 1
2
CP
S 7
CP
S 8
CP
S9
CP
S 1
0
CP
S 1
1

Case Study 3
� Verification digs found coating contained coke particles
� Coke forms a galvanic couple with the steel causing high corrosion ratesrates
� -850 mV not enough
� -950 mV not enough
Conclusion:
•Coating coked during application
•Potential criterion used inappropriate
•Restoration of CP Station current capacity ++ a priority
Conclusions
� ILI data can give a good picture of a pipelines condition
� Detailed statistical analysis of the data is a key step:
� Corrosion distribution
� Corrosion orientation
� Corrosion rate Re-inspection interval, repair programme programme
� Confidence level
� Input from an experienced pipeline corrosion engineer:
� Enables integration and interpretation of CP and coating data
� Enhances the confidence level
� Identifies the most probable cause
� Enables mitigation measures to be developed

Close
� Thank you for your attention.
Contact Points:
Penspen IntegrityUnits 7&8, Terrace Level,Units 7&8, Terrace Level,
St Peter’s Wharf,
Newcastle upon Tyne NE6 1TZ, UK
Tel: +44 (0) 191 238 2200
Fax: +44 (0) 191 275 9786
email: [email protected]
www.penspenintegrity.com