


Languages
Pages
Legal

COPEX, 2014, BrusselsILI and CP Data Comparison and
Usage
Phil Hopkins
David Eyre, Penspen, UK
3rd April, 2014
Presentation
Introduction
CP Data Sources
ILI Data
Case Study 1
Case Study 2
Case Study 1
Case Study 3
Conclusions

Penspen Ltd.
� Penspen is an international engineering consultancy.
� We are in the oil and gas business, specialising in pipelines and facilities.
� Our headquarters are in Richmond, Surrey, UK, but we Richmond, Surrey, UK, but we have offices in USA, Mexico, UAE, Bangkok, Greece, Qatar, Libya, Saudi Arabia, France, etc..
� £110 million/annum business.
� We have >1000 staff around the world.
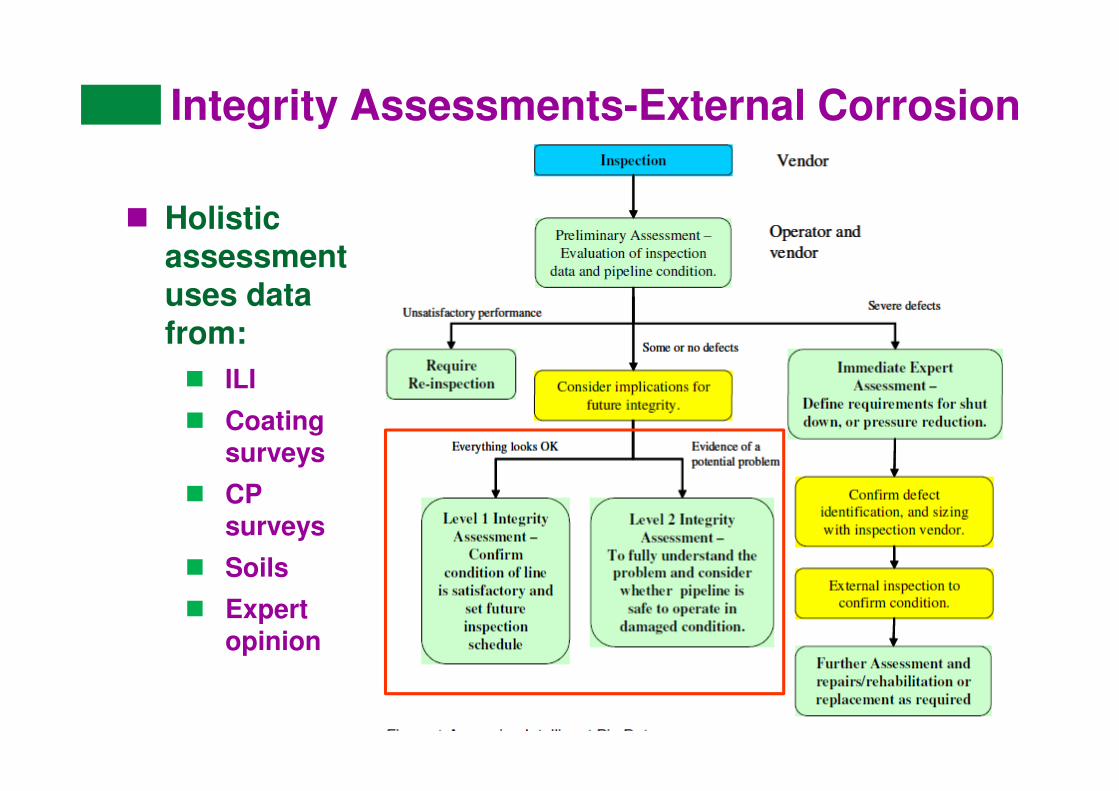
Integrity Assessments-External Corrosion
� Holistic assessment uses data from:
� ILI
� Coating surveys
� CP surveys
� Soils
� Expert opinion

Niels Bohr(1885 – 1962)
Nobel Prize in Physics 1922
“Prediction is very difficult,
especially about the future”

ILI Data
� Generally good for external corrosion
� Primarily used for remaining strength strength assessment
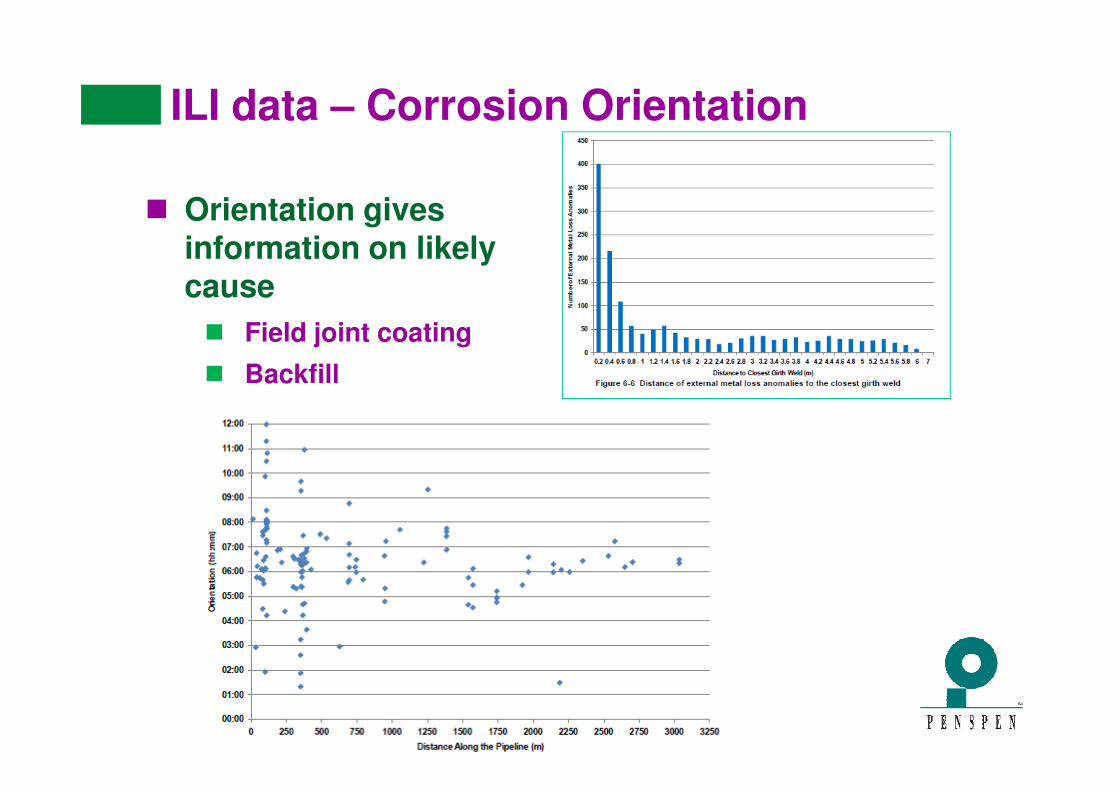
ILI data – Corrosion Orientation
� Orientation gives information on likely cause
� Field joint coating
� Backfill

ILI Data - Corrosion Rates
� Multiple defect matching from two sets of ILI data
� Tolerances can have a big impact at low corrosion ratescorrosion rates
� Statistician needs to be confident in the results
� Used to determine repair dates and next inspection
Cumulative probabilites of failure for individual defects
0%
10%
20%
30%
40%
50%
60%
70%
80%
90%
100%
2000 2010 2020 2030 2040 2050 2060 2070 2080 2090 2100
Date
Pro
ba
bil
ity
Defect 1 Defect 2 Defect 3 Defect 4 Defect 5
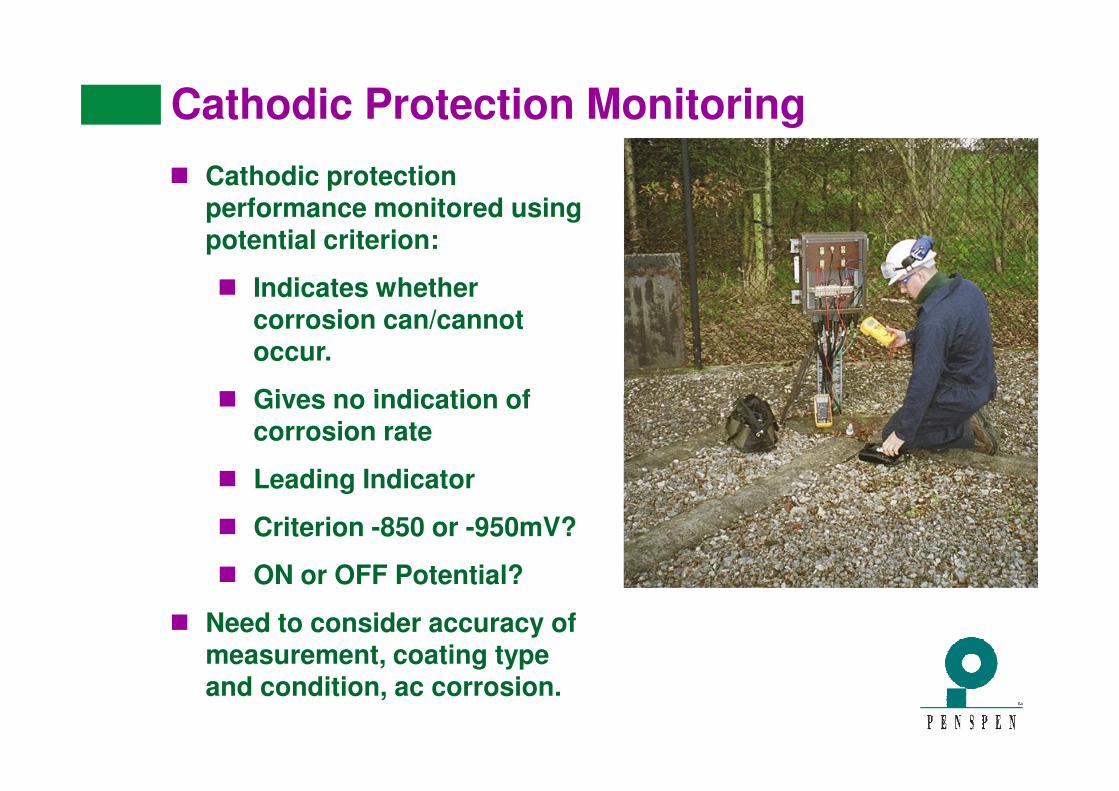
Cathodic Protection Monitoring
� Cathodic protection performance monitored using potential criterion:
� Indicates whether corrosion can/cannot occur.
� Gives no indication of � Gives no indication of corrosion rate
� Leading Indicator
� Criterion -850 or -950mV?
� ON or OFF Potential?
� Need to consider accuracy of measurement, coating type and condition, ac corrosion.
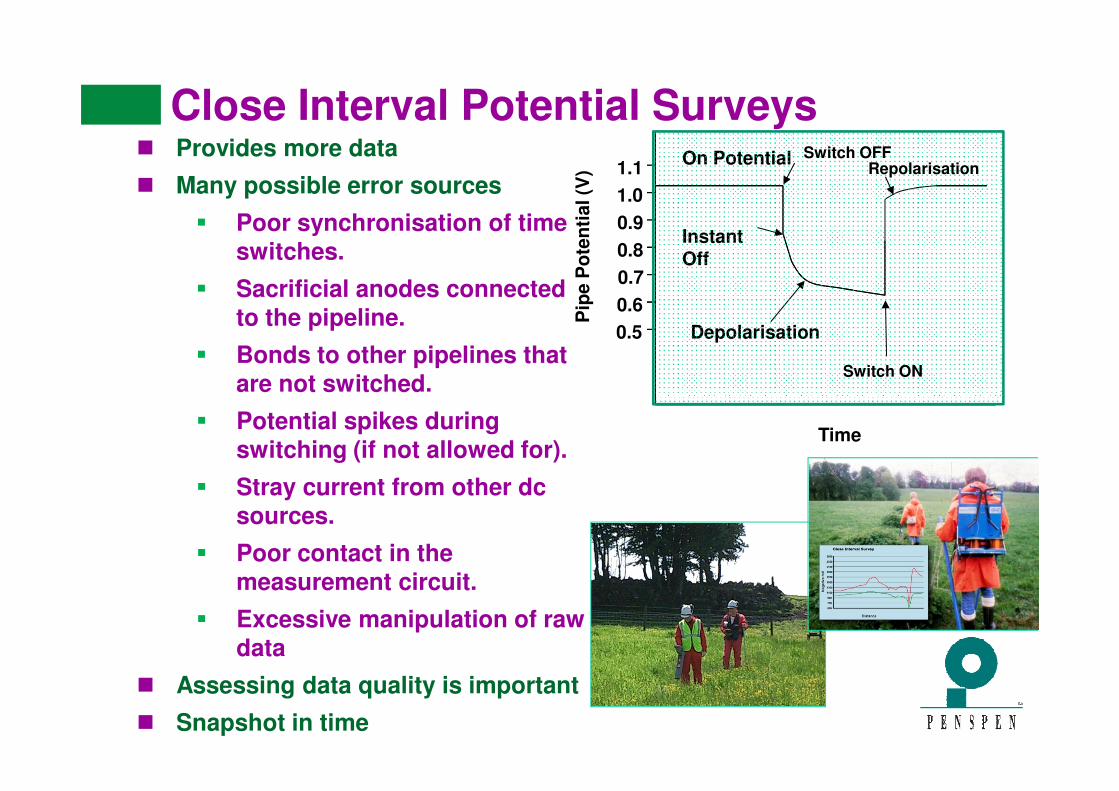
Close Interval Potential Surveys� Provides more data
� Many possible error sources
� Poor synchronisation of time switches.
� Sacrificial anodes connected to the pipeline.
� Bonds to other pipelines that are not switched.
1.1
1.0
0.9
0.8
0.7
0.6
0.5
Pip
e P
ote
nti
al (V
)
Instant Off
On Potential
Depolarisation
Switch ON
Switch OFFRepolarisation
are not switched.
� Potential spikes during switching (if not allowed for).
� Stray current from other dc sources.
� Poor contact in the measurement circuit.
� Excessive manipulation of raw data
� Assessing data quality is important
� Snapshot in time
Time
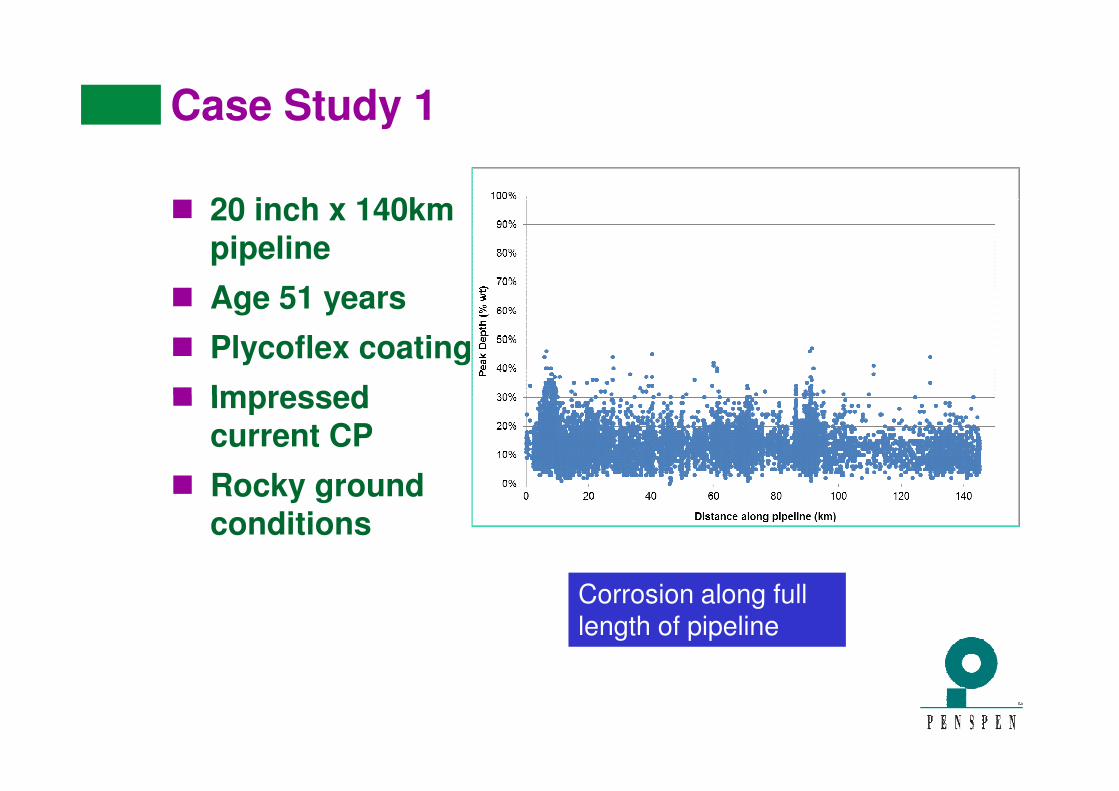
Case Study 1
� 20 inch x 140km pipeline
� Age 51 years
� Plycoflex coating
� Impressed � Impressed current CP
� Rocky ground conditions
Corrosion along full length of pipeline
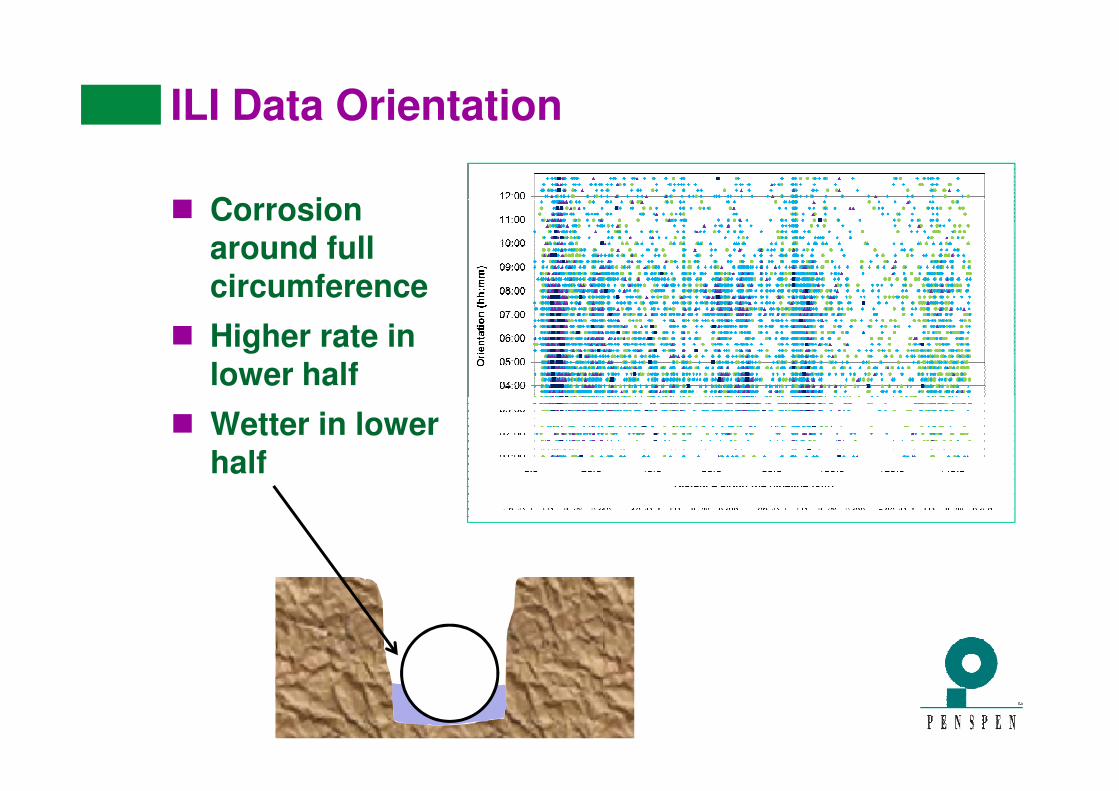
ILI Data Orientation
� Corrosion around full circumference
� Higher rate in lower half
� Wetter in lower half
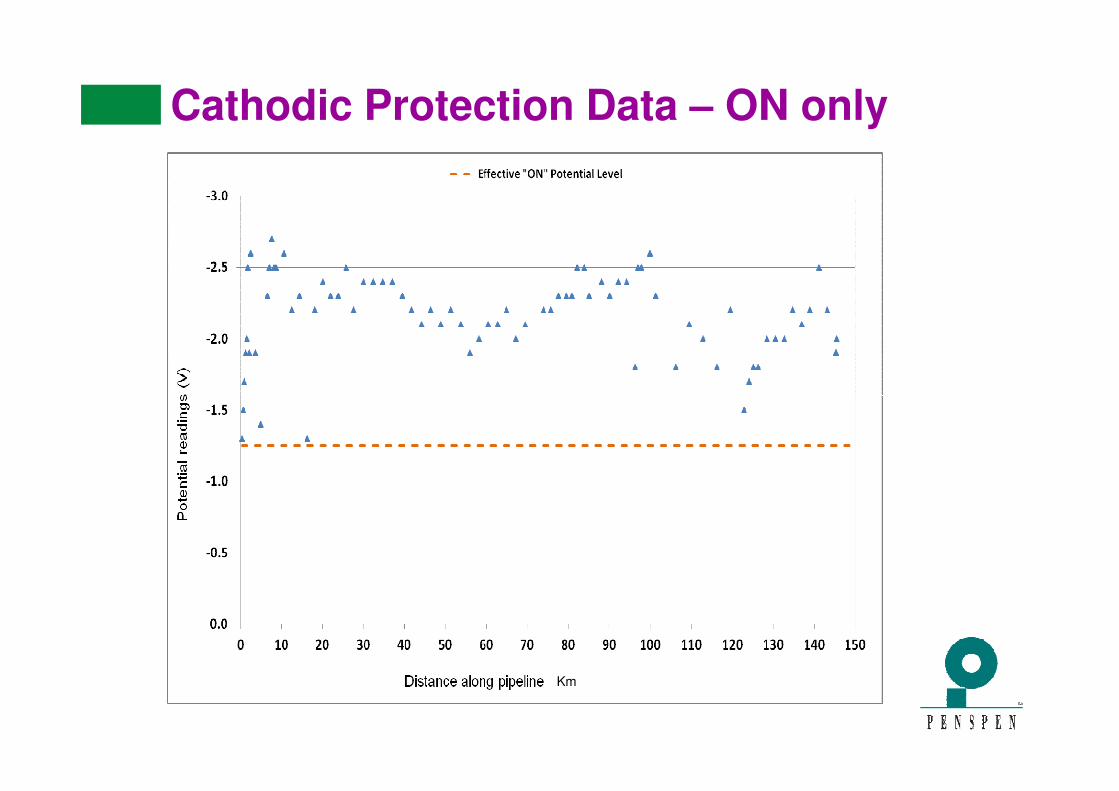
Cathodic Protection Data – ON only
Km

Tape Coating Failure Mode
� Early type PE butyl rubber tape
� Poor adhesion at the overlap
� Soil stresses cause � Soil stresses cause wrinkling and sagging
� Moisture ingress around full circumference
Conclusion:
•Verification digs to confirm assessment
• CIPS survey to better assess CP
• CP will always struggle due to shielding
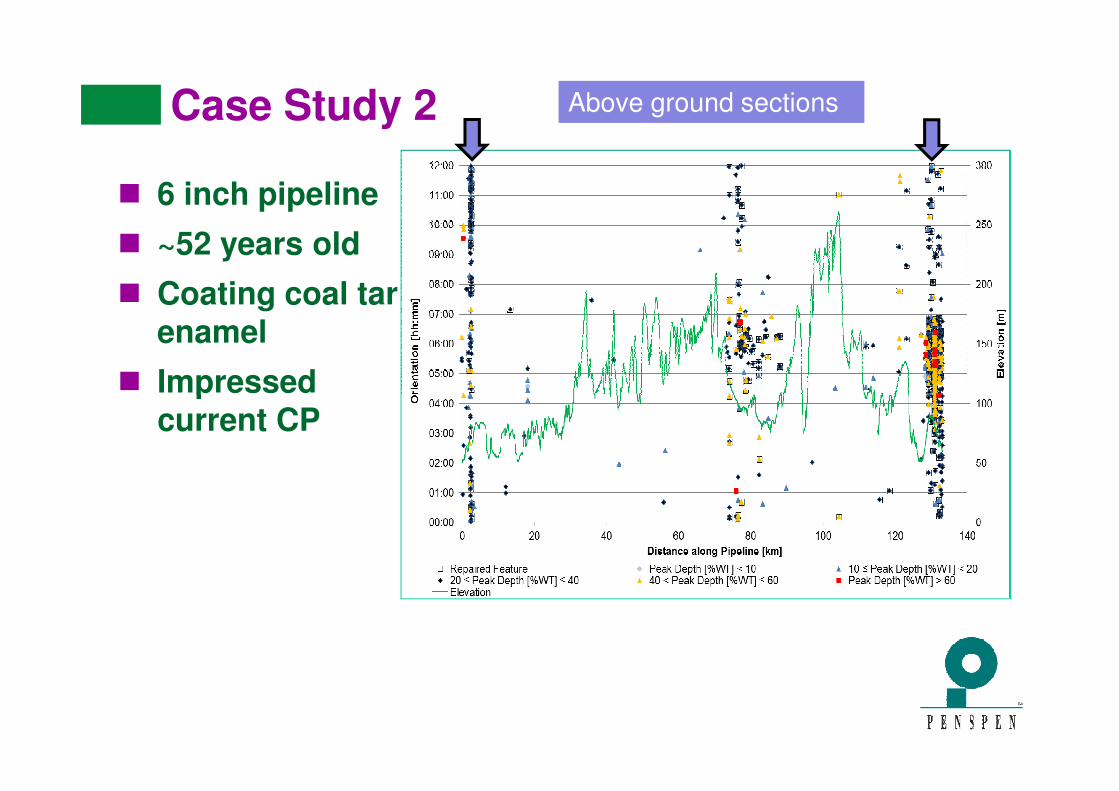
Case Study 2
� 6 inch pipeline
� ~52 years old
� Coating coal tar enamel
� Impressed
Above ground sections
� Impressed current CP
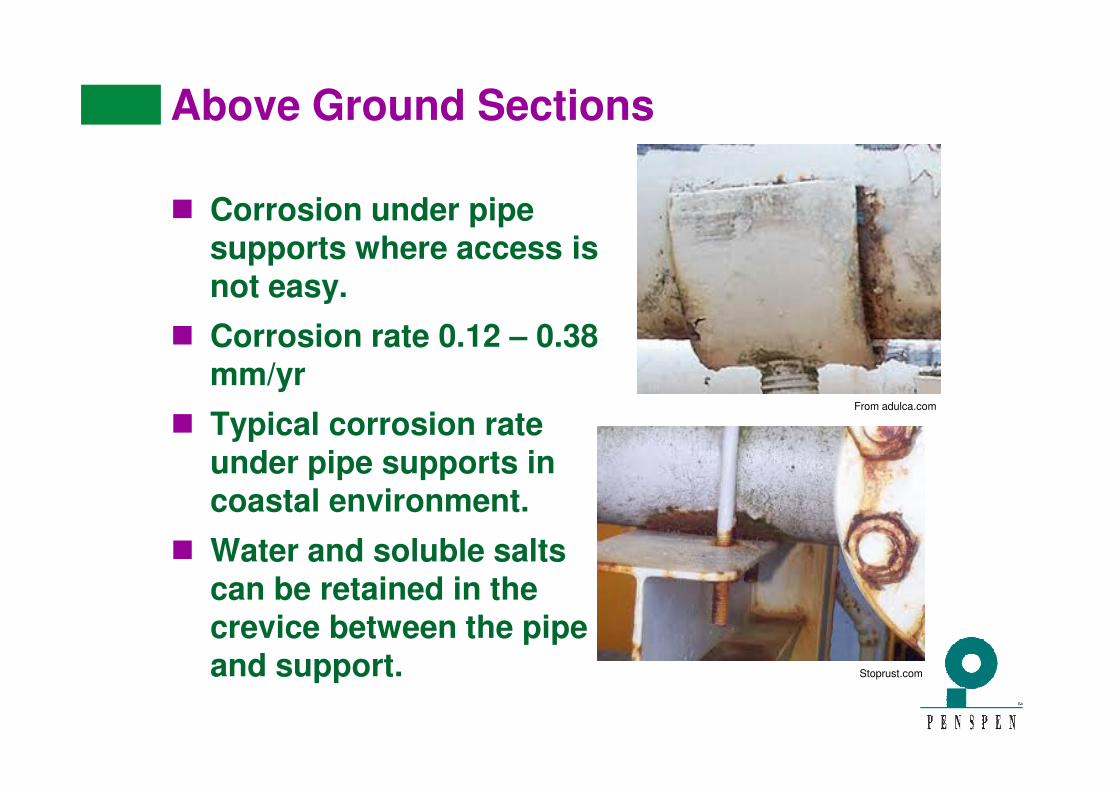
Above Ground Sections
� Corrosion under pipe supports where access is not easy.
� Corrosion rate 0.12 – 0.38 mm/yr
� Typical corrosion rate under pipe supports in coastal environment.
� Water and soluble salts can be retained in the crevice between the pipe and support.
From adulca.com
Stoprust.com

Below Ground Sections
� Corrosion rate low 0.04 -0.07mm/yr
� Only ON potential data available
� Look OK but
Area of corrosion anomalies
� Look OK but misleading.
� Corresponds with low elevation on pipeline with chalk high points either side
� Between CP stations
Conclusions:
•Move and recoat under pipe supports
•Verification digs
•CIP Survey needed
•CP needs adjustment
•OFF potentials should be routine

Case Study 3
� 10 inch pipeline
� ~70 years old
� Coating asphalt enamel – site applied
� Impressed current � Impressed current CP – 13 stations over 33km
� Shared same trench with other pipelines

Field Joint Coating
� Concentration of external corrosion features at field joints
� Field joint coated hand applied hot hand applied hot enamel
� Still significant number of defects elsewhere
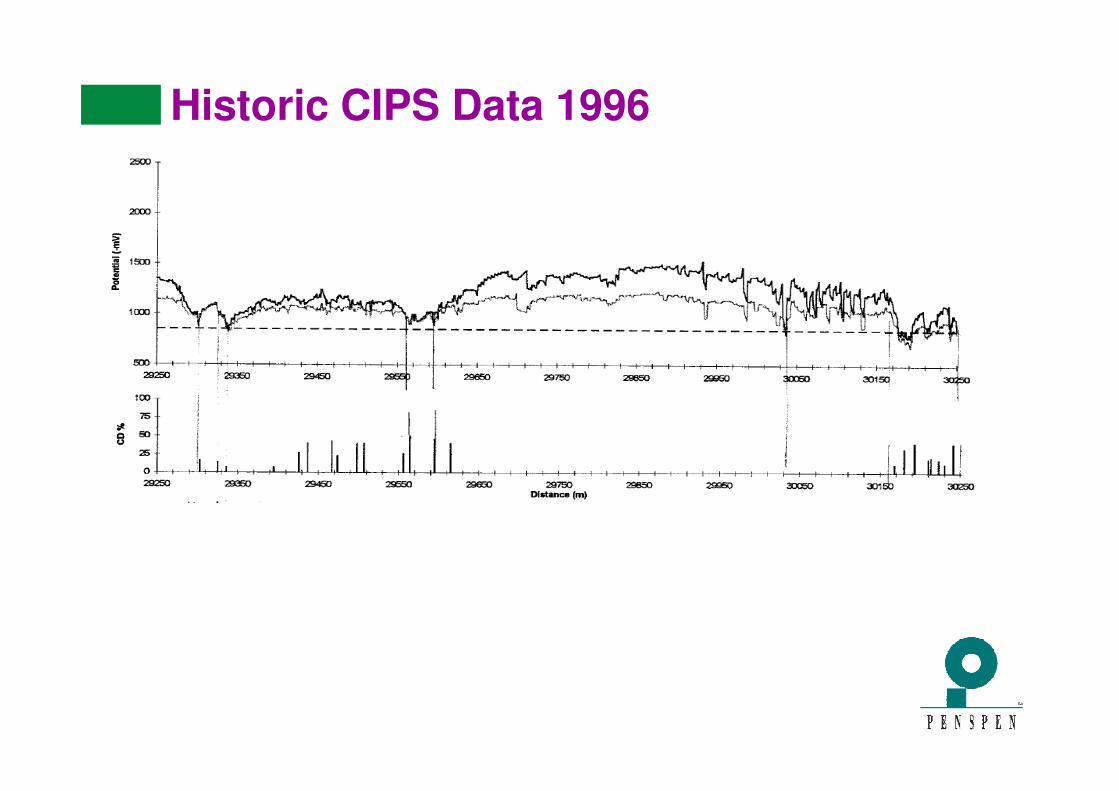
Historic CIPS Data 1996

CIPS Data 2007 and 2013
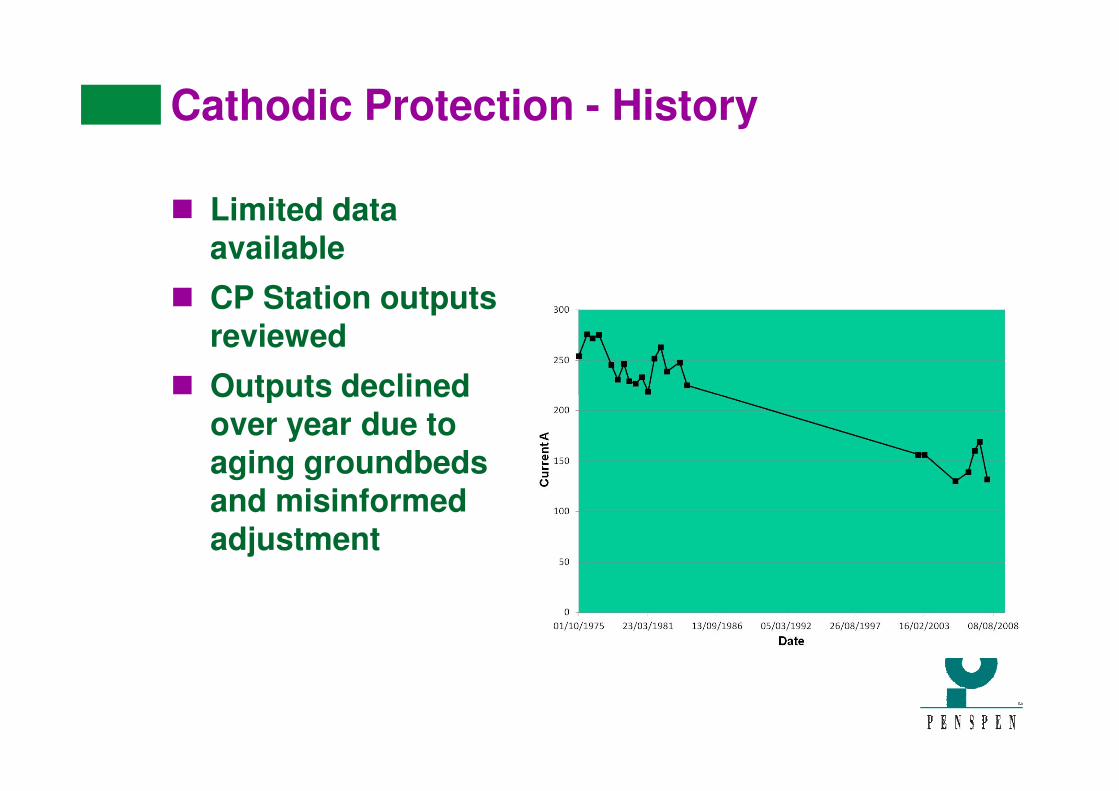
Cathodic Protection - History
� Limited data available
� CP Station outputs reviewed
� Outputs declined � Outputs declined over year due to aging groundbedsand misinformed adjustment

Overlaying ILI Defect Data and CP Station Outputs
CP
S 1
CP
S 2
CP
S 3
CP
S 4
CP
S 5
CP
S 7
CP
S 8
CP
S 6
CP
S 1
2
CP
S 7
CP
S 8
CP
S9
CP
S 1
0
CP
S 1
1

Case Study 3
� Verification digs found coating contained coke particles
� Coke forms a galvanic couple with the steel causing high corrosion ratesrates
� -850 mV not enough
� -950 mV not enough
Conclusion:
•Coating coked during application
•Potential criterion used inappropriate
•Restoration of CP Station current capacity ++ a priority
Conclusions
� ILI data can give a good picture of a pipelines condition
� Detailed statistical analysis of the data is a key step:
� Corrosion distribution
� Corrosion orientation
� Corrosion rate Re-inspection interval, repair programme programme
� Confidence level
� Input from an experienced pipeline corrosion engineer:
� Enables integration and interpretation of CP and coating data
� Enhances the confidence level
� Identifies the most probable cause
� Enables mitigation measures to be developed

Close
� Thank you for your attention.
Contact Points:
Penspen IntegrityUnits 7&8, Terrace Level,Units 7&8, Terrace Level,
St Peter’s Wharf,
Newcastle upon Tyne NE6 1TZ, UK
Tel: +44 (0) 191 238 2200
Fax: +44 (0) 191 275 9786
email: [email protected]
www.penspenintegrity.com
Top Related