Company Overview Presentation - DCC plc/media/Files/D/DCC-Corp/pdfs/Company-Overvie… · Sales,...
24
Company Overview Presentation December 2012
Transcript of Company Overview Presentation - DCC plc/media/Files/D/DCC-Corp/pdfs/Company-Overvie… · Sales,...

Company Overview
Presentation
December 2012

Disclaimer
This presentation does not constitute an invitation to underwrite, subscribe for or otherwise acquire or dispose of any shares or other
securities of DCC plc (“DCC”).
This presentation contains some forward-looking statements that represent DCC’s expectations for its business, based on current
expectations about future events, which by their nature involve risks and uncertainties. DCC believes that its expectations and assumptions
with respect to these forward-looking statements are reasonable; however because they involve risk and uncertainty, which are in some
cases beyond DCC’s control, actual results or performance may differ materially from those expressed or implied by such forward-looking
statements. DCC undertakes no duty to and will not necessarily update any such statements in light of new information or future events,
except to the extent required by any applicable law or regulation. Recipients of this presentation are therefore cautioned that a number of
important factors could cause actual results or outcomes to differ materially from those expressed in any forward-looking statements.
Past performance is no guide to future performance and persons needing advice should consult an independent financial adviser.
Any statement in this presentation which infers that transactions may be earnings accretive does not constitute a profit forecast and should
not be interpreted to mean that DCC’s earnings or net assets in the first full financial year following the transactions, nor in any subsequent
period, would necessarily match or be greater than those for the relevant preceding financial year.
Your attention is drawn to the risk factors referred to in this presentation and also set out in the Principal Risks and Uncertainties section of
DCC’s Annual Report. These risks and uncertainties do not necessarily comprise all the risk factors associated with DCC and/or any
recently acquired businesses. There may be other risks which may have an adverse effect on the business, financial condition, results or
future prospects of DCC.
2

Business Overview
Sales, marketing and distribution of oil and liquefied petroleum
gas products
DCC Energy
SerCom Distribution: Sales, marketing and distribution of IT,
communications and home entertainment products.
SerCom Solutions: Supply chain management services
DCC SerCom
Provider of a broad range of recycling, waste management and resource
recovery services. DCC Environmental
DCC Food &
Beverage Sales, marketing and distribution of food and beverage products
Hospitals Supplies & Services: Medical device and pharma products sales,
marketing and distribution and value added logistics services to hospitals.
Health & Beauty Solutions: Outsourced services to brand owners in the
health and beauty sector.
DCC Healthcare
3

DCC
DCC is a sales, marketing, distribution and business support services Group
operating across 5 divisions
68%
14%
18%
Profit by Geography *
UK
ROI
Rest of World
45%
29%
12%
8% 6%
Profit By Division *
DCC Energy
DCC SerCom (IT, Communications &Home Entertainment Products)
DCC Healthcare
DCC Environmental
DCC Food & Beverage
* YE 31 Mar 2012
4
DCC – Financial Highlights Year ended 31 March 2012
Revenue €10,690.3m ROCE 14.2%
Operating Profit €185.0m Net debt / EDITDA 0.5
Operating Cash flow €277.3m Interest cover (times) 10.4

1976 - 90
Origins as a venture and development capital company, with clear focus on
return on capital employed and operating profit. Generated a compound
annual return on investment of 23% over this period.
1990 - 94
Transition to diversified group focused on 5 sectors
– Energy, IT, Healthcare, Environmental and Food
2012
Listed under Support Services on the Irish and London stock exchanges
Market capitalisation of c. €1.9 billion
Employs approximately 9,000 people
Operating in 10 countries
Today
DCC - History
5

DCC’s Strategy
Our Objective:
To build a growing, sustainable and cash generative business which consistently provides
returns on total capital employed significantly ahead of its cost of capital
We aim to achieve this through:
• Creating and sustaining leading positions in each of the markets in which we operate
• Continuously benchmarking and improving the efficiency of our operating model in each
of our businesses
• Carefully extending our geographic footprint, to provide new horizons for growth
• Attracting and empowering entrepreneurial leadership teams, capable of delivering
outstanding performance, through the deployment of a devolved management structure
• Maintaining financial strength through a disciplined approach to balance sheet
management
6

The Business:
By Division
7

Supply
Commercial 53%
Retail 16%
Industrial 12%
Domestic 11%
Agricultural 5%
Marine 2%
Other 1%
FY 2012
Revenue €7,823.0m
Operating profit €83.5m
ROCE * 14.0%
DCC Energy (45% of FY 2012 Group Profit)
Sales, marketing and distribution of oil and liquefied petroleum gas (LPG)
• Oil for transport, heating and industrial / agricultural processes
• LPG for heating, cooking, transport and industrial / agricultural processes
• Product Split: Road transport 48% Commercial fuel 22%
Heating oil 23% LPG 7%
DCC Energy
Customer Split
Oil Refinery
Oils Artic
Through DCC Energy’s
depots c. 50%
Oils Rigid
Importation /
Inland Terminals, Direct Deliveries
c. 50%
Business model
Delivered by
8 * ROCE = Operating profit divided by average capital employed where capital employed includes all intangible assets (on balance sheet and previously written off)

DCC Energy – our business
Geography Volume Market Share Market
Position
Britain - oil
Britain - LPG
c. 6,500mL
c. 275kT
16%
c. 25%
No. 1
No. 2
Ireland - oil
Ireland - LPG
c. 1,000 m
c. 65kT
9%
37%
No. 5
No. 2
Austria - oil c. 700 m 12% No. 2
Sweden - oil
Sweden - LPG
c. 500 m
c. 182kT
17%
45%
No. 1
No. 1
Norway - LPG c.88kT 43% No. 1
Denmark - oil c. 300 m 13% No. 2
Holland - LPG c. 55kT c. 26% No. 1
Business Statistics (year ended 31 March 2012)
Volumes c. 10 billion Litres
(annualised including acquisitions)
Customers c. 1 million
Trucks c. 2,000
Employees c. 4,300
Sites 340
Retail petrol sites supplied Britain - 1,350
Ireland - 120
9

DCC Energy – vision & strategy
3.2 4.2
5.3
6.2
7.1
7.9
0
1
2
3
4
5
6
7
8
9
07 08 09 10 11 12
Litres (billion) Volumes
59.5
74.3
100.7 113.1
137.3
83.5
0
20
40
60
80
100
120
140
160
07 08 09 10 11 12
Operating Profit 5 Yr. CAGR 7%
€m
DCC Energy’s vision is to be the leading oil and LPG sales,
marketing and distribution business in Europe
• With strong local market shares
• Operating under multiple brands
• Generating high levels of ROCE
• Expanding into new geographies
• Continuing the development of its presence in the green/renewable
energy sector
Strategy
• Continue to consolidate existing markets
• Acquire businesses in new geographies
• Drive organic profit growth by leveraging the scale of the business
• Prioritise growth in the transport fuels segment
• Expand sales of differentiated products
• Cross sell “add-on” products and services
• Expand product/service offering to include alternative/green energies
10

DCC SerCom (29% of FY 2012 Group Profit)
DCC SerCom - sales, marketing and distribution of IT, communications and
home entertainment products and supply chain management services to ICT
industry
FY 2012
Revenue €2,181.2m
Operating profit €53.2m
ROCE * 15.7% Business model
350 industry leading vendors
IT, communications
& home entertainment
products
10,000 customers
Retail, etail, reseller
Consumer & SME
DCC SerCom provides a full range of services to our vendors and customers, delivering an exceptional
route to market for a broad range of innovative products
11 * ROCE = Operating profit divided by average capital employed where capital employed includes all intangible assets (on balance sheet and previously written off)

DCC SerCom – our business
DCC SerCom Geography Market
Position
IT,
Communications
& Home
Entertainment
Products
Britain No. 2
Ireland No. 2
France No. 7
Holland Niche
Sweden Niche
Total Europe No. 5
PCs & servers, 30%
Consumables, 10%
Printers & IT peripherals, 9%
Consumer electronics, 10%
Communications, 6%
Games consoles, 10%
Games software / DVD, 10%
Other, 15%
FY 2012 Product Split
DCC SerCom Services
IT,
Communications
& Home Entertainment
Products
Proactive sales and marketing * Product fulfilment and distribution * Own
label product design and sourcing * E-commerce solutions * End user
fulfilment * Digital media distribution * Third Party logistics * Category
management * Product bundling * Kitting and flashing * VMI programmes
* Outsourced procurement * Demand planning and management * Supplier
aggregation
12

DCC SerCom – vision & strategy
DCC SerCom’s vision is to be the leading specialist consumer
IT distribution business in Western Europe
• With strong local market shares
• Generating high levels of ROCE
• Expanding into new geographies
• The obvious partner for a new vendor to access European retail
Strategy
• Grow market position in converging mobile telephony / IT market
• Further organic growth with complementary acquisitions in Britain
and Europe in Audio Visual, Mobile and Accessories, Unified
Communications
• Service expansion – white label, vendor shops, employee
programmes, third party logistics, category management
• Acquisition and organic expansion into new geographies
29.2
36.7 35.0 36.8
42.5
47.9
07 08 09 10 11 12
Operating Profit * (€m) 5 Yr. CAGR 10.3%
* based on continuing activities i.e. excluding DCC SerCom’s
Enterprise distribution business which was disposed of in June 2012.
13

DCC Healthcare (12% of FY 2012 Group Profit)
Service provider to medical, pharmaceutical and health & beauty sector
brand owners
• DCC Hospital Supplies & Services - provision of sales, marketing,
distribution and other services in Ireland and Britain to medical device and
pharma companies and to healthcare providers
• DCC Health & Beauty Solutions - provision of outsourced services to
health and beauty brand owners in Europe, principally in VMS and skin care
FY 2012
Revenue €330.0m
Operating profit €23.4m
ROCE * 15.4%
Vendors / Customers
• Medical device brand owners
• Pharma brand owners / manufacturers
• Healthcare providers
• Health & Beauty brand owners
Service Offering
• Sales, marketing & distribution
• Regulatory affairs
• Pharma compounding
• Supply chain management & logistics
• Product development, contract manufacturing and packing
Market Coverage
• Hospitals
• Retail pharmacy
• Specialist Health & Beauty retailers
• Direct sales/ mail order companies
Business model
14 * ROCE = Operating profit divided by average capital employed where capital employed includes all intangible assets (on balance sheet and previously written off)

DCC Healthcare – our business
Geography Market Position
Ireland
• No. 1 sales, marketing & distribution of
medical devices and pharma products
• No. 1 pharma compounding service
provider
Britain
• No .1 UK based Health & Beauty contract
manufacturing service provider
• A leading value added healthcare logistics
services provider
Sweden • A leading Health & Beauty outsourced
service provider
15
Devices 27%
Pharma 15%
Logistics 30%
Health & Beauty 28%
Analysis of FY12 sales

DCC Healthcare – vision & strategy
DCC Healthcare’s vision is to build a substantial healthcare business
principally focused on the provision of value added services to the
medical device, pharma and health & beauty sectors
• With strong local market shares
• Generating high levels of ROCE
• Expanding into new geographies
Strategy
DCC Hospital Supplies & Services
• Expansion of medical device and pharma product portfolios and
service offerings
• Acquisition focus – pharma product licences/dossiers, specialist and
service based businesses in Britain; bolt on acquisitions in Ireland
DCC Health & Beauty Solutions
• Continued focus on product development and expansion of European
sales network
• Acquisition focus: expand customer base / geographic penetration in
Continental Europe; enhance service offering
* excluding M&R sold to Patterson Medical in June 2010
21.0 20.6
15.4
19.9
22.5 23.4
07 08 09 10 11 12
Operating Profit* (€m)
5 Yr. CAGR 2.2%
16

DCC Environmental – our business (8% of FY 2012 Group Profit)
Business Stats (year ended 31 March 2012)
Revenue €132.7m
Operating Profit €14.2m
ROCE 10.2% *
Volume 1.5 m tonnes
Recovery rate 74%
Licensed sites 21 facilities
Vehicles 350
Employees c. 900
Geography Market Position
Ireland No. 1 hazardous waste
management business
Britain
A leading recycling, waste
management and resource
recovery business – market
leading positions in Scotland
and the East Midlands region
17 * ROCE = Operating profit divided by average capital employed where capital employed includes all intangible assets (on balance sheet and previously written off)

DCC Environmental – vision & strategy
DCC Environmental’s vision is to be a leading broadly
based waste management and recycling business in
Britain and Ireland
• With strong local market shares
• Generating high levels of ROCE
• Taking advantage of the trends towards more sustainable waste
management
• Emphasis on resource recovery and recycling
Strategy
• Expand non hazardous waste management services
regionally in Britain from current strong positions in Scotland
and the East Midlands region
• Continue to expand innovation led hazardous waste
management service
• Align business to support transition to low carbon economy
Operating Profit (€m)
5 Yr. CAGR 6.4%
10.4
14.0
10.2 9.3
11.6
14.2
07 08 09 10 11 12
18

Business Stats (year ended 31 March 2012)
Revenue €223.4m
Operating Profit €10.7m
ROCE 13.7% *
SKUs c. 4,500
Customers c. 10,000
% revenue accounted for
by DCC “owned” brands 36%
Employees c. 900
Warehouse space c. 335,000 sq ft.
Category Market Position
Healthy Foods No. 1 in ambient healthy foods
in ROI
Wine
A leading independent wine distributor in Ireland
Strong position in off trade in UK
Freshly Ground
Coffee No. 2 in ROI
Other A number of leading market
positions
DCC Food & Beverage – our business (6% of FY 2012 Group Profit)
19 * ROCE = Operating profit divided by average capital employed where capital employed includes all intangible assets (on balance sheet and previously written off)

DCC Food & Beverage – vision & strategy
DCC Food & Beverage’s vision is to be a leading added
value sales, marketing and distribution business, building
number 1 or number 2 branded positions in focused
segments
• With strong market shares
• Generating high levels of ROCE
• Emphasis on healthy foods and indulgence categories
Strategy
• Development of range of both company owned and third party branded products
• Acquisition of complementary businesses and brands
Operating Profit (€m)
5 Yr. CAGR -6.7%
15.1 15.3
12.0
8.5
11.5 10.7
07 08 09 10 11 12
20

22.4 24.2 27.3 29.7
41.5
53.5
67.0
83.3 91.1
97.2 101.6
109.3
121.0
140.1
167.2
180.4
192.8
229.6
185.0
1994 1995 1996 1997 1998 1999 2000 2001 2002 2003 2004 2005 2006 2007 2008 2009 2010 2011 2012
Operating Profit * (€’m)
18 year CAGR **
12.5%
10 year CAGR
7.3%
5 year CAGR
5.7%
21
* excluding net exceptionals, MPH and amortisation of intangible assets
** since flotation in 1994
Years ended 31 March

24.8 28.4 31.9
37.5 44.4
55.4
65.3
82.2
94.9 101.5
106.0
115.1
124.0
143.5
165.1 169.1
178.0
203.2
163.5
94 95 96 97 98 99 00 01 02 03 04 05 06 07 08 09 10 11 12
Adjusted EPS* (cent)
Years ended 31 March * excluding net exceptionals, MPH and amortisation of intangible assets
** since flotation in 1994
18 year CAGR **
11.0%
10 year CAGR
5.6%
5 year CAGR
2.6%
22
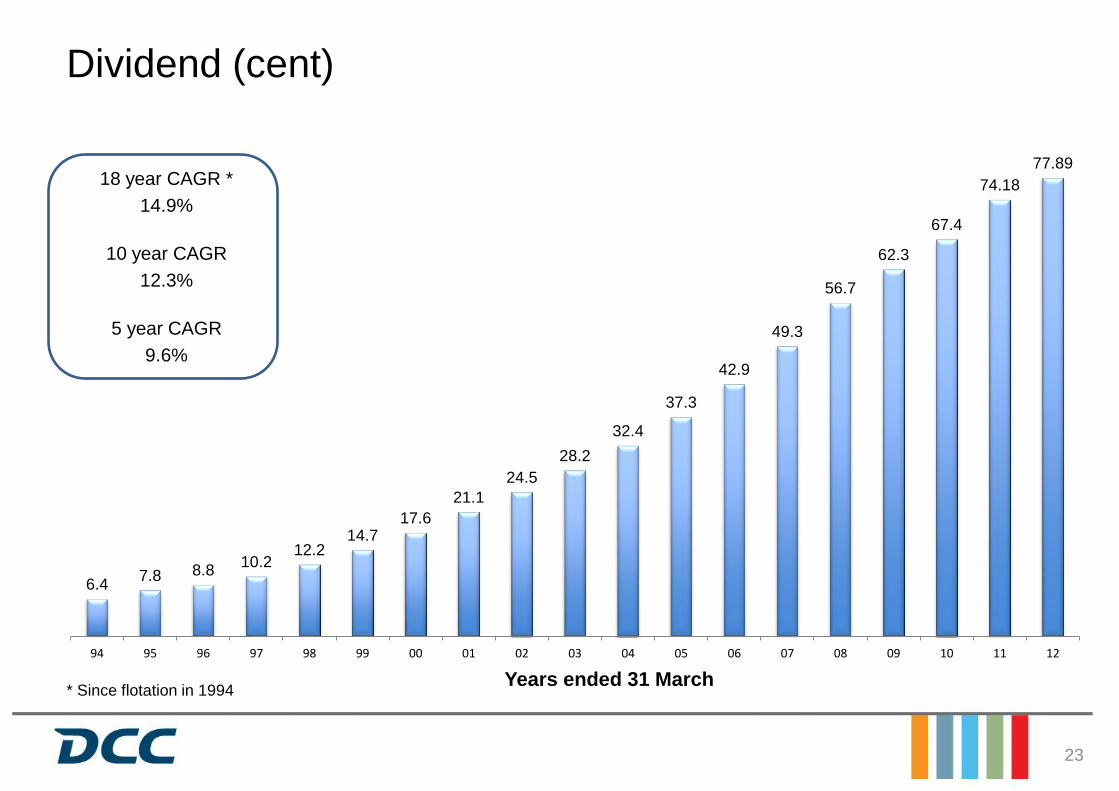
6.4 7.8 8.8
10.2 12.2
14.7 17.6
21.1
24.5
28.2
32.4
37.3
42.9
49.3
56.7
62.3
67.4
74.18
77.89
94 95 96 97 98 99 00 01 02 03 04 05 06 07 08 09 10 11 12
Dividend (cent)
18 year CAGR *
14.9%
10 year CAGR
12.3%
5 year CAGR
9.6%
23
* Since flotation in 1994 Years ended 31 March

Oct 2012
Institutions (% Holding)
North America 34.3%
UK 27.1%
Cont Europe/Asia 8.5%
Total overseas 69.9%
Irish 7.9%
Total institutional 77.8%
Retail 11.5%
Management 2.8%
Lending/Market Makers
7.9%
100.0%
North America 34.3%
UK 27.1%
Cont. Europe/Asia
8.5%
Irish 7.9%
Retail 11.5%
Management 2.8%
Lending/ Market Makers
7.9%
Shareholder base
24