RDM and data sharing landscape: overview for Salford DCC training 20140522

Company Overview

DisclaimerThis presentation does not constitute an invitation to underwrite, subscribe for or otherwise acquire or dispose of any shares or other securities of DCC plc (“DCC”).
This presentation contains some forward-looking statements that represent DCC’s expectations for its business, based on current expectations about future events, which by their nature involve risk and uncertainty. DCC believes that its expectations and assumptions with respect to these forward-looking statements are reasonable; however because they involve risk and uncertainty as to future circumstance, which are in many cases beyond DCC’s control, actual results or performance may differ materially from those expressed or implied by such forward-looking statements. DCC undertakes no duty to and will not necessarily update any such statements in light of new information or future events, except to the extent required by any applicable law or regulation. Recipients of this presentation are therefore cautioned that a number of important factors could cause actual results or outcomes to differ materially from those expressed in or implied by any forward-looking statements.
Any statement in this presentation which infers that transactions may be earnings accretive does not constitute a profit forecast and should not be interpreted to mean that DCC’s earnings or net assets in the first full financial year following the transactions, nor in any subsequent period, would necessarily match or be greater than those for the relevant preceding financial year.
Your attention is drawn to the risk factors referred to in the Principal Risks and Uncertainties section of DCC’s Annual Report. These risks and uncertainties do not necessarily comprise all the risk factors associated with DCC and/or any recently acquired businesses. There may be other risks which may have an adverse effect on the business, financial condition, results or future prospects of DCC. In particular, it should be borne in mind that past performance is no guide to future performance. Persons needing advice should contact an independent financial advisor.
1
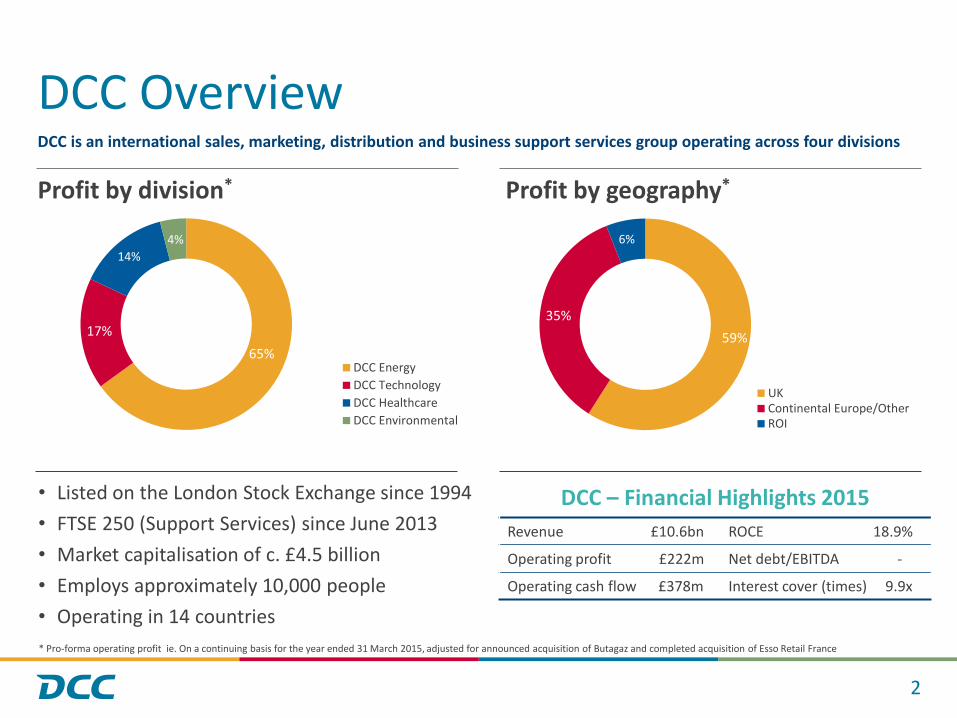
59%35%
6%
UKContinental Europe/OtherROI
65%17%
14%4%
DCC EnergyDCC TechnologyDCC HealthcareDCC Environmental
DCC Overview
Profit by division* Profit by geography*
2
• Listed on the London Stock Exchange since 1994• FTSE 250 (Support Services) since June 2013• Market capitalisation of c. £4.5 billion• Employs approximately 10,000 people• Operating in 14 countries* Pro-forma operating profit ie. On a continuing basis for the year ended 31 March 2015, adjusted for announced acquisition of Butagaz and completed acquisition of Esso Retail France
DCC is an international sales, marketing, distribution and business support services group operating across four divisions
DCC – Financial Highlights 2015Revenue £10.6bn ROCE 18.9%
Operating profit £222m Net debt/EBITDA -
Operating cash flow £378m Interest cover (times) 9.9x
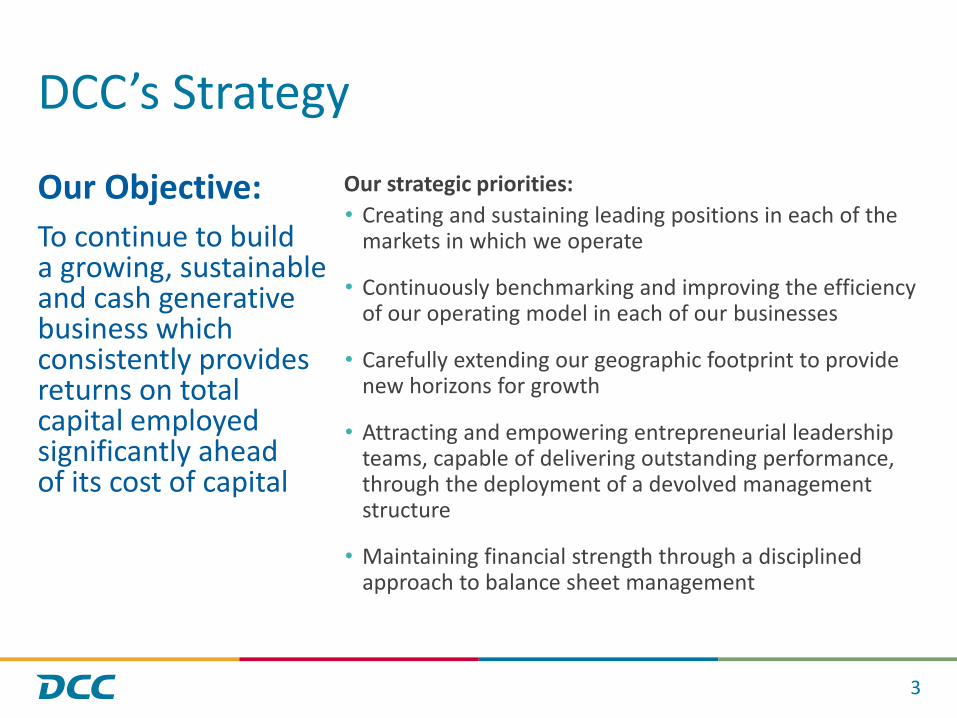
DCC’s Strategy
Our Objective:To continue to build a growing, sustainable and cash generative business which consistently provides returns on total capital employed significantly ahead of its cost of capital
3
Our strategic priorities:• Creating and sustaining leading positions in each of the
markets in which we operate
• Continuously benchmarking and improving the efficiency of our operating model in each of our businesses
• Carefully extending our geographic footprint to provide new horizons for growth
• Attracting and empowering entrepreneurial leadership teams, capable of delivering outstanding performance, through the deployment of a devolved management structure
• Maintaining financial strength through a disciplined approach to balance sheet management

• Excluding the Irish subsidiaries of DCC Food & Beverage which were disposed of in Q4 FY15
Acquisitions - Important Part of the Growth Story
Acquisitions* By Division – Since 2000*
4
15 Year Total
£1.6bn
• £1.8bn spent / committed on acquisitions since flotation in 1994
• Disposals net of exceptionals yielded £0.2bn
*Includes committed in 2014/2015 but not yet paid of c.£410m

Cash Flow Since Flotation in 1994
• Revenue increased from £0.2bn to £10.6bn• Operating profit increased from £17m to
£228m. CAGR of 13.2%• £214m working capital inflow• Capex exceeded depreciation by £86m• Free cash flow of £2.3bn• Free cash flow conversion of 104% and CAGR
of 13.9%• Cash flow after interest and tax of £1.8bn• Acquisition spend of £1.4bn• Further development commitments of £465m• Dividend / share buybacks of £0.7bn• Pro forma net debt / EBITDA of c. 0.6 times
(c.1.4 times at peak)
5
1 April 1994 – 31 March 2015 £m21 Year CAGR
Operating profit 2,195 13.2%Decrease in working capital 214Depreciation 614Other (50)Operating cash flow 2,973 13.5%Capex (700)Free cash flow 2,273 13.9%Interest and tax (474)Free cash flow after interest and tax 1,799 14.3%Acquisitions (1,382)Disposals / exceptionals 239Dividends / share buybacks (680)Share issues 66Translation and other (10)Net cash outflow 32Opening net debt (2)Closing net debt at 31 March 2015 30Development commitments (465)Placing proceeds 193Pro – forma net debt (242)

0%20%40%60%80%
100%120%140%160%
18.8 22.1 25.9 29.9 32.3 37.7 41.950.4
58.3 64.973.6 78.4 84.5
97.5
115.9
139.7
157.9173.1
142.0
171.2
191.2
209.2
4.8 6.1 7.1 8.1 8.6 10.0 11.3 12.9 15.1 18.022.5 25.4
29.233.5
39.8
51.5
59.863.2
67.6 69.976.9
84.5
17 19 22 24 29 36 43 51 56 62
71 75 82
95
117
149
171
196
161
187
208
228
Track Record of Consistent Growth
6
Operating profit (£m) EPS (pence)
Dividend growth (pence) Free cash flow conversion (%) 21 year Average104%
21 year CAGR
14.6%
21 year CAGR
12.2%
1994 2015 1994 2015
1994 2015 1994 2015
21 year CAGR
13.2%

Versus the FTSE 100 and FTSE 250
DCC TSR
7
Source: Datastream – as at 25 May 2015
1064%
96%
307%
0%
200%
400%
600%
800%
1000%
1200%
DCC FTSE 100 FTSE 250
Over last 14 years
426%
50%
120%
0%
50%
100%
150%
200%
250%
300%
350%
400%
450%
DCC FTSE 100 FTSE 250
Over last 7 years 4844%
366%
815%
0%
1000%
2000%
3000%
4000%
5000%
DCC FTSE 100 FTSE 250
Since flotation (21 years)

Our Business: By Division

DCC Energy
The leading oil and liquefied petroleum gas (“LPG”) sales, marketing and distribution business in Europe
• Oil distribution for transport, heating andindustrial / agricultural processes
• LPG distribution for heating, cooking, transport and industrial / agricultural processes
• Retail stations and fuel cards for consumers and commercial customers
• Established market leadership positions in7 countries with a platform to grow thebusiness across Europe and beyond
• Over 30 years industry experience
• Consolidator of fragmented markets
• Partner of choice for oil majors in asset divestment
9
51%
18%
21%
10%
Transport FuelsCommercial FuelHeating (Oil & LPG)LPG
Volume10.8bnLitres
Revenue£7,624.1m
Operating profit£119.4m
ROCE19.8%
Recurring revenue, cash generative and high ROCE business
Based on results for the year ended 31 March 2015
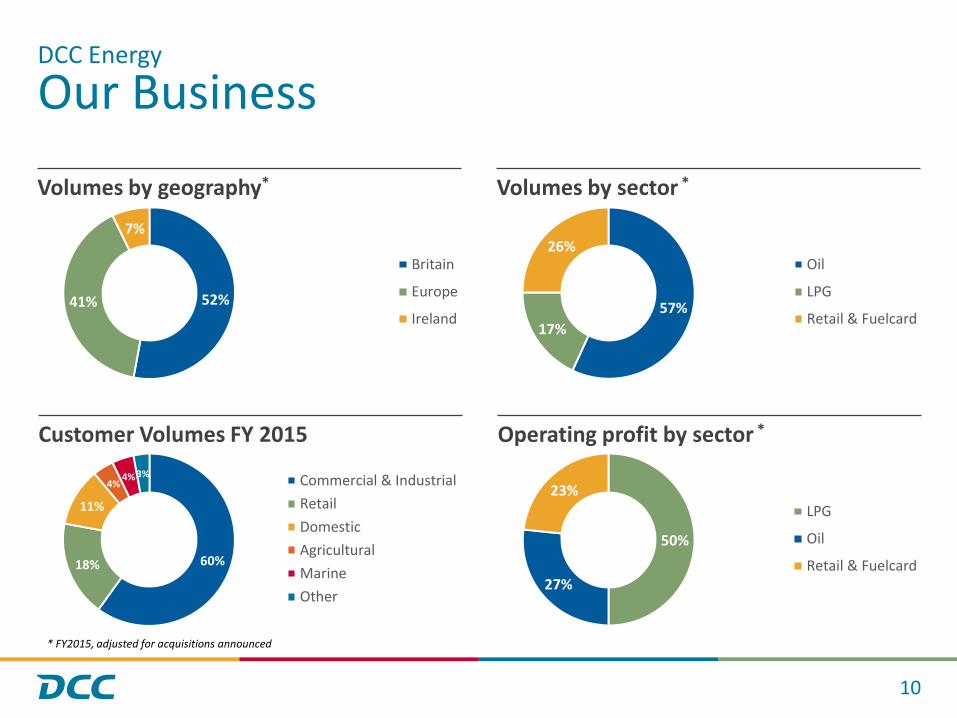
Our Business
52%41%
7%
Britain
Europe
Ireland
10
DCC Energy
Volumes by geography*
Customer Volumes FY 2015
60%18%
11%
4%4%3% Commercial & Industrial
RetailDomesticAgriculturalMarineOther
57%17%
26%Oil
LPG
Retail & Fuelcard
Volumes by sector *
Operating profit by sector *
50%
27%
23%LPG
Oil
Retail & Fuelcard
* FY2015, adjusted for acquisitions announced

A Business of ScalePro-Forma Business Statistics FY 2015(inc. acquisitions announced)
11
DCC Energy
Volumes
13.5bnLitres
Customers
1.3mTrucks
2,150Employees
5,300Facilities
430
Retail petrol sites operated/supplied Britain
1,600France
400Sweden
400Austria
300Ireland
100
Acquisition of Butagaz• Acquisition of the second largest LPG business in France, with
market share of 25% and the leading brand in the market
• Market leader in the cylinder and small bulk market segments
• Sells directly or indirectly to over four million customers
• Significantly increases the scale of DCC’s LPG business from approx. 700,000 tonnes to 1.2 million tonnes
• France is the second largest LPG market in Western Europe –approximately twice the size of the British market
• Currently operates as a stand alone business within Shell - led by an experienced and ambitious management team
• Valuation of €464m (£338m) on a debt-free, cash-free basis
• EBITDA multiple of 3.8 times; EBIT multiple of 6.2 times
12
DCC Energy

DCC Technology
Leading route-to-market partner for global consumer and SME technology brands
13
FY2015Revenue £2,350.3mOperating profit £49.3mROCE 25.5%Employees 1,953
DCC Technology operates under the brand
350industry leading
suppliers
In the homeIn the office On the move
15,000+ customers
Retail, etail, reseller
Consumer & SME

DCC Technology at a GlanceDCC Technology delivers an industry-leading and innovative range of services and value add solutions that
enable our partners to access existing and new sales channels in the most effective manner possible.
The obvious partner for a new supplier to access European Retail and SME markets
14
Key Facts Key Partners
£2.35bturnover
>2,000employees across 12 counties
>87,000m2logistics capacity
>1.4m deliveries last year, shipping over 34m units
350+ technology brands
15,000+reseller & retailer customers
Specialists in SME and Consumer markets
Our Business
Channel SpecialistsBusiness, Retail, Mobile, Supplies
Market Insight and Alignment
Public Sector, Business,
Smart Home, Cloud
Product Focus and BreadthIT, Mobile, Home,Supplies
Value Added Services
Logistics, Supply Chain, Marketing, Retail, Digital
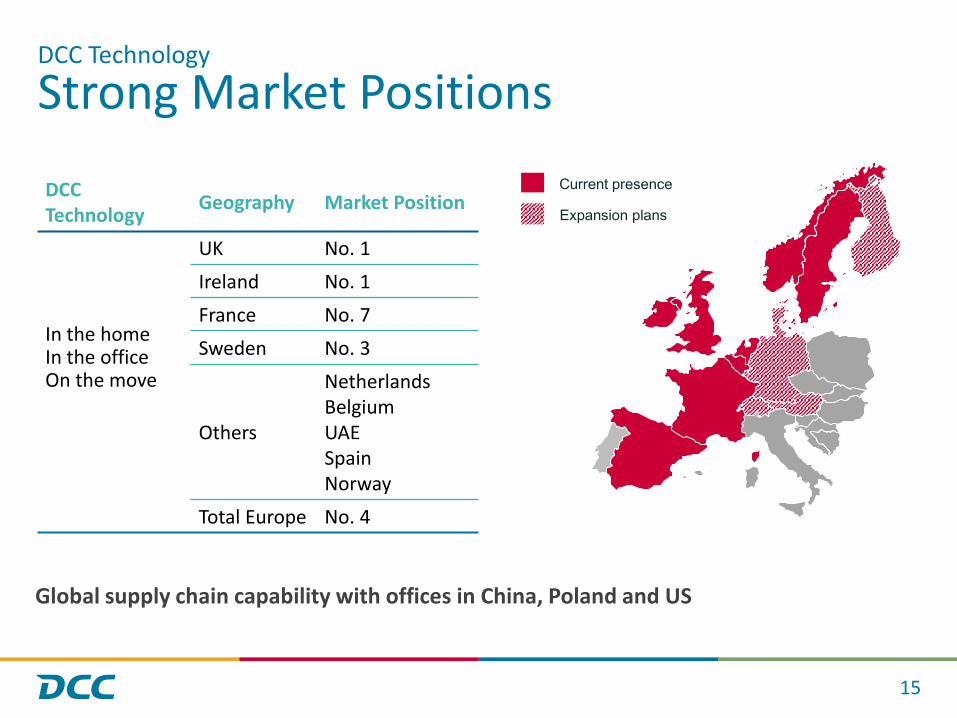
Strong Market Positions
15
DCC Technology Geography Market Position
In the homeIn the office On the move
UK No. 1Ireland No. 1France No. 7Sweden No. 3
Others
NetherlandsBelgiumUAESpainNorway
Total Europe No. 4
Current presence
Expansion plans
Global supply chain capability with offices in China, Poland and US
DCC Technology

DCC HealthcareSales, marketingand distribution of pharmaceuticals and medical devices and provision of services to health & beauty brand owners
16
FY2015Revenue £488.1mOperating profit £39.7mROCE 16.6%Employees 1,992
71%
29%DCC Vital
DCC H&BS
FY15 sales by business FY15 sales by geography
76%
14%
10%
UK
Ireland
ROW
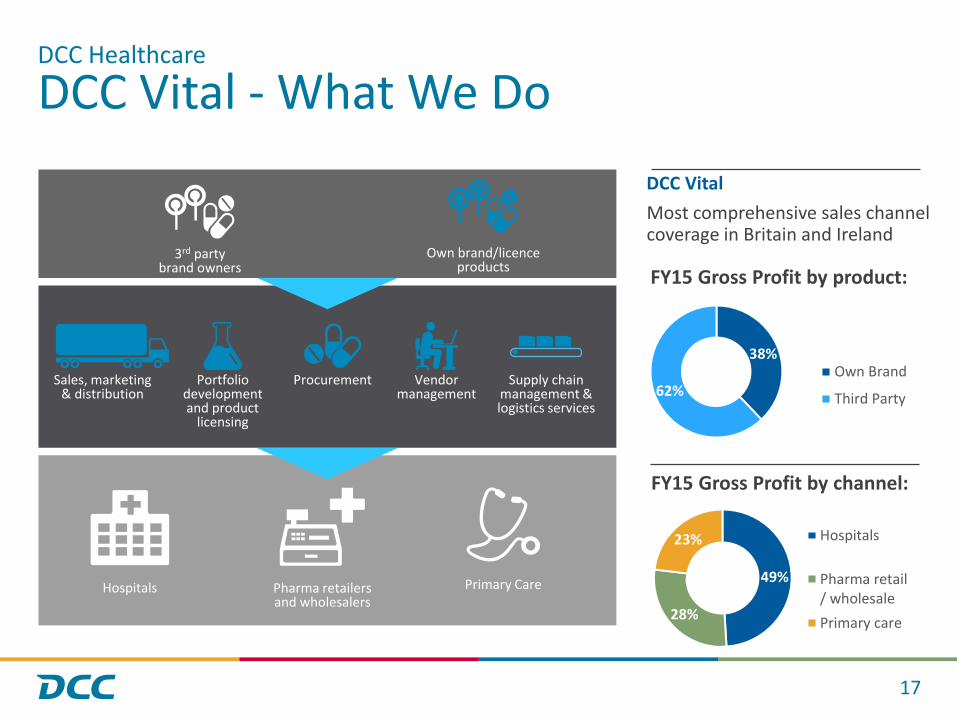
DCC Vital - What We Do
17
Hospitals Pharma retailersand wholesalers
Primary Care
Sales, marketing & distribution
Portfolio development and product
licensing
Procurement Vendor management
Supply chain management & logistics services
3rd partybrand owners
Own brand/licence products
DCC Healthcare
38%
62%Own Brand
Third Party
FY15 Gross Profit by product:
FY15 Gross Profit by channel:
49%
28%
23% Hospitals
Pharma retail/ wholesalePrimary care
DCC VitalMost comprehensive sales channel coverage in Britain and Ireland

DCC Health & Beauty Solutions - What We Do
Product format capability:
18
Product development, contract manufacturingand packing of health & beauty products
Health & beauty brand
owners
Specialist health & beauty retailers
Direct sales/mail order companies
Our Customers
DCC Healthcare
Tablets, effervescents,hard and soft gel capsules
Creams, liquidsand sprays
4.2billion 100millionin FY2015 pots, jars and tubes
in FY2015
DCC H&BSA leading outsourced service providerto the European Health & Beauty sector
A selection of brands we support:

58%
42%
Revenue Split
Non hazardouswaste
Hazardouswaste
DCC Environmental
19
FY2015Revenue £143.6mOperating profit £13.3mROCE 9.7%Employees 1,020
Leading British & Irish provider of recycling, waste management and resource recovery services