CO Enhanced Hydrocarbon Recovery: Incremental Recovery and
240
CO 2 Enhanced Hydrocarbon Recovery: Incremental Recovery and Associated CO 2 Storage Potential in Alberta Alberta Research Council (now part of Alberta Innovates – Technology Futures) Calgary Office: 3608 – 33 St. N.W. Edmonton Office: 250 Karl Clark Road Calgary, AB, Canada T2L 2A6 Edmonton, AB, Canada T6N 1E4 Tel: (403) 210-5222 Fax: (403) 210-5380 Tel: (780) 450-5111 Fax: (780) 450-5333 Summary Report Prepared for the Alberta Energy Research Institute December 2009 Project Managers: Quinn Goretzky, Blaine Hawkins Project Team: Alberta Research Council Art Danielson Xiaohui Deng Quinn Goretzky Blaine Hawkins Git Lim Yongnuan Liu Ashok Singhal Alex Turta Mafiz Uddin Sam Wong Computer Modelling Group Inc. Adel Hammouda Satya Singh Fraser Skoreyko Divestco, Inc Peter Dankers David Shaw Silvertip Ventures Brian Ness SNC Lavalin Doug McDonald Sproule Associates Limited Chris Galas Vikor Energy Inc. Derril Stephenson
Transcript of CO Enhanced Hydrocarbon Recovery: Incremental Recovery and
CO2 Enhanced Hydrocarbon Recovery: Incremental Recovery and
Associated CO2 Storage Potential in Alberta
Alberta Research Council (now part of Alberta Innovates – Technology Futures) Calgary Office: 3608 – 33 St. N.W. Edmonton Office: 250 Karl Clark Road Calgary, AB, Canada T2L 2A6 Edmonton, AB, Canada T6N 1E4 Tel: (403) 210-5222 Fax: (403) 210-5380 Tel: (780) 450-5111 Fax: (780) 450-5333
Summary Report
Prepared for the Alberta Energy Research Institute
December 2009
Project Managers: Quinn Goretzky, Blaine Hawkins Project Team: Alberta Research Council
Art Danielson Xiaohui Deng Quinn Goretzky Blaine Hawkins Git Lim Yongnuan Liu Ashok Singhal Alex Turta Mafiz Uddin Sam Wong
Computer Modelling Group Inc. Adel Hammouda
Satya Singh Fraser Skoreyko Divestco, Inc Peter Dankers David Shaw Silvertip Ventures Brian Ness SNC Lavalin Doug McDonald
Sproule Associates Limited Chris Galas Vikor Energy Inc.
Derril Stephenson

CO2 Enhanced Hydrocarbon Recovery Summary Report December, 2009 Incremental Recovery and CO2 Storage Potential in Alberta
NOTICE
This Report was prepared as an account of work conducted at the Alberta Research Council Inc, which is now part of ALBERTA INNOVATES - TECHNOLOGY FUTURES ("AITF"). The Report was prepared for the Alberta Energy Research Institute, now ALBERTA INNOVATES – ENERGY AND ENVIRONMENT SOLUTIONS, in order to gain a better understanding of the maximum potential for CO2 Enhanced Oil Recovery in Alberta and to assist the Alberta Department of Energy in policy development. Effective January 1, 2010, all contractual rights, obligations, assets, and liabilities of Alberta Research Council Inc. have been transferred, by law, to Alberta Innovates – Technology Futures, a corporation created by Ministerial Order pursuant to Section 14(4) of the Alberta Research and Innovation Act;
All reasonable efforts were made to ensure that the work conforms to accepted scientific, engineering and environmental practices, but AITF makes no other representation and gives no other warranty with respect to the reliability, accuracy, validity or fitness of the information, analysis and conclusions contained in this Report. Any and all implied or statutory warranties of merchantability or fitness for any purpose are expressly excluded. Reference herein to any specified commercial product, process or service by trade-name, trademark, manufacturer or otherwise does not constitute or imply an endorsement or recommendation by AITF. This report and its contents, the project in respect of which it is submitted and the conclusions and recommendations arising from it, do not necessarily reflect the view of the Government of Alberta, its officers, employees or agents. The Government of Alberta, its officers, employees or agents, and consultants make no warranty, express or implied, representation or otherwise, in respect of this report or its contents. The Government of Alberta, its officers, employees and agents and consultants are exempted and absolved from all liability for damage or injury, howsoever caused, to any person in connection with or arising out of the use for any purpose fo this report or its contents.
Any authorized copy of this Report distributed to a third party shall include an acknowledgement that the Report was prepared by AITF and shall give appropriate credit to AITF and the authors of the Report.
Copyright AITF 2010. All rights reserved.
Alberta Research Council ii
CO2 Enhanced Hydrocarbon Recovery Summary Report December, 2009 Incremental Recovery and CO2 Storage Potential in Alberta
TABLE OF CONTENTS Page Notice ............................................................................................................................... ii List of Figures................................................................................................................... v List of Tables.................................................................................................................... vii Nomenclature................................................................................................................... xii 1.0 EXECUTIVE SUMMARY ................................................................................................ 1-1 2.0 INTRODUCTION ............................................................................................................. 2-1
2.1 Background of project ............................................................................................... 2-1 2.2 Project Objectives and Overall Approach ................................................................. 2-2 2.2 Task Definition .......................................................................................................... 2-3
3.0 TASK1: IDENTIFICATION OF PROTOTYPES AND ANALOGUE GROUPINGS .......... 3-1
3.1 Selection of Prototypes ............................................................................................. 3-1 3.2 Selection of Simulation Areas ................................................................................... 3-2 3.3 Analogue Groupings ................................................................................................. 3-3
4.0 TASK 2: NUMERICAL MODELING OF PROTOTYPES ................................................ 4-1
4.1 Pembina Cardium with Conglomerate Prototype ...................................................... 4-1 4.1.1 Geological Model ........................................................................................... 4-1 4.1.2 Numerical Model ............................................................................................ 4-2 4.1.3 History Match ................................................................................................. 4-4 4.1.4 Base Case Forecast ...................................................................................... 4-6 4.1.5 CO2 EOR Forecasts ...................................................................................... 4-7 4.1.6 Area Models ................................................................................................... 4-8
4.2 Pembina Cardium Without Thief Zone Conglomerate .............................................. 4-11
4.2.1 Geological Model ............................................................................................ 4-11 4.2.2 Numerical Model ............................................................................................ 4-13 4.2.3 History Match ................................................................................................. 4-13 4.2.4 Base Case Forecast ...................................................................................... 4-15 4.2.5 CO2 EOR Forecasts ...................................................................................... 4-16 4.2.6 Area Models ................................................................................................... 4-17
4.3 Beaverhill Lake Waterflooded Prototype .................................................................. 4-18
4.3.1 Geological Model ........................................................................................... 4-18 4.3.2 Numerical Model ............................................................................................ 4-20 4.3.3 History Match ................................................................................................. 4-20 4.3.4 Base Line Forecast ........................................................................................ 4-22 4.3.5 CO2 EOR Forecasts ...................................................................................... 4-22 4.3.6 Area Models ................................................................................................... 4-23
4.4 Beaverhill Lake Ssolvent Fooded Prototype (Swan Hills) ........................................ 4-26
4.4.1 Geological Model ........................................................................................... 4-26 4.4.2 Numerical Model ............................................................................................ 4-27 4.4.3 History Match ................................................................................................. 4-28 4.4.4 Base Case Forecast ...................................................................................... 4-29 4.4.5 CO2 EOR Forecasts ...................................................................................... 4-29 4.4.6 Area Models ................................................................................................... 4-30
Alberta Research Council iii
CO2 Enhanced Hydrocarbon Recovery Summary Report December, 2009 Incremental Recovery and CO2 Storage Potential in Alberta
Alberta Research Council iv
TABLE OF CONTENTS (CONCLUDED) Page
4.5 D-2/D-3 Field Prototype (Redwater Pool) ................................................................. 4-32 4.5.1 Geological Model ........................................................................................... 4-32 4.5.2 Numerical Model ............................................................................................ 4-33 4.5.3 History Match ................................................................................................. 4-33 4.5.4 Base Case Forecast ...................................................................................... 4-35 4.5.5 CO2 EOR Forecasts ...................................................................................... 4-35 4.5.6 Area Models ................................................................................................... 4-37 5.0 TASK 3: DEVELOPMENT PLANS FOR PROTOTYPES ................................................ 5-1 5.1 Development Plan Cost Factors ................................................................................ 5-1 5.2 Development Plans ................................................................................................... 5-1 5.2.1 Pembina Cardium with Thief Zone (congolomerate) ..................................... 5-1 5.2.2 Pembina Without Thief Zone (no conglomerate) ........................................... 5-7 5.2.3 Beaverhill Lake Waterflooded Areas ............................................................. 5-13 5.2.4 Beaverhill Lake Solvent Flooded Areas ......................................................... 5-17 5.2.5 Redwater D-3.................................................................................................. 5-22 5.3 Extrapolation to Analogues ....................................................................................... 5-27 5.3.1 Beaverhill Lake pools ..................................................................................... 5-28 5.3.2 D2/D3 Pools ................................................................................................... 5-44 5.3.3 Cardium Pools ............................................................................................... 5-51 5.4 CO2 Requirement and Storage for Prototypes and Analogues ................................ 5-58 5.4.1 Beaverhill Lake Prototypes and Analogues.................................................... 5-58 5.4.2 D2/D3 Prototypes and Analogues ................................................................... 5-59 5.4.3 Cardium Prototypes and Analogues................................................................ 5-69 6.0 REPORT SUMMARY ...................................................................................................... 6-1 6.1 Overview ................................................................................................................... 6-1 6.2 Methodology .............................................................................................................. 6-2
6.3 Development Plans ................................................................................................... 6-4 6.4 Analogues ................................................................................................................. 6-8 6.5 Recommendations .................................................................................................... 6-12
7.0 REFERENCES................................................................................................................. 7-1 APPENDICES
A1 Pattern Development Model ..................................................................................... A1-1 A2 SNC Lavalin Report of Cost Factors for CO2 Recycle with & without hydrocarbon Separation ................................................................................................................ A2-1 A3 AERI RFP .................................................................................................................. A3-1

CO2 Enhanced Hydrocarbon Recovery Summary Report December, 2009 Incremental Recovery and CO2 Storage Potential in Alberta
LIST OF FIGURES
Page Figure 4.1.1.1: Location and distribution of oil wells in the Pembina Cardium Pool .............. 4-1 Figure 4.1.2.1: Comparison of the geological model (40 layers) with the upscaled numerical model (14 layers) ........................................................................................... 4-4 Figure 4.1.3.1: Comparison of IMEX and GEM history matches – oil rate (m3/d@SC), water cut, GOR (m3/m3@SC) and pressure ............................................................ 4-5 Figure 4.1.3.2: Cumulative oil production from sector model at end of history match ........... 4-6 Figure 4.2.1.1: Penn West’s 15-layer geological model ........................................................ 4-11 Figure 4.2.1.2: Pembina Cardium tops as shown by the Penn West 15-layer geological model ............................................................................................................. 4-12 Figure 4.2.3.1: History match of oil production and rate during primary production and water flood .................................................................................................... 4-14 Figure 4.2.3.2: Injection rates for CO2 and water at the CO2 pilot ......................................... 4-14 Figure 4.2.4.1: Location of the horizontal well sub-model relative to the existing pilot .......... 4-15 Figure 4.2.4.2: Configurations of vertical injectors and horizontal producer in the sub-model for field prediction cases ................................................................................ 4-16 Figure 4.2.4.3: Production rates from baseline water flood case .......................................... 4-16 Figure 4.2.5.6: Incremental oil recovery from WAG injection as compared to baseline water flood case ............................................................................................. 4-17 Figure 4.3.1.1: Swan Hills Complex and associated isolated Swan Hills Reefs .................... 4-18 Figure 4.3.1.2: Location of Judy Creek prototype geological model for numerical simulation (red curtain), and well control in the model area ........................................... 4-19 Figure 4.3.2.1: Well development Judy Creek numerical model ............................................ 4-20 Figure 4.3.3.1: History match for cumulative oil, water and gas production and the simulated average field pressure – Judy Creek sector model ....................................... 4-21 Figure 4.3.3.2: History match for oil rate and cumulative oil production – Judy Creek sector model ............................................................................................................. 4-21 Figure 4.3.4.1: Baseline waterflood forecast for Judy Creek sector model ............................ 4-22 Figure 4.3.6.1: Waterflood areas in Swan Hills to which results of Judy Creek sector model were extrapolated .......................................................................................... 4-24 Figure 4.4.1.1: “Top view” of the Swan Hills Field isolated Swan Hills reef ........................... 4-26 Figure 4.4.1.2: Location of the Swan Hills simulation model area and its relationship to the windward reef margin and lagoon ................................................................. 4-27
Alberta Research Council v

CO2 Enhanced Hydrocarbon Recovery Summary Report December, 2009 Incremental Recovery and CO2 Storage Potential in Alberta
LIST OF FIGURES (CONTINUED)
Page Figure 4.4.2.1: Numerical model (left) upscaled from Geological model (right) ..................... 4-27 Figure 4.4.3.1: Cumulative oil production, field data and history match, full sector .............. 4-28 Figure 4.4.6.2: Geologic areas and pattern layout used for areal models and development Plan................................................................................................................. 4-31 Figure 4.5.1.1: View of the eastern windward margin of the Redwater reef showing the location of the Redwater reef D-3 prototype geological model and simulation area (red curtain) .......................................................................... 4-32 Figure 4.5.2.1: Numerical model showing well locations and model horizontal permeability ................................................................................................... 4-33 Figure 4.5.3.1: Historical water disposal rate and cumulative volume.................................... 4-34 Figure 4.5.3.2: Sector history and match of oil rate and cumulative oil production ............... 4-34 Figure 4.5.4.1: Base case oil rate and cumulative production with existing BHP in producers ...................................................................................................... 4-35 Figure 4.5.5.1: Nine spot pattern used for CO2 flood prediction in scenario 4 ...................... 4-36 Figure 4.5.5.2: Oil rate and cumulative oil recovery scenario 4, variation 1 .......................... 4-36 Figure 4.5.6.1: “Top View” of the Redwater reef model showing the reef front, back reef and lagoon facies polygons (in red) and permeability of the uppermost model layer .................................................................................................... 4-37 Figure 5.2.1.1: Pembina Cardium NPCU 1 and PCU 20. Analogue areas selected for extrapolation of simulation results and formulation of development scenarios ........................................................................................................ 5-2 Figure 5.2.1.2: Layout of patterns for development plan showing the fence water injectors.. 5-3 Figure 5.2.1.3: Development plan well layout, existing wells (black), new horizontal wells (green) ........................................................................................................... 5-4 Figure 5.2.1.4: New gathering system used in development plan. Black shows new lines to all production wells; red show CO2 lines to CO2 injectors ............................. 5-4 Figure 5.2.2.1: Patterns used in Pembina without thief zone. Simulation area is outlined in black (lower right) and includes the Penn West CO2 Pilot in the “A” lease ... 5-8 Figure 5.2.2.2: Pembina Cardium without thief zone – existing wells in black and new horizontal production wells (green lines) and new vertical injectors in green for a portion of Area 1 .................................................................................... 5-10 Figure 5.2.2.3: Pembina Cardium without thief zone – injection and gathering systems ...... 5-10 Figure 5.2.2.4: Calculated isenthalpic cooling in the near wellbore region due to expansion of CO2 ............................................................................................................ 5-12
Alberta Research Council vi
CO2 Enhanced Hydrocarbon Recovery Summary Report December, 2009 Incremental Recovery and CO2 Storage Potential in Alberta
Alberta Research Council vii
LIST OF FIGURES (CONCLUDED)
Page Figure 5.2.3.1: Map of Swan Hills pool showing new gathering system (black) to all wells and new CO2 and water injection lines (red) to all WAG injectors used in development plan .......................................................................................... 5-15 Figure 5.2.4.1: Wells used in Swan Hills BHL SFA development plan (existing wells in black, wells drilled since 2001 in red, new wells for development plan in gold); wells outside the patterns are in the WFA ........................................... 5-19 Figure 5.2.4.2 Plan for gathering system lines (black) and CO2/water injection lines (red)... 5-20 Figure 5.2.5.1: Development plan areas and layout of the 48 pattern clusters ..................... 5-23 Figure 5.2.5.2: Layout of patterns used for development plan .............................................. 5-24 Figure 5.2.5.3: Pipeline layout showing new gathering system and water lines .................... 5-25 Figure 5.3.1.1: Distribution of cumulative oil produced (Judy Creek A Solvent Flood area) .. 5-33 Figure 5.3.1.2: Distribution of cumulative solvent injected (Judy Creek A Solvent Flood area) ............................................................................................................... 5-34 Figure 5.3.1.3: Oil rates and oil-cuts as functions of time (Judy Creek BHL A Solvent Flood area) .................................................................................................... 5-34 Figure 5.3.1.4: Oil rates and oil-cuts as functions of cumulative oil produced (Judy Creek BHL A Solvent Flood area) ............................................................................ 5-35 Figure 5.3.1.5: Distribution of cumulative oil produced in the Swan Hills WFA2 area model ............................................................................................................. 5-35 Figure 5.3.1.6: Oil rates and oil-cuts as functions of time (Swan Hills WFA2) ...................... 5-36 Figure 5.3.1.7: Oil rates and oil-cuts as functions of cumulative oil produced (Swan Hills WFA2) ............................................................................................................ 5-36 Figure 5.3.1.8: Distribution of cumulative oil produced solvent flood prototype area SFA3... 5-37 Figure 5.3.1.9: Distribution of cumulative solvent injected solvent flood prototype area SFA3 .............................................................................................................. 5-37 Figure 5.3.1.10: Oil rates and oil-cuts as functions of time solvent flood prototype area SFA3 .............................................................................................................. 5-38 Figure 5.3.1.11: Oil rates and oil-cuts as functions of cumulative oil produced solvent flood Prototype area SFA3 ..................................................................................... 5-38 Figure 5.3.3.1: Block diagram showing porosity in Pembina area south of NPCU-1 ............ 5-54

CO2 Enhanced Hydrocarbon Recovery Summary Report December, 2009 Incremental Recovery and CO2 Storage Potential in Alberta
LIST OF TABLES
Page Table ES-1: CO2 Requirement and storage for Prototypes and Analogues...................... 1-1 Table ES-2: CO2 Prototypes – development plan.............................................................. 1-2 Table 4.1.2.1: Layers in simulation model ............................................................................ 4-3 Table 4.1.2.2: Wells included in simulation area of NPCU ................................................... 4-4 Table 4.1.2.3: Numerical model properties based on geological model ............................... 4-4 Table 4.1.5.1: Summary of simulation runs for NPCU sector model .................................... 4-7 Table 4.1.5.2: History match and forecast results for NPCU sector model .......................... 4-8 Table 4.1.6.1: Performance data for prospective EOR areas – Pembina with thief zone ..... 4-9 Table 4.1.6.2: Summary of simulation runs for prototypes ................................................... 4-9 Table 4.1.6.3: Results of simulation runs for prototypes ...................................................... 4-10 Table 4.2.1.1: Variability of the petrophysical properties in the Penn West geological model ............................................................................................................. 4-12 Table 4.3.5.1: History match and forecast results for Judy Creek sector model .................. 4-23 Table 4.3.6.1: Well injectivity, productivity and predicted WOR for Swan Hills waterflood areas .............................................................................................................. 4-24 Table 4.3.6.2: Results of area model forecasts .................................................................... 4-25 Table 4.3.6.3: CO2 utilization in area model forecasts ......................................................... 4-25 Table 4.4.5.1: Waterflood and CO2 flood forecasts BHL solvent flood sector model ........... 4-29 Table 4.4.6.1: Predicted watercut and corresponding hydrocarbon solvent injection in the areal models at January 1, 2013 ................................................................... 4-30 Table 4.4.6.2: Recovery factors of Swan Hills solvent area models .................................... 4-30 Table 4.5.6.1: Actual performance data for prospective EOR areas – Redwater ................ 4-38 Table 4.5.6.2: Results of Redwater area model forecasts .................................................... 4-38 Table 4.5.6.3: CO2 utilization – Redwater area models ........................................................ 4-38 Table 5.2.1.1: Pembina Cardium thief zone CO2 EOR development plan parameters & performance.................................................................................................... 5-3 Table 5.2.1.2: Pembina Cardium thief zone CO2 EOR summary of results ......................... 5-5 Table 5.2.2.1: Pembina Cardium no thief zone CO2 EOR .................................................... 5-7
Alberta Research Council viii

CO2 Enhanced Hydrocarbon Recovery Summary Report December, 2009 Incremental Recovery and CO2 Storage Potential in Alberta
LIST OF TABLES (CONTINUED)
Page Table 5.2.2.2: Pembina Cardium no thief zone CO2 EOR summary of results .................... 5-11 Table 5.2.3.1: BHL CO2 EOR WFA ...................................................................................... 5-13 Table 5.2.3.2: BHL CO2 EOR WFA summary of results ....................................................... 5-16 Table 5.2.4.1: Development plan parameters BHL SFA prototype ....................................... 5-17 Table 5.2.4.2: BHL CO2 EOR SFA area performance .......................................................... 5-17 Table 5.2.4.3: BHL CO2 EOR SFA summary of results ........................................................ 5-21 Table 5.2.5.1: Redwater D-3 CO2 EOR ................................................................................ 5-22 Table 5.2.5.2: Redwater D-3 CO2 EOR summary of results ................................................ 5-26 Table 5.3.1: Data for selected pool types (ERCB 2006 Reserves) ................................... 5-27 Table 5.3.1.1: Ratio between estimated incremental CO2 EOR recovery to waterflood Recovery for Swan Hills waterflooded areas ................................................. 5-29 Table 5.3.1.2: Performance of some water flooded BHL oil pools ....................................... 5-31 Table 5.3.1.3: Performance of some solvent flooded BHL oil pools...................................... 5-32 Table 5.3.1.4: Analogues to Beaverhill Lake waterflood prototype areas and Beaverhill Lake solvent flood prototype areas ................................................................ 5-32 Table 5.3.1.5: Estimated incremental CO2 EOR for Judy Creek BHL A pool ....................... 5-39 Table 5.3.1.6: Estimated incremental CO2 EOR for Judy Creek BHL B pool ....................... 5-39 Table 5.3.1.7: Estimated incremental CO2 EOR for Carson Creek North BHL A & B pool ... 5-40 Table 5.3.1.8: Estimated incremental CO2 EOR for Goose River BHL A pool ..................... 5-40 Table 5.3.1.9: Estimated incremental CO2 EOR for Kaybob BHL A pool ............................. 5-41 Table 5.3.1.10: Estimated incremental CO2 EOR for Simonette BHL A pool ......................... 5-41 Table 5.3.1.11: Estimated incremental CO2 EOR for Snipe Lake BHL A ............................... 5-42 Table 5.3.1.12: Estimated incremental CO2 EOR for Swan Hills South BHL A & B pools ..... 5-42 Table 5.3.1.13: Estimated incremental CO2 EOR for Virginia Hills BHL A pool ..................... 5-43 Table 5.3.2.1: Pressures and recovery factors of D-2/D-3 Analogue pools ......................... 5-45 Table 5.3.2.2: Estimated incremental CO2 EOR for Bonnie Glen D-3A (immiscible flood)... 5-46 Table 5.3.2.3: Estimated incremental CO2 EOR for Sturgeon Lake D-3 .............................. 5-46
Alberta Research Council ix
CO2 Enhanced Hydrocarbon Recovery Summary Report December, 2009 Incremental Recovery and CO2 Storage Potential in Alberta
LIST OF TABLES (CONTINUED)
Page Table 5.3.2.4: Estimated incremental CO2 EOR for Sturgeon Lake South D-3A ................. 5-47 Table 5.3.2.5: Estimated incremental CO2 EOR for Leduc Woodbend D-3A ....................... 5-47 Table 5.3.2.6: Estimated incremental CO2 EOR for Fenn Big Valley D2A with isolated associated gas cap (Horizontal miscible flood) ............................................. 5-48 Table 5.3.2.7: Estimated incremental CO2 EOR for Leduc Woodbend D2A (Horizontal miscible flood) ................................................................................................ 5-48 Table 5.3.2.8: Estimated incremental CO2 EOR for Meekwap D2 pool ............................... 5-49 Table 5.3.2.9: Estimated incremental CO2 EOR for West Drumheller D2B (horizontal miscible flood) ................................................................................................ 5-49 Table 5.3.2.10: Estimated incremental CO2 EOR for Joffre D-2 pool...................................... 5-49 Table 5.3.2.11: Estimated incremental CO2 EOR for Morinville D-3B pool ............................ 5-50 Table 5.3.3.1: Performance of simulated Cardium prototype areas ..................................... 5-53 Table 5.3.3.2: Geological parameters for area south of NPCU 1.......................................... 5-53 Table 5.3.3.3: Properties of Berrymoor geological model .................................................... 5-55 Table 5.3.3.4: Performance data of Pembina southern EOR areas and Berrymoor ............ 5-56 Table 5.3.3.5: Recovery factors for Pembina Southern EOR areas ..................................... 5-56 Table 5.3.3.6: Prototypes for Pembina Southern EOR areas .............................................. 5-57 Table 5.3.3.7: Prototypes for Pembina Southern EOR areas .............................................. 5-57 Table 5.3.3.8: Data on Analogues (including from ERCB) ................................................... 5-57 Table 5.4.1: CO2 requirement and storage for BHL prototypes and analogues – no risk factor ....................................................................................................... 5-58 Table 5.4.2: CO2 requirement and storage for D-2/D-3 prototype and analogues – no risk factor ....................................................................................................... 5-59 Table 5.3.3: CO2 requirement and storage for Pembina prototypes and analogues – no risk factor ....................................................................................................... 5-60 Table 6.1: CO2 EOR prototypes-development plan summary ........................................ 6-2 Table 6.2: CO2 EOR, requirement and storage for prototypes and analogues – no risk factor .............................................................................................................. 6-3 Table 6.3: CO2 requirement and storage for BHL prototypes and analogues – no risk factor .............................................................................................................. 6-9
Alberta Research Council x

CO2 Enhanced Hydrocarbon Recovery Summary Report December, 2009 Incremental Recovery and CO2 Storage Potential in Alberta
LIST OF TABLES (CONCLUDED)
Page Table 6.4: CO2 requirement and storage for D-2/D-3 prototype and analogues – no risk factor ....................................................................................................... 6-10 Table 6.5: CO2 requirement and storage for Pembina prototypes and analogues – no risk factor ....................................................................................................... 6-11
Alberta Research Council xi
CO2 Enhanced Hydrocarbon Recovery Summary Report December, 2009 Incremental Recovery and CO2 Storage Potential in Alberta
Nomenclature A Area API American Petroleum Institute ARC Alberta Research Council bbl barrel BHA Bottom Hole Assembly BHL Beaverhill Lake BHP Bottom Hole Pressure CBL Cement Bond Log CDMA Conglomerate CIL Cement Integrity Log CMG Computer Modelling Group CO2 Carbon Dioxide CCE Constant Composition Expansion COMP Component cp CentiPoise (measure of viscosity; same as mPa.s) D Darcy (permeability unit) d Day e3m3, e3m3 Thousands of cubic meters e6m3, e6m3 Millions of cubic meters ECLIPSE Schlumberger simulator EOR Enhanced Oil Recovery EOS Equation of State ERCB Energy Resources Conservation Board ESP Electrical Submersible Pump FVF Formation Volume Factor GEM Computer Modelling Group Compositional Simulator GOR Gas-Oil-Ratio ha hectar HC Hydrocarbon HCM Hydrocarbon Miscible HCMF Hydrocarbon Miscible Flood HCPV Hydrocarbon Pore Volume (reservoir volume occupied by hydrocarbon) HZ Horizontal IG, ig Gas injection well IMEX Computer Modelling Group Black Oil Simulator IW, iw Water injection well K,k Permeability kh Permeability-thickness product kg Permeability to gas ko Permeability to oil kr Relative Permeability krg Relative Permeability to gas kro Relative Permeability to oil krog Relative Permeability to oil in the presence of gas
Alberta Research Council xii
CO2 Enhanced Hydrocarbon Recovery Summary Report December, 2009 Incremental Recovery and CO2 Storage Potential in Alberta
krow Relative Permeability to oil in the presence of water krw Relative Permeability to water kw Water Permeability kPa Kilo Pascal LSD Legal Sub Division mD milli Darcy MM Million MMBOE Million Barrel Oil Equivalent MPa Mega Pascal mPa.s Milli Pascal second (viscosity unit; same as centipoise) mscf thousands of standard cubic feet mss Meters sub sea m3 Cubic meter NE North-east NW North-west NPCU North Pembina Cardium Unit NTG Net-to-Gross Ratio NTZ No thief zone OOIP Original Oil in Place (stock tank volume) OWC Oil-water-contact Pb Bubble point pressure Pc Critical pressure Pd Dew point pressure PCU Pembina Cardium Unit Phi-h Porosity-thickness product PV Pore Volume PVT Pressure Volume Temperature relationship (used in reference to phase behaviour
studies) rm3(RM3) Cubic meter, reservoir conditions (pressure and temperature of reservoir) RF Recovery factor ΔRF Incremental recovery factor RFP Request for proposal ROW Right of Way RTA Rate transient analysis SCADA Supervisory Control and Data Acquisition SCVL Surface Casing Vent Leaks SF Solvent Flood SFA Solvent Flood Area SE South-east sm3(SM3) Cubic meter, standard conditions (15.6 oC and 101.3 kPa) STB Stock tank Barrels SW South-west Sg Gas saturation (fraction) Sl Liquid saturation Sw Water saturation (fraction) Swi Initial water saturation (fraction) t tonne Tc Critical temperature
Alberta Research Council xiii
CO2 Enhanced Hydrocarbon Recovery Summary Report December, 2009 Incremental Recovery and CO2 Storage Potential in Alberta
Alberta Research Council xiv
TZ Thief Zone UWI Unique Well Identifier VRR Voidage Replacement Ratio VSD Variable Speed Drive WAG Water-Alternating-Gas WF Waterflood WFA Waterflood Area W/G Water-gas WinProp Computer Modelling Group phase behaviour software WOR Water-oil-ratio WC (WCUT) Water cut
CO2 Enhanced Hydrocarbon Recovery Summary Report December, 2009 Incremental Recovery and CO2 Storage Potential in Alberta
1.0 EXECUTIVE SUMMARY
This is a summary of a more detailed report provided to the Alberta Department of Energy. It contains a
high level overview of that report.
Albertans need a better understanding of the potential of CO2 Enhanced Oil Recovery (EOR) in Alberta,
along with its limitations. The Alberta Energy Research Institute (AERI) and the Alberta Department of
Energy (ADOE) contracted the Alberta Research Council (ARC) to complete a detailed reservoir and
development analysis to quantify the potential for incremental oil recovery and associated CO2 capture
and storage for five horizontal miscible CO2 flood target pool types (prototypes) in Alberta. The detailed
results from the five prototype pools were extrapolated to some 35 analogue pools and areas to provide
an estimate of CO2 enhanced oil recovery potential, CO2 requirement, and associated CO2 storage
potential for these pool types. The ultimate objective of this project was to provide critical technical
information and data to accelerate the pace of EOR and Carbon Capture and Storage (CCS)
demonstration and field projects in Alberta.
Together, the prototype and analogue pools studied have original-oil-in-place of 2.523 billion cubic meters
(15.869 billion barrels) and represent approximately 30% of Alberta’s light-medium oil resource. For
purposes of this study, the specific pool areas studied were high graded to include practical floodable
areas most likely to have EOR applied (Table ES-1). The high graded areas had original-oil-in-place of
1.841 billion cubic meters (11.578 billion barrels).
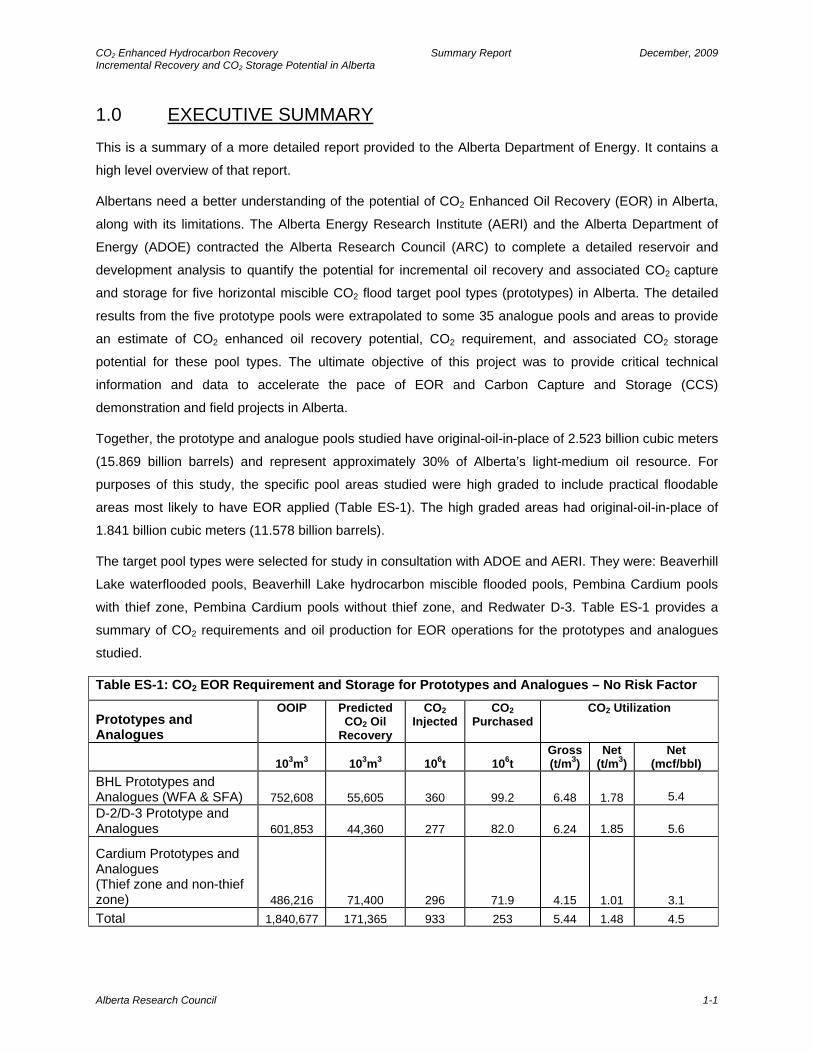
The target pool types were selected for study in consultation with ADOE and AERI. They were: Beaverhill
Lake waterflooded pools, Beaverhill Lake hydrocarbon miscible flooded pools, Pembina Cardium pools
with thief zone, Pembina Cardium pools without thief zone, and Redwater D-3. Table ES-1 provides a
summary of CO2 requirements and oil production for EOR operations for the prototypes and analogues
studied.
Table ES-1: CO2 EOR Requirement and Storage for Prototypes and Analogues – No Risk Factor
Prototypes and Analogues
OOIP
Predicted CO2 Oil
Recovery
CO2 Injected
CO2 Purchased
CO2 Utilization
103m3 103m3 106t
106t Gross (t/m3)
Net (t/m3)
Net (mcf/bbl)
BHL Prototypes and Analogues (WFA & SFA) 752,608 55,605 360
99.2 6.48
1.78
5.4
D-2/D-3 Prototype and Analogues 601,853 44,360 277
82.0 6.24
1.85
5.6
Cardium Prototypes and Analogues (Thief zone and non-thief zone) 486,216 71,400 296
71.9 4.15
1.01
3.1 Total 1,840,677 171,365 933 253 5.44 1.48 4.5
Alberta Research Council 1-1
CO2 Enhanced Hydrocarbon Recovery Summary Report December, 2009 Incremental Recovery and CO2 Storage Potential in Alberta
This study provides new insight into EOR potential in Alberta. This methodology is an improvement on
earlier studies, which were based on high-level reservoir parameter screening or on element of symmetry
simulations, rather than on detailed reservoir technical evaluation. It is important to note that a detailed economics assessment was not a deliverable of the project. Economic data is not provided in this
summary report. Moreover, this assessment did not include the costs of CO2 delivered to the site at the
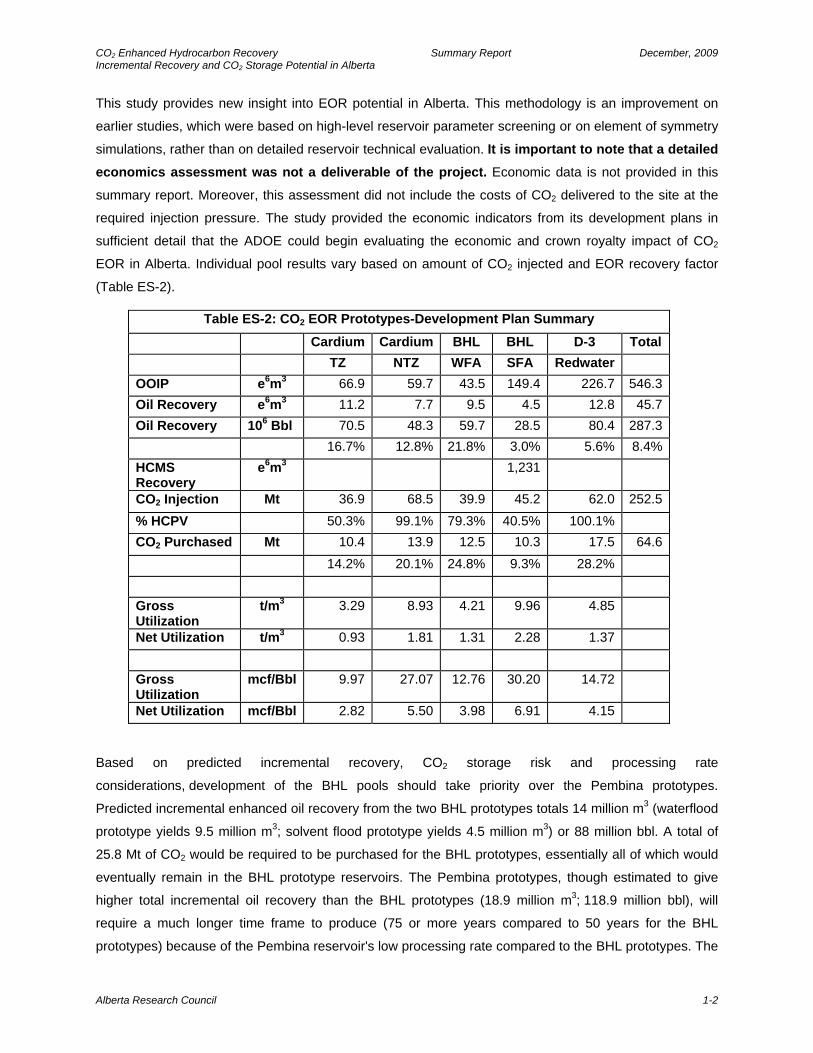
required injection pressure. The study provided the economic indicators from its development plans in
sufficient detail that the ADOE could begin evaluating the economic and crown royalty impact of CO2
EOR in Alberta. Individual pool results vary based on amount of CO2 injected and EOR recovery factor
(Table ES-2).
Table ES-2: CO2 EOR Prototypes-Development Plan Summary Cardium Cardium BHL BHL D-3 Total TZ NTZ WFA SFA Redwater OOIP e6m3 66.9 59.7 43.5 149.4 226.7 546.3Oil Recovery e6m3 11.2 7.7 9.5 4.5 12.8 45.7Oil Recovery 106 Bbl 70.5 48.3 59.7 28.5 80.4 287.3 16.7% 12.8% 21.8% 3.0% 5.6% 8.4%HCMS Recovery
e6m3 1,231
CO2 Injection Mt 36.9 68.5 39.9 45.2 62.0 252.5% HCPV 50.3% 99.1% 79.3% 40.5% 100.1% CO2 Purchased Mt 10.4 13.9 12.5 10.3 17.5 64.6 14.2% 20.1% 24.8% 9.3% 28.2% Gross Utilization
t/m3 3.29 8.93 4.21 9.96 4.85
Net Utilization t/m3 0.93 1.81 1.31 2.28 1.37 Gross Utilization
mcf/Bbl 9.97 27.07 12.76 30.20 14.72
Net Utilization mcf/Bbl 2.82 5.50 3.98 6.91 4.15
Based on predicted incremental recovery, CO2 storage risk and processing rate
considerations, development of the BHL pools should take priority over the Pembina prototypes.
Predicted incremental enhanced oil recovery from the two BHL prototypes totals 14 million m3 (waterflood
prototype yields 9.5 million m3; solvent flood prototype yields 4.5 million m3) or 88 million bbl. A total of
25.8 Mt of CO2 would be required to be purchased for the BHL prototypes, essentially all of which would
eventually remain in the BHL prototype reservoirs. The Pembina prototypes, though estimated to give
higher total incremental oil recovery than the BHL prototypes (18.9 million m3; 118.9 million bbl), will
require a much longer time frame to produce (75 or more years compared to 50 years for the BHL
prototypes) because of the Pembina reservoir's low processing rate compared to the BHL prototypes. The
Alberta Research Council 1-2
CO2 Enhanced Hydrocarbon Recovery Summary Report December, 2009 Incremental Recovery and CO2 Storage Potential in Alberta
Pembina prototypes would require 24.3 Mt of purchased CO2, essentially all of which would eventually
remain in the Pembina prototype reservoirs. The Pembina projects require significant unproven
technology to increase processing rate and contain the CO2 in the flood target. Furthermore, practical
floodable OOIP, particularly in the Cardium, is much lower than ERCB OOIP data. Only 31% of the total
Pembina Cardium OOIP was predicted to be amenable to CO2 EOR. The D3 prototype (Redwater) is
predicted to give the least incremental oil recovery of the prototypes studied, 12.8 million m3 (80.4 million
bbl), primarily because it operates at lower pressure and is not fully miscible. In addition, the remaining oil
target is lower because of the very effective water drive. However, detailed analysis of the Redwater reef
on a well by well basis and using modern seismic may allow a more efficient vertical displacement flood in
portions of the reef and increase the EOR recovery factor. The Redwater prototype would require
purchase of 17.5 Mt of CO2, essentially all of which would eventually remain in the Redwater prototype
reservoir. The Redwater reservoir is close to CO2 sources in the Fort Saskatchewan area and would
require less CO2 transportation infrastructure development than the other prototypes.
The total potential CO2 EOR for all the prototypes and analogues studied is projected to be 171.4 million
m3 (1.08 billion bbl); this would require purchase of 253 million tonne of CO2, essentially all of which
would eventually be stored in the target reservoirs.
Development plans were generated only for the five prototypes studied. A spreadsheet-based model was
utilized to schedule development by starting new patterns to fully utilize available purchased and
produced CO2 within the limits of injectivity and productivity of the operating patterns. It was assumed that
CO2 was delivered at the field gate at the pressure required.
From the development plans, CO2 EOR potential of the five prototype pools is 45.7 million cubic meter
(287.3 million barrel). Purchased CO2 requirement is projected to be 64.6 million tonne for an average net
utilization of 1.41 t/m3 (4.27 mcf/bbl). Individual pool results vary based on amount of CO2 injected, EOR
recovery factor and whether full produced CO2 stream recycle or separation is considered. For instance,
recovery of hydrocarbon miscible solvent from produced CO2 will occur in BHL SFA pools. Detailed
development plans were not prepared for the analogues.
This project began a new chapter in the assessment of EOR potential in Alberta. Nevertheless, further
work still needs to be done. The original AERI RFP identified 17 different pool types for assessment;
ultimately only five were assessed. There remain the other 12 horizontal miscible pool types, as well as
vertical and immiscible targets to consider. Furthermore, the five simulations produced in this report could
benefit from more refinement, especially more sensitivity analysis. This study was restricted to the field
characteristics for CO2 flooding and did not consider the proximity to suitable CO2 sources or the cost to
deliver CO2 to the field. It would be useful to build on this work by evaluating potential sources and
estimate transportation costs to deliver the CO2 to the fields so economics can be run to quantify the size
of the “gap” between the cost to capture, purify, compress and transport the CO2 and its value as a
solvent.
Alberta Research Council 1-3

CO2 Enhanced Hydrocarbon Recovery Summary Report December, 2009 Incremental Recovery and CO2 Storage Potential in Alberta
Alberta Research Council 1-4
In summary, this report provides assessment of the target pools in Alberta that would benefit the most
from EOR. This provides a technical baseline for policy discussions in the Government of Alberta.
However, far from concluding investigations in this area, this report demonstrates that considerable work
still needs to be undertaken to better understand the economic, environmental and policy options for
Alberta.
CO2 Enhanced Hydrocarbon Recovery Summary Report December, 2009 Incremental Recovery and CO2 Storage Potential in Alberta
2.0 INTRODUCTION
Partly in response to the recommendations of the Petroleum Technology Alliance Canada (PTAC) study
Ramping Up Recovery and growing interest in CO2 Enhanced Oil Recovery in Alberta, the Alberta Energy
Research Institute (AERI) funded this project to quantify the potential incremental recovery and
associated CO2 storage potential in Alberta. This report provides insights into further research projects for
AERI (now Alberta Innovates – Energy and Environment Solutions.
The Alberta Research Council (ARC) led the project and managed the project team. The multi-disciplinary
team assembled for this project draws staff from the ARC and seven contractors, with expertise in
numerical modelling, reservoir engineering, carbon capture and storage, field project design,
implementation, monitoring, interpretation, and project management. The project was divided into three
tasks. Through Task 1 (identification of geological prototypes in Alberta for CO2 enhanced recovery),
Task 2 (numerical modelling of the target prototypes) and Task 3 (production of development plans), the
team has been able to quantify the potential for increased oil production and associated CO2 storage in
the target geologic formations. Furthermore, through extrapolation to similar formations and experiences
from other jurisdictions, the team estimates the total oil recovery and associated CO2 storage potential for
CO2 enhanced oil recovery for some thirty-five pools and areas that represent approximately 30% of
Alberta’s conventional oil resource.
In summary, this report provides assessment of the target geologic formations in Alberta that would
benefit the most from CO2 enhanced oil recovery. The report demonstrates that considerable work still
needs to be undertaken to better understand the economic, environmental and policy options for Alberta.
2.1 BACKGROUND OF PROJECT In response to a Request for Proposal (RFP) issued by AERI (Appendix 3), ARC was awarded the
contract in September 2007. As the project leader and integrator, ARC established a methodology and
work plan to undertake this study. Previous estimates of CO2 Capture and Storage (CCS) potential in
Alberta have been based on reservoir screening criteria, rather than on detailed reservoir technical and
economic evaluation. The objective of this project was to complete a detailed reservoir and development
analysis of five representative pools, in order to quantify the potential for incremental oil recovery and
associated CCS potential in Alberta. The project methodology predicts the incremental Enhanced Oil
Recovery (EOR) and CO2 storage in each of the five prototype pools and extrapolates the findings to
some thirty-five analogue pools and areas amenable to CO2 EOR. Development plans provided data to
allow the ADOE to evaluate the economic and crown royalty impact of the CO2 EOR. The ultimate
objective of this project was to provide critical technical information and data to accelerate the pace of
CCS demonstration and field projects in Alberta.
Alberta Research Council 2-1
CO2 Enhanced Hydrocarbon Recovery Summary Report December, 2009 Incremental Recovery and CO2 Storage Potential in Alberta
ARC acted as the Principal Contractor for the study. Overall project management was provided by ARC.
Computer Modelling Group (CMG), SNC-Lavalin Inc. (SNC-Lavalin or SLI), Sproule Associates Limited
(Sproule), Divestco, Silvertip Ventures and Vikor Energy Inc. (Vikor) were subcontractors to ARC. These
organizations were well positioned to undertake the proposed project. As detailed below, these
organizations have extensive in-house expertise in numerical modelling, reservoir engineering, carbon
capture and storage, field project design, implementation, monitoring, and interpretation. These
companies have been involved in developing and implementing enhanced oil recovery technologies, in
some cases for more than 40 years.
In order to provide all the skills necessary to deliver the project, the lead organizations partnered with
third parties to provide additional expertise in geological and development areas. For example, in Task 1,
ARC complemented its expertise with that of The Green Six Ltd (Art Danielson) for reservoir assessment
and development planning activities, and with Sproule Associates (Chris Galas) for validating the results
of this analysis. Static reservoir modelling expertise was provided through partnering with Divestco, Inc.
and engaging the services of experienced geologists David Shaw and Peter Dankers to provide
geological reservoir modelling support. Task 2 was a cooperative effort between ARC, CMG and Sproule.
Task 3 was led by ARC with contributions from SNC Lavalin, Silvertip Ventures, Vikor Energy and
Sproule. At the request of AERI, Derril Stephenson of Vikor Energy Inc. was engaged to provide ongoing
guidance and review during the course of the project to ensure that the needs of ADOE were met. In
addition, Derril Stephenson was also engaged by ARC to assist with preparation and evaluation of
development scenarios in Task 3.
Within the scope of the proposal, Task 1 identified 5 prototype reservoirs, selected areas for simulation,
and determined analogue groupings. In Tasks 2 and 3, the project team focused on the 5 prototypes that
represent 34% of the original-oil-in-place for the light and medium oil pools of Alberta (ERCB 2006).
These 5 prototypes included two Beaver Hill Lake, two Cardium and one D-3 pool from the prospects
listed in Table 1A of the RFP. The results were then extrapolated to approximately thirty-five oil pools
and areas (of the 200 oil pools listed in Tables 1A, 1B, and 1C of the RFP) where extrapolation was
deemed appropriate and valid.
2. 2 PROJECT OBJECTIVES AND OVERALL APPROACH
The objectives of the study were:
• To identify 5 prototype Alberta reservoirs (out of a list of 219 in Tables 1A, 1B and 1C of
the RFP)
• To study 5 representative prototype Alberta oil pools in detail to predict the incremental
oil recovery and CO2 storage in the pools
• To develop a methodology to appropriately extrapolate the findings to other pools
amenable to CO2 EOR
Alberta Research Council 2-2
CO2 Enhanced Hydrocarbon Recovery Summary Report December, 2009 Incremental Recovery and CO2 Storage Potential in Alberta
• To provide development plans for selected fields and associated economic indicators in
sufficient detail that Alberta Department of Energy could assess the economics of CO2
EOR in the province.
Based on the results of the assessment, the ADOE will be able to evaluate the economic and crown
royalty impact of the CO2 EOR. The ultimate objective of this project was to provide critical technical
information and data to accelerate the pace of CCS demonstration and field projects in Alberta.
2.3 TASK DEFINITION
As formulated, the project comprised of three main tasks.
• Task 1 involved an iterative process to identify 5 prototype pools from the original 17 in the
proposal, and clustering of analogue groupings from the list of pools provided by AERI in the
RFP. The process included initial clustering and evaluation of cluster characteristics to reduce the
number of potential prototypes. Five prototypes were selected for more detailed evaluation in
Task 2. The pools were selected to ensure a high level of representation and meaningful
extrapolation to the larger group pools specified in the RFP. As per the RFP, Beaver Hill Lake,
Cardium and Redwater prototypes (representing approximately 34% of the provincial OOIP) were
selected for the first 5 prototypes. Specific areas of the pools from the prototypes were identified
to simulate in Task 2. Some preliminary examination of development options were undertaken to
ensure appropriate integration of Tasks 1, 2 and 3.
• Task 2 involved the further evaluation of the 5 principal prototype pools selected from Task 1.
Numerical modelling of selected areas (sector models) of the five prototype pools was
undertaken. The selected areas were history matched, so that a base case prediction of ultimate
recovery could be made. Then additional predictions of recovery were made for CO2 injection. It
was planned that the remaining 12 prototypes would be evaluated using results of sensitivity tests
conducted in the 5 simulations as well as correlations that had been benchmarked against actual
field data and available simulation predictions.
• Task 3 involved preparation of generic development plans where economic factors and policy
elements could be considered and evaluated. Since a wide range of reservoir types and injection
strategies were considered, the scope of options for reservoir performance was large, and there
was considerable variation in facilities costs and many different cases that could be
contemplated. It was not feasible to complete a detailed cost analysis for all cases. Thus, generic
development plans were generated.
Alberta Research Council 2-3
CO2 Enhanced Hydrocarbon Recovery Summary Report December, 2009 Incremental Recovery and CO2 Storage Potential in Alberta
Alberta Research Council 2-4
In order to be able to extrapolate the results of the Task 2 simulations to the full prototype pools and
eventually to analogue pools, the effect of the following were considered in the numerical simulations:
• Reservoir characteristics;
• CO2 injection process (miscible, variations of WAG etc.);
• Development strategies (infill wells, horizontals, patterns, process);
• Process operating conditions (pressure, flow rates); and
• Simulation parameters (relative permeability).
The results of the study of the pools evaluated in Task 2 were used for calibration of correlations, which
were then used with engineering judgement to extrapolate the results for miscible flooding field wide to
thirty-five analogue pools and areas.
The approach for Task 3 was to develop and utilize factored unit costs for various approaches (e.g. CO2
recycle with separation of hydrocarbons gases vs. no separation on $/mcf, well costs, pipeline costs,
operating costs). The unit cost factors together with output from numerical simulations of prototypes and
the extrapolation of performance characteristics to analogue reservoirs in Task 2, provided input to
assessment of development plan scenarios for a broad range of reservoir types. A spreadsheet-based
model (Pattern Development Model) developed by Vikor (Derril Stephenson) that schedules development
by starting new patterns to fully utilize available purchased and produced CO2 within the limits of
injectivity and productivity of the operating patterns was utilized for this task (See Appendix 1). The field
development plans considered:
• CO2 injection strategies and timing of initiation of new well patterns based on recycle volumes
available for various scenarios;
• Use of new and existing infrastructure such as wells, gathering systems, treatment facilities,
compressors;
• Capital and operating cost estimates for the surface facilities and operation. Capital expenditure
profile consistent with development plan;
• Energy requirements and emissions from the operation;
• Conceptual commercial scale operation with cost estimate accuracy in the +/- 40% range.
• Estimates of the volume of CO2 sequestered in the reservoir at the end of the production.
At this time the cost estimates remain confidential to the prototype operators and the Alberta Department
of Energy.

CO2 Enhanced Hydrocarbon Recovery Summary Report December, 2009 Incremental Recovery and CO2 Storage Potential in Alberta
3.0 IDENTIFICATION OF PROTOTYPES AND ANALOGUE
3.1 SELECTION OF PROTOTYPES The following prototypes and priorities for simulation were identified:
Pool type Prototype pool Operator Simulation by
Back-up
BHL HCMF Swan Hills Devon CMG Judy Creek
BHL waterflood Judy Creek Pengrowth ARC Carson Creek North
D3 Redwater ARC Resources ARC -
Cardium –thief zone Pembina NPCU ARC Resources CMG -
Cardium – no thief zone Pembina “A” Penn West ARC -
Note: The Redwater D-3 pool was substituted for the BHL Platform on Dec. 3, 2007 at the request of the ADOE.
ARC and Divestco, in collaboration with other team partners, undertook detailed in-depth geological
studies/reviews (regional as well as specific pools and prospective areas) along with their respective
performance. Study areas were selected based on their representative characteristics for major parts of
the EOR targets. ARC proceeded to build simulation models but discovered that the two BHL study areas
had many similarities and together they did not cover the full range of the prospective CO2-EOR regions.
ARC also made a similar determination about the two Cardium study areas selected. However, none of
the types of EOR targets inadequately covered by these selections were considered critical in terms of
‘size of the prize’ or expected variation in EOR response to merit extending the study. Our approach was
to use a parametric sensitivity study in Task II along with our collective past experience/judgement to
cover as many situations as technically justified. The relevant data were shared with the teams involved
with Task 2 to enable them to proceed with their work.
Past EOR related activities in the five prototype areas were also studied to develop, test, and validate
extrapolation methodology, and identify scenarios requiring simulation in Task 2.
Alberta Research Council 3-1
CO2 Enhanced Hydrocarbon Recovery Summary Report December, 2009 Incremental Recovery and CO2 Storage Potential in Alberta
3.2 SELECTION OF SIMULATION AREAS Pools with a horizontal displacement mechanism were estimated to have about 60% of the OOIP of the
pools with CO2 EOR potential. Therefore, when the number of prototypes to be studied initially was
reduced, five pools representative of the largest potential were selected.
3.2.1 Cardium Formation The Cardium formation has about 24% of the floodable OOIP of the pools with horizontal displacement
mechanism CO2 EOR potential. The Pembina Cardium pool is by far the largest conventional oil pool in
Alberta. It contains areas with high permeability zones (thief zones) where flow must be controlled to
achieve reasonable conformance in the reservoir and low productivity areas where processing time is
very deleterious to EOR economics. It was decided to complete two studies on the Cardium, one with a
thief zone and one with no thief zone.
3.2.1.1 Cardium Thief Zone The best area of Pembina Cardium is in the North Pembina Cardium Unit #1; ARC Resources is
contemplating a pilot in this region and agreed to assist with the study.
3.2.1.2 Cardium No Thief Zone Penn West has been operating a pilot in the Pembina Cardium “A” Lease and significant geological and
history match work had been done on the area. This area contains conglomerate but it does not have
high permeability so it was decided to build on this work. Penn West agreed to assist with the study.
3.2.2 Beaverhill Lake Formation (BHL) The BHL formation has about 35% of the floodable OOIP of the pools with horizontal displacement
mechanism CO2 EOR potential. Most of the best parts of the BHL pools have had hydrocarbon miscible
floods so a CO2 flood would be “quaternary” not “tertiary” and could recover additional hydrocarbon
miscible solvent (HCMS). Some of the areas in the BHL that have not been solvent flooded are the best
candidates for CO2 EOR. It was decided to complete two studies on the BHL one in a Solvent Flood Area
(SFA) and one in a Waterflood Area (WFA).
3.2.2.1 BHL SFA The Swan Hills BHL pool is the second largest conventional oil pool in Alberta. Devon Canada has
completed a CO2 pilot in an upper layer of a pattern that had high HCMS injection. Devon agreed to
assist with the study using a simulation area that encompassed the pilot area.
3.2.2.2 BHL WFA Pengrowth agreed to assist with the study using an area of Judy Creek BHL. The simulation area was
developed for Judy Creek, but as most of Judy Creek BHL pool has already been solvent flooded it was
decided to use Swan Hills WFA as the prototype as more geological data was available on Swan Hills.
Alberta Research Council 3-2
CO2 Enhanced Hydrocarbon Recovery Summary Report December, 2009 Incremental Recovery and CO2 Storage Potential in Alberta
Alberta Research Council 3-3
Pengrowth also operates the Judy Creek Gas Conservation plant which services most of the large pools
in the area. They provided input to the design and costs of the recycle system.
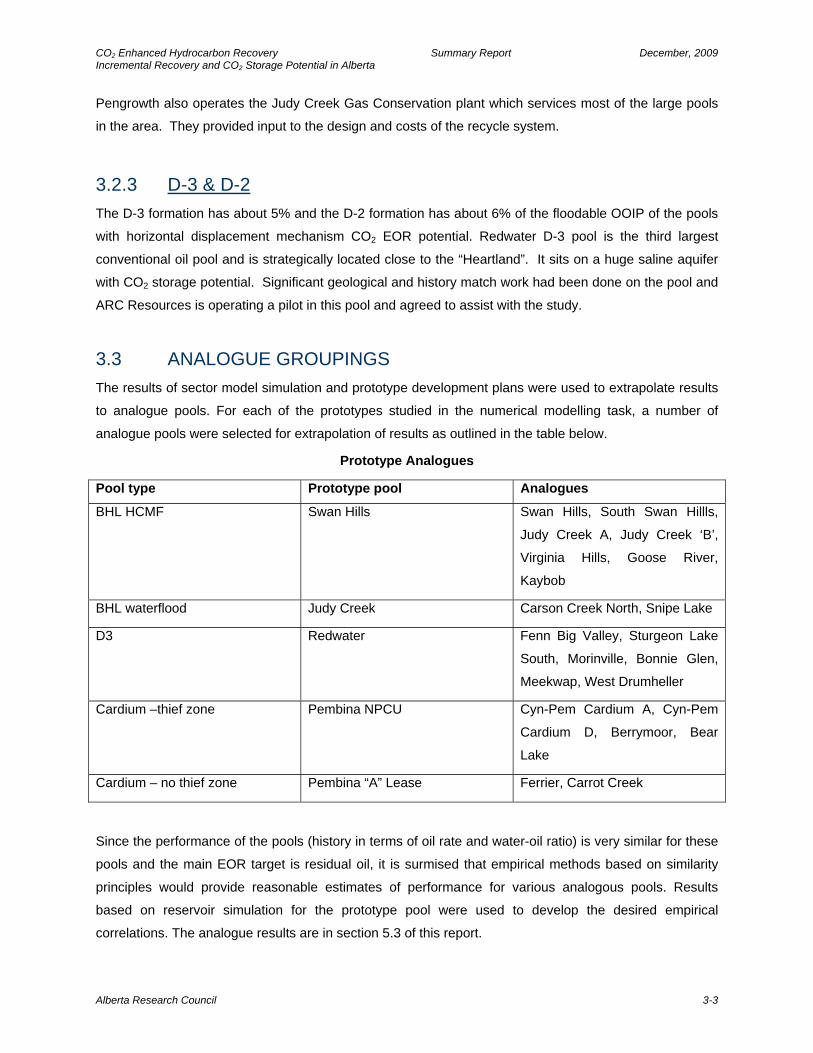
3.2.3 D-3 & D-2 The D-3 formation has about 5% and the D-2 formation has about 6% of the floodable OOIP of the pools
with horizontal displacement mechanism CO2 EOR potential. Redwater D-3 pool is the third largest
conventional oil pool and is strategically located close to the “Heartland”. It sits on a huge saline aquifer
with CO2 storage potential. Significant geological and history match work had been done on the pool and
ARC Resources is operating a pilot in this pool and agreed to assist with the study.
3.3 ANALOGUE GROUPINGS The results of sector model simulation and prototype development plans were used to extrapolate results
to analogue pools. For each of the prototypes studied in the numerical modelling task, a number of
analogue pools were selected for extrapolation of results as outlined in the table below.
Prototype Analogues
Pool type Prototype pool Analogues
BHL HCMF Swan Hills Swan Hills, South Swan Hillls,
Judy Creek A, Judy Creek ‘B’,
Virginia Hills, Goose River,
Kaybob
BHL waterflood Judy Creek Carson Creek North, Snipe Lake
D3 Redwater Fenn Big Valley, Sturgeon Lake
South, Morinville, Bonnie Glen,
Meekwap, West Drumheller
Cardium –thief zone Pembina NPCU Cyn-Pem Cardium A, Cyn-Pem
Cardium D, Berrymoor, Bear
Lake
Cardium – no thief zone Pembina “A” Lease Ferrier, Carrot Creek
Since the performance of the pools (history in terms of oil rate and water-oil ratio) is very similar for these
pools and the main EOR target is residual oil, it is surmised that empirical methods based on similarity
principles would provide reasonable estimates of performance for various analogous pools. Results
based on reservoir simulation for the prototype pool were used to develop the desired empirical
correlations. The analogue results are in section 5.3 of this report.

CO2 Enhanced Hydrocarbon Recovery Summary Report December, 2009 Incremental Recovery and CO2 Storage Potential in Alberta
4.0 NUMERICAL MODELING OF PROTOTYPES
4.1 PEMBINA CARDIUM WITH CONGLOMERATE PROTOTYPE The North Pembina Cardium Unit 1 (NPCU) operated by ARC Resources was chosen as the simulation
prototype for Pembina Cardium with Conglomerate. A sector approximately 2 sections in area,
encompassing wells in Sections 2, 3, 10, and 11 of Township 49, Range 8, W5 was selected for
simulation. The geological model was provided by ARC Resources and refined by Divestco. The
numerical modeling was carried out by Computer Modelling Group.
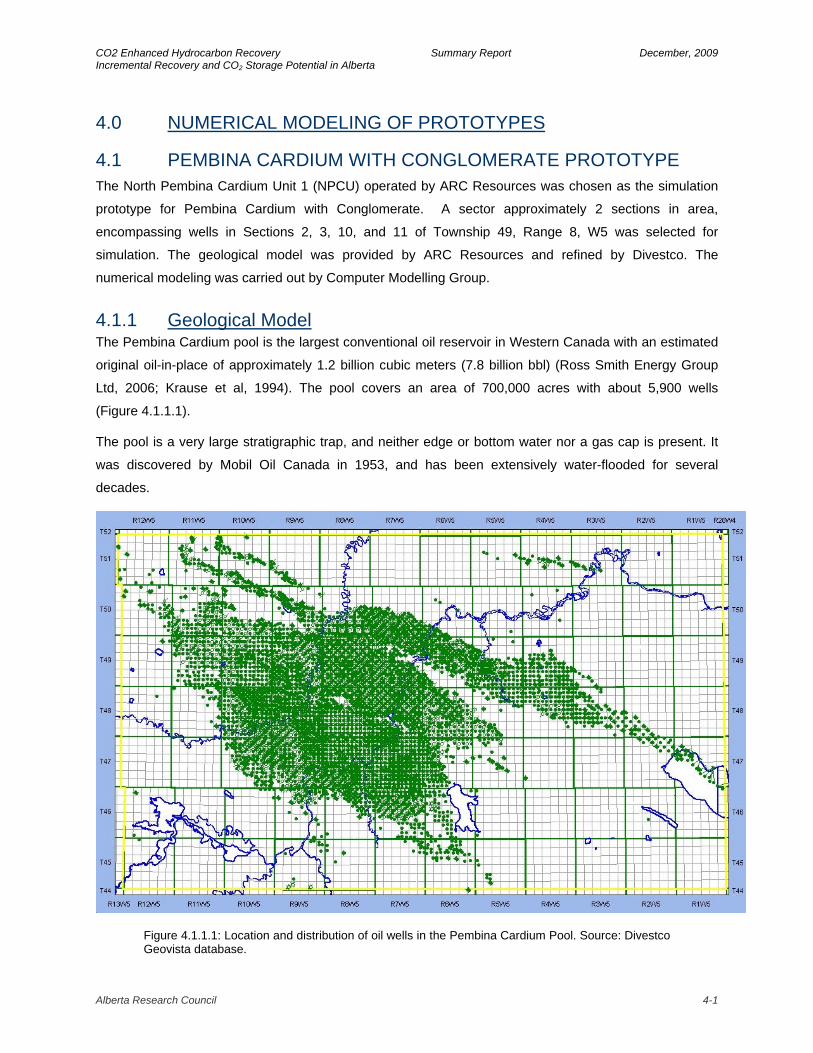
4.1.1 Geological Model The Pembina Cardium pool is the largest conventional oil reservoir in Western Canada with an estimated
original oil-in-place of approximately 1.2 billion cubic meters (7.8 billion bbl) (Ross Smith Energy Group
Ltd, 2006; Krause et al, 1994). The pool covers an area of 700,000 acres with about 5,900 wells
(Figure 4.1.1.1).
The pool is a very large stratigraphic trap, and neither edge or bottom water nor a gas cap is present. It
was discovered by Mobil Oil Canada in 1953, and has been extensively water-flooded for several
decades.
Figure 4.1.1.1: Location and distribution of oil wells in the Pembina Cardium Pool. Source: Divestco Geovista database.
Alberta Research Council 4-1
CO2 Enhanced Hydrocarbon Recovery Summary Report December, 2009 Incremental Recovery and CO2 Storage Potential in Alberta The North Pembina Cardium Unit No. 1 (NPCU-1), currently operated by ARC Resources Ltd., is one of
the most attractive candidates for CO2 injection in the Cardium Formation. A geological model of NPCU-1
was constructed based on geological tops of the Cardium Conglomerate, 5/6 Sand, 4 Sand and 3 Sand
supplied by ARC Resources Ltd. and core analysis data from Divestco’s Geovista database. A suite of
gross thickness and net pay thickness maps created by ARC Resources from core and log data were
used for quality-control of the completed model.
The reservoir quality of the Cardium Formation varies considerably and can be related to the environment
in which the sediments were deposited. Conglomerates that were reworked by waves or currents in a
shoreface setting have better porosity and permeability values than conglomerates formed in a fluvial
setting. Shoreface conglomerates occur to the east of fluvial-influenced conglomerates.
Fractures, vertical barriers to fluid flow and the extent to which the conglomerate acts as a thief zone play
a major role in Cardium reservoir performance. The orientation of fractures is well established to be SW-
NE but their exact location in the subsurface is difficult to ascertain.
The orientation of the geological model area is northeast-southwest, parallel to the regional fracture trend.
Cells with dimensions of 25 m x 25 m x 30 cm oriented parallel to the model boundaries were used to
construct the model. Geological tops of the Cardium Conglomerate, 5/6 Sand, 4 Sand and 3 Sand
supplied by ARC Resources Ltd. were used to construct the structural-stratigraphic framework of the
model. Core coverage of the NPCU-1 unit is excellent, and porosity and permeability values downloaded
from Divestco’s Geovista database were used to construct the rock property model (porosity and
maximum horizontal permeability). The model area contains 69 X 86 X 241 cells - the high degree of
vertical resolution was used to capture vertical variations in reservoir properties that will affect
conformance in the reservoir. The model was exported in RESCUE format for numerical simulation
studies.
4.1.2 Numerical Model The geological Model built using the “Earthvision” software package was imported into the Computer
Modelling Group’s (CMG) “Builder” simulation pre-processer. Some quality control checks were carried
out to confirm that the basic structure of the model and respective position of different geological layers
aligned both in the Builder and the Earthvision model.
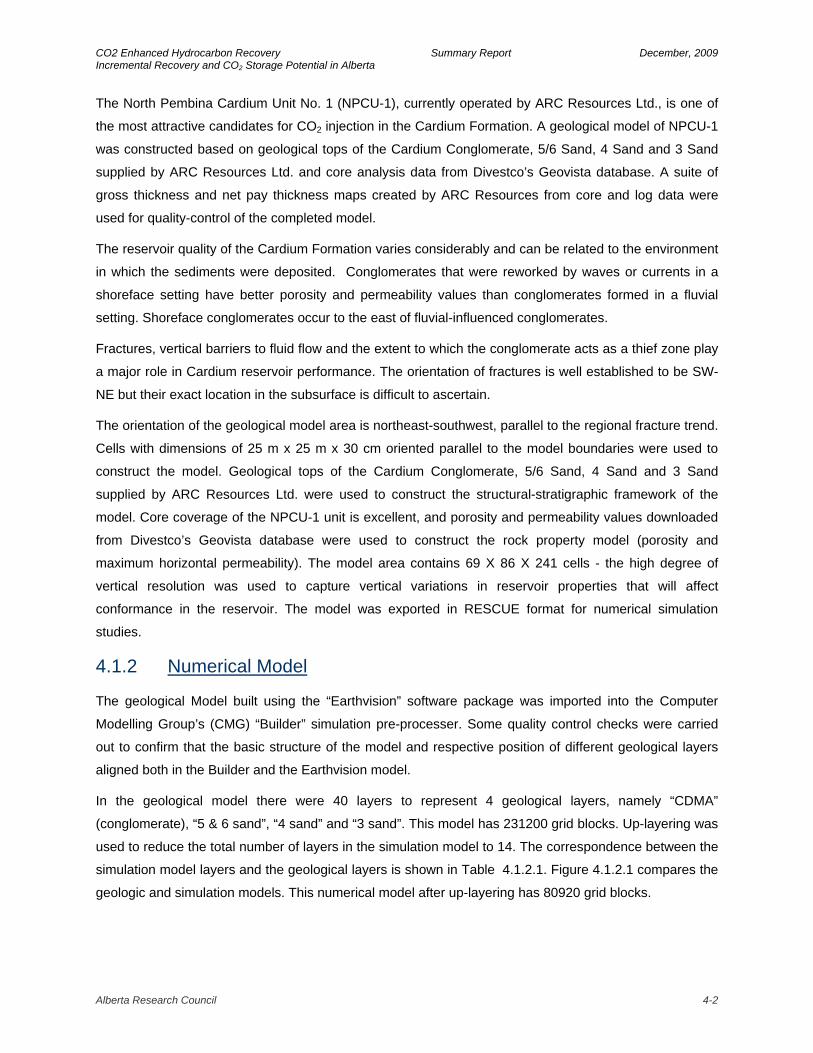
In the geological model there were 40 layers to represent 4 geological layers, namely “CDMA”
(conglomerate), “5 & 6 sand”, “4 sand” and “3 sand”. This model has 231200 grid blocks. Up-layering was
used to reduce the total number of layers in the simulation model to 14. The correspondence between the
simulation model layers and the geological layers is shown in Table 4.1.2.1. Figure 4.1.2.1 compares the
geologic and simulation models. This numerical model after up-layering has 80920 grid blocks.
Alberta Research Council 4-2

CO2 Enhanced Hydrocarbon Recovery Summary Report December, 2009 Incremental Recovery and CO2 Storage Potential in Alberta
Table 4.1.2.1: Layers in Simulation Model Geologic Layer Simulation Layer
1 CDMA (conglomerate) 2 3 5&6 sand 4 5 6 7 8
4 sand
9 10 11 12 13
3 sand
14
The only reservoir properties included in the geological model were porosity, vertical permeability and
horizontal permeability. The vertical permeability in the geological model had high values close to the
values of the horizontal permeability. Based on other studies of the Pembina field, the vertical
permeability was set to 1/10th of the horizontal permeability.
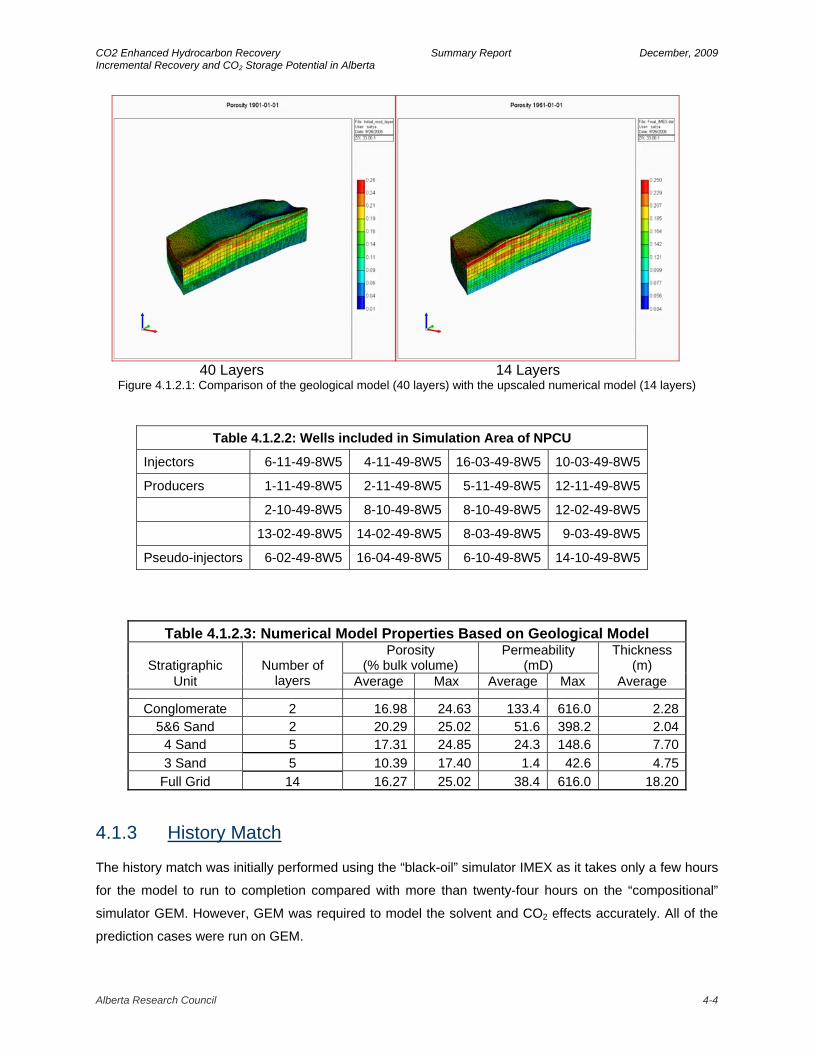
In the area modeled there are a total of 16 wells, four of which have been converted to water injectors at
different times. There was also some gas injection into well 06-11-049-08 W5 prior to its conversion to
water injection. Table 4.1.2.2 lists the well identifiers and well locations. The injection wells are aligned in
a NE/SW direction, with two rows of production wells parallel to the line of injection wells. This constitutes
a line drive pattern. The orientation of the pattern is parallel to the preferred fracture direction in this part
of the Western Sedimentary Basin.
Historical production and injection data were imported into the model to provide rate controls on the wells
as well as for creation of field history files. Petrophysical and fluid properties provided by ARC Resources
were incorporated into the model. The average value of petrophysical properties on a layer by layer basis
is shown in Table 4.1.2.3.
The well logs indicate that there are barriers between the conglomerate and the 5&6 sand and also
between the 4 sand and the 3 sand. In the model this was ensured by setting the transmissibility between
the respective sands to zero. All of the wells have been hydraulically fractured multiple times, so during
modeling they were open in all layers. On injection, it was expected that the fractures would propagate
because of the high injection pressures. This was incorporated into the model through the use of pressure
dependent permeability multipliers.
Alberta Research Council 4-3
CO2 Enhanced Hydrocarbon Recovery Summary Report December, 2009 Incremental Recovery and CO2 Storage Potential in Alberta
40 Layers 14 Layers
Figure 4.1.2.1: Comparison of the geological model (40 layers) with the upscaled numerical model (14 layers)
Table 4.1.2.2: Wells included in Simulation Area of NPCU
Injectors 6-11-49-8W5 4-11-49-8W5 16-03-49-8W5 10-03-49-8W5
Producers 1-11-49-8W5 2-11-49-8W5 5-11-49-8W5 12-11-49-8W5
2-10-49-8W5 8-10-49-8W5 8-10-49-8W5 12-02-49-8W5
13-02-49-8W5 14-02-49-8W5 8-03-49-8W5 9-03-49-8W5
Pseudo-injectors 6-02-49-8W5 16-04-49-8W5 6-10-49-8W5 14-10-49-8W5
Table 4.1.2.3: Numerical Model Properties Based on Geological Model
Stratigraphic Porosity
(% bulk volume) Permeability
(mD) Thickness
(m) Unit
Number of layers Average Max Average Max Average
Conglomerate 2 16.98 24.63 133.4 616.0 2.285&6 Sand 2 20.29 25.02 51.6 398.2 2.04
4 Sand 5 17.31 24.85 24.3 148.6 7.703 Sand 5 10.39 17.40 1.4 42.6 4.75
Full Grid 14 16.27 25.02 38.4 616.0 18.20
4.1.3 History Match The history match was initially performed using the “black-oil” simulator IMEX as it takes only a few hours
for the model to run to completion compared with more than twenty-four hours on the “compositional”
simulator GEM. However, GEM was required to model the solvent and CO2 effects accurately. All of the
prediction cases were run on GEM.
Alberta Research Council 4-4
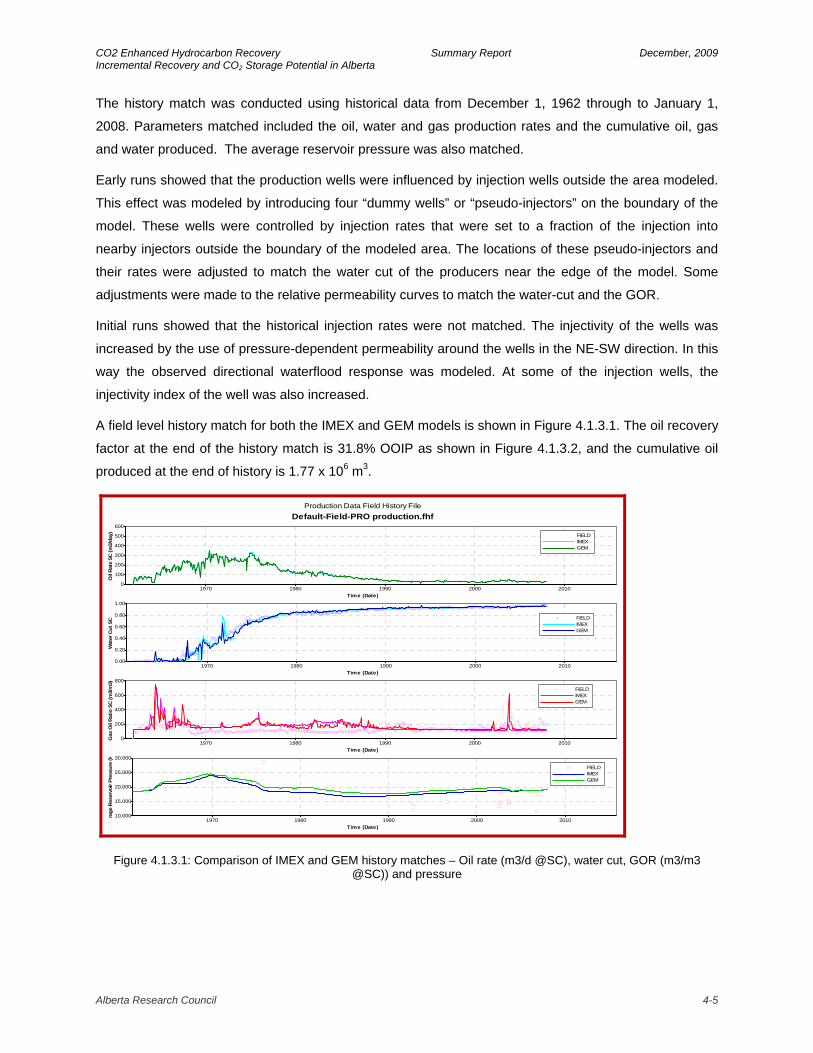
CO2 Enhanced Hydrocarbon Recovery Summary Report December, 2009 Incremental Recovery and CO2 Storage Potential in Alberta The history match was conducted using historical data from December 1, 1962 through to January 1,
2008. Parameters matched included the oil, water and gas production rates and the cumulative oil, gas
and water produced. The average reservoir pressure was also matched.
Early runs showed that the production wells were influenced by injection wells outside the area modeled.
This effect was modeled by introducing four “dummy wells” or “pseudo-injectors” on the boundary of the
model. These wells were controlled by injection rates that were set to a fraction of the injection into
nearby injectors outside the boundary of the modeled area. The locations of these pseudo-injectors and
their rates were adjusted to match the water cut of the producers near the edge of the model. Some
adjustments were made to the relative permeability curves to match the water-cut and the GOR.
Initial runs showed that the historical injection rates were not matched. The injectivity of the wells was
increased by the use of pressure-dependent permeability around the wells in the NE-SW direction. In this
way the observed directional waterflood response was modeled. At some of the injection wells, the
injectivity index of the well was also increased.
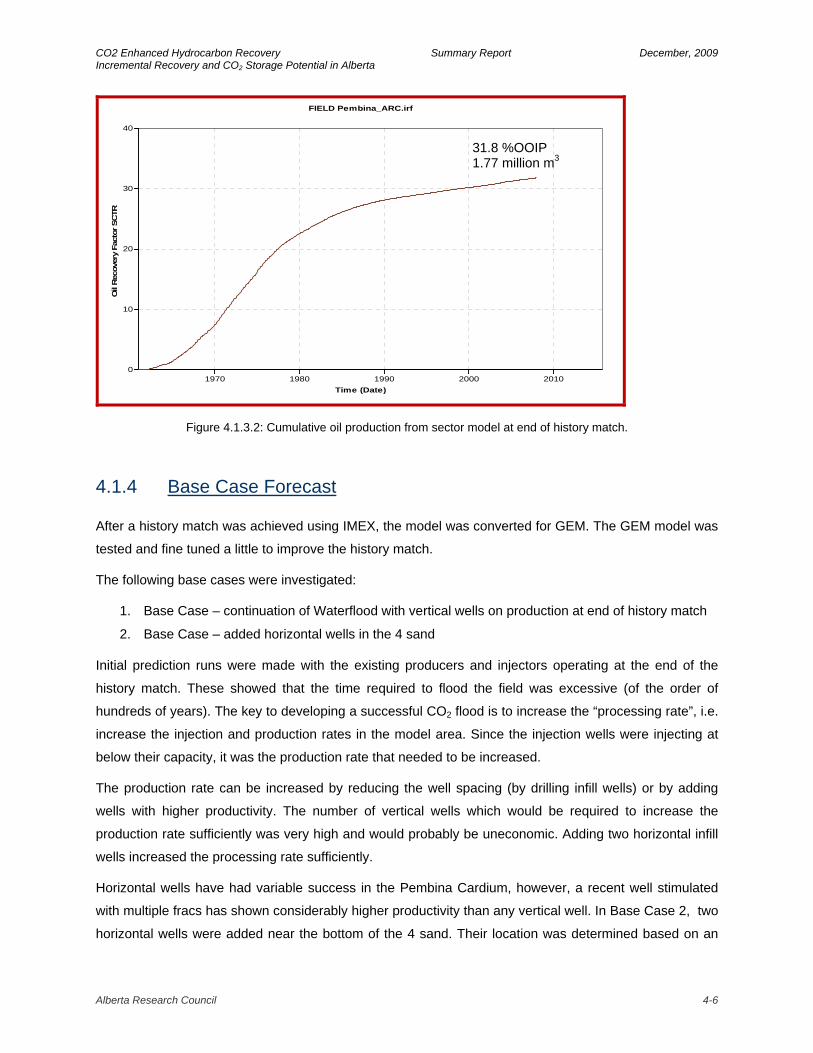
A field level history match for both the IMEX and GEM models is shown in Figure 4.1.3.1. The oil recovery
factor at the end of the history match is 31.8% OOIP as shown in Figure 4.1.3.2, and the cumulative oil
produced at the end of history is 1.77 x 10⁶ m3.
Production Data Field History FileDefault-Field-PRO production.fhf
Time (Date)
Oil
Rat
e SC
(m3/
day)
1970 1980 1990 2000 20100
100
200
300
400
500
600
FIELDIMEXGEM
Time (Date)
Wat
er C
ut S
C
1970 1980 1990 2000 20100.00
0.20
0.40
0.60
0.80
1.00
FIELDIMEXGEM
Time (Date)
Gas
Oil
Rat
io S
C (m
3/m
3)
1970 1980 1990 2000 20100
200
400
600
800
FIELDIMEXGEM
Time (Date)
erag
e R
eser
voir
Pres
sure
(k
1970 1980 1990 2000 201010,000
15,000
20,000
25,000
30,000
FIELDIMEXGEM
Figure 4.1.3.1: Comparison of IMEX and GEM history matches – Oil rate (m3/d @SC), water cut, GOR (m3/m3 @SC)) and pressure
Alberta Research Council 4-5
CO2 Enhanced Hydrocarbon Recovery Summary Report December, 2009 Incremental Recovery and CO2 Storage Potential in Alberta
FIELD Pembina_ARC.irf
Time (Date)
Oil
Rec
over
y Fa
ctor
SC
TR
1970 1980 1990 2000 20100
10
20
30
40
31.8 %OOIP 1.77 million m3
Figure 4.1.3.2: Cumulative oil production from sector model at end of history match.
4.1.4 Base Case Forecast After a history match was achieved using IMEX, the model was converted for GEM. The GEM model was
tested and fine tuned a little to improve the history match.
The following base cases were investigated:
1. Base Case – continuation of Waterflood with vertical wells on production at end of history match
2. Base Case – added horizontal wells in the 4 sand
Initial prediction runs were made with the existing producers and injectors operating at the end of the
history match. These showed that the time required to flood the field was excessive (of the order of
hundreds of years). The key to developing a successful CO2 flood is to increase the “processing rate”, i.e.
increase the injection and production rates in the model area. Since the injection wells were injecting at
below their capacity, it was the production rate that needed to be increased.
The production rate can be increased by reducing the well spacing (by drilling infill wells) or by adding
wells with higher productivity. The number of vertical wells which would be required to increase the
production rate sufficiently was very high and would probably be uneconomic. Adding two horizontal infill
wells increased the processing rate sufficiently.
Horizontal wells have had variable success in the Pembina Cardium, however, a recent well stimulated
with multiple fracs has shown considerably higher productivity than any vertical well. In Base Case 2, two
horizontal wells were added near the bottom of the 4 sand. Their location was determined based on an
Alberta Research Council 4-6
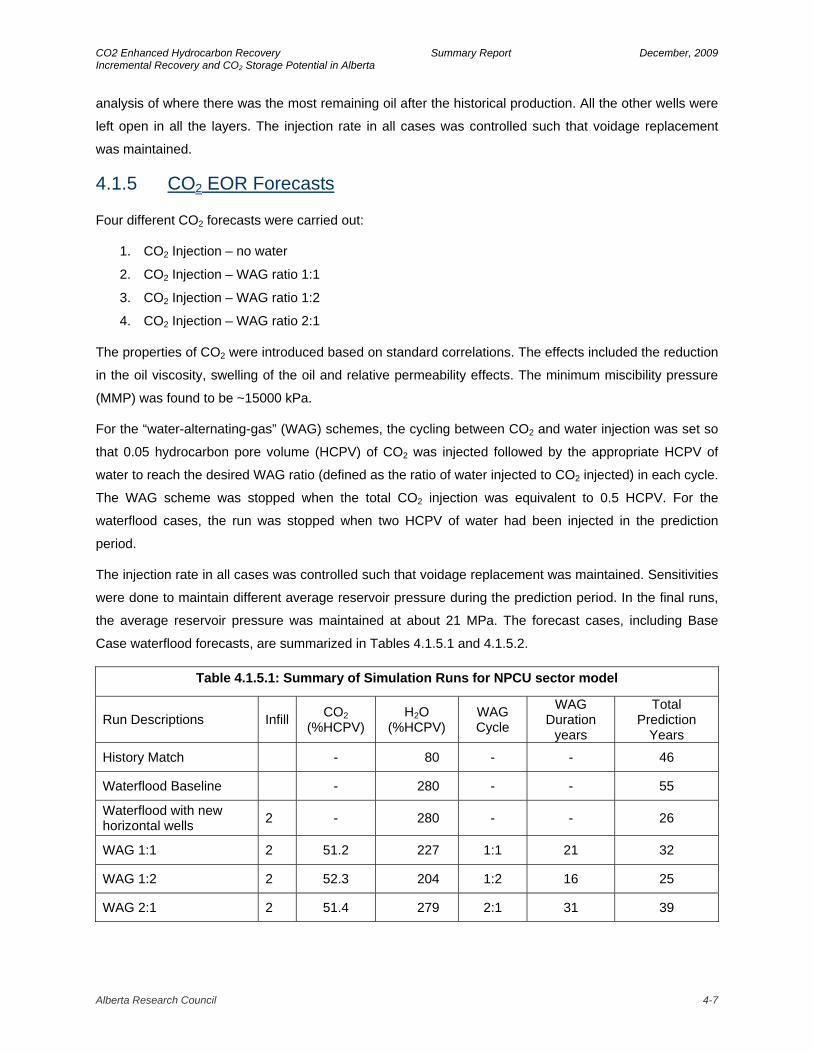
CO2 Enhanced Hydrocarbon Recovery Summary Report December, 2009 Incremental Recovery and CO2 Storage Potential in Alberta analysis of where there was the most remaining oil after the historical production. All the other wells were
left open in all the layers. The injection rate in all cases was controlled such that voidage replacement
was maintained.
4.1.5 CO2 EOR Forecasts
Four different CO2 forecasts were carried out:
1. CO2 Injection – no water
2. CO2 Injection – WAG ratio 1:1
3. CO2 Injection – WAG ratio 1:2
4. CO2 Injection – WAG ratio 2:1
The properties of CO2 were introduced based on standard correlations. The effects included the reduction
in the oil viscosity, swelling of the oil and relative permeability effects. The minimum miscibility pressure
(MMP) was found to be ~15000 kPa.
For the “water-alternating-gas” (WAG) schemes, the cycling between CO2 and water injection was set so
that 0.05 hydrocarbon pore volume (HCPV) of CO2 was injected followed by the appropriate HCPV of
water to reach the desired WAG ratio (defined as the ratio of water injected to CO2 injected) in each cycle.
The WAG scheme was stopped when the total CO2 injection was equivalent to 0.5 HCPV. For the
waterflood cases, the run was stopped when two HCPV of water had been injected in the prediction
period.
The injection rate in all cases was controlled such that voidage replacement was maintained. Sensitivities
were done to maintain different average reservoir pressure during the prediction period. In the final runs,
the average reservoir pressure was maintained at about 21 MPa. The forecast cases, including Base
Case waterflood forecasts, are summarized in Tables 4.1.5.1 and 4.1.5.2.
Table 4.1.5.1: Summary of Simulation Runs for NPCU sector model
Run Descriptions Infill CO2 (%HCPV)
H2O (%HCPV)
WAG Cycle
WAG Duration
years
Total Prediction
Years
History Match - 80 - - 46
Waterflood Baseline - 280 - - 55
Waterflood with new horizontal wells 2 - 280 - - 26
WAG 1:1 2 51.2 227 1:1 21 32
WAG 1:2 2 52.3 204 1:2 16 25
WAG 2:1 2 51.4 279 2:1 31 39
Alberta Research Council 4-7
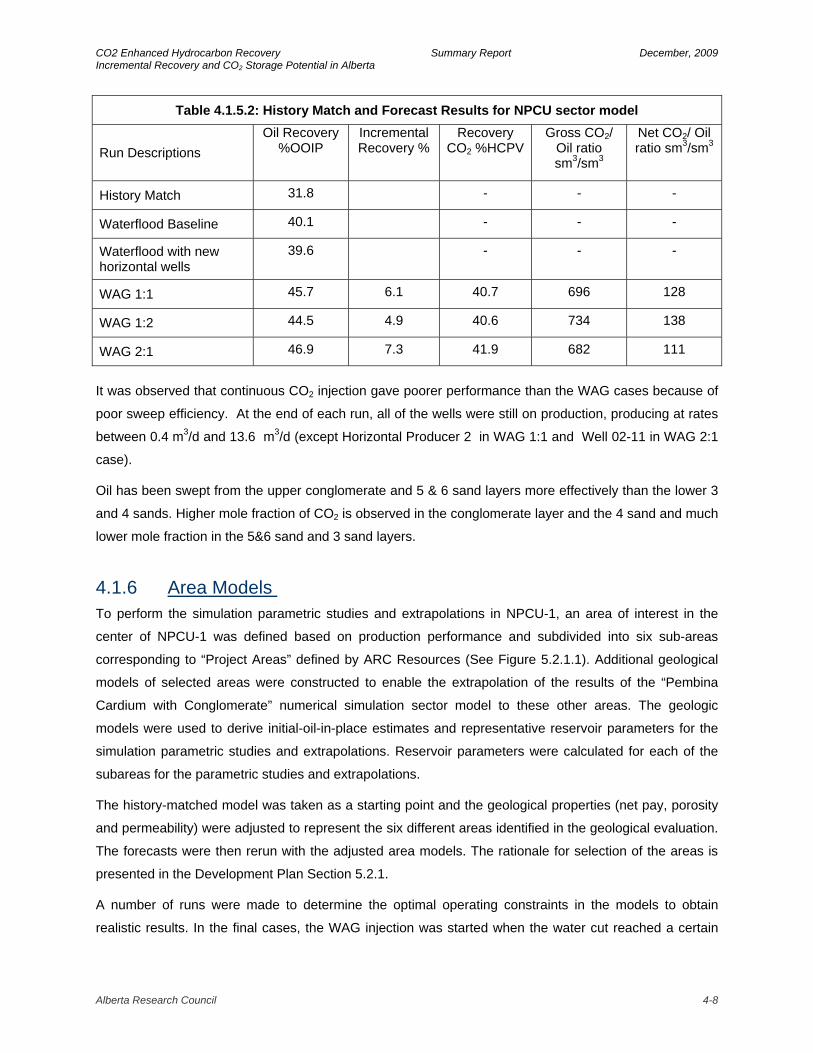
CO2 Enhanced Hydrocarbon Recovery Summary Report December, 2009 Incremental Recovery and CO2 Storage Potential in Alberta
Table 4.1.5.2: History Match and Forecast Results for NPCU sector model
Run Descriptions Oil Recovery
%OOIP Incremental Recovery %
Recovery CO2 %HCPV
Gross CO2/ Oil ratio sm3/sm3
Net CO2/ Oil ratio sm3/sm3
History Match 31.8 - - -
Waterflood Baseline 40.1 - - -
Waterflood with new horizontal wells
39.6 - - -
WAG 1:1 45.7 6.1 40.7 696 128
WAG 1:2 44.5 4.9 40.6 734 138
WAG 2:1 46.9 7.3 41.9 682 111
It was observed that continuous CO2 injection gave poorer performance than the WAG cases because of
poor sweep efficiency. At the end of each run, all of the wells were still on production, producing at rates
between 0.4 m3/d and 13.6 m3/d (except Horizontal Producer 2 in WAG 1:1 and Well 02-11 in WAG 2:1
case).
Oil has been swept from the upper conglomerate and 5 & 6 sand layers more effectively than the lower 3
and 4 sands. Higher mole fraction of CO2 is observed in the conglomerate layer and the 4 sand and much
lower mole fraction in the 5&6 sand and 3 sand layers.
4.1.6 Area Models To perform the simulation parametric studies and extrapolations in NPCU-1, an area of interest in the
center of NPCU-1 was defined based on production performance and subdivided into six sub-areas
corresponding to “Project Areas” defined by ARC Resources (See Figure 5.2.1.1). Additional geological
models of selected areas were constructed to enable the extrapolation of the results of the “Pembina
Cardium with Conglomerate” numerical simulation sector model to these other areas. The geologic
models were used to derive initial-oil-in-place estimates and representative reservoir parameters for the
simulation parametric studies and extrapolations. Reservoir parameters were calculated for each of the
subareas for the parametric studies and extrapolations.
The history-matched model was taken as a starting point and the geological properties (net pay, porosity
and permeability) were adjusted to represent the six different areas identified in the geological evaluation.
The forecasts were then rerun with the adjusted area models. The rationale for selection of the areas is
presented in the Development Plan Section 5.2.1.
A number of runs were made to determine the optimal operating constraints in the models to obtain
realistic results. In the final cases, the WAG injection was started when the water cut reached a certain
Alberta Research Council 4-8
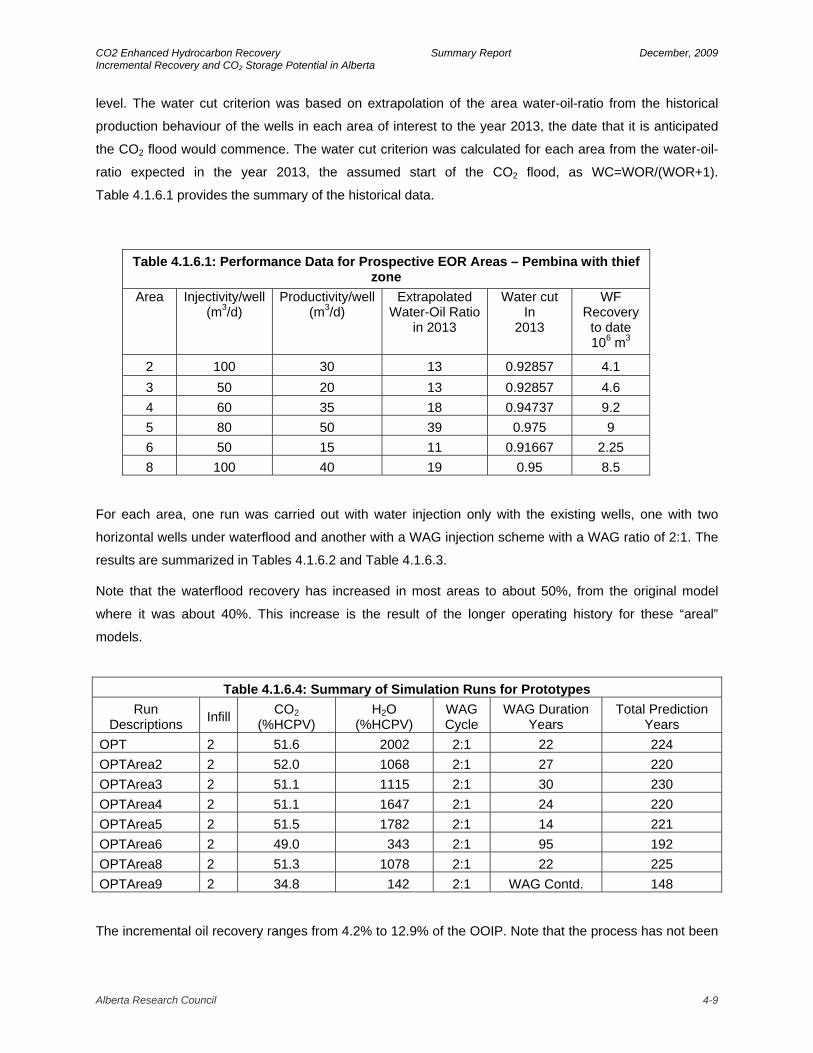
CO2 Enhanced Hydrocarbon Recovery Summary Report December, 2009 Incremental Recovery and CO2 Storage Potential in Alberta level. The water cut criterion was based on extrapolation of the area water-oil-ratio from the historical
production behaviour of the wells in each area of interest to the year 2013, the date that it is anticipated
the CO2 flood would commence. The water cut criterion was calculated for each area from the water-oil-
ratio expected in the year 2013, the assumed start of the CO2 flood, as WC=WOR/(WOR+1).
Table 4.1.6.1 provides the summary of the historical data.
Table 4.1.6.1: Performance Data for Prospective EOR Areas – Pembina with thief zone
Area Injectivity/well (m3/d)
Productivity/well(m3/d)
Extrapolated Water-Oil Ratio
in 2013
Water cut In
2013
WF Recovery
to date 106 m3
2 100 30 13 0.92857 4.1 3 50 20 13 0.92857 4.6 4 60 35 18 0.94737 9.2 5 80 50 39 0.975 9 6 50 15 11 0.91667 2.25 8 100 40 19 0.95 8.5
For each area, one run was carried out with water injection only with the existing wells, one with two
horizontal wells under waterflood and another with a WAG injection scheme with a WAG ratio of 2:1. The
results are summarized in Tables 4.1.6.2 and Table 4.1.6.3.
Note that the waterflood recovery has increased in most areas to about 50%, from the original model
where it was about 40%. This increase is the result of the longer operating history for these “areal”
models.
Table 4.1.6.4: Summary of Simulation Runs for Prototypes
Run Descriptions Infill CO2
(%HCPV) H2O
(%HCPV) WAG Cycle
WAG Duration Years
Total Prediction Years
OPT 2 51.6 2002 2:1 22 224 OPTArea2 2 52.0 1068 2:1 27 220 OPTArea3 2 51.1 1115 2:1 30 230 OPTArea4 2 51.1 1647 2:1 24 220 OPTArea5 2 51.5 1782 2:1 14 221 OPTArea6 2 49.0 343 2:1 95 192 OPTArea8 2 51.3 1078 2:1 22 225 OPTArea9 2 34.8 142 2:1 WAG Contd. 148
The incremental oil recovery ranges from 4.2% to 12.9% of the OOIP. Note that the process has not been
Alberta Research Council 4-9
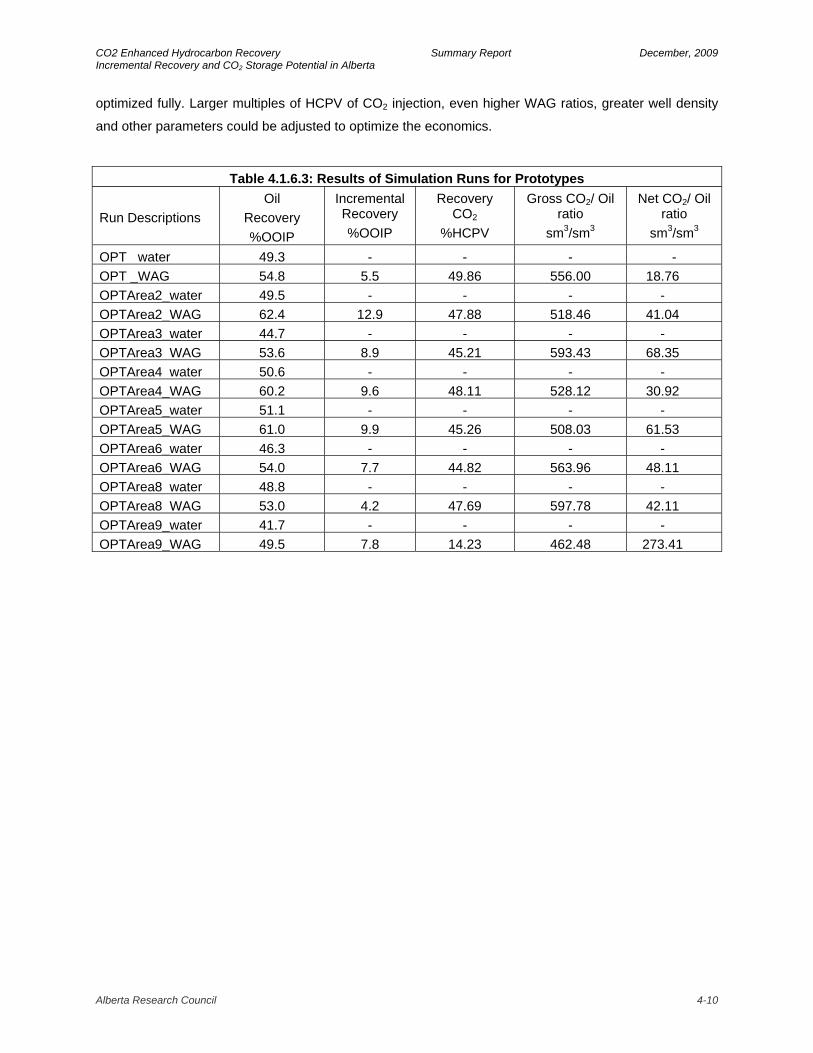
CO2 Enhanced Hydrocarbon Recovery Summary Report December, 2009 Incremental Recovery and CO2 Storage Potential in Alberta optimized fully. Larger multiples of HCPV of CO2 injection, even higher WAG ratios, greater well density
and other parameters could be adjusted to optimize the economics.
Table 4.1.6.3: Results of Simulation Runs for Prototypes
Run Descriptions Oil
Recovery %OOIP
Incremental Recovery %OOIP
Recovery CO2
%HCPV
Gross CO2/ Oil ratio
sm3/sm3
Net CO2/ Oil ratio
sm3/sm3
OPT _water 49.3 - - - -OPT _WAG 54.8 5.5 49.86 556.00 18.76OPTArea2_water 49.5 - - - -OPTArea2_WAG 62.4 12.9 47.88 518.46 41.04OPTArea3_water 44.7 - - - -OPTArea3_WAG 53.6 8.9 45.21 593.43 68.35OPTArea4_water 50.6 - - - -OPTArea4_WAG 60.2 9.6 48.11 528.12 30.92OPTArea5_water 51.1 - - - -OPTArea5_WAG 61.0 9.9 45.26 508.03 61.53OPTArea6_water 46.3 - - - -OPTArea6_WAG 54.0 7.7 44.82 563.96 48.11OPTArea8_water 48.8 - - - -OPTArea8_WAG 53.0 4.2 47.69 597.78 42.11OPTArea9_water 41.7 - - - -OPTArea9_WAG 49.5 7.8 14.23 462.48 273.41
Alberta Research Council 4-10

CO2 Enhanced Hydrocarbon Recovery Summary Report December, 2009 Incremental Recovery and CO2 Storage Potential in Alberta
4.2 PEMBINA CARDIUM WITHOUT THIEF ZONE (NO CONGLOMERATE) PROTOTYPE
An area in the Penn West operated “A” Lease was selected as the prototype for the Pembina Cardium
without thief zone numerical simulation. The area, in which Penn West has been operating a CO2 pilot, is
in Township 48, Range 9, West 5M. The area spans across several legal subdivisions from 5-12-48-9
W5 to 10-11-48-9 W5. The study area selected for reservoir modelling is in the heart of the Pembina
Cardium field. It covers an area 3 km by 2.5 km (3 sections) that includes the pilot and its surrounding
area. Over the selected target area for this study, the conglomerate is about 0.5 m thick or less.
Numerical modelling was carried out by Alberta Research Council using Schlumberger’s Eclipse
simulator.
4.2.1 Geological Model A geological model was provided by Penn West for this simulation study. The model, developed in Petrel
software, was divided areally into 199 by 199 blocks with each block 20 m by 20 m in size. It was
upscaled by Penn West to 15 vertical layers from its original 24 layers. The gridding coordinates for the
model were oriented 45 degrees to align one axis of the model parallel to the permeability on-trend
direction that runs in a NW-SE orientation. The model covers an area of about 1600 ha (6.2 sections).
About 3.2 by 2.5 km of the area was carved out for the simulation study. The area, bounded by the red
boundary as shown in Figure 4.2.1.1, has 800 ha (3.1 sections) of land and encompasses Sections 6, 7,
and 18 of Township 48, Range 8, W5 and Sections 1 to 3, and 10 to 15 of Township 48, Range 9, W5.
(1 1 1) (199 199 1)
(199 1 1)
(1 199 1)
(85 1 1)
(1 88 1)
(199 111 1)
(111 199 1)
CO2 Pilot(1 1 1) (199 199 1)
(199 1 1)
(1 199 1)
(85 1 1)
(1 88 1)
(199 111 1)
(111 199 1)
(1 1 1) (199 199 1)
(199 1 1)
(1 199 1)
(85 1 1)
(1 88 1)
(199 111 1)
(111 199 1)
CO2 Pilot
Figure 4.2.1.1: Penn West’s 15-layer geological model
Alberta Research Council 4-11

CO2 Enhanced Hydrocarbon Recovery Summary Report December, 2009 Incremental Recovery and CO2 Storage Potential in Alberta
The Penn West geological model consists of four main units: lower sandstone, middle sandstone, upper
sandstone and a thin conglomerate. Layer 1 comprises entirely of the conglomerate unit, layers 2 to 11
comprise of both upper and middle sandstones while layers 13 to 15 the lower sandstone. There is an
insignificant barrier to vertical fluid flow between the upper and middle sandstone. The lower sandstone is
separated from the middle sandstones by a regionally extensive shale barrier which is represented in the
model as an inactive layer (layer 12). The petrophysical data for each block, such as average porosity,
horizontal and vertical permeabilities, thickness and ratio of net to gross pay, were delineated and
represented in the model. The tops of the formation structure were also provided and are shown in
Figure 4.2.1.2. The variability of the reservoir attributes for the Cardium Formation in the simulation area
is given in Table 4.2.1.1..
Table 4.2.1.1: Variability of the petrophysical properties in the Penn West geological model
Tops mss
Porosity fraction
Kx mD
Kz mD
Thickness m
Net to Gross Ratio
Minimum 707.3 0.050 0.003 0.000 0.008 0.05
Maximum 761.6 0.215 455.1 302.5 6.327 1
Mean 732.8 0.145 10.021 1.690 1.108 0.758
Figure 4.2.1.2: Pembina Cardium tops as shown by the Penn West 15 layer geological model
Alberta Research Council 4-12
CO2 Enhanced Hydrocarbon Recovery Summary Report December, 2009 Incremental Recovery and CO2 Storage Potential in Alberta
4.2.2 Numerical Model The Penn West geo-model was incorporated into the ECLIPSE black oil simulator (E100) with the solvent
mixing module. Petrophysical and fluid properties provided by Penn West were incorporated into the
model. The model area included Penn West’s CO2 pilot area. The grid blocks in the pilot area were further
sub-divided into 25 finer blocks. The local grid refinement was done to reduce the block size effect for the
two inverted 5-spot CO2 pilots, which are situated in the center of the simulation study area.
The vertical to horizontal permeability ratios (Kv/Kh ) were defined for each block in the model. The
statistical average of the ratio is fairly low, about 0.17. There was no directional permeability trend shown
in the model; the statistical average of the permeabilities in the x-direction is about the same as those in
the y-direction. Nonetheless, the effect of permeability anisotropy was investigated in a water flood case
which shows the effect on incremental recovery was smaller than 1% OOIP.
4.2.3 History Match
The area selected for this study was depleted under primary production beginning February 1, 1955 until
the implementation of the water flood scheme in 1958. The earliest production from the area was from
thirteen wells drilled in 1953 with production ranging from 4 to 15 m3/d. Six wells were converted in early
1958 for water injection with the injection rate ranging from 10 to 27 m3/d. A CO2 miscible flood pilot
started in two inverted 5-spot patterns in March, 2005. There were 67 wells operating in the target area
over the 53 years of primary and water flood operations.
The approach used in the history match was to prescribe water injection rates and oil production rates as
an input control. The simulation output for total liquid, water and gas production rates provides significant
tests for the quality of the history match. A satisfactory match (figure 4.2.3.1) of field production was
achieved by adjusting the water and oil permeability curves, primarily the krw curvature power and
irreducible water saturation. Adjustment of localized fluid transmissibility around wells was made to take
into account the effect of induced fractures. Also, well fractions for the wells located along the boundaries
of the study area were set typically between 0.25 and 0.5 depending on their locations in order to achieve
the injectivity and productivity of these wells.
The history match simulation was extended to the two year production of the CO2 miscible flood pilot.
Injection of CO2 at the two injectors 02/10-11 and 02/12-12 of the pilot started in March 2005. An
acceptable match of the pilot history was achieved (Figure 4.2.3.2).
Alberta Research Council 4-13
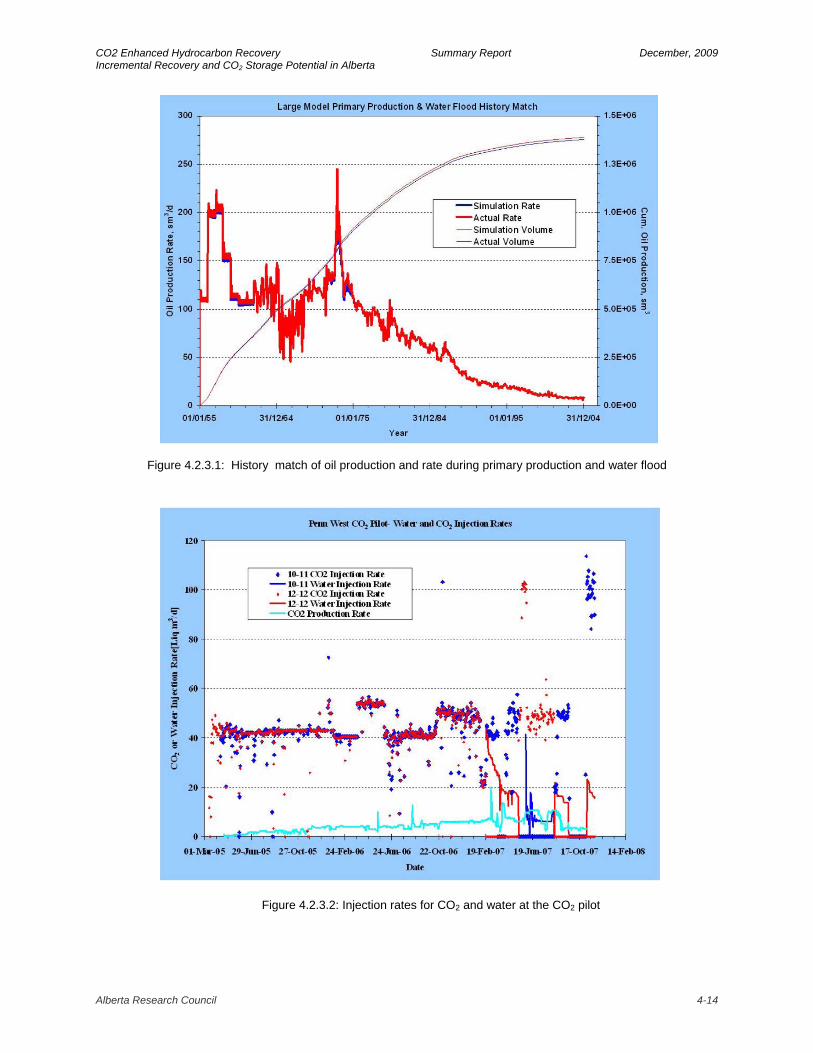
CO2 Enhanced Hydrocarbon Recovery Summary Report December, 2009 Incremental Recovery and CO2 Storage Potential in Alberta
Figure 4.2.3.1: History match of oil production and rate during primary production and water flood
Figure 4.2.3.2: Injection rates for CO2 and water at the CO2 pilot
Alberta Research Council 4-14
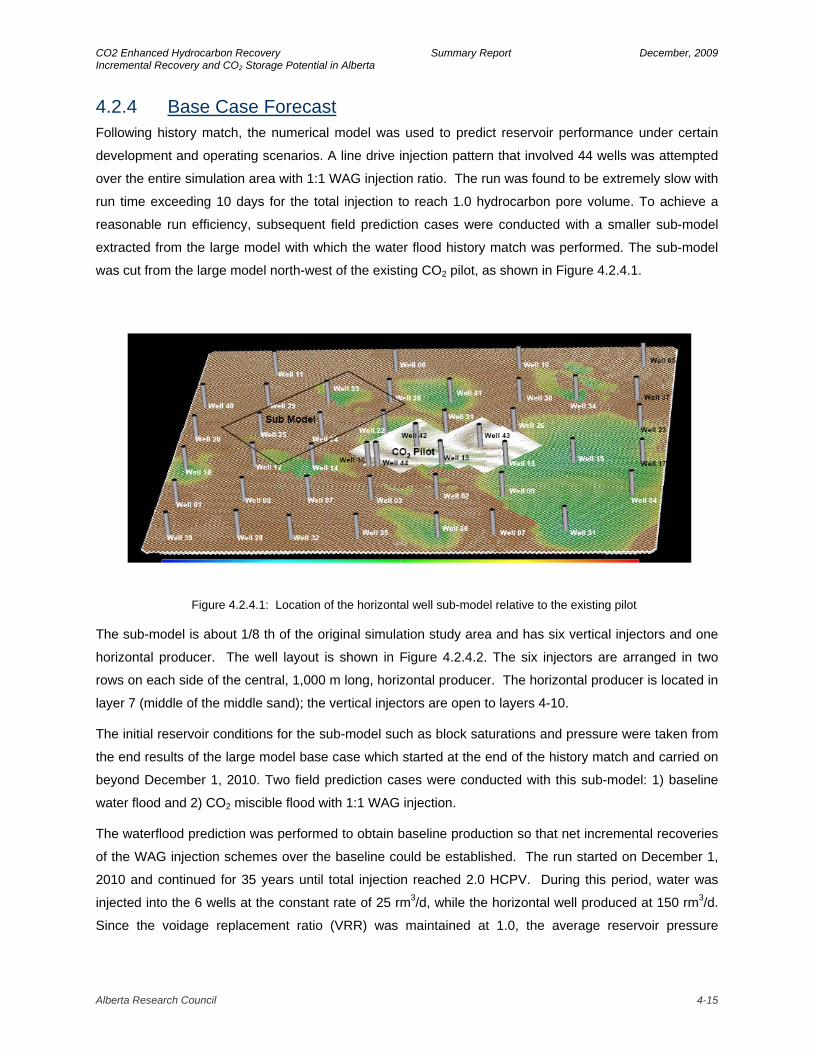
CO2 Enhanced Hydrocarbon Recovery Summary Report December, 2009 Incremental Recovery and CO2 Storage Potential in Alberta
4.2.4 Base Case Forecast Following history match, the numerical model was used to predict reservoir performance under certain
development and operating scenarios. A line drive injection pattern that involved 44 wells was attempted
over the entire simulation area with 1:1 WAG injection ratio. The run was found to be extremely slow with
run time exceeding 10 days for the total injection to reach 1.0 hydrocarbon pore volume. To achieve a
reasonable run efficiency, subsequent field prediction cases were conducted with a smaller sub-model
extracted from the large model with which the water flood history match was performed. The sub-model
was cut from the large model north-west of the existing CO2 pilot, as shown in Figure 4.2.4.1.
Figure 4.2.4.1: Location of the horizontal well sub-model relative to the existing pilot
The sub-model is about 1/8 th of the original simulation study area and has six vertical injectors and one
horizontal producer. The well layout is shown in Figure 4.2.4.2. The six injectors are arranged in two
rows on each side of the central, 1,000 m long, horizontal producer. The horizontal producer is located in
layer 7 (middle of the middle sand); the vertical injectors are open to layers 4-10.
The initial reservoir conditions for the sub-model such as block saturations and pressure were taken from
the end results of the large model base case which started at the end of the history match and carried on
beyond December 1, 2010. Two field prediction cases were conducted with this sub-model: 1) baseline
water flood and 2) CO2 miscible flood with 1:1 WAG injection.
The waterflood prediction was performed to obtain baseline production so that net incremental recoveries
of the WAG injection schemes over the baseline could be established. The run started on December 1,
2010 and continued for 35 years until total injection reached 2.0 HCPV. During this period, water was
injected into the 6 wells at the constant rate of 25 rm3/d, while the horizontal well produced at 150 rm3/d.
Since the voidage replacement ratio (VRR) was maintained at 1.0, the average reservoir pressure
Alberta Research Council 4-15

CO2 Enhanced Hydrocarbon Recovery Summary Report December, 2009 Incremental Recovery and CO2 Storage Potential in Alberta remained relatively constant at 20 MPa throughout this period. Incremental recovery reached 9% from the
baseline water flood simulation. Production rates are shown in Figure 4.2.4.3.
Figure 4.2.4.2: Configurations of vertical injectors and horizontal producer in the sub-model for field prediction cases
Figure 4.2.4.3: Production rates from base line waterflood case
4.2.5 CO2 EOR Forecast One WAG prediction case was performed with the sub-model. The WAG starting date for the prediction
was chosen to be on November 11, 2017 when the water cut of the produced liquid reached 95% in the
baseline waterflood case. Initially, in each WAG cycle, CO2 was injected at the rate of 150 rm3/d into the
six vertical injectors for a month; this was followed by a month of water injection at the same rate. The
Alberta Research Council 4-16
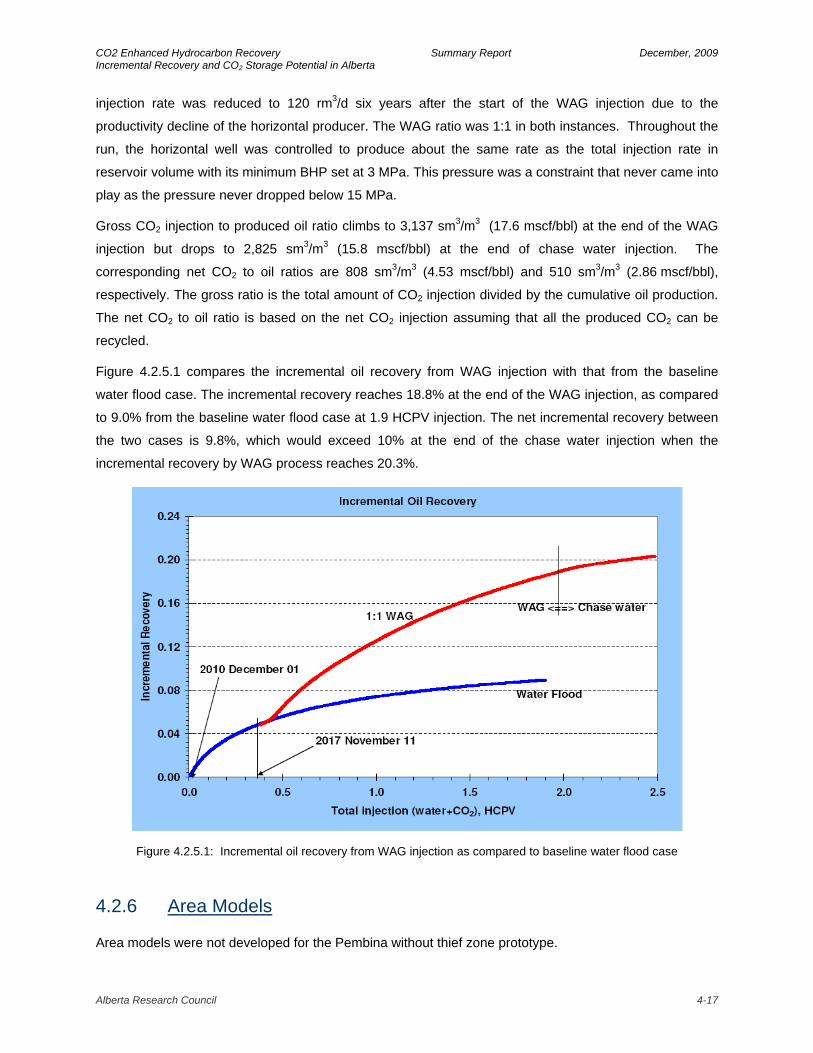
CO2 Enhanced Hydrocarbon Recovery Summary Report December, 2009 Incremental Recovery and CO2 Storage Potential in Alberta
Alberta Research Council 4-17
,137 sm3/m3 (17.6 mscf/bbl) at the end of the WAG
.1 compares the incremental oil recovery from WAG injection with that from the baseline
injection rate was reduced to 120 rm3/d six years after the start of the WAG injection due to the
productivity decline of the horizontal producer. The WAG ratio was 1:1 in both instances. Throughout the
run, the horizontal well was controlled to produce about the same rate as the total injection rate in
reservoir volume with its minimum BHP set at 3 MPa. This pressure was a constraint that never came into
play as the pressure never dropped below 15 MPa.
Gross CO2 injection to produced oil ratio climbs to 3
injection but drops to 2,825 sm3/m3 (15.8 mscf/bbl) at the end of chase water injection. The
corresponding net CO2 to oil ratios are 808 sm3/m3 (4.53 mscf/bbl) and 510 sm3/m3 (2.86 mscf/bbl),
respectively. The gross ratio is the total amount of CO2 injection divided by the cumulative oil production.
The net CO2 to oil ratio is based on the net CO2 injection assuming that all the produced CO2 can be
recycled.
Figure 4.2.5
water flood case. The incremental recovery reaches 18.8% at the end of the WAG injection, as compared
to 9.0% from the baseline water flood case at 1.9 HCPV injection. The net incremental recovery between
the two cases is 9.8%, which would exceed 10% at the end of the chase water injection when the
incremental recovery by WAG process reaches 20.3%.
Figure 4.2.5.1: Incremental oil recovery from WAG injection as compared to baseline water flood case
4.2.6 Area Models
d for the Pembina without thief zone prototype. Area models were not develope

CO2 Enhanced Hydrocarbon Recovery: Summary Report December, 2009 Incremental Recovery and CO2 Storage Potential in Alberta
4.3 BEAVERHILL LAKE WATERFLOODED PROTOTYPE The Pengrowth operated Judy Creek BHL ‘A’ pool was selected as the prototype for Beaverhill Lake
waterflood areas. A sector approximately 1.6 sections in area, encompassing wells in parts of Sections
25, 26, 35 and 36 of TWN 63, R11 W5M, was selected for simulation. The geological model was
developed by Divestco using Pengrowth supplied 3-D grids of the geological tops of the reef. The
simulation was conducted by the Alberta Research Council.
4.3.1 Geological Model The term “Swan Hills Formation” is applied to reefal carbonate complexes and isolated reefs such as the
Judy Creek and the Swan Hills reefs in the Swan Hills area of west-central Alberta. The Swan Hills
Complex is a 100 – 120 m thick succession of restricted to shallow-water carbonates that form an
extensive carbonate bank sequence comprising several shallowing-upwards reefal cycles, each 10–15 m
thick. Each cycle is characterized by a windward, east-facing, high-energy reefal margin that separates
the low-energy reef interior from the open marine basin (figure 4.3.1.1).
SWAN HILLS
SWAN HILLS SOUTH
JUDY CREEKJUDY CREEK SOUTH
CARSON CREEK NORTHCARSON CREEK
VIRGINIA HILLS
SNIPE LAKE
GOOSE RIVER
KAYBOB
Figure 4.3.1.1: Swan Hills Complex and associated isolated Swan Hills Reefs. Source: Divestco Swan Hills Regional Model.
Alberta Research Council 4-18

CO2 Enhanced Hydrocarbon Recovery: Summary Report December, 2009 Incremental Recovery and CO2 Storage Potential in Alberta
The Judy Creek Beaverhill Lake “A” pool, discovered in 1959, is one of several large, isolated, atoll-like,
limestone oil-bearing reefs located to the north of the Swan Hills Complex (Batycky et al, 2007). The oil
pool is formed by a stratigraphic trap in the Swan Hills Formation of the Beaverhill Lake Group. The reef
has a porous organic reef margin with excellent porosity and horizontal and vertical permeability,
particularly along the high energy northeast (windward) margin. The organic reef surrounds a more
stratified interior lagoon characterized by lower porosity and permeability and poorer horizontal and
vertical reservoir continuity.
The reef is characterized by five cycles of reef growth: R1 (base), R2, R3, R4 and R5 (top). These cycles
have a back-stepping arrangement, and the cycles become progressively smaller towards the top of the
reef.
Figure 4.3.1.2: Location of Judy Creek prototype geological model (red curtain), and well control in the
model area.
The orientation of the geological model (Figure 4.3.1.2) is north-south. Cells with dimensions of 25 m x 25
m x 30 cm oriented parallel to the model boundaries were used to construct the model. Pengrowth
supplied 3-D grids of the geological tops of the entire reef which were used to construct the structural-
stratigraphic framework of the model. Pengrowth also provided 3-D rock property grids that were used to
construct the rock property model (porosity and maximum horizontal permeability). The geological model
contains 81 X 81 X 180 cells - the high degree of vertical resolution was used to capture vertical
variations in reservoir properties that will affect conformance in the reservoir. The model was exported in
RESCUE format for numerical simulation studies.
Alberta Research Council 4-19

CO2 Enhanced Hydrocarbon Recovery: Summary Report December, 2009 Incremental Recovery and CO2 Storage Potential in Alberta
4.3.2 Numerical Model The sector numerical model derived from the geological model had 31,117 grid blocks. The grid had 29 x
29 x 37 blocks in the x, y and z directions, respectively. The grid blocks were 71 m square and averaged
2.3 m in height. To the extent possible, the numerical model preserved the permeability and porosity of
the geological model. The model covers four 5-spot patterns on 32 ha (80 acre) spacing.
The wells were introduced into the model at the locations and with the connections to the grid as specified
by their completion records. Petrophysical and fluid properties provided by Pengrowth were incorporated
into the model. Figure 4.3.2.1 shows the wells in a 3-D view of the model.
Producers (Primary)PBI-0235PBI-0236PBI-0436PBI-1026PBI-1035PBI-1036PBI-1225PBI-1236
Water Injectors (EOR)IW-0235IW-0236IW-0436IW-1026IW-1035IW-1225IW-1236IW2-1025IW2-1036IW-0926
Producers (EOR)PBI-0926P0-1025P-0636P-0835P-1425P-1626
Producers (Primary)PBI-0235PBI-0236PBI-0436PBI-1026PBI-1035PBI-1036PBI-1225PBI-1236
Water Injectors (EOR)IW-0235IW-0236IW-0436IW-1026IW-1035IW-1225IW-1236IW2-1025IW2-1036IW-0926
Producers (EOR)PBI-0926P0-1025P-0636P-0835P-1425P-1626
Figure 4.3.2.1: Well development (8 primary producers – converted into water injectors, 10 water alternative gas injectors and 6 active producers during EOR).
4.3.3 History Match The field history consisted of approximately 15 years of primary depletion followed by approximately
30 years of waterflood. The main data available for history matching over this entire period were: water
and oil injection/ production rates for all of the wells. Gas production has also been measured, but at the
time of this study, gas rates were not considered reliable due to operational problems in the early days of
operations. Despite information that the area had only experienced waterflooding, it had in fact been
Alberta Research Council 4-20

CO2 Enhanced Hydrocarbon Recovery: Summary Report December, 2009 Incremental Recovery and CO2 Storage Potential in Alberta
subjected to HMCF in the period 1986-2000. The simulation was conducted assuming that the sector had
been waterflooded only. A consequence is that gas production could not be matched accurately.
A good field history match was obtained as shown in Figures 4.3.3.1 and 4.3.3.2. Oil recovery at the end
of 2007 (end of production history) was 20.4% OOIP. There is clearly good agreement between the
numerical simulation and actual field data.
Pressure (numerical)
Gas
Liquid
Water
Oil
Field (Dotted line)Numerical (Solid line)
Pressure (numerical)
Gas
Liquid
Water
Oil
Field (Dotted line)Numerical (Solid line)
Figure 4.3.3.1: History match for cumulative oil, water and gas production and the simulated average field pressure - Judy Creek sector model
Cum/ Numerical
Cum/ Field
Rate/ Numerical
Rate/ Field
Time (Date)
Cum/ Numerical
Cum/ Field
Rate/ Numerical
Rate/ Field
Time (Date)
Figure 4.3.3.2: History match for oil rate and cumulative oil production - Judy Creek sector model
Alberta Research Council 4-21
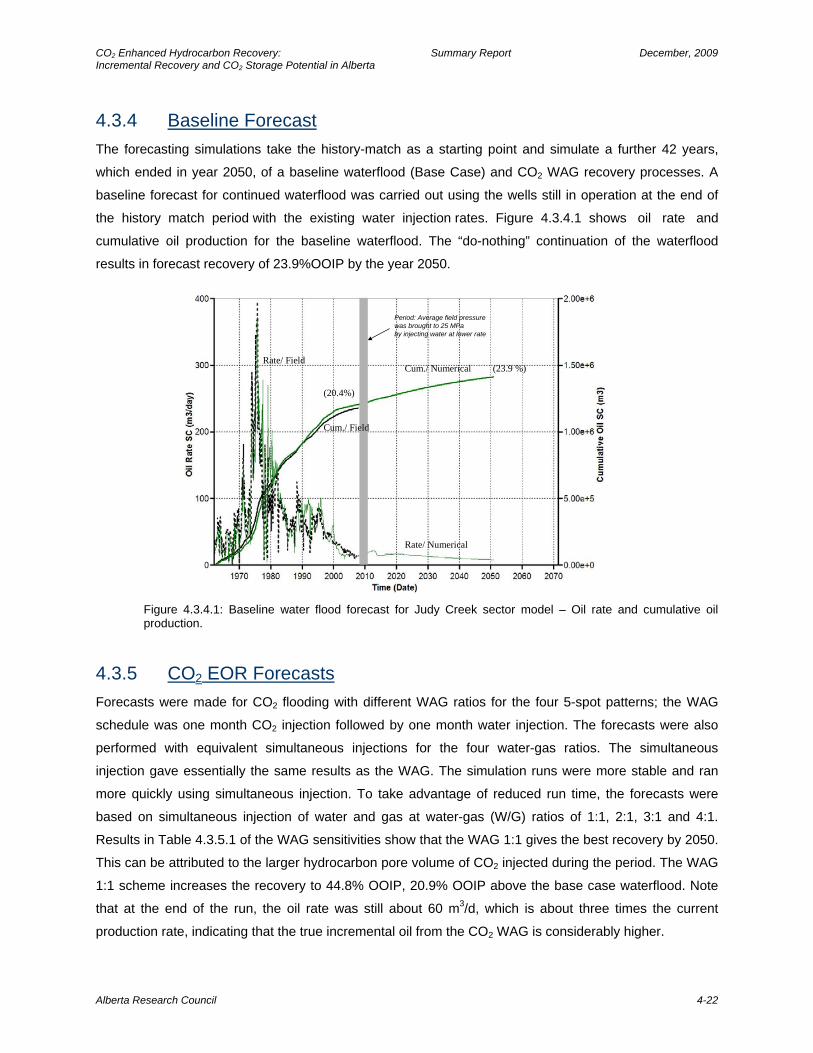
CO2 Enhanced Hydrocarbon Recovery: Summary Report December, 2009 Incremental Recovery and CO2 Storage Potential in Alberta
4.3.4 Baseline Forecast The forecasting simulations take the history-match as a starting point and simulate a further 42 years,
which ended in year 2050, of a baseline waterflood (Base Case) and CO2 WAG recovery processes. A
baseline forecast for continued waterflood was carried out using the wells still in operation at the end of
the history match period with the existing water injection rates. Figure 4.3.4.1 shows oil rate and
cumulative oil production for the baseline waterflood. The “do-nothing” continuation of the waterflood
results in forecast recovery of 23.9%OOIP by the year 2050.
Rate/ Numerical
Rate/ FieldCum./ Numerical (23.9 %)
(20.4%)
Cum./ Field
Period: Average field pressurewas brought to 25 MPaby injecting water at lower rate
Rate/ Numerical
Rate/ FieldCum./ Numerical (23.9 %)
(20.4%)
Cum./ Field
Period: Average field pressurewas brought to 25 MPaby injecting water at lower rate
Figure 4.3.4.1: Baseline water flood forecast for Judy Creek sector model – Oil rate and cumulative oil production.
4.3.5 CO2 EOR Forecasts Forecasts were made for CO2 flooding with different WAG ratios for the four 5-spot patterns; the WAG
schedule was one month CO2 injection followed by one month water injection. The forecasts were also
performed with equivalent simultaneous injections for the four water-gas ratios. The simultaneous
injection gave essentially the same results as the WAG. The simulation runs were more stable and ran
more quickly using simultaneous injection. To take advantage of reduced run time, the forecasts were
based on simultaneous injection of water and gas at water-gas (W/G) ratios of 1:1, 2:1, 3:1 and 4:1.
Results in Table 4.3.5.1 of the WAG sensitivities show that the WAG 1:1 gives the best recovery by 2050.
This can be attributed to the larger hydrocarbon pore volume of CO2 injected during the period. The WAG
1:1 scheme increases the recovery to 44.8% OOIP, 20.9% OOIP above the base case waterflood. Note
that at the end of the run, the oil rate was still about 60 m3/d, which is about three times the current
production rate, indicating that the true incremental oil from the CO2 WAG is considerably higher.
Alberta Research Council 4-22
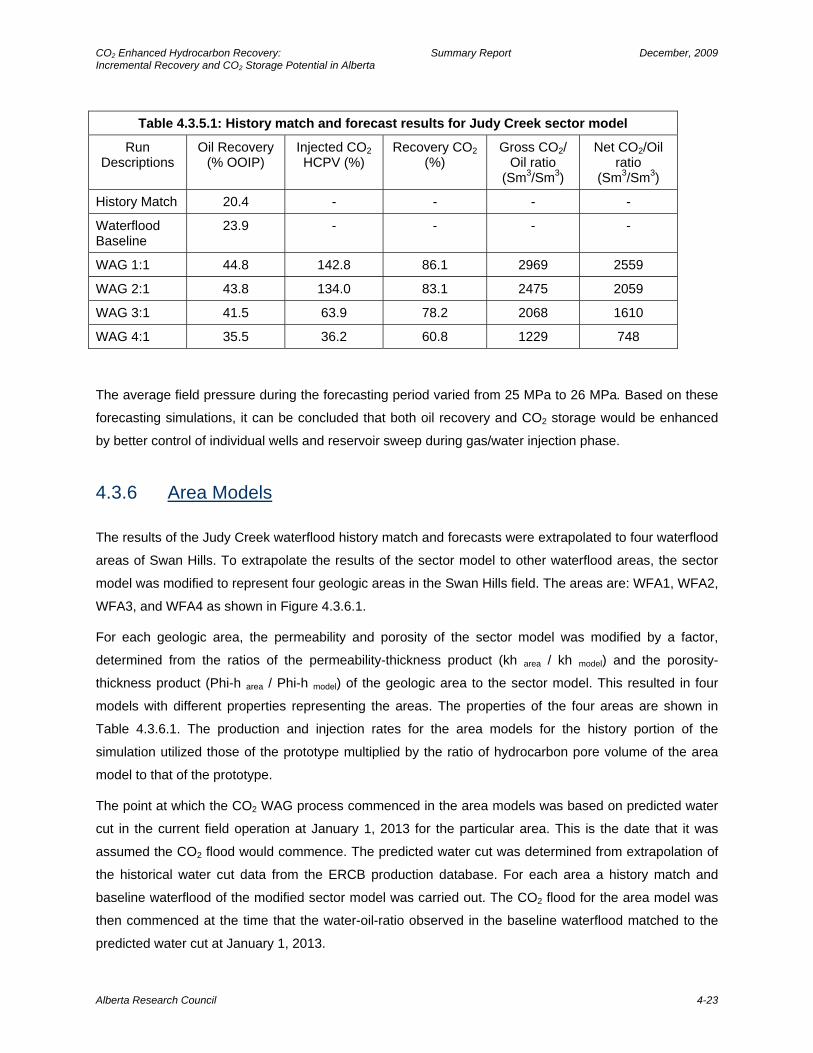
CO2 Enhanced Hydrocarbon Recovery: Summary Report December, 2009 Incremental Recovery and CO2 Storage Potential in Alberta
Table 4.3.5.1: History match and forecast results for Judy Creek sector model
Run Descriptions
Oil Recovery (% OOIP)
Injected CO2 HCPV (%)
Recovery CO2 (%)
Gross CO2/ Oil ratio
(Sm3/Sm3)
Net CO2/Oil ratio
(Sm3/Sm3)
History Match 20.4 - - - -
Waterflood Baseline
23.9 - - - -
WAG 1:1 44.8 142.8 86.1 2969 2559
WAG 2:1 43.8 134.0 83.1 2475 2059
WAG 3:1 41.5 63.9 78.2 2068 1610
WAG 4:1 35.5 36.2 60.8 1229 748
The average field pressure during the forecasting period varied from 25 MPa to 26 MPa. Based on these
forecasting simulations, it can be concluded that both oil recovery and CO2 storage would be enhanced
by better control of individual wells and reservoir sweep during gas/water injection phase.
4.3.6 Area Models
The results of the Judy Creek waterflood history match and forecasts were extrapolated to four waterflood
areas of Swan Hills. To extrapolate the results of the sector model to other waterflood areas, the sector
model was modified to represent four geologic areas in the Swan Hills field. The areas are: WFA1, WFA2,
WFA3, and WFA4 as shown in Figure 4.3.6.1.
For each geologic area, the permeability and porosity of the sector model was modified by a factor,
determined from the ratios of the permeability-thickness product (kh area / kh model) and the porosity-
thickness product (Phi-h area / Phi-h model) of the geologic area to the sector model. This resulted in four
models with different properties representing the areas. The properties of the four areas are shown in
Table 4.3.6.1. The production and injection rates for the area models for the history portion of the
simulation utilized those of the prototype multiplied by the ratio of hydrocarbon pore volume of the area
model to that of the prototype.
The point at which the CO2 WAG process commenced in the area models was based on predicted water
cut in the current field operation at January 1, 2013 for the particular area. This is the date that it was
assumed the CO2 flood would commence. The predicted water cut was determined from extrapolation of
the historical water cut data from the ERCB production database. For each area a history match and
baseline waterflood of the modified sector model was carried out. The CO2 flood for the area model was
then commenced at the time that the water-oil-ratio observed in the baseline waterflood matched to the
predicted water cut at January 1, 2013.
Alberta Research Council 4-23

CO2 Enhanced Hydrocarbon Recovery: Summary Report December, 2009 Incremental Recovery and CO2 Storage Potential in Alberta
Figure 4.3.6.1: Waterflood areas in Swan Hills to which results of Judy Creek sector model were extrapolated
Table 4.3.6.1: Well injectivity, productivity and predicted WOR for Swan Hills waterflood areas Area Wells Injectivity/well Productivity/well WOR in 2013 m3/d m3/d m3/m3 WFA1 (W) 5 600 350 50 WFA2 (NW) 22 1000 300 50 WFA3 (SW) 13 200 300 200 WFA 4 (E) 45 1000 250 50
Alberta Research Council 4-24

CO2 Enhanced Hydrocarbon Recovery: Summary Report December, 2009 Incremental Recovery and CO2 Storage Potential in Alberta
Alberta Research Council 4-25
In terms of effectiveness of waterflood in enhancing reserves, based on ERCB historical data for the
actual areas in the field, the most successful operations have been in the east area, followed by NW, SW
and west. Data for the west area, based on only 5 operating wells may not be representative when the
area is in-filled to complete various proposed patterns. Waterflood performance here was not very
promising and correspondingly, viability of EOR here may need to be closely scrutinized.
Table 4.3.6.2 summarizes the waterflood and WAG 1:1 CO2 recoveries from the area model forecasts.
Table 4.3.6.3 provides data on CO2 utilization observed in the model forecasts. Recovery of CO2 from the
area models was relatively high due to the length of time the chase water was injected, and will not be
reflective of actual field performance.
Table 4.3.6.2: Results of Area Model Forecasts
Area HCPV (106rm3)
OOIP (106sm3)
Oil Recovery at start of CO2
injection (106sm3/%OOIP)
Oil Recovery Baseline
Waterflood (106sm3/%OOIP)
Oil Recovery CO2 WAG
(106sm3/%OOIP)
Incremental CO2
Recovery over
Baseline Waterflood
%OOIP WFA1 13.3 8.89 3.01 / 33.8 3.36 / 37.8 5.07 / 57.1 19.3 WFA2 13.1 8.71 3.41 / 39.2 3.73 / 42.8 5.53 / 63.5 20.7 WFA3 11.8 7.83 2.87 / 36.7 3.21 / 41.0 4.84 / 61.8 20.8 WFA4 10.5 6.97 2.57 / 36.8 2.79 / 40.1 4.81 / 69.1 29.1
Table 4.3.6.3: CO2 Utilization in Area Model Forecasts
Area CO2 Injected
(HCPV)
CO2
Produced
(HCPV)
Gross CO2 utilization
t/m3 oil
Gross CO2 utilization
Mcf/bbl oil
WFA1 0.774 0.748 4.46 13.8
WFA2 0.69 0.653 3.77 11.6
WFA3 0.890 0.586 4.92 15.2
WFA4 0.879 0.803 3.47 10.7
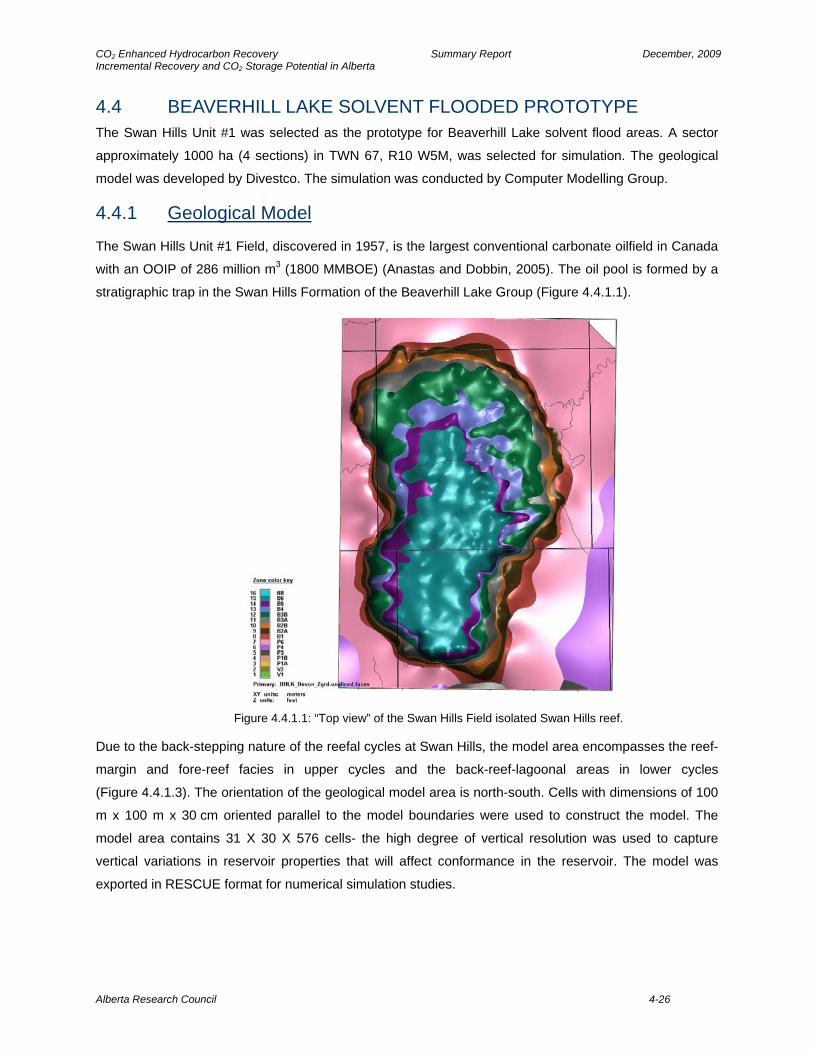
CO2 Enhanced Hydrocarbon Recovery Summary Report December, 2009 Incremental Recovery and CO2 Storage Potential in Alberta 4.4 BEAVERHILL LAKE SOLVENT FLOODED PROTOTYPE The Swan Hills Unit #1 was selected as the prototype for Beaverhill Lake solvent flood areas. A sector
approximately 1000 ha (4 sections) in TWN 67, R10 W5M, was selected for simulation. The geological
model was developed by Divestco. The simulation was conducted by Computer Modelling Group.
4.4.1 Geological Model
The Swan Hills Unit #1 Field, discovered in 1957, is the largest conventional carbonate oilfield in Canada
with an OOIP of 286 million m3 (1800 MMBOE) (Anastas and Dobbin, 2005). The oil pool is formed by a
stratigraphic trap in the Swan Hills Formation of the Beaverhill Lake Group (Figure 4.4.1.1).
Figure 4.4.1.1: “Top view” of the Swan Hills Field isolated Swan Hills reef.
Due to the back-stepping nature of the reefal cycles at Swan Hills, the model area encompasses the reef-
margin and fore-reef facies in upper cycles and the back-reef-lagoonal areas in lower cycles
(Figure 4.4.1.3). The orientation of the geological model area is north-south. Cells with dimensions of 100
m x 100 m x 30 cm oriented parallel to the model boundaries were used to construct the model. The
model area contains 31 X 30 X 576 cells- the high degree of vertical resolution was used to capture
vertical variations in reservoir properties that will affect conformance in the reservoir. The model was
exported in RESCUE format for numerical simulation studies.
Alberta Research Council 4-26
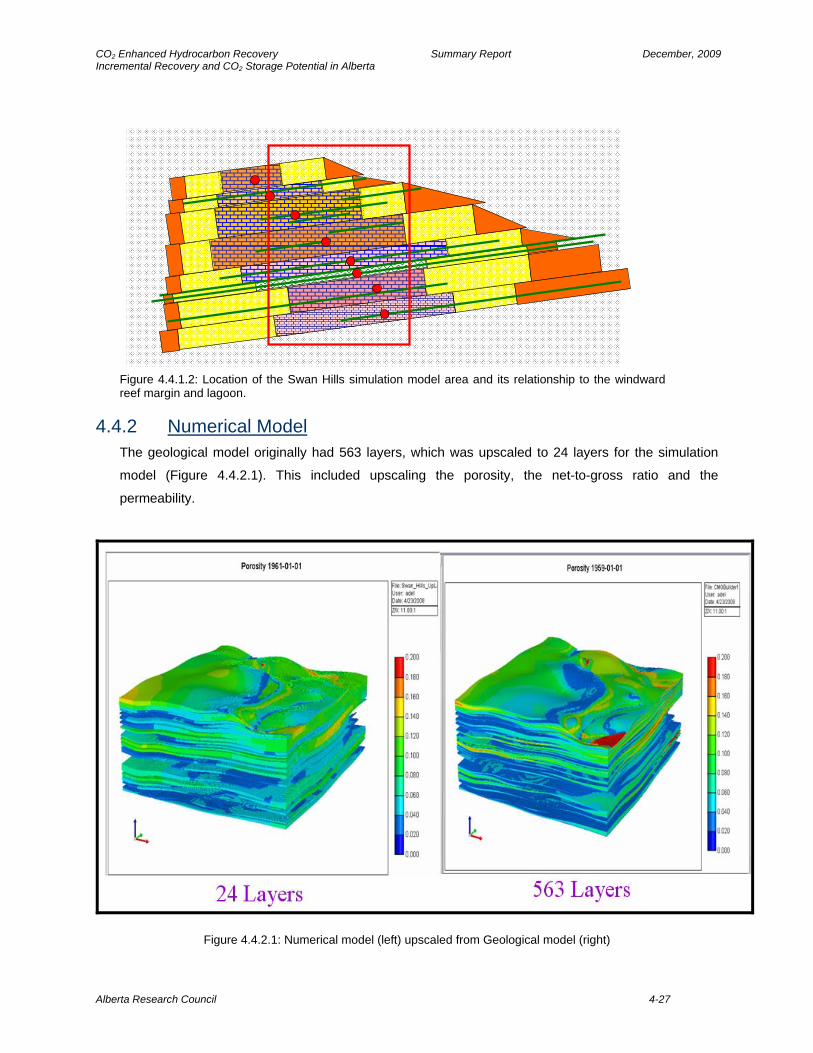
CO2 Enhanced Hydrocarbon Recovery Summary Report December, 2009 Incremental Recovery and CO2 Storage Potential in Alberta
Figure 4.4.1.2: Location of the Swan Hills simulation model area and its relationship to the windward reef margin and lagoon.
4.4.2 Numerical Model The geological model originally had 563 layers, which was upscaled to 24 layers for the simulation
model (Figure 4.4.2.1). This included upscaling the porosity, the net-to-gross ratio and the
permeability.
Figure 4.4.2.1: Numerical model (left) upscaled from Geological model (right)
Alberta Research Council 4-27
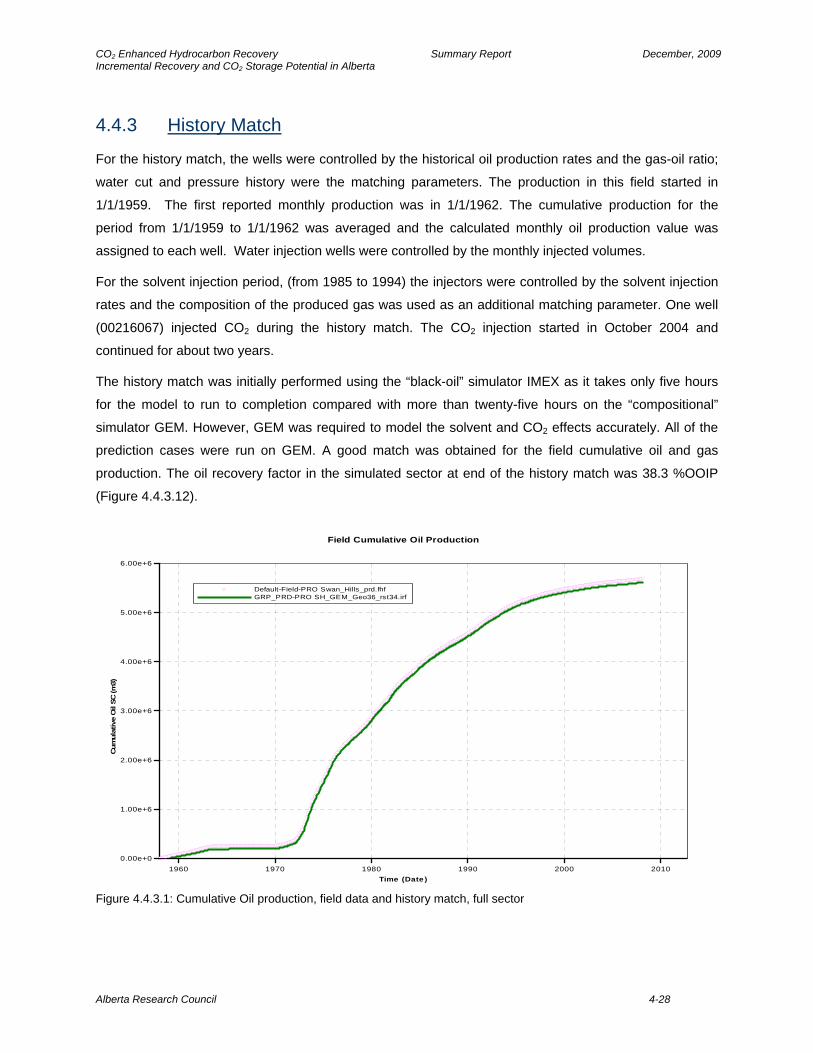
CO2 Enhanced Hydrocarbon Recovery Summary Report December, 2009 Incremental Recovery and CO2 Storage Potential in Alberta 4.4.3 History Match For the history match, the wells were controlled by the historical oil production rates and the gas-oil ratio;
water cut and pressure history were the matching parameters. The production in this field started in
1/1/1959. The first reported monthly production was in 1/1/1962. The cumulative production for the
period from 1/1/1959 to 1/1/1962 was averaged and the calculated monthly oil production value was
assigned to each well. Water injection wells were controlled by the monthly injected volumes.
For the solvent injection period, (from 1985 to 1994) the injectors were controlled by the solvent injection
rates and the composition of the produced gas was used as an additional matching parameter. One well
(00216067) injected CO2 during the history match. The CO2 injection started in October 2004 and
continued for about two years.
The history match was initially performed using the “black-oil” simulator IMEX as it takes only five hours
for the model to run to completion compared with more than twenty-five hours on the “compositional”
simulator GEM. However, GEM was required to model the solvent and CO2 effects accurately. All of the
prediction cases were run on GEM. A good match was obtained for the field cumulative oil and gas
production. The oil recovery factor in the simulated sector at end of the history match was 38.3 %OOIP
(Figure 4.4.3.12).
Field Cumulative Oil Production
Time (Date )
Cum
ulat
ive
Oil
SC (m
3)
1960 1970 1980 1990 2000 20100.00e+0
1.00e+6
2.00e+6
3.00e+6
4.00e+6
5.00e+6
6.00e+6
Default-Field-PRO Swan_Hills_prd.fhfGRP_PRD-PRO SH_GEM_Geo36_rst34.irf
Figure 4.4.3.1: Cumulative Oil production, field data and history match, full sector
Alberta Research Council 4-28
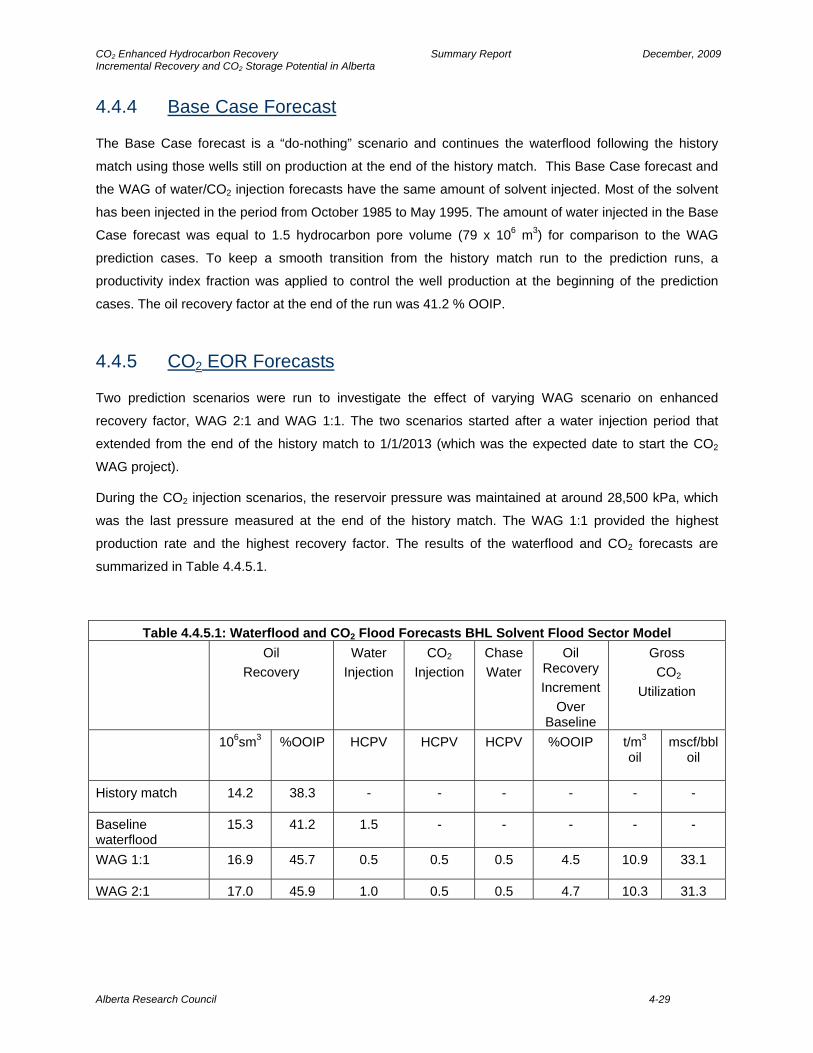
CO2 Enhanced Hydrocarbon Recovery Summary Report December, 2009 Incremental Recovery and CO2 Storage Potential in Alberta 4.4.4 Base Case Forecast
The Base Case forecast is a “do-nothing” scenario and continues the waterflood following the history
match using those wells still on production at the end of the history match. This Base Case forecast and
the WAG of water/CO2 injection forecasts have the same amount of solvent injected. Most of the solvent
has been injected in the period from October 1985 to May 1995. The amount of water injected in the Base
Case forecast was equal to 1.5 hydrocarbon pore volume (79 x 106 m3) for comparison to the WAG
prediction cases. To keep a smooth transition from the history match run to the prediction runs, a
productivity index fraction was applied to control the well production at the beginning of the prediction
cases. The oil recovery factor at the end of the run was 41.2 % OOIP.
4.4.5 CO2 EOR Forecasts
Two prediction scenarios were run to investigate the effect of varying WAG scenario on enhanced
recovery factor, WAG 2:1 and WAG 1:1. The two scenarios started after a water injection period that
extended from the end of the history match to 1/1/2013 (which was the expected date to start the CO2
WAG project).
During the CO2 injection scenarios, the reservoir pressure was maintained at around 28,500 kPa, which
was the last pressure measured at the end of the history match. The WAG 1:1 provided the highest
production rate and the highest recovery factor. The results of the waterflood and CO2 forecasts are
summarized in Table 4.4.5.1.
Table 4.4.5.1: Waterflood and CO2 Flood Forecasts BHL Solvent Flood Sector Model Oil
Recovery Water
Injection CO2
Injection Chase Water
Oil Recovery Increment
Over Baseline
Gross CO2
Utilization
106sm3
%OOIP
HCPV HCPV HCPV %OOIP t/m3 oil
mscf/bbloil
History match 14.2 38.3 - - - - - -
Baseline waterflood
15.3 41.2 1.5 - - - - -
WAG 1:1 16.9 45.7 0.5 0.5 0.5 4.5 10.9 33.1
WAG 2:1 17.0 45.9 1.0 0.5 0.5 4.7 10.3 31.3
Alberta Research Council 4-29

CO2 Enhanced Hydrocarbon Recovery Summary Report December, 2009 Incremental Recovery and CO2 Storage Potential in Alberta 4.4.6 Area Models To extrapolate the results of the sector model to other areas of the Swan Hills field, the sector model was
modified to represent five of the geologic areas in the Swan Hills field: SFA1, SFA2, SFA3, SFA6 and
SFA7 as shown in Figure 4.4.6.2. For each geologic area, the permeability and porosity of the sector
model was modified by a factor, determined from the ratios of the permeability-thickness product (kh area /
kh model) and the porosity-thickness product (Phi-h area / Phi-h model) of the geologic area to the sector
model. This resulted in five models with different properties representing the five areas.
Table 4.4.6.1: Predicted watercut and corresponding hydrocarbon solvent injection in the areal models at January 1, 2013
Area Solvent (%)
Water-oil-ratio (%)
Water Cut
HCPV 107 rm3
OOIP 107 sm3
SFA1 35 30 0.96774 6.59 4.63 SFA2 15 50 0.98039 6.59 4.63 SFA3 5 50 0.98039 6.19 4.36 SFA6 5 100 0.99009 6.43 4.53 SFA7 40 200 0.99502 8.04 5.66
Because the proposed high water cut values delayed the start date of the WAG to between 50-100 years
after the solvent injection The WAG injection was started at water cut of 0.90 instead of the predicted
water cut.
Table 4.4.6.2 shows the recovery factors obtained from the area model runs. The table of recoveries
shows that the areas exhibited very similar behaviour. The low incremental recovery in SFA6 is because
chase water could not be injected into the model. With chase water, recovery would have been similar to
the other areas.
Table 4.4.6.2: Recovery Factors of Swan Hills Solvent Area Models Oil Recovery at start
of CO2 injection Oil Recovery
Baseline Waterflood Oil Recovery CO2
WAG Area
(106sm3) (%OOIP) (106sm3) (%OOIP) (106sm3) (%OOIP)
Incremental CO2 Recovery over Baseline Waterflood
%OOIP SFA1 8.52 18.4 11.6 25.0 13.1 28.3 3.30 SFA2 8.28 17.9 11.3 24.3 12.7 27.5 3.13 SFA3 6.66 15.3 10.6 24.2 11.8 27.0 2.75 SFA6 6.93 15.3 9.69 21.4 10.6 23.5 2.08 SFA7 8.91 15.7 13.3 23.4 14.9 26.3 2.86
Significant difficulty was experienced in the simulation. It was very difficult to maintain reservoir pressure
above MMP using expected production rates; therefore productivity was constrained. Consequently the
anticipated WOR at start of the CO2 EOR was much lower than anticipated in the field. In spite of the
Alberta Research Council 4-30
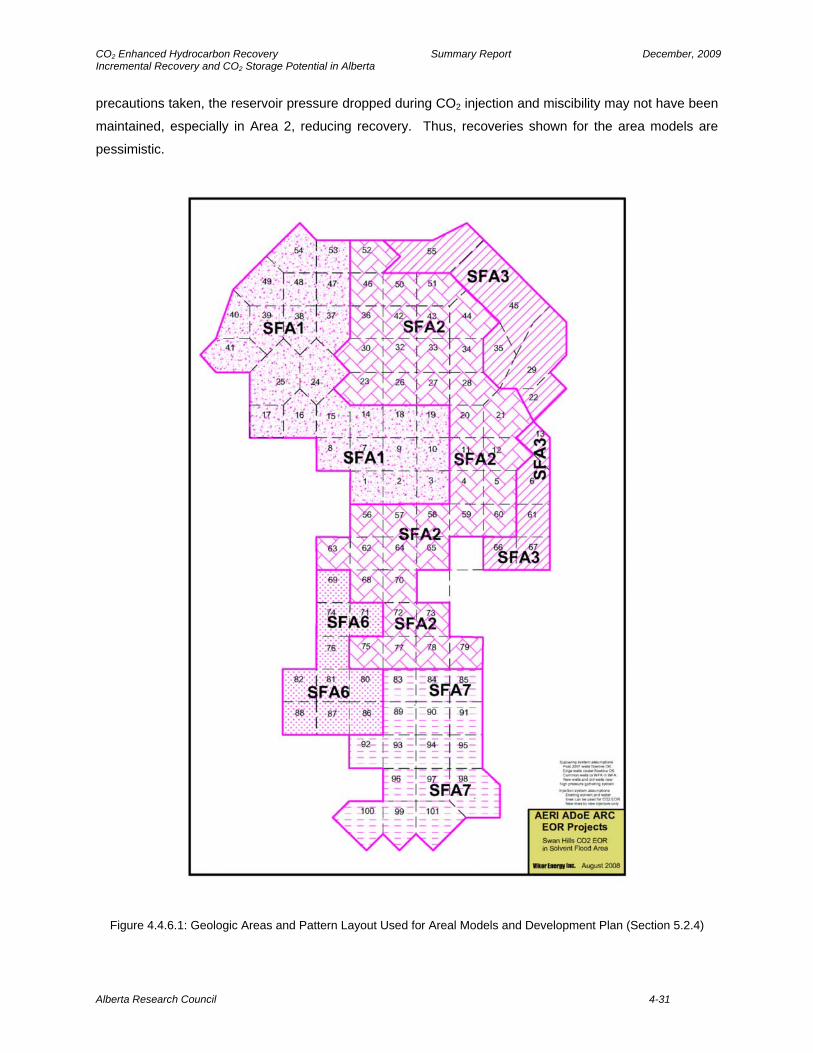
CO2 Enhanced Hydrocarbon Recovery Summary Report December, 2009 Incremental Recovery and CO2 Storage Potential in Alberta
Alberta Research Council 4-31
precautions taken, the reservoir pressure dropped during CO2 injection and miscibility may not have been
maintained, especially in Area 2, reducing recovery. Thus, recoveries shown for the area models are
pessimistic.
Figure 4.4.6.1: Geologic Areas and Pattern Layout Used for Areal Models and Development Plan (Section 5.2.4)
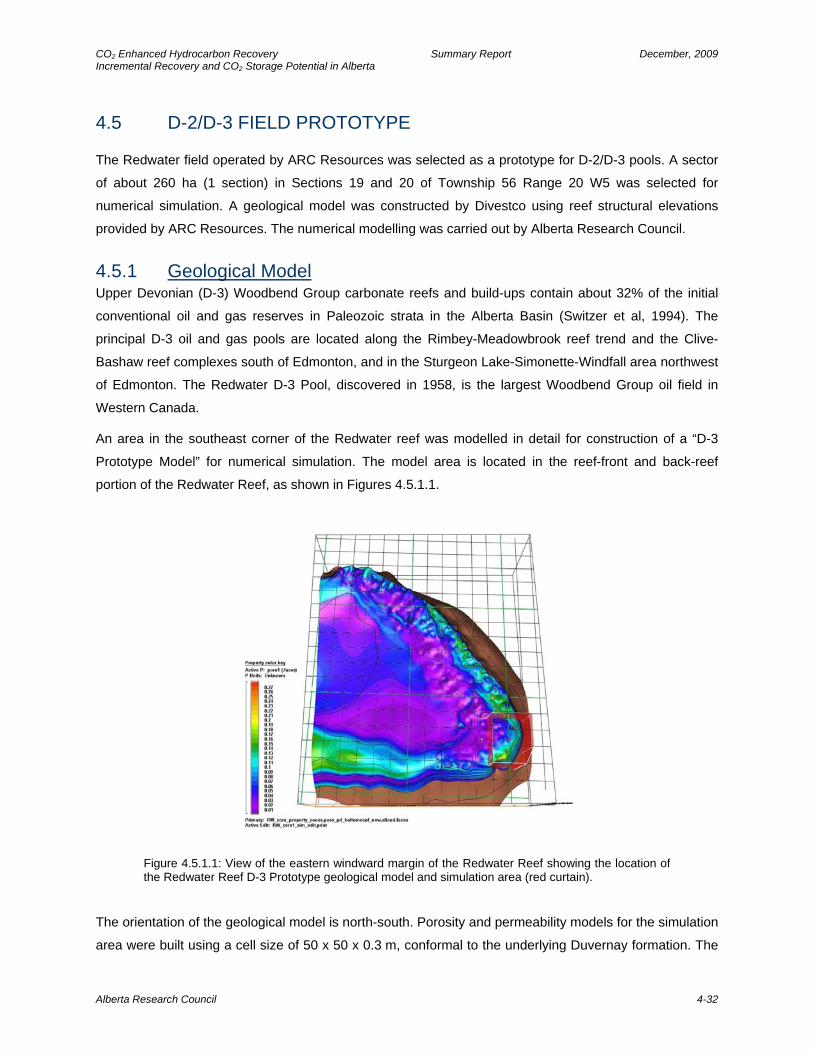
CO2 Enhanced Hydrocarbon Recovery Summary Report December, 2009 Incremental Recovery and CO2 Storage Potential in Alberta
4.5 D-2/D-3 FIELD PROTOTYPE The Redwater field operated by ARC Resources was selected as a prototype for D-2/D-3 pools. A sector
of about 260 ha (1 section) in Sections 19 and 20 of Township 56 Range 20 W5 was selected for
numerical simulation. A geological model was constructed by Divestco using reef structural elevations
provided by ARC Resources. The numerical modelling was carried out by Alberta Research Council.
4.5.1 Geological Model Upper Devonian (D-3) Woodbend Group carbonate reefs and build-ups contain about 32% of the initial
conventional oil and gas reserves in Paleozoic strata in the Alberta Basin (Switzer et al, 1994). The
principal D-3 oil and gas pools are located along the Rimbey-Meadowbrook reef trend and the Clive-
Bashaw reef complexes south of Edmonton, and in the Sturgeon Lake-Simonette-Windfall area northwest
of Edmonton. The Redwater D-3 Pool, discovered in 1958, is the largest Woodbend Group oil field in
Western Canada.
An area in the southeast corner of the Redwater reef was modelled in detail for construction of a “D-3
Prototype Model” for numerical simulation. The model area is located in the reef-front and back-reef
portion of the Redwater Reef, as shown in Figures 4.5.1.1.
Figure 4.5.1.1: View of the eastern windward margin of the Redwater Reef showing the location of the Redwater Reef D-3 Prototype geological model and simulation area (red curtain).
The orientation of the geological model is north-south. Porosity and permeability models for the simulation
area were built using a cell size of 50 x 50 x 0.3 m, conformal to the underlying Duvernay formation. The
Alberta Research Council 4-32
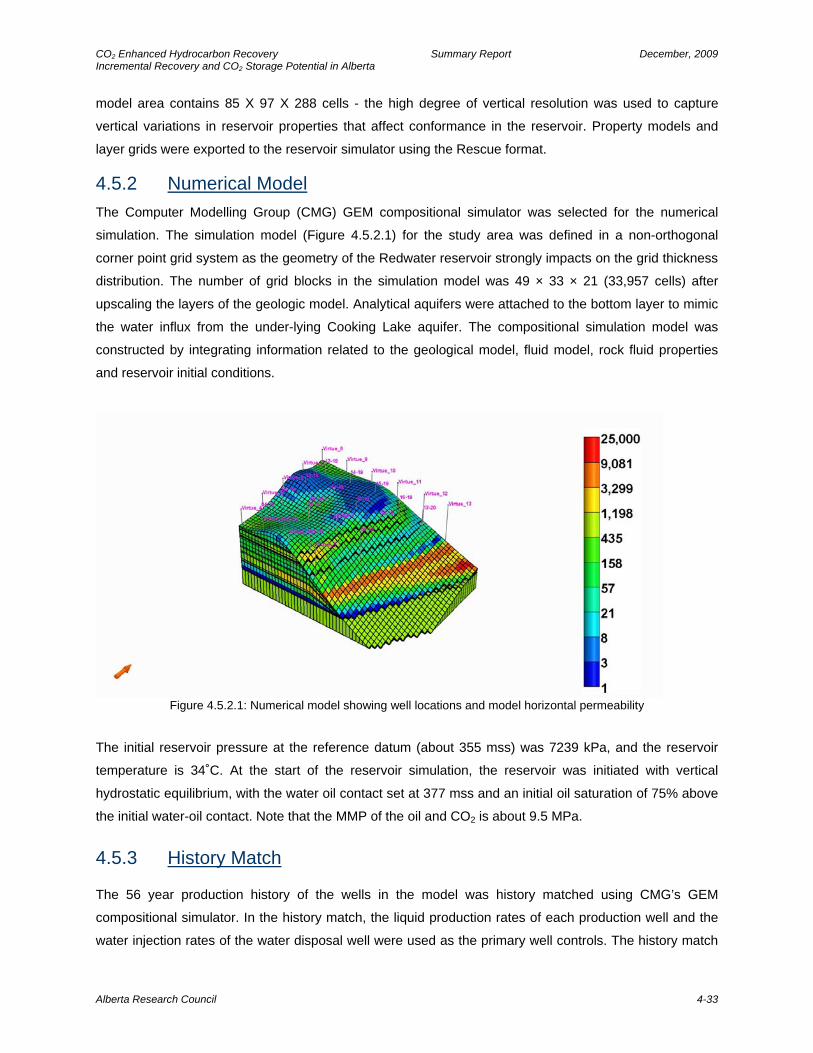
CO2 Enhanced Hydrocarbon Recovery Summary Report December, 2009 Incremental Recovery and CO2 Storage Potential in Alberta
model area contains 85 X 97 X 288 cells - the high degree of vertical resolution was used to capture
vertical variations in reservoir properties that affect conformance in the reservoir. Property models and
layer grids were exported to the reservoir simulator using the Rescue format.
4.5.2 Numerical Model The Computer Modelling Group (CMG) GEM compositional simulator was selected for the numerical
simulation. The simulation model (Figure 4.5.2.1) for the study area was defined in a non-orthogonal
corner point grid system as the geometry of the Redwater reservoir strongly impacts on the grid thickness
distribution. The number of grid blocks in the simulation model was 49 × 33 × 21 (33,957 cells) after
upscaling the layers of the geologic model. Analytical aquifers were attached to the bottom layer to mimic
the water influx from the under-lying Cooking Lake aquifer. The compositional simulation model was
constructed by integrating information related to the geological model, fluid model, rock fluid properties
and reservoir initial conditions.
Figure 4.5.2.1: Numerical model showing well locations and model horizontal permeability
The initial reservoir pressure at the reference datum (about 355 mss) was 7239 kPa, and the reservoir
temperature is 34˚C. At the start of the reservoir simulation, the reservoir was initiated with vertical
hydrostatic equilibrium, with the water oil contact set at 377 mss and an initial oil saturation of 75% above
the initial water-oil contact. Note that the MMP of the oil and CO2 is about 9.5 MPa.
4.5.3 History Match
The 56 year production history of the wells in the model was history matched using CMG’s GEM
compositional simulator. In the history match, the liquid production rates of each production well and the
water injection rates of the water disposal well were used as the primary well controls. The history match
Alberta Research Council 4-33
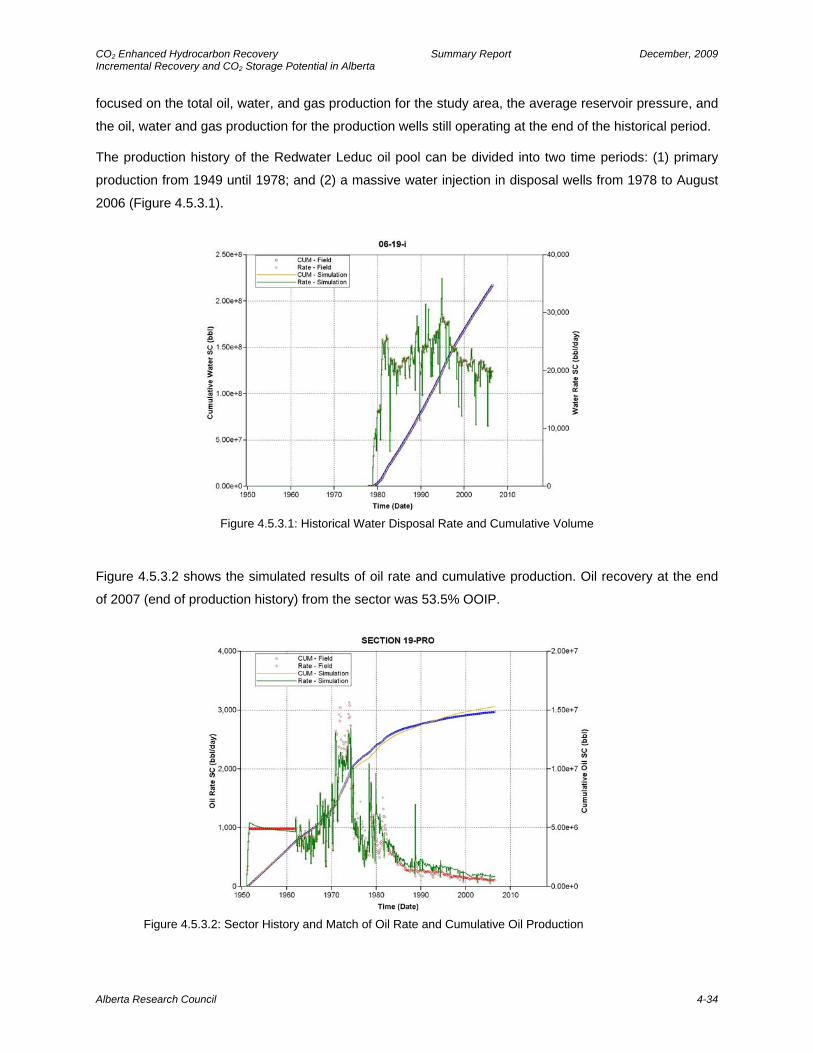
CO2 Enhanced Hydrocarbon Recovery Summary Report December, 2009 Incremental Recovery and CO2 Storage Potential in Alberta
focused on the total oil, water, and gas production for the study area, the average reservoir pressure, and
the oil, water and gas production for the production wells still operating at the end of the historical period.
The production history of the Redwater Leduc oil pool can be divided into two time periods: (1) primary
production from 1949 until 1978; and (2) a massive water injection in disposal wells from 1978 to August
2006 (Figure 4.5.3.1).
Figure 4.5.3.1: Historical Water Disposal Rate and Cumulative Volume
Figure 4.5.3.2 shows the simulated results of oil rate and cumulative production. Oil recovery at the end
of 2007 (end of production history) from the sector was 53.5% OOIP.
Figure 4.5.3.2: Sector History and Match of Oil Rate and Cumulative Oil Production
Alberta Research Council 4-34
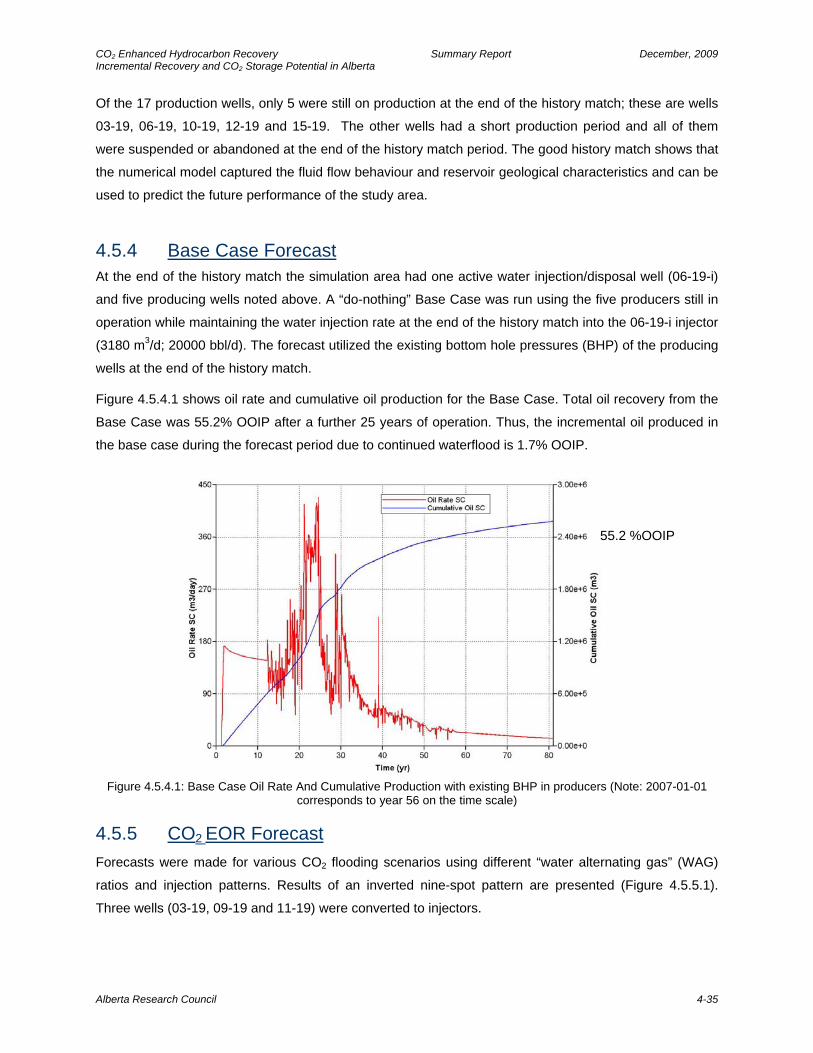
CO2 Enhanced Hydrocarbon Recovery Summary Report December, 2009 Incremental Recovery and CO2 Storage Potential in Alberta
Of the 17 production wells, only 5 were still on production at the end of the history match; these are wells
03-19, 06-19, 10-19, 12-19 and 15-19. The other wells had a short production period and all of them
were suspended or abandoned at the end of the history match period. The good history match shows that
the numerical model captured the fluid flow behaviour and reservoir geological characteristics and can be
used to predict the future performance of the study area.
4.5.4 Base Case Forecast At the end of the history match the simulation area had one active water injection/disposal well (06-19-i)
and five producing wells noted above. A “do-nothing” Base Case was run using the five producers still in
operation while maintaining the water injection rate at the end of the history match into the 06-19-i injector
(3180 m3/d; 20000 bbl/d). The forecast utilized the existing bottom hole pressures (BHP) of the producing
wells at the end of the history match.
Figure 4.5.4.1 shows oil rate and cumulative oil production for the Base Case. Total oil recovery from the
Base Case was 55.2% OOIP after a further 25 years of operation. Thus, the incremental oil produced in
the base case during the forecast period due to continued waterflood is 1.7% OOIP.
55.2 %OOIP
Figure 4.5.4.1: Base Case Oil Rate And Cumulative Production with existing BHP in producers (Note: 2007-01-01 corresponds to year 56 on the time scale)
4.5.5 CO2 EOR Forecast Forecasts were made for various CO2 flooding scenarios using different “water alternating gas” (WAG)
ratios and injection patterns. Results of an inverted nine-spot pattern are presented (Figure 4.5.5.1).
Three wells (03-19, 09-19 and 11-19) were converted to injectors.
Alberta Research Council 4-35
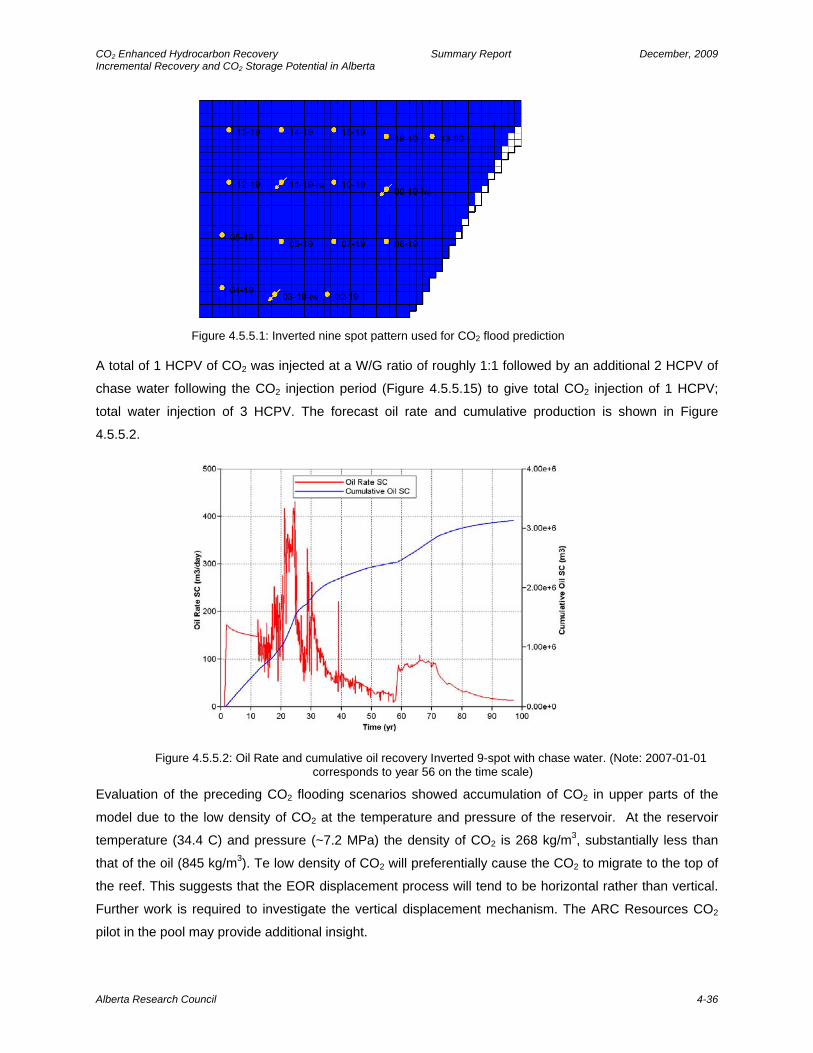
CO2 Enhanced Hydrocarbon Recovery Summary Report December, 2009 Incremental Recovery and CO2 Storage Potential in Alberta
Figure 4.5.5.1: Inverted nine spot pattern used for CO2 flood prediction
A total of 1 HCPV of CO2 was injected at a W/G ratio of roughly 1:1 followed by an additional 2 HCPV of
chase water following the CO2 injection period (Figure 4.5.5.15) to give total CO2 injection of 1 HCPV;
total water injection of 3 HCPV. The forecast oil rate and cumulative production is shown in Figure
4.5.5.2.
Figure 4.5.5.2: Oil Rate and cumulative oil recovery Inverted 9-spot with chase water. (Note: 2007-01-01
corresponds to year 56 on the time scale)
Evaluation of the preceding CO2 flooding scenarios showed accumulation of CO2 in upper parts of the
model due to the low density of CO2 at the temperature and pressure of the reservoir. At the reservoir
temperature (34.4 C) and pressure (~7.2 MPa) the density of CO2 is 268 kg/m3, substantially less than
that of the oil (845 kg/m3). Te low density of CO2 will preferentially cause the CO2 to migrate to the top of
the reef. This suggests that the EOR displacement process will tend to be horizontal rather than vertical.
Further work is required to investigate the vertical displacement mechanism. The ARC Resources CO2
pilot in the pool may provide additional insight.
Alberta Research Council 4-36

CO2 Enhanced Hydrocarbon Recovery Summary Report December, 2009 Incremental Recovery and CO2 Storage Potential in Alberta
4.5.6 Area Models The Redwater Reef Model was used to derive geological parameters for conducting numerical simulation
sensitivity studies designed to extend the results of the numerical simulation from the Redwater sector
simulation area to the remainder of the pool. To derive the sensitivity study parameters, the Redwater
Pool was divided into three sectors corresponding to the Reef Front, Back Reef and Lagoon. The location
of these facies polygons is shown in Figure 4.5.6.1.
Front of reefBack Reef
Lagoon
Figure 4.5.6.1: “Top View” of the Redwater Reef Model showing the Reef Front, Back Reef and Lagoon facies polygons (in red) and permeability of the uppermost model layer. Note the correspondence between areas of good reservoir quality and the Reef Front, and to a lesser degree with the Back Reef.
The Redwater sector model was modified by adjusting the k-h and k-φ ratios of the sector model to match
the average geological parameters of the three areas The resulting area models were used to generate a
base case waterflood and a WAG 1:1 CO2 flood scenario for each area to feed into the development plan.
The CO2 injection was started when the producing water cut reached a certain level. The water cut
criterion was based on extrapolation of the area water-oil-ratio from the historical production behaviour of
the wells in each area of interest to the year 2013, the date that it is anticipated the CO2 flood would
commence. The water cut criterion was calculated for each area from the water-oil-ratio expected in the
year 2013, the assumed start of the CO2 flood, as WC=WOR/(WOR+1). Table 4.5.6.1 provides the
summary of the historical data. Table 4.5.6.2 summarizes the waterflood and WAG 1:1 CO2 recoveries
from the area model forecasts. Table 4.5.6.3 provides data on CO2 utilization observed in the model
forecasts.
Alberta Research Council 4-37
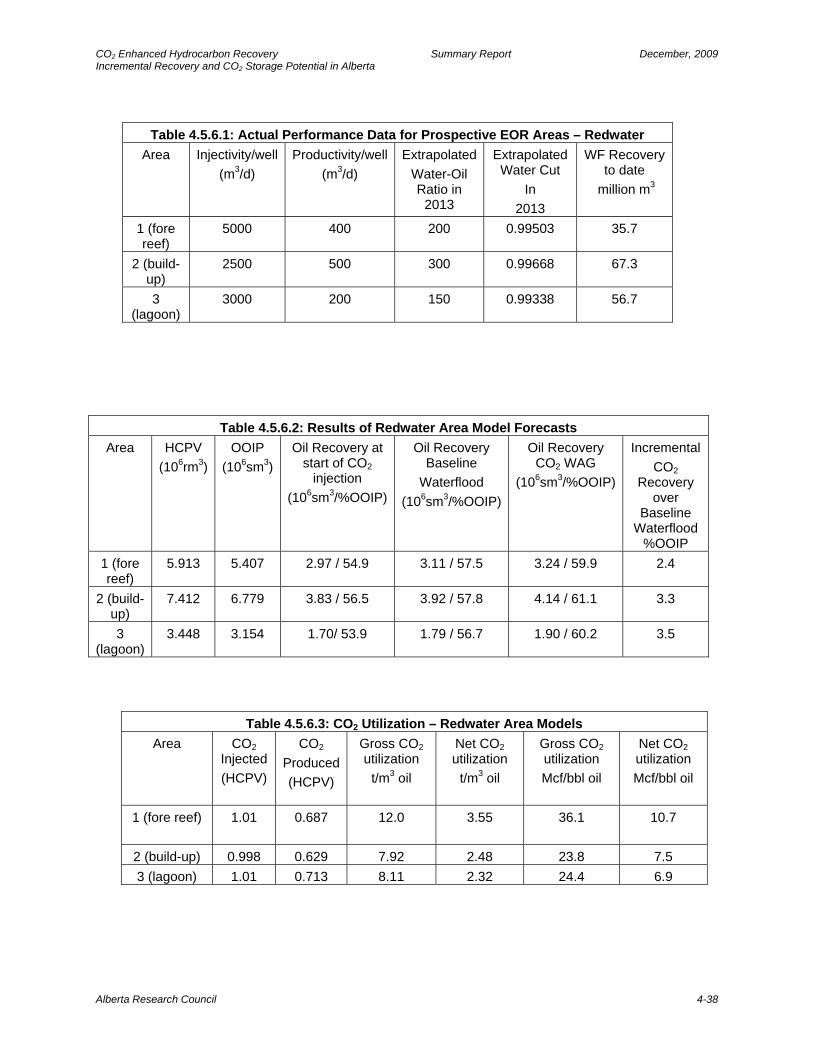
CO2 Enhanced Hydrocarbon Recovery Summary Report December, 2009 Incremental Recovery and CO2 Storage Potential in Alberta
Alberta Research Council 4-38
Table 4.5.6.1: Actual Performance Data for Prospective EOR Areas – Redwater Area Injectivity/well
(m3/d) Productivity/well
(m3/d) Extrapolated
Water-Oil Ratio in
2013
Extrapolated Water Cut
In 2013
WF Recovery to date
million m3
1 (fore reef)
5000 400 200 0.99503 35.7
2 (build-up)
2500 500 300 0.99668 67.3
3 (lagoon)
3000 200 150 0.99338 56.7
Table 4.5.6.2: Results of Redwater Area Model Forecasts Area HCPV
(106rm3) OOIP
(106sm3) Oil Recovery at
start of CO2 injection
(106sm3/%OOIP)
Oil Recovery Baseline
Waterflood (106sm3/%OOIP)
Oil Recovery CO2 WAG
(106sm3/%OOIP)
Incremental CO2
Recovery over
Baseline Waterflood
%OOIP 1 (fore reef)
5.913 5.407 2.97 / 54.9 3.11 / 57.5 3.24 / 59.9 2.4
2 (build-up)
7.412 6.779 3.83 / 56.5 3.92 / 57.8 4.14 / 61.1 3.3
3 (lagoon)
3.448 3.154 1.70/ 53.9 1.79 / 56.7 1.90 / 60.2 3.5
Table 4.5.6.3: CO2 Utilization – Redwater Area Models Area CO2
Injected (HCPV)
CO2 Produced(HCPV)
Gross CO2 utilization
t/m3 oil
Net CO2 utilization
t/m3 oil
Gross CO2 utilization Mcf/bbl oil
Net CO2 utilization Mcf/bbl oil
1 (fore reef) 1.01 0.687
12.0 3.55 36.1 10.7
2 (build-up) 0.998 0.629 7.92 2.48 23.8 7.5 3 (lagoon) 1.01 0.713 8.11 2.32 24.4 6.9

CO2 Enhanced Hydrocarbon Recovery Summary Report December, 2009 Incremental Recovery and CO2 Storage Potential in Alberta
5. DEVELOPMENT PLANS FOR PROTOTYPES Development plans were prepared for the five prototype pools using Vikor’s “Pattern Development Model”
(Appendix 1). Using existing wells and new wells where required, well patterns were prepared for each
prototype pool to fully develop a CO2 flood in the prototype pool. The Pattern Development Model is used
to assess development scenarios by starting new patterns to fully utilize available purchased and
produced CO2 within the limits of injectivity and productivity of the operating patterns.
5.1 DEVELOPMENT PLAN COST FACTORS Well cost factors for well drilling, completion and conversion for the prototype pools were developed by
Silvertip Ventures. Unit cost factors for gas processing were derived from capital and operating cost
estimates prepared by SNC Lavalin (SNC). SNC prepared two cases: a full produced gas recycle case
with no separation of CO2 from other produced gases and a recycle case in which CO2 is separated from
produced gases prior to reinjection. Pengrowth, the Judy Creek Gas Conservation System operator,
provided input into the estimates. The SNC report is provided as Appendix 2.
5.2 DEVELOPMENT PLANS 5.2.1 Pembina Cardium with thief zone (conglomerate), North Pembina
Cardium Unit 1 The prototype for Pembina with a thief zone utilized the better area of the North Pembina Cardium Unit #1
(NPCU#1). For the purpose of creating development plans, the North Pembina Cardium Unit has been
divided into 8 areas (Figure 5.2.1.1). The areal breakdown, outlined in blue, is that used by ARC
Resources. These areas have been further truncated, outlined in red, to include the “thief zone” area and
to simplify the development plan calculations by bounding them with lines of injectors, so that there is no
outflow of oil or CO2 from the areas to be accounted for in the development plan.
Areas 4, 5 and 8 are the best parts of prospective EOR areas within NPCU/ PCU #20. In the
development scenario presented here, Areas 1 & 7 were excluded because of low well injectivity/
productivity indicative of the lack of a thief zone and also to avoid the river.
The production forecast is based on fractional flow curves derived from model sensitivity studies
representative of the six polygons in the development area for continued waterflood using current strategy
to a WOR of 200 and CO2 EOR at a WAG ratio of 2:1. The EOR project development plan used existing
vertical wells on 32 ha (80 acre) per well spacing for injection into all zones and the existing vertical
production wells completed in all zones plus new 600 m horizontal wells competed only in sand 4. The
forecasts were utilized as developed by the simulation study without any risk factors.
The concept was that the area is productivity limited with restricted communication between sand 4 and
the upper sand 5/6 and conglomerate. By injecting into all zones and limiting production from the sand 5/6
and conglomerate, pressure should be higher in the upper zone promoting injection into the higher oil
saturation sand 4. In addition new horizontal water injection wells were drilled at the end of the on-trend
Alberta Research Council 5-1
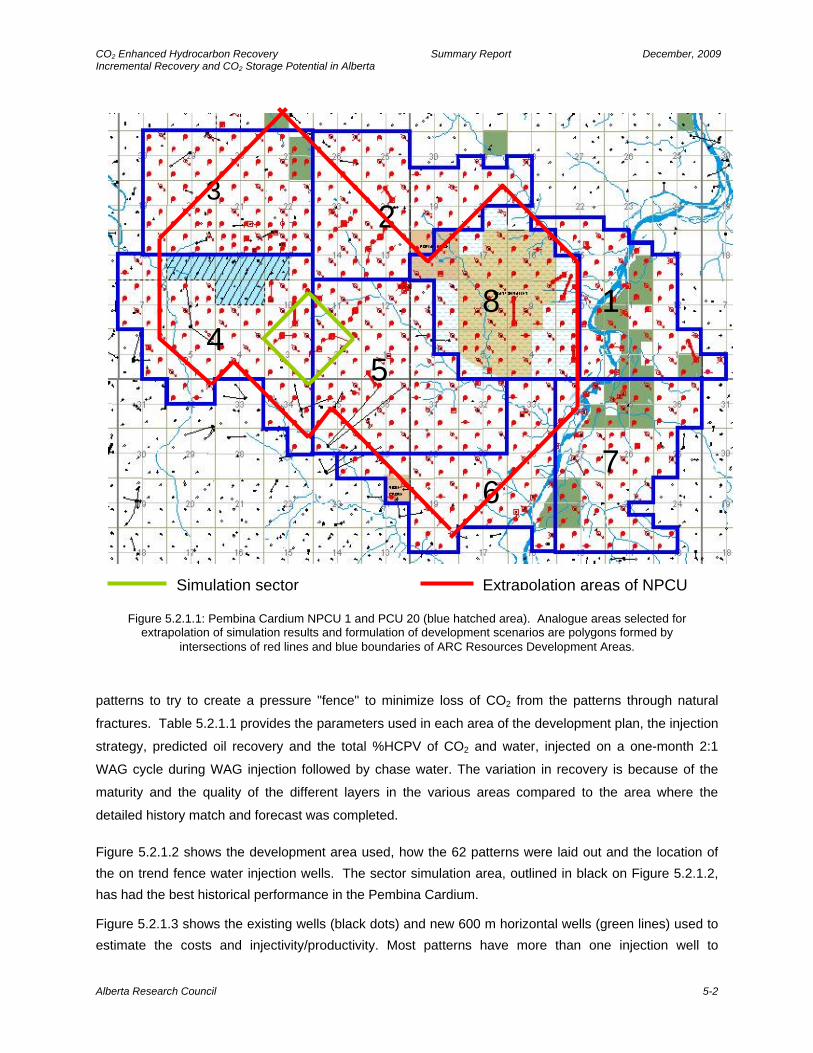
CO2 Enhanced Hydrocarbon Recovery Summary Report December, 2009 Incremental Recovery and CO2 Storage Potential in Alberta
Figure 5.2.1.1: Pembina Cardium NPCU 1 and PCU 20 (blue hatched area). Analogue areas selected for extrapolation of simulation results and formulation of development scenarios are polygons formed by
intersections of red lines and blue boundaries of ARC Resources Development Areas.
patterns to try to create a pressure "fence" to minimize loss of CO2 from the patterns through natural
fractures. Table 5.2.1.1 provides the parameters used in each area of the development plan, the injection
strategy, predicted oil recovery and the total %HCPV of CO2 and water, injected on a one-month 2:1
WAG cycle during WAG injection followed by chase water. The variation in recovery is because of the
maturity and the quality of the different layers in the various areas compared to the area where the
detailed history match and forecast was completed.
Figure 5.2.1.2 shows the development area used, how the 62 patterns were laid out and the location of the on trend fence water injection wells. The sector simulation area, outlined in black on Figure 5.2.1.2, has had the best historical performance in the Pembina Cardium.
Figure 5.2.1.3 shows the existing wells (black dots) and new 600 m horizontal wells (green lines) used to estimate the costs and injectivity/productivity. Most patterns have more than one injection well to
1 8
23
4 5
67
ExtraSimulation sector polation areas of NPCU
Alberta Research Council 5-2

CO2 Enhanced Hydrocarbon Recovery Summary Report December, 2009 Incremental Recovery and CO2 Storage Potential in Alberta
accommodate the horizontal well geometry. The project utilized 171 existing vertical injection wells and 22 new drilled horizontal water fence wells for injection into all layers. One hundred and sixteen new horizontal production wells and 188 existing production wells are utilized. The less productive layers in all wells would be stimulated to enhance processing rates. The forecast assumes all wells stay on production for the life of the patterns.
Table 5.2.1.1 Pembina Cardium Thief Zone CO2 EOR
Development Plan Parameters & Performance Predicted Recovery
Area Hz. Well Productivity OOIP % HCPV Injected
% OOIP
(m3/d) e3m3 CO2 Total WF Base W/F EOR
2 77 9,104 52% 251% 251% 8.6% 18.1% 3 31 6,232 51% 251% 251% 13.3% 17.9% 4 96 10,520 51% 251% 251% 9.2% 14.0% 5 37 23,276 50% 251% 251% 5.3% 18.0% 6 20 3,962 49% 251% 251% 11.6% 9.3% 8 20 17,191 51% 251% 251% 10.0% 17.6%
total 70,285 total million barrels 442
Figure 5.2.1.2: Layout of patterns for development plan showing the fence water injectors
Figure 5.2.1.4 shows a new gathering system (in black) that goes to all production wells and CO2 injection
lines (in red) to all WAG injectors. It was assumed that the existing waterflood system was adequate. A
Alberta Research Council 5-3
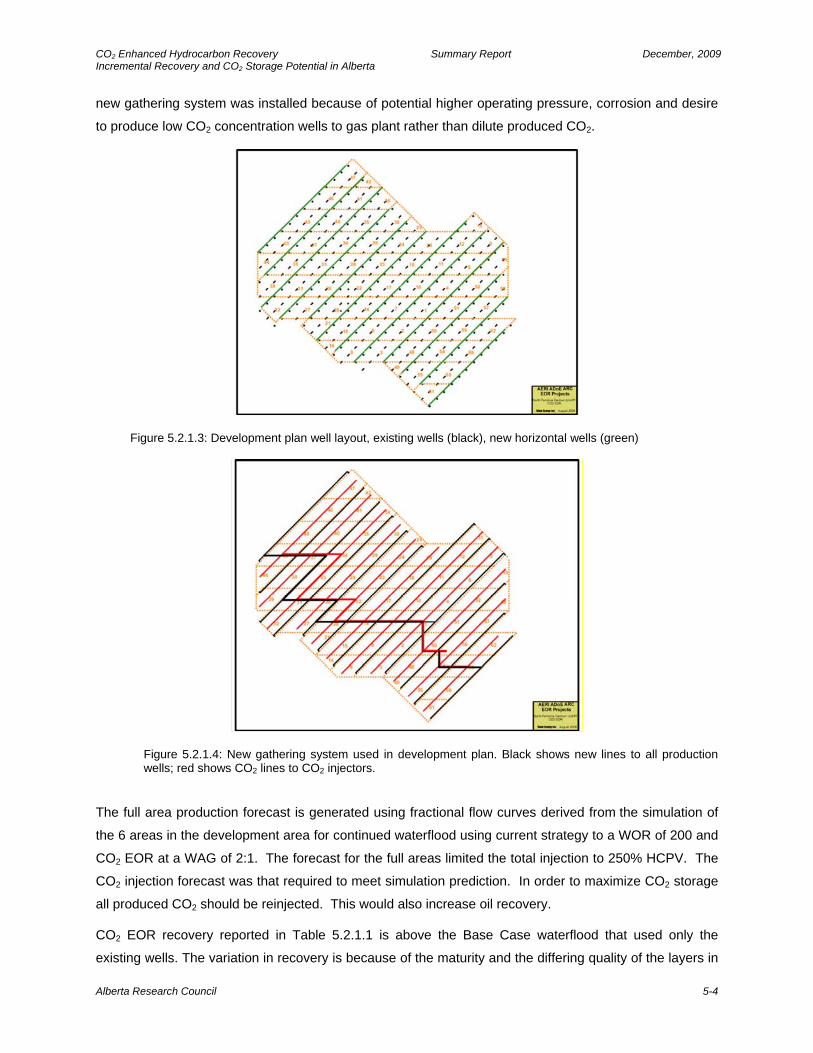
CO2 Enhanced Hydrocarbon Recovery Summary Report December, 2009 Incremental Recovery and CO2 Storage Potential in Alberta
new gathering system was installed because of potential higher operating pressure, corrosion and desire
to produce low CO2 concentration wells to gas plant rather than dilute produced CO2.
Figure 5.2.1.3: Development plan well layout, existing wells (black), new horizontal wells (green)
Figure 5.2.1.4: New gathering system used in development plan. Black shows new lines to all production wells; red shows CO2 lines to CO2 injectors.
The full area production forecast is generated using fractional flow curves derived from the simulation of
the 6 areas in the development area for continued waterflood using current strategy to a WOR of 200 and
CO2 EOR at a WAG of 2:1. The forecast for the full areas limited the total injection to 250% HCPV. The
CO2 injection forecast was that required to meet simulation prediction. In order to maximize CO2 storage
all produced CO2 should be reinjected. This would also increase oil recovery.
CO2 EOR recovery reported in Table 5.2.1.1 is above the Base Case waterflood that used only the
existing wells. The variation in recovery is because of the maturity and the differing quality of the layers in
Alberta Research Council 5-4
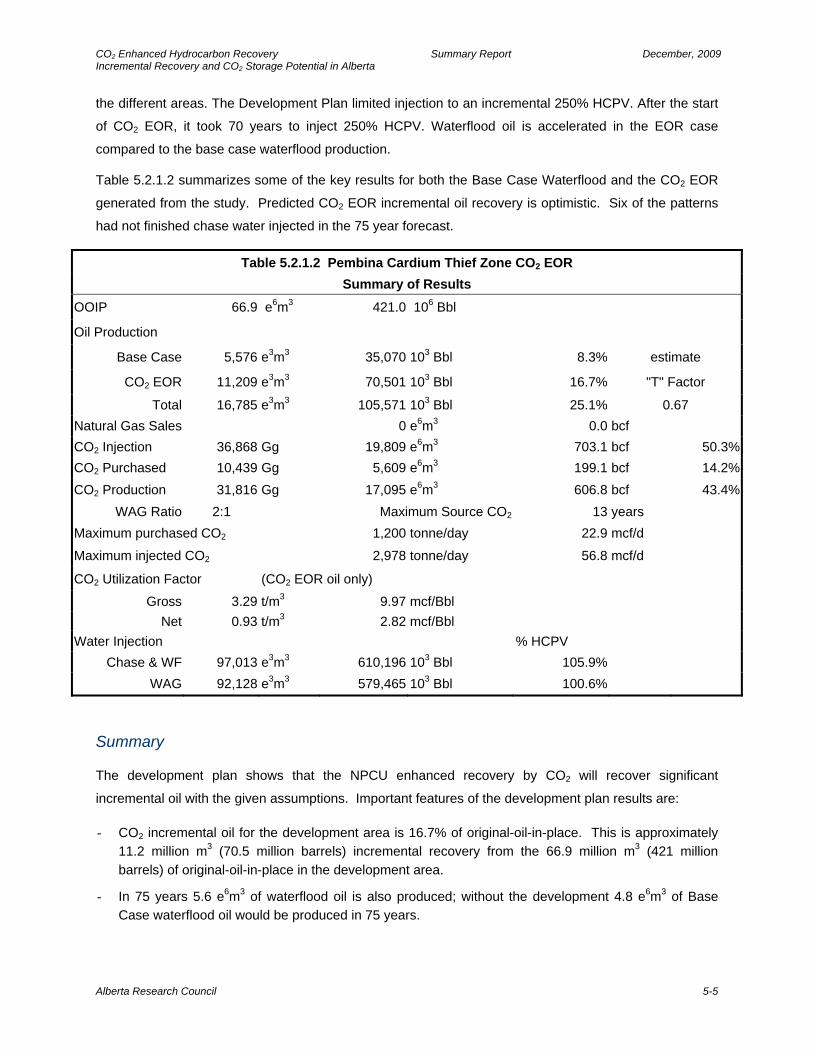
CO2 Enhanced Hydrocarbon Recovery Summary Report December, 2009 Incremental Recovery and CO2 Storage Potential in Alberta
the different areas. The Development Plan limited injection to an incremental 250% HCPV. After the start
of CO2 EOR, it took 70 years to inject 250% HCPV. Waterflood oil is accelerated in the EOR case
compared to the base case waterflood production.
Table 5.2.1.2 summarizes some of the key results for both the Base Case Waterflood and the CO2 EOR
generated from the study. Predicted CO2 EOR incremental oil recovery is optimistic. Six of the patterns
had not finished chase water injected in the 75 year forecast.
Table 5.2.1.2 Pembina Cardium Thief Zone CO2 EOR Summary of Results
OOIP 66.9 e6m3 421.0 106 Bbl
Oil Production
Base Case 5,576 e3m3 35,070 103 Bbl 8.3% estimate
CO2 EOR 11,209 e3m3 70,501 103 Bbl 16.7% "T" Factor
Total 16,785 e3m3 105,571 103 Bbl 25.1% 0.67 Natural Gas Sales 0 e6m3 0.0 bcf CO2 Injection 36,868 Gg 19,809 e6m3 703.1 bcf 50.3%CO2 Purchased 10,439 Gg 5,609 e6m3 199.1 bcf 14.2%CO2 Production 31,816 Gg 17,095 e6m3 606.8 bcf 43.4%
WAG Ratio 2:1 Maximum Source CO2 13 years Maximum purchased CO2 1,200 tonne/day 22.9 mcf/d
Maximum injected CO2 2,978 tonne/day 56.8 mcf/d
CO2 Utilization Factor (CO2 EOR oil only)
Gross 3.29 t/m3 9.97 mcf/Bbl Net 0.93 t/m3 2.82 mcf/Bbl Water Injection % HCPV
Chase & WF 97,013 e3m3 610,196 103 Bbl 105.9% WAG 92,128 e3m3 579,465 103 Bbl 100.6%
Summary
The development plan shows that the NPCU enhanced recovery by CO2 will recover significant
incremental oil with the given assumptions. Important features of the development plan results are:
- CO2 incremental oil for the development area is 16.7% of original-oil-in-place. This is approximately 11.2 million m3 (70.5 million barrels) incremental recovery from the 66.9 million m3 (421 million barrels) of original-oil-in-place in the development area.
- In 75 years 5.6 e6m3 of waterflood oil is also produced; without the development 4.8 e6m3 of Base Case waterflood oil would be produced in 75 years.
Alberta Research Council 5-5

CO2 Enhanced Hydrocarbon Recovery Summary Report December, 2009 Incremental Recovery and CO2 Storage Potential in Alberta
Alberta Research Council 5-6
- Gross CO2 utilization factor was 3.29 tonne/m3 (10.0 mcf/bbl) of incremental oil; net utilization factor was 0.93 tonne/m3 (2.82 mcf/bbl).
- Source CO2 is required for 32 years, 13 years at maximum rate of 1,200 tonne per day.
- CO2 injection is that required to meet the forecast; if all produced CO2 were injected, 10.4 million tonnes would be stored. Considering that this is best area of Pembina, this is not a large amount of stored CO2.
Risk Factors
A number of risk factors exist:
1. In the numerical simulation of NPCU, production from the top conglomerate zone was
controlled in order to achieve better sweep and recovery from the lower zones (which contain
the bulk of the OOIP). The ability to control the flow of CO2 into the conglomerate is
uncertain and introduces risk that the field may not perform as predicted by the simulation
and development plan. In addition, the integrity of the shale and impacts of the vertical
fractured wells are unknowns. These factors may be mitigated by improvements in horizontal
well drilling and fracturing technology in the years preceding the start of the CO2 flood. At this
stage the highest probability that could be assigned is an 80% chance of success with this
approach. The ARC Resources CO2 pilot in Pembina may help to assess this risk.
2. Can the productivity of the horizontal wells running in the off trend direction be achieved and
sustained and fracturing into the upper zones be prevented? Once significant volumes of
CO2 are produced, well bottom hole producing pressure must be kept high to minimize Joule-
Thompson cooling, further impacting productivity (80% chance of success at the most).
3. Processing rate for injection/production in much of the Pembina area is low. The risk is that
there may not be enough productivity and injectivity in any but the best areas of Pembina to
complete the project in a reasonable time. The numerical simulation required significant time
to inject the required volumes of CO2. That can significantly impact project economics.
4. Can we flood off trend from the line drives and contain the CO2 in the pattern with the fence
wells (80% chance of success at the most).
Even if each of the above has an optimistic 80% chance of success, overall chance is only about 50%.
Perhaps other mitigation procedures such as field piloting, testing of long horizontal wells in Sand 4 and
successfully stimulating with multiple fractures, and staging of the project can help further reduce
technical risks.

CO2 Enhanced Hydrocarbon Recovery Summary Report December, 2009 Incremental Recovery and CO2 Storage Potential in Alberta
5.2.2 Pembina without thief zone (no conglomerate) The prototype for Pembina Cardium without a thief zone utilized the area surrounding the Penn West CO2
Pilot in the “A” Lease (Area 2) and the better portion of Cyn Pem Unit #3 (Area 1). The area covered
8,430 ha; see Table 5.2.2.1 for other parameters used for Cyn Pem Unit #3 (Area 1) and “A” Lease (Area
2). The production forecast for both Base Case waterflood and CO2 EOR are based on black oil
modelling using Eclipse 100 simulator. The forecasts were utilized as developed without any risk factors;
the CO2 EOR recovery is realistic. The low WOR after 50 years of waterflood operation illustrates the very
low processing rate and significant remaining oil recovery is expected, although the predicted 23.9% may
be optimistic.
Table 5.2.2.1 Pembina Cardium No Thief Zone CO2 EOR Development Plan Parameters Area Performance Productivity/well Recovery
Area Injectivity per well vertical horizontal
OOIP Predict WOR
Recovery to date % HCPV Inject
% OOIP (Rm3/d) (Rm3/d) e3m3 2013 e3m3 OOIP CO2 Total WF Base EOR1 35 2 50 29,245 1.9 5,690 19.5% 99.1% 300% 300% 23.9% 13.0%2 50 4 75 30,482 4.0 6,559 23.1% 99.1% 300% 300% 23.9% 13.0%
Total 59,727 12,249 21.2%
total millions barrels 375.7 77.0
The EOR project was developed as a line drive with vertical injection wells on 16 ha (40 acre) per well
spacing for injection into all zones and new 1,200 m horizontal wells between the injectors, completed in
the middle of sand 4 with fractures to the other layers. Because the area is very productivity limited the
Development Plan utilized infill drilling to tight spacing (20 acre spacing per well). In addition, new
horizontal water injection wells were drilled at the end of the on trend patterns to try to create a pressure
"fence" to minimize loss of CO2 from the patterns through natural fractures. All of the trend patterns are
developed together to use the fence wells before adjacent off trend patterns are developed.
The EOR recovery project benefits from two factors, a very significant acceleration of oil production and
good incremental recovery from CO2 injection. The modelling indicated that almost 1,000 years of
operation would be required to reach the economic limit with current wells; only 8.4% HCPV of water was
injected in 75 years in the Base Case waterflood. A very large amount of capital is involved in developing
the area to achieve an acceptable processing rate; the development plan was not optimized.
Figure 5.2.2.1 shows the development area used and the 87 patterns that were laid out, as well as the
on-trend fence water injection wells. Area 1 is in the northwest in Twp 49 Rge 10 (Cyn Pem Unit #3) and
Area 2 is in the southeast in Twp 48 Rge 9 and includes part of the “A” Lease. The OOIP was determined
from the Purvis and Bober (1979) analysis of Pembina. The area was measured and the OOIP per ha
Alberta Research Council 5-7
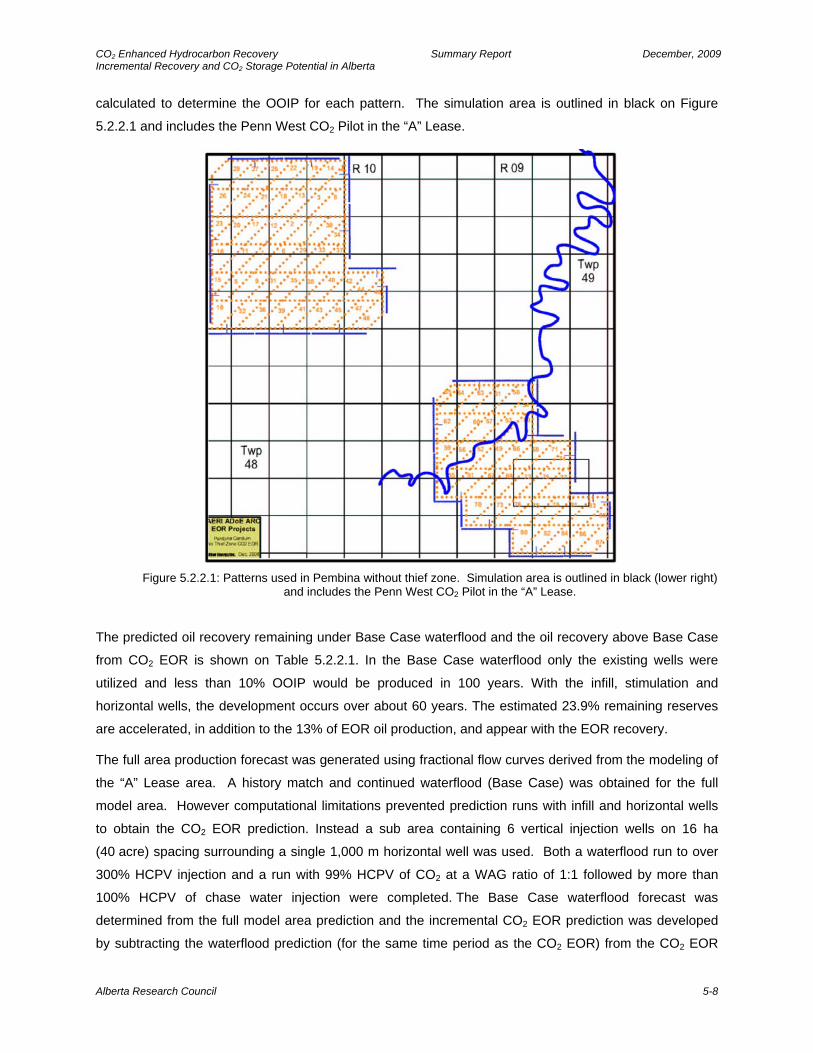
CO2 Enhanced Hydrocarbon Recovery Summary Report December, 2009 Incremental Recovery and CO2 Storage Potential in Alberta
calculated to determine the OOIP for each pattern. The simulation area is outlined in black on Figure
5.2.2.1 and includes the Penn West CO2 Pilot in the “A” Lease.
Figure 5.2.2.1: Patterns used in Pembina without thief zone. Simulation area is outlined in black (lower right)
and includes the Penn West CO2 Pilot in the “A” Lease.
The predicted oil recovery remaining under Base Case waterflood and the oil recovery above Base Case
from CO2 EOR is shown on Table 5.2.2.1. In the Base Case waterflood only the existing wells were
utilized and less than 10% OOIP would be produced in 100 years. With the infill, stimulation and
horizontal wells, the development occurs over about 60 years. The estimated 23.9% remaining reserves
are accelerated, in addition to the 13% of EOR oil production, and appear with the EOR recovery.
The full area production forecast was generated using fractional flow curves derived from the modeling of
the “A” Lease area. A history match and continued waterflood (Base Case) was obtained for the full
model area. However computational limitations prevented prediction runs with infill and horizontal wells
to obtain the CO2 EOR prediction. Instead a sub area containing 6 vertical injection wells on 16 ha
(40 acre) spacing surrounding a single 1,000 m horizontal well was used. Both a waterflood run to over
300% HCPV injection and a run with 99% HCPV of CO2 at a WAG ratio of 1:1 followed by more than
100% HCPV of chase water injection were completed. The Base Case waterflood forecast was
determined from the full model area prediction and the incremental CO2 EOR prediction was developed
by subtracting the waterflood prediction (for the same time period as the CO2 EOR) from the CO2 EOR
Alberta Research Council 5-8
CO2 Enhanced Hydrocarbon Recovery Summary Report December, 2009 Incremental Recovery and CO2 Storage Potential in Alberta
model prediction. The forecast for the full areas limited the total injection to 300% HCPV. The CO2
injected, produced and stored are shown on Table 5.2.2.2. The CO2 injection forecast is that required to
meet simulation prediction. In order to maximize CO2 storage all produced CO2 should be reinjected.
This would also increase oil recovery.
Figure 5.2.2.2 shows the existing wells in black and new horizontal production wells (green lines) and
new vertical injectors in green for a portion of Area 1. Note that most patterns have six injection and two
dual leg horizontal production wells. The EOR injectors include 176 existing vertical production wells, 180
new vertical injection wells and 136 existing vertical injection wells. The 45 new horizontal water fence
injection wells are shown in blue on Figure 5.2.2.1. All production wells are new horizontal wells (25
single leg, 600 m wells and 155 dual leg, 1,200 m wells). It was assumed that all layers in all wells would
be stimulated to enhance processing rate. The forecast assumes all wells stay on production for the life
of the patterns at rates from analysis of historical well performance in each area. The Base Case
waterflood uses only the existing vertical wells.
Figure 5.2.2.3 shows the complete new gathering system (in black) that goes to all wells and water and
CO2 injection lines (in red) to all WAG injectors. A complete new gathering system was included in the
development plan because of potential higher operating pressure, corrosion in existing system and desire
to produce low CO2 concentration wells to the gas plant rather than dilute produced CO2. The much
higher production rates from the fractured horizontal wells will also require new well test facilities.
Because of the age, number of conversions and new wells it is assumed that the existing waterflood
system is inadequate so new water injection lines were installed. The system was laid out to allow
installation of the gathering and injection lines in a common ditch.
Table 5.2.2.2 summarizes some of the key results for both the Base Case Waterflood and the CO2 EOR
Project generated from the study. Predicted oil recovery may be optimistic. CO2 EOR incremental oil
recovery of 7.7 e6m3 or 12.8% OOIP is forecast by the simulation with the injection of 68.5 million tonnes
of CO2, 99.1% HCPV of CO2 at a WAG of 1:1 followed by chase water. All of the patterns had finished
chase water injection in the 65 year forecast. In 65 years 13.9 e6m3 of waterflood oil is also produced;
without the development only 5 e6m3 of Base Case waterflood oil would be produced in 75 years. Source
CO2 is required for 29 years, 22 years at maximum rate of 1,500 tonne per day. CO2 injection shown is
that required to meet the forecast. However, if all produced CO2 were injected, then 13.9 million tonnes
would be stored. Net CO2 utilization is 1.8 tonne/m3 (5.5 mcf/Bbl), gross CO2 utilization is poor at 8.9
tonne/m3 (27 mcf/Bbl), based only on the CO2 EOR oil.
Alberta Research Council 5-9

CO2 Enhanced Hydrocarbon Recovery Summary Report December, 2009 Incremental Recovery and CO2 Storage Potential in Alberta
Figure 5.2.2.2: Pembina Cardium without thief zone - existing wells in black and new horizontal production wells (green lines) and new vertical injectors in green for a portion of Area 1.
Figure 5.2.2.3: Pembina Cardium without thief zone – Injection and Gathering systems
Alberta Research Council 5-10

CO2 Enhanced Hydrocarbon Recovery Summary Report December, 2009 Incremental Recovery and CO2 Storage Potential in Alberta
Table 5.2.2.2 Pembina Cardium No Thief Zone CO2 EOR Summary of Results
Pembina Cardium No Thief Zone CO2 EOR OOIP 59.7 e6m3 375.7 106 Bbl
Oil Production Base Case 13,907 e3m3 87,472 103 Bbl 23.3% estimate
CO2 EOR 7,673 e3m3 48,261 103 Bbl 12.8% "T" Factor Total 21,580 e3m3 135,734 103 Bbl 36.1% 0.36
Natural Gas Sales 62 e6m3 2.2 bcf CO2 Injection 68,503 Gg 36,807 e6m3 1,306.4 bcf 99.1%
CO2 Purchased 13,918 Gg 7,478 e6m3 265.4 bcf 20.1%
CO2 Production 59,434 Gg 31,934 e6m3 1,133.5 bcf 86.0%
WAG Ratio 1:1 Maximum Source CO2 22 years
Maximum purchased CO2 1,500 tonne/day 28.6 mcf/d
Maximum injected CO2 7,462 tonne/day 142.3 mcf/d
CO2 Utilization Factor (CO2 EOR oil only) Gross 8.93 t/m3 27.07 mcf/Bbl
Net 1.81 t/m3 5.50 mcf/Bbl Water Injection % HCPV
Chase & WF 87,378 e3m3 549,589 103 Bbl 106.9% WAG 80,975 e3m3 509,319 103 Bbl 99.1%
Risk Factors
The parts of the “A” Lease and the better portion of the Cyn Pem Unit #3 analyzed here are the best parts of these areas in the Pembina Cardium.
The most significant technical risks include:
1) The impact of the natural fractures on containing the flood in the patterns and zones is a very large geological risk. Will the flood move off trend from the line drive and the fence wells contain the CO2 in the pattern?
2) Can the productivity of the horizontal wells running in the off trend direction be achieved and sustained?
3) Can the flow be forced to the off trend wells with good vertical conformance?
4) Is the acceleration of the remaining reserves and the CO2 EOR potential sufficient to support the huge capital expenditure required?
5) Will the productivity and injectivity be adequate to complete the project in a reasonable length of time?
Alberta Research Council 5-11
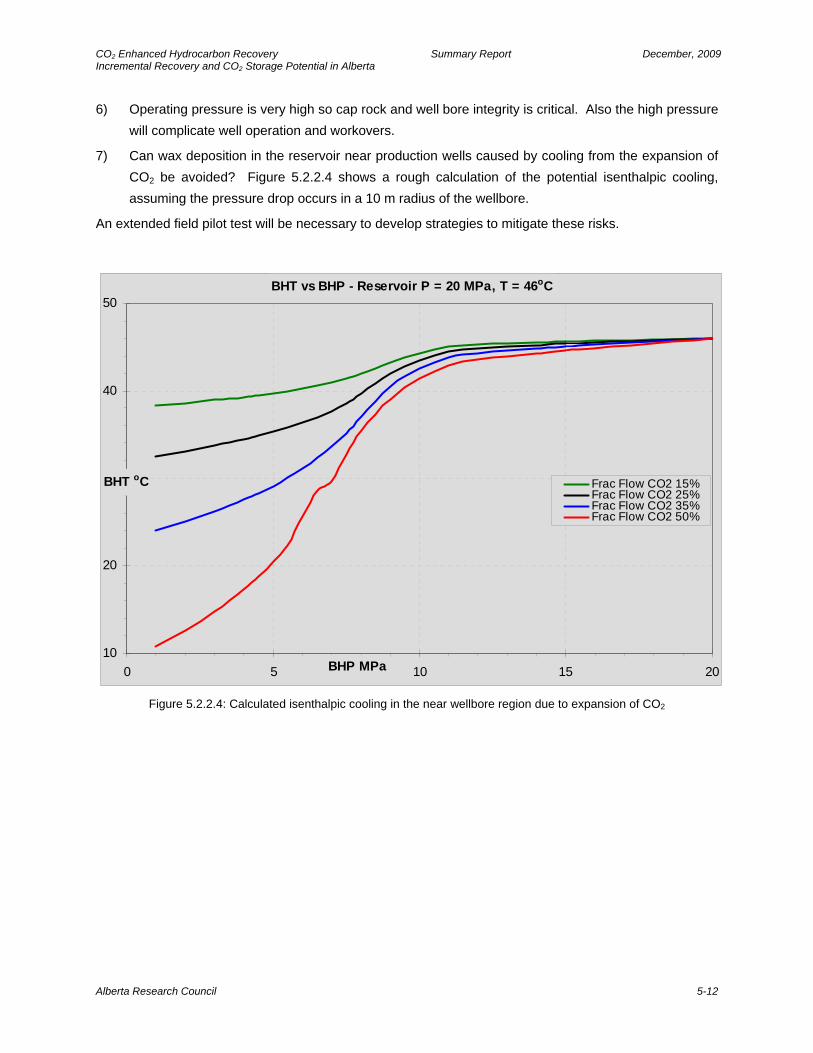
CO2 Enhanced Hydrocarbon Recovery Summary Report December, 2009 Incremental Recovery and CO2 Storage Potential in Alberta
6) Operating pressure is very high so cap rock and well bore integrity is critical. Also the high pressure will complicate well operation and workovers.
7) Can wax deposition in the reservoir near production wells caused by cooling from the expansion of CO2 be avoided? Figure 5.2.2.4 shows a rough calculation of the potential isenthalpic cooling, assuming the pressure drop occurs in a 10 m radius of the wellbore.
An extended field pilot test will be necessary to develop strategies to mitigate these risks.
BHT vs BHP - Reservoir P = 20 MPa, T = 46oC
10
20
30
40
50
0 5 10 15 20BHP MPa
BHT oC Frac Flow CO2 15%Frac Flow CO2 25%Frac Flow CO2 35%Frac Flow CO2 50%
Figure 5.2.2.4: Calculated isenthalpic cooling in the near wellbore region due to expansion of CO2
Alberta Research Council 5-12
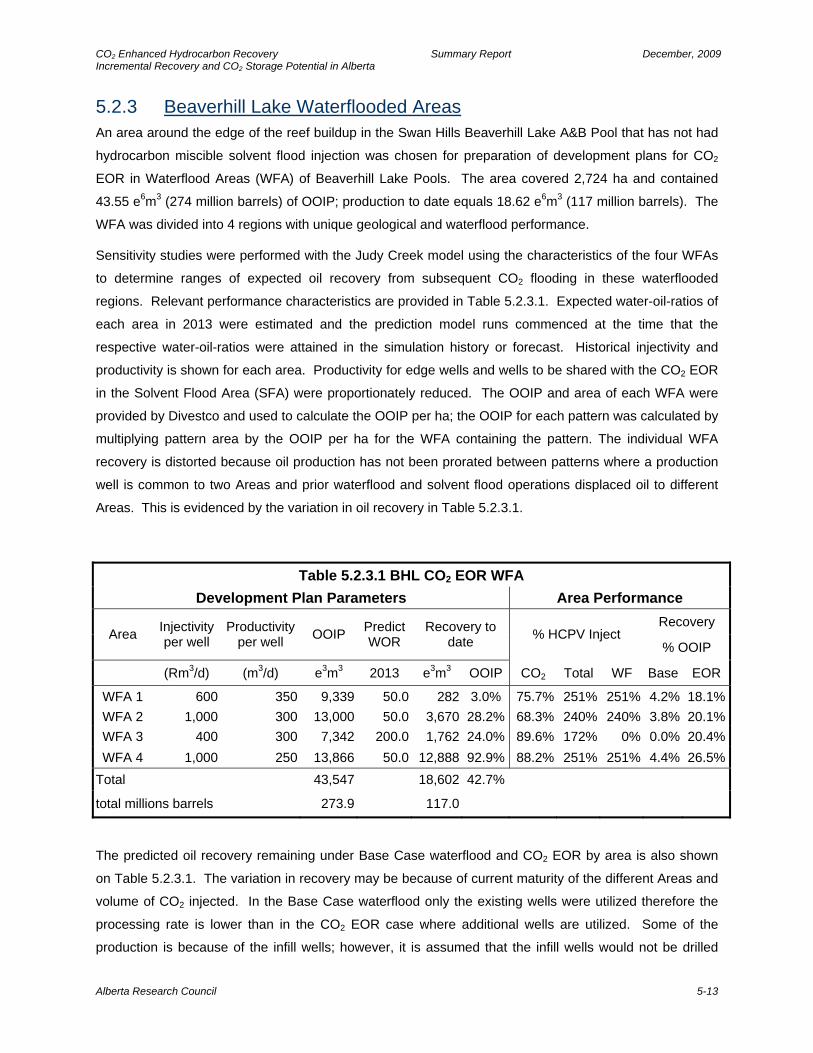
CO2 Enhanced Hydrocarbon Recovery Summary Report December, 2009 Incremental Recovery and CO2 Storage Potential in Alberta
5.2.3 Beaverhill Lake Waterflooded Areas An area around the edge of the reef buildup in the Swan Hills Beaverhill Lake A&B Pool that has not had
hydrocarbon miscible solvent flood injection was chosen for preparation of development plans for CO2
EOR in Waterflood Areas (WFA) of Beaverhill Lake Pools. The area covered 2,724 ha and contained
43.55 e6m3 (274 million barrels) of OOIP; production to date equals 18.62 e6m3 (117 million barrels). The
WFA was divided into 4 regions with unique geological and waterflood performance.
Sensitivity studies were performed with the Judy Creek model using the characteristics of the four WFAs
to determine ranges of expected oil recovery from subsequent CO2 flooding in these waterflooded
regions. Relevant performance characteristics are provided in Table 5.2.3.1. Expected water-oil-ratios of
each area in 2013 were estimated and the prediction model runs commenced at the time that the
respective water-oil-ratios were attained in the simulation history or forecast. Historical injectivity and
productivity is shown for each area. Productivity for edge wells and wells to be shared with the CO2 EOR
in the Solvent Flood Area (SFA) were proportionately reduced. The OOIP and area of each WFA were
provided by Divestco and used to calculate the OOIP per ha; the OOIP for each pattern was calculated by
multiplying pattern area by the OOIP per ha for the WFA containing the pattern. The individual WFA
recovery is distorted because oil production has not been prorated between patterns where a production
well is common to two Areas and prior waterflood and solvent flood operations displaced oil to different
Areas. This is evidenced by the variation in oil recovery in Table 5.2.3.1.
Table 5.2.3.1 BHL CO2 EOR WFA Development Plan Parameters Area Performance
Recovery Area Injectivity
per well Productivity
per well OOIP Predict WOR
Recovery to date % HCPV Inject
% OOIP
(Rm3/d) (m3/d) e3m3 2013 e3m3 OOIP CO2 Total WF Base EOR
WFA 1 600 350 9,339 50.0 282 3.0% 75.7% 251% 251% 4.2% 18.1%WFA 2 1,000 300 13,000 50.0 3,670 28.2% 68.3% 240% 240% 3.8% 20.1%WFA 3 400 300 7,342 200.0 1,762 24.0% 89.6% 172% 0% 0.0% 20.4%WFA 4 1,000 250 13,866 50.0 12,888 92.9% 88.2% 251% 251% 4.4% 26.5%
Total 43,547 18,602 42.7%
total millions barrels 273.9 117.0
The predicted oil recovery remaining under Base Case waterflood and CO2 EOR by area is also shown
on Table 5.2.3.1. The variation in recovery may be because of current maturity of the different Areas and
volume of CO2 injected. In the Base Case waterflood only the existing wells were utilized therefore the
processing rate is lower than in the CO2 EOR case where additional wells are utilized. Some of the
production is because of the infill wells; however, it is assumed that the infill wells would not be drilled
Alberta Research Council 5-13
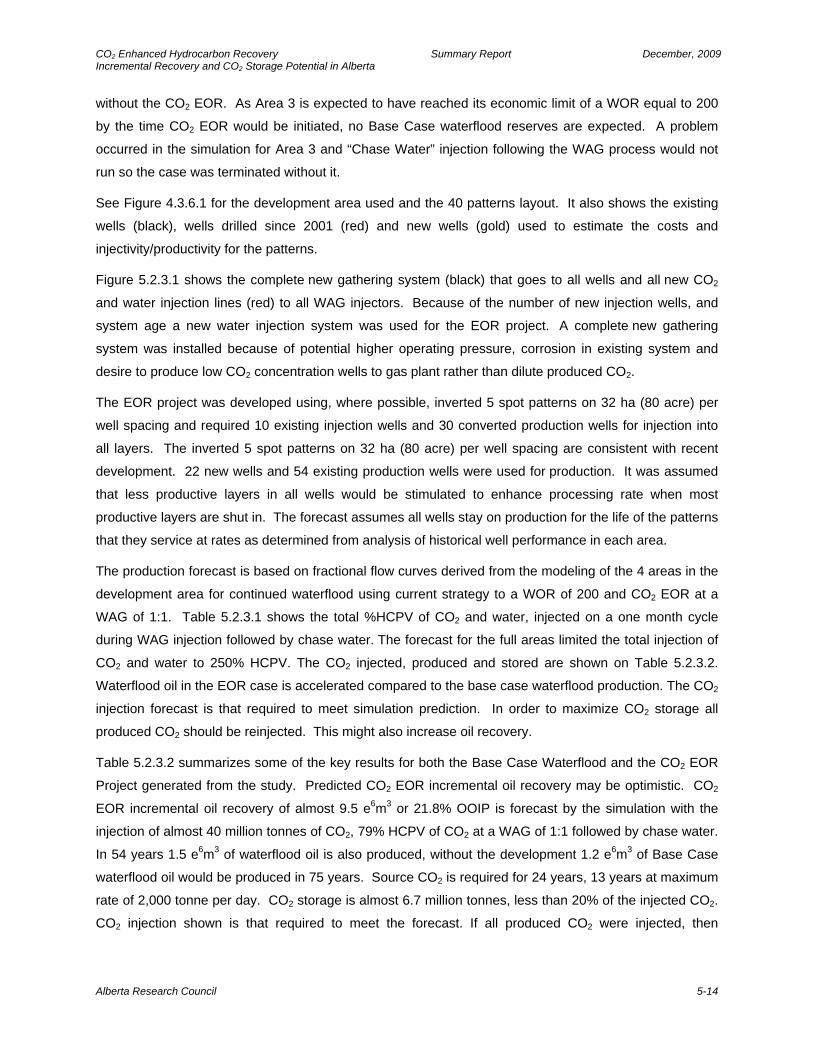
CO2 Enhanced Hydrocarbon Recovery Summary Report December, 2009 Incremental Recovery and CO2 Storage Potential in Alberta
without the CO2 EOR. As Area 3 is expected to have reached its economic limit of a WOR equal to 200
by the time CO2 EOR would be initiated, no Base Case waterflood reserves are expected. A problem
occurred in the simulation for Area 3 and “Chase Water” injection following the WAG process would not
run so the case was terminated without it.
See Figure 4.3.6.1 for the development area used and the 40 patterns layout. It also shows the existing
wells (black), wells drilled since 2001 (red) and new wells (gold) used to estimate the costs and
injectivity/productivity for the patterns.
Figure 5.2.3.1 shows the complete new gathering system (black) that goes to all wells and all new CO2
and water injection lines (red) to all WAG injectors. Because of the number of new injection wells, and
system age a new water injection system was used for the EOR project. A complete new gathering
system was installed because of potential higher operating pressure, corrosion in existing system and
desire to produce low CO2 concentration wells to gas plant rather than dilute produced CO2.
The EOR project was developed using, where possible, inverted 5 spot patterns on 32 ha (80 acre) per
well spacing and required 10 existing injection wells and 30 converted production wells for injection into
all layers. The inverted 5 spot patterns on 32 ha (80 acre) per well spacing are consistent with recent
development. 22 new wells and 54 existing production wells were used for production. It was assumed
that less productive layers in all wells would be stimulated to enhance processing rate when most
productive layers are shut in. The forecast assumes all wells stay on production for the life of the patterns
that they service at rates as determined from analysis of historical well performance in each area.
The production forecast is based on fractional flow curves derived from the modeling of the 4 areas in the
development area for continued waterflood using current strategy to a WOR of 200 and CO2 EOR at a
WAG of 1:1. Table 5.2.3.1 shows the total %HCPV of CO2 and water, injected on a one month cycle
during WAG injection followed by chase water. The forecast for the full areas limited the total injection of
CO2 and water to 250% HCPV. The CO2 injected, produced and stored are shown on Table 5.2.3.2.
Waterflood oil in the EOR case is accelerated compared to the base case waterflood production. The CO2
injection forecast is that required to meet simulation prediction. In order to maximize CO2 storage all
produced CO2 should be reinjected. This might also increase oil recovery.
Table 5.2.3.2 summarizes some of the key results for both the Base Case Waterflood and the CO2 EOR
Project generated from the study. Predicted CO2 EOR incremental oil recovery may be optimistic. CO2
EOR incremental oil recovery of almost 9.5 e6m3 or 21.8% OOIP is forecast by the simulation with the
injection of almost 40 million tonnes of CO2, 79% HCPV of CO2 at a WAG of 1:1 followed by chase water.
In 54 years 1.5 e6m3 of waterflood oil is also produced, without the development 1.2 e6m3 of Base Case
waterflood oil would be produced in 75 years. Source CO2 is required for 24 years, 13 years at maximum
rate of 2,000 tonne per day. CO2 storage is almost 6.7 million tonnes, less than 20% of the injected CO2.
CO2 injection shown is that required to meet the forecast. If all produced CO2 were injected, then
Alberta Research Council 5-14
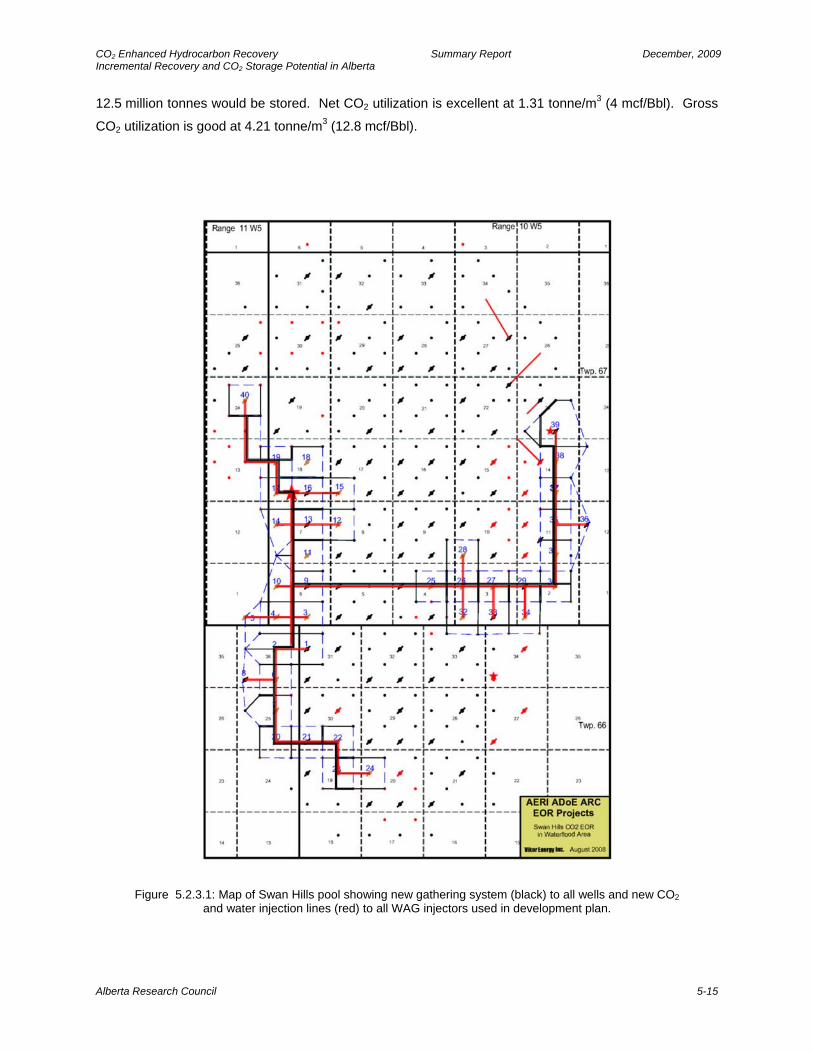
CO2 Enhanced Hydrocarbon Recovery Summary Report December, 2009 Incremental Recovery and CO2 Storage Potential in Alberta
12.5 million tonnes would be stored. Net CO2 utilization is excellent at 1.31 tonne/m3 (4 mcf/Bbl). Gross
CO2 utilization is good at 4.21 tonne/m3 (12.8 mcf/Bbl).
Figure 5.2.3.1: Map of Swan Hills pool showing new gathering system (black) to all wells and new CO2
and water injection lines (red) to all WAG injectors used in development plan.
Alberta Research Council 5-15
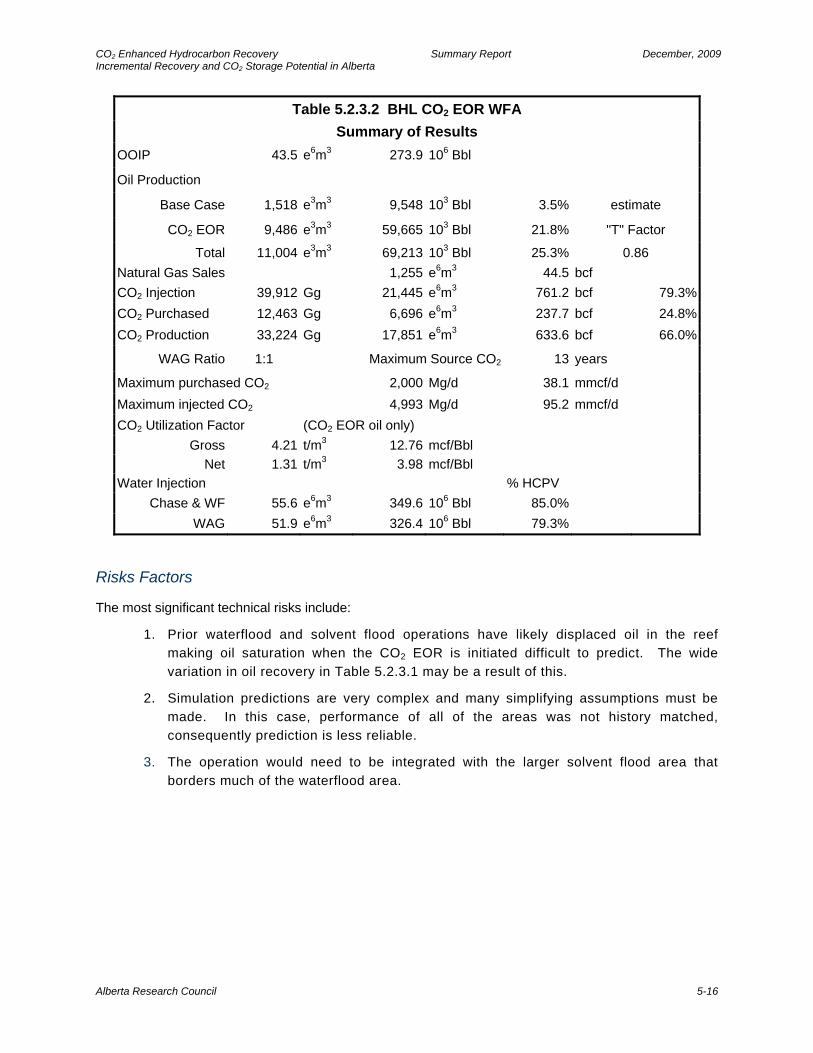
CO2 Enhanced Hydrocarbon Recovery Summary Report December, 2009 Incremental Recovery and CO2 Storage Potential in Alberta
Table 5.2.3.2 BHL CO2 EOR WFA Summary of Results
OOIP 43.5 e6m3 273.9 106 Bbl
Oil Production
Base Case 1,518 e3m3 9,548 103 Bbl 3.5% estimate
CO2 EOR 9,486 e3m3 59,665 103 Bbl 21.8% "T" Factor
Total 11,004 e3m3 69,213 103 Bbl 25.3% 0.86 Natural Gas Sales 1,255 e6m3 44.5 bcf CO2 Injection 39,912 Gg 21,445 e6m3 761.2 bcf 79.3%CO2 Purchased 12,463 Gg 6,696 e6m3 237.7 bcf 24.8%CO2 Production 33,224 Gg 17,851 e6m3 633.6 bcf 66.0%
WAG Ratio 1:1 Maximum Source CO2 13 years
Maximum purchased CO2 2,000 Mg/d 38.1 mmcf/d Maximum injected CO2 4,993 Mg/d 95.2 mmcf/d CO2 Utilization Factor (CO2 EOR oil only) Gross 4.21 t/m3 12.76 mcf/Bbl
Net 1.31 t/m3 3.98 mcf/Bbl Water Injection % HCPV
Chase & WF 55.6 e6m3 349.6 106 Bbl 85.0% WAG 51.9 e6m3 326.4 106 Bbl 79.3%
Risks Factors
The most significant technical risks include:
1. Prior waterflood and solvent flood operations have likely displaced oil in the reef making oil saturation when the CO2 EOR is initiated difficult to predict. The wide variation in oil recovery in Table 5.2.3.1 may be a result of this.
2. Simulation predictions are very complex and many simplifying assumptions must be made. In this case, performance of all of the areas was not history matched, consequently prediction is less reliable.
3. The operation would need to be integrated with the larger solvent flood area that borders much of the waterflood area.
Alberta Research Council 5-16
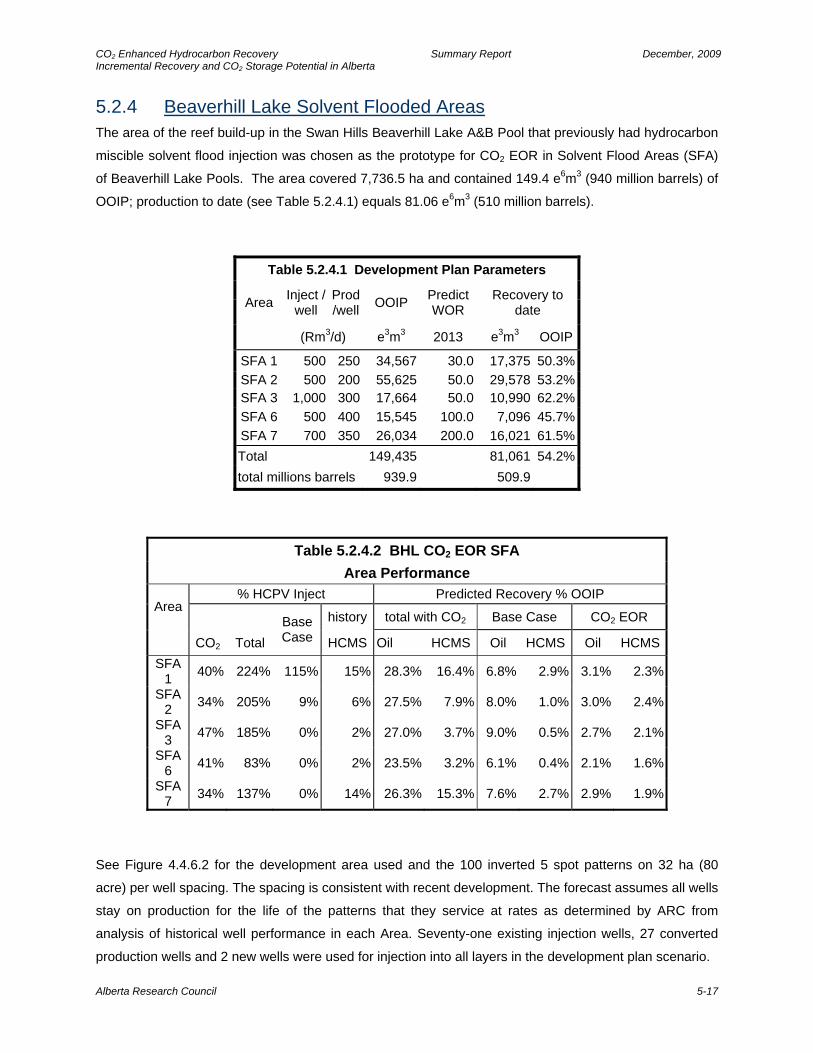
CO2 Enhanced Hydrocarbon Recovery Summary Report December, 2009 Incremental Recovery and CO2 Storage Potential in Alberta
5.2.4 Beaverhill Lake Solvent Flooded Areas The area of the reef build-up in the Swan Hills Beaverhill Lake A&B Pool that previously had hydrocarbon
miscible solvent flood injection was chosen as the prototype for CO2 EOR in Solvent Flood Areas (SFA)
of Beaverhill Lake Pools. The area covered 7,736.5 ha and contained 149.4 e6m3 (940 million barrels) of
OOIP; production to date (see Table 5.2.4.1) equals 81.06 e6m3 (510 million barrels).
Table 5.2.4.1 Development Plan Parameters
Area Inject / well
Prod/well OOIP Predict
WOR Recovery to
date
(Rm3/d) e3m3 2013 e3m3 OOIP
SFA 1 500 250 34,567 30.0 17,375 50.3% SFA 2 500 200 55,625 50.0 29,578 53.2% SFA 3 1,000 300 17,664 50.0 10,990 62.2% SFA 6 500 400 15,545 100.0 7,096 45.7% SFA 7 700 350 26,034 200.0 16,021 61.5% Total 149,435 81,061 54.2% total millions barrels 939.9 509.9
Table 5.2.4.2 BHL CO2 EOR SFA Area Performance
% HCPV Inject Predicted Recovery % OOIP Area
history total with CO2 Base Case CO2 EOR
CO2 Total Base Case HCMS Oil HCMS Oil HCMS Oil HCMS
SFA 1 40% 224% 115% 15% 28.3% 16.4% 6.8% 2.9% 3.1% 2.3%
SFA 2 34% 205% 9% 6% 27.5% 7.9% 8.0% 1.0% 3.0% 2.4%
SFA 3 47% 185% 0% 2% 27.0% 3.7% 9.0% 0.5% 2.7% 2.1%
SFA 6 41% 83% 0% 2% 23.5% 3.2% 6.1% 0.4% 2.1% 1.6%
SFA 7 34% 137% 0% 14% 26.3% 15.3% 7.6% 2.7% 2.9% 1.9%
See Figure 4.4.6.2 for the development area used and the 100 inverted 5 spot patterns on 32 ha (80
acre) per well spacing. The spacing is consistent with recent development. The forecast assumes all wells
stay on production for the life of the patterns that they service at rates as determined by ARC from
analysis of historical well performance in each Area. Seventy-one existing injection wells, 27 converted
production wells and 2 new wells were used for injection into all layers in the development plan scenario.
Alberta Research Council 5-17

CO2 Enhanced Hydrocarbon Recovery Summary Report December, 2009 Incremental Recovery and CO2 Storage Potential in Alberta
Figure 5.2.4.1 shows the existing wells (black), wells drilled since 2001 (red) and new wells (gold) used to
estimate injectivity/productivity for the patterns. The predicted oil and hydrocarbon miscible solvent
(HCMS) recovery remaining under Base Case and CO2 EOR, by area are shown on Table 5.2.4.2.
Significant difficulty was experienced in the simulation of the Area Models. It was very difficult to maintain
reservoir pressure above MMP using expected production rates; therefore, productivity was constrained.
Consequently the WOR at start of the CO2 EOR was much lower than anticipated in the field. In spite of
the precautions taken the reservoir pressure in the simulations dropped during CO2 injection and
miscibility may not have been maintained, especially in Area 2, reducing recovery. The boundary wells
used for history matching were shut in during the prediction cases. The lower number of injectors
prevented achieving the desired WOR value within a reasonable time. In Area 6 the model would not
allow Chase Water resulting in lower recovery in this area.
The HCMS and CO2 reservoir volume factors are very close in the simulation (CO2 should be 50%
heavier in the reservoir) and contributes to low oil recovery in the model. Predicting the volume of HCMS
recovered is difficult because the composition of both produced oil and gas changes significantly with
time. Using the simple approach of deducting initial solution GOR from the hydrocarbon gas produced to
determine the solvent recovery is shown on Table 5.2.4.2. However more HCMS was produced then
injected because of light ends extracted from the oil. The total weight percent of produced HCMS
calculated as 88.5% and 94.8% of injected HCMS for the Base Case and CO2 EOR, respectively. The
total CO2 injected is lower than in the WFA simulation and injection over 50% HCPV may be optimum.
The production forecast is based on fractional flow curves derived from the area models. Table 5.2.4.2
shows the %HCPV of CO2 and water, injected and WAG ratio. The CO2 injected, produced and stored is
shown on Table 5.2.4.3. The CO2 injection is that required for the simulation prediction. To maximize CO2
storage all produced CO2 should be reinjected which would also increase oil recovery. Waterflood oil in
the EOR case is accelerated compared to the base case waterflood production.
Figure 5.2.4.2 shows the complete new gathering system (black) that goes to all wells and new CO2 and
water injection lines (red) to all new injection wells. The existing solvent and water injection lines to
existing injection wells were assumed to be adequate for CO2 EOR. New CO2 and water injection lines
were run from the nearest existing solvent injection well to new injection wells. A complete new gathering
system was installed because of potential higher operating pressure, corrosion in the existing system and
desire to produce low CO2 concentration wells to gas plant rather than dilute produced CO2.
It was assumed that the existing treating plant and waterflood plant would be used for the EOR project. It
is also assumed that CO2 and solution gas separation will be required.
Table 5.2.4.3 summarizes some of the key parameters results for both the Base Case Waterflood and the
CO2 EOR generated from the study. CO2 EOR incremental oil recovery is over 4.5 e6m3 or 3.0% OOIP is
forecast by the simulation with the injection of over 45 million tonnes of CO2, 40% HCPV of CO2 at a
Alberta Research Council 5-18

CO2 Enhanced Hydrocarbon Recovery Summary Report December, 2009 Incremental Recovery and CO2 Storage Potential in Alberta
WAG of 1:1 followed by chase water in four of the five areas. Source CO2 is required for 22 years, 9 years
at maximum rate of 2,000 tonne per day. CO2 injection shown is that required to meet the forecast; if all
produced CO2 were injected 10.4 million tonnes would be stored. Net CO2 utilization is acceptable at 2.28
tonne/m3 (7 mcf/Bbl); Gross CO2 utilization is a poor 9.96 tonne/m3 (30.2 mcf/Bbl), based on EOR oil.
Figure 5.2.4.1: Wells used in Swan Hills BHL SFA development plan (existing wells in black, wells drilled since 2001 in red, new wells for development plan in gold); wells outside the patterns are in the WFA
Alberta Research Council 5-19
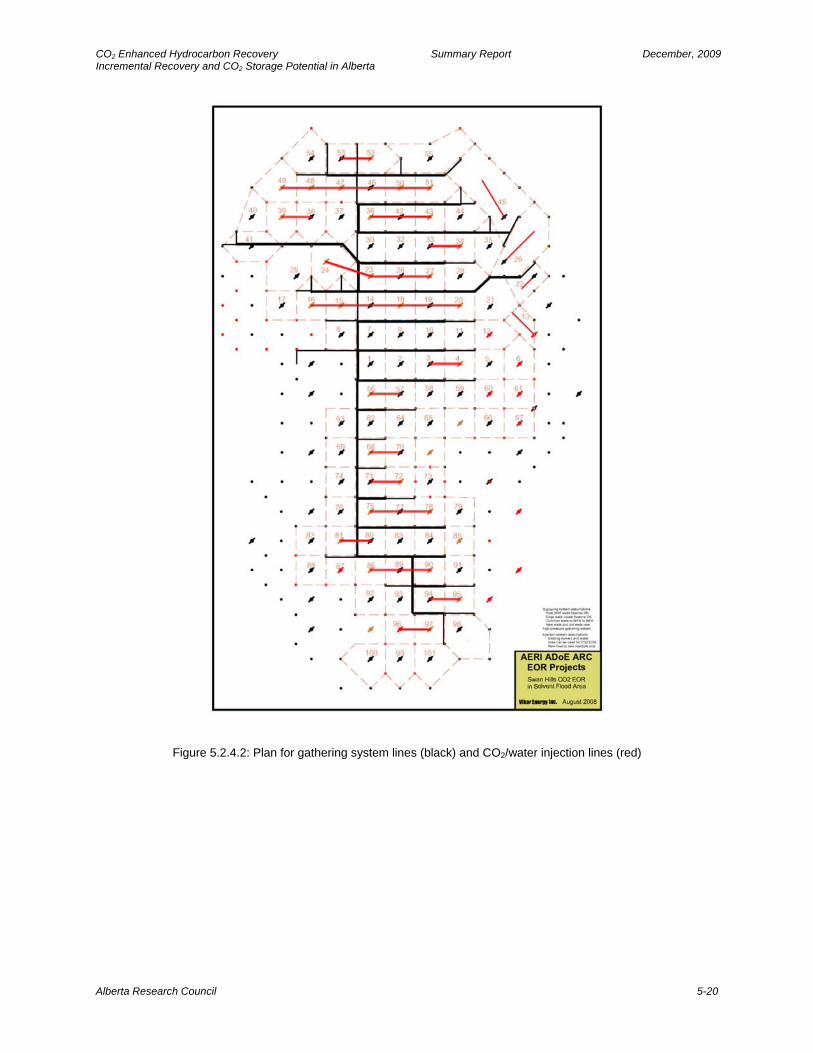
CO2 Enhanced Hydrocarbon Recovery Summary Report December, 2009 Incremental Recovery and CO2 Storage Potential in Alberta
Figure 5.2.4.2: Plan for gathering system lines (black) and CO2/water injection lines (red)
Alberta Research Council 5-20
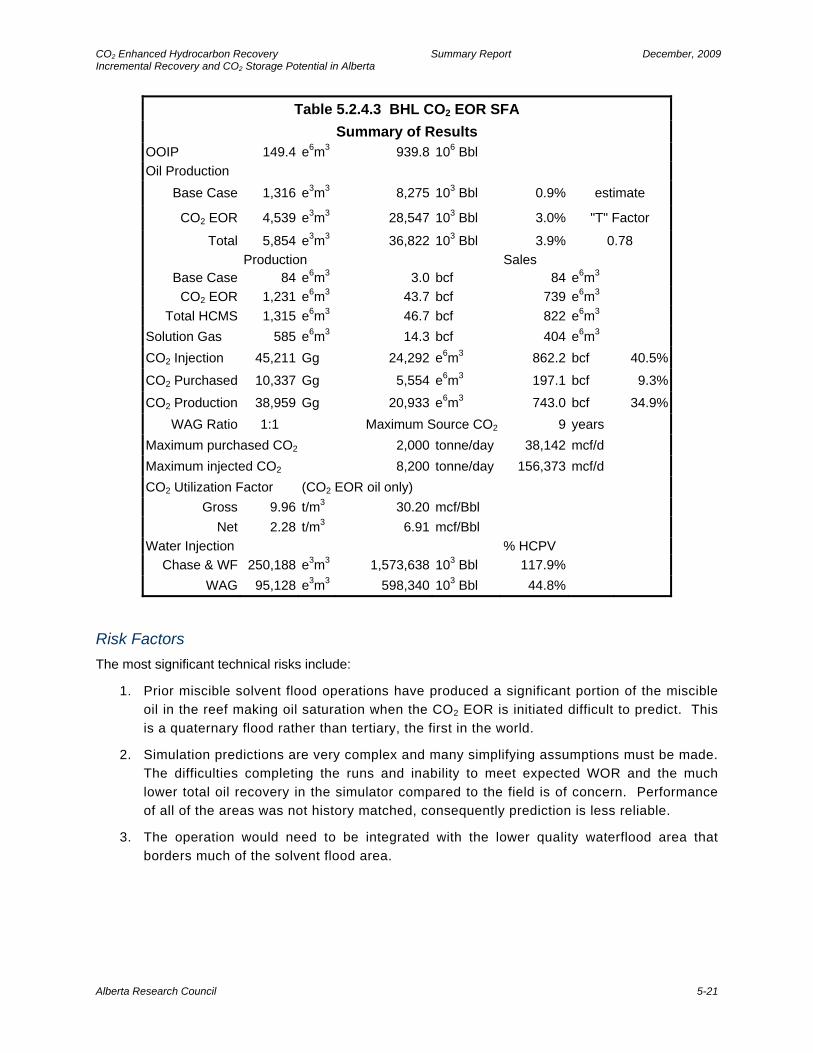
CO2 Enhanced Hydrocarbon Recovery Summary Report December, 2009 Incremental Recovery and CO2 Storage Potential in Alberta
Table 5.2.4.3 BHL CO2 EOR SFA Summary of Results
OOIP 149.4 e6m3 939.8 106 Bbl Oil Production
Base Case 1,316 e3m3 8,275 103 Bbl 0.9% estimate
CO2 EOR 4,539 e3m3 28,547 103 Bbl 3.0% "T" Factor
Total 5,854 e3m3 36,822 103 Bbl 3.9% 0.78 Production Sales
Base Case 84 e6m3 3.0 bcf 84 e6m3 CO2 EOR 1,231 e6m3 43.7 bcf 739 e6m3
Total HCMS 1,315 e6m3 46.7 bcf 822 e6m3 Solution Gas 585 e6m3 14.3 bcf 404 e6m3 CO2 Injection 45,211 Gg 24,292 e6m3 862.2 bcf 40.5%
CO2 Purchased 10,337 Gg 5,554 e6m3 197.1 bcf 9.3%
CO2 Production 38,959 Gg 20,933 e6m3 743.0 bcf 34.9%WAG Ratio 1:1 Maximum Source CO2 9 years
Maximum purchased CO2 2,000 tonne/day 38,142 mcf/d Maximum injected CO2 8,200 tonne/day 156,373 mcf/d CO2 Utilization Factor (CO2 EOR oil only) Gross 9.96 t/m3 30.20 mcf/Bbl
Net 2.28 t/m3 6.91 mcf/Bbl Water Injection % HCPV
Chase & WF 250,188 e3m3 1,573,638 103 Bbl 117.9% WAG 95,128 e3m3 598,340 103 Bbl 44.8%
Risk Factors The most significant technical risks include:
1. Prior miscible solvent flood operations have produced a significant portion of the miscible oil in the reef making oil saturation when the CO2 EOR is initiated difficult to predict. This is a quaternary flood rather than tertiary, the first in the world.
2. Simulation predictions are very complex and many simplifying assumptions must be made. The difficulties completing the runs and inability to meet expected WOR and the much lower total oil recovery in the simulator compared to the field is of concern. Performance of all of the areas was not history matched, consequently prediction is less reliable.
3. The operation would need to be integrated with the lower quality waterflood area that borders much of the solvent flood area.
Alberta Research Council 5-21
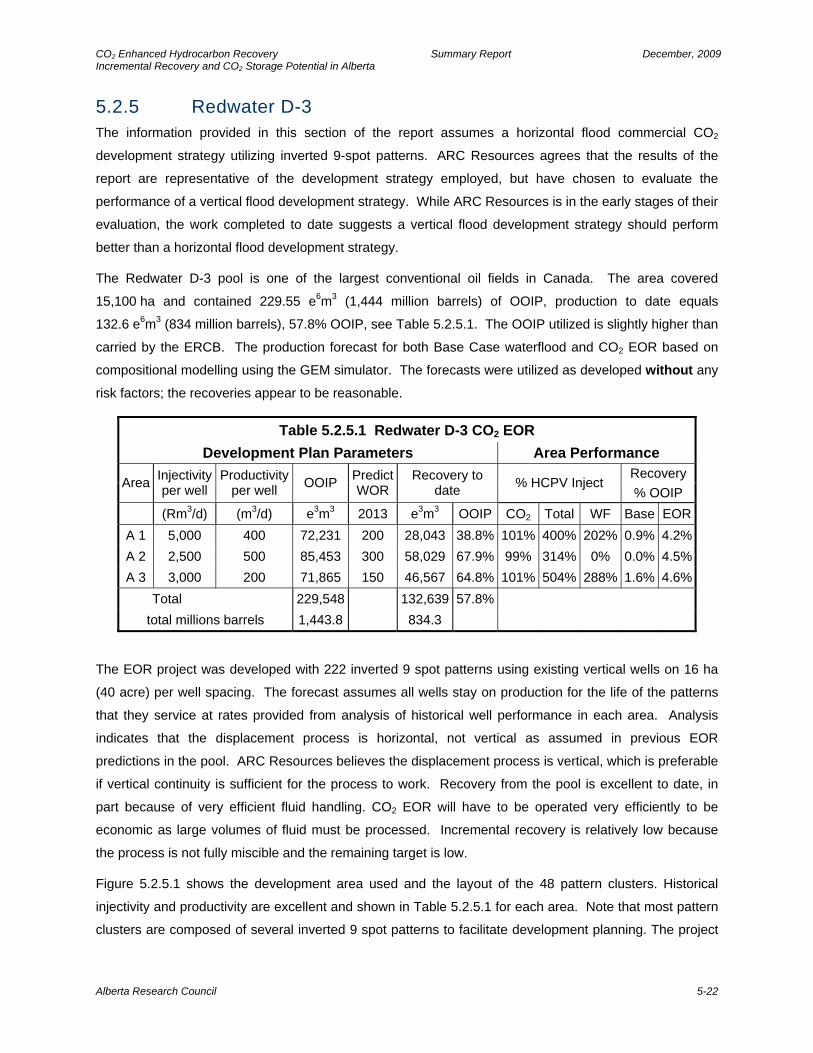
CO2 Enhanced Hydrocarbon Recovery Summary Report December, 2009 Incremental Recovery and CO2 Storage Potential in Alberta
5.2.5 Redwater D-3 The information provided in this section of the report assumes a horizontal flood commercial CO2
development strategy utilizing inverted 9-spot patterns. ARC Resources agrees that the results of the
report are representative of the development strategy employed, but have chosen to evaluate the
performance of a vertical flood development strategy. While ARC Resources is in the early stages of their
evaluation, the work completed to date suggests a vertical flood development strategy should perform
better than a horizontal flood development strategy.
The Redwater D-3 pool is one of the largest conventional oil fields in Canada. The area covered
15,100 ha and contained 229.55 e6m3 (1,444 million barrels) of OOIP, production to date equals
132.6 e6m3 (834 million barrels), 57.8% OOIP, see Table 5.2.5.1. The OOIP utilized is slightly higher than
carried by the ERCB. The production forecast for both Base Case waterflood and CO2 EOR based on
compositional modelling using the GEM simulator. The forecasts were utilized as developed without any
risk factors; the recoveries appear to be reasonable.
Table 5.2.5.1 Redwater D-3 CO2 EOR Development Plan Parameters Area Performance
Recovery Area Injectivity
per well Productivity
per well OOIP Predict WOR
Recovery to date % HCPV Inject
% OOIP (Rm3/d) (m3/d) e3m3 2013 e3m3 OOIP CO2 Total WF Base EOR
A 1 5,000 400 72,231 200 28,043 38.8% 101% 400% 202% 0.9% 4.2%A 2 2,500 500 85,453 300 58,029 67.9% 99% 314% 0% 0.0% 4.5%A 3 3,000 200 71,865 150 46,567 64.8% 101% 504% 288% 1.6% 4.6%
Total 229,548 132,639 57.8% total millions barrels 1,443.8 834.3
The EOR project was developed with 222 inverted 9 spot patterns using existing vertical wells on 16 ha
(40 acre) per well spacing. The forecast assumes all wells stay on production for the life of the patterns
that they service at rates provided from analysis of historical well performance in each area. Analysis
indicates that the displacement process is horizontal, not vertical as assumed in previous EOR
predictions in the pool. ARC Resources believes the displacement process is vertical, which is preferable
if vertical continuity is sufficient for the process to work. Recovery from the pool is excellent to date, in
part because of very efficient fluid handling. CO2 EOR will have to be operated very efficiently to be
economic as large volumes of fluid must be processed. Incremental recovery is relatively low because
the process is not fully miscible and the remaining target is low.
Figure 5.2.5.1 shows the development area used and the layout of the 48 pattern clusters. Historical
injectivity and productivity are excellent and shown in Table 5.2.5.1 for each area. Note that most pattern
clusters are composed of several inverted 9 spot patterns to facilitate development planning. The project
Alberta Research Council 5-22
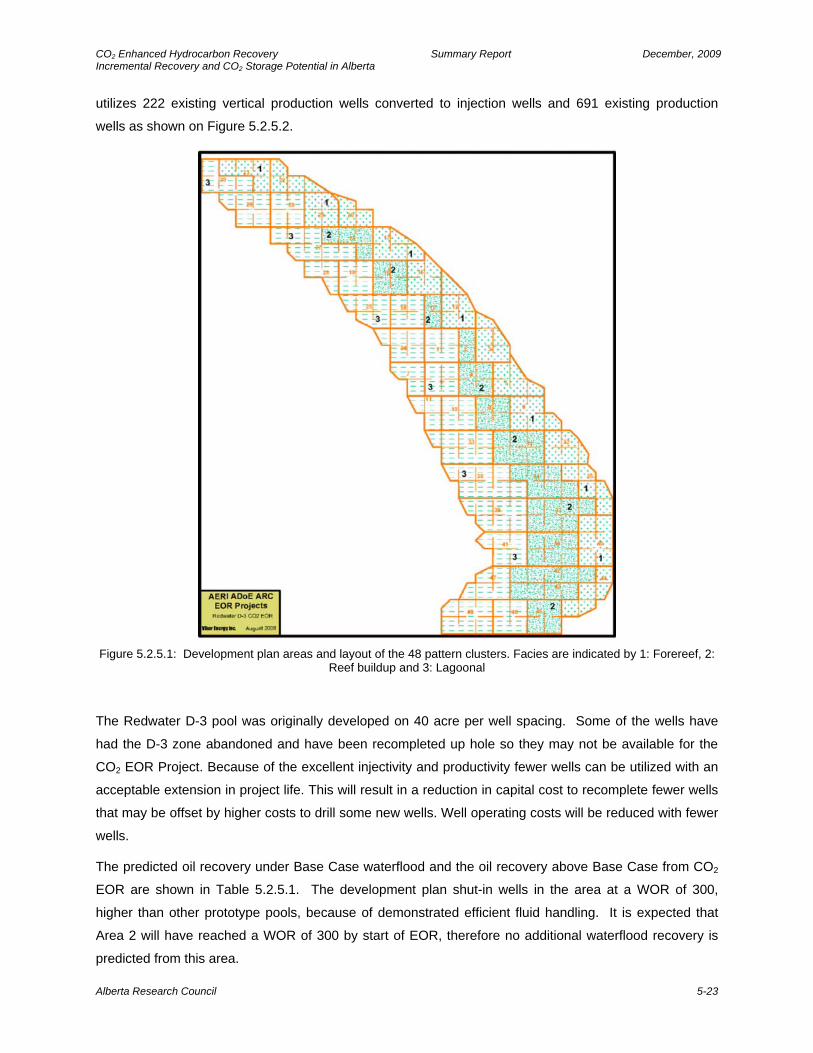
CO2 Enhanced Hydrocarbon Recovery Summary Report December, 2009 Incremental Recovery and CO2 Storage Potential in Alberta
utilizes 222 existing vertical production wells converted to injection wells and 691 existing production
wells as shown on Figure 5.2.5.2.
Figure 5.2.5.1: Development plan areas and layout of the 48 pattern clusters. Facies are indicated by 1: Forereef, 2:
Reef buildup and 3: Lagoonal
The Redwater D-3 pool was originally developed on 40 acre per well spacing. Some of the wells have
had the D-3 zone abandoned and have been recompleted up hole so they may not be available for the
CO2 EOR Project. Because of the excellent injectivity and productivity fewer wells can be utilized with an
acceptable extension in project life. This will result in a reduction in capital cost to recomplete fewer wells
that may be offset by higher costs to drill some new wells. Well operating costs will be reduced with fewer
wells.
The predicted oil recovery under Base Case waterflood and the oil recovery above Base Case from CO2
EOR are shown in Table 5.2.5.1. The development plan shut-in wells in the area at a WOR of 300,
higher than other prototype pools, because of demonstrated efficient fluid handling. It is expected that
Area 2 will have reached a WOR of 300 by start of EOR, therefore no additional waterflood recovery is
predicted from this area.
Alberta Research Council 5-23

CO2 Enhanced Hydrocarbon Recovery Summary Report December, 2009 Incremental Recovery and CO2 Storage Potential in Alberta
Figure 5.2.5.2: Layout of Patterns used for Development Plan
The full area production forecast is generated using fractional flow curves derived from the modeling of
the 3 areas in the development area for continued waterflood using current strategy to a WOR of 300 and
CO2 EOR at a WAG of 1:1. Table 5.2.5.1 shows the total %HCPV of CO2 and water, injected during WAG
injection followed by chase water. The forecast for all the areas used a total injection up to 500% HCPV.
The CO2 injected, produced and stored are shown on Table 5.2.5.2. The CO2 injection forecast is that
required to meet simulation prediction. In order to maximize CO2 storage all produced CO2 should be
reinjected. This would also increase oil recovery.
Figure 5.2.5.3 shows the main new gathering system (in blue) and CO2 and water injection lines (in red).
In addition to the lines shown, an 800 m line to all wells was also included. As the injection wells are
converted from existing producers, a complete new water injection system was installed. A complete new
gathering system was installed to operate at high pressure, potential corrosion in existing system and
desire to produce low CO2 concentration wells to gas plant rather than dilute produced CO2.
Alberta Research Council 5-24
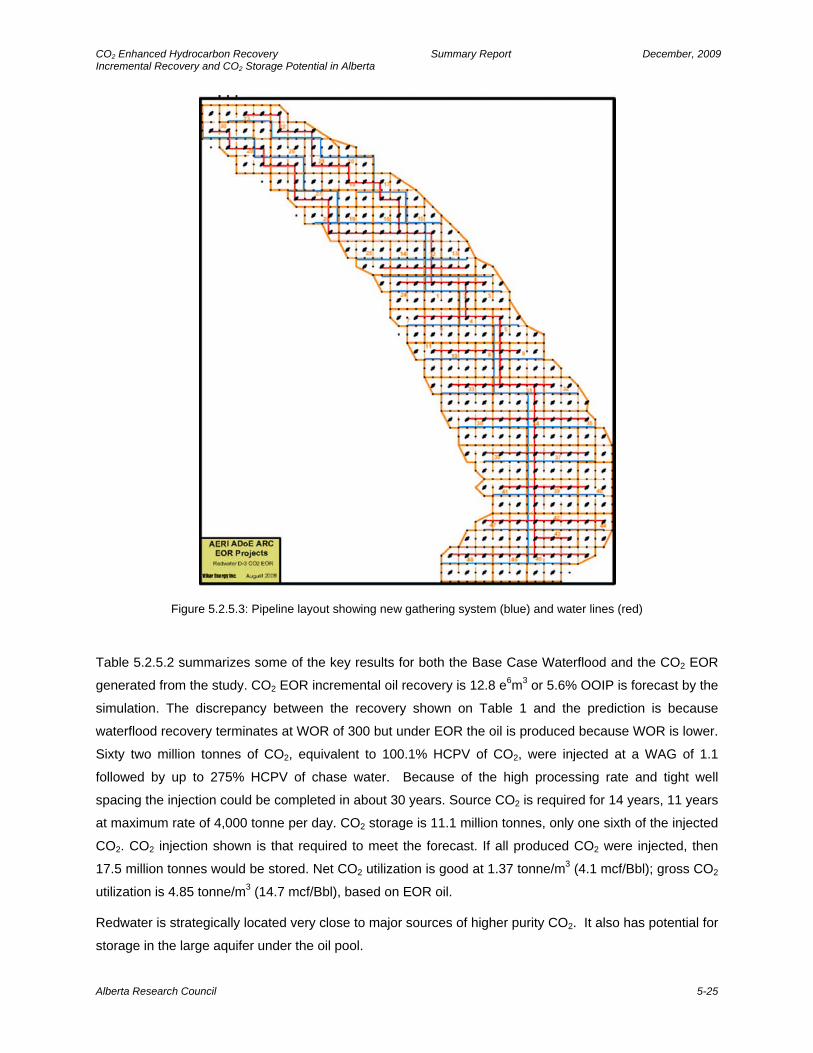
CO2 Enhanced Hydrocarbon Recovery Summary Report December, 2009 Incremental Recovery and CO2 Storage Potential in Alberta
Figure 5.2.5.3: Pipeline layout showing new gathering system (blue) and water lines (red)
Table 5.2.5.2 summarizes some of the key results for both the Base Case Waterflood and the CO2 EOR
generated from the study. CO2 EOR incremental oil recovery is 12.8 e6m3 or 5.6% OOIP is forecast by the
simulation. The discrepancy between the recovery shown on Table 1 and the prediction is because
waterflood recovery terminates at WOR of 300 but under EOR the oil is produced because WOR is lower.
Sixty two million tonnes of CO2, equivalent to 100.1% HCPV of CO2, were injected at a WAG of 1.1
followed by up to 275% HCPV of chase water. Because of the high processing rate and tight well
spacing the injection could be completed in about 30 years. Source CO2 is required for 14 years, 11 years
at maximum rate of 4,000 tonne per day. CO2 storage is 11.1 million tonnes, only one sixth of the injected
CO2. CO2 injection shown is that required to meet the forecast. If all produced CO2 were injected, then
17.5 million tonnes would be stored. Net CO2 utilization is good at 1.37 tonne/m3 (4.1 mcf/Bbl); gross CO2
utilization is 4.85 tonne/m3 (14.7 mcf/Bbl), based on EOR oil.
Redwater is strategically located very close to major sources of higher purity CO2. It also has potential for
storage in the large aquifer under the oil pool.
Alberta Research Council 5-25

CO2 Enhanced Hydrocarbon Recovery Summary Report December, 2009 Incremental Recovery and CO2 Storage Potential in Alberta
Alberta Research Council 5-26
Table 5.2.5.2 Redwater D-3 CO2 EOR Summary of Results
OOIP 226.7 e3m3 1,426 106 Bbl Oil Production
Base Case 1,781 e3m3 11,204 103 Bbl 0.8% estimate CO2 EOR 12,778 e3m3 80,369 103 Bbl 5.6% "T" Factor
Total 14,559 e3m3 91,573 103 Bbl 6.4% 0.88 Natural Gas Sales 0 e6m3 0.0 bcf CO2 Injection 62,022 Gg 33,325 e6m3 1,182.8 bcf 100.1%CO2 Purchased 17,482 Gg 9,393 e6m3 333.4 bcf 28.2%CO2 Production 50,935 Gg 27,367 e6m3 971.4 bcf 82.2%
WAG Ratio 1:1 Maximum Source CO2 11 years Maximum purchased CO2 4,000 Mg/d 76.3 mmcf/d Maximum injected CO2 15,699 Mg/d 299.4 mmcf/d CO2 Utilization Factor (CO2 EOR oil only) Gross 4.85 t/m3 14.72 mcf/Bbl
Net 1.37 t/m3 4.15 mcf/Bbl Water Injection % HCPV
Chase & WF 682.2 e6m3 4,291 106 Bbl 275.4% WAG 280 e6m3 1,758 106 Bbl 112.8%
Risk Factors
The most significant technical risks include: 1. The flood must be operated at near miscible conditions to achieve predicted recovery. Reaching
this pressure may be difficult with the underlying aquifer that is connected with the massive Cooking Lake aquifer.
2. The operating pressure and temperature are very close to CO2 critical point complicating the performance prediction.
3. Whether the CO2 flood can be operated as a vertical or horizontal displacement process is uncertain. The geological analysis used in this study suggests that barriers could preclude a vertical displacement process. The operator does not believe these barriers are continuous and is piloting to see if vertical displacement can be achieved. The horizontal displacement process evaluated in this study should be more conservative than a vertical displacement process.
4. Gravity override will very negatively impact a horizontal displacement process in the thick zones as the CO2 is much lighter than oil (250 kg/m3) at operating conditions.
5. If reservoir pressure could be increased to hydrostatic level, CO2 density could be increased to about 700 kg/m3 reducing gravity override and increasing CO2 storage, but utilization factor would be much poorer.
6. The pool has many old wells, is relatively shallow and is proximate to areas with significant population and hence safety precautions will be critical.
A field pilot test will be necessary to confirm that the CO2 will mobilize sufficient residual oil at achievable operating conditions.
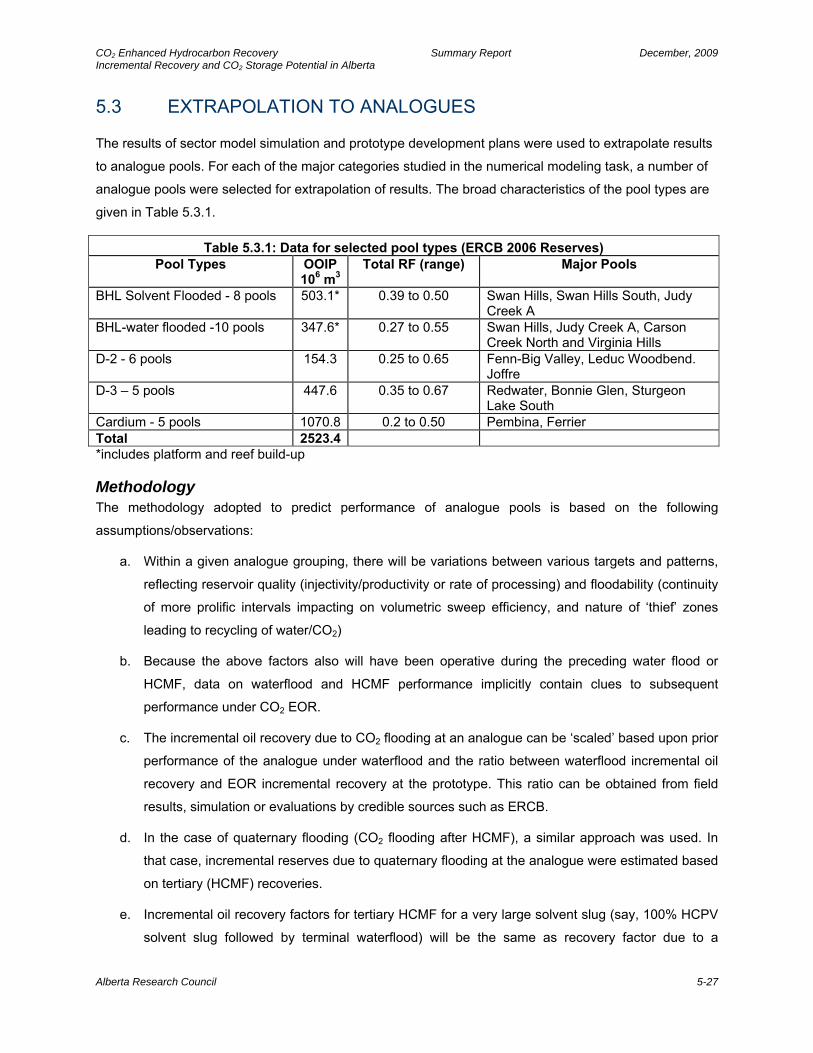
CO2 Enhanced Hydrocarbon Recovery Summary Report December, 2009 Incremental Recovery and CO2 Storage Potential in Alberta
5.3 EXTRAPOLATION TO ANALOGUES
The results of sector model simulation and prototype development plans were used to extrapolate results
to analogue pools. For each of the major categories studied in the numerical modeling task, a number of
analogue pools were selected for extrapolation of results. The broad characteristics of the pool types are
given in Table 5.3.1.
Table 5.3.1: Data for selected pool types (ERCB 2006 Reserves) Pool Types OOIP
106 m3Total RF (range) Major Pools
BHL Solvent Flooded - 8 pools 503.1* 0.39 to 0.50 Swan Hills, Swan Hills South, Judy Creek A
BHL-water flooded -10 pools 347.6* 0.27 to 0.55 Swan Hills, Judy Creek A, Carson Creek North and Virginia Hills
D-2 - 6 pools 154.3 0.25 to 0.65 Fenn-Big Valley, Leduc Woodbend. Joffre
D-3 – 5 pools 447.6 0.35 to 0.67 Redwater, Bonnie Glen, Sturgeon Lake South
Cardium - 5 pools 1070.8 0.2 to 0.50 Pembina, Ferrier Total 2523.4 *includes platform and reef build-up
Methodology The methodology adopted to predict performance of analogue pools is based on the following
assumptions/observations:
a. Within a given analogue grouping, there will be variations between various targets and patterns,
reflecting reservoir quality (injectivity/productivity or rate of processing) and floodability (continuity
of more prolific intervals impacting on volumetric sweep efficiency, and nature of ‘thief’ zones
leading to recycling of water/CO2)
b. Because the above factors also will have been operative during the preceding water flood or
HCMF, data on waterflood and HCMF performance implicitly contain clues to subsequent
performance under CO2 EOR.
c. The incremental oil recovery due to CO2 flooding at an analogue can be ‘scaled’ based upon prior
performance of the analogue under waterflood and the ratio between waterflood incremental oil
recovery and EOR incremental recovery at the prototype. This ratio can be obtained from field
results, simulation or evaluations by credible sources such as ERCB.
d. In the case of quaternary flooding (CO2 flooding after HCMF), a similar approach was used. In
that case, incremental reserves due to quaternary flooding at the analogue were estimated based
on tertiary (HCMF) recoveries.
e. Incremental oil recovery factors for tertiary HCMF for a very large solvent slug (say, 100% HCPV
solvent slug followed by terminal waterflood) will be the same as recovery factor due to a
Alberta Research Council 5-27
CO2 Enhanced Hydrocarbon Recovery Summary Report December, 2009 Incremental Recovery and CO2 Storage Potential in Alberta
combination of partial tertiary flood (say 15% HCPV solvent slug) followed by 100% HCPV CO2
injection in the WAG mode, followed by a terminal water flood. This assumption was necessary
for this exercise because of availability of limited amount of field/simulation results.
f. CO2 injection occurs simultaneously (or phased in the same manner as done at the prototype) at
the entire analogue area.
g. When certain pieces of specific reservoir data were missing, it was assumed that ERCB reserves
data are valid for the prototype as well as various specific analogues.
Forecasting Steps
1. Verify if the areas indicated as analogous from geology are also analogous from performance
point of view. This involves extracting and comparing historical production data from the ERCB
data base of both the analogue pools and the prototype areas used in preparing the development
plan for the prototype.
2. Verify if the data from prototypes can be readily extrapolated to analogs. (Are there different
dominating mechanisms or influences from adjoining regions?)
3. Determine/estimate various incremental recovery factors based on assumptions c. to e. This
involves plotting calendar day oil production rate and oil cut for each analogue and prototype area
versus the respective cumulative oil production and extrapolating the curves to an economic limit
(oil cut 1%, oil rate 1 m3/d). Ideally these curves should converge to the same point on the
cumulative oil axis.
4. Perform analyses in a non-dimensional basis (∆ RF (%OOIP); slug size expressed in HCPV).
Injection/production rates can be ‘scaled’ based on ratios of historic processing rates during
waterflooding in the prototype and analogue.
5.3.1 Beaverhill Lake Pools
Prototype Pool/Areas Selected
The prototype for waterflooded BHL pools was based on the Judy Creek BHL A pool sector model and
the BHL A&B pool waterflooded Area Models to which results of the Judy Creek sector model were
extrapolated. The BHL waterflood areas were designated:
WFA1 located along the western reef rim. This is an area that has had relatively little
injection/production. Data based on only 5 operating wells may not be representative when the
area is infilled to complete various proposed patterns. WF performance here was not very
promising and correspondingly, EOR here may need to be closely scrutinized.
WFA2 located along the western reef rim to the north of WFA1. The area is of intermediate
reservoir quality and has produced from 22 wells.
Alberta Research Council 5-28
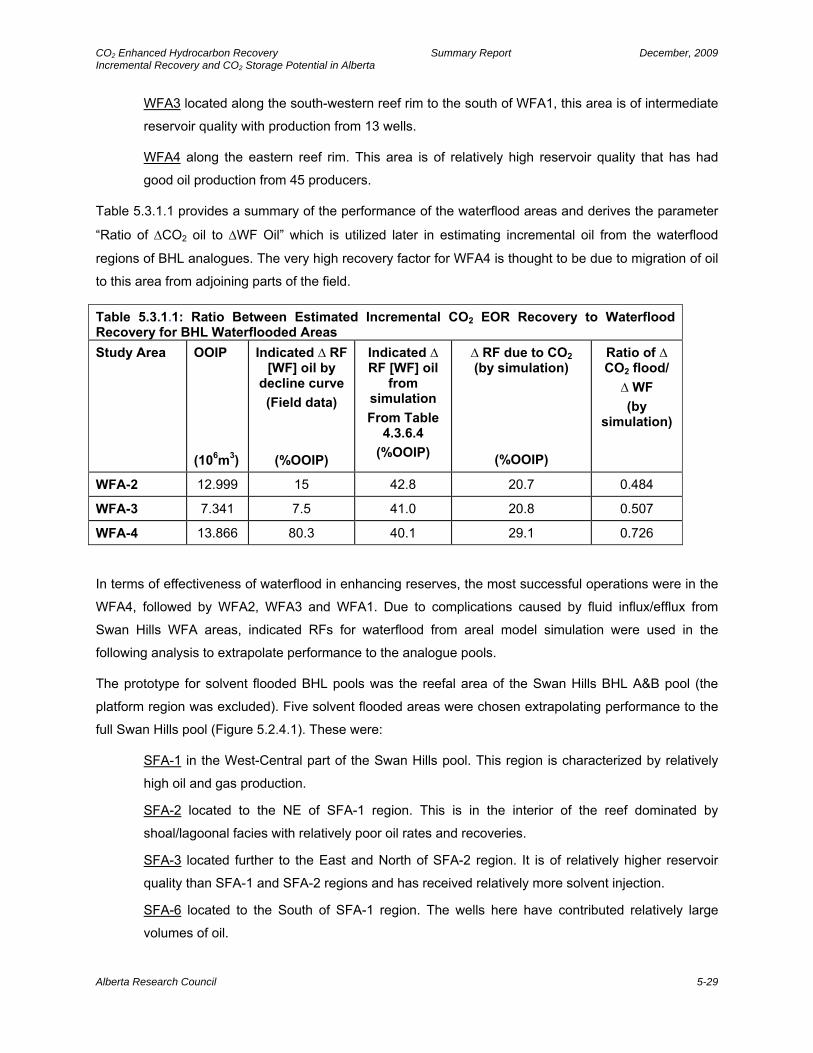
CO2 Enhanced Hydrocarbon Recovery Summary Report December, 2009 Incremental Recovery and CO2 Storage Potential in Alberta
WFA3 located along the south-western reef rim to the south of WFA1, this area is of intermediate
reservoir quality with production from 13 wells.
WFA4 along the eastern reef rim. This area is of relatively high reservoir quality that has had
good oil production from 45 producers.
Table 5.3.1.1 provides a summary of the performance of the waterflood areas and derives the parameter
“Ratio of ΔCO2 oil to ΔWF Oil” which is utilized later in estimating incremental oil from the waterflood
regions of BHL analogues. The very high recovery factor for WFA4 is thought to be due to migration of oil
to this area from adjoining parts of the field.
Table 5.3.1.1: Ratio Between Estimated Incremental CO2 EOR Recovery to Waterflood Recovery for BHL Waterflooded Areas Study Area OOIP
(106m3)
Indicated ∆ RF [WF] oil by
decline curve (Field data)
(%OOIP)
Indicated ∆ RF [WF] oil
from simulation From Table
4.3.6.4 (%OOIP)
∆ RF due to CO2 (by simulation)
(%OOIP)
Ratio of ∆ CO2 flood/
∆ WF (by
simulation)
WFA-2 12.999 15 42.8 20.7 0.484
WFA-3 7.341 7.5 41.0 20.8 0.507
WFA-4 13.866 80.3 40.1 29.1 0.726
In terms of effectiveness of waterflood in enhancing reserves, the most successful operations were in the
WFA4, followed by WFA2, WFA3 and WFA1. Due to complications caused by fluid influx/efflux from
Swan Hills WFA areas, indicated RFs for waterflood from areal model simulation were used in the
following analysis to extrapolate performance to the analogue pools.
The prototype for solvent flooded BHL pools was the reefal area of the Swan Hills BHL A&B pool (the
platform region was excluded). Five solvent flooded areas were chosen extrapolating performance to the
full Swan Hills pool (Figure 5.2.4.1). These were:
SFA-1 in the West-Central part of the Swan Hills pool. This region is characterized by relatively
high oil and gas production.
SFA-2 located to the NE of SFA-1 region. This is in the interior of the reef dominated by
shoal/lagoonal facies with relatively poor oil rates and recoveries.
SFA-3 located further to the East and North of SFA-2 region. It is of relatively higher reservoir
quality than SFA-1 and SFA-2 regions and has received relatively more solvent injection.
SFA-6 located to the South of SFA-1 region. The wells here have contributed relatively large
volumes of oil.
Alberta Research Council 5-29

CO2 Enhanced Hydrocarbon Recovery Summary Report December, 2009 Incremental Recovery and CO2 Storage Potential in Alberta
SFA-7 region located to the South and East of SFA-6 region. This region has received a relatively
large amount of solvent and contributed a large amount of oil.
Wells in each of the above regions were selected to include existing flooding patterns. Adjoining regions
thus share common producers.
Rationale for Selecting Prototype Areas The selection of the prototype areas was made on the basis of geology and production history. Each of
the Beaverhill Lake pools consists of several pay intervals, separated by thick dense intervals. These pay
intervals coalesce in the fore-reef region. The back-reef/interior regions are dominated by shoal/lagoonal
facies. The five solvent flooded regions have different combinations of shoal/lagoonal facies within the
fore-reef/ back reef.
Analogous Pools/ Areas The main CO2-EOR targets in the category of non-solvent flooded (or water flooded) Beaverhill Lake
reservoirs include Carson Creek North (A & B), Snipe Lake and Simonette A and B, besides the non-
solvent flooded portions of larger pools such as Swan Hills. Carson Creek North is a limestone reef
whereas Snipe Lake is a dolomite reef. Both these have been subjected to line drive water flood with
relatively strong waterflood performance. Carson Creek North is the largest of these targets and has also
performed much better in terms of recovery factors for primary and water flooding mechanisms.
Solvent flooded Beaverhill Lake pools analogous to the Swan Hills prototype include Ante Creek, Goose
River*, Judy Creek A, Judy Creek B, Kaybob*, Swan Hills South, Virginia Hills. The two pools marked by
asterisk (*) are dolomite pools; the rest are mainly comprised of limestone. Tables 5.3.1.2 and 5.3.1.3
summarize the performance to date of the BHL pools considered in this study. As an historical aside, in
initial exploitation, only Imperial Oil injected water across the full face in their Swan Hills waterflood. Mobil
(Carson Creek N), Amoco (Swan Hills) and Shell (Virginia Hills) only followed this practice later. Initially
they injected water at the bottom of the formation. In these pools, waterflood recovery is understated and
HCM recovery is overstated.
The Beaverhill Lake analogue pools were examined in a geological context to determine which of the
prototype area models they most resembled. Table 5.3.1.4 shows the assigned areal simulation upon
which the analogue projections were based.
Various wells in the prototype and analogous BHL pools have performed strongly during primary, water
flooding and solvent flooding periods, spanning about 50 years. Oil rate decline has been very gradual
during the above three phases of exploitation. Whereas water injection helped in enhancing overall oil
production, the response to solvent flooding has largely been subtle whereby the decline in oil rate was
significantly arrested, leading to more than 45% oil recovery to-date and oil rates that are still very strong
(although an order of magnitude lower than the peak oil rates).
Alberta Research Council 5-30
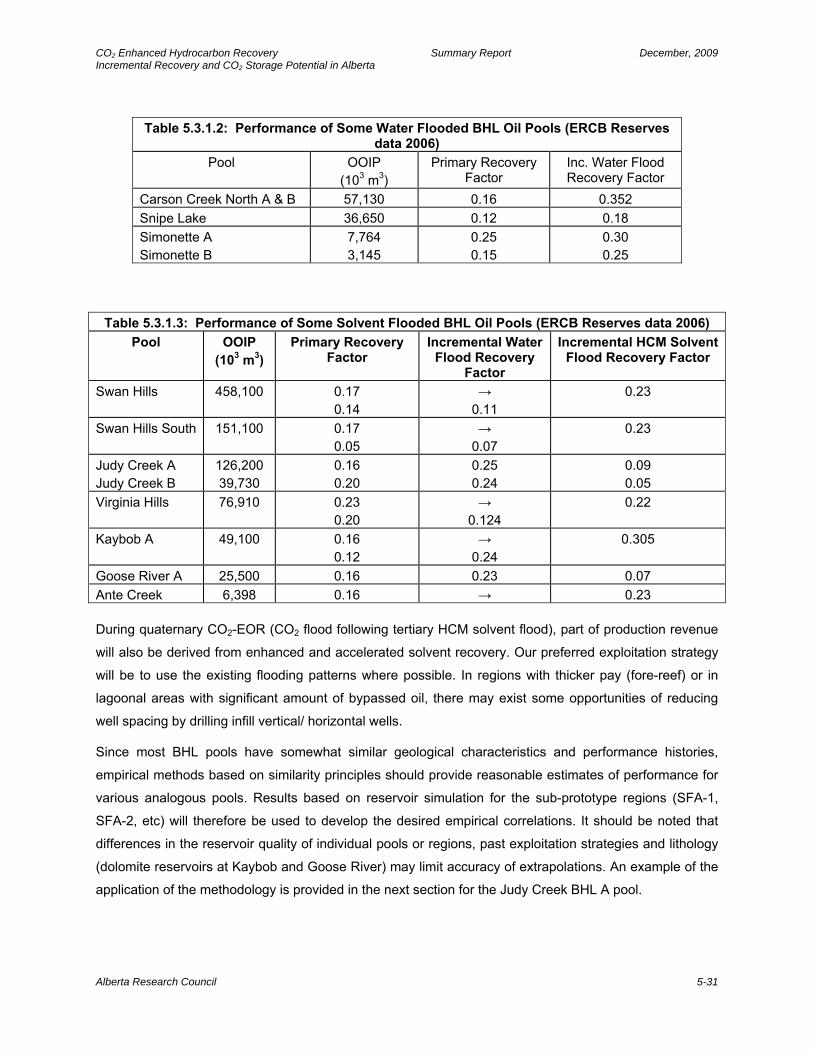
CO2 Enhanced Hydrocarbon Recovery Summary Report December, 2009 Incremental Recovery and CO2 Storage Potential in Alberta
Alberta Research Council 5-31
Table 5.3.1.2: Performance of Some Water Flooded BHL Oil Pools (ERCB Reserves data 2006)
Pool OOIP (103 m3)
Primary Recovery Factor
Inc. Water Flood Recovery Factor
Carson Creek North A & B 57,130 0.16 0.352 Snipe Lake 36,650 0.12 0.18 Simonette A Simonette B
7,764 3,145
0.25 0.15
0.30 0.25
Table 5.3.1.3: Performance of Some Solvent Flooded BHL Oil Pools (ERCB Reserves data 2006) Pool OOIP
(103 m3) Primary Recovery
Factor Incremental Water
Flood Recovery Factor
Incremental HCM Solvent Flood Recovery Factor
Swan Hills 458,100 0.17 0.14
→ 0.11
0.23
Swan Hills South 151,100 0.17 0.05
→ 0.07
0.23
Judy Creek A Judy Creek B
126,200 39,730
0.16 0.20
0.25 0.24
0.09 0.05
Virginia Hills 76,910 0.23 0.20
→ 0.124
0.22
Kaybob A 49,100 0.16 0.12
→ 0.24
0.305
Goose River A 25,500 0.16 0.23 0.07 Ante Creek 6,398 0.16 → 0.23 During quaternary CO2-EOR (CO2 flood following tertiary HCM solvent flood), part of production revenue
will also be derived from enhanced and accelerated solvent recovery. Our preferred exploitation strategy
will be to use the existing flooding patterns where possible. In regions with thicker pay (fore-reef) or in
lagoonal areas with significant amount of bypassed oil, there may exist some opportunities of reducing
well spacing by drilling infill vertical/ horizontal wells.
Since most BHL pools have somewhat similar geological characteristics and performance histories,
empirical methods based on similarity principles should provide reasonable estimates of performance for
various analogous pools. Results based on reservoir simulation for the sub-prototype regions (SFA-1,
SFA-2, etc) will therefore be used to develop the desired empirical correlations. It should be noted that
differences in the reservoir quality of individual pools or regions, past exploitation strategies and lithology
(dolomite reservoirs at Kaybob and Goose River) may limit accuracy of extrapolations. An example of the
application of the methodology is provided in the next section for the Judy Creek BHL A pool.
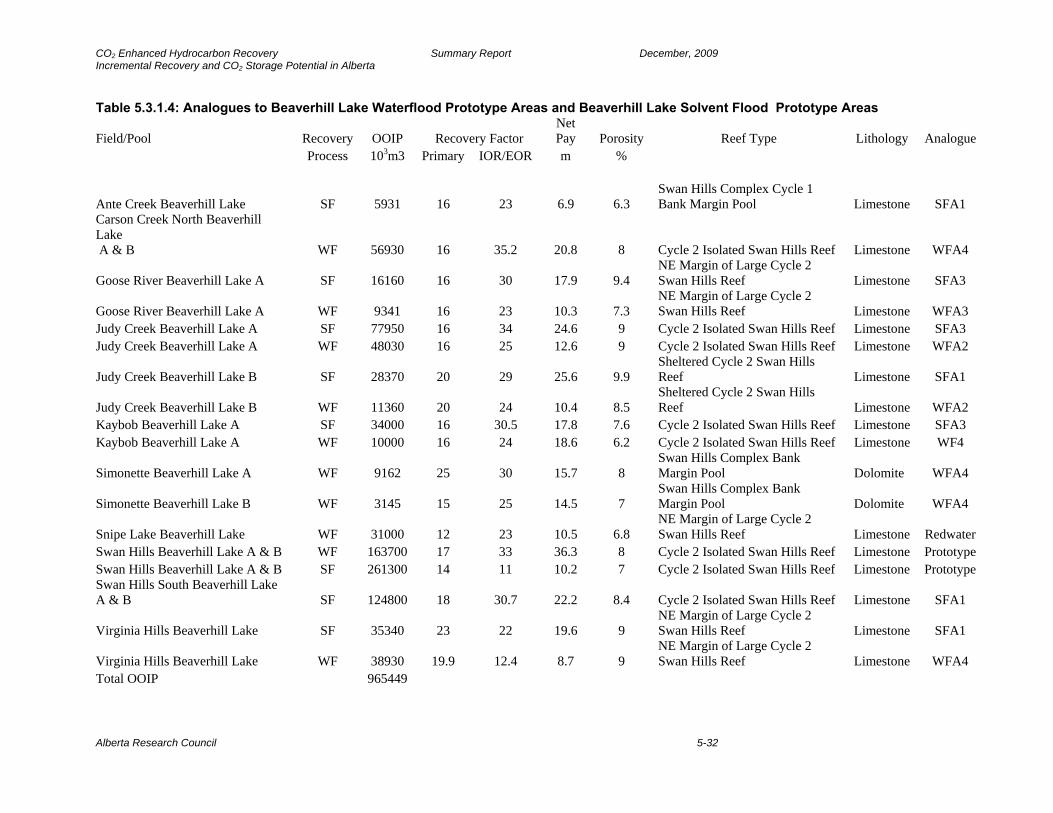
CO2 Enhanced Hydrocarbon Recovery Summary Report December, 2009 Incremental Recovery and CO2 Storage Potential in Alberta Table 5.3.1.4: Analogues to Beaverhill Lake Waterflood Prototype Areas and Beaverhill Lake Solvent Flood Prototype Areas
Field/Pool Recovery OOIP Recovery Factor Net Pay Porosity Reef Type Lithology Analogue
Process 103m3 Primary IOR/EOR m %
Ante Creek Beaverhill Lake SF 5931 16 23 6.9 6.3 Swan Hills Complex Cycle 1 Bank Margin Pool Limestone SFA1
Carson Creek North Beaverhill Lake A & B WF 56930 16 35.2 20.8 8 Cycle 2 Isolated Swan Hills Reef Limestone WFA4
Goose River Beaverhill Lake A SF 16160 16 30 17.9 9.4 NE Margin of Large Cycle 2 Swan Hills Reef Limestone SFA3
Goose River Beaverhill Lake A WF 9341 16 23 10.3 7.3 NE Margin of Large Cycle 2 Swan Hills Reef Limestone WFA3
Judy Creek Beaverhill Lake A SF 77950 16 34 24.6 9 Cycle 2 Isolated Swan Hills Reef Limestone SFA3 Judy Creek Beaverhill Lake A WF 48030 16 25 12.6 9 Cycle 2 Isolated Swan Hills Reef Limestone WFA2
Judy Creek Beaverhill Lake B SF 28370 20 29 25.6 9.9 Sheltered Cycle 2 Swan Hills Reef Limestone SFA1
Judy Creek Beaverhill Lake B WF 11360 20 24 10.4 8.5 Sheltered Cycle 2 Swan Hills Reef Limestone WFA2
Kaybob Beaverhill Lake A SF 34000 16 30.5 17.8 7.6 Cycle 2 Isolated Swan Hills Reef Limestone SFA3 Kaybob Beaverhill Lake A WF 10000 16 24 18.6 6.2 Cycle 2 Isolated Swan Hills Reef Limestone WF4
Simonette Beaverhill Lake A WF 9162 25 30 15.7 8 Swan Hills Complex Bank Margin Pool Dolomite WFA4
Simonette Beaverhill Lake B WF 3145 15 25 14.5 7 Swan Hills Complex Bank Margin Pool Dolomite WFA4
Snipe Lake Beaverhill Lake WF 31000 12 23 10.5 6.8 NE Margin of Large Cycle 2 Swan Hills Reef Limestone Redwater
Swan Hills Beaverhill Lake A & B WF 163700 17 33 36.3 8 Cycle 2 Isolated Swan Hills Reef Limestone Prototype Swan Hills Beaverhill Lake A & B SF 261300 14 11 10.2 7 Cycle 2 Isolated Swan Hills Reef Limestone Prototype Swan Hills South Beaverhill Lake A & B SF 124800 18 30.7 22.2 8.4 Cycle 2 Isolated Swan Hills Reef Limestone SFA1
Virginia Hills Beaverhill Lake SF 35340 23 22 19.6 9 NE Margin of Large Cycle 2 Swan Hills Reef Limestone SFA1
Virginia Hills Beaverhill Lake WF 38930 19.9 12.4 8.7 9 NE Margin of Large Cycle 2 Swan Hills Reef Limestone WFA4
Total OOIP 965449
Alberta Research Council 5-32

CO2 Enhanced Hydrocarbon Recovery Summary Report December, 2009 Incremental Recovery and CO2 Storage Potential in Alberta 5.3.1.1 Judy Creek BHL A Pool
Solvent flooded areas of Judy Creek BHL A pool were examined in sections 22, 23, 24, 25, 26, 27, 34, 35
and 36 of Township 63 Range 11 W5M; Sections 28, 29, 30, 31, 32 & 33 of Township 63 Range 10 W5M;
Sections 4, 5, 6, 7, 8 & 9 of Township 64 Range 10 W5M; and Sections 1, 2, 3, 1 & 11 of Township 64
Range 11 W5M.
The pool is operated by Pengrowth and has been extensively developed under HCMF using ethane as
the HCM solvent. Many of the original HCMF patterns, now under chase waterflood, continue to produce
injected HC solvent. New HCMF solvent flood patterns are added as produced ethane becomes
available. As noted in Figures 5.3.1.1 to 5.3.1.4, the most prolific area of Judy Creek A (and the area with
the most solvent injection) is in the north-east part of the pool. Areas to the south and west are much less
productive. The number of waterflood patterns continues to decrease as more solvent flood patterns are
added. Comparable plots of the performance of the Swan Hills waterflooded prototype area WFA2 and
the Swan Hills solvent flooded prototype area SFA3 that are used as comparison for the methodology are
provided in Figures 5.3.1.5 to 5.3.1.7 and Figures 5.3.1.8 to 5.3.1.11, respectively.
Figure 5.3.1.1: Distribution of Cumulative oil produced (Judy Creek A Solvent Flood area)
Alberta Research Council 5-33
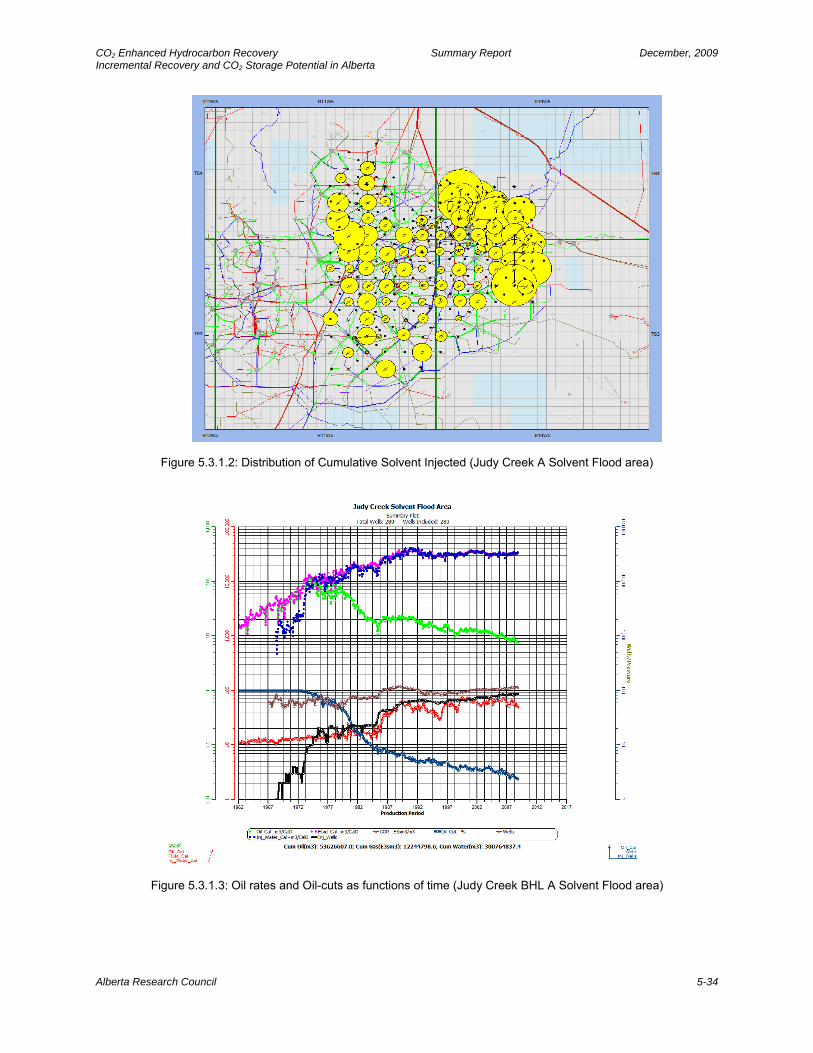
CO2 Enhanced Hydrocarbon Recovery Summary Report December, 2009 Incremental Recovery and CO2 Storage Potential in Alberta
Figure 5.3.1.2: Distribution of Cumulative Solvent Injected (Judy Creek A Solvent Flood area)
Figure 5.3.1.3: Oil rates and Oil-cuts as functions of time (Judy Creek BHL A Solvent Flood area)
Alberta Research Council 5-34

CO2 Enhanced Hydrocarbon Recovery Summary Report December, 2009 Incremental Recovery and CO2 Storage Potential in Alberta
Figure 5.3.1.4: Oil rates and Oil-cuts as functions of Cumulative Oil produced (Judy Creek BHL A Solvent Flood area)
Figure 5.3.1.5: Distribution of Cumulative Oil Produced in the Swan Hills WFA2 area model
Alberta Research Council 5-35
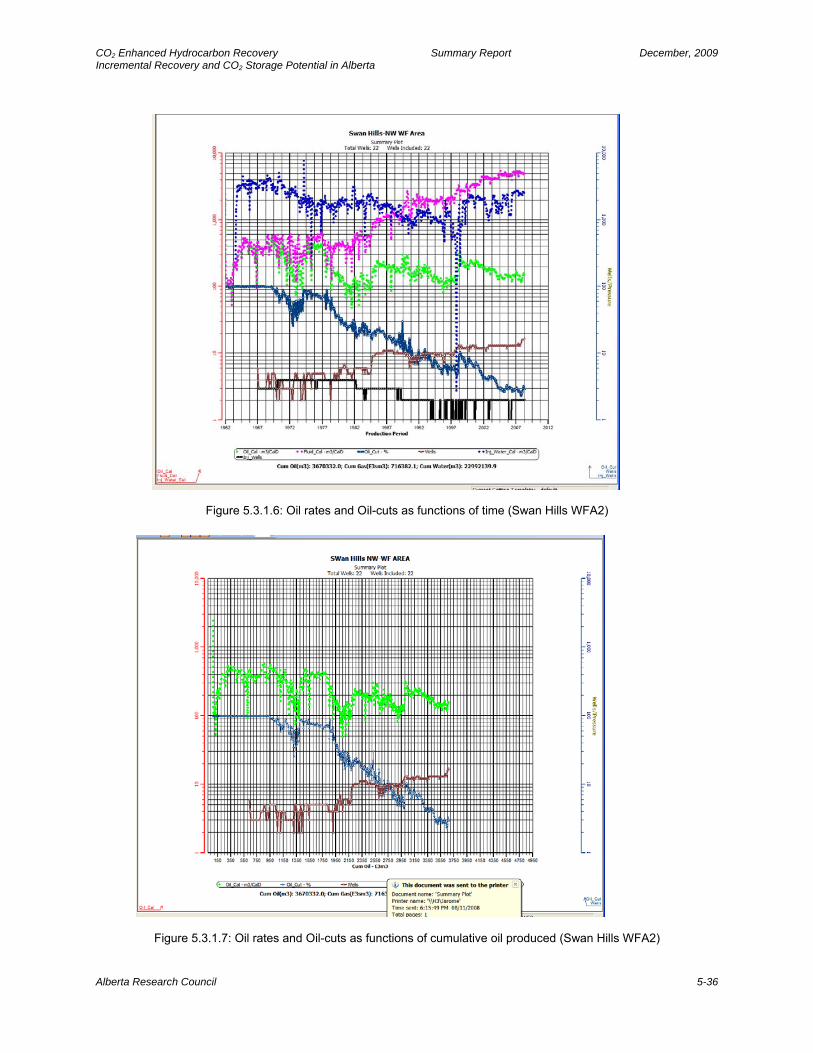
CO2 Enhanced Hydrocarbon Recovery Summary Report December, 2009 Incremental Recovery and CO2 Storage Potential in Alberta
Figure 5.3.1.6: Oil rates and Oil-cuts as functions of time (Swan Hills WFA2)
Figure 5.3.1.7: Oil rates and Oil-cuts as functions of cumulative oil produced (Swan Hills WFA2)
Alberta Research Council 5-36

CO2 Enhanced Hydrocarbon Recovery Summary Report December, 2009 Incremental Recovery and CO2 Storage Potential in Alberta
Figure 5.3.1.8: Distribution of Cumulative Oil Produced Solvent Flood Prototype Area SFA3
Cum. Solvent Inj.
Figure 5.3.1.9: Distribution of Cumulative Solvent Injected Solvent Flood Prototype Area SFA3
Alberta Research Council 5-37

CO2 Enhanced Hydrocarbon Recovery Summary Report December, 2009 Incremental Recovery and CO2 Storage Potential in Alberta
F
Figure 5.3.1.11: Oil rates and Oil-cuts as functions of Cumulative Oil produced Solvent Flood Prototype Area SFA3
igure 5.3.1.10: Oil rates and Oil-cuts as functions of time Solvent Flood Prototype Area SFA3
Alberta Research Council 5-38
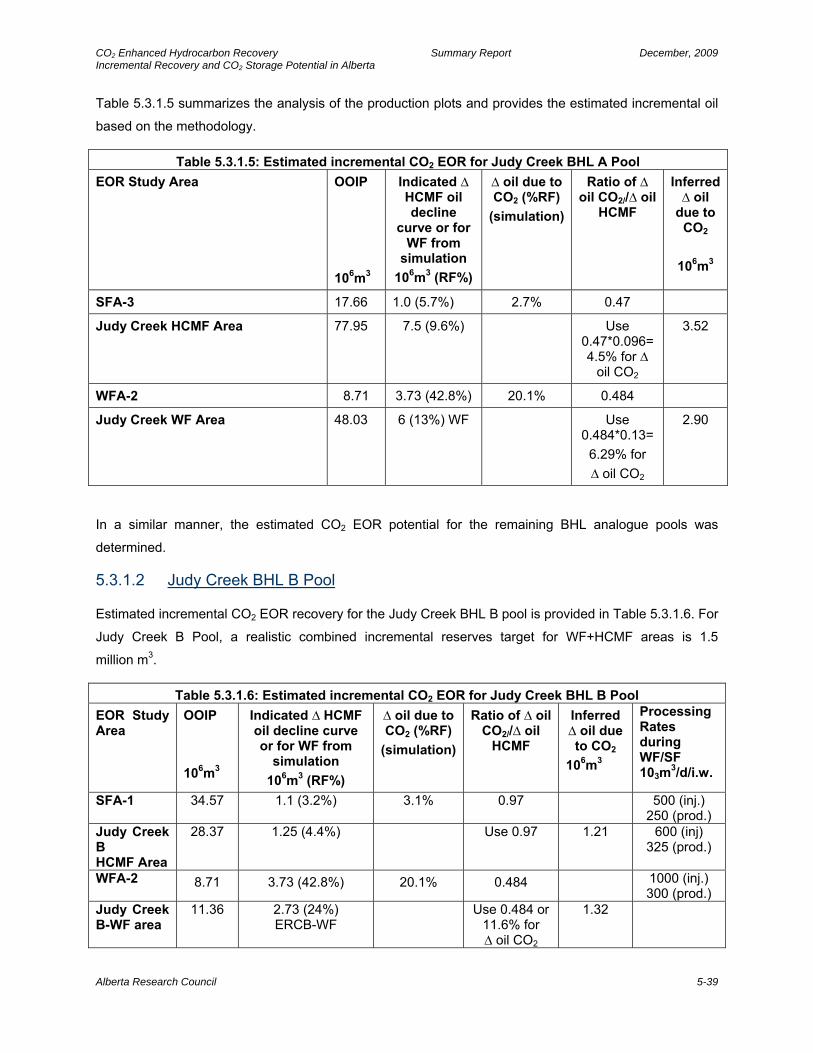
CO2 Enhanced Hydrocarbon Recovery Summary Report December, 2009 Incremental Recovery and CO2 Storage Potential in Alberta Table 5.3.1.5 summarizes the analysis of the production plots and provides the estimated incremental oil
based on the methodology.
Table 5.3.1.5: Estimated incremental CO2 EOR for Judy Creek BHL A Pool EOR Study Area OOIP
106m3
Indicated ∆ HCMF oil decline
curve or for WF from
simulation 106m3 (RF%)
∆ oil due to CO2 (%RF)
(simulation)
Ratio of ∆ oil CO2//∆ oil
HCMF
Inferred ∆ oil
due to CO2
106m3
SFA-3 17.66 1.0 (5.7%) 2.7% 0.47
Judy Creek HCMF Area 77.95 7.5 (9.6%) Use 0.47*0.096=4.5% for ∆
oil CO2
3.52
WFA-2 8.71 3.73 (42.8%) 20.1% 0.484
Judy Creek WF Area 48.03 6 (13%) WF Use 0.484*0.13=
6.29% for ∆ oil CO2
2.90
In a similar manner, the estimated CO2 EOR potential for the remaining BHL analogue pools was
determined.
5.3.1.2 Judy Creek BHL B Pool
Estimated incremental CO2 EOR recovery for the Judy Creek BHL B pool is provided in Table 5.3.1.6. For
Judy Creek B Pool, a realistic combined incremental reserves target for WF+HCMF areas is 1.5
million m3.
Table 5.3.1.6: Estimated incremental CO2 EOR for Judy Creek BHL B Pool EOR Study Area
OOIP 106m3
Indicated ∆ HCMF oil decline curve or for WF from
simulation 106m3 (RF%)
∆ oil due to CO2 (%RF)
(simulation)
Ratio of ∆ oil CO2//∆ oil
HCMF
Inferred ∆ oil due to CO2
106m3
Processing Rates during WF/SF 103m3/d/i.w.
SFA-1 34.57 1.1 (3.2%) 3.1% 0.97 500 (inj.) 250 (prod.)
Judy Creek B HCMF Area
28.37 1.25 (4.4%) Use 0.97 1.21 600 (inj) 325 (prod.)
WFA-2 8.71 3.73 (42.8%) 20.1% 0.484 1000 (inj.) 300 (prod.)
Judy Creek B-WF area
11.36 2.73 (24%) ERCB-WF
Use 0.484 or 11.6% for ∆ oil CO2
1.32
Alberta Research Council 5-39
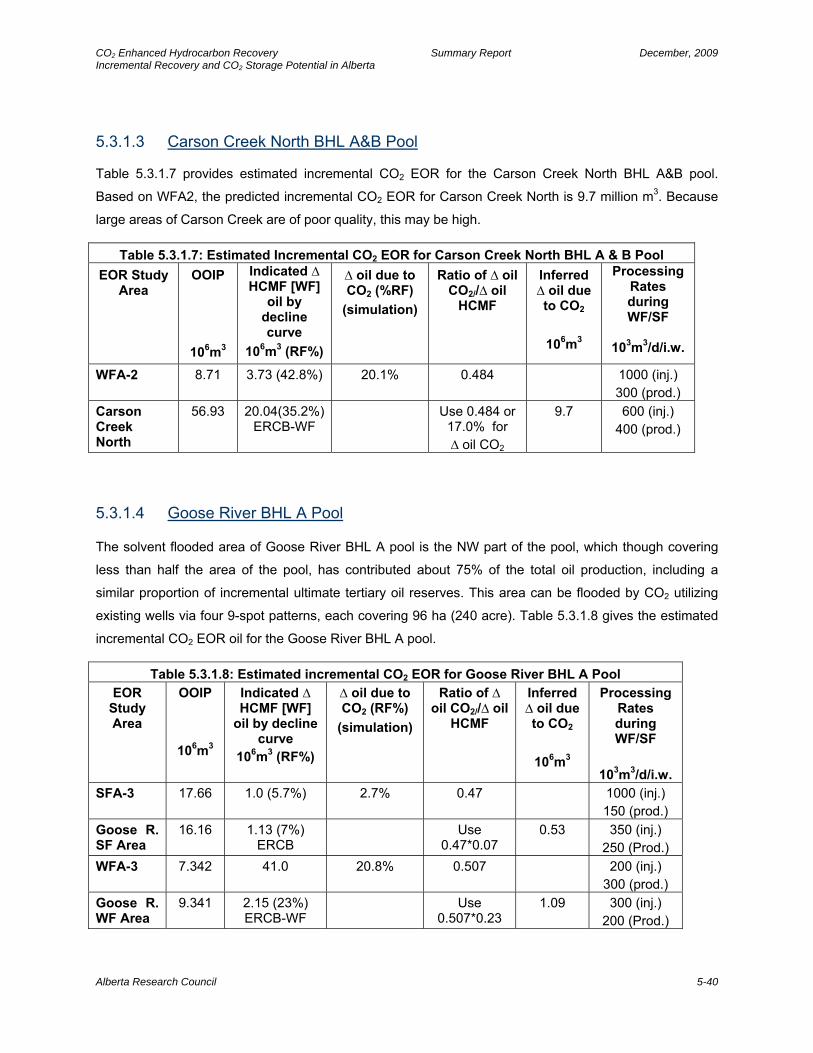
CO2 Enhanced Hydrocarbon Recovery Summary Report December, 2009 Incremental Recovery and CO2 Storage Potential in Alberta 5.3.1.3 Carson Creek North BHL A&B Pool Table 5.3.1.7 provides estimated incremental CO2 EOR for the Carson Creek North BHL A&B pool.
Based on WFA2, the predicted incremental CO2 EOR for Carson Creek North is 9.7 million m3. Because
large areas of Carson Creek are of poor quality, this may be high.
Table 5.3.1.7: Estimated Incremental CO2 EOR for Carson Creek North BHL A & B Pool EOR Study
Area OOIP
106m3
Indicated ∆ HCMF [WF]
oil by decline curve
106m3 (RF%)
∆ oil due to CO2 (%RF)
(simulation)
Ratio of ∆ oil CO2//∆ oil
HCMF
Inferred ∆ oil due to CO2
106m3
Processing Rates during WF/SF
103m3/d/i.w.
WFA-2 8.71 3.73 (42.8%) 20.1% 0.484 1000 (inj.) 300 (prod.)
Carson Creek North
56.93 20.04(35.2%) ERCB-WF
Use 0.484 or 17.0% for ∆ oil CO2
9.7
600 (inj.) 400 (prod.)
5.3.1.4 Goose River BHL A Pool
The solvent flooded area of Goose River BHL A pool is the NW part of the pool, which though covering
less than half the area of the pool, has contributed about 75% of the total oil production, including a
similar proportion of incremental ultimate tertiary oil reserves. This area can be flooded by CO2 utilizing
existing wells via four 9-spot patterns, each covering 96 ha (240 acre). Table 5.3.1.8 gives the estimated
incremental CO2 EOR oil for the Goose River BHL A pool.
Table 5.3.1.8: Estimated incremental CO2 EOR for Goose River BHL A Pool EOR
Study Area
OOIP
106m3
Indicated ∆ HCMF [WF]
oil by decline curve
106m3 (RF%)
∆ oil due to CO2 (RF%)
(simulation)
Ratio of ∆ oil CO2//∆ oil
HCMF
Inferred ∆ oil due to CO2
106m3
Processing Rates during WF/SF
103m3/d/i.w.
SFA-3 17.66 1.0 (5.7%) 2.7% 0.47 1000 (inj.) 150 (prod.)
Goose R. SF Area
16.16 1.13 (7%) ERCB
Use 0.47*0.07
0.53 350 (inj.) 250 (Prod.)
WFA-3 7.342 41.0 20.8% 0.507 200 (inj.) 300 (prod.)
Goose R. WF Area
9.341 2.15 (23%) ERCB-WF
Use 0.507*0.23
1.09 300 (inj.) 200 (Prod.)
Alberta Research Council 5-40
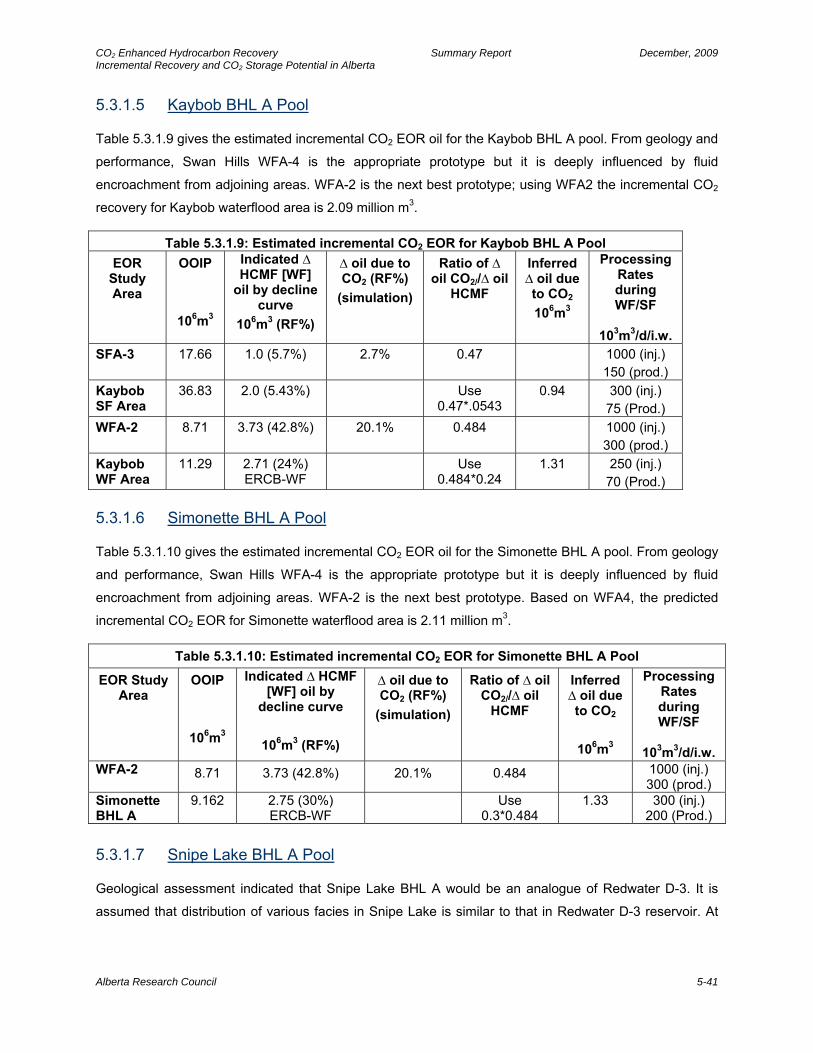
CO2 Enhanced Hydrocarbon Recovery Summary Report December, 2009 Incremental Recovery and CO2 Storage Potential in Alberta 5.3.1.5 Kaybob BHL A Pool
Table 5.3.1.9 gives the estimated incremental CO2 EOR oil for the Kaybob BHL A pool. From geology and
performance, Swan Hills WFA-4 is the appropriate prototype but it is deeply influenced by fluid
encroachment from adjoining areas. WFA-2 is the next best prototype; using WFA2 the incremental CO2
recovery for Kaybob waterflood area is 2.09 million m3.
Table 5.3.1.9: Estimated incremental CO2 EOR for Kaybob BHL A Pool EOR
Study Area
OOIP
106m3
Indicated ∆ HCMF [WF]
oil by decline curve
106m3 (RF%)
∆ oil due to CO2 (RF%)
(simulation)
Ratio of ∆ oil CO2//∆ oil
HCMF
Inferred ∆ oil due to CO2
106m3
Processing Rates during WF/SF
103m3/d/i.w.
SFA-3 17.66 1.0 (5.7%) 2.7% 0.47 1000 (inj.) 150 (prod.)
Kaybob SF Area
36.83 2.0 (5.43%) Use 0.47*.0543
0.94 300 (inj.) 75 (Prod.)
WFA-2 8.71 3.73 (42.8%) 20.1% 0.484 1000 (inj.) 300 (prod.)
Kaybob WF Area
11.29 2.71 (24%) ERCB-WF
Use 0.484*0.24
1.31 250 (inj.) 70 (Prod.)
5.3.1.6 Simonette BHL A Pool
Table 5.3.1.10 gives the estimated incremental CO2 EOR oil for the Simonette BHL A pool. From geology
and performance, Swan Hills WFA-4 is the appropriate prototype but it is deeply influenced by fluid
encroachment from adjoining areas. WFA-2 is the next best prototype. Based on WFA4, the predicted
incremental CO2 EOR for Simonette waterflood area is 2.11 million m3.
Table 5.3.1.10: Estimated incremental CO2 EOR for Simonette BHL A Pool
EOR Study Area
OOIP
106m3
Indicated ∆ HCMF [WF] oil by
decline curve
106m3 (RF%)
∆ oil due to CO2 (RF%)
(simulation)
Ratio of ∆ oil CO2//∆ oil
HCMF
Inferred ∆ oil due to CO2
106m3
Processing Rates during WF/SF
103m3/d/i.w.
WFA-2 8.71 3.73 (42.8%) 20.1% 0.484 1000 (inj.) 300 (prod.)
Simonette BHL A
9.162 2.75 (30%) ERCB-WF
Use 0.3*0.484
1.33 300 (inj.) 200 (Prod.)
5.3.1.7 Snipe Lake BHL A Pool
Geological assessment indicated that Snipe Lake BHL A would be an analogue of Redwater D-3. It is
assumed that distribution of various facies in Snipe Lake is similar to that in Redwater D-3 reservoir. At
Alberta Research Council 5-41
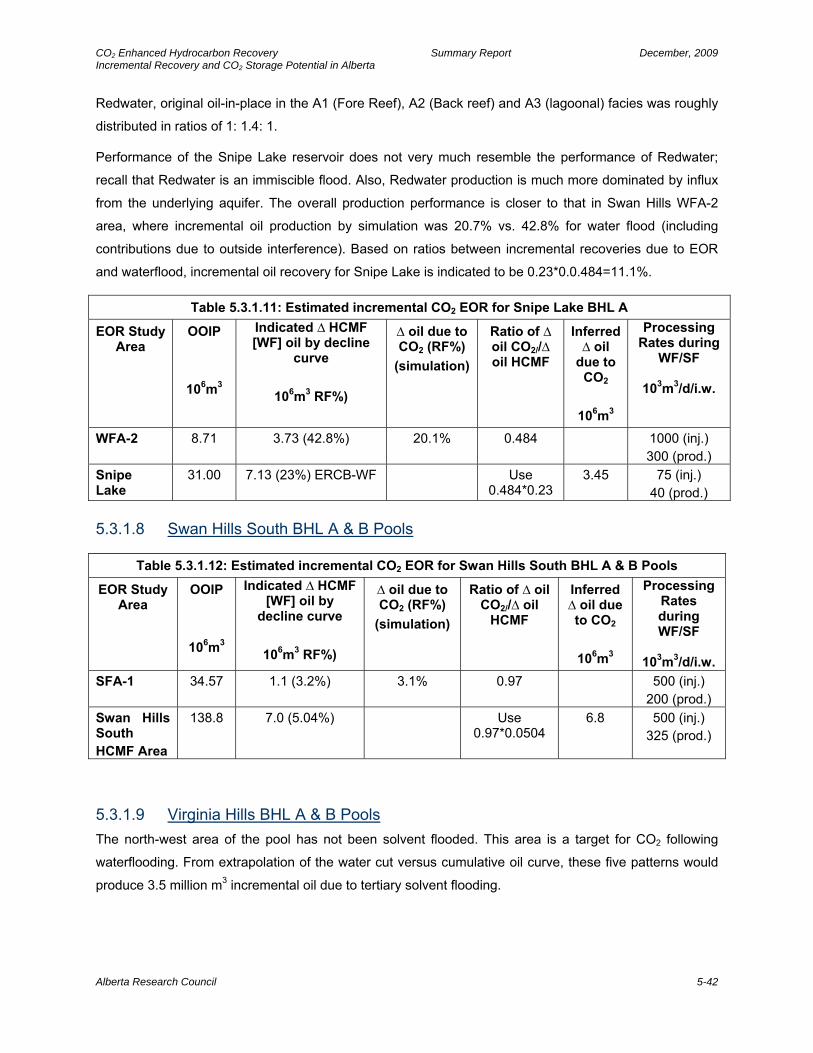
CO2 Enhanced Hydrocarbon Recovery Summary Report December, 2009 Incremental Recovery and CO2 Storage Potential in Alberta Redwater, original oil-in-place in the A1 (Fore Reef), A2 (Back reef) and A3 (lagoonal) facies was roughly
distributed in ratios of 1: 1.4: 1.
Performance of the Snipe Lake reservoir does not very much resemble the performance of Redwater;
recall that Redwater is an immiscible flood. Also, Redwater production is much more dominated by influx
from the underlying aquifer. The overall production performance is closer to that in Swan Hills WFA-2
area, where incremental oil production by simulation was 20.7% vs. 42.8% for water flood (including
contributions due to outside interference). Based on ratios between incremental recoveries due to EOR
and waterflood, incremental oil recovery for Snipe Lake is indicated to be 0.23*0.0.484=11.1%.
Table 5.3.1.11: Estimated incremental CO2 EOR for Snipe Lake BHL A
EOR Study Area
OOIP
106m3
Indicated ∆ HCMF [WF] oil by decline
curve
106m3 RF%)
∆ oil due to CO2 (RF%)
(simulation)
Ratio of ∆ oil CO2//∆ oil HCMF
Inferred ∆ oil
due to CO2
106m3
Processing Rates during
WF/SF
103m3/d/i.w.
WFA-2 8.71 3.73 (42.8%) 20.1% 0.484 1000 (inj.) 300 (prod.)
Snipe Lake
31.00 7.13 (23%) ERCB-WF Use 0.484*0.23
3.45 75 (inj.) 40 (prod.)
5.3.1.8 Swan Hills South BHL A & B Pools
Table 5.3.1.12: Estimated incremental CO2 EOR for Swan Hills South BHL A & B Pools
EOR Study Area
OOIP
106m3
Indicated ∆ HCMF [WF] oil by
decline curve
106m3 RF%)
∆ oil due to CO2 (RF%)
(simulation)
Ratio of ∆ oil CO2//∆ oil
HCMF
Inferred ∆ oil due to CO2
106m3
Processing Rates during WF/SF
103m3/d/i.w.
SFA-1 34.57 1.1 (3.2%) 3.1% 0.97 500 (inj.) 200 (prod.)
Swan Hills South HCMF Area
138.8 7.0 (5.04%) Use 0.97*0.0504
6.8 500 (inj.) 325 (prod.)
5.3.1.9 Virginia Hills BHL A & B Pools The north-west area of the pool has not been solvent flooded. This area is a target for CO2 following
waterflooding. From extrapolation of the water cut versus cumulative oil curve, these five patterns would
produce 3.5 million m3 incremental oil due to tertiary solvent flooding.
Alberta Research Council 5-42

CO2 Enhanced Hydrocarbon Recovery Summary Report December, 2009 Incremental Recovery and CO2 Storage Potential in Alberta
Alberta Research Council 5-43
The CO2 flood area after HCM solvent flood can be developed on five 9-spots drilled on 16 ha/well
(40 acre/well) spacing. During quaternary CO2 injection, it is estimated that they would produce 3.4 million
m3 incremental oil over 40 years for one HCPV of CO2 injection.
Table 5.3.1.13: Estimated incremental CO2 EOR for Virginia Hills BHL A Pool
EOR Study Area
OOIP
106m3
Indicated ∆ HCMF [WF] oil
by decline curve
106m3 (RF%)
∆ oil due to CO2 (RF%)
(simulation)
Ratio of ∆ oil CO2//∆ oil HCMF
Inferred ∆ oil due to
CO2
106m3
Processing Rates during WF/SF
103m3/d/i.w.
SFA-1 34.57 1.1 (3.2%) 3.1% 0.97 500 (inj.) 200 (prod.)
Virginia Hills HCMF Area
35.34 3.5 (9.9%) Use 0.97*0.099
3.4 500 (inj) 325 (prod.)
WFA-2 8.71 3.73 (42.8%) 20.1% 0.484 1000 (inj.) 300 (prod.)
Virginia Hills WF Area
38.93 4.827 (12.4%) WF ERCB
Use 0.726*0.124
3.5 350 (inj.) 125 (prod.)
5.3.1.10 Ante Creek BHL Ante Creek is a ‘linear’ pool, with wells in the NW portion performing much better than in the SW portion.
Much of water and hydrocarbon solvent injection has occurred in this area. Largest amount of solvent
was injected in the well 10-07-65-23W5M, located in the South-central part but did not significantly
improve oil recovery in the offset wells. However, water injection which began in 1969, was altogether
discontinued in 1997 and the total fluid production has been steadily declining and GOR increasing since
then. Very likely, reservoir pressure has declined and the reservoir would need to be re-pressurized
ahead of CO2 injection. The combined incremental recovery factor of 23% OOIP for water and solvent
flood makes this a rather poor prospect for CO2 injection, compared to other BHL pools.
CO2 Enhanced Hydrocarbon Recovery Summary Report December, 2009 Incremental Recovery and CO2 Storage Potential in Alberta
Alberta Research Council 5-44
5.3.2 D2/D3 Pools Prototype Pool/Areas Selected Redwater D3 was selected as the prototype reservoir to be studied in detail. Prototype areas were
defined by including nine-spot flooding patterns comprising wells drilled on 16 ha spacing on the fore-reef
(Eastern edge), reef build-up (central portion of the pool) and lagoon dominated regions to the west.
Analogous Pools/Areas These types of pools are characterized by sustained strong oil rate performance until a majority of their
ultimate oil reserves are produced (typically >70%). Some major pools of this type in Alberta are:
Bonnie Glen D-3A Joffre D-2 Leduc-Woodbend D-2A Fenn-Big Valley D-2A Sturgeon Lake South D-3 Sturgeon Lake D-3
Rationale for Selecting Prototype Areas Geological Features All the above pools are carbonate reefs with regions dominated by
a. relatively thin fore-reef pay, b. main reef build-up regions where pay becomes thick and, c. relatively poor quality back-reef/lagoonal areas.
Performance Aspects of Redwater and Analogous Pools
After major water-breakthrough, water-cuts rapidly increase even after installing high volume lifting
devices and disposing of the produced water within the pay horizon. Economic oil rates could not be
sustained thereafter, leaving behind about half or more of the original oil unrecovered.
By the time of implementing CO2 flooding (2013), most wells would have been essentially watered out
(typically, WOR>150). The main EOR targets regions will be bypassed or would contain residual oil
saturation within watered out pay intervals. There is generally relatively high injectivity/productivity at
different wells and hence, each injector could support more than one producer.
If there are no barriers to vertical flow (or if unbroken, continuous pay interval exceeds 15 m), a vertical
CO2 flood yielding high recovery may become feasible in some areas. However, looking at various pools,
such opportunities appear to be very limited. Hence seven-spot or nine-spot patterned (horizontal flood)
mode of exploitation appears feasible in most of these pools.
Extrapolation Methodology Rationale
Since the performance of the pools (history in terms of oil rate and water-oil ratio) is very similar for these
pools and the main EOR target is residual oil, it is surmised that empirical methods based on similarity
principles would provide reasonable estimates of performance for various analogous pools. Results
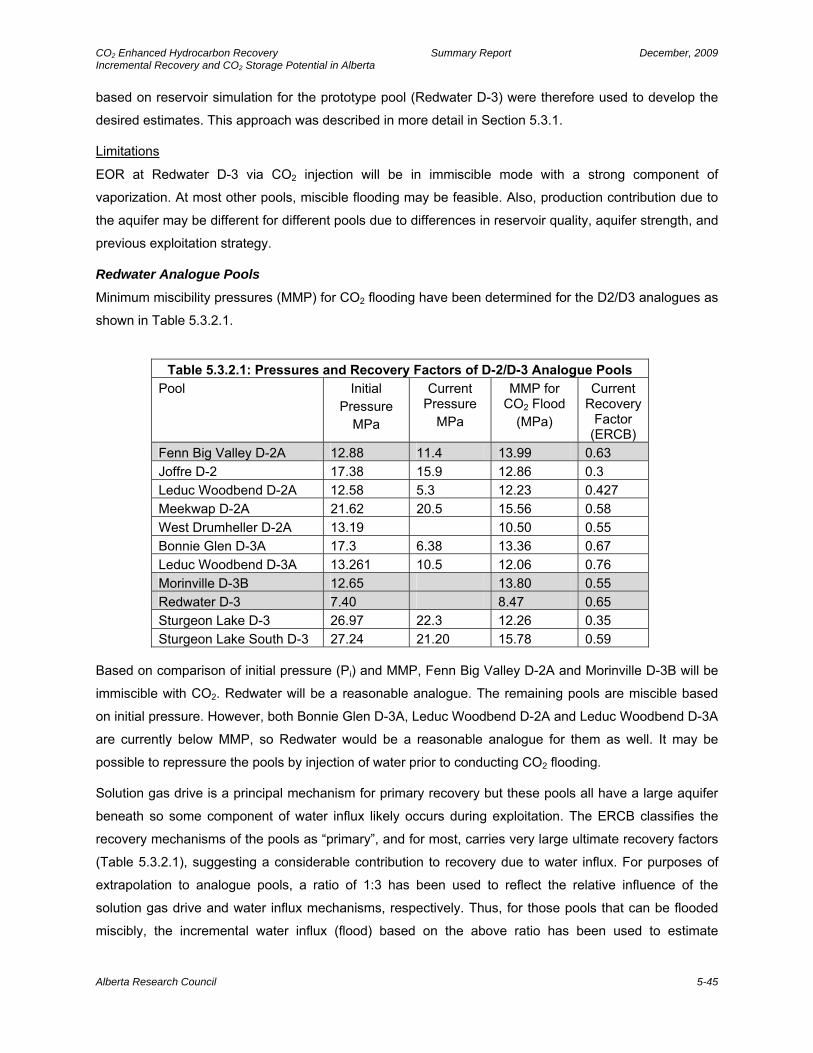
CO2 Enhanced Hydrocarbon Recovery Summary Report December, 2009 Incremental Recovery and CO2 Storage Potential in Alberta
Alberta Research Council 5-45
based on reservoir simulation for the prototype pool (Redwater D-3) were therefore used to develop the
desired estimates. This approach was described in more detail in Section 5.3.1.
Limitations
EOR at Redwater D-3 via CO2 injection will be in immiscible mode with a strong component of
vaporization. At most other pools, miscible flooding may be feasible. Also, production contribution due to
the aquifer may be different for different pools due to differences in reservoir quality, aquifer strength, and
previous exploitation strategy.
Redwater Analogue Pools
Minimum miscibility pressures (MMP) for CO2 flooding have been determined for the D2/D3 analogues as
shown in Table 5.3.2.1.
Table 5.3.2.1: Pressures and Recovery Factors of D-2/D-3 Analogue Pools
Pool Initial Pressure
MPa
Current Pressure
MPa
MMP for CO2 Flood
(MPa)
Current Recovery
Factor (ERCB)
Fenn Big Valley D-2A 12.88 11.4 13.99 0.63 Joffre D-2 17.38 15.9 12.86 0.3 Leduc Woodbend D-2A 12.58 5.3 12.23 0.427 Meekwap D-2A 21.62 20.5 15.56 0.58 West Drumheller D-2A 13.19 10.50 0.55 Bonnie Glen D-3A 17.3 6.38 13.36 0.67 Leduc Woodbend D-3A 13.261 10.5 12.06 0.76 Morinville D-3B 12.65 13.80 0.55 Redwater D-3 7.40 8.47 0.65 Sturgeon Lake D-3 26.97 22.3 12.26 0.35 Sturgeon Lake South D-3 27.24 21.20 15.78 0.59
Based on comparison of initial pressure (Pi) and MMP, Fenn Big Valley D-2A and Morinville D-3B will be
immiscible with CO2. Redwater will be a reasonable analogue. The remaining pools are miscible based
on initial pressure. However, both Bonnie Glen D-3A, Leduc Woodbend D-2A and Leduc Woodbend D-3A
are currently below MMP, so Redwater would be a reasonable analogue for them as well. It may be
possible to repressure the pools by injection of water prior to conducting CO2 flooding.
Solution gas drive is a principal mechanism for primary recovery but these pools all have a large aquifer
beneath so some component of water influx likely occurs during exploitation. The ERCB classifies the
recovery mechanisms of the pools as “primary”, and for most, carries very large ultimate recovery factors
(Table 5.3.2.1), suggesting a considerable contribution to recovery due to water influx. For purposes of
extrapolation to analogue pools, a ratio of 1:3 has been used to reflect the relative influence of the
solution gas drive and water influx mechanisms, respectively. Thus, for those pools that can be flooded
miscibly, the incremental water influx (flood) based on the above ratio has been used to estimate
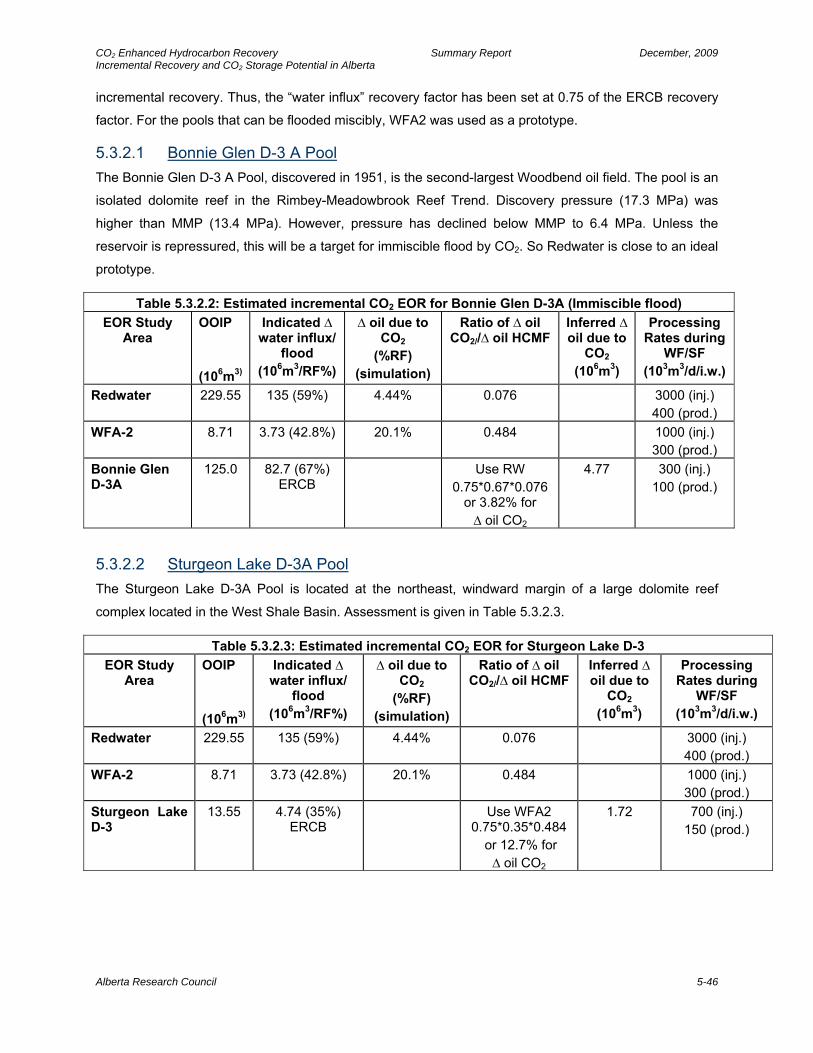
CO2 Enhanced Hydrocarbon Recovery Summary Report December, 2009 Incremental Recovery and CO2 Storage Potential in Alberta
Alberta Research Council 5-46
incremental recovery. Thus, the “water influx” recovery factor has been set at 0.75 of the ERCB recovery
factor. For the pools that can be flooded miscibly, WFA2 was used as a prototype.
5.3.2.1 Bonnie Glen D-3 A Pool The Bonnie Glen D-3 A Pool, discovered in 1951, is the second-largest Woodbend oil field. The pool is an
isolated dolomite reef in the Rimbey-Meadowbrook Reef Trend. Discovery pressure (17.3 MPa) was
higher than MMP (13.4 MPa). However, pressure has declined below MMP to 6.4 MPa. Unless the
reservoir is repressured, this will be a target for immiscible flood by CO2. So Redwater is close to an ideal
prototype.
Table 5.3.2.2: Estimated incremental CO2 EOR for Bonnie Glen D-3A (Immiscible flood) EOR Study
Area OOIP (106m3)
Indicated ∆ water influx/
flood (106m3/RF%)
∆ oil due to CO2
(%RF) (simulation)
Ratio of ∆ oil CO2//∆ oil HCMF
Inferred ∆ oil due to
CO2 (106m3)
Processing Rates during
WF/SF (103m3/d/i.w.)
Redwater 229.55 135 (59%) 4.44% 0.076 3000 (inj.) 400 (prod.)
WFA-2 8.71 3.73 (42.8%) 20.1% 0.484 1000 (inj.) 300 (prod.)
Bonnie Glen D-3A
125.0 82.7 (67%) ERCB
Use RW 0.75*0.67*0.076
or 3.82% for ∆ oil CO2
4.77
300 (inj.) 100 (prod.)
5.3.2.2 Sturgeon Lake D-3A Pool The Sturgeon Lake D-3A Pool is located at the northeast, windward margin of a large dolomite reef
complex located in the West Shale Basin. Assessment is given in Table 5.3.2.3.
Table 5.3.2.3: Estimated incremental CO2 EOR for Sturgeon Lake D-3 EOR Study
Area OOIP (106m3)
Indicated ∆ water influx/
flood (106m3/RF%)
∆ oil due to CO2
(%RF) (simulation)
Ratio of ∆ oil CO2//∆ oil HCMF
Inferred ∆ oil due to
CO2 (106m3)
Processing Rates during
WF/SF (103m3/d/i.w.)
Redwater 229.55 135 (59%) 4.44% 0.076 3000 (inj.) 400 (prod.)
WFA-2 8.71 3.73 (42.8%) 20.1% 0.484 1000 (inj.) 300 (prod.)
Sturgeon Lake D-3
13.55 4.74 (35%) ERCB
Use WFA2 0.75*0.35*0.484
or 12.7% for ∆ oil CO2
1.72 700 (inj.) 150 (prod.)
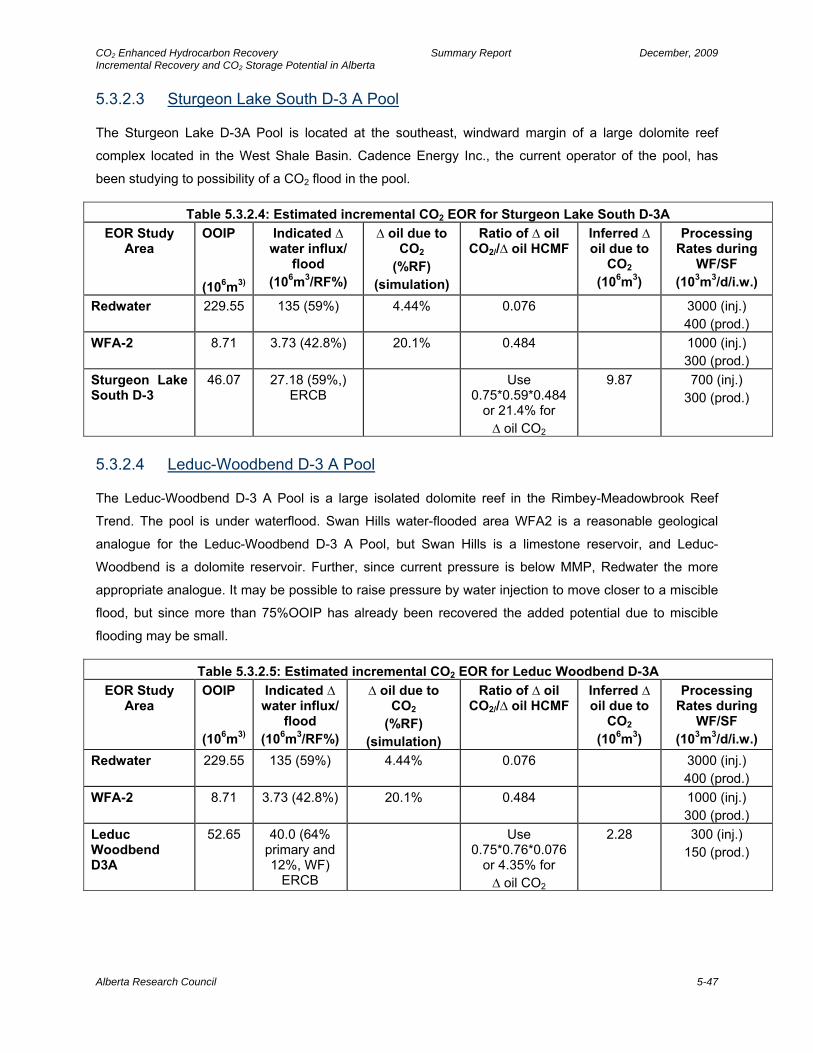
CO2 Enhanced Hydrocarbon Recovery Summary Report December, 2009 Incremental Recovery and CO2 Storage Potential in Alberta
Alberta Research Council 5-47
5.3.2.3 Sturgeon Lake South D-3 A Pool
The Sturgeon Lake D-3A Pool is located at the southeast, windward margin of a large dolomite reef
complex located in the West Shale Basin. Cadence Energy Inc., the current operator of the pool, has
been studying to possibility of a CO2 flood in the pool.
Table 5.3.2.4: Estimated incremental CO2 EOR for Sturgeon Lake South D-3A EOR Study
Area OOIP (106m3)
Indicated ∆ water influx/
flood (106m3/RF%)
∆ oil due to CO2
(%RF) (simulation)
Ratio of ∆ oil CO2//∆ oil HCMF
Inferred ∆ oil due to
CO2 (106m3)
Processing Rates during
WF/SF (103m3/d/i.w.)
Redwater 229.55 135 (59%) 4.44% 0.076 3000 (inj.) 400 (prod.)
WFA-2 8.71 3.73 (42.8%) 20.1% 0.484 1000 (inj.) 300 (prod.)
Sturgeon Lake South D-3
46.07 27.18 (59%,) ERCB
Use 0.75*0.59*0.484
or 21.4% for ∆ oil CO2
9.87
700 (inj.) 300 (prod.)
5.3.2.4 Leduc-Woodbend D-3 A Pool
The Leduc-Woodbend D-3 A Pool is a large isolated dolomite reef in the Rimbey-Meadowbrook Reef
Trend. The pool is under waterflood. Swan Hills water-flooded area WFA2 is a reasonable geological
analogue for the Leduc-Woodbend D-3 A Pool, but Swan Hills is a limestone reservoir, and Leduc-
Woodbend is a dolomite reservoir. Further, since current pressure is below MMP, Redwater the more
appropriate analogue. It may be possible to raise pressure by water injection to move closer to a miscible
flood, but since more than 75%OOIP has already been recovered the added potential due to miscible
flooding may be small.
Table 5.3.2.5: Estimated incremental CO2 EOR for Leduc Woodbend D-3A EOR Study
Area OOIP (106m3)
Indicated ∆ water influx/
flood (106m3/RF%)
∆ oil due to CO2
(%RF) (simulation)
Ratio of ∆ oil CO2//∆ oil HCMF
Inferred ∆ oil due to
CO2 (106m3)
Processing Rates during
WF/SF (103m3/d/i.w.)
Redwater 229.55 135 (59%) 4.44% 0.076 3000 (inj.) 400 (prod.)
WFA-2 8.71 3.73 (42.8%) 20.1% 0.484 1000 (inj.) 300 (prod.)
Leduc Woodbend D3A
52.65 40.0 (64% primary and 12%, WF)
ERCB
Use 0.75*0.76*0.076
or 4.35% for ∆ oil CO2
2.28
300 (inj.) 150 (prod.)
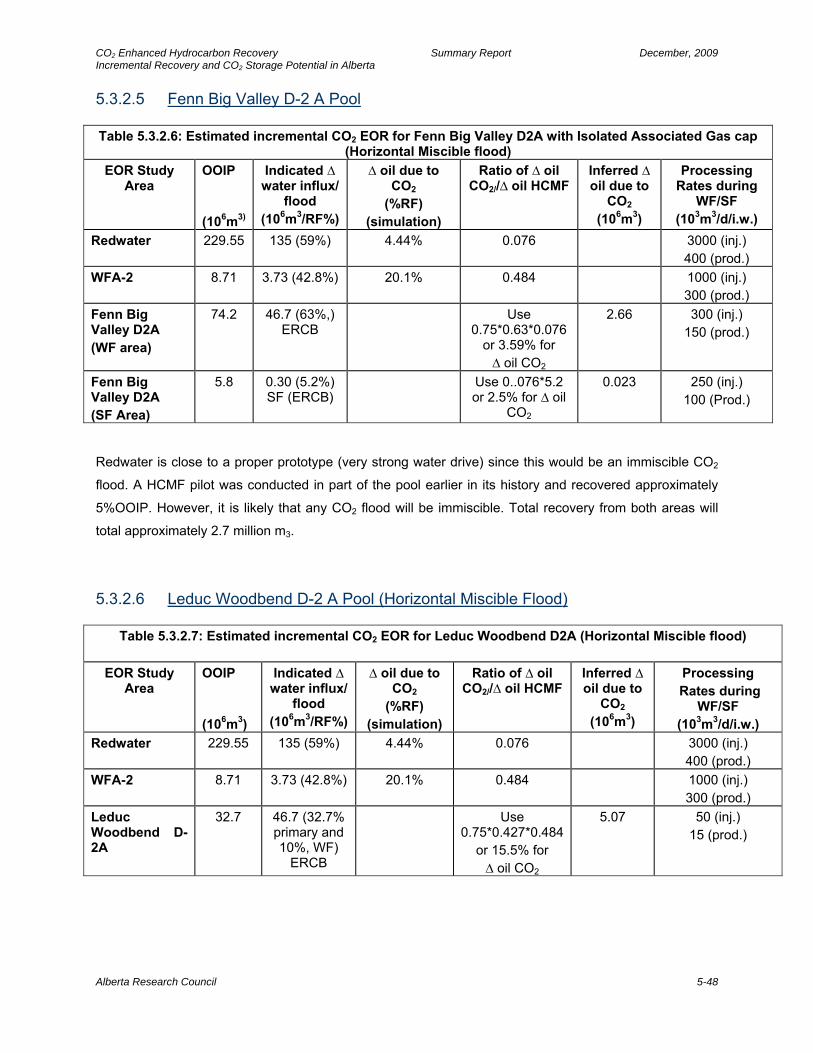
CO2 Enhanced Hydrocarbon Recovery Summary Report December, 2009 Incremental Recovery and CO2 Storage Potential in Alberta
Alberta Research Council 5-48
5.3.2.5 Fenn Big Valley D-2 A Pool
Table 5.3.2.6: Estimated incremental CO2 EOR for Fenn Big Valley D2A with Isolated Associated Gas cap (Horizontal Miscible flood)
EOR Study Area
OOIP (106m3)
Indicated ∆ water influx/
flood (106m3/RF%)
∆ oil due to CO2
(%RF) (simulation)
Ratio of ∆ oil CO2//∆ oil HCMF
Inferred ∆ oil due to
CO2 (106m3)
Processing Rates during
WF/SF (103m3/d/i.w.)
Redwater 229.55 135 (59%) 4.44% 0.076 3000 (inj.) 400 (prod.)
WFA-2 8.71 3.73 (42.8%) 20.1% 0.484 1000 (inj.) 300 (prod.)
Fenn Big Valley D2A (WF area)
74.2 46.7 (63%,) ERCB
Use 0.75*0.63*0.076
or 3.59% for ∆ oil CO2
2.66
300 (inj.) 150 (prod.)
Fenn Big Valley D2A (SF Area)
5.8 0.30 (5.2%) SF (ERCB)
Use 0..076*5.2 or 2.5% for ∆ oil
CO2
0.023 250 (inj.) 100 (Prod.)
Redwater is close to a proper prototype (very strong water drive) since this would be an immiscible CO2
flood. A HCMF pilot was conducted in part of the pool earlier in its history and recovered approximately
5%OOIP. However, it is likely that any CO2 flood will be immiscible. Total recovery from both areas will
total approximately 2.7 million m3.
5.3.2.6 Leduc Woodbend D-2 A Pool (Horizontal Miscible Flood)
Table 5.3.2.7: Estimated incremental CO2 EOR for Leduc Woodbend D2A (Horizontal Miscible flood)
EOR Study Area
OOIP (106m3)
Indicated ∆ water influx/
flood (106m3/RF%)
∆ oil due to CO2
(%RF) (simulation)
Ratio of ∆ oil CO2//∆ oil HCMF
Inferred ∆ oil due to
CO2 (106m3)
Processing Rates during
WF/SF (103m3/d/i.w.)
Redwater 229.55 135 (59%) 4.44% 0.076 3000 (inj.) 400 (prod.)
WFA-2 8.71 3.73 (42.8%) 20.1% 0.484 1000 (inj.) 300 (prod.)
Leduc Woodbend D-2A
32.7 46.7 (32.7% primary and 10%, WF)
ERCB
Use 0.75*0.427*0.484
or 15.5% for ∆ oil CO2
5.07
50 (inj.) 15 (prod.)
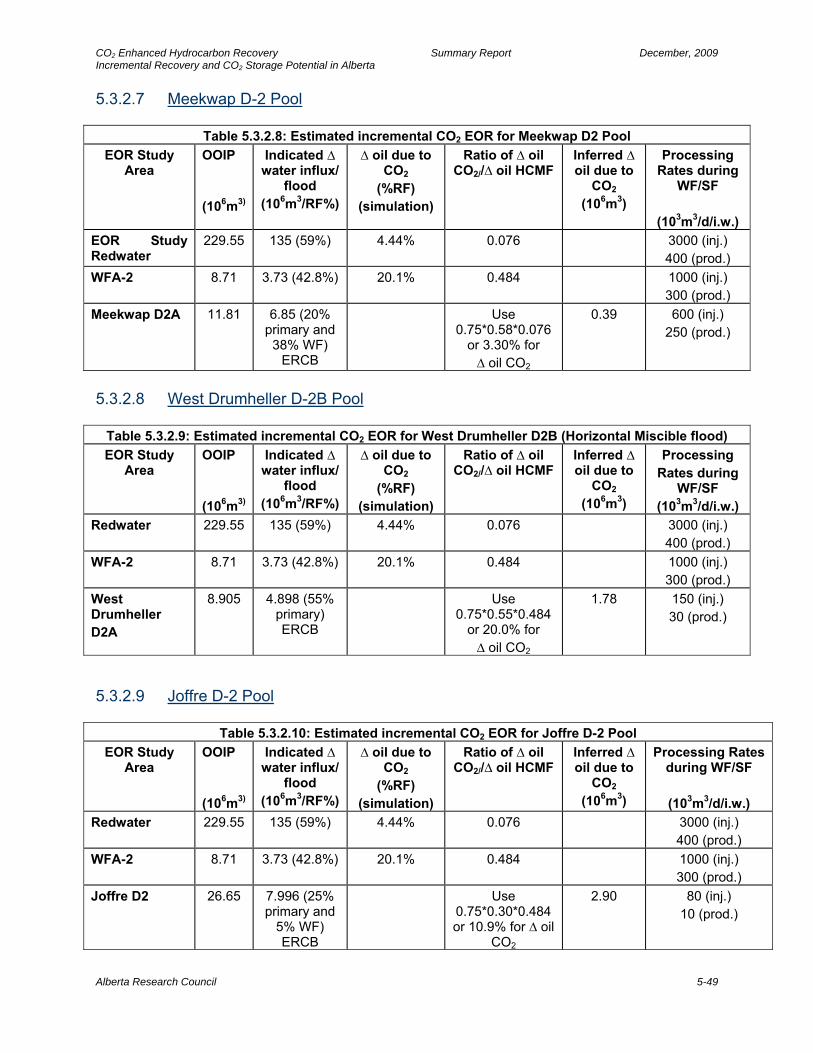
CO2 Enhanced Hydrocarbon Recovery Summary Report December, 2009 Incremental Recovery and CO2 Storage Potential in Alberta
Alberta Research Council 5-49
5.3.2.7 Meekwap D-2 Pool
Table 5.3.2.8: Estimated incremental CO2 EOR for Meekwap D2 Pool EOR Study
Area OOIP (106m3)
Indicated ∆ water influx/
flood (106m3/RF%)
∆ oil due to CO2
(%RF) (simulation)
Ratio of ∆ oil CO2//∆ oil HCMF
Inferred ∆ oil due to
CO2 (106m3)
Processing Rates during
WF/SF
(103m3/d/i.w.) EOR Study Redwater
229.55 135 (59%) 4.44% 0.076 3000 (inj.) 400 (prod.)
WFA-2 8.71 3.73 (42.8%) 20.1% 0.484 1000 (inj.) 300 (prod.)
Meekwap D2A 11.81 6.85 (20% primary and
38% WF) ERCB
Use 0.75*0.58*0.076
or 3.30% for ∆ oil CO2
0.39
600 (inj.) 250 (prod.)
5.3.2.8 West Drumheller D-2B Pool
Table 5.3.2.9: Estimated incremental CO2 EOR for West Drumheller D2B (Horizontal Miscible flood) EOR Study
Area OOIP (106m3)
Indicated ∆ water influx/
flood (106m3/RF%)
∆ oil due to CO2
(%RF) (simulation)
Ratio of ∆ oil CO2//∆ oil HCMF
Inferred ∆ oil due to
CO2 (106m3)
Processing Rates during
WF/SF (103m3/d/i.w.)
Redwater 229.55 135 (59%) 4.44% 0.076 3000 (inj.) 400 (prod.)
WFA-2 8.71 3.73 (42.8%) 20.1% 0.484 1000 (inj.) 300 (prod.)
West Drumheller D2A
8.905 4.898 (55% primary) ERCB
Use 0.75*0.55*0.484
or 20.0% for ∆ oil CO2
1.78
150 (inj.) 30 (prod.)
5.3.2.9 Joffre D-2 Pool
Table 5.3.2.10: Estimated incremental CO2 EOR for Joffre D-2 Pool EOR Study
Area OOIP (106m3)
Indicated ∆ water influx/
flood (106m3/RF%)
∆ oil due to CO2
(%RF) (simulation)
Ratio of ∆ oil CO2//∆ oil HCMF
Inferred ∆ oil due to
CO2 (106m3)
Processing Rates during WF/SF
(103m3/d/i.w.)
Redwater 229.55 135 (59%) 4.44% 0.076 3000 (inj.) 400 (prod.)
WFA-2 8.71 3.73 (42.8%) 20.1% 0.484 1000 (inj.) 300 (prod.)
Joffre D2 26.65 7.996 (25% primary and
5% WF) ERCB
Use 0.75*0.30*0.484 or 10.9% for ∆ oil
CO2
2.90 80 (inj.) 10 (prod.)
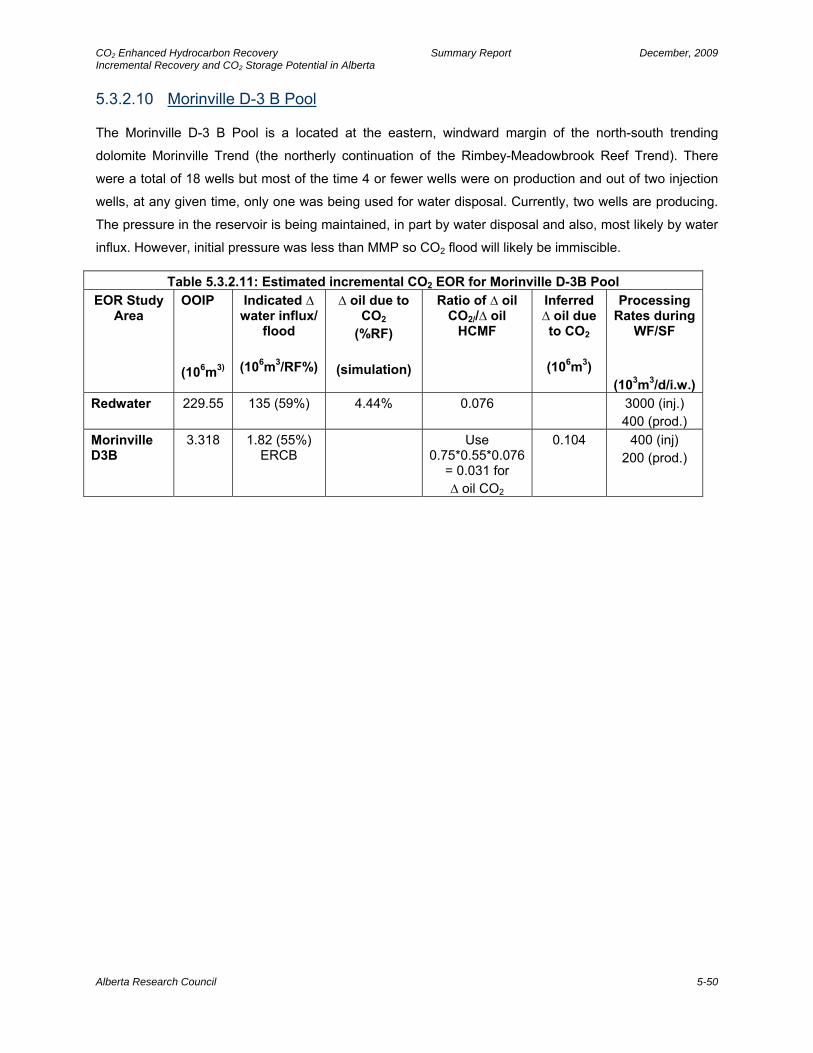
CO2 Enhanced Hydrocarbon Recovery Summary Report December, 2009 Incremental Recovery and CO2 Storage Potential in Alberta
Alberta Research Council 5-50
5.3.2.10 Morinville D-3 B Pool
The Morinville D-3 B Pool is a located at the eastern, windward margin of the north-south trending
dolomite Morinville Trend (the northerly continuation of the Rimbey-Meadowbrook Reef Trend). There
were a total of 18 wells but most of the time 4 or fewer wells were on production and out of two injection
wells, at any given time, only one was being used for water disposal. Currently, two wells are producing.
The pressure in the reservoir is being maintained, in part by water disposal and also, most likely by water
influx. However, initial pressure was less than MMP so CO2 flood will likely be immiscible.
Table 5.3.2.11: Estimated incremental CO2 EOR for Morinville D-3B Pool EOR Study
Area OOIP (106m3)
Indicated ∆ water influx/
flood
(106m3/RF%)
∆ oil due to CO2
(%RF)
(simulation)
Ratio of ∆ oil CO2//∆ oil
HCMF
Inferred ∆ oil due to CO2
(106m3)
Processing Rates during
WF/SF
(103m3/d/i.w.)Redwater 229.55 135 (59%) 4.44% 0.076 3000 (inj.)
400 (prod.) Morinville D3B
3.318 1.82 (55%) ERCB
Use 0.75*0.55*0.076
= 0.031 for ∆ oil CO2
0.104
400 (inj) 200 (prod.)

CO2 Enhanced Hydrocarbon Recovery Summary Report December, 2009 Incremental Recovery and CO2 Storage Potential in Alberta
Alberta Research Council 5-51
5.3.3 Cardium Pools The largest Cardium target is the huge Pembina Cardium field. More than two thirds of the 1.3 billion m3
of oil-in-place in the Pembina Cardium deposits has been subjected to water flooding. By and large, areas
with thicker (>7 m) net pay and water injectivity exceeding 5 m3/d/well (vertical) have been water flooded.
Overall recovery factor of 10% for primary and an additional 10% for water flooding have been assigned
by ERCB. There is a great deal of heterogeneity within and amongst various water flooding Units in the
Pembina field. This is reflected in average productivity, injectivity and recovery factors for individual Units.
Interestingly, solution gas recovery was estimated at about 50%, indicating a significant amount of
reservoir would remain unexploited by primary depletion and water flooding.
Past solvent flooding and immiscible gas flooding operations met with partial success, perhaps due to
limitations in the available production technology, understanding of reservoir heterogeneity and recovery
mechanics and prevailing economic conditions at the time of these tests.
General Methodology The standardized methodology used to extrapolate performance from the analogues was to examine Oil
Cut vs. Cumulative oil plotted on three cycle semi-log graph, so that the shapes of these curves could be
compared to each other.
Assumptions/Speculations/ Observations about Past Production Trends
• Lateral heterogeneity=continuity=areal sweep
• Vertical stratification can be represented by Dykstra-Parsons coefficient.
• Primary reserves are contributed by all intervals. Very tight intervals like Sand 4 (with permeability
< say, 5 md, especially in presence of other intervals of much higher permeability) are unlikely to
contribute to waterflood or EOR. Although Sand 3 contains certain streaks with permeability
exceeding 5 md, their potential EOR contribution may be ignored compared to Cardium sands 4,
5/6 and Conglomerate.
• Primary production contributions may continue for up to say, 20 years upon initiating waterflood.
Likewise, at current state of water flooding (~45 years of water flooding and oil-cut) in most EOR
Target areas of less than 10%; waterflood production contributions would continue for another
20 years.
• Stalling of decline in oil-cut vs. cumulative oil is an indicator of progression of volumetric sweep.
• Decreasing of injection rates promotes redistribution and spread of injected fluids.
• Most infill wells promote volumetric sweep but on occasions, some infill injectors/producers may
actually be promoting short-circuiting of injected fluids.
CO2 Enhanced Hydrocarbon Recovery Summary Report December, 2009 Incremental Recovery and CO2 Storage Potential in Alberta
Alberta Research Council 5-52
• Performance may also be somewhat influenced by optimizing interventions such as redistributing
injection-production, including shutting in of ‘non-performing’ injector and producer wells.
Oil-Cut vs. Cumulative Oil as Basis for Analogue Grouping
Oil-cut vs. cumulative oil curves generally provide good diagnostics of performance of waterfloods and
EOR. They reflect how the injected fluids are sweeping the project area. These curves are generally
unaffected by changes in water handling capabilities or well counts, although the shape of these curves
may be somewhat affected by optimizing actions (e.g. infill wells, shutting in of high water producers,
increasing or decreasing flooding rates).
A steep decline denotes very inefficient sweep, whereby the injected fluid essentially recycles after a
short period, reflecting thief intervals (or regions) between injectors and producers.
For the 15 Pembina waterfloods reviewed, where the peak injection/production rates per well were strong
(on the average, exceeding 15 m3/d/well), no true thief-zone-dominating floods were seen. Roughly
speaking, these floods can be divided in two groups. In Group I, the oil cut monotonically declines. In
Group II, the decline in oil rates is stalled, indicating spreading of the sweep without undue decreases in
oil cut. The former is generally associated with regions with prolific conglomerate and the latter without.
The amount of cumulative oil produced prior to seeing decrease in oil cut reflects strong primary
production aided by generally good volumetric sweep prior to water breakthrough. It may be recalled that
most of these floods were initiated in late 1950’s/ early 1960’s before the start of ERCB production
databases. It may also be pointed out that although the Lower Pembina Sand (Sand 3) may contain some
high quality pay intervals, it is generally seen to be contributing to oil production during the primary
production only (other pay intervals have considerably higher flow capacities). Therefore, the ratio
between oil produced while oil cut is essentially 100% and the ultimate oil produced (oil-cut vs. cumulative
oil curve extrapolated to 1% oil-cut), reflects the proportion of pay intervals not contributing to waterfloods
along with volumetric sweep in the more prolific intervals (Sands 4, 5/6 and Conglomerate).
The similarity of these curves during water flooding suggests that the fractional flow curves can be
modified, taking into account, ‘connectivity’ within the reservoir (or, Dykstra-Parson coefficients). Note that
this ‘connectivity’ during water floods will be higher than that during CO2 flood (since CO2 has a higher
mobility than water). For sensitivity runs, modifications to thicknesses/permeabilities in the models by
appropriate factors can be made.
A prototype area representative of the performance characteristics and geological features of the
analogue area was selected. The performance of the prototype area [ratio ∆RF(CO2)/∆RF(WF)] was used
as a factor to predict the expected CO2 EOR reserves for the analogue areas. Table 5.3.3.1 provides the
performance characteristics of the prototype areas based on simulation.
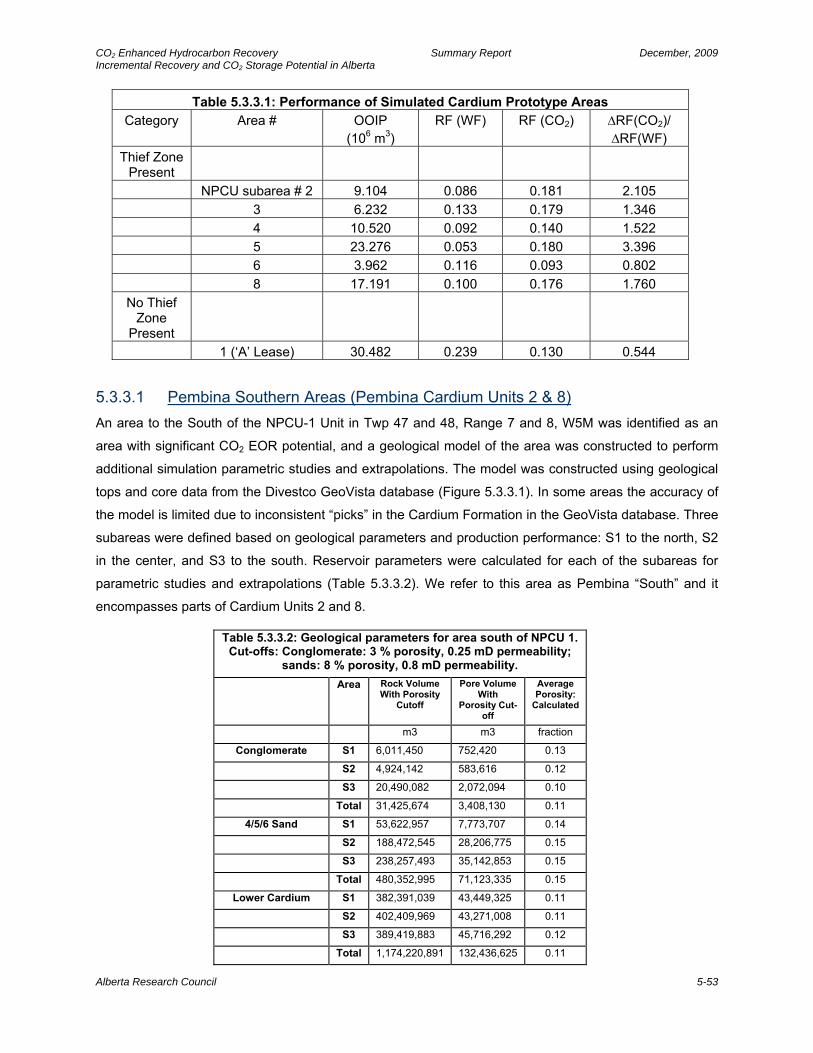
CO2 Enhanced Hydrocarbon Recovery Summary Report December, 2009 Incremental Recovery and CO2 Storage Potential in Alberta
Alberta Research Council 5-53
Table 5.3.3.1: Performance of Simulated Cardium Prototype Areas Category Area # OOIP
(106 m3) RF (WF) RF (CO2) ∆RF(CO2)/
∆RF(WF) Thief Zone
Present
NPCU subarea # 2 9.104 0.086 0.181 2.105 3 6.232 0.133 0.179 1.346 4 10.520 0.092 0.140 1.522 5 23.276 0.053 0.180 3.396 6 3.962 0.116 0.093 0.802 8 17.191 0.100 0.176 1.760
No Thief Zone
Present
1 (‘A’ Lease) 30.482 0.239 0.130 0.544
5.3.3.1 Pembina Southern Areas (Pembina Cardium Units 2 & 8) An area to the South of the NPCU-1 Unit in Twp 47 and 48, Range 7 and 8, W5M was identified as an
area with significant CO2 EOR potential, and a geological model of the area was constructed to perform
additional simulation parametric studies and extrapolations. The model was constructed using geological
tops and core data from the Divestco GeoVista database (Figure 5.3.3.1). In some areas the accuracy of
the model is limited due to inconsistent “picks” in the Cardium Formation in the GeoVista database. Three
subareas were defined based on geological parameters and production performance: S1 to the north, S2
in the center, and S3 to the south. Reservoir parameters were calculated for each of the subareas for
parametric studies and extrapolations (Table 5.3.3.2). We refer to this area as Pembina “South” and it
encompasses parts of Cardium Units 2 and 8.
Table 5.3.3.2: Geological parameters for area south of NPCU 1. Cut-offs: Conglomerate: 3 % porosity, 0.25 mD permeability;
sands: 8 % porosity, 0.8 mD permeability. Area Rock Volume
With Porosity Cutoff
Pore Volume With
Porosity Cut-off
Average Porosity:
Calculated
m3 m3 fraction
Conglomerate S1 6,011,450 752,420 0.13
S2 4,924,142 583,616 0.12
S3 20,490,082 2,072,094 0.10
Total 31,425,674 3,408,130 0.11
4/5/6 Sand S1 53,622,957 7,773,707 0.14
S2 188,472,545 28,206,775 0.15
S3 238,257,493 35,142,853 0.15
Total 480,352,995 71,123,335 0.15
Lower Cardium S1 382,391,039 43,449,325 0.11
S2 402,409,969 43,271,008 0.11
S3 389,419,883 45,716,292 0.12
Total 1,174,220,891 132,436,625 0.11
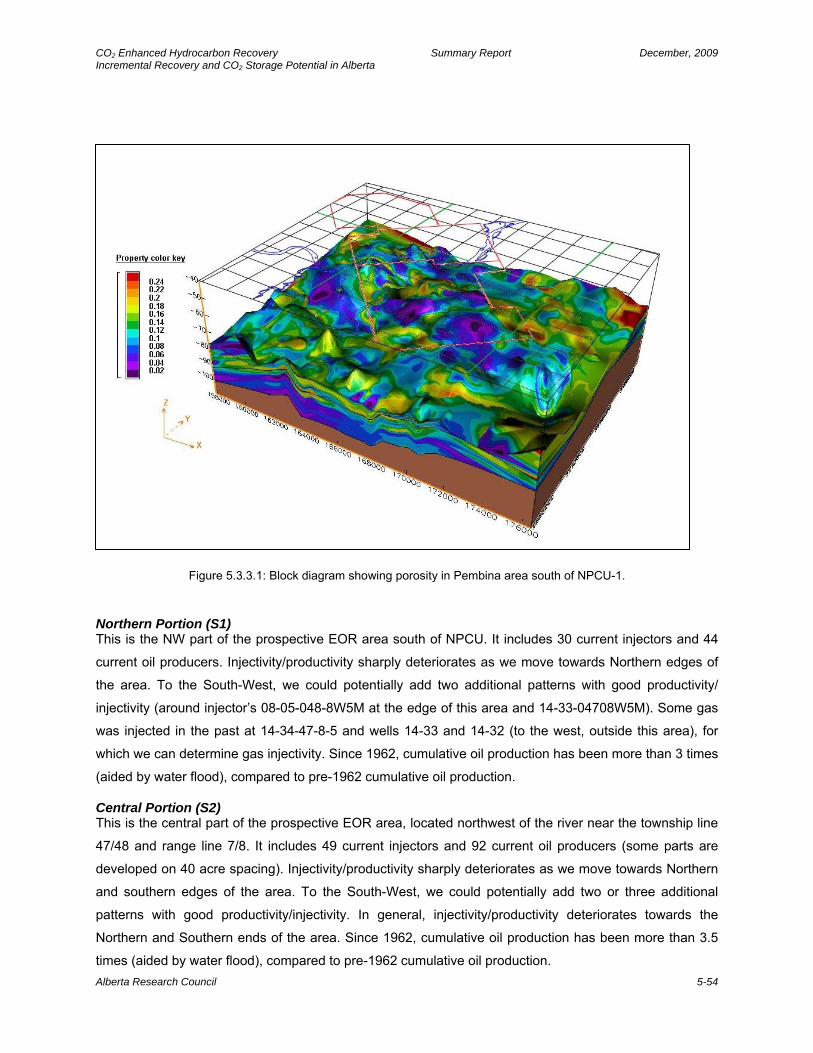
CO2 Enhanced Hydrocarbon Recovery Summary Report December, 2009 Incremental Recovery and CO2 Storage Potential in Alberta
Alberta Research Council 5-54
Figure 5.3.3.1: Block diagram showing porosity in Pembina area south of NPCU-1.
Northern Portion (S1) This is the NW part of the prospective EOR area south of NPCU. It includes 30 current injectors and 44
current oil producers. Injectivity/productivity sharply deteriorates as we move towards Northern edges of
the area. To the South-West, we could potentially add two additional patterns with good productivity/
injectivity (around injector’s 08-05-048-8W5M at the edge of this area and 14-33-04708W5M). Some gas
was injected in the past at 14-34-47-8-5 and wells 14-33 and 14-32 (to the west, outside this area), for
which we can determine gas injectivity. Since 1962, cumulative oil production has been more than 3 times
(aided by water flood), compared to pre-1962 cumulative oil production.
Central Portion (S2) This is the central part of the prospective EOR area, located northwest of the river near the township line
47/48 and range line 7/8. It includes 49 current injectors and 92 current oil producers (some parts are
developed on 40 acre spacing). Injectivity/productivity sharply deteriorates as we move towards Northern
and southern edges of the area. To the South-West, we could potentially add two or three additional
patterns with good productivity/injectivity. In general, injectivity/productivity deteriorates towards the
Northern and Southern ends of the area. Since 1962, cumulative oil production has been more than 3.5
times (aided by water flood), compared to pre-1962 cumulative oil production.
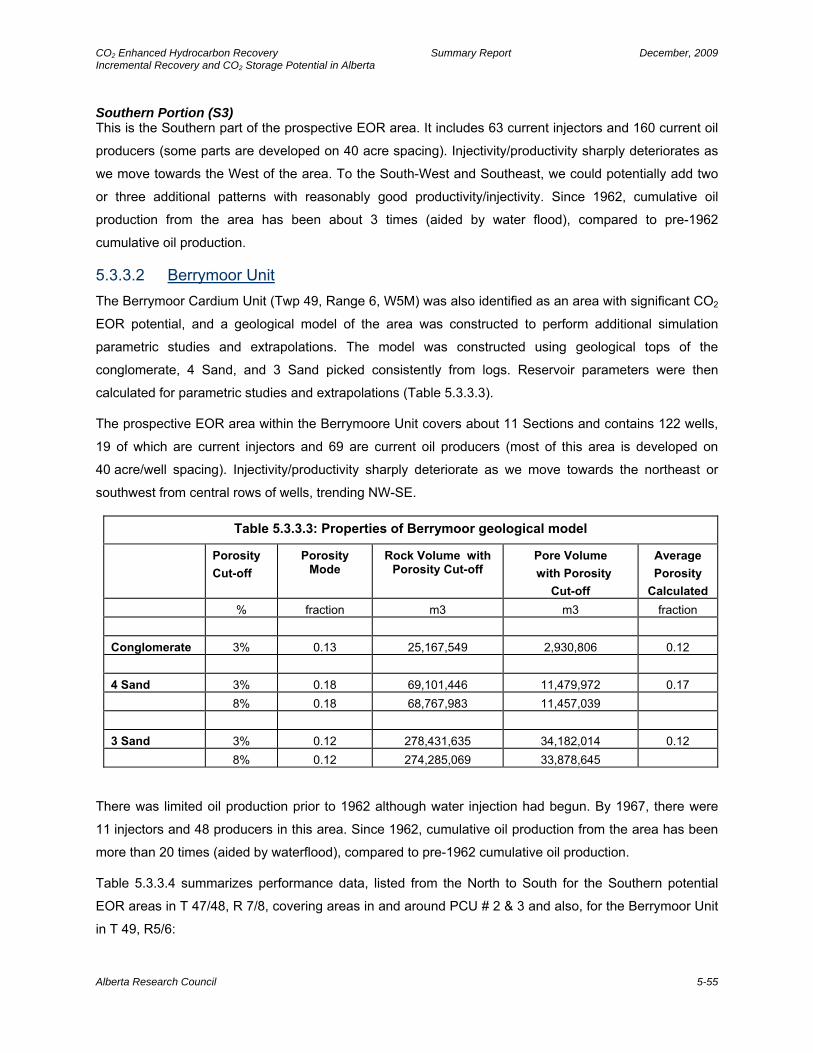
CO2 Enhanced Hydrocarbon Recovery Summary Report December, 2009 Incremental Recovery and CO2 Storage Potential in Alberta
Alberta Research Council 5-55
Southern Portion (S3) This is the Southern part of the prospective EOR area. It includes 63 current injectors and 160 current oil
producers (some parts are developed on 40 acre spacing). Injectivity/productivity sharply deteriorates as
we move towards the West of the area. To the South-West and Southeast, we could potentially add two
or three additional patterns with reasonably good productivity/injectivity. Since 1962, cumulative oil
production from the area has been about 3 times (aided by water flood), compared to pre-1962
cumulative oil production.
5.3.3.2 Berrymoor Unit The Berrymoor Cardium Unit (Twp 49, Range 6, W5M) was also identified as an area with significant CO2
EOR potential, and a geological model of the area was constructed to perform additional simulation
parametric studies and extrapolations. The model was constructed using geological tops of the
conglomerate, 4 Sand, and 3 Sand picked consistently from logs. Reservoir parameters were then
calculated for parametric studies and extrapolations (Table 5.3.3.3).
The prospective EOR area within the Berrymoore Unit covers about 11 Sections and contains 122 wells,
19 of which are current injectors and 69 are current oil producers (most of this area is developed on
40 acre/well spacing). Injectivity/productivity sharply deteriorate as we move towards the northeast or
southwest from central rows of wells, trending NW-SE.
Table 5.3.3.3: Properties of Berrymoor geological model
Porosity Cut-off
Porosity Mode
Rock Volume with Porosity Cut-off
Pore Volume with Porosity
Cut-off
Average Porosity
Calculated % fraction m3 m3 fraction Conglomerate 3% 0.13 25,167,549 2,930,806 0.12 4 Sand 3% 0.18 69,101,446 11,479,972 0.17 8% 0.18 68,767,983 11,457,039 3 Sand 3% 0.12 278,431,635 34,182,014 0.12 8% 0.12 274,285,069 33,878,645
There was limited oil production prior to 1962 although water injection had begun. By 1967, there were
11 injectors and 48 producers in this area. Since 1962, cumulative oil production from the area has been
more than 20 times (aided by waterflood), compared to pre-1962 cumulative oil production.
Table 5.3.3.4 summarizes performance data, listed from the North to South for the Southern potential
EOR areas in T 47/48, R 7/8, covering areas in and around PCU # 2 & 3 and also, for the Berrymoor Unit
in T 49, R5/6:
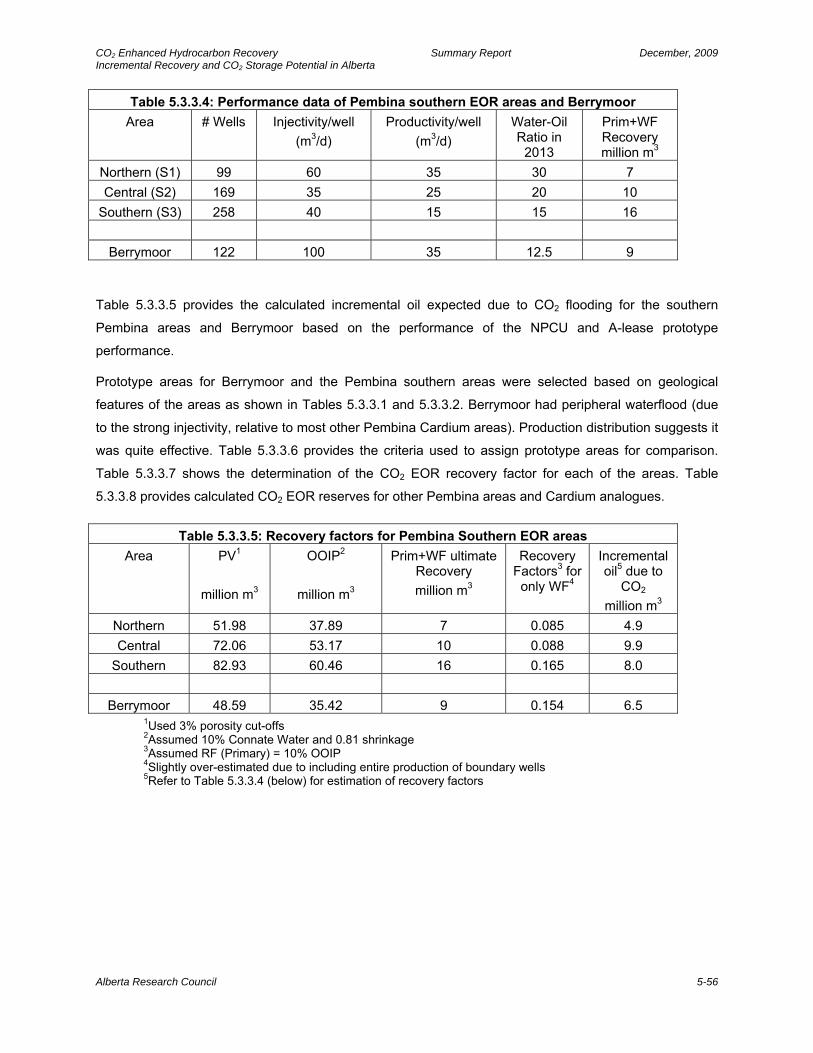
CO2 Enhanced Hydrocarbon Recovery Summary Report December, 2009 Incremental Recovery and CO2 Storage Potential in Alberta
Alberta Research Council 5-56
Table 5.3.3.4: Performance data of Pembina southern EOR areas and Berrymoor Area # Wells Injectivity/well
(m3/d) Productivity/well
(m3/d) Water-Oil Ratio in
2013
Prim+WF Recovery million m3
Northern (S1) 99 60 35 30 7 Central (S2) 169 35 25 20 10
Southern (S3) 258 40 15 15 16
Berrymoor 122 100 35 12.5 9 Table 5.3.3.5 provides the calculated incremental oil expected due to CO2 flooding for the southern
Pembina areas and Berrymoor based on the performance of the NPCU and A-lease prototype
performance.
Prototype areas for Berrymoor and the Pembina southern areas were selected based on geological
features of the areas as shown in Tables 5.3.3.1 and 5.3.3.2. Berrymoor had peripheral waterflood (due
to the strong injectivity, relative to most other Pembina Cardium areas). Production distribution suggests it
was quite effective. Table 5.3.3.6 provides the criteria used to assign prototype areas for comparison.
Table 5.3.3.7 shows the determination of the CO2 EOR recovery factor for each of the areas. Table
5.3.3.8 provides calculated CO2 EOR reserves for other Pembina areas and Cardium analogues.
Table 5.3.3.5: Recovery factors for Pembina Southern EOR areas Area PV1
million m3
OOIP2
million m3
Prim+WF ultimate Recovery million m3
Recovery Factors3 for
only WF4
Incremental oil5 due to
CO2 million m3
Northern 51.98 37.89 7 0.085 4.9 Central 72.06 53.17 10 0.088 9.9
Southern 82.93 60.46 16 0.165 8.0
Berrymoor 48.59 35.42 9 0.154 6.5 1Used 3% porosity cut-offs 2Assumed 10% Connate Water and 0.81 shrinkage 3Assumed RF (Primary) = 10% OOIP 4Slightly over-estimated due to including entire production of boundary wells 5Refer to Table 5.3.3.4 (below) for estimation of recovery factors

CO2 Enhanced Hydrocarbon Recovery Summary Report December, 2009 Incremental Recovery and CO2 Storage Potential in Alberta
Alberta Research Council 5-57
Table 5.3.3.6: Prototypes for Pembina Southern EOR areas
Area PV for Conglomerate
million m3
PV for 4/5/6 sand
million m3
PV for Lower Cardium
million m3
Recovery Factors for
Water Flooding
only
NPCU Prototype
Area Selected
Northern 0.75 7.77 43.45 0.085 4 Central 0.58 28.21 43.27 0.088 2
Southern 2.07 35.14 45.72 0.165 6 Berrymoor 2.93 11.48 34.18 0.154 3
Table 5.3.3.7: Prototypes for Pembina Southern EOR areas
Area NPCU Prototype
Area Selected
∆ Recovery Factor for
Water Flood in Prototype
Area
∆ RF due to CO2 in Prototype
Area
Recovery Factors for
Water Flooding
(analogue)
∆RF due to CO2 in
Analogue Area
Northern 4 0.092 0.14 0.085 0.13 Central 2 0.086 0.181 0.088 0.19
Southern 6 0.116 0.093 0.165 0.13 Berrymoor 3 0.133 0.179 0.154 0.21
Table 5.3.3.8: Data on Analogues (including from ERCB)
Analogue OOIP
(106 m3) RF
(WF)
Reserves (WF)
(106 m3) Prototype
∆RF-CO2/ ∆RF-WF
(Prototype)
∆ Reserves in Analogue for CO2
Flooding (106 m3)
Ferrier Belly River Q/ Cardium G & L
73.840 0.15 11.084 ‘A’ Lease Subarea # 1
0.544 6.0
Carrot Creek Cardium F
5.286 0.17 0.899 NPCU Subarea # 4
1.522 1.37
Cyn-Pem Cardium A 6.410 0.24 1.538 NPCU Subarea # 6
0.802 1.23
Cyn-Pem Cardium D 7.500 0.38 2.850 NPCU Subarea # 6
0.802 2.29
Cynthia Unit
# 2 6.88 4 (P+WF) NPCU
Subarea # 3 1.346 1.23
Bear Lake (Pembina) 5.71 3.3 (P+WF) NPCU Subarea # 4
1.522 1.75
Lobstick (Pembina) 37.9 5 (P+WF) NPCU Subarea # 3
1.346 7.08
Notes: The last three targets, namely Cynthia Unit # 2, Bear Lake and Lobstick are conglomerate (thief zone) dominated, have relatively high injectivities and productivities. For these, in absence of data on OOIP and primary reserves, primary recovery factor was assumed to be 20% and projections for CO2 flooding were based on ratios between RF(CO2)/RF (P+WF) at the respective prototypes.

CO2 Enhanced Hydrocarbon Recovery Summary Report December, 2009 Incremental Recovery and CO2 Storage Potential in Alberta
Alberta Research Council 5-58
5.4 CO2 Requirement and Storage for Prototypes and Analogues The CO2 requirement for each analogue pool was established based on the HCPV of CO2 injected and
produced in the corresponding prototype area. The properties of CO2 for each analogue pool were
determined based on the pressure and temperature of the pool in order to calculate the amount of CO2 to
be injected in each analogue. Note that the total OOIP studied for BHL Lake and Pembina groups is less
than the total OOIP in the waterflood and solvent flood areas of the pools (Table 5.3.1). The study areas
have been “high graded” to include those most likely to have successful EOR. The high graded areas
have 1840.7 million m3 (11578 million bbl) original-oil-in-place.
5.4.1 Beaverhill Lake Prototypes and Analogues Tables 5.4.1 summarizes the results for the assessment of the BHL pools studied. For the BHL target
pools, potential CO2 EOR would be 55.6 million m3 (350 million bbl). Total injection of CO2 including
recycle would be 360.2 Mt. giving a gross CO2 utilization of 6.48 t/m3 (19.6 mcf/bbl). A total of 99.2 Mt of
purchased CO2 would be required giving net CO2 utilization of 1.78 t/m3 (5.39 mcf/bbl). Essentially all of
the purchased CO2 is expected to be retained (stored) in the BHL pools at the end of the project life.
Table 5.4.1: CO2 Requirement and Storage for BHL Prototypes and Analogues-No Risk Factor Field/Pool Recovery
Process OOIP2 Predicted
EOR Oil Recovery
CO2 Injected
CO2 Purchased1
CO2 Utilization
103m3 103m3 106t 106t Gross
(t/m3) Net
(t/m3) Net
(mcf/bbl) Ante Creek BHL SF 5931 580 2.47 0.57 4.25 0.97 2.9 Carson Creek North BHL A & B WF 56930 9700 54.2 16.9 5.59 1.74 5.3
Goose River BHL A SF 16160 530 6.11 1.40 11.53 2.64 8.0
Goose River BHL A WF 9341 1090 6.72 2.10 6.16 1.92 5.8
Judy Creek BHL A SF 77950 3520 26.7 6.11 7.58 1.74 5.2
Judy Creek BHL A WF 48030 2900 24.25 7.56 8.36 2.61 7.9
Judy Creek BHL B SF 28370 1210 11.13 2.55 9.20 2.11 6.4
Judy Creek BHL B WF 11360 1320 7.67 2.39 5.81 1.81 5.5
Kaybob BHL A SF 36830 940 17.43 3.99 18.54 4.24 12.8
Kaybob BHL A WF 11290 1310 10.0 3.13 7.66 2.39 7.2
Simonette BHL A WF 7764 1330 14.2 4.44 10.69 3.34 10.1
Snipe Lake BHL WF 36600 3450 18.5 5.78 5.37 1.67 5.1
Swan Hills BHL A & B (SF prototype)
SF 149435 4539 45.2 10.3 9.96 2.28 6.9
Swan Hills BHL A & B (WF prototype)
WF 43547 9486 39.9 12.5 4.21 1.31 4.0
Swan Hills South BHL A & B SF 138800 6800 38.5 8.81 5.66 1.30 3.9
Virginia Hills BHL SF 35340 3400 10.87 2.49 3.20 0.73 2.2
Virginia Hills BHL WF 38930 3500 26.24 8.19 7.49 2.33 7.1
Sub-total for WF group WF 263,792 34,086 201.8 63.0 5.92 1.85 5.6
Sub-total for SF group SF 488,816 21,519 158.4 36.2 7.36 1.68 5.1
Total 752,608 55,605 360.2 99.2 6.48 1.78 5.4 1 CO2 purchased (and hence “net” utilization, the ratio of purchased CO2 to EOR oil produced) was directly determined only for prototypes in the development plans. For the analogues, the ratio of purchased to injected CO2 of the respective prototypes was used to estimate the CO2 purchase requirement. 2 Build-up only as used in this study

CO2 Enhanced Hydrocarbon Recovery Summary Report December, 2009 Incremental Recovery and CO2 Storage Potential in Alberta
Alberta Research Council 5-59
5.4.2 D2/D3 Prototypes and Analogues Table 5.4.2 summarizes CO2 requirement and storage for the D-2/D-3 target pools. Potential CO2 EOR
would be 44.4 million m3 (279 million bbl). Total injection of CO2 including recycle would be 277 Mt giving
a gross CO2 utilization of 6.24 t/m3 (18.9 mcf/bbl). A total of 82 Mt of purchased CO2 would be required
giving net CO2 utilization of 1.85 t/m3 (5.60 mcf/bbl). Essentially all of the purchased CO2 is expected to
be retained (stored) in the D-2/D-3 pools at the end of the project life.
Table 5.4.2: CO2 Requirement and Storage for D-2/D-3 Prototype and Analogues-No Risk Factor
Field/Pool OOIP
Predicted EOR Oil
Recovery CO2
Injected
CO2 Purchased1
CO2 Utilization
103m3 103 106t
106t Gross (t/m3)
Net (t/m3)
Net (mcf/bbl)
Fenn Big Valley D-2A 74200 2700 46.2 13.4 17.1 4.97 15.0 Joffre D-2 26650 2900 11.8 3.69 4.08 1.27 3.8 Leduc Woodbend D-2A 32700 5.07 12.2 3.80 2.40 0.75 2.3 Meekwap D-2A 11810 390 9.26 2.69 23.7 6.91 20.9 West Drumheller D2A & B 8905 1780 3.74 1.17 2.10 0.66 2.0 Bonnie Glen D-3A 125000 4770 56.1 16.3 11.7 3.42 10.4 Leduc Woodbend D-3A 52650 2280 32.6 9.50 14.3 4.17 12.6 Morinville D-3B 3318 104 1.71 0.50 17.1 4.97 15.0 Redwater D-3 207000 12778 60.0 17.5 4.85 1.37 4.2 Sturgeon Lake D-3A 13550 1720 9.81 3.06 5.70 1.78 5.4 Sturgeon Lake South D-3 46070 9870 33.3 10.4 3.38 1.05 3.2 Total 601,853 44,360 276.7 82.0 6.24 1.85 5.6 1 CO2 purchased (and hence “net” utilization, the ratio of purchased CO2 to EOR oil produced) was directly determined only for prototypes in the development plans. For the analogues, the ratio of purchased to injected CO2 of the respective prototypes was used to estimate the CO2 purchase requirement.
5.4.3 Cardium Prototypes and Analogues The Pembina Cardium field contributes the bulk of the CO2 EOR for the Cardium group. For Pembina
Cardium, potential CO2 EOR would be 60.1 million m3 (378 million bbl). Injection of CO2 including recycle
would be 214 Mt giving a gross CO2 utilization of 3.56 t/m3 (10.8 mcf/bbl). A total of 54.2 Mt of purchased
CO2 would be required giving net CO2 utilization of 0.90 t/m3 (2.73 mcf/bbl). Essentially all of the
purchased CO2 is expected to be retained (stored) in the Pembina Cardium at the end of the project life.
For the combined Pembina Cardium and Cardium analogues assessed, the total potential CO2 EOR
would be 71.4 million m3 (449 million bbl). Injection of CO2 including recycle would be 296 Mt giving a
gross CO2 utilization of 4.15 t/m3 (12.6 mcf/bbl). A total of 71.9 Mt of purchased CO2 would be required
giving net CO2 utilization of 1.01 t/m3 (3.06 mcf/bbl). Essentially all of the purchased CO2 is expected to
be retained (stored) in the Cardium protoypes and analogues at the end of the project life.

CO2 Enhanced Hydrocarbon Recovery Summary Report December, 2009 Incremental Recovery and CO2 Storage Potential in Alberta
Alberta Research Council 5-60
Table 5.4.3: CO2 Requirement and Storage for Pembina Prototypes and Analogues-No Risk Factor Field/Pool OOIP Predicted
EOR Oil Recovery
CO2 Injected
CO2
Purchased1 CO2
Utilization
103m3 103m3 106t 106t Gross (t/m3)
Net (t/m3)
Net (mcf/bbl)
NPCU & PCU 20 (Pembina with TZ prototype)
66,900
11,209
36.9
10.4 3.29
0.93 2.8
A Lease & Cynthia Unit 3 (Pembina no TZ prototype)
59,700
7,673
68.5
13.9 8.93
1.81 5.5
Pembina Bear Lake 5,710 1,800 2.52 0.71 1.40 0.40 1.2
Pembina Berrymoor 35,400 6,530 15.7 4.43 2.40 0.68 2.1
Pembina Cynthia Unit 2 6,880 1,230 6.08 1.24 4.95 1.00 3.0
Pembina Lobstick 37,900 7,080 11.3 3.21 1.60 0.45 1.4
Pembina Cardium South (Units 2 & 3) Area S1 Area S2 Area S3
37,900 53,200 60,500
4,900 9,850 8,000
16.8 23.5 26.7
4.74 6.65 7.56
3.42 2.39 3.34
0.97 0.68 0.95
2.9 2.1 2.9
P. C. U. # 31 20,000 1,860 5.95 1.29 3.20 0.69 2.1
Pembina Sub-total 384,080 60,100 214 54.2 3.56 0.90 2.73 Caroline Cardium E, WF 4,400 260 2.97 0.90 12.0 3.41 10.3
Caroline Cardium E, SF 4,700 140 3.175 0.96 24.1 6.81 20.6
Carrot Creek Cardium F 5,286 1,400 1.06 0.30 0.76 0.21 0.64
Cyn-Pem Cardium A 6,410 1,200 2.59 0.73 2.16 0.61 1.8
Cyn-Pem Cardium D 7,500 2,300 2.24 0.63 0.97 0.28 0,85
Ferrier Belly River Q, Cardium G & L
73,840
9,250
69.9
14.2 11.65
2.36 7.2
Cardium Analogues Sub-Total 102,136 11,300 82.4 17.7 7.25 1.57 4.76 Total Protoypes + Analogues 486,216 71,400 296 71.9 4.15 1.01 3.06 1 CO2 purchased (and hence “net” utilization, the ratio of purchased CO2 to EOR oil produced) was directly determined only for prototypes in the development plans. For the analogues, the ratio of purchased to injected CO2 of the respective prototypes was used to estimate the CO2 purchase requirement.
CO2 Enhanced Hydrocarbon Recovery Summary Report December, 2009 Incremental Recovery and CO2 Storage Potential in Alberta
6.0 REPORT SUMMARY 6.1 OVERVIEW A detailed reservoir and development analysis to quantify the potential for incremental oil recovery and
CO2 capture and storage has been completed for five horizontal miscible CO2 flood target pool types
(prototypes) in Alberta. The detailed results from the five prototype pools have been extrapolated to some
35 analogue pools and areas to provide an estimate of CO2 enhanced oil recovery potential, CO2
requirement, and associated CO2 storage potential for these pool types. Together, the prototype and
analogue pools studied have original-oil-in-place of 2.523 billion cubic meters (15.869 billion barrels) and
represent approximately 30% of Alberta’s light-medium oil resource. For purposes of this study, the
specific pool areas studied were high graded to include practical floodable areas most likely to have EOR
applied (Table 6.2). The high graded areas had original-oil-in-place of 1.841 billion cubic meters (11.578
billion barrels). The ultimate objective of this project was to provide critical technical information and data
to ADOE to accelerate the pace of CO2 Enhanced Oil Recovery (EOR) and Carbon Capture and Storage
(CCS) demonstration and field projects in Alberta.
While detailed economic assessment was not a deliverable of the project, economic indicators from the
development plans were developed in sufficient detail that the Alberta Department of Energy (ADOE)
could evaluate the economic and crown royalty impact of CO2 EOR in Alberta. This data remains
confidential is not included in this summary report.
ARC led the project with contributions from the Computer Modelling Group (CMG), Divestco Inc.
(Divestco), Silvertip Ventures (Silvertip), SNC-Lavalin Inc. (SNC-Lavalin or SLI), Sproule Associates
Limited (Sproule), and Vikor Energy Inc. (Vikor). The experience gained through this project has
enhanced team member knowledge about CO2 geological storage capacity in Alberta.
The target pool types were selected for study in consultation with ADOE and Alberta Energy Research
Institute (AERI). They were: Beaverhill Lake waterflooded pools, Beaverhill Lake hydrocarbon miscible
flooded pools, Pembina Cardium pools with thief zone, Pembina Cardium pools without thief zone, and
Redwater D-3.
Specific prototype pools selected for detailed study included: waterflooded regions of Judy Creek BHL A
and Swan Hills BHL A&B ; hydrocarbon solvent flooded regions of Swan Hills BHL A&B; North Pembina
Cardium Unit (thief zone prototype); Pembina “A” Lease (no thief zone prototype); and Redwater D-3
(prototype for D-2 and D-3 pools).
The development plan results for the prototype pools are in Table 6.1. It was assumed that CO2 was
delivered at the field gate at the pressure required. No cost for delivered CO2 was determined or
assessed.
Alberta Research Council 6-1
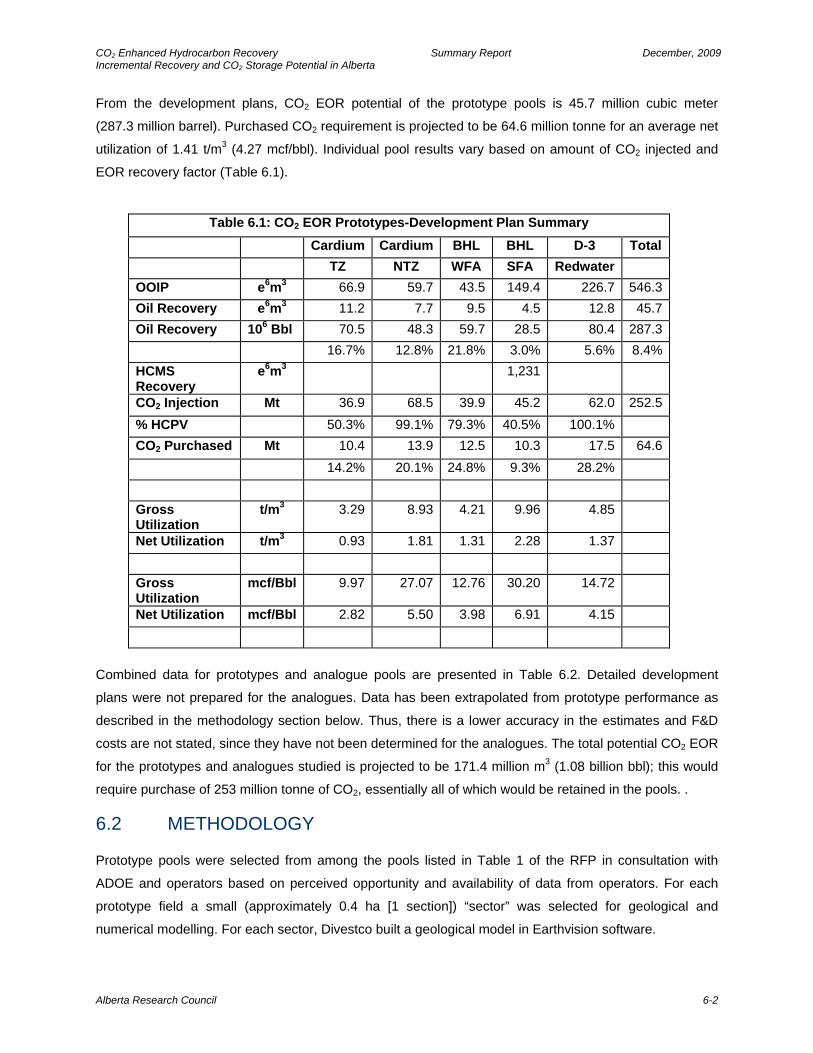
CO2 Enhanced Hydrocarbon Recovery Summary Report December, 2009 Incremental Recovery and CO2 Storage Potential in Alberta From the development plans, CO2 EOR potential of the prototype pools is 45.7 million cubic meter
(287.3 million barrel). Purchased CO2 requirement is projected to be 64.6 million tonne for an average net
utilization of 1.41 t/m3 (4.27 mcf/bbl). Individual pool results vary based on amount of CO2 injected and
EOR recovery factor (Table 6.1).
Table 6.1: CO2 EOR Prototypes-Development Plan Summary
Cardium Cardium BHL BHL D-3 Total TZ NTZ WFA SFA Redwater OOIP e6m3 66.9 59.7 43.5 149.4 226.7 546.3Oil Recovery e6m3 11.2 7.7 9.5 4.5 12.8 45.7Oil Recovery 106 Bbl 70.5 48.3 59.7 28.5 80.4 287.3 16.7% 12.8% 21.8% 3.0% 5.6% 8.4%HCMS Recovery
e6m3 1,231
CO2 Injection Mt 36.9 68.5 39.9 45.2 62.0 252.5% HCPV 50.3% 99.1% 79.3% 40.5% 100.1% CO2 Purchased Mt 10.4 13.9 12.5 10.3 17.5 64.6 14.2% 20.1% 24.8% 9.3% 28.2% Gross Utilization
t/m3 3.29 8.93 4.21 9.96 4.85
Net Utilization t/m3 0.93 1.81 1.31 2.28 1.37 Gross Utilization
mcf/Bbl 9.97 27.07 12.76 30.20 14.72
Net Utilization mcf/Bbl 2.82 5.50 3.98 6.91 4.15
Combined data for prototypes and analogue pools are presented in Table 6.2. Detailed development
plans were not prepared for the analogues. Data has been extrapolated from prototype performance as
described in the methodology section below. Thus, there is a lower accuracy in the estimates and F&D
costs are not stated, since they have not been determined for the analogues. The total potential CO2 EOR
for the prototypes and analogues studied is projected to be 171.4 million m3 (1.08 billion bbl); this would
require purchase of 253 million tonne of CO2, essentially all of which would be retained in the pools. .
6.2 METHODOLOGY
Prototype pools were selected from among the pools listed in Table 1 of the RFP in consultation with
ADOE and operators based on perceived opportunity and availability of data from operators. For each
prototype field a small (approximately 0.4 ha [1 section]) “sector” was selected for geological and
numerical modelling. For each sector, Divestco built a geological model in Earthvision software.
Alberta Research Council 6-2
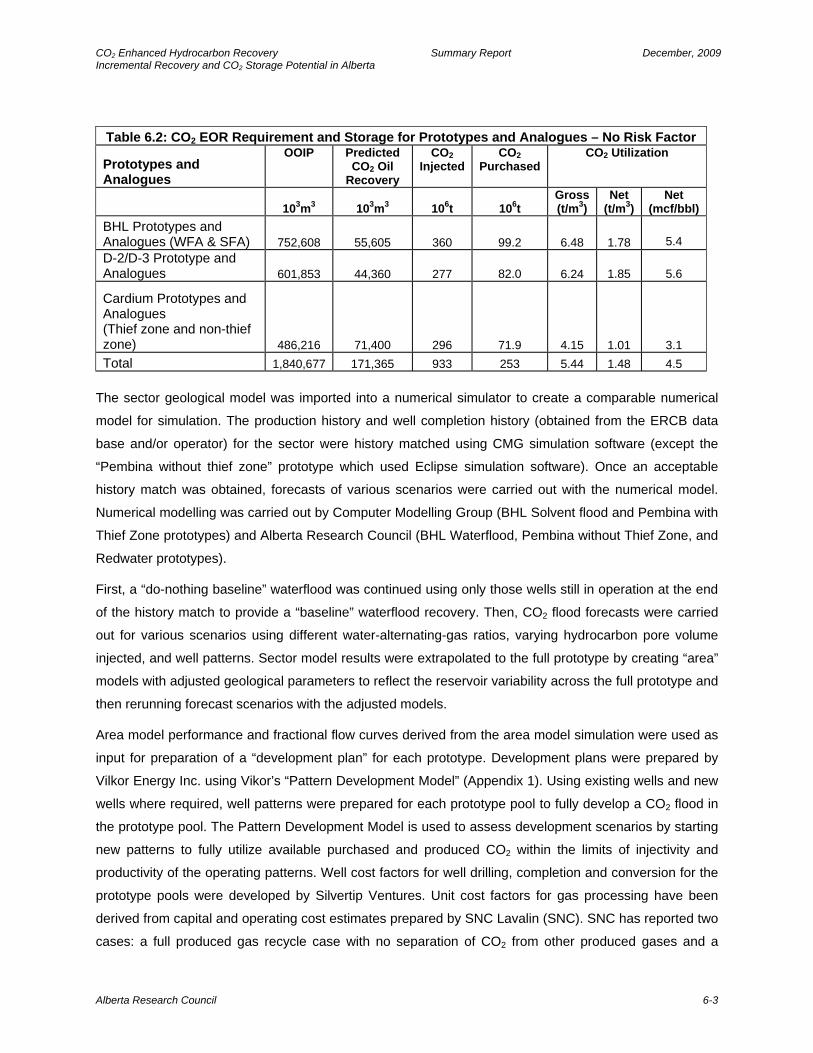
CO2 Enhanced Hydrocarbon Recovery Summary Report December, 2009 Incremental Recovery and CO2 Storage Potential in Alberta
Table 6.2: CO2 EOR Requirement and Storage for Prototypes and Analogues – No Risk Factor
Prototypes and Analogues
OOIP
Predicted CO2 Oil
Recovery
CO2 Injected
CO2 Purchased
CO2 Utilization
103m3 103m3 106t
106t Gross (t/m3)
Net (t/m3)
Net (mcf/bbl)
BHL Prototypes and Analogues (WFA & SFA) 752,608 55,605 360
99.2 6.48
1.78
5.4
D-2/D-3 Prototype and Analogues 601,853 44,360 277
82.0 6.24
1.85
5.6
Cardium Prototypes and Analogues (Thief zone and non-thief zone) 486,216 71,400 296
71.9 4.15
1.01
3.1 Total 1,840,677 171,365 933 253 5.44 1.48 4.5
The sector geological model was imported into a numerical simulator to create a comparable numerical
model for simulation. The production history and well completion history (obtained from the ERCB data
base and/or operator) for the sector were history matched using CMG simulation software (except the
“Pembina without thief zone” prototype which used Eclipse simulation software). Once an acceptable
history match was obtained, forecasts of various scenarios were carried out with the numerical model.
Numerical modelling was carried out by Computer Modelling Group (BHL Solvent flood and Pembina with
Thief Zone prototypes) and Alberta Research Council (BHL Waterflood, Pembina without Thief Zone, and
Redwater prototypes).
First, a “do-nothing baseline” waterflood was continued using only those wells still in operation at the end
of the history match to provide a “baseline” waterflood recovery. Then, CO2 flood forecasts were carried
out for various scenarios using different water-alternating-gas ratios, varying hydrocarbon pore volume
injected, and well patterns. Sector model results were extrapolated to the full prototype by creating “area”
models with adjusted geological parameters to reflect the reservoir variability across the full prototype and
then rerunning forecast scenarios with the adjusted models.
Area model performance and fractional flow curves derived from the area model simulation were used as
input for preparation of a “development plan” for each prototype. Development plans were prepared by
Vilkor Energy Inc. using Vikor’s “Pattern Development Model” (Appendix 1). Using existing wells and new
wells where required, well patterns were prepared for each prototype pool to fully develop a CO2 flood in
the prototype pool. The Pattern Development Model is used to assess development scenarios by starting
new patterns to fully utilize available purchased and produced CO2 within the limits of injectivity and
productivity of the operating patterns. Well cost factors for well drilling, completion and conversion for the
prototype pools were developed by Silvertip Ventures. Unit cost factors for gas processing have been
derived from capital and operating cost estimates prepared by SNC Lavalin (SNC). SNC has reported two
cases: a full produced gas recycle case with no separation of CO2 from other produced gases and a
Alberta Research Council 6-3

CO2 Enhanced Hydrocarbon Recovery Summary Report December, 2009 Incremental Recovery and CO2 Storage Potential in Alberta recycle case in which CO2 is separated from produced gases prior to reinjection. For the Swan Hills
waterflood area, Pembina, and Redwater development plans, the full recycle scenario was used. For the
Swan Hills hydrocarbon solvent flood area development plan, the CO2 separation scenario was used.
Pengrowth, the Judy Creek Gas Conservation System operator, provided input into the estimates. The
SNC report is provided as Appendix 3.
The cost factors have been utilized in the development plans to estimate capital expenditures to
implement the development scenarios. No capital cost was included in the waterflood case. No additional
contingency was added to the SNC and Silvertip estimates. Assumptions used in developing the cost
factors are provided in the respective Sections. Vikor developed the field and plant operating costs, other
than recycle operating costs. Estimated capital and operating costs have not been included in this
summary report.
6.3 DEVELOPMENT PLANS Swan Hills Waterflood Development Plan The EOR project was developed using, where possible, inverted 5 spot patterns on 32 ha (80 acre) per
well spacing and required 10 existing injection wells and 30 converted production wells for injection into
all layers. The inverted 5 spot patterns on 32 ha (80 acre) per well spacing are consistent with recent
development; experimentation with further infill to 16 ha (40 acre) per well spacing is ongoing. Twenty-two
new wells and 54 existing production wells were used for production. It was assumed that less productive
layers in all wells would be stimulated to enhance processing rate when most productive layers are shut
in. The forecast assumed all wells stay on production for the life of the patterns that they service at rates
as determined from analysis of historical well performance in each area.
The development plan forecasts recovery of almost 9.5 million m3 of EOR incremental oil by injection of
almost 40 million tonnes of CO2, including 12.5 million tonnes purchased plus recycle.
The most significant technical risks for BHL waterflood targets include:
• Prior waterflood and solvent flood operations have likely displaced oil in the reef making oil saturation when the CO2 EOR is initiated difficult to predict. The wide variation in oil recovery in Table 5.2.3.1 may be a result of this.
• Simulation predictions are very complex and many simplifying assumptions must be made. In this case, performance of all of the areas was not history matched, consequently prediction is less reliable.
• The operation would need to be integrated with the larger solvent flood area that borders much of the waterflood area.
Swan Hills Solvent Flooded Region Development Plan
The area of the reef build-up in the Swan Hills Beaverhill Lake A&B Pool that previously had hydrocarbon
miscible solvent flood injection was chosen as the prototype for CO2 EOR in Solvent Flood Areas (SFA)
Alberta Research Council 6-4
CO2 Enhanced Hydrocarbon Recovery Summary Report December, 2009 Incremental Recovery and CO2 Storage Potential in Alberta of Beaverhill Lake Pools. The development area consisted of 100 inverted 5 spot patterns on 32 ha
(80 acre) per well spacing. The spacing is consistent with recent Swan Hills development.
CO2 EOR incremental oil recovery of over 4.5 million m3 or 3.0% OOIP is forecast by the simulation with
the injection of over 45 million tonnes of CO2 (10.3 million tonnes purchased) 40% HCPV of CO2 at a
WAG of 1:1 followed by chase water in four of the five areas. Source CO2 is required for 22 years, 9 years
at maximum rate of 2,000 tonne per day.
The most significant technical risks include:
• Prior miscible solvent flood operations have produced a significant portion of the miscible oil in the reef making oil saturation when the CO2 EOR is initiated difficult to predict. This is a quaternary flood rather than tertiary, the first in the world.
• Simulation predictions are very complex and many simplifying assumptions must be made. The difficulties completing the runs and inability to meet expected WOR and the much lower total oil recovery in the simulator compared to the field is of concern. Performance of all of the areas was not history matched, consequently prediction is less reliable.
• The operation would need to be integrated with the lower quality waterflood area that borders much of the solvent flood area.
Pembina with Thief Zone Development The EOR project development plan for Pembina with Thief Zone used existing vertical wells on 32 ha
(80 acre) per well spacing for injection into all zones and the existing vertical production wells completed
in all zones plus new 600 m horizontal wells competed only in sand 4. The concept was that the area is
productivity limited with restricted communication between sand 4 and the upper sand 5/6 and
conglomerate. By injecting into all zones and limiting production from the sand 5/6 and conglomerate,
pressure should be higher in the upper zone promoting injection into the higher oil saturation sand 4. In
addition new horizontal water injection wells were drilled at the end of the on-trend patterns to try to
create a pressure "fence" to minimize loss of CO2 from the patterns through natural fractures.
The development plan shows that the NPCU enhanced recovery by CO2 will recover significant
incremental oil with the given assumptions. Important features of the development plan results are:
• CO2 incremental oil for the development area is 16.7% of original-oil-in-place. This is approximately 11.2 million m3 (70.5 million barrels) incremental recovery from the 66.9 million m3 (421 million barrels) of original-oil-in-place in the development area.
• In 75 years 5.6 million m3 of waterflood oil is also produced; without the development 4.8 million m3 of Base Case waterflood oil would be produced in 75 years.
• Gross CO2 utilization factor was 3.29 tonne/m3 (10.0 mcf/bbl) of incremental oil; net utilization factor was 0.93 tonne/m3 (2.82 mcf/bbl)
• Source CO2 is required for 32 years, 13 years at maximum rate of 1,200 tonne per day.
• Total CO2 injection was 36.9 million tonnes, of which 10.4 million tonnes was purchased.If all produced CO2 were injected 10.4 million tonnes would be stored. Considering that this is the best area of Pembina, this is not a large amount of stored CO2.
Alberta Research Council 6-5
CO2 Enhanced Hydrocarbon Recovery Summary Report December, 2009 Incremental Recovery and CO2 Storage Potential in Alberta A number of risk factors exist:
• In the numerical simulation of NPCU, production from the top conglomerate zone was controlled in order to achieve better sweep and recovery from the lower zones (which contain the bulk of the OOIP). The ability to control the flow of CO2 into the conglomerate is uncertain and introduces risk that the field may not perform as predicted by the simulation and development plan. In addition, the integrity of the shale and impacts of the vertical fractured wells are unknowns. These factors may be mitigated by improvements in horizontal well drilling and fracturing technology in the years preceding the start of the CO2 flood. At this stage the highest probability that could be assigned is an 80% chance of success with this approach. The ARC Resources CO2 pilot may help to assess this risk.
• Can the productivity of the horizontal wells running in the off trend direction be achieved and sustained and fracturing into the upper zones be prevented. Once significant volumes of CO2 are produced, well bottom hole producing pressure must be kept high to minimize Joule-Thompson cooling further impacting productivity.
• Processing rate for injection/production in much of the Pembina area is low. The risk is that there may not be enough productivity and injectivity in any but the best area of Pembina to complete the project in a reasonable time. The numerical simulation required significant time to inject the required volumes of CO2 that can significantly impact project economics.
• Can we flood off trend from the line drives and contain the CO2 in the pattern with the fence wells.
• Field piloting, testing of long horizontal wells in Sand 4 and successfully stimulating with multiple fractures, and staging of the project can help reduce technical risks.
Pembina without Thief Zone Development
The EOR project was developed as a line drive with vertical injection wells on 16 ha (40 acre) per well
spacing for injection into all zones and new 1,200 m horizontal wells between the injectors, completed in
the middle of sand 4 with fractures to the other layers. The area is very productivity limited and required
infill drilling to tight , 20 acre spacing per well. In addition new horizontal water injection wells were drilled
at the end of the on-trend patterns to try to create a pressure "fence" to minimize loss of CO2 from the
patterns through natural fractures. All of the trend patterns are developed together to use the fence wells
before adjacent off trend patterns are developed.
The EOR recovery project benefits from two factors, a very significant acceleration of oil production and
good incremental recovery from CO2 injection. The modelling indicated that almost 1,000 years of
operation would be required to reach the economic limit with current wells, only 8.4% HCPV of water was
injected in 75 years in the Base Case waterflood. A very large amount of capital is involved in developing
the area to achieve an acceptable processing rate; the development plan was not optimized.
The parts of the “A” Lease and the better portion of the Cyn Pem Unit #3 analyzed are the best parts of
these areas in the Pembina Cardium. CO2 EOR incremental oil recovery of 7.7 million m3 or 12.8% OOIP
is forecast by the simulation with the injection of 68.5 million tonnes of CO2 (13.9 million tonnes
purchased), 99.1% HCPV of CO2 at a WAG of 1:1 followed by chase water. All of the patterns had
finished chase water injected in the 65 year forecast. In 65 years, 13.9 million m3 of waterflood oil is also
Alberta Research Council 6-6

CO2 Enhanced Hydrocarbon Recovery Summary Report December, 2009 Incremental Recovery and CO2 Storage Potential in Alberta produced, without the development only 5 million m3 of Base Case waterflood oil would be produced in 75
years. Source CO2 is required for 29 years, 22 years at maximum rate of 1,500 tonne per day. If all
produced CO2 were injected, then 13.9 million tonnes would be stored. Net CO2 utilization is 1.8
tonne/m3 (5.5 mcf/Bbl); gross CO2 utilization is poor at 8.9 tonne/m3 (27 mcf/Bbl), based only on the CO2
EOR oil.
The most significant technical risks include:
• The impact of the natural fractures on containing the flood in the patterns and zones is a very large geological risk. Will the flood move off trend from the line drive and the fence wells contain the CO2 in the pattern?
• Can the productivity of the horizontal wells running in the off trend direction be achieved and sustained?
• Can the flow be forced to the off trend wells with good vertical conformance?
• Is the acceleration of the remaining reserves and the CO2 EOR potential sufficient to support the capital expenditure required?
• Will the productivity and injectivity be adequate to complete the project in a reasonable length of time?
• Operating pressure is very high so cap rock and well bore integrity is critical. Also the high pressure will complicate well operation and workovers.
• Can wax deposition in the reservoir near production wells caused by cooling from the expansion of CO2 be avoided?
An extended field pilot test will be necessary to develop strategies to mitigate these risks.
Redwater Development
The Redwater EOR project was developed with 222 inverted 9 spot patterns using existing vertical wells
on 16 ha (40 acre) per well spacing. The forecast assumes all wells stay on production for the life of the
patterns that they service at rates provided from analysis of historical well performance in each area. that
The development plan assumed that the displacement process is horizontal, not vertical as assumed in
previous EOR predictions in the pool. ARC Resources believes the displacement process is vertical,
which is preferable if vertical continuity is sufficient for the process to work. Recovery from the pool is
excellent to date, in part because of very efficient fluid handling. CO2 EOR will have to be operated very
efficiently to be economic as large volumes of fluid must be processed. Incremental recovery is relatively
low because the process is not fully miscible and the remaining target is low.
CO2 EOR incremental oil recovery of 12.8 million m3 or 5.6% OOIP is forecast by the simulation. Sixty-
two million tonnes of CO2 (17.5 million tonnes purchased), equivalent to 100.1% HCPV of CO2, were
injected at a WAG of 1.1 followed by up to 275% HCPV of chase water. Because of the high processing
rate and tight well spacing the injection could be completed in about 30 years. Source CO2 is required for
Alberta Research Council 6-7
CO2 Enhanced Hydrocarbon Recovery Summary Report December, 2009 Incremental Recovery and CO2 Storage Potential in Alberta 14 years, 11 years at maximum rate of 4,000 tonne per day. If all produced CO2 were injected, then 17.5
million tonnes would be stored. Net CO2 utilization is good at 1.37 tonne/m3 (4.1 mcf/Bbl); gross CO2
utilization is 4.85 tonne/m3 (14.7 mcf/Bbl), based on EOR oil.
The most significant technical risks include:
• The flood must be operated at near miscible conditions to achieve predicted recovery. Reaching this pressure may be difficult with the underlying aquifer that is connected with the massive Cooking Lake aquifer.
• The operating pressure and temperature are very close to CO2 critical point complicating the performance prediction.
• Whether the CO2 flood can be operated as a vertical or horizontal displacement process is uncertain. The geological analysis used in this study suggests that barriers preclude a vertical displacement process. The operator does not believe these barriers are continuous and is piloting to see if vertical displacement can be achieved. The horizontal displacement process evaluated in this study should be more conservative than a vertical displacement process.
• Gravity override will very negatively impact a horizontal displacement process in the thick zones as the CO2 is much lighter than oil (250 kg/m3) at operating conditions.
• If reservoir pressure could be increased to hydrostatic level, CO2 density could be increased to about 700 kg/m3 reducing gravity override and increasing CO2 storage, but utilization factor would be much poorer.
• The pool has many old wells, is relatively shallow and is proximate to areas with significant population and hence safety precautions will be critical.
A field pilot test will be necessary to confirm that the CO2 will mobilize sufficient residual oil at achievable
operating conditions.
6.4 ANALOGUES
A number of “analogue” pools to the prototype pools were identified. The results of sector model
simulation and prototype development plans were used to extrapolate results to the analogue pools. A
methodology was developed to extrapolate simulation and development plan results to estimate CO2
enhanced oil recovery potential and CO2 requirements and utilization for the analogue pools.
Table 6.3 gives EOR oil recovery and CO2 requirements for the Beaverhill Lake group of pools. For the
BHL target pools, potential CO2 EOR would be 55.6 million m3 (350 million bbl). Total injection of CO2
including recycle would be 360.2 Mt. giving a gross CO2 utilization of 6.48 t/m3 (19.6 mcf/bbl). A total of
99.2 Mt of purchased CO2 would be required giving net CO2 utilization of 1.78 t/m3 (5.39 mcf/bbl).
Essentially all of the purchased CO2 would be retained (stored) in the BHL pools at the end of the project
life.
Alberta Research Council 6-8

CO2 Enhanced Hydrocarbon Recovery Summary Report December, 2009 Incremental Recovery and CO2 Storage Potential in Alberta
Table 6.3: CO2 Requirement and Storage for BHL Prototypes and Analogues-No Risk Factor Field/Pool Recovery
Process OOIP Predicted
EOR Oil Recovery
CO2 Injected
CO2 Purchased1
CO2 Utilization
103m3 103m3 106t 106t Gross
(t/m3) Net
(t/m3) Net
(mcf/bbl) Ante Creek BHL SF 5931 580 2.47 0.57 4.25 0.97 2.9 Carson Creek North BHL A & B WF 56930 9700 54.2 16.9 5.59 1.74 5.3
Goose River BHL A SF 16160 530 6.11 1.40 11.53 2.64 8.0
Goose River BHL A WF 9341 1090 6.72 2.10 6.16 1.92 5.8
Judy Creek BHL A SF 77950 3520 26.7 6.11 7.58 1.74 5.2
Judy Creek BHL A WF 48030 2900 24.25 7.56 8.36 2.61 7.9
Judy Creek BHL B SF 28370 1210 11.13 2.55 9.20 2.11 6.4
Judy Creek BHL B WF 11360 1320 7.67 2.39 5.81 1.81 5.5
Kaybob BHL A SF 36830 940 17.43 3.99 18.54 4.24 12.8
Kaybob BHL A WF 11290 1310 10.0 3.13 7.66 2.39 7.2
Simonette BHL A WF 7764 1330 14.2 4.44 10.69 3.34 10.1
Snipe Lake BHL WF 36600 3450 18.5 5.78 5.37 1.67 5.1
Swan Hills BHL A & B (SF prototype)
SF 149435 4539 45.2 10.3 9.96 2.28 6.9
Swan Hills BHL A & B (WF prototype)
WF 43547 9486 39.9 12.5 4.21 1.31 4.0
Swan Hills South BHL A & B SF 138800 6800 38.5 8.81 5.66 1.30 3.9
Virginia Hills BHL SF 35340 3400 10.87 2.49 3.20 0.73 2.2
Virginia Hills BHL WF 38930 3500 26.24 8.19 7.49 2.33 7.1
Sub-total for WF group WF 263,792 34,086 201.8 63.0 5.92 1.85 5.6
Sub-total for SF group SF 488,816 21,519 158.4 36.2 7.36 1.68 5.1
Total 752,608 55,605 360.2 99.2 6.48 1.78 5.4
1 CO2 purchased (and hence “net” utilization, the ratio of purchased CO2 to EOR oil produced) was directly determined only for prototypes in the development plans. For the analogues, the ratio of purchased to injected CO2 of the respective prototypes was used to estimate the CO2 purchase requirement.
Table 6.4 gives EOR oil recovery and CO2 requirements for the D-2 and D-3 group of pools. For the
D-2/D-3 target pools, potential CO2 EOR would be 44.4 million m3 (279 million bbl). Total injection of CO2
including recycle would be 277 Mt giving a gross CO2 utilization of 6.24 t/ m3 (18.9 mcf/bbl). A total of
82 Mt of purchased CO2 would be required giving net CO2 utilization of 1.85 t/m3 (5.60 mcf/bbl).
Essentially all of the purchased CO2 would be retained (stored) in the D-2/D-3 pools at the end of the
project life.
Table 6.5 gives the EOR oil recovery and CO2 requirements for the group of Cardium pools and areas
studied. The Pembina Cardium field contributes the bulk of the CO2 EOR for the Cardium group. For
Pembina Cardium, potential CO2 EOR would be 60.1 million m3 (378 million bbl). Injection of CO2
including recycle would be 214 Mt giving a gross CO2 utilization of 3.56 t/m3 (10.8 mcf/bbl). A total of 54.2
Mt of purchased CO2 would be required giving net CO2 utilization of 0.90 t/m3 (2.73 mcf/bbl). Essentially
all of the purchased CO2 would be retained (stored) in the Pembina Cardium at the end of the project life.
Alberta Research Council 6-9

CO2 Enhanced Hydrocarbon Recovery Summary Report December, 2009 Incremental Recovery and CO2 Storage Potential in Alberta
Table 6.4: CO2 Requirement and Storage for D-2/D-3 Prototype and Analogues-No Risk Factor
Field/Pool OOIP
Predicted EOR Oil
Recovery CO2
Injected
CO2 Purchased1
CO2 Utilization
103m3 103 106t
106t Gross (t/m3)
Net (t/m3)
Net (mcf/bbl)
Fenn Big Valley D-2A 74200 2700 46.2 13.4 17.1 4.97 15.0 Joffre D-2 26650 2900 11.8 3.69 4.08 1.27 3.8 Leduc Woodbend D-2A 32700 5.07 12.2 3.80 2.40 0.75 2.3 Meekwap D-2A 11810 390 9.26 2.69 23.7 6.91 20.9 West Drumheller D2A & B 8905 1780 3.74 1.17 2.10 0.66 2.0 Bonnie Glen D-3A 125000 4770 56.1 16.3 11.7 3.42 10.4 Leduc Woodbend D-3A 52650 2280 32.6 9.50 14.3 4.17 12.6 Morinville D-3B 3318 104 1.71 0.50 17.1 4.97 15.0 Redwater D-3 207000 12778 60.0 17.5 4.85 1.37 4.2 Sturgeon Lake D-3A 13550 1720 9.81 3.06 5.70 1.78 5.4 Sturgeon Lake South D-3 46070 9870 33.3 10.4 3.38 1.05 3.2 Total 601,853 44,360 276.7 82.0 6.24 1.85 5.6 1 CO2 purchased (and hence “net” utilization, the ratio of purchased CO2 to EOR oil produced) was directly determined only for prototypes in the development plans. For the analogues, the ratio of purchased to injected CO2 of the respective prototypes was used to estimate the CO2 purchase requirement.
For the combined Pembina Cardium and Cardium analogues assessed, the total potential CO2 EOR
would be 71.4 million m3 (449 million bbl). Injection of CO2 including recycle would be 296 Mt giving a
gross CO2 utilization of 4.15 t/m3 (12.6 mcf/bbl). A total of 71.9 Mt of purchased CO2 would be required
giving net CO2 utilization of 1.01 t/m3 (3.06 mcf/bbl). Essentially all of the purchased CO2 would be
retained (stored) in the Cardium protoypes and analogues at the end of the project life.
Alberta Research Council 6-10
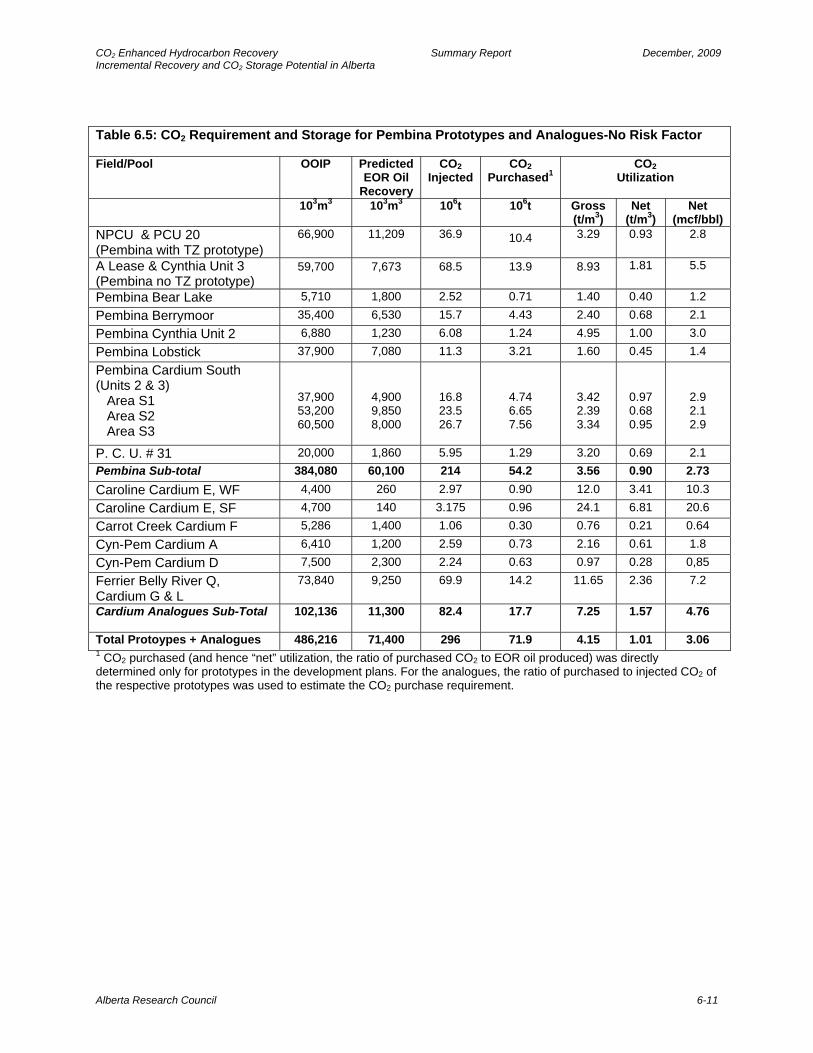
CO2 Enhanced Hydrocarbon Recovery Summary Report December, 2009 Incremental Recovery and CO2 Storage Potential in Alberta
Table 6.5: CO2 Requirement and Storage for Pembina Prototypes and Analogues-No Risk Factor
Field/Pool OOIP Predicted EOR Oil
Recovery
CO2 Injected
CO2 Purchased1
CO2 Utilization
103m3 103m3 106t 106t Gross
(t/m3) Net
(t/m3) Net
(mcf/bbl) NPCU & PCU 20 (Pembina with TZ prototype)
66,900
11,209
36.9
10.4 3.29
0.93 2.8
A Lease & Cynthia Unit 3 (Pembina no TZ prototype)
59,700
7,673
68.5
13.9 8.93
1.81 5.5
Pembina Bear Lake 5,710 1,800 2.52 0.71 1.40 0.40 1.2 Pembina Berrymoor 35,400 6,530 15.7 4.43 2.40 0.68 2.1 Pembina Cynthia Unit 2 6,880 1,230 6.08 1.24 4.95 1.00 3.0 Pembina Lobstick 37,900 7,080 11.3 3.21 1.60 0.45 1.4 Pembina Cardium South (Units 2 & 3) Area S1 Area S2 Area S3
37,900 53,200 60,500
4,900 9,850 8,000
16.8 23.5 26.7
4.74 6.65 7.56
3.42 2.39 3.34
0.97 0.68 0.95
2.9 2.1 2.9
P. C. U. # 31 20,000 1,860 5.95 1.29 3.20 0.69 2.1 Pembina Sub-total 384,080 60,100 214 54.2 3.56 0.90 2.73 Caroline Cardium E, WF 4,400 260 2.97 0.90 12.0 3.41 10.3 Caroline Cardium E, SF 4,700 140 3.175 0.96 24.1 6.81 20.6 Carrot Creek Cardium F 5,286 1,400 1.06 0.30 0.76 0.21 0.64 Cyn-Pem Cardium A 6,410 1,200 2.59 0.73 2.16 0.61 1.8 Cyn-Pem Cardium D 7,500 2,300 2.24 0.63 0.97 0.28 0,85 Ferrier Belly River Q, Cardium G & L
73,840
9,250
69.9
14.2 11.65
2.36 7.2
Cardium Analogues Sub-Total 102,136
11,300
82.4
17.7 7.25
1.57 4.76
Total Protoypes + Analogues 486,216 71,400 296 71.9 4.15 1.01 3.06 1 CO2 purchased (and hence “net” utilization, the ratio of purchased CO2 to EOR oil produced) was directly determined only for prototypes in the development plans. For the analogues, the ratio of purchased to injected CO2 of the respective prototypes was used to estimate the CO2 purchase requirement.
Alberta Research Council 6-11
CO2 Enhanced Hydrocarbon Recovery Summary Report December, 2009 Incremental Recovery and CO2 Storage Potential in Alberta
Alberta Research Council 6-12
6.5 RECOMMENDATIONS
ARC recommends further work in the following areas:
• A total of 17 different prototypes were recommended to cover the formations suitable for horizontal
miscible, horizontal immiscible and floods on pools with a gas cap. To commence the project
5 prototypes were selected in the largest horizontal miscible pools. Additional work on the 12 other
prototypes and on the vertical displacement pools, not included in the original RFP would enhance
the understanding of potential CO2 recovery in Alberta.
• The five simulations produced in this report require more refinement. Specifically more sensitivities
are required. Time and resources available in the current project were not sufficient to conduct a
broad suite of sensitivities. Area models could be improved by more realistic history matching.
• The simulations have been run on the prototypes with the most potential for CO2 EOR in the province.
History matches and sensitivity studies to select injection strategy for these simulations were
performed on relatively small areas of the pools. Predictive only runs were made for other pool areas
with adjusted pay, porosity, permeability and saturation, without any history match or analysis of
optimum injection strategy. Accuracy could be improved by completing history matches and injection
strategy sensitivities on all of the areas. In particular further work on the Beaverhill Lake Solvent
Flood Areas would be beneficial because of the size of the prize and the difficulty achieving
satisfactory prediction runs.
• Locating CO2 backbone pipeline in relation to the best CO2 storage reservoirs.
• This study was restricted to the field characteristics for CO2 flooding and did not consider the
proximity to suitable CO2 sources and the cost to deliver CO2 to the field. It would be useful to build
on this work by evaluating potential sources and estimate transportation costs to deliver the CO2 to
the fields so economics can be run to quantify the size of the “gap” between the cost to capture,
purify, compress and transport the CO2 and its value as a solvent.
CO2 Enhanced Hydrocarbon Recovery Summary Report December, 2009 Incremental Recovery and CO2 Storage Potential in Alberta
7.0 REFERENCES Alberta Energy and Utilities Board, ST98-2007: Alberta’s Energy Reserves 2006 and Supply/Demand Outlook 2007-2016. Canadian Association of Petroleum Producers Statistical Handbook for Canada’s Upstream Petroleum Industry, September 2008. Dashtgard, S.E., Buschkuehle, M.B.E., Berhane, M. and Fairgrieve, B., Local-Scale Baseline Geological Report for the Pembina-Cardium CO2-Enhanced Oil Recovery Site, Alberta Geological Survey, Alberta Energy and Utilities Board, November 2006. Jarrell, P.M., C. Fox, M. Stein, and S. Webb, “Practical Aspects of CO2 Flooding”, SPE Monograph Volume 22, SPE, 2002. Krause, F.F., Deutsch, K.B., Joiner, S.D., Barclay, J.E., Hall, R.L. and Hills, L..V. 1994. Cretaceous Cardium Formation of the Western Canada Sedimentary Basin. In Geological Atlas of the Western Canada Sedimentary Basin. G.D. Mossop and I. Shetsen (comps.). Calgary, Canadian Society of Petroleum Geologists and Alberta Research Council, p. 375 – 383. Krause, F.F. and Nelson, D.A, Storm Event Sedimentation: Lithofacies Association in the Cardium Formation, Pembina Area, West-Central Alberta, Canada in: Stott, D.F. and Glass, D.J. (Eds), The Mesozoic of Middle North America. Calgary, Alberta: Canadian Society of Petroleum Geologists, Memoir 9, pp. 485-511. Nguyen, T.A., S.M. Farouq Ali, “Immiscible Carbon Dioxide Floods Using Impure Gas in the WAG Model”, Petroleum Society of CIM Paper 93-69, presented at the Petroleum Society of CIM Annual Technical Meeting, May 9-12, 1993, Calgary, AB, Canada. Oldale, H.S. and Munday, R.J., Devonian Beaverhill Lake Group of the Western Canadian Sedimentary Basin. In Geological Atlas of the Western Canada Sedimentary Basin. G.D. Mossop and I. Shetsen (comps.). Calgary, Canadian Society of Petroleum Geologists and Alberta Research Council, p. 149-163. Plint, A.G., Walker, R.G., and Bergman, K.M, Cardium Formation 6. Stratigraphic Framework of the Cardium in the Subsurface. Bulletin of Canadian Petroleum Geology V.34, No. 2, June 1986, pp. 213-225. Purvis, R.A. and Bober, W.G., 1979. A Reserves Review of the Pembina Cardium Pool. Journal of Canadian Petroleum Technology, July – September 1979, p. 20 – 34. Ross Smith Energy Group Ltd, 2006. Inconvenient Truth: Tough Slogging for PWT’s CO2 Project. April 13, 2006. Switzer, S.B., Holland, W.G., Christie, D.S., Graf, G.C., Hedinger, A.S., McAuley, R.J., Wierzbicki, R.A. and Packard, J.J., 1994. Devonian Woodbend – Winterburn Strata of the Western Canada Sedimentary Basin. In Geological Atlas of the Western Canada Sedimentary Basin. G.D. Mossop and I. Shetsen (comps.). Calgary, Canadian Society of Petroleum Geologists and Alberta Research Council, p. 165 – 201. Tristone Capital, date unknown. Imperial Oil Resources: Redwater Valuation Summary, p. 54–75. Willmon, G.J., “A study of displacement efficiency in the Redwater field”, J. Pet. Tech., April, 1967, p. 449-456.
Alberta Research Council 7-1
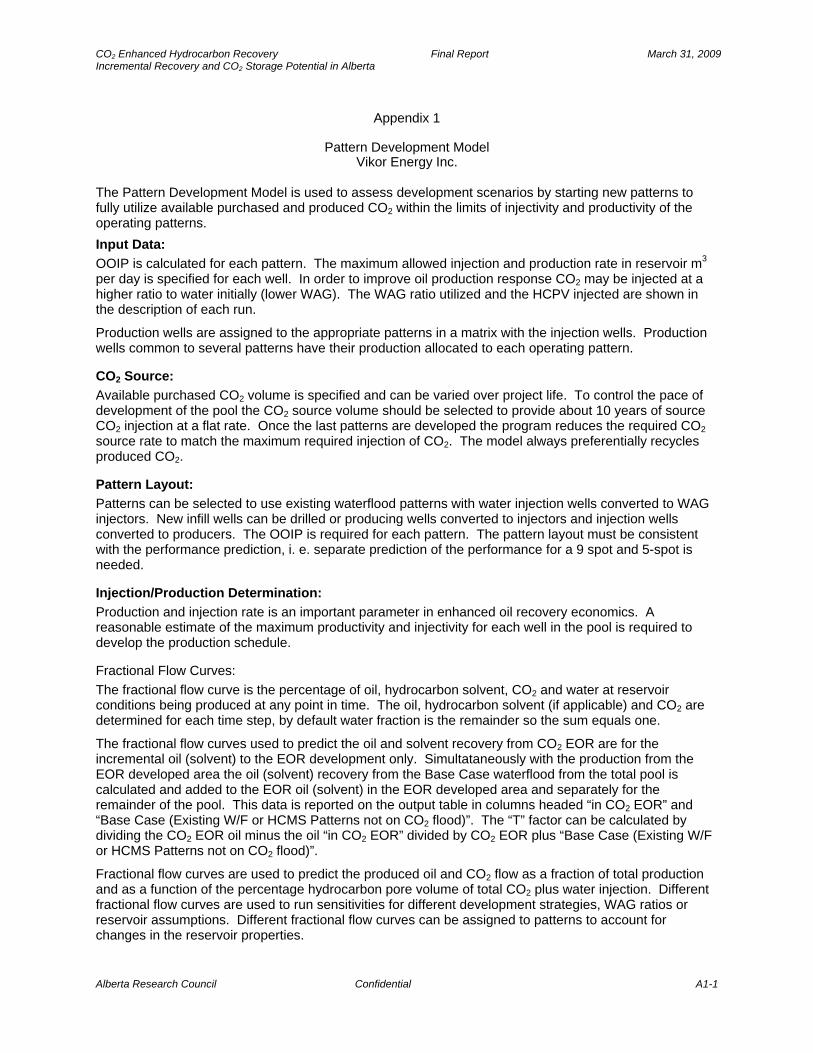
CO2 Enhanced Hydrocarbon Recovery Final Report March 31, 2009 Incremental Recovery and CO2 Storage Potential in Alberta
Appendix 1
Pattern Development Model
Vikor Energy Inc. The Pattern Development Model is used to assess development scenarios by starting new patterns to fully utilize available purchased and produced CO2 within the limits of injectivity and productivity of the operating patterns. Input Data: OOIP is calculated for each pattern. The maximum allowed injection and production rate in reservoir m3 per day is specified for each well. In order to improve oil production response CO2 may be injected at a higher ratio to water initially (lower WAG). The WAG ratio utilized and the HCPV injected are shown in the description of each run.
Production wells are assigned to the appropriate patterns in a matrix with the injection wells. Production wells common to several patterns have their production allocated to each operating pattern.
CO2 Source: Available purchased CO2 volume is specified and can be varied over project life. To control the pace of development of the pool the CO2 source volume should be selected to provide about 10 years of source CO2 injection at a flat rate. Once the last patterns are developed the program reduces the required CO2 source rate to match the maximum required injection of CO2. The model always preferentially recycles produced CO2.
Pattern Layout: Patterns can be selected to use existing waterflood patterns with water injection wells converted to WAG injectors. New infill wells can be drilled or producing wells converted to injectors and injection wells converted to producers. The OOIP is required for each pattern. The pattern layout must be consistent with the performance prediction, i. e. separate prediction of the performance for a 9 spot and 5-spot is needed.
Injection/Production Determination: Production and injection rate is an important parameter in enhanced oil recovery economics. A reasonable estimate of the maximum productivity and injectivity for each well in the pool is required to develop the production schedule.
Fractional Flow Curves: The fractional flow curve is the percentage of oil, hydrocarbon solvent, CO2 and water at reservoir conditions being produced at any point in time. The oil, hydrocarbon solvent (if applicable) and CO2 are determined for each time step, by default water fraction is the remainder so the sum equals one.
The fractional flow curves used to predict the oil and solvent recovery from CO2 EOR are for the incremental oil (solvent) to the EOR development only. Simultataneously with the production from the EOR developed area the oil (solvent) recovery from the Base Case waterflood from the total pool is calculated and added to the EOR oil (solvent) in the EOR developed area and separately for the remainder of the pool. This data is reported on the output table in columns headed “in CO2 EOR” and “Base Case (Existing W/F or HCMS Patterns not on CO2 flood)”. The “T” factor can be calculated by dividing the CO2 EOR oil minus the oil “in CO2 EOR” divided by CO2 EOR plus “Base Case (Existing W/F or HCMS Patterns not on CO2 flood)”.
Fractional flow curves are used to predict the produced oil and CO2 flow as a fraction of total production and as a function of the percentage hydrocarbon pore volume of total CO2 plus water injection. Different fractional flow curves are used to run sensitivities for different development strategies, WAG ratios or reservoir assumptions. Different fractional flow curves can be assigned to patterns to account for changes in the reservoir properties.
Alberta Research Council Confidential A1-1

CO2 Enhanced Hydrocarbon Recovery Final Report March 31, 2009 Incremental Recovery and CO2 Storage Potential in Alberta
Alberta Research Council Confidential A1-2
A separate set of fractional flow curves are needed for each different pattern response expected for each Case. For example a Case might be to inject 100% CO2 for 10% HCPV, followed by a WAG ratio of 0.5 for 20% (CO2) HCPV, followed by a WAG ratio of 2.0 for 20% (CO2) HCPV, then followed by 100% water for 50% HCPV, for a total injection of 150% HCPV, 50% HCPV CO2. A set of fractional flow curves, preferrably in 1% HCPV increments showing the share of flow (in reservoir volume) of oil, CO2 and, if applicable, hydrocarbon miscible solvent, remainder is assumed to be water, for each area that has different performance. See attached example fractional flow table.
To account for some risk a percentage of predicted oil and CO2 production can be used in the economic runs.
Prediction Method: A sufficient number of patterns for the specified injection rate begin to operate at the start of the project. The program injects the available purchased CO2 and the volume of CO2 produced in the previous time step, at the specified WAG ratio and the percentage of hydrocarbon pore volume injected at the end of the specified time is determined. The fractional flow curve for this percentage of hydrocarbon pore volume is then used to predict the volume of oil and CO2 produced. The status of injection for each pattern is tracked independently for each time step.
The maximum injection rate is determined by the pattern injectivity and productivity, assuming a voidage replacement ratio of one. The available productivity is calculated from the productivity of the specified wells producing from the pattern. The producing well productivity is divided equally among the number of operating patterns from which the well produces. Pattern productivity will change as new patterns are added. Some of the wells which initially only produce from one pattern could ultimately, in a five spot development, produce from four patterns.
A new pattern is added when the existing patterns are unable to take the available CO2. Once all of the patterns are operating the source CO2 purchases are limited to match the demand assuming 100% of the produced CO2 is recycled. CO2 injection terminates into a pattern when the specified % HCPV of CO2 is reached and the pattern remains in operation, including any producing wells associated with it, until the total CO2 and water injection volume is reached.
Output: The program tracks the number of patterns and wells operating at any given time. The new injection and production wells required with a new pattern is determined and the specified well completion and tie-in cost added when the pattern comes on stream.
The production well starts up when the first pattern it is associated with begins injection and is shut in when the last pattern it is associated with ceases injection. The number of operating injection and production wells is tracked in order to estimate well operating costs. The oil, water, and CO2 production and the volume of source and recycled CO2 and water injected are calculated monthly.

CO2 Enhanced Hydrocarbon Recovery Summary Report December, 2009 Incremental Recovery and CO2 Storage Potential in Alberta
Appendix 2
Conceptual Surface Facilities Design For CO2 Flood
SCN Lavalin
Alberta Research Council A2-1
FINAL REPORT Revision 1
ENHANCED HYDROCARBON
RECOVERY STUDY
Prepared for
Alberta Research Council Inc. (ARC)
Project #017935 September, 2008
ENHANCED HYDROCARBON RECOVERY STUDY (FINAL) Prepared for: Alberta Research Council (ARC) Rev. 1 Project 017935, September, 2008
Chemicals and Petroleumi
TABLE OF CONTENTS NOTICE TO READER 1.0 EXECUTIVE SUMMARY 2.0 INTRODUCTION
2.1 OVERALL PROJECT SCOPE 2.2 SNC-LAVALIN SCOPE
3.0 STUDY OBJECTIVES, SCOPE AND METHODOLOGY 4.0 STUDY BASIS 5.0 CASE DEFINITIONS 6.0 TECHNICAL DEVELOPMENT OF THE CASES
6.1 PROCESSING CAPACITY REQUIREMENTS 6.2 CO2 SEPARATION TECHNOLOGY 6.3 STATE OF COMMERCIAL DEVELOPMENT: GAS SEPARATION
MEMBRANES 6.4 INLET SEPARATION 6.5 COMPRESSORS 6.6 COMPRESSOR DRIVERS 6.7 DEHYDRATION 6.8 REFRIGERATION 6.9 MEMBRANE SEPARATION 6.10 CO2 RECYCLE 6.11 UTILITIES 6.12 PLOT SPACE 6.13 CONTROL ROOMS 6.14 PIPELINES
7.0 COST ESTIMATES 8.0 RESULTS
8.1 ECONOMIC CALCULATIONS 8.2 OBSERVATIONS
9.0 CONCLUSIONS 10.0 RECOMMENDATIONS APPENDICES: APPENDIX 1 SNC-Lavalin’s Team Members APPENDIX 2 Technical Design Parameters and Drawings

ENHANCED HYDROCARBON RECOVERY STUDY (FINAL) Prepared for: Alberta Research Council (ARC) Rev. 1 Project 017935, September, 2008
Chemicals and Petroleumii
APPENDIX 3 Cost Estimate Basis APPENDIX 4 Cost Estimate Detail

ENHANCED HYDROCARBON RECOVERY STUDY (FINAL) Prepared for: Alberta Research Council (ARC) Rev. 1 Project 017935, September, 2008
Chemicals and Petroleum1
NOTICE TO READER This document contains the expression of the professional opinion of SNC-Lavalin Inc. (“SLI”) as to the matters set out herein, using its professional judgment and reasonable care. It is to be read in the context of the agreement dated November 12, 2007 (the “Agreement”) between SLI and Alberta Research Council Inc. (the “Client” or “ARC”), and the methodology, procedures and techniques used, SLI’s assumptions, and the circumstances and constraints under which its mandate was performed. This document is written solely for the purpose stated in the Agreement, and for the sole and exclusive benefit of the Client, whose remedies are limited to those set out in the Agreement. This document is meant to be read as a whole, and sections or parts thereof should thus not be read or relied upon out of context. SLI has, in preparing the cost estimates, followed methodology and procedures, and exercised due care consistent with the intended level of accuracy, using its professional judgment and reasonable care, and is thus of the opinion that there is a high probability that actual costs will fall within the specified error margin. However, no warranty should be implied as to the accuracy of estimates. Unless expressly stated otherwise, assumptions, data and information supplied by, or gathered from other sources (including the Client, other consultants, testing laboratories and equipment suppliers, etc.) upon which SLI’s opinion as set out herein is based has not been verified by SLI; SLI makes no representation as to its accuracy and disclaims all liability with respect thereto. SLI disclaims any liability to the Client and to third parties in respect of the publication, reference, quoting, or distribution of this report or any of its contents to and reliance thereon by any third party.
ENHANCED HYDROCARBON RECOVERY STUDY (FINAL) Prepared for: Alberta Research Council (ARC) Rev. 1 Project 017935, September, 2008
Chemicals and Petroleum2
1.0 EXECUTIVE SUMMARY This study forms part of one component, Task 3, of a wider project being undertaken by ARC for the Alberta Energy Research Institute (“AERI”) titled “CO2 Enhanced Hydrocarbon Recovery (EHR): Incremental Recovery and CO2 Storage Potential in Alberta”. SNC Lavalin’s scope of work is to evaluate two cases of the surface facility design in a conceptual commercial scale operation, for the selected oil field (subsequently defined as a “hypothetical” field). We are told that the purpose of developing this processing design and cost estimate is to provide a basis for extrapolating the processing from one hypothetical Alberta oil producing field to any number of real Alberta oil fields once the preliminary reservoir evaluation work has been completed and ranked (a task being done by others in parallel with this work). Two cases were considered to process the production from the hypothetical oilfield: Case 1: Separation of fluids and compression of the produced gas back into the reservoir without any CO2 /hydrocarbon separation. Case 2: Separation of fluids, recovery and purification of CO2 and compression of the produced CO2 for re-injection into the reservoir at a purity of some 96% v/v CO2. The design concept for the CO2 processing facility excludes any gathering or distribution pipelines. The facility is assumed to be installed as a new separate unit at the inlet of an existing oil production and treating facility in Alberta. It is assumed that the new facility will require electric power from the grid and that all other utility requirements (relatively minor, including natural gas) will be available from the host oil production facility. It is also assumed that the oil production facility will have associated with it an adequately sized gas processing unit. Given the large inlet flowrate variations during the project lifetime, the facilities were sized based on operating year 19 flow rates, considered to be the peak production year of the project. Note that all dollar values in this report are expressed in CAD. SLI has used an exchange rate from USD, the currency of most of the external information sources, at a nominal exchange rate of CAD 1.00 = USD 1.00. Capital and operating costs of the selected membrane technology are summarized as follows:
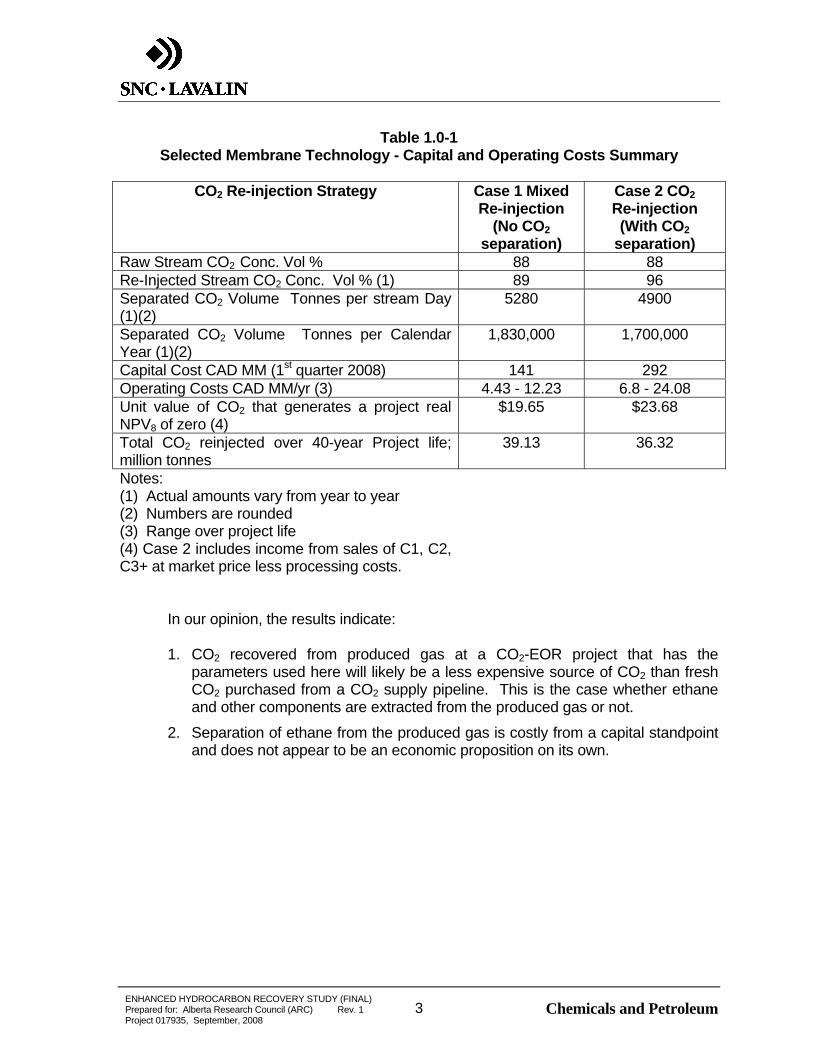
ENHANCED HYDROCARBON RECOVERY STUDY (FINAL) Prepared for: Alberta Research Council (ARC) Rev. 1 Project 017935, September, 2008
Chemicals and Petroleum3
Table 1.0-1 Selected Membrane Technology - Capital and Operating Costs Summary
CO2 Re-injection Strategy Case 1 Mixed
Re-injection (No CO2
separation)
Case 2 CO2 Re-injection (With CO2
separation) Raw Stream CO2 Conc. Vol % 88 88 Re-Injected Stream CO2 Conc. Vol % (1) 89 96 Separated CO2 Volume Tonnes per stream Day (1)(2)
5280 4900
Separated CO2 Volume Tonnes per Calendar Year (1)(2)
1,830,000 1,700,000
Capital Cost CAD MM (1st quarter 2008) 141 292 Operating Costs CAD MM/yr (3) 4.43 - 12.23 6.8 - 24.08 Unit value of CO2 that generates a project real NPV8 of zero (4)
$19.65 $23.68
Total CO2 reinjected over 40-year Project life; million tonnes
39.13 36.32
Notes: (1) Actual amounts vary from year to year (2) Numbers are rounded (3) Range over project life (4) Case 2 includes income from sales of C1, C2, C3+ at market price less processing costs.
In our opinion, the results indicate: 1. CO2 recovered from produced gas at a CO2-EOR project that has the
parameters used here will likely be a less expensive source of CO2 than fresh CO2 purchased from a CO2 supply pipeline. This is the case whether ethane and other components are extracted from the produced gas or not.
2. Separation of ethane from the produced gas is costly from a capital standpoint and does not appear to be an economic proposition on its own.
ENHANCED HYDROCARBON RECOVERY STUDY (FINAL) Prepared for: Alberta Research Council (ARC) Rev. 1 Project 017935, September, 2008
Chemicals and Petroleum4
2.0 INTRODUCTION
2.1 Overall Project Scope This study forms part of one component, Task 3, of a wider project being undertaken by the Client for the Alberta Energy Research Institute (“AERI”) titled “CO2 Enhanced Hydrocarbon Recovery (EHR): Incremental Recovery and CO2 Storage Potential in Alberta”. As we understand it the other two components are: • Task 1 identifies, based on reservoir and performance characteristics,
seventeen prototype pools forming the basis for further evaluation in Tasks 2 and 3.
• Task 2 involves more rigorous evaluation of the 17 pools selected from Task 1. Of these pools, 12 are evaluated using correlations (incorporated in PRIze) and five are to be benchmarked against actual field data and available simulation predictions and to permit extrapolation of information to other Alberta pools.
Task 3 (this task) is to prepare a development plan where economic factors and policy elements can be considered and evaluated. Specifically, SNC-Lavalin’s scope of work is to evaluate two cases of the surface facility design in a conceptual commercial scale operation, for the selected oil field (subsequently defined as a “hypothetical” field). ARC has further Task 3 responsibilities for downhole operational estimating and extrapolation of all results to other Alberta pool locations. The original intent was that Tasks 1 and 2 would precede the commencement of Task 3 but due to time constraints and the desire to maintain the study completion date, it was decided that Task 3 would proceed parallel to Tasks 1 and 2, on the basis of assumed reservoir production volumes and compositions developed by Vikor Resources on behalf of AERI as “typical” of what might be produced from a mature Alberta oilfield. In this instance the example used was Judy Creek and Pengrowth were very helpful in providing typical analyses and other information about their operations in the area.
2.2 SNC-Lavalin Scope ARC asked SNC-Lavalin Inc. (“SLI”) to conduct a study to examine the technical feasibility and associated costs of recovering CO2 from oilfield production from a “typical” Alberta oilfield EOR project and compression of the recovered CO2 for further EOR use or delivery to a pipeline in the same area. This study report summarizes SLI’s findings based on two cases evaluated: • Case 1: Separation of fluids and compression of the produced gas back into the
reservoir without any CO2 /hydrocarbon separation.
ENHANCED HYDROCARBON RECOVERY STUDY (FINAL) Prepared for: Alberta Research Council (ARC) Rev. 1 Project 017935, September, 2008
Chemicals and Petroleum5
• Case 2: Separation of fluids, recovery and purification of CO2 and compression of the produced CO2 for re-injection into the reservoir at a purity of some 96% v/v CO2.
The study contains preliminary designs and cost estimates at an accuracy level of +/- 40%, for separation of the produced fluids, CO2 recovery, compression, dehydration and re-injection of up to ~100 MMSCFD (1.8 million tpa) of CO2 resulting from breakthrough of CO2 from the reservoir. This (Class V) level of capital cost estimate is based on a combination of vendor budget estimates for specific pieces of equipment, information supplied by technology licensors, development of a major equipment list by SLI, and capacity-factored estimates from SLI’s database for equipment and processes where SLI was not able to obtain vendor quotations.
ENHANCED HYDROCARBON RECOVERY STUDY (FINAL) Prepared for: Alberta Research Council (ARC) Rev. 1 Project 017935, September, 2008
Chemicals and Petroleum6
3.0 STUDY OBJECTIVES, SCOPE AND METHODOLOGY SLI’s scope of work includes the following: • SNC-Lavalin’s scope of work is to evaluate two cases of the surface facility
design in a conceptual commercial scale operation, for the selected oil field (subsequently defined as a “hypothetical” field).
• A key consideration is whether to re-inject the full CO2 rich produced gas stream or separation the CO2 from the produced gas before reinjection to meet reservoir needs. It was agreed to do one case with full recycle (no CO2 separation) and the other with CO2 separation to show the process variation and cost differences. However, in reality, each situation will vary and will depend on the reservoir performance prediction in Task 2 (by others).
• Conceptual design of the surface facilities required to support the EOR operation. Where suitable, re-use of existing infrastructure would be preferred. Capital and operating costs are then estimated based on the surface facilities and operational plan (conceptual, +/- 40% cost estimate). Capital expenditures shall be phased consistent with the development plan, adjusted for logical increments of capacity.
• Provide conceptual details of processing (separation, regeneration, dehydration and compression).
• Generate Class V capital and operating cost estimates (±40%) for the facilities provided.
In generating the study results, SNC-Lavalin used: • Data supplied by CO2 separation technology licensors;
• Budget-level equipment quotations from compressor vendors;
• In-house equipment and construction cost information;
• Comparison with publicly available information from other projects. We developed: • HYSIS™ computer models of the process for each case;
• A process flow diagram for each case;
• Heat and material balance for each case;
• Utility consumption estimates for both cases;
• Major Equipment-factored cost estimates for each case;
• Capacity-factored estimates for some process and equipment blocks in both cases;

ENHANCED HYDROCARBON RECOVERY STUDY (FINAL) Prepared for: Alberta Research Council (ARC) Rev. 1 Project 017935, September, 2008
Chemicals and Petroleum7
• Operating cost estimates for each case, with and without capital charges;
• An additional cost estimate and capacity matrix for the produced fluids gathering system and CO2 distribution system, together with field test separator costs.
Appendix 1 lists the SLI team members.
ENHANCED HYDROCARBON RECOVERY STUDY (FINAL) Prepared for: Alberta Research Council (ARC) Rev. 1 Project 017935, September, 2008
Chemicals and Petroleum8
4.0 STUDY BASIS
For this study, the CO2 source is a hypothetical oilfield where produced fluids contain increasing volumes of CO2 over time as the CO2 breaks through with increasing primary and recycle CO2 injection and oil production from the EOR project. The timing and volumes have been determined by Vikor Resources on behalf of ARC. The field production will be gathered via a typical field gathering system with satellite test separators and batteries feeding a central processing plant, assumed for this purpose to be in the Judy Creek area. In normal circumstances one of the goals would be to utilize as many of the existing facilities at the existing processing plant as possible and modify and adapt them in the most cost-effective way possible to accommodate changes in gas production and increasing CO2 concentrations. This can only be done effectively on a specific case basis. Since it is our understanding that this study is directed towards extrapolating results to a wide range of processing plants over a wide geographic area, our two simulation cases assume a stand-alone facility in each case; i.e. the inlet separation facilities we are adding are self sufficient for the volumes of produced fluids and their product streams will continue on as appropriate to feed the existing facilities. When applied to a specific location, there will be the possibility that existing processing plant facilities may be used at least in part. In our opinion the result could be some capital and operating cost savings, partially offset by some revamp costs. Our design requires few significant amounts of external utilities other than electric power. We have assumed that all other utilities such as instrument air, natural gas, etc. will be available in modest amounts from the host plants. As is common practice in oil and gas processing facilities in western Canada our designs avoid the use of steam. The facilities we design are assumed to be totally independent of the source facilities for electric power and any synergies of integration would be developed for specific cases in the future. Table 4.0-1 summarizes the produced fluid and CO2 quality.
Table 4.0-1 Produced Fluid and CO2 Quality
CO2
Reinjection Strategy
Raw Stream CO2 Conc.
Vol %
Re-Injected Stream CO2 Conc. Vol %
Separated CO2 Volume
Tonnes per stream Day
Separated CO2 Volume
Tonnes per calendar Year
Case1 Mixed Re-injection
88 89 5280 1,830,000
Case 2 CO2 Re-injection
88 96 4900 1,700,000
Note that these numbers represent design values. Actual numbers vary widely from year to year. All numbers are rounded.
ENHANCED HYDROCARBON RECOVERY STUDY (FINAL) Prepared for: Alberta Research Council (ARC) Rev. 1 Project 017935, September, 2008
Chemicals and Petroleum9
5.0 CASE DEFINITIONS Two equipment configurations were established in discussion with ARC and Vikor. They are outlined below. Refer also to Process Flow Diagrams in Appendix 2. In both cases primary separation of the fluids (oil, produced water and produced gas) is virtually identical. Case 1 (Mixed Reinjection) Production fluids are separated from the produced gas stream and the CO2 rich gas is dehydrated and compressed to 2100 psig for reinjection into the reservoir. CO2 is not separated or purified prior to compression, so the reinjected gas contains substantial amounts of methane and ethane along with the CO2. Case 2 (CO2 Reinjection) Beginning with the raw produced gas stream, production fluids are separated and the CO2 rich gas is dehydrated and fed to a CO2 separation unit where a “pure” (96% v/v CO2) stream is generated. The CO2 separation unit consists of refrigeration followed by a membrane separation package. Two other streams are produced from the CO2 separation unit: i A hydrocarbon gas stream, Ethane and Methane rich, that is fed to existing gas
processing plant;
ii A hydrocarbon liquid stream, rich in propane and heavier components, that is expected also to be fed to the existing gas processing plant.
The “pure” CO2 stream is compressed to 2100 psig for reinjection to the reservoir. The reinjected gas contains some 96% v/v CO2, the balance being methane and ethane with only traces of nitrogen and virtually no heavier hydrocarbons. To improve the CO2 and Ethane separation a recycle gas stream is compressed and returned to the membrane CO2 separation package inlet.
ENHANCED HYDROCARBON RECOVERY STUDY (FINAL) Prepared for: Alberta Research Council (ARC) Rev. 1 Project 017935, September, 2008
Chemicals and Petroleum10
6.0 TECHNICAL DEVELOPMENT OF THE CASES As noted above, cases 1 and 2 contemplate different approaches to produced gas handling. Case 1 permits 100% reinjection of produced gas, following elementary separation of heavier components and water. Case 2 involves separation and purification of the CO2, and within practical limits maximizes ethane recovery. The two cases require quite different process designs and equipment and yield substantially different capital and operating costs. Not only does Case 2 require separation equipment not needed in Case 1, but also the compressor selection is different for the two cases. Case 2 also contemplates a period of one year at the beginning and four years at the end of the project, when produced gas is not separated but fully reinjected, owing to very small produced gas volumes indicated by Vikor in those time periods.
6.1 Processing Capacity Requirements For both cases, the wide variation in quality and quantity of produced gas over the project life necessitates consideration of how best to balance the need for processing capacity against the desire to minimize and delay capital cost expenditures, avoid having large amounts of capacity standing idle for long periods, and maintain a high level of operating efficiency in the operating units. Using some basic guidelines, SLI elected to split the processing and compression capacity into two equal trains, whose combined capacity would at the peak point of gas production be capable of handling 100% of the produced gas. The second train would be installed so as to come into operation at the point when the first train reaches 100% capacity. In concept, later in the project life when total produced gas volumes once again drop below the maximum capacity of a single train, the older train 1 would be shut down and the newer train 2 would continue to operate until the end of the project. As noted above, for case 2, the scheme envisions delaying produced gas separation until year 2 of the project, and shutting it down in at the end of year 36. Beyond year 36, the volumes of produced gas available do not allow sustainable operation of even a single train of gas separation. During these two periods the dried produced gas would be 100% recycled without separation, similar to case 1. The resulting schemes are as follows:
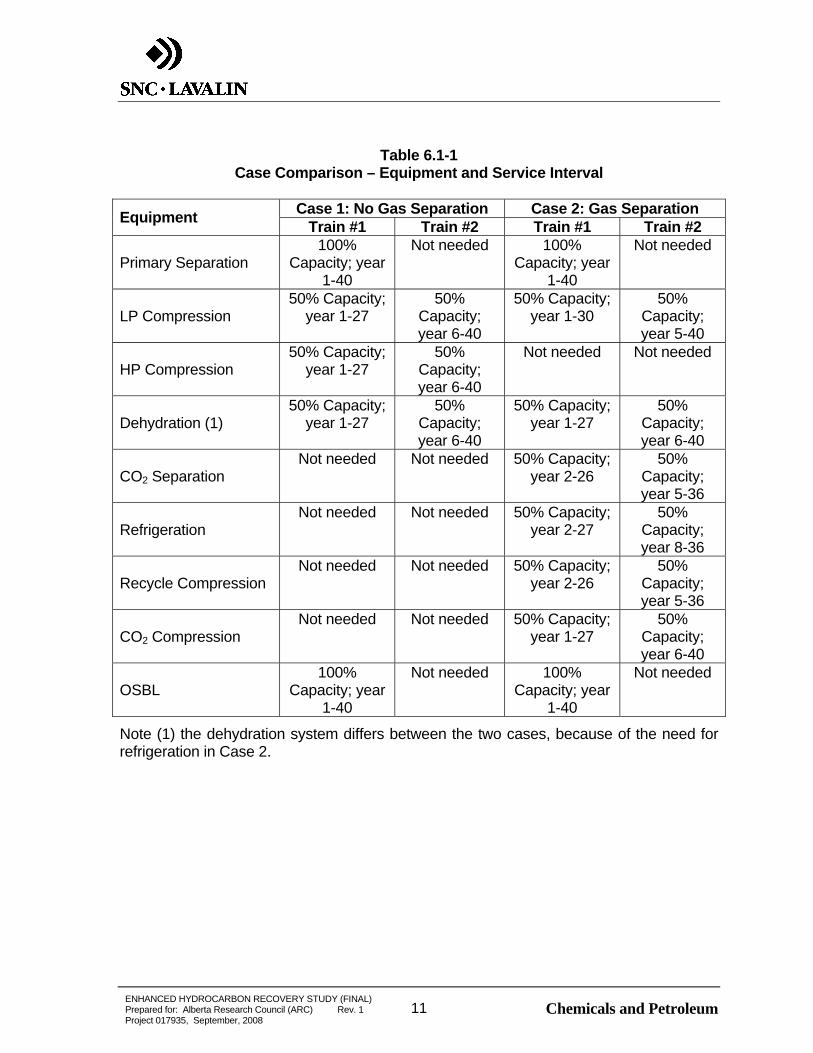
ENHANCED HYDROCARBON RECOVERY STUDY (FINAL) Prepared for: Alberta Research Council (ARC) Rev. 1 Project 017935, September, 2008
Chemicals and Petroleum11
Table 6.1-1
Case Comparison – Equipment and Service Interval
Case 1: No Gas Separation Case 2: Gas Separation Equipment Train #1 Train #2 Train #1 Train #2
Primary Separation 100%
Capacity; year 1-40
Not needed 100% Capacity; year
1-40
Not needed
LP Compression 50% Capacity;
year 1-27 50%
Capacity; year 6-40
50% Capacity; year 1-30
50% Capacity; year 5-40
HP Compression 50% Capacity;
year 1-27 50%
Capacity; year 6-40
Not needed Not needed
Dehydration (1) 50% Capacity;
year 1-27 50%
Capacity; year 6-40
50% Capacity; year 1-27
50% Capacity; year 6-40
CO2 Separation Not needed Not needed 50% Capacity;
year 2-26 50%
Capacity; year 5-36
Refrigeration Not needed Not needed 50% Capacity;
year 2-27 50%
Capacity; year 8-36
Recycle Compression Not needed Not needed 50% Capacity;
year 2-26 50%
Capacity; year 5-36
CO2 Compression Not needed Not needed 50% Capacity;
year 1-27 50%
Capacity; year 6-40
OSBL 100%
Capacity; year 1-40
Not needed 100% Capacity; year
1-40
Not needed
Note (1) the dehydration system differs between the two cases, because of the need for refrigeration in Case 2.
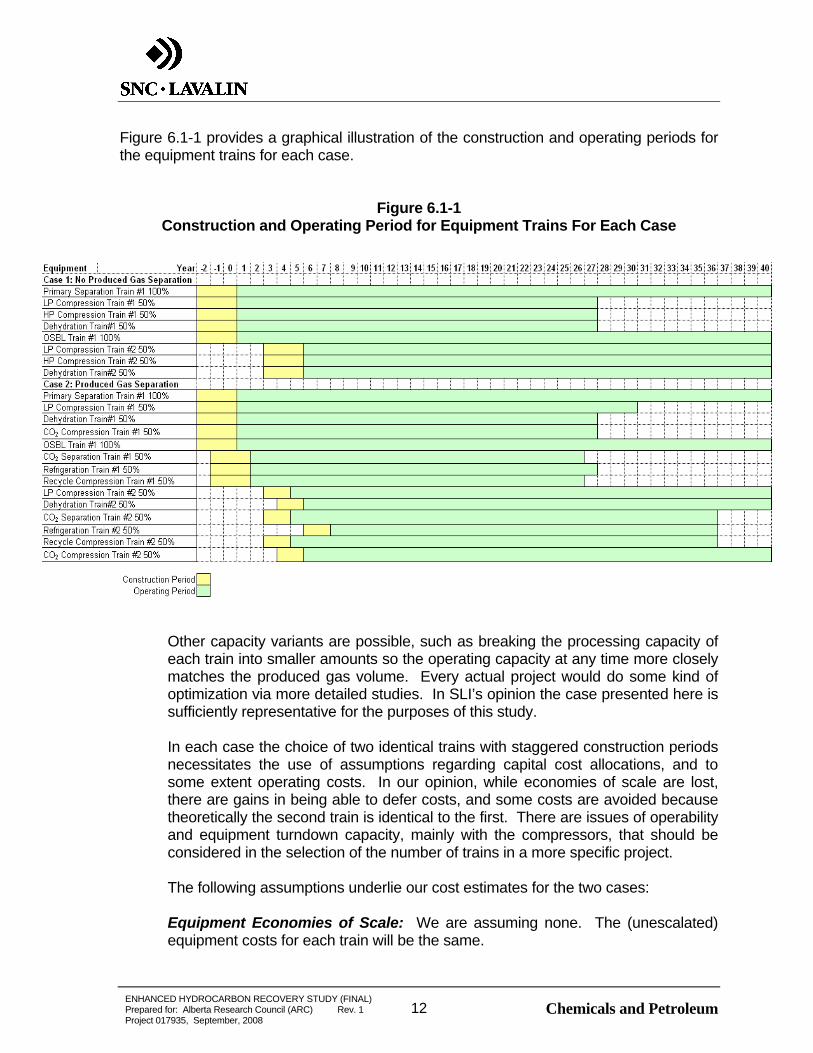
ENHANCED HYDROCARBON RECOVERY STUDY (FINAL) Prepared for: Alberta Research Council (ARC) Rev. 1 Project 017935, September, 2008
Chemicals and Petroleum12
Figure 6.1-1 provides a graphical illustration of the construction and operating periods for the equipment trains for each case.
Figure 6.1-1 Construction and Operating Period for Equipment Trains For Each Case
Other capacity variants are possible, such as breaking the processing capacity of each train into smaller amounts so the operating capacity at any time more closely matches the produced gas volume. Every actual project would do some kind of optimization via more detailed studies. In SLI’s opinion the case presented here is sufficiently representative for the purposes of this study. In each case the choice of two identical trains with staggered construction periods necessitates the use of assumptions regarding capital cost allocations, and to some extent operating costs. In our opinion, while economies of scale are lost, there are gains in being able to defer costs, and some costs are avoided because theoretically the second train is identical to the first. There are issues of operability and equipment turndown capacity, mainly with the compressors, that should be considered in the selection of the number of trains in a more specific project. The following assumptions underlie our cost estimates for the two cases: Equipment Economies of Scale: We are assuming none. The (unescalated) equipment costs for each train will be the same.
ENHANCED HYDROCARBON RECOVERY STUDY (FINAL) Prepared for: Alberta Research Council (ARC) Rev. 1 Project 017935, September, 2008
Chemicals and Petroleum13
Engineering Design Costs: There will be some economies as a result of having two identical trains. We are also assuming that the initial engineering design will incorporate both trains. However, the time lag between first and second trains will mean some changes are likely. Given likely significant evolution of the process used for separation (membranes), the benefit of real operating history and the relatively long project life, there may be additional engineering work required to implement improvements and optimizations in the second train. This will be highly dependent on field and facility performance, timing and regulatory changes, if any. Train 1 Pre-build for Train 2: We are assuming that Train 2 pre-build will be negligible; perhaps a few spool pieces in piping. Therefore there is no assessed effect on either Train 1 or Train 2 capital costs. Construction Adjacent to an Existing Plant: This situation should be able to take advantage of the best of the circumstances (existing infrastructure) without facing the disadvantages (revamp costs and uncertainties). We are assuming: • The existing control room can accommodate new facilities operations;
• Operator facilities will be adequate;
• Other than front end tie-ins there will be no need for additional intervention in the existing ISBL facilities;
• Main access roads and other general infrastructure will be adequate;
• Utilities supplies will be adequate except for power;
• No additional tankage is included except as specifically identified for the new units;
• Electric power supply will need to be upgraded twice;
• Maintenance facilities will need to be upgraded to handle additional and different equipment.
Overall, the net effect is that the percentage of direct costs associated with utilities, offsites and miscellaneous facilities will be substantially less than it would be for a green-field facility, but will still be significant and will vary from one host location to another. Equipment Operation at Variable Throughput Rates: Electric power consumption is assumed to have a fixed and a variable component. Therefore the second train will not result in precise doubling of electric power capacity or use, nor will the yearly variation in power consumption be exactly proportional to plant throughput. The fixed component is a measurement of the total power losses and is considered constant during the project lifetime. The variable component is considered to be proportional to the plant throughput.

ENHANCED HYDROCARBON RECOVERY STUDY (FINAL) Prepared for: Alberta Research Council (ARC) Rev. 1 Project 017935, September, 2008
Chemicals and Petroleum14
We are assuming that the strategy we are proposing will not require additional capital costs to allow equipment to run at high turndown ratios. There will be some operating cost inefficiencies that result from operating equipment at high turndown ratios. These are not accounted for.
6.2 CO2 Separation Technology CO2 is separated only in Case 2. Due to relatively high pressures and high CO2 concentrations, membrane technology was considered to be likely the most appropriate to the inlet conditions. Gas separation membranes use the difference in partial pressure between the feed gas side and the permeate side to preferentially separate a specific component of the gas stream based on its permeation rate across the membrane. Because the driving force for the membrane is the difference in partial pressure across the membrane, this poses challenges as the CO2 purity requirement increases. As the CO2 concentration in the permeate increases, the partial pressure differential decreases and reduces the driving force, thus requiring greater membrane areas to achieve the same separation. Equipment size and consequent capital cost premium increases very rapidly (exponentially). Membrane separation technology typically is most economically effective at reducing residual CO2 to about 10% v/v. Using this technology it is possible to reduce residual CO2 to about 3% v/v if required. This would equate to CO2 product purity of about 98% v/v The following block flow diagram illustrates the chief building blocks in a membrane gas separation system.
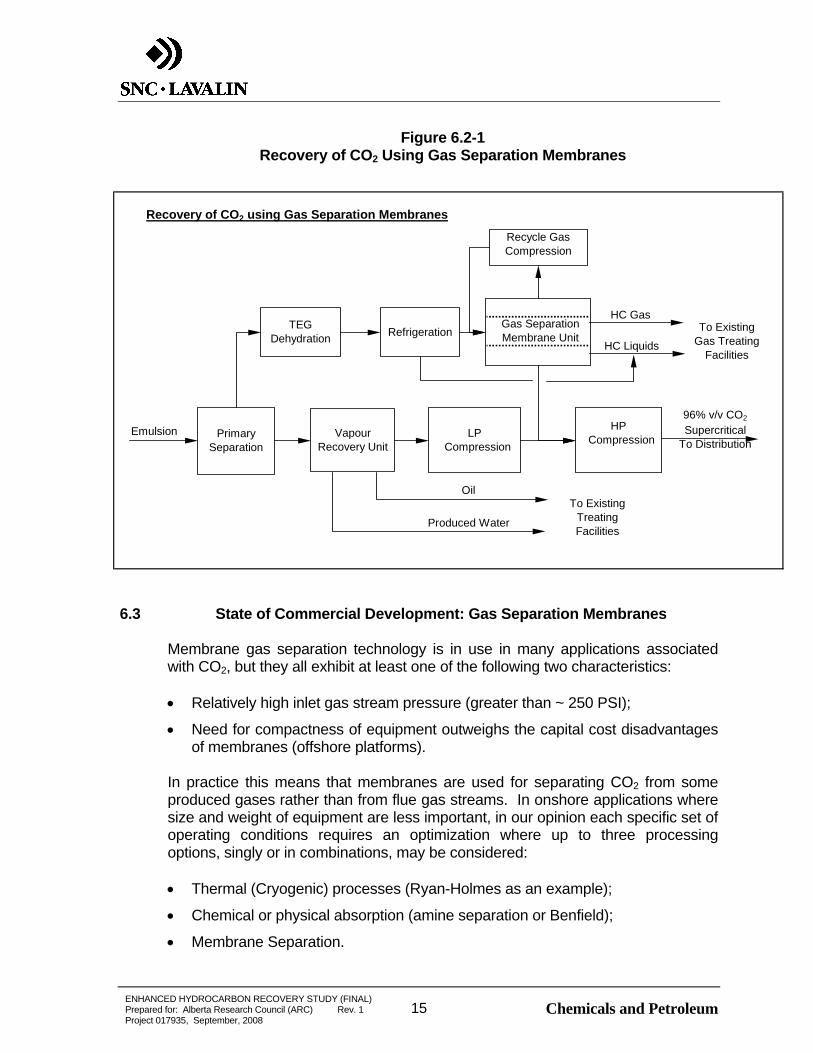
ENHANCED HYDROCARBON RECOVERY STUDY (FINAL) Prepared for: Alberta Research Council (ARC) Rev. 1 Project 017935, September, 2008
Chemicals and Petroleum15
Figure 6.2-1 Recovery of CO2 Using Gas Separation Membranes
6.3 State of Commercial Development: Gas Separation Membranes
Membrane gas separation technology is in use in many applications associated with CO2, but they all exhibit at least one of the following two characteristics: • Relatively high inlet gas stream pressure (greater than ~ 250 PSI);
• Need for compactness of equipment outweighs the capital cost disadvantages of membranes (offshore platforms).
In practice this means that membranes are used for separating CO2 from some produced gases rather than from flue gas streams. In onshore applications where size and weight of equipment are less important, in our opinion each specific set of operating conditions requires an optimization where up to three processing options, singly or in combinations, may be considered: • Thermal (Cryogenic) processes (Ryan-Holmes as an example);
• Chemical or physical absorption (amine separation or Benfield);
• Membrane Separation.
Recovery of CO2 using Gas Separation Membranes
Primary Separation
Vapour Recovery Unit
Recycle Gas Compression
LP Compression
HP Compression
TEG Dehydration Refrigeration
Gas Separation Membrane Unit
96% v/v CO2
Supercritical To Distribution
Emulsion
To Existing Gas Treating
Facilities
HC Gas
HC Liquids
Oil
Produced Water
To Existing Treating Facilities
ENHANCED HYDROCARBON RECOVERY STUDY (FINAL) Prepared for: Alberta Research Council (ARC) Rev. 1 Project 017935, September, 2008
Chemicals and Petroleum16
In our opinion, given the composition and pressure of the inlet stream in this hypothetical case and the requirement to recover ethane, membranes appeared to be the most likely approach. However, membranes and their performance are sensitive to the presence of aromatic hydrocarbons (they can degrade the membrane material), so it should be noted that in the chosen process scheme the gas stream is cooled to close to -15°C to initially remove the aromatic components. We approached a commercial membrane supplier (NATCO-Cynara) and they were most helpful in assisting us. We are aware of ongoing research to improve the selectivity of membranes at lower pressure differentials. They are presently not practical for flue gas CO2 removal, largely because of the requirement to compress the entire inlet flue gas stream from atmospheric to at least 250 PSI to make the membrane work, and then losing much of that pressure across the membrane, resulting in the need to compress the CO2 stream a second time. SLI generated its own HYSIS™ simulation of the membrane CO2 separation process and compared the results with licensor information and knowledge of commercial facilities.
6.4 Inlet Separation The raw stream first encounters an inlet separator that does the initial rough separation of oil, gas and liquids. This facility is designed with two main separation vessels, but it is otherwise a single train for the entire project and as such is constructed 100% at the start. SLI has also included a design and cost estimate for one test separator, sized for 150% of an average single producing well at peak project production. Field information used to establish the design basis was provided by ARC.
6.5 Compressors SLI has adopted the philosophy that a CO2 application is non-critical and therefore we will maximize the economies of scale rather than install smaller machines with the objective of increasing reliability. Although compressors may be available to handle the full flow at peak capacities, the main determining factor for train selection is the turndown capability of the compressors, given the high variability of the feed composition and flow rates. While we selected two parallel trains as the basis for this study, the suitability of more smaller trains should be evaluated when feasibility studies become more site specific.
ENHANCED HYDROCARBON RECOVERY STUDY (FINAL) Prepared for: Alberta Research Council (ARC) Rev. 1 Project 017935, September, 2008
Chemicals and Petroleum17
6.6 Compressor Drivers With the requirement for large amounts of rotating horsepower to compress the feed, CO2, and recycle, SLI has chosen to use electric power due to the potential for sites being remote and with operations staff possibly unfamiliar with high pressure steam. Should a particular site have available excess steam generation capacity or be suitable for a steam system expansion, then steam drivers could be considered for compression. In our opinion studies of such options are very site specific and should be part of Front End Engineering Design (FEED).
6.7 Dehydration Dehydration serves two purposes in this project. First, in both cases it is required to reduce the recycle stream water content to the point where no water condensation is possible, so that the use of stainless steel equipment and pipe can be minimized. In case 2, a dehydration unit is also critical to lower the water content of the separated gas to approximately 11 lbs per million cubic feet prior to refrigeration, to avoid water freezing. In our opinion a glycol-based system is the best choice for this service in both cases. These units are well established in CO2 service for EOR operations in North America and can be manufactured by any qualified package vendor.
6.8 Refrigeration As mentioned above, membrane performance and structural integrity are sensitive to aromatics content in the inlet gas. The raw CO2 is cooled to near –15ºC and the aromatic and heavy compounds are removed as liquids. During this process the system reaches CO2 liquefaction conditions and there will be a small quantity of liquid CO2 condensed. Depending on the inlet gas composition there will also be some CO2 – rich azeotrope mixtures that will condense during the refrigeration process. Refrigeration can be performed using a standard propane refrigeration loop.
6.9 Membrane Separation Usually there will be several cascading membrane separation stages involved in the process (the membrane licensor identified a requirement for 3 to 4 stages in this application). The permeate gas from the first stage will constitute the “purified” CO2 product. The non-permeate stream will be subjected to further gas-liquid separation and becomes the feed for the second membrane stage, and so on. The permeate gas from the 2nd to 4th stages is CO2 rich and can be recycled to the membrane system inlet after recompression, or can be delivered as CO2 product together with the permeate from the first stage. The liquids separated
ENHANCED HYDROCARBON RECOVERY STUDY (FINAL) Prepared for: Alberta Research Council (ARC) Rev. 1 Project 017935, September, 2008
Chemicals and Petroleum18
from the non-permeate at each stage are combined and become the Hydrocarbon Liquid product of the plant, to be sent on to the existing gas processing facility. The non-permeate gas separated after the last membrane stage will constitute the Hydrocarbon Gas product, that will also be sent to the existing gas plant.
6.10 CO2 Recycle As mentioned above, the permeate gas from the 2nd to 4th membrane stages is CO2 rich. Recycling this stream to the membrane unit inlet can improve substantially the CO2-Hydrocarbon separation. In our design we tried to maximize Ethane recovery. We studied different scenarios from zero CO2 recycle, achieving 45-50% overall Ethane recoveries, to higher CO2 recycle rates, achieving over 90% overall Ethane recoveries. We selected an intermediate configuration that has about 25% recycle rate based on the membrane raw feed gas stream volume, and achieving above 75% overall Ethane recovery in the Hydrocarbon Gas stream leaving the membrane unit. In our opinion the CO2 recycle rate and associated Ethane/Hydrocarbon recoveries are very site specific and their determination should be part of Front End Engineering Design (FEED).
6.11 Utilities The electric power consumption of the facilities is substantial. Other facilities require minimal feed water treatment and waste disposal facilities. SLI has assumed that raw water and adequate power from the grid will be available on site. We have included substation costs for each phase of construction.
6.12 Plot Space We have assumed that the required plot space can be made available at whatever locations are selected, immediately next to existing facilities to which our new facilities will be connected. Since layout and plot space is very specific to each site, no attempt has been made to define a layout. We would estimate that a total plot area of some 6000 m2 or 1.5 acres is likely to be required for Case 1; 10,000 m2 or 2.5 acres for case 2.
6.13 Control Rooms We have assumed that sufficient capacity for additional control panels can be made available within existing control rooms at whichever sites may be selected.
6.14 Pipelines The only pipelines to be considered are typical short run gathering lines and product lines between producing wells, injection wells and the processing facility. This study includes a generic table of pipeline costs to assist in the rough calculation of gathering and product lines and their extrapolation to other locations and configurations. It is located in Appendix 2. While part of Task 3, the
ENHANCED HYDROCARBON RECOVERY STUDY (FINAL) Prepared for: Alberta Research Council (ARC) Rev. 1 Project 017935, September, 2008
Chemicals and Petroleum19
extrapolation to various locations will be done by ARC. The Maximum Allowable Operating Pressure (MAOP) was assumed to be 740 psig for the gathering lines and 2250 psig for the product lines to reinjection. Information regarding operating pressures will be specific to each location. We developed nominal values for these and discussed them with ARC, who concurred that they should be sufficiently representative for this study. The design MAOP for the feed gathering system (740 PSIG) was determined by the anticipated wellhead pressures and the objective of remaining within the 300# ANSI standard for valves and fittings. The design MAOP for the product CO2 (2250 PSIG) was determined by the objective of remaining within the 900# ANSI standard for valves and fittings. While this study contemplates only local gathering and distribution CO2 pipelines, gathering and long distance CO2 pipelines are well established in North America, with about 2400 km of trunk lines in operation. In our opinion health and safety issues associated with the transport of CO2 are manageable, and in general significantly less than those associated with the transport of gases containing H2S. CO2 is not toxic or flammable, but it is heavier than air and could pose a threat of asphyxiation under certain circumstances. As a general rule SLI treats CO2 like H2S for the purpose of designing emergency shutdown equipment. Appendix 2 contains: • Process flow diagrams for Cases 1 and 2;
• Heat and Material Balance for Cases 1 and 2;
• Utility requirements for Cases 1 and 2;
• Field pipeline size/cost tables.
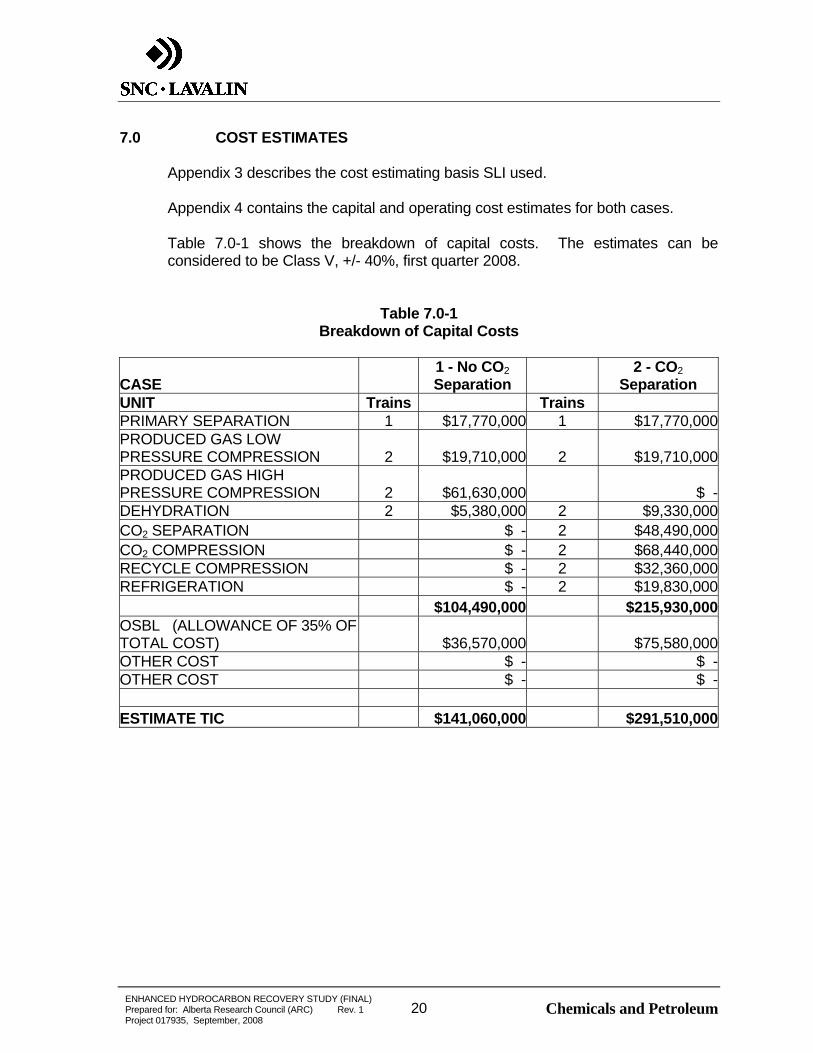
ENHANCED HYDROCARBON RECOVERY STUDY (FINAL) Prepared for: Alberta Research Council (ARC) Rev. 1 Project 017935, September, 2008
Chemicals and Petroleum20
7.0 COST ESTIMATES Appendix 3 describes the cost estimating basis SLI used. Appendix 4 contains the capital and operating cost estimates for both cases. Table 7.0-1 shows the breakdown of capital costs. The estimates can be considered to be Class V, +/- 40%, first quarter 2008.
Table 7.0-1 Breakdown of Capital Costs
CASE 1 - No CO2 Separation
2 - CO2 Separation
UNIT Trains Trains PRIMARY SEPARATION 1 $17,770,000 1 $17,770,000 PRODUCED GAS LOW PRESSURE COMPRESSION 2 $19,710,000 2 $19,710,000 PRODUCED GAS HIGH PRESSURE COMPRESSION 2 $61,630,000 $ -DEHYDRATION 2 $5,380,000 2 $9,330,000CO2 SEPARATION $ - 2 $48,490,000 CO2 COMPRESSION $ - 2 $68,440,000 RECYCLE COMPRESSION $ - 2 $32,360,000REFRIGERATION $ - 2 $19,830,000 $104,490,000 $215,930,000 OSBL (ALLOWANCE OF 35% OF TOTAL COST) $36,570,000 $75,580,000 OTHER COST $ - $ -OTHER COST $ - $ - ESTIMATE TIC $141,060,000 $291,510,000

ENHANCED HYDROCARBON RECOVERY STUDY (FINAL) Prepared for: Alberta Research Council (ARC) Rev. 1 Project 017935, September, 2008
Chemicals and Petroleum21
8.0 RESULTS The operating cost tables are found in Appendix 4. They include a parasitic CO2 calculation that provides a rough estimate of how much CO2 is generated by the energy used to separate and compress the CO2. As no CO2 separation credits are assumed, the parasitic CO2 noted in the table plays no part in the rest of the calculations. It is included as it is a standard parameter in all CO2 separation studies. It becomes part of the “net CO2 Sequestered” calculations, along with estimates of parasitic CO2 associated with the primary CO2 source, system losses and determinations of how much CO2 is left in the ground.
8.1 Economic Calculations SLI advises that we are not economists. Our economic calculations are simple and should not be used for economic decision-making. However, in our opinion they can be used as comparative tools to analyze a range of cases that have similar characteristics. See Appendix 3 for an explanation of how operating costs are calculated. The unit cost per tonne of CO2 is shown in two ways: The first “Cash Cost” is the total annual cash operating cost outlay divided by the annual amount of CO2 separated and recycled. The calculation is using tonnes per year of CO2 irrespective of the recycle stream composition, which will vary from year to year and case to case. The second set of results is from an NPV calculation and represents the constant value of CO2 that will deliver an 8% real rate of return to the constructor/operator of the separation facilities over the life of the project. Thus, the numbers in the table illustrate a project where the proponent: a. Does economic calculations on a 100% equity, before-tax, no-escalation or
inflation basis;
b. Does project DCF calculations at an 8% discount rate and gets a NPV of zero over 2-3-year construction periods for each project phase and overall 40-year operating life.
These two conditions are sometimes described as generating a “real rate of return (of 8%)” and that term will be used in the subsequent discussion. c. Receives the raw produced gas stream from the field at no cost;
d. Has no Owner’s costs such as land, office, etc.;
e. Pays for, installs and operates all the recycle facilities;
f. Gets paid for the CO2 recycled at no markup;
g. Receives no revenue for any product except the CO2 (Case 1) and CO2 + Ethane + Methane + NGLs (Case 2);
h. Gets no credit for net CO2 stored;
ENHANCED HYDROCARBON RECOVERY STUDY (FINAL) Prepared for: Alberta Research Council (ARC) Rev. 1 Project 017935, September, 2008
Chemicals and Petroleum22
i. Power cost: CAD 80.00/ MWh;
j. Natural gas cost: CAD 7.00/mcf;
k. Case 1 (no separation; no ethane recovered): CO2 value determined by the economic calculation to deliver a NPV8 of zero (8% real rate of return);
l. Case 2 (CO2 separated; Ethane recovered): CO2 value determined by the economic calculation to deliver a NPV8 of zero with the following additional product values:
• Specification Ethane value of $400 per tonne. The ethane is in a stream that still requires further purification. SLI has assessed a nominal $50/tonne discount from specification ethane value to account for the existing plant’s requirement to further purify the stream so the ethane can be sold as a product).
• Specification natural gas value of $7.00/mcf or CAD 185 per tonne. SLI has assessed a nominal $20/tonne discount from specification methane/natural gas value to account for the existing plant’s requirement to further purify the stream so the methane can be sold as a product).
• Specification NGL (C3+) value of CAD 352/tonne. SLI has assessed a nominal $30/tonne discount from specification NGL value to account for the existing plant’s requirement to further purify the stream so the NGLs can be sold as a product. This calculation is based on a nominal crude oil price of $100/bbl, 6.29 bbl/tonne at density 1.0 (API 10o), NGL value of 80% of crude oil value, NGL density of 0.70 (API 70o).
8.2 Observations
While it is not within SLI’s mandate to perform overall economic analyses and we do not have all the information to do so, we have the following observations: 1. In Case 1 the value (cost) of CO2 re-injected in the initial year and final six
years of the project’s life are very high, because of the small amounts of CO2 being re-injected. It is acceptable to tolerate high CO2 costs at the project’s outset. However, for the final years unless the high CO2 costs are offset by continuing significant additional oil production it would be our expectation that on economic grounds the project would be terminated short of its nominal 40-year life.
2. In Case 2 the same situation applies, but the period at the end of the project where reinjected CO2 costs appear excessive is 7-8 years.
3. Case 2 indicates a CO2 value of about $23.70 per tonne is required to deliver an 8% real rate of return, compared with about $19.70 in case 1. This difference has two sources:
a. The additional equipment in case 2 is there mainly for the purpose of separating ethane, although it has additional effects of increasing the CO2

ENHANCED HYDROCARBON RECOVERY STUDY (FINAL) Prepared for: Alberta Research Council (ARC) Rev. 1 Project 017935, September, 2008
Chemicals and Petroleum23
concentration in the recycle stream and generating three more revenue streams (ethane, natural gas and NGLs).
b. The separation of an ethane stream results in about 10% of the total CO2 that was recycled in Case 1 being lost, mainly via the ethane stream. Therefore Case 2 actually recycles 10% less CO2 than Case 1. In a real project it is likely that the CO2 leaving with the ethane would be separated from the ethane in the existing gas processing facilities and returned to the CO2 recycle compressor suction, but evaluating such integration is beyond the scope of this study.
4. At the level of accuracy of our estimates, $19.70 and $23.70 for Cases 1 and 2 respectively, there is uncertainty that they may be considered to be the same number. Nonetheless, if they are close, even if the ethane separation case were to be shown to be somewhat better economically than the no-separation case, there is still the question of whether it is worth risking the additional ~$140 million in CAPEX.
5. The implication of the difference between the cases is that at a value of $350 per tonne of ethane in an impure stream, the business of separating ethane does not improve the economics of the project and may impair them somewhat.
6. The results will be particularly sensitive to revenue derived from ethane, natural gas and NGLs. Larger values for these streams may narrow the difference, while lower values and/or higher processing fees will increase the difference.
7. If reservoir conditions still dictate the need for much higher CO2 content in the reinjection stream, the penalty for having to separate ethane is large from a capital standpoint but does not have as great an influence from an economic perspective.
8. From other information we are aware of, Case 2 at ~$23.70 per tonne of CO2 represents a CO2 source that is less expensive than what might be expected as a cost for raw CO2 delivered via long-distance pipeline from an original CO2 source that is quite pure to begin with.
9. Energy costs in the form of electric power are the largest component of operating costs.
SLI contrasted the results of our work with the knowledge that membranes are actually in use on produced gas from land-based CO2-EOR projects, notably in SW USA. We asked the question: Under what circumstances could membranes be economically competitive in this service? The answer appears to be that membranes would likely look more attractive if: a. The raw stream contains no aromatics or other materials that could potentially
damage the membranes;

ENHANCED HYDROCARBON RECOVERY STUDY (FINAL) Prepared for: Alberta Research Council (ARC) Rev. 1 Project 017935, September, 2008
Chemicals and Petroleum24
b. The raw stream is lower in CO2 concentration than the stream here, therefore making CO2 separation essential to the success of the EOR project;
c. The requirement for ethane recovery was relaxed somewhat, thereby reducing or eliminating the need for a recycle stream and associated compressor.
Figure 8.1-1 shows how capital costs are split among the various components of the plant, for costs incurred in Case 1.
Figure 8.1-1 Capital Cost Breakdown for Various Components of the Plant in Case 1
COMPRESSION57%
DEHYDRATION4%
OSBL26%
PRIMARY SEPARATION
13%
Figure 8.1-2 shows how capital costs are split among the various components of the plant, for costs incurred in Case 2.
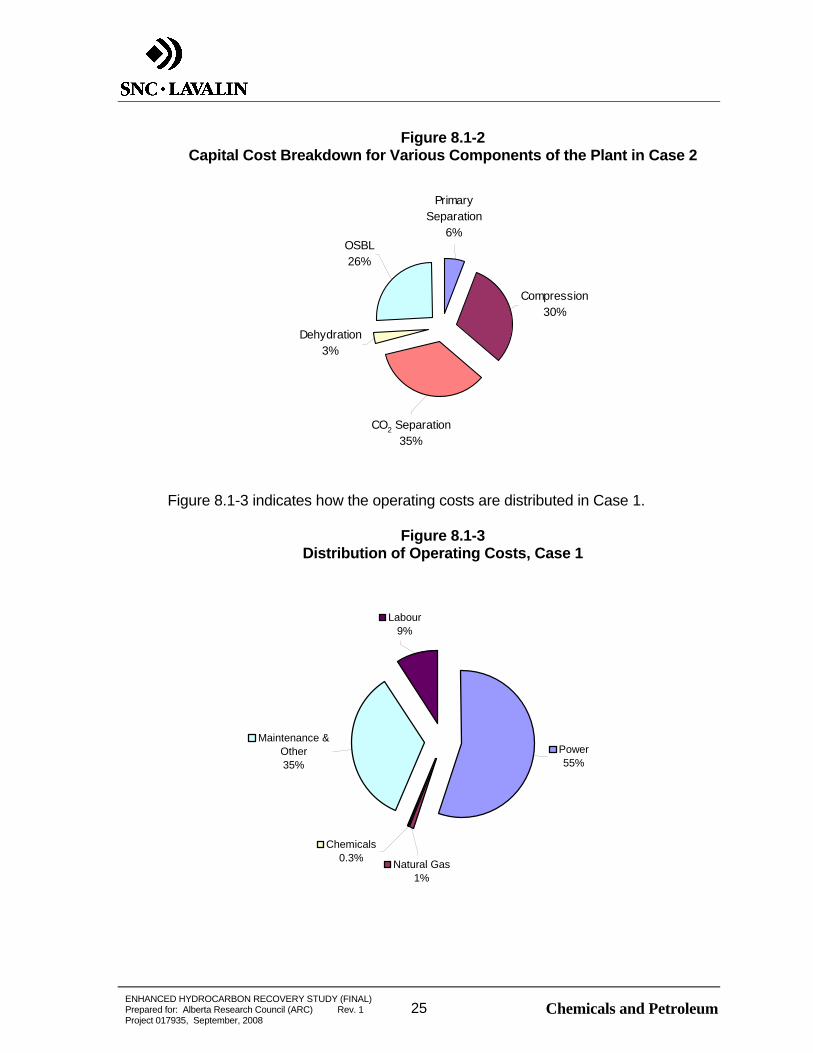
ENHANCED HYDROCARBON RECOVERY STUDY (FINAL) Prepared for: Alberta Research Council (ARC) Rev. 1 Project 017935, September, 2008
Chemicals and Petroleum25
Figure 8.1-2 Capital Cost Breakdown for Various Components of the Plant in Case 2
OSBL26%
Dehydration3%
CO2 Separation35%
Compression30%
Primary Separation
6%
Figure 8.1-3 indicates how the operating costs are distributed in Case 1.
Figure 8.1-3 Distribution of Operating Costs, Case 1
Labour9%
Maintenance & Other35%
Chemicals0.3% Natural Gas
1%
Power55%
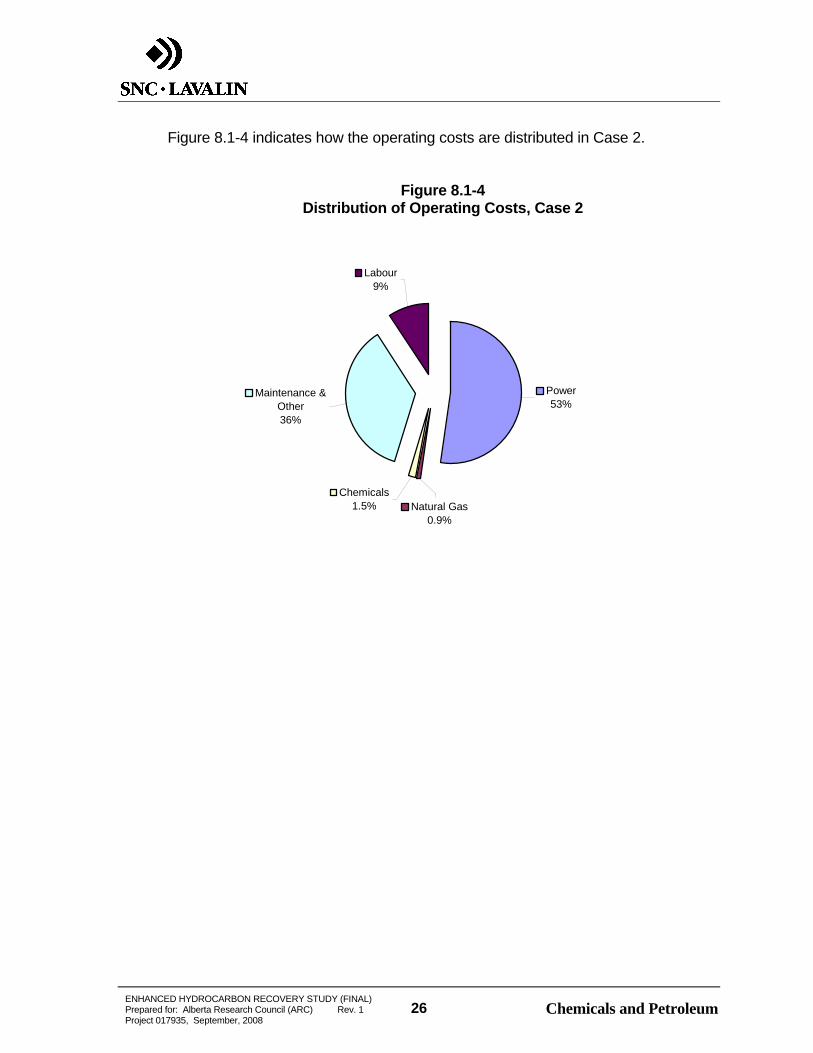
ENHANCED HYDROCARBON RECOVERY STUDY (FINAL) Prepared for: Alberta Research Council (ARC) Rev. 1 Project 017935, September, 2008
Chemicals and Petroleum26
Figure 8.1-4 indicates how the operating costs are distributed in Case 2.
Figure 8.1-4 Distribution of Operating Costs, Case 2
Chemicals1.5% Natural Gas
0.9%
Maintenance & Other36%
Labour9%
Power53%
ENHANCED HYDROCARBON RECOVERY STUDY (FINAL) Prepared for: Alberta Research Council (ARC) Rev. 1 Project 017935, September, 2008
Chemicals and Petroleum27
9.0 CONCLUSIONS
In conclusion, in our opinion: The technology for CO2 recycle and ethane separation is commercially available. Recycled CO2, even when burdened with ethane recovery cost, appears to be a competitive source of CO2 when compared with likely costs for raw purchased CO2. The two cases do not differ markedly in the amount of CO2 recycled. The real difference between them is associated with how much ethane is recovered as a separate stream. The difference between the cases can therefore be seen as a rough measure of the cost of recovering an ethane-rich stream for use elsewhere. Recovery of ethane in this hypothetical project does not appear to be an economic proposition. While the dialogue among SLI, ARC and AERI has been extensive, the results of SLI’s investigations suggests that a deeper understanding of the decision-making required of companies as they choose how to design a CO2-EOR project requires longer analysis time periods, a greater degree of integration of the work of the reservoir engineers and the facilities engineers, and the evaluation of several more options for CO2 separation and recycle.
ENHANCED HYDROCARBON RECOVERY STUDY (FINAL) Prepared for: Alberta Research Council (ARC) Rev. 1 Project 017935, September, 2008
Chemicals and Petroleum28
10.0 RECOMMENDATIONS Since this is a study on a “typical” Alberta situation, any specific decision on which case is most appropriate to a particular location will require additional effort to better define and optimize equipment, most appropriate number of processing trains, operational constraints, costs and revenue streams. The study has assumed all utilities other than electric power would be available to the CO2 separation facilities from the host plant. Any future work should look in detail into possible energy and other optimization opportunities with the host plant, which will vary from location to location. The slightly negative result of the employment of membranes in an application that would appear to suit them suggests that further work may need to be done to better define the optimum CO2 separation techniques in a Canadian context.
ENHANCED HYDROCARBON RECOVERY STUDY (FINAL) Prepared for: Alberta Research Council (ARC) Rev. 1 Project 017935, September, 2008
Chemicals and PetroleumApp 1-1
Appendix 1 SNC-Lavalin’s Team Members
The following SNC-Lavalin personnel participated in the project: Brian Fraser, P. Eng Project Manager
Doug Macdonald, P. Eng Project Advisor and Technical Participant
Sorin Andrei Process Lead, Pipeline Design
Rodolfo Tellez Process Modeling
Roger Warren, P. Eng Licensor Package Development and Analysis, Technology Evaluation
Victor Campos Retrofit Layout, Equipment Sizing
Herb Bowers Cost Estimating

ENHANCED HYDROCARBON RECOVERY STUDY (FINAL) Prepared for: Alberta Research Council (ARC) Rev. 1 Project 017935, September, 2008
Chemicals and PetroleumApp 2-1
Appendix 2 Technical Design Parameters and Drawings
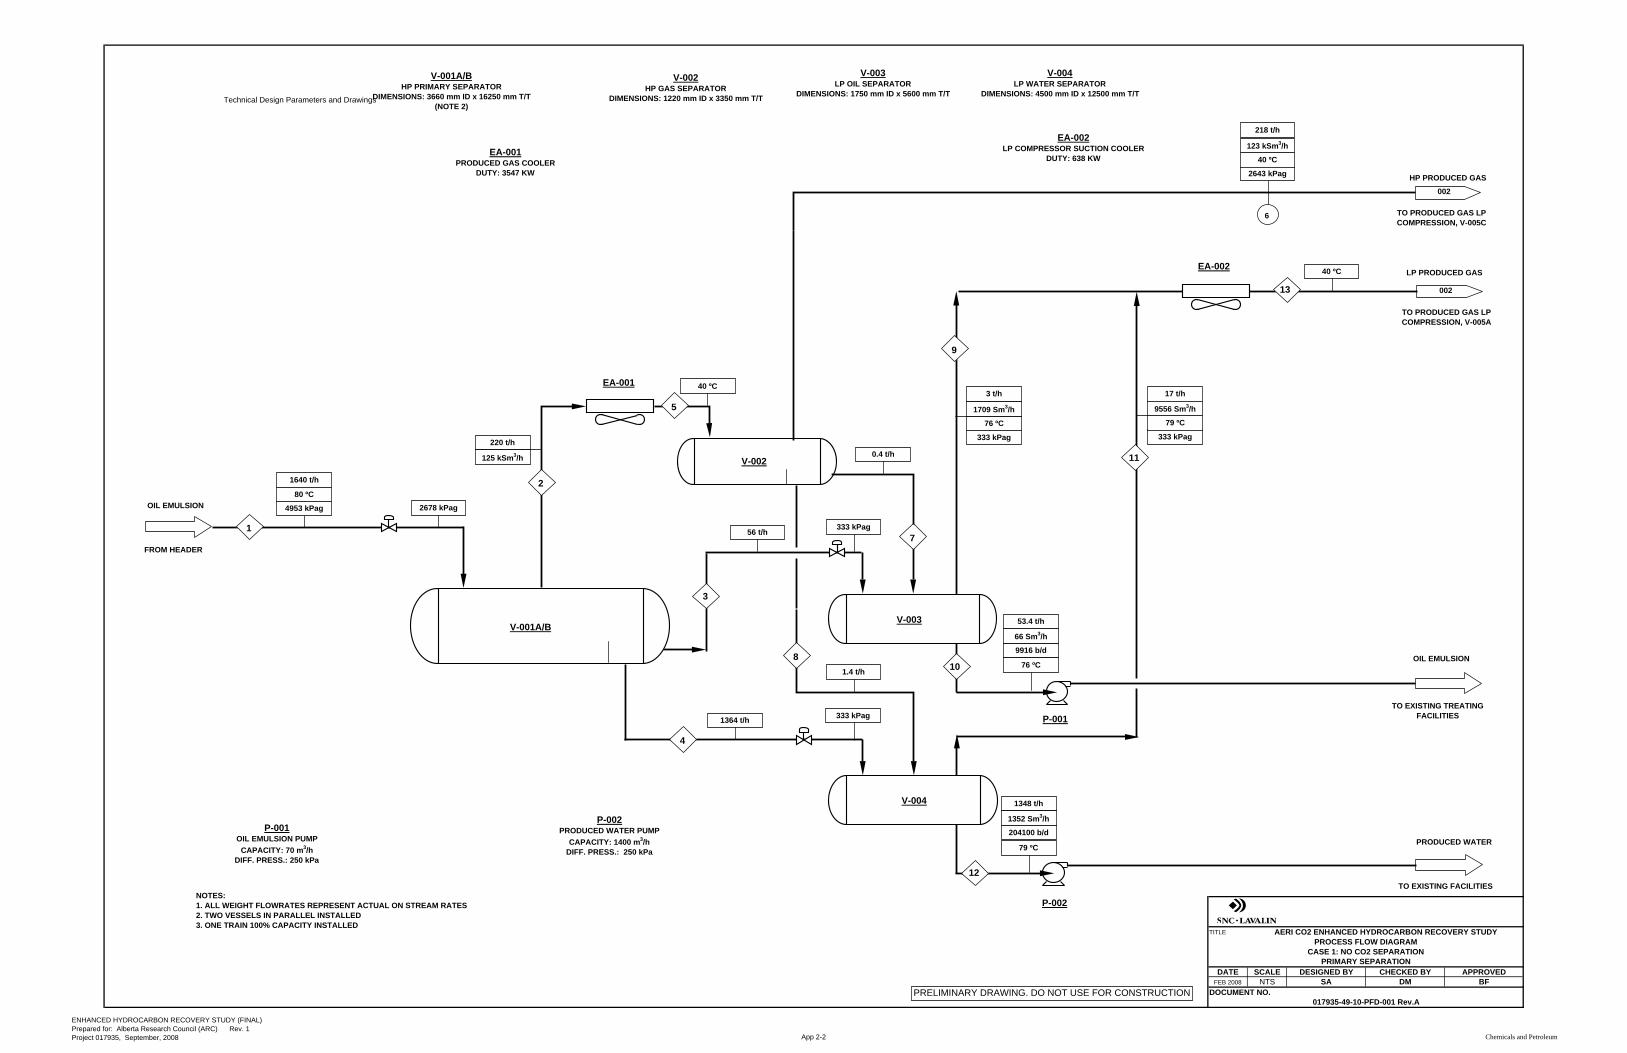
Technical Design Parameters and Drawings
TITLE
DATE SCALEFEB 2008 NTS
DOCUMENT NO.
AERI CO2 ENHANCED HYDROCARBON RECOVERY STUDY
DMSA BF
017935-49-10-PFD-001 Rev.A
PROCESS FLOW DIAGRAMCASE 1: NO CO2 SEPARATION
PRIMARY SEPARATIONDESIGNED BY CHECKED BY APPROVED
OIL EMULSION
FROM HEADER
PRELIMINARY DRAWING. DO NOT USE FOR CONSTRUCTION
002
002
OIL EMULSION
TO EXISTING TREATING FACILITIES
TO EXISTING FACILITIES
PRODUCED WATER
HP PRODUCED GAS
LP PRODUCED GAS
TO PRODUCED GAS LP COMPRESSION, V-005C
TO PRODUCED GAS LP COMPRESSION, V-005A
4953 kPag 2678 kPag
333 kPag
EA-001
V-001A/B
V-002
V-003
V-004
P-001
P-002
V-001A/BHP PRIMARY SEPARATOR
DIMENSIONS: 3660 mm ID x 16250 mm T/T(NOTE 2)
V-002HP GAS SEPARATOR
DIMENSIONS: 1220 mm ID x 3350 mm T/T
V-003LP OIL SEPARATOR
DIMENSIONS: 1750 mm ID x 5600 mm T/T
V-004LP WATER SEPARATOR
DIMENSIONS: 4500 mm ID x 12500 mm T/T
P-001OIL EMULSION PUMP
CAPACITY: 70 m3/hDIFF. PRESS.: 250 kPa
P-002PRODUCED WATER PUMP
CAPACITY: 1400 m3/hDIFF. PRESS.: 250 kPa
1640 t/h
80 ºC
220 t/h
125 kSm3/h
56 t/h
1364 t/h
40 ºC
2643 kPag
218 t/h
40 ºC
123 kSm3/h
333 kPag
53.4 t/h
9916 b/d
66 Sm3/h
76 ºC
1348 t/h
204100 b/d
1352 Sm3/h
79 ºC
333 kPag
3 t/h
76 ºC
1709 Sm3/h
0.4 t/h
1.4 t/h
333 kPag
17 t/h
79 ºC
9556 Sm3/h
EA-002 40 ºC
EA-002LP COMPRESSOR SUCTION COOLER
DUTY: 638 KWEA-001
PRODUCED GAS COOLERDUTY: 3547 KW
NOTES:1. ALL WEIGHT FLOWRATES REPRESENT ACTUAL ON STREAM RATES2. TWO VESSELS IN PARALLEL INSTALLED3. ONE TRAIN 100% CAPACITY INSTALLED
6
1
2
5
3
4
8
7
10
9
11
13
12
ENHANCED HYDROCARBON RECOVERY STUDY (FINAL)Prepared for: Alberta Research Council (ARC) Rev. 1 Project 017935, September, 2008 App 2-2 Chemicals and Petroleum
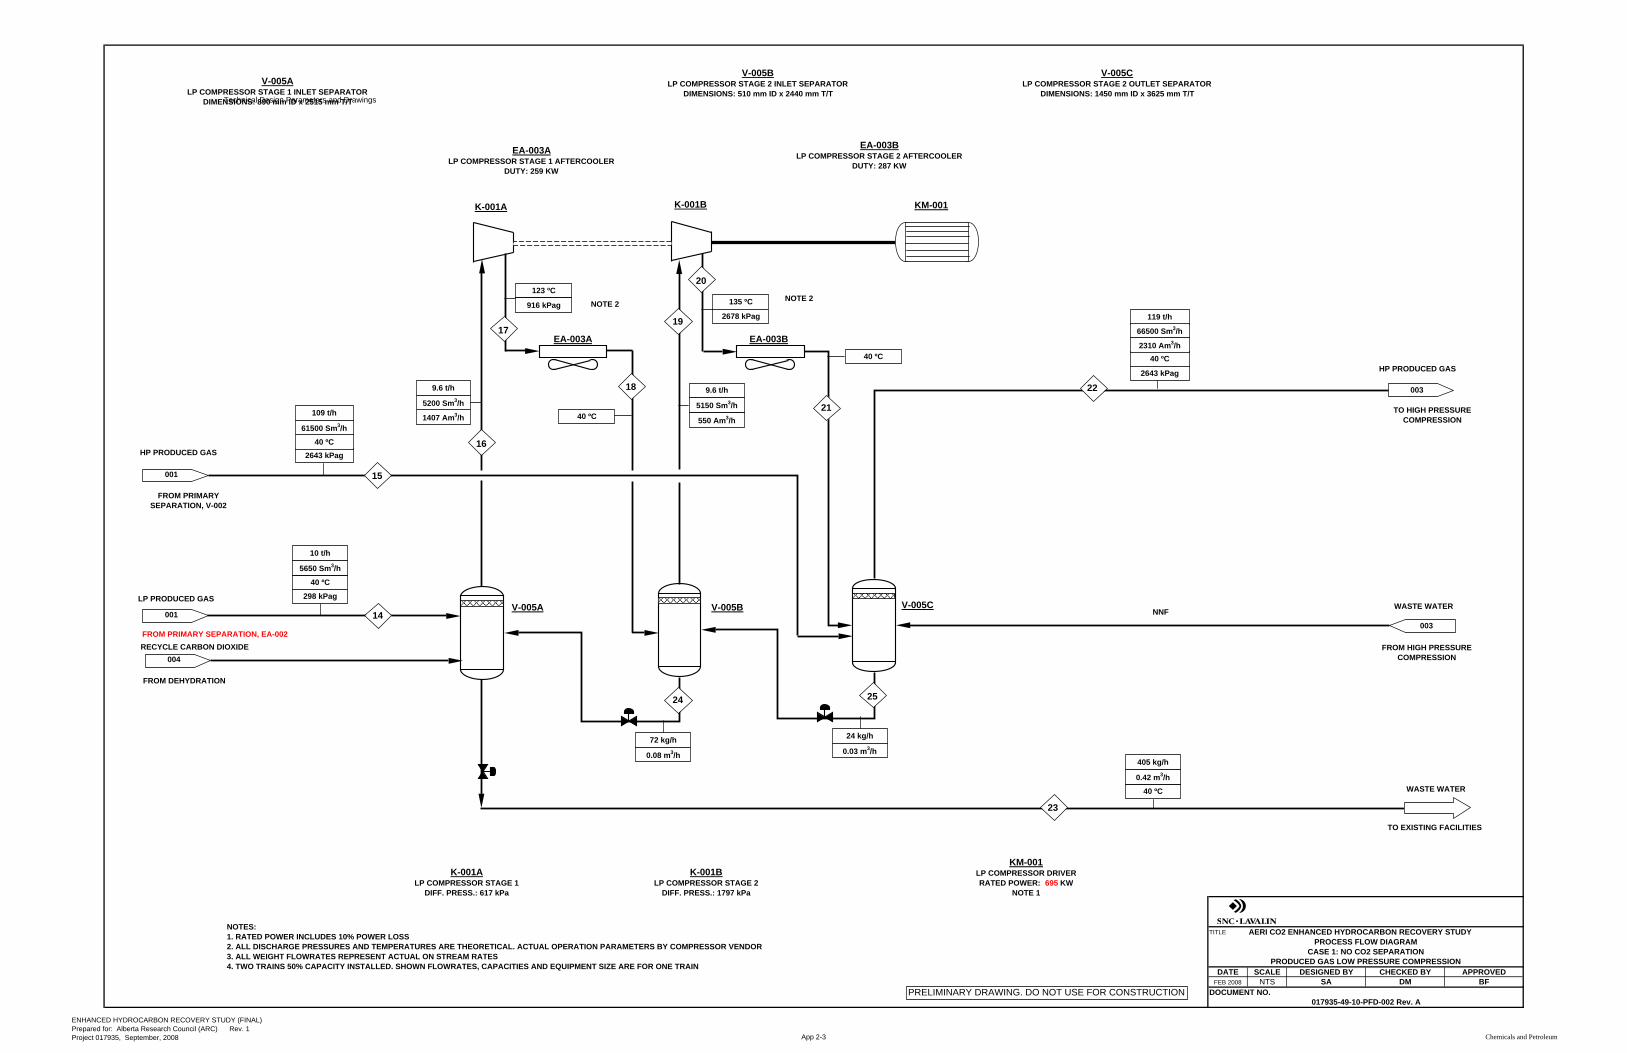
Technical Design Parameters and Drawings
TITLE
DATE SCALEFEB 2008 NTS
DOCUMENT NO.017935-49-10-PFD-002 Rev. A
PROCESS FLOW DIAGRAMCASE 1: NO CO2 SEPARATION
PRODUCED GAS LOW PRESSURE COMPRESSIONDESIGNED BY CHECKED BY APPROVED
AERI CO2 ENHANCED HYDROCARBON RECOVERY STUDY
DMSA BF
FROM PRIMARY SEPARATION, EA-002
LP PRODUCED GAS
TO EXISTING FACILITIES
WASTE WATER
V-005ALP COMPRESSOR STAGE 1 INLET SEPARATOR
DIMENSIONS: 890 mm ID x 2515 mm T/T
V-005BLP COMPRESSOR STAGE 2 INLET SEPARATOR
DIMENSIONS: 510 mm ID x 2440 mm T/T
K-001ALP COMPRESSOR STAGE 1
DIFF. PRESS.: 617 kPa
K-001BLP COMPRESSOR STAGE 2
DIFF. PRESS.: 1797 kPa
EA-003ALP COMPRESSOR STAGE 1 AFTERCOOLER
DUTY: 259 KW
EA-003BLP COMPRESSOR STAGE 2 AFTERCOOLER
DUTY: 287 KW
PRELIMINARY DRAWING. DO NOT USE FOR CONSTRUCTION
123 ºC
916 kPag
40 ºC
135 ºC
2678 kPag
40 ºC 40 ºC
2643 kPag
TO HIGH PRESSURE COMPRESSION
HP PRODUCED GAS
003
KM-001LP COMPRESSOR DRIVERRATED POWER: 695 KW
NOTE 1
K-001A K-001B
EA-003A EA-003B
V-005A V-005B V-005C
V-005CLP COMPRESSOR STAGE 2 OUTLET SEPARATOR
DIMENSIONS: 1450 mm ID x 3625 mm T/T
KM-001
001003
WASTE WATER
FROM HIGH PRESSURE COMPRESSION
001
HP PRODUCED GAS
FROM PRIMARY SEPARATION, V-002
2643 kPag
109 t/h
40 ºC
61500 Sm3/h
298 kPag
10 t/h
40 ºC
5650 Sm3/h
9.6 t/h
1407 Am3/h
5200 Sm3/h
72 kg/h
0.08 m3/h
9.6 t/h
550 Am3/h
5150 Sm3/h
24 kg/h
0.03 m3/h405 kg/h
40 ºC
0.42 m3/h
119 t/h
66500 Sm3/h
NOTES:1. RATED POWER INCLUDES 10% POWER LOSS2. ALL DISCHARGE PRESSURES AND TEMPERATURES ARE THEORETICAL. ACTUAL OPERATION PARAMETERS BY COMPRESSOR VENDOR3. ALL WEIGHT FLOWRATES REPRESENT ACTUAL ON STREAM RATES4. TWO TRAINS 50% CAPACITY INSTALLED. SHOWN FLOWRATES, CAPACITIES AND EQUIPMENT SIZE ARE FOR ONE TRAIN
NOTE 2NOTE 2
NNF
2310 Am3/h
FROM DEHYDRATION
RECYCLE CARBON DIOXIDE004
14
15
16
17
18
19
20
21
22
23
24 25
ENHANCED HYDROCARBON RECOVERY STUDY (FINAL)Prepared for: Alberta Research Council (ARC) Rev. 1 Project 017935, September, 2008 App 2-3 Chemicals and Petroleum
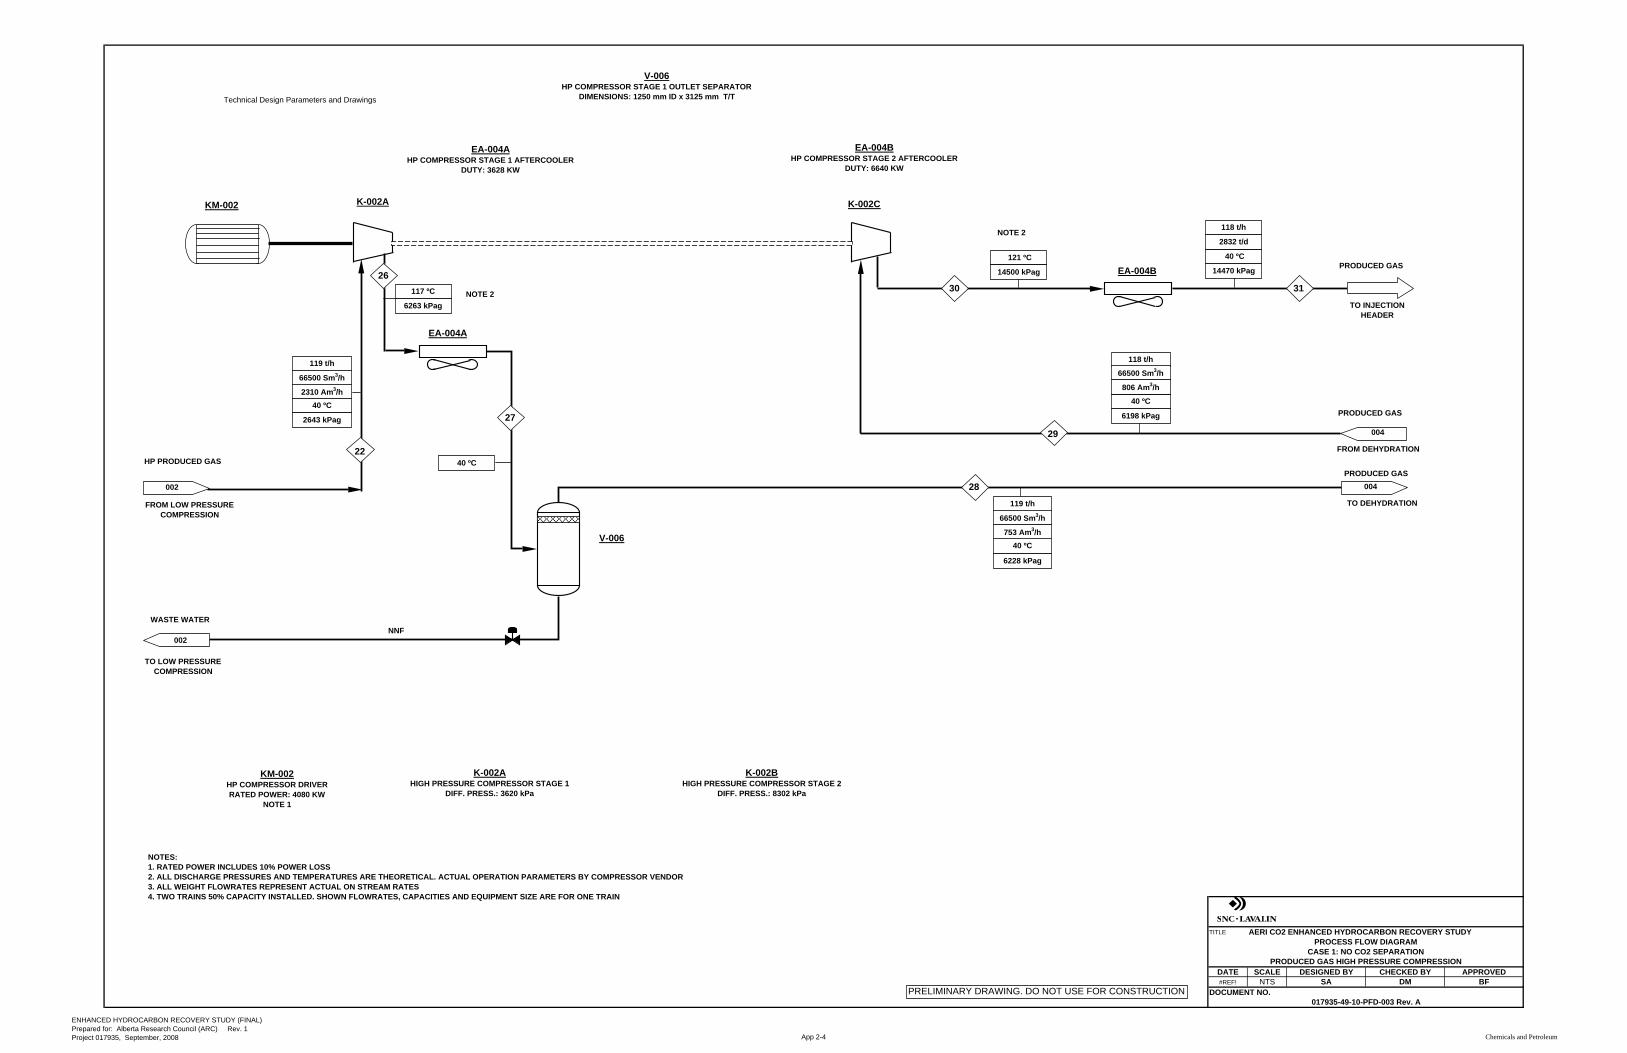
Technical Design Parameters and Drawings
TITLE
DATE SCALE#REF! NTS DMSA BF
AERI CO2 ENHANCED HYDROCARBON RECOVERY STUDY
DOCUMENT NO.017935-49-10-PFD-003 Rev. A
PROCESS FLOW DIAGRAMCASE 1: NO CO2 SEPARATION
PRODUCED GAS HIGH PRESSURE COMPRESSIONDESIGNED BY CHECKED BY APPROVED
002
FROM LOW PRESSURE COMPRESSION
HP PRODUCED GAS
004
TO DEHYDRATION
PRODUCED GAS
V-006HP COMPRESSOR STAGE 1 OUTLET SEPARATOR
DIMENSIONS: 1250 mm ID x 3125 mm T/T
K-002AHIGH PRESSURE COMPRESSOR STAGE 1
DIFF. PRESS.: 3620 kPa
K-002BHIGH PRESSURE COMPRESSOR STAGE 2
DIFF. PRESS.: 8302 kPa
EA-004AHP COMPRESSOR STAGE 1 AFTERCOOLER
DUTY: 3628 KW
EA-004BHP COMPRESSOR STAGE 2 AFTERCOOLER
DUTY: 6640 KW
004
FROM DEHYDRATION
PRODUCED GAS
TO INJECTION HEADER
PRODUCED GAS
PRELIMINARY DRAWING. DO NOT USE FOR CONSTRUCTION
117 ºC
6263 kPag
121 ºC
14500 kPag
118 t/h
40 ºC
14470 kPag
K-002A K-002C
V-006
EA-004A
EA-004B
40 ºC
KM-002
KM-002HP COMPRESSOR DRIVERRATED POWER: 4080 KW
NOTE 1
002
WASTE WATER
TO LOW PRESSURE COMPRESSION
NNF
2832 t/d
NOTES:1. RATED POWER INCLUDES 10% POWER LOSS2. ALL DISCHARGE PRESSURES AND TEMPERATURES ARE THEORETICAL. ACTUAL OPERATION PARAMETERS BY COMPRESSOR VENDOR3. ALL WEIGHT FLOWRATES REPRESENT ACTUAL ON STREAM RATES4. TWO TRAINS 50% CAPACITY INSTALLED. SHOWN FLOWRATES, CAPACITIES AND EQUIPMENT SIZE ARE FOR ONE TRAIN
NOTE 2
NOTE 2
40 ºC
2643 kPag
119 t/h
66500 Sm3/h
2310 Am3/h40 ºC
6198 kPag
118 t/h
66500 Sm3/h
806 Am3/h
40 ºC
6228 kPag
119 t/h
66500 Sm3/h
753 Am3/h
26
22
27
28
29
30 31
ENHANCED HYDROCARBON RECOVERY STUDY (FINAL)Prepared for: Alberta Research Council (ARC) Rev. 1 Project 017935, September, 2008 App 2-4 Chemicals and Petroleum
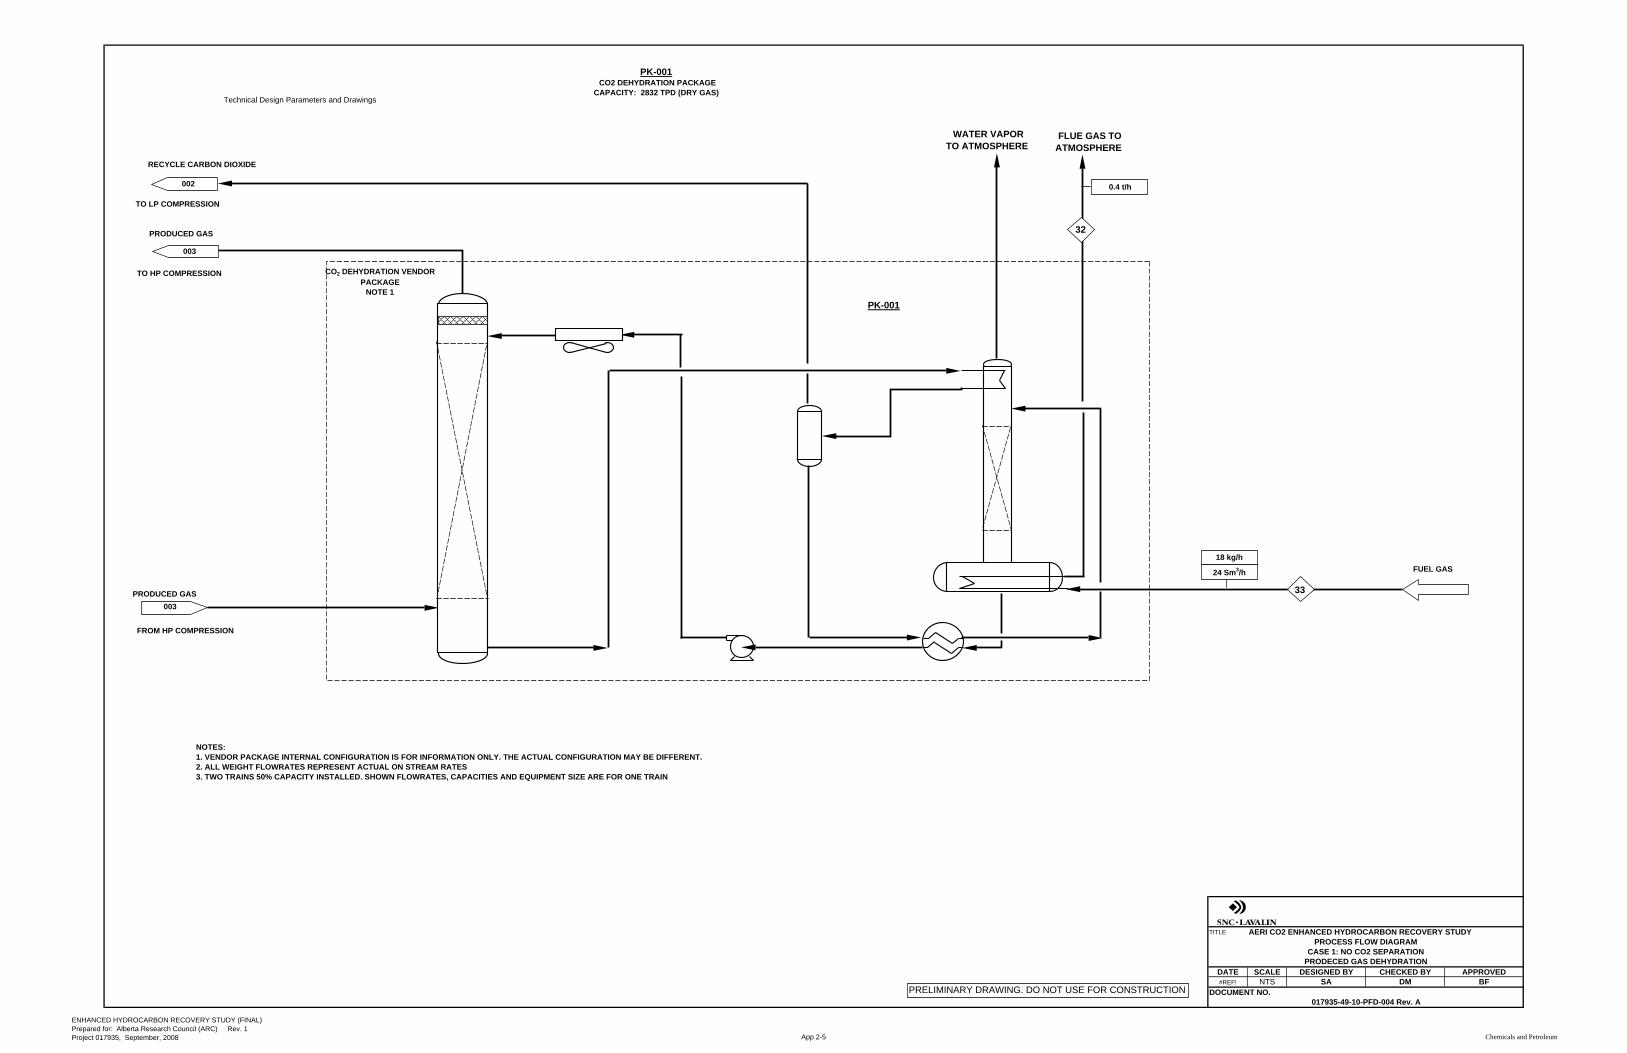
Technical Design Parameters and Drawings
TITLE
DATE SCALE#REF! NTS
AERI CO2 ENHANCED HYDROCARBON RECOVERY STUDY
DMDOCUMENT NO.
017935-49-10-PFD-004 Rev. A
PROCESS FLOW DIAGRAMCASE 1: NO CO2 SEPARATION
PRODECED GAS DEHYDRATIONDESIGNED BY CHECKED BY APPROVED
SA BF
PRODUCED GAS
FROM HP COMPRESSION
003
003
PRODUCED GAS
TO HP COMPRESSION
WATER VAPOR TO ATMOSPHERE
PRELIMINARY DRAWING. DO NOT USE FOR CONSTRUCTION
18 kg/h
24 Sm3/h FUEL GAS
FLUE GAS TO ATMOSPHERE
CO2 DEHYDRATION VENDOR PACKAGE
NOTE 1
PK-001 CO2 DEHYDRATION PACKAGE
CAPACITY: 2832 TPD (DRY GAS)
PK-001
NOTES:1. VENDOR PACKAGE INTERNAL CONFIGURATION IS FOR INFORMATION ONLY. THE ACTUAL CONFIGURATION MAY BE DIFFERENT.2. ALL WEIGHT FLOWRATES REPRESENT ACTUAL ON STREAM RATES3. TWO TRAINS 50% CAPACITY INSTALLED. SHOWN FLOWRATES, CAPACITIES AND EQUIPMENT SIZE ARE FOR ONE TRAIN
0.4 t/h002
RECYCLE CARBON DIOXIDE
TO LP COMPRESSION
32
33
ENHANCED HYDROCARBON RECOVERY STUDY (FINAL)Prepared for: Alberta Research Council (ARC) Rev. 1 Project 017935, September, 2008 App 2-5 Chemicals and Petroleum
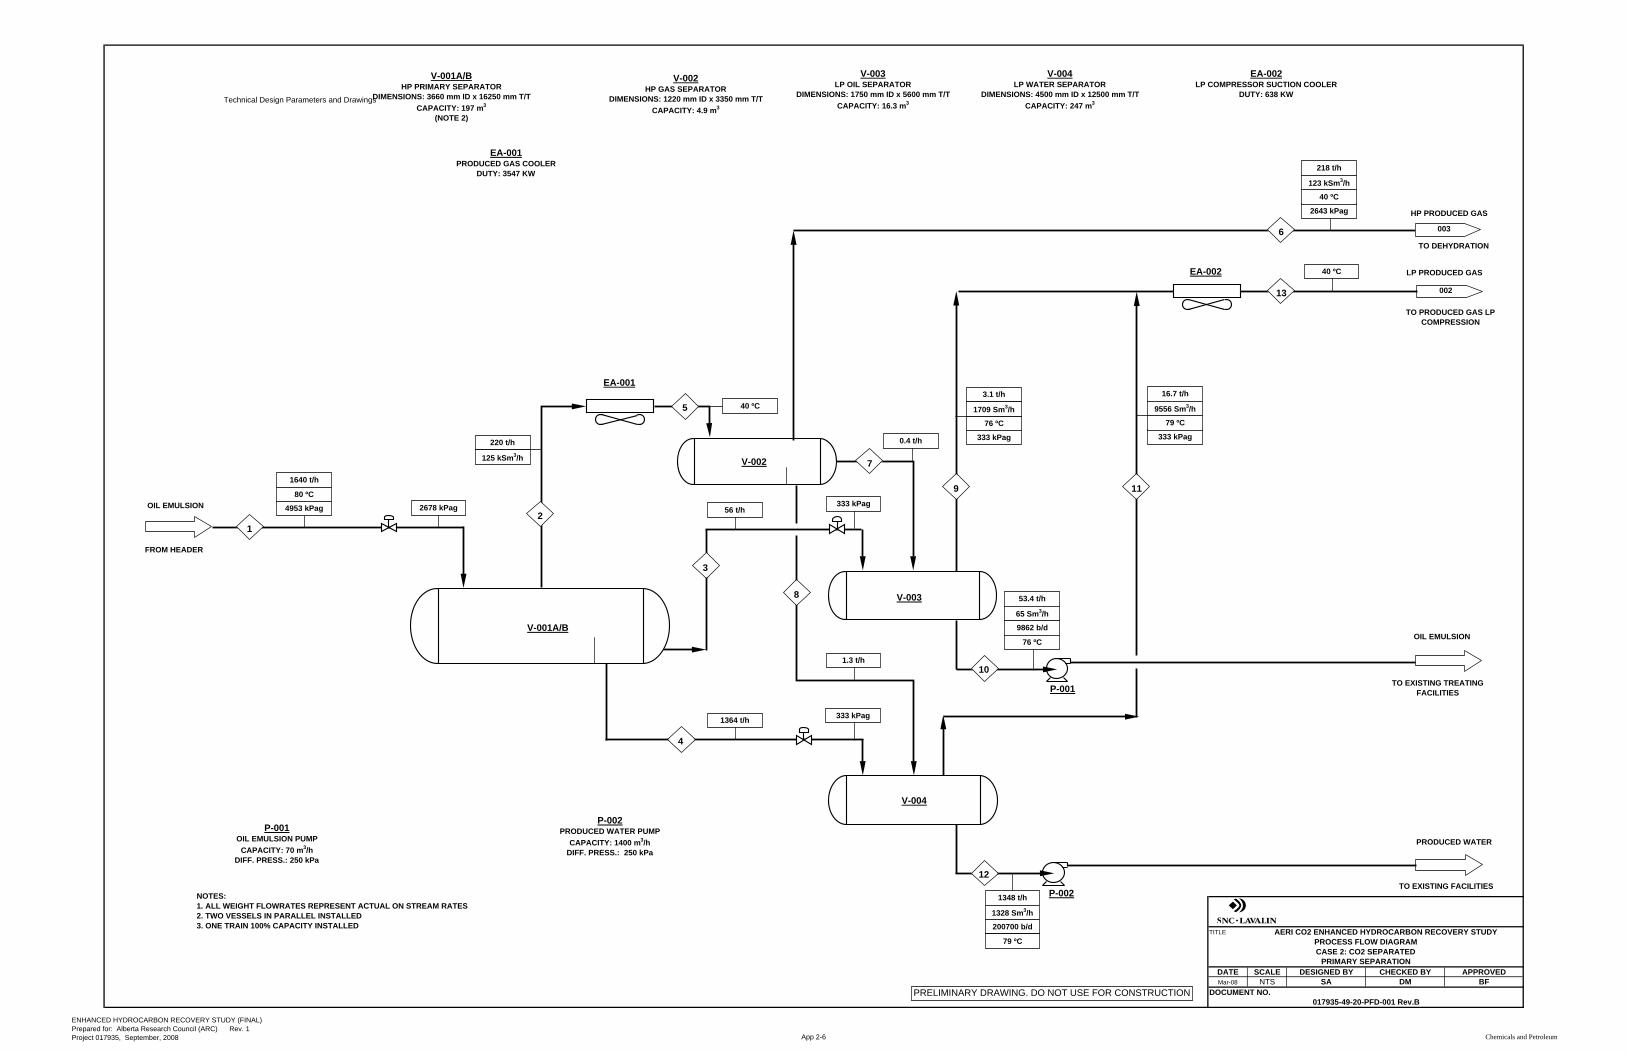
Technical Design Parameters and Drawings
TITLE
DATE SCALEMar-08 NTS
DOCUMENT NO.
AERI CO2 ENHANCED HYDROCARBON RECOVERY STUDY
DMSA BF
017935-49-20-PFD-001 Rev.B
PROCESS FLOW DIAGRAMCASE 2: CO2 SEPARATED
PRIMARY SEPARATIONDESIGNED BY CHECKED BY APPROVED
OIL EMULSION
FROM HEADER
PRELIMINARY DRAWING. DO NOT USE FOR CONSTRUCTION
003
002
OIL EMULSION
TO EXISTING TREATING FACILITIES
TO EXISTING FACILITIES
PRODUCED WATER
HP PRODUCED GAS
LP PRODUCED GAS
TO DEHYDRATION
TO PRODUCED GAS LP COMPRESSION
4953 kPag 2678 kPag 333 kPag
EA-001
V-001A/B
V-002
V-003
V-004
P-001
P-002
V-001A/BHP PRIMARY SEPARATOR
DIMENSIONS: 3660 mm ID x 16250 mm T/TCAPACITY: 197 m3
(NOTE 2)
V-002HP GAS SEPARATOR
DIMENSIONS: 1220 mm ID x 3350 mm T/TCAPACITY: 4.9 m3
V-003LP OIL SEPARATOR
DIMENSIONS: 1750 mm ID x 5600 mm T/TCAPACITY: 16.3 m3
V-004LP WATER SEPARATOR
DIMENSIONS: 4500 mm ID x 12500 mm T/TCAPACITY: 247 m3
P-001OIL EMULSION PUMP
CAPACITY: 70 m3/hDIFF. PRESS.: 250 kPa
P-002PRODUCED WATER PUMP
CAPACITY: 1400 m3/hDIFF. PRESS.: 250 kPa
1640 t/h
80 ºC
220 t/h
125 kSm3/h
56 t/h
1364 t/h
40 ºC
2643 kPag
218 t/h
40 ºC
123 kSm3/h
333 kPag
53.4 t/h
9862 b/d
65 Sm3/h
76 ºC
1348 t/h
200700 b/d
1328 Sm3/h
79 ºC
333 kPag
3.1 t/h
76 ºC
1709 Sm3/h
0.4 t/h
1.3 t/h
333 kPag
16.7 t/h
79 ºC
9556 Sm3/h
EA-002 40 ºC
EA-002LP COMPRESSOR SUCTION COOLER
DUTY: 638 KW
EA-001PRODUCED GAS COOLER
DUTY: 3547 KW
NOTES:1. ALL WEIGHT FLOWRATES REPRESENT ACTUAL ON STREAM RATES2. TWO VESSELS IN PARALLEL INSTALLED3. ONE TRAIN 100% CAPACITY INSTALLED
12
3
4
5
8
7
9 11
6
13
10
12
ENHANCED HYDROCARBON RECOVERY STUDY (FINAL)Prepared for: Alberta Research Council (ARC) Rev. 1 Project 017935, September, 2008 App 2-6 Chemicals and Petroleum
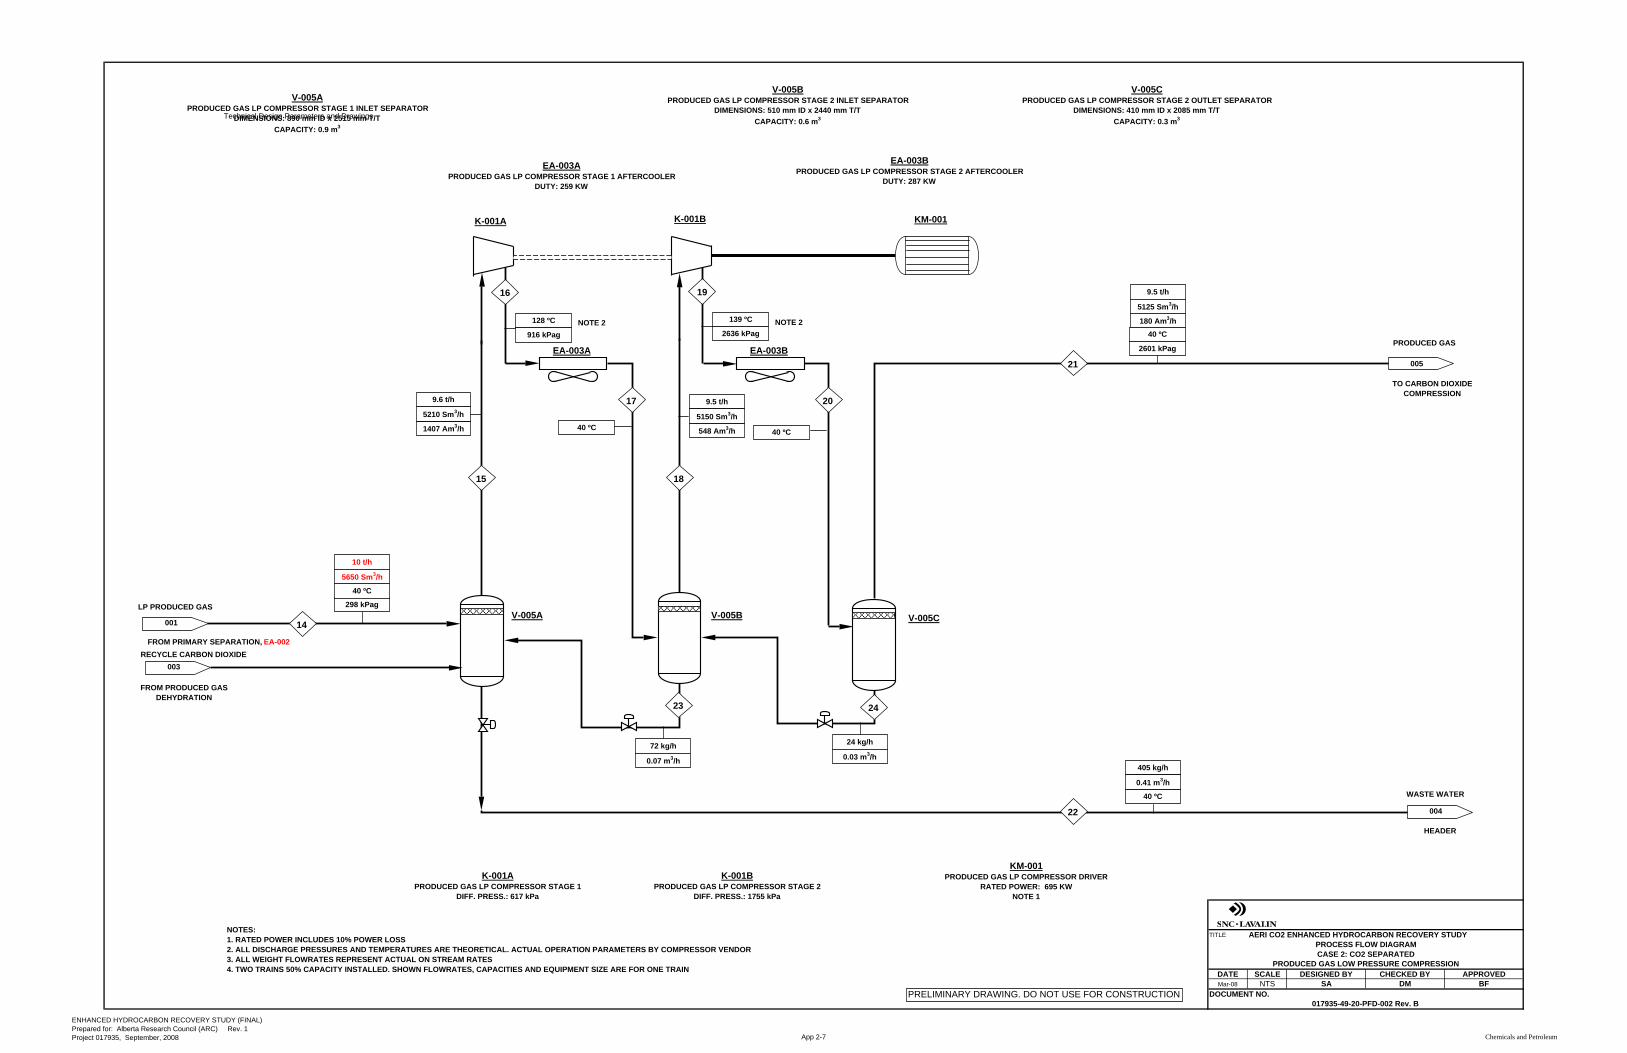
Technical Design Parameters and Drawings
TITLE
DATE SCALEMar-08 NTS
DOCUMENT NO.017935-49-20-PFD-002 Rev. B
PROCESS FLOW DIAGRAMCASE 2: CO2 SEPARATED
PRODUCED GAS LOW PRESSURE COMPRESSIONDESIGNED BY CHECKED BY APPROVED
AERI CO2 ENHANCED HYDROCARBON RECOVERY STUDY
DMSA BF
FROM PRIMARY SEPARATION, EA-002
LP PRODUCED GAS
HEADER
WASTE WATER
V-005APRODUCED GAS LP COMPRESSOR STAGE 1 INLET SEPARATOR
DIMENSIONS: 890 mm ID x 2515 mm T/TCAPACITY: 0.9 m3
V-005BPRODUCED GAS LP COMPRESSOR STAGE 2 INLET SEPARATOR
DIMENSIONS: 510 mm ID x 2440 mm T/TCAPACITY: 0.6 m3
K-001APRODUCED GAS LP COMPRESSOR STAGE 1
DIFF. PRESS.: 617 kPa
K-001BPRODUCED GAS LP COMPRESSOR STAGE 2
DIFF. PRESS.: 1755 kPa
EA-003APRODUCED GAS LP COMPRESSOR STAGE 1 AFTERCOOLER
DUTY: 259 KW
EA-003BPRODUCED GAS LP COMPRESSOR STAGE 2 AFTERCOOLER
DUTY: 287 KW
PRELIMINARY DRAWING. DO NOT USE FOR CONSTRUCTION
128 ºC
916 kPag
40 ºC
139 ºC
2636 kPag 40 ºC
2601 kPag
TO CARBON DIOXIDE COMPRESSION
PRODUCED GAS
005
KM-001PRODUCED GAS LP COMPRESSOR DRIVER
RATED POWER: 695 KWNOTE 1
K-001A K-001B
EA-003A EA-003B
V-005A V-005B
V-005CPRODUCED GAS LP COMPRESSOR STAGE 2 OUTLET SEPARATOR
DIMENSIONS: 410 mm ID x 2085 mm T/TCAPACITY: 0.3 m3
KM-001
001
298 kPag
10 t/h
40 ºC
5650 Sm3/h
9.6 t/h
1407 Am3/h
5210 Sm3/h
72 kg/h
0.07 m3/h
9.5 t/h
548 Am3/h
5150 Sm3/h
24 kg/h
0.03 m3/h405 kg/h
40 ºC
0.41 m3/h
9.5 t/h
5125 Sm3/h
NOTES:1. RATED POWER INCLUDES 10% POWER LOSS2. ALL DISCHARGE PRESSURES AND TEMPERATURES ARE THEORETICAL. ACTUAL OPERATION PARAMETERS BY COMPRESSOR VENDOR3. ALL WEIGHT FLOWRATES REPRESENT ACTUAL ON STREAM RATES4. TWO TRAINS 50% CAPACITY INSTALLED. SHOWN FLOWRATES, CAPACITIES AND EQUIPMENT SIZE ARE FOR ONE TRAIN
NOTE 2 NOTE 2 180 Am3/h
FROM PRODUCED GAS DEHYDRATION
RECYCLE CARBON DIOXIDE003
004
40 ºC
V-005C14
15 18
17 20
16 19
21
22
2423
ENHANCED HYDROCARBON RECOVERY STUDY (FINAL)Prepared for: Alberta Research Council (ARC) Rev. 1 Project 017935, September, 2008 App 2-7 Chemicals and Petroleum

Technical Design Parameters and Drawings
TITLE
DATE SCALEMar-08 NTS
AERI CO2 ENHANCED HYDROCARBON RECOVERY STUDY
DMDOCUMENT NO.
017935-49-20-PFD-003 Rev. B
PROCESS FLOW DIAGRAMCASE 2: CO2 SEPARATED
PRODUCED GAS DEHYDRATIONDESIGNED BY CHECKED BY APPROVED
SA BF
HP PRODUCED GAS
FROM PRIMARY SEPARATION
001
WATER VAPOR TO ATMOSPHERE
PRELIMINARY DRAWING. DO NOT USE FOR CONSTRUCTION
30 kg/h
40 Sm3/h FUEL GAS
FLUE GAS TO ATMOSPHERE
DEHYDRATION VENDOR PACKAGE
NOTE 1
PK-001 CO2 DEHYDRATION PACKAGECAPACITY: 2616 TPD (DRY GAS)
PK-001
NOTES:1. VENDOR PACKAGE INTERNAL CONFIGURATION IS FOR INFORMATION ONLY. THE ACTUAL CONFIGURATION MAY BE DIFFERENT.2. ALL WEIGHT FLOWRATES REPRESENT ACTUAL ON STREAM RATES3. TWO TRAINS 50% CAPACITY INSTALLED. SHOWN FLOWRATES, CAPACITIES AND EQUIPMENT SIZE ARE FOR ONE TRAIN
0.6 t/h
004
DRY PRODUCED GAS
TO CO2 SEPARATION
002
CARBON DIOXIDE
TO PRODUCED GAS LP COMPRESSION
45 ºC
2523 kPag
109 t/h
61335 Sm3/h
005
DRY PRODUCED GAS
TO CO2 COMPRESSIONSTARTUP BYPASS LINE
6
25
27
26
ENHANCED HYDROCARBON RECOVERY STUDY (FINAL)Prepared for: Alberta Research Council (ARC) Rev. 1 Project 017935, September, 2008 App 2-8 Chemicals and Petroleum
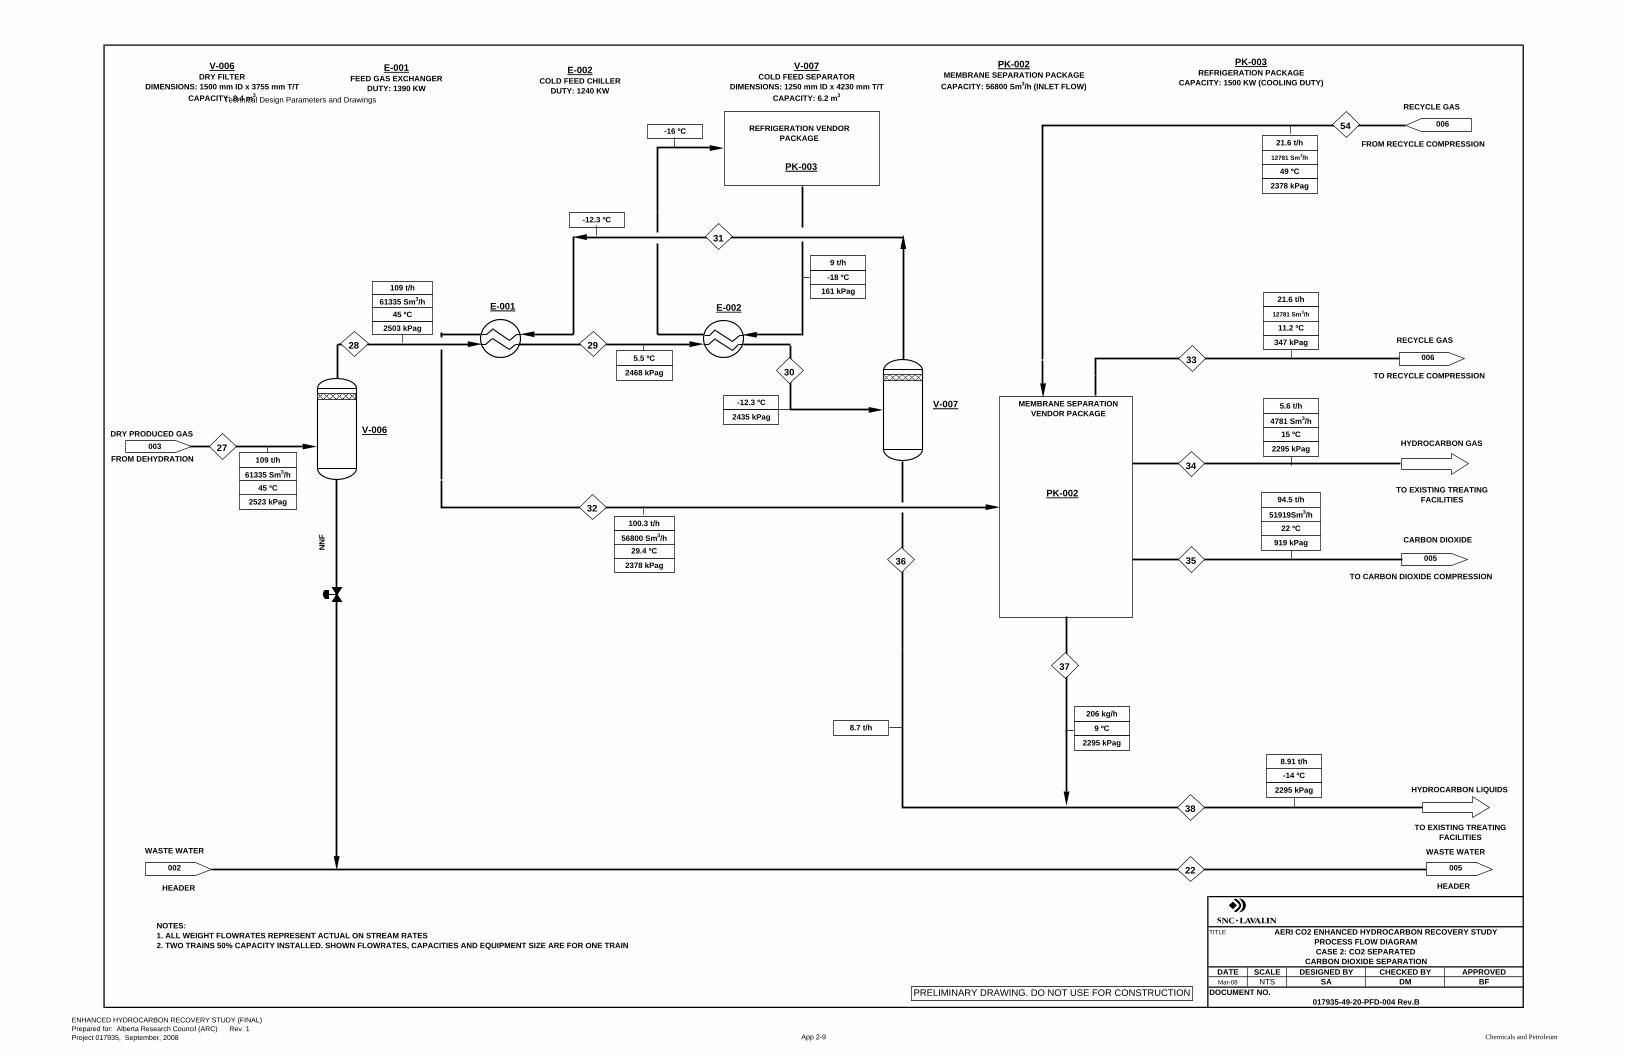
Technical Design Parameters and Drawings
TITLE
DATE SCALEMar-08 NTS
017935-49-20-PFD-004 Rev.B
PROCESS FLOW DIAGRAMCASE 2: CO2 SEPARATED
CARBON DIOXIDE SEPARATIONDESIGNED BY CHECKED BY APPROVED
DOCUMENT NO.
AERI CO2 ENHANCED HYDROCARBON RECOVERY STUDY
DMSA BFPRELIMINARY DRAWING. DO NOT USE FOR CONSTRUCTION
HYDROCARBON LIQUIDS
TO EXISTING TREATING FACILITIES
V-006
V-006DRY FILTER
DIMENSIONS: 1500 mm ID x 3755 mm T/TCAPACITY: 8.4 m3
003DRY PRODUCED GAS
FROM DEHYDRATION
HEADER
WASTE WATER
005
CARBON DIOXIDE
TO CARBON DIOXIDE COMPRESSION
TO EXISTING TREATING FACILITIES
HYDROCARBON GAS
005
PK-002
MEMBRANE SEPARATION VENDOR PACKAGE
V-007
E-001 E-002
HEADER
WASTE WATER
002
006
RECYCLE GAS
TO RECYCLE COMPRESSION
006
RECYCLE GAS
FROM RECYCLE COMPRESSION
V-007COLD FEED SEPARATOR
DIMENSIONS: 1250 mm ID x 4230 mm T/TCAPACITY: 6.2 m3
E-001FEED GAS EXCHANGER
DUTY: 1390 KW
E-002COLD FEED CHILLER
DUTY: 1240 KW
PK-002MEMBRANE SEPARATION PACKAGE
CAPACITY: 56800 Sm3/h (INLET FLOW)
PK-003REFRIGERATION PACKAGE
CAPACITY: 1500 KW (COOLING DUTY)
NN
F45 ºC
2503 kPag
109 t/h
61335 Sm3/h
5.5 ºC
PK-003
-12.3 ºC
2435 kPag
-12.3 ºC
8.7 t/h
-18 ºC
161 kPag
9 t/h
-16 ºC
15 ºC
2295 kPag
5.6 t/h
4781 Sm3/h
11.2 ºC
347 kPag
21.6 t/h
12781 Sm3/h
22 ºC
919 kPag
94.5 t/h
51919Sm3/h
REFRIGERATION VENDOR PACKAGE
9 ºC
2295 kPag
206 kg/h
-14 ºC
2295 kPag
8.91 t/h
49 ºC
2378 kPag
21.6 t/h
12781 Sm3/h
NOTES:1. ALL WEIGHT FLOWRATES REPRESENT ACTUAL ON STREAM RATES2. TWO TRAINS 50% CAPACITY INSTALLED. SHOWN FLOWRATES, CAPACITIES AND EQUIPMENT SIZE ARE FOR ONE TRAIN
45 ºC
2523 kPag
109 t/h
61335 Sm3/h
29.4 ºC
2378 kPag
100.3 t/h
56800 Sm3/h
2468 kPag
27
28 29
30
31
32
33
34
3536
38
22
37
54
ENHANCED HYDROCARBON RECOVERY STUDY (FINAL)Prepared for: Alberta Research Council (ARC) Rev. 1 Project 017935, September, 2008 App 2-9 Chemicals and Petroleum
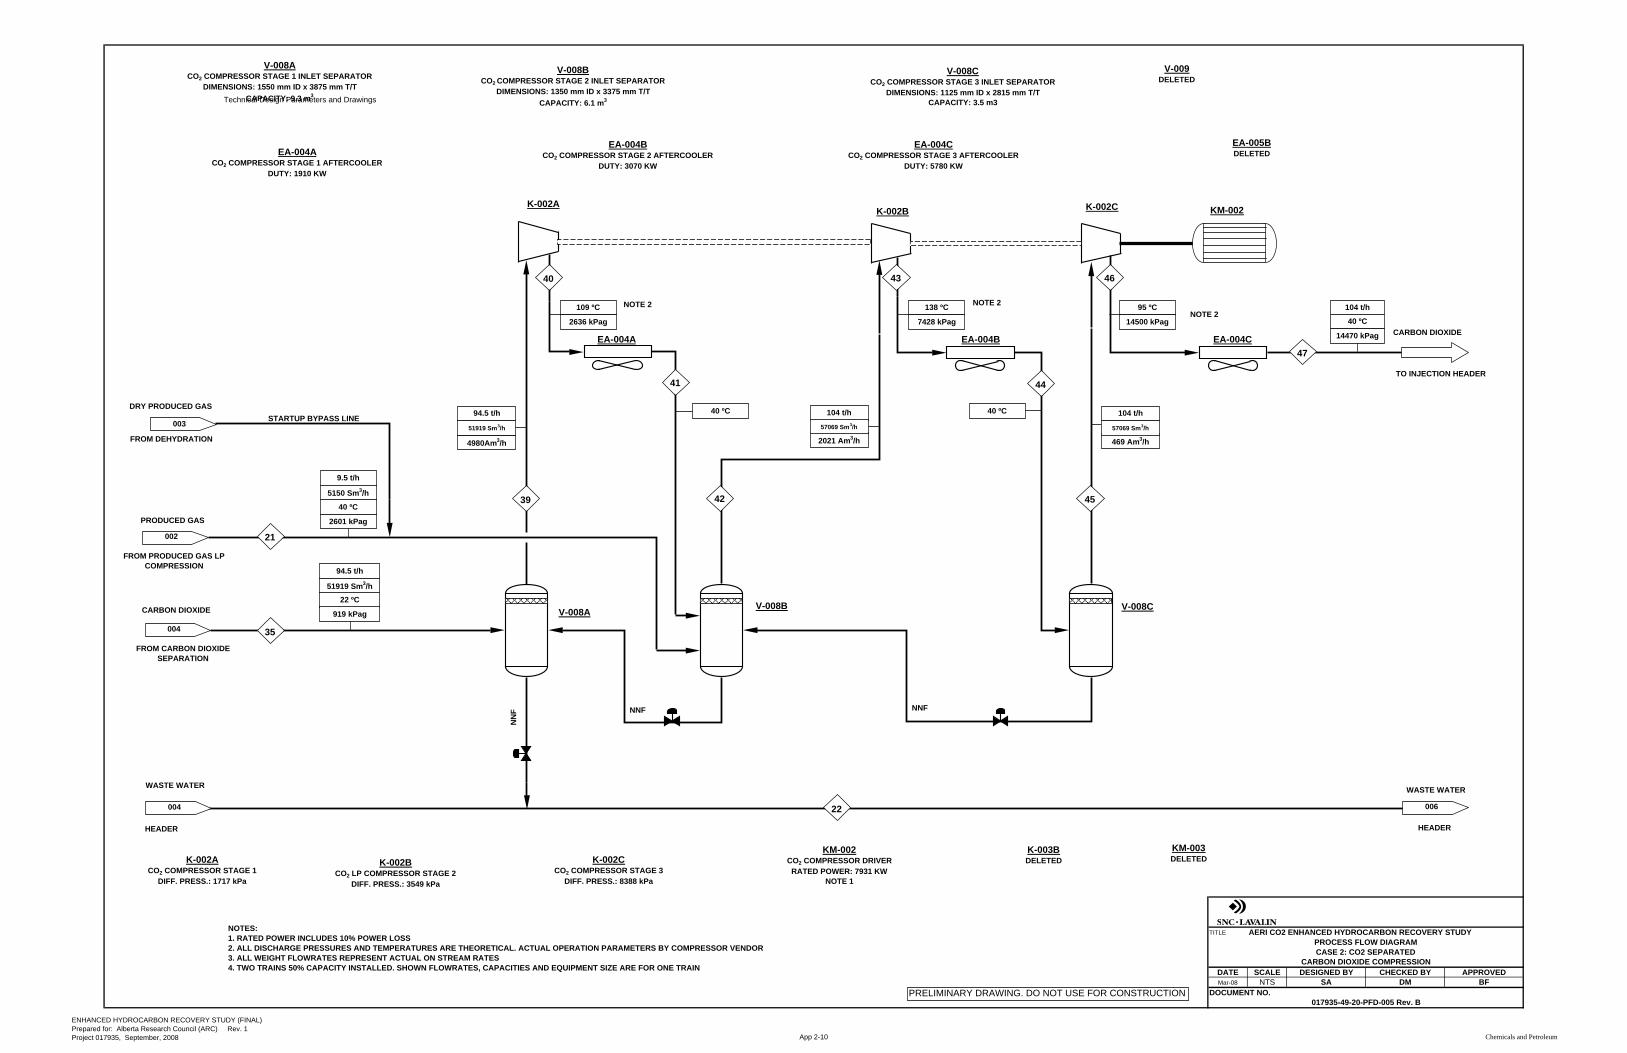
Technical Design Parameters and Drawings
TITLE
DATE SCALEMar-08 NTS
DOCUMENT NO.017935-49-20-PFD-005 Rev. B
PROCESS FLOW DIAGRAMCASE 2: CO2 SEPARATED
CARBON DIOXIDE COMPRESSIONDESIGNED BY CHECKED BY APPROVED
AERI CO2 ENHANCED HYDROCARBON RECOVERY STUDY
DMSA BF
FROM PRODUCED GAS LPCOMPRESSION
PRODUCED GAS
HEADER
WASTE WATER
V-008ACO2 COMPRESSOR STAGE 1 INLET SEPARATOR
DIMENSIONS: 1550 mm ID x 3875 mm T/TCAPACITY: 9.3 m3
V-008BCO2 COMPRESSOR STAGE 2 INLET SEPARATOR
DIMENSIONS: 1350 mm ID x 3375 mm T/TCAPACITY: 6.1 m3
K-002ACO2 COMPRESSOR STAGE 1
DIFF. PRESS.: 1717 kPa
K-002BCO2 LP COMPRESSOR STAGE 2
DIFF. PRESS.: 3549 kPa
EA-004ACO2 COMPRESSOR STAGE 1 AFTERCOOLER
DUTY: 1910 KW
EA-004BCO2 COMPRESSOR STAGE 2 AFTERCOOLER
DUTY: 3070 KW
PRELIMINARY DRAWING. DO NOT USE FOR CONSTRUCTION
109 ºC
2636 kPag
40 ºC
TO INJECTION HEADER
CARBON DIOXIDE
KM-002CO2 COMPRESSOR DRIVERRATED POWER: 7931 KW
NOTE 1
K-002AK-002B
EA-004A
V-008A V-008B
V-008CCO2 COMPRESSOR STAGE 3 INLET SEPARATOR
DIMENSIONS: 1125 mm ID x 2815 mm T/TCAPACITY: 3.5 m3
002
NOTES:1. RATED POWER INCLUDES 10% POWER LOSS2. ALL DISCHARGE PRESSURES AND TEMPERATURES ARE THEORETICAL. ACTUAL OPERATION PARAMETERS BY COMPRESSOR VENDOR3. ALL WEIGHT FLOWRATES REPRESENT ACTUAL ON STREAM RATES4. TWO TRAINS 50% CAPACITY INSTALLED. SHOWN FLOWRATES, CAPACITIES AND EQUIPMENT SIZE ARE FOR ONE TRAIN
NOTE 2
FROM CARBON DIOXIDE SEPARATION
CARBON DIOXIDE
004
004
WASTE WATER
HEADER
V-008C
EA-004B EA-004C
K-002C
NNF NNF
NN
F
KM-002
K-002CCO2 COMPRESSOR STAGE 3
DIFF. PRESS.: 8388 kPa
K-003BDELETED
KM-003DELETED
V-009DELETED
EA-004CCO2 COMPRESSOR STAGE 3 AFTERCOOLER
DUTY: 5780 KW
EA-005BDELETED
94.5 t/h
4980Am3/h
51919 Sm3/h
138 ºC
7428 kPag
40 ºC
95 ºC
14500 kPag 40 ºC
14470 kPag
104 t/hNOTE 2NOTE 2
40 ºC
2601 kPag
9.5 t/h
5150 Sm3/h
006
003
DRY PRODUCED GAS
FROM DEHYDRATION
STARTUP BYPASS LINE
22 ºC
919 kPag
94.5 t/h
51919 Sm3/h
104 t/h
2021 Am3/h
57069 Sm3/h
104 t/h
469 Am3/h
57069 Sm3/h
21
35
39 42
40
41
43
44
45
46
47
22
ENHANCED HYDROCARBON RECOVERY STUDY (FINAL)Prepared for: Alberta Research Council (ARC) Rev. 1 Project 017935, September, 2008 App 2-10 Chemicals and Petroleum

Technical Design Parameters and Drawings
TITLE
DATE SCALEMar-08 NTS
AERI CO2 ENHANCED HYDROCARBON RECOVERY STUDY
DMSA BFDOCUMENT NO.
017935-49-20-PFD-006 Rev. B
PROCESS FLOW DIAGRAMCASE 2: CO2 SEPARATEDRECYCLE COMPRESSION
DESIGNED BY CHECKED BY APPROVED
FROM CARBON DIOXIDE SEPARATION
RECYCLE GAS
HEADER
WASTE WATER
V-010ARECYCLE COMPRESSOR STAGE 1 INLET SEPARATOR
DIMENSIONS: 914 mm ID x 2290 mm T/TCAPACITY: 1.9 m3
V-010BRECYCLE COMPRESSOR STAGE 2 INLET SEPARATOR
DIMENSIONS: 800 mm ID x 2000 mm T/TCAPACITY: 1.3 m3
K-004ARECYCLE COMPRESSOR STAGE 1
DIFF. PRESS.: 583 kPa
K-004BRECYCLE COMPRESSOR STAGE 2
DIFF. PRESS.: 1516 kPa
EA-006ARECYCLE COMPRESSOR STAGE 1 AFTERCOOLER
DUTY: 222 KW
EA-006BRECYCLE COMPRESSOR STAGE 2 AFTERCOOLER
DUTY: 602 KW
PRELIMINARY DRAWING. DO NOT USE FOR CONSTRUCTION
84 ºC
930 kPag
49 ºC
138 ºC
2419 kPag
49 ºC
TO CARBON DIOXIDE SEPARATION
RECYCLE GAS
004
KM-004RECYCLE COMPRESSOR DRIVER
RATED POWER: 1035 KWNOTE 1
K-004A K-004B
EA-006A EA-006B
V-010A V-010B V-010C
V-010CRECYCLE COMPRESSOR STAGE 2 OUTLET SEPARATOR
DIMENSIONS: 640 mm ID x 1600 mm T/TCAPACITY: 0.7 m3
KM-004
004
NOTES:1. RATED POWER INCLUDES 10% POWER LOSS2. ALL DISCHARGE PRESSURES AND TEMPERATURES ARE THEORETICAL. ACTUAL OPERATION PARAMETERS BY COMPRESSOR VENDOR3. ALL WEIGHT FLOWRATES REPRESENT ACTUAL ON STREAM RATES4. TWO TRAINS 50% CAPACITY INSTALLED. SHOWN FLOWRATES, CAPACITIES AND EQUIPMENT SIZE ARE FOR ONE TRAIN
NOTE 2 NOTE 2
TO EXISTING FACILITIES
WASTE WATER
005
NNFNNF
NN
F
V-011LUBE OIL SEPARATOR
DIMENSIONS: 640 mm ID x 1600 mm T/TCAPACITY: 0.7 m3
V-011
405 kg/h
40 ºC
0.42 m3/h
2778 Am3/h
21.6 t/h
12781 Sm3/h
1385 Am3/h
21.6 t/h
12781 Sm3/h
11.2 ºC
347 kPag
21.6 t/h
12781 Sm3/h
49 ºC
2378 kPag
21.6 t/h
12781 Sm3/h
33
48 51
49 52
50 53
54
ENHANCED HYDROCARBON RECOVERY STUDY (FINAL)Prepared for: Alberta Research Council (ARC) Rev. 1 Project 017935, September, 2008 App 2-11 Chemicals and Petroleum

Rev./Date By Checked ApprovedA / Mar. 2008 VC SA BF
Project: B / Sep. 2008 SA DM BFDoc. #:Page
Stream Number Units 1 2 3 4 5 6 7 8 9 10 11 12 13
Stream Description Oil Emulsion from Header Produced Gas Recovered Oil
EmulsionRecovered
WaterCooled Produced
Gas HP Produced Gas V-002 Separated Oil
V-002 Separated
Water
LP Produced Gas from V-
003Oil Emulsion
LP Produced Gas from V-
004Produced Water LP Produced
Gas
Vapor Weight Fraction 0.123 1.00 0.00 0.00 0.99 1.00 0.00 0.00 1.00 0.00 1.000 0.000 0.925Temperature ºC 80 80 80 80 40 40 40 40 75.5 75.5 79.2 79.2 40.0Pressure kPag 4953 2678 2678 2678 2678 2643 2643 2643 333 333 333 333 298Molar Rate kg-mol/hr 80690 5277 363 75050 5277 5200 4.5 72.8 72.3 295 404 74719 477Mass Rate Ton/hr 1640 220.05 56.13 1363 220.05 218.33 0.39 1.33 3.12 53.40 16.71 1348.06 19.83Actual Volumetric Flow Am3/hr 3841 5047 72.28 1409 4269 4267 0.50 1.33 474 69.33 2678.10 1396.23 2816.76Standard Volumetric Flow Sm3/hr ------- 124800 67.4 1340 ------- 123000 0.48 1.31 1709 817 9556 1328 -------Enthalpy GJ/h -23.217 -1.868 -0.137 -21.201 -1.881 -1.859 -0.001 -0.021 -0.025 -0.113 -0.152 -21.070 -0.179Molecular Weight 20.32 41.70 154.70 18.17 41.70 41.99 88.19 18.26 43.05 181.00 41.33 18.04 41.61Actual Density kg/m3 426.90 43.60 776.50 968.00 51.55 51.17 793.10 999.99 6.56 770.20 6.24 965.50 7.04Dynamic Viscosity cP ------- 0.018 1.349 0.367 ------- 0.016 0.530 0.674 0.016 1.773 0.016 0.355 -------Thermal Conductivity W/m-ºC ------- 0.025 0.111 0.663 ------- 0.022 0.103 0.621 0.022 0.134 0.022 0.669 -------Specific Heat kJ/kg-ºC ------- 1.127 2.293 4.315 ------- 1.140 1.230 4.256 1.057 2.312 0.974 4.350 -------Surface Tension dyne/cm ------- ------- 16.74 62.16 ------- ------ 15.90 68.83 ------ 20.70 ------ 62.420 -------Compressibility ------- 0.9077 ------ ------ ------- 0.8648 ------- ------- 0.9834 ------- 0.9831 ------- -------Composition
CO2 % weight 13.64 91.57 5.45 1.40 91.57 92.25 13.23 2.29 86.27 0.80 95.10 0.24 93.72Water % weight 82.07 0.70 0.04 98.58 0.70 0.11 0.02 97.71 0.63 0.01 4.60 99.74 3.98
N2 % weight 0.01 0.08 0.00 0.00 0.08 0.08 0.00 0.00 0.02 0.00 0.00 0.00 0.01O2 % weight 0.00 0.00 0.00 0.00 0.00 0.00 0.00 0.00 0.00 0.00 0.00 0.00 0.00C1 % weight 0.29 2.15 0.06 0.00 2.15 2.16 0.12 0.00 1.06 0.00 0.00 0.00 0.17C2 % weight 0.41 2.96 0.26 0.00 2.96 2.98 0.72 0.00 3.89 0.06 0.00 0.00 0.61C3 % weight 0.14 1.01 0.21 0.00 1.01 1.02 0.71 0.00 2.40 0.09 0.00 0.00 0.38C4 % weight 0.08 0.53 0.27 0.00 0.53 0.53 1.11 0.00 1.82 0.18 0.00 0.00 0.29
C5+ % weight 3.36 1.01 93.70 0.02 1.01 0.86 84.09 0.00 3.90 98.86 0.29 0.02 0.85
017935017935-49-10-HM-001
HEAT AND MATERIAL BALANCE
1 of 3
AERI CO2 ENHANCED HYDROCARBON RECOVERY STUDY. CASE 1 - NO CO2 SEPARATION
ARCClient:
ENHANCED HYDROCARBON RECOVERY STUDY (FINAL)Prepared for: Alberta Research Council (ARC) Rev. 1 Project 017935, September, 2008 App 2-12 Chemicals and Petroleum

Rev./Date By Checked ApprovedA / Mar. 2008 VC SA BF
Preoject: B / Sep. 2008 SA DM BFDoc. #:Page
Stream Number Units 14 15 16 17 18 19 20 21 22 23 24 25 26
Stream Description LP Produced Gas to Train A
HP Produced Gas to Train A
1st stage LP Compressor
Suction
1st stage LP Compressor Discharge
Cooled 1st stage LP Compressor
Discharge
2nd stage LP Compressor
Suction
2nd stage LP Compressor Discharge
Cooled 2nd stage LP
Compressor Discharge
HP Produced Gas Waste Water 1st Stage Waste
Water2nd Stage
Waste Water
1st Stage HP Compressor Discharge
Vapor Weight Fraction 0.925 1.000 1.000 1.000 0.989 1.000 1.000 0.995 1.000 0.000 0.000 0.000 1.000Temperature ºC 40 40 40 123.2 40 40 134.8 40 40 40 40 40 116.7Pressure kPag 298 2643 298 916 881 881 2678 2643 2643 298 881 2643 6263Molar Rate kg-mol/hr 238.3 2600 220.3 220.3 220.3 217.9 217.9 217.9 2816.6 21.5 3.6 1.1 2816.6Mass Rate Ton/hr 9.92 109.2 9.58 9.58 9.58 9.51 9.51 9.51 118.65 0.41 0.07 0.02 118.65Actual Volumetric Flow Am3/hr 1408.38 2133.6 1406.23 697.48 549.42 549.33 251.67 176.79 2309.73 0.41 0.07 0.03 1239.18Standard Volumetric Flow Sm3/hr ------- 61500 5210 5210 ------- 5150 5150 ------- 66650 0 0 0 66650Enthalpy GJ/h -0.090 -0.930 -0.084 -0.084 -0.085 -0.084 -0.083 -0.084 -1.013 -0.006 -0.001 0.000 -1.006Molecular Weight 41.61 41.99 43.47 43.47 43.47 43.65 43.65 43.65 42.13 18.85 20.16 21.64 42.13Actual Density kg/m3 7.04 51.17 6.81 13.73 17.43 17.35 37.87 53.91 51.37 981.70 963.10 955.90 95.75Dynamic Viscosity cP ------- 0.016 0.015 0.020 ------- 0.015 0.021 ------- 0.016 0.771 0.869 0.930 0.021Thermal Conductivity W/m-ºC ------- 0.022 0.019 0.026 ------- 0.019 0.028 ------- 0.022 0.580 0.509 0.434 0.031Specific Heat kJ/kg-ºC ------- 1.140 0.927 0.995 ------- 0.953 1.053 ------- 1.136 4.201 4.026 3.814 1.269Surface Tension dyne/cm ------- ------ ------- ------- ------- ------- ------- ------- ------- 59.87 59.42 58.47 -------Compressibility ------- 0.8648 0.9801 0.9772 ------- 0.9513 0.9461 ------- 0.8644 ------- ------- ------- 0.8638Composition
CO2 % weight 93.72 92.25 96.97 96.97 96.97 97.46 97.46 97.46 92.69 0.47 1.45 4.94 92.69Water % weight 3.98 0.11 0.76 0.76 0.76 0.31 0.31 0.31 0.11 94.67 86.86 78.35 0.11
N2 % weight 0.01 0.08 0.01 0.01 0.01 0.01 0.01 0.01 0.07 0.00 0.00 0.00 0.07O2 % weight 0.00 0.00 0.00 0.00 0.00 0.00 0.00 0.00 0.00 0.00 0.00 0.00 0.00C1 % weight 0.17 2.16 0.17 0.17 0.17 0.18 0.18 0.18 2.00 0.00 0.00 0.00 2.00C2 % weight 0.61 2.98 0.64 0.64 0.64 0.64 0.64 0.64 2.79 0.00 0.01 0.03 2.79C3 % weight 0.38 1.02 0.39 0.39 0.39 0.39 0.39 0.39 0.97 0.00 0.01 0.06 0.97C4 % weight 0.29 0.53 0.30 0.30 0.30 0.30 0.30 0.30 0.51 0.00 0.03 0.13 0.51
C5+ % weight 0.85 0.86 0.76 0.76 0.76 0.72 0.72 0.72 0.85 4.86 11.64 16.48 0.85
AERI CO2 ENHANCED HYDROCARBON RECOVERY STUDY. CASE 1 - NO CO2 SEPARATION
017935017935-49-10-HM-001
Client: ARCHEAT AND MATERIAL BALANCE
2 of 3
ENHANCED HYDROCARBON RECOVERY STUDY (FINAL)Prepared for: Alberta Research Council (ARC) Rev. 1 Project 017935, September, 2008 App 2-13 Chemicals and Petroleum
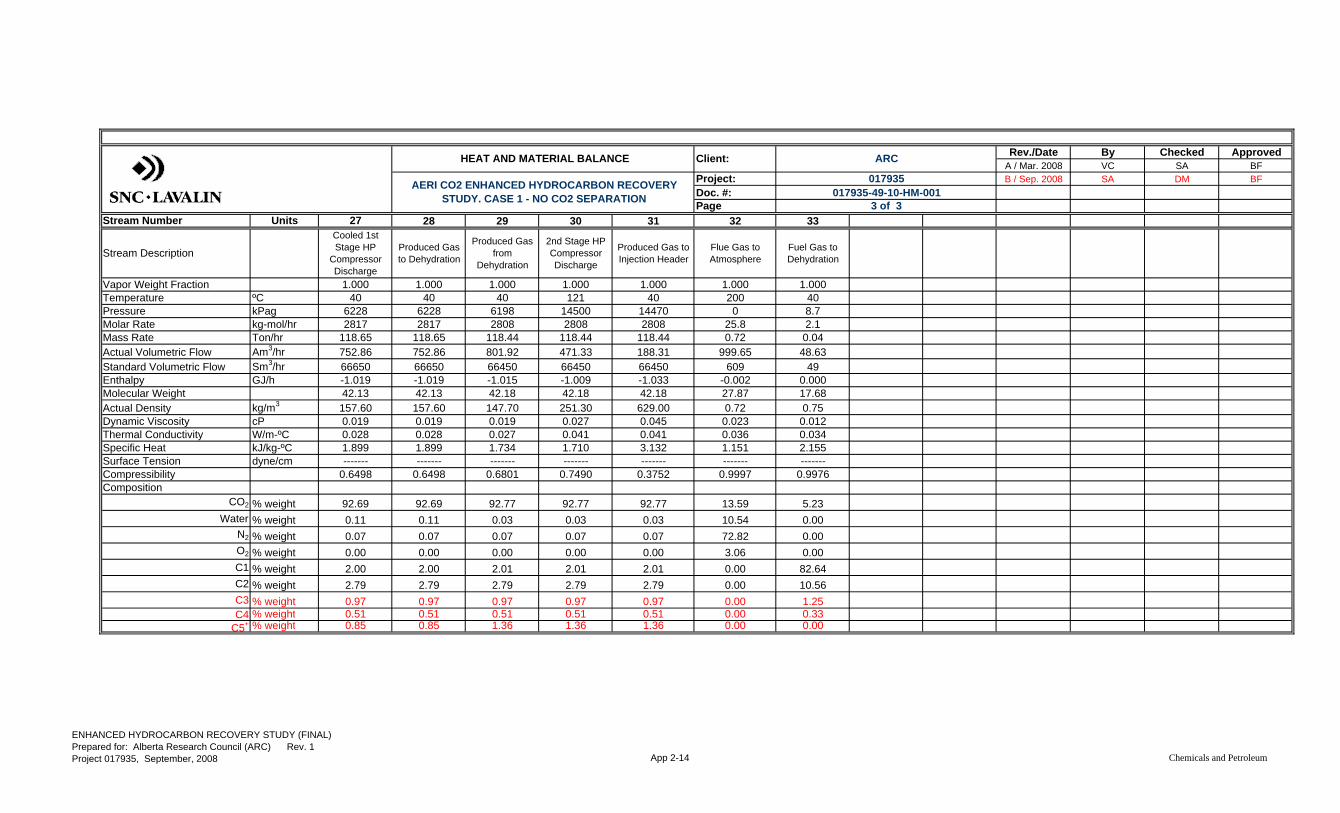
Rev./Date By Checked ApprovedA / Mar. 2008 VC SA BF
Project: B / Sep. 2008 SA DM BFDoc. #:Page
Stream Number Units 27 28 29 30 31 32 33
Stream Description
Cooled 1st Stage HP
Compressor Discharge
Produced Gas to Dehydration
Produced Gas from
Dehydration
2nd Stage HP Compressor Discharge
Produced Gas to Injection Header
Flue Gas to Atmosphere
Fuel Gas to Dehydration
Vapor Weight Fraction 1.000 1.000 1.000 1.000 1.000 1.000 1.000Temperature ºC 40 40 40 121 40 200 40Pressure kPag 6228 6228 6198 14500 14470 0 8.7Molar Rate kg-mol/hr 2817 2817 2808 2808 2808 25.8 2.1Mass Rate Ton/hr 118.65 118.65 118.44 118.44 118.44 0.72 0.04Actual Volumetric Flow Am3/hr 752.86 752.86 801.92 471.33 188.31 999.65 48.63Standard Volumetric Flow Sm3/hr 66650 66650 66450 66450 66450 609 49Enthalpy GJ/h -1.019 -1.019 -1.015 -1.009 -1.033 -0.002 0.000Molecular Weight 42.13 42.13 42.18 42.18 42.18 27.87 17.68Actual Density kg/m3 157.60 157.60 147.70 251.30 629.00 0.72 0.75Dynamic Viscosity cP 0.019 0.019 0.019 0.027 0.045 0.023 0.012Thermal Conductivity W/m-ºC 0.028 0.028 0.027 0.041 0.041 0.036 0.034Specific Heat kJ/kg-ºC 1.899 1.899 1.734 1.710 3.132 1.151 2.155Surface Tension dyne/cm ------- ------- ------- ------- ------- ------- -------Compressibility 0.6498 0.6498 0.6801 0.7490 0.3752 0.9997 0.9976Composition
CO2 % weight 92.69 92.69 92.77 92.77 92.77 13.59 5.23Water % weight 0.11 0.11 0.03 0.03 0.03 10.54 0.00
N2 % weight 0.07 0.07 0.07 0.07 0.07 72.82 0.00O2 % weight 0.00 0.00 0.00 0.00 0.00 3.06 0.00C1 % weight 2.00 2.00 2.01 2.01 2.01 0.00 82.64C2 % weight 2.79 2.79 2.79 2.79 2.79 0.00 10.56C3 % weight 0.97 0.97 0.97 0.97 0.97 0.00 1.25C4 % weight 0.51 0.51 0.51 0.51 0.51 0.00 0.33
C5+ % weight 0.85 0.85 1.36 1.36 1.36 0.00 0.00
017935017935-49-10-HM-001
HEAT AND MATERIAL BALANCE
3 of 3
Client: ARC
AERI CO2 ENHANCED HYDROCARBON RECOVERY STUDY. CASE 1 - NO CO2 SEPARATION
ENHANCED HYDROCARBON RECOVERY STUDY (FINAL)Prepared for: Alberta Research Council (ARC) Rev. 1 Project 017935, September, 2008 App 2-14 Chemicals and Petroleum

Rev./Date By Checked ApprovedA / Mar. 2008 VC SA BF
Project: B / Mar. 2008 VC SA BFDoc. #: C / Sep/ 2008 SA DM BFPage
Stream Number Units 1 2 3 4 5 6 7 8 9 10 11 12 13
Stream Description Oil Emulsion from Header Produced Gas Recovered Oil
EmulsionRecovered
WaterCooled Produced
GasHP Produced Gas
to DehydrationV-002
Separated Oil
V-002 Separated
Water
LP Produced Gas from
V-003Oil Emulsion
LP Produced Gas from V-
004Produced Water LP Produced
Gas
Vapor Weight Fraction 0.123 1.0 0.0 0.0 0.99 1.0 0.0 0.0 1.0 0.0 1.0 0.0 0.9Temperature ºC 80 80 80 80 40 40 40 40 76 76 79 79 40Pressure kPag 4953 2678 2678 2678 2678 2643 2643 2643 333 333 333 333 298Molar Rate kg-mol/hr 80690 5277 363 75050 5277 5200 4.48 72.80 72.28 295 404 74719 477Mass Rate Ton/hr 1640 220 56 1363 220 218 0.39 1.33 3.12 53 17 1348 20Actual Volumetric Flow Am3/hr 3841 5047 72 1409 4269 4267 0.50 1.33 474 69 2678 1396 2817Standard Volumetric Flow Sm3/hr ------- 124800 67 1340 ------- 123000 0.48 1.31 1709 817 9556 1328 -------Enthalpy GJ/h -23.217 -1.868 -0.137 -21.201 -1.881 -1.859 -0.001 -0.021 -0.025 -0.113 -0.152 -21.070 -0.179Molecular Weight 20.320 41.700 154.700 18.170 41.700 41.990 88.190 18.260 43.050 181.000 41.330 18.040 41.610Actual Density kg/m3 426.900 43.600 776.500 968.000 51.550 51.170 793.100 999.990 6.563 770.200 6.238 965.500 7.044Dynamic Viscosity cP ------- 0.018 1.349 0.367 ------- 0.016 0.530 0.674 0.016 1.773 0.016 0.355 -------Thermal Conductivity W/m-ºC ------- 0.025 0.111 0.663 ------- 0.022 0.103 0.621 0.022 0.134 0.022 0.669 -------Specific Heat kJ/kg-ºC ------- 1.127 2.293 4.315 ------- 1.140 1.230 4.256 1.057 2.312 0.974 4.350 -------Surface Tension dyne/cm ------- ------- 16.740 62.160 ------- ------ 15.900 68.830 ------ 20.700 ------ 62.420 -------Compressibility ------- 0.908 ------ ------ ------- 0.865 ------- ------- 0.983 ------- 0.983 ------- -------Composition
CO2 % weight 13.64 91.57 5.45 1.40 91.57 92.25 13.23 2.29 86.27 0.80 95.10 0.24 93.72Water % weight 82.07 0.70 0.04 98.58 0.70 0.11 0.02 97.71 0.63 0.01 4.60 99.74 3.98
N2 % weight 0.01 0.08 0.00 0.00 0.08 0.08 0.00 0.00 0.02 0.00 0.00 0.00 0.01O2 % weight 0.00 0.00 0.00 0.00 0.00 0.00 0.00 0.00 0.00 0.00 0.00 0.00 0.00C1 % weight 0.29 2.15 0.06 0.00 2.15 2.16 0.12 0.00 1.06 0.00 0.00 0.00 0.17C2 % weight 0.41 2.96 0.26 0.00 2.96 2.98 0.72 0.00 3.89 0.06 0.00 0.00 0.61C3 % weight 0.14 1.01 0.21 0.00 1.01 1.02 0.71 0.00 2.40 0.09 0.00 0.00 0.38
017935017935-49-20-HM-001
HEAT AND MATERIAL BALANCE
1 of 5
AERI CO2 ENHANCED HYDROCARBON RECOVERY STUDY. CASE 1 - CO2 SEPARATION
ARCClient:
ENHANCED HYDROCARBON RECOVERY STUDY (FINAL)Prepared for: Alberta Research Council (ARC) Rev. 1 Project 017935, September, 2008 App 2-15 Chemicals and Petroleum
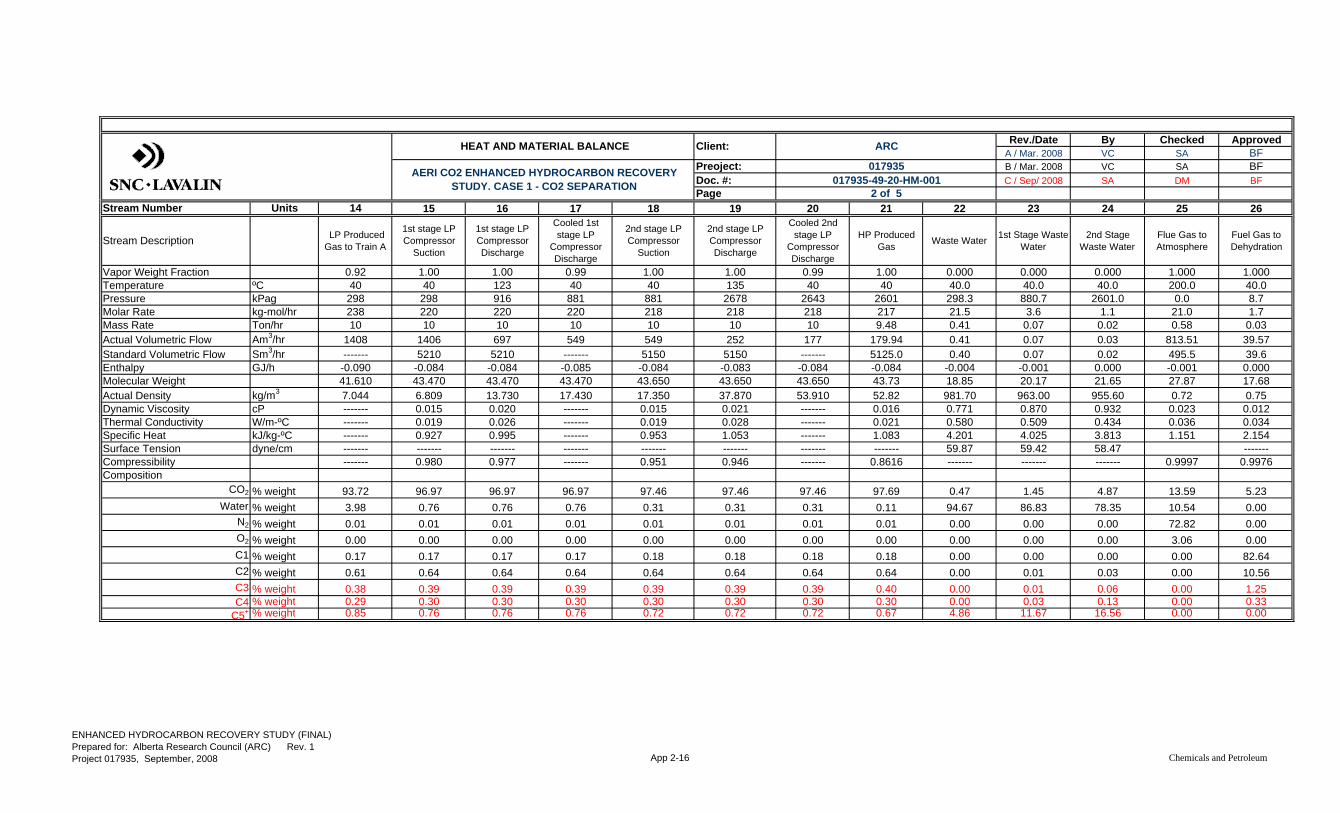
Rev./Date By Checked ApprovedA / Mar. 2008 VC SA BF
Preoject: B / Mar. 2008 VC SA BFDoc. #: C / Sep/ 2008 SA DM BFPage
Stream Number Units 14 15 16 17 18 19 20 21 22 23 24 25 26
Stream Description LP Produced Gas to Train A
1st stage LP Compressor
Suction
1st stage LP Compressor Discharge
Cooled 1st stage LP
Compressor Discharge
2nd stage LP Compressor
Suction
2nd stage LP Compressor Discharge
Cooled 2nd stage LP
Compressor Discharge
HP Produced Gas Waste Water 1st Stage Waste
Water2nd Stage
Waste WaterFlue Gas to Atmosphere
Fuel Gas to Dehydration
Vapor Weight Fraction 0.92 1.00 1.00 0.99 1.00 1.00 0.99 1.00 0.000 0.000 0.000 1.000 1.000Temperature ºC 40 40 123 40 40 135 40 40 40.0 40.0 40.0 200.0 40.0Pressure kPag 298 298 916 881 881 2678 2643 2601 298.3 880.7 2601.0 0.0 8.7Molar Rate kg-mol/hr 238 220 220 220 218 218 218 217 21.5 3.6 1.1 21.0 1.7Mass Rate Ton/hr 10 10 10 10 10 10 10 9.48 0.41 0.07 0.02 0.58 0.03Actual Volumetric Flow Am3/hr 1408 1406 697 549 549 252 177 179.94 0.41 0.07 0.03 813.51 39.57Standard Volumetric Flow Sm3/hr ------- 5210 5210 ------- 5150 5150 ------- 5125.0 0.40 0.07 0.02 495.5 39.6Enthalpy GJ/h -0.090 -0.084 -0.084 -0.085 -0.084 -0.083 -0.084 -0.084 -0.004 -0.001 0.000 -0.001 0.000Molecular Weight 41.610 43.470 43.470 43.470 43.650 43.650 43.650 43.73 18.85 20.17 21.65 27.87 17.68Actual Density kg/m3 7.044 6.809 13.730 17.430 17.350 37.870 53.910 52.82 981.70 963.00 955.60 0.72 0.75Dynamic Viscosity cP ------- 0.015 0.020 ------- 0.015 0.021 ------- 0.016 0.771 0.870 0.932 0.023 0.012Thermal Conductivity W/m-ºC ------- 0.019 0.026 ------- 0.019 0.028 ------- 0.021 0.580 0.509 0.434 0.036 0.034Specific Heat kJ/kg-ºC ------- 0.927 0.995 ------- 0.953 1.053 ------- 1.083 4.201 4.025 3.813 1.151 2.154Surface Tension dyne/cm ------- ------- ------- ------- ------- ------- ------- ------- 59.87 59.42 58.47 -------Compressibility ------- 0.980 0.977 ------- 0.951 0.946 ------- 0.8616 ------- ------- ------- 0.9997 0.9976Composition
CO2 % weight 93.72 96.97 96.97 96.97 97.46 97.46 97.46 97.69 0.47 1.45 4.87 13.59 5.23Water % weight 3.98 0.76 0.76 0.76 0.31 0.31 0.31 0.11 94.67 86.83 78.35 10.54 0.00
N2 % weight 0.01 0.01 0.01 0.01 0.01 0.01 0.01 0.01 0.00 0.00 0.00 72.82 0.00O2 % weight 0.00 0.00 0.00 0.00 0.00 0.00 0.00 0.00 0.00 0.00 0.00 3.06 0.00C1 % weight 0.17 0.17 0.17 0.17 0.18 0.18 0.18 0.18 0.00 0.00 0.00 0.00 82.64C2 % weight 0.61 0.64 0.64 0.64 0.64 0.64 0.64 0.64 0.00 0.01 0.03 0.00 10.56C3 % weight 0.38 0.39 0.39 0.39 0.39 0.39 0.39 0.40 0.00 0.01 0.06 0.00 1.25C4 % weight 0.29 0.30 0.30 0.30 0.30 0.30 0.30 0.30 0.00 0.03 0.13 0.00 0.33
C5+ % weight 0.85 0.76 0.76 0.76 0.72 0.72 0.72 0.67 4.86 11.67 16.56 0.00 0.00
AERI CO2 ENHANCED HYDROCARBON RECOVERY STUDY. CASE 1 - CO2 SEPARATION
017935017935-49-20-HM-001
Client: ARCHEAT AND MATERIAL BALANCE
2 of 5
ENHANCED HYDROCARBON RECOVERY STUDY (FINAL)Prepared for: Alberta Research Council (ARC) Rev. 1 Project 017935, September, 2008 App 2-16 Chemicals and Petroleum
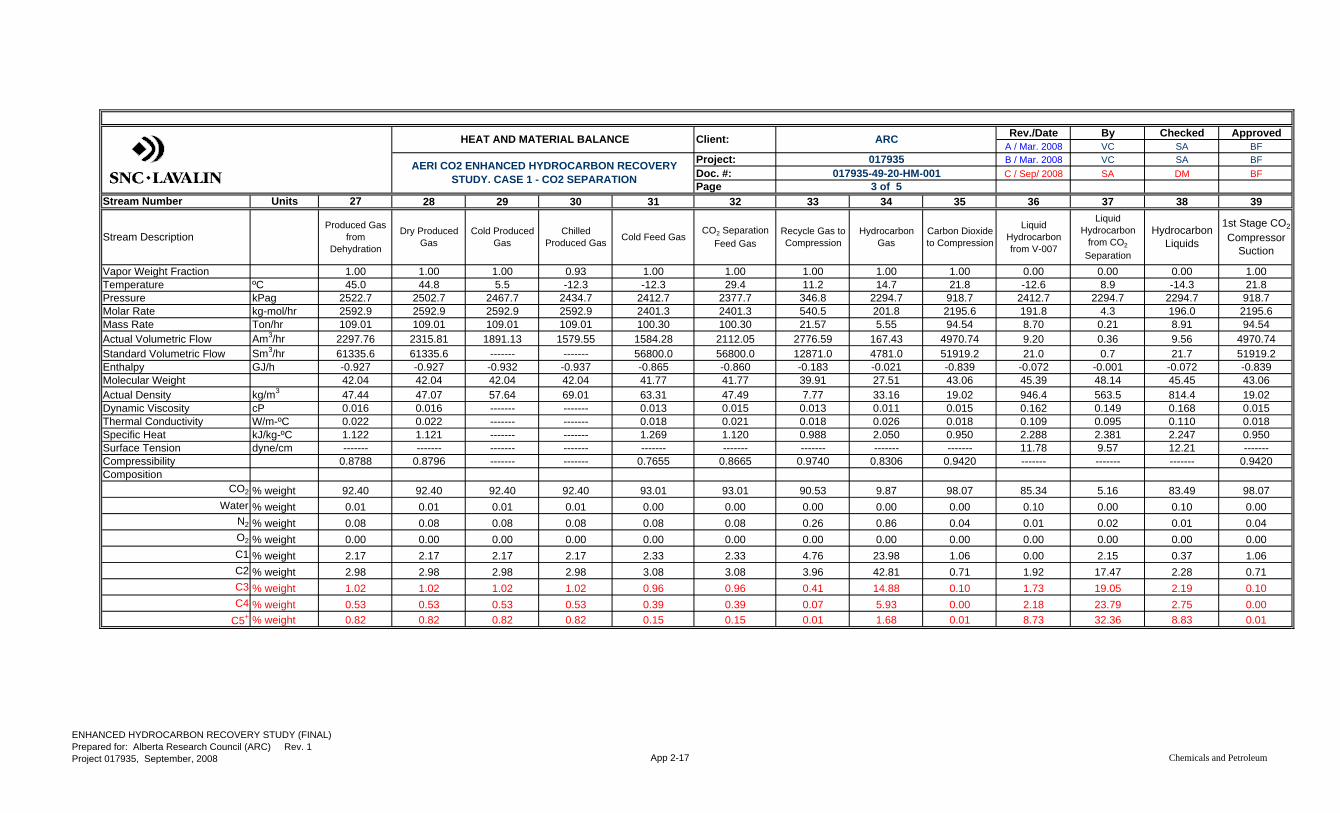
Rev./Date By Checked ApprovedA / Mar. 2008 VC SA BF
Project: B / Mar. 2008 VC SA BFDoc. #: C / Sep/ 2008 SA DM BFPage
Stream Number Units 27 28 29 30 31 32 33 34 35 36 37 38 39
Stream DescriptionProduced Gas
from Dehydration
Dry Produced Gas
Cold Produced Gas
Chilled Produced Gas Cold Feed Gas
CO2 Separation Feed Gas
Recycle Gas to Compression
Hydrocarbon Gas
Carbon Dioxide to Compression
Liquid Hydrocarbon from V-007
Liquid Hydrocarbon
from CO2
Separation
Hydrocarbon Liquids
1st Stage CO2
Compressor Suction
Vapor Weight Fraction 1.00 1.00 1.00 0.93 1.00 1.00 1.00 1.00 1.00 0.00 0.00 0.00 1.00Temperature ºC 45.0 44.8 5.5 -12.3 -12.3 29.4 11.2 14.7 21.8 -12.6 8.9 -14.3 21.8Pressure kPag 2522.7 2502.7 2467.7 2434.7 2412.7 2377.7 346.8 2294.7 918.7 2412.7 2294.7 2294.7 918.7Molar Rate kg-mol/hr 2592.9 2592.9 2592.9 2592.9 2401.3 2401.3 540.5 201.8 2195.6 191.8 4.3 196.0 2195.6Mass Rate Ton/hr 109.01 109.01 109.01 109.01 100.30 100.30 21.57 5.55 94.54 8.70 0.21 8.91 94.54Actual Volumetric Flow Am3/hr 2297.76 2315.81 1891.13 1579.55 1584.28 2112.05 2776.59 167.43 4970.74 9.20 0.36 9.56 4970.74Standard Volumetric Flow Sm3/hr 61335.6 61335.6 ------- ------- 56800.0 56800.0 12871.0 4781.0 51919.2 21.0 0.7 21.7 51919.2Enthalpy GJ/h -0.927 -0.927 -0.932 -0.937 -0.865 -0.860 -0.183 -0.021 -0.839 -0.072 -0.001 -0.072 -0.839Molecular Weight 42.04 42.04 42.04 42.04 41.77 41.77 39.91 27.51 43.06 45.39 48.14 45.45 43.06Actual Density kg/m3 47.44 47.07 57.64 69.01 63.31 47.49 7.77 33.16 19.02 946.4 563.5 814.4 19.02Dynamic Viscosity cP 0.016 0.016 ------- ------- 0.013 0.015 0.013 0.011 0.015 0.162 0.149 0.168 0.015Thermal Conductivity W/m-ºC 0.022 0.022 ------- ------- 0.018 0.021 0.018 0.026 0.018 0.109 0.095 0.110 0.018Specific Heat kJ/kg-ºC 1.122 1.121 ------- ------- 1.269 1.120 0.988 2.050 0.950 2.288 2.381 2.247 0.950Surface Tension dyne/cm ------- ------- ------- ------- ------- ------- ------- ------- ------- 11.78 9.57 12.21 -------Compressibility 0.8788 0.8796 ------- ------- 0.7655 0.8665 0.9740 0.8306 0.9420 ------- ------- ------- 0.9420Composition
CO2 % weight 92.40 92.40 92.40 92.40 93.01 93.01 90.53 9.87 98.07 85.34 5.16 83.49 98.07Water % weight 0.01 0.01 0.01 0.01 0.00 0.00 0.00 0.00 0.00 0.10 0.00 0.10 0.00
N2 % weight 0.08 0.08 0.08 0.08 0.08 0.08 0.26 0.86 0.04 0.01 0.02 0.01 0.04O2 % weight 0.00 0.00 0.00 0.00 0.00 0.00 0.00 0.00 0.00 0.00 0.00 0.00 0.00C1 % weight 2.17 2.17 2.17 2.17 2.33 2.33 4.76 23.98 1.06 0.00 2.15 0.37 1.06C2 % weight 2.98 2.98 2.98 2.98 3.08 3.08 3.96 42.81 0.71 1.92 17.47 2.28 0.71C3 % weight 1.02 1.02 1.02 1.02 0.96 0.96 0.41 14.88 0.10 1.73 19.05 2.19 0.10C4 % weight 0.53 0.53 0.53 0.53 0.39 0.39 0.07 5.93 0.00 2.18 23.79 2.75 0.00
C5+ % weight 0.82 0.82 0.82 0.82 0.15 0.15 0.01 1.68 0.01 8.73 32.36 8.83 0.01
017935017935-49-20-HM-001
HEAT AND MATERIAL BALANCE
3 of 5
Client: ARC
AERI CO2 ENHANCED HYDROCARBON RECOVERY STUDY. CASE 1 - CO2 SEPARATION
ENHANCED HYDROCARBON RECOVERY STUDY (FINAL)Prepared for: Alberta Research Council (ARC) Rev. 1 Project 017935, September, 2008 App 2-17 Chemicals and Petroleum

Rev./Date By Checked ApprovedA / Mar. 2008 VC SA BF
Project: B / Mar. 2008 VC SA BFDoc. #: C / Sep/ 2008 SA DM BFPage
Stream Number Units 40 41 42 43 44 45 46 47 48 49 50 51 52
Stream Description1st Stage CO2
Compressor Discharge
Cooled 1st Stage CO2
Compressor Discharge
2nd Stage CO2
LP Compressor Suction
2nd Stage CO2
Compressor Discharge
Cooled 2nd Stage CO2 Compressor
Discharge
3rd Stage CO2
Compressor Suction
3rd Stage CO2
Compressor Discharge
Carbon Dioxide to Injection
1st Stage Recycle
Compressor Suction
1st Stage Recycle
Compressor Discharge
Cooled 1st Stage Recycle Compressor Discharge
2nd Stage Recycle
Compressor Suction
2nd Stage Recycle
Compressor Discharge
Vapor Weight Fraction 1.000 1.000 1.000 1.000 1.000 1.000 1.000 0.000 1.000 1.000 1.000 1.000 1.000Temperature ºC 109.4 40.0 40.0 137.9 40.0 40.0 94.7 40.0 11.170 84.2 48.9 48.9 137.8Pressure kPag 2635.7 2600.7 2600.7 7427.7 7392.7 7392.7 14498.7 14468.7 347 930.0 902.4 902.4 2419.0Molar Rate kg-mol/hr 2195.6 2195.6 2412.4 2411.9 2411.9 2411.9 2411.9 2411.9 541 540.5 540.5 540.5 540.5Mass Rate Ton/hr 94.54 94.54 104.02 104.02 104.02 104.02 104.02 104.02 22 21.57 21.57 21.57 21.57Actual Volumetric Flow Am3/hr 2392 1841 2021 957 469 469 329 151 2777 1513 1384.53 1384.53 702.64Standard Volumetric Flow Sm3/hr 51919 51919 57044 57069 57069 57069 57069 57069 12871 12871 12871.0 12871.0 12871.0Enthalpy GJ/h -0.831 -0.838 -0.923 -0.913 -0.929 -0.929 -0.925 -0.942 -0.183 -0.181 -0.182 -0.182 -0.180Molecular Weight 43.06 43.06 43.13 43.13 43.13 43.13 43.13 43.13 39.910 39.91 39.91 39.91 39.91Actual Density kg/m3 39.59 51.44 51.56 108.70 221.80 221.80 316.60 687.30 7.769 14.26 15.6 15.6 30.70Dynamic Viscosity cP 0.020 0.016 0.016 0.023 0.021 0.021 0.029 0.048 0.013 0.017 0.015 0.015 0.020Thermal Conductivity W/m-ºC 0.026 0.021 0.021 0.032 0.031 0.031 0.043 0.039 0.018 0.025 0.022 0.022 0.030Specific Heat kJ/kg-ºC 1.045 1.075 1.076 1.215 2.709 2.709 2.042 3.145 0.988 1.067 1.044 1.044 1.147Surface Tension dyne/cm ------- ------- ------- ------- ------- ------- ------- ------- ------- ------- ------- ------- -------Compressibility 0.9360 0.8687 0.8680 0.8742 0.5598 0.5598 0.6505 ------- 0.974 0.9714 0.9604 0.9604 0.9591Composition 0.000
CO2 % weight 98.07 98.07 98.04 98.04 98.04 98.04 98.04 98.04 90.53 90.53 90.53 90.53 90.53Water % weight 0.00 0.00 0.01 0.01 0.01 0.01 0.01 0.01 0.00 0.00 0.00 0.00 0.00
N2 % weight 0.04 0.04 0.04 0.04 0.04 0.04 0.04 0.04 0.26 0.26 0.26 0.26 0.26O2 % weight 0.00 0.00 0.00 0.00 0.00 0.00 0.00 0.00 0.00 0.00 0.00 0.00 0.00C1 % weight 1.06 1.06 0.98 0.98 0.98 0.98 0.98 0.98 4.76 4.76 4.76 4.76 4.76C2 % weight 0.71 0.71 0.71 0.71 0.71 0.71 0.71 0.71 3.96 3.96 3.96 3.96 3.96C3 % weight 0.10 0.10 0.13 0.13 0.13 0.13 0.13 0.13 0.41 0.41 0.41 0.41 0.41C4 % weight 0.00 0.00 0.03 0.03 0.03 0.03 0.03 0.03 0.07 0.07 0.07 0.07 0.07
C5+ % weight 0.01 0.01 0.06 0.06 0.06 0.06 0.06 0.06 0.01 0.01 0.01 0.01 0.01
HEAT AND MATERIAL BALANCE Client: ARC
AERI CO2 ENHANCED HYDROCARBON RECOVERY STUDY. CASE 1 - CO2 SEPARATION
017935017935-49-20-HM-001
4 of 5
ENHANCED HYDROCARBON RECOVERY STUDY (FINAL)Prepared for: Alberta Research Council (ARC) Rev. 1 Project 017935, September, 2008 App 2-18 Chemicals and Petroleum
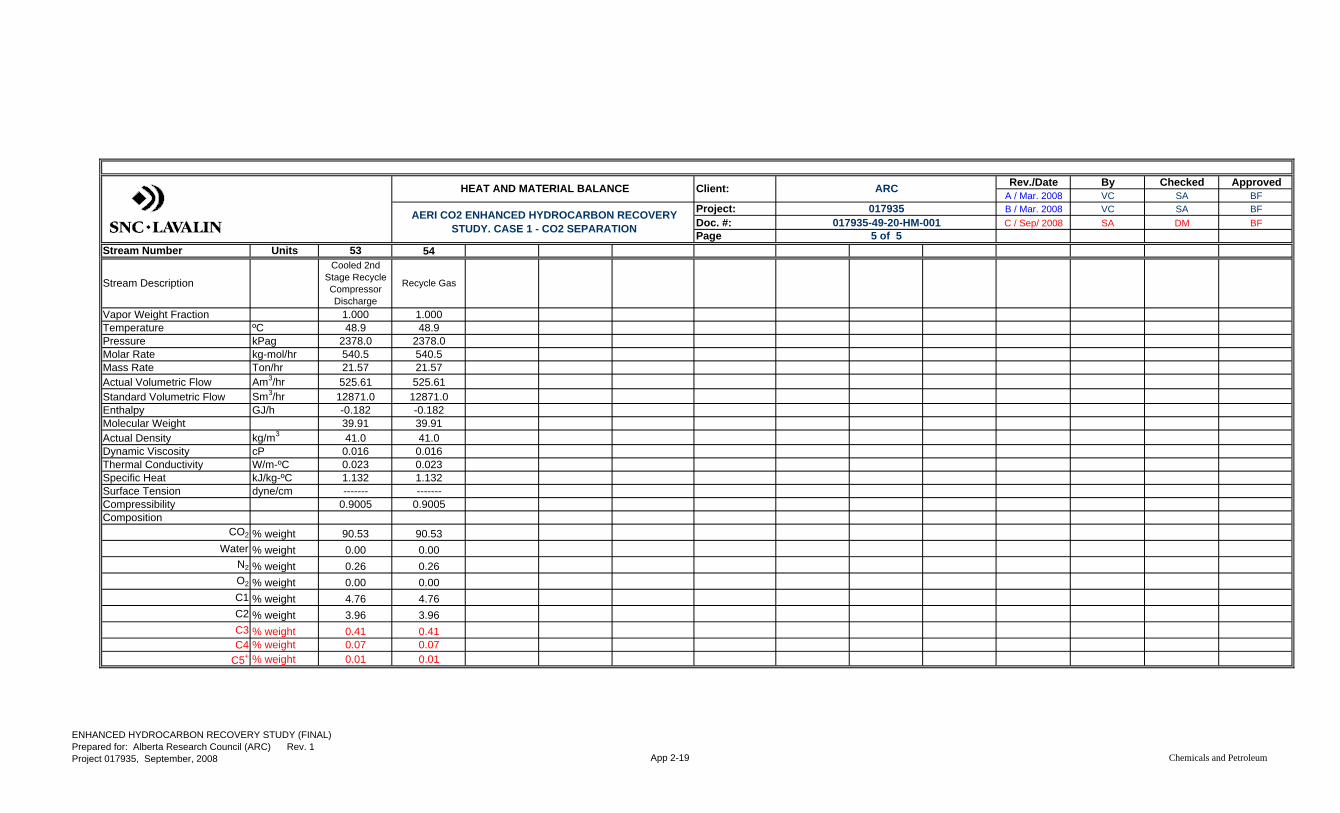
Rev./Date By Checked ApprovedA / Mar. 2008 VC SA BF
Project: B / Mar. 2008 VC SA BFDoc. #: C / Sep/ 2008 SA DM BFPage
Stream Number Units 53 54
Stream Description
Cooled 2nd Stage Recycle Compressor Discharge
Recycle Gas
Vapor Weight Fraction 1.000 1.000Temperature ºC 48.9 48.9Pressure kPag 2378.0 2378.0Molar Rate kg-mol/hr 540.5 540.5Mass Rate Ton/hr 21.57 21.57Actual Volumetric Flow Am3/hr 525.61 525.61Standard Volumetric Flow Sm3/hr 12871.0 12871.0Enthalpy GJ/h -0.182 -0.182Molecular Weight 39.91 39.91Actual Density kg/m3 41.0 41.0Dynamic Viscosity cP 0.016 0.016Thermal Conductivity W/m-ºC 0.023 0.023Specific Heat kJ/kg-ºC 1.132 1.132Surface Tension dyne/cm ------- -------Compressibility 0.9005 0.9005Composition
CO2 % weight 90.53 90.53Water % weight 0.00 0.00
N2 % weight 0.26 0.26O2 % weight 0.00 0.00C1 % weight 4.76 4.76C2 % weight 3.96 3.96C3 % weight 0.41 0.41C4 % weight 0.07 0.07
C5+ % weight 0.01 0.01
HEAT AND MATERIAL BALANCE Client: ARC
AERI CO2 ENHANCED HYDROCARBON RECOVERY STUDY. CASE 1 - CO2 SEPARATION
017935017935-49-20-HM-001
5 of 5
ENHANCED HYDROCARBON RECOVERY STUDY (FINAL)Prepared for: Alberta Research Council (ARC) Rev. 1 Project 017935, September, 2008 App 2-19 Chemicals and Petroleum
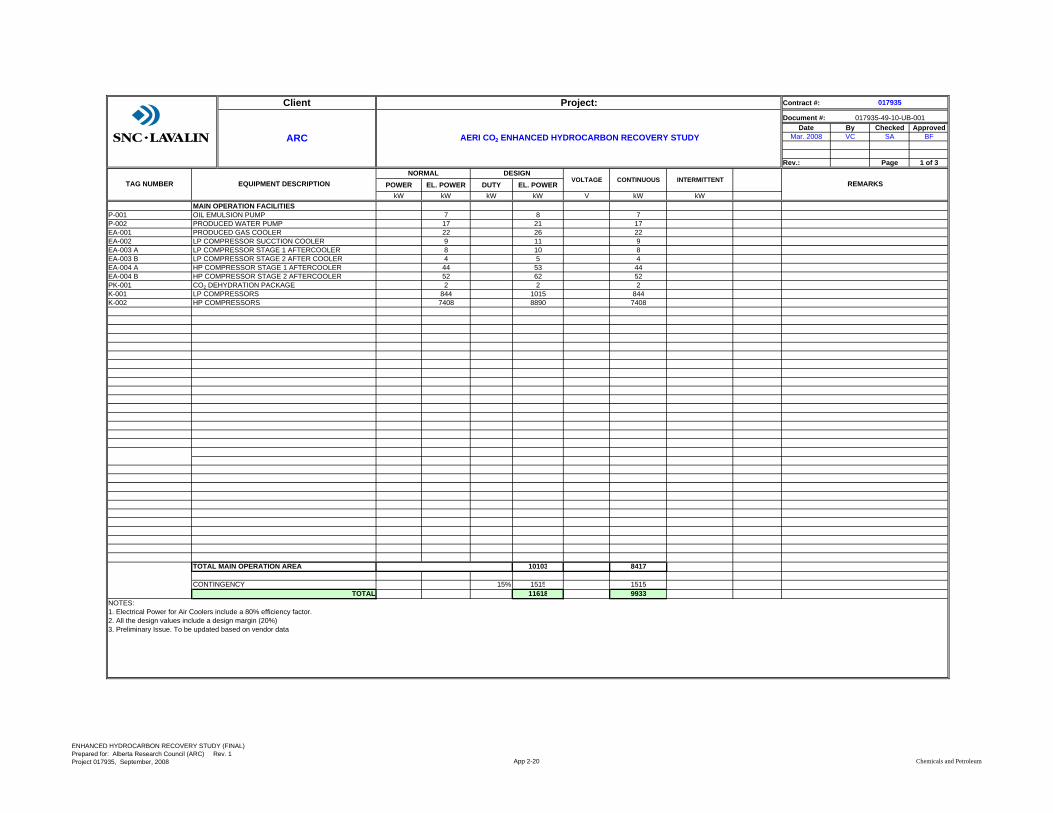
Contract #:
Document #:Date By Checked Approved
Mar. 2008 VC SA BF
Rev.: Page 1 of 3
POWER EL. POWER DUTY EL. POWERkW kW kW kW V kW kW
P-001 7 8 7P-002 17 21 17EA-001 22 26 22EA-002 9 11 9EA-003 A 8 10 8EA-003 B 4 5 4EA-004 A 44 53 44EA-004 B 52 62 52PK-001 2 2 2K-001 844 1015 844K-002 7408 8890 7408
10103 8417
15% 1515 151511618 9933
NOTES:1. Electrical Power for Air Coolers include a 80% efficiency factor.2. All the design values include a design margin (20%)3. Preliminary Issue. To be updated based on vendor data
017935Client
ARC
Project:
AERI CO2 ENHANCED HYDROCARBON RECOVERY STUDY
017935-49-10-UB-001
REMARKSVOLTAGE
PRODUCED GAS COOLER
LP COMPRESSOR STAGE 2 AFTER COOLER
PRODUCED WATER PUMP
NORMAL
CO2 DEHYDRATION PACKAGE
HP COMPRESSORS
OIL EMULSION PUMPMAIN OPERATION FACILITIES
TAG NUMBER EQUIPMENT DESCRIPTION CONTINUOUS INTERMITTENTDESIGN
CONTINGENCY
LP COMPRESSOR SUCCTION COOLER
HP COMPRESSOR STAGE 2 AFTERCOOLER
LP COMPRESSORS
HP COMPRESSOR STAGE 1 AFTERCOOLER
LP COMPRESSOR STAGE 1 AFTERCOOLER
TOTAL
TOTAL MAIN OPERATION AREA
ENHANCED HYDROCARBON RECOVERY STUDY (FINAL)Prepared for: Alberta Research Council (ARC) Rev. 1 Project 017935, September, 2008 App 2-20 Chemicals and Petroleum
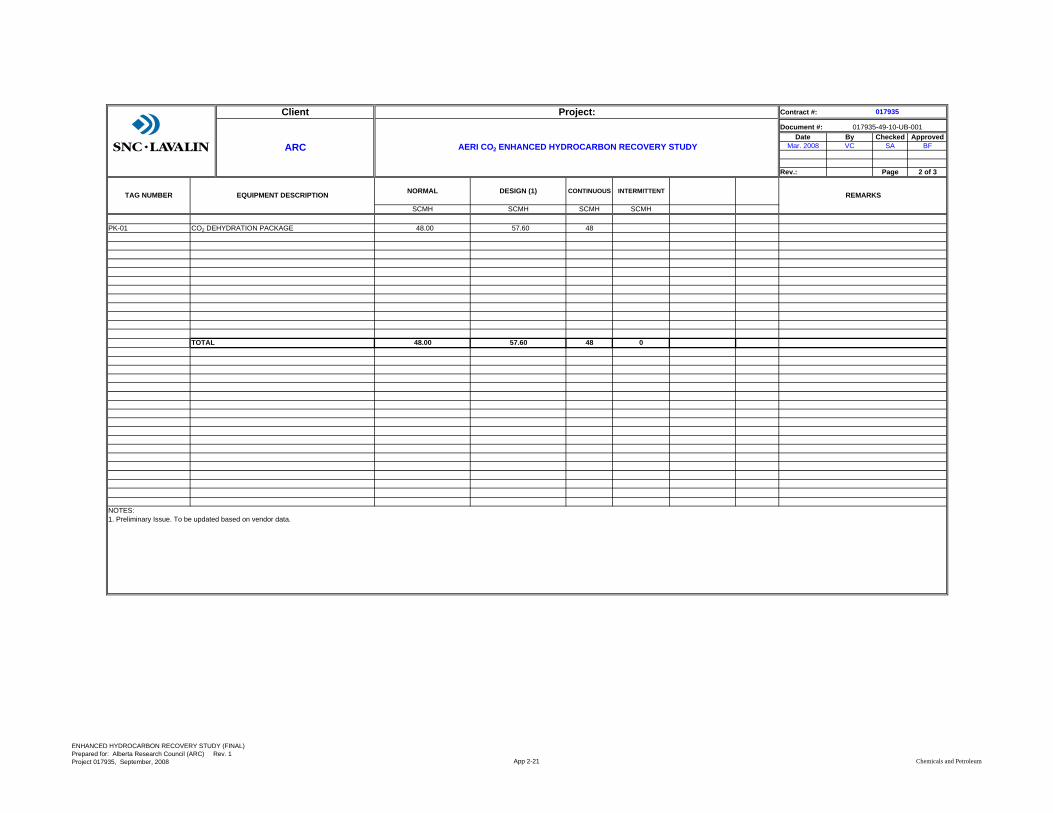
Contract #:
Document #:Date By Checked Approved
Mar. 2008 VC SA BF
Rev.: Page 2 of 3
SCMH SCMH
PK-01 48.00 57.60 48
48 0
NOTES:1. Preliminary Issue. To be updated based on vendor data.
Client Project: 017935
ARC AERI CO2 ENHANCED HYDROCARBON RECOVERY STUDY
017935-49-10-UB-001
CONTINUOUS INTERMITTENT REMARKSTAG NUMBER EQUIPMENT DESCRIPTION
CO2 DEHYDRATION PACKAGE
TOTAL 48.00 57.60
NORMAL DESIGN (1)
SCMH SCMH
ENHANCED HYDROCARBON RECOVERY STUDY (FINAL)Prepared for: Alberta Research Council (ARC) Rev. 1 Project 017935, September, 2008 App 2-21 Chemicals and Petroleum
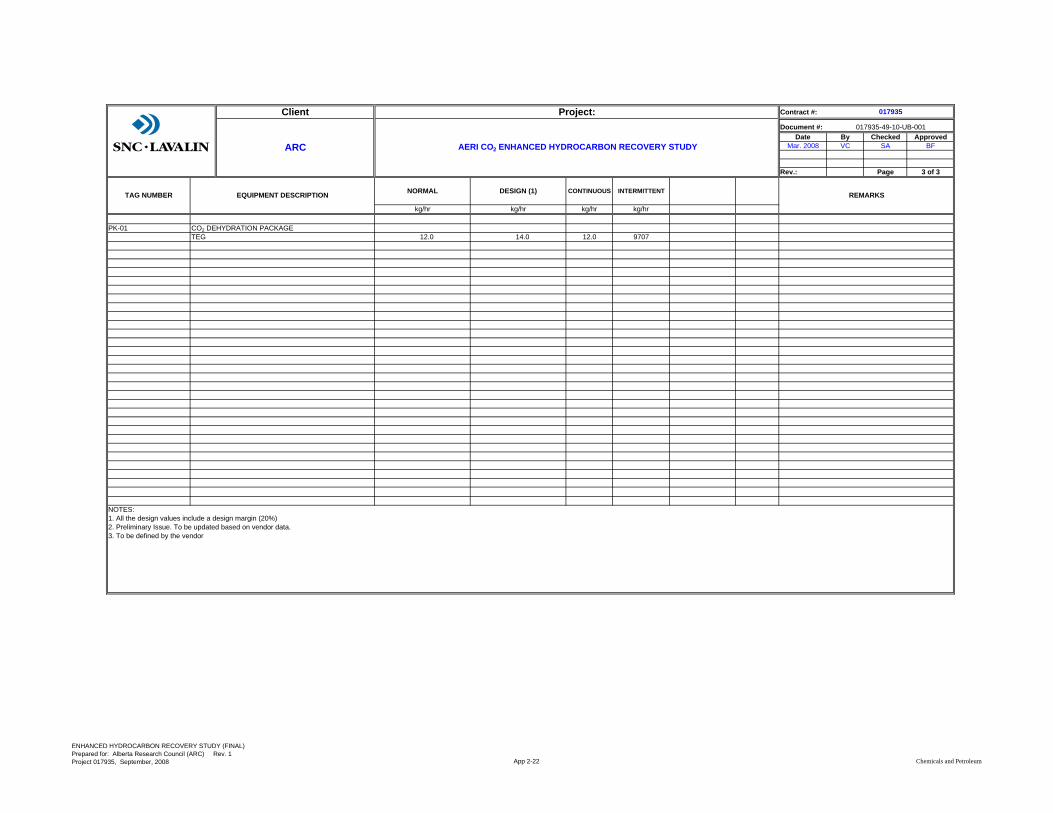
Contract #:
Document #:Date By Checked Approved
Mar. 2008 VC SA BF
Rev.: Page 3 of 3
kg/hr kg/hr
PK-0112.0 14.0 12.0 9707
NOTES:1. All the design values include a design margin (20%)2. Preliminary Issue. To be updated based on vendor data.3. To be defined by the vendor
017935
ARC AERI CO2 ENHANCED HYDROCARBON RECOVERY STUDY
017935-49-10-UB-001
kg/hr
TAG NUMBER EQUIPMENT DESCRIPTION NORMAL DESIGN (1)
Client Project:
CO2 DEHYDRATION PACKAGETEG
CONTINUOUS INTERMITTENT REMARKS
kg/hr
ENHANCED HYDROCARBON RECOVERY STUDY (FINAL)Prepared for: Alberta Research Council (ARC) Rev. 1 Project 017935, September, 2008 App 2-22 Chemicals and Petroleum
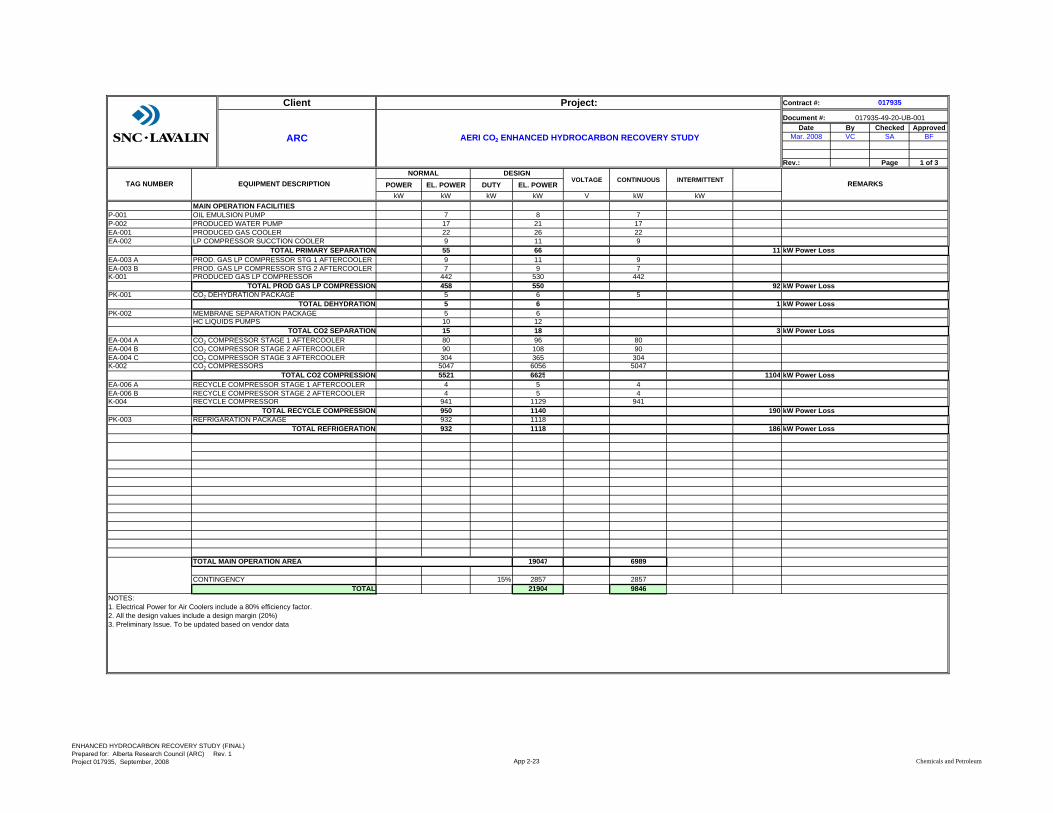
Contract #:
Document #:Date By Checked Approved
Mar. 2008 VC SA BF
Rev.: Page 1 of 3
POWER EL. POWER DUTY EL. POWERkW kW kW kW V kW kW
P-001 7 8 7P-002 17 21 17EA-001 22 26 22EA-002 9 11 9
55 66 11EA-003 A 9 11 9EA-003 B 7 9 7K-001 442 530 442
458 550 92PK-001 5 6 5
5 6 1PK-002 5 6
10 1215 18 3
EA-004 A 80 96 80EA-004 B 90 108 90EA-004 C 304 365 304K-002 5047 6056 5047
5521 6625 1104EA-006 A 4 5 4EA-006 B 4 5 4K-004 941 1129 941
950 1140 190PK-003 932 1118
932 1118 186
19047 6989
15% 2857 285721904 9846
NOTES:1. Electrical Power for Air Coolers include a 80% efficiency factor.2. All the design values include a design margin (20%)3. Preliminary Issue. To be updated based on vendor data
TOTAL
TOTAL MAIN OPERATION AREA
CONTINGENCY
PROD. GAS LP COMPRESSOR STG 1 AFTERCOOLER
TOTAL REFRIGERATION
CO2 COMPRESSOR STAGE 2 AFTERCOOLER
TOTAL CO2 COMPRESSION
CO2 COMPRESSOR STAGE 1 AFTERCOOLER
PRODUCED GAS LP COMPRESSOR
Client
ARC
Project:
AERI CO2 ENHANCED HYDROCARBON RECOVERY STUDY
TAG NUMBER EQUIPMENT DESCRIPTION CONTINUOUS INTERMITTENTDESIGNNORMAL
VOLTAGE
REFRIGARATION PACKAGE
RECYCLE COMPRESSOR STAGE 2 AFTERCOOLER
CO2 COMPRESSOR STAGE 3 AFTERCOOLER
RECYCLE COMPRESSOR STAGE 1 AFTERCOOLER
CO2 COMPRESSORS
RECYCLE COMPRESSOR
CO2 DEHYDRATION PACKAGE
TOTAL RECYCLE COMPRESSION
LP COMPRESSOR SUCCTION COOLER
PROD. GAS LP COMPRESSOR STG 2 AFTERCOOLER
TOTAL DEHYDRATION
TOTAL PROD GAS LP COMPRESSION
OIL EMULSION PUMPMAIN OPERATION FACILITIES
TOTAL PRIMARY SEPARATION
PRODUCED WATER PUMPPRODUCED GAS COOLER
kW Power Loss
kW Power Loss
017935-49-20-UB-001
017935
REMARKS
kW Power Loss
kW Power LossMEMBRANE SEPARATION PACKAGE
TOTAL CO2 SEPARATION kW Power LossHC LIQUIDS PUMPS
kW Power Loss
kW Power Loss
ENHANCED HYDROCARBON RECOVERY STUDY (FINAL)Prepared for: Alberta Research Council (ARC) Rev. 1 Project 017935, September, 2008 App 2-23 Chemicals and Petroleum

Contract #:
Document #:Date By Checked Approved
Mar. 2008 VC SA BF
Rev.: Page 2 of 3
SCMH SCMH
PK-01 40.00 48.00 40
40 0
NOTES:1. Preliminary Issue. To be updated based on vendor data.
NORMAL DESIGN (1)
SCMH SCMH
48.0040.00TOTAL
TAG NUMBER EQUIPMENT DESCRIPTION
CO2 DEHYDRATION PACKAGE
REMARKS
Client Project: 017935
ARC AERI CO2 ENHANCED HYDROCARBON RECOVERY STUDY
017935-49-20-UB-001
CONTINUOUS INTERMITTENT
ENHANCED HYDROCARBON RECOVERY STUDY (FINAL)Prepared for: Alberta Research Council (ARC) Rev. 1 Project 017935, September, 2008 App 2-24 Chemicals and Petroleum

Contract #:
Document #:Date By Checked Approved
Mar. 2008 VC SA BF
Rev.: Page 3 of 3
kg/hr kg/hr
PK-00111.0 13.0 11.0 10695
PK-002
PK-003
NOTES:1. All the design values include a design margin (20%)2. Preliminary Issue. To be updated based on vendor data.3. To be defined by the vendor
kg/hr
CONTINUOUS INTERMITTENT REMARKS
REFRIGERATION PACKAGEREFRIGERANT
MEMBRANESMEMBRANE SEPARATION PACKAGE
CO2 DEHYDRATION PACKAGETEG
kg/hr
TAG NUMBER EQUIPMENT DESCRIPTION NORMAL DESIGN (1)
Client Project: 017935
ARC AERI CO2 ENHANCED HYDROCARBON RECOVERY STUDY
017935-49-20-UB-001
ENHANCED HYDROCARBON RECOVERY STUDY (FINAL)Prepared for: Alberta Research Council (ARC) Rev. 1 Project 017935, September, 2008 App 2-25 Chemicals and Petroleum
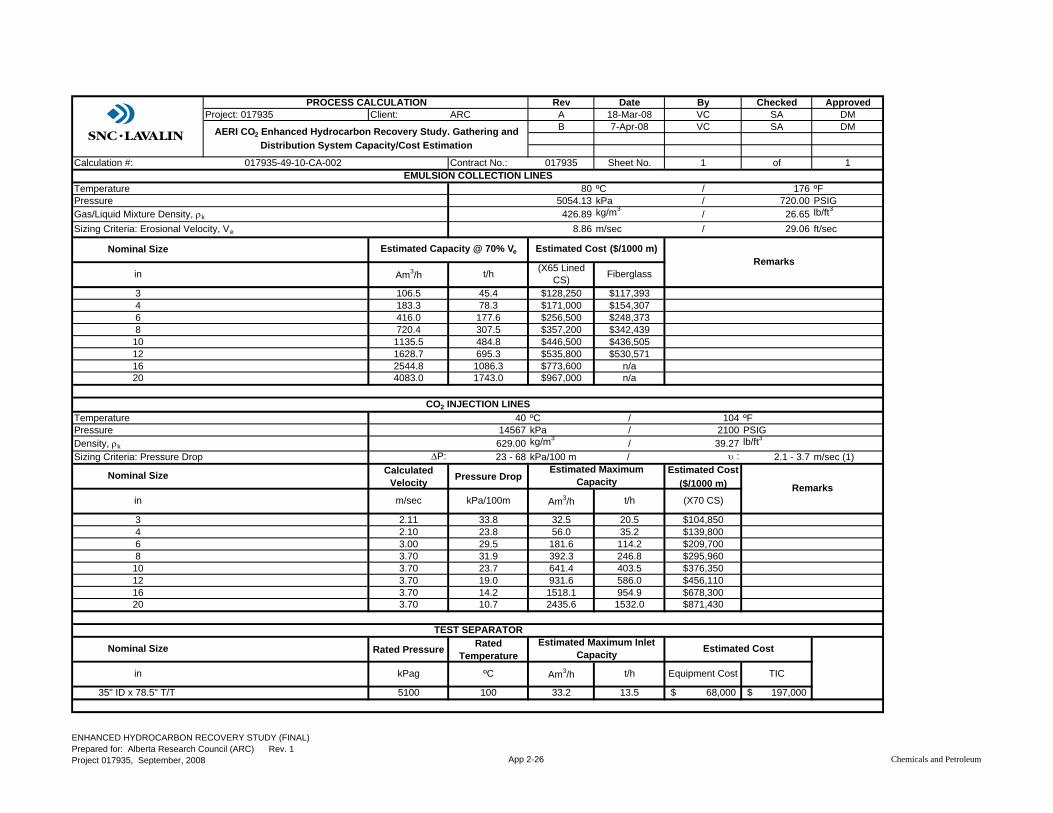
Rev Date By Checked ApprovedProject: 017935 Client: ARC A 18-Mar-08 VC SA DM
B 7-Apr-08 VC SA DM
Calculation #: Contract No.: 017935 Sheet No. 1 of 1
80 ºC / 176 ºF5054.13 kPa / 720.00 PSIG
426.89 kg/m3 / 26.65 lb/ft3
8.86 m/sec / 29.06 ft/sec
Cross-sectional Area
0.005 106.5 45.4 $128,250 $117,3930.008 183.3 78.3 $171,000 $154,3070.019 416.0 177.6 $256,500 $248,3730.032 720.4 307.5 $357,200 $342,4390.051 1135.5 484.8 $446,500 $436,5050.073 1628.7 695.3 $535,800 $530,5710.114 2544.8 1086.3 $773,600 n/a0.183 4083.0 1743.0 $967,000 n/a
40 ºC / 104 ºF14567 kPa / 2100 PSIG
629.00 kg/m3 / 39.27 lb/ft3
ΔP: 23 - 68 kPa/100 m / υ : 2.1 - 3.7 m/sec (1)
Cross-sectional Area Calculated Velocity Pressure Drop Estimated Cost
($/1000 m)
0.004 2.11 33.8 32.5 20.5 $104,8500.007 2.10 23.8 56.0 35.2 $139,8000.017 3.00 29.5 181.6 114.2 $209,7000.029 3.70 31.9 392.3 246.8 $295,9600.048 3.70 23.7 641.4 403.5 $376,3500.070 3.70 19.0 931.6 586.0 $456,1100.114 3.70 14.2 1518.1 954.9 $678,3000.183 3.70 10.7 2435.6 1532.0 $871,430
Cross-sectional Area Rated Pressure Rated Temperature
5100 100 33.2 13.5 68,000$ 197,000$
Estimated Cost
TICAm3/h t/h Equipment Costin m2 kPag ºC
35" ID x 78.5" T/T
TEST SEPARATOR
Nominal Size Estimated Maximum Inlet Capacity
101216
46
t/hRemarks
(X70 CS)
Estimated Maximum Capacity
20
Am3/h
Sizing Criteria: Pressure Drop
Nominal Size
kPa/100min m2 m/sec
8
3
CO2 INJECTION LINESTemperature Pressure Density, ρk
PROCESS CALCULATION
AERI CO2 Enhanced Hydrocarbon Recovery Study. Gathering and Distribution System Capacity/Cost Estimation
017935-49-10-CA-002EMULSION COLLECTION LINES
Temperature Pressure Gas/Liquid Mixture Density, ρk
t/h
Sizing Criteria: Erosional Velocity, Ve
Nominal Size Estimated Capacity @ 70% Ve
in m2 Am3/h
20
68
34
16
1012
(X65 Lined CS) Fiberglass
Estimated Cost ($/1000 m)Remarks
ENHANCED HYDROCARBON RECOVERY STUDY (FINAL)Prepared for: Alberta Research Council (ARC) Rev. 1 Project 017935, September, 2008 App 2-26 Chemicals and Petroleum
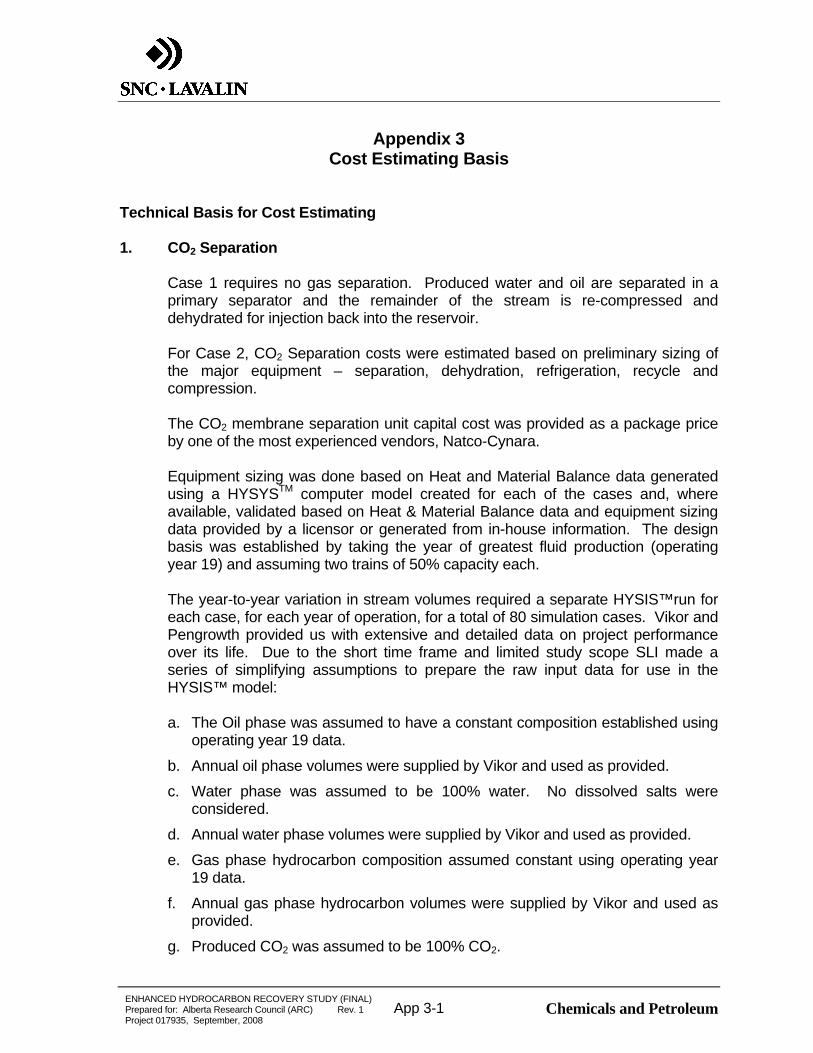
ENHANCED HYDROCARBON RECOVERY STUDY (FINAL) Prepared for: Alberta Research Council (ARC) Rev. 1 Project 017935, September, 2008
Chemicals and PetroleumApp 3-1
Appendix 3 Cost Estimating Basis
Technical Basis for Cost Estimating 1. CO2 Separation
Case 1 requires no gas separation. Produced water and oil are separated in a primary separator and the remainder of the stream is re-compressed and dehydrated for injection back into the reservoir. For Case 2, CO2 Separation costs were estimated based on preliminary sizing of the major equipment – separation, dehydration, refrigeration, recycle and compression. The CO2 membrane separation unit capital cost was provided as a package price by one of the most experienced vendors, Natco-Cynara. Equipment sizing was done based on Heat and Material Balance data generated using a HYSYSTM computer model created for each of the cases and, where available, validated based on Heat & Material Balance data and equipment sizing data provided by a licensor or generated from in-house information. The design basis was established by taking the year of greatest fluid production (operating year 19) and assuming two trains of 50% capacity each. The year-to-year variation in stream volumes required a separate HYSIS™run for each case, for each year of operation, for a total of 80 simulation cases. Vikor and Pengrowth provided us with extensive and detailed data on project performance over its life. Due to the short time frame and limited study scope SLI made a series of simplifying assumptions to prepare the raw input data for use in the HYSIS™ model: a. The Oil phase was assumed to have a constant composition established using
operating year 19 data.
b. Annual oil phase volumes were supplied by Vikor and used as provided.
c. Water phase was assumed to be 100% water. No dissolved salts were considered.
d. Annual water phase volumes were supplied by Vikor and used as provided.
e. Gas phase hydrocarbon composition assumed constant using operating year 19 data.
f. Annual gas phase hydrocarbon volumes were supplied by Vikor and used as provided.
g. Produced CO2 was assumed to be 100% CO2.
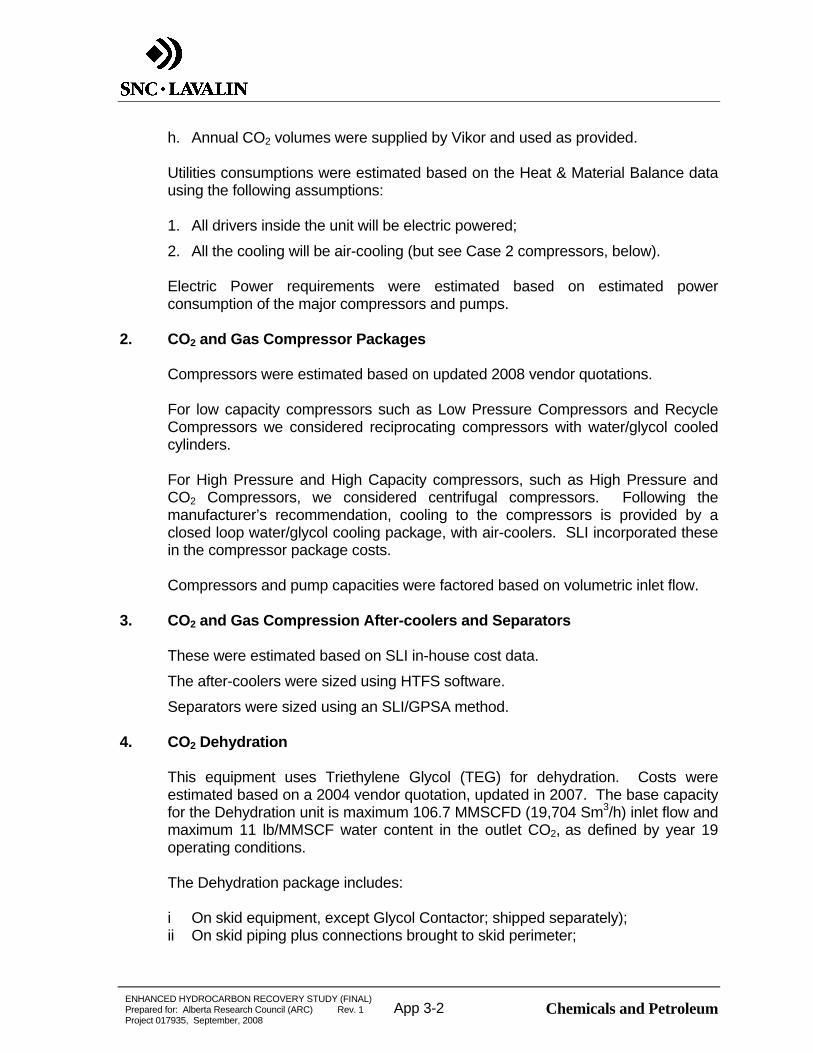
ENHANCED HYDROCARBON RECOVERY STUDY (FINAL) Prepared for: Alberta Research Council (ARC) Rev. 1 Project 017935, September, 2008
Chemicals and PetroleumApp 3-2
h. Annual CO2 volumes were supplied by Vikor and used as provided. Utilities consumptions were estimated based on the Heat & Material Balance data using the following assumptions: 1. All drivers inside the unit will be electric powered;
2. All the cooling will be air-cooling (but see Case 2 compressors, below). Electric Power requirements were estimated based on estimated power consumption of the major compressors and pumps.
2. CO2 and Gas Compressor Packages Compressors were estimated based on updated 2008 vendor quotations. For low capacity compressors such as Low Pressure Compressors and Recycle Compressors we considered reciprocating compressors with water/glycol cooled cylinders. For High Pressure and High Capacity compressors, such as High Pressure and CO2 Compressors, we considered centrifugal compressors. Following the manufacturer’s recommendation, cooling to the compressors is provided by a closed loop water/glycol cooling package, with air-coolers. SLI incorporated these in the compressor package costs. Compressors and pump capacities were factored based on volumetric inlet flow.
3. CO2 and Gas Compression After-coolers and Separators These were estimated based on SLI in-house cost data.
The after-coolers were sized using HTFS software.
Separators were sized using an SLI/GPSA method.
4. CO2 Dehydration This equipment uses Triethylene Glycol (TEG) for dehydration. Costs were estimated based on a 2004 vendor quotation, updated in 2007. The base capacity for the Dehydration unit is maximum 106.7 MMSCFD (19,704 Sm3/h) inlet flow and maximum 11 lb/MMSCF water content in the outlet CO2, as defined by year 19 operating conditions. The Dehydration package includes: i On skid equipment, except Glycol Contactor; shipped separately); ii On skid piping plus connections brought to skid perimeter;

ENHANCED HYDROCARBON RECOVERY STUDY (FINAL) Prepared for: Alberta Research Council (ARC) Rev. 1 Project 017935, September, 2008
Chemicals and PetroleumApp 3-3
iii Instrumentation. The package does not include: i Foundations; ii Off-skid piping; iii PLC/DCS; iv Electrical; v Spare Parts; vi Fireproofing or Firewater systems. Overall Dehydration package cost and utilities consumptions were estimated based on Inlet volumetric flow.
5. Pipelines Installed capital costs were estimated based on in-house $ per diameter-inch- kilometer factors. These costs were developed in matrix form to be used along with typical flow rates associated with those pipeline diameters based on an average 1 Km length of pipeline for gathering and distribution lines. The high pressure rated CO2 distribution pipelines (900#) design basis considered: Material API5L-X65; Buried 2.5 m; Externally coated and cathodic protected.
6. Operating Costs Operating costs were assessed using the following parameters and assumptions: Natural Gas purchase price = $7.00/mcf nominal; 1 MCF = 1,000,000 BTU; Power cost: $80 per MWH nominal; Water cost: N.A.; TEG cost: CAD 12.50 /USG; Service factor assumption: 97%; Other annual cash variable and Fixed operating costs: 3% of Total Installed Cost (TIC) of facilities. Subtotal all cash costs Operating manpower: 10% of cash costs Total cash operating costs Parasitic CO2 generation from power purchase: 1 tonne per MWh power purchased (nominally an average for all sources in AB; close to that for conventional coal-fired power generation).

ENHANCED HYDROCARBON RECOVERY STUDY (FINAL) Prepared for: Alberta Research Council (ARC) Rev. 1 Project 017935, September, 2008
Chemicals and PetroleumApp 4-1
Appendix 4 Cost Estimate Detail

AERI CO2 ENHANCED HYDROCARBON RECOVERY STUDYPROJECT # : 017935Rev. E/MAR.31.2008
CASE 1‐No CO2 Separation 2‐ CO2 Separation
UNIT Trains Trains
PRIMARY SEPARATION 1 17,770,000$ 1 17,770,000$
PRODUCED GAS LOW PRESSURE COMPRESSION 2 19,710,000$ 2 19,710,000$
PRODUCED GAS HIGH PRESSURE COMPRESSION 2 61,630,000$ ‐$
DEHYDRATION 2 5,380,000$ 2 9,330,000$
CO2 SEPARATION ‐$ 2 48,490,000$
CO2 COMPRESSION ‐$ 2 68,440,000$
RECYCLE COMPRESSION ‐$ 2 32,360,000$
REFRIGERATION ‐$ 2 19,830,000$
104,490,000$ 215,930,000$
OSBL ( ALLOWANCE OF 35% OF TOTAL COST) 36,570,000$ 75,580,000$
OTHER COST ‐$ ‐$
OTHER COST ‐$ ‐$
ESTIMATE TIC 141,060,000$ 291,510,000$
EQUIPMENT FACTORED ESTIMATE ( + / ‐ 40% )BASED ON USGC ‐ 1ST QUARTER 2008
CASE 1: NO CO2 SEPARATION
PRIMARY SEPARATION
13%
OSBL26%
DEHYDRATION4%
COMPRESSION57%
CASE 2: CO2 SEPARATION
PRIMARY SEPARATION
6%
COMPRESSION30%
SEPARATION35%
DEHYDRATION3%
OSBL26%
ENHANCED HYDROCARBON RECOVERY STUDY (FINAL)Prepared for: Alberta Research Council (ARC) Rev. 1 Project 017935, September, 2008 App 4‐2 Chemicals and Petroleum
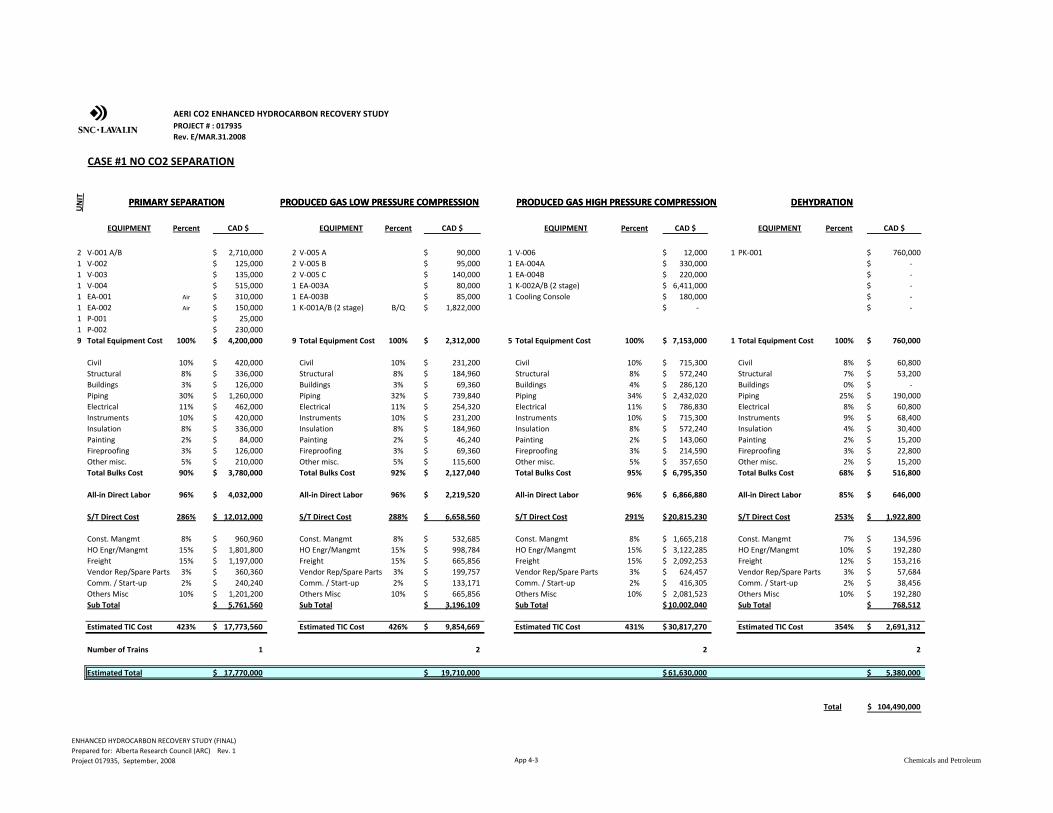
AERI CO2 ENHANCED HYDROCARBON RECOVERY STUDY
Rev. E/MAR.31.2008PROJECT # : 017935
DEHYDRATIONPRODUCED GAS HIGH PRESSURE COMPRESSION
CASE #1 NO CO2 SEPARATION
PRIMARY SEPARATION PRODUCED GAS LOW PRESSURE COMPRESSION
UNIT DEHYDRATIONPRODUCED GAS HIGH PRESSURE COMPRESSIONPRIMARY SEPARATION PRODUCED GAS LOW PRESSURE COMPRESSION
EQUIPMENT Percent CAD $ EQUIPMENT Percent CAD $ EQUIPMENT Percent CAD $ EQUIPMENT Percent CAD $
2 V‐001 A/B 2,710,000$ 2 V‐005 A 90,000$ 1 V‐006 12,000$ 1 PK‐001 760,000$ 1 V‐002 125,000$ 2 V‐005 B 95,000$ 1 EA‐004A 330,000$ ‐$ 1 V‐003 135,000$ 2 V‐005 C 140,000$ 1 EA‐004B 220,000$ ‐$ 1 V‐004 515,000$ 1 EA‐003A 80,000$ 1 K‐002A/B (2 stage) 6,411,000$ ‐$ 1 EA‐001 Air 310,000$ 1 EA‐003B 85,000$ 1 Cooling Console 180,000$ ‐$ 1 EA‐002 Air 150,000$ 1 K‐001A/B (2 stage) B/Q 1,822,000$ ‐$ ‐$ 1 P‐001 25,000$ 1 P‐002 230,000$ 9 Total Equipment Cost 100% 4,200,000$ 9 Total Equipment Cost 100% 2,312,000$ 5 Total Equipment Cost 100% 7,153,000$ 1 Total Equipment Cost 100% 760,000$
Civil 10% 420,000$ Civil 10% 231,200$ Civil 10% 715,300$ Civil 8% 60,800$ Structural 8% 336,000$ Structural 8% 184,960$ Structural 8% 572,240$ Structural 7% 53,200$ Buildings 3% 126,000$ Buildings 3% 69,360$ Buildings 4% 286,120$ Buildings 0% ‐$ Piping 30% 1,260,000$ Piping 32% 739,840$ Piping 34% 2,432,020$ Piping 25% 190,000$ Electrical 11% 462,000$ Electrical 11% 254,320$ Electrical 11% 786,830$ Electrical 8% 60,800$ Instruments 10% 420,000$ Instruments 10% 231,200$ Instruments 10% 715,300$ Instruments 9% 68,400$ Insulation 8% 336,000$ Insulation 8% 184,960$ Insulation 8% 572,240$ Insulation 4% 30,400$ Painting 2% 84,000$ Painting 2% 46,240$ Painting 2% 143,060$ Painting 2% 15,200$ Fireproofing 3% 126,000$ Fireproofing 3% 69,360$ Fireproofing 3% 214,590$ Fireproofing 3% 22,800$ Other misc. 5% 210,000$ Other misc. 5% 115,600$ Other misc. 5% 357,650$ Other misc. 2% 15,200$ Total Bulks Cost 90% 3,780,000$ Total Bulks Cost 92% 2,127,040$ Total Bulks Cost 95% 6,795,350$ Total Bulks Cost 68% 516,800$
All‐in Direct Labor 96% 4,032,000$ All‐in Direct Labor 96% 2,219,520$ All‐in Direct Labor 96% 6,866,880$ All‐in Direct Labor 85% 646,000$
S/T Direct Cost 286% 12,012,000$ S/T Direct Cost 288% 6,658,560$ S/T Direct Cost 291% 20,815,230$ S/T Direct Cost 253% 1,922,800$
Const. Mangmt 8% 960,960$ Const. Mangmt 8% 532,685$ Const. Mangmt 8% 1,665,218$ Const. Mangmt 7% 134,596$ HO Engr/Mangmt 15% 1,801,800$ HO Engr/Mangmt 15% 998,784$ HO Engr/Mangmt 15% 3,122,285$ HO Engr/Mangmt 10% 192,280$ Freight 15% 1,197,000$ Freight 15% 665,856$ Freight 15% 2,092,253$ Freight 12% 153,216$ Vendor Rep/Spare Parts 3% 360,360$ Vendor Rep/Spare Parts 3% 199,757$ Vendor Rep/Spare Parts 3% 624,457$ Vendor Rep/Spare Parts 3% 57,684$ Comm. / Start‐up 2% 240,240$ Comm. / Start‐up 2% 133,171$ Comm. / Start‐up 2% 416,305$ Comm. / Start‐up 2% 38,456$ Others Misc 10% 1,201,200$ Others Misc 10% 665,856$ Others Misc 10% 2,081,523$ Others Misc 10% 192,280$ Sub Total 5,761,560$ Sub Total 3,196,109$ Sub Total 10,002,040$ Sub Total 768,512$
Estimated TIC Cost 423% 17,773,560$ Estimated TIC Cost 426% 9,854,669$ Estimated TIC Cost 431% 30,817,270$ Estimated TIC Cost 354% 2,691,312$
Number of Trains 1 2 2 2
Estimated Total 17,770,000$ 19,710,000$ 61,630,000$ 5,380,000$
Total 104,490,000$
ENHANCED HYDROCARBON RECOVERY STUDY (FINAL)Prepared for: Alberta Research Council (ARC) Rev. 1 Project 017935, September, 2008 App 4‐3 Chemicals and Petroleum

AERI CO2 ENHANCED HYDROCARBON RECOVERY STUDYPROJECT # : 017935Rev. E/MAR.31.2008
CASE #2 CO2 SEPARATION
UNIT
EQUIPMENT Percent CAD $ EQUIPMENT Percent CAD $ EQUIPMENT Percent CAD $ EQUIPMENT Percent CAD $ EQUIPMENT Percent CAD $ EQUIPMENT Percent CAD $ EQUIPMENT Percent CAD $
‐$ 2 V‐001 A/B 2,710,000$ 2 V‐005 A 90,000$ 1 PK‐001 1,318,000$ 1 E‐001 40,000$ 1 V‐008A 140,000$ 1 V‐010A 139,000$ 1 PK‐003 2,800,000$ 1 V‐002 125,000$ 2 V‐005 B 95,000$ 1 E‐002 26,000$ 1 V‐008B 132,000$ 1 V‐010B 128,000$ ‐$ 1 V‐003 135,000$ 2 V‐005 C 140,000$ 1 V‐006 135,000$ 1 V‐008C 126,000$ 1 V‐010C 100,000$ ‐$ 1 V‐004 515,000$ 1 EA‐003A 80,000$ 1 V‐007 145,000$ 1 EA‐004A 485,000$ 1 V‐011 95,000$ ‐$ 1 EA‐001 Air 310,000$ 1 EA‐003B 85,000$ 1 PK‐002 6,500,000$ 1 EA‐004B 490,000$ 1 EA‐006A 125,000$ ‐$ 1 EA‐002 Air 150,000$ 1 K‐001A/B (2 stage) B/Q 1,822,000$ 1 EA‐004C 440,000$ 1 EA‐006B 123,000$ ‐$ 1 P‐001 25,000$ 1 K‐002A,B,C (3 stage) B/Q 6,061,000$ 1 K‐004A,B (2 stage) 3,289,000$ 1 P‐002 230,000$ 1 Cooling Console 180,000$
‐$ 9 Total Equipment Cost 100% 4,200,000$ 9 Total Equipment Cost 100% 2,312,000$ 1 Total Equipment Cost 100% 1,318,000$ 5 Total Equipment Cost 100% 6,846,000$ 8 Total Equipment Cost 100% 8,054,000$ 7 Total Equipment Cost 100% 3,999,000$ 1 Total Equipment Cost 100% 2,800,000$
Civil 10% 420,000$ Civil 10% 231,200$ Civil 8% 105,440$ Civil 8% 547,680$ Civil 10% 805,400$ Civil 10% 399,900$ Civil 8% 224,000$ Structural 8% 336,000$ Structural 8% 184,960$ Structural 7% 92,260$ Structural 7% 479,220$ Structural 8% 644,320$ Structural 8% 319,920$ Structural 7% 196,000$ Buildings 3% 126,000$ Buildings 3% 69,360$ Buildings 0% ‐$ Buildings 0% ‐$ Buildings 4% 322,160$ Buildings 4% 159,960$ Buildings 0% ‐$ Piping 30% 1,260,000$ Piping 32% 739,840$ Piping 25% 329,500$ Piping 25% 1,711,500$ Piping 32% 2,577,280$ Piping 32% 1,279,680$ Piping 25% 700,000$ Electrical 11% 462,000$ Electrical 11% 254,320$ Electrical 8% 105,440$ Electrical 8% 547,680$ Electrical 11% 885,940$ Electrical 11% 439,890$ Electrical 8% 224,000$ Instruments 10% 420,000$ Instruments 10% 231,200$ Instruments 9% 118,620$ Instruments 9% 616,140$ Instruments 10% 805,400$ Instruments 10% 399,900$ Instruments 9% 252,000$ Insulation 8% 336,000$ Insulation 8% 184,960$ Insulation 4% 52,720$ Insulation 4% 273,840$ Insulation 8% 644,320$ Insulation 8% 319,920$ Insulation 4% 112,000$ Painting 2% 84,000$ Painting 2% 46,240$ Painting 2% 26,360$ Painting 2% 136,920$ Painting 2% 161,080$ Painting 2% 79,980$ Painting 2% 56,000$ Fireproofing 3% 126,000$ Fireproofing 3% 69,360$ Fireproofing 3% 39,540$ Fireproofing 3% 205,380$ Fireproofing 3% 241,620$ Fireproofing 3% 119,970$ Fireproofing 3% 84,000$ Other misc. 5% 210,000$ Other misc. 5% 115,600$ Other misc. 2% 26,360$ Other misc. 2% 136,920$ Other misc. 5% 402,700$ Other misc. 5% 199,950$ Other misc. 2% 56,000$ Total Bulks Cost 90% 3,780,000$ Total Bulks Cost 92% 2,127,040$ Total Bulks Cost 68% 896,240$ Total Bulks Cost 68% 4,655,280$ Total Bulks Cost 93% 7,490,220$ Total Bulks Cost 93% 3,719,070$ Total Bulks Cost 68% 1,904,000$
All‐in Direct Labor 96% 4,032,000$ All‐in Direct Labor 96% 2,219,520$ All‐in Direct Labor 85% 1,120,300$ All‐in Direct Labor 85% 5,819,100$ All‐in Direct Labor 96% 7,731,840$ All‐in Direct Labor 96% 3,839,040$ All‐in Direct Labor 85% 2,380,000$
S/T Direct Cost 286% 12,012,000$ S/T Direct Cost 288% 6,658,560$ S/T Direct Cost 253% 3,334,540$ S/T Direct Cost 253% 17,320,380$ S/T Direct Cost 289% 23,276,060$ S/T Direct Cost 289% 11,557,110$ S/T Direct Cost 253% 7,084,000$
Const. Mangmt 8% 960,960$ Const. Mangmt 8% 532,685$ Const. Mangmt 7% 233,418$ Const. Mangmt 7% 1,212,427$ Const. Mangmt 7% 1,629,324$ Const. Mangmt 7% 808,998$ Const. Mangmt 7% 495,880$ HO Engr/Mangmt 15% 1,801,800$ HO Engr/Mangmt 15% 998,784$ HO Engr/Mangmt 10% 333,454$ HO Engr/Mangmt 10% 1,732,038$ HO Engr/Mangmt 15% 3,491,409$ HO Engr/Mangmt 10% 1,155,711$ HO Engr/Mangmt 10% 708,400$ Freight 15% 1,197,000$ Freight 15% 665,856$ Freight 12% 265,709$ Freight 12% 1,380,154$ Freight 15% 2,331,633$ Freight 12% 926,168$ Freight 12% 564,480$ Vendor Rep/Spare Parts 3% 360,360$ Vendor Rep/Spare Parts 3% 199,757$ Vendor Rep/Spare Parts 3% 100,036$ Vendor Rep/Spare Parts 3% 519,611$ Vendor Rep/Spare Parts 3% 698,282$ Vendor Rep/Spare Parts 3% 346,713$ Vendor Rep/Spare Parts 3% 212,520$ Comm. / Start‐up 2% 240,240$ Comm. / Start‐up 2% 133,171$ Comm. / Start‐up 2% 66,691$ Comm. / Start‐up 2% 346,408$ Comm. / Start‐up 2% 465,521$ Comm. / Start‐up 2% 231,142$ Comm. / Start‐up 2% 141,680$ Others Misc 10% 1,201,200$ Others Misc 10% 665,856$ Others Misc 10% 333,454$ Others Misc 10% 1,732,038$ Others Misc 10% 2,327,606$ Others Misc 10% 1,155,711$ Others Misc 10% 708,400$ Sub Total 5,761,560$ Sub Total 3,196,109$ Sub Total 1,332,762$ Sub Total 6,922,675$ Sub Total 10,943,775$ Sub Total 4,624,444$ Sub Total 2,831,360$
Estimated TIC Cost 423% 17,773,560$ Estimated TIC Cost 426% 9,854,669$ Estimated TIC Cost 354% 4,667,302$ Estimated TIC Cost 354% 24,243,055$ Estimated TIC Cost 425% 34,219,835$ Estimated TIC Cost 405% 16,181,554$ Estimated TIC Cost 354% 9,915,360$
Number of Trains 1 2 2 2 2 2 2
Estimated Total 17,770,000$ 19,710,000$ 9,330,000$ 48,490,000$ 68,440,000$ 32,360,000$ 19,830,000$
Total 215,930,000$
RECYCLE COMPRESSIONPRIMARY SEPARATION CO2 SEPARATION CO2 COMPRESSION REFRIGERATIONPRODUCED GAS LOW PRESSURE COMPRESSION PRODUCED GAS DEHYRRATION
ENHANCED HYDROCARBON RECOVERY STUDY (FINAL)Prepared for: Alberta Research Council (ARC) Rev. 1 Project 017935, September, 2008 App 4‐4 Chemicals and Petroleum

AERI CO2 ENHANCED HYDROCARBON RECOVERY STUDYPROJECT # : 017935Equipment Construction/Operating Periods
Rev. A/MAR.31.2008
Equipment Year -2 -1 0 1 2 3 4 5 6 7 8 9 10 11 12 13 14 15 16 17 18 19 20 21 22 23 24 25 26 27 28 29 30 31 32 33 34 35 36 37 38 39 40
Construction PeriodOperating Period
Dehydration Train#1 50%
Dehydration Train#2 50%
Dehydration Train#1 50%
Case 1: No Produced Gas SeparationPrimary Separation Train #1 100%LP Compression Train #1 50%
LP Compression Train #2 50%
HP Compression Train #1 50%
CO2 Separation Train #1 50%
OSBL Train #1 100%
Case 2: Produced Gas SeparationPrimary Separation Train #1 100%LP Compression Train #1 50%
HP Compression Train #2 50%
Recycle Compression Train #2 50%
CO2 Compression Train #1 50%
CO2 Compression Train #2 50%
OSBL Train #1 100%
CO2 Separation Train #2 50%
Refrigeration Train #1 50%
Refrigeration Train #2 50%
Recycle Compression Train #1 50%LP Compression Train #2 50%Dehydration Train#2 50%
ENHANCED HYDROCARBON RECOVERY STUDY (FINAL)Prepared for: Alberta Research Council (ARC) Rev. 1 Project 017935, September, 2008 App 4‐5 Chemicals and Petroleum
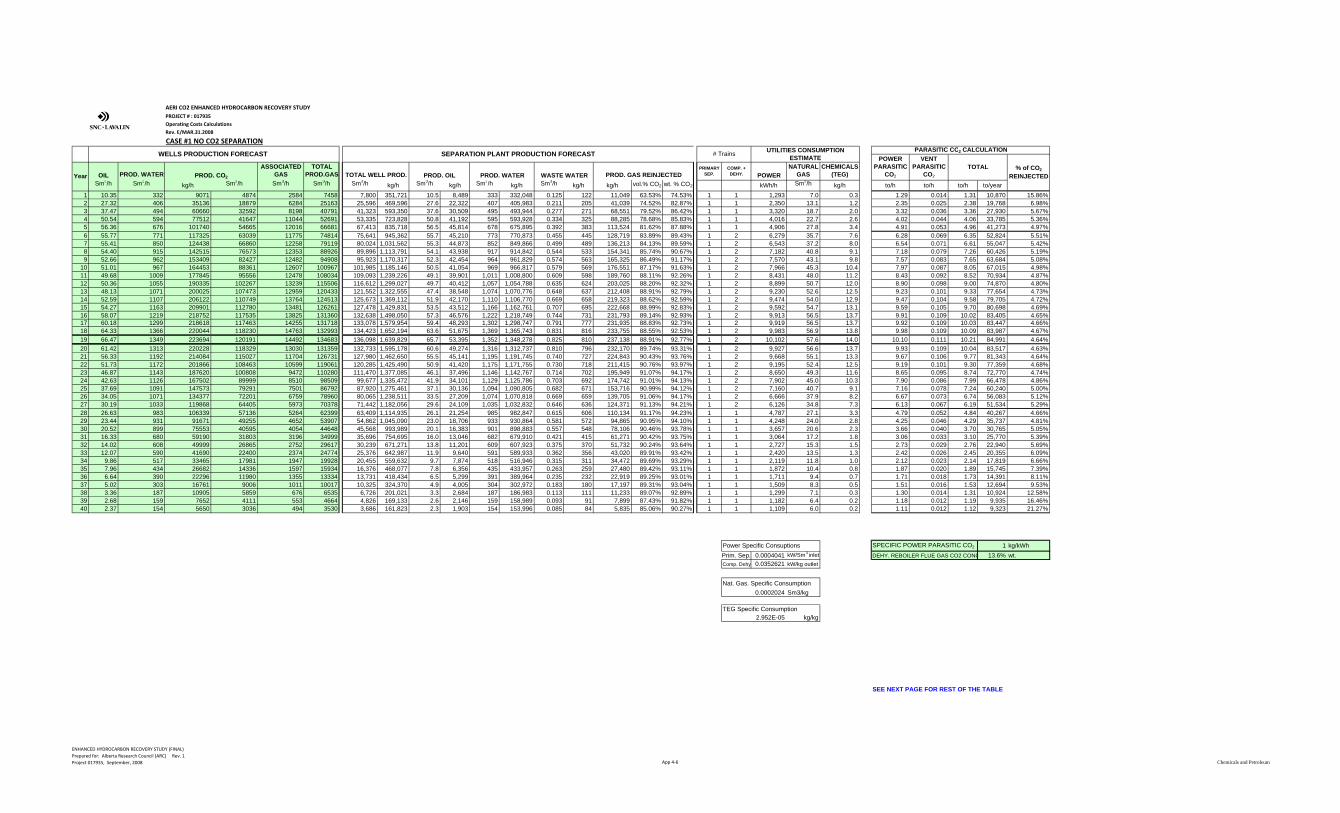
AERI CO2 ENHANCED HYDROCARBON RECOVERY STUDYPROJECT # : 017935Operating Costs CalculationsRev. E/MAR.31.2008
OIL PROD. WATERASSOCIATED
GASTOTAL
PROD.GASPRIMARY
SEP.COMP. +
DEHY. POWERNATURAL
GASCHEMICALS
(TEG)Sm3/h Sm3/h kg/h Sm3/h Sm3/h Sm3/h Sm3/h kg/h Sm3/h kg/h Sm3/h kg/h Sm3/h kg/h kg/h vol.% CO2 wt. % CO2 kWh/h Sm3/h kg/h to/h to/h to/h to/year
1 10.35 332 9071 4874 2584 7458 7,800 351,721 10.5 8,489 333 332,048 0.125 122 11,049 63.53% 74.53% 1 1 1,293 7.0 0.3 1.29 0.014 1.31 10,870 15.86%2 27.32 406 35136 18879 6284 25163 25,596 469,596 27.6 22,322 407 405,983 0.211 205 41,039 74.52% 82.87% 1 1 2,350 13.1 1.2 2.35 0.025 2.38 19,768 6.98%3 37.47 494 60660 32592 8198 40791 41,323 593,350 37.6 30,509 495 493,944 0.277 271 68,551 79.52% 86.42% 1 1 3,320 18.7 2.0 3.32 0.036 3.36 27,930 5.67%4 50.54 594 77512 41647 11044 52691 53,335 723,828 50.8 41,192 595 593,928 0.334 325 88,285 78.68% 85.83% 1 1 4,016 22.7 2.6 4.02 0.044 4.06 33,785 5.36%5 56.36 676 101740 54665 12016 66681 67,413 835,718 56.5 45,814 678 675,895 0.392 383 113,524 81.62% 87.88% 1 1 4,906 27.8 3.4 4.91 0.053 4.96 41,273 4.97%6 55.77 771 117325 63039 11775 74814 75,641 945,362 55.7 45,210 773 770,873 0.455 445 128,719 83.89% 89.43% 1 2 6,279 35.7 7.6 6.28 0.069 6.35 52,824 5.51%7 55.41 850 124438 66860 12258 79119 80,024 1,031,562 55.3 44,873 852 849,866 0.499 489 136,213 84.13% 89.59% 1 2 6,543 37.2 8.0 6.54 0.071 6.61 55,047 5.42%8 54.40 915 142515 76573 12353 88926 89,896 1,113,791 54.1 43,938 917 914,842 0.544 533 154,341 85.74% 90.67% 1 2 7,182 40.8 9.1 7.18 0.079 7.26 60,426 5.19%9 52.66 962 153409 82427 12482 94908 95,923 1,170,317 52.3 42,454 964 961,829 0.574 563 165,325 86.49% 91.17% 1 2 7,570 43.1 9.8 7.57 0.083 7.65 63,684 5.08%
10 51.01 967 164453 88361 12607 100967 101,985 1,185,146 50.5 41,054 969 966,817 0.579 569 176,551 87.17% 91.63% 1 2 7,966 45.3 10.4 7.97 0.087 8.05 67,015 4.98%11 49.68 1009 177845 95556 12478 108034 109,093 1,239,226 49.1 39,901 1,011 1,008,800 0.609 598 189,760 88.11% 92.26% 1 2 8,431 48.0 11.2 8.43 0.092 8.52 70,934 4.87%12 50.36 1055 190335 102267 13239 115506 116,612 1,299,027 49.7 40,412 1,057 1,054,788 0.635 624 203,025 88.20% 92.32% 1 2 8,899 50.7 12.0 8.90 0.098 9.00 74,870 4.80%13 48.13 1071 200025 107473 12959 120433 121,552 1,322,555 47.4 38,548 1,074 1,070,776 0.648 637 212,408 88.91% 92.79% 1 2 9,230 52.6 12.5 9.23 0.101 9.33 77,654 4.73%14 52.59 1107 206122 110749 13764 124513 125,673 1,369,112 51.9 42,170 1,110 1,106,770 0.669 658 219,323 88.62% 92.59% 1 2 9,474 54.0 12.9 9.47 0.104 9.58 79,705 4.72%15 54.27 1163 209901 112780 13481 126261 127,478 1,429,831 53.5 43,512 1,166 1,162,761 0.707 695 222,668 88.99% 92.83% 1 2 9,592 54.7 13.1 9.59 0.105 9.70 80,698 4.69%16 58.07 1219 218752 117535 13825 131360 132,638 1,498,050 57.3 46,576 1,222 1,218,749 0.744 731 231,793 89.14% 92.93% 1 2 9,913 56.5 13.7 9.91 0.109 10.02 83,405 4.65%17 60.18 1299 218618 117463 14255 131718 133,078 1,579,954 59.4 48,293 1,302 1,298,747 0.791 777 231,935 88.83% 92.73% 1 2 9,919 56.5 13.7 9.92 0.109 10.03 83,447 4.66%18 64.33 1366 220044 118230 14763 132993 134,423 1,652,194 63.6 51,675 1,369 1,365,743 0.831 816 233,755 88.55% 92.53% 1 2 9,983 56.9 13.8 9.98 0.109 10.09 83,987 4.67%19 66.47 1349 223694 120191 14492 134683 136,098 1,639,829 65.7 53,395 1,352 1,348,278 0.825 810 237,138 88.91% 92.77% 1 2 10,102 57.6 14.0 10.10 0.111 10.21 84,991 4.64%20 61.42 1313 220228 118329 13030 131359 132,733 1,595,178 60.6 49,274 1,316 1,312,737 0.810 796 232,170 89.74% 93.31% 1 2 9,927 56.6 13.7 9.93 0.109 10.04 83,517 4.63%21 56.33 1192 214084 115027 11704 126731 127,980 1,462,650 55.5 45,141 1,195 1,191,745 0.740 727 224,843 90.43% 93.76% 1 2 9,668 55.1 13.3 9.67 0.106 9.77 81,343 4.64%22 51.73 1172 201866 108463 10599 119061 120,285 1,425,490 50.9 41,420 1,175 1,171,755 0.730 718 211,415 90.76% 93.97% 1 2 9,195 52.4 12.5 9.19 0.101 9.30 77,359 4.68%23 46.87 1143 187620 100808 9472 110280 111,470 1,377,085 46.1 37,496 1,146 1,142,767 0.714 702 195,949 91.07% 94.17% 1 2 8,650 49.3 11.6 8.65 0.095 8.74 72,770 4.74%24 42.63 1126 167502 89999 8510 98509 99,677 1,335,472 41.9 34,101 1,129 1,125,786 0.703 692 174,742 91.01% 94.13% 1 2 7,902 45.0 10.3 7.90 0.086 7.99 66,478 4.86%25 37.69 1091 147573 79291 7501 86792 87,920 1,275,461 37.1 30,136 1,094 1,090,805 0.682 671 153,716 90.99% 94.12% 1 2 7,160 40.7 9.1 7.16 0.078 7.24 60,240 5.00%26 34.05 1071 134377 72201 6759 78960 80,065 1,238,511 33.5 27,209 1,074 1,070,818 0.669 659 139,705 91.06% 94.17% 1 2 6,666 37.9 8.2 6.67 0.073 6.74 56,083 5.12%27 30.19 1033 119868 64405 5973 70378 71,442 1,182,056 29.6 24,109 1,035 1,032,832 0.646 636 124,371 91.13% 94.21% 1 2 6,126 34.8 7.3 6.13 0.067 6.19 51,534 5.29%28 26.63 983 106339 57136 5264 62399 63,409 1,114,935 26.1 21,254 985 982,847 0.615 606 110,134 91.17% 94.23% 1 1 4,787 27.1 3.3 4.79 0.052 4.84 40,267 4.66%29 23.44 931 91671 49255 4652 53907 54,862 1,045,090 23.0 18,706 933 930,864 0.581 572 94,865 90.95% 94.10% 1 1 4,248 24.0 2.8 4.25 0.046 4.29 35,737 4.81%30 20.52 899 75553 40595 4054 44648 45,568 993,989 20.1 16,383 901 898,883 0.557 548 78,106 90.46% 93.78% 1 1 3,657 20.6 2.3 3.66 0.040 3.70 30,765 5.05%31 16.33 680 59190 31803 3196 34999 35,696 754,695 16.0 13,046 682 679,910 0.421 415 61,271 90.42% 93.75% 1 1 3,064 17.2 1.8 3.06 0.033 3.10 25,770 5.39%32 14.02 608 49999 26865 2752 29617 30,239 671,271 13.8 11,201 609 607,923 0.375 370 51,732 90.24% 93.64% 1 1 2,727 15.3 1.5 2.73 0.029 2.76 22,940 5.69%33 12.07 590 41690 22400 2374 24774 25,376 642,987 11.9 9,640 591 589,933 0.362 356 43,020 89.91% 93.42% 1 1 2,420 13.5 1.3 2.42 0.026 2.45 20,355 6.09%34 9.86 517 33465 17981 1947 19928 20,455 559,632 9.7 7,874 518 516,946 0.315 311 34,472 89.69% 93.29% 1 1 2,119 11.8 1.0 2.12 0.023 2.14 17,819 6.66%35 7.96 434 26682 14336 1597 15934 16,376 468,077 7.8 6,356 435 433,957 0.263 259 27,480 89.42% 93.11% 1 1 1,872 10.4 0.8 1.87 0.020 1.89 15,745 7.39%36 6.64 390 22296 11980 1355 13334 13,731 418,434 6.5 5,299 391 389,964 0.235 232 22,919 89.25% 93.01% 1 1 1,711 9.4 0.7 1.71 0.018 1.73 14,391 8.11%37 5.02 303 16761 9006 1011 10017 10,325 324,370 4.9 4,005 304 302,972 0.183 180 17,197 89.31% 93.04% 1 1 1,509 8.3 0.5 1.51 0.016 1.53 12,694 9.53%38 3.36 187 10905 5859 676 6535 6,726 201,021 3.3 2,684 187 186,983 0.113 111 11,233 89.07% 92.89% 1 1 1,299 7.1 0.3 1.30 0.014 1.31 10,924 12.58%39 2.68 159 7652 4111 553 4664 4,826 169,133 2.6 2,146 159 158,989 0.093 91 7,899 87.43% 91.82% 1 1 1,182 6.4 0.2 1.18 0.012 1.19 9,935 16.46%40 2.37 154 5650 3036 494 3530 3,686 161,823 2.3 1,903 154 153,996 0.085 84 5,835 85.06% 90.27% 1 1 1,109 6.0 0.2 1.11 0.012 1.12 9,323 21.27%
Power Specific Consuptions 1 kg/kWhPrim. Sep. 0.0004041 kW/Sm3 inlet 13.6% wt.Comp. Dehy 0.0352621 kW/kg outlet
Nat. Gas. Specific Consumption0.0002024 Sm3/kg
TEG Specific Consumption2.952E-05 kg/kg
SEE NEXT PAGE FOR REST OF THE TABLE
CASE #1 NO CO2 SEPARATION
WELLS PRODUCTION FORECAST PARASITIC CO2 CALCULATION
% of CO2
REINJECTED
SEPARATION PLANT PRODUCTION FORECAST UTILITIES CONSUMPTION ESTIMATE# Trains
WASTE WATER
DEHY. REBOILER FLUE GAS CO2 CONC
TOTAL
SPECIFIC POWER PARASITIC CO2
POWER PARASITIC
CO2
VENT PARASITIC
CO2PROD. OIL PROD. WATER PROD. GAS REINJECTEDPROD. CO2Year TOTAL WELL PROD.
ENHANCED HYDROCARBON RECOVERY STUDY (FINAL)Prepared for: Alberta Research Council (ARC) Rev. 1 Project 017935, September, 2008 App 4‐6 Chemicals and Petroleum
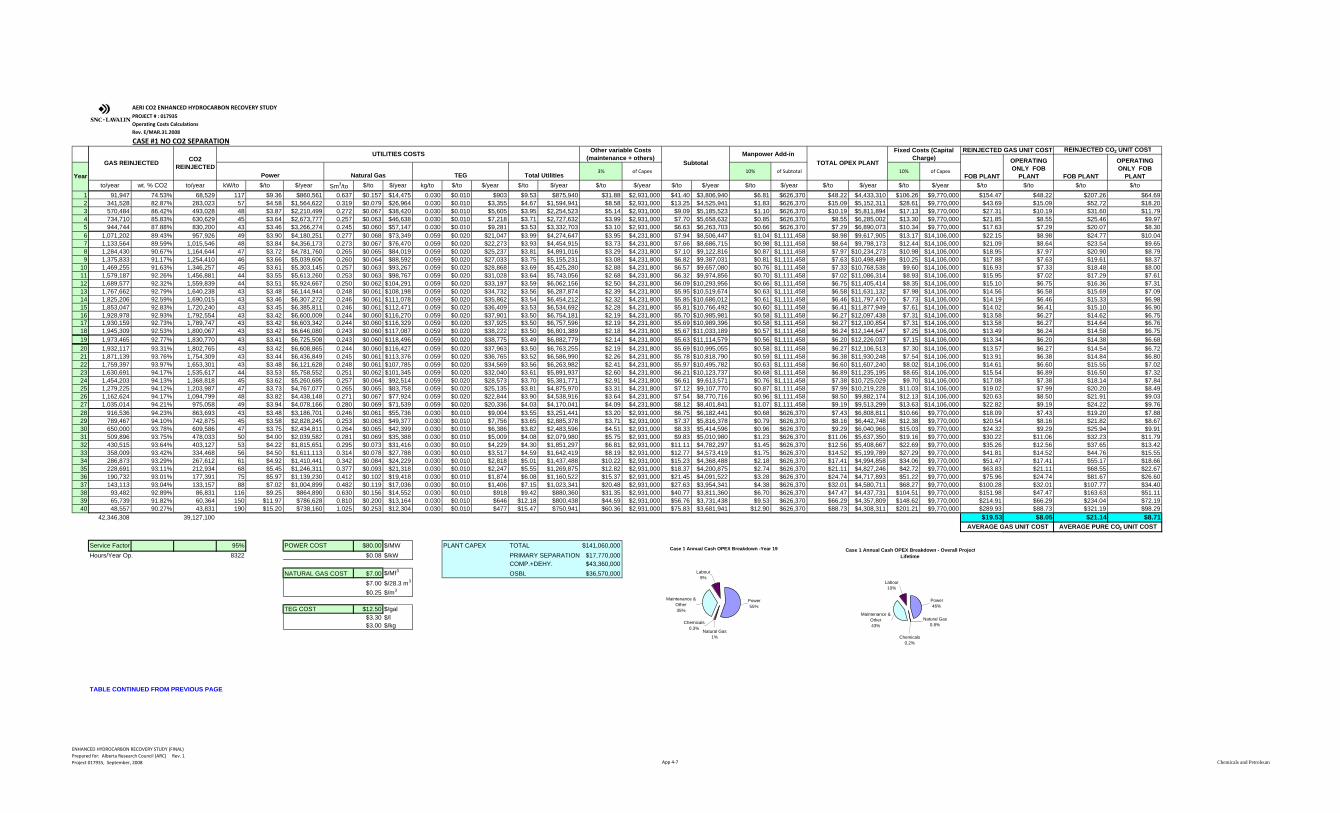
123456789
10111213141516171819202122232425262728293031323334353637383940
Year
AERI CO2 ENHANCED HYDROCARBON RECOVERY STUDYPROJECT # : 017935Operating Costs CalculationsRev. E/MAR.31.2008
3% of Capex 10% of Subtotal 10% of Capex
to/year wt. % CO2 to/year kW/to $/to $/year Sm3/to $/to $/year kg/to $/to $/year $/to $/year $/to $/year $/to $/year $/to $/year $/to $/year $/to $/year $/to $/to $/to $/to91,947 74.53% 68,529 117 $9.36 $860,561 0.637 $0.157 $14,475 0.030 $0.010 $903 $9.53 $875,940 $31.88 $2,931,000 $41.40 $3,806,940 $6.81 $626,370 $48.22 $4,433,310 $106.26 $9,770,000 $154.47 $48.22 $207.26 $64.69
341,528 82.87% 283,023 57 $4.58 $1,564,622 0.319 $0.079 $26,964 0.030 $0.010 $3,355 $4.67 $1,594,941 $8.58 $2,931,000 $13.25 $4,525,941 $1.83 $626,370 $15.09 $5,152,311 $28.61 $9,770,000 $43.69 $15.09 $52.72 $18.20570,484 86.42% 493,028 48 $3.87 $2,210,499 0.272 $0.067 $38,420 0.030 $0.010 $5,605 $3.95 $2,254,523 $5.14 $2,931,000 $9.09 $5,185,523 $1.10 $626,370 $10.19 $5,811,894 $17.13 $9,770,000 $27.31 $10.19 $31.60 $11.79734,710 85.83% 630,629 45 $3.64 $2,673,777 0.257 $0.063 $46,638 0.030 $0.010 $7,218 $3.71 $2,727,632 $3.99 $2,931,000 $7.70 $5,658,632 $0.85 $626,370 $8.55 $6,285,002 $13.30 $9,770,000 $21.85 $8.55 $25.46 $9.97944,744 87.88% 830,200 43 $3.46 $3,266,274 0.245 $0.060 $57,147 0.030 $0.010 $9,281 $3.53 $3,332,703 $3.10 $2,931,000 $6.63 $6,263,703 $0.66 $626,370 $7.29 $6,890,073 $10.34 $9,770,000 $17.63 $7.29 $20.07 $8.30
1,071,202 89.43% 957,926 49 $3.90 $4,180,251 0.277 $0.068 $73,349 0.059 $0.020 $21,047 $3.99 $4,274,647 $3.95 $4,231,800 $7.94 $8,506,447 $1.04 $1,111,458 $8.98 $9,617,905 $13.17 $14,106,000 $22.15 $8.98 $24.77 $10.041,133,564 89.59% 1,015,546 48 $3.84 $4,356,173 0.273 $0.067 $76,470 0.059 $0.020 $22,273 $3.93 $4,454,915 $3.73 $4,231,800 $7.66 $8,686,715 $0.98 $1,111,458 $8.64 $9,798,173 $12.44 $14,106,000 $21.09 $8.64 $23.54 $9.651,284,430 90.67% 1,164,644 47 $3.72 $4,781,760 0.265 $0.065 $84,019 0.059 $0.020 $25,237 $3.81 $4,891,016 $3.29 $4,231,800 $7.10 $9,122,816 $0.87 $1,111,458 $7.97 $10,234,273 $10.98 $14,106,000 $18.95 $7.97 $20.90 $8.791,375,833 91.17% 1,254,410 46 $3.66 $5,039,606 0.260 $0.064 $88,592 0.059 $0.020 $27,033 $3.75 $5,155,231 $3.08 $4,231,800 $6.82 $9,387,031 $0.81 $1,111,458 $7.63 $10,498,489 $10.25 $14,106,000 $17.88 $7.63 $19.61 $8.371,469,255 91.63% 1,346,257 45 $3.61 $5,303,145 0.257 $0.063 $93,267 0.059 $0.020 $28,868 $3.69 $5,425,280 $2.88 $4,231,800 $6.57 $9,657,080 $0.76 $1,111,458 $7.33 $10,768,538 $9.60 $14,106,000 $16.93 $7.33 $18.48 $8.001,579,187 92.26% 1,456,881 44 $3.55 $5,613,260 0.253 $0.063 $98,767 0.059 $0.020 $31,028 $3.64 $5,743,056 $2.68 $4,231,800 $6.32 $9,974,856 $0.70 $1,111,458 $7.02 $11,086,314 $8.93 $14,106,000 $15.95 $7.02 $17.29 $7.611,689,577 92.32% 1,559,839 44 $3.51 $5,924,667 0.250 $0.062 $104,291 0.059 $0.020 $33,197 $3.59 $6,062,156 $2.50 $4,231,800 $6.09 $10,293,956 $0.66 $1,111,458 $6.75 $11,405,414 $8.35 $14,106,000 $15.10 $6.75 $16.36 $7.311,767,662 92.79% 1,640,238 43 $3.48 $6,144,944 0.248 $0.061 $108,198 0.059 $0.020 $34,732 $3.56 $6,287,874 $2.39 $4,231,800 $5.95 $10,519,674 $0.63 $1,111,458 $6.58 $11,631,132 $7.98 $14,106,000 $14.56 $6.58 $15.69 $7.091,825,206 92.59% 1,690,015 43 $3.46 $6,307,272 0.246 $0.061 $111,078 0.059 $0.020 $35,862 $3.54 $6,454,212 $2.32 $4,231,800 $5.85 $10,686,012 $0.61 $1,111,458 $6.46 $11,797,470 $7.73 $14,106,000 $14.19 $6.46 $15.33 $6.981,853,047 92.83% 1,720,240 43 $3.45 $6,385,811 0.246 $0.061 $112,471 0.059 $0.020 $36,409 $3.53 $6,534,692 $2.28 $4,231,800 $5.81 $10,766,492 $0.60 $1,111,458 $6.41 $11,877,949 $7.61 $14,106,000 $14.02 $6.41 $15.10 $6.901,928,978 92.93% 1,792,554 43 $3.42 $6,600,009 0.244 $0.060 $116,270 0.059 $0.020 $37,901 $3.50 $6,754,181 $2.19 $4,231,800 $5.70 $10,985,981 $0.58 $1,111,458 $6.27 $12,097,438 $7.31 $14,106,000 $13.58 $6.27 $14.62 $6.751,930,159 92.73% 1,789,747 43 $3.42 $6,603,342 0.244 $0.060 $116,329 0.059 $0.020 $37,925 $3.50 $6,757,596 $2.19 $4,231,800 $5.69 $10,989,396 $0.58 $1,111,458 $6.27 $12,100,854 $7.31 $14,106,000 $13.58 $6.27 $14.64 $6.761,945,309 92.53% 1,800,067 43 $3.42 $6,646,080 0.243 $0.060 $117,087 0.059 $0.020 $38,222 $3.50 $6,801,389 $2.18 $4,231,800 $5.67 $11,033,189 $0.57 $1,111,458 $6.24 $12,144,647 $7.25 $14,106,000 $13.49 $6.24 $14.58 $6.751,973,465 92.77% 1,830,770 43 $3.41 $6,725,508 0.243 $0.060 $118,496 0.059 $0.020 $38,775 $3.49 $6,882,779 $2.14 $4,231,800 $5.63 $11,114,579 $0.56 $1,111,458 $6.20 $12,226,037 $7.15 $14,106,000 $13.34 $6.20 $14.38 $6.681,932,117 93.31% 1,802,765 43 $3.42 $6,608,865 0.244 $0.060 $116,427 0.059 $0.020 $37,963 $3.50 $6,763,255 $2.19 $4,231,800 $5.69 $10,995,055 $0.58 $1,111,458 $6.27 $12,106,513 $7.30 $14,106,000 $13.57 $6.27 $14.54 $6.721,871,139 93.76% 1,754,309 43 $3.44 $6,436,849 0.245 $0.061 $113,376 0.059 $0.020 $36,765 $3.52 $6,586,990 $2.26 $4,231,800 $5.78 $10,818,790 $0.59 $1,111,458 $6.38 $11,930,248 $7.54 $14,106,000 $13.91 $6.38 $14.84 $6.801,759,397 93.97% 1,653,301 43 $3.48 $6,121,628 0.248 $0.061 $107,785 0.059 $0.020 $34,569 $3.56 $6,263,982 $2.41 $4,231,800 $5.97 $10,495,782 $0.63 $1,111,458 $6.60 $11,607,240 $8.02 $14,106,000 $14.61 $6.60 $15.55 $7.021,630,691 94.17% 1,535,617 44 $3.53 $5,758,552 0.251 $0.062 $101,345 0.059 $0.020 $32,040 $3.61 $5,891,937 $2.60 $4,231,800 $6.21 $10,123,737 $0.68 $1,111,458 $6.89 $11,235,195 $8.65 $14,106,000 $15.54 $6.89 $16.50 $7.321,454,203 94.13% 1,368,818 45 $3.62 $5,260,685 0.257 $0.064 $92,514 0.059 $0.020 $28,573 $3.70 $5,381,771 $2.91 $4,231,800 $6.61 $9,613,571 $0.76 $1,111,458 $7.38 $10,725,029 $9.70 $14,106,000 $17.08 $7.38 $18.14 $7.841,279,225 94.12% 1,203,987 47 $3.73 $4,767,077 0.265 $0.065 $83,758 0.059 $0.020 $25,135 $3.81 $4,875,970 $3.31 $4,231,800 $7.12 $9,107,770 $0.87 $1,111,458 $7.99 $10,219,228 $11.03 $14,106,000 $19.02 $7.99 $20.20 $8.491,162,624 94.17% 1,094,799 48 $3.82 $4,438,148 0.271 $0.067 $77,924 0.059 $0.020 $22,844 $3.90 $4,538,916 $3.64 $4,231,800 $7.54 $8,770,716 $0.96 $1,111,458 $8.50 $9,882,174 $12.13 $14,106,000 $20.63 $8.50 $21.91 $9.031,035,014 94.21% 975,058 49 $3.94 $4,078,166 0.280 $0.069 $71,539 0.059 $0.020 $20,336 $4.03 $4,170,041 $4.09 $4,231,800 $8.12 $8,401,841 $1.07 $1,111,458 $9.19 $9,513,299 $13.63 $14,106,000 $22.82 $9.19 $24.22 $9.76
916,536 94.23% 863,693 43 $3.48 $3,186,701 0.246 $0.061 $55,736 0.030 $0.010 $9,004 $3.55 $3,251,441 $3.20 $2,931,000 $6.75 $6,182,441 $0.68 $626,370 $7.43 $6,808,811 $10.66 $9,770,000 $18.09 $7.43 $19.20 $7.88789,467 94.10% 742,875 45 $3.58 $2,828,245 0.253 $0.063 $49,377 0.030 $0.010 $7,756 $3.65 $2,885,378 $3.71 $2,931,000 $7.37 $5,816,378 $0.79 $626,370 $8.16 $6,442,748 $12.38 $9,770,000 $20.54 $8.16 $21.82 $8.67650,000 93.78% 609,586 47 $3.75 $2,434,811 0.264 $0.065 $42,399 0.030 $0.010 $6,386 $3.82 $2,483,596 $4.51 $2,931,000 $8.33 $5,414,596 $0.96 $626,370 $9.29 $6,040,966 $15.03 $9,770,000 $24.32 $9.29 $25.94 $9.91509,896 93.75% 478,033 50 $4.00 $2,039,582 0.281 $0.069 $35,388 0.030 $0.010 $5,009 $4.08 $2,079,980 $5.75 $2,931,000 $9.83 $5,010,980 $1.23 $626,370 $11.06 $5,637,350 $19.16 $9,770,000 $30.22 $11.06 $32.23 $11.79430,515 93.64% 403,127 53 $4.22 $1,815,651 0.295 $0.073 $31,416 0.030 $0.010 $4,229 $4.30 $1,851,297 $6.81 $2,931,000 $11.11 $4,782,297 $1.45 $626,370 $12.56 $5,408,667 $22.69 $9,770,000 $35.26 $12.56 $37.65 $13.42358,009 93.42% 334,468 56 $4.50 $1,611,113 0.314 $0.078 $27,788 0.030 $0.010 $3,517 $4.59 $1,642,419 $8.19 $2,931,000 $12.77 $4,573,419 $1.75 $626,370 $14.52 $5,199,789 $27.29 $9,770,000 $41.81 $14.52 $44.76 $15.55286,873 93.29% 267,612 61 $4.92 $1,410,441 0.342 $0.084 $24,229 0.030 $0.010 $2,818 $5.01 $1,437,488 $10.22 $2,931,000 $15.23 $4,368,488 $2.18 $626,370 $17.41 $4,994,858 $34.06 $9,770,000 $51.47 $17.41 $55.17 $18.66228,691 93.11% 212,934 68 $5.45 $1,246,311 0.377 $0.093 $21,318 0.030 $0.010 $2,247 $5.55 $1,269,875 $12.82 $2,931,000 $18.37 $4,200,875 $2.74 $626,370 $21.11 $4,827,246 $42.72 $9,770,000 $63.83 $21.11 $68.55 $22.67190,732 93.01% 177,391 75 $5.97 $1,139,230 0.412 $0.102 $19,418 0.030 $0.010 $1,874 $6.08 $1,160,522 $15.37 $2,931,000 $21.45 $4,091,522 $3.28 $626,370 $24.74 $4,717,893 $51.22 $9,770,000 $75.96 $24.74 $81.67 $26.60143,113 93.04% 133,157 88 $7.02 $1,004,899 0.482 $0.119 $17,036 0.030 $0.010 $1,406 $7.15 $1,023,341 $20.48 $2,931,000 $27.63 $3,954,341 $4.38 $626,370 $32.01 $4,580,711 $68.27 $9,770,000 $100.28 $32.01 $107.77 $34.40
93,482 92.89% 86,831 116 $9.25 $864,890 0.630 $0.156 $14,552 0.030 $0.010 $918 $9.42 $880,360 $31.35 $2,931,000 $40.77 $3,811,360 $6.70 $626,370 $47.47 $4,437,731 $104.51 $9,770,000 $151.98 $47.47 $163.63 $51.1165,739 91.82% 60,364 150 $11.97 $786,628 0.810 $0.200 $13,164 0.030 $0.010 $646 $12.18 $800,438 $44.59 $2,931,000 $56.76 $3,731,438 $9.53 $626,370 $66.29 $4,357,809 $148.62 $9,770,000 $214.91 $66.29 $234.04 $72.1948,557 90.27% 43,831 190 $15.20 $738,160 1.025 $0.253 $12,304 0.030 $0.010 $477 $15.47 $750,941 $60.36 $2,931,000 $75.83 $3,681,941 $12.90 $626,370 $88.73 $4,308,311 $201.21 $9,770,000 $289.93 $88.73 $321.19 $98.29
42,346,308 39,127,100 $19.53 $8.05 $21.14 $8.71
Service Factor 95% POWER COST $80.00 $/MW PLANT CAPEX TOTAL $141,060,000Hours/Year Op. 8322 $0.08 $/kW PRIMARY SEPARATION $17,770,000
COMP.+DEHY. $43,360,000NATURAL GAS COST $7.00 $/Mf3 OSBL $36,570,000
$7.00 $/28.3 m3
$0.25 $/m3
TEG COST $12.50 $/gal$3.30 $/l$3.00 $/kg
Power $6,725,508 $155,764,193Natural Gas $118,496 $2,731,122Chemicals $38,775 $759,386Maintenance & Other $4,231,800 $145,857,600Labour $1,111,458 $35,726,739Total $12,226,037 $340,839,041TABLE CONTINUED FROM PREVIOUS PAGE
CASE #1 NO CO2 SEPARATIONREINJECTED CO2 UNIT COST
FOB PLANT
OPERATING ONLY FOB
PLANT
AVERAGE PURE CO2 UNIT COST
Natural Gas TEG Total Utilities
UTILITIES COSTS
AVERAGE GAS UNIT COST
CO2 REINJECTEDGAS REINJECTED
FOB PLANT
OPERATING ONLY FOB
PLANT
REINJECTED GAS UNIT COST
Power
Other variable Costs (maintenance + others)
SubtotalManpower Add-in Fixed Costs (Capital
Charge)TOTAL OPEX PLANT
Case 1 Annual Cash OPEX Breakdown -Year 19
Labour9%
Power55%
Maintenance & Other35%
Natural Gas1%
Chemicals0.3%
Case 1 Annual Cash OPEX Breakdown - Overall ProjectLifetime
Natural Gas0.8%
Chemicals0.2%
Maintenance & Other43%
Labour10%
Power46%
ENHANCED HYDROCARBON RECOVERY STUDY (FINAL)Prepared for: Alberta Research Council (ARC) Rev. 1 Project 017935, September, 2008 App 4‐7 Chemicals and Petroleum
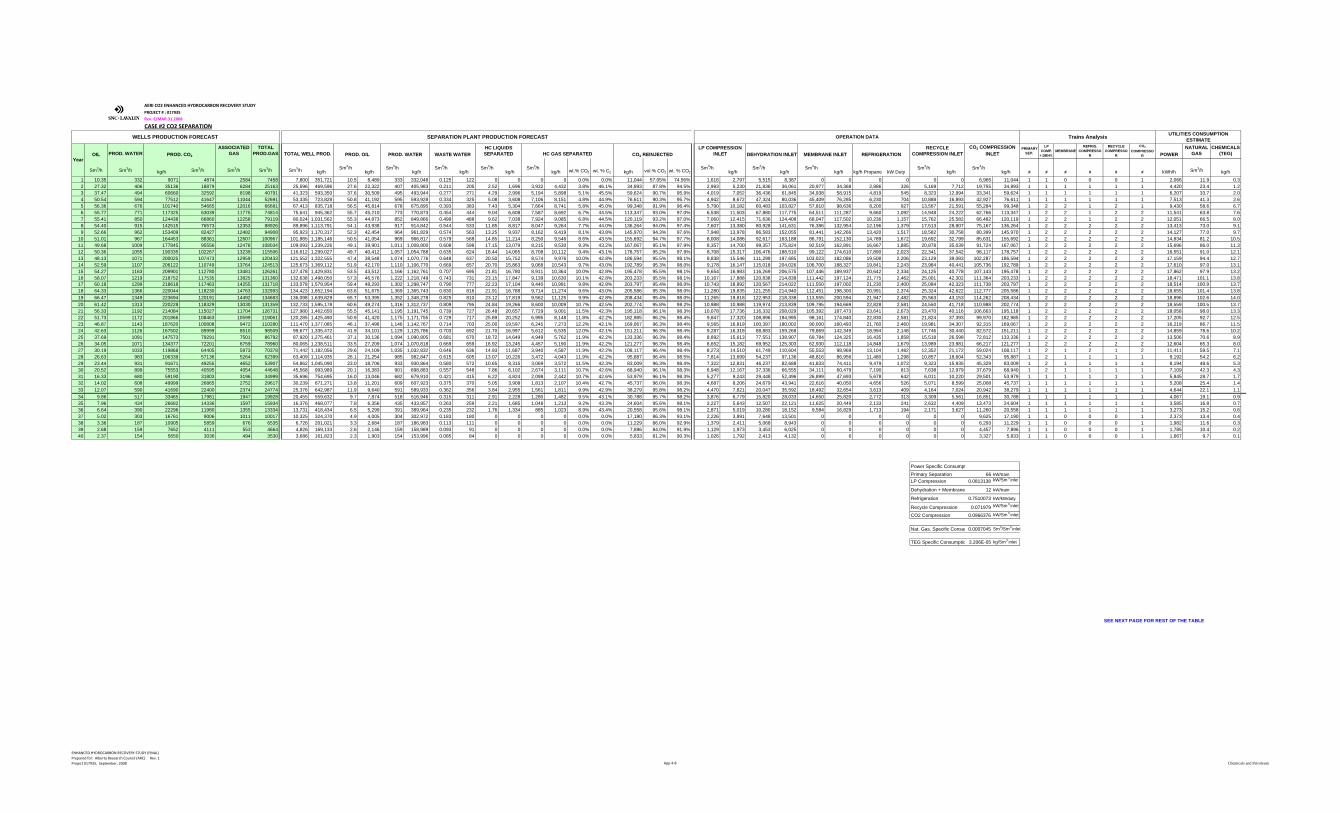
AERI CO2 ENHANCED HYDROCARBON RECOVERY STUDY
PROJECT # : 017935
Rev. E/MAR.31.2008
CASE #2 CO2 SEPARATION
OIL PROD. WATERASSOCIATED
GASTOTAL
PROD.GAS POWERNATURAL
GASCHEMICALS
(TEG)
Sm3/h Sm3/h kg/h Sm3/h Sm3/h Sm3/h Sm3/h kg/hSm3/h
kg/hSm3/h
kg/hSm3/h
kg/hSm3/h
kg/hSm3/h
kg/h wt.% CO2 wt. % C2 kg/h vol.% CO2 wt. % CO2Sm3/h
kg/hSm3/h
kg/hSm3/h
kg/h kg/h Propane kW DutySm3/h
kg/hSm3/h
kg/h # # # # # # kWh/h Sm3/h kg/h
1 10.35 332 9071 4874 2584 7458 7,800 351,721 10.5 8,489 333 332,048 0.125 122 0 0 0 0 0.0% 0.0% 11,044 57.05% 74.56% 1,616 2,797 5,515 8,387 0 0 0 0 0 0 6,965 11,044 1 1 0 0 0 1 2,066 11.9 0.32 27.32 406 35136 18879 6284 25163 25,596 469,596 27.6 22,322 407 405,983 0.211 205 2.52 1,696 3,932 4,432 3.8% 46.1% 34,893 87.8% 94.5% 2,993 5,230 21,836 36,061 20,977 34,368 2,886 326 5,169 7,712 19,755 34,893 1 1 1 1 1 1 4,420 23.4 1.23 37.47 494 60660 32592 8198 40791 41,323 593,350 37.6 30,509 495 493,944 0.277 271 4.29 2,996 5,194 5,898 5.1% 45.5% 59,624 90.7% 95.9% 4,019 7,052 36,436 61,845 34,938 58,915 4,819 545 8,323 12,994 33,341 59,624 1 1 1 1 1 1 6,207 33.7 2.04 50.54 594 77512 41647 11044 52691 53,335 723,828 50.8 41,192 595 593,928 0.334 325 5.08 3,608 7,106 8,151 4.8% 44.9% 76,611 90.3% 95.7% 4,942 8,672 47,324 80,036 45,409 76,285 6,230 704 10,888 16,893 42,927 76,611 1 1 1 1 1 1 7,513 41.3 2.65 56.36 676 101740 54665 12016 66681 67,413 835,718 56.5 45,814 678 675,895 0.393 383 7.43 5,304 7,664 8,741 5.8% 45.0% 99,348 91.9% 96.4% 5,790 10,182 60,483 103,827 57,810 98,636 8,200 927 13,567 21,591 55,284 99,348 1 2 2 1 2 1 9,430 58.6 6.76 55.77 771 117325 63039 11775 74814 75,641 945,362 55.7 45,210 773 770,873 0.454 444 9.04 6,608 7,587 8,692 6.7% 44.5% 113,347 93.0% 97.0% 6,538 11,503 67,880 117,775 64,511 111,287 9,660 1,092 14,948 24,222 62,766 113,347 1 2 2 1 2 2 11,541 63.8 7.67 55.41 850 124438 66860 12258 79119 80,024 1,031,562 55.3 44,873 852 849,866 0.499 488 9.62 7,038 7,924 9,085 6.8% 44.5% 120,119 93.2% 97.0% 7,060 12,415 71,636 124,408 68,047 117,502 10,236 1,157 15,762 25,582 66,482 120,119 1 2 2 1 2 2 12,051 66.5 8.08 54.40 915 142515 76573 12353 88926 89,896 1,113,791 54.1 43,938 917 914,842 0.544 533 11.85 8,817 8,047 9,264 7.7% 44.0% 136,264 94.0% 97.4% 7,607 13,380 80,928 141,631 76,386 132,954 12,196 1,379 17,513 28,807 75,167 136,264 1 2 2 2 2 2 13,413 73.0 9.19 52.66 962 153409 82427 12482 94908 95,923 1,170,317 52.3 42,454 964 961,829 0.574 563 13.25 9,937 8,162 9,419 8.1% 43.8% 145,970 94.3% 97.6% 7,948 13,978 86,583 152,055 81,441 142,266 13,420 1,517 18,582 30,758 80,399 145,970 1 2 2 2 2 2 14,127 77.0 9.7
10 51.01 967 164453 88361 12607 100967 101,985 1,185,146 50.5 41,054 969 966,817 0.579 568 14.85 11,214 8,250 9,546 8.6% 43.5% 155,692 94.7% 97.7% 8,008 14,086 92,617 163,188 86,791 152,130 14,789 1,672 19,692 32,799 85,631 155,692 1 2 2 2 2 2 14,834 81.2 10.511 49.68 1009 177845 95556 12478 108034 109,093 1,239,226 49.1 39,901 1,011 1,008,800 0.608 598 17.15 13,079 8,215 9,530 9.3% 43.2% 167,067 95.1% 97.9% 8,357 14,700 99,357 175,824 92,519 162,891 16,667 1,885 20,878 35,039 91,724 167,067 1 2 2 2 2 2 15,696 86.0 11.312 50.36 1055 190335 102267 13239 115506 116,612 1,299,027 49.7 40,412 1,057 1,054,788 0.635 624 18.44 14,065 8,708 10,112 9.4% 43.1% 178,757 95.2% 97.9% 8,708 15,317 106,476 188,510 99,122 174,610 17,890 2,023 22,341 37,542 98,117 178,757 1 2 2 2 2 2 16,551 91.0 12.113 48.13 1071 200025 107473 12959 120433 121,552 1,322,555 47.4 38,548 1,074 1,070,776 0.648 637 20.50 15,752 8,574 9,976 10.0% 42.8% 186,594 95.5% 98.1% 8,838 15,546 111,299 197,685 103,023 182,086 19,508 2,206 23,129 39,083 102,287 186,594 1 2 2 2 2 2 17,159 94.4 12.714 52.59 1107 206122 110749 13764 124513 125,673 1,369,112 51.9 42,170 1,110 1,106,770 0.669 657 20.70 15,863 9,068 10,543 9.7% 43.0% 192,789 95.3% 98.0% 9,178 16,147 115,018 204,026 106,700 188,327 19,841 2,243 23,984 40,441 105,736 192,789 1 2 2 2 2 2 17,610 97.0 13.115 54.27 1163 209901 112780 13481 126261 127,478 1,429,831 53.5 43,512 1,166 1,162,761 0.707 695 21.81 16,780 8,911 10,364 10.0% 42.8% 195,478 95.5% 98.1% 9,654 16,983 116,269 206,575 107,446 189,937 20,642 2,334 24,125 40,778 107,143 195,478 1 2 2 2 2 2 17,862 97.9 13.216 58.07 1219 218752 117535 13825 131360 132,638 1,498,050 57.3 46,576 1,222 1,218,749 0.743 731 23.15 17,847 9,139 10,630 10.1% 42.8% 203,233 95.5% 98.1% 10,167 17,888 120,838 214,838 111,442 197,124 21,775 2,462 25,001 42,302 111,364 203,233 1 2 2 2 2 2 18,471 101.1 13.817 60.18 1299 218618 117463 14255 131718 133,078 1,579,954 59.4 48,293 1,302 1,298,747 0.790 777 22.23 17,104 9,440 10,991 9.8% 42.8% 203,797 95.4% 98.0% 10,743 18,892 120,567 214,022 111,550 197,002 21,230 2,400 25,084 42,323 111,738 203,797 1 2 2 2 2 2 18,514 100.9 13.718 64.33 1366 220044 118230 14763 132993 134,423 1,652,194 63.6 51,675 1,369 1,365,743 0.830 816 21.91 16,788 9,714 11,274 9.6% 43.0% 205,586 95.3% 98.0% 11,280 19,835 121,255 214,940 112,451 198,300 20,991 2,374 25,324 42,622 112,777 205,586 1 2 2 2 2 2 18,655 101.4 13.819 66.47 1349 223694 120191 14492 134683 136,098 1,639,829 65.7 53,395 1,352 1,348,278 0.825 810 23.12 17,819 9,562 11,125 9.9% 42.8% 208,434 95.4% 98.0% 11,265 19,818 122,953 218,338 113,555 200,594 21,947 2,482 25,563 43,153 114,262 208,434 1 2 2 2 2 2 18,896 102.6 14.020 61.42 1313 220228 118329 13030 131359 132,733 1,595,178 60.6 49,274 1,316 1,312,737 0.809 795 24.84 19,266 8,600 10,009 10.7% 42.5% 202,774 95.8% 98.2% 10,988 10,988 119,974 213,839 109,795 194,669 22,828 2,581 24,550 41,718 110,988 202,774 1 2 2 2 2 2 18,559 100.5 13.721 56.33 1192 214084 115027 11704 126731 127,980 1,462,650 55.5 45,141 1,195 1,191,745 0.739 727 26.48 20,657 7,729 9,001 11.5% 42.3% 195,118 96.1% 98.3% 10,078 17,736 116,332 208,029 105,392 187,473 23,641 2,673 23,470 40,116 106,663 195,118 1 2 2 2 2 2 18,058 98.0 13.322 51.73 1172 201866 108463 10599 119061 120,285 1,425,490 50.9 41,420 1,175 1,171,755 0.729 717 25.89 20,252 6,995 8,148 11.8% 42.2% 182,985 96.2% 98.4% 9,847 17,320 108,896 194,995 98,161 174,840 22,830 2,581 21,824 37,393 99,970 182,985 1 2 2 2 2 2 17,205 92.7 12.523 46.87 1143 187620 100808 9472 110280 111,470 1,377,085 46.1 37,496 1,146 1,142,767 0.714 703 25.00 19,597 6,245 7,273 12.2% 42.1% 169,067 96.3% 98.4% 9,565 16,819 100,397 180,002 90,000 160,493 21,760 2,460 19,981 34,307 92,315 169,067 1 2 2 2 2 2 16,219 86.7 11.524 42.63 1126 167502 89999 8510 98509 99,677 1,335,472 41.9 34,101 1,129 1,125,786 0.703 692 21.70 16,997 5,612 6,535 12.0% 42.1% 151,211 96.3% 98.4% 9,287 16,318 88,883 159,268 79,869 142,349 18,994 2,148 17,746 30,440 82,572 151,211 1 2 2 2 2 2 14,859 78.6 10.225 37.69 1091 147573 79291 7501 86792 87,920 1,275,461 37.1 30,136 1,094 1,090,805 0.681 670 18.72 14,649 4,949 5,762 11.9% 42.2% 133,336 96.3% 98.4% 8,892 15,613 77,551 138,907 69,784 124,325 16,435 1,858 15,518 26,598 72,812 133,336 1 2 2 2 2 2 13,506 70.6 8.926 34.05 1071 134377 72201 6759 78960 80,065 1,238,511 33.5 27,209 1,074 1,070,818 0.669 659 16.92 13,245 4,457 5,190 11.9% 42.2% 121,277 96.3% 98.4% 8,652 15,182 69,952 125,303 62,930 112,118 14,848 1,679 13,989 23,981 66,217 121,277 1 2 2 2 2 2 12,604 65.3 8.027 30.19 1033 119868 64405 5973 70378 71,442 1,182,056 29.6 24,109 1,035 1,032,832 0.646 636 14.93 11,687 3,940 4,587 11.9% 42.2% 108,117 96.4% 98.4% 8,273 14,510 61,749 110,604 55,553 98,969 13,104 1,482 12,352 21,172 59,024 108,117 1 2 1 2 1 2 11,411 59.5 7.128 26.63 983 106339 57136 5264 62399 63,409 1,114,935 26.1 21,254 985 982,847 0.615 605 13.07 10,226 3,472 4,043 11.9% 42.2% 95,887 96.4% 98.5% 7,814 13,699 54,237 97,136 48,816 86,956 11,480 1,298 10,857 18,604 52,343 95,887 1 2 1 1 1 1 9,192 54.2 6.229 23.44 931 91671 49255 4652 53907 54,862 1,045,090 23.0 18,706 933 930,864 0.580 572 10.65 8,315 3,069 3,572 11.5% 42.3% 83,009 96.3% 98.4% 7,322 12,831 46,237 82,688 41,833 74,411 9,479 1,072 9,323 15,935 45,329 83,009 1 2 1 1 1 1 8,194 48.6 5.330 20.52 899 75553 40595 4054 44648 45,568 993,989 20.1 16,383 901 898,883 0.557 548 7.86 6,102 2,674 3,111 10.7% 42.6% 68,940 96.1% 98.3% 6,948 12,167 37,336 66,555 34,111 60,479 7,190 813 7,638 12,979 37,679 68,940 1 2 1 1 1 1 7,109 42.3 4.331 16.33 680 59190 31803 3196 34999 35,696 754,695 16.0 13,046 682 679,910 0.421 415 6.22 4,824 2,098 2,442 10.7% 42.6% 53,979 96.1% 98.3% 5,277 9,243 29,448 52,496 26,899 47,693 5,678 642 6,011 10,220 29,501 53,979 1 1 1 1 1 1 5,845 28.7 1.732 14.02 608 49999 26865 2752 29617 30,239 671,271 13.8 11,201 609 607,923 0.375 370 5.05 3,908 1,813 2,107 10.4% 42.7% 45,737 96.0% 98.3% 4,687 8,206 24,679 43,941 22,616 40,050 4,656 526 5,071 8,599 25,008 45,737 1 1 1 1 1 1 5,208 25.4 1.433 12.07 590 41690 22400 2374 24774 25,376 642,987 11.9 9,640 591 589,933 0.362 356 3.84 2,955 1,561 1,811 9.9% 42.9% 38,279 95.8% 98.2% 4,470 7,821 20,047 35,592 18,492 32,654 3,613 409 4,164 7,024 20,942 38,279 1 1 1 1 1 1 4,644 22.1 1.134 9.86 517 33465 17981 1947 19928 20,455 559,632 9.7 7,874 518 516,946 0.315 311 2.91 2,228 1,280 1,482 9.5% 43.1% 30,788 95.7% 98.2% 3,876 6,779 15,820 28,033 14,650 25,820 2,772 313 3,309 5,561 16,851 30,788 1 1 1 1 1 1 4,067 19.1 0.935 7.96 434 26682 14336 1597 15934 16,376 468,077 7.8 6,356 435 433,957 0.263 259 2.21 1,685 1,048 1,213 9.2% 43.3% 24,604 95.6% 98.1% 3,227 5,643 12,507 22,121 11,625 20,449 2,133 241 2,632 4,409 13,473 24,604 1 1 1 1 1 1 3,585 16.8 0.736 6.64 390 22296 11980 1355 13334 13,731 418,434 6.5 5,299 391 389,964 0.235 232 1.76 1,334 885 1,023 8.9% 43.4% 20,558 95.6% 98.1% 2,871 5,019 10,280 18,152 9,584 16,829 1,713 194 2,171 3,627 11,260 20,558 1 1 1 1 1 1 3,273 15.2 0.637 5.02 303 16761 9006 1011 10017 10,325 324,370 4.9 4,005 304 302,972 0.183 180 0 0 0 0 0.0% 0.0% 17,190 86.3% 93.1% 2,226 3,891 7,648 13,501 0 0 0 0 0 0 9,625 17,190 1 1 0 0 0 1 2,373 13.4 0.438 3.36 187 10905 5859 676 6535 6,726 201,021 3.3 2,684 187 186,983 0.113 111 0 0 0 0 0.0% 0.0% 11,229 86.0% 92.9% 1,379 2,411 5,068 8,943 0 0 0 0 0 0 6,293 11,229 1 1 0 0 0 1 1,982 11.6 0.339 2.68 159 7652 4111 553 4664 4,826 169,133 2.6 2,146 159 158,989 0.093 91 0 0 0 0 0.0% 0.0% 7,896 84.0% 91.9% 1,129 1,973 3,453 6,025 0 0 0 0 0 0 4,457 7,896 1 1 0 0 0 1 1,785 10.4 0.240 2.37 154 5650 3036 494 3530 3,686 161,823 2.3 1,903 154 153,996 0.085 84 0 0 0 0 0.0% 0.0% 5,833 81.2% 90.3% 1,026 1,792 2,413 4,132 0 0 0 0 0 0 3,327 5,833 1 1 0 0 0 1 1,667 9.7 0.1
66 kW/train0.0813138 kW/Sm3 inlet
12 kW/train
0.7510073 kW/kWduty
0.071979 kW/Sm3 inlet
0.0966376 kW/Sm3 inlet
0.0007045 Sm3/Sm3 inlet
3.206E-05 kg/Sm3 inlet
SEE NEXT PAGE FOR REST OF THE TABLE
Power Specific Consumpt
Primary SeparationLP Compression
Dehydration + Membrane
Refrigeration
Recycle Compression
CO2 Compression
Nat. Gas. Specific Consum
TEG Specific Consumptio
PROD. CO2
WELLS PRODUCTION FORECAST
YearTOTAL WELL PROD.
UTILITIES CONSUMPTION ESTIMATE
WASTE WATERPROD. OIL PROD. WATER CO2 REINJECTEDHC LIQUIDS SEPARATED
Trains Analysis
HC GAS SEPARATEDLP
COMP. + DEHY.
CO2
COMPRESSOR
SEPARATION PLANT PRODUCTION FORECAST OPERATION DATA
CO2 COMPRESSION INLETDEHYDRATION INLET
LP COMPRESSION INLET MEMBRANE INLET REFRIGERATION
RECYCLE COMPRESSION INLET
PRIMARY SEP.
REFRIG. COMPRESSO
RMEMBRANE
RECYCLE COMPRESSO
R
ENHANCED HYDROCARBON RECOVERY STUDY (FINAL)Prepared for: Alberta Research Council (ARC) Rev. 1 Project 017935, September, 2008 App 4‐8 Chemicals and Petroleum
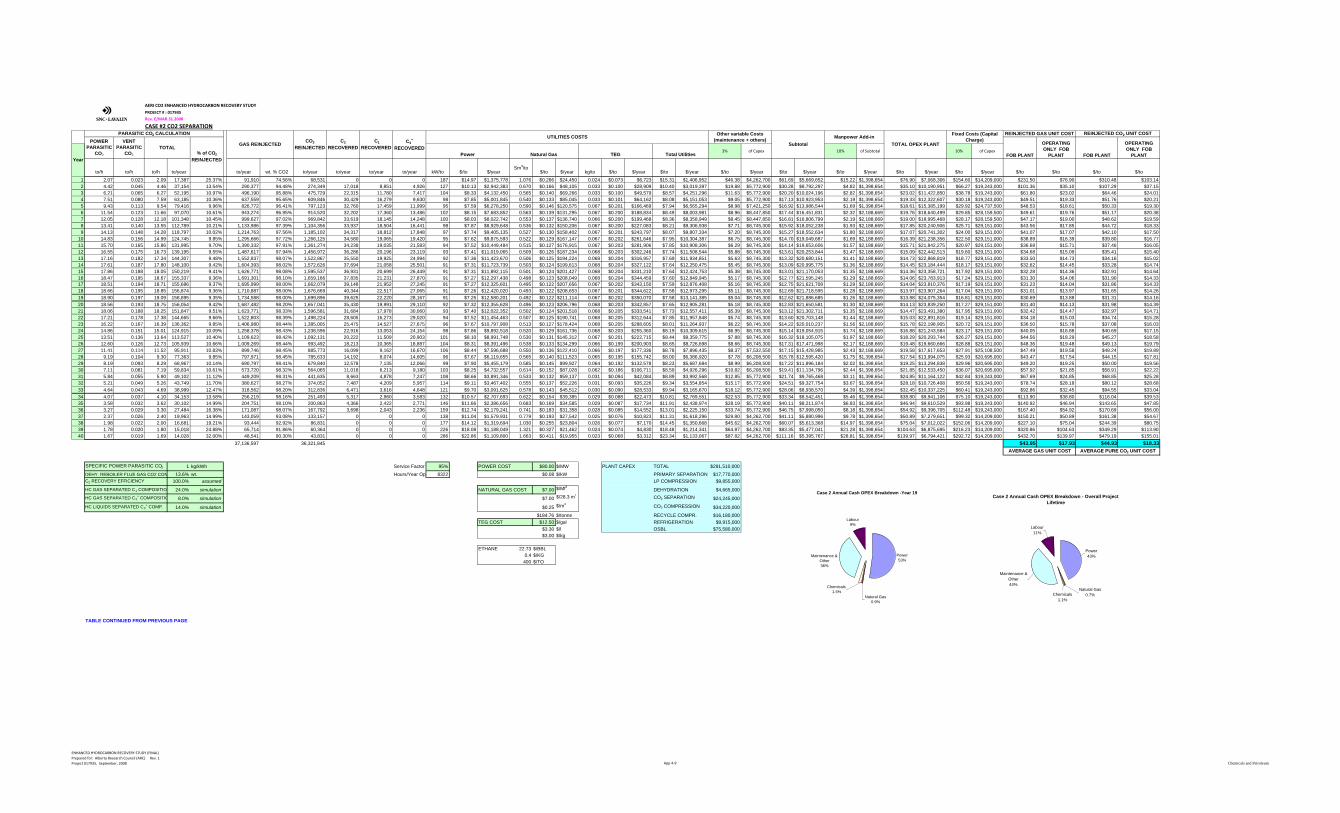
123456789
10111213141516171819202122232425262728293031323334353637383940
Year
AERI CO2 ENHANCED HYDROCARBON RECOVERY STUDY
PROJECT # : 017935
Rev. E/MAR.31.2008
CASE #2 CO2 SEPARATION
3% of Capex 10% of Subtotal 10% of Capex
to/h to/h to/h to/year to/year wt. % CO2 to/year to/year to/year to/year kW/to $/to $/yearSm3/to
$/to $/year kg/to $/to $/year $/to $/year $/to $/year $/to $/year $/to $/year $/to $/year $/to $/year $/to $/to $/to $/to
2.07 0.023 2.09 17,387 25.37% 91,910 74.56% 68,531 0 0 0 187 $14.97 $1,375,778 1.076 $0.266 $24,450 0.024 $0.073 $6,723 $15.31 $1,406,952 $46.38 $4,262,700 $61.69 $5,669,652 $15.22 $1,398,654 $76.90 $7,068,306 $154.60 $14,209,000 $231.50 $76.90 $310.48 $103.144.42 0.045 4.46 37,154 13.54% 290,377 94.48% 274,349 17,018 8,851 4,926 127 $10.13 $2,942,383 0.670 $0.166 $48,105 0.033 $0.100 $28,909 $10.40 $3,019,397 $19.88 $5,772,900 $30.28 $8,792,297 $4.82 $1,398,654 $35.10 $10,190,951 $66.27 $19,243,000 $101.36 $35.10 $107.29 $37.156.21 0.065 6.27 52,195 10.97% 496,190 95.88% 475,729 22,315 11,780 7,417 104 $8.33 $4,132,450 0.565 $0.140 $69,266 0.033 $0.100 $49,579 $8.57 $4,251,296 $11.63 $5,772,900 $20.20 $10,024,196 $2.82 $1,398,654 $23.02 $11,422,850 $38.78 $19,243,000 $61.80 $23.02 $64.46 $24.017.51 0.080 7.59 63,185 10.36% 637,559 95.65% 609,846 30,429 16,279 9,630 98 $7.85 $5,001,845 0.540 $0.133 $85,045 0.033 $0.101 $64,162 $8.08 $5,151,053 $9.05 $5,772,900 $17.13 $10,923,953 $2.19 $1,398,654 $19.33 $12,322,607 $30.18 $19,243,000 $49.51 $19.33 $51.76 $20.219.43 0.113 9.54 79,416 9.96% 826,772 96.41% 797,123 32,760 17,459 11,999 95 $7.59 $6,278,250 0.590 $0.146 $120,575 0.067 $0.201 $166,469 $7.94 $6,565,294 $8.98 $7,421,250 $16.92 $13,986,544 $1.69 $1,398,654 $18.61 $15,385,199 $29.92 $24,737,500 $48.53 $18.61 $50.33 $19.30
11.54 0.123 11.66 97,070 10.61% 943,274 96.95% 914,520 32,202 17,360 13,486 102 $8.15 $7,683,852 0.563 $0.139 $131,295 0.067 $0.200 $188,834 $8.49 $8,003,981 $8.96 $8,447,850 $17.44 $16,451,831 $2.32 $2,188,669 $19.76 $18,640,499 $29.85 $28,159,500 $49.61 $19.76 $51.17 $20.3812.05 0.128 12.18 101,348 10.45% 999,627 97.02% 969,842 33,619 18,145 14,248 100 $8.03 $8,022,742 0.553 $0.137 $136,740 0.066 $0.200 $199,468 $8.36 $8,358,949 $8.45 $8,447,850 $16.81 $16,806,799 $2.19 $2,188,669 $19.00 $18,995,468 $28.17 $28,159,500 $47.17 $19.00 $48.62 $19.5913.41 0.140 13.55 112,789 10.21% 1,133,986 97.39% 1,104,356 33,937 18,504 16,441 98 $7.87 $8,929,648 0.536 $0.132 $150,206 0.067 $0.200 $227,083 $8.21 $9,306,938 $7.71 $8,745,300 $15.92 $18,052,238 $1.93 $2,188,669 $17.85 $20,240,906 $25.71 $29,151,000 $43.56 $17.85 $44.72 $18.3314.13 0.148 14.28 118,797 10.02% 1,214,763 97.56% 1,185,102 34,317 18,812 17,848 97 $7.74 $9,405,135 0.527 $0.130 $158,402 0.067 $0.201 $243,797 $8.07 $9,807,334 $7.20 $8,745,300 $15.27 $18,552,634 $1.80 $2,188,669 $17.07 $20,741,302 $24.00 $29,151,000 $41.07 $17.07 $42.10 $17.5014.83 0.156 14.99 124,745 9.85% 1,295,666 97.72% 1,266,125 34,580 19,065 19,420 95 $7.62 $9,875,593 0.522 $0.129 $167,147 0.067 $0.202 $261,646 $7.95 $10,304,387 $6.75 $8,745,300 $14.70 $19,049,687 $1.69 $2,188,669 $16.39 $21,238,356 $22.50 $29,151,000 $38.89 $16.39 $39.80 $16.7715.70 0.165 15.86 131,995 9.70% 1,390,332 97.91% 1,361,274 34,238 19,035 21,583 94 $7.52 $10,449,484 0.515 $0.127 $176,915 0.067 $0.203 $281,906 $7.85 $10,908,306 $6.29 $8,745,300 $14.14 $19,653,606 $1.57 $2,188,669 $15.71 $21,842,275 $20.97 $29,151,000 $36.68 $15.71 $37.46 $16.0516.55 0.175 16.73 139,195 9.55% 1,487,617 97.94% 1,456,972 36,286 20,196 23,119 93 $7.41 $11,019,065 0.509 $0.126 $187,234 0.068 $0.203 $302,246 $7.74 $11,508,544 $5.88 $8,745,300 $13.61 $20,253,844 $1.47 $2,188,669 $15.09 $22,442,513 $19.60 $29,151,000 $34.68 $15.09 $35.41 $15.4017.16 0.182 17.34 144,307 9.48% 1,552,837 98.07% 1,522,867 35,550 19,925 24,994 92 $7.36 $11,423,670 0.506 $0.125 $194,224 0.068 $0.204 $316,957 $7.69 $11,934,851 $5.63 $8,745,300 $13.32 $20,680,151 $1.41 $2,188,669 $14.73 $22,868,819 $18.77 $29,151,000 $33.50 $14.73 $34.16 $15.0217.61 0.187 17.80 148,100 9.42% 1,604,393 98.02% 1,572,626 37,694 21,058 25,501 91 $7.31 $11,723,739 0.503 $0.124 $199,613 0.068 $0.204 $327,122 $7.64 $12,250,475 $5.45 $8,745,300 $13.09 $20,995,775 $1.36 $2,188,669 $14.45 $23,184,444 $18.17 $29,151,000 $32.62 $14.45 $33.28 $14.7417.86 0.188 18.05 150,219 9.41% 1,626,771 98.08% 1,595,537 36,931 20,699 26,449 91 $7.31 $11,892,115 0.501 $0.124 $201,427 0.068 $0.204 $331,210 $7.64 $12,424,753 $5.38 $8,745,300 $13.01 $21,170,053 $1.35 $2,188,669 $14.36 $23,358,721 $17.92 $29,151,000 $32.28 $14.36 $32.91 $14.6418.47 0.195 18.67 155,337 9.36% 1,691,301 98.10% 1,659,166 37,835 21,231 27,870 91 $7.27 $12,297,438 0.498 $0.123 $208,049 0.068 $0.204 $344,459 $7.60 $12,849,945 $5.17 $8,745,300 $12.77 $21,595,245 $1.29 $2,188,669 $14.06 $23,783,913 $17.24 $29,151,000 $31.30 $14.06 $31.90 $14.3318.51 0.194 18.71 155,686 9.37% 1,695,999 98.00% 1,662,079 39,148 21,952 27,245 91 $7.27 $12,325,601 0.495 $0.122 $207,656 0.067 $0.202 $343,150 $7.59 $12,876,408 $5.16 $8,745,300 $12.75 $21,621,708 $1.29 $2,188,669 $14.04 $23,810,376 $17.19 $29,151,000 $31.23 $14.04 $31.86 $14.3318.66 0.195 18.85 156,874 9.36% 1,710,887 98.00% 1,676,669 40,344 22,517 27,065 91 $7.26 $12,420,020 0.493 $0.122 $208,653 0.067 $0.201 $344,622 $7.58 $12,973,295 $5.11 $8,745,300 $12.69 $21,718,595 $1.28 $2,188,669 $13.97 $23,907,264 $17.04 $29,151,000 $31.01 $13.97 $31.65 $14.2618.90 0.197 19.09 158,895 9.35% 1,734,588 98.00% 1,699,896 39,625 22,220 28,167 91 $7.25 $12,580,201 0.492 $0.122 $211,114 0.067 $0.202 $350,070 $7.58 $13,141,385 $5.04 $8,745,300 $12.62 $21,886,685 $1.26 $2,188,669 $13.88 $24,075,354 $16.81 $29,151,000 $30.69 $13.88 $31.31 $14.1618.56 0.193 18.75 156,054 9.42% 1,687,482 98.20% 1,657,041 35,430 19,991 29,110 92 $7.32 $12,355,628 0.496 $0.123 $206,796 0.068 $0.203 $342,857 $7.65 $12,905,281 $5.18 $8,745,300 $12.83 $21,650,581 $1.30 $2,188,669 $14.13 $23,839,250 $17.27 $29,151,000 $31.40 $14.13 $31.98 $14.3918.06 0.188 18.25 151,847 9.51% 1,623,771 98.33% 1,596,581 31,684 17,978 30,060 93 $7.40 $12,022,352 0.502 $0.124 $201,518 0.068 $0.205 $333,541 $7.73 $12,557,411 $5.39 $8,745,300 $13.12 $21,302,711 $1.35 $2,188,669 $14.47 $23,491,380 $17.95 $29,151,000 $32.42 $14.47 $32.97 $14.7117.21 0.178 17.38 144,665 9.66% 1,522,803 98.39% 1,498,224 28,605 16,273 29,020 94 $7.52 $11,454,463 0.507 $0.125 $190,741 0.068 $0.205 $312,644 $7.85 $11,957,848 $5.74 $8,745,300 $13.60 $20,703,148 $1.44 $2,188,669 $15.03 $22,891,816 $19.14 $29,151,000 $34.18 $15.03 $34.74 $15.2816.22 0.167 16.39 136,362 9.85% 1,406,980 98.44% 1,385,005 25,475 14,527 27,675 96 $7.67 $10,797,908 0.513 $0.127 $178,424 0.068 $0.205 $288,605 $8.01 $11,264,937 $6.22 $8,745,300 $14.22 $20,010,237 $1.56 $2,188,669 $15.78 $22,198,905 $20.72 $29,151,000 $36.50 $15.78 $37.08 $16.0314.86 0.151 15.01 124,915 10.09% 1,258,378 98.43% 1,238,596 22,916 13,053 24,154 98 $7.86 $9,892,518 0.520 $0.129 $161,736 0.068 $0.203 $255,360 $8.19 $10,309,615 $6.95 $8,745,300 $15.14 $19,054,915 $1.74 $2,188,669 $16.88 $21,243,584 $23.17 $29,151,000 $40.05 $16.88 $40.69 $17.1513.51 0.136 13.64 113,527 10.40% 1,109,623 98.42% 1,092,131 20,222 11,509 20,903 101 $8.10 $8,991,748 0.530 $0.131 $145,312 0.067 $0.201 $222,715 $8.44 $9,359,775 $7.88 $8,745,300 $16.32 $18,105,075 $1.97 $2,188,669 $18.29 $20,293,744 $26.27 $29,151,000 $44.56 $18.29 $45.27 $18.5812.60 0.126 12.73 105,939 10.66% 1,009,269 98.44% 993,492 18,213 10,365 18,887 104 $8.31 $8,391,496 0.538 $0.133 $134,299 0.066 $0.199 $200,903 $8.65 $8,726,698 $8.66 $8,745,300 $17.31 $17,471,998 $2.17 $2,188,669 $19.48 $19,660,666 $28.88 $29,151,000 $48.36 $19.48 $49.13 $19.7911.41 0.114 11.52 95,911 10.83% 899,746 98.45% 885,773 16,099 9,162 16,670 106 $8.44 $7,596,688 0.550 $0.136 $122,410 0.066 $0.197 $177,336 $8.78 $7,896,435 $8.37 $7,532,550 $17.15 $15,428,985 $2.43 $2,188,669 $19.58 $17,617,653 $27.91 $25,108,500 $47.49 $19.58 $48.24 $19.89
9.19 0.104 9.30 77,363 9.85% 797,971 98.45% 785,633 14,192 8,074 14,605 96 $7.67 $6,119,655 0.565 $0.140 $111,523 0.065 $0.195 $155,742 $8.00 $6,386,920 $7.78 $6,208,500 $15.78 $12,595,420 $1.75 $1,398,654 $17.54 $13,994,075 $25.93 $20,695,000 $43.47 $17.54 $44.15 $17.818.19 0.093 8.29 68,967 10.14% 690,797 98.41% 679,840 12,578 7,135 12,066 99 $7.90 $5,455,179 0.585 $0.145 $99,927 0.064 $0.192 $132,578 $8.23 $5,687,684 $8.99 $6,208,500 $17.22 $11,896,184 $2.02 $1,398,654 $19.25 $13,294,838 $29.96 $20,695,000 $49.20 $19.25 $50.00 $19.567.11 0.081 7.19 59,834 10.61% 573,720 98.32% 564,065 11,018 6,213 9,180 103 $8.25 $4,732,557 0.614 $0.152 $87,028 0.062 $0.186 $106,711 $8.59 $4,926,296 $10.82 $6,208,500 $19.41 $11,134,796 $2.44 $1,398,654 $21.85 $12,533,450 $36.07 $20,695,000 $57.92 $21.85 $58.91 $22.225.84 0.055 5.90 49,102 11.12% 449,209 98.31% 441,635 8,663 4,878 7,247 108 $8.66 $3,891,346 0.533 $0.132 $59,137 0.031 $0.094 $42,084 $8.89 $3,992,568 $12.85 $5,772,900 $21.74 $9,765,468 $3.11 $1,398,654 $24.85 $11,164,122 $42.84 $19,243,000 $67.69 $24.85 $68.85 $25.285.21 0.049 5.26 43,749 11.70% 380,627 98.27% 374,052 7,487 4,209 5,957 114 $9.11 $3,467,402 0.555 $0.137 $52,226 0.031 $0.093 $35,226 $9.34 $3,554,854 $15.17 $5,772,900 $24.51 $9,327,754 $3.67 $1,398,654 $28.18 $10,726,408 $50.56 $19,243,000 $78.74 $28.18 $80.12 $28.684.64 0.043 4.69 38,999 12.47% 318,562 98.20% 312,836 6,471 3,616 4,648 121 $9.70 $3,091,625 0.578 $0.143 $45,512 0.030 $0.090 $28,533 $9.94 $3,165,670 $18.12 $5,772,900 $28.06 $8,938,570 $4.39 $1,398,654 $32.45 $10,337,225 $60.41 $19,243,000 $92.86 $32.45 $94.55 $33.044.07 0.037 4.10 34,153 13.58% 256,219 98.16% 251,493 5,317 2,960 3,583 132 $10.57 $2,707,693 0.622 $0.154 $39,385 0.029 $0.088 $22,473 $10.81 $2,769,551 $22.53 $5,772,900 $33.34 $8,542,451 $5.46 $1,398,654 $38.80 $9,941,106 $75.10 $19,243,000 $113.90 $38.80 $116.04 $39.533.58 0.032 3.62 30,102 14.99% 204,751 98.10% 200,863 4,366 2,422 2,771 146 $11.66 $2,386,656 0.683 $0.169 $34,585 0.029 $0.087 $17,734 $11.91 $2,438,974 $28.19 $5,772,900 $40.11 $8,211,874 $6.83 $1,398,654 $46.94 $9,610,529 $93.98 $19,243,000 $140.92 $46.94 $143.65 $47.853.27 0.029 3.30 27,484 16.38% 171,087 98.07% 167,792 3,698 2,043 2,236 159 $12.74 $2,179,241 0.741 $0.183 $31,358 0.028 $0.085 $14,552 $13.01 $2,225,150 $33.74 $5,772,900 $46.75 $7,998,050 $8.18 $1,398,654 $54.92 $9,396,705 $112.48 $19,243,000 $167.40 $54.92 $170.69 $56.002.37 0.026 2.40 19,963 14.99% 143,059 93.08% 133,157 0 0 0 138 $11.04 $1,579,931 0.779 $0.193 $27,542 0.025 $0.076 $10,823 $11.31 $1,618,296 $29.80 $4,262,700 $41.11 $5,880,996 $9.78 $1,398,654 $50.89 $7,279,651 $99.32 $14,209,000 $150.21 $50.89 $161.38 $54.671.98 0.022 2.00 16,681 19.21% 93,444 92.92% 86,831 0 0 0 177 $14.12 $1,319,694 1.030 $0.255 $23,804 0.026 $0.077 $7,170 $14.45 $1,350,668 $45.62 $4,262,700 $60.07 $5,613,368 $14.97 $1,398,654 $75.04 $7,012,022 $152.06 $14,209,000 $227.10 $75.04 $244.39 $80.751.78 0.020 1.80 15,018 24.88% 65,714 91.86% 60,364 0 0 0 226 $18.08 $1,188,049 1.321 $0.327 $21,462 0.024 $0.074 $4,830 $18.48 $1,214,341 $64.87 $4,262,700 $83.35 $5,477,041 $21.28 $1,398,654 $104.63 $6,875,695 $216.23 $14,209,000 $320.86 $104.63 $349.29 $113.901.67 0.019 1.69 14,028 32.00% 48,541 90.30% 43,831 0 0 0 286 $22.86 $1,109,800 1.663 $0.411 $19,955 0.023 $0.068 $3,312 $23.34 $1,133,067 $87.82 $4,262,700 $111.16 $5,395,767 $28.81 $1,398,654 $139.97 $6,794,421 $292.72 $14,209,000 $432.70 $139.97 $479.19 $155.01
37,136,597 36,321,845 $43.95 $17.93 $44.93 $18.33
1 kg/kWh Service Factor 95% POWER COST $80.00 $/MW PLANT CAPEX TOTAL $291,510,000
13.6% wt. Hours/Year Op 8322 $0.08 $/kW PRIMARY SEPARATION $17,770,000100.0% assumed LP COMPRESSION $9,855,000
24.0% simulation NATURAL GAS COST $7.00 $/Mf3 DEHYDRATION $4,665,000
8.0% simulation $7.00 $/28.3 m3 CO2 SEPARATION $24,245,000
14.0% simulation $0.25 $/m3 CO2 COMPRESSION $34,220,000
$184.76 $/tonne RECYCLE COMPR. $16,180,000TEG COST $12.50 $/gal REFRIGERATION $9,915,000
$3.30 $/l OSBL $75,580,000$3.00 $/kg
Power $290,510,639 ######### ETHANE 22.73 $/BBLNatural Gas $4,880,798 $211,114 0.4 $/KGChemicals $7,094,144 $350,070 400 $/TOMaintenance & Other $289,905,300 $8,745,300Labour $73,326,488 $2,188,669Total $665,717,369 #########
TABLE CONTINUED FROM PREVIOUS PAGE
HC GAS SEPARATED C1 COMPOSITIO
HC GAS SEPARATED C3+ COMPOSITIO
HC LIQUIDS SEPARATED C3+ COMP.
C2
RECOVERED
C2 RECOVERY EFFICIENCY
CO2
REINJECTEDGAS REINJECTED
PARASITIC CO2 CALCULATION
% of CO2
REINJECTED
DEHY. REBOILER FLUE GAS CO2 CON
TOTAL
SPECIFIC POWER PARASITIC CO2
POWER PARASITIC
CO2
C1
RECOVEREDC3
+
RECOVERED
AVERAGE GAS UNIT COST
Other variable Costs (maintenance + others)
SubtotalManpower Add-in Fixed Costs (Capital
Charge)TOTAL OPEX PLANT
FOB PLANT
OPERATING ONLY FOB
PLANT
REINJECTED GAS UNIT COST
Power Natural Gas TEG Total Utilities
UTILITIES COSTSREINJECTED CO2 UNIT COST
FOB PLANT
OPERATING ONLY FOB
PLANT
AVERAGE PURE CO2 UNIT COST
VENT PARASITIC
CO2
Case 2 Annual Cash OPEX Breakdown -Year 19
Power53%
Maintenance & Other36%
Labour9%
Natural Gas0.9%
Chemicals1.5%
Case 2 Annual Cash OPEX Breakdown - Overall Project Lifetime
Labour11%
Maintenance &Other44%
Natural Gas0.7%Chemicals
1.1%
Power43%
ENHANCED HYDROCARBON RECOVERY STUDY (FINAL)Prepared for: Alberta Research Council (ARC) Rev. 1 Project 017935, September, 2008 App 4‐9 Chemicals and Petroleum
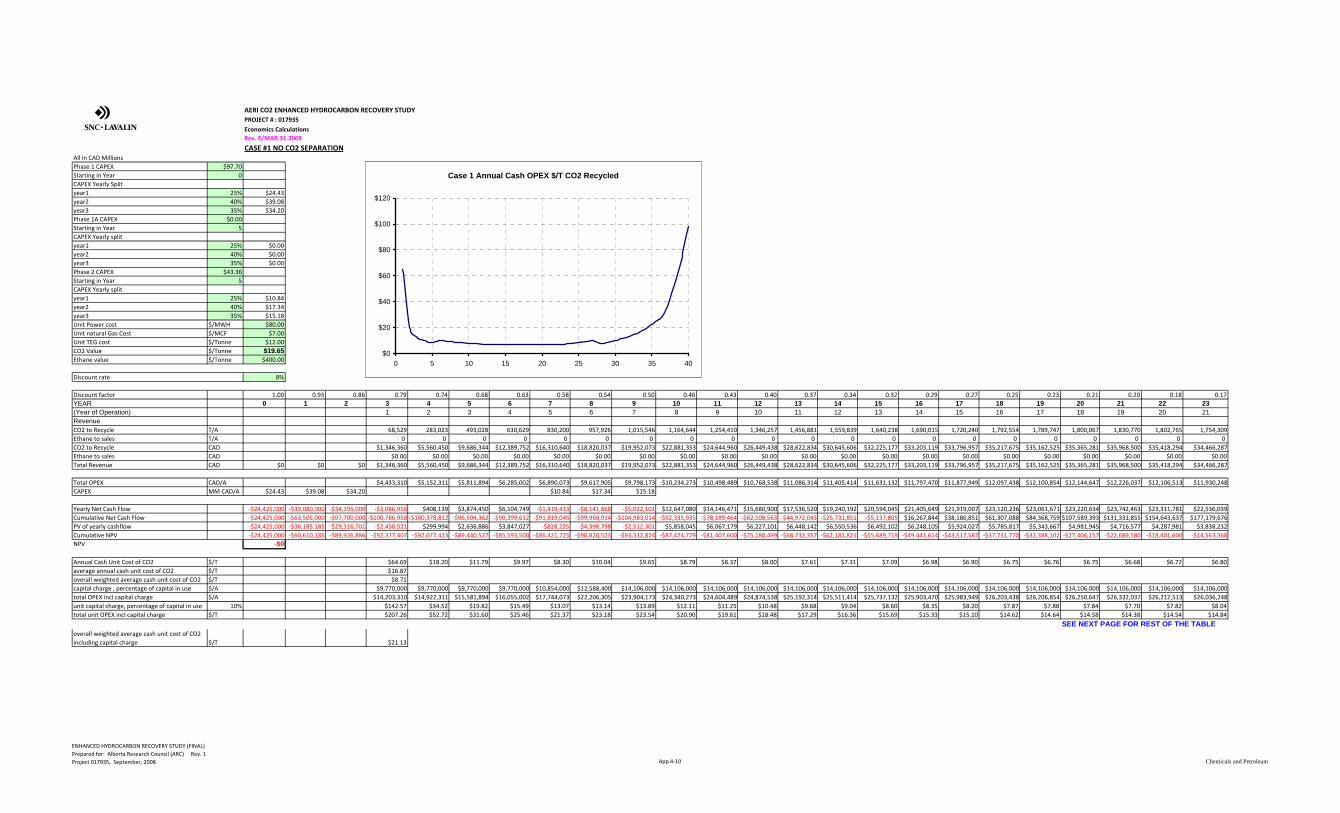
AERI CO2 ENHANCED HYDROCARBON RECOVERY STUDYPROJECT # : 017935
Economics CalculationsRev. E/MAR.31.2008
All in CAD MillionsPhase 1 CAPEX $97.70Starting in Year 0CAPEX Yearly Splityear1 25% $24.43year2 40% $39.08year3 35% $34.20Phase 1A CAPEX $0.00Starting in Year 5CAPEX Yearly splityear1 25% $0.00year2 40% $0.00year3 35% $0.00Phase 2 CAPEX $43.36Starting in Year 5CAPEX Yearly splityear1 25% $10.84year2 40% $17.34year3 35% $15.18Unit Power cost $/MWH $80.00Unit natural Gas Cost $/MCF $7.00Unit TEG cost $/Tonne $12.00CO2 Value $/Tonne $19.65Ethane value $/Tonne $400.00
Discount rate 8%
Discount factor 1.00 0.93 0.86 0.79 0.74 0.68 0.63 0.58 0.54 0.50 0.46 0.43 0.40 0.37 0.34 0.32 0.29 0.27 0.25 0.23 0.21 0.20 0.18 0.17YEAR 0 1 2 3 4 5 6 7 8 9 10 11 12 13 14 15 16 17 18 19 20 21 22 23(Year of Operation) 1 2 3 4 5 6 7 8 9 10 11 12 13 14 15 16 17 18 19 20 21RevenueCO2 to Recycle T/A 68,529 283,023 493,028 630,629 830,200 957,926 1,015,546 1,164,644 1,254,410 1,346,257 1,456,881 1,559,839 1,640,238 1,690,015 1,720,240 1,792,554 1,789,747 1,800,067 1,830,770 1,802,765 1,754,309Ethane to sales T/A 0 0 0 0 0 0 0 0 0 0 0 0 0 0 0 0 0 0 0 0 0CO2 to Recycle CAD $1,346,360 $5,560,450 $9,686,344 $12,389,752 $16,310,640 $18,820,037 $19,952,073 $22,881,353 $24,644,960 $26,449,438 $28,622,834 $30,645,606 $32,225,177 $33,203,119 $33,796,957 $35,217,675 $35,162,525 $35,365,281 $35,968,500 $35,418,294 $34,466,287Ethane to sales CAD $0.00 $0.00 $0.00 $0.00 $0.00 $0.00 $0.00 $0.00 $0.00 $0.00 $0.00 $0.00 $0.00 $0.00 $0.00 $0.00 $0.00 $0.00 $0.00 $0.00 $0.00Total Revenue CAD $0 $0 $0 $1,346,360 $5,560,450 $9,686,344 $12,389,752 $16,310,640 $18,820,037 $19,952,073 $22,881,353 $24,644,960 $26,449,438 $28,622,834 $30,645,606 $32,225,177 $33,203,119 $33,796,957 $35,217,675 $35,162,525 $35,365,281 $35,968,500 $35,418,294 $34,466,287
Total OPEX CAD/A $4,433,310 $5,152,311 $5,811,894 $6,285,002 $6,890,073 $9,617,905 $9,798,173 $10,234,273 $10,498,489 $10,768,538 $11,086,314 $11,405,414 $11,631,132 $11,797,470 $11,877,949 $12,097,438 $12,100,854 $12,144,647 $12,226,037 $12,106,513 $11,930,248CAPEX MM CAD/A $24.43 $39.08 $34.20 $10.84 $17.34 $15.18
Yearly Net Cash Flow ‐$24,425,000 ‐$39,080,000 ‐$34,195,000 ‐$3,086,950 $408,139 $3,874,450 $6,104,749 ‐$1,419,433 ‐$8,141,868 ‐$5,022,101 $12,647,080 $14,146,471 $15,680,900 $17,536,520 $19,240,192 $20,594,045 $21,405,649 $21,919,007 $23,120,236 $23,061,671 $23,220,634 $23,742,463 $23,311,781 $22,536,039Cumulative Net Cash Flow ‐$24,425,000 ‐$63,505,000 ‐$97,700,000 ‐$100,786,950 ‐$100,378,812 ‐$96,504,362 ‐$90,399,612 ‐$91,819,045 ‐$99,960,914 ‐$104,983,014 ‐$92,335,935 ‐$78,189,464 ‐$62,508,563 ‐$44,972,043 ‐$25,731,851 ‐$5,137,805 $16,267,844 $38,186,851 $61,307,088 $84,368,759 $107,589,393 $131,331,855 $154,643,637 $177,179,676PV of yearly cashflow ‐$24,425,000 ‐$36,185,185 ‐$29,316,701 ‐$2,450,521 $299,994 $2,636,886 $3,847,027 ‐$828,225 ‐$4,398,798 ‐$2,512,301 $5,858,045 $6,067,179 $6,227,101 $6,448,142 $6,550,536 $6,492,102 $6,248,105 $5,924,027 $5,785,817 $5,343,667 $4,981,945 $4,716,577 $4,287,981 $3,838,232Cumulative NPV ‐$24,425,000 ‐$60,610,185 ‐$89,926,886 ‐$92,377,407 ‐$92,077,413 ‐$89,440,527 ‐$85,593,500 ‐$86,421,725 ‐$90,820,523 ‐$93,332,824 ‐$87,474,779 ‐$81,407,600 ‐$75,180,499 ‐$68,732,357 ‐$62,181,821 ‐$55,689,719 ‐$49,441,614 ‐$43,517,587 ‐$37,731,770 ‐$32,388,102 ‐$27,406,157 ‐$22,689,580 ‐$18,401,600 ‐$14,563,368NPV -$0
Annual Cash Unit Cost of CO2 $/T $64.69 $18.20 $11.79 $9.97 $8.30 $10.04 $9.65 $8.79 $8.37 $8.00 $7.61 $7.31 $7.09 $6.98 $6.90 $6.75 $6.76 $6.75 $6.68 $6.72 $6.80average annual cash unit cost of CO2 $/T $16.87overall weighted average cash unit cost of CO2 $/T $8.71capital charge , percentage of capital in use $/A $9,770,000 $9,770,000 $9,770,000 $9,770,000 $10,854,000 $12,588,400 $14,106,000 $14,106,000 $14,106,000 $14,106,000 $14,106,000 $14,106,000 $14,106,000 $14,106,000 $14,106,000 $14,106,000 $14,106,000 $14,106,000 $14,106,000 $14,106,000 $14,106,000total OPEX incl capital charge $/A $14,203,310 $14,922,311 $15,581,894 $16,055,002 $17,744,073 $22,206,305 $23,904,173 $24,340,273 $24,604,489 $24,874,538 $25,192,314 $25,511,414 $25,737,132 $25,903,470 $25,983,949 $26,203,438 $26,206,854 $26,250,647 $26,332,037 $26,212,513 $26,036,248unit capital charge, percentage of capital in use 10% $142.57 $34.52 $19.82 $15.49 $13.07 $13.14 $13.89 $12.11 $11.25 $10.48 $9.68 $9.04 $8.60 $8.35 $8.20 $7.87 $7.88 $7.84 $7.70 $7.82 $8.04total unit OPEX incl capital charge $/T $207.26 $52.72 $31.60 $25.46 $21.37 $23.18 $23.54 $20.90 $19.61 $18.48 $17.29 $16.36 $15.69 $15.33 $15.10 $14.62 $14.64 $14.58 $14.38 $14.54 $14.84
SEE NEXT PAGE FOR REST OF THE TABLEoverall weighted average cash unit cost of CO2 including capital charge $/T $21.13
CASE #1 NO CO2 SEPARATION
Case 1 Annual Cash OPEX $/T CO2 Recycled
$0
$20
$40
$60
$80
$100
$120
0 5 10 15 20 25 30 35 40
ENHANCED HYDROCARBON RECOVERY STUDY (FINAL)Prepared for: Alberta Research Council (ARC) Rev. 1 Project 017935, September, 2008 App 4‐10 Chemicals and Petroleum
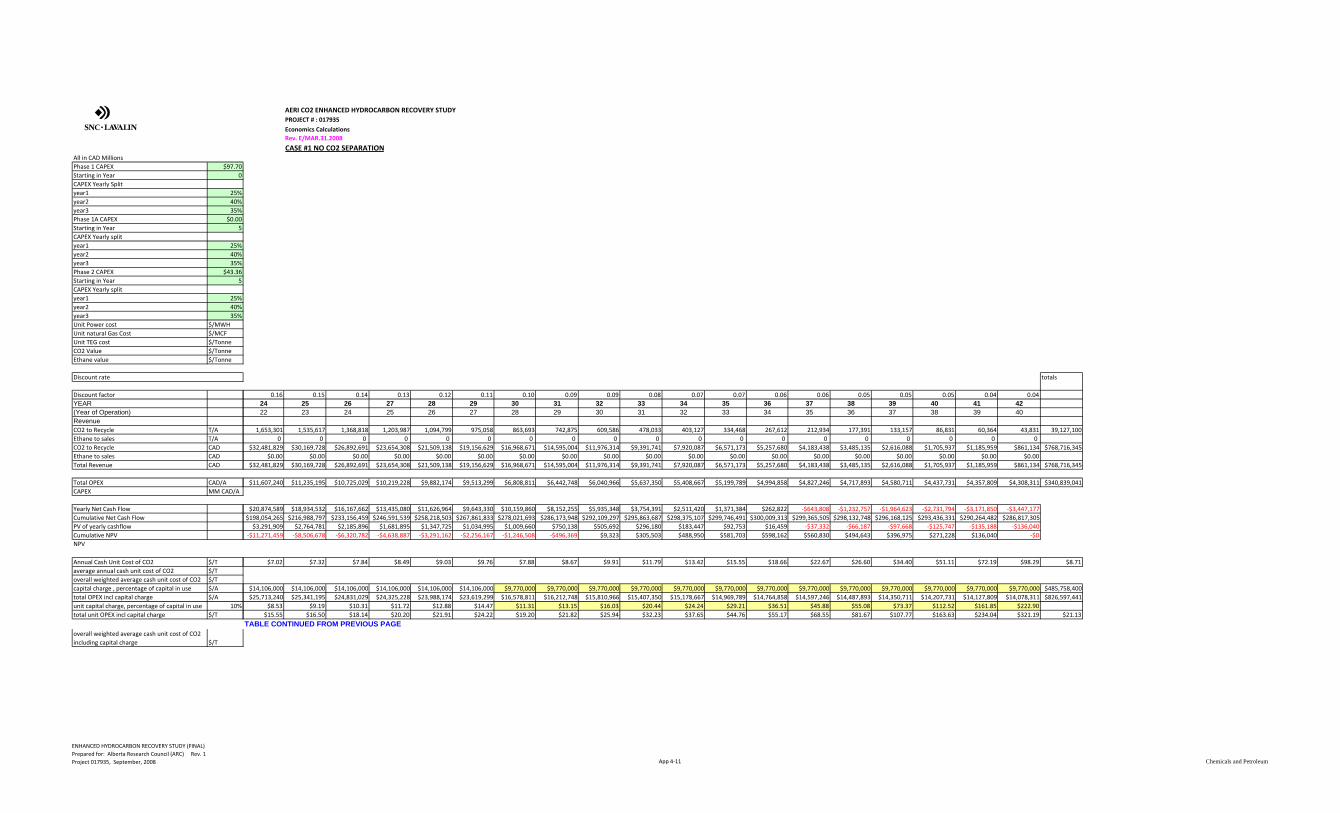
All in CAD MillionsPhase 1 CAPEX $97.70Starting in Year 0CAPEX Yearly Splityear1 25%year2 40%year3 35%Phase 1A CAPEX $0.00Starting in Year 5CAPEX Yearly splityear1 25%year2 40%year3 35%Phase 2 CAPEX $43.36Starting in Year 5CAPEX Yearly splityear1 25%year2 40%year3 35%Unit Power cost $/MWHUnit natural Gas Cost $/MCFUnit TEG cost $/TonneCO2 Value $/TonneEthane value $/Tonne
Discount rate
Discount factorYEAR(Year of Operation)RevenueCO2 to Recycle T/AEthane to sales T/ACO2 to Recycle CADEthane to sales CADTotal Revenue CAD
Total OPEX CAD/ACAPEX MM CAD/A
Yearly Net Cash FlowCumulative Net Cash FlowPV of yearly cashflowCumulative NPVNPV
Annual Cash Unit Cost of CO2 $/Taverage annual cash unit cost of CO2 $/Toverall weighted average cash unit cost of CO2 $/Tcapital charge , percentage of capital in use $/Atotal OPEX incl capital charge $/Aunit capital charge, percentage of capital in use 10%total unit OPEX incl capital charge $/T
overall weighted average cash unit cost of CO2 including capital charge $/T
AERI CO2 ENHANCED HYDROCARBON RECOVERY STUDYPROJECT # : 017935
Economics CalculationsRev. E/MAR.31.2008
totals
0.16 0.15 0.14 0.13 0.12 0.11 0.10 0.09 0.09 0.08 0.07 0.07 0.06 0.06 0.05 0.05 0.05 0.04 0.0424 25 26 27 28 29 30 31 32 33 34 35 36 37 38 39 40 41 4222 23 24 25 26 27 28 29 30 31 32 33 34 35 36 37 38 39 40
1,653,301 1,535,617 1,368,818 1,203,987 1,094,799 975,058 863,693 742,875 609,586 478,033 403,127 334,468 267,612 212,934 177,391 133,157 86,831 60,364 43,831 39,127,1000 0 0 0 0 0 0 0 0 0 0 0 0 0 0 0 0 0 0
$32,481,829 $30,169,728 $26,892,691 $23,654,308 $21,509,138 $19,156,629 $16,968,671 $14,595,004 $11,976,314 $9,391,741 $7,920,087 $6,571,173 $5,257,680 $4,183,438 $3,485,135 $2,616,088 $1,705,937 $1,185,959 $861,134 $768,716,345$0.00 $0.00 $0.00 $0.00 $0.00 $0.00 $0.00 $0.00 $0.00 $0.00 $0.00 $0.00 $0.00 $0.00 $0.00 $0.00 $0.00 $0.00 $0.00
$32,481,829 $30,169,728 $26,892,691 $23,654,308 $21,509,138 $19,156,629 $16,968,671 $14,595,004 $11,976,314 $9,391,741 $7,920,087 $6,571,173 $5,257,680 $4,183,438 $3,485,135 $2,616,088 $1,705,937 $1,185,959 $861,134 $768,716,345
$11,607,240 $11,235,195 $10,725,029 $10,219,228 $9,882,174 $9,513,299 $6,808,811 $6,442,748 $6,040,966 $5,637,350 $5,408,667 $5,199,789 $4,994,858 $4,827,246 $4,717,893 $4,580,711 $4,437,731 $4,357,809 $4,308,311 $340,839,041
$20,874,589 $18,934,532 $16,167,662 $13,435,080 $11,626,964 $9,643,330 $10,159,860 $8,152,255 $5,935,348 $3,754,391 $2,511,420 $1,371,384 $262,822 ‐$643,808 ‐$1,232,757 ‐$1,964,623 ‐$2,731,794 ‐$3,171,850 ‐$3,447,177$198,054,265 $216,988,797 $233,156,459 $246,591,539 $258,218,503 $267,861,833 $278,021,693 $286,173,948 $292,109,297 $295,863,687 $298,375,107 $299,746,491 $300,009,313 $299,365,505 $298,132,748 $296,168,125 $293,436,331 $290,264,482 $286,817,305$3,291,909 $2,764,781 $2,185,896 $1,681,895 $1,347,725 $1,034,995 $1,009,660 $750,138 $505,692 $296,180 $183,447 $92,753 $16,459 ‐$37,332 ‐$66,187 ‐$97,668 ‐$125,747 ‐$135,188 ‐$136,040
‐$11,271,459 ‐$8,506,678 ‐$6,320,782 ‐$4,638,887 ‐$3,291,162 ‐$2,256,167 ‐$1,246,508 ‐$496,369 $9,323 $305,503 $488,950 $581,703 $598,162 $560,830 $494,643 $396,975 $271,228 $136,040 ‐$0
$7.02 $7.32 $7.84 $8.49 $9.03 $9.76 $7.88 $8.67 $9.91 $11.79 $13.42 $15.55 $18.66 $22.67 $26.60 $34.40 $51.11 $72.19 $98.29 $8.71
$14,106,000 $14,106,000 $14,106,000 $14,106,000 $14,106,000 $14,106,000 $9,770,000 $9,770,000 $9,770,000 $9,770,000 $9,770,000 $9,770,000 $9,770,000 $9,770,000 $9,770,000 $9,770,000 $9,770,000 $9,770,000 $9,770,000 $485,758,400$25,713,240 $25,341,195 $24,831,029 $24,325,228 $23,988,174 $23,619,299 $16,578,811 $16,212,748 $15,810,966 $15,407,350 $15,178,667 $14,969,789 $14,764,858 $14,597,246 $14,487,893 $14,350,711 $14,207,731 $14,127,809 $14,078,311 $826,597,441
$8.53 $9.19 $10.31 $11.72 $12.88 $14.47 $11.31 $13.15 $16.03 $20.44 $24.24 $29.21 $36.51 $45.88 $55.08 $73.37 $112.52 $161.85 $222.90$15.55 $16.50 $18.14 $20.20 $21.91 $24.22 $19.20 $21.82 $25.94 $32.23 $37.65 $44.76 $55.17 $68.55 $81.67 $107.77 $163.63 $234.04 $321.19 $21.13
TABLE CONTINUED FROM PREVIOUS PAGE
CASE #1 NO CO2 SEPARATION
ENHANCED HYDROCARBON RECOVERY STUDY (FINAL)Prepared for: Alberta Research Council (ARC) Rev. 1 Project 017935, September, 2008 App 4‐11 Chemicals and Petroleum
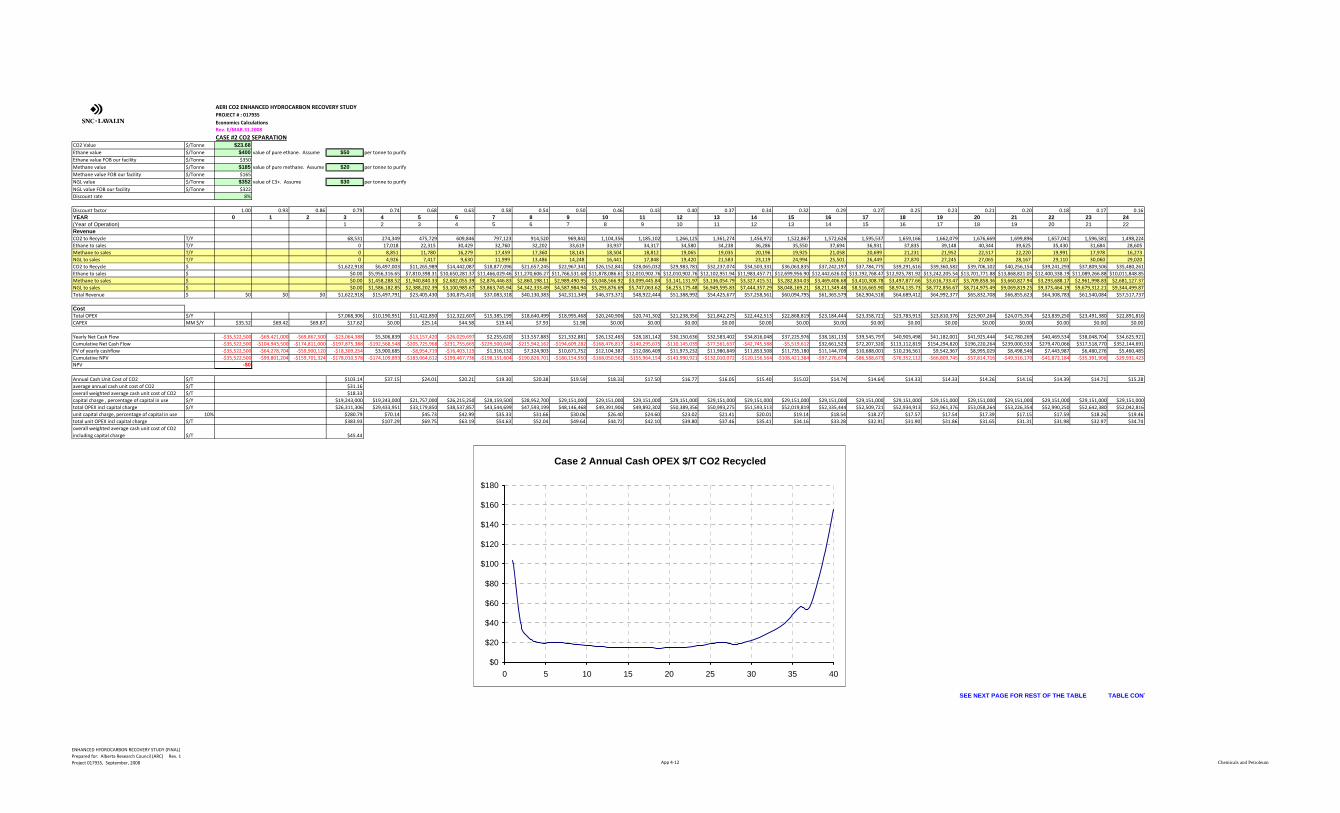
AERI CO2 ENHANCED HYDROCARBON RECOVERY STUDYPROJECT # : 017935
Economics CalculationsRev. E/MAR.31.2008
CASE #2 CO2 SEPARATIONCO2 Value $/Tonne $23.68Ethane value $/Tonne $400 value of pure ethane. Assume $50 per tonne to purifyEthane value FOB our facility $/Tonne $350Methane value $/Tonne $185 value of pure methane. Assume $20 per tonne to purifyMethane value FOB our facility $/Tonne $165NGL value $/Tonne $352 value of C3+. Assume $30 per tonne to purifyNGL value FOB our facility $/Tonne $322Discount rate 8%
Discount factor 1.00 0.93 0.86 0.79 0.74 0.68 0.63 0.58 0.54 0.50 0.46 0.43 0.40 0.37 0.34 0.32 0.29 0.27 0.25 0.23 0.21 0.20 0.18 0.17 0.16YEAR 0 1 2 3 4 5 6 7 8 9 10 11 12 13 14 15 16 17 18 19 20 21 22 23 24(Year of Operation) 1 2 3 4 5 6 7 8 9 10 11 12 13 14 15 16 17 18 19 20 21 22RevenueCO2 to Recycle T/Y 68,531 274,349 475,729 609,846 797,123 914,520 969,842 1,104,356 1,185,102 1,266,125 1,361,274 1,456,972 1,522,867 1,572,626 1,595,537 1,659,166 1,662,079 1,676,669 1,699,896 1,657,041 1,596,581 1,498,224Ethane to sales T/Y 0 17,018 22,315 30,429 32,760 32,202 33,619 33,937 34,317 34,580 34,238 36,286 35,550 37,694 36,931 37,835 39,148 40,344 39,625 35,430 31,684 28,605Methane to sales T/Y 0 8,851 11,780 16,279 17,459 17,360 18,145 18,504 18,812 19,065 19,035 20,196 19,925 21,058 20,699 21,231 21,952 22,517 22,220 19,991 17,978 16,273NGL to sales T/Y 0 4,926 7,417 9,630 11,999 13,486 14,248 16,441 17,848 19,420 21,583 23,119 24,994 25,501 26,449 27,870 27,245 27,065 28,167 29,110 30,060 29,020CO2 to Recycle $ $1,622,918 $6,497,003 $11,265,989 $14,442,087 $18,877,096 $21,657,245 $22,967,341 $26,152,841 $28,065,032 $29,983,781 $32,237,074 $34,503,331 $36,063,835 $37,242,197 $37,784,775 $39,291,616 $39,360,582 $39,706,102 $40,256,154 $39,241,293 $37,809,506 $35,480,261Ethane to sales $ $0.00 $5,956,316.65 $7,810,398.31 $10,650,281.37 $11,466,029.46 $11,270,606.27 $11,766,531.68 $11,878,086.61 $12,010,902.76 $12,010,902.76 $12,102,951.94 $11,983,457.71 $12,699,956.90 $12,442,626.02 $13,192,768.47 $12,925,781.92 $13,242,205.54 $13,701,771.88 $13,868,821.05 $12,400,338.19 $11,089,266.88 $10,011,848.85Methane to sales $ $0.00 $1,458,288.52 $1,940,840.33 $2,682,055.39 $2,876,446.83 $2,860,198.11 $2,989,490.95 $3,048,566.92 $3,099,445.84 $3,141,131.97 $3,136,054.79 $3,327,415.51 $3,282,834.03 $3,469,406.68 $3,410,308.78 $3,497,877.66 $3,616,733.47 $3,709,858.36 $3,660,827.94 $3,293,688.17 $2,961,998.83 $2,681,127.37NGL to sales $ $0.00 $1,586,182.85 $2,388,202.39 $3,100,985.67 $3,863,745.94 $4,342,333.49 $4,587,984.94 $5,293,876.69 $5,747,063.62 $6,253,175.48 $6,949,595.83 $7,444,357.29 $8,048,169.21 $8,211,349.48 $8,516,665.90 $8,974,135.73 $8,772,856.67 $8,714,975.49 $9,069,819.25 $9,373,464.19 $9,679,312.21 $9,344,499.87Total Revenue $ $0 $0 $0 $1,622,918 $15,497,791 $23,405,430 $30,875,410 $37,083,318 $40,130,383 $42,311,349 $46,373,371 $48,922,444 $51,388,992 $54,425,677 $57,258,561 $60,094,795 $61,365,579 $62,904,518 $64,689,412 $64,992,377 $65,832,708 $66,855,623 $64,308,783 $61,540,084 $57,517,737
CostTotal OPEX $/Y $7,068,306 $10,190,951 $11,422,850 $12,322,607 $15,385,199 $18,640,499 $18,995,468 $20,240,906 $20,741,302 $21,238,356 $21,842,275 $22,442,513 $22,868,819 $23,184,444 $23,358,721 $23,783,913 $23,810,376 $23,907,264 $24,075,354 $23,839,250 $23,491,380 $22,891,816CAPEX MM $/Y $35.52 $69.42 $69.87 $17.62 $0.00 $25.14 $44.58 $19.44 $7.93 $1.98 $0.00 $0.00 $0.00 $0.00 $0.00 $0.00 $0.00 $0.00 $0.00 $0.00 $0.00 $0.00 $0.00 $0.00 $0.00
Yearly Net Cash Flow ‐$35,522,500 ‐$69,421,000 ‐$69,867,500 ‐$23,064,388 $5,306,839 ‐$13,157,420 ‐$26,029,697 $2,255,620 $13,557,883 $21,332,881 $26,132,465 $28,181,142 $30,150,636 $32,583,402 $34,816,048 $37,225,976 $38,181,135 $39,545,797 $40,905,498 $41,182,001 $41,925,444 $42,780,269 $40,469,534 $38,048,704 $34,625,921Cumulative Net Cash Flow ‐$35,522,500 ‐$104,943,500 ‐$174,811,000 ‐$197,875,388 ‐$192,568,548 ‐$205,725,968 ‐$231,755,665 ‐$229,500,046 ‐$215,942,162 ‐$194,609,282 ‐$168,476,817 ‐$140,295,675 ‐$110,145,039 ‐$77,561,637 ‐$42,745,588 ‐$5,519,612 $32,661,523 $72,207,320 $113,112,819 $154,294,820 $196,220,264 $239,000,533 $279,470,066 $317,518,770 $352,144,691PV of yearly cashflow ‐$35,522,500 ‐$64,278,704 ‐$59,900,120 ‐$18,309,254 $3,900,685 ‐$8,954,719 ‐$16,403,125 $1,316,132 $7,324,903 $10,671,752 $12,104,387 $12,086,409 $11,973,232 $11,980,849 $11,853,508 $11,735,180 $11,144,709 $10,688,001 $10,236,561 $9,542,367 $8,995,029 $8,498,546 $7,443,987 $6,480,276 $5,460,485Cumulative NPV ‐$35,522,500 ‐$99,801,204 ‐$159,701,324 ‐$178,010,578 ‐$174,109,893 ‐$183,064,612 ‐$199,467,736 ‐$198,151,604 ‐$190,826,701 ‐$180,154,950 ‐$168,050,562 ‐$155,964,154 ‐$143,990,921 ‐$132,010,072 ‐$120,156,564 ‐$108,421,384 ‐$97,276,674 ‐$86,588,673 ‐$76,352,112 ‐$66,809,745 ‐$57,814,716 ‐$49,316,170 ‐$41,872,184 ‐$35,391,908 ‐$29,931,423NPV -$0
Annual Cash Unit Cost of CO2 $/T $103.14 $37.15 $24.01 $20.21 $19.30 $20.38 $19.59 $18.33 $17.50 $16.77 $16.05 $15.40 $15.02 $14.74 $14.64 $14.33 $14.33 $14.26 $14.16 $14.39 $14.71 $15.28average annual cash unit cost of CO2 $/T $31.16overall weighted average cash unit cost of CO2 $/T $18.33capital charge , percentage of capital in use $/Y $19,243,000 $19,243,000 $21,757,000 $26,215,250 $28,159,500 $28,952,700 $29,151,000 $29,151,000 $29,151,000 $29,151,000 $29,151,000 $29,151,000 $29,151,000 $29,151,000 $29,151,000 $29,151,000 $29,151,000 $29,151,000 $29,151,000 $29,151,000 $29,151,000 $29,151,000total OPEX incl capital charge $/Y $26,311,306 $29,433,951 $33,179,850 $38,537,857 $43,544,699 $47,593,199 $48,146,468 $49,391,906 $49,892,302 $50,389,356 $50,993,275 $51,593,513 $52,019,819 $52,335,444 $52,509,721 $52,934,913 $52,961,376 $53,058,264 $53,226,354 $52,990,250 $52,642,380 $52,042,816unit capital charge, percentage of capital in use 10% $280.79 $70.14 $45.73 $42.99 $35.33 $31.66 $30.06 $26.40 $24.60 $23.02 $21.41 $20.01 $19.14 $18.54 $18.27 $17.57 $17.54 $17.39 $17.15 $17.59 $18.26 $19.46total unit OPEX incl capital charge $/T $383.93 $107.29 $69.75 $63.19 $54.63 $52.04 $49.64 $44.72 $42.10 $39.80 $37.46 $35.41 $34.16 $33.28 $32.91 $31.90 $31.86 $31.65 $31.31 $31.98 $32.97 $34.74overall weighted average cash unit cost of CO2 including capital charge $/T $45.44
SEE NEXT PAGE FOR REST OF THE TABLE TABLE CONT
Case 2 Annual Cash OPEX $/T CO2 Recycled
$0
$20
$40
$60
$80
$100
$120
$140
$160
$180
0 5 10 15 20 25 30 35 40
ENHANCED HYDROCARBON RECOVERY STUDY (FINAL)Prepared for: Alberta Research Council (ARC) Rev. 1 Project 017935, September, 2008 App 4‐12 Chemicals and Petroleum

CO2 Value $/TonneEthane value $/TonneEthane value FOB our facility $/TonneMethane value $/TonneMethane value FOB our facility $/TonneNGL value $/TonneNGL value FOB our facility $/TonneDiscount rate
Discount factorYEAR(Year of Operation)RevenueCO2 to Recycle T/YEthane to sales T/YMethane to sales T/YNGL to sales T/YCO2 to Recycle $Ethane to sales $Methane to sales $NGL to sales $Total Revenue $
CostTotal OPEX $/YCAPEX MM $/Y
Yearly Net Cash FlowCumulative Net Cash FlowPV of yearly cashflowCumulative NPVNPV
Annual Cash Unit Cost of CO2 $/Taverage annual cash unit cost of CO2 $/Toverall weighted average cash unit cost of CO2 $/Tcapital charge , percentage of capital in use $/Ytotal OPEX incl capital charge $/Yunit capital charge, percentage of capital in use 10%total unit OPEX incl capital charge $/Toverall weighted average cash unit cost of CO2 including capital charge $/T
AERI CO2 ENHANCED HYDROCARBON RECOVERY STUDYPROJECT # : 017935
Economics CalculationsRev. E/MAR.31.2008
CASE #2 CO2 SEPARATION
totals
0.15 0.14 0.13 0.12 0.11 0.10 0.09 0.09 0.08 0.07 0.07 0.06 0.06 0.05 0.05 0.05 0.04 0.0425 26 27 28 29 30 31 32 33 34 35 36 37 38 39 40 41 4223 24 25 26 27 28 29 30 31 32 33 34 35 36 37 38 39 40
1,385,005 1,238,596 1,092,131 993,492 885,773 785,633 679,840 564,065 441,635 374,052 312,836 251,493 200,863 167,792 133,157 86,831 60,364 43,831 36,321,84525,475 22,916 20,222 18,213 16,099 14,192 12,578 11,018 8,663 7,487 6,471 5,317 4,366 3,698 0 0 0 014,527 13,053 11,509 10,365 9,162 8,074 7,135 6,213 4,878 4,209 3,616 2,960 2,422 2,043 0 0 0 027,675 24,154 20,903 18,887 16,670 14,605 12,066 9,180 7,247 5,957 4,648 3,583 2,771 2,236 0 0 0 0
$32,799,054 $29,331,869 $25,863,350 $23,527,424 $20,976,468 $18,604,993 $16,099,649 $13,357,921 $10,458,606 $8,858,134 $7,408,450 $5,955,745 $4,756,755 $3,973,562 $3,153,363 $2,056,290 $1,429,523 $1,037,988 $860,157,205$8,916,366.90 $8,020,684.44 $7,077,799.12 $6,374,663.78 $5,634,667.78 $4,967,239.49 $4,402,226.94 $3,856,252.58 $3,032,098.87 $2,620,538.65 $2,264,934.42 $1,860,866.58 $1,528,101.52 $1,294,206.80 $0.00 $0.00 $0.00 $0.00 $306,332,499$2,393,426.07 $2,150,588.94 $1,896,192.31 $1,707,769.00 $1,509,425.83 $1,330,274.95 $1,175,547.69 $1,023,586.38 $803,628.34 $693,478.92 $595,831.98 $487,734.92 $399,040.25 $336,664.59 $0.00 $0.00 $0.00 $0.00 $80,647,787$8,911,240.29 $7,777,442.75 $6,730,853.09 $6,081,486.69 $5,367,881.80 $4,702,916.43 $3,885,157.92 $2,955,866.27 $2,333,405.05 $1,918,024.79 $1,496,653.15 $1,153,649.56 $892,179.99 $719,965.69 $0.00 $0.00 $0.00 $0.00 $195,189,476$53,020,087 $47,280,585 $41,568,194 $37,691,343 $33,488,443 $29,605,424 $25,562,581 $21,193,627 $16,627,738 $14,090,176 $11,765,869 $9,457,997 $7,576,077 $6,324,399 $3,153,363 $2,056,290 $1,429,523 $1,037,988 $1,442,326,966
$22,198,905 $21,243,584 $20,293,744 $19,660,666 $17,617,653 $13,994,075 $13,294,838 $12,533,450 $11,164,122 $10,726,408 $10,337,225 $9,941,106 $9,610,529 $9,396,705 $7,279,651 $7,012,022 $6,875,695 $6,794,421 $665,717,369$0.00 $0.00 $0.00 $0.00 ‐$40.43 ‐$48.80 $0.00 $0.00 ‐$9.86 $0.00 $0.00 $0.00 $0.00 $0.00 ‐$50.34 $0.00 $0.00 $0.00 $142
$30,821,182 $26,037,002 $21,274,450 $18,030,677 $56,295,790 $64,411,349 $12,267,743 $8,660,177 $15,318,616 $3,363,768 $1,428,645 ‐$483,109 ‐$2,034,452 ‐$3,072,305 $46,213,712 ‐$4,955,732 ‐$5,446,172 ‐$5,756,433$382,965,873 $409,002,875 $430,277,325 $448,308,002 $504,603,792 $569,015,141 $581,282,884 $589,943,060 $605,261,676 $608,625,444 $610,054,089 $609,570,979 $607,536,528 $604,464,222 $650,677,934 $645,722,202 $640,276,030 $634,519,597$4,500,444 $3,520,249 $2,663,281 $2,090,003 $6,042,087 $6,401,028 $1,128,829 $737,847 $1,208,469 $245,707 $96,626 ‐$30,255 ‐$117,969 ‐$164,954 $2,297,441 ‐$228,117 ‐$232,123 ‐$227,172
‐$25,430,979 ‐$21,910,730 ‐$19,247,449 ‐$17,157,446 ‐$11,115,359 ‐$4,714,331 ‐$3,585,502 ‐$2,847,654 ‐$1,639,185 ‐$1,393,478 ‐$1,296,852 ‐$1,327,106 ‐$1,445,076 ‐$1,610,029 $687,412 $459,295 $227,172 ‐$0
$16.03 $17.15 $18.58 $19.79 $19.89 $17.81 $19.56 $22.22 $25.28 $28.68 $33.04 $39.53 $47.85 $56.00 $54.67 $80.75 $113.90 $155.01 $18.33
$29,151,000 $29,151,000 $29,151,000 $29,151,000 $25,108,500 $20,228,500 $20,228,500 $20,228,500 $19,243,000 $19,243,000 $19,243,000 $19,243,000 $19,243,000 $19,243,000 $14,209,000 $14,209,000 $14,209,000 $14,209,000 $984,678,450$51,349,905 $50,394,584 $49,444,744 $48,811,666 $42,726,153 $34,222,575 $33,523,338 $32,761,950 $30,407,122 $29,969,408 $29,580,225 $29,184,106 $28,853,529 $28,639,705 $21,488,651 $21,221,022 $21,084,695 $21,003,421 $1,650,395,819
$21.05 $23.54 $26.69 $29.34 $28.35 $25.75 $29.75 $35.86 $43.57 $51.44 $61.51 $76.52 $95.80 $114.68 $106.71 $163.64 $235.39 $324.18$37.08 $40.69 $45.27 $49.13 $48.24 $43.56 $49.31 $58.08 $68.85 $80.12 $94.55 $116.04 $143.65 $170.69 $161.38 $244.39 $349.29 $479.19 $45.44
TINUED FROM PREVIOUS PAGE
ENHANCED HYDROCARBON RECOVERY STUDY (FINAL)Prepared for: Alberta Research Council (ARC) Rev. 1 Project 017935, September, 2008 App 4‐13 Chemicals and Petroleum

CO2 Enhanced Hydrocarbon Recovery Summary Report December, 2009 Incremental Recovery and CO2 Storage Potential in Alberta
Appendix 3
Request for Proposal
CO2 Enhanced Hydrocarbon Recovery (EHR): Incremental Recovery and CO2 Storage Potential in Alberta
Alberta Energy Research Institute RFP# AERI007
Alberta Research Council A3-1
REQUEST FOR PROPOSALS (RFP) RFP #: AERI007
Alberta Advanced Education & Technology Alberta Energy Research Institute 25th Floor, AMEC Place 801 - 6 Avenue S.W. Calgary, Alberta, T2P3W2
CO2 Enhanced Hydrocarbon Recovery (EHR): Incremental Recovery and CO2 Storage Potential in Alberta
RFP Issue Date: June 19, 2007
RFP Closing: 4:30 pm Alberta Time, July 16, 2007 Contracting Administrator: Susan Emilsson Fax: (403) 297 3638 E-mail: [email protected]
Vendors may obtain this document directly from the Contracting Administrator. Facsimile or digital Proposals (i.e., Word 2000 or PDF format for text) will be accepted, however, the required THREE (3) of print versions must also be sent. All materials and
copies of the Proposal must be received by the RFP Closing prescribed above.
CO2 EOR – Incremental Recovery and CO2 Storage i

TABLE OF CONTENTS
1. DEFINITIONS __________________________________________________________ 1 2. CO2 ENHANCED HYDROCARBON RECOVERY: INCREMENTAL RECOVERY
AND CO2 STORAGE POTENTIAL _________________________________________ 2 2.1 Preamble__________________________________________________________________ 2 2.2 Term of Contract___________________________________________________________ 3 2.3 Description of Deliverables___________________________________________________ 3 2.4 Required Expertise _________________________________________________________ 3 2.5 Proposal Format ___________________________________________________________ 4 2.6 Proposal Content ___________________________________________________________ 4 2.7 Evaluation Criteria _________________________________________________________ 7 2.8 Proposed Schedule of Events _________________________________________________ 8
3. VENDOR PROPOSAL GUIDELINES _______________________________________ 8 3.1 General Information ________________________________________________________ 8 3.2 Proposal Submission and RFP Closing _________________________________________ 8
4. PROPOSAL EVALUATION PROCESS AND SEQUENCE ______________________ 9 4.1 Phase One _________________________________________________________________ 9 4.2 Phase Two_________________________________________________________________ 9 4.3 Phase Three ______________________________________________________________ 10
5. RFP ADMINISTRATION TERMS AND CONDITIONS _______________________ 10 5.1 Stipulations_______________________________________________________________ 10 5.2 The Contract _____________________________________________________________ 11 5.3 Confidentiality ____________________________________________________________ 11
5.3.1 Confidentiality and Security of Information ____________________________________________11 5.3.2 FOIP and Collection of Personal Information __________________________________________11 5.3.3 Protection of Privacy _____________________________________________________________12
5.4 Period of Commitment _____________________________________________________ 12 5.5 Subcontracting____________________________________________________________ 13 5.6 Computers, Software, Parking, Secretarial Services, Travel, Expenses and Insurance _ 13 5.7 Proposal Expenses _________________________________________________________ 13 5.8 Agreement on Internal Trade________________________________________________ 13 5.9 Copyright ________________________________________________________________ 14 5.10 Conflict of Interest_________________________________________________________ 14 5.11 Proposal Returns __________________________________________________________ 14 5.12 Vendor Debriefing _________________________________________________________ 14 5.13 Questions ________________________________________________________________ 14 5.14 Contact Information _______________________________________________________ 15
APPENDIX A: VENDOR PROPOSAL COVER SHEET _______________________ 15 APPENDIX B: CONSORTIUM PROPOSAL COVER SHEET __________________ 16 APPENDIX C: TABLES _________________________________________________ 18
CO2 EOR – Incremental Recovery and CO2 Storage ii

1. DEFINITIONS Vendors are advised to pay careful attention to the wording used throughout this Request for Proposals (RFP). Failure to satisfy any term or condition of this RFP may deem the Proposal ineligible for consideration by Alberta Advanced Education & Technology. Throughout this RFP, terminology is used as follows: Alberta Advanced Education & Technology means Her Majesty the Queen in Right of Alberta as represented by the Minister of Advanced Education & Technology. ADOE means the Alberta Department of Energy. AERI means the Alberta Energy Research Institute. Alberta Time means Mountain Standard Time or Daylight Saving Time as provided for in the Daylight Saving Time Act of Alberta. APC means the Alberta Purchasing Connection (www.purchasingconnection.ca), the service used by the Government of Alberta that provides an open and competitive marketplace to advertise business opportunities, release open bidding opportunities and support the procurement process. Business Day means 8:15 a.m. to 4:30 p.m., Alberta Time, Monday to Friday, excluding statutory holidays observed by Alberta Advanced Education & Technology. Business Hours means 8:15 a.m. to 4:30 p.m., Alberta Time, on Business Days. CCS means CO2 Capture and Storage. Consortium means two or more individuals and/or organizations that together submit a Proposal. Note that when a Consortium submits a Proposal, the Proposal Form in Appendix “B” must be used. Contract means an executed agreement between a successful Vendor and Alberta Advanced Education & Technology to provide the Deliverables described in this RFP. Deliverables mean the tasks described in section 2.3, and includes all the working papers, surveys, notes, plans, designs, reports, records, studies, drawings, examinations, assessments, procedures, specifications, evaluations, results, conclusions, interpretations, calculations, analyses, systems, software, source code, documents, writings, programs, hardware, devices, data or any components of these, regardless of how they are represented, stored, produced, or acquired. EHR means Enhanced Hydrocarbon Recovery.
CO2 EOR – Incremental Recovery and CO2 Storage 1
Evaluation Team means the individuals who, on behalf of Alberta Advanced Education & Technology, will evaluate the Proposals to this RFP. Expertise means knowledge, skills and/or experience gained through post-secondary education, employment, voluntary activities, and continuous learning. FOIP means the Freedom of Information and Protection of Privacy Act of Alberta, R.S.A. 2000, c. F-25, as amended, revised or substituted from time to time. Personal Information means recorded information about an identifiable individual defined in section 1(n) of FOIP, R.S.A. 2000, c. F-25, as amended. Prime Vendor means the Vendor in a Consortium that is responsible for the completion of all Deliverables and is accountable for all terms and conditions of a Contract. Proposal means the Vendor’s response to this RFP and includes all the Vendor’s attachments. RFP means this Request for Proposals document and associated documentation and appendices.
Vendor means an individual, organization or Consortium providing a Proposal to this RFP. Vendor’s Resource(s) means the personnel assigned by the Vendor to complete the Deliverables pursuant to a Contract, and includes its employees, subcontractors and agents. References to “Alberta Advanced Education & Technology”, “Government of Alberta”, “Her Majesty”, “Minister”, and “Ministry” mean “Her Majesty the Queen in right of Alberta” and are only used for administrative purposes. Headings are used for convenience only, and they do not affect the meaning or interpretation of the clauses. Words in the singular include the plural and vice versa.
2. CO2 ENHANCED HYDROCARBON RECOVERY: INCREMENTAL RECOVERY AND CO2 STORAGE POTENTIAL
2.1 Preamble In the Ministry of Advanced Education & Technology, the Alberta Energy Research Institute (AERI) works with industry and other government ministries to promote innovation and technology that will enable Alberta's energy sector to evolve. Its strategic focus areas include conventional and unconventional oil & gas recovery and upgrading, clean coal, electricity, renewable and alternative energy, CO2 management and water management. Background information on AERI is available at: http://www.aeri.ab.ca/.
CO2 EOR – Incremental Recovery and CO2 Storage 2
The Alberta Department of Energy (ADOE) is responsible for ensuring the development of Alberta’s energy resources are appropriate, environmentally sustainable, and in the public interest. To accomplish this goal, Alberta also supports further the development of enhanced recovery technologies, alternate sources of energy, improved energy efficiencies, and emissions reductions technologies, while maintaining a competitive royalty and regulatory framework necessary to attract capital investment from world markets. Background information on ADOE is available at http://www.energy.gov.ab.ca/. ADOE and AERI invite Vendors to submit a proposal to complete a detailed reservoir and development analysis to quantify the potential for incremental recovery and CO2 Capture and Storage (CCS) pertaining to CO2 Enhanced Hydrocarbon Recovery (EHR) current and future activities in Alberta. The intention is to study representative pools in detail to predict the incremental oil recovery and CO2 storage in the pool and develop a methodology to extrapolate the findings to the remainder of the pools amenable to CO2 EOR. Development plans including capital and operating cost estimates, schedule of expenditures, etc. are required to permit the ADOE to complete evaluation of the economic and crown royalty impact of the CO2 EOR. Vendors are requested to provide complete details on the approach that they will take to complete the study. Vendors are encouraged to recommend alternative approaches to complete the work. It is the intention of AERI and ADOE to work closely with the successful Vendor to finalize the study scope, pools to be evaluated and data sources. Proposals shall include the estimated effort required to complete the work.
2.2 Term of Contract The Deliverables must be completed on or before March 1, 2008.
2.3 Description of Deliverables The successful Vendor shall provide AERI and ADOE with a detailed report for the work completed, including performance predictions for both continued current operation and CO2 EHR development in a format that ADOE can conveniently consolidate into their Royalty model for economic analysis and AERI can use to identify CCS technology gaps. The successful Vendor may also be required to provide a summary report of the final predictions but excluding methodology and any discussion of how any confidential information was used.
2.4 Required Expertise
The Vendor must demonstrate expertise in engineering design and project implementation pertaining to Enhanced Hydrocarbon Recovery and Carbon Dioxide Capture and Storage. The Vendor shall provide information on the qualifications and experience of the corporation and key personnel to be assigned to complete the study.
CO2 EOR – Incremental Recovery and CO2 Storage 3
2.5 Proposal Format Vendors should review section 3 for an explanation of the requirements for a compliant Proposal The documents are required to form a compliant Proposal include a proposal submission letter, Vendor Profile, RFP requirement and detailed budget.
2.6 Proposal Content Only Proposals that provide information for all of the following tasks will be considered: Task 1A: Identify, Screen Study Pools: AERI and ADOE have identified oil pools with miscible CO2 EHR and storage potential. A list of these pools, Tables 1A, 1B & 1C, is attached as Appendix C. The following summarizes the pools to be studied.
Miscible Horizontal CO2 EHR - Tables 1A: Seventy (70) horizontal pools with CO2 EHR potential have been identified; nine (9) of these pools have both waterflood and solvent flood areas that have CO2 EHR potential. The following distribution of studies is proposed: 1. At least two (2) high quality areas of the five (5) Cardium pools with different
characteristics need to be analysed. 2. At least one (1) of the eight (8) Beaverhill Lake Pools that have had horizontal
hydrocarbon miscible solvent (HCMS) floods need to be analysed to determine both oil and hydrocarbon solvent recovery.
3. At least two (2) pools with significantly different reservoir characteristics should be analysed from the ten (10) areas in the Beaverhill Lake Pools that have been water flooded.
4. At least one (1) of the nine (9) D-2 pools, that have been water flooded or have a strong natural water drive should be analysed.
5. At least one (1) of the five (5) D-3 pools that have been water flooded or have a strong natural water drive should be analysed.
6. At least three (3) pools of the forty-two (42) other pools in various pool types should be selected for further study.
Immiscible Horizontal CO2 EHR - Tables 1B: Sixty-five (65) horizontal pools with immiscible CO2 EHR potential have been identified, the major pool types include: 1. One (1) of the thirteen (13) Mannville Pools that have been water flooded or has a strong
natural water drive should be analysed.
CO2 EOR – Incremental Recovery and CO2 Storage 4
2. One (1) of the nine (9) Dina Pools that have been water flooded or have a strong natural water drive should be analysed.
3. At least one (1) of the forty-three (43) other pools should be selected for further study. Oil Pools with Large Gas Caps - Tables 1C: Eighty-two (82) pools with large gas caps have the potential to store a significant volume of CO2. However there is a concern that the gas cap will be a large thief zone precluding or dramatically delaying Enhanced Hydrocarbon recovery from the large remaining oil in these pools. Vendors are requested to select pools with gas caps in communication with oil legs for study: 1. At least two (2) of which has been produced with a water fence 2. At least two (2) where the oil was produced prior to gas cap blowdown 3. The above pools should have a variation in the ratio of HCPV between the gas cap and
oil leg from low (~25%) to high (~200%). Task 1B: Group Study Pools: The pools to be studied should be selected to maximize the number of other pools that can have EHR potential assigned by considering analogue issues like: 1. Formation type and productivity 2. Depth, temperature and pressure data 3. Reservoir fluid properties 4. Development history and past performance 5. Heterogeneity Task 1C: Final Pool Selection: AERI and ADOE will work closely with the successful Vendor to finalize the pools to be evaluated. This selection will be impacted by: 1. The amount of EHR that might be developed by the pool type 2. The number of “analogue” pools where the data can be extrapolated to predict EOR 3. The location of the pools to facilitate infrastructure development 4. Participation of the pool operators in the study 5. Suitable pools where the Vendor may have specific expertise to facilitate the work. Task 1D: Final Selection: The final selection of pools shall be made to maximize available pool information, which can be completed within the time constraints of this study. Vendor shall identify the sources of data that they plan to utilize completing this work. ADOE has confidential information on performance of CO2 EHR pilots some of the pools that may be shared with the successful vendor under strict confidentiality. Task 2: Geology and Reservoir Engineering:
CO2 EOR – Incremental Recovery and CO2 Storage 5
Vendors are requested to provide all information and analysis necessary to provide a performance prediction for oil recovery accurate to approximately plus or minus 25% for the specific fields studied. Vendors shall provide their plan to complete the following: 1. The detail of geological description required for the pools, and how the work will be
completed. 2. Vendor shall specify whether to correlations will be used or what additional laboratory
and other studies will be required to complete the performance prediction. 3. Simulation tools to be used in the predictions, streamline modelling or numerical
simulation, (compositional or black oil) shall be used as required to provide the required predictions.
4. Past performance history match and a production forecast for continued operation of current production strategy is required. This information should include predicted annual average water and HCMS (where applicable) injection and oil, gas HCMS (where applicable), and water production rates and total volumes. In addition to any possible infill or other development required to produce the remaining reserves shall be identified.
5. The CO2 EHR prediction shall include CO2 and water injection, and oil, gas, HCMS (where applicable), CO2, and water production in total, by time step and on an annual basis and a prediction of the total CO2 stored. It shall be assumed that all of the produced CO2 shall be recycled to the reservoir.
6. Predict optimum reservoir operating pressure and determine injection required to pre-pressure the reservoir.
7. Identify constraints to pool development (e.g. injectivity, productivity, conformance) and potential research to overcome these barriers.
8. Evaluate different development strategies for the CO2 EHR prediction including: • infill drilling • horizontal drilling • various CO2 and water injection strategies (simultaneous, tapered WAG, different
WAG ratio’s etc) • different pattern configuration (5 spot, 9 spot, line drive) • different CO2 HCPV injection volumes (25%, 50%, 75%, & 100%) for best
injection strategy 9. Estimate the injection well tubing head pressure for CO2 injection and CO2 purity
required for the field, including concentration of allowable contaminants. 10. Determine if economics or other constraints preclude recycling the complete produced
gas stream. 11. Specify the proposed recovery process for the immiscible CO2 EHR pools. Task 3: Development Plan:
CO2 EOR – Incremental Recovery and CO2 Storage 6
Vendors are requested to prepare a development plan for the CO2 EHR project so that the ADOE can complete an economic analysis of the CO2 EOR. The ADOE will provide the successful company with a list of the final information tables to be provided. 1. Study should be completed assuming source CO2 is delivered to a central point in the
field at injection pressure. 2. Development strategies should allow for 8 – 12 years of constant source CO2 supply to
the pool before significant decline in source CO2 requirement occurs. 3. Study should identify new wells, well re-completions, use or replacement of existing
injection and gathering pipeline systems, and treating and water injection facilities. Where suitable existing infrastructure should be reused.
4. Appropriate plant to recycle either the full produced gas stream or capture the CO2 from the produced gas to meet reservoir needs.
5. Capital and operating cost estimates with an approximate plus or minus 25% accuracy shall be provided for the cases. Energy requirements and emissions of CO2 from the operation of the EHR project shall be estimated. Capital expenditures shall be phased consistent with the development plan. All assumptions used in the cost estimates shall be included.
2.7 Evaluation Criteria Vendors should review section 4 for a description of the evaluation process. Proposals will be evaluated using the following criteria:
List of Criteria Score Expertise and experience of the key personnel in the area of work for which they are responsible
20
Quality of the proposal, including unique approaches that might expedite the study and or increase oil recovery and number of pools to which the results can be applied
20
Approach to well and facility design materials selection for CO2 flooding, knowledge of CO2 recycle and cost estimation
20
WCSB production & geological experience knowledge 10 Corporate experience and key personnel experience in CO2 EOR, reservoir modelling and other relevant areas
10
Corporate and key personnel experience with waterflood and miscible flood simulation studies.
10
Corporate tools (e.g. numerical simulators, other) and access to pool and other data
5
Resources to complete the work within the required time frame 5 Total Possible Points 100
CO2 EOR – Incremental Recovery and CO2 Storage 7
Vendors with the highest scores may be invited to make a presentation to the Evaluation Team and references may be checked. The results of the presentations and reference checks will be used by the Evaluation Team to revise the scores. If a Contract is awarded as a result of this RFP, it will be offered to the Vendor with the highest revised score. In the event of a tie, the Evaluation Team will develop and apply a suitable tie-breaking mechanism.
2.8 Proposed Schedule of Events RFP Issue Date June 19, 2007 RFP Close Date July 16, 2007, 4:30 pm, Alberta Time The above dates are subject to change at the sole discretion of Alberta Advanced Education & Technology.
3. VENDOR PROPOSAL GUIDELINES
3.1 General Information Proposals that do not include the proper required documents as listed in section 2.6 shall be deemed non-compliant. Vendors may respond to this RFP as a single Vendor or as a Consortium. If the Proposal is from a Consortium, the Proposal cover sheet in Appendix “B” must be used, and each member of the Consortium must sign and date the cover sheet. Vendors may request a Word version of the Proposal form from the Contracting Administrator, but must not adjust the formatting in any way. Forms must be typed or computer generated.
3.2 Proposal Submission and RFP Closing Proposals must be received by Alberta Advanced Education & Technology on or before 4:30 p.m. Alberta Time on July 16, 2007 (the “Closing Date”). For RFP closing purposes, the official time of receipt of Proposals shall be as determined by the clock used by the Contracting Administrator to time and date stamp the Proposals. Vendors may amend or withdraw their Proposal prior to the RFP Closing Date and time by submitting a clear and detailed written notice to the Contracting Administrator. Proposals become irrevocable after the RFP Closing Date. In either of the following circumstances:
CO2 EOR – Incremental Recovery and CO2 Storage 8
a) the Vendor has rescinded a Proposal prior to the RFP closing date and time; or b) Alberta Advanced Education & Technology has received the Proposal after the RFP closing
date and time;
Such Proposal will, at the Vendor’s choice, either be returned to the Vendor at the Vendor’s expense after the RFP closing date and time, or destroyed by Alberta Advanced Education & Technology after the RFP closing date and time. In responding to this RFP: (a) The RFP cover page must be completed, signed by the Vendor and included in the
Proposal. (b) Proposals received unsigned or after the RFP Closing Date will be rejected. (c) Ambiguous, unclear or unreadable Proposals may be cause for rejection. (d) Proposals should be sealed and clearly marked with the RFP number and Closing Date
and addressed as follows: Attention: Susan Emilsson Alberta Energy Research Institute, Suite 2540, 801 6th Avenue SW Calgary, AB T2P 3W2 [email protected]
(e) Submit three signed print versions of the Proposal
Proposals submitted electronically or by fax will be accepted so long as the required three print versions of the Proposal and all other related material are received on or before 4:30 p.m., Alberta Time, July 16, 2007. In the event of discrepancies between the print version and the electronic version, the version received first will govern.
Alberta Advanced Education & Technology is not responsible for technical failures that may result in the Proposals not being received prior to the dates and times noted above.
4. PROPOSAL EVALUATION PROCESS AND SEQUENCE The Evaluation Procedure consists of the following three phases:
4.1 Phase One
The Evaluation Team determines whether the Vendor has fully met the evaluation criteria. Evaluation of the quality of content is the focus of Phase Two. If a Proposal does not meet all of the evaluation criteria in Phase One, then it will not be evaluated further.
4.2 Phase Two • Evaluation Team members score the Proposals using the evaluation criteria listed in
section 2.8, prior to meeting as a team. • The individual scores are compared and discussed when the Evaluation Team meets.
CO2 EOR – Incremental Recovery and CO2 Storage 9
• A final team score for each criterion is agreed upon, either through consensus, or through a calculation of the average score.
• The Proposals with the highest final scores for Phase Two will be short-listed and considered for Phase Three
4.3 Phase Three
• High-ranking Vendors will be invited to make a presentation to the Evaluation Team. • References may be contacted in order to assess the Vendor’s suitability for a Contract. • Based upon the additional information provided, the Evaluation Team will revise the
consensus scores If any Contract is offered as a result of this RFP, the Vendor with the highest final score will be invited to negotiate a Contract. Alberta Advanced Education & Technology reserves the right to not award a Contract if no Proposal receives a minimum of 60% of the available points. It also reserves the right to refuse to offer a Contract to a Vendor should a reference check prove unfavorable in the opinion of the Evaluation Team. Subject to the requirements of the FOIP Act, discussed below, such scores, described above, shall be confidential, and no totals or scores of such ratings shall be released to any other party.
5. RFP ADMINISTRATION TERMS AND CONDITIONS
5.1 Stipulations Alberta Advanced Education & Technology reserves the right to cancel this RFP at any time and to reissue it for any reason whatsoever, without incurring any liability and no Vendor will have any claim against Alberta Advanced Education & Technology as a consequence. Alberta Advanced Education & Technology is not bound to accept the Proposal that provides the lowest price quote, nor any Proposal of those submitted. Pricing quoted shall be in Canadian dollars and exclusive of the Goods and Services Tax and Harmonized Sales Tax. A Proposal submitted in response to the RFP constitutes an offer and will proceed to a Contract only if Alberta Advanced Education & Technology accepts the Proposal. Alberta Advanced Education & Technology reserves the right to request further information from interested Vendors as required, and at the Vendor’s expense.
CO2 EOR – Incremental Recovery and CO2 Storage 10
5.2 The Contract The Contract to be entered into between the successful Vendor and Alberta Advanced Education & Technology shall be negotiated by Alberta Advanced Education & Technology. If, in Alberta Advanced Education & Technology’s opinion, it appears that the negotiations will not result in a Contract with the preferred Vendor within thirty (30) days, negotiations with other Vendors submitting Proposals may be undertaken. This RFP and the Proposal shall form part of the Contract. In the case of conflicts, discrepancies, errors or omissions among this RFP, the Proposal and the Contract, the documents and amendments to them shall take precedence and govern in the following order: (a) Contract (b) RFP (c) Proposal Claims made in the Proposal will constitute contractual warranties. Any provisions in the Proposal may be included in the Contract as a direct provision thereof
5.3 Confidentiality
5.3.1 Confidentiality and Security of Information The Vendor shall: (a) keep strictly confidential all information concerning Alberta Advanced
Education & Technology and/or third parties, or any of the business or activities of Alberta Advanced Education & Technology and/or third parties acquired as a result of participation in this RFP;
(b) only use, copy or disclose such information as necessary for the purpose of submitting a Proposal or upon written authorization of Alberta Advanced Education & Technology; and
(c) Maintain security standards, including control of access to data and other information, consistent with the highest standards of business practice in the industry.
5.3.2 FOIP and Collection of Personal Information The purpose of collecting the Personal Information requested in this RFP is to enable Alberta Advanced Education & Technology to ensure the accuracy and reliability of the Proposal, to enable Alberta Advanced Education & Technology to evaluate the Vendor’s response to this RFP and to fulfill other related program purposes of Alberta Advanced Education & Technology. Authority for this collection is section 33(c) of FOIP. FOIP applies to all information and records relating to, or obtained, generated, created, collected or provided under, the RFP and/or the Contract and which are in the custody or control of Alberta Advanced Education & Technology.
CO2 EOR – Incremental Recovery and CO2 Storage 11

All documents submitted to Alberta Advanced Education & Technology are governed by the access and privacy provisions of FOIP. While FOIP allows persons a right of access to records in Alberta Advanced Education & Technology’s custody or control, it also prohibits Alberta Advanced Education & Technology from disclosing Personal Information or confidential business information. This prohibition takes effect if disclosure would be significantly harmful to a Vendor’s business interests or would be an unreasonable invasion of personal privacy as defined in sections 16 and 17 of the Act. Vendors are encouraged to identify those portions of their submissions which they are submitting in confidence and which, if revealed, would harm the business interests of the Vendor. Evaluation criteria and process for this RFP are public information. Individual assessments of Vendors are considered confidential and of interest to competitors or other Vendors under this RFP. Individual assessment information will be provided, upon request, to the Vendor to whom it relates, and to others, only in accordance with FOIP. Information regarding FOIP procedures is available on the web at http://www.gov.ab.ca/foip.
5.3.3 Protection of Privacy FOIP imposes an obligation on Alberta Advanced Education & Technology, and through the RFP and related Contract, on the Vendor, to protect the privacy of individuals to whom information relates. The Vendor will meet the standards set by the requirements of Part 2 of FOIP, for all Personal Information the Vendor has access to, collects or uses, discloses or destroys as a consequence of carrying out obligations under the contract. By submitting Personal Information, the Vendor consents and shall obtain the consent of the Vendor’s Resources to its disclosure for the purposes, stated in section 5.3.2, to verify professional standing and to conduct reference checks, if needed. All costs associated with meeting the Vendor’s requirements of FOIP as set out in this RFP and the Contract will be borne by the Vendor.
5.4 Period of Commitment Proposals shall be final and binding on the Vendor for 90 days from the RFP’s Closing date and time and may not be altered by subsequent offerings, discussions, or commitments unless the Vendor is requested to do so by Alberta Advanced Education & Technology.
CO2 EOR – Incremental Recovery and CO2 Storage 12

5.5 Subcontracting The Vendor may subcontract only upon written approval from Alberta Advanced Education & Technology, such approval not to be unreasonably withheld.
5.6 Computers, Software, Parking, Secretarial Services, Travel, Expenses and Insurance
The successful Vendor: • Will provide their own office space, equipment, computers, software, telephone and
photocopy facilities as required, and other tools as necessary for the purpose of performing the Services. Amenities, including but not limited to secretarial services and parking, will not be provided. Onsite equipment, computers, software, telephone and photocopy facilities may be available for use when the work requires face-to-face collaboration at an Alberta Advanced Education & Technology office location.
• May be required to provide evidence of a valid security clearance check, normally a
background and criminal records check, on the Vendor, if the Vendor is an individual, or on any or all of the Vendor's employees, agents or subcontractors that may be providing the services, prior to a contract being executed. Alberta Advanced Education & Technology will be under no obligation to enter into any Contract with a Vendor if, in the opinion of Alberta Advanced Education & Technology, acting reasonably, the results of such a security clearance check is not satisfactory.
• May be required to travel to meet contractual requirements and may be expected to attend occasional project meetings at their own expense.
• Must submit expense invoices to be reimbursed for approved expenses incurred while delivering the Services. The expense invoices must contain the Pre-qualified Vendor’s name, Contract number, total expense, and attach actual receipts.
• Are required, at their own expense, to obtain insurance under a contract of General Liability Insurance in accordance with the Alberta Insurance Act in an amount not less than $2,000,000 inclusive per occurrence insuring against bodily injury, personal injury, and property damage including loss of use thereof. Evidence of such insurance in a format acceptable to Alberta Advanced Education & Technology shall be made available to Alberta Advanced Education & Technology, at Alberta Advanced Education & Technology’s request, as a condition of any Contract(s).
5.7 Proposal Expenses The Vendor is responsible for all costs of: • preparing the Proposal • attending an interview if applicable, and • For subsequent negotiations, if any, with Alberta Advanced Education & Technology.
5.8 Agreement on Internal Trade This RFP is subject to Chapter 5 of the Agreement on Internal Trade.
CO2 EOR – Incremental Recovery and CO2 Storage 13

5.9 Copyright All Deliverables produced by the Vendor under the Contract shall become the property of the Crown in Right of Alberta. The Vendor will also waive all moral rights to the Deliverables.
5.10 Conflict of Interest Vendors must fully disclose in writing to the Contracting Administrator on or before the closing date of this RFP, the circumstances of any possible conflict of interest or what could be perceived as a possible conflict of interest if the Vendor were to become a contracting party pursuant to this RFP. Alberta Advanced Education & Technology shall review any submissions by Vendors under this provision and may reject any Proposals where, in the opinion of Alberta Advanced Education & Technology, the Vendor could be in a conflict of interest or could be perceived to be in a possible conflict of interest position if the Vendor were to become a contracting party pursuant to this RFP
5.11 Proposal Returns Proposals and accompanying documentation submitted by the Vendors are the property of Alberta Advanced Education & Technology and will not be returned. The Proposals and accompanying documentation shall be retained in accordance with Alberta Advanced Education & Technology’s records management policies and regulations.
5.12 Vendor Debriefing Alberta Advanced Education & Technology will, at the request of an unsuccessful Vendor who responded to this RFP, conduct a debriefing for the purpose of informing the Vendor as to why their Proposal was not selected.
5.13 Questions All questions regarding the RFP must be directed to the Contracting Administrator, in writing. Enquiries and responses will be recorded and may, at the Minister’s discretion, be distributed to all Vendors. The Vendor is responsible for notifying the Contracting Administrator in writing of any ambiguity, divergence, error, omission, oversight, or contradiction, or item subject to more than one interpretation in the RFP, as it is discovered, and to request any instruction, decision, or direction required to prepare the Proposal. In order for Alberta Advanced Education & Technology to deal effectively with Vendor questions or concerns about any term, condition or requirements of this RFP, such questions or concerns must be communicated in writing to the Contracting Administrator on or before July 12, 2007 4:30 p.m., Alberta Time. Questions received after this time will be answered if time permits.
CO2 EOR – Incremental Recovery and CO2 Storage 14

CO2 EOR – Incremental Recovery and CO2 Storage 15
Verbal responses to enquiries are not binding on any party. Questions may be directed to Dr. Surindar Singh, e-mail at [email protected] .
5.14 Contact Information For further information, contact:
Dr. Surindar Singh Senior Research Manager, CO2 Management
Alberta Energy Research Institute Alberta Advanced Education & Technology 6th Floor, Phipps-McKinnon Building,
Suite 500, 10020 - 101A Ave NW, Edmonton, Alberta T5J 3G2.
Phone (780) 422 0046
E-mail: [email protected]
APPENDIX A: VENDOR PROPOSAL COVER SHEET
Alberta Energy Research Institute 25th Floor, AMEC Place 801 - 6 Avenue S.W. Calgary, Alberta, T2P3W2
CO2 Enhanced Hydrocarbon Recovery (EHR): Incremental Recovery and CO2 Storage Potential in Alberta
Opportunity Number: AERI007
RFP Issue Date: June 19, 2007 RFP Closing: 4:30 pm Alberta Time, July 16, 2007 Contracting Administrator: Susan Emilsson Fax: (403) 297 3638 E-mail: [email protected]
Vendors may obtain this document directly from the Contracting Administrator
Facsimile or digital Proposals (i.e., Word 2000 or PDF format for text) will be accepted, however, the required THREE (3) print versions must also be sent. All materials and copies
of the Proposal must be received by the RFP Closing prescribed above. Vendors must sign and return this cover page with their Proposal.
Enclosed is my Proposal to this Request for Proposals. The Vendor consents, and has obtained written consent of any individuals identified in the Proposal, to the use of the information in the Proposal by Alberta Advanced Education & Technology; Alberta Advanced Education & Technology’s employees, subcontractors and agents, to evaluate the Proposal and use this information for other program purposes of Alberta Advanced Education & Technology. __________________________________ __________________________________ Vendor Name (if different than Authorized vendor Address Signature below) __________________________________ __________________________________ Telephone Facsimile __________________________________ __________________________________ Authorized Signature (Print Name) __________________________________ __________________________________ Title (if applicable) Date Vendors must accept the administration terms and conditions of the RFP by completing the following statement. I, ____________________ (sign name), (check box) accept the Administration Terms and Conditions in Section 5 of this Request for Proposals.
CO2 EOR – Incremental Recovery and CO2 Storage 15

APPENDIX B: CONSORTIUM PROPOSAL COVER SHEET
Alberta Energy Research Institute 25th Floor, AMEC Place 801 - 6 Avenue S.W. Calgary, Alberta, T2P3W2
CO2 Enhanced Hydrocarbon Recovery (EHR): Incremental Recovery and CO2 Storage Potential in Alberta
Opportunity Number: AERI007
RFP Issue Date: June 19, 2007 RFP Closing: 4:30 pm Alberta Time, July 16, 2007 Contracting Administrator: Susan Emilsson Fax: (403) 297 3638 E-mail: [email protected]
Vendors may obtain this document directly from the Contracting Administrator
Facsimile or digital Proposals (i.e., Word 2000 or PDF format for text) will be accepted, however, the required THREE (3) print versions must also be sent. All materials and copies
of the Proposal must be received by the RFP Closing prescribed above. Vendors must sign and return this cover page with their Proposal.
Enclosed is my Proposal to this Request for Proposals. The Vendor consents, and has obtained written consent of any individuals identified in the Proposal, to the use of the information in the Proposal by Alberta Advanced Education & Technology; Alberta Advanced Education & Technology’s employees, subcontractors and agents, to evaluate the Proposal and use this information for other program purposes of Alberta Advanced Education & Technology. __________________________________ __________________________________ Prime Vendor Name Vendor Address __________________________________ __________________________________ Telephone Facsimile __________________________________ __________________________________ Authorized Signature (Print Name) __________________________________ __________________________________ Title (if applicable) Date Vendors must accept the administration terms and conditions of the RFP by completing the following statement. I, ____________________ (sign name), (check box) accept the Administration Terms and Conditions in Section 5 of this Request for Proposals.
CO2 EOR – Incremental Recovery and CO2 Storage 16
RFP # NUMBER Consortium Proposal Cover Sheet – Page 2 ________________________________ __________________________________ Vendor Name Vendor Address __________________________________ __________________________________ Telephone Facsimile __________________________________ __________________________________ Authorized Signature (Print Name) __________________________________ __________________________________ Title (if applicable) Date Vendors must accept the administration terms and conditions of the RFP by completing the following statement. I, ____________________ (sign name), (check box) accept the Administration Terms and Conditions in Section 5 of this Request for Proposals __________________________________ __________________________________ Vendor Name Vendor Address __________________________________ __________________________________ Telephone Facsimile __________________________________ __________________________________ Authorized Signature (Print Name) __________________________________ __________________________________ Title (if applicable) Date Vendors must accept the administration terms and conditions of the RFP by completing the following statement. I, ____________________ (sign name), (check box) accept the Administration Terms and Conditions in Section 5 of this Request for Proposals
Please Note: Vendors must add signature lines to accommodate all Vendors in a Consortium.
CO2 EOR – Incremental Recovery and CO2 Storage 17
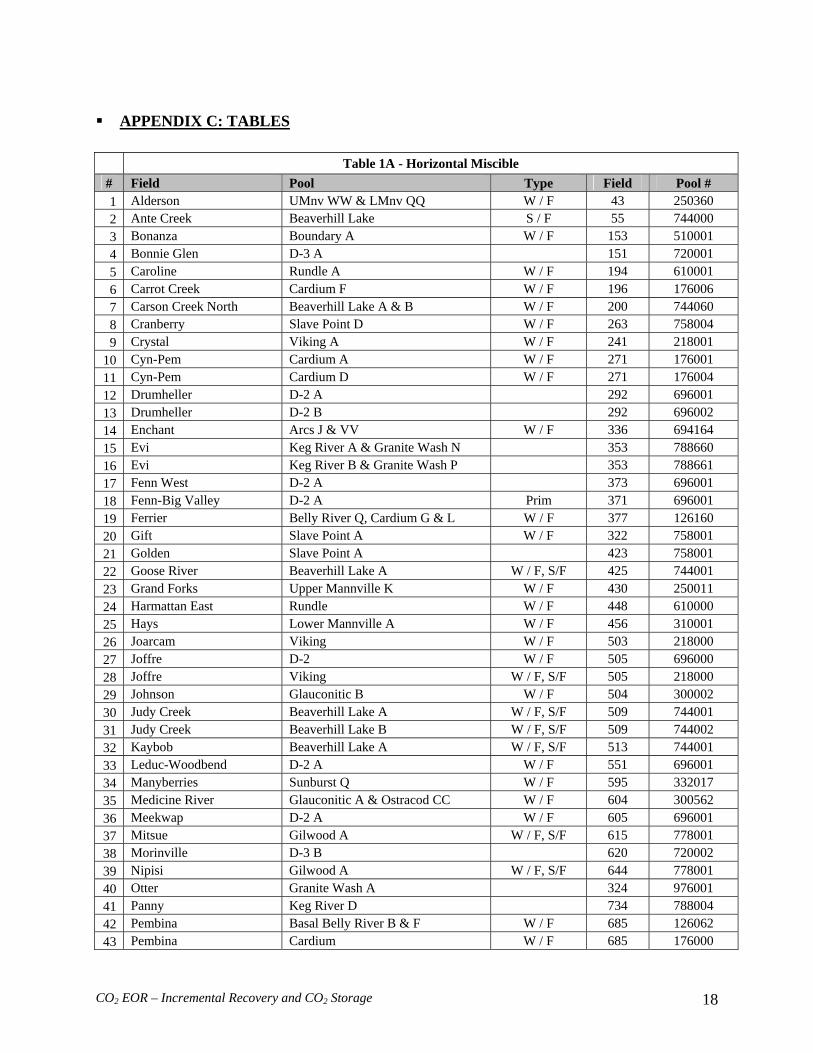
APPENDIX C: TABLES
Table 1A - Horizontal Miscible # Field Pool Type Field Pool # 1 Alderson UMnv WW & LMnv QQ W / F 43 250360 2 Ante Creek Beaverhill Lake S / F 55 744000 3 Bonanza Boundary A W / F 153 510001 4 Bonnie Glen D-3 A 151 720001 5 Caroline Rundle A W / F 194 610001 6 Carrot Creek Cardium F W / F 196 176006 7 Carson Creek North Beaverhill Lake A & B W / F 200 744060 8 Cranberry Slave Point D W / F 263 758004 9 Crystal Viking A W / F 241 218001
10 Cyn-Pem Cardium A W / F 271 176001 11 Cyn-Pem Cardium D W / F 271 176004 12 Drumheller D-2 A 292 696001 13 Drumheller D-2 B 292 696002 14 Enchant Arcs J & VV W / F 336 694164 15 Evi Keg River A & Granite Wash N 353 788660 16 Evi Keg River B & Granite Wash P 353 788661 17 Fenn West D-2 A 373 696001 18 Fenn-Big Valley D-2 A Prim 371 696001 19 Ferrier Belly River Q, Cardium G & L W / F 377 126160 20 Gift Slave Point A W / F 322 758001 21 Golden Slave Point A 423 758001 22 Goose River Beaverhill Lake A W / F, S/F 425 744001 23 Grand Forks Upper Mannville K W / F 430 250011 24 Harmattan East Rundle W / F 448 610000 25 Hays Lower Mannville A W / F 456 310001 26 Joarcam Viking W / F 503 218000 27 Joffre D-2 W / F 505 696000 28 Joffre Viking W / F, S/F 505 218000 29 Johnson Glauconitic B W / F 504 300002 30 Judy Creek Beaverhill Lake A W / F, S/F 509 744001 31 Judy Creek Beaverhill Lake B W / F, S/F 509 744002 32 Kaybob Beaverhill Lake A W / F, S/F 513 744001 33 Leduc-Woodbend D-2 A W / F 551 696001 34 Manyberries Sunburst Q W / F 595 332017 35 Medicine River Glauconitic A & Ostracod CC W / F 604 300562 36 Meekwap D-2 A W / F 605 696001 37 Mitsue Gilwood A W / F, S/F 615 778001 38 Morinville D-3 B 620 720002 39 Nipisi Gilwood A W / F, S/F 644 778001 40 Otter Granite Wash A 324 976001 41 Panny Keg River D 734 788004 42 Pembina Basal Belly River B & F W / F 685 126062 43 Pembina Cardium W / F 685 176000
CO2 EOR – Incremental Recovery and CO2 Storage 18

44 Pembina Nisku II 685 696035 45 Pouce Coupe South Boundary B W / F 729 510002 46 Provost Dina S 750 322019 47 Provost Dina Y 750 322025 48 Provost Ellerslie N & OOO 750 336060 49 Rainbow Keg River F S / F 753 788006 50 Rainbow Keg River OO W / F 753 788041 51 Rainbow Muskeg C W / F 753 782003 52 Rainbow Sulphur Point B W / F 753 781002 53 Rainbow South Muskeg H W / F 754 782008 54 Redwater D-3 770 720000 55 Rycroft Halfway C W / F 802 516003 56 Seal Slave Point A 827 758001 57 Simonette Beaverhill Lake A W / F 844 744001 58 Simonette Beaverhill Lake B W / F 844 744002 59 Slave Slave Point H 839 758008 60 Slave Slave Point S 839 758019 61 Snipe Lake Beaverhill Lake W / F 856 744000 62 Sturgeon Lake D-3 874 720000 63 Sturgeon Lake South D-3 876 720000 64 Swan Hills Beaverhill Lake A&B W / F, S/F 887 744060 65 Swan Hills South Beaverhill Lake A&B S / F 889 744060 66 Turin Upper Mannville H W / F 911 250008 67 Valhalla Montney C & LL W / F 920 524063 68 Virginia Hills Beaverhill Lake W / F, S/F 925 744000 69 Wayne-Rosedale Nisku A 935 696001 70 Youngstown Arcs 996 694000
Table 1B - Horizontal Immiscible # Field Pool Type Field Pool # 1 Alderson Lower Mannville B W / F 43 310002 2 Bellshill Lake Ellerslie A 115 336001 3 Bow Island Sawtooth U 160 428021 4 Cecil Charlie Lake JJ 204 508036 5 Chauvin South Mannville Mu #1 W / F 212 248060 6 Chauvin South Sparky H W / F 212 276008 7 Chin Coulee Glauconitic C & BMnv A W / F 217 301360 8 Countess Upper Mannville O W / F 259 250015 9 Enchant Ellis L 336 418012
10 Glenevis Banff 416 644000 11 Grand Forks Lower Mann K & V W / F 430 310060 12 Grand Forks Sawtooth MM W / F 430 428039 13 Grand Forks Sawtooth O 430 428015 14 Grand Forks Sawtooth OO W / F 430 428041 15 Grand Forks Sawtooth T 430 428020 16 Grand Forks Upper Mannville B W / F 430 250002 17 Harmattan-Elkton Rundle C W / F 450 610003 18 Hays Sawtooth B 456 428002
CO2 EOR – Incremental Recovery and CO2 Storage 19

19 Hayter Dina A W / F 457 322001 20 Hayter Dina B 457 322002 21 Hayter Dina I 457 322009 22 Horsefly Lake Mannville W / F 475 248000 23 Jenner Upper Mannville F 500 250006 24 Killam Glauconitic FF 524 300032 25 Provost Basal Quartz C 750 334003 26 Provost Blairmore 750 244000 27 Provost Blairmore B 750 244002 28 Provost Cummings I W / F 750 302009 29 Provost Cummings S 750 302019 30 Provost Dina A 750 322001 31 Provost Dina G4G 750 322233 32 Provost Dina N 750 322014 33 Provost Dina O 750 322015 34 Provost Dina Q 750 322017 35 Provost Dina YY 750 322051 36 Provost Glauconitic A 750 300001 37 Provost Lloydminster DD W / F 750 294030 38 Provost Lloydminster KK 750 294037 39 Provost Lloydminster O W / F 750 294015 40 Provost Lloydminster X & Cummings N W / F 750 294260 41 Provost Mannville L 750 248012 42 Provost Sparky D W / F 750 276004 43 Redwater Basal Mannville H 770 320008 44 Ronalane Sawtooth B 792 428002 45 Stettler D-2 A W / F 866 696001 46 Stettler D-3 A 866 720001 47 Suffield Upper Mannville D W / F 877 250004 48 Suffield Upper Mannville J W / F 877 250010 49 Suffield Upper Mannville U W / F 877 250021 50 Suffield Upper Mannville YYY W / F 877 250725 51 Taber Glauconitic K W / F 893 300011 52 Taber Taber N W / F 893 346014 53 Taber Taber Q & Sawtooth 893 346260 54 Taber North Taber C 894 346003 55 Taber South Mannville A W / F 895 248001 56 Taber South Mannville B W / F 895 248002 57 Valhalla Doe Creek I W / F 920 190009 58 Valhalla Doe Creek T,U & BB W / F 920 190061 59 Vermilion Sparky A W / F 921 276001 60 Viking-Kinsella Sparky E W / F 923 276005 61 Viking-Kinsella Sparky JJ W / F 923 276036 62 Viking-Kinsella Upper Mannville Z3Z W / F 923 251126 63 Virginia Hills Belloy A W / F 925 556001 64 Wainwright Wainwright & Sparky Z W / F 928 278160 65 Wainwright Wainwright B W / F 928 278002
CO2 EOR – Incremental Recovery and CO2 Storage 20

Table 1C - Gas Cap Pools # Field Pool Type Field Pool #
1 Acheson D-3 A W / F 9 720001 2 Beauvallon Colony K 105 256011 3 Belloy Debolt A,B,C,D,E & 113 612060 4 Bigoray Pekisko A 126 642001 5 Blueridge Pekisko A 148 642001 6 Boundary Lake South Triassic G 157 500007 7 Campbell-Namao Blairmore A 185 244001 8 Campbell-Namao Blairmore J 185 244010
9 Carbon Belly River,Viking, Mann & Rundle Mu #1 190 219260
10 Carbon Glauconitic J & S 190 300060 11 Caroline Basal Mannville Mu #3 194 320066 12 Caroline First White Specks & Viking A 194 214260 13 Cessford Basal Colorado A W / F 206 242001 14 Cessford Mannville C W / F 206 248003 15 Cessford Mannville Y & Z 206 248061 16 Cherhill Banff H 213 644008 17 Chickadee Upper Mannville D & Gething D 235 251060 18 Crossfield Rundle B 267 610002 19 Dunvegan Debolt & Elkton Mu #1 300 612060 20 Edson Viking, Mannville & Jurassic Mu #1 320 220360 21 Ferrybank Belly River C,G & H W / F 378 126060 22 Fox Creek Viking,Umnv & Gething Mu #1 395 326260 23 Garrington Cardium, Viking & Manv Mu #1 W / F 405 177460 24 Garrington Mannville & Rundle Mu #1 405 248960 25 Garrington Wabamun A 405 658001 26 Ghost Pine Upper & Lower Mannville Mu #1 408 250361 27 Ghost Pine Upper Mannville Q,Y,Ff & T3T 408 250064 28 Gilby Basal Mannville A & Jurassic D 412 320160 29 Gilby Mannville,Jurassic Rundle Mu #1 412 320360 30 Greencourt Jurassic A & Pekisko A 431 446560 31 Harmattan East Viking E W / F 448 218005 32 Homeglen-Rimbey D-3 470 720000 33 Hussar Glauconitic A 486 300001 34 Innisfail D-3 494 720000 35 Joarcam Viking C 503 218003 36 Judy Creek Viking A 509 218001 37 Kaybob Viking O & Gething 513 222363 38 Kaybob South Triassic A W / F 514 500001 39 Kaybob South UMnv D,Gething O2O Triassic B 514 254860 40 Knopcik Halfway N & Montney A 536 516560 41 Leduc-Woodbend D-3 A W / F 551 720001 42 Lone Pine Creek D-3 A 576 720001 43 Long Coulee Glauconitic F 577 300006 44 Long Coulee Glauconitic I & Sunburst G 577 303160 45 Medicine River Basal Quartz LL 604 334038
CO2 EOR – Incremental Recovery and CO2 Storage 21
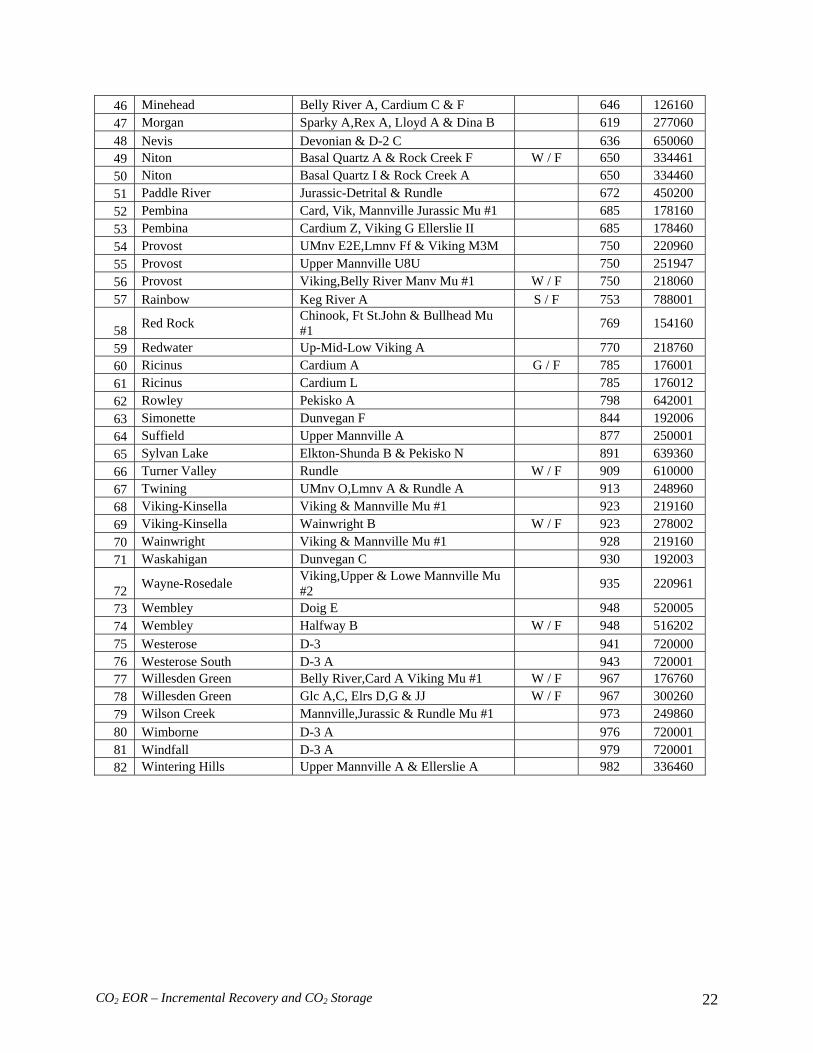
CO2 EOR – Incremental Recovery and CO2 Storage 22
46 Minehead Belly River A, Cardium C & F 646 126160 47 Morgan Sparky A,Rex A, Lloyd A & Dina B 619 277060 48 Nevis Devonian & D-2 C 636 650060 49 Niton Basal Quartz A & Rock Creek F W / F 650 334461 50 Niton Basal Quartz I & Rock Creek A 650 334460 51 Paddle River Jurassic-Detrital & Rundle 672 450200 52 Pembina Card, Vik, Mannville Jurassic Mu #1 685 178160 53 Pembina Cardium Z, Viking G Ellerslie II 685 178460 54 Provost UMnv E2E,Lmnv Ff & Viking M3M 750 220960 55 Provost Upper Mannville U8U 750 251947 56 Provost Viking,Belly River Manv Mu #1 W / F 750 218060 57 Rainbow Keg River A S / F 753 788001
58 Red Rock Chinook, Ft St.John & Bullhead Mu #1 769 154160
59 Redwater Up-Mid-Low Viking A 770 218760 60 Ricinus Cardium A G / F 785 176001 61 Ricinus Cardium L 785 176012 62 Rowley Pekisko A 798 642001 63 Simonette Dunvegan F 844 192006 64 Suffield Upper Mannville A 877 250001 65 Sylvan Lake Elkton-Shunda B & Pekisko N 891 639360 66 Turner Valley Rundle W / F 909 610000 67 Twining UMnv O,Lmnv A & Rundle A 913 248960 68 Viking-Kinsella Viking & Mannville Mu #1 923 219160 69 Viking-Kinsella Wainwright B W / F 923 278002 70 Wainwright Viking & Mannville Mu #1 928 219160 71 Waskahigan Dunvegan C 930 192003
72 Wayne-Rosedale Viking,Upper & Lowe Mannville Mu #2 935 220961
73 Wembley Doig E 948 520005 74 Wembley Halfway B W / F 948 516202 75 Westerose D-3 941 720000 76 Westerose South D-3 A 943 720001 77 Willesden Green Belly River,Card A Viking Mu #1 W / F 967 176760 78 Willesden Green Glc A,C, Elrs D,G & JJ W / F 967 300260 79 Wilson Creek Mannville,Jurassic & Rundle Mu #1 973 249860 80 Wimborne D-3 A 976 720001 81 Windfall D-3 A 979 720001 82 Wintering Hills Upper Mannville A & Ellerslie A 982 336460