
Chemengcomm Conjugate
30
KINETIC P ARA M ETER ESTIMA TIO N BY ST ANDARD O PTIMIZA TIO N METH O DS IN CA T AL YTIC CONVERTER MODELING G. PONTIKAKIS C. P AP ADI MITRI OU A. ST AMA TELO S Univ ersity of Thessal y ,Volos, G reece The application of mathematical models to the prediction of the performance of aut omo tiv e cat aly tic conver ter s is gai nin g inc rea sin g int erest, bot h for gasoline and diesel engined-vehicles. This article addresses converter modeling in the transi ent state under rea lis tic exp eri mental con dit ions. The mod el emp loy ed in thi s stu dy rel ies on Langmu ir- Hin she lwood kin eti cs, and a numbe r of appar ent kinetic parame ters must be tuned to matc h the behavio r of each different catalyst formulation. The previously applied procedure of manua lly tunin g kine tics parameter s requi res signi fican t manpo wer. This article presents a methodology for kinetic parameter estimation that is based on standard optimization methods. The methodology is being applied in the exploitation of synthetic gas experiments and legislated driving cycle tests and the assessment of the quality of information contained in the test results. Although the optimization technique employed for parameter estimation is well known, the deve lopme nt of the spec ific paramete r estimation metho- dolog y that employ s the results of the availab le types of expe rime nts is novel and requir ed sig nificant dev elo pme nt. App lic ati on of thi s refined tuning met hodolo gy inc rea ses the qualit y and rel iab ili ty of pre dic tio n and als o greatly reduces the required manpower, which is important in the specific engineering design process. The parameter estimation procedure is applied to the exa mpl e of model ing of a die sel cat aly tic con ver ter wit h ads orptio n capabilities, based on laboratory experiments and vehicle driving cycle tests. Keywords : Automotive catalytic converters; Reaction kinetics; Mathematical modeling Received 3 January 2002; in final form 26 November 2002. Add res s cor res pon dence to A. Stamat elo s, Universit y of Thessa ly, 383 34 Volos, Greece. E-mail: [email protected] Chem. Eng. Comm., 191: 1 4731501,2004 Copyright #T aylo r & Fra nc is Inc. I SSN: 0098- 644 5 prin t/1 563- 5201onl ine DOI: 10.1080/00 9864 404 90472634
-
Upload
mauricio-sales-cruz -
Category
Documents
-
view
236 -
download
0
Transcript of Chemengcomm Conjugate
7/25/2019 Chemengcomm Conjugate
http://slidepdf.com/reader/full/chemengcomm-conjugate 1/29
KINETICPARAMETERESTIMATIONBYSTANDARD
OPTIMIZATIONMETHODS INCATALYTIC
CONVERTERMODELING
G. PONTIKAKIS
C. PAPADIMITRIOU
A. STAMATELOS
University of Thessaly,Volos, Greece
The application of mathematical models to the prediction of the performance
of automotive catalytic converters is gaining increasing interest, both for
gasoline and diesel engined-vehicles. This article addresses converter modelingin the transient state under realistic experimental conditions. The model
employed in this study relies on Langmuir-Hinshelwood kinetics, and a
number of apparent kinetic parameters must be tuned to match the behavior
of each different catalyst formulation. The previously applied procedure of
manually tuning kinetics parameters requires significant manpower. This
article presents a methodology for kinetic parameter estimation that is based
on standard optimization methods. The methodology is being applied in the
exploitation of synthetic gas experiments and legislated driving cycle tests and
the assessment of the quality of information contained in the test results.
Although the optimization technique employed for parameter estimation iswell known, the development of the specific parameter estimation metho-
dology that employs the results of the available types of experiments is novel
and required significant development. Application of this refined tuning
methodology increases the quality and reliability of prediction and also
greatly reduces the required manpower, which is important in the specific
engineering design process. The parameter estimation procedure is applied to
the example of modeling of a diesel catalytic converter with adsorption
capabilities, based on laboratory experiments and vehicle driving cycle tests.
Keywords: Automotive catalytic converters; Reaction kinetics; Mathematicalmodeling
Received 3 January 2002; in final form 26 November 2002.
Address correspondence to A. Stamatelos, University of Thessaly, 383 34 Volos,
Greece. E-mail: [email protected]
Chem. Eng. Comm., 191: 14731501, 2004
Copyright#Taylor & Francis Inc.
ISSN: 0098-6445 print/1563-5201online
DOI: 10.1080/009864 40490472634
1473
7/25/2019 Chemengcomm Conjugate
http://slidepdf.com/reader/full/chemengcomm-conjugate 2/29
INTRODUCTION
Research on chemical kinetics of complex heterogeneous catalytic
reactions of industrial importance often requires the estimation of rate(or even equilibrium) coefficients by nonlinear regression (Froment,
1987). A variety of methods are applied to solve practical problems in
parameter optimization, starting from traditional calculus methods
and ranging to the so-called ‘‘evolutionary algorithms’’ (Park and
Froment, 1998). These methodologies have been applied during the
past two decades to the modeling of steady-state industrial processes
(Watson et al., 1996; Moros et al., 1996; Felis et al., 1999; Wolf and
Moros, 1997). However, modeling of catalytic reactors with transient
prevailing behavior has been only recently supported by such meth-odologies. On the other hand, the increasingly stringent emission
standards introduced by legislation forces automotive and catalyst
manufacturers to develop and apply a large number of catalytic
exhaust after-treatment systems. The catalytic converter has been the
crucial component in the majority of such systems (Koltsakis and
Stamatelos, 1997). The design of catalytic converter systems is
increasingly supported today by mathematical modeling. In a catalytic
converter, there is strong interaction between physical processes (spe-
cies mass transfer to and from the washcoat and heat transfer betweenthe exhaust gas and the monolith) and chemical processes (hetero-
geneous catalytic reactions taking place on the noble metals of the
washcoat and, under certain conditions, adsorption, storage, and
desorption of chemical species in the washcoat).
Heat and mass transport in catalytic converters (reactor submodel)
have been modeled with variable detail and scope, ranging from the
assumption of adiabatic monoliths in uniform inlet flow distribution,
e.g., Young and Finlayson (1976) and Heck and Wei (1976), as well as
simplified control-oriented models (Glielmo et al., 2000), to morecomplex models that take into account heat exchange with the
monolith’s canning and the surrounding air and nonuniform dis-
tribution at the converter’s inlet (Flytzani-Stefanopoulos et al., 1986;
Chen et al., 1988). However, the cornerstone of each catalytic con-
verter model is the chemical kinetics submodel. The exact reaction
scheme depends on the kind of catalytic converter under study but for
every reaction taken into account by the model, a reaction rate must be
provided. The reaction rates are different for each washcoat for-
mulation and cannot be determined a priori. This is due to severalreasons (Schmidt, 1998):
First, all reactions occurring in a catalytic converter proceed hetero-
geneously on the noble metal surface. The exact reaction path involves
multiple reactions and intermediate steps, thus it is not known. Besides,
1474 G. PONTIKAKIS ET AL.
7/25/2019 Chemengcomm Conjugate
http://slidepdf.com/reader/full/chemengcomm-conjugate 3/29
the reaction path depends on the possible presence of species in the real
exhaust gas that are not present in an experimental setup.
Second, the reactions kinetics are very sensitive to the washcoatformulation. Noble metal loading and its dispersion in the washcoat,
washcoat porosity, etc., may affect the reaction rates. Impurities that
may be present may promote one rate over the others.
Last but not least, catalytic processes suffer from aging and deactivation,
and these depend on the conditions under which the catalyst is aged.
Two catalytic converters with identical washcoat formulations behave
quite differently after aging under different operating conditions.
To summarize, reaction kinetics in a catalytic converter are sensitive tothe input gas formulation, the washcoat formulation, and its history. To
circumvent the above difficulties, especially in the study of real-world
catalyst performance on-vehicle, a class of simplified models, using
Langmuir-Hinshelwood (LH) kinetics, is increasingly applied as engi-
neering tools. This category of models uses empirical reaction rate
expressions, which involve tunable parameters (Siemund et al., 1996;
Koltsakis and Stamatelos, 1998). All phenomena that are not explicitly
accounted for by the model are lumped into the values of these tunable
parameters.The kinetics expressions following the Langmuir-Hinshelwood
formalism are of the type:
rrea ¼ AeE =R gT xAxB
G1
; where G ¼ GðT ; xA; xB; . . . ;xN ; K 1; K 2; . . . ;K nÞ
The Langmuir-Hinshelwood expressions predict an exponential
(Arrhenius-type) dependence on temperature, while G is an inhibitionterm, a function of temperature and concentrations x of various species
that may inhibit the reaction. In the above expression, factors A and E
(the pre-exponential factor or frequency factor and the activation energy)
as well as factors K included in term G are considered tunable para-
meters. The effect of different washcoat formulations and the interaction
between different species are lumped into these parameters. Conse-
quently, the resulting reaction rates can be considered as fitting laws.
Traditionally, the lumped parameters were manually tuned to
compromise between the accurate fitting of the results of several experi-ments and tests. In this paper, a model already tested in diesel catalytic
converter design optimization (Pontikakis et al., 2000) was linked to a
computer-aided procedure for tuning kinetic parameters, based on
experimental data from both the laboratory and vehicle driving cycle
tests.
KINETIC PARAMETER ESTIMATION 1475
7/25/2019 Chemengcomm Conjugate
http://slidepdf.com/reader/full/chemengcomm-conjugate 4/29
SYSTEMDESCRIPTION
Balance Equations and Chemical Processes
A diesel oxidation catalyst modeling case is employed in this study,
because diesel catalyst modeling is simpler and does not require the
complex NOx reduction kinetics around stoichiometry that a three-way
catalyst does. A short description of the modeling approach follows.
Mass Balances. The mass balance calculations in the catalytic converter
are employed for one monolith channel. The mass transfer of reactants
and products to and from the catalytic surface correspondingly is
computed with the aid of a ‘‘film model’’ approach. According to thisapproximation, the species from each channel’s bulk gas flow diffuse
down to a hypothetical catalyst’s solid-gas interface, through the gas flow
boundary layer and the adsorbing washcoat. At the chemically active
solid-gas interface species may react or adsorb and desorb to and from
the washcoat. Reaction products and desorbing species diffuse back to
the bulk gas flow.
A mean bulk value x j is employed for the gas phase concentration of
each species. Likewise, a value xs; j is considered for the concentration of
each species at the active interface. Thus, the mass balance for the gasphase is the following:
r guz
@ x j
@ z ¼ r gkm; j S ðx j xs; j Þ ð1Þ
A mass transfer coefficient km; j is employed for the species diffusion
through the flow boundary layer and the washcoat. The mass transfer
coefficients are given as functions of the Nusselt and Sherwood dimen-
sionless numbers for the monolith’s channels.A separate mass balance must be applied for gas-phase components
in the washcoat:
r g
M gkm; j S ðx j x j ; sÞ ¼ Rrea; j þ Rsrp; j ð2Þ
The rates Rrea; j and Rsrp; j refer to the production or consumption
of species at the solid-gas interface due to reaction and adsorption-
desorption respectively. For N R reactions, each taking place with a raterk, the rate of consumption or production of a species j is
Rrea; j ¼XN R
k¼1
a j ;krk ð3Þ
1476 G. PONTIKAKIS ET AL.
7/25/2019 Chemengcomm Conjugate
http://slidepdf.com/reader/full/chemengcomm-conjugate 5/29
where a j ;k is the stoichiometric coefficient of species j in reaction k.
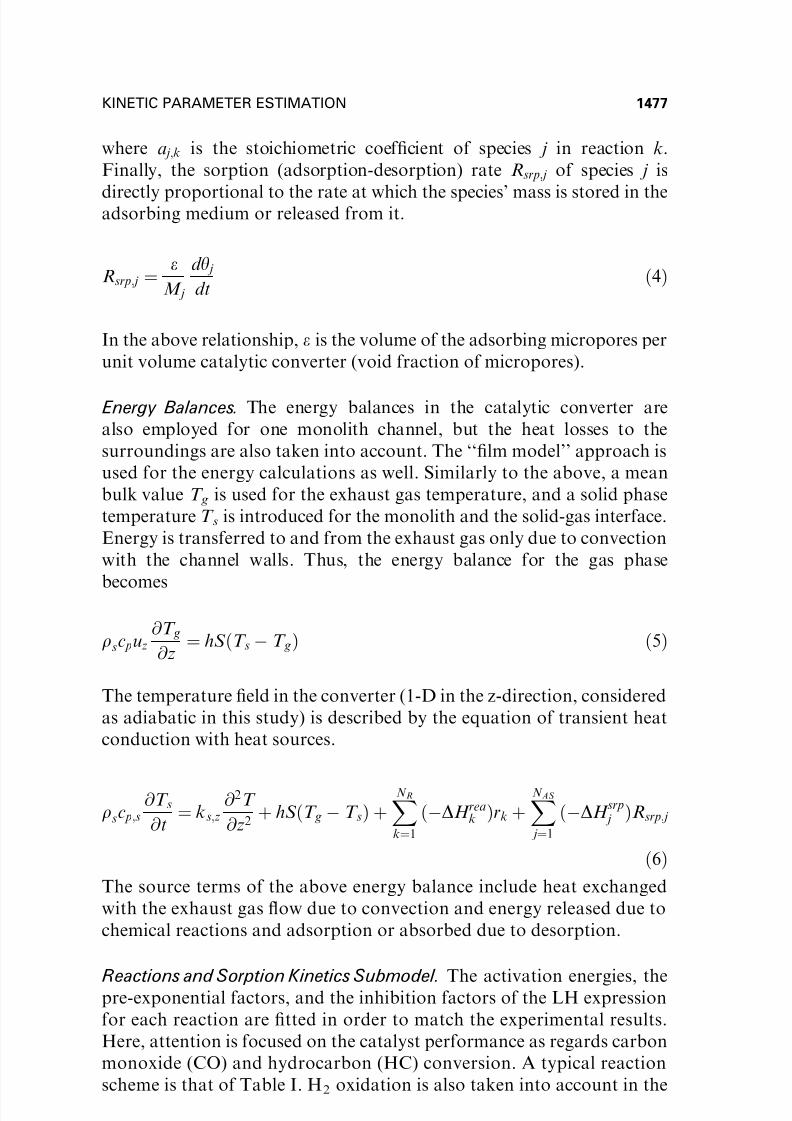
Finally, the sorption (adsorption-desorption) rate Rsrp; j of species j is
directly proportional to the rate at which the species’ mass is stored in theadsorbing medium or released from it.
Rsrp; j ¼ e
M j
d y j
dt ð4Þ
In the above relationship, e is the volume of the adsorbing micropores per
unit volume catalytic converter (void fraction of micropores).
Energy Balances. The energy balances in the catalytic converter are
also employed for one monolith channel, but the heat losses to the
surroundings are also taken into account. The ‘‘film model’’ approach is
used for the energy calculations as well. Similarly to the above, a mean
bulk value T g is used for the exhaust gas temperature, and a solid phase
temperature T s is introduced for the monolith and the solid-gas interface.
Energy is transferred to and from the exhaust gas only due to convection
with the channel walls. Thus, the energy balance for the gas phase
becomes
rsc puz
@ T g
@ z ¼ hS ðT s T gÞ ð5Þ
The temperature field in the converter (1-D in the z-direction, considered
as adiabatic in this study) is described by the equation of transient heat
conduction with heat sources.
rsc p;s@ T s
@ t ¼ ks;z
@ 2T
@ z2 þ hS ðT g T sÞ þ
XN R
k¼1
ðDH reak Þrk þ
XN AS
j ¼1
ðDH srp
j ÞRsrp; j
ð6Þ
The source terms of the above energy balance include heat exchanged
with the exhaust gas flow due to convection and energy released due to
chemical reactions and adsorption or absorbed due to desorption.
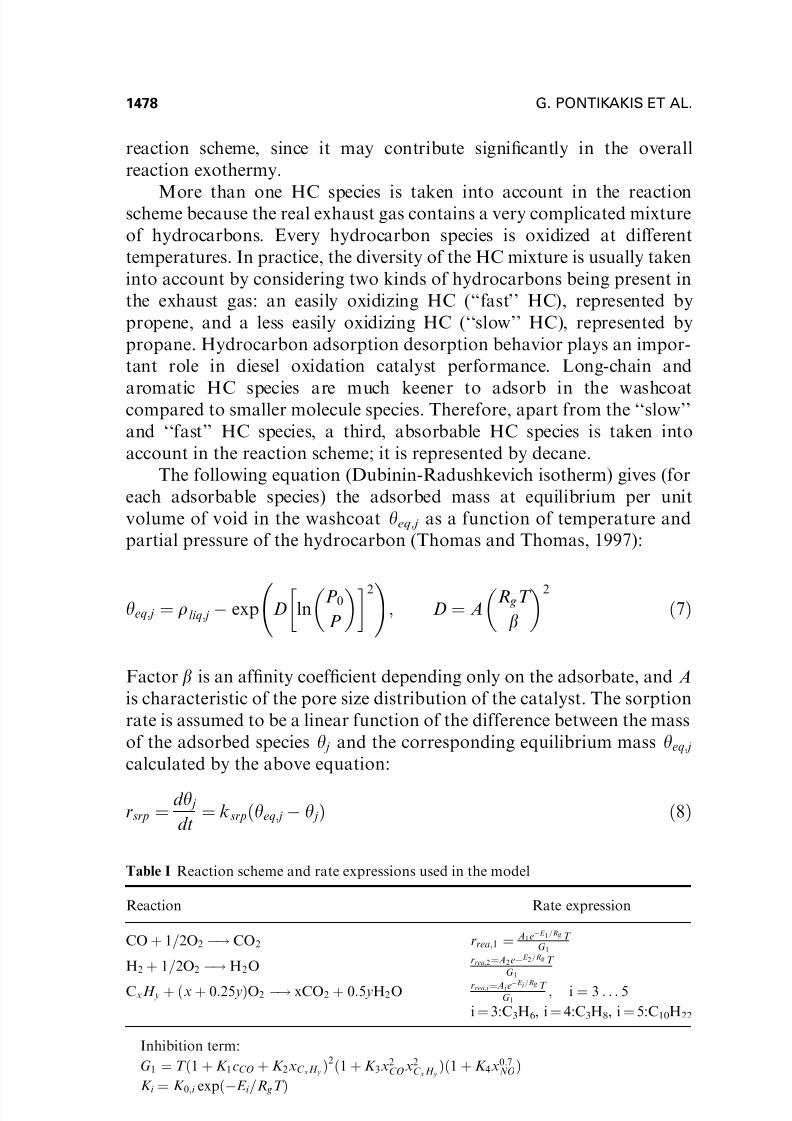
Reactions and Sorption Kinetics Submodel. The activation energies, thepre-exponential factors, and the inhibition factors of the LH expression
for each reaction are fitted in order to match the experimental results.
Here, attention is focused on the catalyst performance as regards carbon
monoxide (CO) and hydrocarbon (HC) conversion. A typical reaction
scheme is that of Table I. H2 oxidation is also taken into account in the
KINETIC PARAMETER ESTIMATION 1477
7/25/2019 Chemengcomm Conjugate
http://slidepdf.com/reader/full/chemengcomm-conjugate 6/29
reaction scheme, since it may contribute significantly in the overall
reaction exothermy.
More than one HC species is taken into account in the reactionscheme because the real exhaust gas contains a very complicated mixture
of hydrocarbons. Every hydrocarbon species is oxidized at different
temperatures. In practice, the diversity of the HC mixture is usually taken
into account by considering two kinds of hydrocarbons being present in
the exhaust gas: an easily oxidizing HC (‘‘fast’’ HC), represented by
propene, and a less easily oxidizing HC (‘‘slow’’ HC), represented by
propane. Hydrocarbon adsorption desorption behavior plays an impor-
tant role in diesel oxidation catalyst performance. Long-chain and
aromatic HC species are much keener to adsorb in the washcoatcompared to smaller molecule species. Therefore, apart from the ‘‘slow’’
and ‘‘fast’’ HC species, a third, absorbable HC species is taken into
account in the reaction scheme; it is represented by decane.
The following equation (Dubinin-Radushkevich isotherm) gives (for
each adsorbable species) the adsorbed mass at equilibrium per unit
volume of void in the washcoat yeq,j as a function of temperature and
partial pressure of the hydrocarbon (Thomas and Thomas, 1997):
yeq; j ¼ rliq; j exp D ln P0
P
2 !; D ¼ A
R gT
b
2
ð7Þ
Factor b is an affinity coefficient depending only on the adsorbate, and A
is characteristic of the pore size distribution of the catalyst. The sorption
rate is assumed to be a linear function of the difference between the mass
of the adsorbed species y j and the corresponding equilibrium mass yeq; j
calculated by the above equation:
rsrp ¼ d y j
dt ¼ ksrpðyeq; j y j Þ ð8Þ
Table I Reaction scheme and rate expressions used in the model
Reaction Rate expression
CO þ 1=2O2 ! CO2 rrea;1 ¼ A1 eE 1=R g T G1
H2 þ 1=2O2 ! H2O rrea;2 ¼A2 eE 2=R g T
G1
CxH y þ ðx þ 0:25 yÞO2 ! xCO2 þ 0:5 yH2O rrea;i ¼Ai eE i =R g T G1
; i ¼ 3 . . . 5
i ¼ 3:C3H6, i ¼ 4:C3H8, i ¼ 5:C10H22
Inhibition term:
G1 ¼ T ð1 þ K 1cCO þ K 2xC x H y Þ2ð1 þ K 3x2COx2
C x H yÞð1 þ K 4x0:7
NOÞ
K i ¼ K 0;i expðE i =R gT Þ
1478 G. PONTIKAKIS ET AL.

7/25/2019 Chemengcomm Conjugate
http://slidepdf.com/reader/full/chemengcomm-conjugate 7/29
Here, ksrp is a sorption rate, which is constant in the case of adsorption
since adsorption is a non-activated process (Kaerger and Ruthven, 1992):
ksrp ¼ kads ¼ const; y j < yeq; j ð9Þ
Desorption is an activated process (Kaerger and Ruthven, 1992), thus the
sorption rate exhibits exponential temperature dependence in this case:
ksrp: j ¼ kdes; j ¼ k0des; j exp
E D; j
R gT
; y j > yeq; j ð10Þ
More details about the introduction of the additional absorbing hydro-
carbon and the role of the adsorption submodel, along with additional
information about modeling details and justification, can be found in
Pontikakis et al. (2000).
Numerical Solution Procedure and Simulation Duration Data. The balance
equations are discretized along the axial direction, and for each node, the
Newton-Raphson method is employed to solve the nonlinear system of
equations that results from the application of Equation (2) for all reactingspecies. To achieve this, the rates of species production or consumption
due to reaction (Rrea) and adsorption-desorption (Rsrp) are needed.
Although the calculation of the rates of reactions is straightforward from
Equation (3), the calculation of the adsorption/desorption rate from
Equation (4) is more complicated. It implies a series of equilibrium steps
that are taken to calculate the mass of adsorbed species from Equation
(8). The solution gives the vector of species concentrations (xs) at the
gas-solid interface of the catalyst. This is used to solve numerically the
coupled mass and energy balances using a finite-difference scheme and thus toget the axial distribution of concentrations an temperatures. A typical
run of the full new European driving cycle (NEDC) using a Pentium III
1000 MHz PC takes less than five minutes, that is, CATRAN software
runs the simulation of the catalytic converter faster than real time.
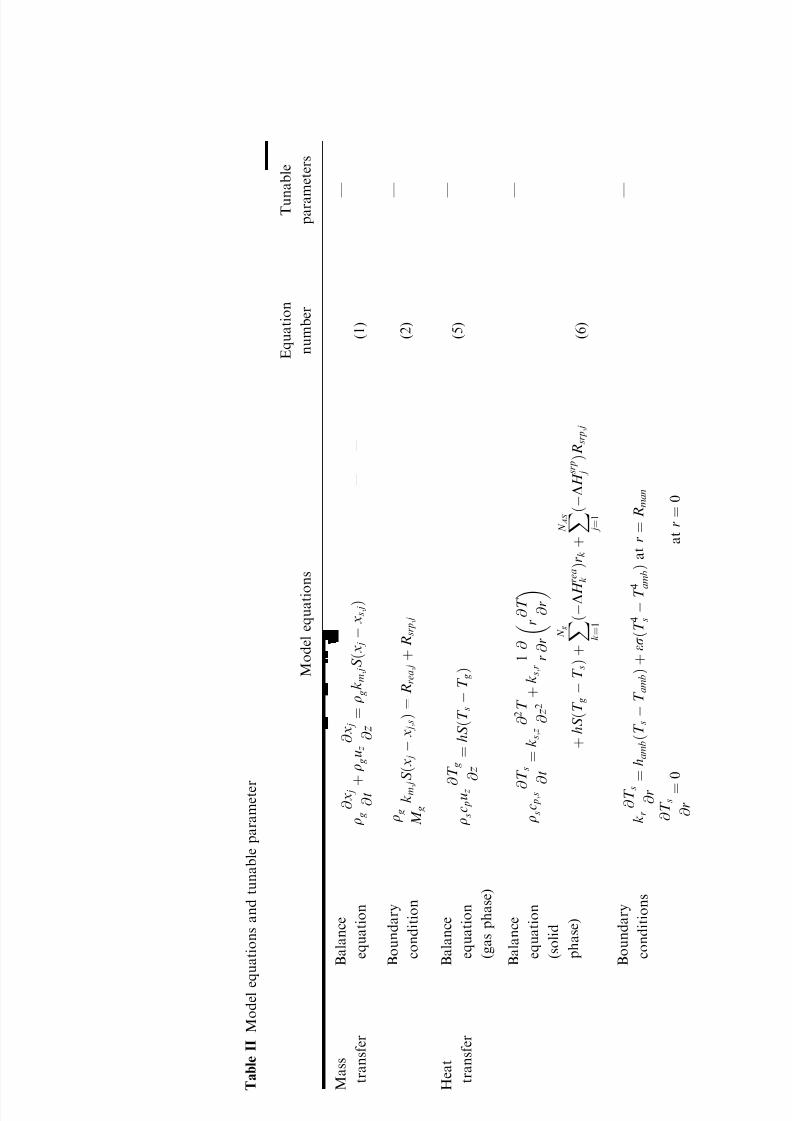
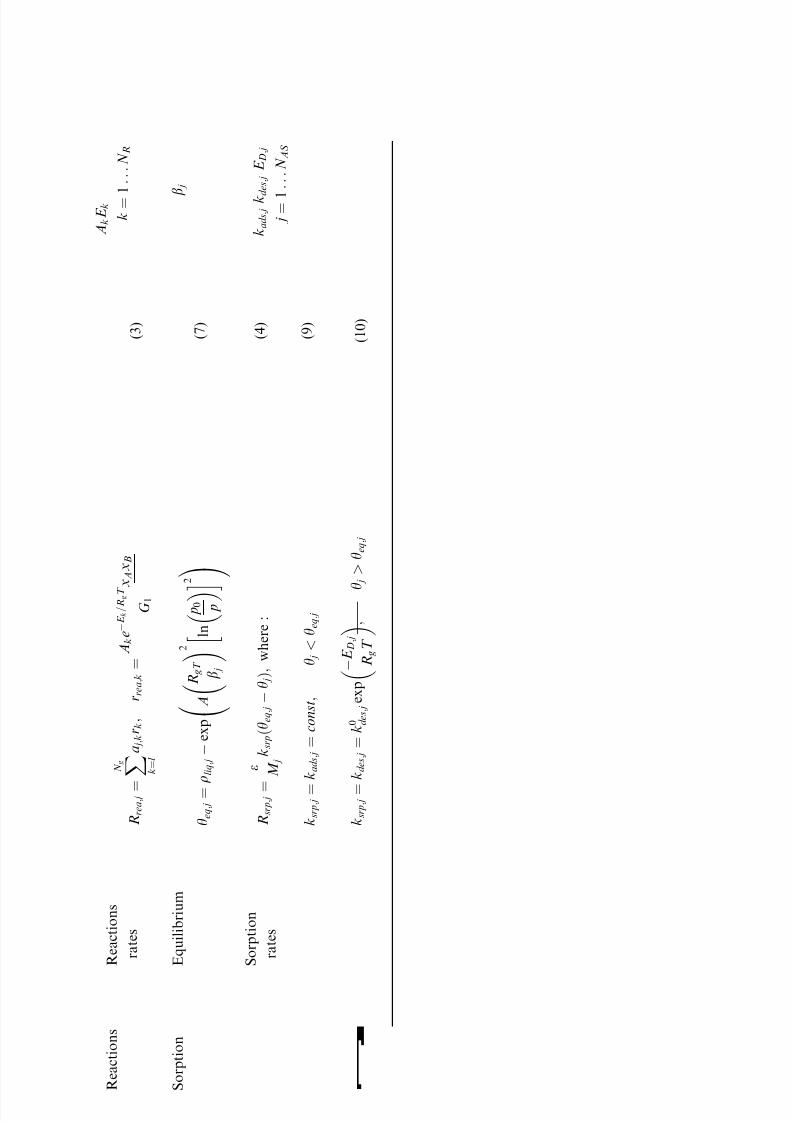
Tunable Parameters
The use of apparent kinetics for the reaction and the sorption submodels
introduces a number of model parameters that must be estimated basedon the results of suitable experiments. The tunable parameters are the
pre-exponential factors and the activation energies for the oxidation of
CO and each of the HC species. For the tunable parameters contained in
the inhibition term (G1), the values specified in Koltsakis and Stamatelos
(1998) that are adapted from the work of Voltz et al. (1973) are
KINETIC PARAMETER ESTIMATION 1479
7/25/2019 Chemengcomm Conjugate
http://slidepdf.com/reader/full/chemengcomm-conjugate 8/29
T a b l e I I
M o d e l e q u a t i o n s a n d t u n a b l e p a r a m e t e r
M o d e l e q u a t i o
n s
E q u a t i o n
n u m b e r
T u n
a b l e
p a r a m
e t e r s
M a s s
t r a n s f e r
B a l a n c e
e q u a t i o n
r g
@ x j @ t þ
r g u z
@ x j
@ z
¼
r g k m ; j
S ð x j
x s ; j
Þ
( 1 )
—
B o u n d a r y
c o n d i t i o n
r g M g
k m ; j
S ð x j
x j ; s
Þ ¼
R r e a ; j þ
R s r p ; j
( 2 )
—
H e a t
t r a n s f e r
B a l a n c e
e q u a t i o n
( g a s p h a s e )
r s c p u z
@ T g @ z
¼
h S ð T s
T g
Þ
( 5 )
—
B a l a n c e
e q u a t i o n
( s o l i d
p h a s e )
r s c p ; s @
T s @ t ¼
k s ; z
@ 2 T
@ z 2
þ
k s ; r
1 r @ @
r r @
T @ r
þ
h S ð T g
T s Þ þ
X N g
k ¼ 1
ð D H
r e a k Þ r k þ
X N A S
j ¼ 1
ð D H s r p j
Þ R s r p ; j
( 6 )
—
B o u n d a r y
c o n d i t i o n s
k r @ T s @ r ¼
h a m b ð T s
T a m b Þ þ
e s ð T 4 s T 4
a
m b Þ a t r ¼
R m a n
@ T s @ r
¼
0
a t r ¼
0
—
1480
7/25/2019 Chemengcomm Conjugate
http://slidepdf.com/reader/full/chemengcomm-conjugate 9/29
R e a c t i o n s
R e a c t i o n s
r a t e s
R r e a ; j ¼
X N g
k ¼ l
a j ; k r k ;
r r e a ; k ¼
A k e E k = R g T x A x B
G 1
( 3 )
A k E k k ¼
1 .
.
.
N R
S o r p t i o n
E q u i l i b r i u m
y e q ; j ¼
r l i q ; j
e x p
A
R g T b j
! 2
l n p 0 p
2
0 @
1 A
( 7 )
b j
S o r p t i o n
r a t e s
R s r p ; j ¼
e M j
k s r p
ð y e q ; j
y j Þ ; w h e r e :
( 4 )
k a d s ; j k d e s ; j
E D ; j
j ¼ 1
.
.
.
N A S
k s r p ; j ¼
k a d s ; j ¼
c o n s t ;
y j <
y e q : j
( 9 )
k s r p ; j ¼
k d e s ; j ¼
k 0 d e s ; j e x p
E D ; j
R g T
;
y
j >
y e q ; j
( 1 0 )
1481
7/25/2019 Chemengcomm Conjugate
http://slidepdf.com/reader/full/chemengcomm-conjugate 10/29
employed. No adjustment of G1 terms is attempted at this stage. Also,
based on usual practice, the pre-exponential factor and activation energy
for H2 oxidation are assumed to be equal to the ones for CO oxidationand are not separately tuned.
The adsorption-desorption submodel also introduces tunable para-
meters for each adsorbable species, namely the affinity coefficient b, the
adsorption rate kads, and the desorption pre-exponential factor kdes and
activation energy E D. The pore size distribution factor A in Equation (7)
and the void fraction of the micropores e in Equation (4) are character-
istics of the catalyst. In our case, their values are A ¼ 1079 [mol/J] and
e ¼ 71073 [m3/m3].
The equations of the model and the tunable parameters each equa-tion introduces are summarized in Table II.
TUNINGPROCEDURE
CurrentTuning Practice
Although the use of tunable parameter catalytic converter models is more
than 20 years old, not much work has been carried out in the direction of
computer-aided tuning. In most cases, kinetic tuning is done in anexpirical manner. For the inhibition terms of the reaction rates, the
kinetics provided in the historical work of Voltz et al. are popular even
today in this class of models. The order of magnitude of the apparent
activation energies is approximately known for most reactions and could
be used as a starting point. Then, one would manually try to adjust the
pre-exponential factor and, to a much lesser extent, the activation energy,
in order to adequately fit the computed curves to the experimental ones.
Montreuil et al. (1992) were the first to present a systematic attempt
for the tuning of the parameters of their steady-state three-way catalyticconverter model. They compiled an experimental database of steady-state
efficiencies for two catalyst formulations and fitted the parameters of
their model according to the database. This was done by defining a merit
function of the tunable parameters as the square differences between
experimental and computed values and minimizing it with the aid of the
conjugate gradients method. The chemical reactions submodel contained
95 parameters. By grouping the tunable parameters according to each
kinetic subsystem, they progressively tuned all model parameters in a
semi-empirical way.Dubien and Schweich (1997) also published a methodology to
determine the frequency factor and the activation energy of simple rate
expressions from light-off experiments. They used theoretical calculations
to provide an initial approximation of the tunable parameters and then
optimized the parameters similar to the method of Montreuil et al., i.e.,
1482 G. PONTIKAKIS ET AL.
7/25/2019 Chemengcomm Conjugate
http://slidepdf.com/reader/full/chemengcomm-conjugate 11/29
defining a merit function and using the downhill simplex method to
minimize it. Their approach was successful but of limited practical value
because it was applicable only to noncompeting reactions. It was there-fore restricted to the study of simple mixtures of reactants and could not
be used to fit parameters of a realistic reaction scheme.
In this work, the diesel catalytic converter model is tuned based on
the results of routine experiments. The merit function approach is also
used here and, in order to minimize it, the method of conjugate gradients
is employed.
Tuning Experiments
In order to evaluate the tunable parameters of the model of the diesel
oxidation catalyst, we employed the published performance of a catalyst
by means of the results of
synthetic gas bench (SGB) experiments with mini-catalysts and
vehicle driving cycle experiments with full-scale catalysts in real engine
exhaust (Pontikakis et al., 2000).
The SGB tests presented in the aforementioned work lie in twocategories: sorption and light-off tests. They are used in this work to tune
the adsorption-desorption and reaction submodels respectively. In par-
allel, an independent assessment of the tunable parameter values was
accomplished using the data from driving cycle tests.
Sorption tests aimed at isolating the hydrocarbons’ adsorption-
desorption process. Therefore the gas used in the sorption tests contained
only hydrocarbon (decane). The inlet mixture was balanced by nitrogen.
The catalyst was initially clean (i.e., it did not contain any adsorbed
hydrocarbons); gas was supplied at constant temperature and flow rateand hydrocarbon adsorption occurred. When the process reached equi-
librium (i.e., inlet and outlet hydrocarbon concentrations were equili-
brated), hydrocarbon supply was zeroed; temperature was ramped at a
constant rate of 1 K/s and the adsorbed hydrocarbon gradually desorbed
(Pontikakis et al., 2000). Light-off tests were conducted under constant
gas hourly space velocity (GHSV) and composition. O2, CO2, CO, NO,
SO2, and H2O were included in the gas mixture in order to resemble real
exhaust gas conditions. The catalysts of the experiments were initially
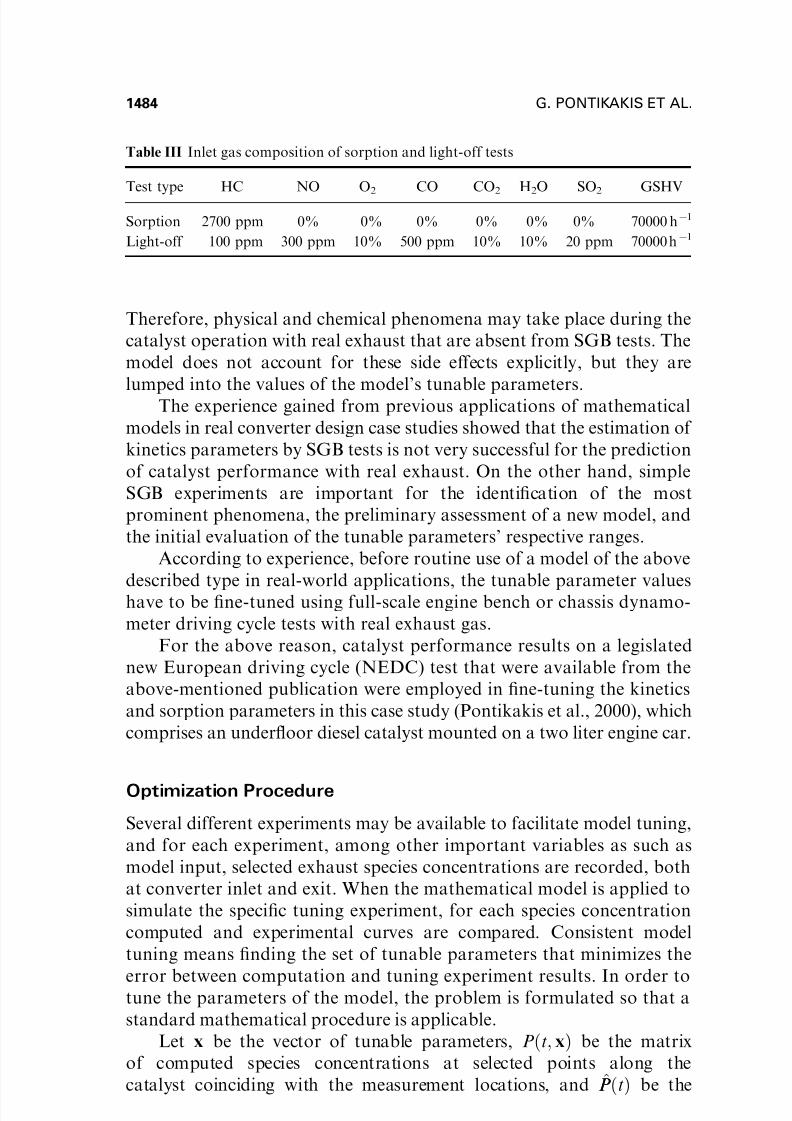
clean. Temperature was ramped at 1 K/s as soon as the experiment began.The inlet gas composition of the sorption and light-off tests is given
in Table III.
SGB tests can be considered as only a simplification of the full-scale
tests with real exhaust gas, which is a very complex mixture containing a
lot of hydrocarbons and also oxygenates in the case of diesel exhaust.
KINETIC PARAMETER ESTIMATION 1483
7/25/2019 Chemengcomm Conjugate
http://slidepdf.com/reader/full/chemengcomm-conjugate 12/29
Therefore, physical and chemical phenomena may take place during the
catalyst operation with real exhaust that are absent from SGB tests. The
model does not account for these side effects explicitly, but they are
lumped into the values of the model’s tunable parameters.The experience gained from previous applications of mathematical
models in real converter design case studies showed that the estimation of
kinetics parameters by SGB tests is not very successful for the prediction
of catalyst performance with real exhaust. On the other hand, simple
SGB experiments are important for the identification of the most
prominent phenomena, the preliminary assessment of a new model, and
the initial evaluation of the tunable parameters’ respective ranges.
According to experience, before routine use of a model of the above
described type in real-world applications, the tunable parameter valueshave to be fine-tuned using full-scale engine bench or chassis dynamo-
meter driving cycle tests with real exhaust gas.
For the above reason, catalyst performance results on a legislated
new European driving cycle (NEDC) test that were available from the
above-mentioned publication were employed in fine-tuning the kinetics
and sorption parameters in this case study (Pontikakis et al., 2000), which
comprises an underfloor diesel catalyst mounted on a two liter engine car.
Optimization Procedure
Several different experiments may be available to facilitate model tuning,
and for each experiment, among other important variables as such as
model input, selected exhaust species concentrations are recorded, both
at converter inlet and exit. When the mathematical model is applied to
simulate the specific tuning experiment, for each species concentration
computed and experimental curves are compared. Consistent model
tuning means finding the set of tunable parameters that minimizes the
error between computation and tuning experiment results. In order totune the parameters of the model, the problem is formulated so that a
standard mathematical procedure is applicable.
Let x be the vector of tunable parameters, Pðt; xÞ be the matrix
of computed species concentrations at selected points along the
catalyst coinciding with the measurement locations, and P̂PðtÞ be the
Table III Inlet gas composition of sorption and light-off tests
Test type HC NO O2 CO CO2 H2O SO2 GSHV
Sorption 2700 ppm 0% 0% 0% 0% 0% 0% 70000 h71
Light-off 100 ppm 300 ppm 10% 500 ppm 10% 10% 20 ppm 70000 h71
1484 G. PONTIKAKIS ET AL.
7/25/2019 Chemengcomm Conjugate
http://slidepdf.com/reader/full/chemengcomm-conjugate 13/29
corresponding matrix of measured concentrations. The error between the
experimental and computed variables is, for each element in the matrix,
ei :rðt; xÞ ¼ P̂Pi ;rðtÞ Pi ;rðt; xÞ ð11Þ
where Pi ;r is the i th measured concentration of species i from the rth
experiment.
The performance measure is taken to be a weighted average of the
individual errors, over time, over all variables and over all experiments,
where the variables Pi , r are considered at times t ¼ kDt, with Dt being
the discretization interval. The resulting performance measure is
sðxÞ ¼
PN exp
r¼1
PN err
r¼1
PT r
r¼1
wi ;rðPi ; j ;r P̂Pi ; j ;rÞ2
PN exp
r¼1
PN err
r¼1
PT r
r¼1
wi ;r P̂P2
i ; j ;r
ð12Þ
which is essentially an overall measure of the relative error between
experimental ð P̂Pt; t ¼ 1 . . . T Þ and computed (Pt, t ¼ 1 . . .T ) data over allexperiments. The weights wi ,r scale the contribution of each error quan-
tity ei,r in the performance measure.
In this work, the penalty method (Pierre, 1965) is employed to
properly account for constraints. These constraints limit the acceptable
values of the tunable parameters within specified bounds. Thus, model
tuning reduces to solving the following problem:
minimize f ðxÞ
where f ðxÞ ¼ sðxÞ c(x) > 0
sðxÞ þ W P
ðcðxÞÞ2c(x) < 0
ð13Þ
and cðxÞ ¼ ½c1ðxÞ; c2ðxÞ; . . . ; cnðxÞT ð14Þ
where f (x) is the new merit function, x ¼ ½x1;x2; . . . ;xnT is the vector of
tunable parameters, and c(x) is the constraints vector.
The penalty term W
PðcðxÞÞ2
increases the value of the merit
function beyond the performance measure in case one or more con-straints are violated. W is a constant that has a very big value compared
to the merit function value. Here, the value of W was set as W ¼ 106.
The constraints are introduced because the tunable parameters
represent physical properties and, thus, may not have values that con-
tradict their physical meaning.
KINETIC PARAMETER ESTIMATION 1485
7/25/2019 Chemengcomm Conjugate
http://slidepdf.com/reader/full/chemengcomm-conjugate 14/29
In this work, the merit function f ðxÞ is minimized by use of the
conjugate gradients method. The conjugate gradients minimization
algorithm performs successive line minimizations along the directions hi ,which are set to be
hi þ1 ¼ gi þ1 þ ghi ;
where gi ¼ H f ðxÞ;
gi ¼ gi þ1 gi þ1
gi gi
and h0 ¼ g0
It has been proved (Press et al., 1988) that the vectors hi (along which
we perform the minimizations) satisfy the conjugancy condition:
hi H h j ¼ 0; j < i
where H is the Hessian matrix of the function f at point P:
½H ij ¼ @ 2 f
@ xi @ x j
p
Minimizing along a direction hi þ 1, which is conjugate to the previous
direction hi , means that the gradient along the direction hi þ 1 is perpen-
dicular to the direction hi . Thus, minimization along hi þ 1 will not spoil
the previous minimization along hi . If the merit function f is an exactquadratic form, n line minimizations (where n is number of components
of vector x) along the conjugate directions hi will lead to the minimum.
Practically, our merit function is not an exact quadratic form, therefore
the repetition of the n line minimizations is needed in order to converge to
the minimum.
In this work, a FORTRAN-77 implementation of the conjugate
gradients algorithm that is given by Press et al. (1988) was employed. The
derivatives of the merit function were computed numerically by dis-
cretizing on the tunable parameters space, since analytical expressions of the derivatives are not readily obtainable. The details of the numerical
derivatives estimation are also given in the book by Press et al. (1988). In
the case that the pre-exponential factor A and the oxidation energy E of
an oxidation reaction were tuned simultaneously, convergence problems
occurred in the search for the optimum point. This was due partly to the
1486 G. PONTIKAKIS ET AL.
7/25/2019 Chemengcomm Conjugate
http://slidepdf.com/reader/full/chemengcomm-conjugate 15/29
several orders-of-magnitude difference between the values of A and E ,
roughly varying in the range 1010<A < 1025 and 50000< E < 150000 and
partly to the several orders-of-magnitude difference between the values of the sensitivity of the merit function with respect to A and E . This
insensitivity of the merit function along certain directions in the para-
meter space, along with the errors involved in the numerical estimation of
the derivatives of the merit function with respect to these parameters,
contributed to the poor convergence of the optimization algorithm. This
problem was overcome using the following reparameterization:
A ¼ 10~AA ) eAA ¼ log A
E ¼ 104 eE E ) eE E ¼ 104E
where eAA and eE E are the new parameters. The values of eAA and eE E vary within
ranges of the same order of magnitude, 10 < eAA < 25 and 5 < eE E < 15, and
the sensitivities are of the same order of magnitude. With the above
formulation of the tunable parameters, the convergence problems were
eliminated.
RESULTS
Adsorption-DesorptionTuning
Initially, the adsorption phase parameters of the model were tuned using
the available SGB adsorption-desorption tests. Specifically, the adsorp-
tion phase (0500 s) of two sorption experiments, conducted at different
inlet gas temperatures (106 and 127C) but with the same inlet compo-
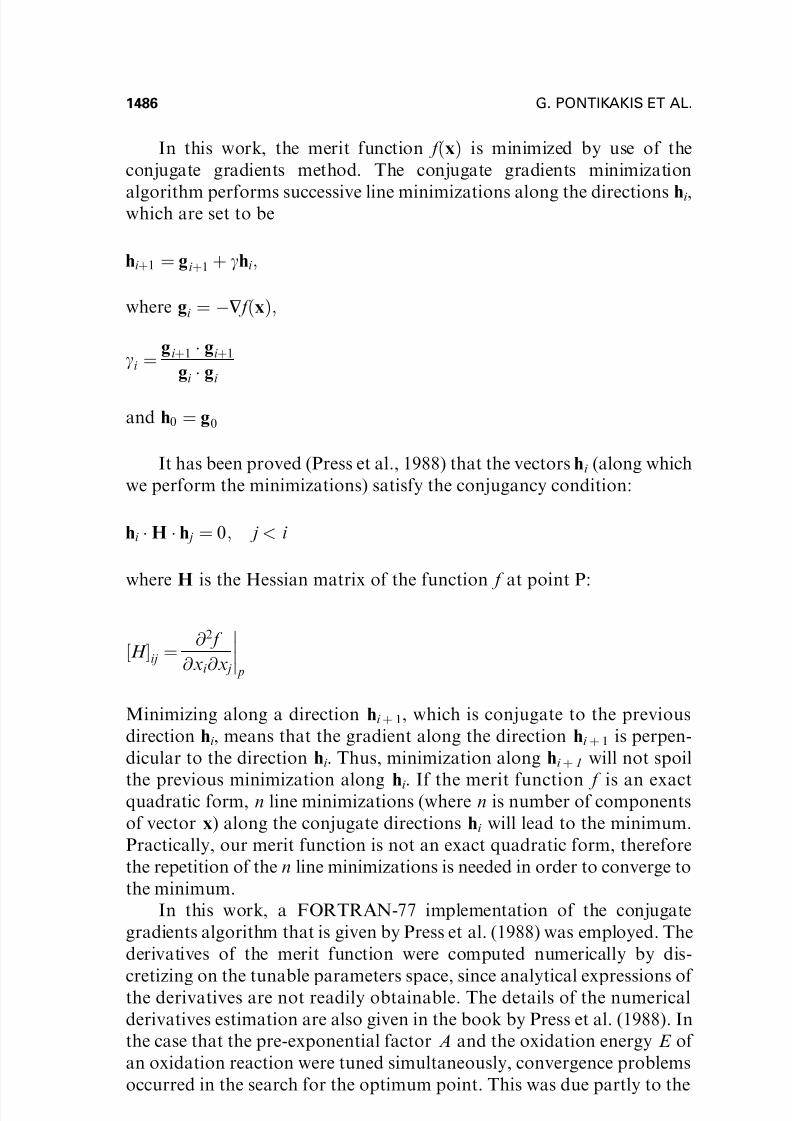
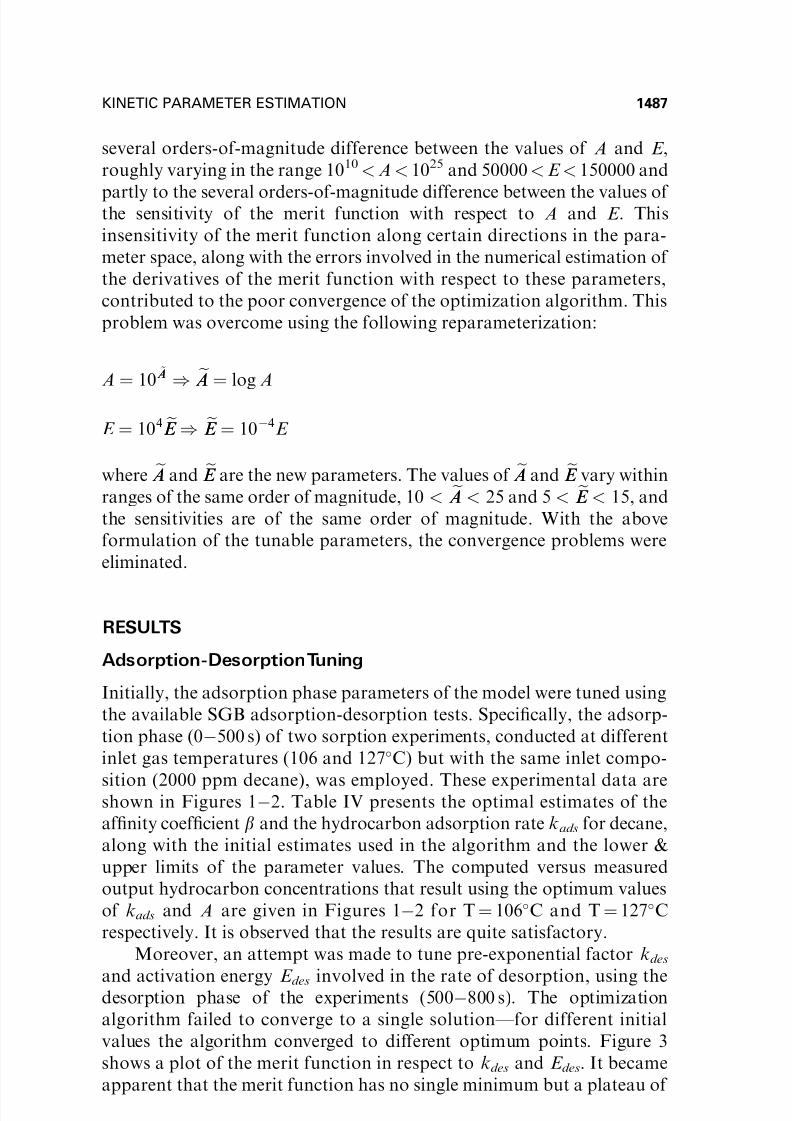
sition (2000 ppm decane), was employed. These experimental data areshown in Figures 12. Table IV presents the optimal estimates of the
affinity coefficient b and the hydrocarbon adsorption rate kads for decane,
along with the initial estimates used in the algorithm and the lower &
upper limits of the parameter values. The computed versus measured
output hydrocarbon concentrations that result using the optimum values
of kads and A are given in Figures 12 for T ¼ 106C and T ¼ 127C
respectively. It is observed that the results are quite satisfactory.
Moreover, an attempt was made to tune pre-exponential factor kdes
and activation energy E des involved in the rate of desorption, using thedesorption phase of the experiments (500800 s). The optimization
algorithm failed to converge to a single solution—for different initial
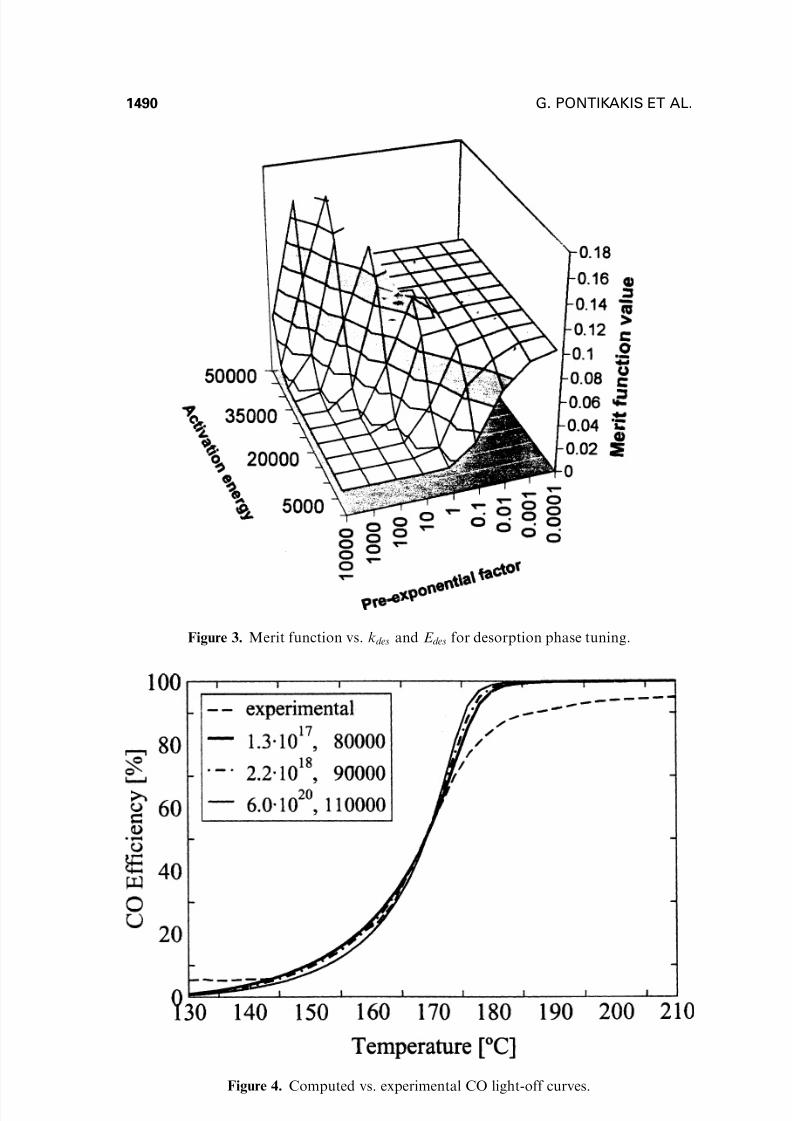
values the algorithm converged to different optimum points. Figure 3
shows a plot of the merit function in respect to kdes and E des. It became
apparent that the merit function has no single minimum but a plateau of
KINETIC PARAMETER ESTIMATION 1487

7/25/2019 Chemengcomm Conjugate
http://slidepdf.com/reader/full/chemengcomm-conjugate 16/29
minima. The simulation is not sensitive to the rate of desorption. This
could imply that the process is controlled by the adsorption-desorption
equilibrium. In other words, the simulated system behavior seems not to
depend on the rate that the system reacts against the shift of the equili-
brium point but on the rate the equilibrium shifts (due to the gradual inlet
temperature increase).
Thus, the tunable parameters cannot be determined unambiguously
from the specific data. As shown in the next section, full-scale vehicle tests
were finally employed for this task.
Inserting any one of the ‘‘optimum’’ pairs of kdes and E des values to
model the adsorption-desorption experiments, the curves shown in
Figure 1 (T ¼ 106C) and (T ¼ 127C) are generated. Thus, the experi-
ments are not suitable for the determination of the values of kdes and E des.
In order to achieve this, the experiments should be conducted again with
a faster temperature rise during the desorption phase.
OxidationTuning using SGBLight-Off Experiments
The next step of the tuning exercise was to evaluate the tunable para-
meters for the oxidation of CO and HC. For each species, there are two
tunable parameters, namely the pre-exponential factor A and the
Figure 1. Sorption experiment at T ¼ 106C; computed vs. measured hydrocarbon concen-
tration.
1488 G. PONTIKAKIS ET AL.
7/25/2019 Chemengcomm Conjugate
http://slidepdf.com/reader/full/chemengcomm-conjugate 17/29
activation energy E . A first attempt was made to determine the
pre-exponential factor ACO and the activation energy E CO of the CO
oxidation based on the results of routine light-off tests.
The experimental CO light-off curve shown in Figure 4 was
employed in this process. It must be noted that the input gas in this test
also contained hydrocarbon, which is oxidized in the experiment’s tem-
perature range. In order to focus only on the simultaneous determinationof ACO and E CO, the kinetics for hydrocarbon oxidation were adopted
from previous experience.
The algorithm converged to different optimum points, depending on
the starting point of the optimization procedure. To better present this
situation, the merit function was plotted against the two tunable para-
meters, and the results are visualized in Figure 5. From any starting
Figure 2. Sorption experiment at T ¼ 127
C; computed vs. measured hydrocarbon concen-tration.
Table IV Tunning of the adsorption phase parameters
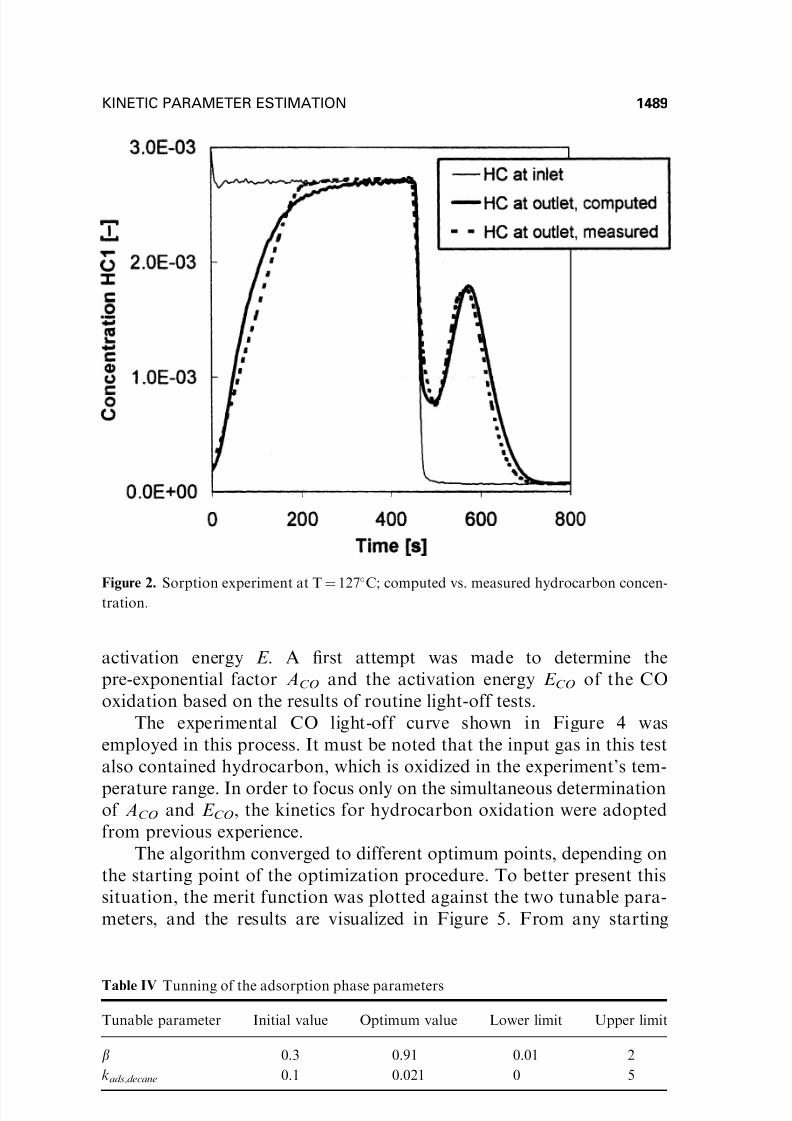
Tunable parameter Initial value Optimum value Lower limit Upper limit
b 0.3 0.91 0.01 2
kads,decane 0.1 0.021 0 5
KINETIC PARAMETER ESTIMATION 1489
7/25/2019 Chemengcomm Conjugate
http://slidepdf.com/reader/full/chemengcomm-conjugate 18/29
Figure 3. Merit function vs. kdes and E des for desorption phase tuning.
Figure 4. Computed vs. experimental CO light-off curves.
1490 G. PONTIKAKIS ET AL.
7/25/2019 Chemengcomm Conjugate
http://slidepdf.com/reader/full/chemengcomm-conjugate 19/29
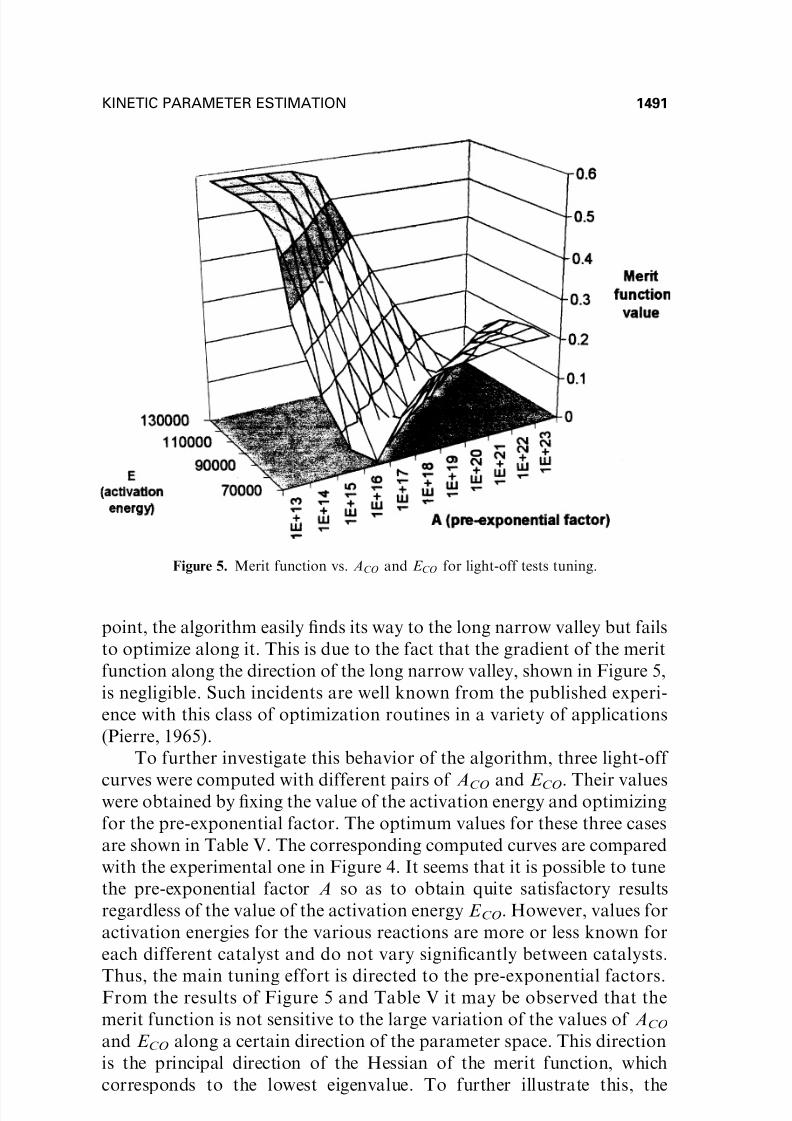
point, the algorithm easily finds its way to the long narrow valley but fails
to optimize along it. This is due to the fact that the gradient of the merit
function along the direction of the long narrow valley, shown in Figure 5,
is negligible. Such incidents are well known from the published experi-
ence with this class of optimization routines in a variety of applications
(Pierre, 1965).
To further investigate this behavior of the algorithm, three light-off
curves were computed with different pairs of ACO and E CO. Their valueswere obtained by fixing the value of the activation energy and optimizing
for the pre-exponential factor. The optimum values for these three cases
are shown in Table V. The corresponding computed curves are compared
with the experimental one in Figure 4. It seems that it is possible to tune
the pre-exponential factor A so as to obtain quite satisfactory results
regardless of the value of the activation energy E CO. However, values for
activation energies for the various reactions are more or less known for
each different catalyst and do not vary significantly between catalysts.
Thus, the main tuning effort is directed to the pre-exponential factors.From the results of Figure 5 and Table V it may be observed that the
merit function is not sensitive to the large variation of the values of ACO
and E CO along a certain direction of the parameter space. This direction
is the principal direction of the Hessian of the merit function, which
corresponds to the lowest eigenvalue. To further illustrate this, the
Figure 5. Merit function vs. ACO and E CO for light-off tests tuning.
KINETIC PARAMETER ESTIMATION 1491
7/25/2019 Chemengcomm Conjugate
http://slidepdf.com/reader/full/chemengcomm-conjugate 20/29
eigenvalues and the eigenvectors of the Hessian matrix of the merit
function are shown in Table V for each case. The eigenvalues, which
measure the curvature of the merit function at the optimal point alongthe principal directions, are also indicative of the relative uncertainty in
the parameter estimates along these principal directions. The large
uncertainty observed along one direction indicates that the available
experimental data were no adequate for the reliable estimation of these
parameters.
Thus, SGB light-off tests alone cannot be used for the determination
of CO oxidation parameters. The same applies for the HC oxidation,
since the light-off behavior of hydrocarbons is similar to that of CO and,
furthermore, the rate expressions for CO and HC oxidation are of the
same type.
OxidationTuning Using a Driving Cycle
As a final step, a vehicle driving cycle test was employed in order to
successfully tune the model. The driving cycle test is a complex transient
test where all physical and chemical phenomena taking place in the cat-
alyst are coupled. Therefore, one cannot isolate the chemical reaction and
tune for the corresponding parameters separately. Instead, it is requiredto tune all parameters simultaneously.
The complicated mixture of exhaust gas hydrocarbons was simulated
in the above-described model with three hydrocarbons: a fast-oxidizing
HC, represented by propene, a slow-oxidizing HC, represented by pro-
pane, and an adsorbable HC, represented by decane. Thus, it was
Table V Merit function value, Eigenvalues, and Eigenvectors for each pair of ACO and
E CO
Point
ACO and E CO
at each point
Merit function
value
Eigenvalue of
Hessian matrix
Eigenvectors of
Hessian matrix
1 1.5 1017
80000
2.13 1073 l1 ¼ 155.7
l2 ¼ 73.4
v1 ¼ 0:874
0:486
,
v2 ¼ 0:486
0:874
2 2.6 1018
90000
2.19 1073 l1 ¼ 159.6
l2 ¼ 3.8
v1 ¼ 0:863
0:51
,
v2 ¼
0:51
0:863 3 6.0 1020
110000
2.72 1073 l1 ¼ 164.283
l2 ¼ 5.864
v1 ¼ 0:848
0:53
,
v2 ¼ 0:53
0:848
1492 G. PONTIKAKIS ET AL.
7/25/2019 Chemengcomm Conjugate
http://slidepdf.com/reader/full/chemengcomm-conjugate 21/29
attempted to minimize the error between computed and measured outlet
concentration of CO and HC by tuning:
CO activation energy E CO and pre-exponential factor ACO
HC activation energy E HC,j and pre-exponential factor AHC,j for each
of the three hydrocarbons
Four tunable parameters involved in the absorption-desorption model
for the adsorbable HC, i.e., the affinity coefficient b and the adsorption-
desorption rate parameters kads, kdes, and E des.
In total, 12 tunable parameters must be determined. Two experimentally
determined catalyst outlet concentration curves available for CO and HCwere employed in the process of optimal fitting of the above 12
parameters. Because two experimental curves are used, the weights in
Equation (12) must be properly set. To facilitate that, we computed the
average of the measured outlet concentration for CO and for HC. Their
ratio is
average measured CO outlet concentration
average measured HC outlet concentration ffi 5
Thus, in order for the contribution of each experimental data set to be of
the same order of magnitude, the weight for HC was set five times greater
that the corresponding weight for CO: wHC ¼ 5, wCO ¼ 1.
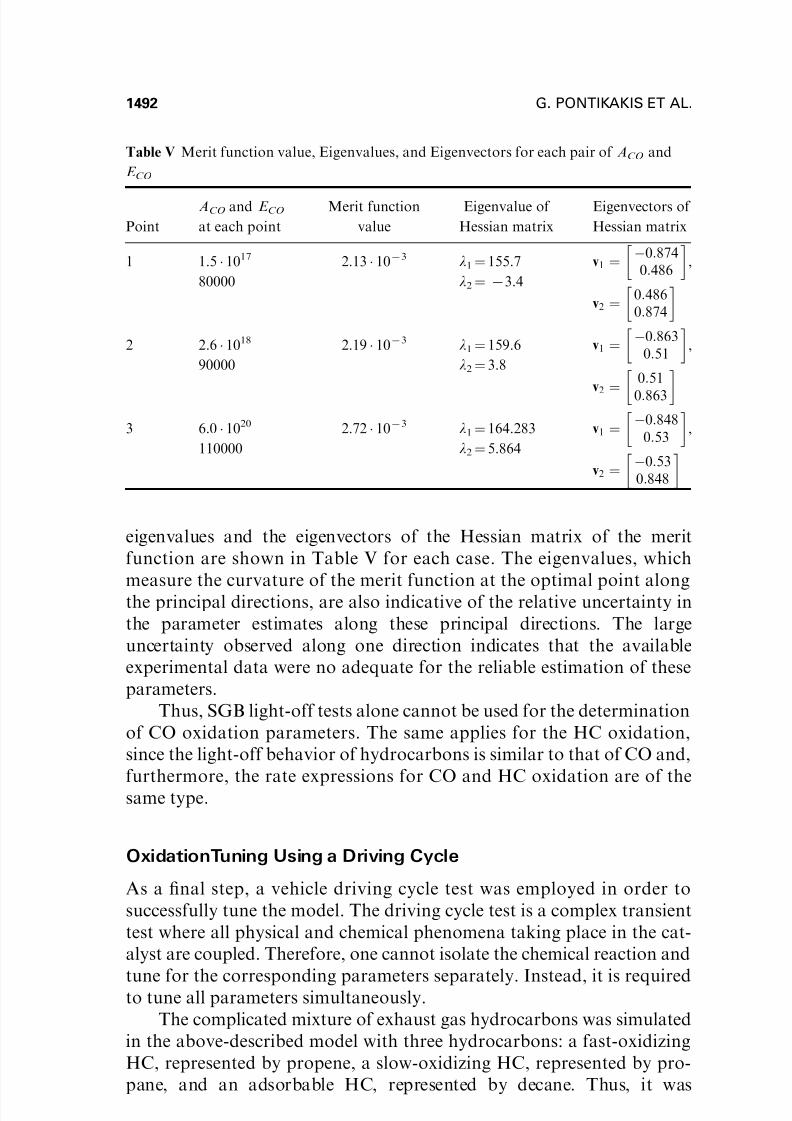
The initial and optimum values for each parameter are given in Table VI.
The computed versus measured outlet concentration curves for CO, HC
emissions, and computed versus measured temperatures at the converter
Table VI Tuning of all model parameters against a driving cycle test
Tunable parameter Initial value Minimum value Maximum value Optimum value
Aco 1021 1010 1030 1.6 1015
E co 110000 50000 130000 66290
A propene 1020 1010 1030 1.1 1021
E propene 90000 50000 100000 84260
A propane 1020 1010 1030 4.9 1017
E propane 120000 100000 150000 130150
Adecane 10
20
10
10
10
30
6.1 10
14
E decane 90000 50000 100000 56140
b 0.2 0.01 5 0.47
kads 0.02 0 10 2.5 1073
kdes 10 0 105 8.7
E des 20000 1000 50000 22930
KINETIC PARAMETER ESTIMATION 1493
7/25/2019 Chemengcomm Conjugate
http://slidepdf.com/reader/full/chemengcomm-conjugate 22/29
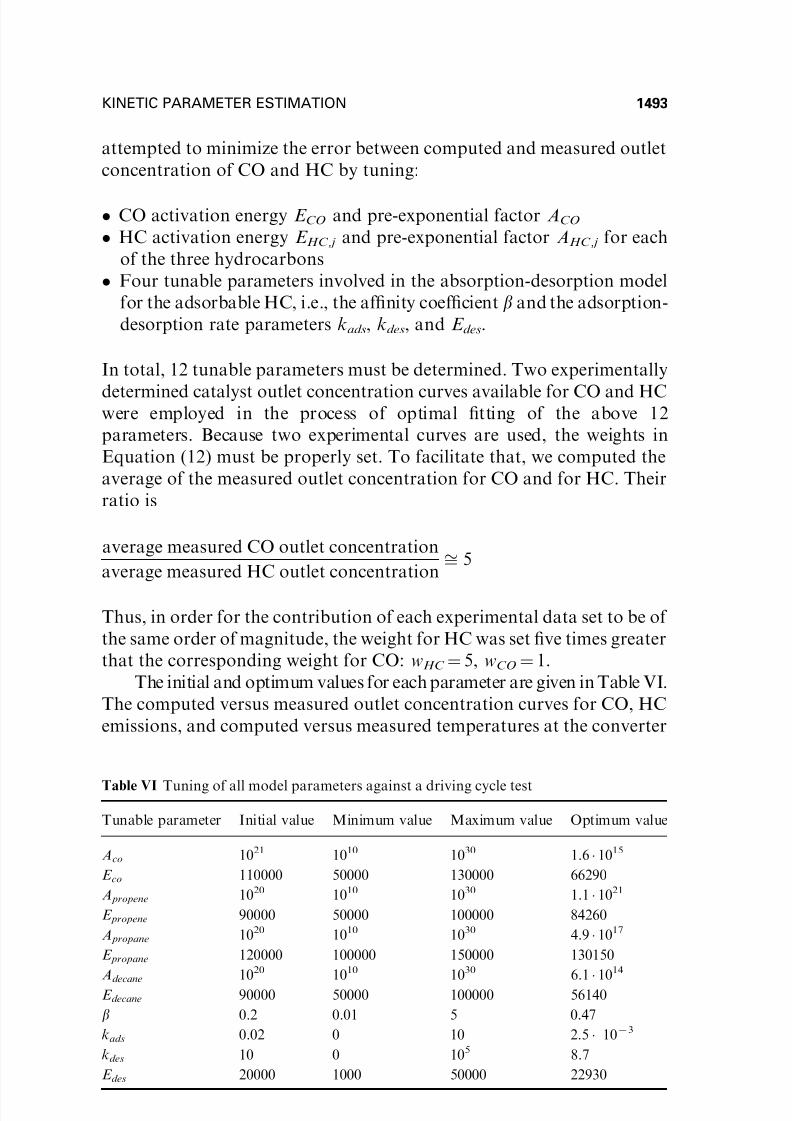
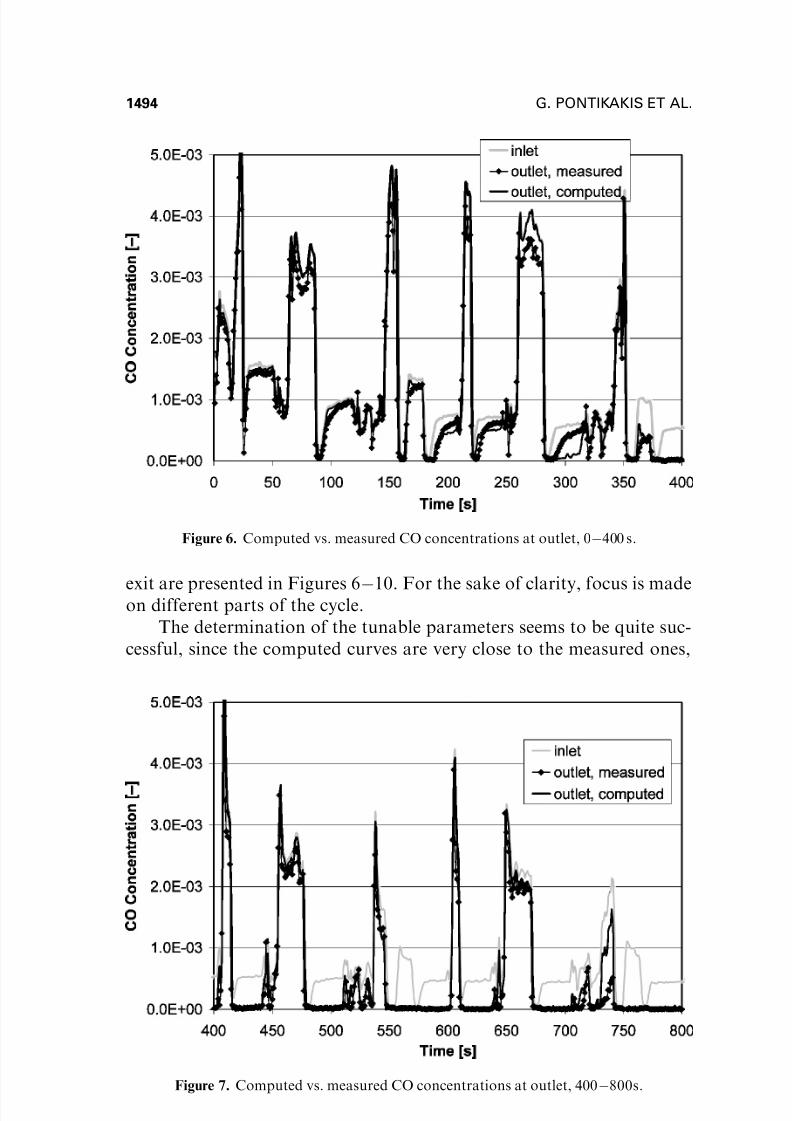
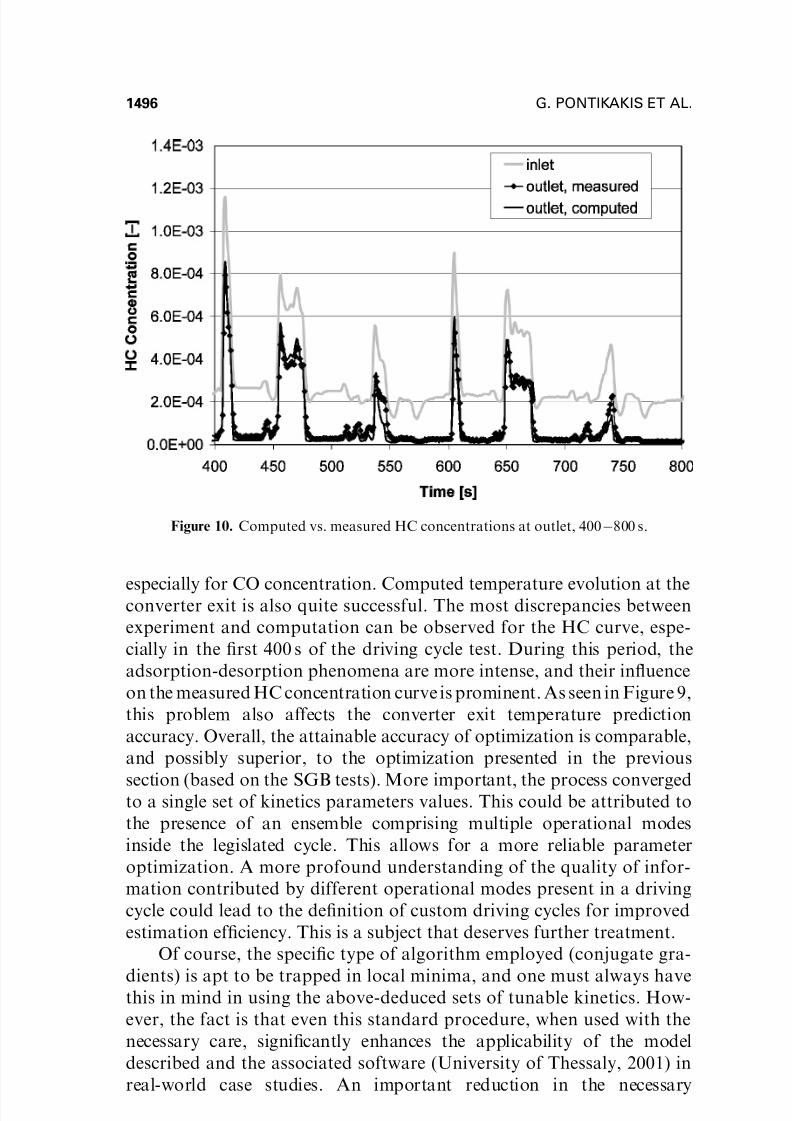
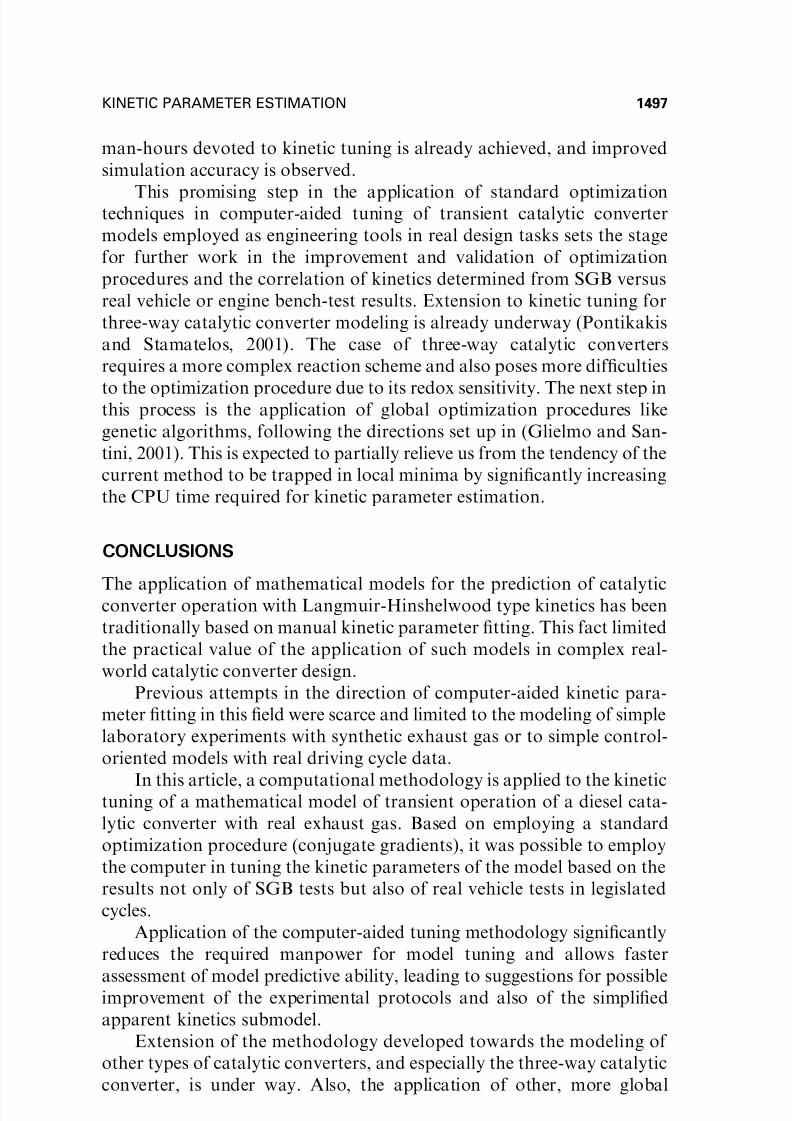
exit are presented in Figures 610. For the sake of clarity, focus is madeon different parts of the cycle.
The determination of the tunable parameters seems to be quite suc-
cessful, since the computed curves are very close to the measured ones,
Figure 6. Computed vs. measured CO concentrations at outlet, 0400 s.
Figure 7. Computed vs. measured CO concentrations at outlet, 400800s.
1494 G. PONTIKAKIS ET AL.
7/25/2019 Chemengcomm Conjugate
http://slidepdf.com/reader/full/chemengcomm-conjugate 23/29
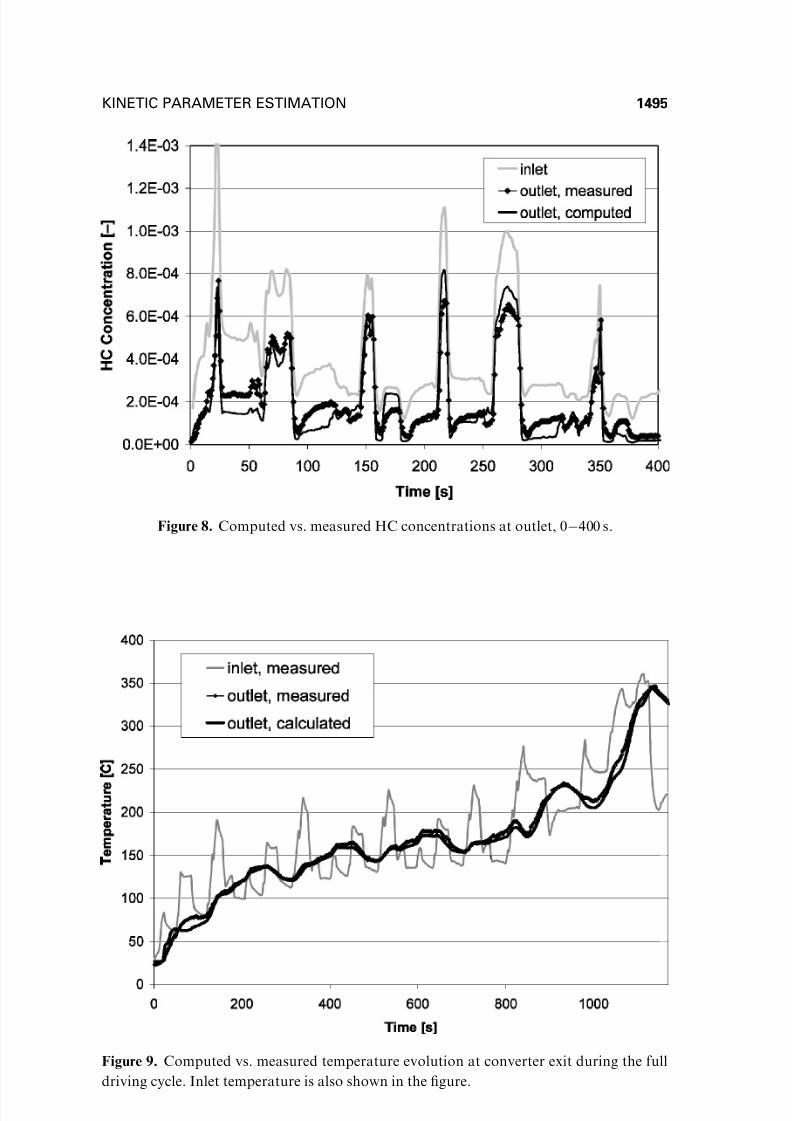
Figure 8. Computed vs. measured HC concentrations at outlet, 0400 s.
Figure 9. Computed vs. measured temperature evolution at converter exit during the full
driving cycle. Inlet temperature is also shown in the figure.
KINETIC PARAMETER ESTIMATION 1495
7/25/2019 Chemengcomm Conjugate
http://slidepdf.com/reader/full/chemengcomm-conjugate 24/29
especially for CO concentration. Computed temperature evolution at theconverter exit is also quite successful. The most discrepancies between
experiment and computation can be observed for the HC curve, espe-
cially in the first 400 s of the driving cycle test. During this period, the
adsorption-desorption phenomena are more intense, and their influence
on the measured HC concentration curve is prominent. As seen in Figure 9,
this problem also affects the converter exit temperature prediction
accuracy. Overall, the attainable accuracy of optimization is comparable,
and possibly superior, to the optimization presented in the previous
section (based on the SGB tests). More important, the process convergedto a single set of kinetics parameters values. This could be attributed to
the presence of an ensemble comprising multiple operational modes
inside the legislated cycle. This allows for a more reliable parameter
optimization. A more profound understanding of the quality of infor-
mation contributed by different operational modes present in a driving
cycle could lead to the definition of custom driving cycles for improved
estimation efficiency. This is a subject that deserves further treatment.
Of course, the specific type of algorithm employed (conjugate gra-
dients) is apt to be trapped in local minima, and one must always havethis in mind in using the above-deduced sets of tunable kinetics. How-
ever, the fact is that even this standard procedure, when used with the
necessary care, significantly enhances the applicability of the model
described and the associated software (University of Thessaly, 2001) in
real-world case studies. An important reduction in the necessary
Figure 10. Computed vs. measured HC concentrations at outlet, 400800 s.
1496 G. PONTIKAKIS ET AL.
7/25/2019 Chemengcomm Conjugate
http://slidepdf.com/reader/full/chemengcomm-conjugate 25/29
man-hours devoted to kinetic tuning is already achieved, and improved
simulation accuracy is observed.
This promising step in the application of standard optimizationtechniques in computer-aided tuning of transient catalytic converter
models employed as engineering tools in real design tasks sets the stage
for further work in the improvement and validation of optimization
procedures and the correlation of kinetics determined from SGB versus
real vehicle or engine bench-test results. Extension to kinetic tuning for
three-way catalytic converter modeling is already underway (Pontikakis
and Stamatelos, 2001). The case of three-way catalytic converters
requires a more complex reaction scheme and also poses more difficulties
to the optimization procedure due to its redox sensitivity. The next step inthis process is the application of global optimization procedures like
genetic algorithms, following the directions set up in (Glielmo and San-
tini, 2001). This is expected to partially relieve us from the tendency of the
current method to be trapped in local minima by significantly increasing
the CPU time required for kinetic parameter estimation.
CONCLUSIONS
The application of mathematical models for the prediction of catalyticconverter operation with Langmuir-Hinshelwood type kinetics has been
traditionally based on manual kinetic parameter fitting. This fact limited
the practical value of the application of such models in complex real-
world catalytic converter design.
Previous attempts in the direction of computer-aided kinetic para-
meter fitting in this field were scarce and limited to the modeling of simple
laboratory experiments with synthetic exhaust gas or to simple control-
oriented models with real driving cycle data.
In this article, a computational methodology is applied to the kinetictuning of a mathematical model of transient operation of a diesel cata-
lytic converter with real exhaust gas. Based on employing a standard
optimization procedure (conjugate gradients), it was possible to employ
the computer in tuning the kinetic parameters of the model based on the
results not only of SGB tests but also of real vehicle tests in legislated
cycles.
Application of the computer-aided tuning methodology significantly
reduces the required manpower for model tuning and allows faster
assessment of model predictive ability, leading to suggestions for possibleimprovement of the experimental protocols and also of the simplified
apparent kinetics submodel.
Extension of the methodology developed towards the modeling of
other types of catalytic converters, and especially the three-way catalytic
converter, is under way. Also, the application of other, more global
KINETIC PARAMETER ESTIMATION 1497
7/25/2019 Chemengcomm Conjugate
http://slidepdf.com/reader/full/chemengcomm-conjugate 26/29
7/25/2019 Chemengcomm Conjugate
http://slidepdf.com/reader/full/chemengcomm-conjugate 27/29
Subscripts
ads adsorption
des desorption
eq equilibrium
g gas
liq liquid
r radial direction
rea reaction
s 1. solid, 2. solid-gas interface
srp sorption
tot total
j species jk reaction k
z axial direction
REFERENCES
Chen, D. K. S., Bissett, E. J., Oh, S. H., and Van Ostrom, D. L. (1988). A three-
dimensional model for the analysis of transient thermal and conversion
characteristics of monolithic catalytic converters, SAE paper 880282, Societyof Automatic Engineers, Warrendale, Penn.
Dubien, C. and Schweich, D. (1997). Three way catalytic converter modeling:
Numerical determination of kinetic data, In Catalysis and Automotive Pol-
lution Control IV: Proceedings of the Fourth International Symposium (CA-
POC4), Brussels, Belgium, April 911, 1997 , Elsevier, New York.
Felis, V., Bellefon, C., Fouilloux, P., and Schweich, D. (1999). Hydrode-
chlorination and hydrodearomatization of monoaromatic chlorophenols into
cyclohexanol on Ru/C catalysts applied to water depollution, Appl. Catal. B
Environ., 20, 91100.Flytzani-Stefanopoulos, M., Voecks, G. E., and Charng, T. (1986). Modeling of
heat transfer in non-adiabatic monolithic reactors and experimental com-
parisons of metal monoliths with packed beds, Chem. Eng. Sci., 41, 1203.
Froment, G. F. (1987). The kinetics of complex catalytic reactions, Chem. Eng.
Sci., 42, 10731087.
Glielmo, L. and Santini, S. (2001). A two-time-scale infinite-adsorption model of
three-way catalytic converters during the warm-up phase, J. Dyn. Syst. Meas.
Control , 123(1), 6270.
Glielmo, L., Milano, M., and Santini, S. (2000). Three-way catalytic convertermodelling: Neural networks and genetic algorithm for the reaction kinetics
submodel, SAE paper 2000-01-0212, Society of Automotive Engineers,
Warrendale, Penn.
Heck, R. H. and Wei, J. (1976). Mathematical modeling of monolithic catalysts,
AIChE J., 22(3), 477.
KINETIC PARAMETER ESTIMATION 1499
7/25/2019 Chemengcomm Conjugate
http://slidepdf.com/reader/full/chemengcomm-conjugate 28/29
Kaerger, J. and Ruthven, D. M. (1992). Diffusion in Zeolites and Other
Microporous Solids, Wiley, New York.
Koltsakis, G. C. and Stamatelos, A. M. (1997). Catalytic automotive exhaustaftertreatment, Progr. Energy Combust. Sci., 23, 153.
Koltsakis, G. C. and Stamatelos, A. M. (1998). Three-way catalytic converter
modeling and applications, Chem. Eng. Commun., 164, 153.
Montreuil, C. N., Williams, S. C., and Adamczyk, A. A. (1992). Modeling current
generation catalytic converters: Laboratory experiments and kinetic para-
meter optimization— Steady state kinetics, SAE paper 920096, Society of
Automotive Engineers, Warrendale, Penn.
Moros, R., Kalies, H., Rex, H. G., and Schaffarczyk, St. (1996). A genetic
algorithm for generating initial parameter estimations for kinetic models of catalytic processes, Comput. Chem. Eng., 20(10), 12571270.
Park, Tae-Yun and Froment, Gilbert F. (1998). A hybrid genetic algorithm for
the estimation of parameters in detailed kinetic models, Comput. Chem. Eng.,
22, Suppl., S103S110.
Pierre, D. (1965). Optimization Theory with Applications, Dover Publications,
New York.
Pontikakis, G. and Stamatelos, A. (2001). Mathematical modeling of catalytic
exhaust systems for EURO-3 and EURO-4 emissions standards, Proc. Inst.
Mech. Eng. Part D J. Automob. Eng., 215, 10051015.Pontikakis, G. N., Koltsakis, G. C., Stamatelos, A. M., Noirot, R., Agliany,
Y., Colas, H., and Versaevel, P. (2000). Experimental and modeling study on
zeolite catalysts for diesel engines, paper presented at CAPOC V, Fifth
International Congress on Catalysis and Automotive Pollution Control,
Brussels, April.
Press, W. H., Flannery, B. P., Teukolsky, S. A., and Vetterling, W. T. (1988).
Numerical Recipes in Fortran 77: The Art of Scientific Computing, Cambridge
University Press, Cambridge, England.
Schmidt, L. D. (1998). The Engineering of Chemical Reactions, Oxford UniversityPress, Oxford.
Siemund, S., Leclerc, J. P., Schweich, D., Prigent, M., and Castagna, F. (1996).
Three-way monolithic converter: Simulations versus experiments, Chem.
Eng. Sci., 51(15), 3709.
Thomas, J. M. and Thomas, W. J. (1997). Principles and Practice of
Heterogeneous Catalysis, VCH Verlagsgesellschaft, Weinheim, Germany.
University of Thessaly (2001). LTTE: CATRAN Catalytic Converter Modeling
Software, Version V3R1, User’s Manual., Volos, Greece.
Voltz, S. E., Morgan, C. R., Liederman, D., and Jacob, S. M. (1973). Ind. Eng.Chem. Prod. Res. Dev., 12, 294.
Watson, Beth A., Klein, Michael T., and Harding, Robert H. (1996). Mechanistic
modeling of n-heptane cracking on HZSM-5, Ind. Eng. Chem. Res., 35(5),
15061516.
1500 G. PONTIKAKIS ET AL.

7/25/2019 Chemengcomm Conjugate
http://slidepdf.com/reader/full/chemengcomm-conjugate 29/29
Wolf, D. and Moros, R. (1997). Estimating rate constants of heterogeneous
catalytic reactions without supposition of rate determining surface steps— an
application of a genetic algorithm, Chem. Eng. Sci., 52(7), 11891199.Young, L. C. and Finlayson, B. A. (1976). Mathematical models of the mono-
lithic catalytic converter. Part 1: Development of model and application of
orthogonal collocation, AIChE J., 22, 331.
KINETIC PARAMETER ESTIMATION 1501