Characterization of Deuterium Beam Operation on...
33
SANDIA REPORT SAND2009-8165 Unlimited Release Printed December 2009 Characterization of Deuterium Beam Operation on RHEPP-1 for Future Neutron Generation Applications Timothy Jerome Renk Michael Schall Gary W. Cooper Prepared by Sandia National Laboratories Albuquerque, New Mexico 87185 and Livermore, California 94550 Sandia is a multiprogram laboratory operated by Sandia Corporation, a Lockheed Martin Company, for the United States Department of Energy’s National Nuclear Security Administration under Contract DE-AC04-94AL85000. Approved for public release; further dissemination unlimited.
Transcript of Characterization of Deuterium Beam Operation on...
SANDIA REPORT SAND2009-8165 Unlimited Release Printed December 2009
Characterization of Deuterium Beam Operation on RHEPP-1 for Future Neutron Generation Applications Timothy Jerome Renk Michael Schall Gary W. Cooper Prepared by Sandia National Laboratories Albuquerque, New Mexico 87185 and Livermore, California 94550
Sandia is a multiprogram laboratory operated by Sandia Corporation, a Lockheed Martin Company, for the United States Department of Energy’s National Nuclear Security Administration under Contract DE-AC04-94AL85000.
Approved for public release; further dissemination unlimited.
2
Issued by Sandia National Laboratories, operated for the United States Department of Energy by Sandia Corporation. NOTICE: This report was prepared as an account of work sponsored by an agency of the United States Government. Neither the United States Government, nor any agency thereof, nor any of their employees, nor any of their contractors, subcontractors, or their employees, make any warranty, express or implied, or assume any legal liability or responsibility for the accuracy, completeness, or usefulness of any information, apparatus, product, or process disclosed, or represent that its use would not infringe privately owned rights. Reference herein to any specific commercial product, process, or service by trade name, trademark, manufacturer, or otherwise, does not necessarily constitute or imply its endorsement, recommendation, or favoring by the United States Government, any agency thereof, or any of their contractors or subcontractors. The views and opinions expressed herein do not necessarily state or reflect those of the United States Government, any agency thereof, or any of their contractors. Printed in the United States of America. This report has been reproduced directly from the best available copy. Available to DOE and DOE contractors from U.S. Department of Energy Office of Scientific and Technical Information P.O. Box 62 Oak Ridge, TN 37831 Telephone: (865) 576-8401 Facsimile: (865) 576-5728 E-Mail: [email protected] Online ordering: http://www.osti.gov/bridge Available to the public from U.S. Department of Commerce National Technical Information Service 5285 Port Royal Rd. Springfield, VA 22161 Telephone: (800) 553-6847 Facsimile: (703) 605-6900 E-Mail: [email protected] Online order: http://www.ntis.gov/help/ordermethods.asp?loc=7-4-0#online
3
SAND2009-8165 Unlimited Release
Printed December 2009
Characterization of Deuterium Beam Operation on RHEPP-1 for Future Neutron Generation Applications
Timothy Jerome Renk
Directed Energy Beam Applications and Initiatives Sandia National Laboratories
P.O. Box 5800 Albuquerque, New Mexico 87185-MS1182
Michael Schall Gary W. Cooper
Department of Chemical and Nuclear Engineering
University of New Mexico Albuquerque, NM 87131
Abstract We investigate the potential for neutron generation using the 1 MeV RHEPP-1 intense pulsed ion
beam facility at Sandia National Laboratories for a number of emerging applications. Among these are
interrogation of cargo for detection of special nuclear materials (SNM). Ions from single-stage sources
driven by pulsed power represent a potential source of significant neutron bursts. While a number of
applications require higher ion energies (e.g. tens of MeV) than that provided by RHEPP-1, its ability
to generate deuterium beams allow for neutron generation at and below 1 MeV. This report details the
successful generation and characterization of deuterium ion beams, and their use in generating up
to 3 x 10¹⁰ neutrons into 4 per 5kA ion pulse.

4
ACKNOWLEDGMENTS The authors wish to thank Gerard. A. Torres for technical assistance in the RHEPP-1 ion beam experiments.
5
CONTENTS 1. Introduction. ............................................................................................................................... 7 2. Description of RHEPP-1 and Experimental Setup. ................................................................. 11 3. Experimental results................................................................................................................. 14 3.1 Characterization of ion beam operation with deuterium gas injection ...................... 14 3.2 Local ion current measurements using Peppershakers .............................................. 17 3.3 Neutron generation and characterization using deuterium ion beams and distributed targets .............................................................................................................. 22 4. Discussion and Conclusions .................................................................................................... 29 5. References ................................................................................................................................ 31 6. Distribution .............................................................................................................................. 32
FIGURES Figure 1. Fusion cross-sections as a function of deuterium energy ............................................... 9 Figure 2. RHEPP-1 Marx and pulse-forming line ....................................................................... 12 Figure 3. RHEPP-1 LIVA and vacuum tank ............................................................................... 12 Figure 4. Schematic side view of RHEPP-1 diode region ........................................................... 13 Figure 5. Propagated corrected voltage and Center FCup signals, Shot TJR 31196 ................... 15 Figure 6. RHEPP shot TJR31790, with diode-Fcup distance 70 cm ........................................... 16 Figure 7. Propagated voltages and total current, argon injection ................................................ 18 Figure 8. Photograph of Fcups and peppershakers for peppershaker shots ................................. 19 Figure 9. Be(n,)6 Cross section .................................................................................................. 24 Figure 10. ErD2 target array prior to neutron generation ............................................................. 25 Figure 11. ErD2 target array after neutron generation ................................................................. 26 Figure 12. CD2 target array prior to neutron generation .............................................................. 26 Figure 13. CD2 target array after neutron generation .................................................................. 27 Figure 14. Neutron yield into 4 vs. Shot Number ...................................................................... 28 Figure 15. ErD2 neutron yield, predicted and measured vs. voltage ............................................ 29
TABLES Table 1. Thick Target Yields of the 10B(d,n)11C reaction ............................................................ 20 Table 2. Ion Fluence of Shot 31145 ............................................................................................. 21 Table 3. Neutron energies (MeV) at incident Deuteron energy and Exit Angle ......................... 23
6
NOMENCLATURE
SNM Special Nuclear Material RHEPP-1 Repetitive High Energy Pulsed Power LIVA Linear Induction Voltage Adder MAP Magnetically Injected Plasma MBA Materials Balance Area BN boron nitride ErD2 erbium deuteride CD2 deuterated polyethylene FCup Faraday Cup Be Beryllium SNL Sandia National Laboratories PMT Photomultiplier tube
7
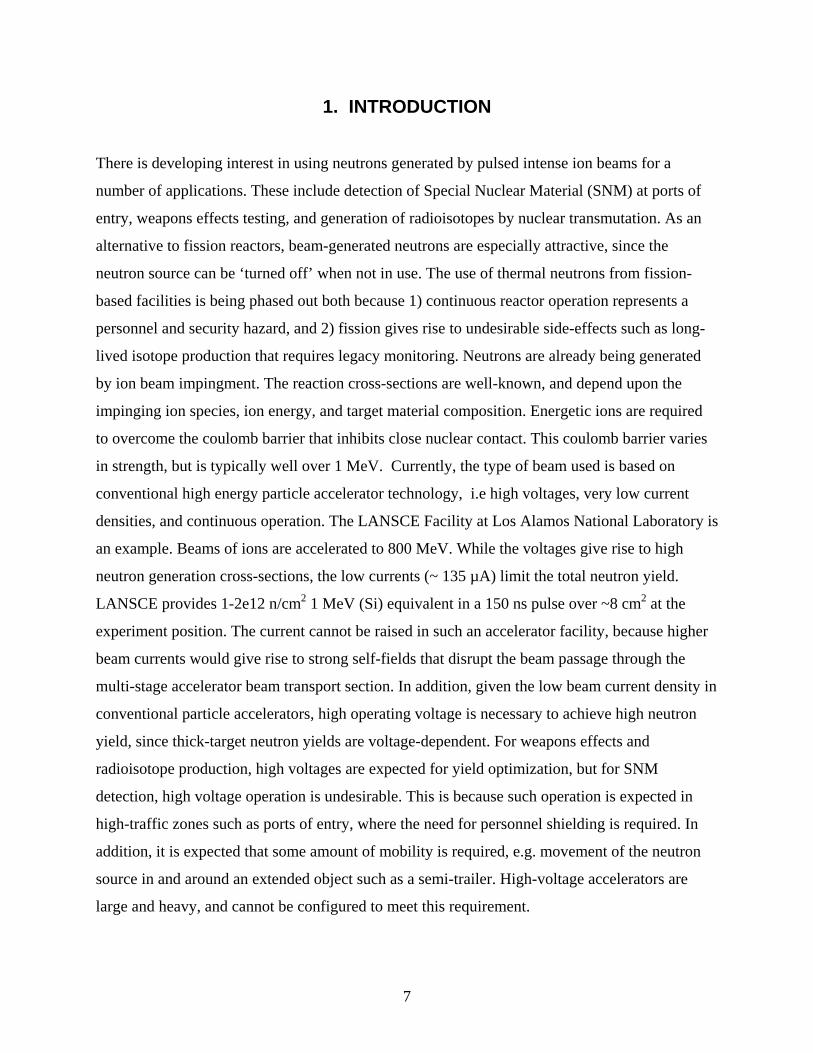
1. INTRODUCTION There is developing interest in using neutrons generated by pulsed intense ion beams for a
number of applications. These include detection of Special Nuclear Material (SNM) at ports of
entry, weapons effects testing, and generation of radioisotopes by nuclear transmutation. As an
alternative to fission reactors, beam-generated neutrons are especially attractive, since the
neutron source can be ‘turned off’ when not in use. The use of thermal neutrons from fission-
based facilities is being phased out both because 1) continuous reactor operation represents a
personnel and security hazard, and 2) fission gives rise to undesirable side-effects such as long-
lived isotope production that requires legacy monitoring. Neutrons are already being generated
by ion beam impingment. The reaction cross-sections are well-known, and depend upon the
impinging ion species, ion energy, and target material composition. Energetic ions are required
to overcome the coulomb barrier that inhibits close nuclear contact. This coulomb barrier varies
in strength, but is typically well over 1 MeV. Currently, the type of beam used is based on
conventional high energy particle accelerator technology, i.e high voltages, very low current
densities, and continuous operation. The LANSCE Facility at Los Alamos National Laboratory is
an example. Beams of ions are accelerated to 800 MeV. While the voltages give rise to high
neutron generation cross-sections, the low currents (~ 135 µA) limit the total neutron yield.
LANSCE provides 1-2e12 n/cm2 1 MeV (Si) equivalent in a 150 ns pulse over ~8 cm2 at the
experiment position. The current cannot be raised in such an accelerator facility, because higher
beam currents would give rise to strong self-fields that disrupt the beam passage through the
multi-stage accelerator beam transport section. In addition, given the low beam current density in
conventional particle accelerators, high operating voltage is necessary to achieve high neutron
yield, since thick-target neutron yields are voltage-dependent. For weapons effects and
radioisotope production, high voltages are expected for yield optimization, but for SNM
detection, high voltage operation is undesirable. This is because such operation is expected in
high-traffic zones such as ports of entry, where the need for personnel shielding is required. In
addition, it is expected that some amount of mobility is required, e.g. movement of the neutron
source in and around an extended object such as a semi-trailer. High-voltage accelerators are
large and heavy, and cannot be configured to meet this requirement.
8
If the output voltage requirement is then lowered, there are two other possible ways to increase
neutron yield over that produced by a conventional particle accelerator: 1) increase the current
density, and 2) change the driver ion. The first can be accomplished by the use of intense beams
from single-stage acceleration diodes. Increased currents and current densities would boost the
dose-rate significantly, as beam currents can momentarily reach kA instead of µA. Such beams
can be generated using pulsed power technology and high source current density ion sources,
such as were originally developed at Sandia for the Light Ion Fusion Program [1]. The prior
application required beams of high brightness so as to focus high power from some distance on a
small fusion pellet target. Such high brightness is not required for the present application set, as
it is anticipated that beams of moderate brightness will be used to strike distributed targets. The
use of high-power ion beams to generate neutrons is the subject of another LDRD project
[117860].
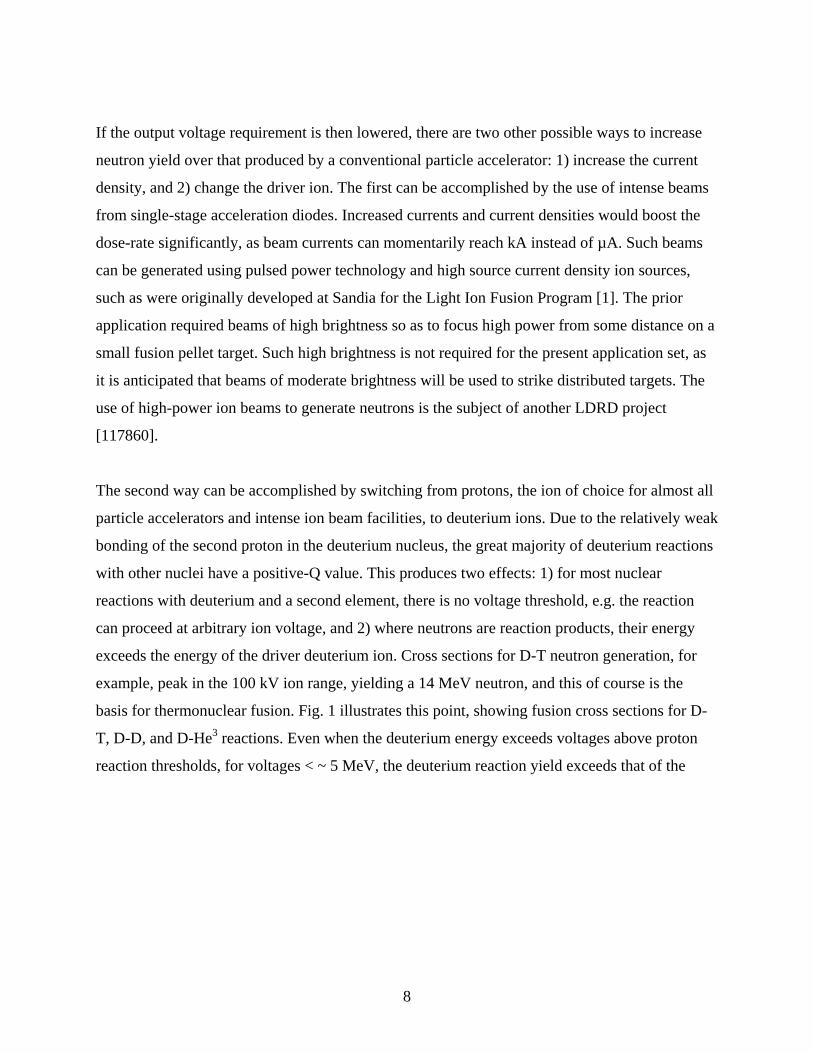
The second way can be accomplished by switching from protons, the ion of choice for almost all
particle accelerators and intense ion beam facilities, to deuterium ions. Due to the relatively weak
bonding of the second proton in the deuterium nucleus, the great majority of deuterium reactions
with other nuclei have a positive-Q value. This produces two effects: 1) for most nuclear
reactions with deuterium and a second element, there is no voltage threshold, e.g. the reaction
can proceed at arbitrary ion voltage, and 2) where neutrons are reaction products, their energy
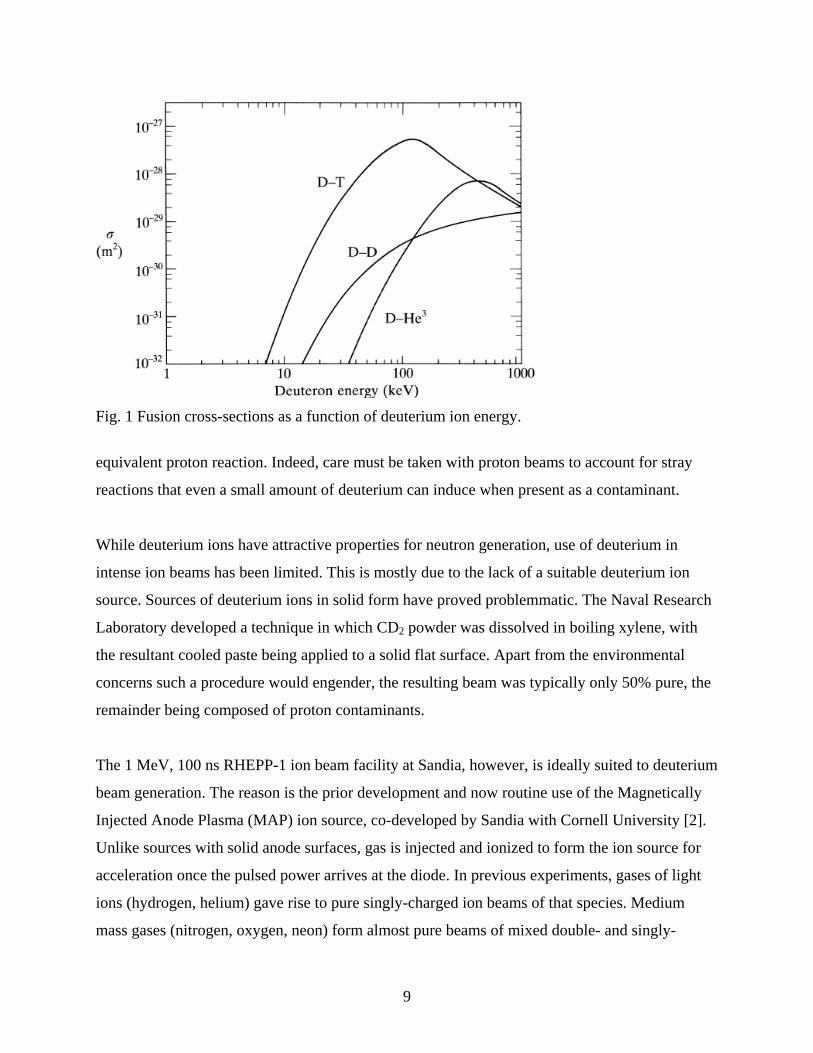
exceeds the energy of the driver deuterium ion. Cross sections for D-T neutron generation, for
example, peak in the 100 kV ion range, yielding a 14 MeV neutron, and this of course is the
basis for thermonuclear fusion. Fig. 1 illustrates this point, showing fusion cross sections for D-
T, D-D, and D-He3 reactions. Even when the deuterium energy exceeds voltages above proton
reaction thresholds, for voltages < ~ 5 MeV, the deuterium reaction yield exceeds that of the
9
Fig. 1 Fusion cross-sections as a function of deuterium ion energy.
equivalent proton reaction. Indeed, care must be taken with proton beams to account for stray
reactions that even a small amount of deuterium can induce when present as a contaminant.
While deuterium ions have attractive properties for neutron generation, use of deuterium in
intense ion beams has been limited. This is mostly due to the lack of a suitable deuterium ion
source. Sources of deuterium ions in solid form have proved problemmatic. The Naval Research
Laboratory developed a technique in which CD2 powder was dissolved in boiling xylene, with
the resultant cooled paste being applied to a solid flat surface. Apart from the environmental
concerns such a procedure would engender, the resulting beam was typically only 50% pure, the
remainder being composed of proton contaminants.
The 1 MeV, 100 ns RHEPP-1 ion beam facility at Sandia, however, is ideally suited to deuterium
beam generation. The reason is the prior development and now routine use of the Magnetically
Injected Anode Plasma (MAP) ion source, co-developed by Sandia with Cornell University [2].
Unlike sources with solid anode surfaces, gas is injected and ionized to form the ion source for
acceleration once the pulsed power arrives at the diode. In previous experiments, gases of light
ions (hydrogen, helium) gave rise to pure singly-charged ion beams of that species. Medium
mass gases (nitrogen, oxygen, neon) form almost pure beams of mixed double- and singly-
10
charged beams of the injection species. The ability to tune the ion beam to a selectable species
(such as deuterium) offers the potential of inducing a specific desired nuclear reaction. And since
the anode source itself is gaseous and not solid, it is self-renewing, and so beam generation can
proceed over an indefinite number of pulses. Successful neutron generation will give rise to at
least short-term radioactivity and thus radiological hold times before target materials and
diagnostics can be accessed. If the vacuum section of an intense beam does not have to be
accessed to renew the ion source, the target section can be kept under vacuum, and thus multiple
experiments can be undertaken before radiological holds (which only occur when vacuum is
broken) need take place.
This report details the development of deuterium beam generation capability for the RHEPP-1
facility. The project experimental plan that we developed is divided into several sections which
will be discussed in detail in Section III below. Deuterium, unlike other gases used in RHEPP-1
beam experiments, is an Accountable Nuclear Material. Undertaking deuterium ion beam
experiments required the establishment of a Materials Balance Area (MBA), and completion of
SEC220 (Category III and IV MBA Custodian Training). After this, we defined a Radioactive
Materials Area, and posted the RHEPP-1 experiment cell as a Controlled Area. A new procedure
was then instituted, in that after each series of deuterium beam experiments was completed,
surveys by Radiological Control Technicians were required before handling any of the
experimental hardware. All of these steps were implemented in a straightforward manner with a
relatively small time investment, and are now part of permanent RHEPP-1 operations
procedures. Experiments then consisted of the following:
1) Characterization of RHEPP-1 ion beam operation with deuterium gas injection. This
was expected to be straightforward, as deuterium gas is in principle no different from
hydrogen or any number of other gases used in RHEPP-1 to make ion beams. The
principle diagnostics used include corrected diode voltage and current, and an array
of Faraday cups (FCups) to measure local ion current density. By placing the FCups
at a considerable distance (up to 70 cm), time-of-flight (TOF) measurements can
determine the beam composition to confirm the existence and purity of the resultant
deuterium beam.
11
2) Nuclear activation to to measure local ion current, as a comparison with the FCup
measurements. The activation sample took the form of ‘peppershakers’, i.e. a small
activation sample placed inside a canister with an aperture hole. The purpose of this
geometry is contain as much material as possible which might be ablated by the ion
beam impingment on the activation surface. The peppershakers fielded were
borrowed from the Hermes LDRD project. Boron Nitride (BN) activation samples
were fielded, and data recorded from several beam experiments confirmed values of
ion fluence that are consistent with that measured using the FCup array.
3) Neutron generation and characterization. Several arrays of target material were placed
in the beam path. Neutron activation was measured by a Beryllium detector, which is
an in-situ activation diagnostic utilizing the 9Be(n,α)6He reaction (t1/2 = 807 msec) to
determine the neutron fluence on the detector from which a total yield can be
calculated. Total neutron yield into 4pi was determined for the following target array
materials: BN, ErD2, CD2, and vanadium.
Section 2 below begins with a short description of the RHEPP-I ion beam and the geometry for
the deuterium experiments, followed by a detailed discussion of the three points listed above in
Section 3.
2. DESCRIPTION OF RHEPP-1 AND EXPERIMENT SETUP The RHEPP-1 pulsed ion beam facility is located in the Bldg. 970 Medium Bay at Sandia
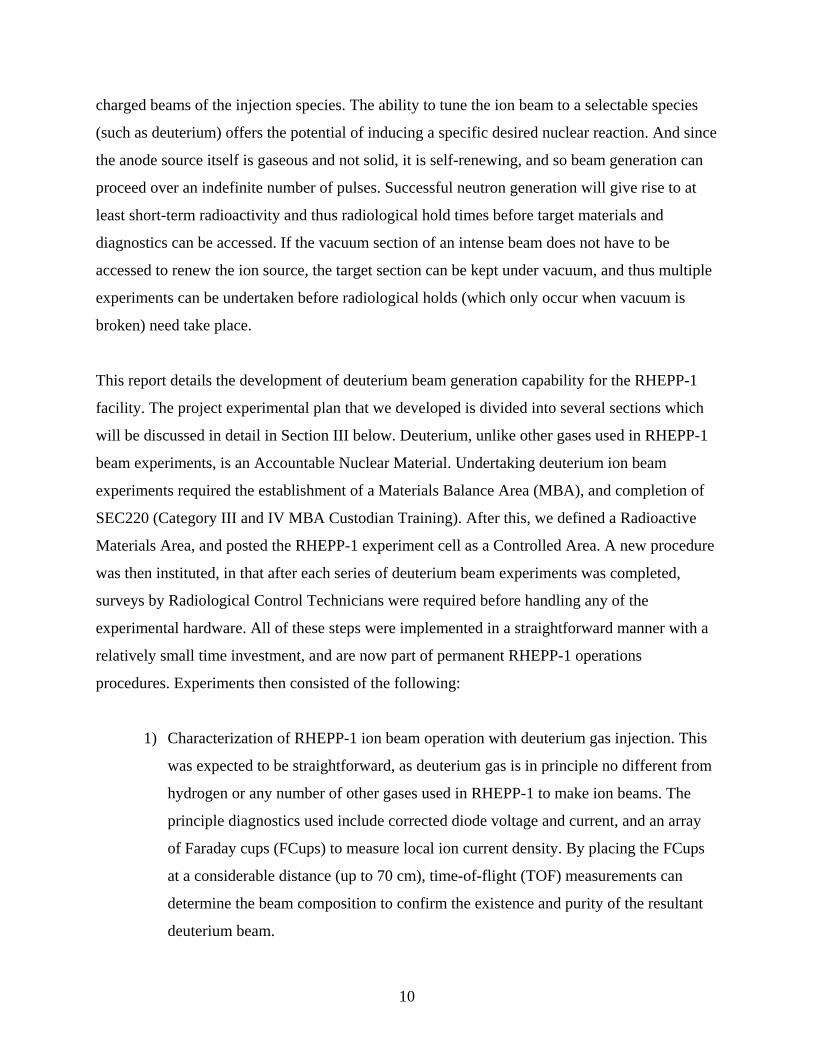
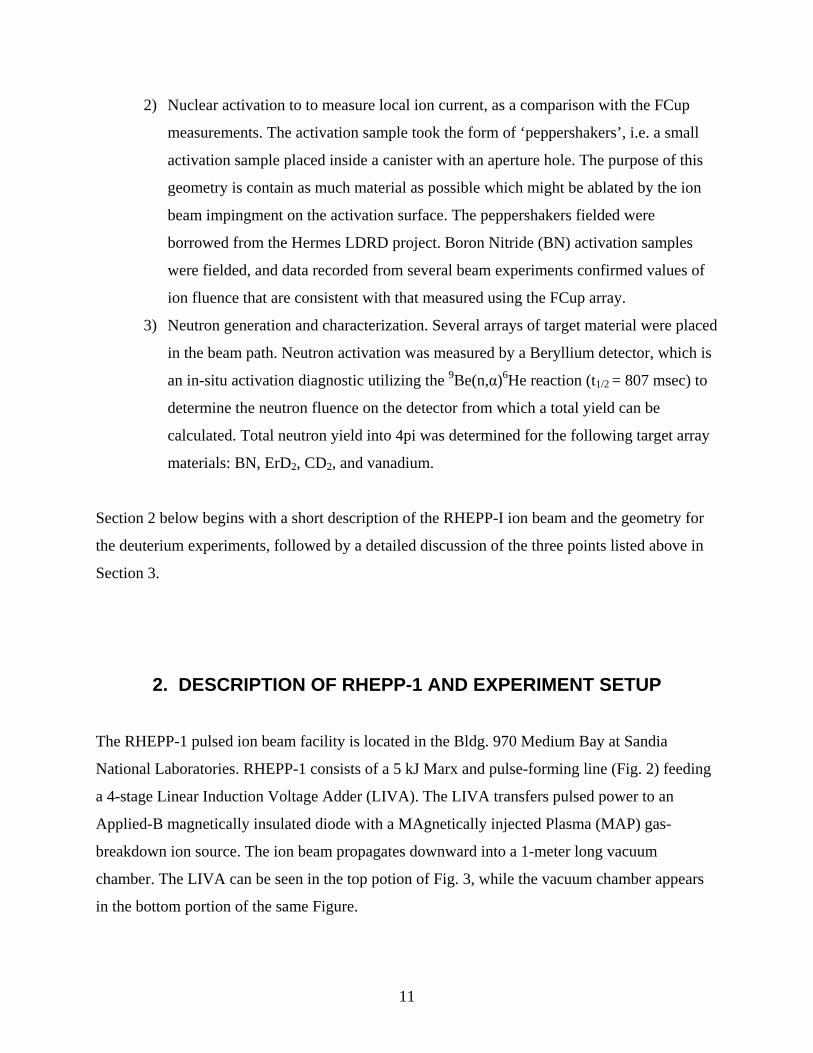
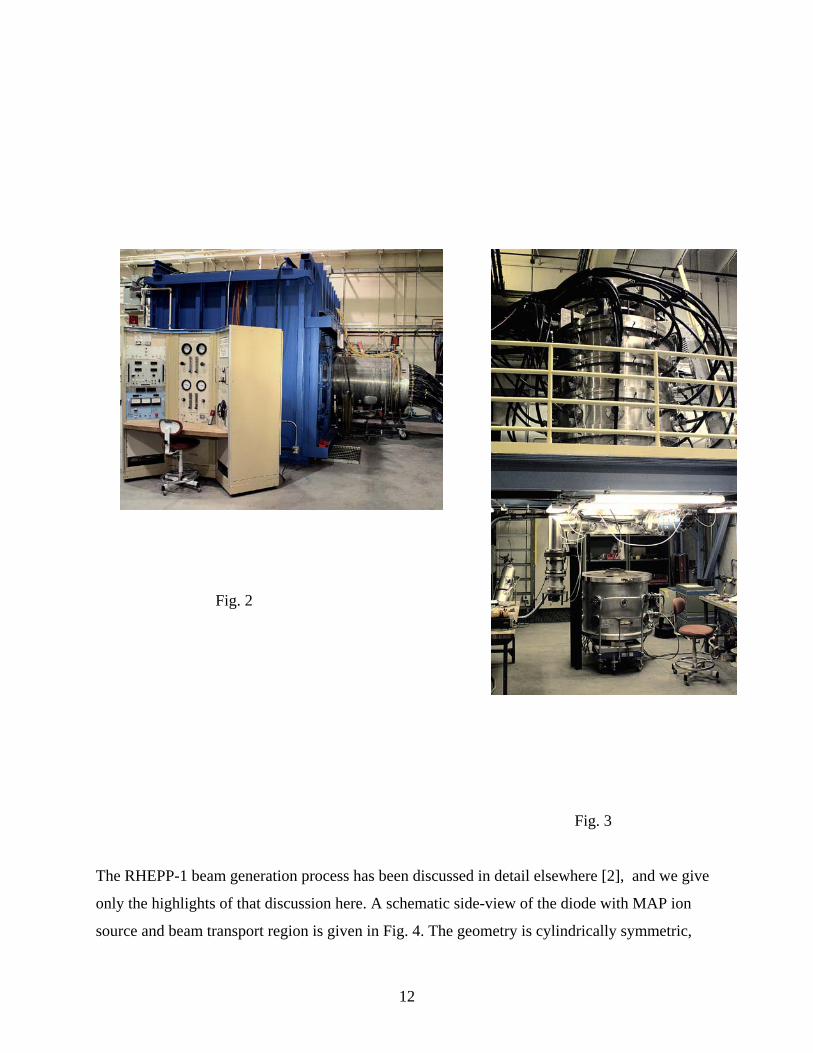
National Laboratories. RHEPP-1 consists of a 5 kJ Marx and pulse-forming line (Fig. 2) feeding
a 4-stage Linear Induction Voltage Adder (LIVA). The LIVA transfers pulsed power to an
Applied-B magnetically insulated diode with a MAgnetically injected Plasma (MAP) gas-
breakdown ion source. The ion beam propagates downward into a 1-meter long vacuum
chamber. The LIVA can be seen in the top potion of Fig. 3, while the vacuum chamber appears
in the bottom portion of the same Figure.
12
Fig. 2
Fig. 3
The RHEPP-1 beam generation process has been discussed in detail elsewhere [2], and we give
only the highlights of that discussion here. A schematic side-view of the diode with MAP ion
source and beam transport region is given in Fig. 4. The geometry is cylindrically symmetric,
13
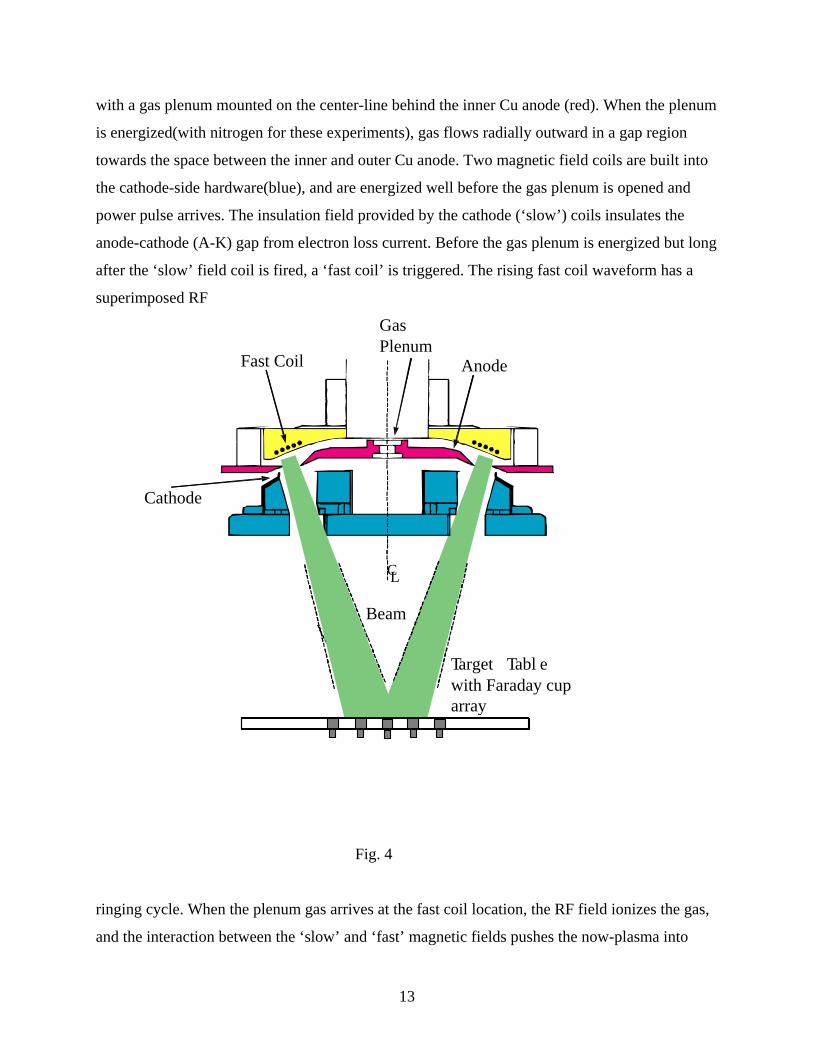
with a gas plenum mounted on the center-line behind the inner Cu anode (red). When the plenum
is energized(with nitrogen for these experiments), gas flows radially outward in a gap region
towards the space between the inner and outer Cu anode. Two magnetic field coils are built into
the cathode-side hardware(blue), and are energized well before the gas plenum is opened and
power pulse arrives. The insulation field provided by the cathode (‘slow’) coils insulates the
anode-cathode (A-K) gap from electron loss current. Before the gas plenum is energized but long
after the ‘slow’ field coil is fired, a ‘fast coil’ is triggered. The rising fast coil waveform has a
superimposed RF
Cathode
Target Tabl ewith Faraday cuparray
AnodeFast Coil
Beam
CL
GasPlenum
Fig. 4
ringing cycle. When the plenum gas arrives at the fast coil location, the RF field ionizes the gas,
and the interaction between the ‘slow’ and ‘fast’ magnetic fields pushes the now-plasma into
14
position for acceleration when the power pulse arrives. The annular-shaped beam is brought to a
soft focus due to the 20 degree pitch in the anode design, and Faraday cups can be mounted in
the focal region to measure the beam fluence. A beam can be generated every 15 seconds.
The RHEPP-1 facility has been used to conduct an extensive array of materials modification
experiments. These include surface modification, surface alloying, thin film formation, and long-
term survivability of candidate first-wall materials for use in future fusion reactors. Additional
details of RHEPP-1 experiments can be found in References 3-6.
3. EXPERIMENTAL RESULTS
3.1. Characterization of ion beam operation with deuterium gas injection A radial array of FCups was installed in the beam path, at a distance of 45 cm from the diode,
and used to monitor the beam current density and composition as a function of time. The FCups
used are of non-biased design, with a built-in permanent magnet, and were spaced 2 cm apart
from a central cup located at the center of the beam focus. The FCup cover is made of tantalum,
with an entrance aperture of 0.060 inch diameter. FCup performance has been validated by
comparison with direct measurements of beam melt duration using target material made of
single-crystal silicon wafers, with the melt duration compared with predictions from a 1-D heat
flow model [7].
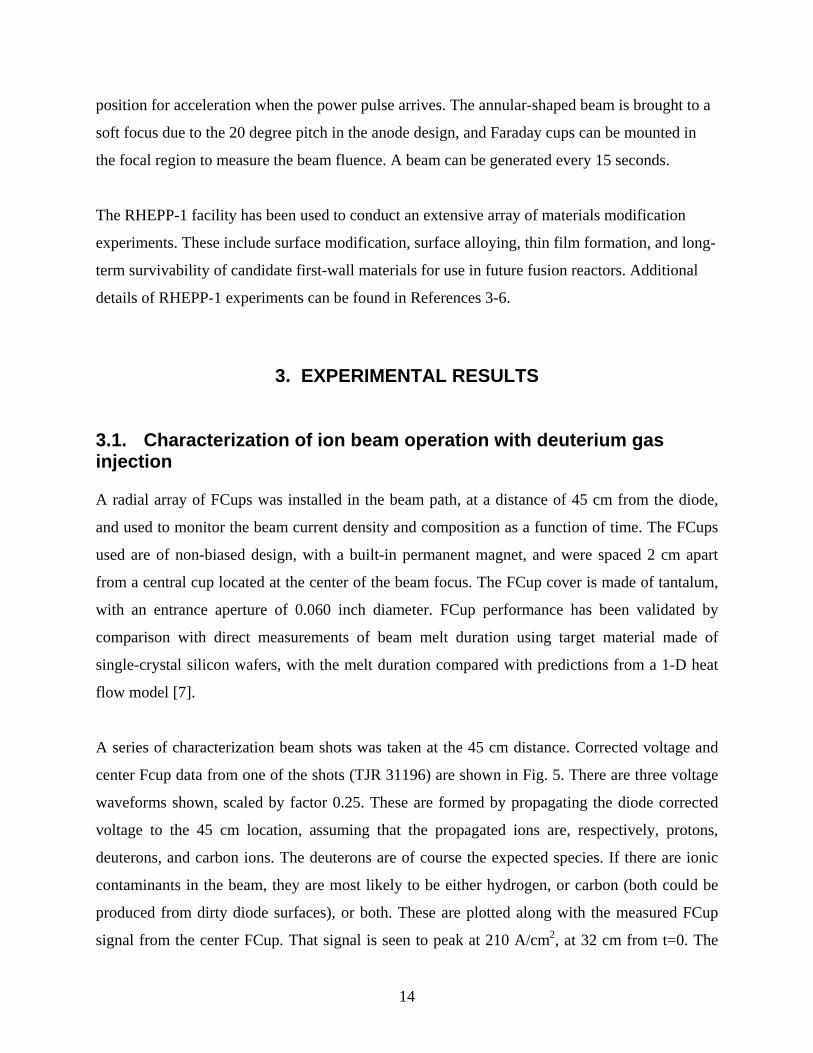
A series of characterization beam shots was taken at the 45 cm distance. Corrected voltage and
center Fcup data from one of the shots (TJR 31196) are shown in Fig. 5. There are three voltage
waveforms shown, scaled by factor 0.25. These are formed by propagating the diode corrected
voltage to the 45 cm location, assuming that the propagated ions are, respectively, protons,
deuterons, and carbon ions. The deuterons are of course the expected species. If there are ionic
contaminants in the beam, they are most likely to be either hydrogen, or carbon (both could be
produced from dirty diode surfaces), or both. These are plotted along with the measured FCup
signal from the center FCup. That signal is seen to peak at 210 A/cm2, at 32 cm from t=0. The
15
t=0 reference point is defined by the theoretical arrival of any protons in the beam. There is then
a 16 nsec delay to expected deuteron arrival, and a further delay of a total 90 nsec to any carbon
0
50
100
150
200
250
300
0 50 100 150 200
Voltage/4 - ProtonsVoltage/4 - DEUTERONSVoltage/4 - CarbonCenter FCup
Time (ns)
Cor
rect
ed D
iode
Vol
tage
(kV
/4)
or
Cur
rent
Den
sity
A/c
m2
Fig. 5. Propagated corrected voltage and Center Fcup signals, Shot TJR 31196.
ion arrival. As can be seen, there is no FCup signal until after the (blue) expected deuteron
arrival time, and no signal on the FCup in the time between t=0 and the expected deuteron arrival
time. Thus we infer that 1) no protons arrive in the beam, and 2) there is a 15 nsec turn-on delay
before the deuterons arrive, over and above the time to the beginning of the deuteron voltage.
The FCup signal then drops quickly past its 210 A/cm2 peak, reaches a second smaller local
maximum, and decreases steadily thereafter (after t=75 nsec), including during the time that any
carbon component would arrive. In the absence of more systematic beam ion composition study
such as would be afforded by Thomson Parabola analysis, we take this as conclusive evidence
that the beam produced by deuterium gas injection into the RHEPP-1 MAP diode is a purely
deuteron beam. The beam energy delivered to the center FCup location was 7.1 J/cm2, which is a
fluence well above that needed to ablate any target material in the beam path. The beam fluence
16
decreases by roughly half for each 2 cm increase in radial position from the center cup. By
adding each azimuthal target area associated with the outer FCups, we can estimate very roughly
that a total of 600 J of beam energy was delivered within a 6 cm radius on this shot. Peak total
beam current is estimated then at 4.8 kA.
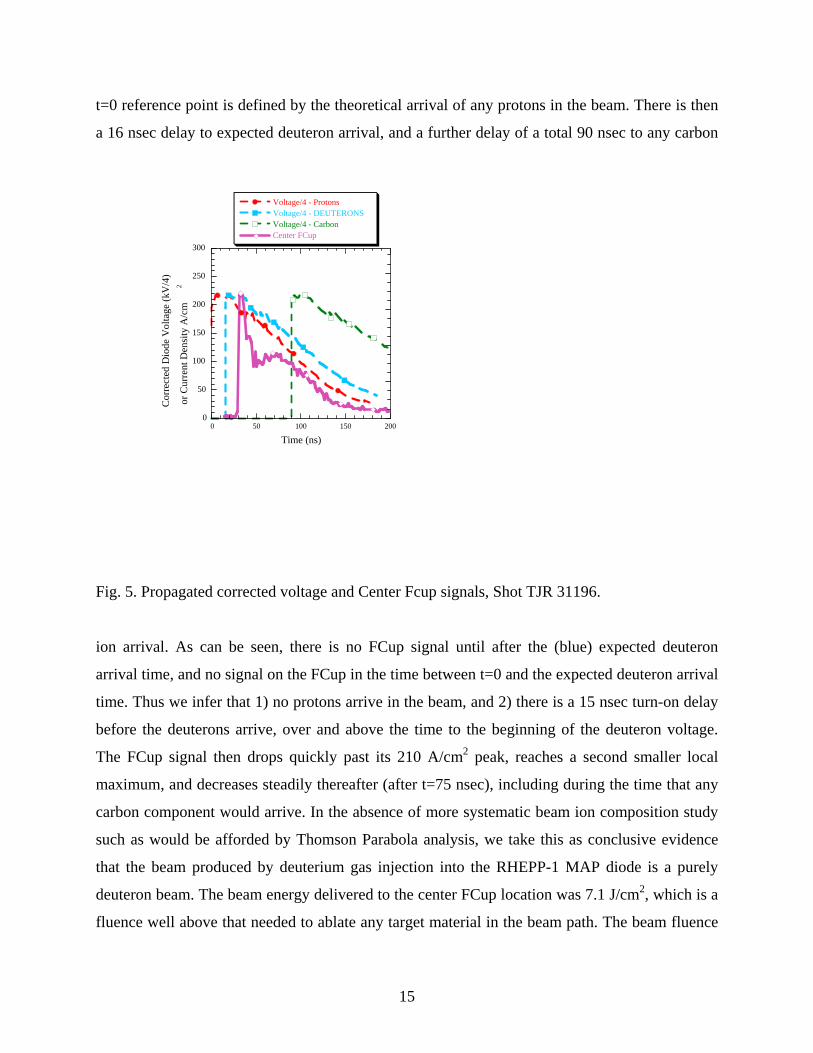
A follow-on beam measurement was taken, in which the diode-FCup distance was increased
from 45 to 70 cm, and the diode operated with more then normal gas fill, so as to produce a
decreased output voltage. The resultant beam data analagous to those shown in Fig. 5 are shown
in Fig. 6.
0
50
100
150
200
250
300
350
400
0 50 100 150 200 250 300 350 400
Voltage (kV) - propagated protonsVoltage (kV) - propagated deuteronsVoltage (kV) - propagated carbonCenter FCup (scaled)
Time (ns)
Cor
rect
ed D
iode
Vol
tage
(kV
)
or
Cur
rent
Den
sity
A/c
m2
Fig. 6. RHEPP shot TJR31790, with diode-Fcup distance 70 cm.
It is evident that the expected ion arrival times have increased significantly. From t = 0,
deuterium arrival has increased to 33 ns, and carbon to 200 ns. The measured center cup FCup
17
signal begins only after t = 50 ns. The FCup signal is qualitatively similar to that seen in Fig. 5.
After a time delay, the signal rises quickly, decreases and reaches a second local maximum that
appears connected to a local maximum in the deuterium propagated volatge at t = ~ 110 ns. Then
the current decreases steadily, with no features correlated to the arrival of expected carbon ions
at t = 200 ns. This again we conclude that there are no ions other than deuterons in the beam.
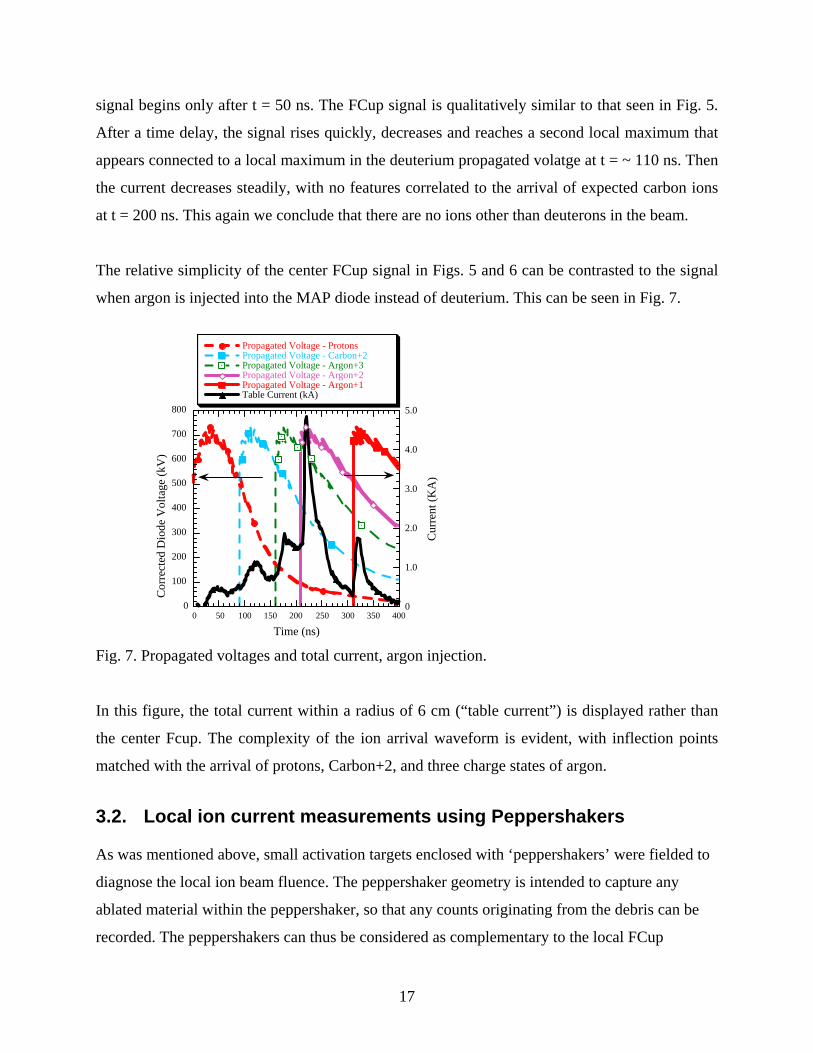
The relative simplicity of the center FCup signal in Figs. 5 and 6 can be contrasted to the signal
when argon is injected into the MAP diode instead of deuterium. This can be seen in Fig. 7.
Fig. 7. Propagated voltages and total current, argon injection.
In this figure, the total current within a radius of 6 cm (“table current”) is displayed rather than
the center Fcup. The complexity of the ion arrival waveform is evident, with inflection points
matched with the arrival of protons, Carbon+2, and three charge states of argon.
3.2. Local ion current measurements using Peppershakers As was mentioned above, small activation targets enclosed with ‘peppershakers’ were fielded to
diagnose the local ion beam fluence. The peppershaker geometry is intended to capture any
ablated material within the peppershaker, so that any counts originating from the debris can be
recorded. The peppershakers can thus be considered as complementary to the local FCup
0
100
200
300
400
500
600
700
800
0 50 100 150 200 250 300 350 400
Propagated Voltage - ProtonsPropagated Voltage - Carbon+2Propagated Voltage - Argon+3Propagated Voltage - Argon+2Propagated Voltage - Argon+1Table Current (kA)
0
1.0
2.0
3.0
4.0
5.0
Time (ns)
Cor
rect
ed D
iode
Vol
tage
(kV
)
Cur
rent
(K
A)
18
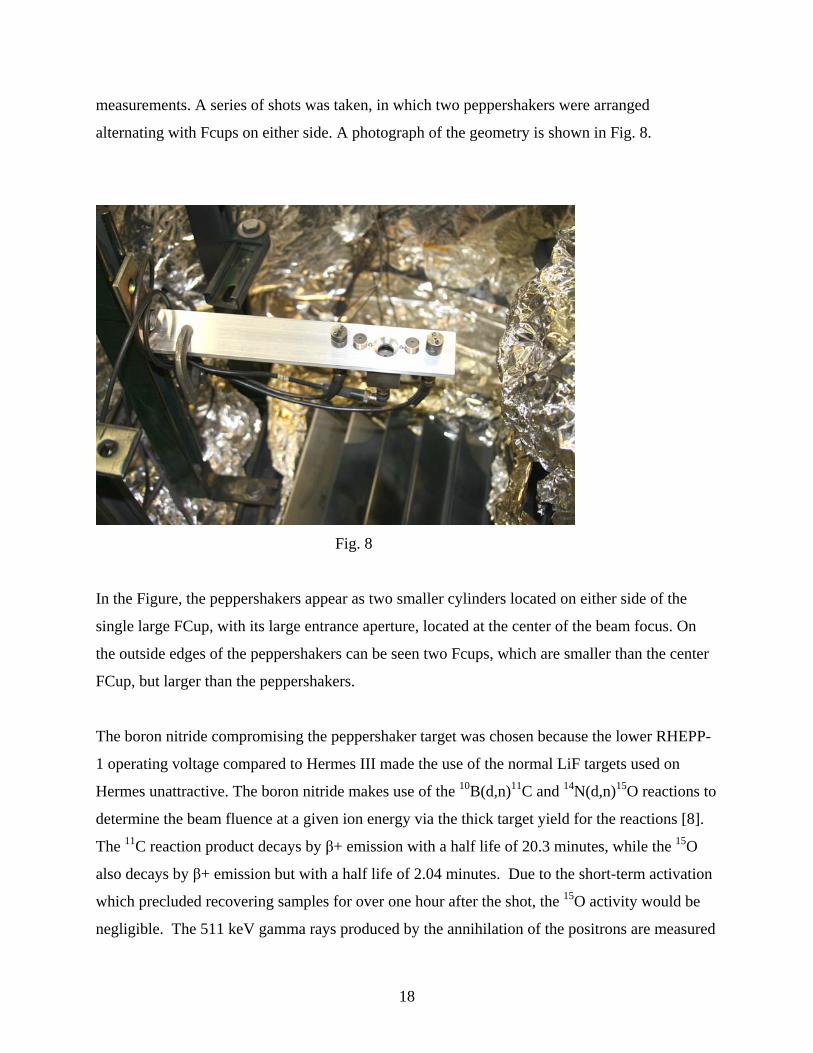
measurements. A series of shots was taken, in which two peppershakers were arranged
alternating with Fcups on either side. A photograph of the geometry is shown in Fig. 8.
Fig. 8
In the Figure, the peppershakers appear as two smaller cylinders located on either side of the
single large FCup, with its large entrance aperture, located at the center of the beam focus. On
the outside edges of the peppershakers can be seen two Fcups, which are smaller than the center
FCup, but larger than the peppershakers.
The boron nitride compromising the peppershaker target was chosen because the lower RHEPP-
1 operating voltage compared to Hermes III made the use of the normal LiF targets used on
Hermes unattractive. The boron nitride makes use of the 10B(d,n)11C and 14N(d,n)15O reactions to
determine the beam fluence at a given ion energy via the thick target yield for the reactions [8].
The 11C reaction product decays by β+ emission with a half life of 20.3 minutes, while the 15O
also decays by β+ emission but with a half life of 2.04 minutes. Due to the short-term activation
which precluded recovering samples for over one hour after the shot, the 15O activity would be
negligible. The 511 keV gamma rays produced by the annihilation of the positrons are measured
19
by a germanium detector and multichannel analyzer, or in a sodium iodide coincidence counting
system coupled to a multichannel scaler. The number of incident ions, Np, can be found from the
product of the initial number of radioactive nuclei produced by the beam, N0, and the thick target
yield, TTY:
Np = N0 / TTY
The thick target yield will be energy dependent, so some knowledge of the beam voltage is
needed to determine the beam fluence. Assuming that the irradiation time is very small
compared to the mean lifetime, the number of events counted by the detector, C, in a time
interval Δt, is given by:
C = ε rb [exp(-λt1) - exp(-λt2)] N0
where t1 is the time after the irradiation pulse when the counting begins, t2 is the time after
irradiation when the counting ends, ε is the counting efficiency of the detector for the relevant
gamma ray energy, rb is the branching ratio and λ is the decay constant for 11C. These relations,
along with the area, A, of the entrance hole in the pepper-shaker, gives the fluence, in ions per
cm2:
Fluence (ions/cm2) = C/(ε x rb x TTY x A x [exp(-λt1) - exp(-λt2)])
= Co/(ε x rb x TTY x A)
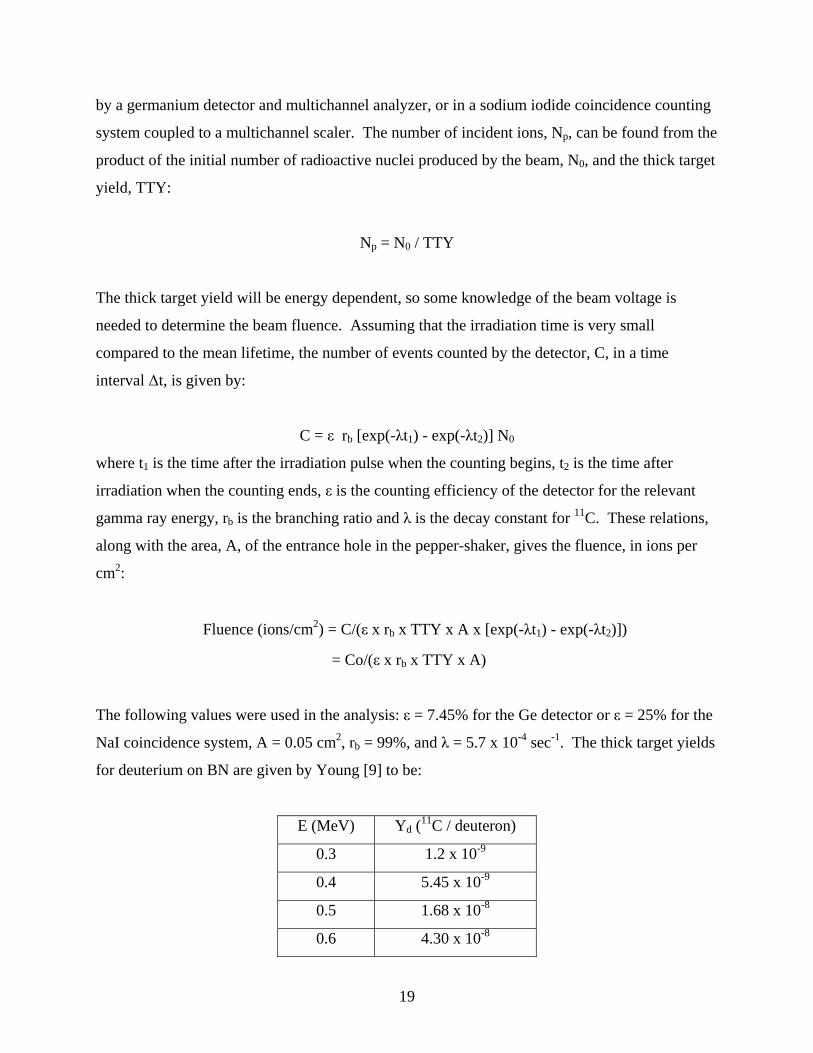
The following values were used in the analysis: ε = 7.45% for the Ge detector or ε = 25% for the
NaI coincidence system, A = 0.05 cm2, rb = 99%, and λ = 5.7 x 10⁻⁴ sec-1. The thick target yields
for deuterium on BN are given by Young [9] to be:
E (MeV) Yd (11C / deuteron)
0.3 1.2 x 10⁻⁹
0.4 5.45 x 10⁻⁹
0.5 1.68 x 10⁻⁸
0.6 4.30 x 10⁻⁸
20
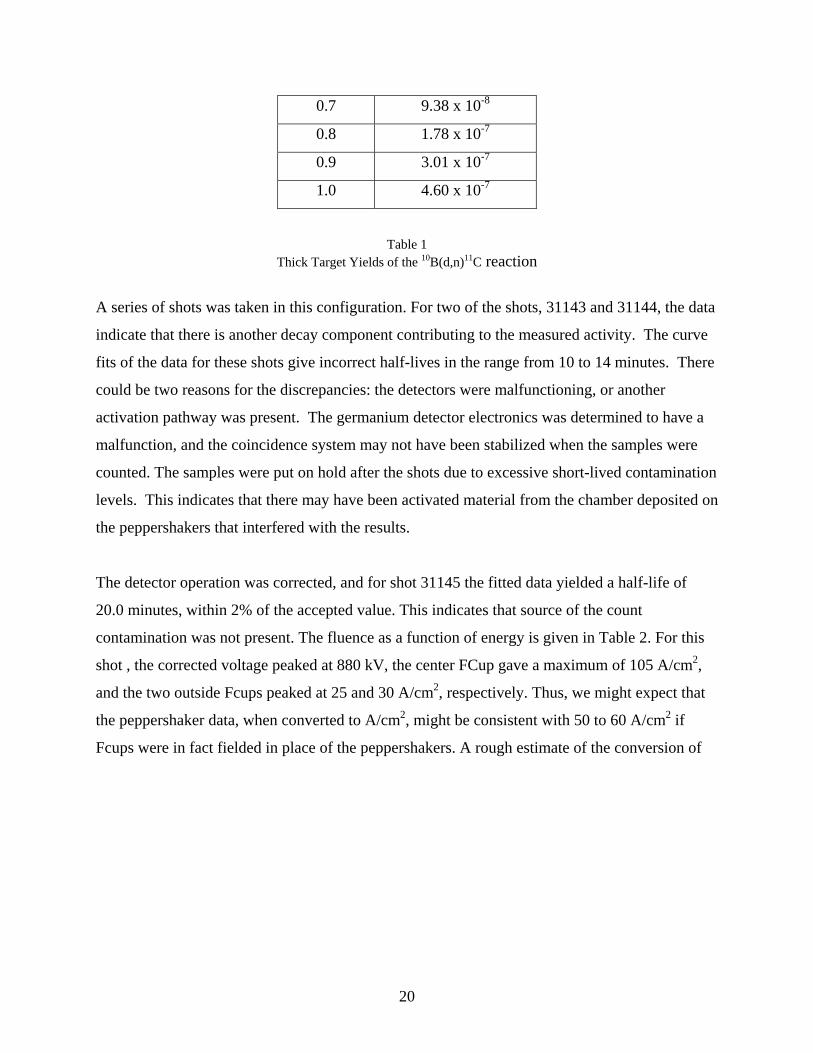
0.7 9.38 x 10⁻⁸
0.8 1.78 x 10⁻⁷
0.9 3.01 x 10⁻⁷
1.0 4.60 x 10⁻⁷
Table 1 Thick Target Yields of the 10B(d,n)11C reaction
A series of shots was taken in this configuration. For two of the shots, 31143 and 31144, the data
indicate that there is another decay component contributing to the measured activity. The curve
fits of the data for these shots give incorrect half-lives in the range from 10 to 14 minutes. There
could be two reasons for the discrepancies: the detectors were malfunctioning, or another
activation pathway was present. The germanium detector electronics was determined to have a
malfunction, and the coincidence system may not have been stabilized when the samples were
counted. The samples were put on hold after the shots due to excessive short-lived contamination
levels. This indicates that there may have been activated material from the chamber deposited on
the peppershakers that interfered with the results.
The detector operation was corrected, and for shot 31145 the fitted data yielded a half-life of
20.0 minutes, within 2% of the accepted value. This indicates that source of the count
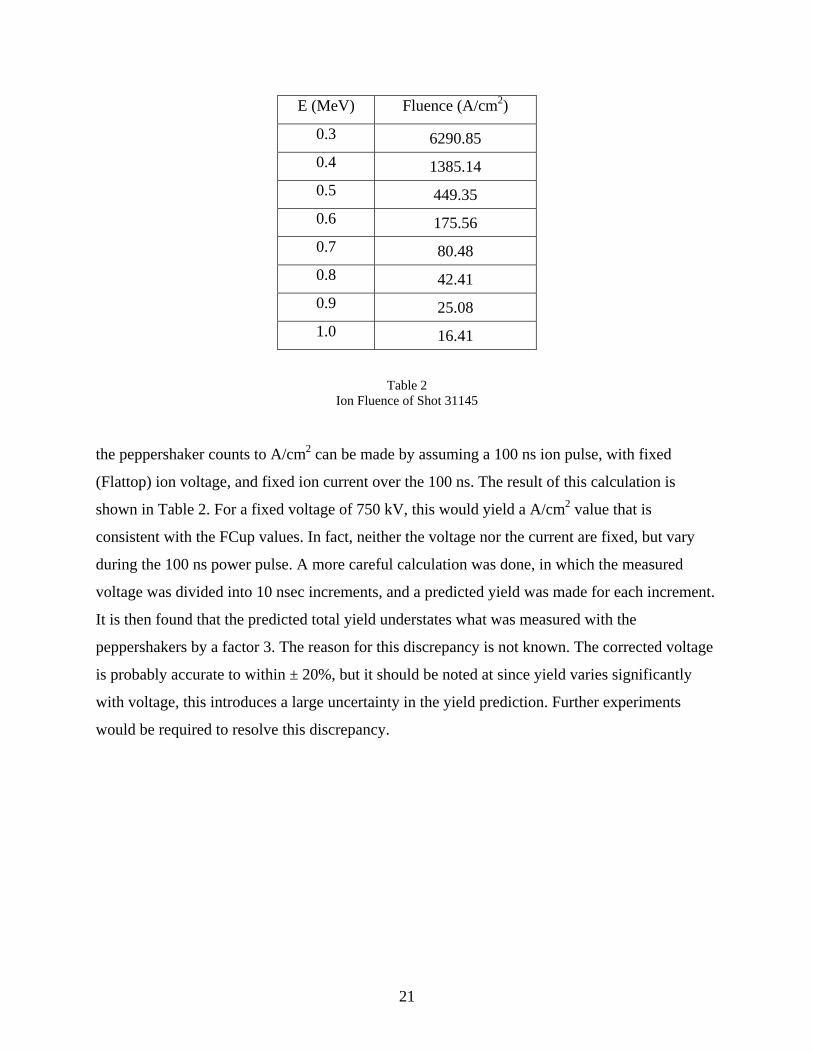
contamination was not present. The fluence as a function of energy is given in Table 2. For this
shot , the corrected voltage peaked at 880 kV, the center FCup gave a maximum of 105 A/cm2,
and the two outside Fcups peaked at 25 and 30 A/cm2, respectively. Thus, we might expect that
the peppershaker data, when converted to A/cm2, might be consistent with 50 to 60 A/cm2 if
Fcups were in fact fielded in place of the peppershakers. A rough estimate of the conversion of
21
E (MeV) Fluence (A/cm2)
0.3 6290.85
0.4 1385.14
0.5 449.35
0.6 175.56
0.7 80.48
0.8 42.41
0.9 25.08
1.0 16.41
Table 2 Ion Fluence of Shot 31145
the peppershaker counts to A/cm2 can be made by assuming a 100 ns ion pulse, with fixed
(Flattop) ion voltage, and fixed ion current over the 100 ns. The result of this calculation is
shown in Table 2. For a fixed voltage of 750 kV, this would yield a A/cm2 value that is
consistent with the FCup values. In fact, neither the voltage nor the current are fixed, but vary
during the 100 ns power pulse. A more careful calculation was done, in which the measured
voltage was divided into 10 nsec increments, and a predicted yield was made for each increment.
It is then found that the predicted total yield understates what was measured with the
peppershakers by a factor 3. The reason for this discrepancy is not known. The corrected voltage
is probably accurate to within ± 20%, but it should be noted at since yield varies significantly
with voltage, this introduces a large uncertainty in the yield prediction. Further experiments
would be required to resolve this discrepancy.
22
3.3. Neutron generation and characterization using deuterium ion beams and distributed large-area targets For this series of experiments, the peppershaker arrays were replaced by distributed targets
meant to generate neutron bursts when struck by the deuteron beam. In each case, the target
material was in the form of small pieces that were assembled around several Fcups which were
present to record local ion fluences. In some of the cases below, the Fcup apertures were partially
blocked by the target material. During the repeated ion beam shots applied to the target surface,
visible damage was observed to accumulate. Although it is possible that the loss of surface
material may have affected the ability of the target to generate neutrons, we did not take this into
consideration in the data below, as our anecdotal experience during the experiments did not lead
us to believe that there was a systematic drop in neutron output with the number of beam shots.
We begin first by describing the beryllium detector.
Beryllium Detector
The Be detector is an in situ activation diagnostic that utilizes the 9Be(n,α)6He reaction
(t1/2 = 807 msec) to determine the neutron fluence on the detector from which a total yield can be
calculated. The detector consists of 13 beryllium rods encased in BC-418 scintillator that is
coupled to a Hamamatsu R5946 photomultiplier tube (PMT) which is configured for photon
counting. The 6He decays through β- decay, emitting electrons with an end-point energy of 3.51
MeV. The electrons interact with the scintillator producing light which is detected by the PMT.
The output of the PMT is fed through a constant fraction discriminator to a multi-channel scaler
and software that records the signal pulses versus time. From this data the decay curve is
generated which is then fitted using an IDL routine to an equation with the form
A(t) = A0 exp(-λt)
This detector was cross calibrated using the dense plasma focus (DPF) at National Securities
Technologies in North Las Vegas, NV which produces 2.45 MeV neutrons via the D-D fusion
reaction. Taking into account the distance of the detector from the DPF source, a calibration
factor was determined. To determine the total yield of the RHEPP shots, the value of A0 from
the curve fit is multiplied by the calibration factor and the square of the distance (in cm) from the
23
detector to the center of the deuterium beam. The detector was fielded either at the side or at the
bottom of the RHEPP vacuum chamber.
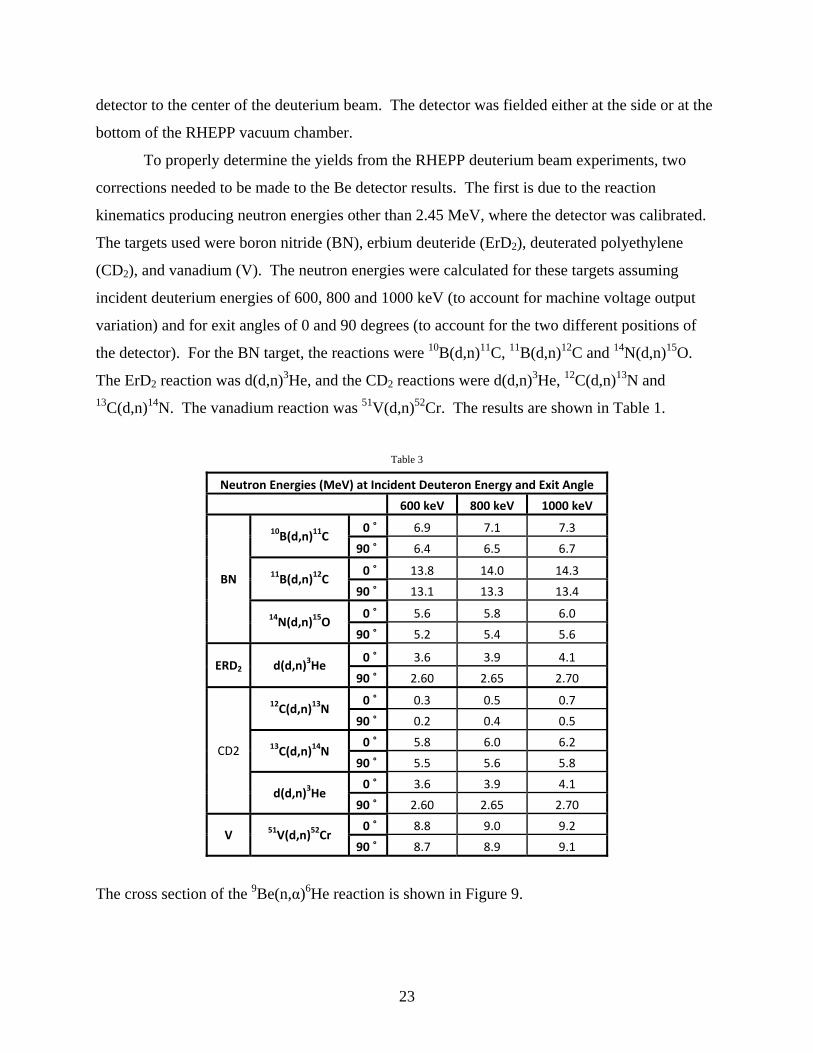
To properly determine the yields from the RHEPP deuterium beam experiments, two
corrections needed to be made to the Be detector results. The first is due to the reaction
kinematics producing neutron energies other than 2.45 MeV, where the detector was calibrated.
The targets used were boron nitride (BN), erbium deuteride (ErD2), deuterated polyethylene
(CD2), and vanadium (V). The neutron energies were calculated for these targets assuming
incident deuterium energies of 600, 800 and 1000 keV (to account for machine voltage output
variation) and for exit angles of 0 and 90 degrees (to account for the two different positions of
the detector). For the BN target, the reactions were 10B(d,n)11C, 11B(d,n)12C and 14N(d,n)15O.
The ErD2 reaction was d(d,n)3He, and the CD2 reactions were d(d,n)3He, 12C(d,n)13N and 13C(d,n)14N. The vanadium reaction was 51V(d,n)52Cr. The results are shown in Table 1.
Table 3
Neutron Energies (MeV) at Incident Deuteron Energy and Exit Angle
600 keV 800 keV 1000 keV
BN
10B(d,n)11C 0 ˚ 6.9 7.1 7.3
90 ˚ 6.4 6.5 6.7
11B(d,n)12C 0 ˚ 13.8 14.0 14.3
90 ˚ 13.1 13.3 13.4
14N(d,n)15O 0 ˚ 5.6 5.8 6.0
90 ˚ 5.2 5.4 5.6
ERD2 d(d,n)3He 0 ˚ 3.6 3.9 4.1
90 ˚ 2.60 2.65 2.70
CD2
12C(d,n)13N 0 ˚ 0.3 0.5 0.7
90 ˚ 0.2 0.4 0.5
13C(d,n)14N 0 ˚ 5.8 6.0 6.2
90 ˚ 5.5 5.6 5.8
d(d,n)3He 0 ˚ 3.6 3.9 4.1
90 ˚ 2.60 2.65 2.70
V 51V(d,n)52Cr 0 ˚ 8.8 9.0 9.2
90 ˚ 8.7 8.9 9.1
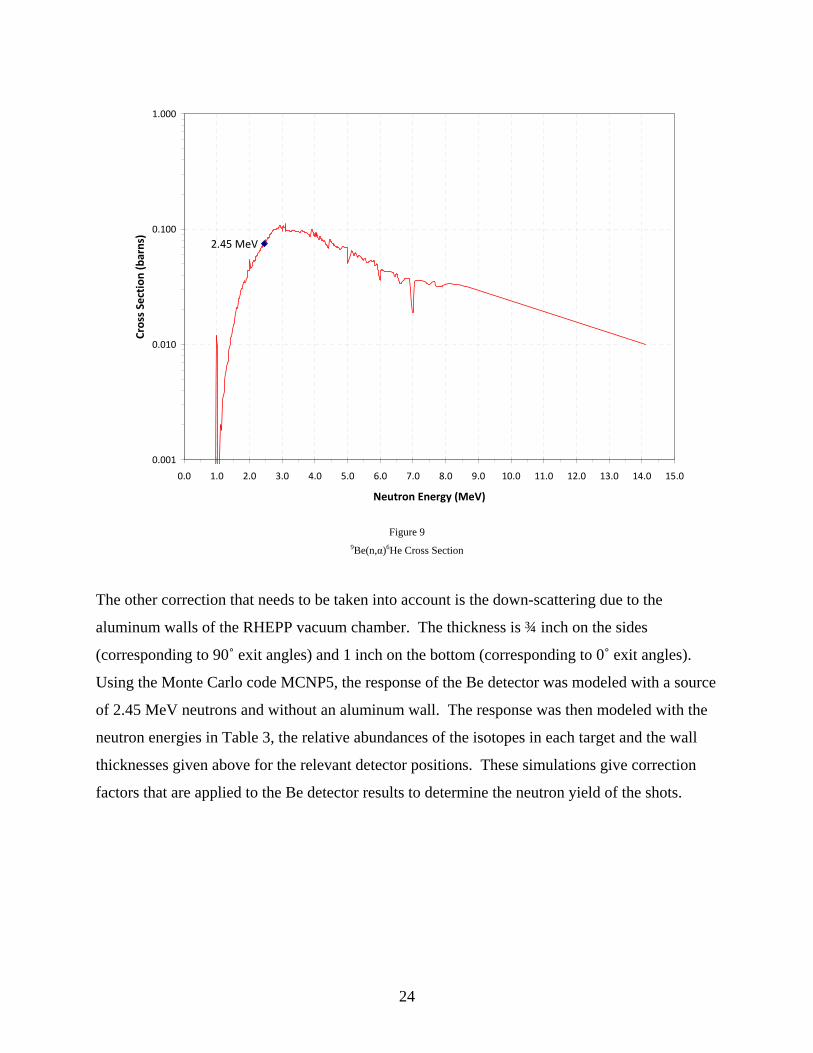
The cross section of the 9Be(n,α)6He reaction is shown in Figure 9.
24
2.45 MeV
0.001
0.010
0.100
1.000
0.0 1.0 2.0 3.0 4.0 5.0 6.0 7.0 8.0 9.0 10.0 11.0 12.0 13.0 14.0 15.0
Neutron Energy (MeV)
Cross Section (barns)
Figure 9
9Be(n,α)6He Cross Section
The other correction that needs to be taken into account is the down-scattering due to the
aluminum walls of the RHEPP vacuum chamber. The thickness is ¾ inch on the sides
(corresponding to 90˚ exit angles) and 1 inch on the bottom (corresponding to 0˚ exit angles).
Using the Monte Carlo code MCNP5, the response of the Be detector was modeled with a source
of 2.45 MeV neutrons and without an aluminum wall. The response was then modeled with the
neutron energies in Table 3, the relative abundances of the isotopes in each target and the wall
thicknesses given above for the relevant detector positions. These simulations give correction
factors that are applied to the Be detector results to determine the neutron yield of the shots.
25
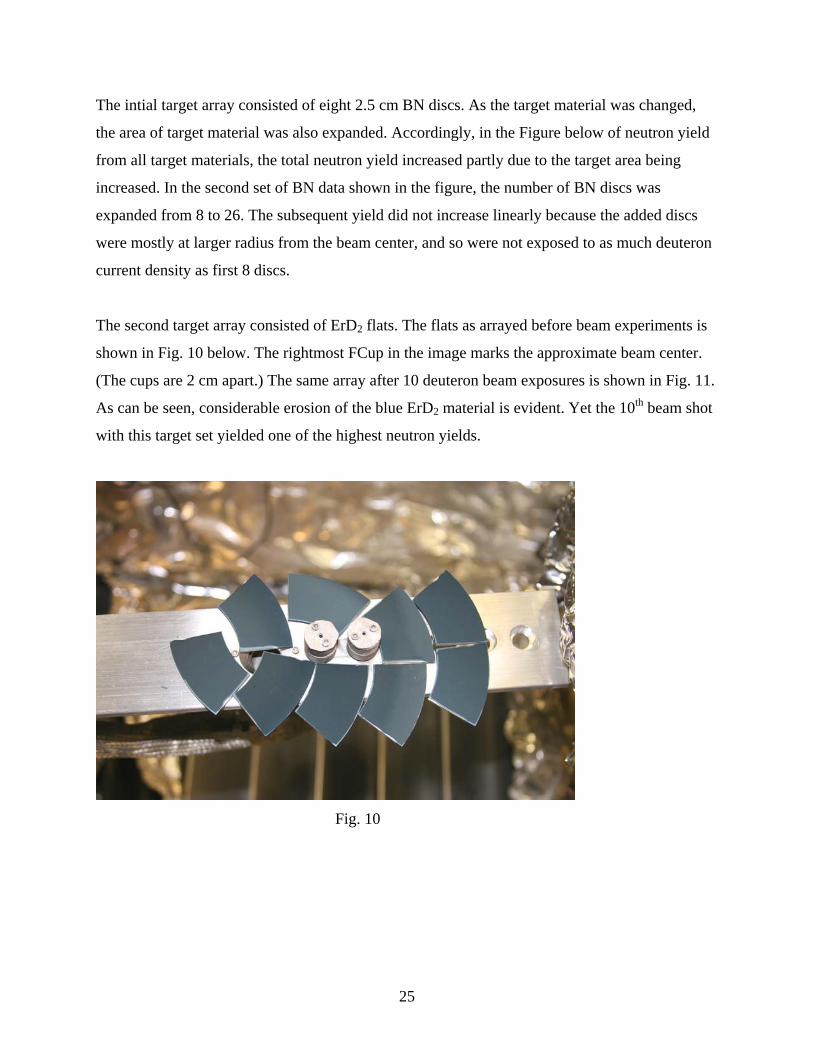
The intial target array consisted of eight 2.5 cm BN discs. As the target material was changed,
the area of target material was also expanded. Accordingly, in the Figure below of neutron yield
from all target materials, the total neutron yield increased partly due to the target area being
increased. In the second set of BN data shown in the figure, the number of BN discs was
expanded from 8 to 26. The subsequent yield did not increase linearly because the added discs
were mostly at larger radius from the beam center, and so were not exposed to as much deuteron
current density as first 8 discs.
The second target array consisted of ErD2 flats. The flats as arrayed before beam experiments is
shown in Fig. 10 below. The rightmost FCup in the image marks the approximate beam center.
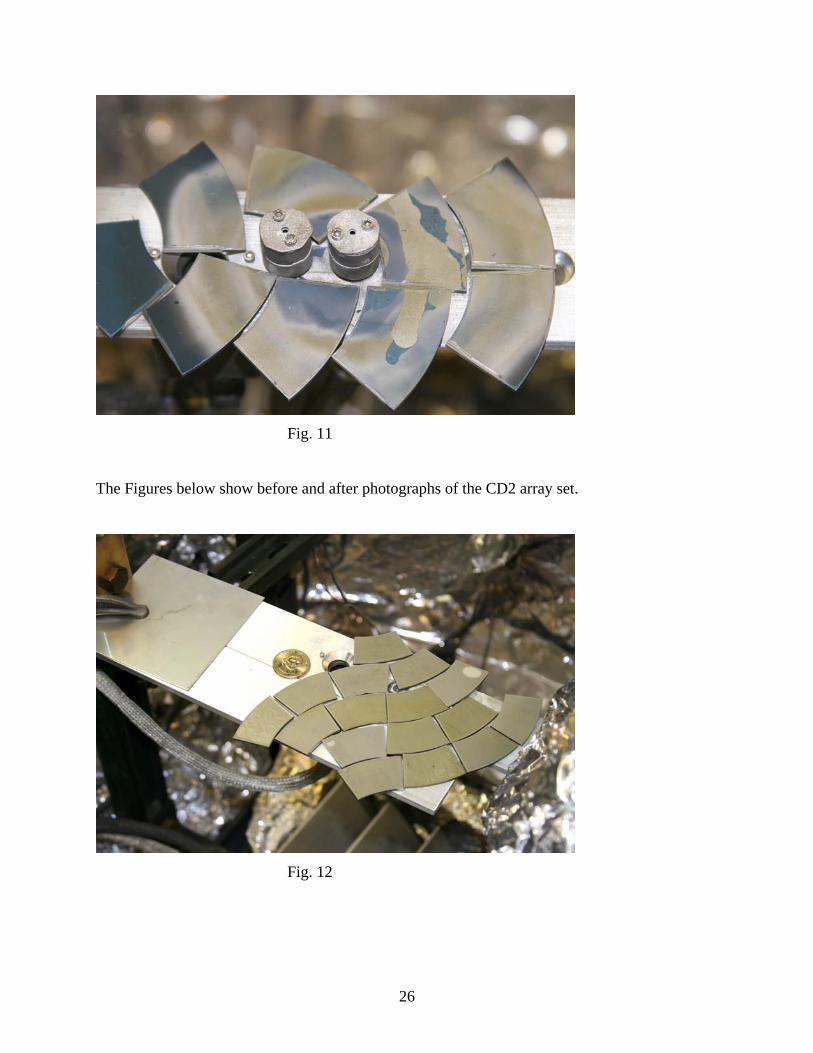
(The cups are 2 cm apart.) The same array after 10 deuteron beam exposures is shown in Fig. 11.
As can be seen, considerable erosion of the blue ErD2 material is evident. Yet the 10th beam shot
with this target set yielded one of the highest neutron yields.
Fig. 10
26
Fig. 11
The Figures below show before and after photographs of the CD2 array set.
Fig. 12
27
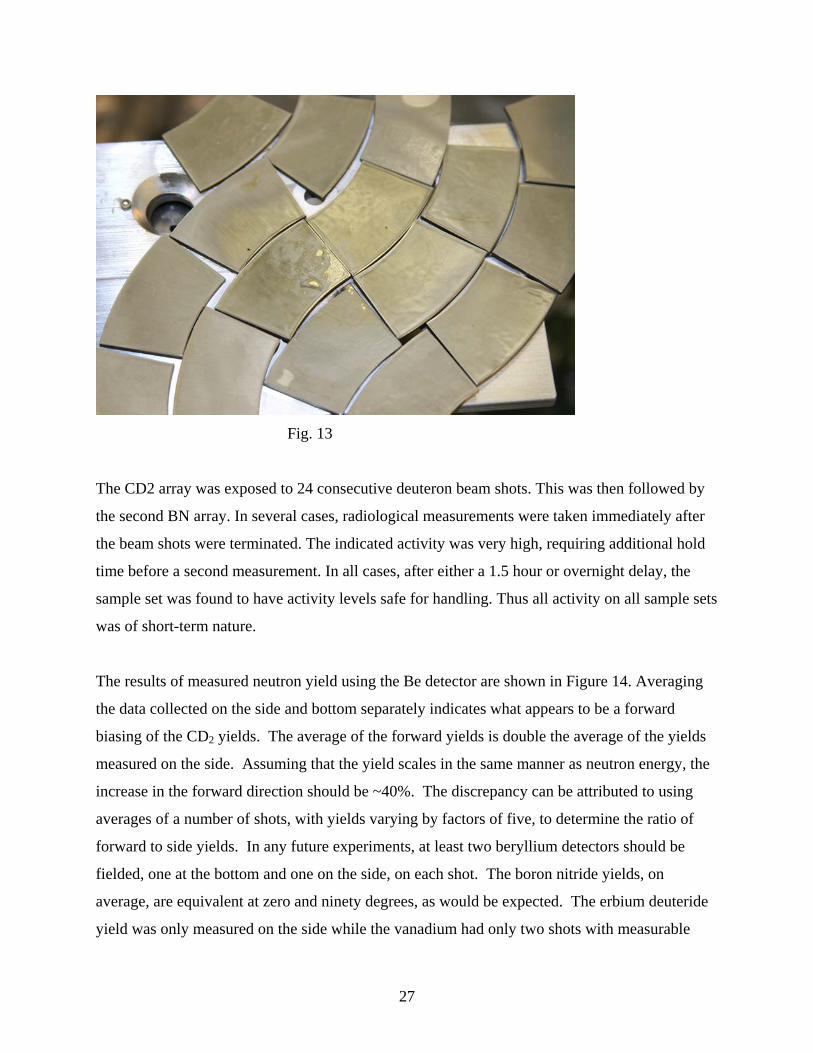
Fig. 13
The CD2 array was exposed to 24 consecutive deuteron beam shots. This was then followed by
the second BN array. In several cases, radiological measurements were taken immediately after
the beam shots were terminated. The indicated activity was very high, requiring additional hold
time before a second measurement. In all cases, after either a 1.5 hour or overnight delay, the
sample set was found to have activity levels safe for handling. Thus all activity on all sample sets
was of short-term nature.
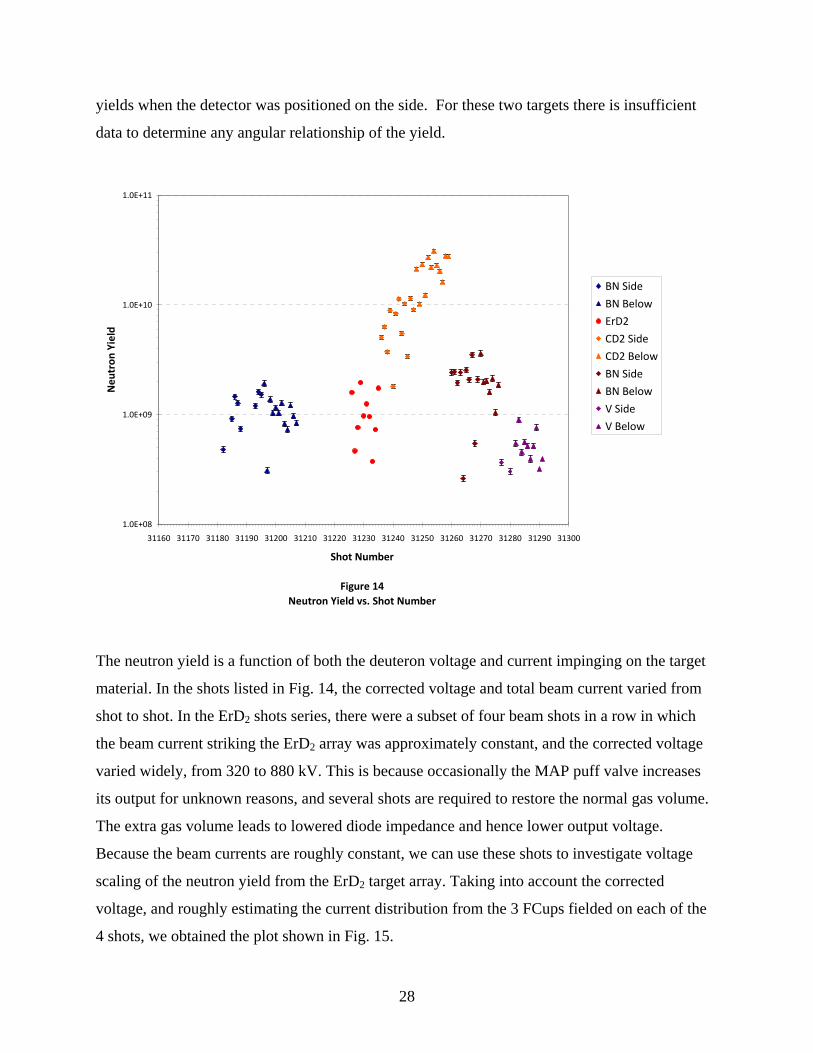
The results of measured neutron yield using the Be detector are shown in Figure 14. Averaging
the data collected on the side and bottom separately indicates what appears to be a forward
biasing of the CD2 yields. The average of the forward yields is double the average of the yields
measured on the side. Assuming that the yield scales in the same manner as neutron energy, the
increase in the forward direction should be ~40%. The discrepancy can be attributed to using
averages of a number of shots, with yields varying by factors of five, to determine the ratio of
forward to side yields. In any future experiments, at least two beryllium detectors should be
fielded, one at the bottom and one on the side, on each shot. The boron nitride yields, on
average, are equivalent at zero and ninety degrees, as would be expected. The erbium deuteride
yield was only measured on the side while the vanadium had only two shots with measurable
28
yields when the detector was positioned on the side. For these two targets there is insufficient
data to determine any angular relationship of the yield.
1.0E+08
1.0E+09
1.0E+10
1.0E+11
31160 31170 31180 31190 31200 31210 31220 31230 31240 31250 31260 31270 31280 31290 31300
Shot Number
Figure 14
Neutron Yield vs. Shot Number
Neutron Yield
BN Side
BN Below
ErD2
CD2 Side
CD2 Below
BN Side
BN Below
V Side
V Below
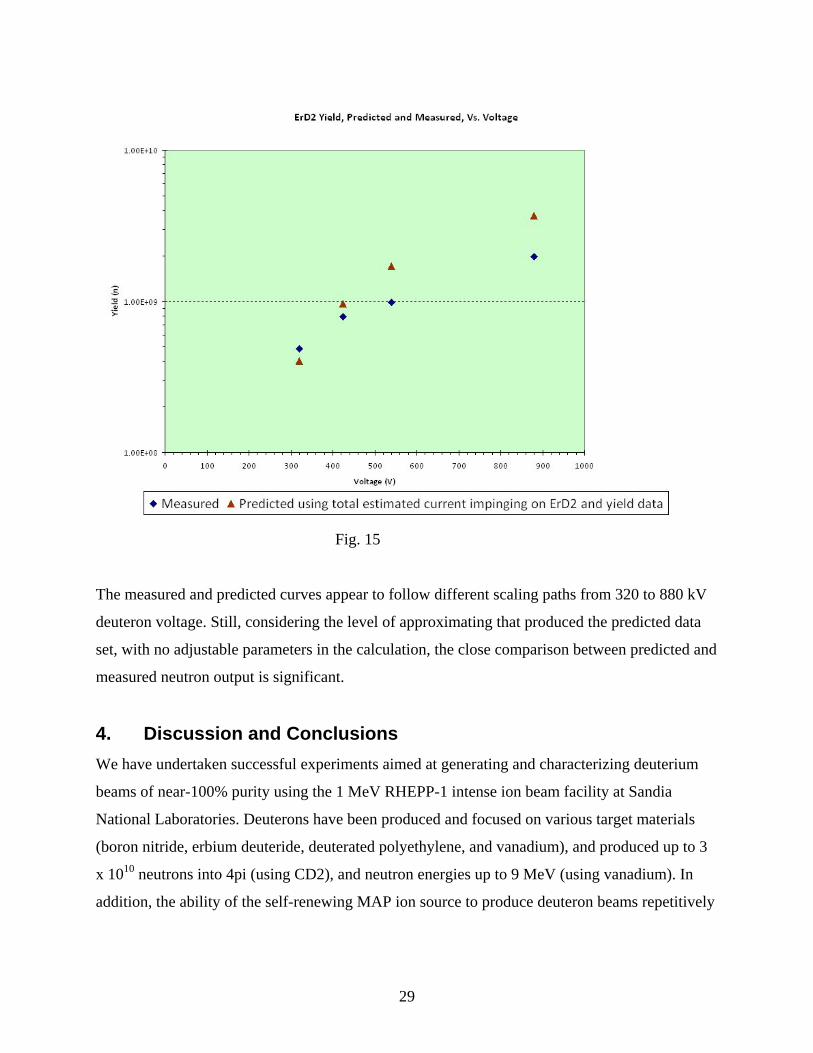
The neutron yield is a function of both the deuteron voltage and current impinging on the target
material. In the shots listed in Fig. 14, the corrected voltage and total beam current varied from
shot to shot. In the ErD2 shots series, there were a subset of four beam shots in a row in which
the beam current striking the ErD2 array was approximately constant, and the corrected voltage
varied widely, from 320 to 880 kV. This is because occasionally the MAP puff valve increases
its output for unknown reasons, and several shots are required to restore the normal gas volume.
The extra gas volume leads to lowered diode impedance and hence lower output voltage.
Because the beam currents are roughly constant, we can use these shots to investigate voltage
scaling of the neutron yield from the ErD2 target array. Taking into account the corrected
voltage, and roughly estimating the current distribution from the 3 FCups fielded on each of the
4 shots, we obtained the plot shown in Fig. 15.
29
Fig. 15
The measured and predicted curves appear to follow different scaling paths from 320 to 880 kV
deuteron voltage. Still, considering the level of approximating that produced the predicted data
set, with no adjustable parameters in the calculation, the close comparison between predicted and
measured neutron output is significant.
4. Discussion and Conclusions
We have undertaken successful experiments aimed at generating and characterizing deuterium
beams of near-100% purity using the 1 MeV RHEPP-1 intense ion beam facility at Sandia
National Laboratories. Deuterons have been produced and focused on various target materials
(boron nitride, erbium deuteride, deuterated polyethylene, and vanadium), and produced up to 3
x 1010 neutrons into 4pi (using CD2), and neutron energies up to 9 MeV (using vanadium). In
addition, the ability of the self-renewing MAP ion source to produce deuteron beams repetitively
30
without the need to break vacuum results in the ability to accumulate neutron doses over a large
number of pulses. The beam is well-characterized, and neutron production is consistent with
predictions based upon well-known neutron yields on thick targets.
Such an intense pulsed ion beam-based neutron source has the potential to produce a narrower
and better-characterized neutron spectrum than that typically produced by, for example, thermal
neutrons from fission reactors, or neutrons produced by very high energy ion beams such as
that from the LANSCE facility at Los Alamos National Laboratory. Future experiment plans
include a measurement of the RHEPP-produced neutron spectrum, and the mating of the neutron
productions with neutron detectors of relevance to SNM detection in the field.

31
5. REFERENCES
1. J. P. VanDevender and D. L. Cook, Inertial Confinement Fusion with light ion beams, Science
232, 831-836 (1986). 2. T. J. Renk, P. P. Provencio, S. V. Prasad, A. S. Shlapakovski, A. V. Petrov, K. Yatsui, W.
Jiang, and H. Suematsu, Materials Modification Using Intense Ion Beams, Proc. Of the IEEE 92, 1057-1081 (2004).
3. Y. Fudamoto, T. J. Renk, G. A. Torres, N. Kishimoto, Superconductivity in MgB2 films synthesized by ablation from high-power ion beam, Nucl. Instr. Meth. B – Beam Interactions with Materials & Atoms 250, 320-323 (2006).
4. Timothy J. Renk, Anatoli Shlapakovski, Robert R. Peterson, James P. Blanchard and Carl Martin, Miniconference on use of ion beams for surface modification, new materials synthesis, and materials response, Physics of Plasmas 12, 058302 (2005).
5. Timothy J. Renk, Paula P. Provencio, Paul G. Clem, Somuri Prasad, and Michael O. Thompson, Use of Intense Ion Beams for Surface Modification and Creation of New Materials, SAND2002-4215, printed December 2002.
6. Timothy J. Renk, Paula P. Provencio, S. V. Prasad, T. E. Buchheit, V. Engelko, D. McNulty, T. D. Petersen, and D. W. Petersen, Investigation of the Effects of Intense Pulsed Particle Beams on the Durability of Metal-to-Plastic Interfaces, SAND2005-1080, printed February 2005.
7. M. O. Thompson and T. J. Renk, Numerical modeling and experimental measurements of pulsed ion beam surface treatment, Mat. Res. Soc. Symp. Proc. 504, 33 (1998).
8. G. D. Chambers, G. W. Cooper, M.E. Savage, C. L. Ruiz and F.A Schmidlapp, Calibration of a direct nuclear activation diagnostic which uses boron nitride to measure energetic deuterium ions, Rev. Sci. Instr. 70, 1205-1208 (1999).
9. F. C. Young, J. Golden, and C. A. Kapetanakos, Diagnostics for intense pulsed ion beams, Rev. Sci. Instr. 48, 432-443 (1977).
32
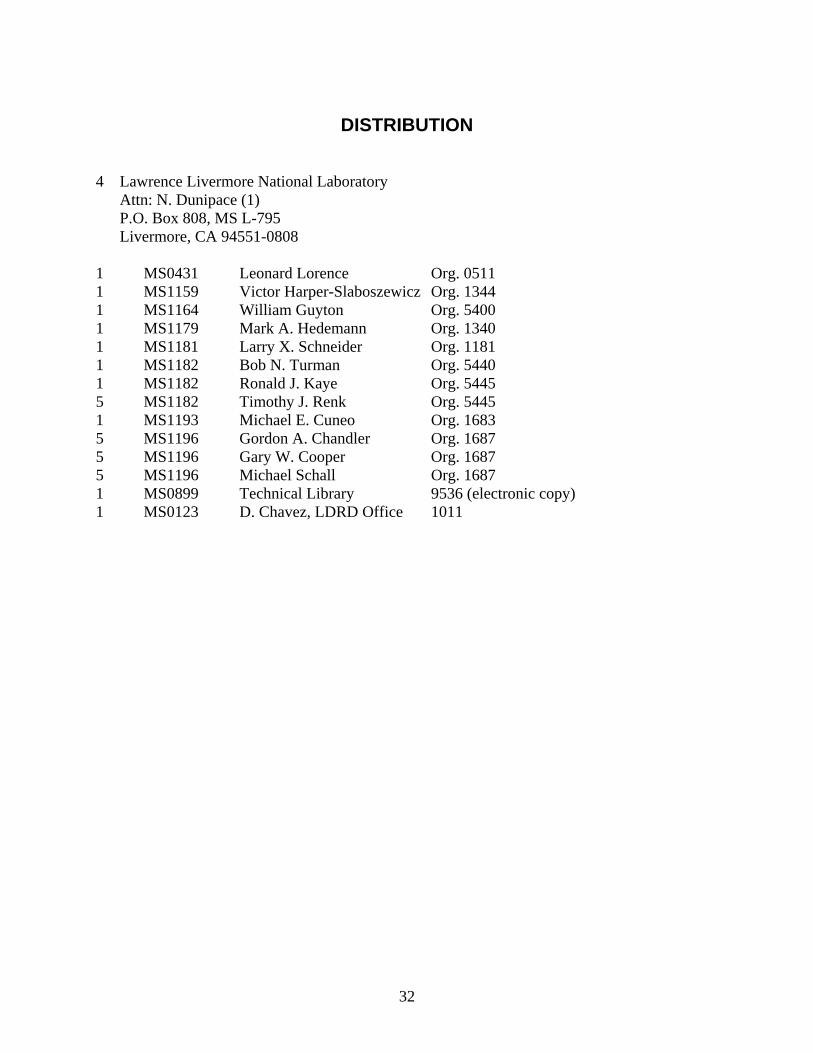
DISTRIBUTION
4 Lawrence Livermore National Laboratory Attn: N. Dunipace (1) P.O. Box 808, MS L-795
Livermore, CA 94551-0808 1 MS0431 Leonard Lorence Org. 0511 1 MS1159 Victor Harper-Slaboszewicz Org. 1344 1 MS1164 William Guyton Org. 5400 1 MS1179 Mark A. Hedemann Org. 1340 1 MS1181 Larry X. Schneider Org. 1181 1 MS1182 Bob N. Turman Org. 5440 1 MS1182 Ronald J. Kaye Org. 5445 5 MS1182 Timothy J. Renk Org. 5445 1 MS1193 Michael E. Cuneo Org. 1683 5 MS1196 Gordon A. Chandler Org. 1687 5 MS1196 Gary W. Cooper Org. 1687 5 MS1196 Michael Schall Org. 1687 1 MS0899 Technical Library 9536 (electronic copy) 1 MS0123 D. Chavez, LDRD Office 1011