Chapter 4 FISH SALTING METHODS -...
30
Chapter 4 FISH SALTING METHODS
Transcript of Chapter 4 FISH SALTING METHODS -...

Chapter 4
FISH SALTING METHODS
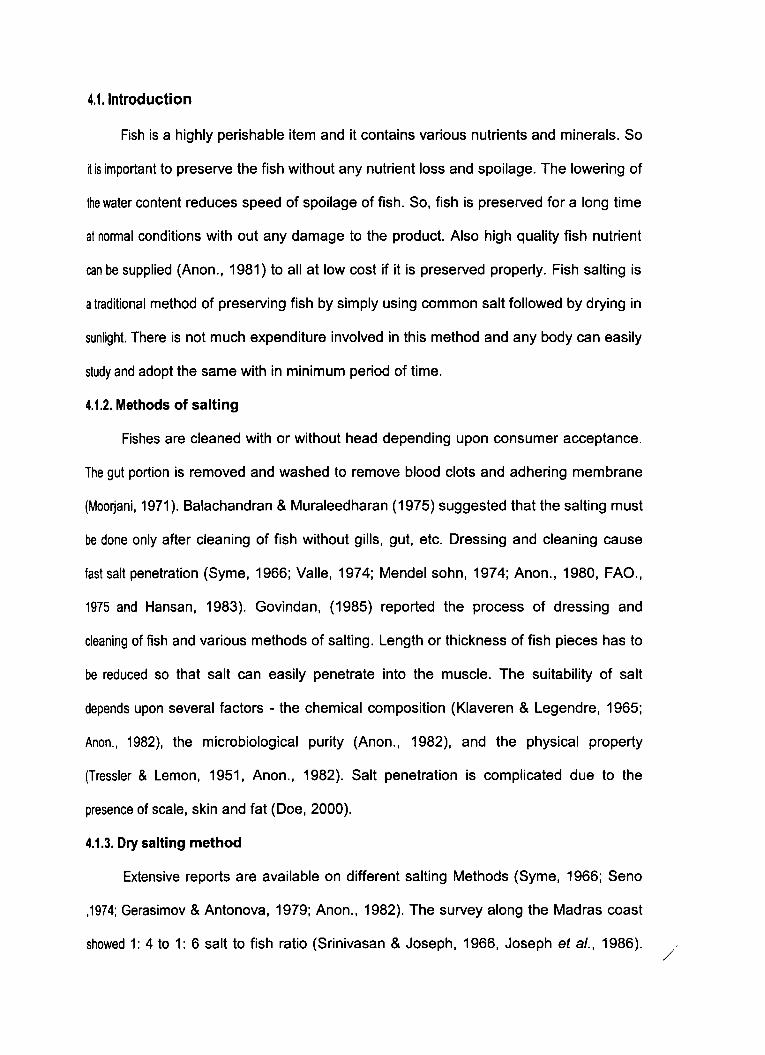
4.1. Introduction
Fish is a highly perishable item and it contains various nutrients and minerals. So
it is important to preserve the fish without any nutrient loss and spoilage. The lowering of
the water content reduces speed of spoilage of fish. So, fish is preserved for a long time
at normal conditions with out any damage to the product. Also high quality fish nutrient
can be supplied (Anon., 1981) to all at low cost if it is preserved properly. Fish salting is
a traditional method of preserving fish by simply using common salt followed by drying in
sunlight. There is not much expenditure involved in this method and any body can easily
study and adopt the same with in minimum period of time.
4.1.2. Methods of salting
Fishes are cleaned with or without head depending upon consumer acceptance.
The gut portion is removed and washed to remove blood clots and adhering membrane
(Moorjani, 1971). Balachandran & Muraleedharan (1975) suggested that the salting must
be done only after cleaning of fish without gills, gut, etc. Dressing and cleaning cause
fast salt penetration (Syme, 1966; Valle, 1974; Mendel sohn, 1974; Anon., 1980, FAO.,
1975 and Hansan, 1983). Govindan, (1985) reported the process of dressing and
cleaning of fish and various methods of salting. Length or thickness of fish pieces has to
be reduced so that salt can easily penetrate into the muscle. The suitability of salt
depends upon several factors - the chemical composition (Klaveren & Legendre, 1965;
Anon., 1982), the microbiological purity (Anon., 1982), and the physical property
(Tressler & Lemon, 1951, Anon., 1982). Salt penetration is complicated due to the
presence of scale, skin and fat (Doe, 2000).
4.1.3. Dry salting method
Extensive reports are available on different salting Methods (Syme, 1966; Seno
,1974; Gerasimov & Antonova, 1979; Anon., 1982). The survey along the Madras coast
showed 1: 4 to 1: 6 salt to fish ratio (Srinivasan & Joseph, 1966, Joseph et al., 1986). /
33
Antony & Govindan (1983) used 1: 5 salt to fish for lizard fish. Kalaimani et al., (1988)
suggested 25% salt for salting. 1:1 salt to fish for anchovies was suggested for sun
drying by Reddy et al. (1991). 1: 4 salt to fish was recommended for salting of thread fin
bream, Jew fish, shark and mackerel (ISI, 1967a, 1967b, 1969, 1974, Keay, 1986).
Thomas & Balachandran (1989) reported that 1: 3 to 1: 10 salt to fish depending on the
size of the fish. Generally it was reported that people of Kerala use 1: 4 salt to fish and
Tamilnadu people use 1: 5 salt to fish and salting time is 12 to 24 hours (Thomas &
Balachandran, 1989). Salt contributes flavour at lower concentration and is a
bacteriostatic at higher concentration (Daun, 1975). Sikorski et al. (1995) stated that salt
penetration during dry salting is critical and fast depending on several factors. He further
suggested that the finely grained salt rapidly dissolve in fish muscle fluid causing a too
rapid withdrawal of moisture.
4.1.4. Wet salting of fish
5% brine is used for salted anchovies, saturated brine for salted and pressed
Decapterus sp., shark and ray (Srinivasan & Joseph, 1966; Prabhu & Kandoran, 1991;
Shetty et al., 1991; Sankar & Solanki, 1992 and Gupta & Chakrabarti, 1994). Ragulin
(1958) reported that wet salting is more effective than dry salting and salt penetration is
fast in wet salting. Anon. (1982) discussed about various wet salting methods. Sikorski
et al. (1995) describes the use of saturated brine for fish preservation.
4.1.5. Physico-Chemical properties of salting
Weight loss in ribbon fish during dry salting, yield of mackerel and weight loss in
wet and dry salted mackerel and weight loss in Anchovies in the initial 4 and 8 hours
were reported by Cutting (1961); Valsan (1976): Seno, (1974) and Ragulin (1958).
Salting is reported to change structural and mechanical feature of muscle tissue
(Stansby, 1963; Voskresensky, 1965 and Anon., 1982). In fish, rapid loss of weight takes
place in the first day and salt content rises to about 18% of wet tissue (FAO., 1957;
34
Anon., 1965}. The uptake of salt by fish depends on different factors namely the fat,
thickness, freshness and temperature of fish (Stansby 1963; Anon., 1982). The salt
uptake is slower with high fat content and thickness or temperature (Anon., 1982). The
freshness of fish has inverse relation to salt uptake while temperature has got a direct
relation (Sankar & Solanki, 1992).
Moisture loss was high during initial period in dry salted shark, but the loss was
less during the subsequent salting period (Kandoran et al., 1965; Kandoran et al., 1969;
Chakrabarti, 1988; Chellappan, 1989 & 1991; Ramachandran & Solanki 1991).
Knshnakumar et al. (1986) reported the lowering of pH in sardine in brine. Lowering of
pH in mackerel during salting was observed also by Balachandran & Muraleedharan
(1975). The aw of brine salted fish cake is 0.96 to 0.82 and brine salted anchovies is 0.80
to 0.79 aw (Chakrabarti et al., 1991 & Reddy et al., 1991). Kandoran et al. (1965) studied
TVN loss in dry salted shark. The nitrogenous compound loss during salting in ungutted
and gutted mackerel was reported by Mathew & Ragunath (1996) and the decrease of
NPN content in wet salting of shark and ray by Sankar & Solanki (1992). Change in SSN
in sardine, shark and ray was observed by Krishnakumar et al. (1986) and Sankar &
Solanki (1992). The change in urea content in the early period of salting is reported by
Kandoran et al. (1965). Decrease in urea in wet salted shark was observed by
Ramachandran & Solanki (1991). The formation of FFA in sardine stored in chilled
seawater is another change noticed (Krishnakumar et al., 1986 and Shetty et al., 1991).
The FFA hydrolysis in heavy salted sample was rapid and is proportional to decrease of
phospholipids (Lovern, 1961). The oxidation of FFA to PV in salt solution in presence of
dissolved oxygen will take place in brine solution. Krishnakumar et al. (1986) and
Sikorski et al. (1995) stated that the salt uptake of fish cause rapid protein denaturation,
coagulation and further penetration of salt.
35
Levendov (1958) and Daun (1975) reported the action of diffusion and osmosis
during salting and other characteristics by mass transfer of water and sodium chloride in
to fish in brine The weight of fish increases initially due to up taking of salt and swelling
of fish in anchovies. Mrochkov (1958) reported that considerable loss occurs in protein
and non-protein nitrogen. Ragulin (1958) reported that there is loss in protein, lipids and
minerals during salting and the loss depends on temperature. Zugarramurdi et al. (1993)
reported that only certain quantity of salt can be absorbed by fish flesh and at saturation,
this quantity is equal to the amount of salt that would dissolve in a quantity of water
equal to what the fish might have at the moment of establishing equilibrium.
Fougere (1952) studied moisture loss and salt uptake in fish. Due to the
contraction of tissue the electrostatic force of terminal end of the protein molecule
determining the structural lattices of proteins results in about 15 to 25% bound water
reverted to free state (Voskresensky, 1965). This leads to the shrinkage and structural
variations in protein molecules. The salting time and temperature is an important factor
for salting fish. It is reported that salting time required is 12 to 24 hours in tropical
countries like India (Thomas & Balachandran, 1989). Protein denaturation by using
sodium chloride in cod and Baltic herring (Duerr & Dyer, 1952 and Linko & Nikkila
,1961 ).
4.1.6. Chemical Preservatives
Chemical and natural preservatives are used to increase the storage life.
Chemical preservative and salt or salt solution is recommended to increase storage life
of the dried or cured fish. These chemicals slow down chemical changes of fish flesh
and are anti-oxidants. Valsan (1968) recommended 2% sodium propionate in the wet
cured fish and the spoilage can be reduced and shelf life extended up to 9 to 12 months.
Joseph et al. (1988b) used 10% brine containing 0.1 % citric acid in whole prawns. Gupta
& Chakrabarti (1994) and Hiremath et aI., (1989) used saturated brine and 0.1 %
36
~pionic acid. Prasad et al. (1994) used heat-treated salt to check the growth of red
nalophiles in salted fish. Anon. (1981) suggested that acetic acid, benzoic acid and
propionic acid are cheap and useful as chemical preservative and 1.0% sodium
benzoate or benzoic acid dip is useful for dry fish. Potassium benzoate dip is useful
against dun and is soluble. Syme (1966) recommended 3% sodium phosphate and
0.25% sodium benzoate. Antony (1990) reported 0.1% calcium propionate dusting on
the dried fish before sealing in pouches. Klaveren & Legendre (1965) recommended
hypochlorite solution or powdered chloride of lime dip or salt and boric acid dusting or
0.4% sodium acid phosphate and 0.25% sodium benzoate with salt to prevent ./
reddening.
A dip of 0.8-mole sodium propionate for 30 sec. or 0.1 % sorbic acid with salted
fish is more effective. Joseph & Srinivasan (1967) used sodium benzoate and sodium
bicarbonate in the ratio of 1:3 in the preparation of dried salted fish. Joseph & Srinivasan
(1967) used 25-ppm chlorotetracycline as preservative for dry salted fish. Valsan (1968
& 1985) reported that 3% sodium propionate and salt just before packing is good for
better storage. Shewan (1961) reported that fish needs 75% relative humidity for the
growth of red halophiles and sorbic acid is the best preservative. Tarr (1961) suggested
many preservatives like sodium or potassium nitrites and their salts as chemical
preservatives. The nitrates are reduced to nitrites during the storage. He further
suggested that formaldehyde, sodium nitrite, pencillic acid, aureomycin (CTC),
lelramycin, chloromycin and other strong antibiotics retard bacterial action.
4.1.7. Natural Preservatives
Devadasan et al. (1975) reported on the effect of tartaric acid and garlic as
preservative in pickle curing of fish. Balachandran & Muraleedharan (1975) reported
colombo curing of mackerel where they used gorukha puli (malabar tamarind) as
preservative. The storage of dry cured fish using natural preservative and the anti-
37
oxidant effect of betel leaf extract was reported by Kalaimani et al. (1984). The action of
spices and herbs are greater than the chemical preservatives with cloves, cinnamon and
mustard and they exert greater preservative action (Hersom & Hullard, 1981).
Cardamom, cum in, coriander, pimento and ginger have little effect and bay leaves;
cloves oils are effective against bacteria (Hersom & Hullard, 1981). Rao et al. (1958)
used tamarind (Tamarindus indica) as preservative in mackerel.
4.1.8. Drying of fish
There are different Methods used for drying salted fish namely Sun drying or
natural drying, Electrical drying and Solar drying. Smoke drying is another method of
preserving the fish using the principle of drying technique. (Anon., 1956 & 1982; FAO.,
1975; Stansby, 1963; Anon., 1965 and Cutting, 1996). The natural drying of fish is
economically viable than using mechanical dryers considering the cost (Zugarramurdi et
al., 1993). They also further suggested that good product can be obtained in tropical
climates if the products are prepared after considering points namely temperature,
humidity of the air and quality of raw material. Sun drying of fish with or with out salting
of Bombay duck, silver bellies, anchovies, round sead, ribbon fish and shark had been
vividly reported (Srinivasan & Joseph, 1966; Prabhu, 1972; Joseph et al., 1986; Babu et
al., 1987 Joseph et al., 1988a; Prabhu & Kandoran, 1991; Garg et al., 1989). Perovic &
Samuel (1978) reported that fish is salted and dried all along the Indian coasts from
Gujarat to West Bengal. Anon. (1982 & 1994) reported the use of drying on a raised
platform with crow-proof and fly-proof environment. The raised plate from besides
permitting good air movement prevents contamination of different sorts. Babu et al.
(1987) reported on the different surfaces used for purpose of drying.
4.1.9. Time and temperature
Anon (1956) stated that shorter the drying time, the more tender and fibrous was
the texture of the products. Gerasimov & Antonova (1979) showed that 30 to 35°C is the
38
optimum natural temperature and depends on weather condition. Camu et al. (1983)
reported that sun drying is good for mackerel at 36 to 49°C. Pillai & Pillai (1989) reported
18 hours sun drying for laminated dry fish. Gopakumar & Devadasan (1983) and Reddy
et al. (1991) reported that the fish be dried until a constant weight is obtained. Anon.
(1982) suggested some important points to consider while sun drying. The effect of salt
during drying was reported by Anon. (1982).
4.1.10. Basic principles of fish drying
Fish drying implies removal of water from fish because water is essential for the
activity of all living organisms. The removal of water slows down or stops the growth of
microbiological or autolytic activity. The controlled artificial dehydration of fish was
carried out regardless of weather conditions (FAO. 1957 & 1975). Several workers have
reported the process of drying, flow of water molecule to surface, effect of heat during
drying and relative humidity on the fish (Jasson, 1965; Waterman, 1976; Anon., 1982).
The physical changes and theoretical application of fish drying was reported by Jason
(1965) and Cutting (1996). The relative humidity of air, air velocity, air temperature and
surface area of fish are very important factors. The Integrated fisheries project, cochin
has a well arranged electrical hot air tunnel drier with a capacity of 1000 kg / 16 hours.
The tunnel drier has one upper and another lower chamber. The upper chamber has
heating elements and hot air blower. The lower chamber has space to charge the trolley
and two exhaust fans to remove highly humidified air and a temperature regulator. The
salted fish after washing was arranged on perforated Aluminum trays and kept on the
trolley and kept in tunnel. The temperature is regulated between 45 and 50C. Perovic &
Samuel (1978) reported that fish dried in the above method will be better quality than
other methods but the unit cost of production will be about 50% higher than sun dried
products.
39
Govindan (1985) described various types of artificial drying methods to dry the
materials fast and more efficient, without any contamination by dust, insects, microbes,
birds and animals. The different types of drier fabricated include, Cabinet type dryer,
Tunnel drier, Multi- deck tunnel drier, Fluidized - bed - drier, Rotary dryer and Solar
dryers (Sripathy & Balasaraswathi, 1985; Demir & Evcin, 1993; Anon., 1982 and 1981).
Anon. (1987) and Rubbi et al. (1983) reported that solar dryers prevent fish from dust,
and protects from birds, animals and dries quickly than sun drying. Anon (1982) reported
that the sun light energy is collected and concentrated to produce elevated temperature
to increase the rate of drying. Parabolic reflectors and absorption unit are used for
sunlight. However, Reddy et al. (1991) and Sripathy & Balasaraswathi (1985) reported
that there is no merit in solar drier except in producing dust free product and Anon.
(1982) reported that none of the solar driers are used on commercial basis.
4.1.11. Present Methods of transporting
It is an important process to reach the product to the destination in time for better
price and sales. The various kinds of transportation methods used are train, truck, cars,
etc. by road (Anon., 1982). The salted fishes are usually packed in vallam made by
using dried coconut leaves or using dried bamboo sticks. Antony et al. (1988) and
Gopakumar (1996) reported that the dried leaves of coconut and palm and jute bags are
used for bulk transportation of dried fish (Gopal, 1990; Antony et al., 1988). The cured
and dried products thus prepared are not hygienically handled. This allows the entrance
of foreign materials and insects. Due to poor handling and packaging the appearance of
the fish is not at all good and cause loss (Ward, 1996) to the traders. During rainy
season or monsoon season the landing of fresh fish was less and the demand for salted
fish was more. This necessitates the need for proper transportation and packaging.
4.1.12.1. Packaging
Fishes are bulk packed using palm or coconut dried leaves usually called as
'vallum', contain 15 to 20 kg, easy to handle. It is observed that polythene bags
containing 100gm packs sold in city have good acceptance. Kumar (1990) reported the
various packing materials like papers and paperboards, cellophane, plastics, vinyl films,
metallized plastics, aluminium foils and composite structure etc. But low-density
polythene is widely used for packing dried fish due the low cost and transparent quality
and better appearance (Antony, 1990). Gopal (2000) suggested LDPE of 100 gauge for
dry fish packing.
4.1.12.2. Purpose of packaging
The purposes of packing are to contain the product, to protect the product and to
help in selling the product (Anon., 1981). Further the psychology of the consumer
depends on many factors such as appearance, colour and odour of the products. The
fish seller needs to protect the fish from the external environment such as the entrance
of external undesirable materials as bacteria, insects, moisture and oxygen. It also
protects the products from the attack of mould and pink formation and gives better
storage life (FAO, 1957). According to Prabhu & Gopal (1990), Gopakumar (1996) the
packaging of dried fish need inertness, leak proofness, impermeability to oxygen,
moisture and less transparent. Resistance to mechanical abrasion and puncture is
another desired quality.
4.1.13. Storage temperature
This is an important factor in dry fish. The dried fishes are usually stored at room
temperature 28°C (Antony, 1990). Further the dried fish absorbs moisture from the
surrounding atmosphere or it may lose moisture due to dry atmosphere. This is because
the moisture content of atmosphere had greater influence on the relative humidity and
temperature. FAO. (1957) suggested that the salted dry fish stored at low temperature
41
would not encourage the growth of red halophiles. FAO. (1991) suggested to keep the
fish at the low temperature of 10°C to check the growth of red halophiles. Syme (1966)
reported that the dry fish be stored at 41° F (S°C) so that red halophiles do not grow. The
maximum growth occurs during the storage at 77°F (2SoC). Klaveren & Legendre (196S)
suggested that the growth of red halophiles is due to the proteolytic action of the meat at
25°C. Rubbi et al. (1983) reported that the fish stored at +130C was of superior quality in
all cases than the fish stored at room temperature. Camu et al. (1983) suggested that
the dried mackerel stored at 18°C is acceptable for 12 weeks. Tressler & Lemon (19S1)
recommended low temperature for fatty fishes. Sikorski et al. (199S) stated that the
salted fish undergoes partial proteolysis due to the activity of muscle proteases in living
animal. So to restrict the excessive proteolysis, the dried fish has to be stored at low
temperature of + Soc.
4.2. Aim and Objectives
The study is aimed to:
• Develop salting techniques that minimize salt and salting time for economical and
cost effective salting.
• To regulate weight changes during salting and yield.
• To improve the quality and shelf life of the salted and dried products by using
chemical and natural preservatives.
4.3. Materials And Methods
4.3.1. Preparation of Sample
Fishes used for the study were mackerel, ribbonfish and shark. Fishes were
selected to study the salting and drying behaviour of three widely different groups of
fish. Mackerel is a red meat fish with medium fat content, ribbonfish is a white
meat fish and shark belongs to elasmobranches with meat containing high urea.
The first two fish belong to teleosts. The fresh iced fish were transported to the
42
laboratory and cleaned immediately using standard method described below. The fish
were washed to remove any foreign materials and measured for total length. They were
weighed before and after cleaning to find the yield. The fishes were then cleaned without
any gills, gut, and blood clotting and intestinal membrane. They were washed to remove
blood and separated in to eight lots - among them four lots used for dry salting and other
four lots used for wet salting. Salting proceeded as follows. Salting of different sets was
carried out for different durations (days).
4.3.2. Dry salting method
The first four lots of fish as mentioned above were salted with refined salt
(Ramachandran et al., 1990) as the bacterial load is less in the ratio of 1: 4 salt to fish
and chemical preservative, calcium propionate was mixed at different level of 0, 1 %, 2%
and 3% (four lots) to the salt initially as fishes to be stored at semi-dried condition.
Separate 10 samples were prepared in each lot to find weight loss of the fish at different
hours during salting and sun drying. The salted samples were dipped in water to remove
excess salt. Samples were also removed at every four hours and dipped in water for one
10 two minutes to remove the excess salt to study biochemical changes of fish up to 48
hours. The flow sheet for dry salted fish is in Table 4.1.
4.3.3. Wet salting method
The next four lots of fish were dipped in saturated brine solution 1: 2 ratio of fish
and brine solution (w/v). The natural preservative, the filtered tamarind juice (T.lndicus)
oflhe strength of 0,5%,10% and 15% (four lots) were added (w/v). This solution was
changed after 8 hours and fresh solution of the same strength was added to maintain the
strength of the solution. Further samples were separated as above and to fulfill the
above purpose. Swaminathan (1993) reported the chemical constituents of T.lndicus.
The flow sheet for wet salted fish is in Table 4.2.
4.3.4. Washing and drying of fish
The salted fish as above, after 48 hours were washed for 1 to 2 minutes to
remove the excess salt and dried for eight hours. The samples were weighed to find the
weight loss and separated after four hours at noon and after eight hours at evening
during drying to study the weight loss and biochemical changes such as moisture and
salt. The temperature and relative humidity were measured. After drying, the best lot of
each type of fish was selected for storage studies.
4.3.5. Storage
The best dry or wet salted lots from the four lots were selected and divided
further into four lots for storage study. The 1st lot was stored without packing in room
condition. The 2nd lot was packed and sealed in polyethane bags and stored at room
condition and temperature and relative humidity were noted for one month at morning,
noon and evening. The 3rd and 4th lots were packed sealed in polyethane bags and
stored in a refrigerator at +130c and cold store at - 20°c respectively to study the
organoleptic and chemical changes during the storage periods using the standard
methods. The 1 si and 2nd lot's samples were removed at 10, 20 and 30 days interval and
3rc1 and 41h lot's samples were removed at 1, 2, 3 and 4 months interval. (Table 4.3)
4.4. Statistical analysis of results
The experimental data were subjected to statistical analysis using the two factor
ANOVA as Fisher & Yates (1963) and Snedecor & Cochren (1980), the mathematical
model used for the purpose was
X ij = ~ + a i + 13 j +E ij
The ANOVA results prepared are given on anova tables. Where ever the treatment
effect were found to be significant, least significant difference (LSD) were calculated
using the formula
LSD = (2/r x Ve) x t a (error dJ.)
The results of the analysis of the data are given at the end of each chapter.
4.4. Results
4.4.1. Processing yield of fresh fish
Average yield of mackerel after cleaning and evisceration was 83.74% with a
range of 80.54 to 86.06% and ribbon fish showed 76.47% with a range of 70.52 to
87.01% and shark showed 63.57% yield with a range of 50.01 to 67.30%.
4.4.2. Weight loss during salting and drying
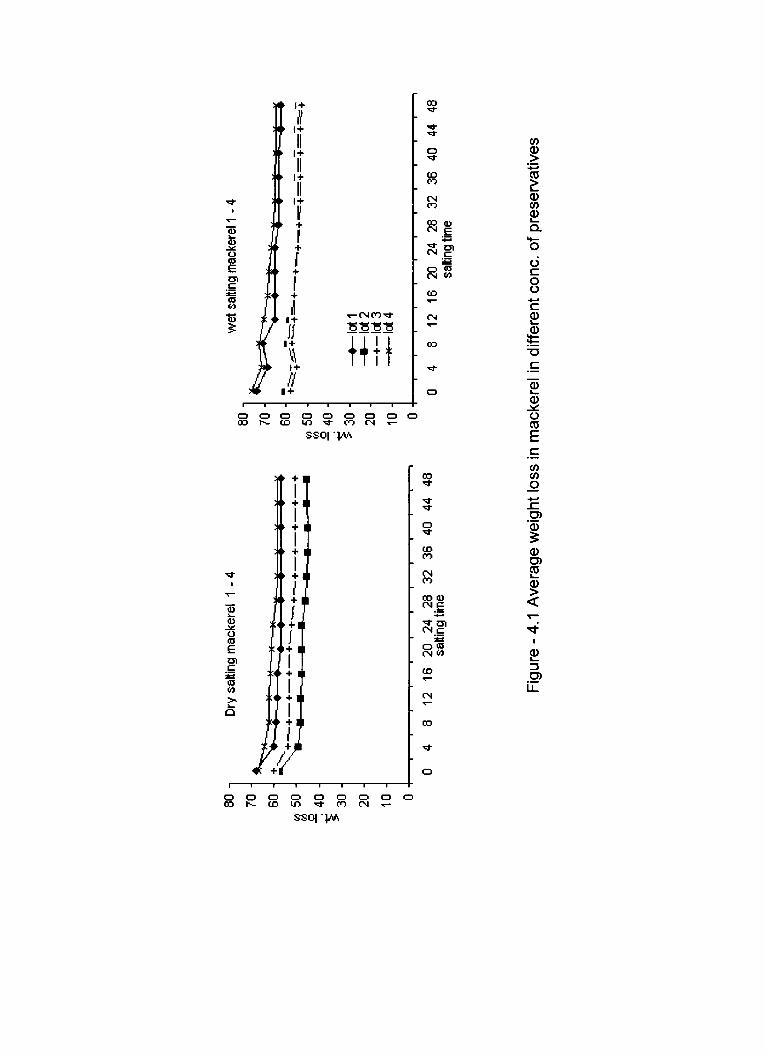
4.4.2.1. Dry and wet salted Mackerel
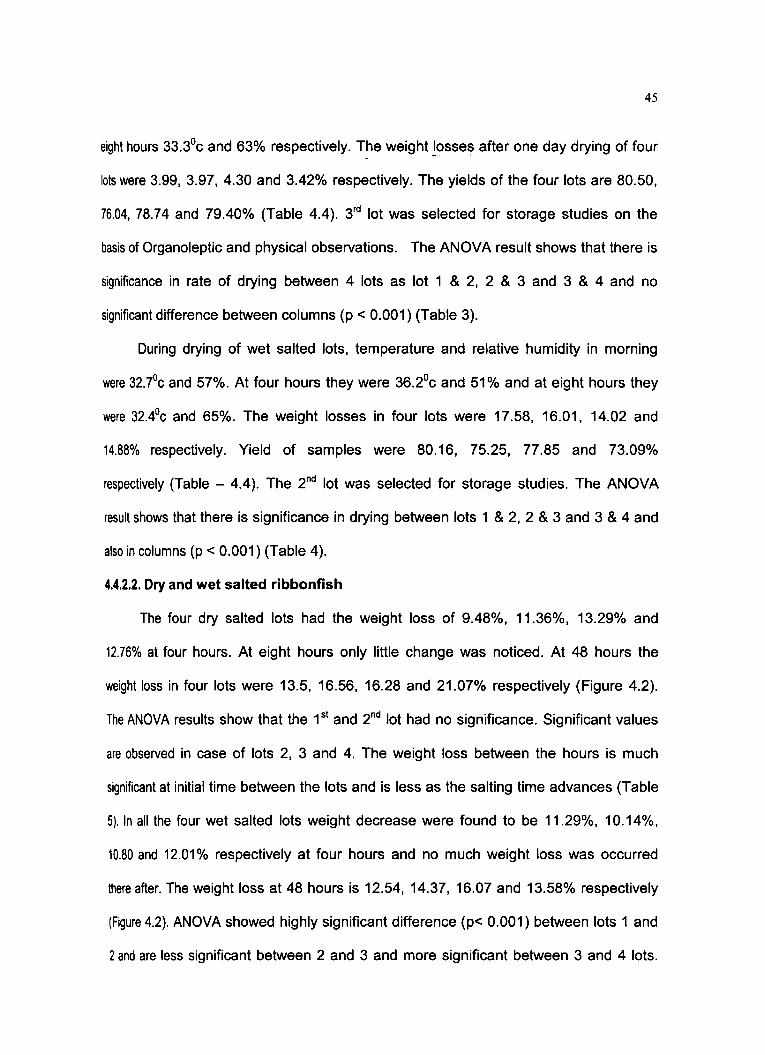
Weight losses, in four dry salted lots at the initial stage (at four hours) were high --:. - --
at 11.76%,14.24%,10.96% and 8.18% respectively. Maximum weight loss was noted in
the first eight hours of salting. After that period only slight weight loss was observed up
to 48 hours. The weight loss at 48 hours was 16.18, 20.83, 15.61 and 12.84%
respectively in these four lots (Figure 4.1). ANOVA results show that there is significant
difference between lots (p < 0.001). Lot one is significantly different from lot 2, 3 and 4
and lot two is significantly different from lot 1, 3 and 4. Also lot 3 and 4 are significantly
different from others. The average weight change of fish showed significant difference
between hours in all occasion depending on the control and preservative (Table 1). Initial
weight losses in four lots of wet salted mackerel were 6.79%, 6.69%, 5.54% and 5.80%
at four hours. Weight loss increases a little at eight hours. The weight loss decreases
subsequently at 24 hours. The weight loss at 48th hours was 3.53%, 11.04%, 8.65% and
14.51% in four lots respectively. Wet salting showed very little weight changes (Figure -
4.1). The ANOVA results show that each lot is significantly different (p < 0.001) the
difference is not so pronounced as in dry salted fish. There is significant difference in
weight loss between hours (p < 0.001) (Table 2).
During drying of dry salted lot, the morning temperature and relative humidity
were 33.2oc and 54% respectively. At four hours they were 36.1 oc and 45.1 % and at
45
eight hours 33.30c and 63% respectively. The weight losses after one day drying of four
lots were 3.99, 3.97, 4.30 and 3.42% respectively. The yields of the four lots are 80.50,
76.04, 78.74 and 79.40% (Table 4.4). 3rd lot was selected for storage studies on the
basis of Organoleptic and physical observations. The ANOVA result shows that there is
significance in rate of drying between 4 lots as lot 1 & 2, 2 & 3 and 3 & 4 and no
significant difference between columns (p < 0.001) (Table 3).
During drying of wet salted lots, temperature and relative humidity in morning
were 32.7oc and 57%. At four hours they were 36.2°c and 51% and at eight hours they
were 32.4°c and 65%. The weight losses in four lots were 17.58, 16.01, 14.02 and
14.88% respectively. Yield of samples were 80.16, 75.25, 77.85 and 73.09%
respectively (Table - 4.4). The 2nd lot was selected for storage studies. The ANOVA
result shows that there is significance in drying between lots 1 & 2, 2 & 3 and 3 & 4 and
also in columns (p < 0.001) (Table 4).
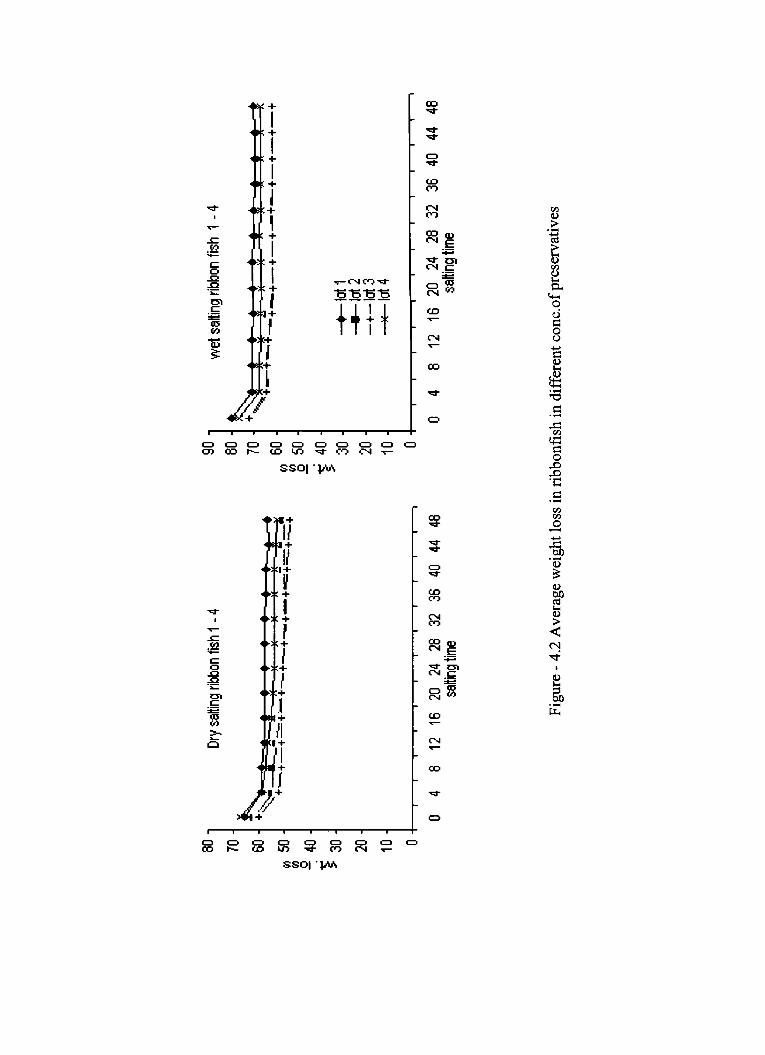
4.4.2.2. Dry and wet salted ribbonfish
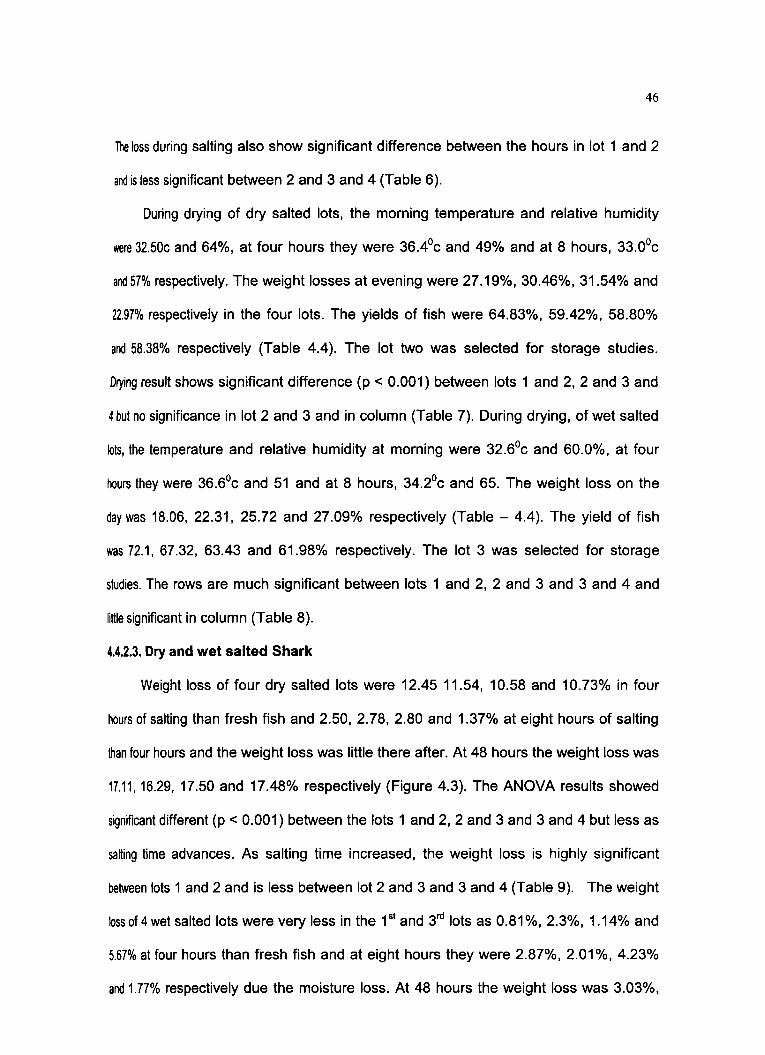
The four dry salted lots had the weight loss of 9.48%, 11.36%, 13.29% and
12.76% at four hours. At eight hours only little change was noticed. At 48 hours the
weight loss in four lots were 13.5, 16.56, 16.28 and 21.07% respectively (Figure 4.2).
The ANOVA results show that the 1st and 2nd lot had no significance. Significant values
are observed in case of lots 2, 3 and 4. The weight loss between the hours is much
significant at initial time between the lots and is less as the salting time advances (Table
5). In all the four wet salted lots weight decrease were found to be 11.29%, 10.14%,
10.80 and 12.01 % respectively at four hours and no much weight loss was occurred
there after. The weight loss at 48 hours is 12.54, 14.37, 16.07 and 13.58% respectively
(Figure 4.2). ANOVA showed highly significant difference (p< 0.001) between lots 1 and
2 and are less significant between 2 and 3 and more significant between 3 and 4 lots.
46
The loss during salting also show significant difference between the hours in lot 1 and 2
and is less significant between 2 and 3 and 4 (Table 6).
During drying of dry salted lots, the morning temperature and relative humidity
were 32.50c and 64%, at four hours they were 36.4°c and 49% and at 8 hours, 33.0oc
and 57% respectively. The weight losses at evening were 27.19%,30.46%,31.54% and
22.97% respectively in the four lots. The yields of fish were 64.83%, 59.42%, 58.80%
and 58.38% respectively (Table 4.4). The lot two was selected for storage studies.
Drying result shows significant difference (p < 0.001) between lots 1 and 2, 2 and 3 and
4 but no significance in lot 2 and 3 and in column (Table 7). During drying, of wet salted
lots, the temperature and relative humidity at morning were 32.6°c and 60.0%, at four
hours they were 36.6oc and 51 and at 8 hours, 34.2oc and 65. The weight loss on the
day was 18.06, 22.31, 25.72 and 27.09% respectively (Table - 4.4). The yield of fish
was 72.1,67.32, 63.43 and 61.98% respectively. The lot 3 was selected for storage
studies. The rows are much significant between lots 1 and 2, 2 and 3 and 3 and 4 and
little significant in column (Table 8).
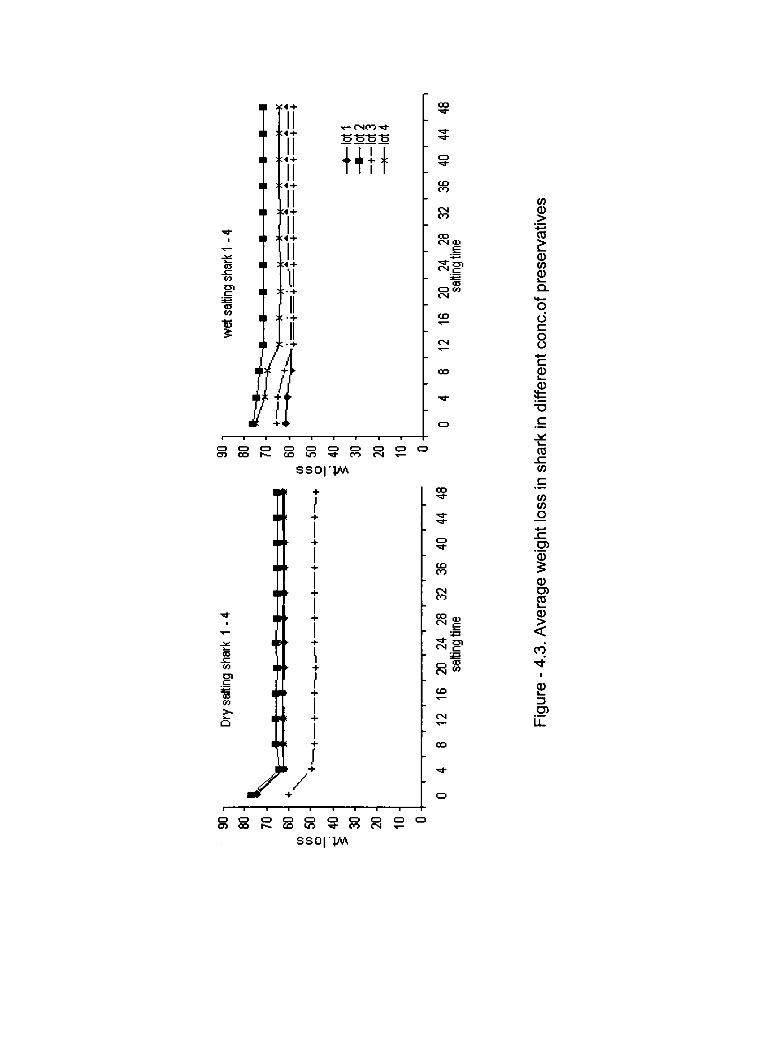
4.4.2.3. Dry and wet salted Shark
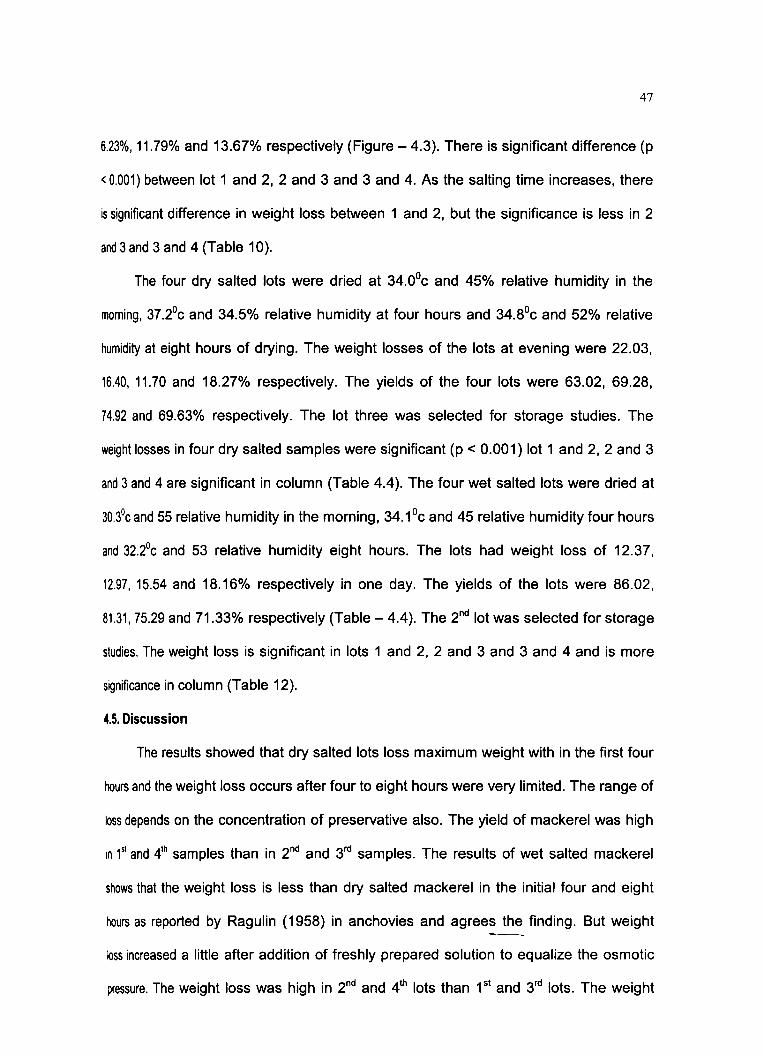
Weight loss of four dry salted lots were 12.45 11.54, 10.58 and 10.73% in four
hours of salting than fresh fish and 2.50, 2.78, 2.80 and 1.37% at eight hours of salting
than four hours and the weight loss was little there after. At 48 hours the weight loss was
17.11,16.29, 17.50 and 17.48% respectively (Figure 4.3). The ANOVA results showed
significant different (p < 0.001) between the lots 1 and 2, 2 and 3 and 3 and 4 but less as
salting time advances. As salting time increased, the weight loss is highly significant
between lots 1 and 2 and is less between lot 2 and 3 and 3 and 4 (Table 9). The weight
Iossof4wet salted lots were very less in the 1st and 3fd lots as 0.81%,2.3%,1.14% and
5.67% at four hours than fresh fish and at eight hours they were 2.87%, 2.01 %, 4.23%
and 1.77% respectively due the moisture loss. At 48 hours the weight loss was 3.03%,
47
6.23%,11.79% and 13.67% respectively (Figure - 4.3). There is significant difference (p
< 0.001) between lot 1 and 2, 2 and 3 and 3 and 4. As the salting time increases, there
is significant difference in weight loss between 1 and 2, but the significance is less in 2
and 3 and 3 and 4 (Table 10).
The four dry salted lots were dried at 34.0Qc and 45% relative humidity in the
morning, 37.2°c and 34.5% relative humidity at four hours and 34.8Qc and 52% relative
humidity at eight hours of drying. The weight losses of the lots at evening were 22.03,
16.40, 11.70 and 18.27% respectively. The yields of the four lots were 63.02, 69.28,
74.92 and 69.63% respectively. The lot three was selected for storage studies. The
weight losses in four dry salted samples were Significant (p < 0.001) lot 1 and 2, 2 and 3
and 3 and 4 are significant in column (Table 4.4). The four wet salted lots were dried at
30.30c and 55 relative humidity in the morning, 34.1 Qc and 45 relative humidity four hours
and 32.2°c and 53 relative humidity eight hours. The lots had weight loss of 12.37,
12.97, 15.54 and 18.16% respectively in one day. The yields of the lots were 86.02,
81.31,75.29 and 71.33% respectively (Table - 4.4). The 2nd lot was selected for storage
studies. The weight loss is significant in lots 1 and 2, 2 and 3 and 3 and 4 and is more
significance in column (Table 12).
4.5. Discussion
The results showed that dry salted lots loss maximum weight with in the first four
hours and the weight loss occurs after four to eight hours were very limited. The range of
loss depends on the concentration of preservative also. The yield of mackerel was high
in 1st and 41h samples than in 2nd and 3rd samples. The results of wet salted mackerel
shows that the weight loss is less than dry salted mackerel in the initial four and eight
hours as reported by Ragulin (1958) in anchovies and agrees the finding. But weight
loss increased a little after addition of freshly prepared solution to equalize the osmotic
pressure. The weight loss was high in 2nd and 4th lots than 1 sI and 3rd lots. The weight
48
loss during drying showed that weight loss was high in wet salted lot than dry salted lots.
This may be due to the high moisture content in wet salted mackerel and evaporated
during drying. The rate of yield shows that there is not much difference in both cases.
The result agrees with the weight loss of brined anchovies reported by Prabhu &
Kandoran (1991) and is depended on moisture content. The yield of mackerel agrees
with result reported by Va/san (1976) on mackerel. There was much difference in yield in
dry and wet salted mackerel in lot 4 only.
The results g,o~on weight loss of ribbon fish during dry salting was very high 6} at initial period of salting as noted by Cutting (1961) and agrees with the result. Weight
loss was little during later hours. The weight loss in 1 st and 4th lots was high than other
two and yield was high in lot one. The results of the wet salted ribbonfish showed that
the weight loss was as noted in wet salted mackerel. The yield was high in wet salted
ribbonfish than dry salted ribbonfish. But the 4th lot of both dry and wet salted ribbonfish
have almost same yield.
The dry and wet salted shark lots, during salting showed same results as above.
The weight loss, during salting was high in dry salted shark. Weight loss was maximum
up to 24 hours and was marginal from 24 to 48 hours. There was not much difference in
weight loss of dry and wet salted lots during drying and weight loss was high in wet
salted lots. The results showed that there was much difference in yield in dry and wet
salted shark. There was more difference in dry salted shark lot three than others. The
~eld in wet salted lots showed that it was in decreasing order from 1 st to 4th lots. This
may be due to the fact that wet salted fish do not extrude much moisture during salting
as dry salted ones.
80
70
60
Cl? 50
Cl?
~ 4
0
~ 30
20
10
Dry
sal
ting
mac
kere
l 1
-4
~ ;
~
: ;
• •
• •
• ¥
~+~+-+-+-+~+~+~+-+-+-+-+
• •
• •
• •
• •
• •
• •
oL-~~~-.~-.-. _
_ .-.-.-.-.-~
o 4
8 12
16
20
24
28
32
36
40
44
48
sa
lting
tim
e
80
70
60
Cl? 50
Cl?
.Q 4
0
~ 30
20
wet
sal
ting
mac
kere
l 1 -
4
~~ •
•••• ,
.¥
----
--
--
+~+*+~+~+-+-+-+~+=+=+=+=+
-+-I
ot
1 --
--lo
t 2
-+-I
ot
3
1~~~~~~~~~~~~
-*-l
ot4
o 4
8 12
1 6
20
24
28
32
36
40
44
48
sa
lting
time
Fig
ure
-4.
1 A
vera
ge w
eigh
t lo
ss in
mac
kere
l in
diff
eren
t con
c. o
f pre
serv
ativ
es
80
Dry
sattin
g rib
bon
fish
1 -4
70
60 H~:
::t:::
:!"* t
~ ~
~ t
~ t-=
: 00
50~
+~+-
+=+~
+-+-
+~+-
+~+=
+_+
00 ~
40
]: 30
..
20
10 oll--~~-r-r-r-r-.-.-r-.-r~
o 4
8 12
16
20
24
28
32
36
40
44
48
sa
ttingt
ime
90
wet
sattin
g rib
bon
fish
1 -4
~~j ~ •
I !
t t
* •
* *
*---t
~~~-~-+-+-+-+~+-+-+-+-+
00
60
~ 50
~
40
30
20
10
-+-l
ot1
-lo
t 2
-+
-Io
t 3
~lot4
Ol~~~~~~
o 4
8 12
16
20
24
28
32
36
40
44
48
sa
ttingt
ime
Fig
ure
-4.
2 A
vera
ge w
eigh
t los
s in
rib
bonf
ish
in d
iffe
rent
con
c.of
pres
erva
tive
s
(J)
90
80
70
60
~ 50
~ 4
0 30
20
10
Dry sa~ing s
hark
1 -
4
~I I
I
, ,
, I
I I
I I
+~ +~+-+-+~+~+-+-+-+-+-+~+
Ol~ ~~~~~~~--
o 4
8 12
16
20
24
28
32
36
40
44
48
sa~ingtime
(J)
90
80
70
60
~ 50
~
40
30
20
10
wet s
a~in
g sh
ark
1 -4
~:::::::::
~-+~.
. .
~--.--.--.--.--.--.
, ~--.--+==+==+~+--+--+--+--+--+--+
-+-I
ot 1
--
--lo
t 2
-+-I
ot 3
"""
"*,,,""
Iot 4
O~I~~~~~~~~-
o 4
8 12
16
20
24
28
32
36
40
44
48
sa
~ing
time
Fig
ure
-4.
3. A
vera
ge w
eigh
t lo
ss in
sha
rk in
diff
ere
nt c
on
c.o
f pr
eser
vativ
es
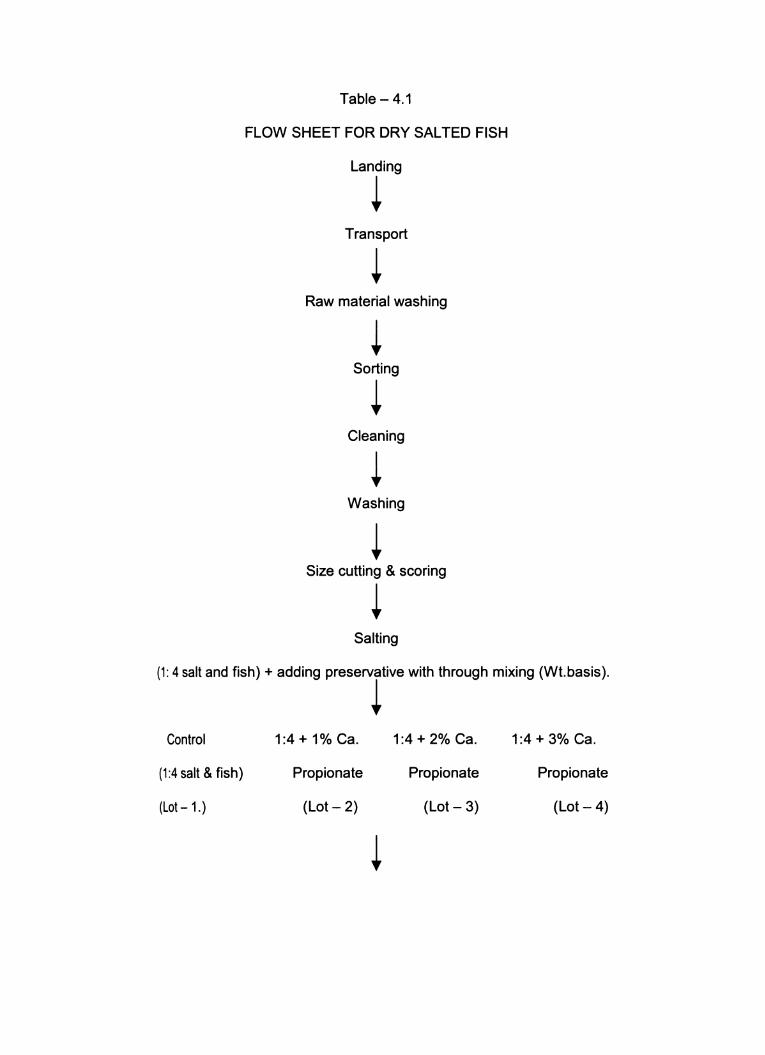
Table - 4.1
FLOW SHEET FOR DRY SALTED FISH
Landing
~ Transport
~ Raw material washing
~ Sorting
~ Cleaning
Washing
~ Size cutting & scoring
~ Salting
(1: 4 salt and fish) + adding preservative with through mixing (Wt.basis).
~ Control 1:4 + 1% Ca. 1:4 + 2% Ca. 1:4 + 3% Ca.
(1:4 salt & fish) Propionate Propionate Propionate
(Lot -1.) (Lot - 2) (Lot - 3) (Lot - 4)
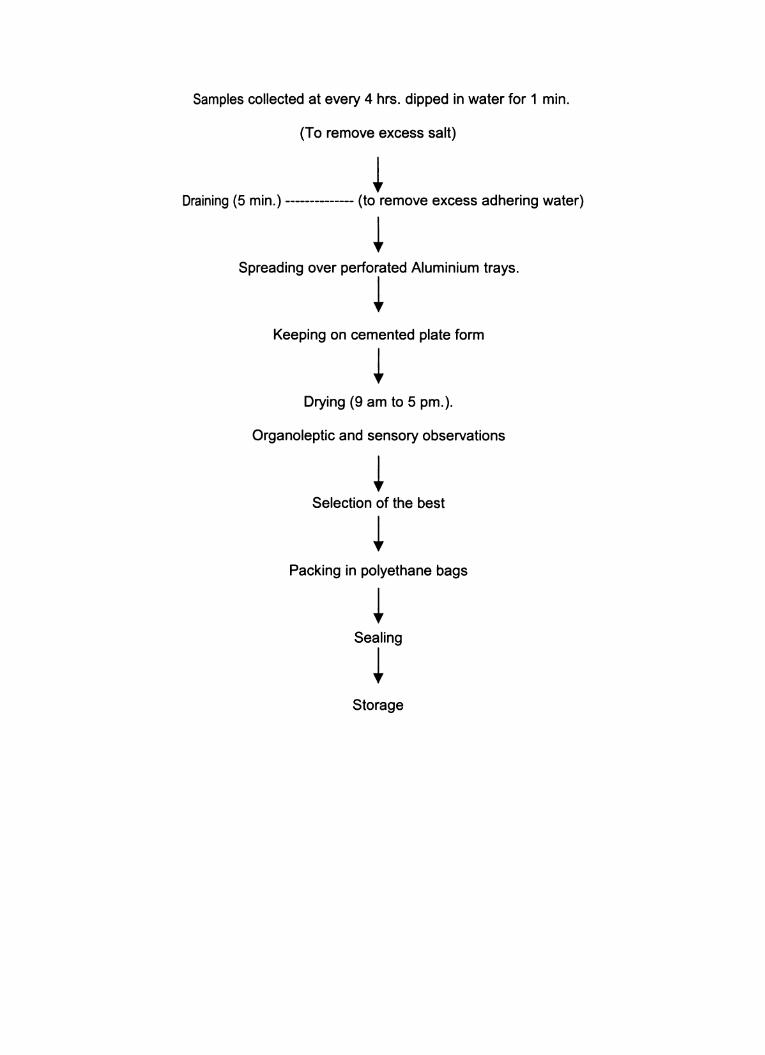
Samples collected at every 4 hrs. dipped in water for 1 min.
(To remove excess salt)
~ Draining (5 min.) -------------- (to remove excess adhering water)
~ Spreading over perforated Aluminium trays.
~ Keeping on cemented plate form
~ Drying (9 am to 5 pm.).
Organoleptic and sensory observations
~ Selection of the best
~ Packing in polyethane bags
~ Sealing
~ Storage
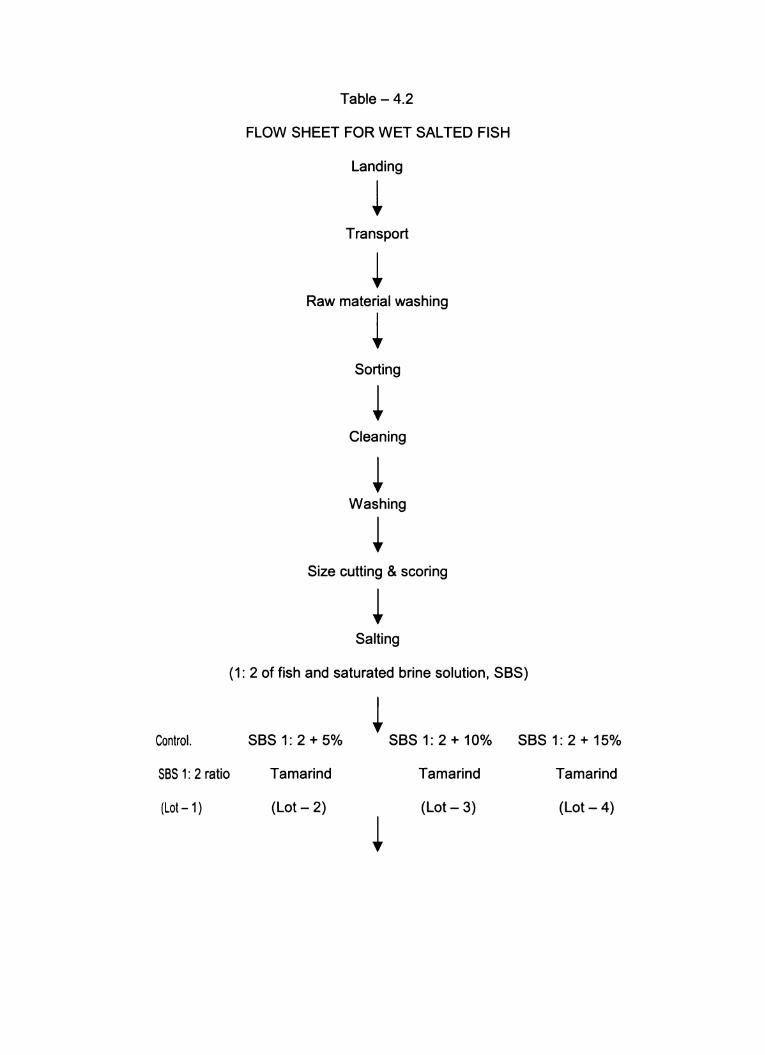
Table - 4.2
FLOW SHEET FOR WET SALTED FISH
Landing
~ Transport
~ Raw material washing
~ Sorting
Cleaning
~ Washing
~ Size cutting & scoring
Salting
(1: 2 of fish and saturated brine solution, SBS)
~ Control. SBS 1: 2 + 5% SBS 1: 2 + 10% SBS 1: 2 + 15%
SBS 1: 2 ratio Tamarind Tamarind Tamarind
(Lot-1) (Lot - 2) (Lot - 3) (Lot - 4)
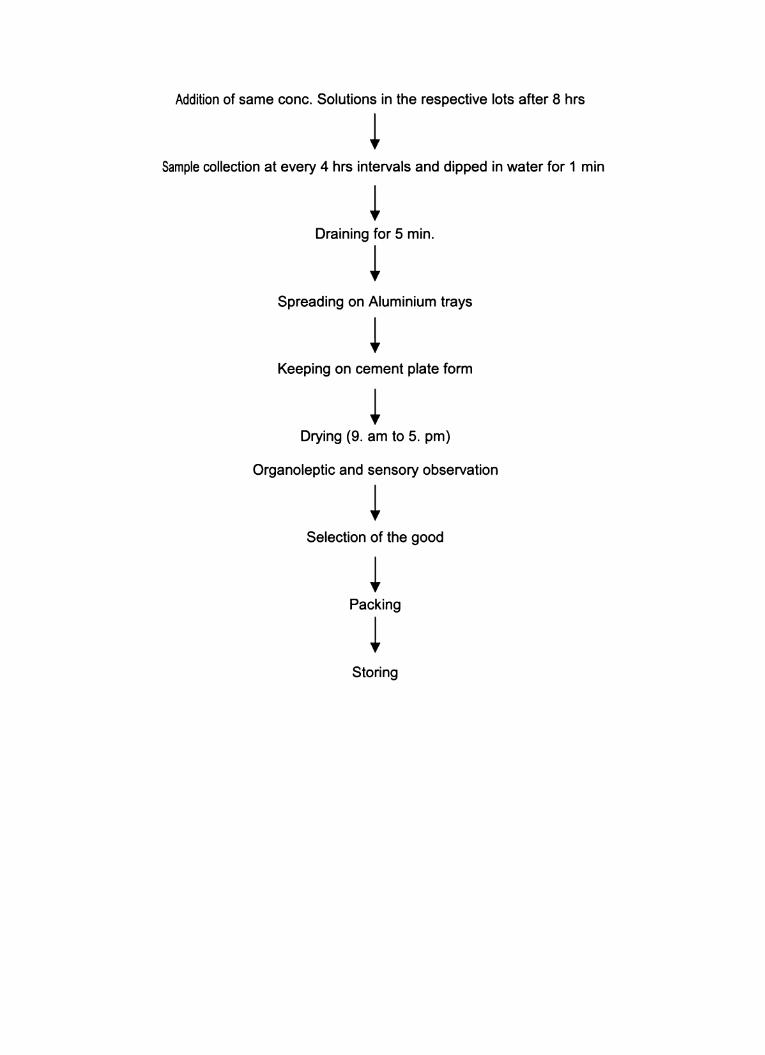
Addition of same conc. Solutions in the respective lots after 8 hrs
Sample collection at every 4 hrs intervals and dipped in water for 1 min
~ Draining for 5 min.
~ Spreading on Aluminium trays
Keeping on cement plate form
~ Drying (9. am to 5. pm)
Organoleptic and sensory observation
Selection of the good
~ Packing
~ Storing
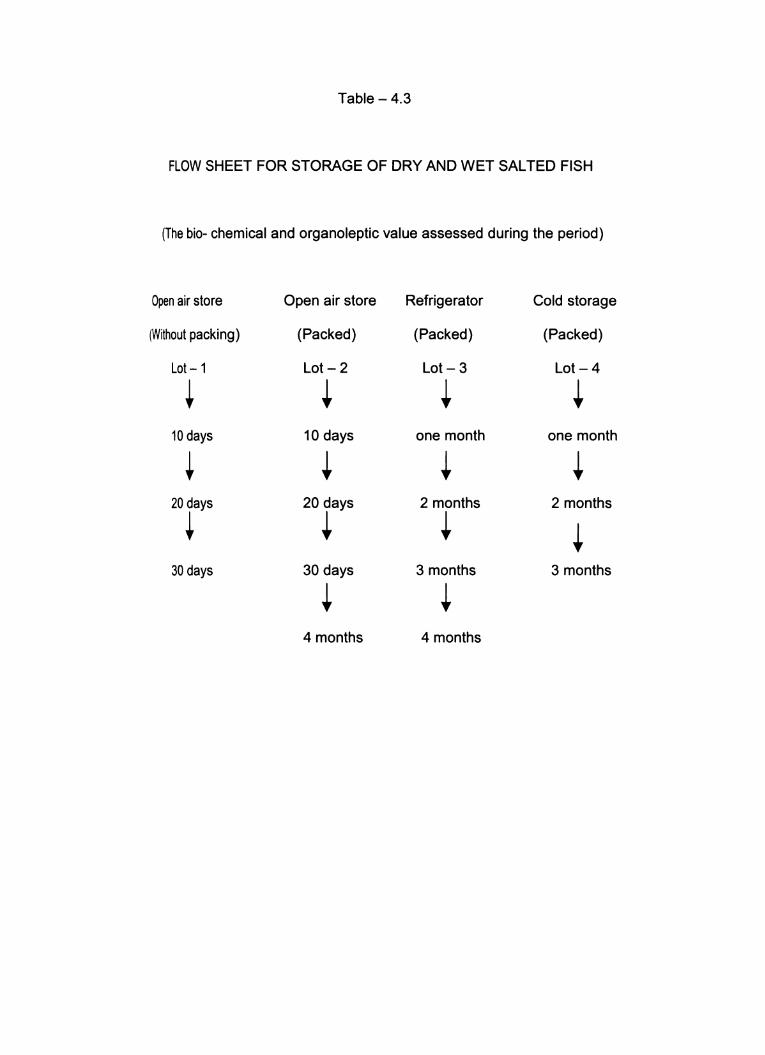
Table - 4.3
FLOW SHEET FOR STORAGE OF DRY AND WET SALTED FISH
(The bio- chemical and organoleptic value assessed during the period)
Open air store Open air store Refrigerator Cold storage
(Without packing) (Packed) (Packed) (Packed)
Lot-1 Lot-2 Lot- 3 Lot-4
+ + + + 10 days 10 days one month one month
+ + + + 20 days 20 days 2 months 2 months
+ + + + 30 days 30 days 3 months 3 months
+ + 4 months 4 months
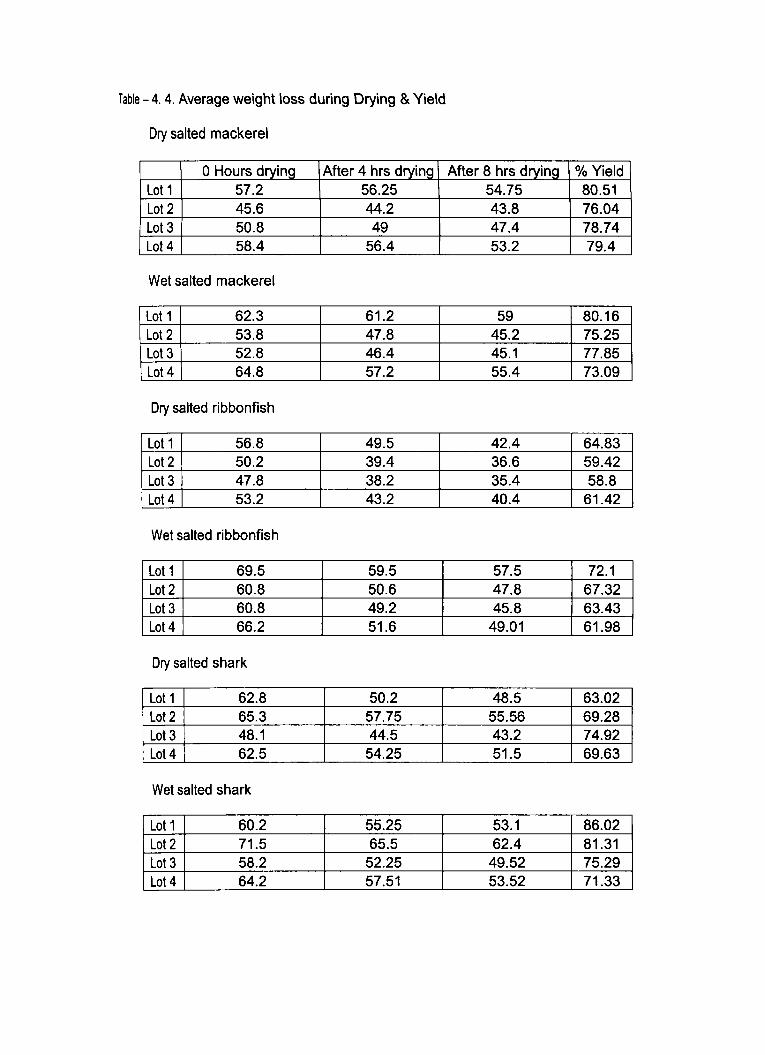
Table - 4. 4. Average weight loss during Drying & Yield
Dry salted mackerel
o Hours drying After 4 hrs drying After 8 hrs drying % Yield Lot 1 57.2 56.25 54.75 80.51 Lot 2 45.6 44.2 43.8 76.04 Lot 3 50.8 49 47.4 78.74 Lot 4 58.4 56.4 53.2 79.4
Wet salted mackerel
Lot 1 62.3 61.2 59 80.16 Lot 2 53.8 47.8 45.2 75.25 Lot 3 52.8 46.4 45.1 77.85 Lot 4 64.8 57.2 55.4 73.09
Dry salted ribbonfish
Lot 1 56.8 49.5 42.4 64.83 Lot 2 50.2 39.4 36.6 59.42 Lot 3 47.8 38.2 35.4 58.8 Lot 4 53.2 43.2 40.4 61.42
Wet salted ribbonfish
Lot 1 69.5 59.5 57.5 72.1 Lot 2 60.8 50.6 47.8 67.32 Lot 3 60.8 49.2 45.8 63.43 Lot 4 66.2 51.6 49.01 61.98
Dry salted shark
Lot 1 62.8 50.2 48.5 63.02 Lot 2 65.3 57.75 55.56 69.28 Lot 3 48.1 44.5 43.2 74.92 Lot 4 62.5 54.25 51.5 69.63
Wet salted shark
Lot 1 60.2 55.25 53.1 86.02 Lot 2 71.5 65.5 62.4 81.31 Lot 3 58.2 52.25 49.52 75.29 Lot 4 64.2 57.51 53.52 71.33
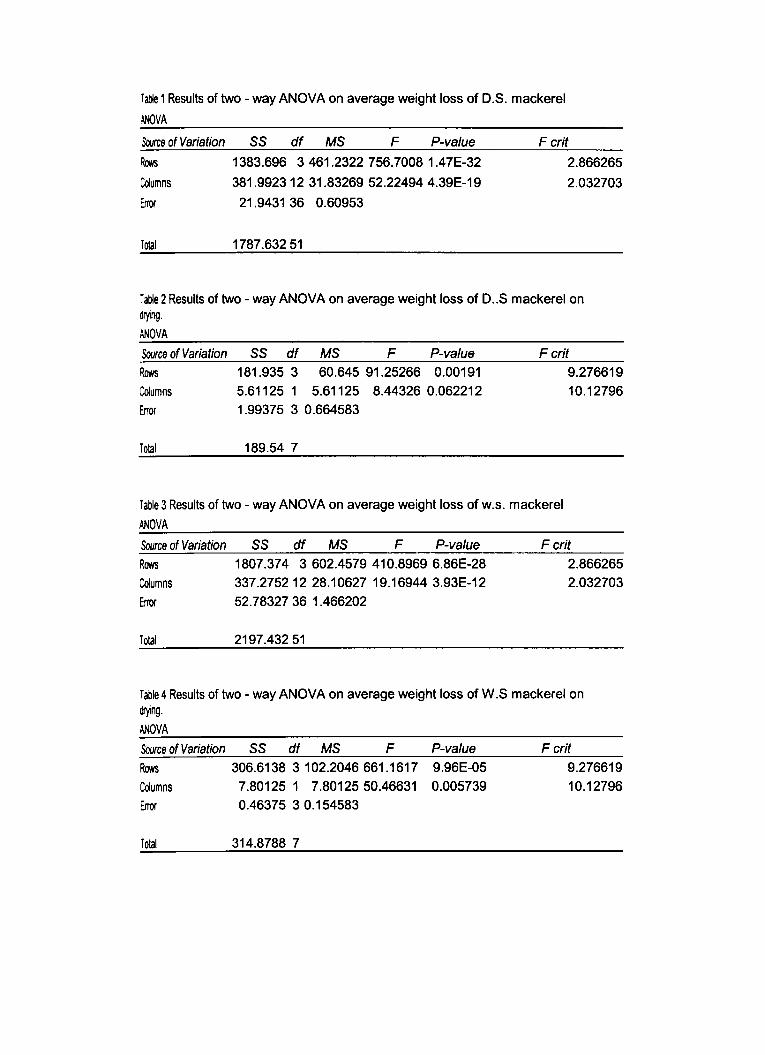
Table 1 Results of two - way ANOVA on average weight loss of 0.5. mackerel
OOVA
Source of Variation
Columns
Error
Total
SS df MS F P-value
1383.696 3 461.2322 756.7008 1.4 7E-32
381.992312 31.83269 52.22494 4.39E-19
21.9431 36 0.60953
1787.63251
F crit
2.866265
2.032703
Table 2 Results of two - way ANOVA on average weight loss of 0 .. 5 mackerel on drying.
ANOVA
Source of Variation
Rows Columns Error
Total
SS df MS F P-value
181.935 3 60.645 91.25266 0.00191 5.61125 1 5.61125 8.44326 0.062212 1.99375 3 0.664583
189.54 7
F crit
9.276619 10.12796
Table 3 Results of two - way ANOVA on average weight loss of w.s. mackerel
ANOVA
Source of Variation
Rows Columns Error
Total
SS df MS FP-value
1807.374 3 602.4579 410.8969 6.86E-28 337.275212 28.10627 19.16944 3.93E-12 52.78327 36 1.466202
2197.43251
F crit
2.866265 2.032703
Table 4 Results of two - way ANOVA on average weight loss of W.S mackerel on dr,ing.
M-IOVA
Source of Variation SS df MS F P-value
Rows 306.6138 3102.2046661.1617 9.96E-05 Columns Error
Total
7.80125 1 7.8012550.46631 0.005739 0.46375 3 0.154583
314.8788 7
F crit
9.276619 10.12796
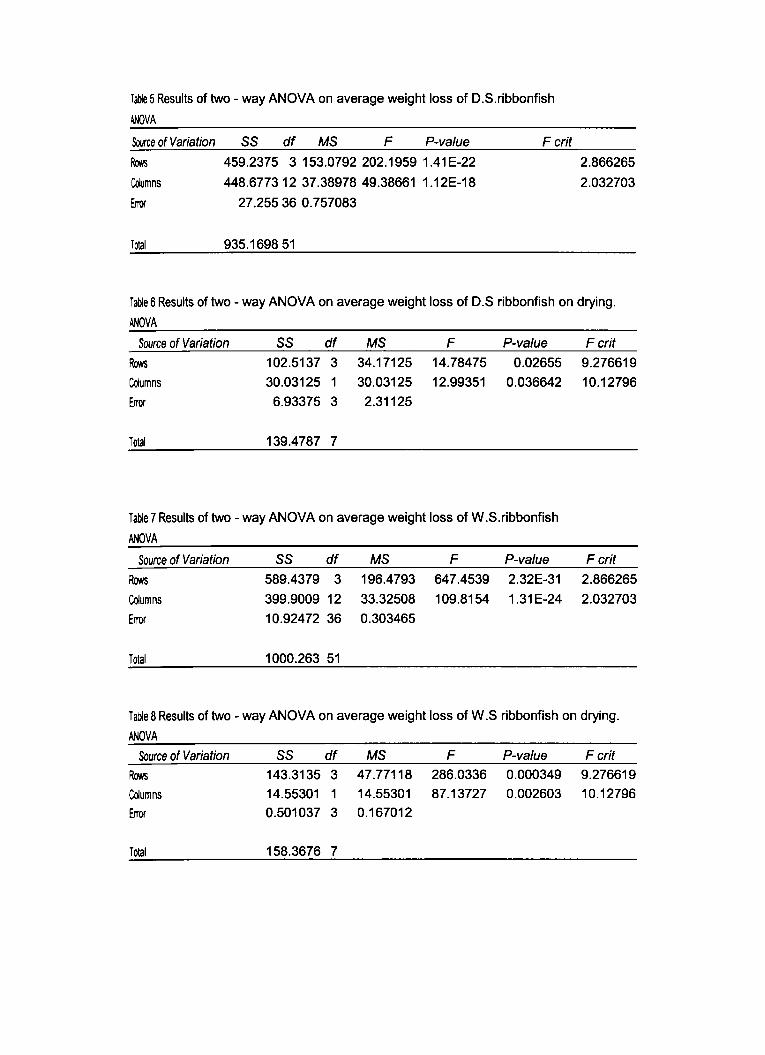
Table 5 Results of two - way ANOVA on average weight loss of D.S.ribbonfish
~OVA
Soorce of Variation SS df MS F P-value
~
Columns
Error
Total
459.2375 3 153.0792 202.1959 1.41 E-22
448.677312 37.38978 49.38661 1.12E-18
27.25536 0.757083
935.169851
F crit
2.866265
2.032703
Table 6 Results of two - way ANOVA on average weight loss of D.S ribbonfish on drying.
mOVA
Source of Variation SS df MS F P-value
Rows 102.5137 3 34.17125 14.78475 0.02655
Columns 30.03125 1 30.03125 12.99351 0.036642
Error 6.93375 3 2.31125
Total 139.4787 7
Table 7 Results of two - way ANOVA on average weight loss of W.S.ribbonfish
moVA
Source of Variation SS df MS F P-value
Rows 589.4379 3 196.4793 647.4539 2.32E-31
Columns 399.9009 12 33.32508 109.8154 1.31E-24
Error 10.92472 36 0.303465
Total 1000.263 51
F crit
9.276619
10.12796
F crit
2.866265
2.032703
T aoIe 8 Results of two - way ANOVA on average weight loss of W.S ribbonfish on drying.
mOVA
Source of Variation SS df MS F P-value F crit
Rows 143.3135 3 47.77118 286.0336 0.000349 9.276619
Columns 14.55301 1 14.55301 87.13727 0.002603 10.12796
Error 0.501037 3 0.167012
Total 158.3676 7
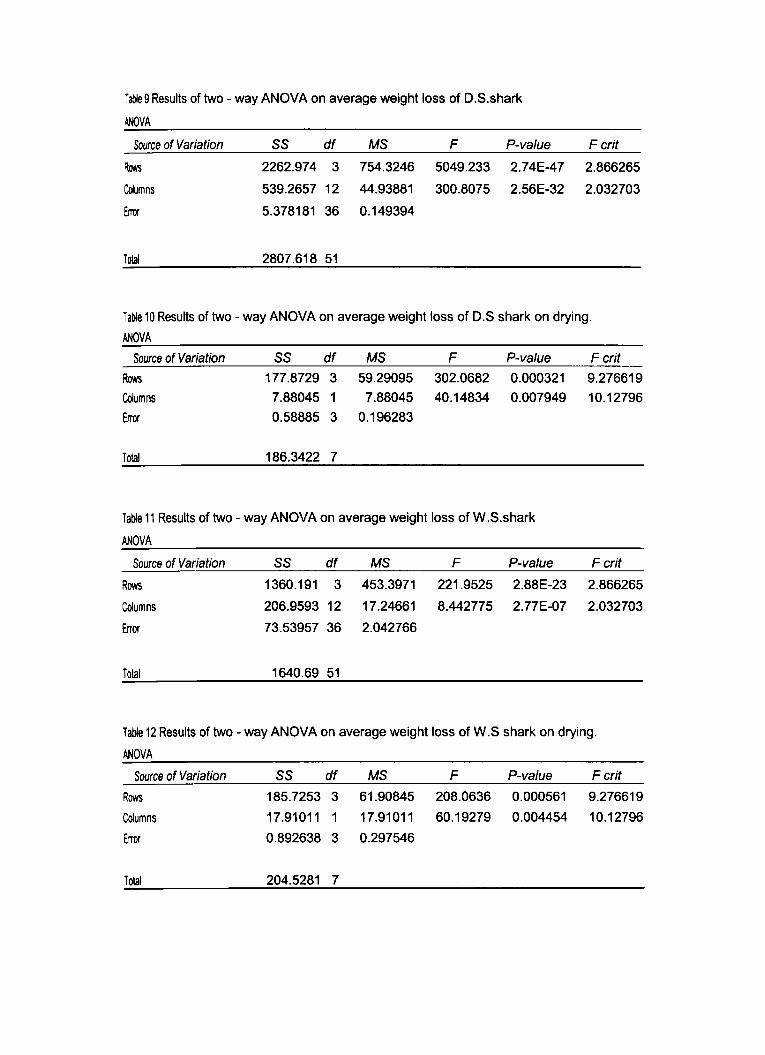
Table 9 Results of two - way ANOVA on average weight loss of D.S.shark
OOVA
Source of Variation SS df MS F P-value F crit
~ 2262.974 3 754.3246 5049.233 2.74E-47 2.866265
Columns 539.2657 12 44.93881 300.8075 2.56E-32 2.032703
Error 5.378181 36 0.149394
Total 2807.618 51
Table 10 Results of two - way ANOVA on average weight loss of D.S shark on drying.
mOVA
Source of Variation SS df MS F P-value F crit
Rows 177.8729 3 59.29095 302.0682 0.000321 9.276619
Columns 7.88045 1 7.88045 40.14834 0.007949 10.12796
Error 0.58885 3 0.196283
Total 186.3422 7
Table 11 Results of two - way ANOVA on average weight loss of W.S.shark
~OVA
Source of Variation
Rows Columns
Error
Total
SS df MS F P-value F crit
1360.191 3 453.3971 221.9525 2.88E-23 2.866265
206.9593 12 17.24661 8.442775 2.77E-07 2.032703
73.53957 36 2.042766
1640.69 51
Table 12 Results of two - way ANOVA on average weight loss of W.S shark on drying.
~OVA
Source of Variation SS df MS F P-value F crit
Rows 185.7253 3 61.90845 208.0636 0.000561 9.276619
Columns 17.91011 1 17.91011 60.19279 0.004454 10.12796
Error 0.892638 3 0.297546
Total 204.5281 7


![Salting in and Salting out of proteins and Dialysis ( Isolation Of Lactate Dehydrogenase Enzyme ) BCH 333 [practical]](https://static.fdocuments.net/doc/165x107/56649d305503460f94a08720/salting-in-and-salting-out-of-proteins-and-dialysis-isolation-of-lactate.jpg)

![Salting in and Salting out of proteins and Dialysis BCH 333 [practical]](https://static.fdocuments.net/doc/165x107/56649ef55503460f94c087a8/salting-in-and-salting-out-of-proteins-and-dialysis-bch-333-practical.jpg)