Business Process Monitoring for Retail POS and Retail F&R ...
59
Application Monitoring Set-up and User Guideline Business Process Monitoring for Retail POS and Retail F&R Version: 1.1 (ST-A/PI 01M and higher)
Transcript of Business Process Monitoring for Retail POS and Retail F&R ...

Application Monitoring Set-up and User Guideline
Business Process Monitoring for Retail POS and Retail F&R Version: 1.1 (ST-A/PI 01M and higher)
Contents 1 Introduction ......................................................................................................................... 5
1.1 Retail Basics .................................................................................................................. 5 1.1.1 Business Process “POS Inbound” ........................................................................... 5 1.1.2 Business Process “Forecast and Replenishment” .................................................... 6
1.2 How to Set Up and Use Business Process Monitoring.................................................... 8 1.2.1 Generic Set Up Procedure ...................................................................................... 8 1.2.2 Alert Inbox in Business Process Operations Work Center ..................................... 13
2 Monitoring of Business Process “POS Inbound” ................................................................ 16 2.1 Monitoring of PIPE Processing .................................................................................... 16
2.1.1 Background Information....................................................................................... 16 2.1.2 Purpose and Benefit.............................................................................................. 18 2.1.3 Monitoring Object “POS Transactions” (KIRET001) ........................................... 19 2.1.3.1 System Requirements........................................................................................ 19 2.1.3.2 Available Key Figures ...................................................................................... 19 2.1.3.3 Configuration on Monitoring Object Level ....................................................... 19 2.1.3.4 Key Figure “POS Transactions in Status Error“ ................................................ 20 2.1.3.5 Key Figure “POS Transactions in Status Warning“ ........................................... 20 2.1.3.6 Key Figure “POS Transactions in Status Unprocessed“..................................... 20 2.1.3.7 Key Figure “POS Transactions in Status Processed“ ......................................... 21 2.1.3.8 Key Figure “Turnover of POS Transactions in Status Error“ ............................. 21 2.1.3.9 Key Figure “Turnover of POS Transactions in Status Warning“........................ 21 2.1.3.10 Key Figure “Turnover of POS Transactions in Status Unprocessed“ .............. 22 2.1.3.11 Key Figure “Turnover of POS Transactions in Status Processed“ .................. 22 2.1.3.12 Key Figure “Messages created during POS Processing“ ................................ 23 2.1.3.13 Displaying Alert Details ................................................................................ 23
2.1.4 Monitoring Object “POS Aggregates” (KIRET002) ............................................. 24 2.1.4.1 System Requirements........................................................................................ 24 2.1.4.2 Available Key Figures ...................................................................................... 24 2.1.4.3 Configuration on Monitoring Object Level ....................................................... 25 2.1.4.4 Key Figure “Status: Aggregation Started“ ......................................................... 25 2.1.4.5 Key Figure “Status: Aggregation Completed“ ................................................... 25 2.1.4.6 Key Figure “Status: Outbound Processing Started“ ........................................... 25 2.1.4.7 Key Figure “Status: Outbound Processing Completed“ ..................................... 26 2.1.4.8 Key Figure “Status: Completed“ ....................................................................... 26 2.1.4.9 Key Figure “Processed Aggregates“.................................................................. 26 2.1.4.10 Key Figure “Aggregates with Status OK“ ...................................................... 27 2.1.4.11 Key Figure “Aggregates with Status Unprocessed“ ....................................... 27 2.1.4.12 Key Figure “Aggregates with Status Warning“ .............................................. 27 2.1.4.13 Key Figure “Aggregates with Status Error“ ................................................... 27 2.1.4.14 Displaying Alert Details ................................................................................ 28

2.2 Monitoring of Inbound Processing in ERP ................................................................... 28 2.2.1 Background Information....................................................................................... 28 2.2.2 Purpose and Benefit.............................................................................................. 31 2.2.3 Monitoring Object “POS Inbound Monitor in ERP” (REPOSERP) ....................... 31 2.2.3.1 System Requirements........................................................................................ 31 2.2.3.2 Available Key Figures ...................................................................................... 31 2.2.3.3 Configuration on Monitoring Object Level ....................................................... 32 2.2.3.4 Key Figure “Number of Stores with unfinished outbound processing status” .... 32 2.2.3.5 Key Figure “Number of Stores with incorrect outbound communication” ......... 32 2.2.3.6 Key Figure “Number of Stores with incorrect partner system messages” ........... 33 2.2.3.7 Key Figure “Number of Stores with unfinished inbound processing” ................ 33 2.2.3.8 Key Figure “Number of Stores with incomplete inbound transfer” .................... 33 2.2.3.9 Key Figure “Number of IDoc Message Types without Inbound Transfer” ......... 33 2.2.3.10 Key Figure “Number of IDoc Messages with Errors” .................................... 33 2.2.3.11 Displaying Alert Details ................................................................................ 34
3 Monitoring of Business Process “Forecast and Replenishment” ......................................... 35 3.1 Monitoring of F&R Connectivity Exceptions (ERP) .................................................... 35
3.1.1 Background Information....................................................................................... 35 3.1.2 Purpose and Benefit.............................................................................................. 36 3.1.3 Monitoring Object “F&R Connectivity Exceptions (ERP)” (REFRCONM) .......... 36 3.1.3.1 System Requirements........................................................................................ 36 3.1.3.2 Available Key Figures ...................................................................................... 37 3.1.3.3 Configuration on Monitoring Object Level ....................................................... 37 3.1.3.4 Key Figure “Number of Transmissions in Error Status” .................................... 37 3.1.3.5 Key Figure “Number of Interface Files in Error Status” .................................... 38 3.1.3.6 Displaying Alert Details.................................................................................... 38
3.2 Monitoring of F&R Connectivity Exceptions (SCM) ................................................... 39 3.2.1 Background Information....................................................................................... 39 3.2.2 Purpose and Benefit.............................................................................................. 40 3.2.3 Monitoring Object “F&R Connectivity Exceptions SCM” (REFRCONE) ............ 40 3.2.3.1 System Requirements........................................................................................ 40 3.2.3.2 Available Key Figures ...................................................................................... 40 3.2.3.3 Configuration on Monitoring Object Level ....................................................... 40 3.2.3.4 Key Figure “No. of Interface Records with Errors” ........................................... 40 3.2.3.5 Displaying Alert Details.................................................................................... 41
3.3 Monitoring of the FRP Dispatcher ............................................................................... 42 3.3.1 Background Information....................................................................................... 42 3.3.2 Purpose and Benefit.............................................................................................. 43 3.3.3 Monitoring Object “Retail F&R Dispatcher Activation” (REFREDIS) ................. 43 3.3.3.1 System Requirements........................................................................................ 43 3.3.3.2 Available Key Figures ...................................................................................... 43 3.3.3.3 Configuration on Monitoring Object Level ....................................................... 43

3.3.3.4 Key Figure “Status of FRP Dispatcher Processes” ............................................ 43 3.3.3.5 Key Figure “Messages in FRP Dispatcher Logs” .............................................. 44 3.3.3.6 Displaying Alert Details.................................................................................... 44
3.4 Monitoring of the F&R Location Status ....................................................................... 46 3.4.1 Background Information....................................................................................... 46 3.4.2 Purpose and Benefit.............................................................................................. 47 3.4.3 Monitoring Object “F&R Location Status” (REFRELST) ..................................... 47 3.4.3.1 System Requirements........................................................................................ 47 3.4.3.2 Available Key Figures ...................................................................................... 47 3.4.3.3 Configuration on Monitoring Object Level ....................................................... 48 3.4.3.4 Key Figure “Backlog: Locations with unprocessed tasks” ................................. 48 3.4.3.5 Key Figure “Backlog: Total number of unprocessed tasks” ............................... 49 3.4.3.6 Key Figure “Exceptions: Locations with erroneous tasks” ................................ 49 3.4.3.7 Key Figure “Exceptions: Total number of erroneous tasks” .............................. 49 3.4.3.8 Displaying Alert Details.................................................................................... 49
3.5 Monitoring of F&R Exceptions ................................................................................... 50 3.5.1 Background Information....................................................................................... 50 3.5.2 Purpose and Benefit.............................................................................................. 51 3.5.3 Monitoring Object “Retail F&R Exceptions” (REFREEXC) ................................ 51 3.5.3.1 System Requirements........................................................................................ 51 3.5.3.2 Available Key Figures ...................................................................................... 53 3.5.3.3 Configuration on Monitoring Object Level ....................................................... 53 3.5.3.4 Key Figures “Number of Exceptions with priority High/Medium/Low” ............ 53 3.5.3.5 Displaying Alert Details.................................................................................... 54
3.6 Monitoring of F&R Order Proposals ............................................................................ 54 3.6.1 Background Information....................................................................................... 54 3.6.2 Purpose and Benefit.............................................................................................. 56 3.6.3 Monitoring Object “F&R Order Proposals” (KIRET003) ..................................... 56 3.6.3.1 System Requirements........................................................................................ 56 3.6.3.2 Available Key Figures ...................................................................................... 56 3.6.3.3 Configuration on Monitoring Object Level ....................................................... 56 3.6.3.4 Key Figure “Order Proposals in Status Error” ................................................... 57 3.6.3.5 Key Figure “Order Proposals in Status Warning” .............................................. 57 3.6.3.6 Displaying Alert Details.................................................................................... 57
3.7 Monitoring of Data Consistency between SAP ERP and SAP SCM ............................. 59
1 Introduction This guide describes the available monitoring functionalities that are offered by Business Process Monitoring (BPMon) in SAP Solution Manager for Retail POS and Retail F&R processes. For each of the functionalities the technical prerequisites are listed, and the purpose and the properties of the functionality are described briefly. The guide does not intend to discuss a comprehensive monitoring concept for your Retail processes. Instead, it is recommended to use the Best Practice documents for Retail operations in order to define a generic approach for operating your Retail processes. These documents are available on SAP Service Marketplace under alias RUNSAP (http://www.service.sap.com/runsap Run SAP Best Practices):
“Manage Operations for SAP POS” “Manage Operations for SAP for Retail ERP Replenishment”
1.1 Retail Basics
1.1.1 Business Process “POS Inbound” POS Inbound is the process in which data collected at the Point of sale (POS) is transferred to a central system for subsequent processing. The POS Inbound process is extremely critical in a Retail environment because the core function of a retail system is to manage the distribution of goods to the customer. The distribution is mainly influenced by stock levels in the POS and the calculated requirements for each POS. The stock levels are managed in SAP ERP for Retail and updated by goods movements and sales activities carried out at the POS. Based on this data, replenishment requirements are calculated on a central system. In order to avoid expensive surplus or out of stock situations at the store, it is obvious that the passage of the sales information from the POS System to ERP and to potentially a Forecast & Replenishment tool has to be secured and closely monitored. Besides the update of stock levels, financial aspects also play an important role in this process as it is at the POS where retailers earn their money. Missing data can therefore cause serious irritations in subsequent applications as the turnover reporting may not reflect the real life showing mainly lower results and results in FI are also not correct. It is vital to the retailers business that no data is lost on the way. The complexity of this process involving various systems and processes underlines the importance of a well defined monitoring and scheduling landscape. Sales transactions are usually registered at the POS system located in the stores. This information is extracted on a regular basis (ranging from every few seconds to once a day) and transferred via an EAI middleware and transformation tool to POS Data Management’s central component called PIPE (POS Inbound Processing Engine). Within this tool the incoming data is verified and posted to subsequent applications. The design of PIPE allows to process data for each subsequent application either immediately or as a bulk process with a self-defined frequency and a customized aggregation level. Whereas data is mostly transferred in detail to SAP BI to enable detailed analysis and data mining, the data is aggregated by date, store and article in order to update follow-on applications such as SAP for Retail. The most common subsequent applications are SAP BI, SAP ERP and SAP F&R. The flexible design of PIPE however enables the possibility to provide other applications in an efficient way. Apart from sales data, other data generated at the POS such as goods movements or financial transactions as well as statistical information can be transferred using the same path as the sales data. The following figure provides an overview of the exemplary process:

1.1.2 Business Process “Forecast and Replenishment” SAP Forecasting and Replenishment is a highly automated solution for a Retail Company for the daily replenishment (re-supplying) of articles for stores and distribution centers. F&R is part of the software component SCM since release 4.1. F&R uses SCM master data (Products, Locations, calendars), enhanced with F&R specific master data (profiles, DIF, Procurement Cycles, Product Hierarchies etc.).

High-level System Landscape:
SAP Forecasting and Replenishment (SAP F&R) optimizes the internal logistics of Retail companies by improving the replenishment processes. It aims to:
Cut surplus stock in distribution centers and stores Reduce stock-outs in distribution centers and stores Lessen the large amount of manual work required by implementing highly automated
replenishment planning in stores and distribution centers Increase transparency in the supply chain through effective analysis
SAP F&R is a component of SAP Supply Chain Management. SAP F&R needs to be connected to an ERP system that provides relevant master data and transactional data. In the standard integration scenario SAP F&R is connected to SAP ERP for Retail. The process starts with the transfer of relevant data needed to run the automatic and manual replenishment. The output of the replenishment process is the order proposals that may be released automatically or marked as unreleased. In the latter case, the results of the automatic replenishment have to be reviewed in the manual release process. In each of the process steps, exceptions may be raised. Some exceptions can prevent the automatic release of the order proposals. Exceptions are to be processed in the Exception Workbench and/or during the review of automatic replenishment results in the Replenishment Workbench. As a result order proposals are released. Once again the loop is closed by transferring the released order proposals to the SAP ERP for Retail system for follow-up processing. The SAP ERP for Retail system converts the order proposal automatically into orders. In order to avoid expensive surplus or out-of-stock situations, it is necessary that the transfer of the master and transactional data information from the SAP ERP for Retail system to SAP F&R has to be secured and closely monitored. Missing data can falsify the forecast and replenishment calculation.
SAP BW
F&R Analysis
Historical data
SAP R/3 Retail Master Data Open Orders Stock/Inventory Promotions (DIF)
F&R in SAP SCM
Forecasted Time Series Created Order Proposals
Store POS system
(Point of sales)

Furthermore, the results of automatic replenishment need to be reviewed before transferring the order proposals to the SAP ERP for Retail system for follow-on processing.
1.2 How to Set Up and Use Business Process Monitoring In general, all steps described here for setting up and using the Business Process Monitoring refer to an SAP Solution Manager 7.0 system, EhP1 SP26, and to SAP Solution Manager 7.1 system, SP02, respectively. In older versions of the SAP Solution Manager the setup procedure as well as the handling of the Alert Inbox is slightly different. The following technical and functional prerequisites to start with the monitoring setup have to be fulfilled:
A solution is defined in SAP Solution Manager. All managed systems have to be connected to the SAP Solution Manager system, and Logical
Components have to be defined for these systems in the System Landscape (transaction SMSY). You have modeled a business process for Retail in the Solution Landscape Directory. Software add-on ST-A/PI 01M or higher is installed on all managed systems.
Refer to SAP notes 521820 and 784752 to find more details on these prerequisites.
1.2.1 Generic Set Up Procedure In order to set up monitoring for Retail processes in SAP Solution Manager several steps have to be performed inside the Business Process Monitoring Setup Session. These steps follow a well-defined procedure. Find below a generic description of these steps which can be applied to each Retail monitoring object that are described in the next chapters. Each time a certain monitoring object does not follow this generic approach the specifics will be described in the corresponding chapter.

Refer also to the “Setup Guide – Business Process Monitoring” for further details on how to set up BPMon. The document is available on SAP Service Marketplace under alias BPM (http://www.service.sap.com/bpm Media Library Technical Information “Setup Guide – Business Process Monitoring”). First call the Business Process Operations work center in SAP Solution Manager (transaction SOLMAN_WORKCENTER, tab “Business Process Operations”). Click on link “Setup Business Process Monitoring” in the “Common Tasks” section on the left side of the screen. Select your solution in the next screen in order to enter the BPMon setup session.
If you enter the BPMon Setup session initially you should first load the available monitoring objects from the managed systems. This has to be done as each application offers its own data collectors that only run if certain system prerequisites are fulfilled. SAP Solution Manager is not aware of which application-specific data collectors are available until you read this information from the managed systems. Navigate to check “Update Central Application Monitoring Repository”, click on button “Load Monitors”, tick all systems which belong to your business process and confirm.

Now, the actual setup can take place starting in check “Business Processes”. Select your business process for Retail and save.
Navigate to the check that was created new and that is named after your business process. Here, choose all the business process steps where monitoring should be assigned to and save.

Next, the monitoring type needs to be defined. All Retail-specific monitoring objects are of type “Application Monitors: Retail”. Select this monitoring type from the list and save.
On the next check “Application Monitors” use the value help in field “Monitor Name” to get the monitoring object of your choice. Provide a speaking name for the monitoring object, mark the checkbox in column “Select” and save. Note that you can have several monitoring objects assigned to one business process step or interface.

Each monitoring object offers one or more key figures and several selection criteria that are used to filter out the documents or interfaces to be monitored. Refer to the subsequent chapters to find specific information on the available key figures and selection criteria for each monitoring object. For each monitoring object a schedule has to be maintained which defines when data collection should be triggered on the managed systems. Refer to the general “Setup Guide – Business Process Monitoring” to find details on how to maintain the schedule.
On so-called key figure level threshold values for alerting have to be specified. As soon as a threshold value is exceeded, an alert is raised with the corresponding alert rating (yellow or red). If the threshold values are not exceeded, a green rating is set. The type of threshold values are specific for each monitoring object. Again, refer to the subsequent chapters to find more details on the threshold values for each functionality. Once you have entered all relevant information for the monitoring object, the monitoring customizing has to be generated and activated. This is done in check “Generation/Deactivation/Activation” by clicking buttons “Generate Customizing” and “Activate Monitoring”. A corresponding log is displayed after carrying out these steps, indicating any error situations that could prevent that the monitoring is working properly.

1.2.2 Alert Inbox in Business Process Operations Work Center
After activating the monitoring the data collectors will be run according to their monitoring schedule on the managed system. Based on the results of the data collection alerts are created in SAP Solution Manager. You can the view the results in the Alert Inbox of the Business Process Operations work center. In order to access the Alert Inbox call transaction SOLMAN_WORKCENTER and navigate to the “Business Process Operations” tab. You have two options to call the Alert Inbox. Either you click on the entry “Alert Inbox” on the left-hand side. In the selection screen choose the solution your Retail business process belongs to. This will open directly the Alert Inbox of this solution, and you can work with the alerts. Second, you can drill down through the different monitoring layers. Start on solution level by clicking on entry “Solution” on the left-hand side. If the displayed solution is not the one where you have set up the Retail monitoring, you can switch to the relevant solution by expanding the “Solutions with Active Business Process and Interface Monitoring” tray.
For each business process an icon indicates the highest alert rating that is available in the business process. By clicking on this icon the Alert Inbox opens directly, showing only the monitoring objects belonging to that business process. If you click on the name of the business process, a graphical overview on the business process is opened, showing the highest alert rating for each business process step or interface where monitoring is assigned to.

By clicking on one of the active business process steps or interfaces, the Alert Inbox opens for that specific step or interface. For each of the assigned key figures the latest alert and the total number of critical alerts is displayed, as well as the timestamps of the alert creation, and the affected managed system.

In order to see the alert history of each key figure, and to start error handling on the critical alerts, mark the key figure you are interested in. This opens a list at the bottom of the screen. Here, each single alert is listed (starting with the most recent at the top) together with an informative alert text, the timestamp of the alert creation, and the measured value that determined the alert rating according to the threshold values you provided during the setup.
In most cases a “Detail Info” functionality is available that provides you details on the alerts. Just mark the line of the alert you are interested in, and click on button “Detail Info”. You will then be led to the managed system where you can find details on the alerts either within the standard monitoring transaction, or in another overview screen (depending on the monitoring object). Refer to the chapters below to find more information on the “Detail Info” functionality for each monitoring object. Further actions can be taken from the alert overview (like creating tickets for the single alerts, or confirming alerts for which the error has been resolved). Refer to the “Setup Guide – Business Process Monitoring” available on SAP Service Marketplace to find a more detailed explanation on these features.

2 Monitoring of Business Process “POS Inbound” 2.1 Monitoring of PIPE Processing
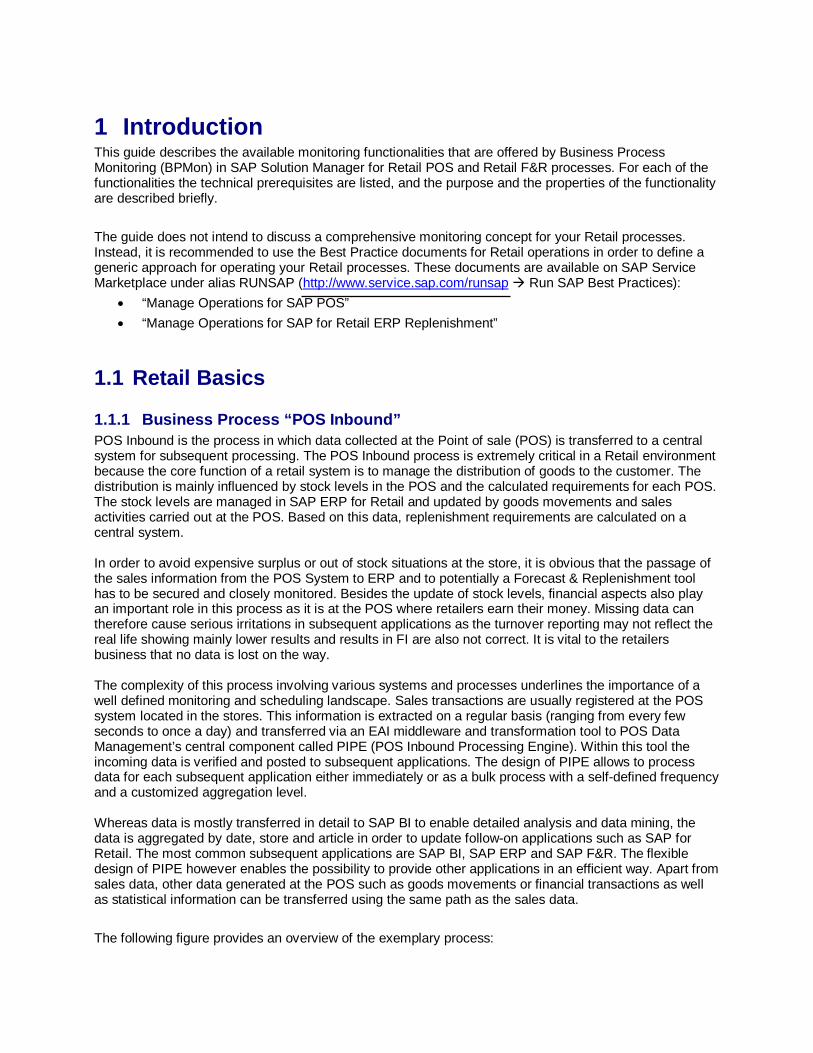
2.1.1 Background Information After loading the transactional data to SAP POS DM the incoming data needs to be validated by use of verification tasks. After this successful validation the data processing needs to be triggered for each processing step (or so called task) relevant for the actual information. Additionally the reprocessing for data which originally had been loaded with missing master data or other issues needs to be triggered. In most common cases, first several validation tasks are executed automatically by PIPE (via immediate task processing) to validate the incoming data. These tasks include one or several tasks to check the master data, the balancing of each ticket (the accumulated sales amount for one transaction must correspond to the amount of the payment types of the same transaction) and duplicate checking (to make sure data is only loaded once). After the verification tasks, processing tasks are executed. In order to check the status of the processing, the PIPE monitor (or POS Workbench, transaction /POSDW/MON0) should be opened or refreshed every few minutes if data is processed on a real-time or near real-time basis. If POS data is transferred only once a day, the monitor should be checked during and after processing. The entry screen of the POS Workbench provides selection criteria for selecting transactions related to specific stores, sales organizations or distribution channels. In addition it allows to select only data which are in a specific status (transactions with assigned tasks in status error, warning, unprocessed or processed successfully).
The result screen gives an overview about the selected transactions, their status, the assigned revenue and the messages created during the processing.
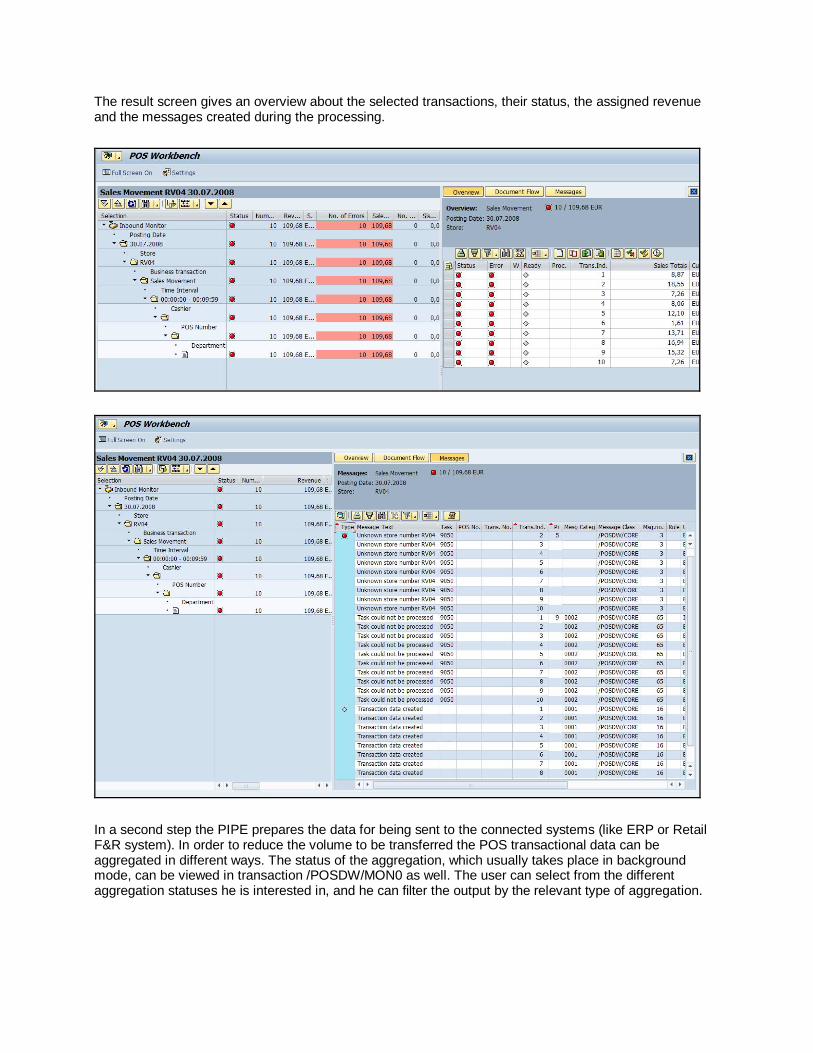
In a second step the PIPE prepares the data for being sent to the connected systems (like ERP or Retail F&R system). In order to reduce the volume to be transferred the POS transactional data can be aggregated in different ways. The status of the aggregation, which usually takes place in background mode, can be viewed in transaction /POSDW/MON0 as well. The user can select from the different aggregation statuses he is interested in, and he can filter the output by the relevant type of aggregation.

As a result, an overview is displayed showing the status of the different aggregation tasks.
2.1.2 Purpose and Benefit Two monitoring objects exist in BPMon which can be used to automate the monitoring of PIPE processing:
1) The monitoring object “POS Transactions” provides keyfigures where POS Transactions in a specific status are counted. An alert is created if for example more than 10 POS transactions were found with a creation date since yesterday with an error status. Another type of keyfigure can be used to create automatically alerts if the total revenue which is assigned to a selected set of transactions is higher than the customized threshold value.
One keyfigure can be used to alert on specific messages which were created during PIPE processing.
2) Monitoring object “POS Aggregates” allows for monitoring the status of the aggregation run, and for the number of single aggregations in a critical or successful status.

2.1.3 Monitoring Object “POS Transactions” (KIRET001) 2.1.3.1 System Requirements The managed system needs the BI content 7.03 with SP 6 or higher to be able to use the monitoring object POS Transactions. The minimum software level for ST-A/PI is 01M. The monitoring object has to be assigned to a business process step. The user who is executing the collector for this monitoring object needs to have the authorization object W_POS_TRAN assigned. The authorization field /POSDW/PAC has to be filled with “03”, the authorization field /POSDW/ST0 with “*” (see also note 784752). The relevant user is the one which is maintained in the RFC connection which is used for collecting the data (usually SM_BPMO).
2.1.3.2 Available Key Figures The data collector offers 9 keyfigures:
Key Figure Analysis Transaction
Description
POS Transactions in Status Error
/POSDW/MON0 Counts the number of POS Transactions in status ”Error”
POS Transactions in Status Warning
/POSDW/MON0 Counts the number of POS Transactions in status “Warning”
POS Transactions in Status Unprocessed
/POSDW/MON0 Counts the number of POS Transactions in status “Unprocessed”
POS Transactions in Status Processed
/POSDW/MON0 Counts the number of POS Transactions in status “Processed”
Turnover of POS Transactions in Status Error
/POSDW/MON0 Calculates the sum of the turnover of all transactions in status ”Error” lying in the defined time range
Turnover of POS Transactions in Status Warning
/POSDW/MON0 Calculates the sum of the turnover of all transactions in status “Warning” lying in the defined time range
Turnover of POS Transactions in Status Unprocessed
/POSDW/MON0 Calculates the sum of the turnover of all transactions in status “Unprocessed” lying in the defined time range
Turnover of POS Transactions in Status Processed
/POSDW/MON0 Calculates the sum of the turnover of all transactions in status “Processed” lying in the defined time range
Messages created during POS Processing
/POSDW/MON0 Counts the number messages of a specific type during PIPE processing
2.1.3.3 Configuration on Monitoring Object Level On monitoring object level, no filter criteria have to be defined. Only the schedule for data collection has to be specified in tab “Monitoring Schedule”. It is strongly recommended to observe the runtime of a collector and set the scheduling frequency accordingly (value for scheduling interval must be higher than the runtime of a collector). The runtime can be tested by starting the collector with the tool “TBI reports” from transaction ST13 on the managed system.

2.1.3.4 Key Figure “POS Transactions in Status Error“ This key figure returns the number of POS transactions in status “Error” whose posting date lies in the time range defined by the two parameters “Older than x days” and “Younger than y days”. In general, the following selection criteria are available:
Description Type Mandatory Select-Option F4 Help
Store C X X
Business Transaction C X X
Message Type C X X
Message Class C X X
Message Number C X X
Message Category C X X
Older than x days I
Younger than y days I
2.1.3.5 Key Figure “POS Transactions in Status Warning“ This key figure returns the number of POS transactions in status “Warning” whose posting date lies in the time range defined by the two parameters “Older than x days” and “Younger than y days”. In general, the following selection criteria are available:
Description Type Mandatory Select-Option F4 Help
Store C X X
Business Transaction C X X
Message Type C X X
Message Class C X X
Message Number C X X
Message Category C X X
Older than x days I
Younger than y days I
2.1.3.6 Key Figure “POS Transactions in Status Unprocessed“ This key figure returns the number of POS transactions in status “Unprocessed” whose posting date lies in the time range defined by the two parameters “Older than x days” and “Younger than y days”. In general, the following selection criteria are available:
Description Type Mandatory Select-Option F4 Help
Store C X X
Business Transaction C X X
Message Type C X X

Message Class C X X
Message Number C X X
Message Category C X X
Older than x days I
Younger than y days I
2.1.3.7 Key Figure “POS Transactions in Status Processed“ This key figure returns the number of POS transactions in status “Processed” which where processed either on the day before the data collector is running, or on the current day (depending on the settings in parameter “Data from previous day”). In general, the following selection criteria are available:
Description Type Mandatory Select-Option F4 Help
Store C X X
Business Transaction C X X
Data from previous day C X
2.1.3.8 Key Figure “Turnover of POS Transactions in Status Error“ This key figure returns the total turnover of all POS transactions in status “Error” whose posting date lies in the time range defined by the two parameters “Older than x days” and “Younger than y days”. In general, the following selection criteria are available:
Description Type Mandatory Select-Option F4 Help
Store C X X
Business Transaction C X X
Currency C X X
Message Type C X X
Message Class C X X
Message Number C X X
Message Category C X X
Older than x days I
Younger than y days I
2.1.3.9 Key Figure “Turnover of POS Transactions in Status Warning“ This key figure returns the total turnover of all POS transactions in status “Warning” whose posting date lies in the time range defined by the two parameters “Older than x days” and “Younger than y days”. In general, the following selection criteria are available:

Description Type Mandatory Select-Option F4 Help
Store C X X
Business Transaction C X X
Currency C X X
Message Type C X X
Message Class C X X
Message Number C X X
Message Category C X X
Older than x days I
Younger than y days I
2.1.3.10 Key Figure “Turnover of POS Transactions in Status Unprocessed“ This key figure returns the total turnover of all POS transactions in status “Unprocessed” whose posting date lies in the time range defined by the two parameters “Older than x days” and “Younger than y days”. In general, the following selection criteria are available:
Description Type Mandatory Select-Option F4 Help
Store C X X
Business Transaction C X X
Currency C X X
Message Type C X X
Message Class C X X
Message Number C X X
Message Category C X X
Older than x days I
Younger than y days I
2.1.3.11 Key Figure “Turnover of POS Transactions in Status Processed“ This key figure returns the total turnover of all POS transactions in status “Processed” which where processed either on the day before the data collector is running, or on the current day (depending on the settings in parameter “Data from previous day”). In general, the following selection criteria are available:
Description Type Mandatory Select-Option F4 Help
Store C X X
Business Transaction C X X
Currency C X X
Data from previous day C X

2.1.3.12 Key Figure “Messages created during POS Processing“ This key figure returns all messages which were created during processing of POS transactions. The time range is defined by the two parameters “Older than x days” and “Younger than y days”. In general, the following selection criteria are available: Description Type Mandatory Select-Option F4 Help
Store C X X
Message Type C X X
Message Class C X X
Message Number C X X
Message Category C X X
Task C X X
Older than x days I
Younger than y days I
2.1.3.13 Displaying Alert Details As soon as alerts are created in the monitoring session it is possible to see the detail list which is related to such an alert (only the detail list of the last collector run is available). If you are interested in the detail list press the “Detail Info” button.
Then an RFC connection to the managed system is opened and an ALV list with more detailed information is shown. It is also possible to jump from this ALV list into the monitoring transaction /POSDW/MON0 for one of the chosen entries in the detail list.

2.1.4 Monitoring Object “POS Aggregates” (KIRET002) 2.1.4.1 System Requirements The managed system needs the BI content 7.03 with SP 6 or higher to be able to use the monitoring object POS Transactions. The minimum software level for ST-A/PI is 01M. The monitoring object has to be assigned to a business process step.
2.1.4.2 Available Key Figures The data collector offers 9 keyfigures:
Key Figure Analysis Transaction
Description
Status: Aggregation started
/POSDW/MON0 Counts the number of POS aggregates in status “Aggregation started”
Status: Aggregation completed
/POSDW/MON0 Counts the number of POS aggregates in status “Aggregation completed”
Status: Outbound Processing started
/POSDW/MON0 Counts the number of POS aggregates in status “Outbound processing started”
Status: Outbound Processing completed
/POSDW/MON0 Counts the number of POS aggregates in status “Outbound processing completed”
Status: Completed /POSDW/MON0 Counts the number of POS aggregates in status “Completed”
Processed Aggregates
/POSDW/MON0 Counts the number of POS aggregates which have at least one package in status “OK” or “Warning”
Aggregates with Status OK
/POSDW/MON0 Counts the number of POS aggregates which have at least one package in status “OK”
Aggregates with Status Unprocessed
/POSDW/MON0 Counts the number of POS aggregates which have at least one package in status “Unprocessed”

Aggregates with Status Warning
/POSDW/MON0 Counts the number of POS aggregates which have at least one package in status “Warning”
Aggregates with Status Error
/POSDW/MON0 Counts the number of POS aggregates which have at least one package in status “Error”
2.1.4.3 Configuration on Monitoring Object Level On monitoring object level, no filter criteria have to be defined. Only the schedule for data collection has to be specified in tab “Monitoring Schedule”. It is strongly recommended to observe the runtime of a collector and set the scheduling frequency accordingly (value for scheduling interval must be higher than the runtime of a collector). The runtime can be tested by starting the collector with the tool “TBI reports” from transaction ST13 on the managed system.
2.1.4.4 Key Figure “Status: Aggregation Started“ On key figure level double-click on the field counter and a selection screen will open showing the selection criteria (depending on the chosen keyfigure).The following selection criteria are available:
Description Type Mandatory Select-Option F4 Help
Store C X X
Aggregation Level C X X
Aggregation Task C X X
Older than x days I
Younger than y days I
2.1.4.5 Key Figure “Status: Aggregation Completed“ On key figure level double-click on the field counter and a selection screen will open showing the selection criteria (depending on the chosen keyfigure).The following selection criteria are available:
Description Type Mandatory Select-Option F4 Help
Store C X X
Aggregation Level C X X
Aggregation Task C X X
Older than x days I
Younger than y days I
2.1.4.6 Key Figure “Status: Outbound Processing Started“ On key figure level double-click on the field counter and a selection screen will open showing the selection criteria (depending on the chosen keyfigure).The following selection criteria are available:

Description Type Mandatory Select-Option F4 Help
Store C X X
Aggregation Level C X X
Aggregation Task C X X
Older than x days I
Younger than y days I
2.1.4.7 Key Figure “Status: Outbound Processing Completed“ On key figure level double-click on the field counter and a selection screen will open showing the selection criteria (depending on the chosen keyfigure).The following selection criteria are available:
Description Type Mandatory Select-Option F4 Help
Store C X X
Aggregation Level C X X
Aggregation Task C X X
Older than x days I
Younger than y days I
2.1.4.8 Key Figure “Status: Completed“ On key figure level double-click on the field counter and a selection screen will open showing the selection criteria (depending on the chosen keyfigure). The following selection criteria are available:
Description Type Mandatory Select-Option F4 Help
Store C X X
Aggregation Level C X X
Aggregation Task C X X
Data from previous day C X
2.1.4.9 Key Figure “Processed Aggregates“ On key figure level double-click on the field counter and a selection screen will open showing the selection criteria (depending on the chosen keyfigure). The following selection criteria are available:
Description Type Mandatory Select-Option F4 Help
Store C X X
Aggregation Level C X X
Aggregation Task C X X
Data from previous day C X

2.1.4.10 Key Figure “Aggregates with Status OK“ On key figure level double-click on the field counter and a selection screen will open showing the selection criteria (depending on the chosen keyfigure). The following selection criteria are available:
Description Type Mandatory Select-Option F4 Help
Store C X X
Aggregation Level C X X
Aggregation Task C X X
Data from previous day C X
2.1.4.11 Key Figure “Aggregates with Status Unprocessed“ On key figure level double-click on the field counter and a selection screen will open showing the selection criteria (depending on the chosen keyfigure). The following selection criteria are available:
Description Type Mandatory Select-Option F4 Help
Store C X X
Aggregation Level C X X
Aggregation Task C X X
Older than x days I
Younger than y days I
2.1.4.12 Key Figure “Aggregates with Status Warning“ On key figure level double-click on the field counter and a selection screen will open showing the selection criteria (depending on the chosen keyfigure). The following selection criteria are available:
Description Type Mandatory Select-Option F4 Help
Store C X X
Aggregation Level C X X
Aggregation Task C X X
Older than x days I
Younger than y days I
2.1.4.13 Key Figure “Aggregates with Status Error“ On key figure level double-click on the field counter and a selection screen will open showing the selection criteria (depending on the chosen keyfigure). The following selection criteria are available:
Description Type Mandatory Select-Option F4 Help
Store C X X
Aggregation Level C X X
Aggregation Task C X X
Older than x days I
Younger than y days I
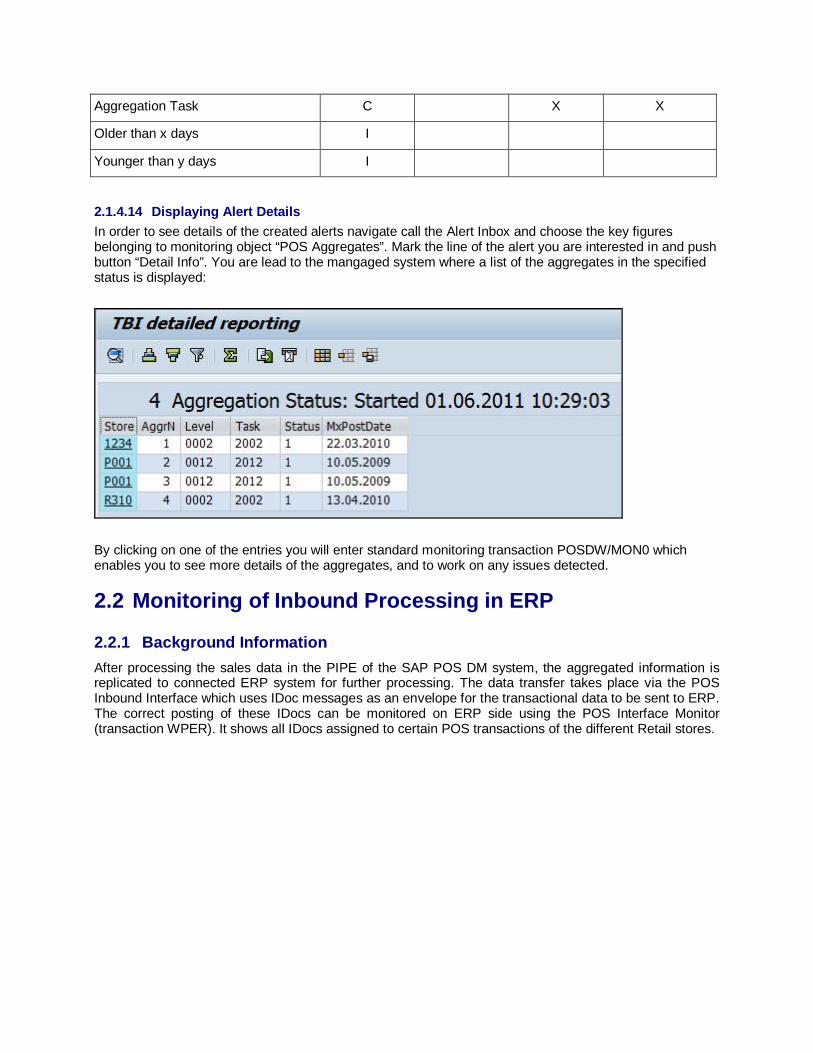
2.1.4.14 Displaying Alert Details In order to see details of the created alerts navigate call the Alert Inbox and choose the key figures belonging to monitoring object “POS Aggregates”. Mark the line of the alert you are interested in and push button “Detail Info”. You are lead to the mangaged system where a list of the aggregates in the specified status is displayed:
By clicking on one of the entries you will enter standard monitoring transaction POSDW/MON0 which enables you to see more details of the aggregates, and to work on any issues detected.
2.2 Monitoring of Inbound Processing in ERP
2.2.1 Background Information After processing the sales data in the PIPE of the SAP POS DM system, the aggregated information is replicated to connected ERP system for further processing. The data transfer takes place via the POS Inbound Interface which uses IDoc messages as an envelope for the transactional data to be sent to ERP. The correct posting of these IDocs can be monitored on ERP side using the POS Interface Monitor (transaction WPER). It shows all IDocs assigned to certain POS transactions of the different Retail stores.
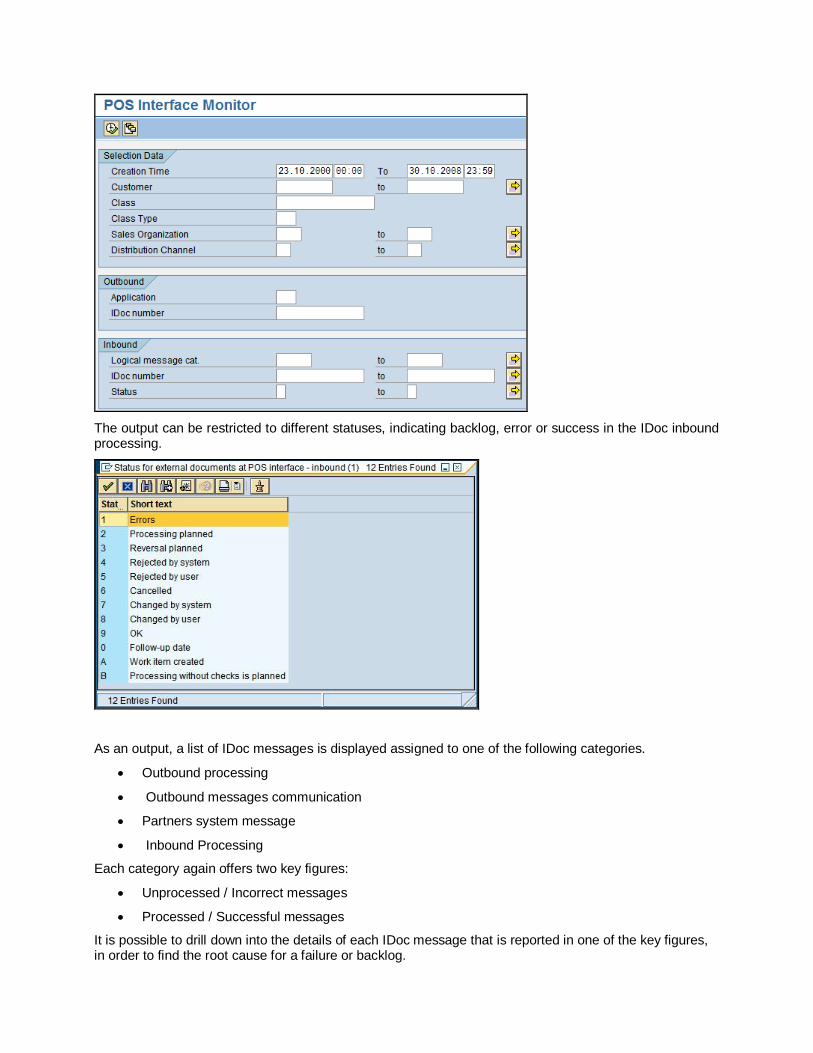
The output can be restricted to different statuses, indicating backlog, error or success in the IDoc inbound processing.
As an output, a list of IDoc messages is displayed assigned to one of the following categories.
Outbound processing
Outbound messages communication
Partners system message
Inbound Processing
Each category again offers two key figures:
Unprocessed / Incorrect messages
Processed / Successful messages
It is possible to drill down into the details of each IDoc message that is reported in one of the key figures, in order to find the root cause for a failure or backlog.
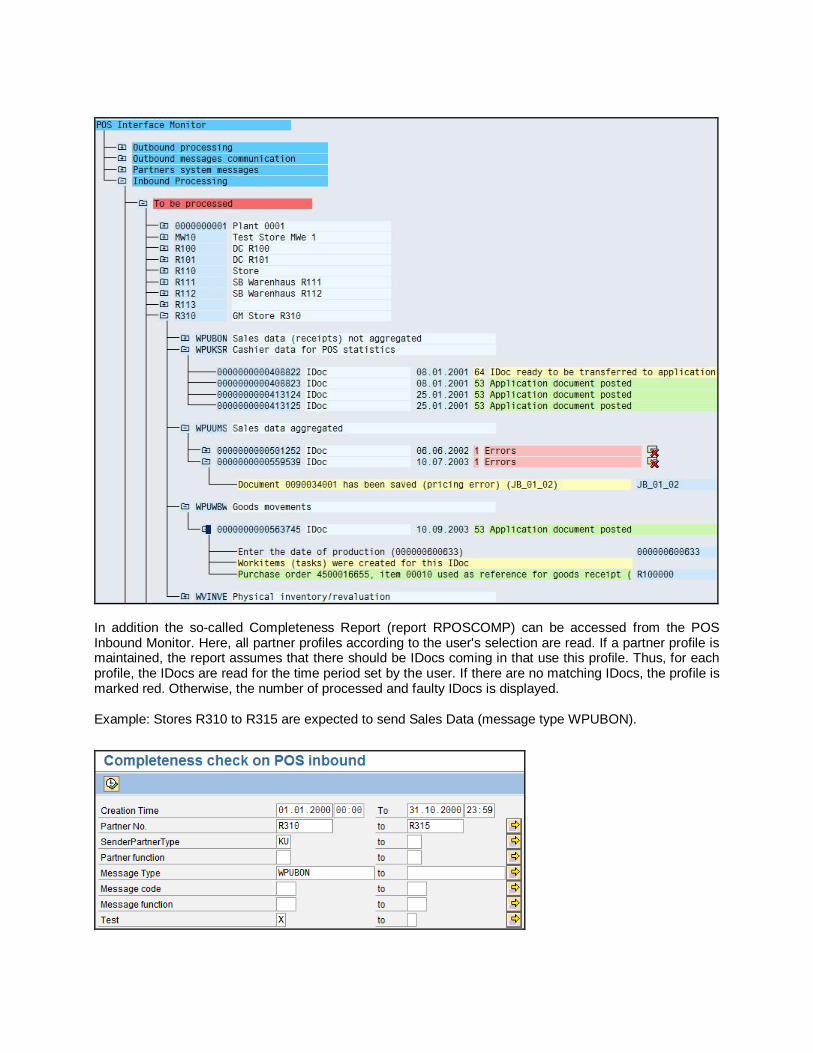
In addition the so-called Completeness Report (report RPOSCOMP) can be accessed from the POS Inbound Monitor. Here, all partner profiles according to the user's selection are read. If a partner profile is maintained, the report assumes that there should be IDocs coming in that use this profile. Thus, for each profile, the IDocs are read for the time period set by the user. If there are no matching IDocs, the profile is marked red. Otherwise, the number of processed and faulty IDocs is displayed. Example: Stores R310 to R315 are expected to send Sales Data (message type WPUBON).

The result shows four Stores, which have sent several IDoc messages, where some of them are in error state. Two stores have sent no IDocs at all.
2.2.2 Purpose and Benefit The monitoring object “POS Inbound Monitor in ERP” can be used for automatic monitoring of the POS Inbound Interface instead of monitoring the results of transaction WPER and the Completeness Report manually. The available key figures offer a comparable functionality as provided by the POS Interface Monitor and the Completeness Report.
2.2.3 Monitoring Object “POS Inbound Monitor in ERP” (REPOSERP) 2.2.3.1 System Requirements The managed system must be an SAP ERP 6.0 SP09 system or higher. You can assign this monitoring object either to a business process step or to an interface.
2.2.3.2 Available Key Figures The data collector offers the following key figures:
Key Figure Analysis Transaction
Description
Number of Stores with unfinished outbound processing status*
WPER Counts the number of stores with unfinished outbound processing
Number of Stores with incorrect outbound communication*
WPER Counts the number of stores with incorrect outbound communication according
Number of Stores with incorrect partner system messages
WPER Counts the number of stores with incorrect partner system messages

Number of Stores with unfinished inbound processing
WPER Counts the number of stores with unfinished inbound processing
Number of Stores with incomplete inbound transfer
WPER Counts the number of stores with incomplete inbound transfer
Number of IDoc Message Types without Inbound Transfer
Report RPOSCOMP
Counts the number of IDoc message types without inbound transfer
Number of IDoc Messages with Errors
Report RPOSCOMP
Counts the number of IDoc messages with errors
*not relevant for business process “POS Inbound”
2.2.3.3 Configuration on Monitoring Object Level On Monitoring Object level first select the key figures you want to monitor in tab “Key Figures”. Then, in tab “Detail Information” filter criteria to specify the monitoring have to be defined: Double-click the counter “001” in order to open a selection screen. The following selection criteria can be maintained: Description Type Mandatory Select-Option F4 Help
Sales Organisation C X X
Distribution Channel C X X
Retail Store ID C X X
Wildcard characters are allowed. You can use button "Validation" to check if your entries are correct. In tab “Monitoring Schedule” the scheduling for data collection has to be defined.
2.2.3.4 Key Figure “Number of Stores with unfinished outbound processing status” This key figure counts the number of stores with unfinished outbound processing according to the selection criteria on header level. The value is derived from section "Outbound Processing => Not fully processed" in the POS Interface Monitor (transaction WPER).
Description Type Mandatory Select-Option F4 Help
Outbound Application C X
Note that this key figure is not intended to be used in monitoring of business process “POS Inbound”.
2.2.3.5 Key Figure “Number of Stores with incorrect outbound communication” This key figure counts the number of stores with incorrect outbound communication according to the selection criteria on header level. The value is derived from section "Outbound messages communication => Communication incorrect" in the POS Interface Monitor (transaction WPER).
Description Type Mandatory Select-Option F4 Help
Outbound Application C X

Note that this key figure is not intended to be used in monitoring of business process “POS Inbound”.
2.2.3.6 Key Figure “Number of Stores with incorrect partner system messages” This key figure counts the number of stores with incorrect partner system messages according to the selection criteria on header level. The value is derived from section " Partners system messages => ..." in POS Interface Monitor (transaction WPER).
Description Type Mandatory Select-Option F4 Help
Inbound Status C X
2.2.3.7 Key Figure “Number of Stores with unfinished inbound processing” This key figure counts the number of stores with unfinished inbound processing according to the selection criteria on header level. The value is derived from section "Inbound Processing => To be processed" in the POS Interface Monitor (transaction WPER).
Description Type Mandatory Select-Option F4 Help
Inbound Status C X
2.2.3.8 Key Figure “Number of Stores with incomplete inbound transfer” This key figure counts the number of stores with incomplete inbound transfer according to the selection criteria on header level. The value is derived from "Completeness check on POS inbound => Partners with incomplete transfer" in the POS Interface Monitor (transaction WPER).
Description Type Mandatory Select-Option F4 Help
IDoc Message Type C X
2.2.3.9 Key Figure “Number of IDoc Message Types without Inbound Transfer” This key figure counts the number of IDoc message types without inbound transfer according to the selection criteria on header level. The value is derived from section "Completeness check on POS inbound => Message categories without transfer" in the Completeness Report (report RPOSCOMP).
Description Type Mandatory Select-Option F4 Help
IDoc Message Type C X
2.2.3.10 Key Figure “Number of IDoc Messages with Errors” This key figure counts the number of IDoc messages with errors according to the selection criteria on header level. The value is derived from section "Completeness check on POS inbound => IDocs with errors" in the Completeness Report (report RPOSCOMP).
Description Type Mandatory Select-Option F4 Help
IDoc Message Type C X

2.2.3.11 Displaying Alert Details As soon as alerts are created in the Allert Inbox alerting details can be displayed via the “Detail Info” functionality directly in the managed ERP system. Mark the line of the alert you are interested in the details and use push-button “Detail Info” to call the managed system.
Depending on the key figure you will be led either to transaction WPER (in order to find details on the stores with issues in inbound processing), or the output of the Completeness Report (report RPOSCOMP) is displayed, showing details on the IDoc Inbound processing for the different partner profiles.

3 Monitoring of Business Process “Forecast and Replenishment”
3.1 Monitoring of F&R Connectivity Exceptions (ERP)
3.1.1 Background Information
Within a replenishment process data needs to be exchanged between the ERP system and the connected SCM system where the actual planning run is carried out. This data exchange takes place interface-specific via messages. The F&R R/3 Connectivity Exceptions Monitor FRE_UI can be used to display these messages and interface files sent from ERP to SCM, as well as any exceptions that occur during processing. Transaction FRE_UI also allows to delete messages/exceptions which is however not relevant for monitoring and hence is out of scope here. In the entry screen the user can select either which messages/exceptions should be displayed by restricting the output with the following selection criteria:
Interface Transmission Date / Time Object Object Key Message Type Message Class Message Number
Or one can display the interface files by selecting File Name, Interface, and Send Date:

After executing the detail screen of the messages/exceptions part is called displaying all messages which fit to the selection criteria. The output is aggregated into transmissions (one transmission can consist of one or more messages):
When calling the detail screen for the interface files a list will be generated with all interface files and their current status.
3.1.2 Purpose and Benefit
The Monitoring Object "F&R Connectivity Exceptions Monitor (ERP)" checks for transmissions and interface files in error which are created in a Retail F&R Process in the interface between ERP and SCM system on ERP side. It can be used for automatic monitoring and alerting instead of the standard transaction FRE_UI.
Note: In order to ensure a comprehensive monitoring of the interface traffic between ERP and SCM system in the F&R process it is strongly recommended to set up the monitoring object "F&R Connectivity Exceptions Monitor (SCM)" in addition (technical name REFRCONE). This monitoring object checks for errors in the inbound processing of interface records sent from ERP to SCM system.
3.1.3 Monitoring Object “F&R Connectivity Exceptions (ERP)” (REFRCONM) 3.1.3.1 System Requirements The managed system must be either an SAP ERP 6.0 SP09 system, or an SAP ERP 6.02 system and higher. You can assign this monitoring object either to a business process step or to an interface.

3.1.3.2 Available Key Figures The data collector offers two key figures:
Key Figure Analysis Transaction
Description
Number of Transmissions in error status
FRE_UI Counts the number of erroneous transmissions present on monitored ERP system (only transmissions where at least one message with message type ‘E’ is present are taken into consideration). Note that the data collector counts the number of transmissions, not messages (a single message might consist of one or more transmissions).
Number of Interface Files in error status
FRE_UI Counts the number of erroneous interface files present on monitored ERP system. If reprocessing took place for a specific interface file, it is taken into account for monitoring only if reprocessing failed, too.
3.1.3.3 Configuration on Monitoring Object Level On monitoring object level first select the key figures you want to monitor in tab “Key Figures”. Then, in tab “Detail Information” filter criteria to specify the monitoring have to be defined: Double-click the counter “001” in order to open a selection screen. Only one selection criterion can be maintained: Description Type Mandatory Select-Option F4 Help
Interface Type C X X
Wildcard characters are allowed. You can use button "Validation" to check if your entries are correct. In tab “Monitoring Schedule” the scheduling for data collection has to be defined. Depending on the data collector mode you choose it is either recommend to run the data collection continuously over the day (mode DELTA) or once a day (collector mode ALL).
3.1.3.4 Key Figure “Number of Transmissions in Error Status” On key figure level further filter criteria can be maintained that will restrict the data collection further if necessary. Doubleclick the counter “001” to open a new selection screen. The following parameters are availabe:
Description Type Mandatory Select-Option F4 Help
Object C X
Message Class C X
Message Number C X
Select x days in past I
Collector mode C X
Notes:
Parameter “Select x days in past” restricts the number of days data is collected in the past. If not filled, data collection takes place only at the day the collector is scheduled to run. In order to avoid too high volume to be read from database, the parameter can only be set to a maximum of 180 days in the past.

Parameter “Collector Mode” defines which data collection mode is used. In case mode ALL is set, the data collector counts all entries in error status to be found on ERP system in accordance with the filter criterion “Select x days in past”. If mode DELTA is chosen, the “Select x days in past” value is only used for the initial data collection run. For all subsequent runs, only those entries are alerted which came in newly since the last data collection. If you do not provide a value, mode DELTA is chosen per default.
You can use button "Validation" to check if your entries are correct. 3.1.3.5 Key Figure “Number of Interface Files in Error Status” Double-click the counter “001” in order to maintain filter criteria for this key figure. The following parameters are available: Description Type Mandatory Select-Option F4 Help
Select x days in past I
Collector mode C X
Both parameters work exactly as described for key figure “Number of Transmissions in error status”. You can use button "Validation" to check if your entries are correct. 3.1.3.6 Displaying Alert Details As soon as alerts are created in the Allert Inbox alerting details (i.e. the erroneous transmissions and interface files) can be displayed via the “Detail Info” functionality directly in the managed ERP system. Mark the line of the alert you are interested in the details and use push-button “Detail Info” to call transaction FRE_UI on the corresponding backend system.
Depending on the Key Figure transaction FRE_UI then displays only those entries (either transmissions or interfaces files) which fit to the selection criteria and are currently in error status.

3.2 Monitoring of F&R Connectivity Exceptions (SCM)
3.2.1 Background Information
Within a replenishment process data needs to be exchanged between the ERP system and the connected SCM system where the actual planning run is carried out. This data exchange takes place interface-specific via messages. In a Retail SCM system the Interface Workbench /FRE/CON can be used to search for erroneous interface records which were transferred from the connected ERP system. In the entry screen the user can select which interface types (“message types”) should be displayed in detail, and he can restrict the output according to the following selection criteria:
Product Product Type Target / Source Location Target / Source Location Type
When calling the detail screen of the Interface Workbench, the header data and the alert messages of all selected interface records is displayed.

3.2.2 Purpose and Benefit
The monitoring object "F&R Connectivity Exceptions Monitor (SCM)" checks for interface records in error which are created in a Retail F&R Process in the interface between ERP and SCM system on SCM side. It can be used for automatic monitoring and alerting instead of the standard transaction /FRE/CON.
Note: In order to ensure a comprehensive monitoring of the interface traffic between ERP and SCM system in the F&R process it is strongly recommended to setup the monitoring object "F&R Connectivity Exceptions Monitor (ERP)" in addition (technical name REFRCONM). This monitoring object checks for errors in the outbound processing of transmissions and interface files sent from ERP to SCM system.
3.2.3 Monitoring Object “F&R Connectivity Exceptions SCM” (REFRCONE) 3.2.3.1 System Requirements The managed system must be a SAP SCM 5.1 system or later (software component SCM >= 510). You can assign this monitoring object either to a business process step or to an interface.
3.2.3.2 Available Key Figures The data collector offers one key figure:
Key Figure Analysis Transaction
Description
Number of Interface Records with Errors
/FRE/CON Counts the number of erroneous interface records present on the SCM system
3.2.3.3 Configuration on Monitoring Object Level On monitoring object level first select the key figures you want to monitor in tab “Key Figures”. Then, in tab “Detail Information” filter criteria to specify the monitoring have to be defined: Doubleclick the counter “001” in order to open a selection screen. Only one selection criterion can be maintained: Description Type Mandatory Select-Option F4 Help
Interface Type C X X
Wildcard characters are allowed. You can use button "Validation" to check if your entries are correct. In tab “Monitoring Schedule” the scheduling for data collection has to be defined. Depending on the data collector mode you choose it is either recommend to run the data collection continuously over the day (mode DELTA) or once a day (collector mode ALL).
3.2.3.4 Key Figure “No. of Interface Records with Errors” On key figure level further filter criteria can be maintained that will restrict the data collection further if necessary. Double-click the counter “001” to open a new selection screen. The following parameters are available:
Description Type Mandatory Select-Option F4 Help
Product C(40) X
Product Type C(2) X
Target Location C(20) X

Target Location Type C(4) X
Source Location C(20) X
Source Location Type C(4) X
Select x days in past I
Collector mode C X
Notes:
Parameters “Product”, “Product Type”, “Target/Source Location”, and “Target/Source Location Type” are only taken into account for data collection when the maximum number of characters (as indicated in the table above) is not exceeded
The value help for parameter "Product" reads its entries from table /FRE/BIF_MATKEY, not from general master data table /SAPAPO/MATKEY. Thus the values offered there might be very dynamic depending on the data which is present in /FRE/BIF_MATKEY. If you want to set up monitoring for a product that is currently not contained in the table, you can also enter values manually. However, ensure that these values have the same format which can be found on database (see transaction SE17), otherwise they will not be taken into consideration for data collection.
Parameter “Select x days in past” restricts the number of days data is collected in the past. If not filled, data collection takes place only at the day the collector is scheduled to run. In order to avoid too high volume to be read from database, the parameter can only be set to a maximum of 180 days in the past.
Parameter “Collector Mode” defines which data collection mode is used. In case mode ALL is set, the data collector counts all entries in error status to be found on ERP system in accordance with the filter criterion “Select x days in past”. If mode DELTA is chosen, the “Select x days in past” value is only used for the initial data collection run. For all subsequent runs, only those entries are alerted which came in newly since the last data collection. If you do not provide a value, mode DELTA is chosen per default
You can use button "Validation" to check if your entries are correct.
3.2.3.5 Displaying Alert Details In order to display all alerted entries in the Interface Workbench in managed SCM system the detail information functionality can be used. Mark the line of the alert you are interest in the details and push button “Detail Info”.

The Interface Workbench /FRE/CON is then called directly (without the entry screen for selecting the interface records). Note that for technical reasons the display is not restricted to the maximum number of days as specified during the BPMon configuration. Instead, all interface records are displayed which are currently in error status and which fit to the other selection criteria maintained in BPMon Setup session.
3.3 Monitoring of the FRP Dispatcher
3.3.1 Background Information The FRP Dispatcher is a tool for automatic background processing of FRP in SAP Forecasting and Replenishment 5.0. It consists of three processes:
The dispatcher itself is responsible for background processing Its status is controlled by the controller process Events are transferred to the dispatcher by the event handler process.

In addition there are five different types of FRP logs: Dispatcher activation log Dispatcher start log Dispatcher processing log Controller processing log Event Handler processing log
3.3.2 Purpose and Benefit The data collector fetches the dispatcher status and log entry counters from the SCM system and displays them as alerts within the Solution Manager's Business Process Monitoring.
3.3.3 Monitoring Object “Retail F&R Dispatcher Activation” (REFREDIS) 3.3.3.1 System Requirements The data collector is part of the add-on ST-A/PI release 01M. The technical name of the monitoring object is REFREDIS.The managed system must be a SAP SCM 5.0 system or later (software component SCM >= 500). You can assign this monitoring object to a business process step only. If you have a SCM 5.0 system (or later) running F&R, but you are still using the old scheduling approach from SCM 4.1 (with a periodic execution of program /FRE/FRP_MID_BASIC as a background job), then the new FRP Dispatcher must be always inactive. In such a case it makes no sense to use this monitoring object, as it would always report this intended inactive dispatcher as a problem. Instead you would rather setup a batch job monitoring for program /FRE/FRP_MID_BASIC. Check which FRP dispatching approach is used for F&R in the SCM system:
Old SCM 4.1 method with a scheduled batch run of program /FRE/FRP_MID_BASIC New SCM 5.X method using the FRP Dispatcher Activation (trx /FRE/FRP_DISP_ACT)
Only use this monitoring object if the new method is active.
3.3.3.2 Available Key Figures List of key figures available for the monitoring object:
Key Figure Analysis Transaction
Description
Status of FRP Dispatcher Processes
/FRE/FRP_DISP_ACT
To monitor the status of all or individual FRP Dispatcher processes (together with the trace level setting), as well as the last update time of the dispatcher status.
Messages in FRP Dispatcher Logs
/FRE/FRP_DISP_ACT
Monitors the number of log messages of type Error (and optionally also Warning) in any of the FRP Dispatcher logs.
3.3.3.3 Configuration on Monitoring Object Level This application monitor does not have any selection criteria on monitoring object level.
3.3.3.4 Key Figure “Status of FRP Dispatcher Processes” Only one selection criterion is available on key figure level.
Description Type Mandatory Select-Option F4 Help
Create individual alerts C X
The parameter “Create individual alerts” has two options One common measurement for all FRP Dispatcher processes Individual measurement for each FRP Dispatcher process
The first option creates one single alert to monitor all three processes with a common rating, whereas the second options creates always three alerts to see the individual status of each process. This key figure is a status key figure for which you do not need to set a threshold.
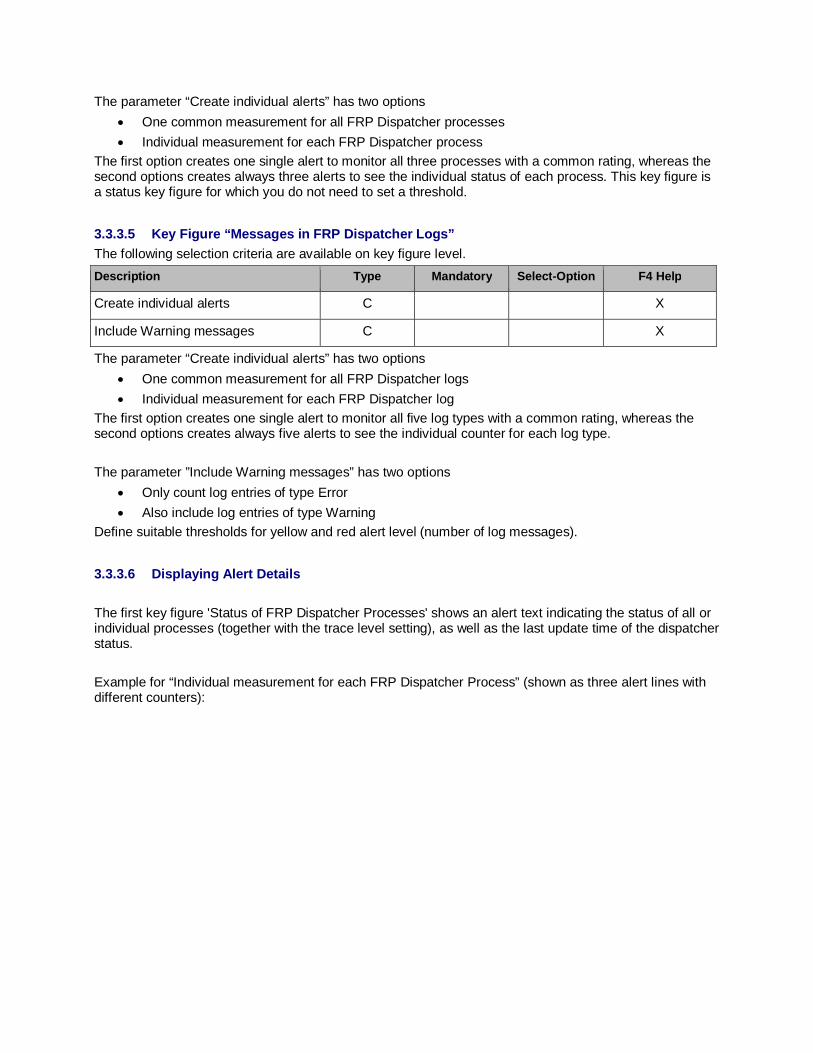
3.3.3.5 Key Figure “Messages in FRP Dispatcher Logs” The following selection criteria are available on key figure level. Description Type Mandatory Select-Option F4 Help
Create individual alerts C X
Include Warning messages C X
The parameter “Create individual alerts” has two options One common measurement for all FRP Dispatcher logs Individual measurement for each FRP Dispatcher log
The first option creates one single alert to monitor all five log types with a common rating, whereas the second options creates always five alerts to see the individual counter for each log type. The parameter ”Include Warning messages” has two options
Only count log entries of type Error Also include log entries of type Warning
Define suitable thresholds for yellow and red alert level (number of log messages).
3.3.3.6 Displaying Alert Details The first key figure 'Status of FRP Dispatcher Processes' shows an alert text indicating the status of all or individual processes (together with the trace level setting), as well as the last update time of the dispatcher status. Example for “Individual measurement for each FRP Dispatcher Process” (shown as three alert lines with different counters):

The second key figure “Messages in FRP Dispatcher Logs” shows an alert text indicating the number of log messages of type Error (and optionally also Warning). Example for “Individual measurement for each FRP Dispatcher Log” (shown as five alert lines with different counters):
Detail information for key figure ”Status of FRP Dispatcher Processes” Mark an alert and press push button “Detail Info”. This brings you into the monitored SCM system and simply displays the standard transaction /FRE/FRP_DISP_ACT, where you can check and change the status of the FRP Dispatcher. Example:

Detail information for key figure “Messages in FRP Dispatcher Logs” Mark an alert and press push button “Detail Info”. This displays a list of messages for the FRP Dispatcher. Depending on the setting for parameter ”Create individual alerts”, either messages for all five log types are displayed together, or only the selected log type will be shown.
3.4 Monitoring of the F&R Location Status
3.4.1 Background Information The F&R Processor (FRP) performs the forecasting and replenishment runs for the Retail Locations (e.g. Stores, Distribution Centers or Vendors). For each location several tasks (sequences) are executed, and each task gets its own status code. List of possible task sequence status codes:
0 = Initial 1 = Running 2 = OK 3 = Error 4 = Fatal error 5 = Lock error
The backlog monitoring considers status codes 0 and 1. The exception monitoring considers status codes 3, 4 and 5.

FRP Dispatching and Monitoring: There are two approaches for the FRP dispatching in the SCM system:
New SCM 5.X method using the FRP Dispatcher Activation (transaction /FRE/FRP_DISP_ACT) Old SCM 4.1 method with a scheduled batch run of program /FRE/FRP_MID_BASIC
Report /FRE/UI_FRP_SHOW_LOC_STATUS (transaction /FRE/FRP_LOC_STATUS) displays a list showing the FRP status for each location if the FRP run was executed by using the FRP Dispatcher. If you use the old concept from SCM 4.1 (still possible in SCM 5.X) with dispatcher program /FRE/FRP_MID_BASIC to execute the FRP run you can display the FRP status with report /FRE/UI_FRP_SHOW_SEQSTATUS.
3.4.2 Purpose and Benefit The application monitor "Retail F&R Location Status" is a data collector to retrieve the backlog and exceptions of Location processing during the FRP run from an SAP SCM F&R system and display them as alerts within the Solution Manager's Business Process Monitoring. It can monitor the location status for both dispatching approaches. It is one common monitoring object with one setup and one range of key figures. Only the internal data collection is based on different data sources. With the default setup the data collector determines automatically which FRP dispatching approach is used, by checking the FRP Dispatcher Activation. However, you can also override this determination and force the data collection to either use the sequence status of the old batch processor or the task status of the new FRP Dispatcher.
3.4.3 Monitoring Object “F&R Location Status” (REFRELST) 3.4.3.1 System Requirements The data collector is part of the add-on ST-A/PI release 01M. The technical name of the monitoring object is REFRELST. The managed system must be a SAP SCM 5.0 system or later (software component SCM >= 500). You can assign this monitoring object to a business process step only. Preparation: Use the F&R-specific manual monitoring methods (new approach: transaction /FRE/FRP_LOC_STATUS; old approach: report /FRE/UI_FRP_SHOW_SEQSTATUS) to get an understanding about the volume of locations and tasks/sequences due for processing or with erroneous processing.
3.4.3.2 Available Key Figures The following key figures are available for the monitoring object:
Key Figure Analysis Transaction
Description
Backlog: Locations with unprocessed tasks
/FRE/FRP_LOC_STATUS
This key figure counts the number of locations that meet the filter criteria and have at least one task (sequence) that is still unprocessed or not yet complete; this is indicated by status 0 (initial) or 1 (running).
Backlog: Total number of unprocessed tasks
/FRE/FRP_LOC_STATUS
This key figure counts the total number of unprocessed tasks for all locations that meet the filter criteria; this is indicated by status 0 (initial) or 1 (running).
Exceptions: Locations with erroneous tasks
/FRE/FRP_LOC_STATUS
This key figure counts the number of locations that meet the filter criteria and have at least one erroneous task (sequence); this is indicated by status 3, 4, or 5.

Exceptions: Total number of erroneous tasks
/FRE/FRP_LOC_STATUS
This key figure counts the total number of erroneous tasks for all locations that meet the filter criteria; this is indicated by status 3, 4, or 5.
Note: It is normally sufficient to choose only one key figure from each category, that is, one backlog and one exception key figure, depending on the measured value on which you want to base the thresholds. 'Locations' counts retail locations affected with at least one unprocessed or erroneous task, whereas 'Total number' counts all tasks with the respective status. The alert text always displays both measured values, the number of locations, and the total number of tasks regardless of which key figure you have selected.
3.4.3.3 Configuration on Monitoring Object Level Selection criteria on monitoring object header level: Description Type Mandatory Select-Option F4 Help
Location Number C X X X
Location Type C X
FRP Scheduler C X
With parameter ”Location Number” you can specify the relevant locations for the monitoring. There is a value help available showing also the location type and description. This parameter is mandatory. However, if you want to select all locations you can enter wildcard '*'. The optional parameter ”Location Type” lets you filter on the type of location, either exclusively or in combination with parameter “Location Number”. With the optional parameter “FRP Scheduler” you can specify which data source is taken by the data collector.
The default setting (parameter value empty) means an automatic determination of used FRP Scheduler Method in the SCM system.
Enter ”B” to force the collection on sequences of the old SCM 4.1 method with a scheduled batch run of program /FRE/FRP_MID_BASIC.
Enter ”D” to force the collection on tasks of the new SCM 5.X method using the FRP Dispatcher Activation.
This application monitor does not have any selection criteria on key figure level.
3.4.3.4 Key Figure “Backlog: Locations with unprocessed tasks” This key figure counts the number of locations that meet the filter criteria and have at least one task (sequence) that is still unprocessed or not yet complete; this is indicated by status 0 (initial) or 1 (running). If you want to base the thresholds on the total number of unprocessed tasks instead, choose key figure “Backlog: Total number of unprocessed tasks”. Define suitable thresholds for the YELLOW and RED alerts (number of locations).

3.4.3.5 Key Figure “Backlog: Total number of unprocessed tasks” This key figure counts the total number of unprocessed tasks for all locations that meet the filter criteria; this is indicated by status 0 (initial) or 1 (running). If you want to base the thresholds on the total number of locations affected instead, choose key figure ”Backlog: Locations with unprocessed tasks”. Define suitable thresholds for the YELLOW and RED alerts (number of tasks).
3.4.3.6 Key Figure “Exceptions: Locations with erroneous tasks” This key figure counts the number of locations that meet the filter criteria and have at least one erroneous task (sequence); this is indicated by status 3, 4, or 5. If you want to base the thresholds on the total number of erroneous tasks instead, choose key figure “Exceptions: Total number of erroneous tasks”. Define suitable thresholds for the YELLOW and RED alerts (number of locations). 3.4.3.7 Key Figure “Exceptions: Total number of erroneous tasks” This key figure counts the total number of erroneous tasks for all locations that meet the filter criteria; this is indicated by status 3, 4, or 5. If you want to base the thresholds on the total number of locations affected instead, choose key figure ”Backlog: Locations with erroneous tasks”. Define suitable thresholds for the YELLOW and RED alerts (number of tasks).
3.4.3.8 Displaying Alert Details In the Alert Inbox for each key figure you see an alert text corresponding to the selected key figure. It shows both, the number of affected locations and the total number of unprocessed or erroneous tasks (sequences). In addition there are additional columns to indicate the total number of analyzed locations and the used FRP Scheduler Method (defining the data source for key figure selection). Example for key figure “Backlog: Locations with unprocessed tasks”:
Mark an alert and press push button “Detail Info”. This brings you into the monitored SCM system and displays either the detail output of report /FRE/UI_FRP_SHOW_SEQSTATUS (old method) or report /FRE/UI_FRP_SHOW_LOC_STATUS (new method). The selection of locations is filtered corresponding to the setup of the monitoring object, as well as by the used key figure (backlog or exceptions).

3.5 Monitoring of F&R Exceptions
3.5.1 Background Information Exceptions: Exceptions are messages (e.g. errors, alerts) that are generated during (background) processing by various applications within F&R. These exceptions are stored in an F&R-specific database model (not the general application log). The system creates exceptions automatically in different business processes. It assigns these exceptions to objects (for example, locations, products, and order proposals) in the corresponding business areas (for example, forecast, replenishment). Users may be interested in exceptions from different sources. For this reason, each user can subscribe to different business areas, allowing them to access the exceptions in these areas. You can also select exceptions on the selection screen in the Exception Workbench on the basis of business criteria (for example, business objects) and technical attributes (for example, priority and creation date).
“Location product &1/&2 not found” “Error reading master data for location &1” “Stockout for product &2 in location &1” “No default forecast profile found” “DIF &1 defined twice” ...
EXCEPTION Business areas: Customizing Master Data DIF Inventory Management Consumption Forecast & Replenishment Order Quantity optimization Order Proposal Management
Process Steps : Forecast & Replenishment Order Proposal Release Management Internal Connectivity Analytics System Administration
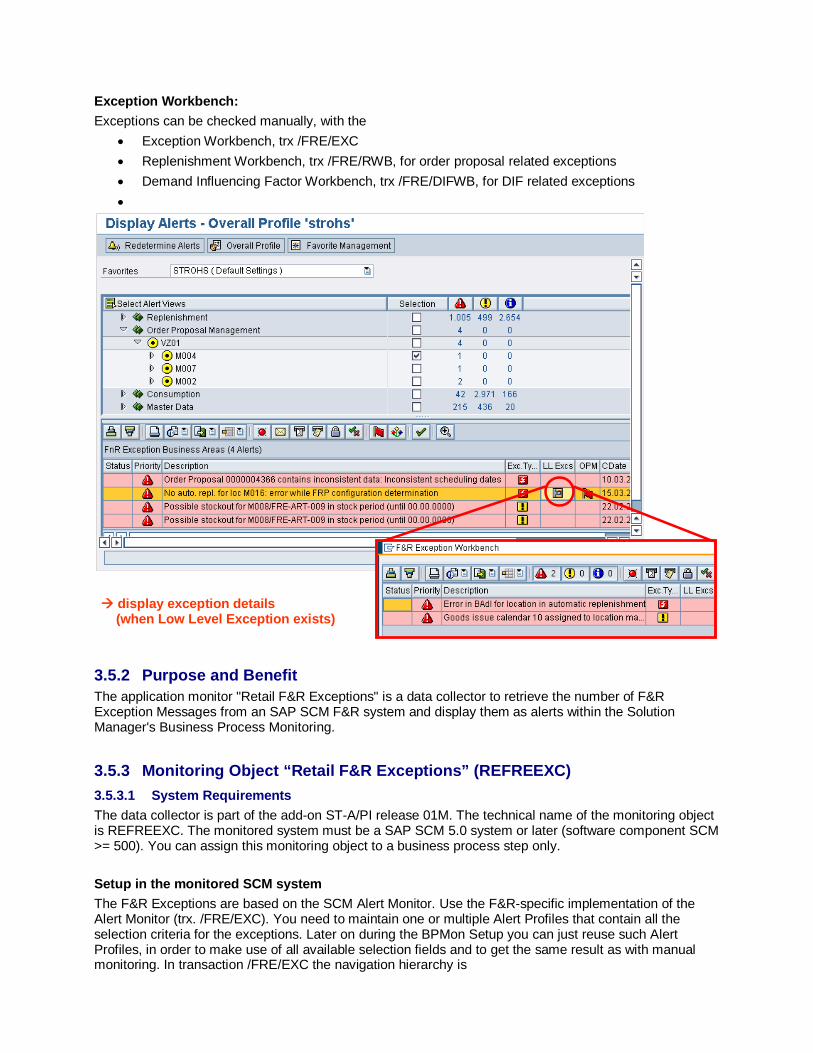
Exception Workbench: Exceptions can be checked manually, with the
Exception Workbench, trx /FRE/EXC Replenishment Workbench, trx /FRE/RWB, for order proposal related exceptions Demand Influencing Factor Workbench, trx /FRE/DIFWB, for DIF related exceptions
3.5.2 Purpose and Benefit The application monitor "Retail F&R Exceptions" is a data collector to retrieve the number of F&R Exception Messages from an SAP SCM F&R system and display them as alerts within the Solution Manager's Business Process Monitoring.
3.5.3 Monitoring Object “Retail F&R Exceptions” (REFREEXC) 3.5.3.1 System Requirements The data collector is part of the add-on ST-A/PI release 01M. The technical name of the monitoring object is REFREEXC. The monitored system must be a SAP SCM 5.0 system or later (software component SCM >= 500). You can assign this monitoring object to a business process step only. Setup in the monitored SCM system The F&R Exceptions are based on the SCM Alert Monitor. Use the F&R-specific implementation of the Alert Monitor (trx. /FRE/EXC). You need to maintain one or multiple Alert Profiles that contain all the selection criteria for the exceptions. Later on during the BPMon Setup you can just reuse such Alert Profiles, in order to make use of all available selection fields and to get the same result as with manual monitoring. In transaction /FRE/EXC the navigation hierarchy is
display exception details (when Low Level Exception exists)

Overall Profile (containing application-specific alert profiles) Alert Profile (containing FRE Exception Business Areas as alert types) Selection Variant (containing business criteria and technical attributes)

Run the evaluation (push button "Redetermine Alerts") to check the runtime of the selection. With a large amount of exceptions this may take a while. In such a case you should not schedule the BPMon data collector with a high frequency.
3.5.3.2 Available Key Figures The following key figures are available for the monitoring object:
Key Figure Analysis Transaction
Description
Number of Exceptions with priority High
/FRE/EXC This key figure counts the number of F&R exception messages with priority "High" that meet the filter criteria for the selection variant used.
Number of Exceptions with priority Medium
/FRE/EXC This key figure counts the number of F&R exception messages with priority "Medium" that meet the filter criteria for the selection variant used.
Number of Exceptions with priority Low
/FRE/EXC This key figure counts the number of F&R exception messages with priority "Low" that meet the filter criteria for the selection variant used.
3.5.3.3 Configuration on Monitoring Object Level Selection criteria on monitoring object level:
Description Type Mandatory Select-Option F4 Help
Alert Profile C X X
There is only one parameter on header level of the monitoring object. Enter the “Alert Profile” as maintained in trx /FRE/EXC in the SCM system (there is a value help available).
3.5.3.4 Key Figures “Number of Exceptions with priority High/Medium/Low” This application monitor does not have any selection criteria on key figure level. There are three key figures, which just differ in the exception priority High/Medium/Low. This allows defining different thresholds for the alert rating, i.e. for high-priority messages you would like to get notified earlier. The priority corresponds to the exception priority (high/medium/low) as customized inside the Alert Profile's selection variant. Please note that this does not always fit to the exception message type (abort/error/warning/info), e.g. the priority can be high but the message type is warning, etc.
It is recommended to use the first key figure for priority High as minimum setup. In the alert display you will see the number of Medium and Low priority Exceptions as an additional information as well. However, if you want to customize an additional alerting also for priorities Medium and/or Low with own thresholds, you need to include these key figures as well. In such a case, make sure that these exceptions are actually considered by the selection variant.

3.5.3.5 Displaying Alert Details In the alert list for each key figure you see three columns to display the number of exceptions with priority High / Medium / Low, as well an alert text corresponding to the selected key figure priority. In addition there are additional columns for the total number of exceptions, the used selection variant ID and the runtime it took for the data collector to get this result. Example for key figure “Number of Exceptions with priority High “:
Mark an alert and press push button “Detail Info”. This brings you into the monitored SCM system and displays a popup screen with the found exceptions as per the chosen selection variant. Example:
3.6 Monitoring of F&R Order Proposals
3.6.1 Background Information The Forecast and Replenishment processor creates order proposals in SCM. After release, these need to be transferred back to ERP for purchasing. In Order Proposal Management (OPM) you can bundle and release the optimized product requirements for order proposals. You can update the goods movements using the interface to the purchasing system, and use open goods movements for calculating requirements.

During the processing and releasing of order proposals, exceptions may occur. These exceptions are stored in the general F&R exception table (/FRE/MSG). The configuration of the exceptions defines whether it is relevant for the release of an order proposal.
Replenishment Workbench:
You can process order proposals that were not released in the Replenishment Workbench /FRE/RWB and then release them for the ordering process in a follow-up system. Once order proposals have been transported to the purchasing system, you can only change these order proposals in that system. For these changes to be reflected in SAP F&R, you have to import the changes from the purchasing system to SAP F&R.
The Replenishment Workbench offers a work list displaying the status of the order proposals:
“Location product &1/&2 not found” “Error reading master data for location &1” “Stockout for product &2 in location &1” “No default forecast profile found” “DIF &1 defined twice” ...
EXCEPTION Business areas: Customizing Master Data DIF Inventory Management Consumption Forecast & Replenishment Order Quantity optimization Order Proposal Management
Process Steps : Forecast & Replenishment Order Proposal Release Management Internal Connectivity Analytics System Administration

Any exceptions during the release of the order proposals can be viewed in the Exception List:
3.6.2 Purpose and Benefit The application monitor "F&R Order Proposals" can be used to automatically monitor the backlog of unreleased order proposals instead of viewing the release status in the Replenishment Workbench manually.
3.6.3 Monitoring Object “F&R Order Proposals” (KIRET003) 3.6.3.1 System Requirements The data collector is part of the add-on ST-A/PI release 01M. The technical name of the monitoring object is REKIRET003. The monitored system must be a SAP SCM 5.0 system or later (software component SCM >= 500). You can assign this monitoring object to a business process step only.
3.6.3.2 Available Key Figures The following key figures are available for the monitoring object:
Key Figure Analysis Transaction
Description
Order Proposals in Status Error
/FRE/RWB Counts the number of order proposals in a release status with high priority
Order Proposals in Status Warning
/FRE/RWB Counts the number of order proposals in a release status with low priority
3.6.3.3 Configuration on Monitoring Object Level On monitoring object level, no filter criteria have to be defined. Only the schedule for data collection has to be specified in tab “Monitoring Schedule”. It is strongly recommended to observe the runtime of a collector and set the scheduling frequency accordingly (value for scheduling interval must be higher than the runtime of a collector). The runtime can be tested by starting the collector with the tool “TBI reports” from transaction ST13 on the managed system.

3.6.3.4 Key Figure “Order Proposals in Status Error” This key figure counts the number of order proposals which are, to the point in time of data collection, in a release state with high priority. Namely, these states are the following:
(10) Customer-specific release with high priority (11) Exception-based release with high priority (12) Object-based release with high priority (13) Exception- and object-based release with high priority
The following selection criteria can be maintained to restrict data collection:
Description Type Mandatory Select-Option F4 Help
Location C X X
Location type C X X X
Supplying/Receiving C X X
3.6.3.5 Key Figure “Order Proposals in Status Warning” This key figure counts the number of order proposals which are, to the point in time of data collection, in a release state with high priority. Namely, these states are the following:
(20) Customer-specific release with low priority (21) Exception-based release with low priority (22) Object-based release with low priority (23) Exception- and object-based release with low priority
The following selection criteria can be maintained to restrict data collection:
Description Type Mandatory Select-Option F4 Help
Location C X X
Location type C X X X
Supplying/Receiving C X X
3.6.3.6 Displaying Alert Details Once alerts are created in Solution Manager you can view the results inthe Alert Inbox.

By clicking on the “Detail Info” button, an ALV list is displayed showing details to the order proposals that were alerted:
By clickling on one of the order proposal numbers the Replenishment Workbench (transaction /FRE/RWB) is opened which enables you to work on the unreleased order proposal in more detail.
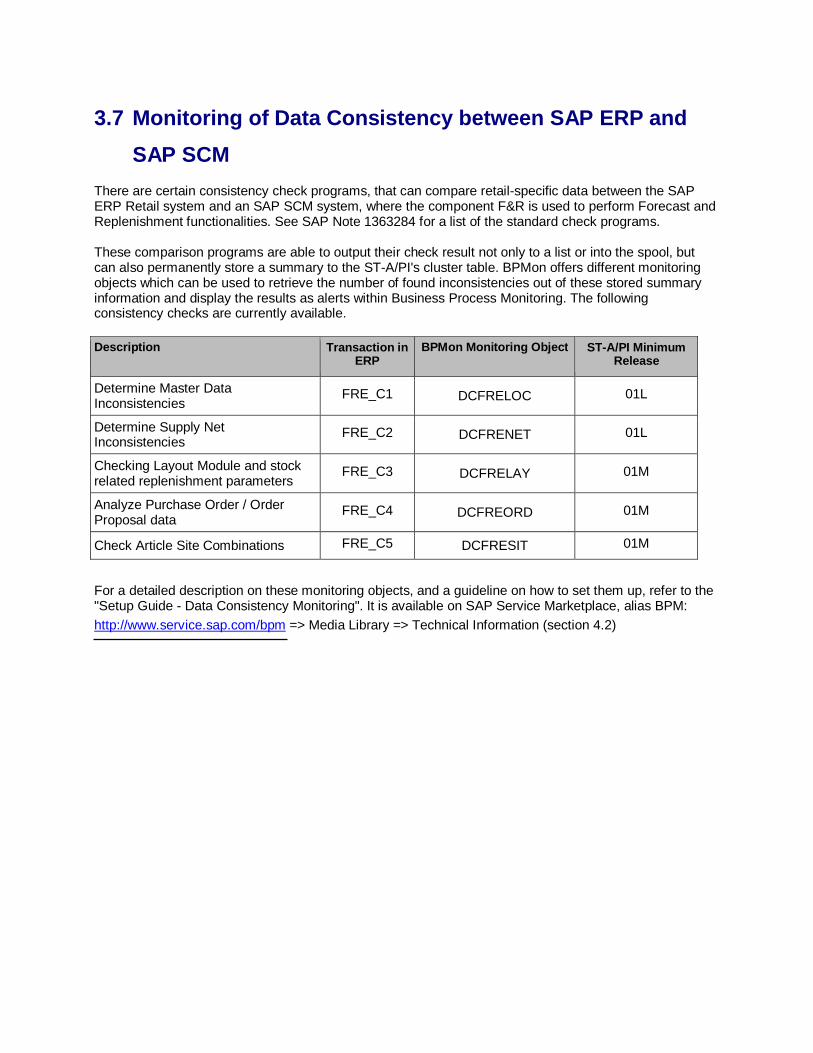
3.7 Monitoring of Data Consistency between SAP ERP and SAP SCM
There are certain consistency check programs, that can compare retail-specific data between the SAP ERP Retail system and an SAP SCM system, where the component F&R is used to perform Forecast and Replenishment functionalities. See SAP Note 1363284 for a list of the standard check programs. These comparison programs are able to output their check result not only to a list or into the spool, but can also permanently store a summary to the ST-A/PI's cluster table. BPMon offers different monitoring objects which can be used to retrieve the number of found inconsistencies out of these stored summary information and display the results as alerts within Business Process Monitoring. The following consistency checks are currently available. Description Transaction in
ERP BPMon Monitoring Object ST-A/PI Minimum
Release
Determine Master Data Inconsistencies FRE_C1 DCFRELOC 01L
Determine Supply Net Inconsistencies FRE_C2 DCFRENET 01L
Checking Layout Module and stock related replenishment parameters FRE_C3 DCFRELAY 01M
Analyze Purchase Order / Order Proposal data FRE_C4 DCFREORD 01M
Check Article Site Combinations FRE_C5 DCFRESIT 01M
For a detailed description on these monitoring objects, and a guideline on how to set them up, refer to the "Setup Guide - Data Consistency Monitoring". It is available on SAP Service Marketplace, alias BPM: http://www.service.sap.com/bpm => Media Library => Technical Information (section 4.2)