
Bimodal Dual AC Imaging - oxford- · PDF fileBimodal Dual AC™ Imaging ... of contrast in...
4
An exclusive measurement ability, Dual AC, has been developed by Asylum Research for use on the MFP-3D™ and Cypher™ AFMs. Since its introduction, the number of applications for Dual AC has increased dramatically. This note will give you an introduction to bimodal imaging, just one of many Dual AC techniques that can be performed on Asylum’s AFMs. Bimodal Dual AC ™ Imaging Background Dual AC imaging encompasses a wide variety of techniques. We have broken down these various imaging techniques to specifically describe the mode for different applications. The table below explains the various Dual AC techniques along with the software settings needed for imaging. For this application note, only bimodal Dual AC imaging will be discussed. Bimodal Dual AC Imaging – How it Works Bimodal Dual AC imaging provides enhanced contrast for materials properties (Figure 1) by taking advantage of the flexibility and power of the digital signal processing within the ARC2™ controller. The idea behind this is simple. Cantilevers are extended mechanical objects and have many different Figure 1: Bimodal Dual AC 2nd mode amplitude overlaid on rendered AFM topography (left) and fundamental phase image overlaid on topography (right) of multi-component surf wax. Notice the high contrast visible in the bimodal Dual AC image and the relative lack of contrast in the fundamental phase, 4 µm scan. AFM Asylum Research Technique Description Frequency 1-f 1 Frequency 2-f 2 Drive 1-2 Mode: Drive Bimodal 1 Drive the 1st and 2nd resonance. At or near fundamental resonance At or near 2nd resonance On-On Dual AC: tapping piezo or blueDrive™ MFM 2 Bimodal with special operating parameters and a magnetic cantilever. At or near fundamental resonance At or near 2nd resonance On-On Dual AC: tapping piezo or blueDrive Passive bimodal Similar to bimodal, but the 2nd resonance is only monitored, not driven. At or near fundamental resonance At or near 2nd resonance On-Off Dual AC: tapping piezo or blueDrive Active harmonic Similar to bimodal, but a higher harmonic driven. At or near fundamental resonance f 2 =N×f 1 where N is an integer On-On Dual AC: tapping piezo or blueDrive Passive harmonic Higher harmonic is simply monitored, not driven. At or near fundamental resonance f 2 =N×f 1 where N is an integer On-Off Dual AC: tapping piezo or blueDrive DART By driving at one frequency below resonance (A 1 ) and another above (A 2 ), the A 2 -A 1 gives an error signal we can use to track the resonance frequency changes. Slightly below fundamental resonance (A~A max /2) Slightly above fundamental resonance (A~A max /2) On-On Dual AC: tapping piezo or blueDrive DART-PFM 3 Piezoresponse Force Microscopy technique using the above. Slightly below fundamental resonance (A~A max /2) Slightly above fundamental resonance (A~A max /2) On-On PFM: Dual AC to Chip
Transcript of Bimodal Dual AC Imaging - oxford- · PDF fileBimodal Dual AC™ Imaging ... of contrast in...
An exclusive measurement ability, Dual AC, has been developed by Asylum Research for use on the MFP-3D™ and Cypher™
AFMs. Since its introduction, the number of applications for Dual AC has increased dramatically. This note will give you an
introduction to bimodal imaging, just one of many Dual AC techniques that can be performed on Asylum’s AFMs.
Bimodal Dual AC™ Imaging
BackgroundDual AC imaging encompasses a wide variety of techniques. We have broken down these various imaging techniques to specifically describe the mode for different applications. The table below explains the various Dual AC techniques along with the software settings needed for imaging. For this application note, only bimodal Dual AC imaging will be discussed.
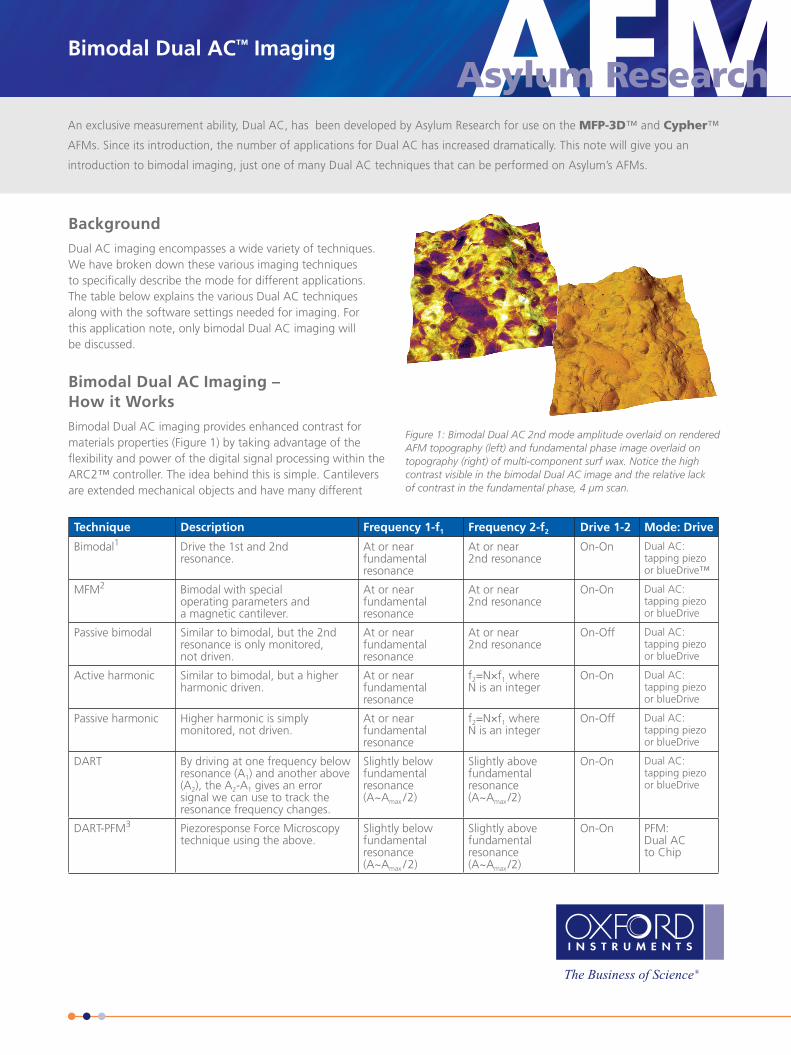
Bimodal Dual AC Imaging – How it WorksBimodal Dual AC imaging provides enhanced contrast for materials properties (Figure 1) by taking advantage of the flexibility and power of the digital signal processing within the ARC2™ controller. The idea behind this is simple. Cantilevers are extended mechanical objects and have many different
Figure 1: Bimodal Dual AC 2nd mode amplitude overlaid on rendered AFM topography (left) and fundamental phase image overlaid on topography (right) of multi-component surf wax. Notice the high contrast visible in the bimodal Dual AC image and the relative lack of contrast in the fundamental phase, 4 µm scan.
AFMAsylum Research
Technique Description Frequency 1-f1 Frequency 2-f2 Drive 1-2 Mode: Drive
Bimodal1 Drive the 1st and 2nd resonance.
At or near fundamental resonance
At or near 2nd resonance
On-On Dual AC: tapping piezo or blueDrive™
MFM2 Bimodal with special operating parameters and a magnetic cantilever.
At or near fundamental resonance
At or near 2nd resonance
On-On Dual AC: tapping piezo or blueDrive
Passive bimodal Similar to bimodal, but the 2nd resonance is only monitored, not driven.
At or near fundamental resonance
At or near 2nd resonance
On-Off Dual AC: tapping piezo or blueDrive
Active harmonic Similar to bimodal, but a higher harmonic driven.
At or near fundamental resonance
f2=N×f1 where N is an integer
On-On Dual AC: tapping piezo or blueDrive
Passive harmonic Higher harmonic is simply monitored, not driven.
At or near fundamental resonance
f2=N×f1 where N is an integer
On-Off Dual AC: tapping piezo or blueDrive
DART By driving at one frequency below resonance (A1) and another above (A2), the A2-A1 gives an error signal we can use to track the resonance frequency changes.
Slightly below fundamental resonance (A~Amax /2)
Slightly above fundamental resonance (A~Amax /2)
On-On Dual AC: tapping piezo or blueDrive
DART-PFM3 Piezoresponse Force Microscopy technique using the above.
Slightly below fundamental resonance (A~Amax /2)
Slightly above fundamental resonance (A~Amax /2)
On-On PFM: Dual AC to Chip
Bimodal Dual AC™ Imaging
2
flexural resonant frequencies. In the past, AC atomic force microscopes have typically excited one of those modes, usually the lowest frequency, or “fundamental” mode and then used the amplitude or frequency of that mode as the input for a feedback system that controls the tip-sample separation.4, 5
When the amplitude of the fundamental motion is used, the term “Amplitude Modulated AFM”6 (AM-AFM) has been employed.
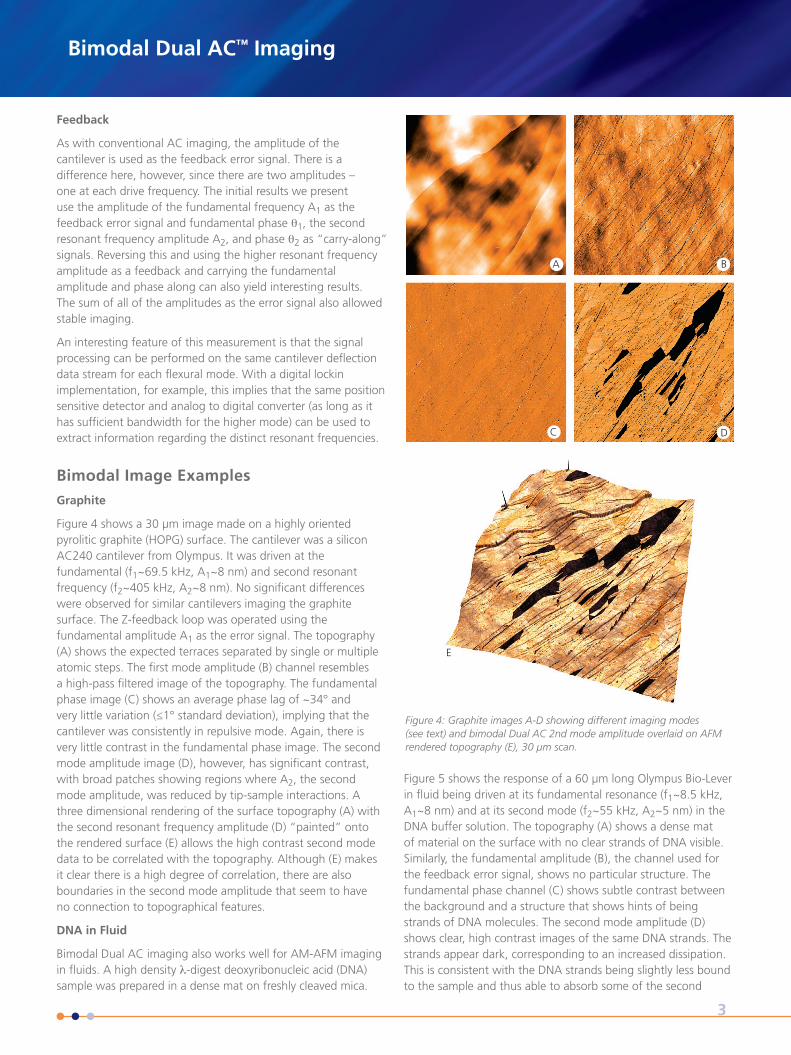
A plucked guitar string has higher flexural resonances that are harmonic, meaning that if the fundamental mode is at a frequency f0, the next resonance is at 2f0, the next is at 3f0 and so on. For all but a few very specialized types,7,8 cantilever resonant frequencies are non-harmonic. Butt and Jaschke9 as well as Sarid10 give nice reviews of cantilever mechanics. Figure 2 gives the theoretical resonant frequencies for diving board shaped cantilevers for the first few resonant frequencies. The measured resonant frequencies for two representative cantilevers, the Olympus AC240 (for air imaging) and Olympus Bio-Lever (for fluid imaging) are also listed.
One of the simplest methods for looking at the effect of higher modes is to drive them directly, using the same machinery set-up as that used in AC imaging.11 As with AC imaging using the first resonant frequency, the amplitude of the cantilever measured at the drive frequency is used as the error signal in a feedback loop. In reference 8, Stark et al. observed enhanced phase contrast on a sample using the third resonant frequency of a triangular cantilever. Crittenden et al. have also explored using higher harmonics for imaging because the response of the higher harmonics is sharper than the response of the fundamental resonance.12
If the periodic repulsive interactions between the tip and sample are nonlinear, they will couple motion into higher harmonics.13,14,15,16 This can provide information about the mechanical properties of the sample. During a single AM-AFM vibrational cycle, the tip typically samples a range of forces, from the long range attractive to the short range repulsive. If the tip interacts with the short ranged repulsive forces, information about the mechanical properties of the sample can be obtained.
For single oscillation mode imaging, if the phase shift is positive, it is customary to refer to the imaging mode as “net attractive” or simply “attractive”. If the phase shift is negative, the mode is referred to as “repulsive”. Recently, Rodriguez and Garcia17 published a theoretical simulation of a non-contact, attractive mode technique where the cantilever was driven at its two lowest resonant frequencies. In their simulations, they observed that the phase of the second mode had a strong dependence on the Hamaker constant of the material being imaged, implying that this technique could be used to extract chemical information about the surfaces being imaged. Other work by Garcia’s group has also demonstrated that the compositional sensitivity of an AFM is enhanced by the simultaneous excitation of its first two normal resonant frequencies.18
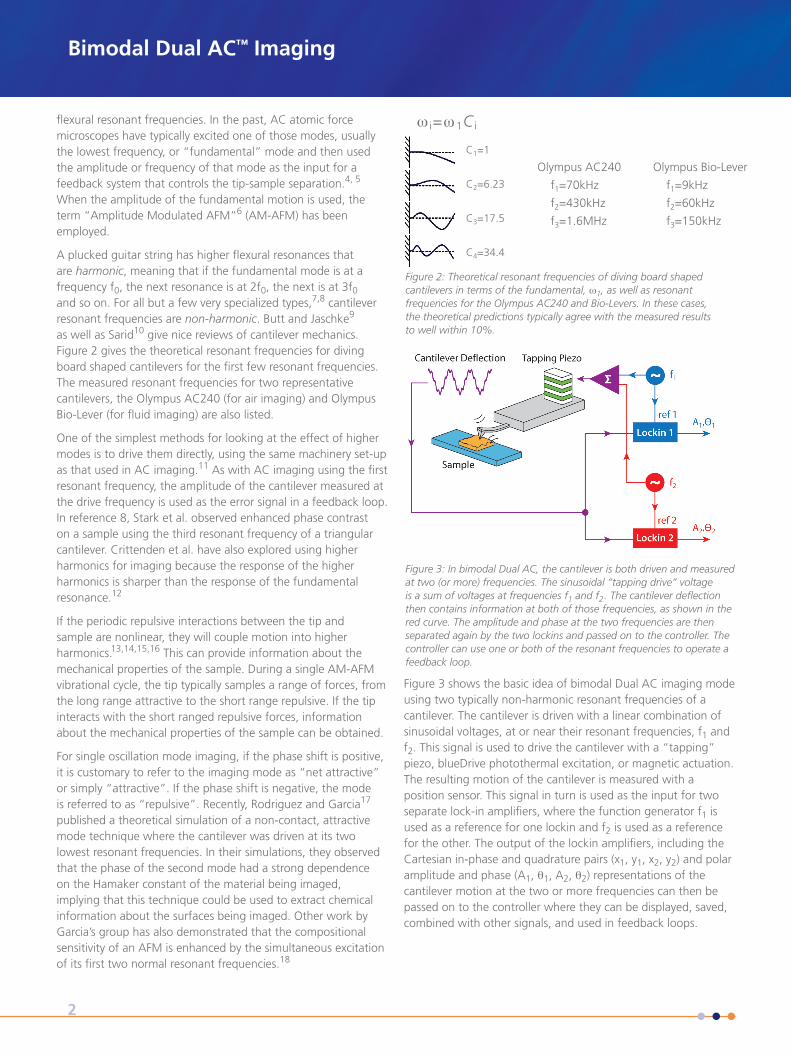
Figure 3 shows the basic idea of bimodal Dual AC imaging mode using two typically non-harmonic resonant frequencies of a cantilever. The cantilever is driven with a linear combination of sinusoidal voltages, at or near their resonant frequencies, f1 and f2. This signal is used to drive the cantilever with a “tapping” piezo, blueDrive photothermal excitation, or magnetic actuation. The resulting motion of the cantilever is measured with a position sensor. This signal in turn is used as the input for two separate lock-in amplifiers, where the function generator f1 is used as a reference for one lockin and f2 is used as a reference for the other. The output of the lockin amplifiers, including the Cartesian in-phase and quadrature pairs (x1, y1, x2, y2) and polar amplitude and phase (A1, θ1, A2, θ2) representations of the cantilever motion at the two or more frequencies can then be passed on to the controller where they can be displayed, saved, combined with other signals, and used in feedback loops.
Figure 2: Theoretical resonant frequencies of diving board shaped cantilevers in terms of the fundamental, w1, as well as resonant frequencies for the Olympus AC240 and Bio-Levers. In these cases, the theoretical predictions typically agree with the measured results to well within 10%.
Figure 3: In bimodal Dual AC, the cantilever is both driven and measured at two (or more) frequencies. The sinusoidal “tapping drive” voltage is a sum of voltages at frequencies f1 and f2. The cantilever deflection then contains information at both of those frequencies, as shown in the red curve. The amplitude and phase at the two frequencies are then separated again by the two lockins and passed on to the controller. The controller can use one or both of the resonant frequencies to operate a feedback loop.
Olympus AC240 Olympus Bio-Lever
f1=70kHz f1=9kHz
f2=430kHz f2=60kHz
f3=1.6MHz f3=150kHz
w i=w1C i
C1=1
C2=6.23
C3=17.5
C4=34.4
Bimodal Dual AC™ Imaging
3
Feedback
As with conventional AC imaging, the amplitude of the cantilever is used as the feedback error signal. There is a difference here, however, since there are two amplitudes – one at each drive frequency. The initial results we present use the amplitude of the fundamental frequency A1 as the feedback error signal and fundamental phase θ1, the second resonant frequency amplitude A2, and phase θ2 as “carry-along” signals. Reversing this and using the higher resonant frequency amplitude as a feedback and carrying the fundamental amplitude and phase along can also yield interesting results. The sum of all of the amplitudes as the error signal also allowed stable imaging.
An interesting feature of this measurement is that the signal processing can be performed on the same cantilever deflection data stream for each flexural mode. With a digital lockin implementation, for example, this implies that the same position sensitive detector and analog to digital converter (as long as it has sufficient bandwidth for the higher mode) can be used to extract information regarding the distinct resonant frequencies.
Bimodal Image ExamplesGraphite
Figure 4 shows a 30 µm image made on a highly oriented pyrolitic graphite (HOPG) surface. The cantilever was a silicon AC240 cantilever from Olympus. It was driven at the fundamental (f1~69.5 kHz, A1~8 nm) and second resonant frequency (f2~405 kHz, A2~8 nm). No significant differences were observed for similar cantilevers imaging the graphite surface. The Z-feedback loop was operated using the fundamental amplitude A1 as the error signal. The topography (A) shows the expected terraces separated by single or multiple atomic steps. The first mode amplitude (B) channel resembles a high-pass filtered image of the topography. The fundamental phase image (C) shows an average phase lag of ~34° and very little variation (≤1° standard deviation), implying that the cantilever was consistently in repulsive mode. Again, there is very little contrast in the fundamental phase image. The second mode amplitude image (D), however, has significant contrast, with broad patches showing regions where A2, the second mode amplitude, was reduced by tip-sample interactions. A three dimensional rendering of the surface topography (A) with the second resonant frequency amplitude (D) “painted” onto the rendered surface (E) allows the high contrast second mode data to be correlated with the topography. Although (E) makes it clear there is a high degree of correlation, there are also boundaries in the second mode amplitude that seem to have no connection to topographical features.
DNA in Fluid
Bimodal Dual AC imaging also works well for AM-AFM imaging in fluids. A high density λ-digest deoxyribonucleic acid (DNA) sample was prepared in a dense mat on freshly cleaved mica.
Figure 5 shows the response of a 60 µm long Olympus Bio-Lever in fluid being driven at its fundamental resonance (f1~8.5 kHz, A1~8 nm) and at its second mode (f2~55 kHz, A2~5 nm) in the DNA buffer solution. The topography (A) shows a dense mat of material on the surface with no clear strands of DNA visible. Similarly, the fundamental amplitude (B), the channel used for the feedback error signal, shows no particular structure. The fundamental phase channel (C) shows subtle contrast between the background and a structure that shows hints of being strands of DNA molecules. The second mode amplitude (D) shows clear, high contrast images of the same DNA strands. The strands appear dark, corresponding to an increased dissipation. This is consistent with the DNA strands being slightly less bound to the sample and thus able to absorb some of the second
Figure 4: Graphite images A-D showing different imaging modes (see text) and bimodal Dual AC 2nd mode amplitude overlaid on AFM rendered topography (E), 30 µm scan.
E
D
B
C
A

Visit www.AsylumResearch.com to learn more
The foregoing application note is copyrighted by Oxford Instruments Asylum Research, Inc. Oxford Instruments Asylum Research, Inc. does not intend the application note or any part thereof to form part of any order or contract or regarded as a representation relating to the products or service concerned, but it may, with acknowledgement to Oxford Instruments Asylum Research, Inc., be used, applied or reproduced for any purpose. Oxford Instruments Asylum Research, Inc. reserves the right to alter, without notice the specification, design or conditions of supply of any product or service. Application Note 9 – 10/2014.
6310 Hollister AvenueSanta Barbara, CA 93117Voice +1 (805) 696-6466Toll free +1 (888) 472-2795Fax +1 (805) 696-6444
[email protected]@AsylumResearch.com
resonant frequency energy. Again, rendering the topography in three dimensions and painting the second mode amplitude on top (E) allowed the topography and second mode amplitude to be spatially correlated.
ConclusionBimodal Dual AC imaging provides a simple, convenient way to obtain image contrast based on material property variations that may not be present in conventional phase imaging. For quantitative measurements of storage modulus and loss modulus (or loss tangent) consider other techniques in Asylum’s NanomechPro™ toolkit,20 including AM-FM Viscoelastic Mapping Mode, Contact Resonance Viscoelastic Mapping Mode, and Fast Force Mapping Mode.
References1. R. Proksch, Appl Phys Lett 89, 113121 (2006).2. J. Li, J. Cleveland, R. Proksch, Appl Phys Lett 94, 163118 (2009).3. B.J. Rodriguez, C. Callahan, S.V. Kalinin, and R. Proksch, Nanotech 18,
475504 (2007).4. G. Binnig, C.F. Quate, and C. Gerber, Phys Rev Lett 56 (9), 930 (1986).5. Y. Martin, C.C. Williams, and H.K. Wickramasinghe, J Appl Phys 61
(10), 4723 (1987).6. R. Garcia and R. Perez, Surf Sci Reports 47 (6-8), 197 (2002).7. O. Sahin, G. Yaralioglu, R. Grow, S.F. Zappe, A. Atalar, C. Quate, and
O. Solgaard, Sensors and Actuators A-Physical 114 (2-3), 183 (2004).8. O. Sahin, C.F. Quate, O. Solgaard, and A. Atalar, Phys Rev B 69 (16)
(2004).9. H.J. Butt and M. Jaschke, Nanotech 6 (1), 1 (1995).10. D. Sarid, Scanning Force Microscopy, (Oxford University Press, 1990).11. R.W. Stark, T. Drobek, and W.M. Heckl, Appl Phys Lett 74 (22), 3296
(1999).12. S. Crittenden, A. Raman, and R. Reifenberger, Phys Rev B 72 (23)
(2005).13. M. Stark, R. W. Stark, W.M. Heckl, and R. Guckenberger, PNAS 99
(13), 8473 (2002).14. R. Hillenbrand, M. Stark, and R. Guckenberger, Appl Phys Lett 76
(23), 3478 (2000).15. R.W. Stark and W.M. Heckl, Rev Sci Inst 74 (12), 5111 (2003).16. R.W. Stark, Nanotech 15 (3), 347 (2004).17. T.R. Rodriguez and R. Garcia, Appl Phys Lett 84 (3), 449 (2004).18. N.F. Martinez, S. Patil, J.R. Lozano and R. Garcia, Appl Phys Lett 89,
153115 (2006).19. A. Buguin, O. Du Roure, and P. Silberzan, Appl Phys Lett 78 (19),
2982 (2001).20. www.AsylumResearch.com/NanomechPro
Figure 5: (A) topography, (B) fundamental amplitude, (C) fundamental phase, (D) bimodal Dual AC second mode amplitude of DNA, 750 nm scan. (E) Second mode amplitude data overlaid on rendered AFM topography.
E
D
B
C
A
E


