1 Interventional Dual-Energy Imaging 2 -Feasibility of ...
20
Interventional Dual-Energy Imaging 1 - Feasibility of rapid kV-switching on a C-Arm CT System 2 K. M¨ uller, 1 S. Datta, 2, ∗ M. Ahmad, 1 J.-H. Choi, 1 T. Moore, 2 3 L. Pung, 2 C. Niebler, 3 G. E. Gold, 4, 5, 6 A. Maier, 7, † and R. Fahrig 1, ‡ 4 1 Radiological Sciences Lab, Stanford University, Stanford, CA, USA 5 2 Siemens Medical Solutions Inc., Malvern, PA 6 3 Department of Electrical Engineering, 7 Technische Hochschule N¨ urnberg, Germany 8 4 Department of Radiology, Stanford University, Stanford, CA, USA 9 5 Department of Orthopaedic Surgery, 10 Stanford University, Stanford, CA, USA 11 6 Department of Bioengineering, Stanford University, Stanford, CA, USA 12 7 Pattern Recognition Lab, Friedrich-Alexander-Universit¨ at 13 Erlangen-N¨ urnberg, Erlangen, Germany 14 (Dated: September 27, 2016) 15 1
Transcript of 1 Interventional Dual-Energy Imaging 2 -Feasibility of ...
Interventional Dual-Energy Imaging1
- Feasibility of rapid kV-switching on a C-Arm CT System2
K. Muller,1 S. Datta,2, ∗ M. Ahmad,1 J.-H. Choi,1 T. Moore,23
L. Pung,2 C. Niebler,3 G. E. Gold,4, 5, 6 A. Maier,7, † and R. Fahrig1, ‡4
1Radiological Sciences Lab, Stanford University, Stanford, CA, USA5
2Siemens Medical Solutions Inc., Malvern, PA6
3Department of Electrical Engineering,7
Technische Hochschule Nurnberg, Germany8
4Department of Radiology, Stanford University, Stanford, CA, USA9
5Department of Orthopaedic Surgery,10
Stanford University, Stanford, CA, USA11
6Department of Bioengineering, Stanford University, Stanford, CA, USA12
7Pattern Recognition Lab, Friedrich-Alexander-Universitat13
Erlangen-Nurnberg, Erlangen, Germany14
(Dated: September 27, 2016)15
1
Kerstin Muller
Typewritten Text
Preprint version. Copyright Medical Physics.

Abstract
Purpose: In the last years, dual-energy CT imaging has shown clinical value thanks to its ability
to differentiate materials based on their atomic number and to exploit different properties of images
acquired at two different energies. C-arm CT systems are used to guide procedures in the inter-
ventional suite. Up to now, there are no commercially available systems that employ dual-energy
material decomposition. This paper explores the feasibility of implementing a fast kV-switching
technique on a clinical available angiographic system for acquiring dual-energy C-arm CT images.
Methods: As an initial proof of concept, a fast kV-switching approach was implemented on an
angiographic C-arm system and the peak tube voltage during 3D rotational scans was measured.
The tube voltage measurements during fast kV-switching scans were compared to corresponding
measurements on kV-constant scans. Additionally, to prove stability of the requested exposure
parameters, the accuracy of the delivered tube current and pulse width were also recorded and
compared. In a first phantom experiment, the voxel intensity values of the individual tube volt-
age components of the fast kV-switching scans were compared to their corresponding kV-constant
scans. The same phantom was used for a simple material decomposition between different iodine
concentrations and pure water using a fast kV-switching protocol of 81 and 125 kV. In the last
experiment, the same kV-switching protocol as in the phantom scan was used in an in vivo pig
study to demonstrate clinical feasibility.
Results: During rapid kV-switching acquisitions, the measured tube voltage of the X-ray tube
during fast switching scans has an absolute deviation of 0.23± 0.13 kV compared to the measured
tube voltage produced during kV-constant acquisitions. The stability of the peak tube voltage over
different scan requests was about 0.10 kV for the low and 0.46 for the high energy kV-switching
scans and less than 0.1 kV for kV-constant scans, indicating slightly lower stability for kV-switching
scans. The tube current resulted in a relative deviation of -1.6% for the low and 6.6% overestima-
tion for the high tube voltage of the kV-switching scans compared to the kV-constant scans. The
pulse width showed no deviation for the longer pulse width and only minor deviations (0.02± 0.02
ms) for the shorter pulse widths compared to the kV-constant scans. The phantom experiment
using different iodine concentrations showed an accurate correlation (R2 > 0.99) between the ex-
tracted intensity values in the kV-switching and kV-constant reconstructed volumes, and allows
for an automatic differentiation between contrast concentration down to 10% (350 mg/mL iodine)
and pure water under low-noise conditions. Preliminary results of iodine and soft tissue separation
2
showed also promising results in the first in vivo pig study.
Conclusion: The feasibility of dual-energy imaging using a fast kV-switching method on an an-
giographic C-arm CT system was investigated. Direct measurements of beam quality in the X-ray
field demonstrate the stability of the kV-switching method. Phantom and in vivo experiments
showed that images did not deviate from those of corresponding kV-constant scans. All performed
experiments confirmed the capability of performing fast kV-switching scans on a clinical available
C-arm CT system. More complex material decomposition tasks and post-processing steps will be
part of future investigations.
∗ Now with Case Western Reserve University School of Medicine, Cleveland, OH, USA† Also with the Erlangen Graduate School in Advanced Optical Technologies (SAOT), Erlangen, Germany‡ Now with Siemens Healthcare GmbH, Forchheim, Germany
3
I. INTRODUCTION16
C-arm angiography is the primary imaging modality used during minimally invasive pro-17
cedures for navigation of interventional devices. These C-arm angiographic systems are18
capable of guiding the physician using fluoroscopic 2D X-rays at frame rates up to 30 f/s.19
Furthermore, they allow acquisition of 2D X-ray images during rotational scans. These X-20
ray images acquired under different projection angles can be used for a 3D reconstruction21
of the field-of-view using a cone-beam reconstruction (FDK) algorithm [1]. The 3D recon-22
structions are clinically used for numerous applications, including liver cancer treatment in23
interventional oncology [2], providing additional navigational support during transcatheter24
structural heart interventions [3] or cerebral aneurysms assessment in neuroradiology [4].25
In the last decade, dual-energy imaging in conventional CT has grown in clinical use26
[5–9]. This technique allows the differentiation of materials and tissue based on differential27
absorption of varying X-ray photon energies [10]. For example, iodine, a commonly used28
vascular contrast agent, shows sharply decreasing attenuation with increasing X-ray energy29
due to the photo-electric effect. This spectral response is different than that of soft tis-30
sue which shows more constant attenuation due mostly to Compton scattering. Acquiring31
X-ray projection images at different photon energies requires two consecutive scans with32
two different tube potentials (consecutive technique), a multilayer detector (multilayer tech-33
nique), a photon-counting energy-discrimination detector (photon counting technique), two34
simultaneously operating X-ray tubes (dual-source technique), or one X-ray tube with rapid35
modulation of the tube voltage (fast kV-switching technique) [11].36
Within interventional radiology, dual-energy imaging is still ongoing research, including37
development of photon counting detectors with dual-energy capabilities [12–15]. Interven-38
tional dual-energy imaging would allow, for example, differentiation of iodinated contrast39
agent and haemorrhage directly after revascularisation in acute ischaemic stroke patients40
[16]. Also 3D spectral imaging during the intervention may permit depiction of the vascular41
lumen while separating it from calcified plaque and/or different contrast agent [17]. Detailed42
material differentiation within the interventional suite directly during or after the treatment43
would allow adjustment of respective therapy planning immediately.44
In this paper, the hypothesis that fast kV-switching dual-energy imaging is possible with45
an interventional angiography system using only one sweep of the C-arm is investigated. The46
4

system is equipped with one X-ray tube and can be used to generate images at different X-ray47
energies by switching the X-ray tube voltage rapidly from pulse to pulse. To date, there is no48
clinically available angiographic C-arm system available allowing dual-energy imaging during49
a single rotational 3D acquisition. In a first experiment, tube voltage measurements were50
performed to prove the concept of kV-switching with the C-arm system and to measure any51
instability resulting from rapidly switching the tube voltage. A fast kV-switching protocol52
was used to image an electron density phantom with different iodine concentrations, and a53
first in vivo study was carried out. Preliminary results on the feasibility have been presented54
in Datta et al. [18], where one specific rapid kV-switching set up has been evaluated with55
respect to only one iodine concentration (500 mg I; 10 mg/mL) within a water-like phantom.56
This first limited study encouraged us to investigate multiple rapid kV-switching setups in57
a phantom and in an in vivo study.58
II. METHODS AND MATERIALS59
A. C-arm CT: kV-Switching Principle60
In general, an automatic exposure control (AEC) software is integrated in C-arm systems61
in order to maintain the same detector entrance dose throughout the scan while rotating62
around the patient [19]. The software adapts the tube current (mA), pulse width (ms), and63
tube voltage (kV) in order to maintain a constant detector entrance dose. That means the64
exposure varies dynamically based on the projection angle and attenuation of the object in65
the field of view. In order to perform dual-energy C-arm CT imaging, constant tube voltage66
settings are required. In this study, a prototype software application enables manual control67
of the tube output on a research Artis zeego C-arm angiography system (Siemens Healthcare68
GmbH, Forchheim, Germany). The prototype uses a modifiable configuration file that allows69
acquisition of projection images with pre-defined acquisition parameters: kVp, mA, and ms70
for each X-ray pulse. Each 3D acquisition resulted in 248 projections over an angular range71
of 200 degrees over a time duration of 10 s with an angular increment of 0.8◦ between72
adjacent 2D X-ray images. No copper filtration is used in addition to the system’s fixed73
filtration of 2.5 mm aluminum. The acquired 2D projection images have an isotropic pixel74
size of 0.616 mm. For the kV-switching scan, there were 124 projections acquired at a low75
5

tube voltage interleaved with 124 projections acquired at a high tube voltage. The current76
and pulse width parameters for the scans were chosen to match the current and pulse width77
parameters the system reports during a clinical scan of a body phantom with the AEC on,78
with a dose request of 1.2µGy/f and the respective tube voltage. The sets of projections were79
separated and reconstructed individually for the low and high energy datasets with a filtered-80
backprojection algorithm. To facilitate a head-to-head comparison, kV-constant acquisitions81
were undersampled by removing alternating projections before reconstruction. The 2D X-82
ray projection images were pre-processed according to the actual exposure parameters used.83
All volumes were reconstructed with an isotropic voxel size of 1 mm distributed on a 256384
grid size. No additional post-processing algorithms were applied.85
B. Calibration of kV Meter using Fixed Exposure Parameter86
In order to assess the C-arm system’s capability of switching high and low tube voltage87
between adjacent frames during a 3D rotational scan, a kV meter was used to measure88
the respective peak tube voltage within the X-ray beam spectrum. First, to assess the89
consistency of the kV meter to measure the system tube voltage for 2D and 3D imaging,90
the tube voltage was measured using sequences with fixed exposure parameter settings.91
For both experiments, the tube voltage was measured within the X-ray beam path using92
a non-invasive kV meter from Radcal R© Accu-Gold with an AGMS-D sensor. The sensor has93
a range from 40-160 kV and a nominal accuracy of ±2.5%. The calibration of this device94
can be traced to the Accredited Dosimetry Calibration Laboratory (ADCL) calibration. In95
measuring the peak voltage of the X-ray beam, the general recommendations of AAPM96
Report #74 (Quality Control in Diagnostic Radiology) were followed [20]. Although kV97
meters are typically suspended in air during measurements, the kV meter was attached to98
the face of the flat panel detector in order to maintain the appropriate source/kV-meter99
orientation during a C-arm rotation. It was verified that any backscatter contribution to100
the kV meter reading was negligible (< 1%). From the datasheet of the installed X-ray101
generator an accuracy of the X-ray tube (MEGALIX CAT Plus) of ±5% can be assumed.102
6
C. 3D Tube Voltage Measurement using fast kV-Switching103
For evaluation of the stability of the kV-switching scans, the tube current was held con-104
stant at 100, 200, or 300 mA and four different fast kV-switching settings were investigated.105
The tested kV-switching protocols had low and high kVp of 70/90, 70/109, 81/109, and106
81/125 kV with 100, 200, and 300 mA, and with 12.5 ms and 3.2 ms pulse width for the107
low and the high energies. It is noted that a fast kV-switching scan between 70 kV and108
125 kV is not possible when a similar detector entrance dose is preferred for both low and109
high energies. Rapidly switching the current between low and high tube voltage settings is110
not possible because that is controlled by changing the temperature of the filament. The111
system’s minimal pulse width is 3.2 ms and the maximum pulse width is 12.5 ms. Therefore,112
a fast kV-switching scan between 70 and 125 kV would result in underexposed 70 kV images113
or overexposed 125 kV images.114
D. Contrast Concentration Measurements115
The next experiment was an iodine contrast concentration benchmark evaluation using116
the same 3D scan protocol as described in Section IIA. The inner disk of the electron density117
phantom (model M062) from CIRS was loaded with eight 20 mL syringes. The syringes118
were filled with iodinated contrast (Omnipaque 350 mg/mL) with different concentrations119
(0%, 5%, 10%, 12.5%, 25%, 50%, 75%, and 100%), as well as a dense bone sample (1.82 g/cc120
physical density). Taking into consideration the possible kV-switching range of the previous121
experiment in Section IIC, four different kV-switching combinations were performed: 70/90122
kV (12.5/3.3 ms, 350 mA), 81/109 kV (12.5/3.3 ms, 225 mA), 90/125 kV (12.5/3.2 ms, 250123
mA), and 81/125 kV (12.5/3.2 ms, 225 mA). Tube current was selected such that no severe124
under or overexposure of the phantom will appear in the acquired X-ray low and high energy125
projection images.126
E. In vivo Experiment127
The capability of the kV-switching method of dual-energy imaging was also tested in128
vivo. The protocol for this in vivo animal study was approved by Stanford University’s129
Administrative Panel on Laboratory Animal Care. One Yorkshire pig (approximately 50130
7
kg) was used for this study. Arterial femoral access was established using percutaneous131
puncture for hemodynamic monitoring, administration of medications, and the injection of132
contrast agent. First, two constant scans with 81 kV, 295 mA, and 12.5 ms and 125 kV,133
295 mA, and 3.2 ms were performed, followed by the fast kV-switching scan using the same134
parameters. Again, tube current was selected such that no severe under or overexposure of135
the pig will appear in the 2D acquired projection X-ray images. All scans were performed136
during administration of a 17 mL bolus of 50% iodinated contrast agent (Omnipaque 350137
mg/mL) diluted in saline. The contrast was administered with a rate of 1.5 mL/s through138
a 5F Envoy guiding catheter (Codman, Raynham, MA) positioned proximally within the139
external carotid artery using a power injector (Medtron, Saarbrucken, Germany). An X-ray140
imaging delay of 1s was used.141
For the in vivo data, from the high and low energy 3D reconstructions, a dual-energy142
index (DEI) volume is computed according to Johnson et al. [21]:143
DEI =HU81kV −HU125kV
HU81kV +HU125kV + 2000. (1)
The DEI is zero for water, negative for atoms with a smaller and positive for atoms with a144
larger effective atomic number Z than water.145
III. RESULTS AND DISCUSSION146
A. Calibration of kV Meter using Fixed Exposure Parameter147
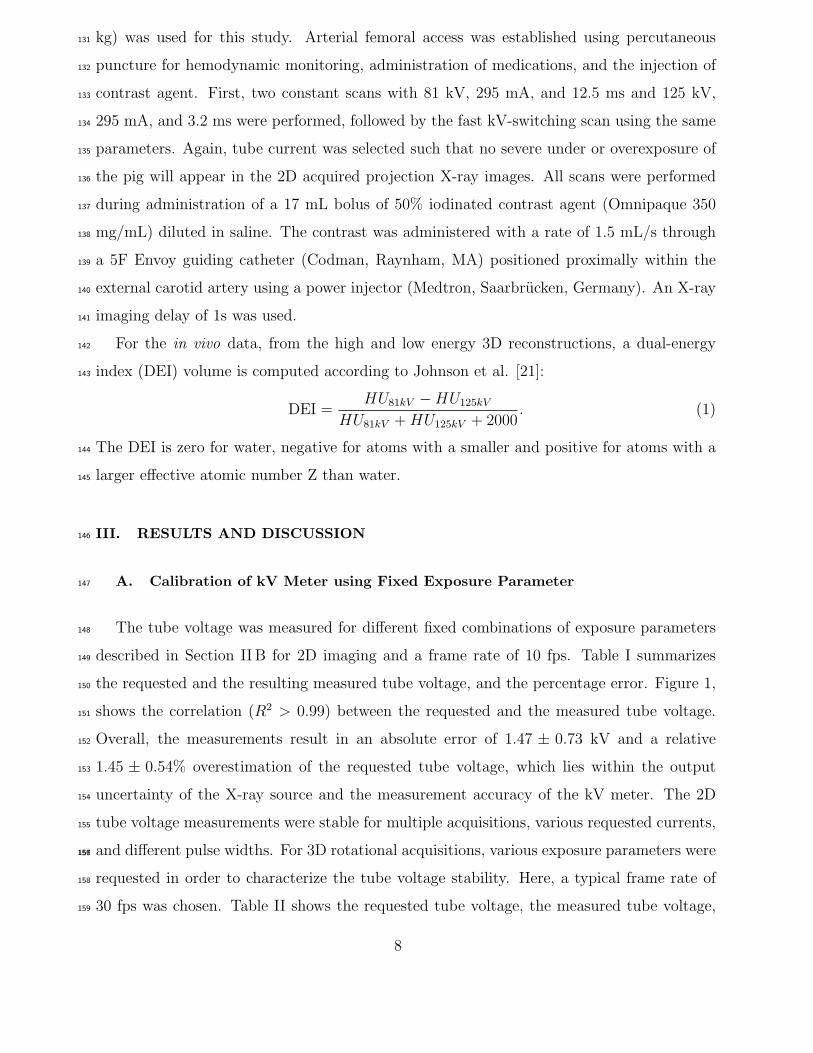
The tube voltage was measured for different fixed combinations of exposure parameters148
described in Section II B for 2D imaging and a frame rate of 10 fps. Table I summarizes149
the requested and the resulting measured tube voltage, and the percentage error. Figure 1,150
shows the correlation (R2 > 0.99) between the requested and the measured tube voltage.151
Overall, the measurements result in an absolute error of 1.47 ± 0.73 kV and a relative152
1.45 ± 0.54% overestimation of the requested tube voltage, which lies within the output153
uncertainty of the X-ray source and the measurement accuracy of the kV meter. The 2D154
tube voltage measurements were stable for multiple acquisitions, various requested currents,155
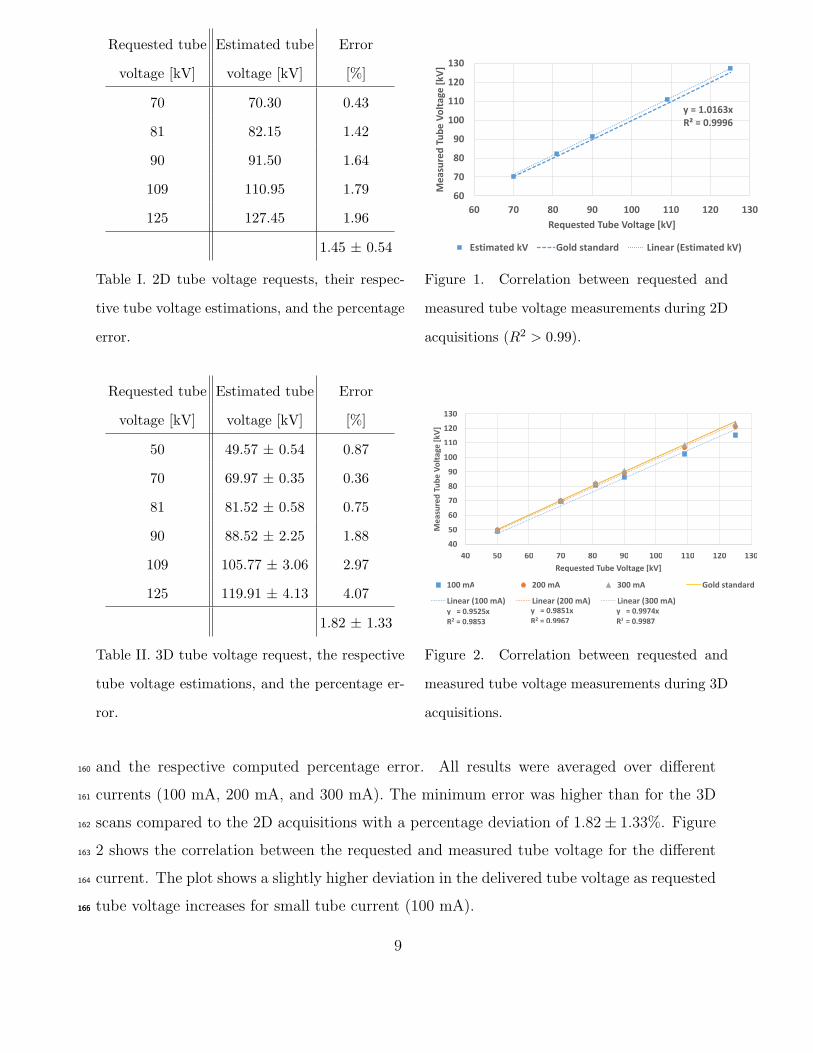
and different pulse widths. For 3D rotational acquisitions, various exposure parameters were156157
requested in order to characterize the tube voltage stability. Here, a typical frame rate of158
30 fps was chosen. Table II shows the requested tube voltage, the measured tube voltage,159
8
Requested tube Estimated tube Error
voltage [kV] voltage [kV] [%]
70 70.30 0.43
81 82.15 1.42
90 91.50 1.64
109 110.95 1.79
125 127.45 1.96
1.45 ± 0.54
Table I. 2D tube voltage requests, their respec-
tive tube voltage estimations, and the percentage
error.
y = 1.0163x
R² = 0.9996
60
70
80
90
100
110
120
130
60 70 80 90 100 110 120 130
Me
asu
red
Tu
be
Vo
lta
ge
[k
V]
Requested Tube Voltage [kV]
Estimated kV Gold standard Linear (Estimated kV)
Figure 1. Correlation between requested and
measured tube voltage measurements during 2D
acquisitions (R2 > 0.99).
Requested tube Estimated tube Error
voltage [kV] voltage [kV] [%]
50 49.57 ± 0.54 0.87
70 69.97 ± 0.35 0.36
81 81.52 ± 0.58 0.75
90 88.52 ± 2.25 1.88
109 105.77 ± 3.06 2.97
125 119.91 ± 4.13 4.07
1.82 ± 1.33
Table II. 3D tube voltage request, the respective
tube voltage estimations, and the percentage er-
ror.
40
50
60
70
80
90
100
110
120
130
40 50 60 70 80 90 100 110 120 130
Me
asu
red
Tu
be
Vo
lta
ge
[k
V]
Requested Tube Voltage [kV]
100 mA 200 mA 300 mA Gold standard
Linear (100 mA) Linear (200 mA) Linear (300 mA)
y = 0.9525x
R2 = 0.9853
y = 0.9851x
R2 = 0.9967
y = 0.9974x
R2 = 0.9987
Figure 2. Correlation between requested and
measured tube voltage measurements during 3D
acquisitions.
and the respective computed percentage error. All results were averaged over different160
currents (100 mA, 200 mA, and 300 mA). The minimum error was higher than for the 3D161
scans compared to the 2D acquisitions with a percentage deviation of 1.82± 1.33%. Figure162
2 shows the correlation between the requested and measured tube voltage for the different163
current. The plot shows a slightly higher deviation in the delivered tube voltage as requested164
tube voltage increases for small tube current (100 mA).165166
9
B. 3D Tube Voltage Estimation using fast kV-Switching167
The experiments in Section IIIA show that the deviation of the measured and requested168
tube voltage is within the nominal accuracy of the kV meter. For the fast kV-switching169
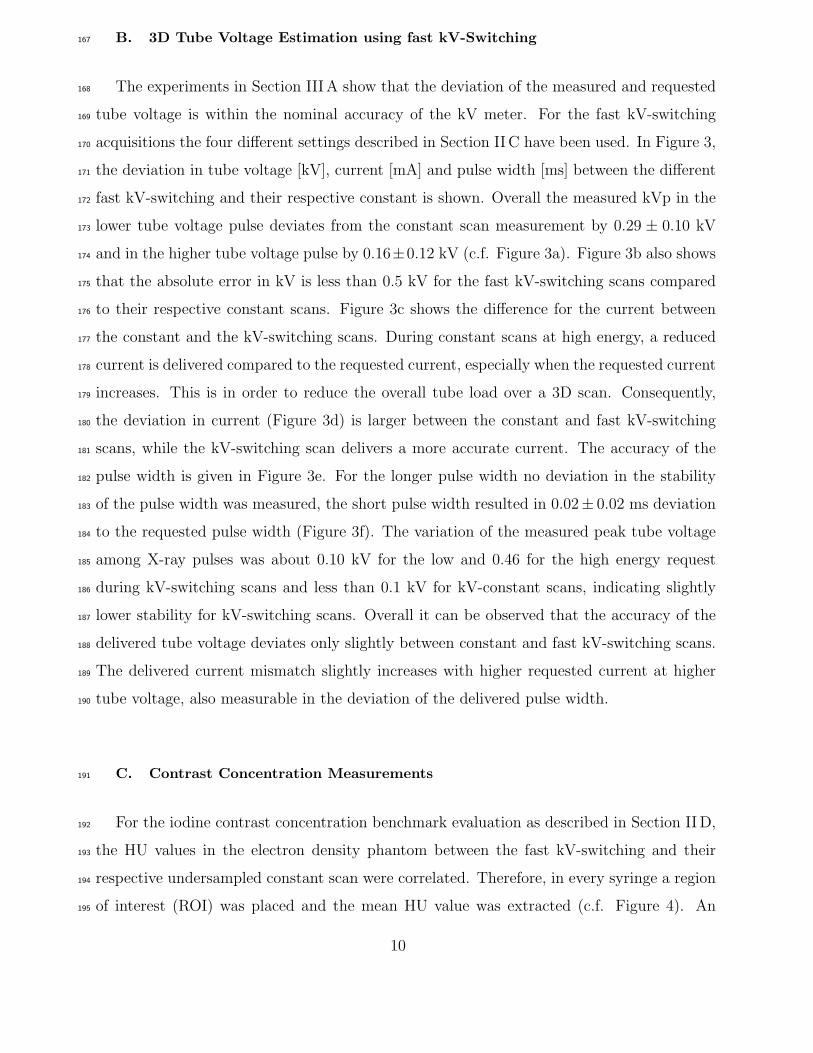
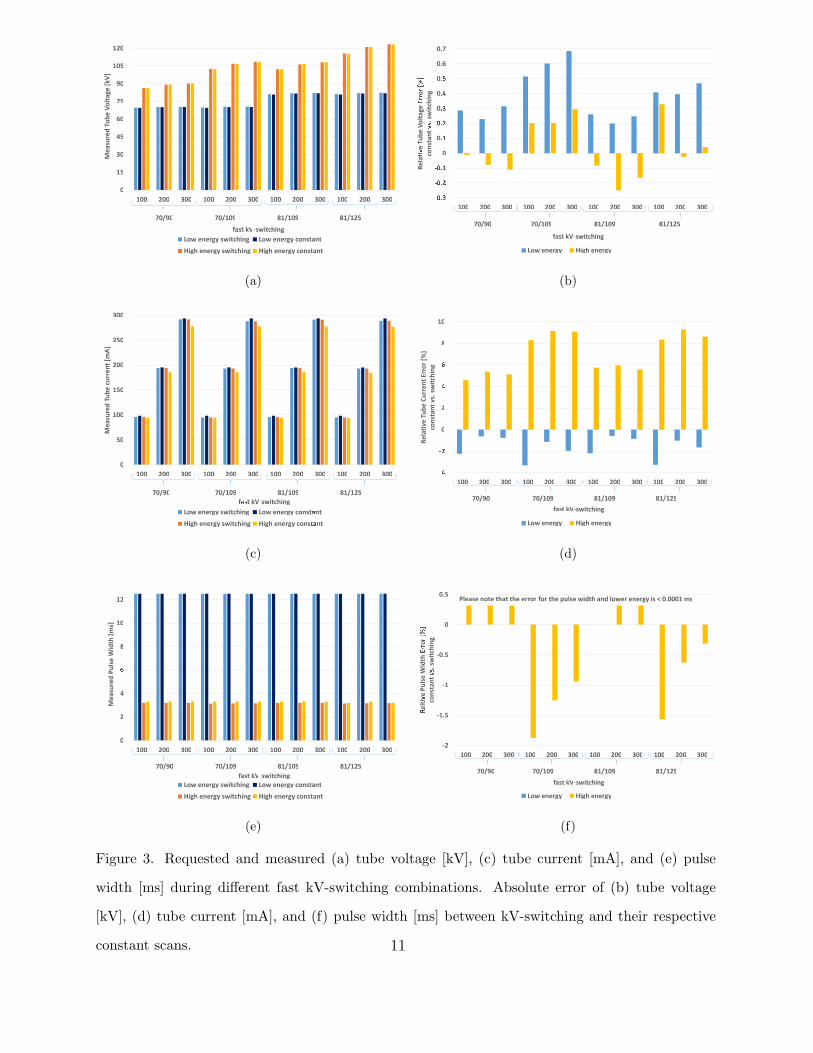
acquisitions the four different settings described in Section IIC have been used. In Figure 3,170
the deviation in tube voltage [kV], current [mA] and pulse width [ms] between the different171
fast kV-switching and their respective constant is shown. Overall the measured kVp in the172
lower tube voltage pulse deviates from the constant scan measurement by 0.29 ± 0.10 kV173
and in the higher tube voltage pulse by 0.16±0.12 kV (c.f. Figure 3a). Figure 3b also shows174
that the absolute error in kV is less than 0.5 kV for the fast kV-switching scans compared175
to their respective constant scans. Figure 3c shows the difference for the current between176
the constant and the kV-switching scans. During constant scans at high energy, a reduced177
current is delivered compared to the requested current, especially when the requested current178
increases. This is in order to reduce the overall tube load over a 3D scan. Consequently,179
the deviation in current (Figure 3d) is larger between the constant and fast kV-switching180
scans, while the kV-switching scan delivers a more accurate current. The accuracy of the181
pulse width is given in Figure 3e. For the longer pulse width no deviation in the stability182
of the pulse width was measured, the short pulse width resulted in 0.02± 0.02 ms deviation183
to the requested pulse width (Figure 3f). The variation of the measured peak tube voltage184
among X-ray pulses was about 0.10 kV for the low and 0.46 for the high energy request185
during kV-switching scans and less than 0.1 kV for kV-constant scans, indicating slightly186
lower stability for kV-switching scans. Overall it can be observed that the accuracy of the187
delivered tube voltage deviates only slightly between constant and fast kV-switching scans.188
The delivered current mismatch slightly increases with higher requested current at higher189
tube voltage, also measurable in the deviation of the delivered pulse width.190
C. Contrast Concentration Measurements191
For the iodine contrast concentration benchmark evaluation as described in Section IID,192
the HU values in the electron density phantom between the fast kV-switching and their193
respective undersampled constant scan were correlated. Therefore, in every syringe a region194
of interest (ROI) was placed and the mean HU value was extracted (c.f. Figure 4). An195
10
0
15
30
45
60
75
90
105
120
100 200 300 100 200 300 100 200 300 100 200 300
Me
asu
red
Tu
be
Vo
lta
ge
[k
V]
fast kV-switching
Low energy switching Low energy constant
High energy switching High energy constant
70/90 70/109 81/109 81/125
(a)
-���
����
-���
0
0�.
��0
0��
0�
0�
0.6
0.7
100 200 300 100 200 300 100 200 300 100 200 300
Re
la
t��
e T
ub
e V
olt
ag
e E
or
��
con
sta
nt
v��
swit
chin
g
fast kV-switching
Low energy High energy
70/90 70/109 81/109 81/125
(b)
0
50
100
150
200
250
300
100 200 300 100 200 300 100 200 300 100 200 300
Me
asu
red
Tu
be
cu
rre
nt
[mA
]
fa�t kV-switching
Low energy switching Low energy constant
High energy switching High energy cons�ant
70/90 70/109 81/109 81/125
(c)
��
��
0
2
�
6
8
10
100 200 300 100 200 300 100 200 300 100 200 300
Re
lati
ve
Tu
be
Cu
rre
nt
Err
or
[%]
con
sta
nt
vs.
sw
itch
ing
fast kV-switching
Low energy High energy
70/90 70/109 81/109 81/125
(d)
0
2
4
�
8
10
12
100 200 300 100 200 300 100 200 300 100 200 300
Me
asu
red
Pu
lse
Wid
th [
ms]
fast kV-switching
Low energy switching Low energy constant
High energy switching High energy constant
70/90 70/109 81/109 81/125
(e)
-2
-1.5
-1
-0.5
0
0.5
100 200 300 100 200 300 100 200 300 100 200 300
R
elt
i�
e P
uls
e W
idth
���
o
�r��
con
sta
nt
���
swit
chin
g
fast kV-switching
Low energy High energy
70/90 70/109 81/109 81/125
Please note that the error for the pulse width and lower energy is < 0.0001 ms
(f)
Figure 3. Requested and measured (a) tube voltage [kV], (c) tube current [mA], and (e) pulse
width [ms] during different fast kV-switching combinations. Absolute error of (b) tube voltage
[kV], (d) tube current [mA], and (f) pulse width [ms] between kV-switching and their respective
constant scans. 11
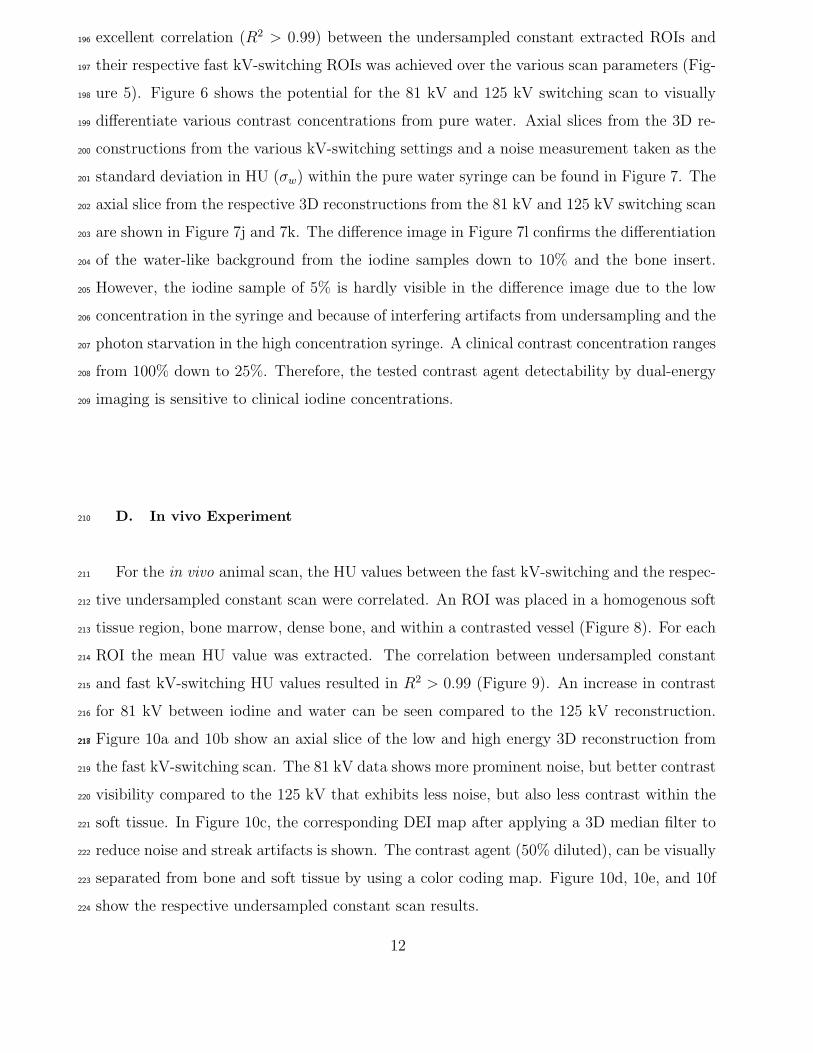
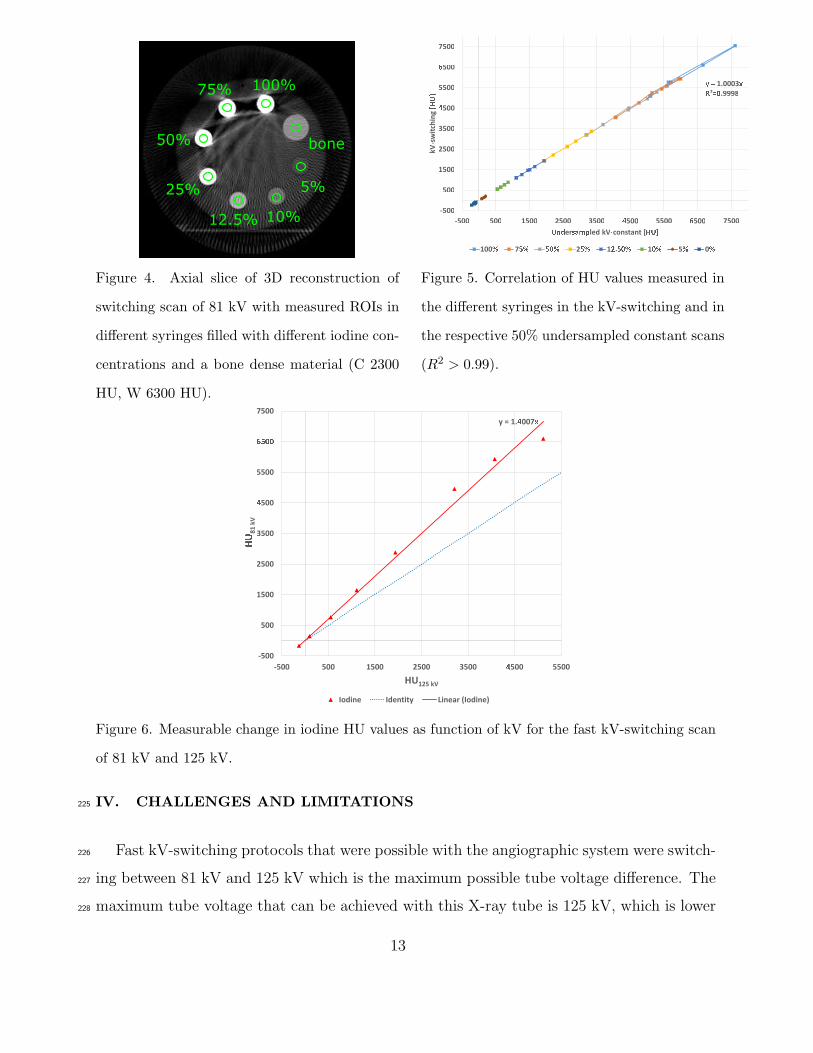
excellent correlation (R2 > 0.99) between the undersampled constant extracted ROIs and196
their respective fast kV-switching ROIs was achieved over the various scan parameters (Fig-197
ure 5). Figure 6 shows the potential for the 81 kV and 125 kV switching scan to visually198
differentiate various contrast concentrations from pure water. Axial slices from the 3D re-199
constructions from the various kV-switching settings and a noise measurement taken as the200
standard deviation in HU (σw) within the pure water syringe can be found in Figure 7. The201
axial slice from the respective 3D reconstructions from the 81 kV and 125 kV switching scan202
are shown in Figure 7j and 7k. The difference image in Figure 7l confirms the differentiation203
of the water-like background from the iodine samples down to 10% and the bone insert.204
However, the iodine sample of 5% is hardly visible in the difference image due to the low205
concentration in the syringe and because of interfering artifacts from undersampling and the206
photon starvation in the high concentration syringe. A clinical contrast concentration ranges207
from 100% down to 25%. Therefore, the tested contrast agent detectability by dual-energy208
imaging is sensitive to clinical iodine concentrations.209
D. In vivo Experiment210
For the in vivo animal scan, the HU values between the fast kV-switching and the respec-211
tive undersampled constant scan were correlated. An ROI was placed in a homogenous soft212
tissue region, bone marrow, dense bone, and within a contrasted vessel (Figure 8). For each213
ROI the mean HU value was extracted. The correlation between undersampled constant214
and fast kV-switching HU values resulted in R2 > 0.99 (Figure 9). An increase in contrast215
for 81 kV between iodine and water can be seen compared to the 125 kV reconstruction.216
Figure 10a and 10b show an axial slice of the low and high energy 3D reconstruction from217218
the fast kV-switching scan. The 81 kV data shows more prominent noise, but better contrast219
visibility compared to the 125 kV that exhibits less noise, but also less contrast within the220
soft tissue. In Figure 10c, the corresponding DEI map after applying a 3D median filter to221
reduce noise and streak artifacts is shown. The contrast agent (50% diluted), can be visually222
separated from bone and soft tissue by using a color coding map. Figure 10d, 10e, and 10f223
show the respective undersampled constant scan results.224
12
100%75%
50%
25%
12.5% 10%
5%
bone
Figure 4. Axial slice of 3D reconstruction of
switching scan of 81 kV with measured ROIs in
different syringes filled with different iodine con-
centrations and a bone dense material (C 2300
HU, W 6300 HU).
-500
500
1500
2500
3500
4500
5500
!500
7500
-500 500 1500 2500 3500 4500 5500 !500 7500
kV
-sw
itch
ing
["#$
U%&ers'()led kV-constant [HU*
100+ 75+ 5,+ 25+ 12/5,+ 1,+ 5+ 0+
y 1 1.0003x
321,.9998
Figure 5. Correlation of HU values measured in
the different syringes in the kV-switching and in
the respective 50% undersampled constant scans
(R2 > 0.99).
y = 1.70078
-500
500
1500
2500
3500
7500
5500
9:;;
7500
-500 500 1500 2500 3500 <500 5500
=>
81
kV
HU125 kV
Iodine Identity Linear (Iodine)
Figure 6. Measurable change in iodine HU values as function of kV for the fast kV-switching scan
of 81 kV and 125 kV.
IV. CHALLENGES AND LIMITATIONS225
Fast kV-switching protocols that were possible with the angiographic system were switch-226
ing between 81 kV and 125 kV which is the maximum possible tube voltage difference. The227
maximum tube voltage that can be achieved with this X-ray tube is 125 kV, which is lower228
13

(a) 70 kV; σw = 89.42 HU (b) 90 kV; σw = 63.48 HU (c) Difference (a)-(b)
(d) 81 kV; σw = 63.34 HU (e) 109 kV; σw = 46.11 HU (f) Difference (d)-(e)
(g) 90 kV; σw = 45.07 HU (h) 125 kV; σw = 43.19 HU (i) Difference (g)-(h)
(j) 81 kV; σw = 64.85 HU (k) 125 kV; σw = 42.13 HU (l) Difference (j)-(k)
Figure 7. Axial slice of fast kV-switching scans in first and second column (C 2300 HU, W 6300
HU) and third column the respective difference slice (C 0 HU, W 1250 HU).14
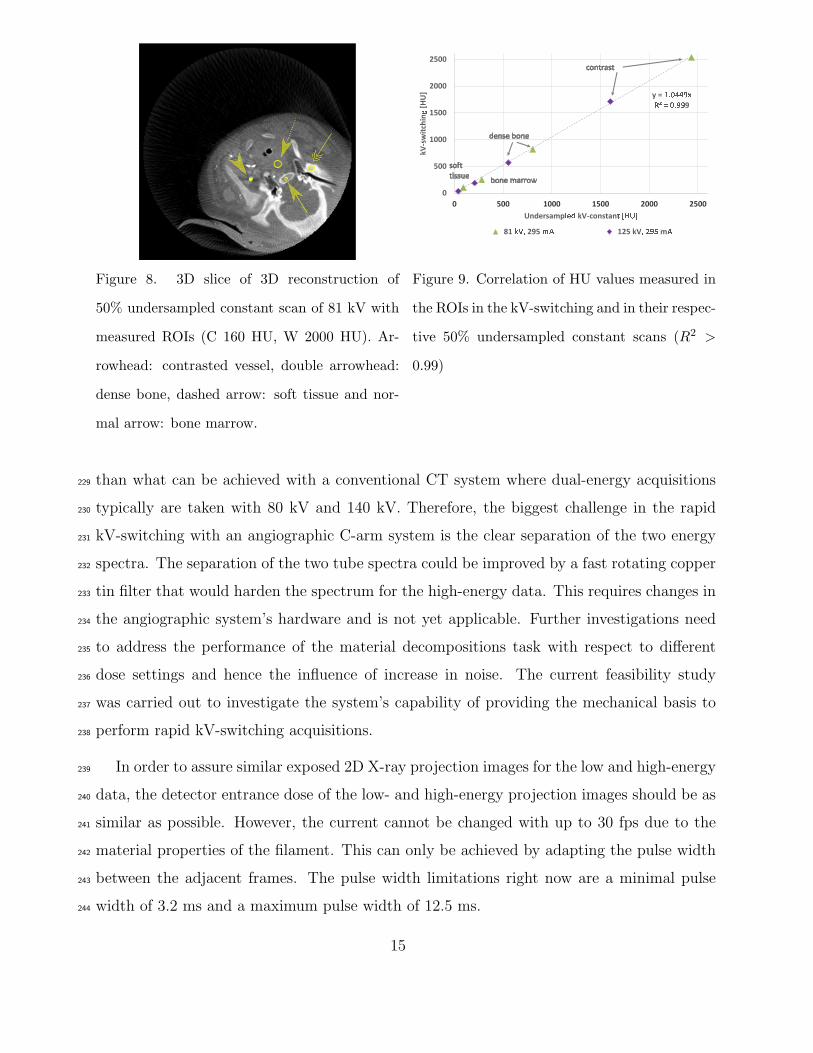
Figure 8. 3D slice of 3D reconstruction of
50% undersampled constant scan of 81 kV with
measured ROIs (C 160 HU, W 2000 HU). Ar-
rowhead: contrasted vessel, double arrowhead:
dense bone, dashed arrow: soft tissue and nor-
mal arrow: bone marrow.
y = ?@ABBCD
FG I A@CC9
0
500
1000
1500
2000
2500
0 500 1000 1500 2000 2500
kV-switchin
g
[HU]
UndersamplJK kV-constanL MNOP
81 QST 295 mV 125 kVT WCX mV
Figure 9. Correlation of HU values measured in
the ROIs in the kV-switching and in their respec-
tive 50% undersampled constant scans (R2 >
0.99)
than what can be achieved with a conventional CT system where dual-energy acquisitions229
typically are taken with 80 kV and 140 kV. Therefore, the biggest challenge in the rapid230
kV-switching with an angiographic C-arm system is the clear separation of the two energy231
spectra. The separation of the two tube spectra could be improved by a fast rotating copper232
tin filter that would harden the spectrum for the high-energy data. This requires changes in233
the angiographic system’s hardware and is not yet applicable. Further investigations need234
to address the performance of the material decompositions task with respect to different235
dose settings and hence the influence of increase in noise. The current feasibility study236
was carried out to investigate the system’s capability of providing the mechanical basis to237
perform rapid kV-switching acquisitions.238
In order to assure similar exposed 2D X-ray projection images for the low and high-energy239
data, the detector entrance dose of the low- and high-energy projection images should be as240
similar as possible. However, the current cannot be changed with up to 30 fps due to the241
material properties of the filament. This can only be achieved by adapting the pulse width242
between the adjacent frames. The pulse width limitations right now are a minimal pulse243
width of 3.2 ms and a maximum pulse width of 12.5 ms.244
15

(a) (b) (c)
(d) (e) (f)
Figure 10. Axial slice of different 3D reconstructions, (a) fast kV-switching 81 kV scan (C 160 HU,
W 2000 HU). (b) Fast kV-switching 125 kV scan (C 160 HU, W 2000 HU). (c) Dual-energy index
(DEI) image of fast kV-switching 81/125 kV scan. (d) Undersampled kV-constant 81 kV scan (C
-460 HU, W 1070 HU). (e) Undersampled kV-constant 125 kV scan (C 160 HU, W 2000 HU) and
(f) DEI image of undersampled kV-constant scans.
Overall, further investigations need to address more complex material decomposition245
specific algorithmic development [22–26], as well as 3D image quality improvements to reduce246
the undersampling artifacts [27].247
V. CONCLUSION248
In this paper, the feasibility of fast kV-switching for dual-energy imaging using an an-249
giographic C-arm CT system was investigated. The tube potential was switched between250
adjacent frames during a 3D rotational scan during detector readout at 30 fps. The eval-251
uation of the tube voltage stability during a fast kV-switching scan was compared to the252
respective kV-constant scan and showed a relative deviation of about 0.27±0.18%. Overall,253
the requested pulse width and tube current only differ slightly between kV-constant and fast254
16
kV-switching scans. One potential clinical fast kV-switching application in the angiographic255
suite is to distinguish iodine from water in order to produce virtual digital subtraction an-256
giography data. Therefore, a fast kV-switching scan between 81 kV and 125 kV was used257
for an experiment using an electron density phantom. An excellent correlation (R2 > 0.99)258
between HU values in kV-switching and kV-constant scans was observed for various iodine259
concentrations in an electron density phantom. The lowest bound of iodine concentration260
that could be accurately detected was 10%. A first in vivo pig experiment also confirmed a261
high correlation between measured HU values in kV-constant and fast kV-switching scans,262
and allows for the differentiation of iodine, and soft tissue.263
ACKNOWLEDGMENTS264
The authors gratefully acknowledge funding support from the NIH Shared Instrument265
Grant S10 RR026714 supporting the zeego@StanfordLab, and Siemens Healthcare GmbH266
Advanced Therapies. Special thanks also go to Jeremy Heit, MD, PhD and Yamil Saenz for267
their help with the in vivo pig experiment.268
DISCLAIMER269
The concepts and information presented in this paper are based on research and are not270
commercially available.271
Potential conflict of interest272
Please note that this study was supported by an institutional research grant funded by Siemens273
Healthcare, Forchheim, Germany. However, the study design, methodology and results were pro-274
vided by the first author and were independent of any oversight from the company.275
[1] L. A. Feldkamp, L. C. Davis, and J. W. Kress, “Practical cone-beam algorithm,” Journal of276
the Optical Society of America A 1, 612–619 (1984).277
17
[2] A. Tognolini, J. Louie, G. Hwang, L. Hofmann, D. Sze, and N. Kothary, “C-arm Computed278
Tomography for Hepatic Interventions: A Practical Guide,” Journal of Vascular and Inter-279
ventional Radiology 21, 1817–1823 (2010).280
[3] P. Biaggi, C. Fernandez-Golfın, R. Hahn, and R. Corti, “Hybrid Imaging During Tran-281
scatheter Structural Heart Interventions.” Current cardiovascular imaging reports 8, 33 (2015).282
[4] N. S. Heran, J. K. Song, K. Namba, W. Smith, Y. Niimi, and A. Berenstein, “The utility of283
DynaCT in neuroendovascular procedures,” American Journal of Neuroradiology 27, 330–332284
(2006).285
[5] I. Danad, Z. A. Fayad, M. J. Willemink, and J. K. Min, “New Applications of Cardiac286
Computed Tomography,” JACC: Cardiovascular Imaging 8, 710–723 (2015).287
[6] I. Vlahos, R. Chung, A. Chung, and R. Morgan, “Dual-Energy CT: Vascular Applications,”288
American Journal of Roentgenology 199, 87–97 (2012).289
[7] T. Heye, R. C. Nelson, L. M. Ho, D. Marin, and D. T. Boll, “Dual-energy CT applications290
in the abdomen.” American Journal of Roentgenology 199, 64–70 (2012).291
[8] T. G. Flohr, C. H. McCollough, H. Bruder, M. Petersilka, K. Gruber, C. Suβ, M. Grasruck,292
K. Stierstorfer, B. Krauss, R. Raupach, A. N. Primak, A. Kuttner, S. Achenbach, C. Becker,293
A. Kopp, and B. M. Ohnesorge, “First performance evaluation of a dual-source CT (DSCT)294
system,” European Radiology 16, 256–268 (2006).295
[9] B. Krauss, K. L Grant, B. T Schmidt, and T. G Flohr, “The Importance of Spectral Separa-296
tion: An Assessment of Dual-Energy Spectral Separation for Quantitative Ability and Dose297
Efficiency.” Investigative Radiology 50, 114–118 (2015).298
[10] A. Graser, T. R. C. Johnson, H. Chandarana, and M. Macari, “Dual energy CT: Preliminary299
observations and potential clinical applications in the abdomen,” European Radiology 19,300
13–23 (2009).301
[11] C. H. McCollough, S. Leng, L. Yu, and J. G. Fletcher, “Dual- and Multi-Energy CT: Princi-302
ples, Technical Approaches, and Clinical Applications.” Radiology 276, 637–653 (2015).303
[12] Z. Yu, S Leng, S.M. Jorgensen, Z. Li, R. Gutjahr, B. Chen, X. Duan, A.F. Halaweish, L. Yu,304
E.L. Ritman, and C.H. McCollough, “Initial results from a prototype whole-body photon-305
counting computed tomography system,” in SPIE Medical Imaging (2015).306
[13] M. Manhart, R. Fahrig, J. Hornegger, A. Doerfler, and A. Maier, “Guided Noise Reduction for307
Spectral CT with Energy-Selective Photon Counting Detectors,” in Proceedings of the Third308
18
CT Meeting (2014) pp. 91–94.309
[14] M. Ahmad, R. Fahrig, M. Spahn, J.-H. Choi, N. Koster, S. Reitz, W. Hinshaw, L. Pung,310
T. Moore, A. Maier, and K. Muller, “First in-vivo experiments with a large field-of-view flat311
panel photon-counting detector,” in Proceedings of The Fourth International Conference on312
Image Formation in X-Ray Computed Tomography, edited by M. Kachelriess (2016).313
[15] K. Muller, M. Ahmad, M. Spahn, J.-H. Choi, S. Reitz, N. Koster, Y. Lu, R. Fahrig, and314
A. Maier, “Towards material decomposition on large field-of-view flat panel photon-counting315
detectors – first in-vivo results,” in Proceedings of The Fourth International Conference on316
Image Formation in X-Ray Computed Tomography, edited by M. Kachelriess (2016).317
[16] M. P M Tijssen, P. A M Hofman, A. A R Stadler, W. Van Zwam, R. De Graaf, R. J. Van318
Oostenbrugge, E. Klotz, J. E. Wildberger, and A. A. Postma, “The role of dual energy CT319
in differentiating between brain haemorrhage and contrast medium after mechanical revascu-320
larisation in acute ischaemic stroke,” European Radiology 24, 834–840 (2014).321
[17] Sebastian Feuerlein, Ewald Roessl, Roland Proksa, Gerhard Martens, Oliver Klass, Mar-322
tin Jeltsch, Volker Rasche, Hans-Juergen Brambs, Martin H K Hoffmann, and Jens-Peter323
Schlomka, “Multienergy photon-counting K-edge imaging: potential for improved luminal324
depiction in vascular imaging.” Radiology 249, 1010–1016 (2008).325
[18] S. Datta, J.-H. Choi, C. Niebler, A. Maier, R. Fahrig, and K. Mueller, “Dual-Energy C-326
Arm CT in the Angiographic Suite,” in 2015 IEEE Nuclear Science Symposium and Medical327
Imaging Conference Record (NSS/MIC) (2015).328
[19] R. Fahrig, R. Dixon, T. Payne, R. L. Morin, A. Ganguly, and N. Strobel, “Dose and image329
quality for a cone-beam C-arm CT system.” Medical Physics 33, 4541–4550 (2006).330
[20] Task Group 12 Diagnostic X-ray Imaging Committee, Quality Control in Diagnostic Radiology,331
AAPM Report No.74 74 (AAPM, 2002).332
[21] T. R. C. Johnson, B. Krauss, M. Sedlmair, M. Grasruck, H. Bruder, D. Morhard, C. Fink,333
S. Weckbach, M. Lenhard, B. Schmidt, T. Flohr, M. F. Reiser, and C. R. Becker, “Material334
differentiation by dual energy CT: initial experience.” European Radiology 17, 1510–7 (2007).335
[22] E. Meyer, R. Raupach, M. Lell, B. Schmidt, and M. Kachelrieß, “Frequency split metal336
artifact reduction (FSMAR) in computed tomography,” Medical Physics 39, 1904 (2012).337
[23] S. Faby, S. Kuchenbecker, S. Sawall, D. Simons, H.-P. Schlemmer, M. Lell, and M. Kachelrieß,338
“Performance of todays dual energy CT and future multi energy CT in virtual non-contrast339
19

imaging and in iodine quantification: A simulation study,” Medical Physics 42, 4349–4366340
(2015).341
[24] S. Kuchenbecker, S. Faby, S. Sawall, M. Lell, and M. Kachelrieß, “Dual energy CT: How well342
can pseudo-monochromatic imaging reduce metal artifacts?” Medical Physics 42, 1023–1036343
(2015).344
[25] W Zbijewski, G J Gang, J Xu, a S Wang, J W Stayman, K Taguchi, J a Carrino, and J H345
Siewerdsen, “Dual-energy cone-beam CT with a flat-panel detector: effect of reconstruction346
algorithm on material classification.” Medical Physics 41, 021908 (2014).347
[26] Justin L. Ducote, Tong Xu, and Sabee Molloi, “Optimization of a flat-panel based real time348
dual-energy system for cardiac imaging,” Medical Physics 33, 1562 (2006).349
[27] T. Niu, X. Dong, M. Petrongolo, and L. Zhu, “Iterative image-domain decomposition for350
dual-energy CT,” Medical Physics 41, 041901 (2014).351
20