April Logsdon Human Interaction and the Life Cycle of the ...
23
April Logsdon Human Interaction and the Life Cycle of the Salmon Overview: In an outdoor school-type setting, students make observations and learn about the life cycle of the salmon and the environment that the salmon needs in order to thrive. Students will also participate in an activity where they represent salmon and progress or perish as they pass through the stages of life, demonstrating the drastic number of salmon that do not survive each stage. Reasons for survival or death will also be discussed along the way. Students will also work with threat cards. They will place the dangers presented on those cards in a cause and effect chart and discuss, with a partner, what the possible impacts of that event could be on the salmon population. Finally, as an assessment, students will create a community service poster that promotes positive human impact on the environment. National Geography Standards: ● Standard 8: The characteristics and spatial distribution of ecosystems and biomes on Earth’s surface. ● Standard 14: How human actions modify the physical environment. Oregon Geography Content Standard: ● 6.16: Explain how technological developments, societal decisions and personal practices influence sustainability in the Western Hemisphere. Oregon Science Content Standard ● MS-LS2-1: Analyze and interpret data to provide evidence for the effects of resource availability on organisms and populations of organisms in an ecosystem. Common Core Standards: ● SL.6.1: Engage effectively in a range of collaborative discussions, (one-on-one, in groups, and teacher-led) with diverse partners on grade 6 topics, texts, and issues, building on others’ ideas and expressing their own clearly. Objectives: In completing this activity, students should be able to describe how the components of ecosystems, particularly the ecosystem of the salmon, are connected and contribute to the
Transcript of April Logsdon Human Interaction and the Life Cycle of the ...

April Logsdon
Human Interaction and the Life Cycle of the Salmon
Overview: In an outdoor school-type setting, students make observations and learn about the life cycle of
the salmon and the environment that the salmon needs in order to thrive. Students will also
participate in an activity where they represent salmon and progress or perish as they pass
through the stages of life, demonstrating the drastic number of salmon that do not survive each
stage. Reasons for survival or death will also be discussed along the way. Students will also
work with threat cards. They will place the dangers presented on those cards in a cause and
effect chart and discuss, with a partner, what the possible impacts of that event could be on the
salmon population. Finally, as an assessment, students will create a community service poster
that promotes positive human impact on the environment.
National Geography Standards: ● Standard 8: The characteristics and spatial distribution of ecosystems and biomes on
Earth’s surface.
● Standard 14: How human actions modify the physical environment.
Oregon Geography Content Standard: ● 6.16: Explain how technological developments, societal decisions and personal practices
influence sustainability in the Western Hemisphere.
Oregon Science Content Standard
● MS-LS2-1: Analyze and interpret data to provide evidence for the effects of resource
availability on organisms and populations of organisms in an ecosystem. Common Core Standards:
● SL.6.1: Engage effectively in a range of collaborative discussions, (one-on-one, in
groups, and teacher-led) with diverse partners on grade 6 topics, texts, and issues,
building on others’ ideas and expressing their own clearly.
Objectives: In completing this activity, students should be able to describe how the components of
ecosystems, particularly the ecosystem of the salmon, are connected and contribute to the

energy of their own cycles. They should also be able to describe and explain how human-
induced changes in one place can affect the physical environment and life cycle of the salmon.
Grade Levels: 6 Time: 1.5 hours
Materials: ● An environment where salmon are or could be found.
○ Environmental elements include small coastal or freshwater streams with
elements such as trees or long grasses on the bank; rocks fit for hiding in the
water; tributaries; gravel, pebbles or small rocks where salmon might spawn.
○ In Oregon, some possible places to view salmon:
■ Herman Creek
■ Eagle Creek Trail
■ Big Bottom Unit of the Clackamas Wilderness
■ Bonneville Dam
● Writing utensil
● “Observation” Worksheet, Appendix A
● Diagrams of the Individual Phases of the Life Cycle of the Salmon, Appendix B
● Life Cycle Chart, Appendix C
● “Survival Rates” Information, Appendix D
● “Cause and Effect” Worksheet, Appendix E
● “Threat Cards,” Appendix F, if you want to make the cards with a title, included
is a sheet of covers to use.
● Rubric for Scoring Assessment, Appendix G
● Thermometer to measure water
● Poster paper
● Markers
● Clipboards
● 2500 pieces of paper or other items, divided into groups of 100, and placed in bags or
envelopes ahead of time
Background: Undoubtedly, you will have a student ask why studying the salmon is so important, especially if
it is not a part of their diet. Here’s what they need to know:

● When salmon spawn and die at the end of their life cycle, they are a source of nutrition
that allows other animals, like bear, eagle, mink, and otter, to survive harsh winters.
● The salmon are also a source of nutrients to the plant life as they decompose.
● The salmon are a critical element to the food chain. They are the energy that fuels the
natural environment.
Procedures: 1. Once students have arrived at the “Salmon Environment,” distribute the “Observation”
worksheet (Appendix A). Ask them to get their writing utensil and spread out within a
certain boundary and observe and record their surroundings using sights, smells and
sounds in the “Observation” worksheet. Direct them to pay special attention to the area
where salmon could be without letting on that you’re talking about salmon. Remind
students that observation does not include inference. It should be obvious, fact based
observation. The hope is that they will take note of items like trees or tall grasses along
the river bank For pictures of salmon environments you can download the following:
www.dfw.state.or.us/.../E2F_Volunteer_Guide_PP3_Salmonid_Habitat.ppt 2. Discuss what students have observed, placing special emphasis on the elements of the
salmon habitat.
3. Hand out the life cycle chart (Appendix C). Go through the life cycle of the salmon using
the diagram card (Appendix D). Students should draw pictures and write notes in the
ellipse and name the stage in the rectangle below it. In the brief notes, items that can be
included are things that are essential to the environment of a thriving salmon habitat and
where the salmon lives throughout its various stages. As the group continues this
process, start to link the observations to the life cycle lesson. After talking about the
perfect water temperature, as a part of their thriving environment, students could be sent
to measure the water.
4. To demonstrate the drastic death rates of salmon as they progress through the stages of
life, ask students to put down their materials and line up shoulder to shoulder in an open
area. Use the base number of 2,500. Figure out how to divide your students. Maybe
some are partners, but it is easiest if you have 25 “teams.” Give each student or pair of
students a bag with 100 items, like paper squares or counters. All students and their 100
items start out as eggs, so all students get to take a giant step forward. When continuing
to the next level, for example, eggs to alevins, 375 survive. That means that the class
needs to get rid of 2,175 pieces. If they know they have 100 pieces a piece, it’s easy to

count. When a student runs out of pieces, they have perished. Only four groups should
have survived at this point if you have used 25 groups. Those students get to take a
giant step forward while all other students have to stay behind because they “die.” A
student only perishes if all of their pieces are gone. Continue through the stages until all
students have perished.
5. Get back together as a group and discuss their thoughts. In what stages did the most
salmon perish? What are some possible causes of death? This would be a great chance
to connect their observations to the death rate. Reveal other causes of death that have
not been presented.
6. Present the students with another worksheet, “Cause and Effect” (Appendix E). Partners
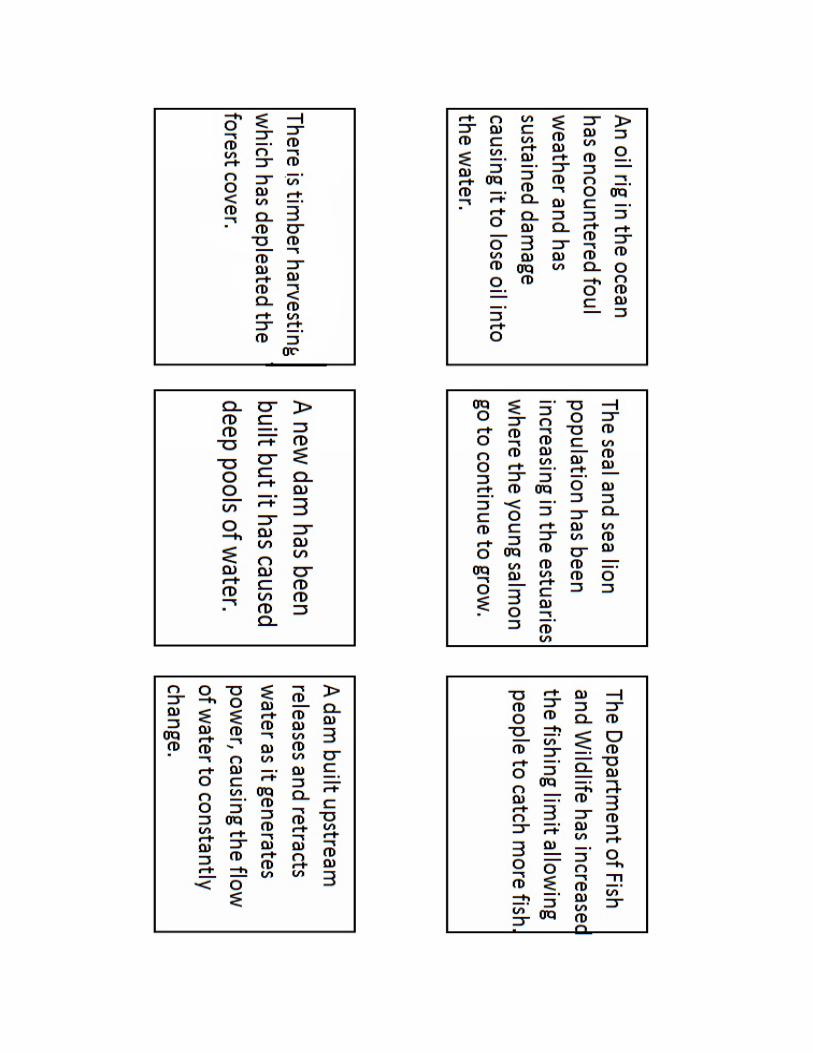
will work best for this so students have someone to discuss ideas with. Lay the “Threat
Cards” (Appendix F) out in a wide space with the word, “THREAT” facing up. These
cards contain possible threats to the salmon. The student pairs will each select one card
at a time and write the threat in the cause box. Then the pairs need to discuss the effect
that this may have on the salmon and their environment. For example, a student may
draw a card that says, “ A local company has accidentally released some chemicals into
the local stream.” Students could simply say, as an effect, that the chemicals traveled
downstream and poisoned a group of fry who will not survive. Another example might be
that they draw a card that says, “The climate change has caused a low snowpack this
last winter. This snowpack feeds into a local stream.” The student could respond that the
water temperature might rise where the salmon are living and that could bring disease.
Encourage students to use their best guesses and common sense and let them you will
discuss the answers. Encourage student to look at the environment they are in to come
up with effects from the threats.
7. When students have had enough time to complete the activity, bring them back together
to discuss and check for correct thinking. Take the students back to the location where
they did their observation and discuss what elements are present or missing to make
this area conducive for salmon.
Assessment: Students will be asked to break up into pairs. You could use different pairings than before to get
more interaction and ideas generated. Students will work on a community service advertisement
poster. Give the students the following prompt: The local salmon population has been declining.

Please make a poster with your partner that informs the community about things they can do to
help increase the number of salmon.
A rubric has been included to assist with scoring. (Appendix G)
Extensions: ● Students can participate in a “Salmon in the Classroom” project where the local soil,
water, and conservation district of department of fish and wildlife brings in eggs and a
complete tank set-up for the class to try to raise salmon. Students chart data, such as
water temperature, and watch the fish progress or perish.
● Return back to the cause and effect worksheet and threat cards and have students find
articles related to the topic. They can do small group presentations and reports.
● The local department of fish and wildlife will often have a program where they bring fish
and lead the students through a dissection.
● Students can test water quality of the local rivers and streams. Often the local soil and
water conservation district will have materials for classes to borrow for this. They may
even send someone to help your class through this process.
● There are many fun activities relating to the ones in this lesson, including an obstacle
course designed to simulate the challenges of the salmon as they travel through life.
http://www.troutintheclassroom.org/teachers/library/survival-salmon
Sources: United States. National Park Service. "The Salmon Life Cycle." National Parks Service.
U.S. Department of the Interior, Apr. 2014. Web. 15 Aug. 2016.
<https://www.nps.gov/olym/learn/nature/the-salmon-life-cycle.htm>.
Fowler, Bev. Salmonids in the Classroom: Intermediate. Vancouver, B.C.: Fisheries and Oceans
Canada, 2002. Print.
Herkamp, Kevin. Salmon Life Cycle. Salem,OR: Oregon Department of Fish and Wildlife, 7 Nov.
2012. PPT.

Appendix A
Observations- Record what you are observing as far as sight, sound, and smell. Remember that an observation is the obvious and factual.
Sights
Sounds
Smells


Appendix D
Survival Rates of Salmon through the Stages of Life
Example of Survival Rates for Actual Salmon
Stage of Development
Number Deaths Survivors Percentage Possible causes of death
Eggs to Alevins
2500 2125 375 15% ● Unfertilized eggs ● Gravel movement ● Low oxygen in the water ● Drastic changes in water temperature ● Pollution ● Disease ● Predators
Alevins to Fry 375 245 30 12% ● Lack of adequate food ● Predators ● River blockage ● Pollution
Fry to Smolts 30 25 5 20% ● Predators
Smolts to Adults
5 3 2 67% ● Harvesting ● Predators
Adults to Spawners
2 2 0 0% ● High or low water levels ● Predators ● Obstructions ● Diseases ● Death after spawning

Appendix E
Cause and Effect
Directions: With your partner, select one “Threat” card at a time. Describe the threat, or cause, in
the arrow. Then in the rectangle, describe how that might be harmful for the salmon and their
habitat.


Appendix G - Rubric for Assessing the Posters
1-2 3-4 5-6 Comments
Demonstrates Knowledge About Human Impact on Salmon Populations
The student demonstrates knowledge effectively by identifying an impact that humans have or can have on salmon.
The student demonstrates some knowledge by identifying an impact that humans have or can have on salmon. Details may be slightly inaccurate.
The student demonstrates little knowledge of human impact on salmon. Information or details are inaccurate or not based on reliable information.
Demonstrates Knowledge About Salmon and Ecosystems
The student effectively demonstrates knowledge of the ecosystem of a salmon by providing accurate information.
The student demonstrates some knowledge of the ecosystem of the salmon by providing some information or information that is may be slightly inaccurate.
The student demonstrates little or no knowledge of ecosystem of the salmon. Little information has been provided or it is not accurate.
Demonstrates the Ability to Effectively Collaborate in Group Discussion*
The student was observed actively listening and speaking when appropriate. The student contributed useful ideas and solutions.
The student was observed actively listening most of the time and speaking on occasion. The student contributed some ideas and maybe a solution.
The student was observed actively listening only sometimes and rarely spoke. The student may have only contributed one item of use in conversation.
Effort and Creativity
The student’s project is complete, has an effective amount of detail that draws attention and is colorful.
The student’s project is complete, has sufficient detail and some color.
The student’s project may be unfinished, have little detail and no color.
Score Final Score:
*This can be assessed during almost any of the activities and allows the teacher the opportunity to observe each
student at some point in the lesson.