Application of Infrared Thermographic Imaging to ...docs.trb.org/00968576.pdfApplication of Infrared...
164
Application of Infrared Thermographic Imaging to Bituminous Concrete Pavements – Final Report James Mahoney, Scott A. Zinke Jack E. Stephens, Leslie A. Myers A. John DaDalt Report Number 2229-F-03-7 Submitted to the Connecticut Department of Transportation November 2003 Connecticut Advanced Pavement Laboratory Connecticut Transportation Institute School of Engineering University of Connecticut
Transcript of Application of Infrared Thermographic Imaging to ...docs.trb.org/00968576.pdfApplication of Infrared...
Application of Infrared Thermographic Imagingto Bituminous Concrete Pavements – Final Report
James Mahoney, Scott A. ZinkeJack E. Stephens, Leslie A. Myers
A. John DaDalt
Report Number2229-F-03-7
Submitted to the Connecticut Department of Transportation
November 2003
Connecticut Advanced Pavement LaboratoryConnecticut Transportation Institute
School of EngineeringUniversity of Connecticut
ii
1. Report No.
2. Government Accession No. 3. Recipient’s Catalog No.
2229-F-03-7 N/A N/A 4. Title and Subtitle 5. Report Date
November 2003
6. Performing Organization CodeApplication of Infrared Thermographic Imaging to Bituminous ConcretePavements – Final Report
N/A
7. Author(s) 8. Performing Organization Report No.
James Mahoney, Scott A. Zinke, Jack E. Stephens, Leslie A. Myers and A. JohnDaDalt
CAP Lab 2-2003
9. Performing Organization Name and Address 10. Work Unit No. (TRAIS)
N/A11. Contract or Grant No.
Connecticut Advanced Pavement Laboratory University of Connecticut
Connecticut Transportation InstituteStorrs, CT 06269-5202
N/A
12. Sponsoring Agency Name and Address 13. Type of Report and Period Covered
Final
14. Sponsoring Agency Code
Connecticut Department of Transportation280 West StreetRocky Hill, CT 06067-0207
N/A
15. Supplementary Notes
N/A
16. Abstract
The application of infrared thermographic imaging to the analysis of asphalt concrete pavement provides an alternativemethod and means of evaluating the material with respect to segregation, future distress and overall lifespan. Severalvariables examined throughout this study were incorporated with the use of the thermographic camera to provide furtherinsight as to the material properties as well as the practical application of asphalt pavement to Connecticut roads andhighways. These variables include comparisons of temperature differential vs. compacted material density, remixing vs.non-remixing material transfer vehicles, day vs. night time paving, haul distances vs. temperature differentials, Superpavevs. Marshall mixes, as well as evaluations and close examinations of material gradations, transfer methods, pavingequipment, crews, plants, haul units, weather and base conditions among other variables as they all apply to the thermalconsistency as well as the overall quality of the finished road or highway. An evaluation of each variable examinedthroughout this study is found in the corresponding section of this report. Conclusions and recommendations as to theoutcomes of this study are found following the completed analysis.
17. Key Words 18. Distribution Statement
Paving Materials, Cold Weather Construction,Thermal Imagery, Mechanical Analysis, TemperatureDifferential Damage, GPS Referencing, ThermalSegregation.
No restrictions. This document is available to the public through theNational Technical Information Service Springfield, Virginia 22161
19. Security Classif. (of this report) 20. Security Classif. (of this page) 21. No. of Pages 22. Price
Unclassified Unclassified 151 N/A
Technical Report Documentation Page
Form DOT F 1700.7 (8-72) Reproduction of completed page authorized
iii
Table of Contents
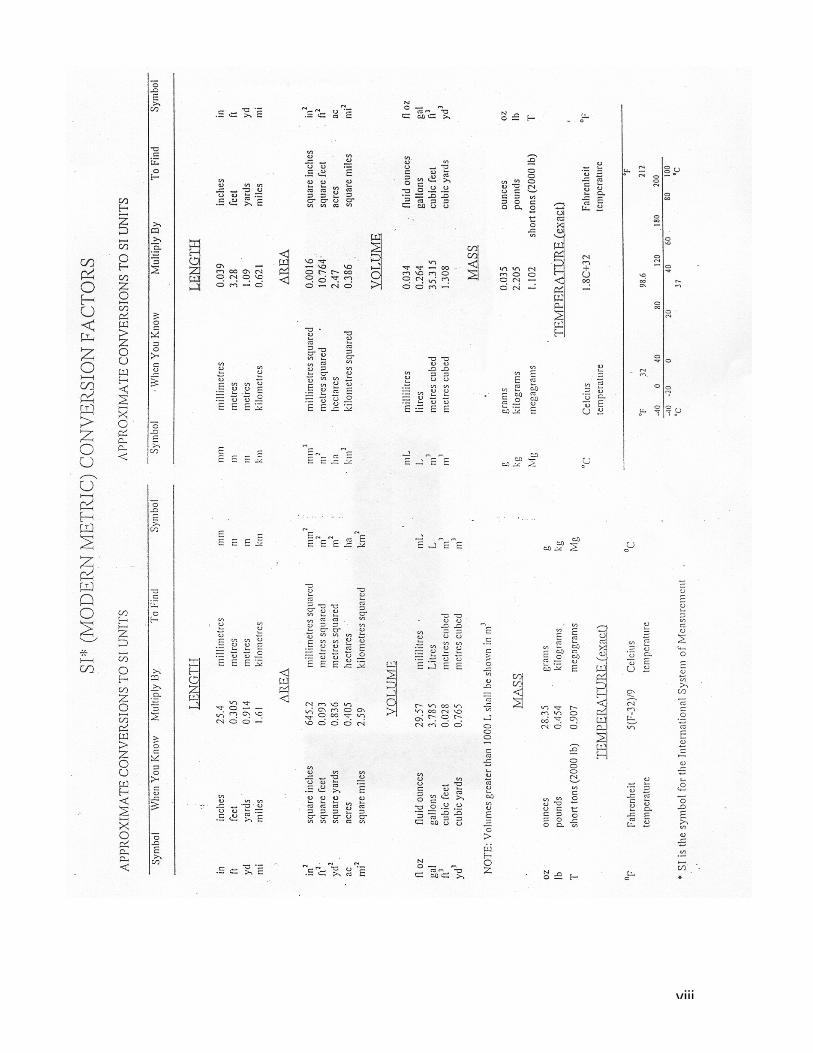
Title Page iTechnical Report Documentation iiTable of Contents iiiList of Figures vList of Tables viiMetric Conversion Page viii
Background 1
Study Objectives 2
Study Benefits 2
Literature Review 3
Construction Data 6
Variables Examined 8
Methodology 9
Database 11
Monitored Sites 11
Nuclear Density Testing 14
Tracking Material through the Paver 16
Paver Hopper Wings 17
Gradation Analysis 18
Spillage 25
Haul Distance 29
Material Transfer Vehicles (MTVs) 32
Same Plant, Same Paving Crew, Long Haul 39
Delays Between Trucks 41
Seasonal Differences 41
iv
Table of Contents – Continued
Day vs Night Paving 42
Ambient Air Temperature 43
Base Temperatures 44
Base Mix and Leveling Courses 45
Recycled Asphalt Pavement (RAP) 46
Lift Thickness 1.5 vs 2.0 Inches 46
Heated Bodies vs Non-Heated Bodies 47
Superpave vs Marshall Mixes 48
Same Paving Crew and Equipment, Different Mix Plant 48
Same HMA Plant – Different Paving Crews 49
Same Project – Two Paving Crews – Two HMA Plants – Same Day 50
Same Project, Same Equipment – Different Paver Operators 51
Pavement Distress – Same HMA Plant, Same Paving Crew, 2 Projects 51
Conclusions 54
Recommendations 60
References 64
v
List of Figures
Figure 1 – Relative Density vs Temperature Differential 16
Figure 2 – Thermal Image after 4 loads between hopper wing folds 18
Figure 3 – Thermal Image after hopper wing fold, one load after Figure 2 18
Figure 4 – Location where Cold Spot sample #1 from Table 4 was taken 20
Figure 5 – Location where Cold Spot sample #2 from Table 4 was taken 20
Figure 6 - Location where Cold Spot sample #1 from Table 5 was taken 22
Figure 7 - Location where Cold Spot sample #2 from Table 5 was taken 22
Figure 8 – Pavement Texture after Approximately 1 Year 23
Figure 9 – Gradation of two mixes from the same plant 24
Figure 10 – JMF for most visibly segregated mixes observed 25
Figure 11 – Visual image of a spill 27
Figure 12 – Spilled material and corresponding thermal image 27
Figure 13 – Thermal Image before Paver has Passed over spilledMaterial in Figure 14 28
Figure 14 – Thermal Image after Paver has Passed over spilledMaterial in Figure 13 28
Figure 15 – Typical Thermal Image for Short Haul Distances 29
Figure 16 – Typical Image for Project with Approximate HaulDistance of 56 miles 30
Figure 17 – Typical Thermal Image for Project with ApproximateHaul Distance of 56 miles using a non-remixing MTV 31
Figure 18 – Temperature vs Haul Distance 32
Figure 19 – With non-remixing MTV 34
Figure 20 – Using end dump method 35
vi
Figure 21 – With remixing MTV 36
Figure 22 – Same project as Figure 21 using end-dump technique 36
Figure 23 – Thermal image taken after 30 minute stoppage forservicing remixing MTV during cold windy weather 37
Figure 24 – Thermal image taken on project using non-remixingMTV after 50 minute wait 38
Figure 25 – Thermal Image taken on project with 43 mile haulDistance and no MTV 40
Figure 26 – Thermal Image taken on project with 56 mile haulDistance and non-remixing MTV 40
Figure 27 – Delay between trucks vs difference in temperature 41
Figure 28 – Average air temperature at Bradley Airport vsAverage temperature differentials 44
Figure 29 – Thermal Image of Pavement after Breakdown Rolling 45
Figure 30 – Thermal Image of Spot Visible in Figure 31 52
Figure 31 – Visible image of Figure 30 taken one year after placement 52
Figure 32 – Thermal image taken at time of construction 2 years ago 53
Figure 33 – Visible Image of Figure 32, 2 Years Later – no visible distress 53
Figure 34 – Material Spilled By Truck Pull-Out After Discharge into Paver 57
Figure 35 – V-Shaped Cold Spot 57
vii
List of Tables
Table 1 – Monitored Site 12
Table 2 – Crews observed on multiple sites 14
Table 3 – Breakdown of Relative Density Differences 15
Table 4 – Observed Gradation of Cooler and Warmer Areas 19
Table 5 – Observed Gradation of Cooler and Warmer Areas 21
Table 6 – Various Methods of Conveying Material to Paver Hopper 33
Table 7 – Same HMA Plant and Paving Crew, Long HaulsOne Project with MTV and One without 39
Table 8 – Breakdown of Data by Month at End Dump ExchangesExcluding Data from Projects with MTV 42
Table 9 – Average Temperature Differentials for Night Paving Projects 43
Table 10 – Temperature Differentials Between Marshall andSuperpave Mixes Excluding MTV Data 48
Table 11 – Same Paving Crew and EquipmentDifferent HMA Plant - Crew 1 48
Table 12 – Same Paving Crew and EquipmentDifferent HMA Plant - Crew 2 49
Table 13 – Same Mix Plant, Different Paving Crew Excluding MTV Data 50
Table 14 – Same Project, 2 HMA Plants, 2 Paving CrewsSame Day – No MTV 51
viii
Application of Infrared Thermographic Imagingto Bituminous Concrete Pavements
Background
Most of the pavement in Connecticut is constructed of hot mix asphalt (HMA).
For successful placing and compaction of HMA, each step in the placement procedure
must be accomplished within the proper temperature range. Thus, when the mix
temperature varies in material placed, the compaction and the performance of the in-place
pavement can also be expected to vary. Infrared thermometers have long been used to
check surface temperatures, but small areas of low temperature can easily be missed.
Infrared thermographic imaging is an alternative to thermometers and has the ability to
give a continuous plot of surface temperatures. The infrared camera displays and records
temperatures as colored images with a reference scale.
Several studies have shown that the problem of temperature differentials in HMA
construction is recognized throughout the United States. Observations over the years
indicate that the open textured areas, sometimes referred to as segregated areas, often
perform poorly, frequently raveling and breaking up at a much younger age than areas
with tighter surface texture. Areas with lower temperatures may also exhibit an open
texture from the asphalt binder being stiffer. The increased stiffness of the binder may
cause the material to behave differently as it comes out from under the paver screed thus
producing a surface texture that is very different from the surrounding material.
The infrared thermographic camera makes effective monitoring of temperature
variations more possible than it was for earlier studies. If the causes of localized
temperature differences can be determined, and techniques to reduce this differential
developed, pavement life should increase.
2
Study Objectives
The purpose of the investigation was to use infrared thermographic imaging to
identify factors or conditions that contribute to thermal segregation in fresh paver-placed
asphalt pavement, which affect compaction and lead to premature distress of the
pavement. Data obtained from the project was evaluated for its thermal characteristics.
Thermal segregation and gradation segregation are factors that lead to pavement
distresses such as raveling, potholes, and shortened service life. These two types of
segregation have similar appearances in the finished pavement but their causes may or
may not be related.
Temperature data was obtained using an infrared thermographic imaging camera,
and related computer software, at paving sites in the field. Field conditions desirable for
obtaining data on cold spots included:
• Cold weather paving• Night paving• Cold weather paving at night• Seasonal paving – to rate severity/impact of temperature difference during
summer and winter weather• Paving equipment
Study Benefits
The Connecticut Department of Transportation would benefit through improved
pavement performance. Better understanding of the relationship between placement
conditions and mix temperatures would result in the development of improved placement
procedures. Quantifying temperature differences based upon environmental conditions
would assist DOT and industry personnel in the decision-making process related to paving
operations under less-than-optimal conditions. Reduction in thermal segregation in the
HMA during the placement operation should reduce the number of irregularities and
consequently, decrease the penalties assessed to contractors. The result would be improved
3
durability and rideability of the finished pavement which will ultimately benefit the
motoring public by providing a smooth, longer lasting pavement. The benefits would be a
reduction in maintenance costs and associated impacts to motorists during repairs.
Literature Review
In recent years, a number of studies have been conducted that attempt to explain
field observations of segregation in bituminous concrete pavements. Types of
segregation have been referred to as “end-of-load”, “cyclic”, “load to load”, “systematic”
or “spot” segregation. An attempt was made to identify, define, and measure the types of
segregation through laboratory testing, field observations, and visual inspection. As part
of a comprehensive NCHRP 9-11 study, Stroup-Gardiner and Brown (2000) defined
segregation as:
“…a lack of homogeneity in the HMA constituents of the in-place mat of such amagnitude that there is a reasonable expectation of accelerated pavementdistress(es). Constituents are interpreted to mean asphalt cement, aggregates,additives, and air voids.”
The primary focus of their study was to formulate procedures for identifying and
measuring segregation (both gradation and temperature segregation) using various
techniques. Each technique was evaluated for its usefulness in detecting and assessing
segregation and included a wide-range of nondestructive and destructive testing
approaches. Infrared thermography was one of the approaches analyzed along with
nuclear density tests, cores, portable seismic pavement analyzer, and ROSANv surface
texture measurement system. Pavement condition surveys from six states (including
Connecticut) were presented with respect to gradation and temperature segregation and
showed a decrease in life ranging from 5 to 12 years for pavements exhibiting
segregation. Infrared thermography was reported as a viable method for doing the
following:
4
• Surveying each lot for temperature differentials which indicated the level ofsegregation, and then allot consequent pay adjustments;
• Estimating the level and percentage of segregation in a specified area ofpavement mat;
• Developing percent uniformity measurement for each lot potentially through useof an infrared sensor bar mounted behind paver screeds, and displayed on amonitor posted next to the paver operator.
The researchers reported that infrared thermography was not useful in identifying
the type of segregation (gradation versus temperature). Additionally, staff at NCAT
developed a spreadsheet analysis program that normalized data from thermal photographs
and then created a histogram of temperatures that was used to compute the percentage
level of segregation.
Another study was conducted in Michigan to classify levels of segregation on
nineteen field sites, comparing one-minute nuclear density measurements and gradation
tests on cores. The study did not attempt to identify the causes of segregation, but
observed statistical patterns between gradation values and nuclear-measured density
values for “segregated” and “non-segregated” portions of the mat. A sampling technique
along with statistical methods was developed; however, the infrared thermographic
camera was not used in the study.
Researchers in the state of Washington examined four WashDOT paving projects
in 1998 for evidence of end-of-load segregation. Mostly dense-graded asphalt concrete
mixes were monitored using the thermal infrared camera to identify the existence and
extent of mat temperature differentials and related material properties. The sampling and
testing of hot-mix during placement and compaction was the focus for the study, in terms
of evaluating segregation. Early and late season projects, along with night projects, were
evaluated for temperature differentials in the mat. Equipment and construction practices
5
were documented and in at least one project, a Material Transfer Vehicle (MTV) was
used during paving operations. Samples were taken from the mat behind the paver screed
and from the truck bed. Devices such as the nuclear gauge, non-nuclear gauge (PQI), and
digital probe thermometer were used in addition to the thermal infrared camera and the
extraction of cores. Density and percent air voids were determined and analyses using the
Rice density test, gradation, and asphalt content were performed. Gradation and asphalt
content analysis showed no significant aggregate segregation or difference in asphalt
content within the cooler areas, although higher air voids were found in these areas.
Temperature differentials for the four projects examined ranged between 7° and 39° C. It
was reported that concentrated areas of significantly cooler material resulted in reduced
compaction of these areas in the mat. The researchers also suggested that shorter haul
times, insulated truck beds, warmer weather paving, improved rolling practices, and more
frequent remixing of the HMA would help to greatly reduce or eliminate the occurrence
of temperature differential damage.
John Henault (ConnDOT Research Division) completed a study on temperature
differential damage for HMA projects in the fall of 1999. Thermal images were taken
immediately after paver laydown and pairs of neighboring high and low temperature
spots were selected. Nuclear measurements of the density after compaction were made
on each spot. Comparisons of computed air voids for each pair (high and low
temperature at time of compaction) revealed differences ranging up to 8%. For a limited
number of pairs, cores were also taken and differences in actual air voids determined.
Since the viscosity of asphalt binder is directly related to temperature, differences in the
degree of compaction can be expected when the temperature varies. It was also reported
that open-textured areas were frequently cooler at the time of rolling. Several other
studies were found by Henault indicating that end-of-load segregation is recognized as an
6
industry-wide problem. He confirmed that use of an infrared thermographic imager
enabled more effective monitoring of localized temperature variations.
A similar study conducted by Washington State Department of Transportation
was completed in Summer 2001. The study examined thermal segregation from many
different angles. One factor identified by the report was the type of haul unit used to
deliver the HMA to the job site. Of the different methods used to deliver HMA to the
job-site, end dump haul units exhibited the greatest level of thermal segregation. In
Connecticut, end dumps are the primary method used to convey HMA to the paving
project. Additionally, the report proposed the concept of employing a density
specification based upon the densities obtained in the mat where truck changes occurred.
The rational behind density testing at the truck changes was that these areas are the most
prone to fail and even though they represent a small percentage of the surface area,
failure of these areas generally will require the entire pavement to be replaced. The
Washington State Department of Transportation report also showed that there was some
correlation between warmer ambient temperatures and the temperature differentials that
were observed. Higher ambient temperatures reduced the temperature differentials
observed.
Construction Data
For the CAP Lab study, construction data including thermal images was collected
from 40 paving projects ongoing in Connecticut. The placement of the wearing surface
was monitored. Leveling courses were not monitored due to the wide variability in the
placement thickness. The monitored projects included Connecticut DOT Class 1
(nominal maximum aggregate size of 3/4 inch) and 12.5 mm Superpave mixes at traffic
levels of 2, 3 and 4. Pavement for one site was placed in November 2000 and the
remaining projects were in the 2001, 2002 and early 2003 construction seasons. The
7
HMA was produced at several different plants and limited sampling from truck beds was
conducted at the plant for one project. There were 4 projects that were monitored
exclusively for effect heated bodies had on the material at the time of final placement.
On 11 projects, material transfer vehicles (MTV) were used for placement of at least a
portion of the HMA. On 8 of the projects, the MTV used was a Roadtec 2500. This is
significant because of the large amount of material the MTV stores within it and the
remixing of the material being delivered prior to discharging it to the paver. The MTVs
used on the other 3 projects did not provide direct remixing of the material. The paver
hopper inserts were equipped with remixing paddles but the paddles were not operated
during the periods of observation. There was some indirect remixing of the HMA during
the discharge into the MTV and the dumping of the material into the hopper of the paver.
The procedure routinely consisted of gathering data and observations using the
following:
• Visual observation,• Infrared thermographic imaging camera and related computer software,• Digital photographic imaging,• Recording of image-specific site information (cold spot shape, etc.),• Recording of exact location coordinates using GPS hand-held device for future
monitoring,• Entry of construction data into comprehensive Filemaker database.
Other tasks were performed occasionally in order to determine the impact of additional
factors on the data presented. Examples of these tasks are as follows:
• Nuclear density testing of compacted material,• Material samples taken immediately behind paver by DOT officials,• Recording of time between truck load changes,• Truck configurations• Screed and spill locations
The ThermaCAM PM575 was used to capture thermal images of HMA mix while
being discharged from the truck bed into the paver’s hopper and while being placed prior
to compaction. Cool spots, or temperature differentials, in the uncompacted mat were
8
marked for density tests to be made after compaction (when possible) for each monitored
site. GPS coordinates were also recorded for referencing most of the cool spot locations.
Thermal images were initially recorded during rolling operations from atop one of the
rollers but safety concerns ended the use this vantage point. From then on, images were
taken from the screed stop location. The screed stop location is taken as the point where
the screed stops in between truck changes. Images were then processed and analyzed
using the ThermaCAM Researcher 2000 software on a laboratory computer.
Variables Examined
A list of major variables considered by the CAP Lab personnel as influential to
the generation of cold spots in freshly-placed asphalt concrete pavements are outlined
below.
• General temperature placement issues – including cold weather and nightpaving, and cold weather paving at night, differences in base and air temperature.
• Inclement weather conditions – effect of precipitation, placement of asphalt onwet surfaces, and rapid cooling of pavement material during truck loading intopaver and/or prior to rolling or between roller passes. No observations were madeunder these conditions due to the unpredictability of the weather combined withthe uncertainty of whether or not paving will occur.
• Equipment Issues – e.g., frequency of folding hopper wings, auger movementand depth of material in augers, paver shadow, use of material transfer device(MTV), removal of spilled loose material.
• Thickness Variation – including thickness of lift (1.5” versus 2.0”) and levelingprior to overlays.
• Truck Changes – e.g., length of time between trucks, amount of material retainedon pavement after truck pull out, amount of material in hopper, and loading delayincurred when paving under overpasses.
• Haul Distance/Haul Time – distance from HMA plant to the project and traveltime of haul from HMA plant to the project.
• Segregation – due to temperature or gradation.
• Paving Material Characteristics – such as virgin binder versus presence ofRAP.
9
Many other lesser variables also enter into the generation of the cold spots. These
variables are much harder to track and even harder to quantify. Examples of these lesser
variables would be the head of material on the screed augers, continuous rotation of the
screed auger, rate at which material is loaded into the paver hopper, the amount of
material over the hopper conveyors and flowgates, how tightly or loosely the material
was tarped in haul unit, the screed angle, moisture in the aggregates, paver speed and
having to perform multiple drops into the paver hopper when going uphill. There are
many more lesser variables that will affect the temperature differentials observed in a
paving project.
Methodology
Every attempt was made to collect data as similarly as possible between projects.
All images unless otherwise noted were taken at the location where the screed stopped at
truck changes for end dump transfer of material from the haul unit to the paver hopper.
For MTVs, this location was approximated as it was not readily apparent where the
material changed from truckload to truckload. Also, using the thermal camera, the mat
was observed throughout the entire discharge of material. Any anomalies were noted and
imaged. The temperature differentials noted throughout the report include only the data
gathered off of the thermal images taken at the truck changes unless otherwise noted.
Haul distances and haul times represent one-way travel from the HMA plant to the
project.
During the 2002-2003 construction season, attempts were made to take thermal
images of all truck exchanges made while CAP Lab personnel were present at the project.
This was done to reduce bias caused by selectively imaging only colder loads. Some of
the previously collected images were selectively taken only at cold spots therefore the
10
data was not necessarily representative of the material being placed. The location of each
thermal image weas determined, whenever possible, using a handheld Trimble
GeoExplorer 3 GPS unit. On selected projects, nuclear densities were also determined on
a longitudinal profile through cold spots. Obtaining nuclear densities was a large
challenge. Safety was a primary concern as traffic control on some projects was not
adequate to accommodate testing. It was therefore not always possible to collect as many
readings as desired. Also, the collection of data required 15-20 minutes after finish
rolling. Having sufficient time at the completion of rolling was not always possible
because traffic had to be shifted onto the new HMA mat. Any differences observed were
noted for later analysis.
After collecting the thermal images, they were processed through ThermaCAM
Researcher 2000 – March edition software that was provided with the thermal camera.
Using this software, all of the temperature scales on all of the images were adjusted to
between 190°F and 300°F, therefore the temperatures represented by each color were
similar from image to image. On several occasions the high end scale for the images had
to be increased above 300°F to accommodate the observed temperatures. These images
can be found in the Filemaker database described in the following section. Also, the
software allowed for the warmest and coolest surface temperatures on the mat to be
determined. The difference between the warmest and coolest spot on an individual
thermal image will be referred to as the temperature differential. These observed
temperatures were chosen to be relatively close to each other to avoid problems
associated with temperature differences created by normal cooling. The coolest spots
were marked on the mat and density readings were recorded at 3 foot intervals along a
straight longitudinal line to obtain information pertaining to a possible drop in density
due to the corresponding cold spot. The zero distance on the density plots represent the
11
cold spot with the negative distances representing material placed before the cold spot
and positive distances after the cold spot.
Database
A database was developed to handle the large amount of data. The original
database was developed using Microsoft Access. As the project continued, modifications
were required to be performed to the database. Implementing these changes to the
Access database was presenting many problems due to the limited experience
manipulating Access databases. Therefore it was decided to convert the database to
Filemaker. The CAP Lab has a good deal of experience using Filemaker which allowed
for more efficient modifications and data analysis. Without the use of a database, it
would have been nearly impossible to conduct this study as there are approximately 1,250
images with all of their corresponding information.
The database was designed to store all of the pertinent information gathered in the
field as well as to perform necessary computations. This pertinent information included
GPS coordinates, density information and a copy of the thermal image for display on
every screen for the appropriate record. This allowed for a better analysis of the images
as all of the information was available with the image. The database also allowed for
images to be excluded from the mat temperature computations if they were deemed to be
irrelevant. Examples of images excluded from the computations would be paver hoppers,
haul units, duplicate images etc.
Monitored Sites
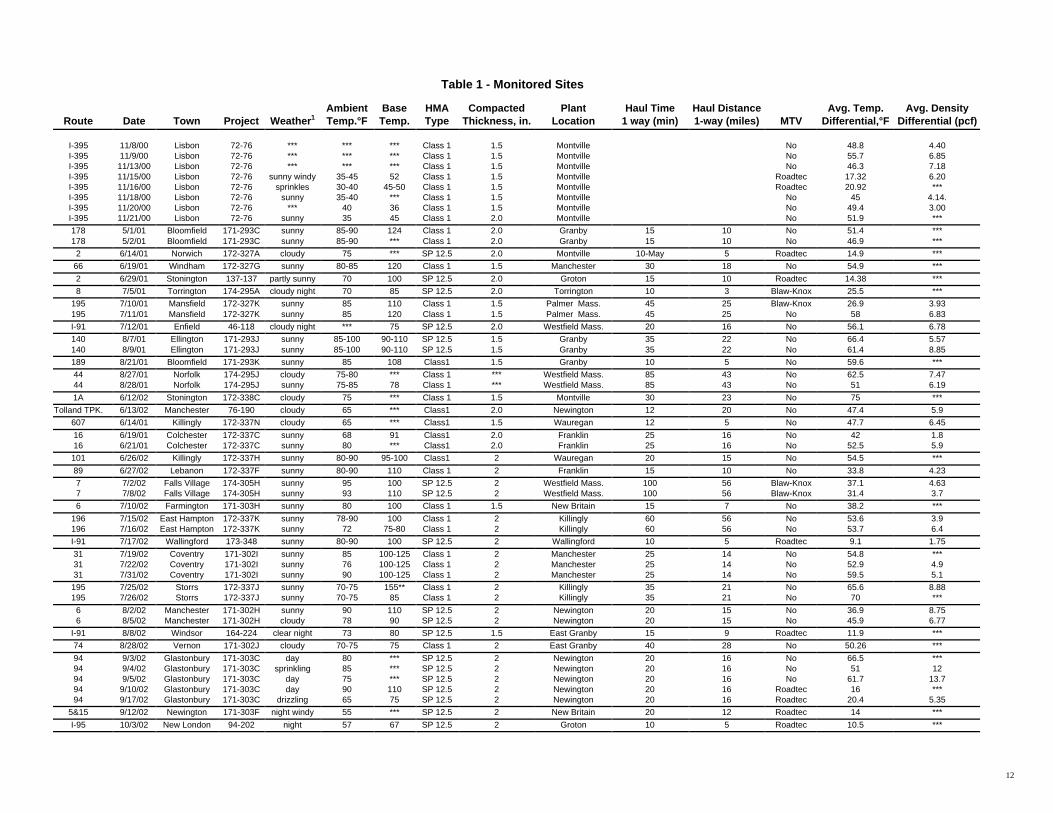
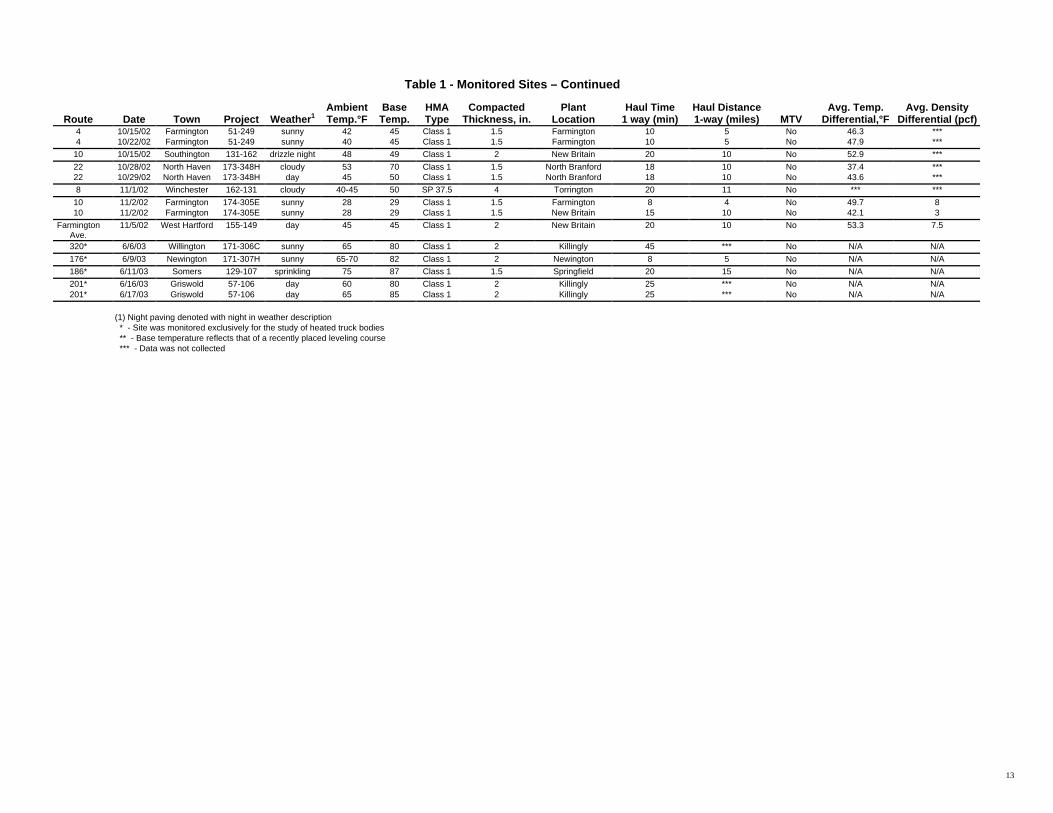
Table 1 contains a listing of the paving projects monitored for this project. A
detailed narrative for each of the sites monitored during this study can be found in
Appendix A.
12
Table 1 - Monitored Sites
Ambient Base HMA Compacted Plant Haul Time Haul Distance Avg. Temp. Avg. DensityRoute Date Town Project Weather1 Temp.°F Temp. Type Thickness, in. Location 1 way (min) 1-way (miles) MTV Differential,°F Differential (pcf)
I-395 11/8/00 Lisbon 72-76 *** *** *** Class 1 1.5 Montville No 48.8 4.40I-395 11/9/00 Lisbon 72-76 *** *** *** Class 1 1.5 Montville No 55.7 6.85I-395 11/13/00 Lisbon 72-76 *** *** *** Class 1 1.5 Montville No 46.3 7.18I-395 11/15/00 Lisbon 72-76 sunny windy 35-45 52 Class 1 1.5 Montville Roadtec 17.32 6.20I-395 11/16/00 Lisbon 72-76 sprinkles 30-40 45-50 Class 1 1.5 Montville Roadtec 20.92 ***I-395 11/18/00 Lisbon 72-76 sunny 35-40 *** Class 1 1.5 Montville No 45 4.14.I-395 11/20/00 Lisbon 72-76 *** 40 36 Class 1 1.5 Montville No 49.4 3.00I-395 11/21/00 Lisbon 72-76 sunny 35 45 Class 1 2.0 Montville No 51.9 ***
178 5/1/01 Bloomfield 171-293C sunny 85-90 124 Class 1 2.0 Granby 15 10 No 51.4 ***178 5/2/01 Bloomfield 171-293C sunny 85-90 *** Class 1 2.0 Granby 15 10 No 46.9 ***
2 6/14/01 Norwich 172-327A cloudy 75 *** SP 12.5 2.0 Montville 10-May 5 Roadtec 14.9 ***
66 6/19/01 Windham 172-327G sunny 80-85 120 Class 1 1.5 Manchester 30 18 No 54.9 ***
2 6/29/01 Stonington 137-137 partly sunny 70 100 SP 12.5 2.0 Groton 15 10 Roadtec 14.38 ***
8 7/5/01 Torrington 174-295A cloudy night 70 85 SP 12.5 2.0 Torrington 10 3 Blaw-Knox 25.5 ***
195 7/10/01 Mansfield 172-327K sunny 85 110 Class 1 1.5 Palmer Mass. 45 25 Blaw-Knox 26.9 3.93195 7/11/01 Mansfield 172-327K sunny 85 120 Class 1 1.5 Palmer Mass. 45 25 No 58 6.83
I-91 7/12/01 Enfield 46-118 cloudy night *** 75 SP 12.5 2.0 Westfield Mass. 20 16 No 56.1 6.78
140 8/7/01 Ellington 171-293J sunny 85-100 90-110 SP 12.5 1.5 Granby 35 22 No 66.4 5.57140 8/9/01 Ellington 171-293J sunny 85-100 90-110 SP 12.5 1.5 Granby 35 22 No 61.4 8.85
189 8/21/01 Bloomfield 171-293K sunny 85 108 Class1 1.5 Granby 10 5 No 59.6 ***
44 8/27/01 Norfolk 174-295J cloudy 75-80 *** Class 1 *** Westfield Mass. 85 43 No 62.5 7.4744 8/28/01 Norfolk 174-295J sunny 75-85 78 Class 1 *** Westfield Mass. 85 43 No 51 6.19
1A 6/12/02 Stonington 172-338C cloudy 75 *** Class 1 1.5 Montville 30 23 No 75 ***
Tolland TPK. 6/13/02 Manchester 76-190 cloudy 65 *** Class1 2.0 Newington 12 20 No 47.4 5.9
607 6/14/01 Killingly 172-337N cloudy 65 *** Class1 1.5 Wauregan 12 5 No 47.7 6.45
16 6/19/01 Colchester 172-337C sunny 68 91 Class1 2.0 Franklin 25 16 No 42 1.816 6/21/01 Colchester 172-337C sunny 80 *** Class1 2.0 Franklin 25 16 No 52.5 5.9
101 6/26/02 Killingly 172-337H sunny 80-90 95-100 Class1 2 Wauregan 20 15 No 54.5 ***
89 6/27/02 Lebanon 172-337F sunny 80-90 110 Class 1 2 Franklin 15 10 No 33.8 4.23
7 7/2/02 Falls Village 174-305H sunny 95 100 SP 12.5 2 Westfield Mass. 100 56 Blaw-Knox 37.1 4.637 7/8/02 Falls Village 174-305H sunny 93 110 SP 12.5 2 Westfield Mass. 100 56 Blaw-Knox 31.4 3.7
6 7/10/02 Farmington 171-303H sunny 80 100 Class 1 1.5 New Britain 15 7 No 38.2 ***
196 7/15/02 East Hampton 172-337K sunny 78-90 100 Class 1 2 Killingly 60 56 No 53.6 3.9196 7/16/02 East Hampton 172-337K sunny 72 75-80 Class 1 2 Killingly 60 56 No 53.7 6.4
I-91 7/17/02 Wallingford 173-348 sunny 80-90 100 SP 12.5 2 Wallingford 10 5 Roadtec 9.1 1.75
31 7/19/02 Coventry 171-302I sunny 85 100-125 Class 1 2 Manchester 25 14 No 54.8 ***31 7/22/02 Coventry 171-302I sunny 76 100-125 Class 1 2 Manchester 25 14 No 52.9 4.931 7/31/02 Coventry 171-302I sunny 90 100-125 Class 1 2 Manchester 25 14 No 59.5 5.1
195 7/25/02 Storrs 172-337J sunny 70-75 155** Class 1 2 Killingly 35 21 No 65.6 8.88195 7/26/02 Storrs 172-337J sunny 70-75 85 Class 1 2 Killingly 35 21 No 70 ***
6 8/2/02 Manchester 171-302H sunny 90 110 SP 12.5 2 Newington 20 15 No 36.9 8.756 8/5/02 Manchester 171-302H cloudy 78 90 SP 12.5 2 Newington 20 15 No 45.9 6.77
I-91 8/8/02 Windsor 164-224 clear night 73 80 SP 12.5 1.5 East Granby 15 9 Roadtec 11.9 ***
74 8/28/02 Vernon 171-302J cloudy 70-75 75 Class 1 2 East Granby 40 28 No 50.26 ***
94 9/3/02 Glastonbury 171-303C day 80 *** SP 12.5 2 Newington 20 16 No 66.5 ***94 9/4/02 Glastonbury 171-303C sprinkling 85 *** SP 12.5 2 Newington 20 16 No 51 1294 9/5/02 Glastonbury 171-303C day 75 *** SP 12.5 2 Newington 20 16 No 61.7 13.794 9/10/02 Glastonbury 171-303C day 90 110 SP 12.5 2 Newington 20 16 Roadtec 16 ***94 9/17/02 Glastonbury 171-303C drizzling 65 75 SP 12.5 2 Newington 20 16 Roadtec 20.4 5.35
5&15 9/12/02 Newington 171-303F night windy 55 *** SP 12.5 2 New Britain 20 12 Roadtec 14 ***
I-95 10/3/02 New London 94-202 night 57 67 SP 12.5 2 Groton 10 5 Roadtec 10.5 ***
13
Table 1 - Monitored Sites – Continued
Ambient Base HMA Compacted Plant Haul Time Haul Distance Avg. Temp. Avg. DensityRoute Date Town Project Weather1 Temp.°F Temp. Type Thickness, in. Location 1 way (min) 1-way (miles) MTV Differential,°F Differential (pcf)
4 10/15/02 Farmington 51-249 sunny 42 45 Class 1 1.5 Farmington 10 5 No 46.3 ***4 10/22/02 Farmington 51-249 sunny 40 45 Class 1 1.5 Farmington 10 5 No 47.9 ***
10 10/15/02 Southington 131-162 drizzle night 48 49 Class 1 2 New Britain 20 10 No 52.9 ***
22 10/28/02 North Haven 173-348H cloudy 53 70 Class 1 1.5 North Branford 18 10 No 37.4 ***22 10/29/02 North Haven 173-348H day 45 50 Class 1 1.5 North Branford 18 10 No 43.6 ***
8 11/1/02 Winchester 162-131 cloudy 40-45 50 SP 37.5 4 Torrington 20 11 No *** ***
10 11/2/02 Farmington 174-305E sunny 28 29 Class 1 1.5 Farmington 8 4 No 49.7 810 11/2/02 Farmington 174-305E sunny 28 29 Class 1 1.5 New Britain 15 10 No 42.1 3
FarmingtonAve.
11/5/02 West Hartford 155-149 day 45 45 Class 1 2 New Britain 20 10 No 53.3 7.5
320* 6/6/03 Willington 171-306C sunny 65 80 Class 1 2 Killingly 45 *** No N/A N/A
176* 6/9/03 Newington 171-307H sunny 65-70 82 Class 1 2 Newington 8 5 No N/A N/A
186* 6/11/03 Somers 129-107 sprinkling 75 87 Class 1 1.5 Springfield 20 15 No N/A N/A
201* 6/16/03 Griswold 57-106 day 60 80 Class 1 2 Killingly 25 *** No N/A N/A201* 6/17/03 Griswold 57-106 day 65 85 Class 1 2 Killingly 25 *** No N/A N/A
(1) Night paving denoted with night in weather description * - Site was monitored exclusively for the study of heated truck bodies ** - Base temperature reflects that of a recently placed leveling course *** - Data was not collected
14
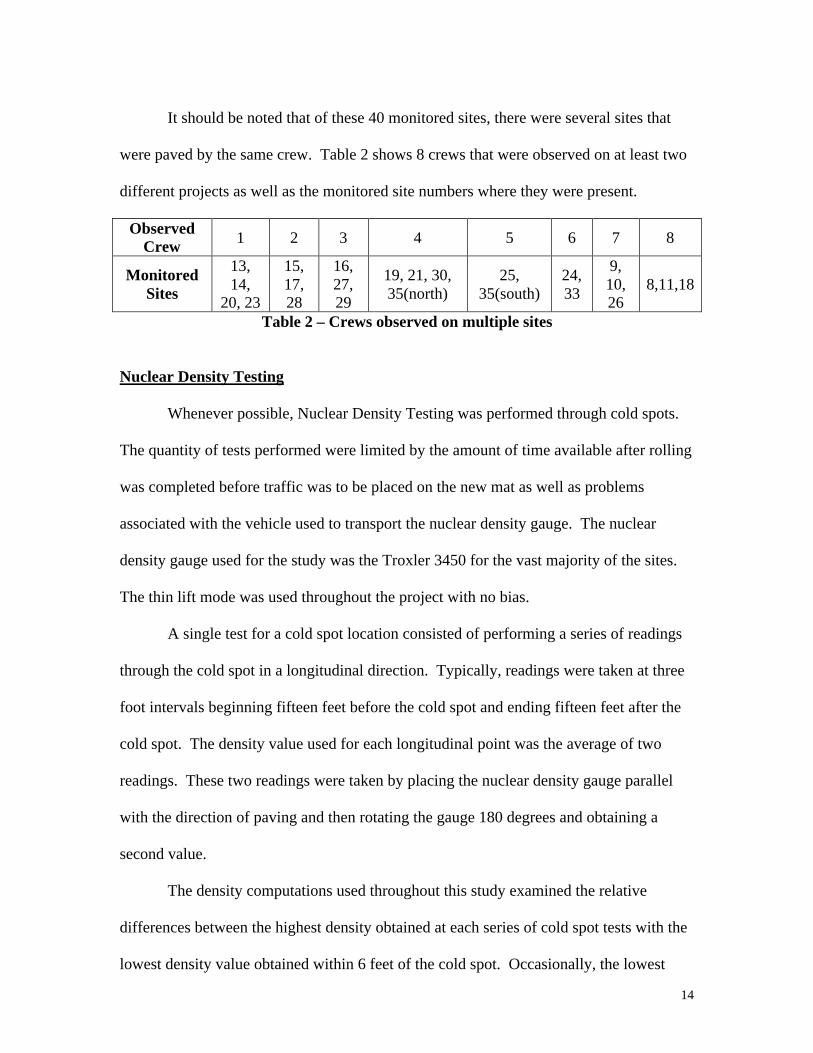
It should be noted that of these 40 monitored sites, there were several sites that
were paved by the same crew. Table 2 shows 8 crews that were observed on at least two
different projects as well as the monitored site numbers where they were present.
ObservedCrew 1 2 3 4 5 6 7 8
MonitoredSites
13,14,
20, 23
15,17,28
16,27,29
19, 21, 30,35(north)
25,35(south)
24,33
9,10,26
8,11,18
Table 2 – Crews observed on multiple sites
Nuclear Density Testing
Whenever possible, Nuclear Density Testing was performed through cold spots.
The quantity of tests performed were limited by the amount of time available after rolling
was completed before traffic was to be placed on the new mat as well as problems
associated with the vehicle used to transport the nuclear density gauge. The nuclear
density gauge used for the study was the Troxler 3450 for the vast majority of the sites.
The thin lift mode was used throughout the project with no bias.
A single test for a cold spot location consisted of performing a series of readings
through the cold spot in a longitudinal direction. Typically, readings were taken at three
foot intervals beginning fifteen feet before the cold spot and ending fifteen feet after the
cold spot. The density value used for each longitudinal point was the average of two
readings. These two readings were taken by placing the nuclear density gauge parallel
with the direction of paving and then rotating the gauge 180 degrees and obtaining a
second value.
The density computations used throughout this study examined the relative
differences between the highest density obtained at each series of cold spot tests with the
lowest density value obtained within 6 feet of the cold spot. Occasionally, the lowest

15
density was not obtained at the exact cold spot as it was marked. On several occasions
the lowest density was obtained 3-6 feet from that spot. The relative densities were used
to eliminate potential problems associated with applying a bias for the gauge as well as
on several occasions density series were performed before finish rolling had occurred.
Density series performed before finish rolling were deemed to be acceptable provided no
additional rolling of the test area occurred while testing was ongoing. Density testing
was sometimes performed before finish rolling had occurred. This was generally during
the hottest days as it took a long while for the pavement to cool sufficiently for finish
rolling. For this study, taking density measurements before finish rolling occurred was
assumed to have little impact on the data as the focus was placed on the relative
difference in the density. Table 3 contains information regarding density differentials
broken down by month.
Table 3Breakdown of Relative Density Differences
Relative Density Relative DensityMonth Difference End Dump, pcf Difference with MTV, pcf
May* N/A N/AJune 4.97 N/AJuly 6.38 3.58
August 7.07 N/ASeptember* 12.6* 5.35
October 4.95 N/ANovember 5.36 6.2*
* One Project
The relative density differences for MTV must be viewed cautiously as the amount of
data for September and November is very small. In this study, the total quantity of data
for the MTVs is quite small as they significantly and consistently reduced the
temperature differentials. It was therefore determined that the main focus of the study
should exclude projects using a MTV.
16
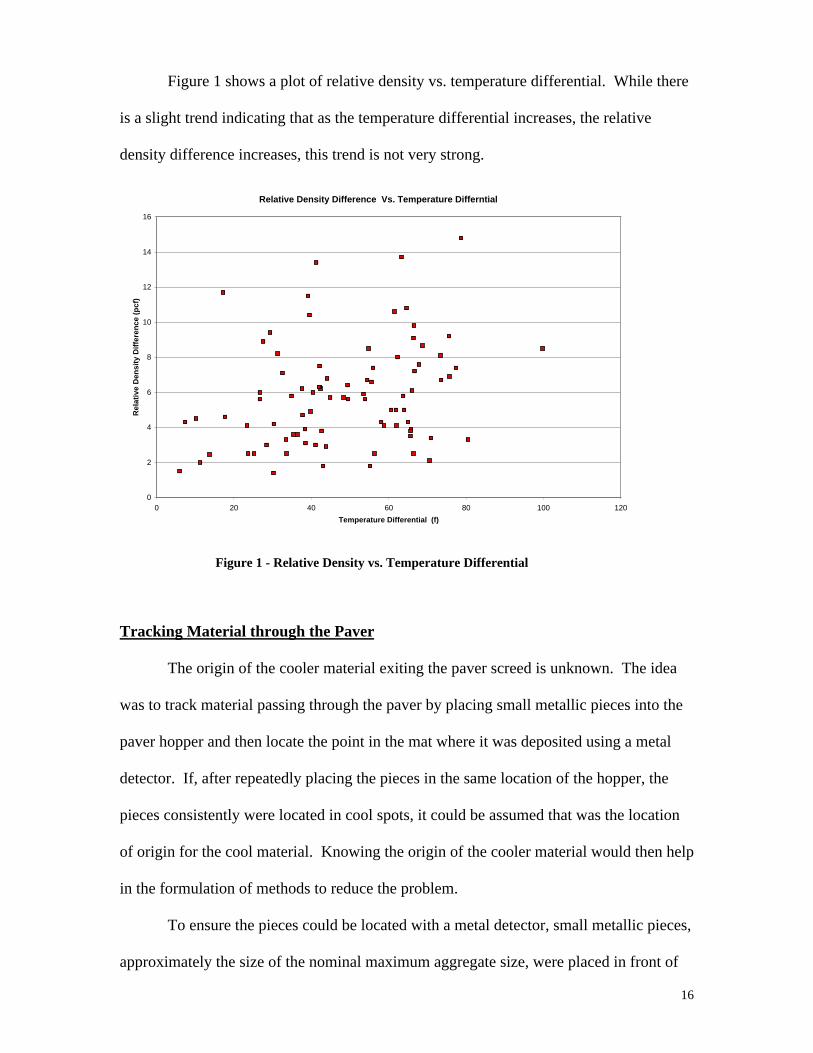
Figure 1 shows a plot of relative density vs. temperature differential. While there
is a slight trend indicating that as the temperature differential increases, the relative
density difference increases, this trend is not very strong.
Relative Density Difference Vs. Temperature Differntial
0
2
4
6
8
10
12
14
16
0 20 40 60 80 100 120
Temperature Differential (f)
Rel
ativ
e D
ensi
ty D
iffe
ren
ce (
pcf
)
Figure 1 - Relative Density vs. Temperature Differential
Tracking Material through the Paver
The origin of the cooler material exiting the paver screed is unknown. The idea
was to track material passing through the paver by placing small metallic pieces into the
paver hopper and then locate the point in the mat where it was deposited using a metal
detector. If, after repeatedly placing the pieces in the same location of the hopper, the
pieces consistently were located in cool spots, it could be assumed that was the location
of origin for the cool material. Knowing the origin of the cooler material would then help
in the formulation of methods to reduce the problem.
To ensure the pieces could be located with a metal detector, small metallic pieces,
approximately the size of the nominal maximum aggregate size, were placed in front of
17
the paver and their positions marked. Attempts were then made to find these pieces after
the pavement was compacted. Unfortunately, the success rate of locating the pieces from
a known position was less than 25%. This poor rate of relocating the pieces lead to the
conclusion that it would be nearly impossible to locate an object that could be almost
anywhere in the mat from that truckload of material, assuming it came out of the hopper
in the first place.
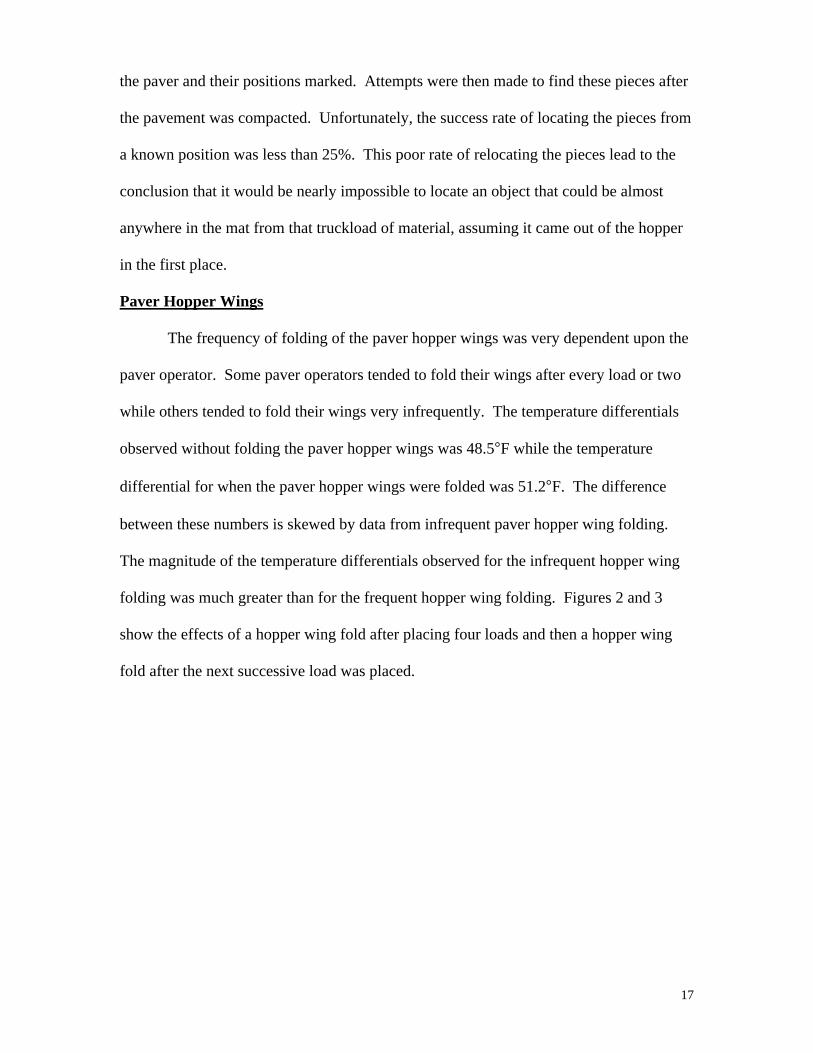
Paver Hopper Wings
The frequency of folding of the paver hopper wings was very dependent upon the
paver operator. Some paver operators tended to fold their wings after every load or two
while others tended to fold their wings very infrequently. The temperature differentials
observed without folding the paver hopper wings was 48.5°F while the temperature
differential for when the paver hopper wings were folded was 51.2°F. The difference
between these numbers is skewed by data from infrequent paver hopper wing folding.
The magnitude of the temperature differentials observed for the infrequent hopper wing
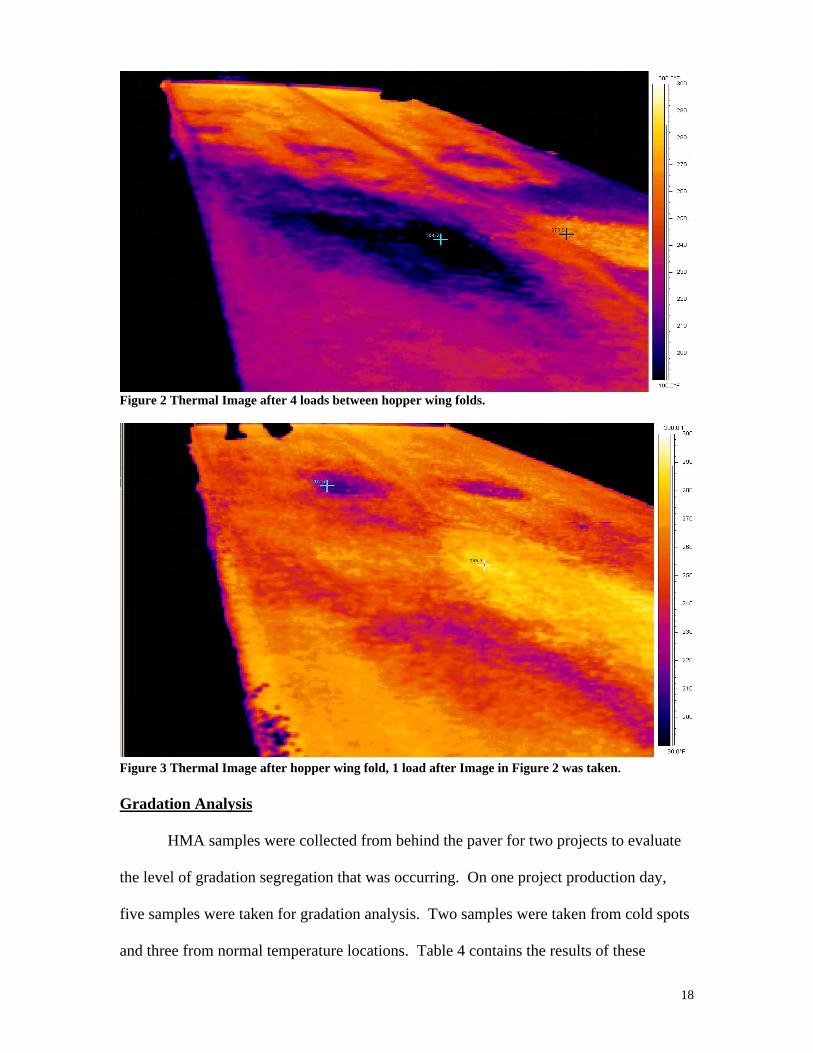
folding was much greater than for the frequent hopper wing folding. Figures 2 and 3
show the effects of a hopper wing fold after placing four loads and then a hopper wing
fold after the next successive load was placed.
18
Figure 2 Thermal Image after 4 loads between hopper wing folds.
Figure 3 Thermal Image after hopper wing fold, 1 load after Image in Figure 2 was taken.
Gradation Analysis
HMA samples were collected from behind the paver for two projects to evaluate
the level of gradation segregation that was occurring. On one project production day,
five samples were taken for gradation analysis. Two samples were taken from cold spots
and three from normal temperature locations. Table 4 contains the results of these
19
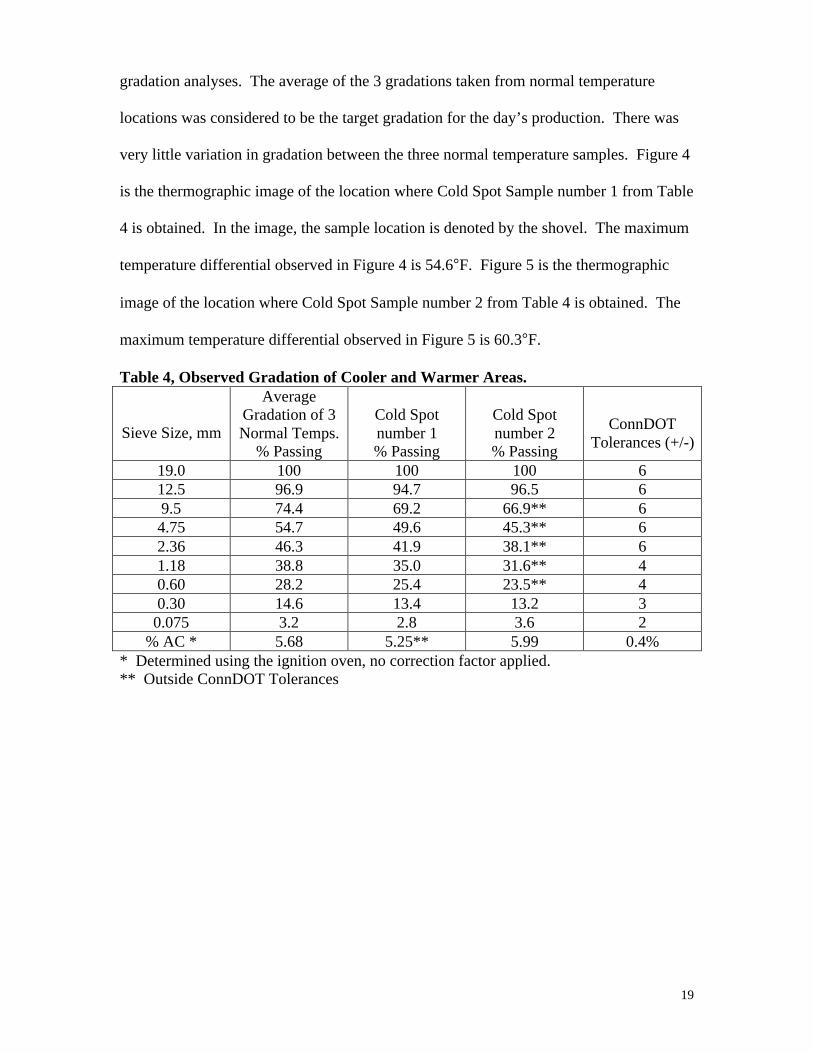
gradation analyses. The average of the 3 gradations taken from normal temperature
locations was considered to be the target gradation for the day’s production. There was
very little variation in gradation between the three normal temperature samples. Figure 4
is the thermographic image of the location where Cold Spot Sample number 1 from Table
4 is obtained. In the image, the sample location is denoted by the shovel. The maximum
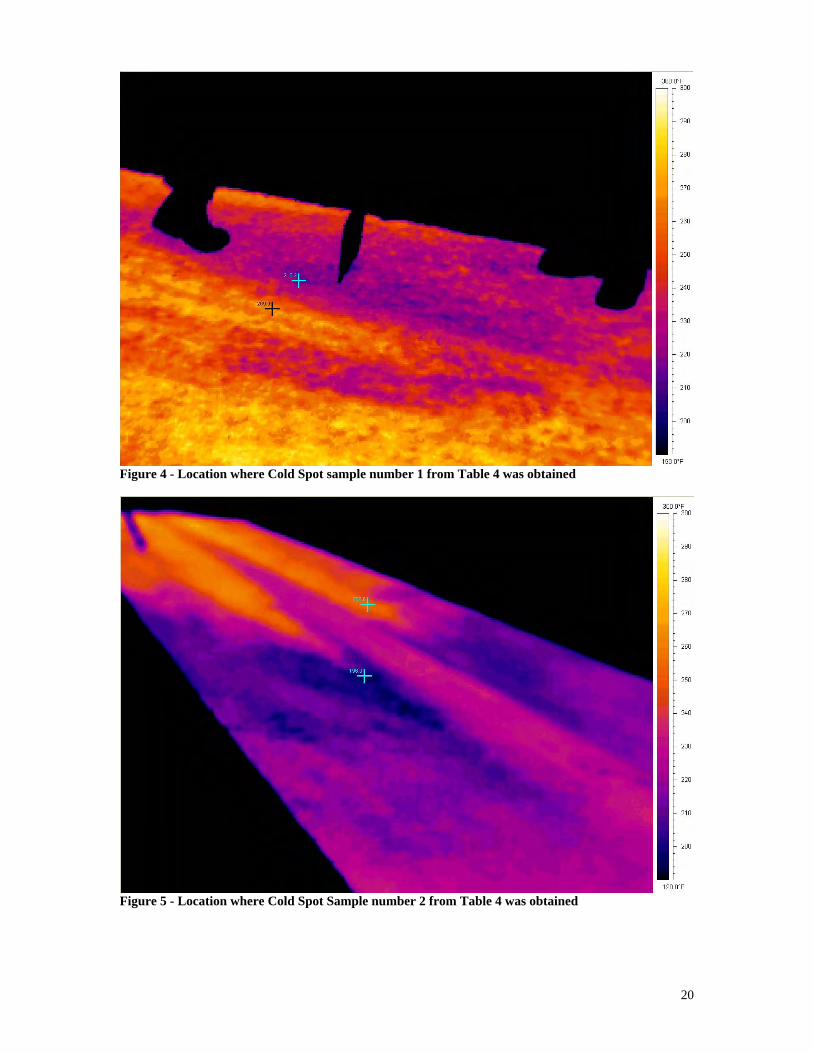
temperature differential observed in Figure 4 is 54.6°F. Figure 5 is the thermographic
image of the location where Cold Spot Sample number 2 from Table 4 is obtained. The
maximum temperature differential observed in Figure 5 is 60.3°F.
Table 4, Observed Gradation of Cooler and Warmer Areas.
Sieve Size, mm
AverageGradation of 3Normal Temps.
% Passing
Cold Spotnumber 1% Passing
Cold Spotnumber 2% Passing
ConnDOTTolerances (+/-)
19.0 100 100 100 612.5 96.9 94.7 96.5 69.5 74.4 69.2 66.9** 64.75 54.7 49.6 45.3** 62.36 46.3 41.9 38.1** 61.18 38.8 35.0 31.6** 40.60 28.2 25.4 23.5** 40.30 14.6 13.4 13.2 3
0.075 3.2 2.8 3.6 2% AC * 5.68 5.25** 5.99 0.4%
* Determined using the ignition oven, no correction factor applied.** Outside ConnDOT Tolerances
20
Figure 4 - Location where Cold Spot sample number 1 from Table 4 was obtained
Figure 5 - Location where Cold Spot Sample number 2 from Table 4 was obtained
21
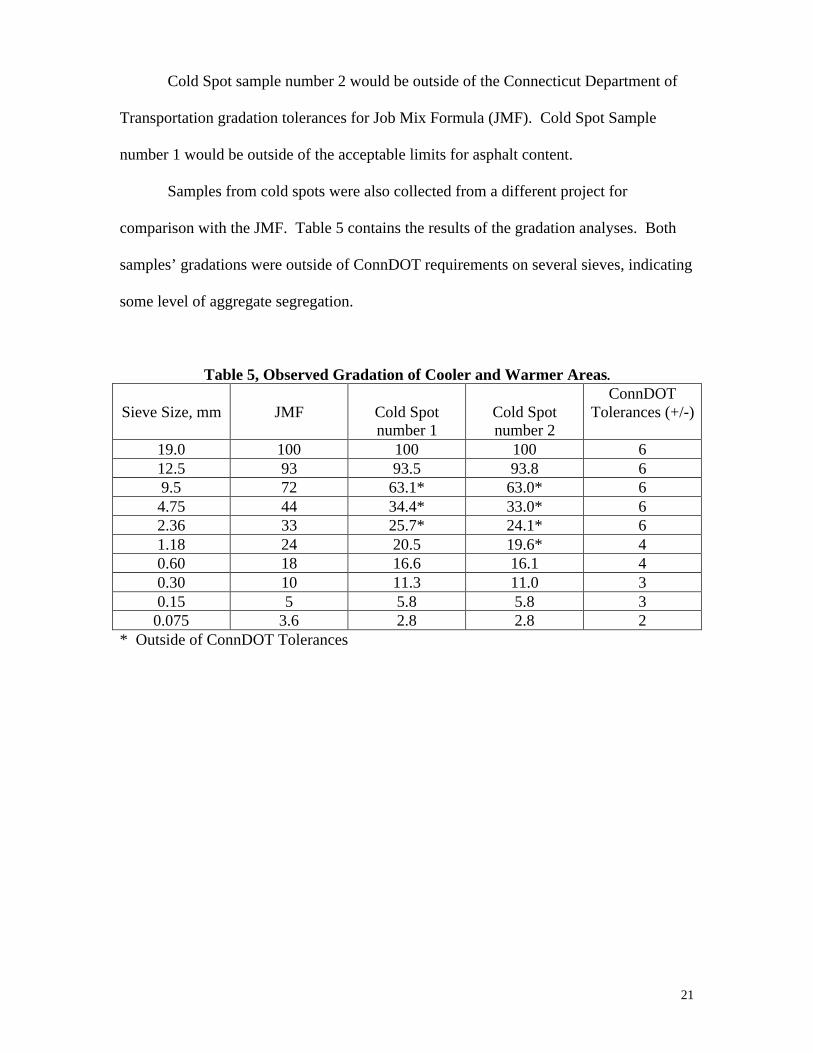
Cold Spot sample number 2 would be outside of the Connecticut Department of
Transportation gradation tolerances for Job Mix Formula (JMF). Cold Spot Sample
number 1 would be outside of the acceptable limits for asphalt content.
Samples from cold spots were also collected from a different project for
comparison with the JMF. Table 5 contains the results of the gradation analyses. Both
samples’ gradations were outside of ConnDOT requirements on several sieves, indicating
some level of aggregate segregation.
Table 5, Observed Gradation of Cooler and Warmer Areas.
Sieve Size, mm JMF Cold Spotnumber 1
Cold Spotnumber 2
ConnDOTTolerances (+/-)
19.0 100 100 100 612.5 93 93.5 93.8 69.5 72 63.1* 63.0* 64.75 44 34.4* 33.0* 62.36 33 25.7* 24.1* 61.18 24 20.5 19.6* 40.60 18 16.6 16.1 40.30 10 11.3 11.0 30.15 5 5.8 5.8 3
0.075 3.6 2.8 2.8 2* Outside of ConnDOT Tolerances

22
Figure 6 - Location where Cold Spot Sample number 1 from Table 5 Obtained
Figure 7 - Location where Cold Spot Sample number 2 from Table 5 Obtained
23
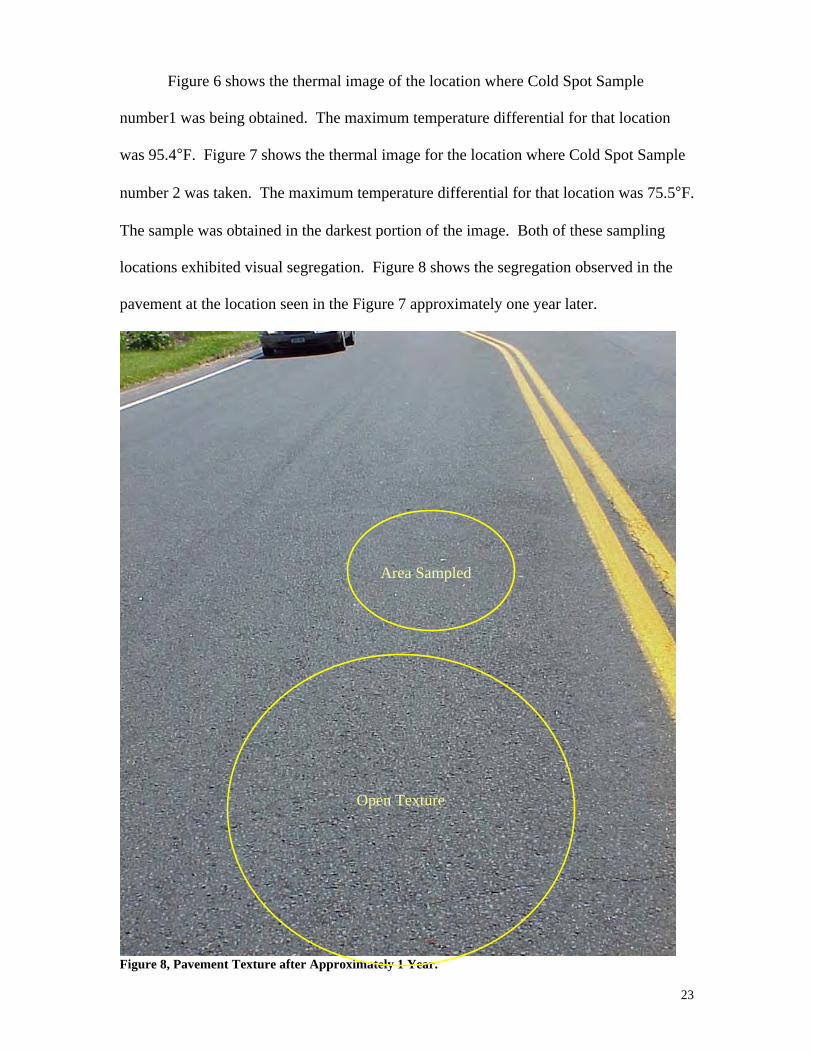
Figure 6 shows the thermal image of the location where Cold Spot Sample
number1 was being obtained. The maximum temperature differential for that location
was 95.4°F. Figure 7 shows the thermal image for the location where Cold Spot Sample
number 2 was taken. The maximum temperature differential for that location was 75.5°F.
The sample was obtained in the darkest portion of the image. Both of these sampling
locations exhibited visual segregation. Figure 8 shows the segregation observed in the
pavement at the location seen in the Figure 7 approximately one year later.
Figure 8, Pavement Texture after Approximately 1 Year.
Area Sampled
Open Texture
24
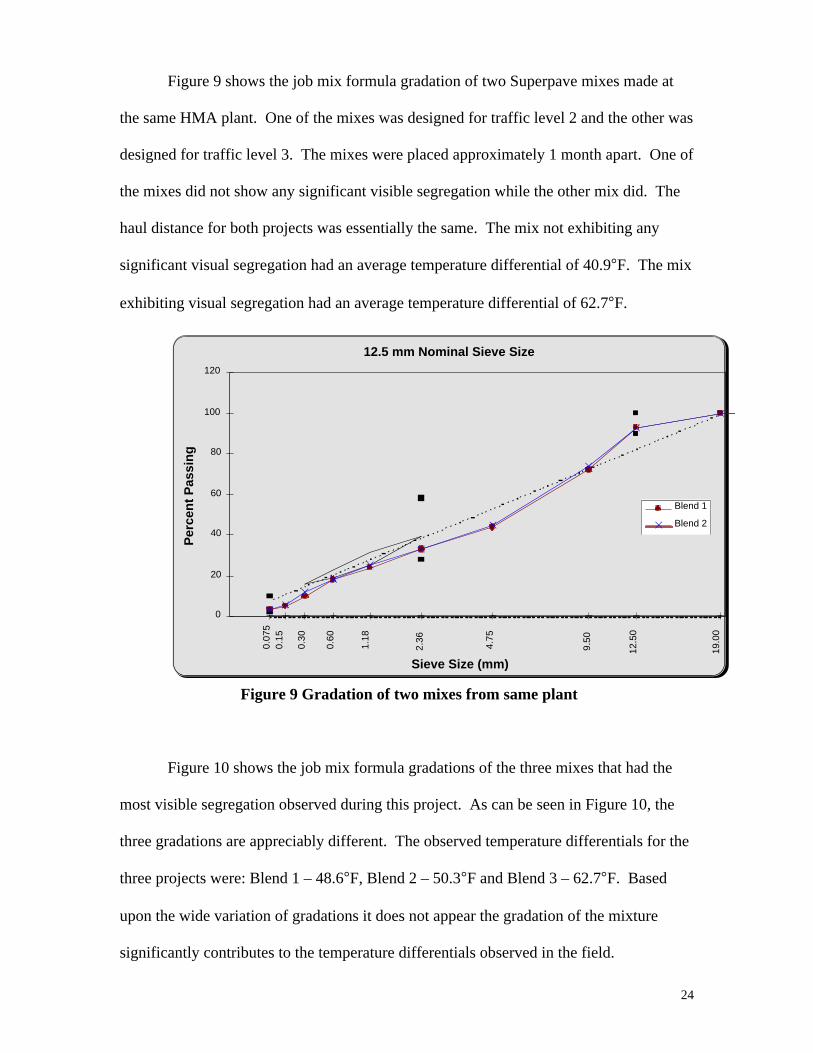
Figure 9 shows the job mix formula gradation of two Superpave mixes made at
the same HMA plant. One of the mixes was designed for traffic level 2 and the other was
designed for traffic level 3. The mixes were placed approximately 1 month apart. One of
the mixes did not show any significant visible segregation while the other mix did. The
haul distance for both projects was essentially the same. The mix not exhibiting any
significant visual segregation had an average temperature differential of 40.9°F. The mix
exhibiting visual segregation had an average temperature differential of 62.7°F.
12.5 mm Nominal Sieve Size
0.07
50.
15
0.30
0.60
1.18
2.36
4.75
9.50
19.0
0
12.5
0
0
20
40
60
80
100
120
Sieve Size (mm)
Per
cen
t P
assi
ng
Blend 1
Blend 2
Blend 3
Blend 4
Blend 5
Figure 9 Gradation of two mixes from same plant
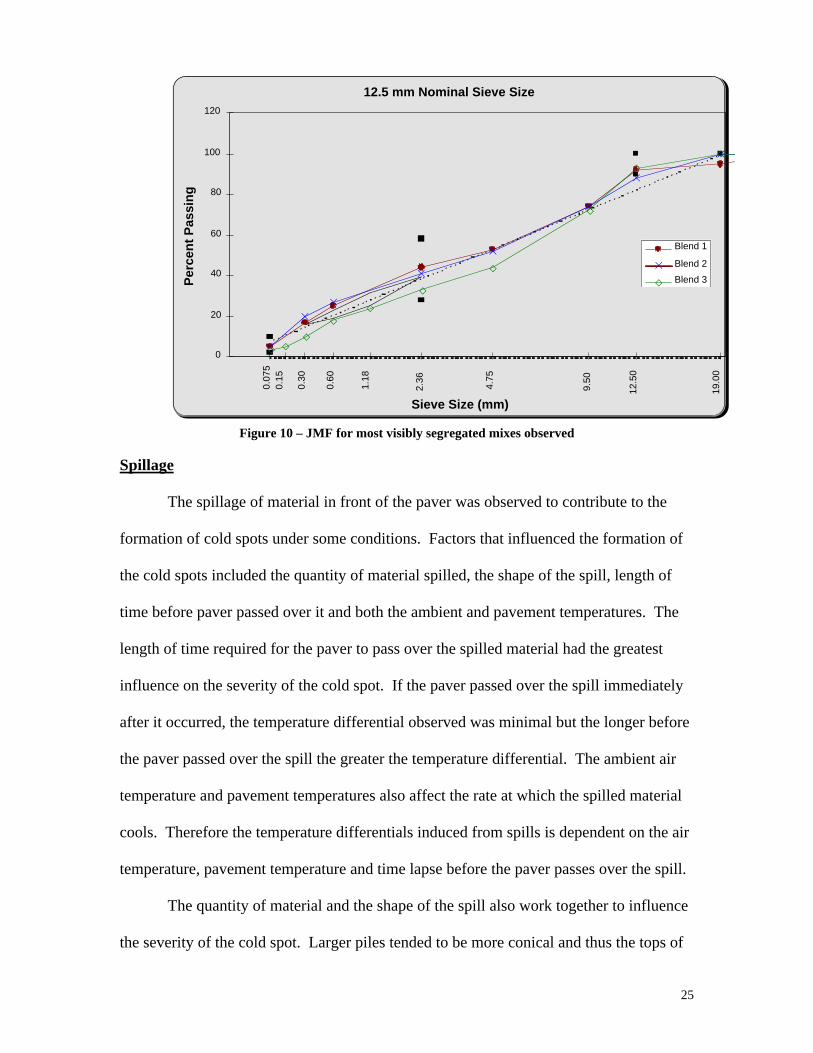
Figure 10 shows the job mix formula gradations of the three mixes that had the
most visible segregation observed during this project. As can be seen in Figure 10, the
three gradations are appreciably different. The observed temperature differentials for the
three projects were: Blend 1 – 48.6°F, Blend 2 – 50.3°F and Blend 3 – 62.7°F. Based
upon the wide variation of gradations it does not appear the gradation of the mixture
significantly contributes to the temperature differentials observed in the field.
25
12.5 mm Nominal Sieve Size
0.07
50.
15
0.30
0.60
1.18
2.36
4.75
9.50
19.0
0
12.5
0
0
20
40
60
80
100
120
Sieve Size (mm)
Per
cen
t P
assi
ng
Blend 1
Blend 2
Blend 3
Blend 4
Blend 5
Figure 10 – JMF for most visibly segregated mixes observed
Spillage
The spillage of material in front of the paver was observed to contribute to the
formation of cold spots under some conditions. Factors that influenced the formation of
the cold spots included the quantity of material spilled, the shape of the spill, length of
time before paver passed over it and both the ambient and pavement temperatures. The
length of time required for the paver to pass over the spilled material had the greatest
influence on the severity of the cold spot. If the paver passed over the spill immediately
after it occurred, the temperature differential observed was minimal but the longer before
the paver passed over the spill the greater the temperature differential. The ambient air
temperature and pavement temperatures also affect the rate at which the spilled material
cools. Therefore the temperature differentials induced from spills is dependent on the air
temperature, pavement temperature and time lapse before the paver passes over the spill.
The quantity of material and the shape of the spill also work together to influence
the severity of the cold spot. Larger piles tended to be more conical and thus the tops of
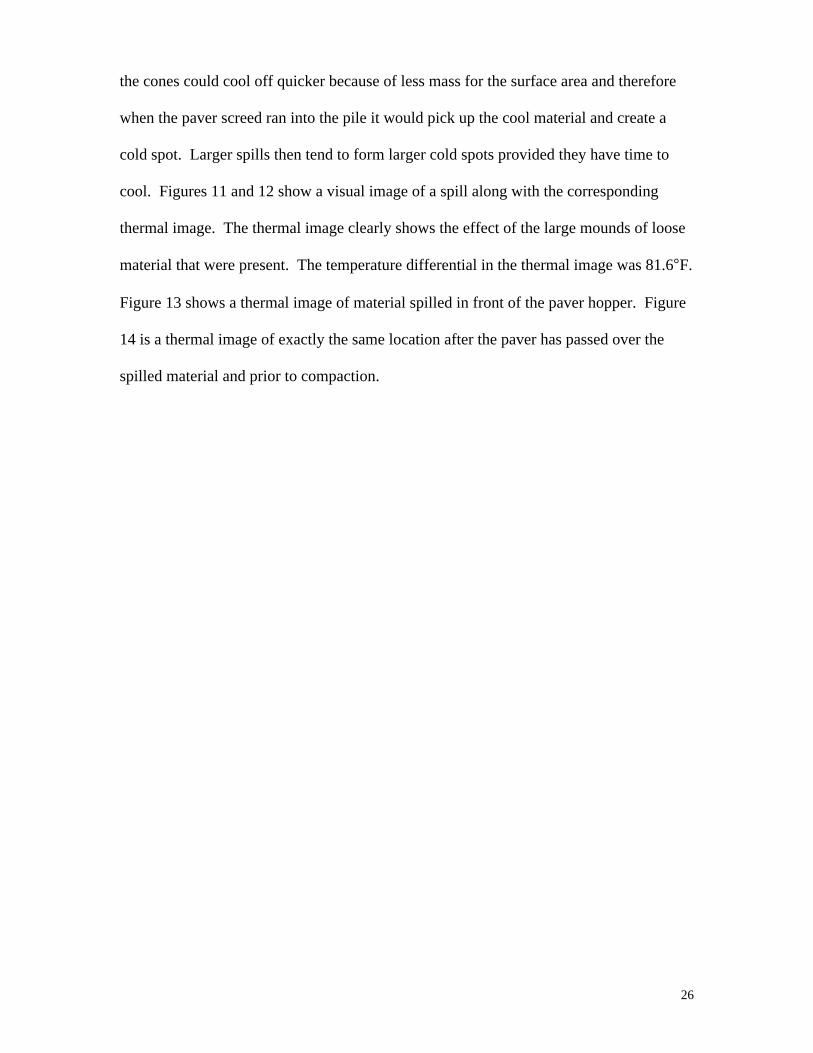
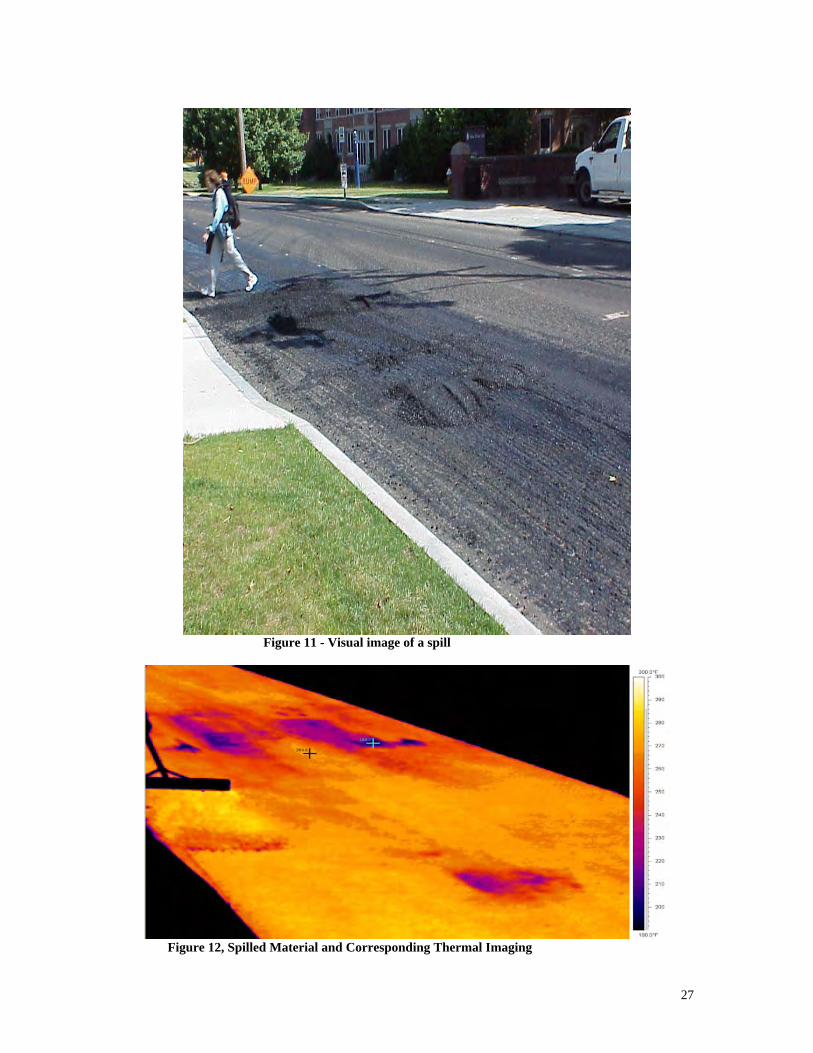
26
the cones could cool off quicker because of less mass for the surface area and therefore
when the paver screed ran into the pile it would pick up the cool material and create a
cold spot. Larger spills then tend to form larger cold spots provided they have time to
cool. Figures 11 and 12 show a visual image of a spill along with the corresponding
thermal image. The thermal image clearly shows the effect of the large mounds of loose
material that were present. The temperature differential in the thermal image was 81.6°F.
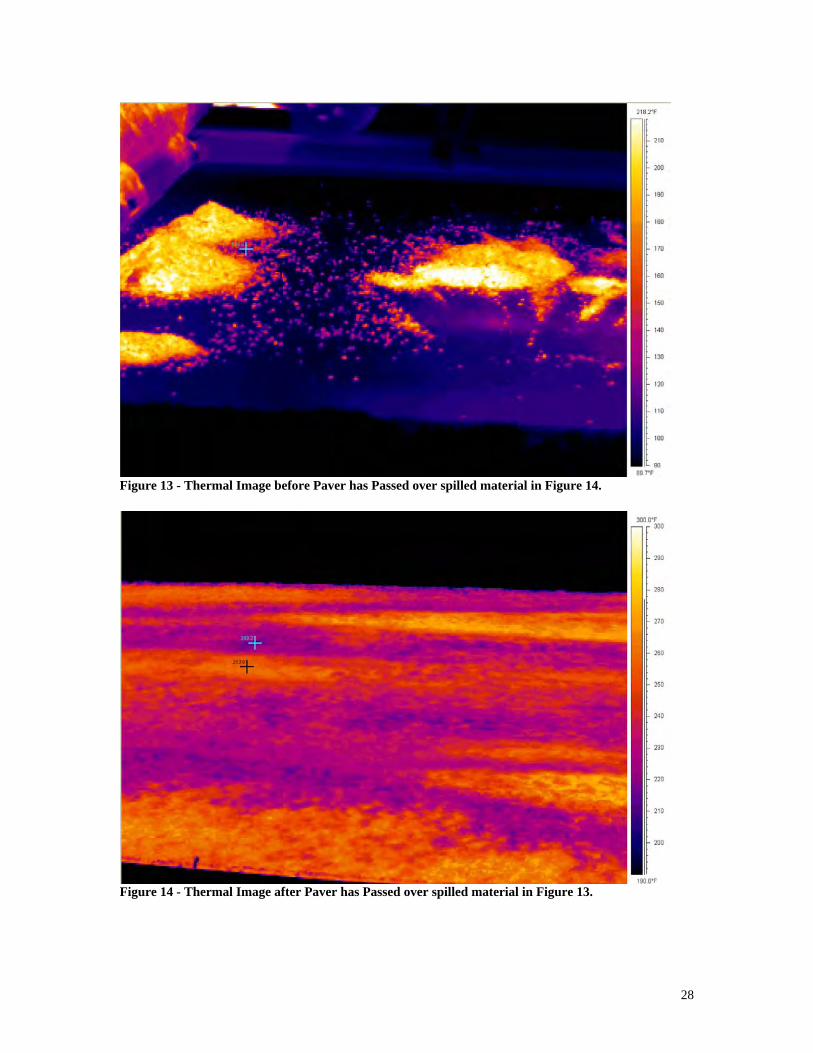
Figure 13 shows a thermal image of material spilled in front of the paver hopper. Figure
14 is a thermal image of exactly the same location after the paver has passed over the
spilled material and prior to compaction.
27
Figure 11 - Visual image of a spill
Figure 12, Spilled Material and Corresponding Thermal Imaging
28
Figure 13 - Thermal Image before Paver has Passed over spilled material in Figure 14.
Figure 14 - Thermal Image after Paver has Passed over spilled material in Figure 13.
29
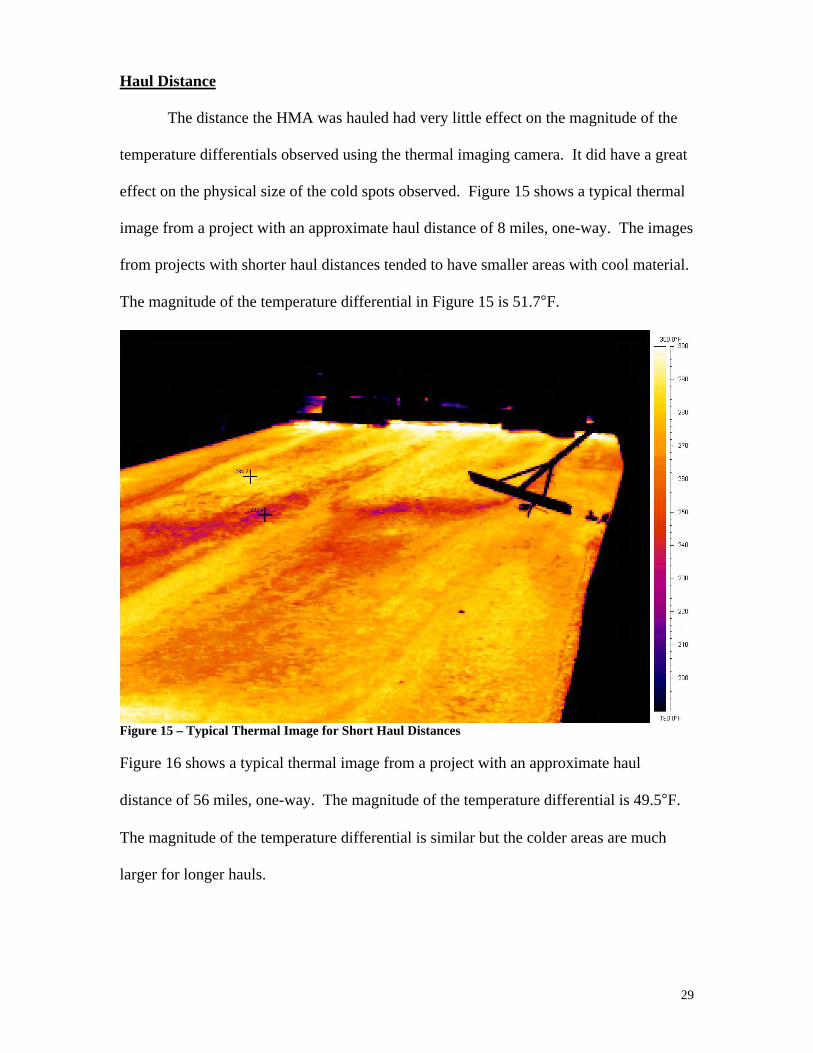
Haul Distance
The distance the HMA was hauled had very little effect on the magnitude of the
temperature differentials observed using the thermal imaging camera. It did have a great
effect on the physical size of the cold spots observed. Figure 15 shows a typical thermal
image from a project with an approximate haul distance of 8 miles, one-way. The images
from projects with shorter haul distances tended to have smaller areas with cool material.
The magnitude of the temperature differential in Figure 15 is 51.7°F.
Figure 15 – Typical Thermal Image for Short Haul Distances
Figure 16 shows a typical thermal image from a project with an approximate haul
distance of 56 miles, one-way. The magnitude of the temperature differential is 49.5°F.
The magnitude of the temperature differential is similar but the colder areas are much
larger for longer hauls.
30
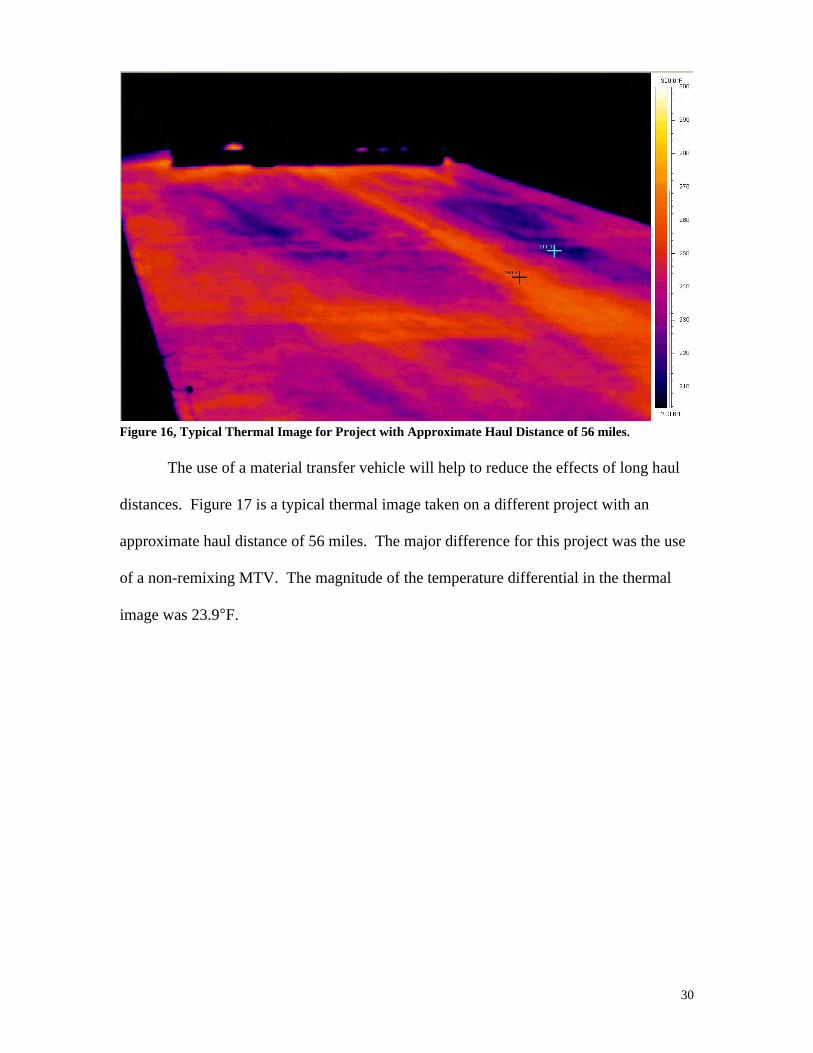
Figure 16, Typical Thermal Image for Project with Approximate Haul Distance of 56 miles.
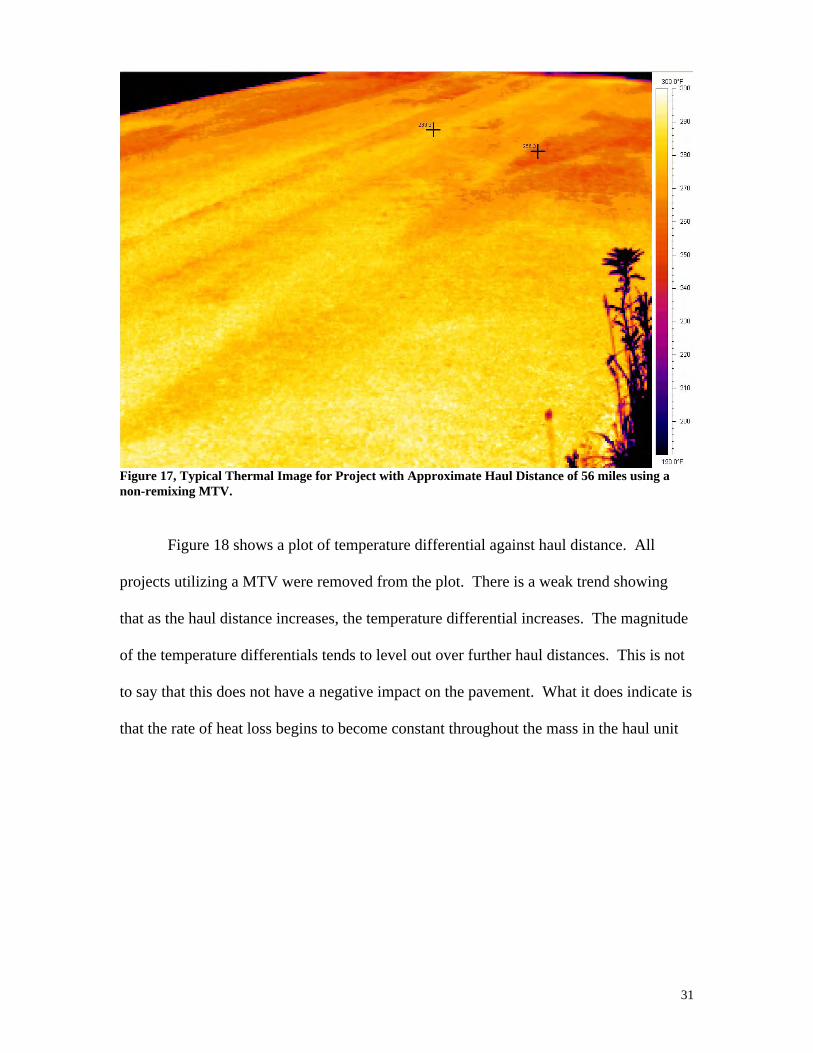
The use of a material transfer vehicle will help to reduce the effects of long haul
distances. Figure 17 is a typical thermal image taken on a different project with an
approximate haul distance of 56 miles. The major difference for this project was the use
of a non-remixing MTV. The magnitude of the temperature differential in the thermal
image was 23.9°F.
31
Figure 17, Typical Thermal Image for Project with Approximate Haul Distance of 56 miles using anon-remixing MTV.
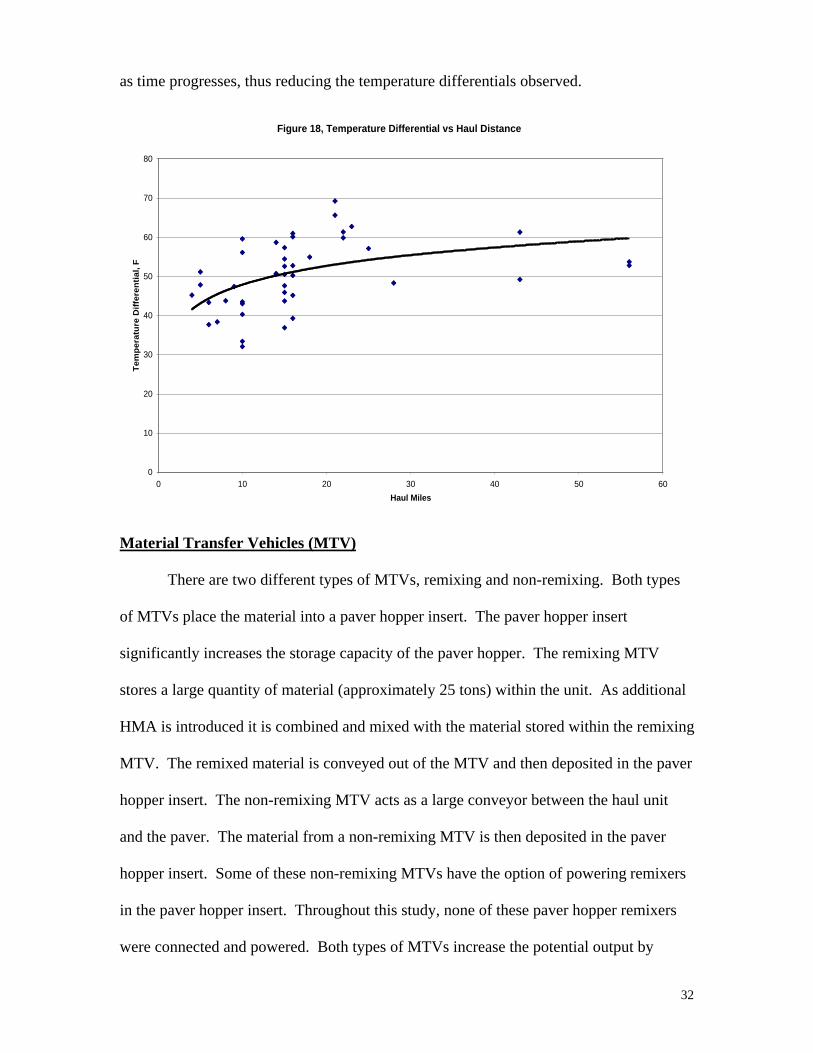
Figure 18 shows a plot of temperature differential against haul distance. All
projects utilizing a MTV were removed from the plot. There is a weak trend showing
that as the haul distance increases, the temperature differential increases. The magnitude
of the temperature differentials tends to level out over further haul distances. This is not
to say that this does not have a negative impact on the pavement. What it does indicate is
that the rate of heat loss begins to become constant throughout the mass in the haul unit
32
as time progresses, thus reducing the temperature differentials observed.
Figure 18, Temperature Differential vs Haul Distance
0
10
20
30
40
50
60
70
80
0 10 20 30 40 50 60
Haul Miles
Te
mp
era
ture
Dif
fere
nti
al, F
Material Transfer Vehicles (MTV)
There are two different types of MTVs, remixing and non-remixing. Both types
of MTVs place the material into a paver hopper insert. The paver hopper insert
significantly increases the storage capacity of the paver hopper. The remixing MTV
stores a large quantity of material (approximately 25 tons) within the unit. As additional
HMA is introduced it is combined and mixed with the material stored within the remixing
MTV. The remixed material is conveyed out of the MTV and then deposited in the paver
hopper insert. The non-remixing MTV acts as a large conveyor between the haul unit
and the paver. The material from a non-remixing MTV is then deposited in the paver
hopper insert. Some of these non-remixing MTVs have the option of powering remixers
in the paver hopper insert. Throughout this study, none of these paver hopper remixers
were connected and powered. Both types of MTVs increase the potential output by
33
reducing or eliminating the amount of time the paving train has to stop during truck
changes.
Both types of Material Transfer Vehicles (MTV) are an effective method for
reducing temperature differentials at the time of placement for HMA. The remixing
MTVs virtually eliminate the observed temperature differentials and the non-remixing
MTVs greatly reduce the magnitude of the temperature differentials. As MTVs produced
relatively uniform temperature profiles throughout projects, less emphasis was placed on
them during the study.
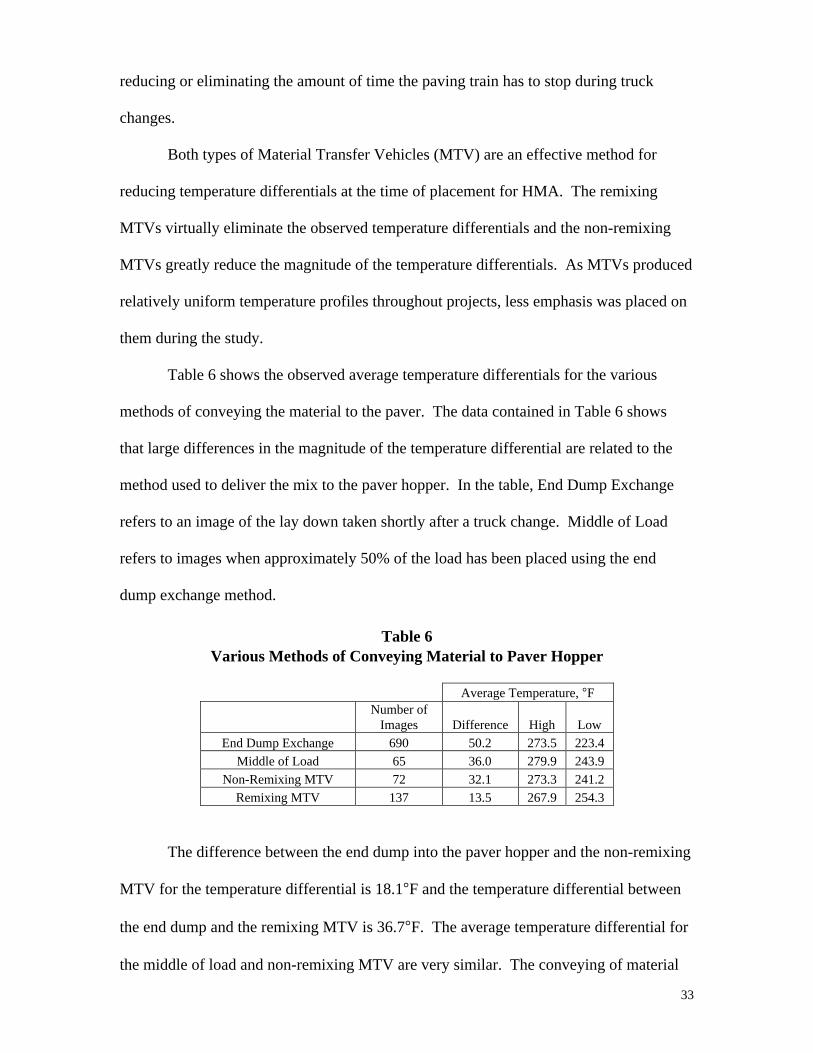
Table 6 shows the observed average temperature differentials for the various
methods of conveying the material to the paver. The data contained in Table 6 shows
that large differences in the magnitude of the temperature differential are related to the
method used to deliver the mix to the paver hopper. In the table, End Dump Exchange
refers to an image of the lay down taken shortly after a truck change. Middle of Load
refers to images when approximately 50% of the load has been placed using the end
dump exchange method.
Table 6Various Methods of Conveying Material to Paver Hopper
Average Temperature, °FNumber of
Images Difference High LowEnd Dump Exchange 690 50.2 273.5 223.4
Middle of Load 65 36.0 279.9 243.9Non-Remixing MTV 72 32.1 273.3 241.2
Remixing MTV 137 13.5 267.9 254.3
The difference between the end dump into the paver hopper and the non-remixing
MTV for the temperature differential is 18.1°F and the temperature differential between
the end dump and the remixing MTV is 36.7°F. The average temperature differential for
the middle of load and non-remixing MTV are very similar. The conveying of material
34
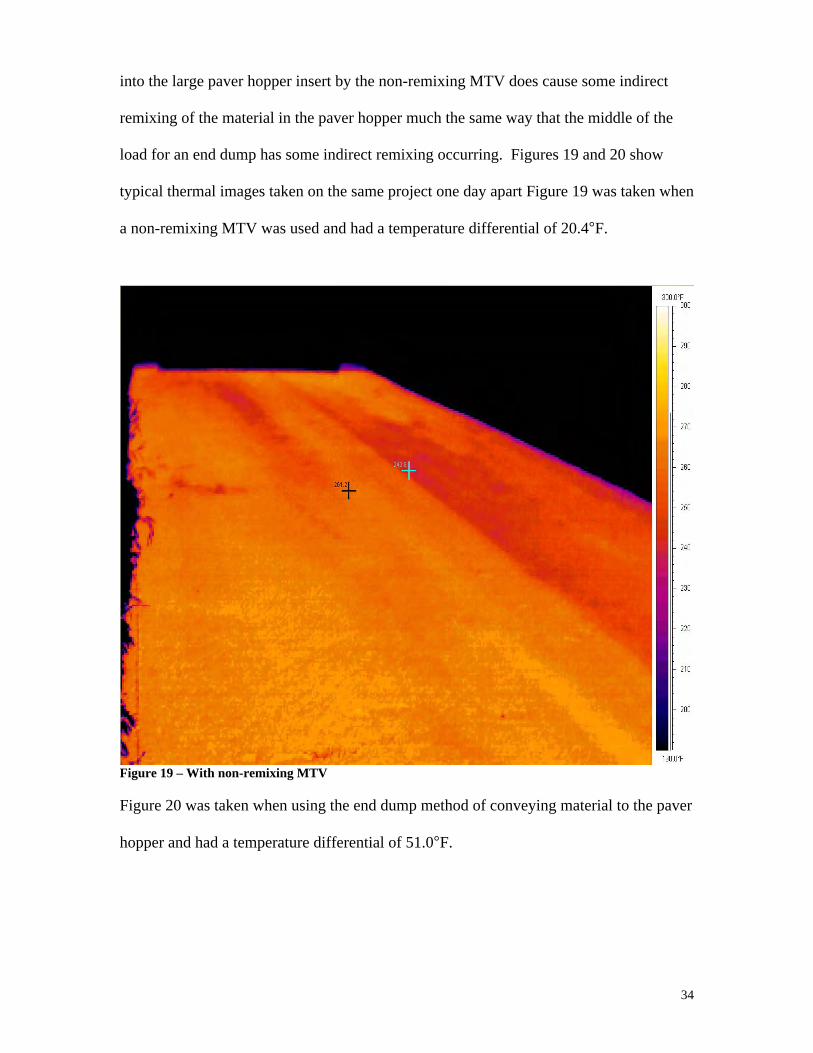
into the large paver hopper insert by the non-remixing MTV does cause some indirect
remixing of the material in the paver hopper much the same way that the middle of the
load for an end dump has some indirect remixing occurring. Figures 19 and 20 show
typical thermal images taken on the same project one day apart Figure 19 was taken when
a non-remixing MTV was used and had a temperature differential of 20.4°F.
Figure 19 – With non-remixing MTV
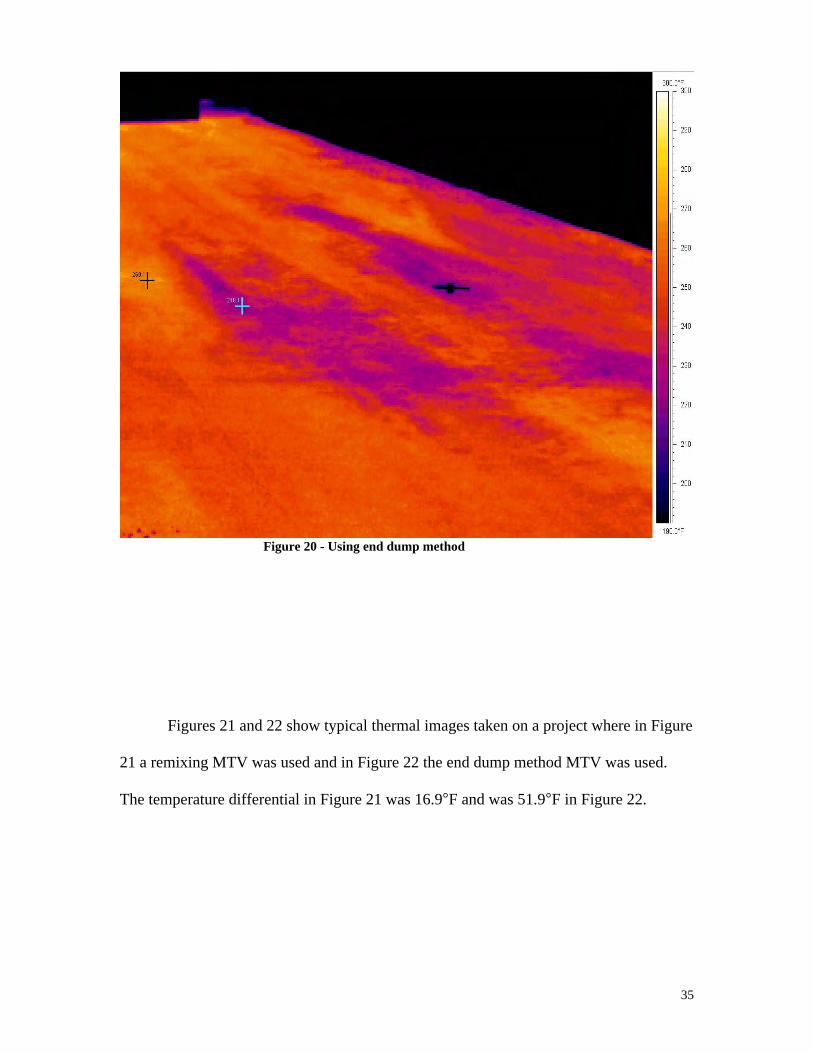
Figure 20 was taken when using the end dump method of conveying material to the paver
hopper and had a temperature differential of 51.0°F.
35
Figure 20 - Using end dump method
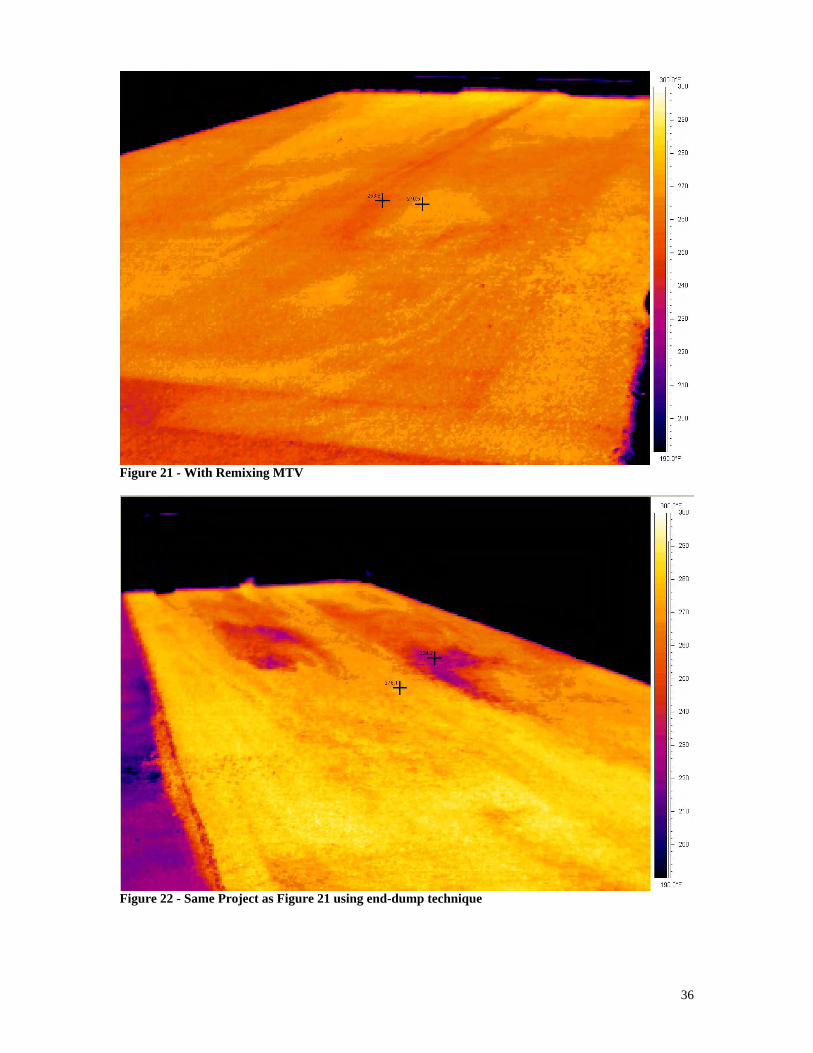
Figures 21 and 22 show typical thermal images taken on a project where in Figure
21 a remixing MTV was used and in Figure 22 the end dump method MTV was used.
The temperature differential in Figure 21 was 16.9°F and was 51.9°F in Figure 22.
36
Figure 21 - With Remixing MTV
Figure 22 - Same Project as Figure 21 using end-dump technique
37
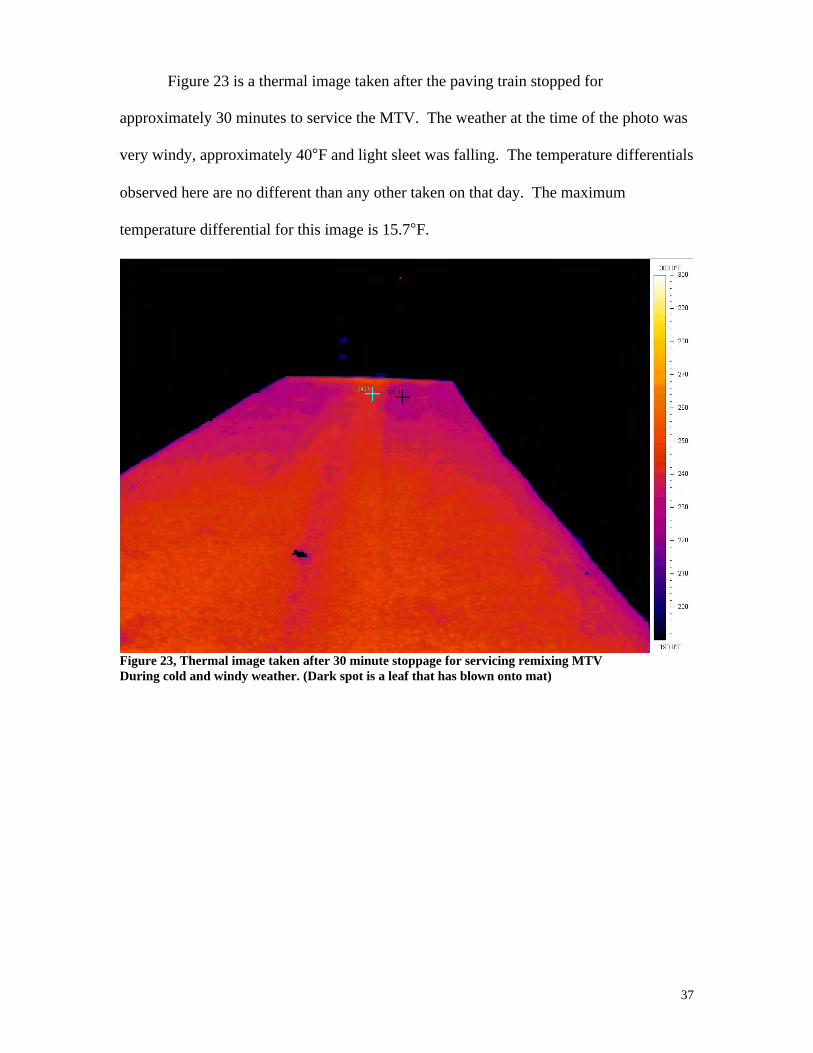
Figure 23 is a thermal image taken after the paving train stopped for
approximately 30 minutes to service the MTV. The weather at the time of the photo was
very windy, approximately 40°F and light sleet was falling. The temperature differentials
observed here are no different than any other taken on that day. The maximum
temperature differential for this image is 15.7°F.
Figure 23, Thermal image taken after 30 minute stoppage for servicing remixing MTVDuring cold and windy weather. (Dark spot is a leaf that has blown onto mat)
38
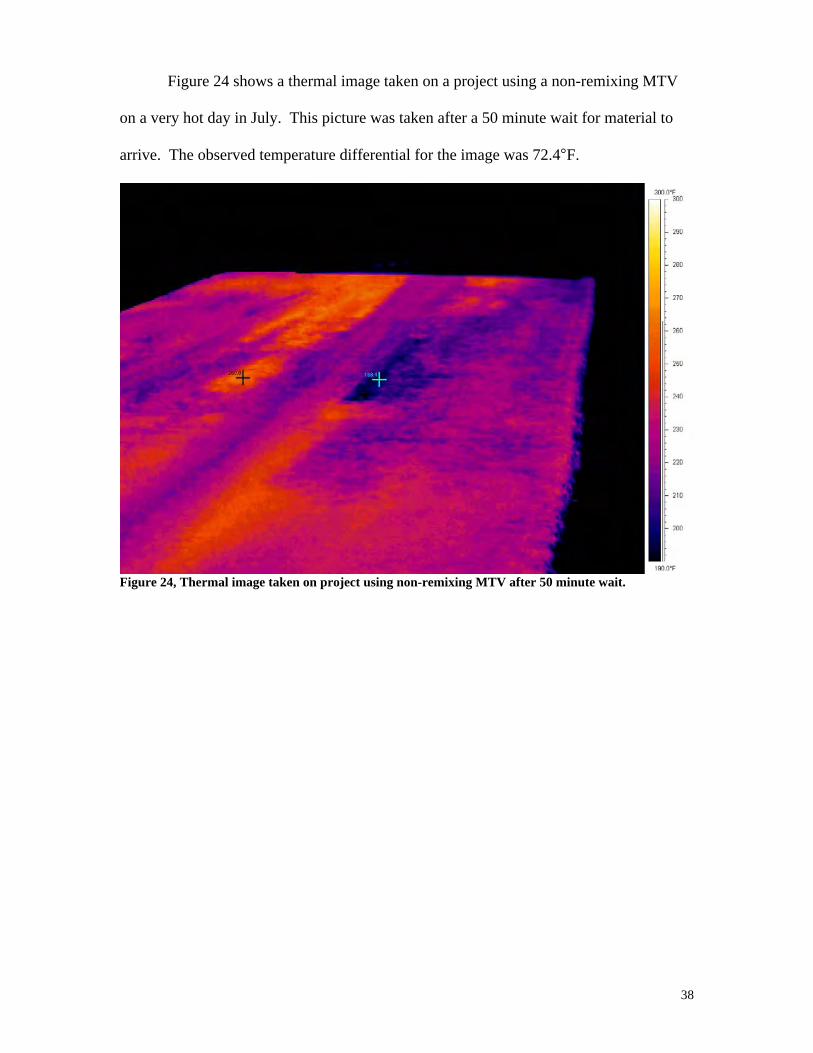
Figure 24 shows a thermal image taken on a project using a non-remixing MTV
on a very hot day in July. This picture was taken after a 50 minute wait for material to
arrive. The observed temperature differential for the image was 72.4°F.
Figure 24, Thermal image taken on project using non-remixing MTV after 50 minute wait.
39
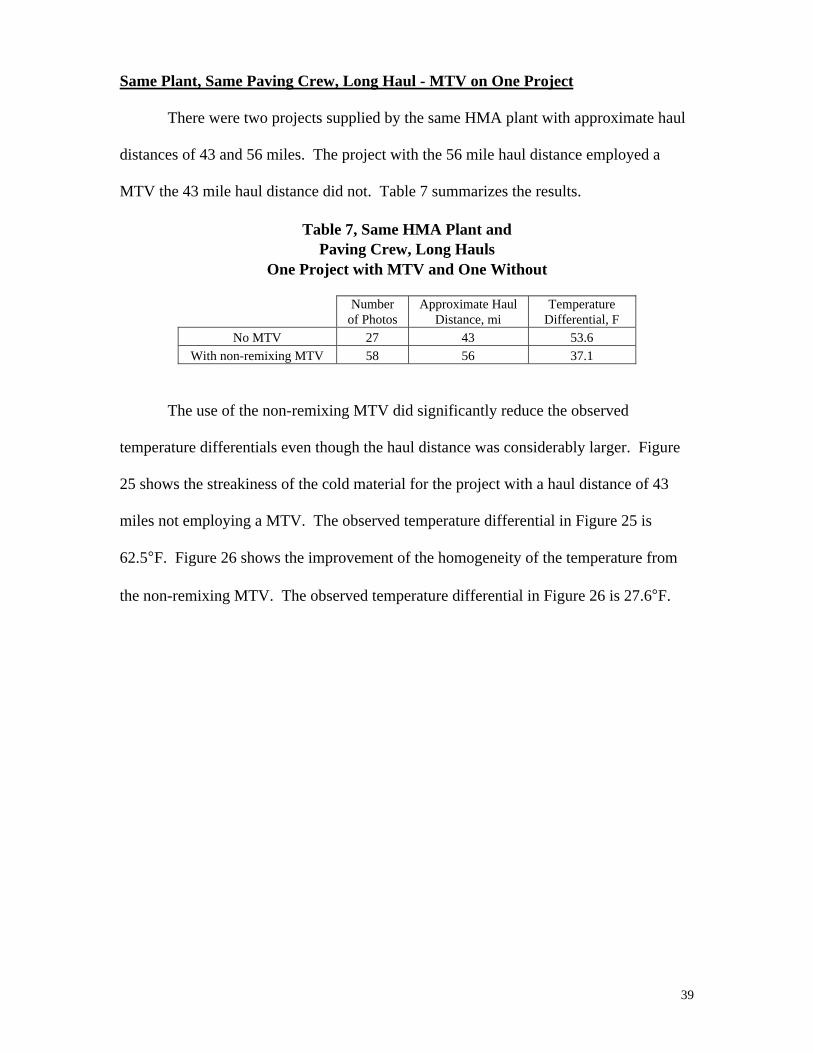
Same Plant, Same Paving Crew, Long Haul - MTV on One Project
There were two projects supplied by the same HMA plant with approximate haul
distances of 43 and 56 miles. The project with the 56 mile haul distance employed a
MTV the 43 mile haul distance did not. Table 7 summarizes the results.
Table 7, Same HMA Plant andPaving Crew, Long Hauls
One Project with MTV and One Without
Numberof Photos
Approximate HaulDistance, mi
TemperatureDifferential, F
No MTV 27 43 53.6With non-remixing MTV 58 56 37.1
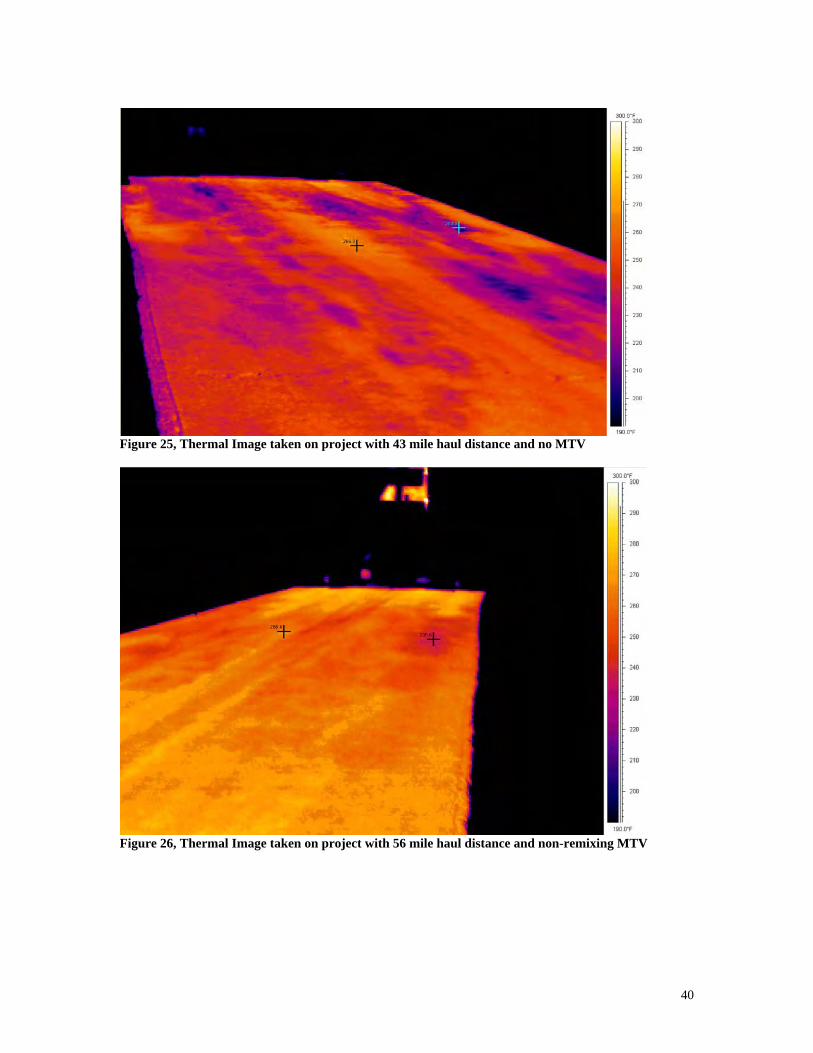
The use of the non-remixing MTV did significantly reduce the observed
temperature differentials even though the haul distance was considerably larger. Figure
25 shows the streakiness of the cold material for the project with a haul distance of 43
miles not employing a MTV. The observed temperature differential in Figure 25 is
62.5°F. Figure 26 shows the improvement of the homogeneity of the temperature from
the non-remixing MTV. The observed temperature differential in Figure 26 is 27.6°F.
40
Figure 25, Thermal Image taken on project with 43 mile haul distance and no MTV
Figure 26, Thermal Image taken on project with 56 mile haul distance and non-remixing MTV
41
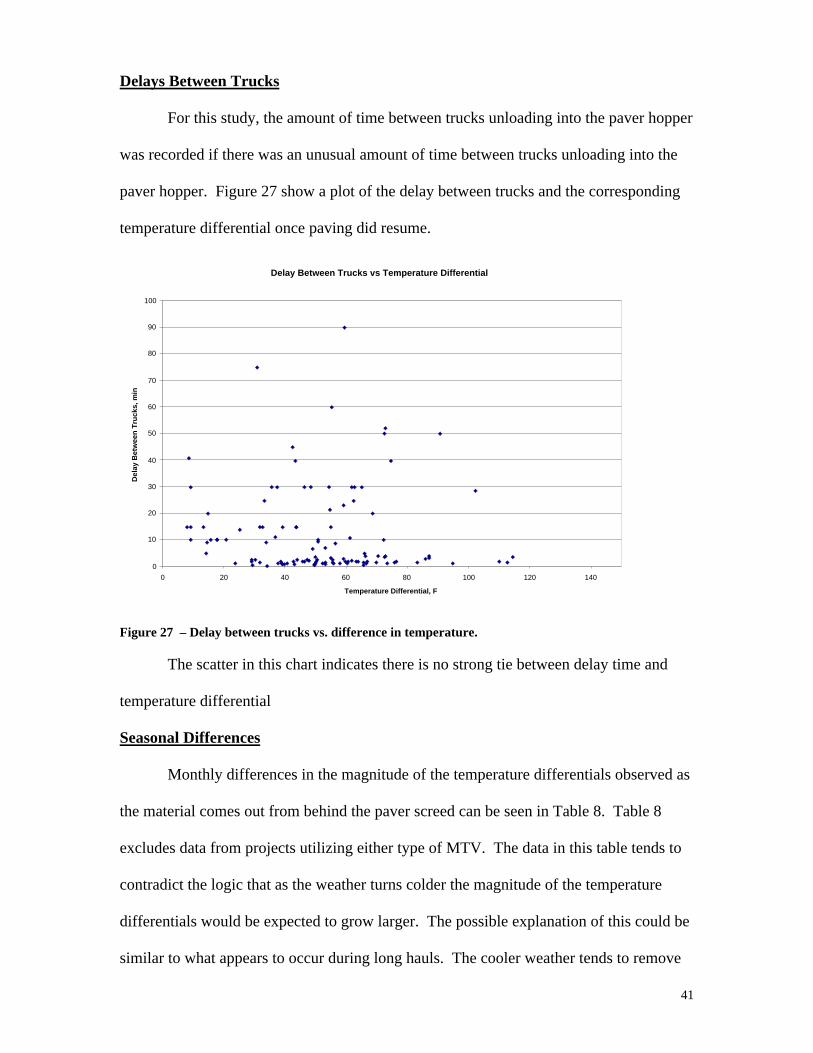
Delays Between Trucks
For this study, the amount of time between trucks unloading into the paver hopper
was recorded if there was an unusual amount of time between trucks unloading into the
paver hopper. Figure 27 show a plot of the delay between trucks and the corresponding
temperature differential once paving did resume.
Delay Between Trucks vs Temperature Differential
0
10
20
30
40
50
60
70
80
90
100
0 20 40 60 80 100 120 140
Temperature Differential, F
Del
ay B
etw
een
Tru
cks,
min
Figure 27 – Delay between trucks vs. difference in temperature.
The scatter in this chart indicates there is no strong tie between delay time and
temperature differential
Seasonal Differences
Monthly differences in the magnitude of the temperature differentials observed as
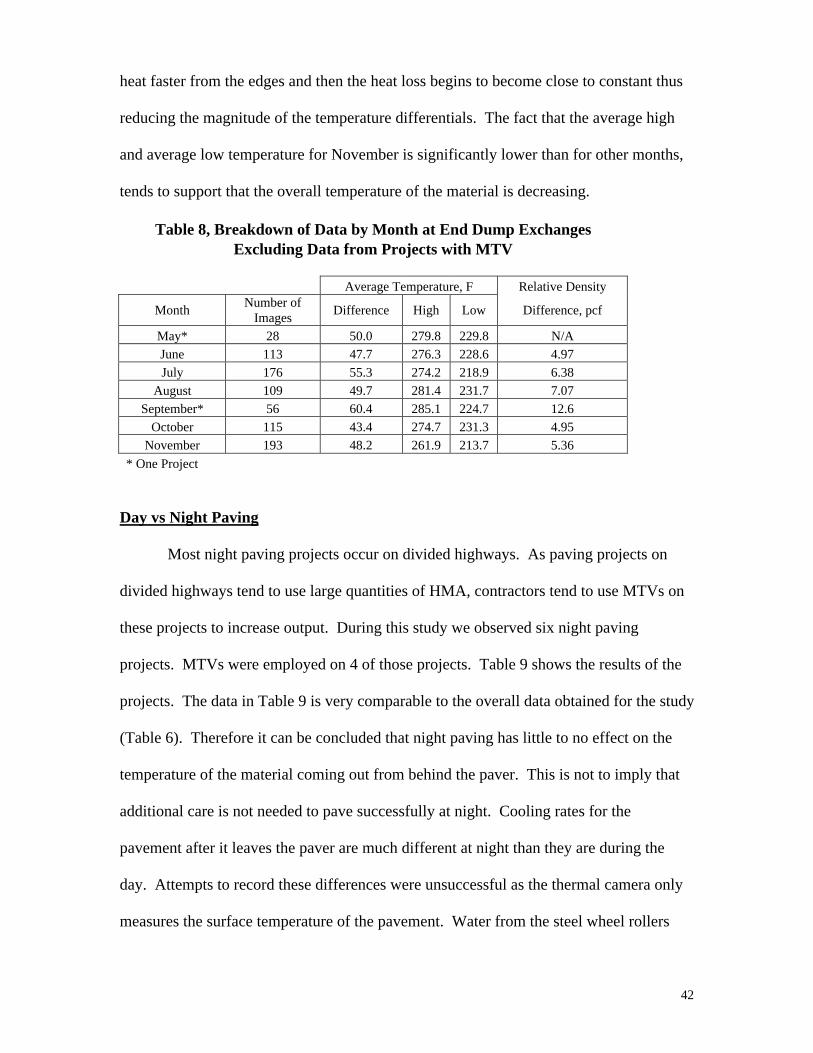
the material comes out from behind the paver screed can be seen in Table 8. Table 8
excludes data from projects utilizing either type of MTV. The data in this table tends to
contradict the logic that as the weather turns colder the magnitude of the temperature
differentials would be expected to grow larger. The possible explanation of this could be
similar to what appears to occur during long hauls. The cooler weather tends to remove
42
heat faster from the edges and then the heat loss begins to become close to constant thus
reducing the magnitude of the temperature differentials. The fact that the average high
and average low temperature for November is significantly lower than for other months,
tends to support that the overall temperature of the material is decreasing.
Table 8, Breakdown of Data by Month at End Dump ExchangesExcluding Data from Projects with MTV
Average Temperature, F Relative Density
MonthNumber of
ImagesDifference High Low Difference, pcf
May* 28 50.0 279.8 229.8 N/AJune 113 47.7 276.3 228.6 4.97July 176 55.3 274.2 218.9 6.38
August 109 49.7 281.4 231.7 7.07September* 56 60.4 285.1 224.7 12.6
October 115 43.4 274.7 231.3 4.95November 193 48.2 261.9 213.7 5.36
* One Project
Day vs Night Paving
Most night paving projects occur on divided highways. As paving projects on
divided highways tend to use large quantities of HMA, contractors tend to use MTVs on
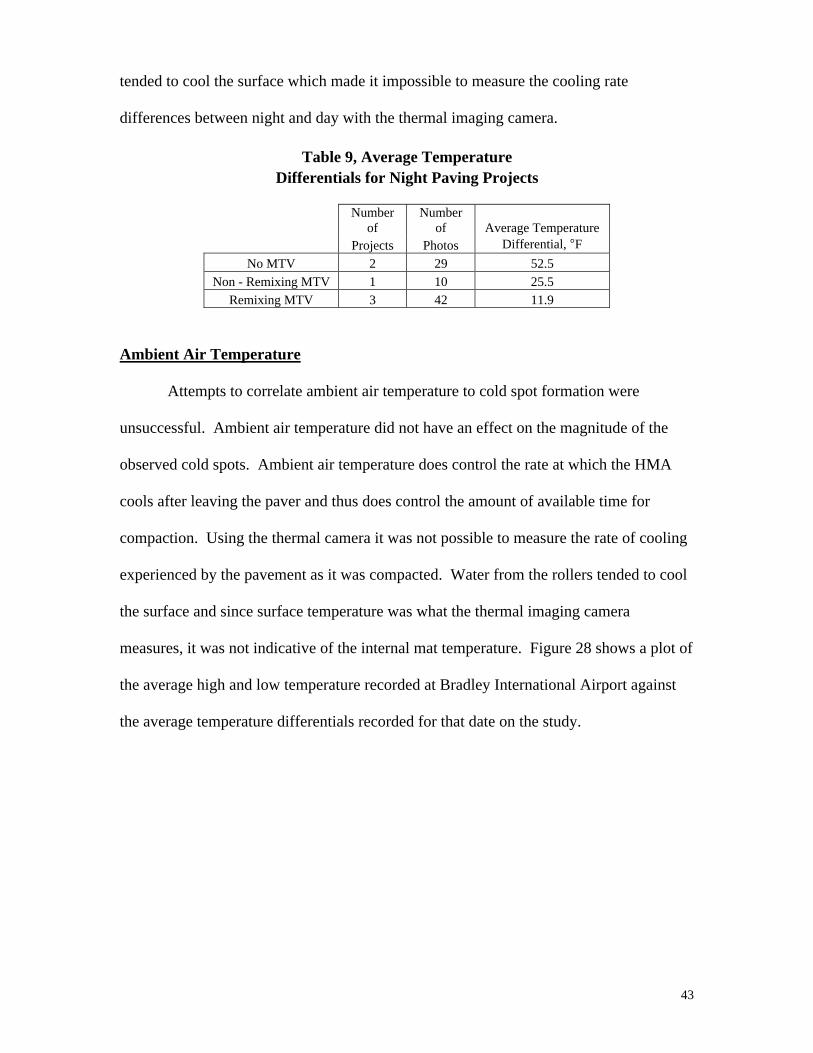
these projects to increase output. During this study we observed six night paving
projects. MTVs were employed on 4 of those projects. Table 9 shows the results of the
projects. The data in Table 9 is very comparable to the overall data obtained for the study
(Table 6). Therefore it can be concluded that night paving has little to no effect on the
temperature of the material coming out from behind the paver. This is not to imply that
additional care is not needed to pave successfully at night. Cooling rates for the
pavement after it leaves the paver are much different at night than they are during the
day. Attempts to record these differences were unsuccessful as the thermal camera only
measures the surface temperature of the pavement. Water from the steel wheel rollers
43
tended to cool the surface which made it impossible to measure the cooling rate
differences between night and day with the thermal imaging camera.
Table 9, Average TemperatureDifferentials for Night Paving Projects
Numberof
Numberof Average Temperature
Projects Photos Differential, °F
No MTV 2 29 52.5Non - Remixing MTV 1 10 25.5
Remixing MTV 3 42 11.9
Ambient Air Temperature
Attempts to correlate ambient air temperature to cold spot formation were
unsuccessful. Ambient air temperature did not have an effect on the magnitude of the
observed cold spots. Ambient air temperature does control the rate at which the HMA
cools after leaving the paver and thus does control the amount of available time for
compaction. Using the thermal camera it was not possible to measure the rate of cooling
experienced by the pavement as it was compacted. Water from the rollers tended to cool
the surface and since surface temperature was what the thermal imaging camera
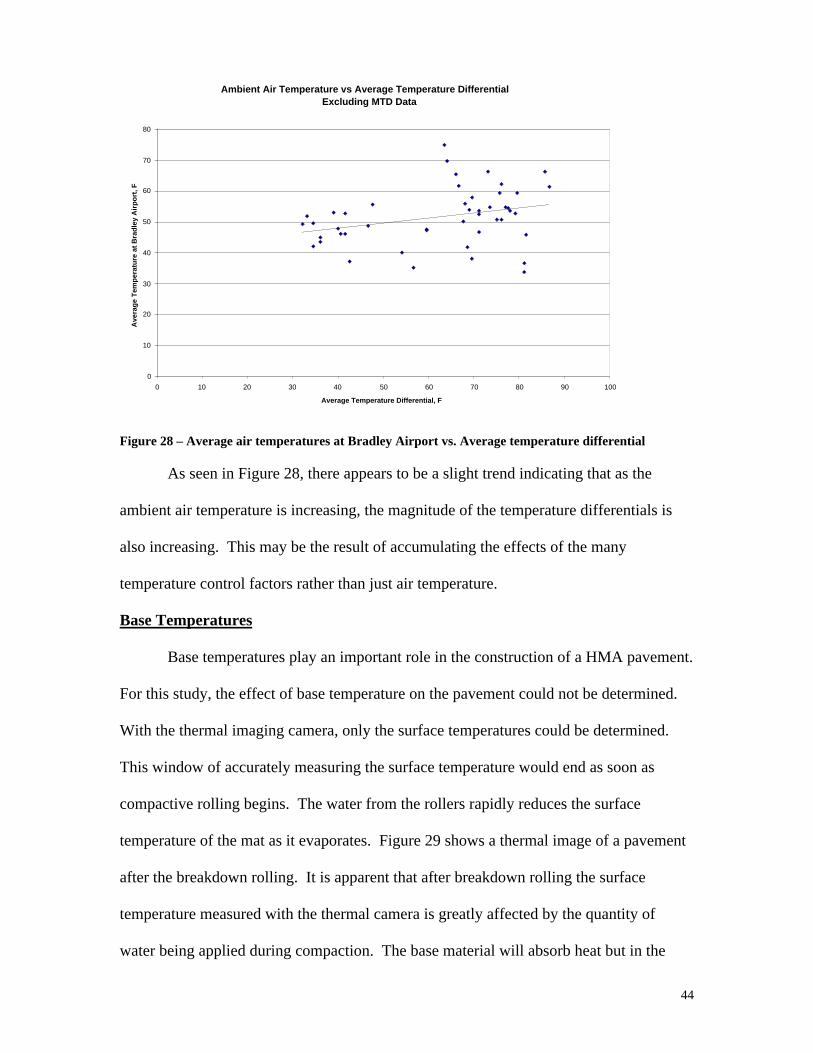
measures, it was not indicative of the internal mat temperature. Figure 28 shows a plot of
the average high and low temperature recorded at Bradley International Airport against
the average temperature differentials recorded for that date on the study.
44
Ambient Air Temperature vs Average Temperature DifferentialExcluding MTD Data
0
10
20
30
40
50
60
70
80
0 10 20 30 40 50 60 70 80 90 100
Average Temperature Differential, F
Ave
rag
e T
emp
erat
ure
at
Bra
dle
y A
irp
ort
, F
Figure 28 – Average air temperatures at Bradley Airport vs. Average temperature differential
As seen in Figure 28, there appears to be a slight trend indicating that as the
ambient air temperature is increasing, the magnitude of the temperature differentials is
also increasing. This may be the result of accumulating the effects of the many
temperature control factors rather than just air temperature.
Base Temperatures
Base temperatures play an important role in the construction of a HMA pavement.
For this study, the effect of base temperature on the pavement could not be determined.
With the thermal imaging camera, only the surface temperatures could be determined.
This window of accurately measuring the surface temperature would end as soon as
compactive rolling begins. The water from the rollers rapidly reduces the surface
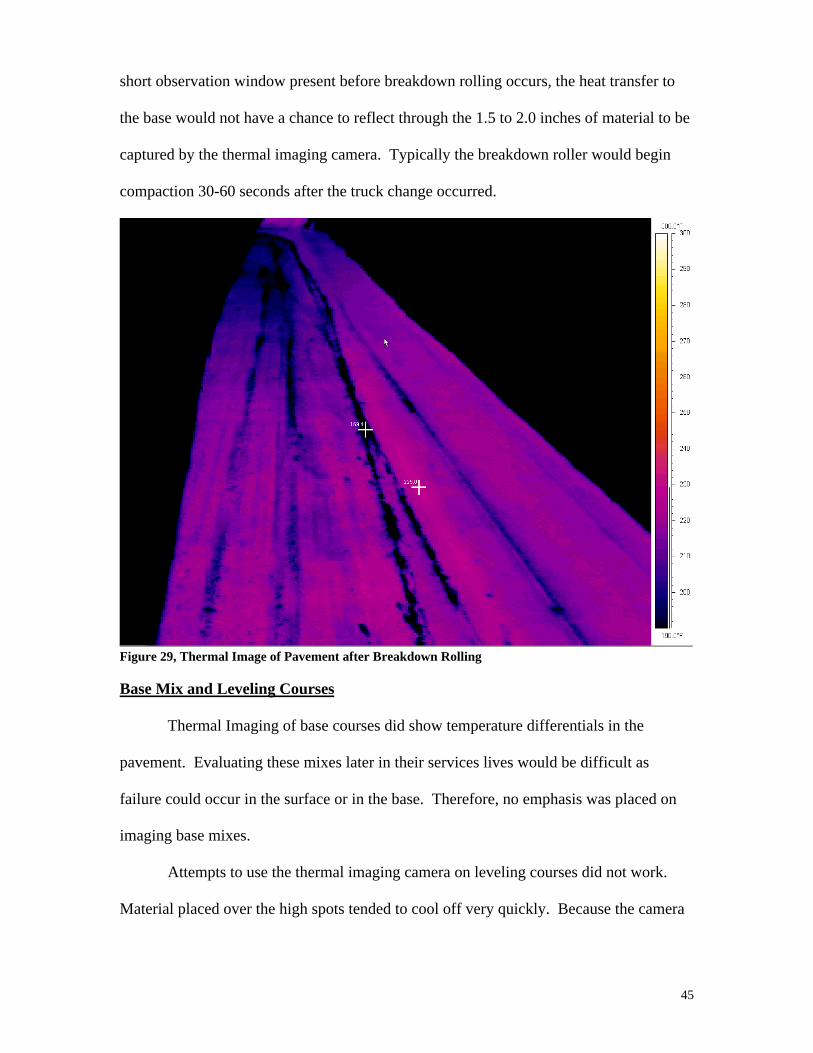
temperature of the mat as it evaporates. Figure 29 shows a thermal image of a pavement
after the breakdown rolling. It is apparent that after breakdown rolling the surface
temperature measured with the thermal camera is greatly affected by the quantity of
water being applied during compaction. The base material will absorb heat but in the
45
short observation window present before breakdown rolling occurs, the heat transfer to
the base would not have a chance to reflect through the 1.5 to 2.0 inches of material to be
captured by the thermal imaging camera. Typically the breakdown roller would begin
compaction 30-60 seconds after the truck change occurred.
Figure 29, Thermal Image of Pavement after Breakdown Rolling
Base Mix and Leveling Courses
Thermal Imaging of base courses did show temperature differentials in the
pavement. Evaluating these mixes later in their services lives would be difficult as
failure could occur in the surface or in the base. Therefore, no emphasis was placed on
imaging base mixes.
Attempts to use the thermal imaging camera on leveling courses did not work.
Material placed over the high spots tended to cool off very quickly. Because the camera
46
tended to reveal the thin spots in leveling course and not actual cold spots, no imaging
was performed on leveling courses.
Recycled Asphalt Pavement (RAP)
During this study, 10 days were observed using Superpave 12.5 mm mixes
containing RAP without a MTV in use. The average observed temperature differential
for mixes containing 10% RAP was 51.4°F. The average observed temperature
differential for 12.5 mm Superpave mixes with no RAP was 48.8°F. Given the limited
data for Superpave mixes containing RAP versus Superpave mixes containing no RAP, it
would appear that the RAP had very little influence on the magnitude of the temperature
differentials.
Lift Thickness 1.5 vs 2.0 Inches
The target compacted thickness of the HMA mat varied by project from 1.5
inches to 2.0 inches. Only one project varied the target compacted thickness from 1.5 to
2.0 inches. It is difficult to truly establish the effect of increasing the compacted
thickness with only one project varying the thickness within the project. The effect on
that particular project was to decrease the area of the cold spots.
The comparison of projects where the targeted thickness remained the same
requires some caution as the conditions between projects are not the same. The variation
of these conditions may have a larger influence on the magnitude of the observed
temperature differentials than the compacted thickness of the mat. For a compacted
target thickness of 1.5 inches 301 thermal images were taken and the average temperature
differential for all of these images was 48.6°F. For a target compacted thickness of 2.0
inches 400 thermal images were taken and the average temperature differential was
51.5°F. Data collected on days were a MTV was used was excluded from both averages.
47
Heated Bodies vs Non-Heated Bodies
The CAP Lab monitored 4 different sites to study the effects of heated bodies on
temperature differentials. The results of this data are not included in the overall averages
reported throughout the rest of the study. The magnitude of the temperature differences
were recorded for both heated and non heated bodies. The determination of whether or
not a haul unit was heated was not a trivial task. Ultimately, the only definitive method
for determining if the haul unit had a heated body (and if it was in use) was to ask the
driver. This assumes the information from the driver was correct. It also became clear
that there were different methods of running the truck’s exhaust through the body. The
efficiency of the various heating methods was unclear and beyond the scope of this study.
Observations were made of 73 loads of HMA being delivered. Of the 73 loads, it
was determined that 30 had heated bodies and 43 did not. The average temperature
differential for loads with heated bodies was 39.2°F and for non-heated bodies was
44.53°F. There were no apparent differences observed in the size of shape of the cold
spots between loads placed from heated and non-heated haul unit bodies. This data was
collected in June so that these differences may or may not be different during the cold
weather months.
Measurements of the temperature of the skin of the trucks also showed some
differences between heated and non-heated bodies. The average of the highest
temperatures observed on the outside of the trucks for 4 loads was 187.0°F for heated
bodies and 161.3°F for 11 loads with non-heated bodies. This would indicate that the
heating of the haul unit body with the truck’s exhaust does increase the body temperature
somewhat.
48
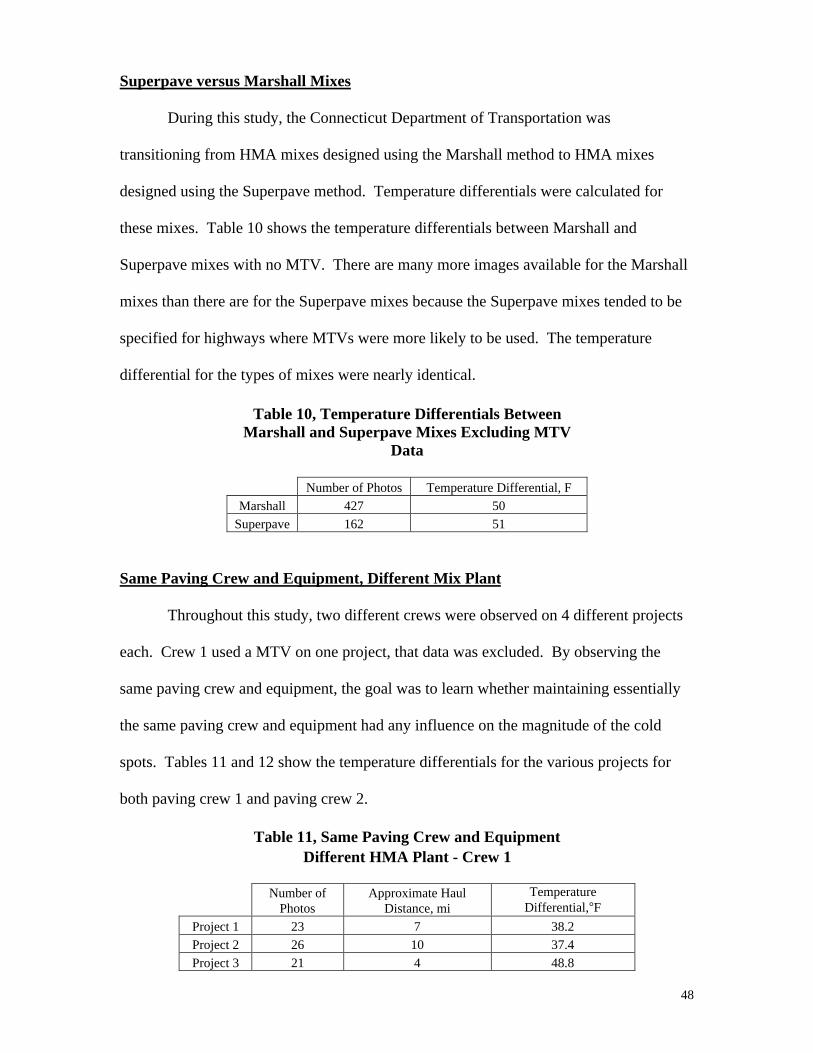
Superpave versus Marshall Mixes
During this study, the Connecticut Department of Transportation was
transitioning from HMA mixes designed using the Marshall method to HMA mixes
designed using the Superpave method. Temperature differentials were calculated for
these mixes. Table 10 shows the temperature differentials between Marshall and
Superpave mixes with no MTV. There are many more images available for the Marshall
mixes than there are for the Superpave mixes because the Superpave mixes tended to be
specified for highways where MTVs were more likely to be used. The temperature
differential for the types of mixes were nearly identical.
Table 10, Temperature Differentials BetweenMarshall and Superpave Mixes Excluding MTV
Data
Number of Photos Temperature Differential, FMarshall 427 50
Superpave 162 51
Same Paving Crew and Equipment, Different Mix Plant
Throughout this study, two different crews were observed on 4 different projects
each. Crew 1 used a MTV on one project, that data was excluded. By observing the
same paving crew and equipment, the goal was to learn whether maintaining essentially
the same paving crew and equipment had any influence on the magnitude of the cold
spots. Tables 11 and 12 show the temperature differentials for the various projects for
both paving crew 1 and paving crew 2.
Table 11, Same Paving Crew and EquipmentDifferent HMA Plant - Crew 1
Number ofPhotos
Approximate HaulDistance, mi
TemperatureDifferential,°F
Project 1 23 7 38.2Project 2 26 10 37.4Project 3 21 4 48.8
49
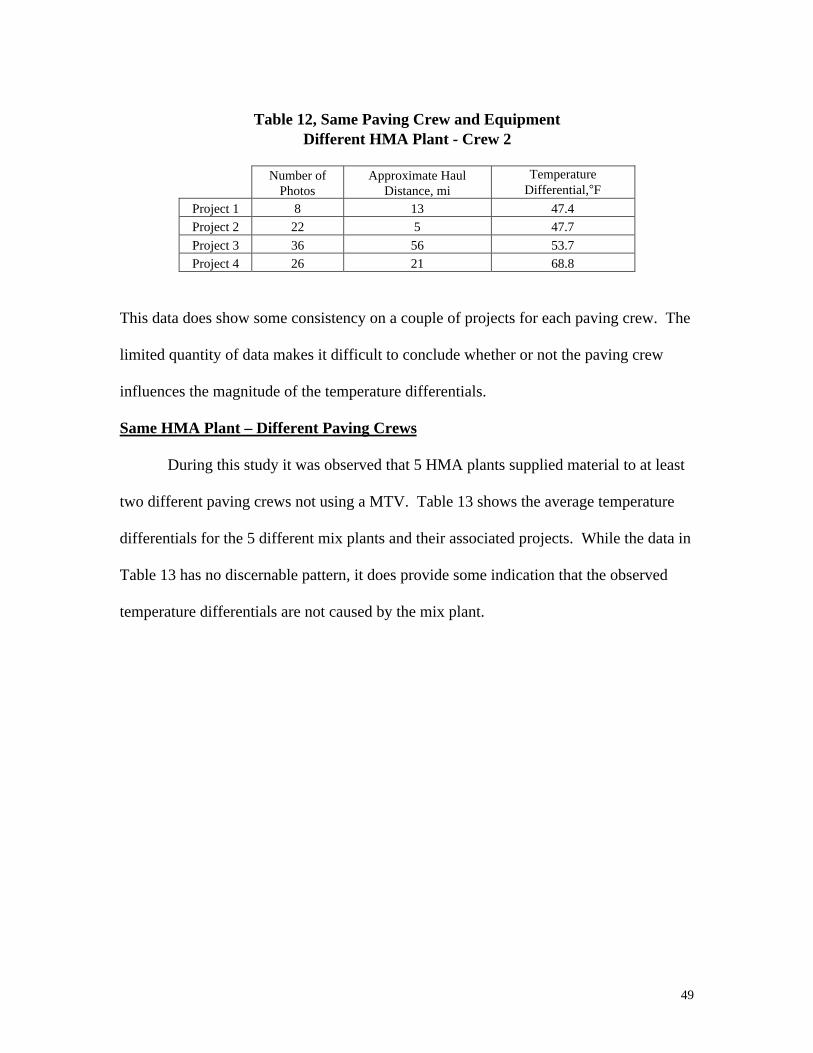
Table 12, Same Paving Crew and EquipmentDifferent HMA Plant - Crew 2
Number ofPhotos
Approximate HaulDistance, mi
TemperatureDifferential,°F
Project 1 8 13 47.4Project 2 22 5 47.7
Project 3 36 56 53.7Project 4 26 21 68.8
This data does show some consistency on a couple of projects for each paving crew. The
limited quantity of data makes it difficult to conclude whether or not the paving crew
influences the magnitude of the temperature differentials.
Same HMA Plant – Different Paving Crews
During this study it was observed that 5 HMA plants supplied material to at least
two different paving crews not using a MTV. Table 13 shows the average temperature
differentials for the 5 different mix plants and their associated projects. While the data in
Table 13 has no discernable pattern, it does provide some indication that the observed
temperature differentials are not caused by the mix plant.

50
Table 13, Same Mix Plant Different Paving CrewExcluding MTV Data
Number Approximate Haul Temperature
Plant 1 of Photos Distance, mi Differential, °F
Project 1 56 16 60.4Project 2 48 15 40.9Project 3 8 12 47.4
Plant 2
Project 1 22 5 47.7Project 2 13 15 54.5
Plant 3
Project 1 12 16 56.1Project 2 27 43 53.6
Plant 4
Project 1 15 10 52.9Project 2 24 10 42.1Project 3 23 7 38.2
Plant 5
Project 1 21 4 48.3Project 2 31 5 47.3
Same Project – Two Paving Crews – Two HMA Plants – Same Day
One monitored project used material from two different mix plants, two different
paving crews placing all of the material in a single day. This project occurred in the
beginning of November on an extremely cold day for the time of year. Table 14
summarizes the data for that project. These observed temperature differentials are below
the average end dump temperature differentials of 50.2°F for the entire study. The data
in the table shows that the southern paving crew using the mix hauled slightly farther
than the northern crew had an average temperature differential difference that was six
degrees lower than the northern crew under essentially the same environmental
conditions.

51
Table 14, Same Project, 2 HMA Plants2 Paving Crews – Same Day - No MTV
Numberof Photos
Approximate HaulDistance, mi
TemperatureDifferential, °F
North Crew 21 4 48.3South Crew 24 10 42.1
Same Project, Same Equipment – Different Paver Operators
One paving project changed paver operators. Everything else remained the same.
The magnitude of the temperature differentials for the original paver operator was 53.5°F
with a relative density difference of 4.9 pcf. The new paver operator had temperature
differentials of 59.5°F and a relative density difference of 5.1 pcf. This very limited
information may indicate that the paver operator may have an influence on the formation
of cold spots. This may be due to the level of material remaining in the paver hopper at
the time of truck changes. As the research team was not permitted on the equipment, it
was difficult to estimate the amount of material remaining in the paver hopper during
truck changes without interfering with the standard truck change procedure.
Pavement Distress – Same HMA Plant, Same Paving Crew, 2 Different Projects
Figure 30 shows a thermal image taken on a roadway that exhibited highly visible
segregation at the time of placement. Figure 31 is a visible image of that same spot
approximately one year later. Figure 31 is showing some signs of early distress.
52
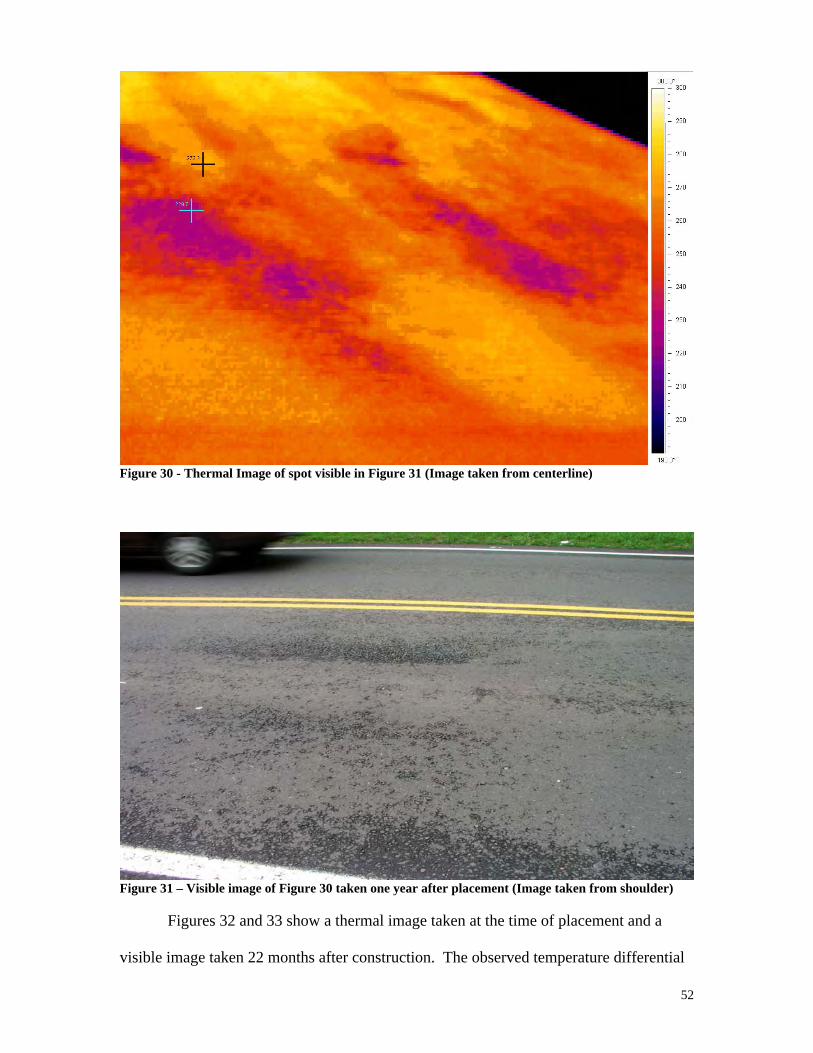
Figure 30 - Thermal Image of spot visible in Figure 31 (Image taken from centerline)
Figure 31 – Visible image of Figure 30 taken one year after placement (Image taken from shoulder)
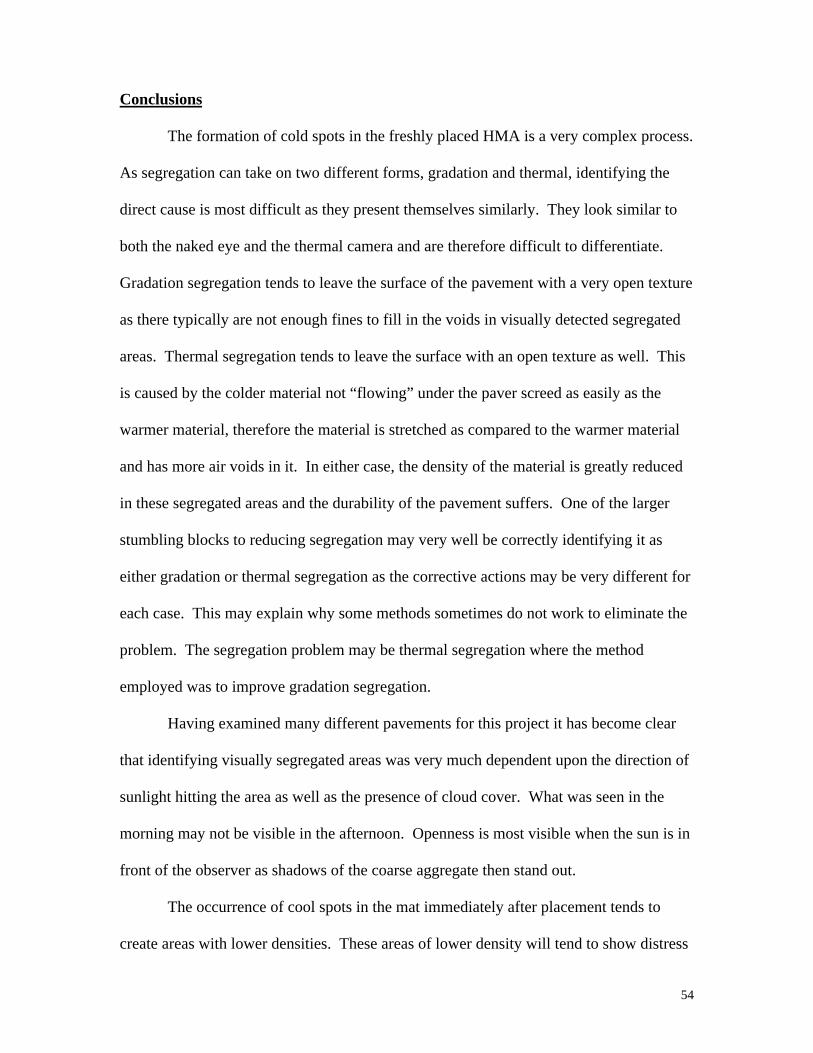
Figures 32 and 33 show a thermal image taken at the time of placement and a
visible image taken 22 months after construction. The observed temperature differential
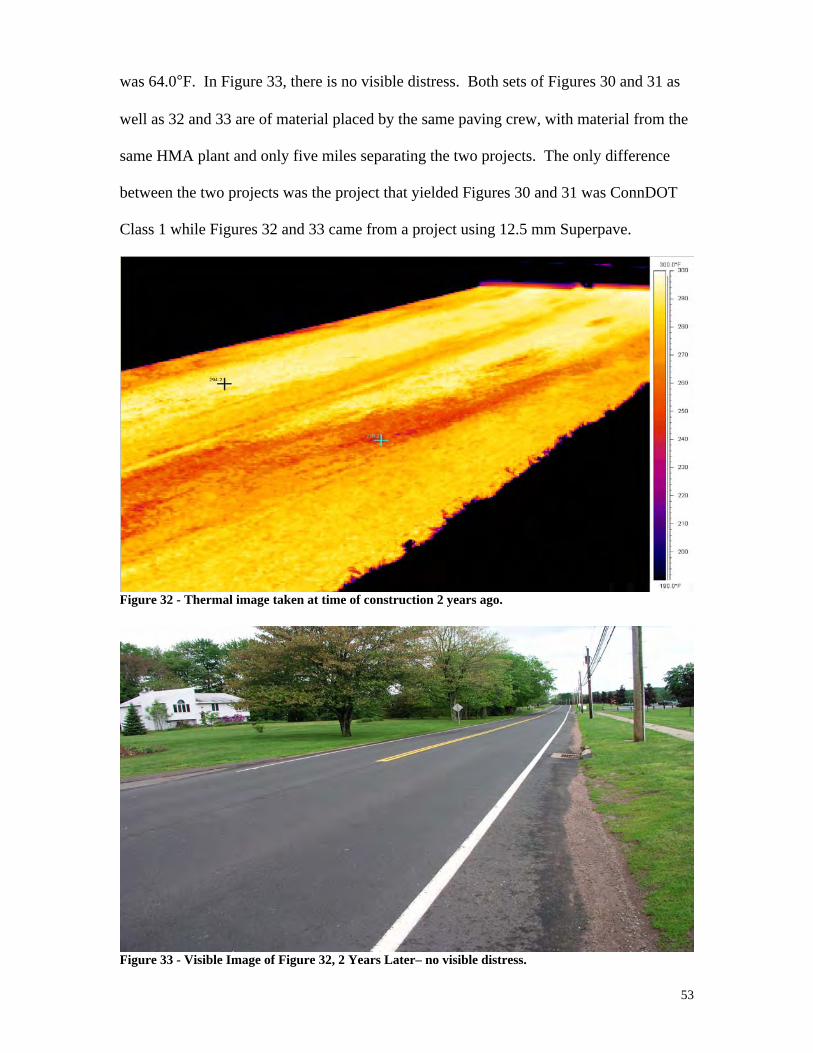
53
was 64.0°F. In Figure 33, there is no visible distress. Both sets of Figures 30 and 31 as
well as 32 and 33 are of material placed by the same paving crew, with material from the
same HMA plant and only five miles separating the two projects. The only difference
between the two projects was the project that yielded Figures 30 and 31 was ConnDOT
Class 1 while Figures 32 and 33 came from a project using 12.5 mm Superpave.
Figure 32 - Thermal image taken at time of construction 2 years ago.
Figure 33 - Visible Image of Figure 32, 2 Years Later– no visible distress.
54
Conclusions
The formation of cold spots in the freshly placed HMA is a very complex process.
As segregation can take on two different forms, gradation and thermal, identifying the
direct cause is most difficult as they present themselves similarly. They look similar to
both the naked eye and the thermal camera and are therefore difficult to differentiate.
Gradation segregation tends to leave the surface of the pavement with a very open texture
as there typically are not enough fines to fill in the voids in visually detected segregated
areas. Thermal segregation tends to leave the surface with an open texture as well. This
is caused by the colder material not “flowing” under the paver screed as easily as the
warmer material, therefore the material is stretched as compared to the warmer material
and has more air voids in it. In either case, the density of the material is greatly reduced
in these segregated areas and the durability of the pavement suffers. One of the larger
stumbling blocks to reducing segregation may very well be correctly identifying it as
either gradation or thermal segregation as the corrective actions may be very different for
each case. This may explain why some methods sometimes do not work to eliminate the
problem. The segregation problem may be thermal segregation where the method
employed was to improve gradation segregation.
Having examined many different pavements for this project it has become clear
that identifying visually segregated areas was very much dependent upon the direction of
sunlight hitting the area as well as the presence of cloud cover. What was seen in the
morning may not be visible in the afternoon. Openness is most visible when the sun is in
front of the observer as shadows of the coarse aggregate then stand out.
The occurrence of cool spots in the mat immediately after placement tends to
create areas with lower densities. These areas of lower density will tend to show distress
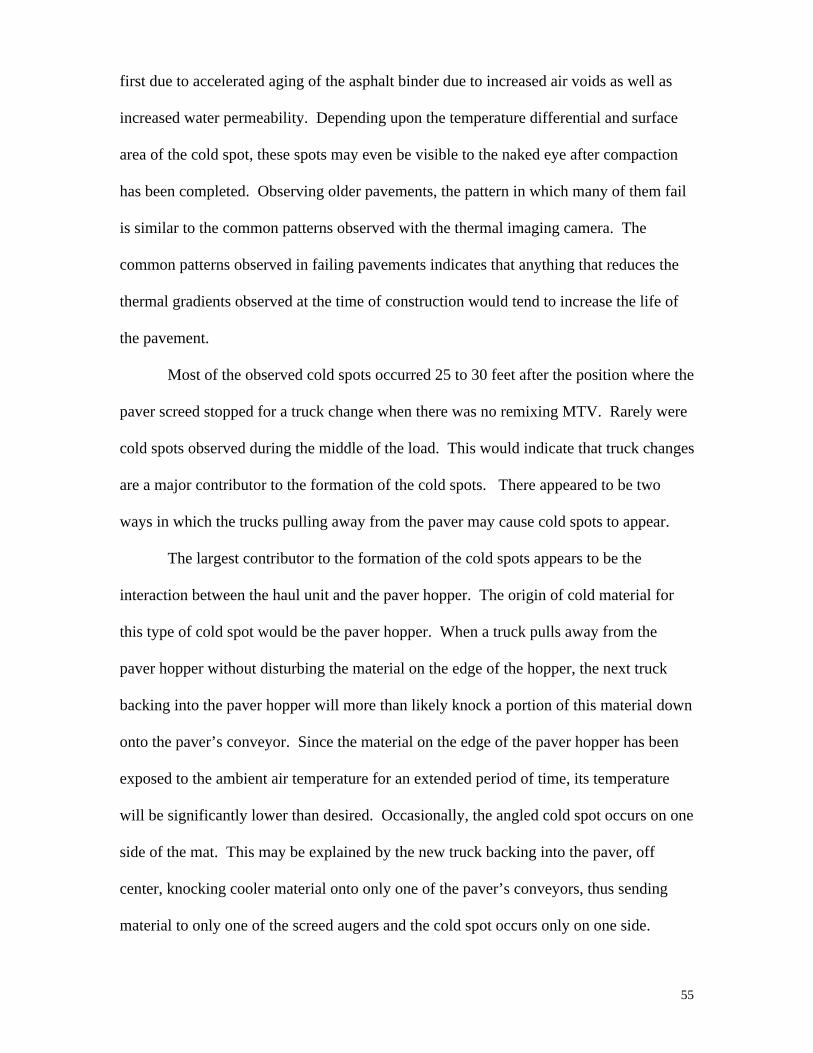
55
first due to accelerated aging of the asphalt binder due to increased air voids as well as
increased water permeability. Depending upon the temperature differential and surface
area of the cold spot, these spots may even be visible to the naked eye after compaction
has been completed. Observing older pavements, the pattern in which many of them fail
is similar to the common patterns observed with the thermal imaging camera. The
common patterns observed in failing pavements indicates that anything that reduces the
thermal gradients observed at the time of construction would tend to increase the life of
the pavement.
Most of the observed cold spots occurred 25 to 30 feet after the position where the
paver screed stopped for a truck change when there was no remixing MTV. Rarely were
cold spots observed during the middle of the load. This would indicate that truck changes
are a major contributor to the formation of the cold spots. There appeared to be two
ways in which the trucks pulling away from the paver may cause cold spots to appear.
The largest contributor to the formation of the cold spots appears to be the
interaction between the haul unit and the paver hopper. The origin of cold material for
this type of cold spot would be the paver hopper. When a truck pulls away from the
paver hopper without disturbing the material on the edge of the hopper, the next truck
backing into the paver hopper will more than likely knock a portion of this material down
onto the paver’s conveyor. Since the material on the edge of the paver hopper has been
exposed to the ambient air temperature for an extended period of time, its temperature
will be significantly lower than desired. Occasionally, the angled cold spot occurs on one
side of the mat. This may be explained by the new truck backing into the paver, off
center, knocking cooler material onto only one of the paver’s conveyors, thus sending
material to only one of the screed augers and the cold spot occurs only on one side.
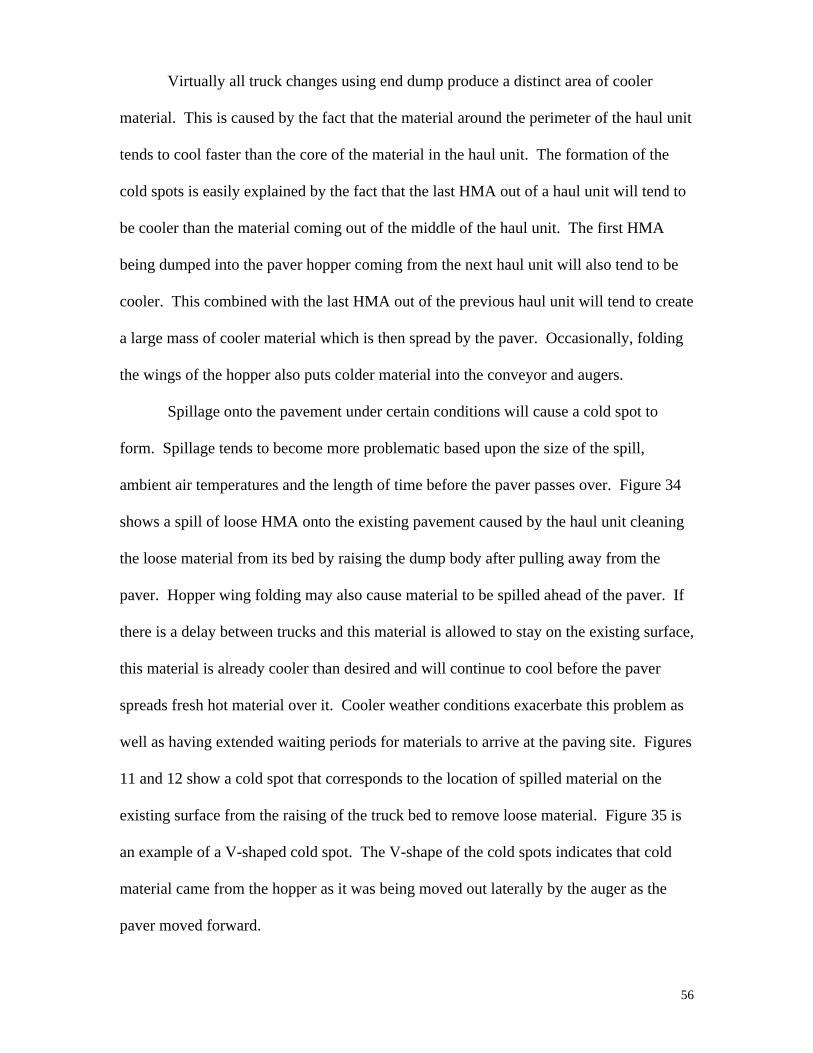
56
Virtually all truck changes using end dump produce a distinct area of cooler
material. This is caused by the fact that the material around the perimeter of the haul unit
tends to cool faster than the core of the material in the haul unit. The formation of the
cold spots is easily explained by the fact that the last HMA out of a haul unit will tend to
be cooler than the material coming out of the middle of the haul unit. The first HMA
being dumped into the paver hopper coming from the next haul unit will also tend to be
cooler. This combined with the last HMA out of the previous haul unit will tend to create
a large mass of cooler material which is then spread by the paver. Occasionally, folding
the wings of the hopper also puts colder material into the conveyor and augers.
Spillage onto the pavement under certain conditions will cause a cold spot to
form. Spillage tends to become more problematic based upon the size of the spill,
ambient air temperatures and the length of time before the paver passes over. Figure 34
shows a spill of loose HMA onto the existing pavement caused by the haul unit cleaning
the loose material from its bed by raising the dump body after pulling away from the
paver. Hopper wing folding may also cause material to be spilled ahead of the paver. If
there is a delay between trucks and this material is allowed to stay on the existing surface,
this material is already cooler than desired and will continue to cool before the paver
spreads fresh hot material over it. Cooler weather conditions exacerbate this problem as
well as having extended waiting periods for materials to arrive at the paving site. Figures
11 and 12 show a cold spot that corresponds to the location of spilled material on the
existing surface from the raising of the truck bed to remove loose material. Figure 35 is
an example of a V-shaped cold spot. The V-shape of the cold spots indicates that cold
material came from the hopper as it was being moved out laterally by the auger as the
paver moved forward.
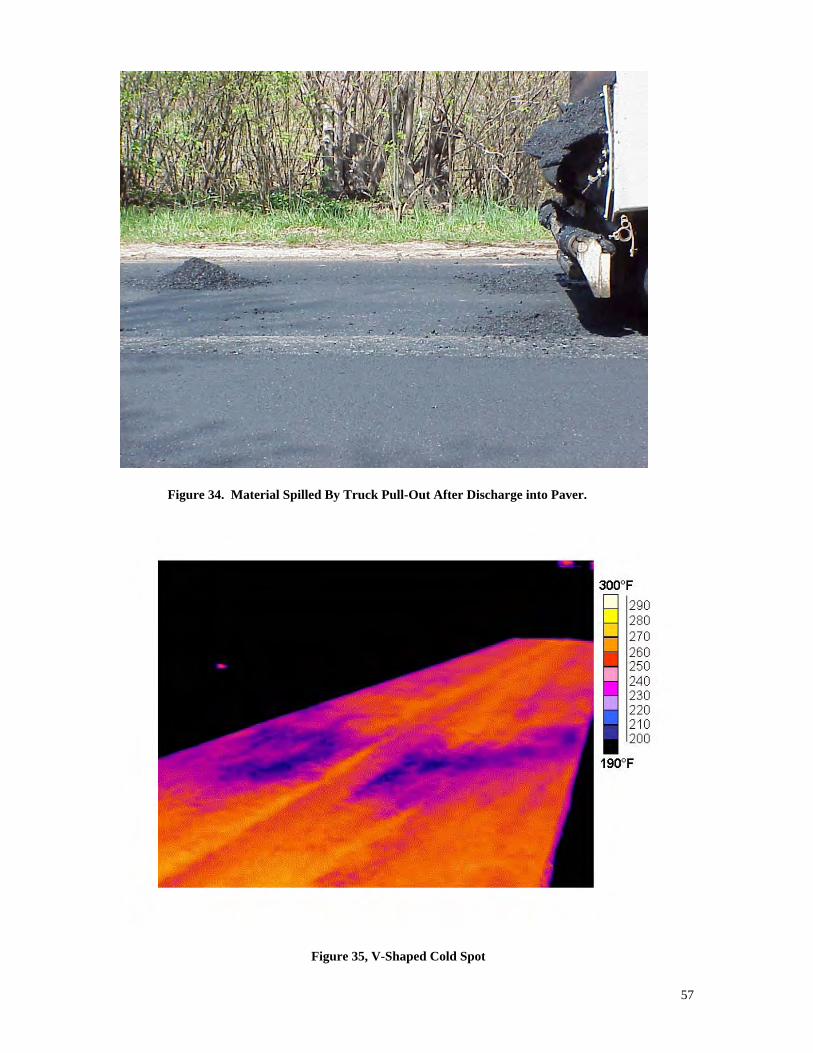
57
Figure 34. Material Spilled By Truck Pull-Out After Discharge into Paver.
Figure 35, V-Shaped Cold Spot
58
The exact location of the cold spot in relation to the point where the paver stopped
for a truck change varied depending how far the paver traveled without material being
dumped into the hopper. The further the paver traveled without material being dumped
into the hopper, the closer to the stop point the cold spot would occur. The location of
the cold spot did not effect the magnitude of the temperature differences observed.
The use of a MTV greatly reduces the size and magnitude of the cold spots. This
became very evident on monitored projects where a MTV was only used for a small
portion of the project with no other changes to the equipment on the project. The only
difference in the paver when a MTV is employed is the paver hopper insert. The rest of
the paver is unchanged so therefore the material that forms the cold spots must originate
from the standard paver hopper without the insert or the haul unit itself. It can also be
concluded that the operation of the slat conveyors and screed augers do not significantly
contribute to the formation of cold spots as these did not change when a MTV was used.
The remixing MTVs virtually eliminated all of the cold spots normally observed.
The remixing action produced a virtually homogeneous temperature profile in the placed
mat. The remixing MTVs also eliminated the visual segregation on two projects where
visual segregation was distinct before a remixing MTV was employed. Over the course
of this study, no projects were monitored where visual segregation was occurring and a
non-remixing MTV was used for a portion of the project. Therefore, it is not possible to
draw conclusions as to their effectiveness at reducing visually segregated areas. It was
demonstrated that non-remixing MTVs do reduce thermal segregation.
Observations of pavement being placed on bridge decks were not made. Most of
the paving projects observed did not have any bridge decks or if they did, they were not
being resurfaced during the mainline paving operations.
59
The use of RAP in the pavement did not contribute to the temperature
differentials observed in our projects. The temperature differentials observed for mixes
that did or did not contain RAP was virtually identical. The use of RAP did not appear to
have any influence on areas with visually segregated areas.
The paving crew may have a slight influence on the magnitude of the temperature
differentials. But as was consistently demonstrated throughout the study, no paving crew
can greatly reduce the magnitude of the cold spots without the use of a MTV.
The collection of data from night paving projects that did not use a MTV was
very limited. From this limited data, it appears that night paving without a MTV does not
influence the magnitude of the temperature differentials coming out from the paver.
Night paving still requires added vigilance as the material will cool off quicker after it
has been placed. Extra care must also be used to identify segregation during night paving
operations as it is harder to identify them under reduced lighting.
There is no correlation between ambient air temperatures and temperature
differentials observed as the material leaves the paver. Like night paving, additional care
must be used when paving during less desirable conditions as the material in general will
tend to cool off quicker.
The folding of paver hopper wings at frequent, regular intervals after each load
does not contribute to the formation of cold spots in the pavement. When the paver
hopper wings are folded infrequently, colder material from the wings is then incorporated
into the mat forming a large cold spot and decreasing the density in that specific area.
See Figures 2 and 3.
Segregation both thermal and gradation has many factors that can influence it.
Throughout this study, it became clear that controlling these factors to isolate a single
60
variable would be next to impossible. As much as possible, every attempt was made to
isolate as many variables as possible.
Recommendations
Segregation, both gradation and thermal, greatly reduces the lifespan of the
pavement. There are several things that can reduce the impact of thermal and gradation
segregation. Remixing MTVs greatly reduce if not eliminate both types of segregation.
The remixing that occurs in the machine homogenizes both the gradation and temperature
of the material. This remixing tends to produce a mat with a uniform temperature profile
along with a uniform surface texture. Some of the non-remixing MTVs have an option
that allows for remixing in the paver hopper. While this option was never observed in
use during this study, its use would be highly recommended based upon the results
observed with the remixing MTVs. Even without the remixing paver hopper insert, non-
remixing MTVs do greatly reduce thermal segregation. The use of MTVs should be
encouraged.
Removing spilled HMA from the roadway prior to passing over the spillage with
the paver will also help to reduce thermal segregation. This becomes especially
important for spills of material containing more than one or two shovelfuls that will be
on the roadway for an extended period of time prior to being covered with fresh material.
The ambient air temperature and wind speed will also tend to cool any spilled material
much quicker making removing the spillage more important on cool and windy days.
Also, the cleaning of haul units should be performed in a designated area not in the area
to be paved. Material cleaned out of the haul units in front of the paver acts like spillage
and can create cold spots.
When using haul units that will be required to dump directly into the paver hopper
the haul distance should be kept as short as possible. The results of this study indicate
61
that while the haul distance does increase the size of the cold areas compared to those
projects with a shorter haul distance. The monitored project with the greatest haul
distance utilized a non-remixing MTV. The use of a non-remixing MTV did mitigate the
effects of the long haul and produced a temperature profile similar to projects with much
shorter haul distances.
Folding of the paver hopper wings should either be performed frequently such as
after each load or not at all during the day’s production. If the hopper wings are folded
frequently, the flaps on the front of the paver hopper should be in good condition to
reduce spillage out the front of the hopper when the wings are folded. When folding the
hopper wings, attention should be paid to the quantity of material present in the hopper.
If there is too little material in the hopper, the cooler material from the hopper wings will
strongly influence the thermal profile of the pavement. If the paver hopper is too full,
then the material from the hopper wings will over flow out the front of the paver hopper.
It is important to also maintain the level of material in the paver hopper to cover the
conveyors and permit a uniform flow of material to enter the paver tunnel at the flow
gates.
While night paving and cold weather did not produce large temperature
differentials, additional care must still be used when paving in these conditions. The
effects of night paving and cold weather paving could not be observed in this study as the
infra-red camera only measures the surface temperature of the pavement. The surface
temperature of the pavement is only indicative of the pavement’s temperature before
rolling commences as water from the rollers will produce a false temperature reading for
the surface of the pavement.
The use of heated bodies on the haul units did reduce the magnitude of the
observed temperature differentials by approximately 5°F. While this use of heated bodies
62
does not resolve the problem of thermal segregation, it does help to reduce the problem.
Additional study of the different types of heating systems for the haul units should be
undertaken using the thermal camera to determine their effectiveness.
The thermal imaging camera is an excellent tool for identifying areas of freshly
placed HMA pavements that may have segregation problems. The camera readily
identifies areas with temperature differentials. Density testing should be performed in
these low temperature areas with a nuclear density gauge to identify the reduction in the
density in these areas. Additional research work should be performed to identify a
procedure for testing areas with low temperatures during construction as some state
Departments of Transportation have instituted maximum allowable temperature
differentials in an attempt to minimize thermal segregation problems. Other states are
attempting to implement a procedure to perform density testing profiles through cold spot
areas.
Two monitored sites for this study had serious visible segregation when the end
dump method for material transfer was used. In the middle of paving these projects, a
remixing MTV was used for several days of placement thereby eliminating the visible
segregation when the MTV was in use. Studying these projects further as they age would
help to establish how much additional life span, if any, could be expected with the use of
a remixing MTV. One monitored project for this study did use a non-remixing MTV for
one day of production. This project could also be monitored for the life expectancy
differences between portions constructed with the non-remixing MTV and the portions
constructed with the haul units dumping directly into the paver hopper.
Throughout this study GPS coordinates were obtained at the location where each
thermal image was taken. The GPS coordinates provide location references in order to
allow further study of these pavements as they age. It is recommended that an additional

63
study be conducted in approximately 5 years to document the condition of the pavements
5-7 years after they were constructed. This additional study would help to document how
the recorded temperature differentials at the time of construction have impacted the
service life of the pavement. This may be practical only where pavements can be
assessed without the need for traffic protection.
64
References
Mahoney, J., Pierce, L., Uhlmeyer, J., Moore, R., Muench, S., Read, S., and H. Jakob.“Identification and Assessment of Construction-Related Asphalt Concrete PavementTemperature Differentials”, Presented to Transportation Research Board, 2000.
Stroup-Gardiner, M., and E.R. Brown. “Segregation in Hot-Mix Asphalt Pavements”,NCHRP Report 441, National Research Council, 2000.
Chang, C., Wolff, T., and G. Baladi. “Detecting Segregation in Bituminous Pavementsand Relating Its Effects to Condition”, Presented to Transportation Research Board,2000.
Henault, J. “Development of Guidelines for Reduction of Temperature DifferentialDamage (TDD) for Hot Mix Asphalt Pavement Projects in Connecticut”, ConstructionReport No. 2222-1-99-5, Connecticut Department of Transportation, November 1999.
Willoughby, K. A., Mahoney, J., Pierce, L. M., Uhlmeyer, J. S., Anderson, K., Read, S.,Muench, S., Thompson, T. and R. Moore. “Construction-Related Asphalt ConcretePavement Temperature Differentials and Corresponding Density Differentials”, ReportNumber WA-RD 476.1, Washington State Transportation Center, June 2001.
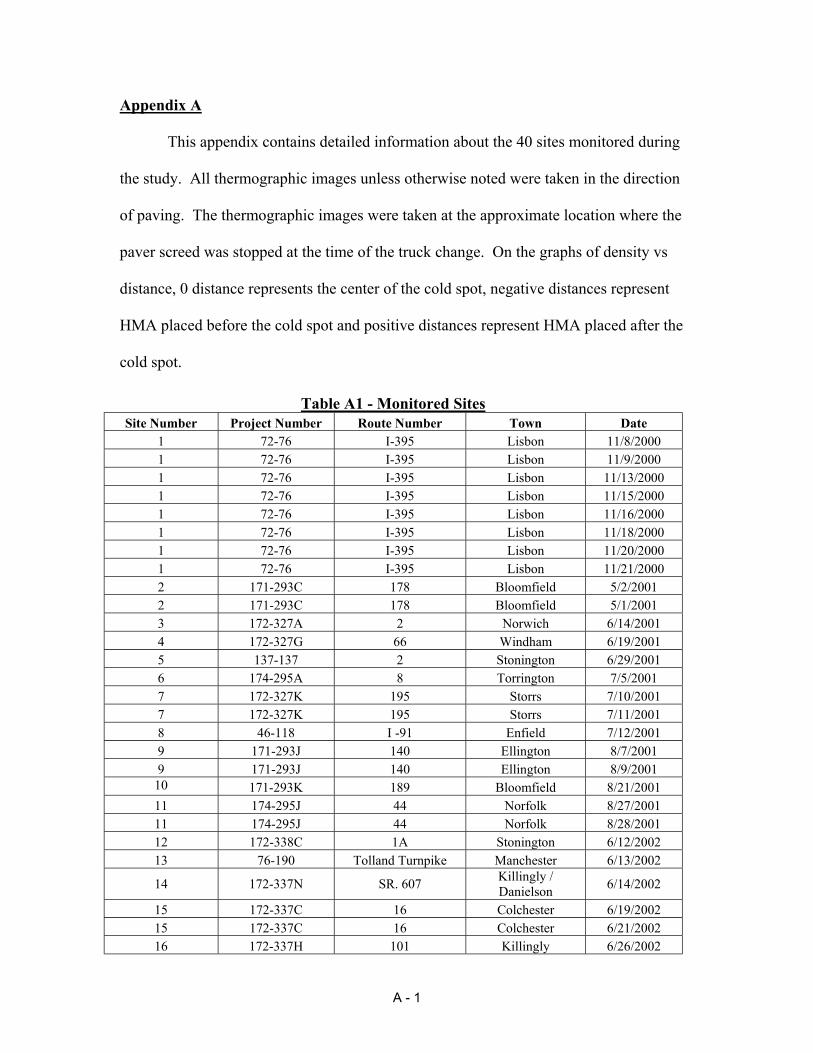
Appendix A
This appendix contains detailed information about the 40 sites monitored during
the study. All thermographic images unless otherwise noted were taken in the direction
of paving. The thermographic images were taken at the approximate location where the
paver screed was stopped at the time of the truck change. On the graphs of density vs
distance, 0 distance represents the center of the cold spot, negative distances represent
HMA placed before the cold spot and positive distances represent HMA placed after the
cold spot.
Table A1 - Monitored Sites Site Number Project Number Route Number Town Date
1 72-76 I-395 Lisbon 11/8/2000 1 72-76 I-395 Lisbon 11/9/2000 1 72-76 I-395 Lisbon 11/13/2000 1 72-76 I-395 Lisbon 11/15/2000 1 72-76 I-395 Lisbon 11/16/2000 1 72-76 I-395 Lisbon 11/18/2000 1 72-76 I-395 Lisbon 11/20/2000 1 72-76 I-395 Lisbon 11/21/2000 2 171-293C 178 Bloomfield 5/2/2001 2 171-293C 178 Bloomfield 5/1/2001 3 172-327A 2 Norwich 6/14/2001 4 172-327G 66 Windham 6/19/2001 5 137-137 2 Stonington 6/29/2001 6 174-295A 8 Torrington 7/5/2001 7 172-327K 195 Storrs 7/10/2001 7 172-327K 195 Storrs 7/11/2001 8 46-118 I -91 Enfield 7/12/2001 9 171-293J 140 Ellington 8/7/2001 9 171-293J 140 Ellington 8/9/2001
10 171-293K 189 Bloomfield 8/21/2001 11 174-295J 44 Norfolk 8/27/2001 11 174-295J 44 Norfolk 8/28/2001 12 172-338C 1A Stonington 6/12/2002 13 76-190 Tolland Turnpike Manchester 6/13/2002
14 172-337N SR. 607 Killingly / Danielson 6/14/2002
15 172-337C 16 Colchester 6/19/2002 15 172-337C 16 Colchester 6/21/2002 16 172-337H 101 Killingly 6/26/2002
A - 1
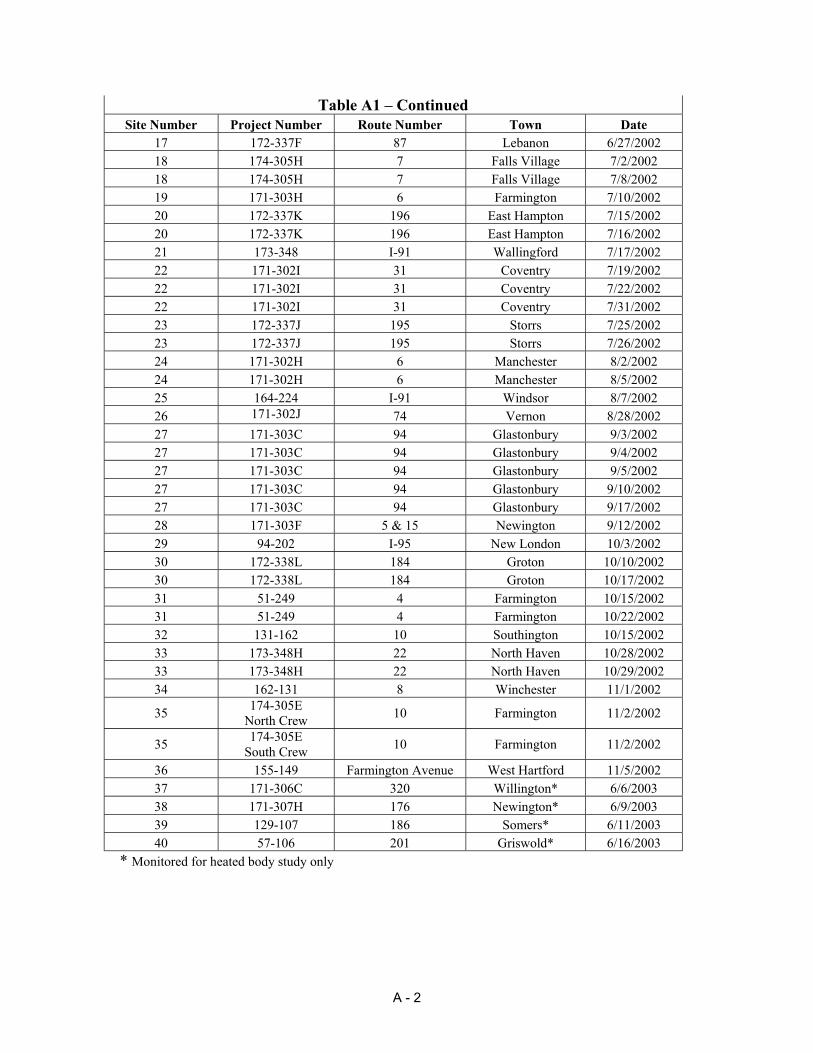
Table A1 – Continued Site Number Project Number Route Number Town Date
17 172-337F 87 Lebanon 6/27/2002 18 174-305H 7 Falls Village 7/2/2002 18 174-305H 7 Falls Village 7/8/2002 19 171-303H 6 Farmington 7/10/2002 20 172-337K 196 East Hampton 7/15/2002 20 172-337K 196 East Hampton 7/16/2002 21 173-348 I-91 Wallingford 7/17/2002 22 171-302I 31 Coventry 7/19/2002 22 171-302I 31 Coventry 7/22/2002 22 171-302I 31 Coventry 7/31/2002 23 172-337J 195 Storrs 7/25/2002 23 172-337J 195 Storrs 7/26/2002 24 171-302H 6 Manchester 8/2/2002 24 171-302H 6 Manchester 8/5/2002 25 164-224 I-91 Windsor 8/7/2002 26 171-302J 74 Vernon 8/28/2002 27 171-303C 94 Glastonbury 9/3/2002 27 171-303C 94 Glastonbury 9/4/2002 27 171-303C 94 Glastonbury 9/5/2002 27 171-303C 94 Glastonbury 9/10/2002 27 171-303C 94 Glastonbury 9/17/2002 28 171-303F 5 & 15 Newington 9/12/2002 29 94-202 I-95 New London 10/3/2002 30 172-338L 184 Groton 10/10/2002 30 172-338L 184 Groton 10/17/2002 31 51-249 4 Farmington 10/15/2002 31 51-249 4 Farmington 10/22/2002 32 131-162 10 Southington 10/15/2002 33 173-348H 22 North Haven 10/28/2002 33 173-348H 22 North Haven 10/29/2002 34 162-131 8 Winchester 11/1/2002
35 174-305E North Crew 10 Farmington 11/2/2002
35 174-305E South Crew 10 Farmington 11/2/2002
36 155-149 Farmington Avenue West Hartford 11/5/2002 37 171-306C 320 Willington* 6/6/2003 38 171-307H 176 Newington* 6/9/2003 39 129-107 186 Somers* 6/11/2003 40 57-106 201 Griswold* 6/16/2003
* Monitored for heated body study only
A - 2
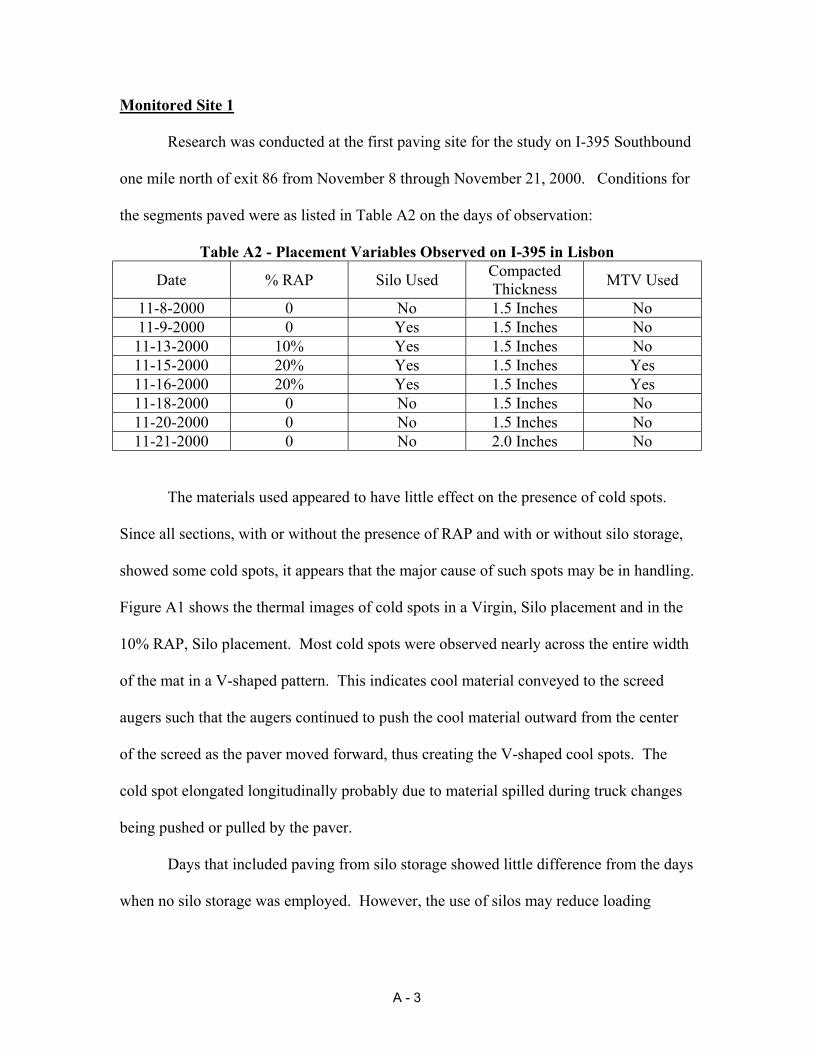
Monitored Site 1
Research was conducted at the first paving site for the study on I-395 Southbound
one mile north of exit 86 from November 8 through November 21, 2000. Conditions for
the segments paved were as listed in Table A2 on the days of observation:
Table A2 - Placement Variables Observed on I-395 in Lisbon
Date % RAP Silo Used Compacted Thickness MTV Used
11-8-2000 0 No 1.5 Inches No 11-9-2000 0 Yes 1.5 Inches No 11-13-2000 10% Yes 1.5 Inches No 11-15-2000 20% Yes 1.5 Inches Yes 11-16-2000 20% Yes 1.5 Inches Yes 11-18-2000 0 No 1.5 Inches No 11-20-2000 0 No 1.5 Inches No 11-21-2000 0 No 2.0 Inches No
The materials used appeared to have little effect on the presence of cold spots.
Since all sections, with or without the presence of RAP and with or without silo storage,
showed some cold spots, it appears that the major cause of such spots may be in handling.
Figure A1 shows the thermal images of cold spots in a Virgin, Silo placement and in the
10% RAP, Silo placement. Most cold spots were observed nearly across the entire width
of the mat in a V-shaped pattern. This indicates cool material conveyed to the screed
augers such that the augers continued to push the cool material outward from the center
of the screed as the paver moved forward, thus creating the V-shaped cool spots. The
cold spot elongated longitudinally probably due to material spilled during truck changes
being pushed or pulled by the paver.
Days that included paving from silo storage showed little difference from the days
when no silo storage was employed. However, the use of silos may reduce loading
A - 3
delays between trucks Figure A2 shows images of cold spots in a Virgin, No Silo
placement and in Virgin, Silo placement.
The thickness of the asphalt lift was altered on the last day of paving. The lift
thickness was increased from 1.5 inches to 2.0 inches, and the mix was kept constant as
Virgin, No Silo. The major difference in the two cases was the significantly decreased
visibility of cold spots (visibly segregated patches) on the surface when the 2-inch lift
was paved. In the 1.5-inch section, cold spots were easily identified since they were
visible to the human eye on the surface of the freshly placed pavement where the front of
the paver had been stopped during truck changes. These cold spots were either barely or
no longer visible to the human eye on the 2-inch lift; however, significant cold spots were
visible in the thermal infrared images. Figure 3 illustrates the images of cold spots in
both a 1.5-inch and 2.0-inch lift section. Cold spots observed in the 2.0-inch lift also
were found to cover a smaller area than those observed in the 1.5-inch section. This was
the only site monitored where the target compacted thickness was intentionally changed
for a day’s paving.
There were approximately 16 to 18 trucks hauling every day and the same amount
of material in every truck, regardless of the capacity of the truck. The material in the
semi trailers flared out to zero depth at one end, possibly leading to more cooling.
Frequently, trucks pulling away from the paver spilled material on the pavement in front
of the paver, as shown in two digital photographs presented in Figure A4. The spilled
material was shoveled onto the shoulder, into the hopper, or on several occasions, it was
left lying on the pavement in front of the paver. Cold spots were then recorded in the
spillage area after the paver had passed over the area (see Figure A5). When unloading a
A - 4
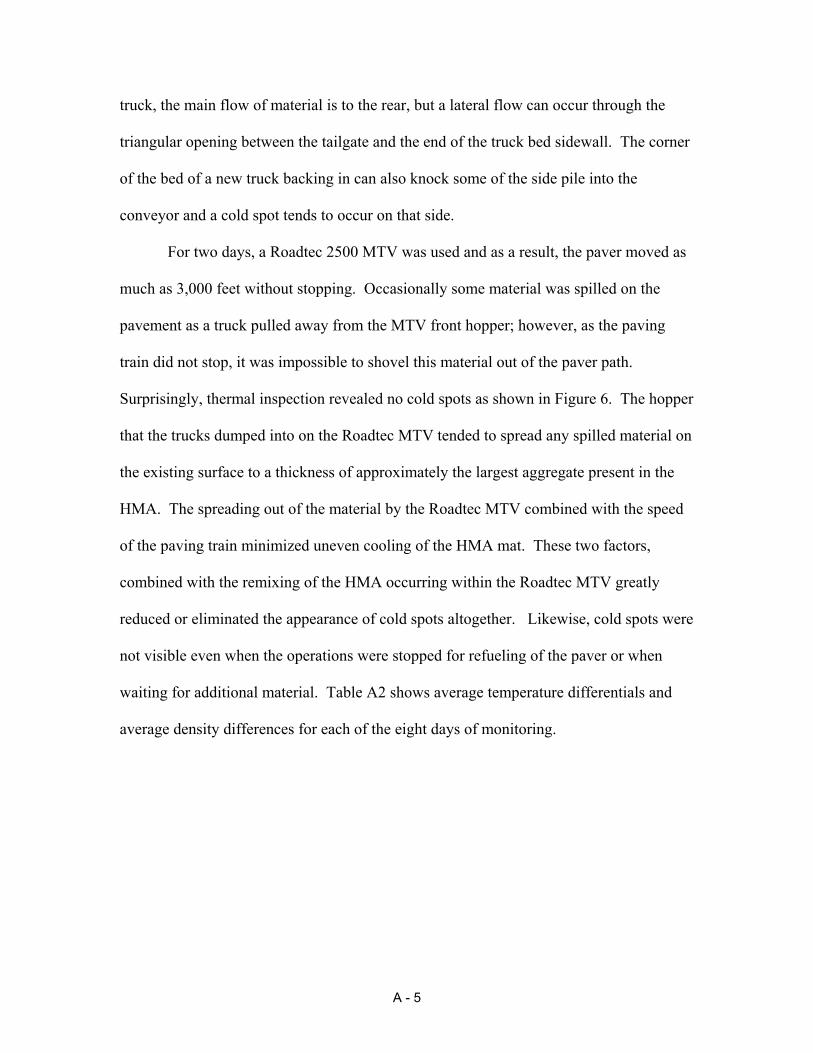
truck, the main flow of material is to the rear, but a lateral flow can occur through the
triangular opening between the tailgate and the end of the truck bed sidewall. The corner
of the bed of a new truck backing in can also knock some of the side pile into the
conveyor and a cold spot tends to occur on that side.
For two days, a Roadtec 2500 MTV was used and as a result, the paver moved as
much as 3,000 feet without stopping. Occasionally some material was spilled on the
pavement as a truck pulled away from the MTV front hopper; however, as the paving
train did not stop, it was impossible to shovel this material out of the paver path.
Surprisingly, thermal inspection revealed no cold spots as shown in Figure 6. The hopper
that the trucks dumped into on the Roadtec MTV tended to spread any spilled material on
the existing surface to a thickness of approximately the largest aggregate present in the
HMA. The spreading out of the material by the Roadtec MTV combined with the speed
of the paving train minimized uneven cooling of the HMA mat. These two factors,
combined with the remixing of the HMA occurring within the Roadtec MTV greatly
reduced or eliminated the appearance of cold spots altogether. Likewise, cold spots were
not visible even when the operations were stopped for refueling of the paver or when
waiting for additional material. Table A2 shows average temperature differentials and
average density differences for each of the eight days of monitoring.
A - 5
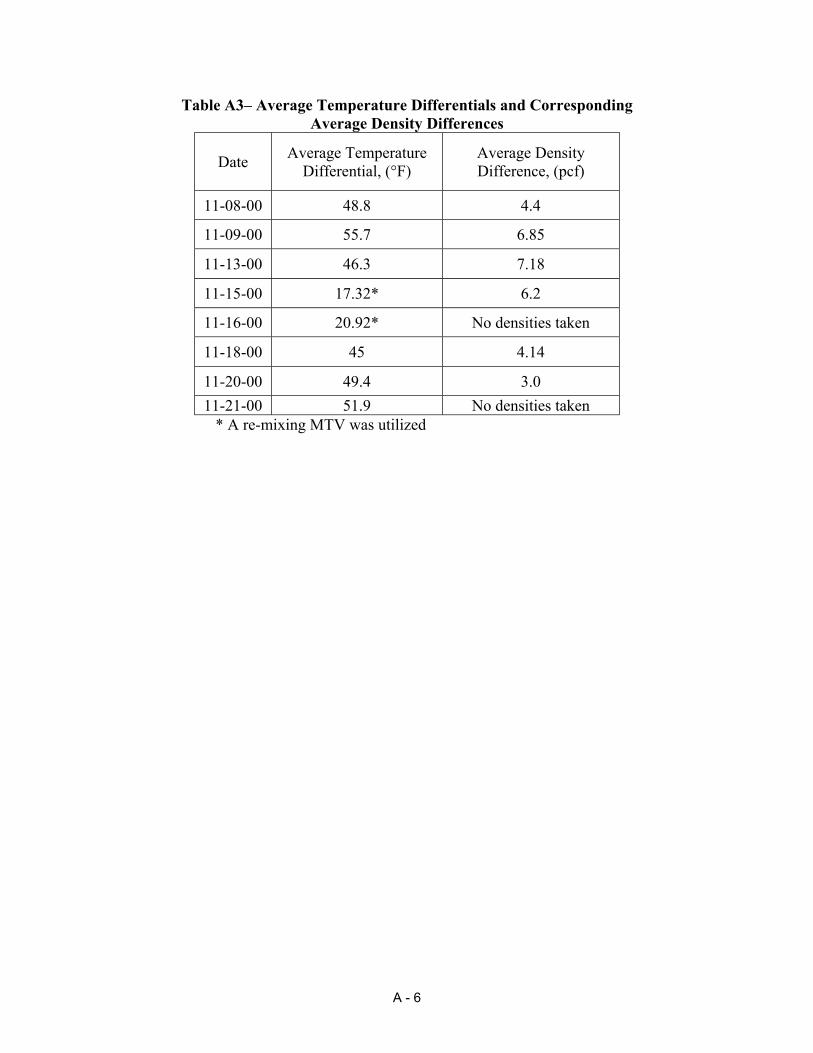
Table A3– Average Temperature Differentials and Corresponding Average Density Differences
Date Average Temperature Differential, (°F)
Average Density Difference, (pcf)
11-08-00 48.8 4.4
11-09-00 55.7 6.85
11-13-00 46.3 7.18
11-15-00 17.32* 6.2
11-16-00 20.92* No densities taken
11-18-00 45 4.14
11-20-00 49.4 3.0 11-21-00 51.9 No densities taken
* A re-mixing MTV was utilized
A - 6
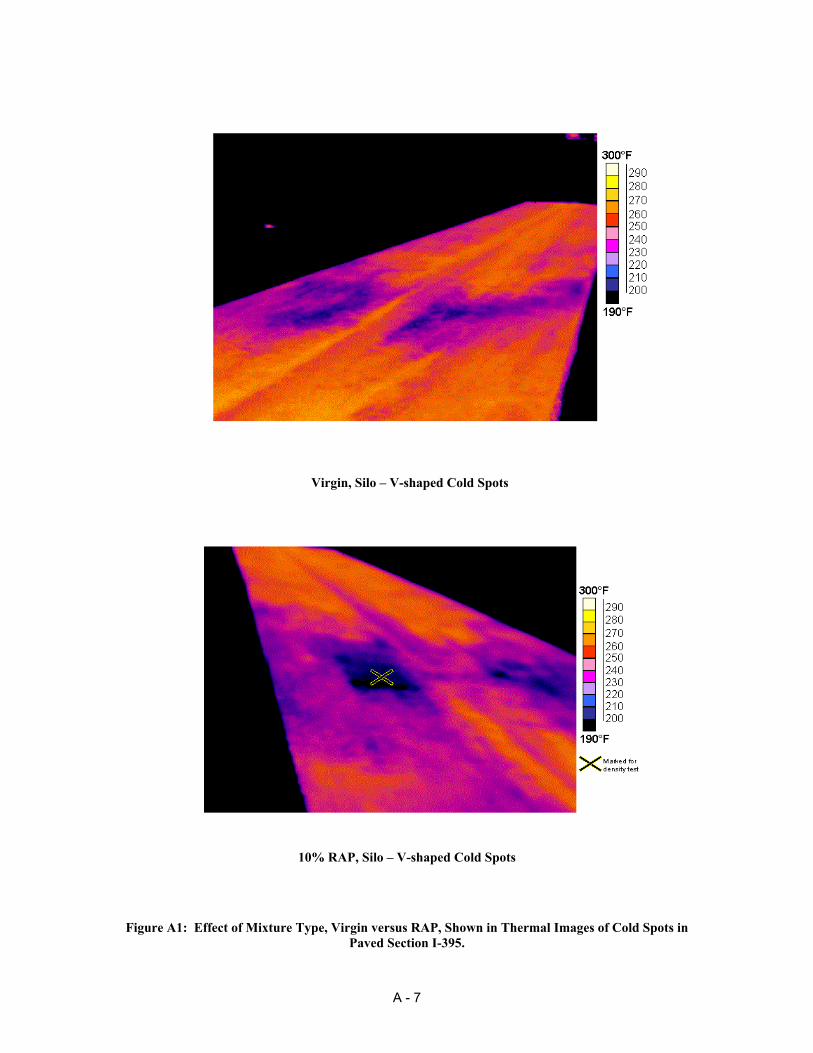
Virgin, Silo – V-shaped Cold Spots
10% RAP, Silo – V-shaped Cold Spots
Figure A1: Effect of Mixture Type, Virgin versus RAP, Shown in Thermal Images of Cold Spots in
Paved Section I-395.
A - 7
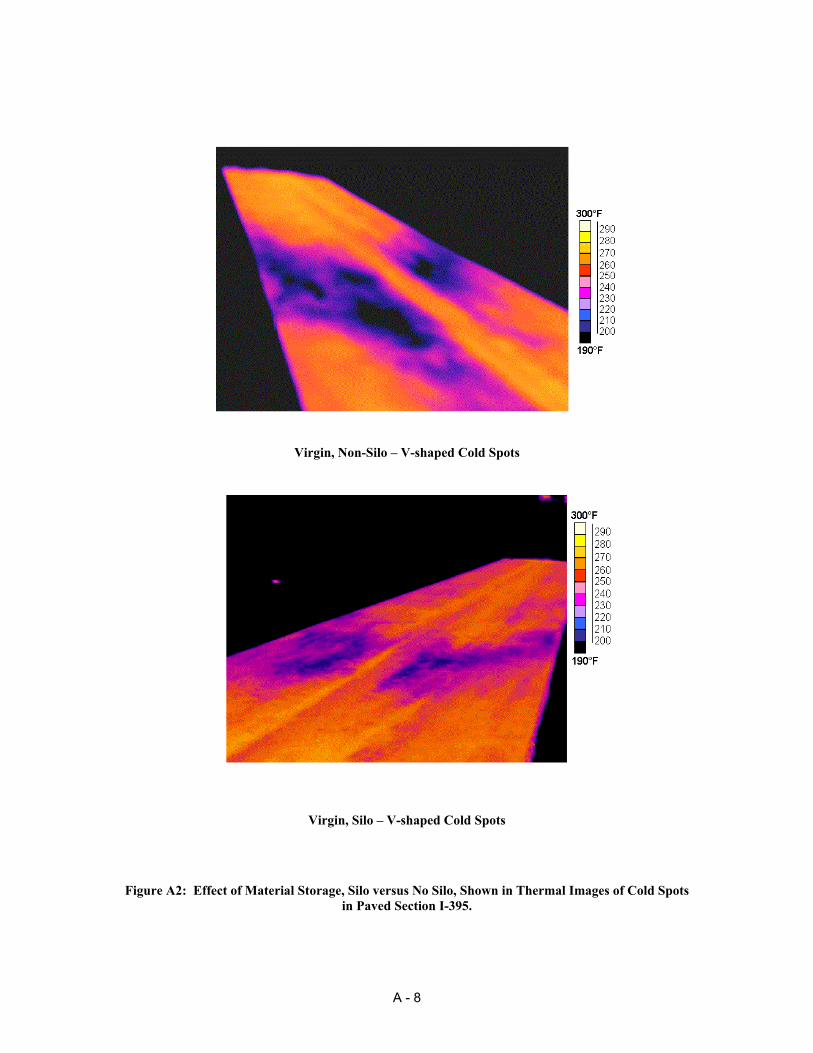
Virgin, Non-Silo – V-shaped Cold Spots
Virgin, Silo – V-shaped Cold Spots
Figure A2: Effect of Material Storage, Silo versus No Silo, Shown in Thermal Images of Cold Spots
in Paved Section I-395.
A - 8
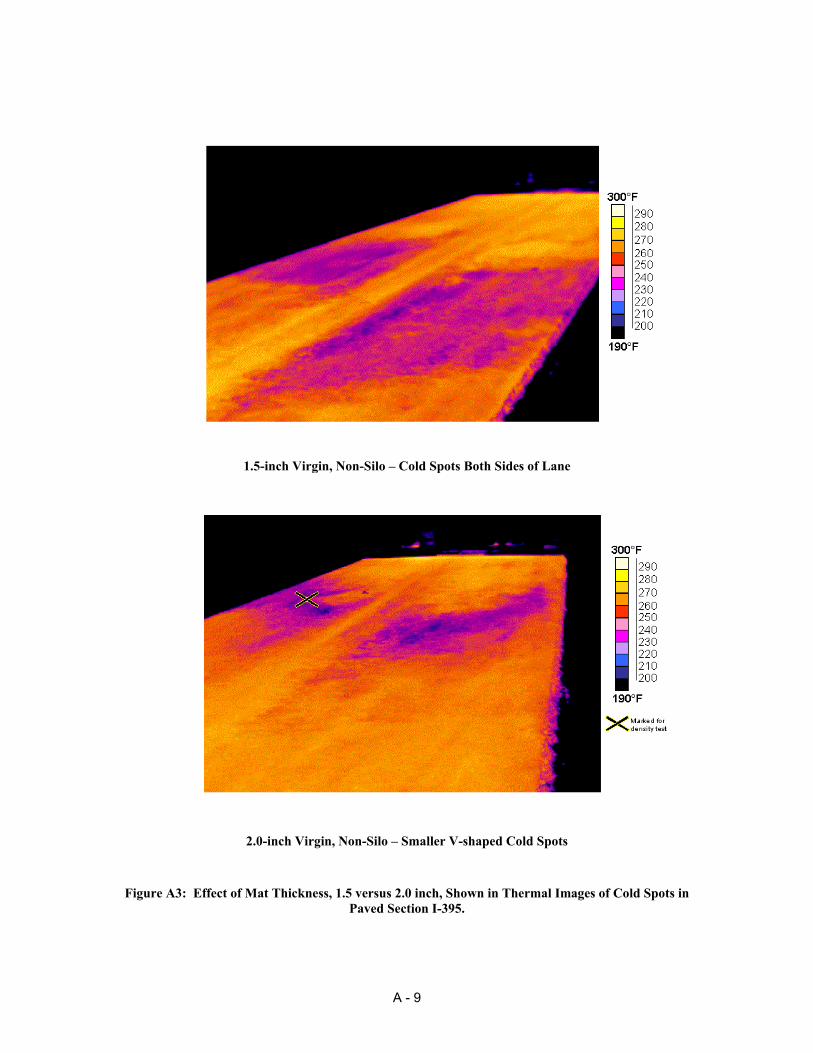
1.5-inch Virgin, Non-Silo – Cold Spots Both Sides of Lane
2.0-inch Virgin, Non-Silo – Smaller V-shaped Cold Spots
Figure A3: Effect of Mat Thickness, 1.5 versus 2.0 inch, Shown in Thermal Images of Cold Spots in
Paved Section I-395.
A - 9
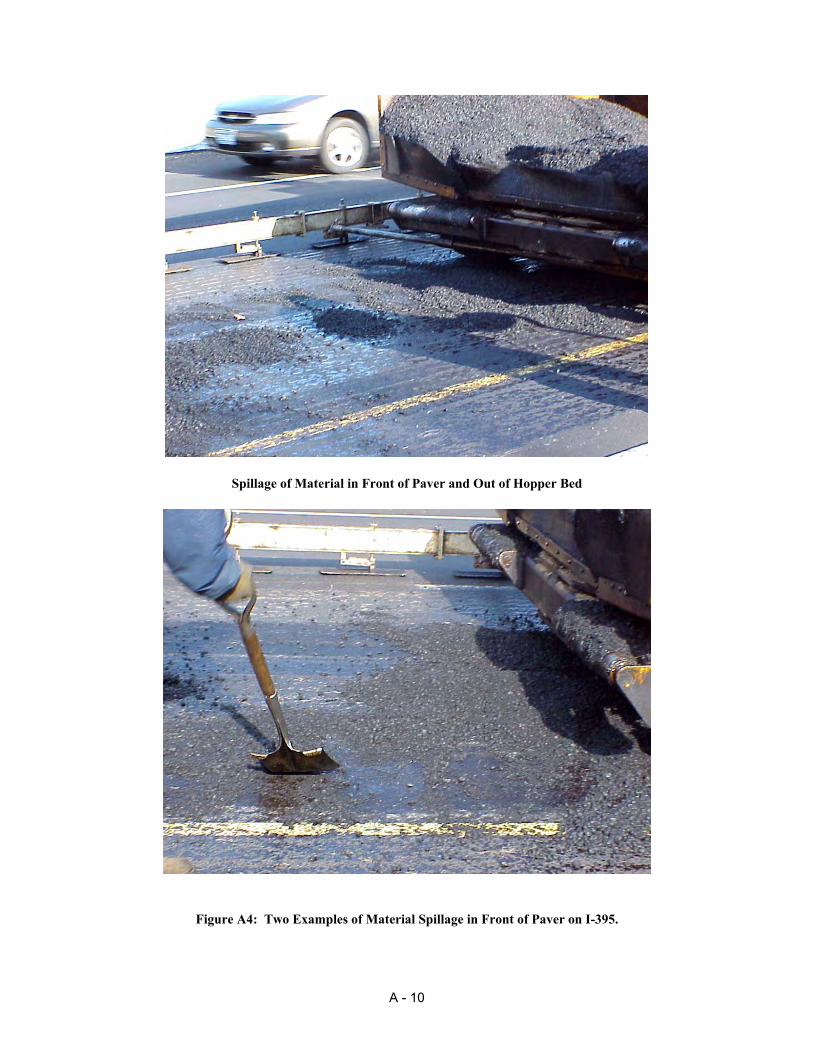
Spillage of Material in Front of Paver and Out of Hopper Bed
Figure A4: Two Examples of Material Spillage in Front of Paver on I-395.
A - 10
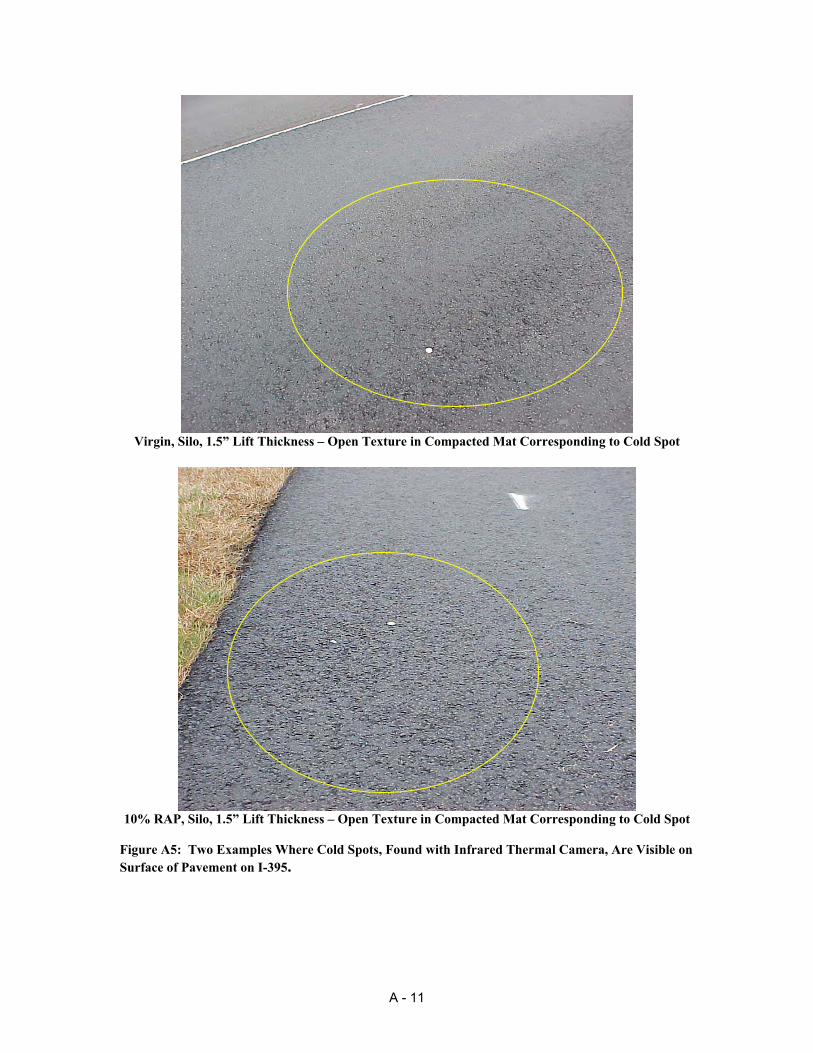
Virgin, Silo, 1.5” Lift Thickness – Open Texture in Compacted Mat Corresponding to Cold Spot
10% RAP, Silo, 1.5” Lift Thickness – Open Texture in Compacted Mat Corresponding to Cold Spot
Figure A5: Two Examples Where Cold Spots, Found with Infrared Thermal Camera, Are Visible on Surface of Pavement on I-395.
A - 11
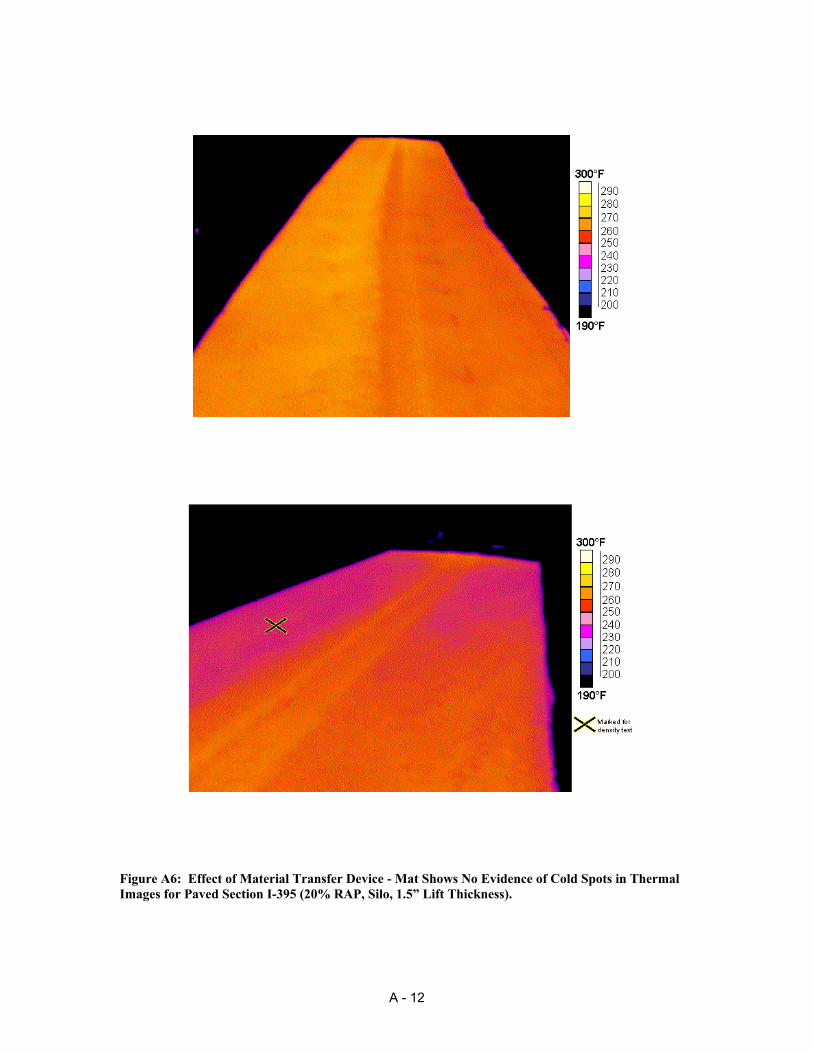
Figure A6: Effect of Material Transfer Device - Mat Shows No Evidence of Cold Spots in Thermal Images for Paved Section I-395 (20% RAP, Silo, 1.5” Lift Thickness).
A - 12
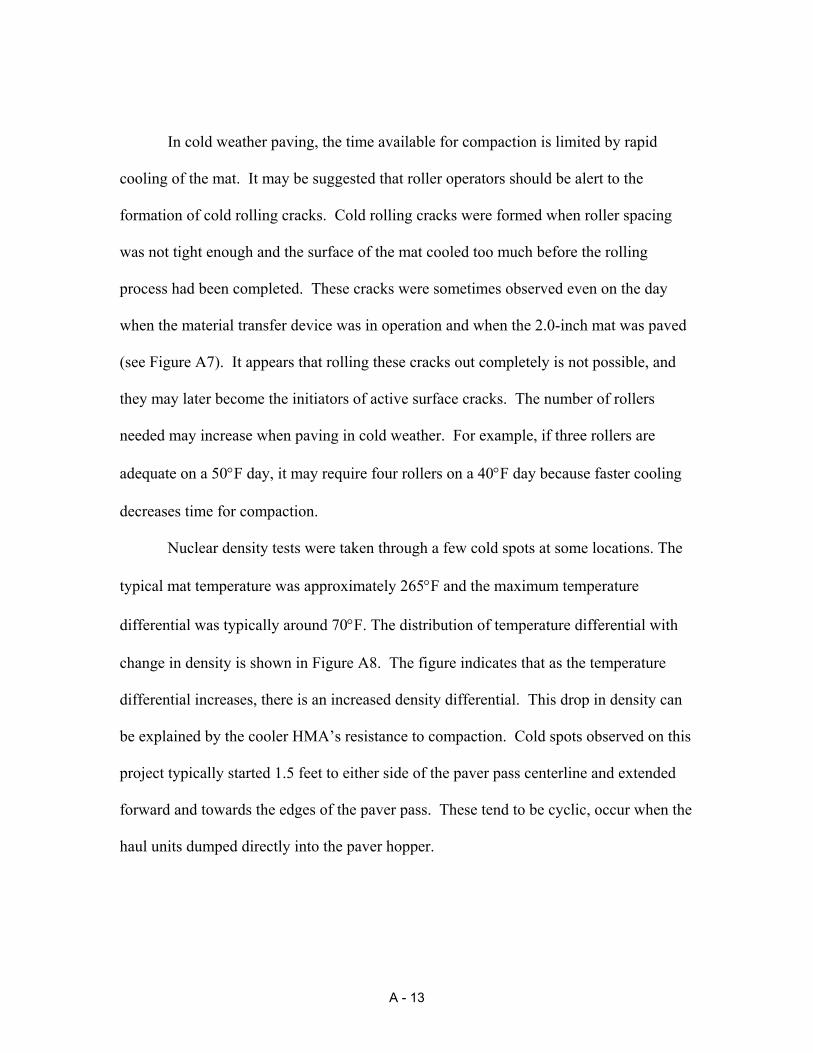
In cold weather paving, the time available for compaction is limited by rapid
cooling of the mat. It may be suggested that roller operators should be alert to the
formation of cold rolling cracks. Cold rolling cracks were formed when roller spacing
was not tight enough and the surface of the mat cooled too much before the rolling
process had been completed. These cracks were sometimes observed even on the day
when the material transfer device was in operation and when the 2.0-inch mat was paved
(see Figure A7). It appears that rolling these cracks out completely is not possible, and
they may later become the initiators of active surface cracks. The number of rollers
needed may increase when paving in cold weather. For example, if three rollers are
adequate on a 50°F day, it may require four rollers on a 40°F day because faster cooling
decreases time for compaction.
Nuclear density tests were taken through a few cold spots at some locations. The
typical mat temperature was approximately 265°F and the maximum temperature
differential was typically around 70°F. The distribution of temperature differential with
change in density is shown in Figure A8. The figure indicates that as the temperature
differential increases, there is an increased density differential. This drop in density can
be explained by the cooler HMA’s resistance to compaction. Cold spots observed on this
project typically started 1.5 feet to either side of the paver pass centerline and extended
forward and towards the edges of the paver pass. These tend to be cyclic, occur when the
haul units dumped directly into the paver hopper.
A - 13
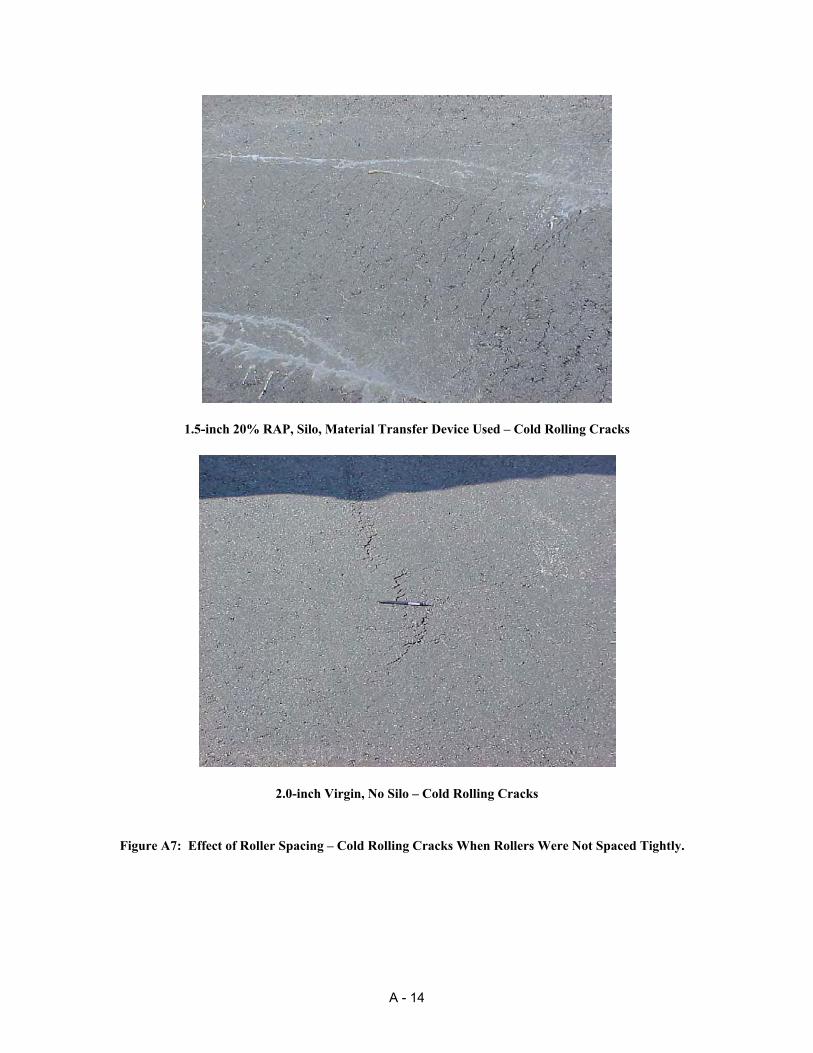
1.5-inch 20% RAP, Silo, Material Transfer Device Used – Cold Rolling Cracks
2.0-inch Virgin, No Silo – Cold Rolling Cracks Figure A7: Effect of Roller Spacing – Cold Rolling Cracks When Rollers Were Not Spaced Tightly.
A - 14
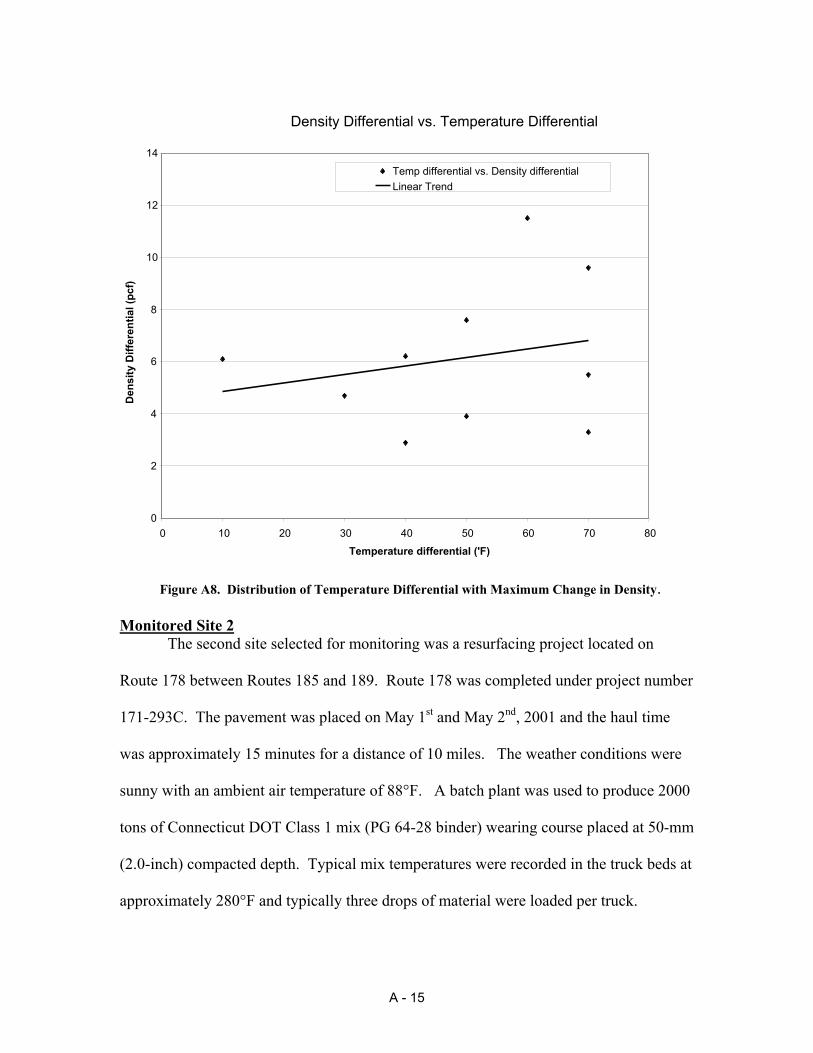
Density Differential vs. Temperature Differential
14 Temp differential vs. Density differential Linear Trend
12
10
Den
sity
Diff
eren
tial (
pcf)
8
6
4
2
0 10 20 30 40 50 60 70 80 0
Temperature differential ('F)
Figure A8. Distribution of Temperature Differential with Maximum Change in Density. Monitored Site 2 The second site selected for monitoring was a resurfacing project located on
Route 178 between Routes 185 and 189. Route 178 was completed under project number
171-293C. The pavement was placed on May 1st and May 2nd, 2001 and the haul time
was approximately 15 minutes for a distance of 10 miles. The weather conditions were
sunny with an ambient air temperature of 88°F. A batch plant was used to produce 2000
tons of Connecticut DOT Class 1 mix (PG 64-28 binder) wearing course placed at 50-mm
(2.0-inch) compacted depth. Typical mix temperatures were recorded in the truck beds at
approximately 280°F and typically three drops of material were loaded per truck.
A - 15
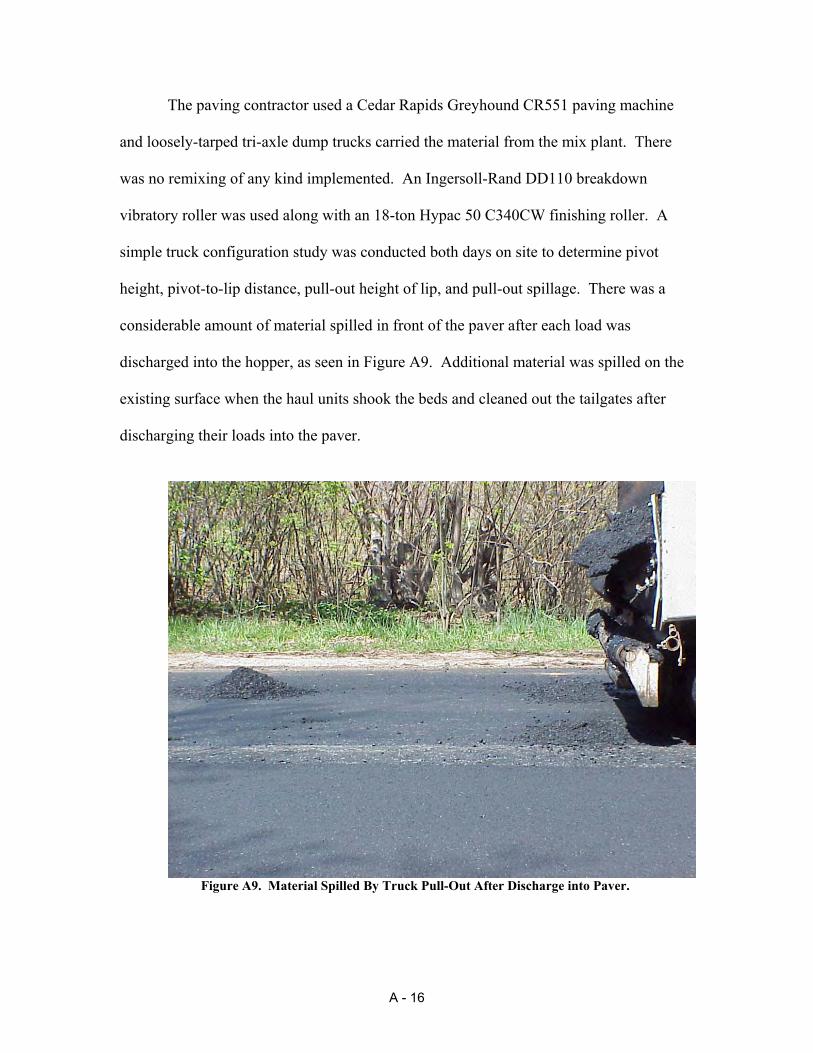
The paving contractor used a Cedar Rapids Greyhound CR551 paving machine
and loosely-tarped tri-axle dump trucks carried the material from the mix plant. There
was no remixing of any kind implemented. An Ingersoll-Rand DD110 breakdown
vibratory roller was used along with an 18-ton Hypac 50 C340CW finishing roller. A
simple truck configuration study was conducted both days on site to determine pivot
height, pivot-to-lip distance, pull-out height of lip, and pull-out spillage. There was a
considerable amount of material spilled in front of the paver after each load was
discharged into the hopper, as seen in Figure A9. Additional material was spilled on the
existing surface when the haul units shook the beds and cleaned out the tailgates after
discharging their loads into the paver.
Figure A9. Material Spilled By Truck Pull-Out After Discharge into Paver.
A - 16
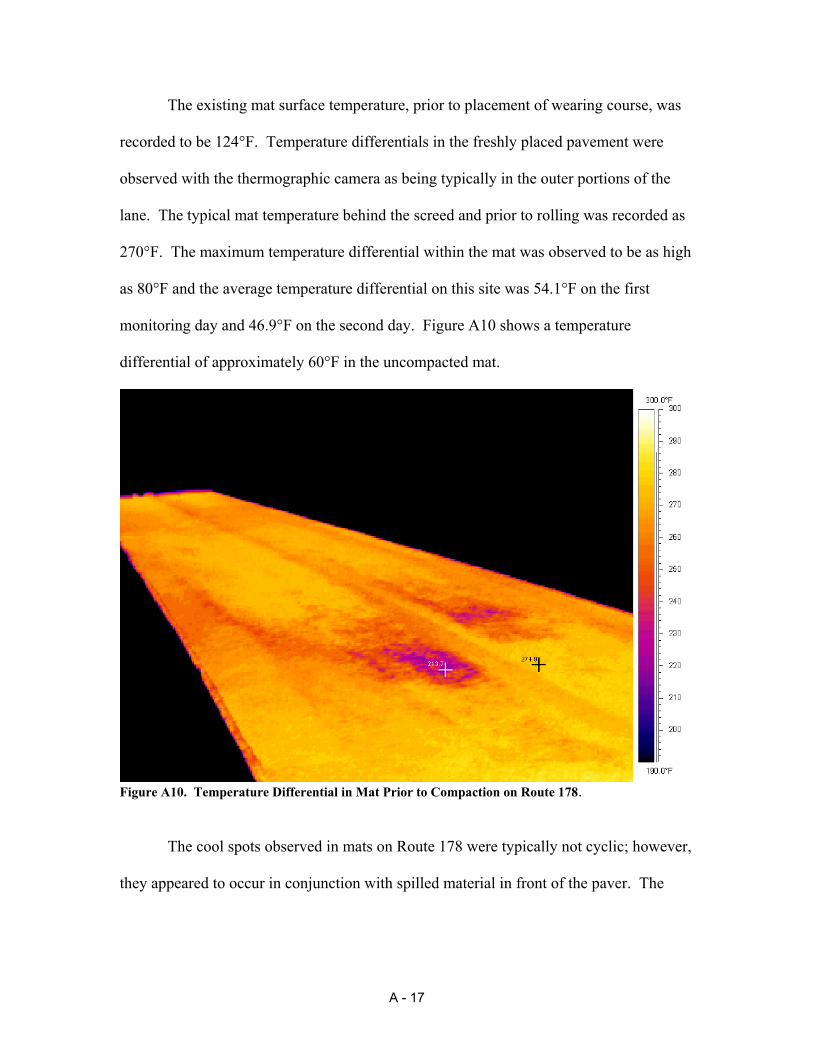
The existing mat surface temperature, prior to placement of wearing course, was
recorded to be 124°F. Temperature differentials in the freshly placed pavement were
observed with the thermographic camera as being typically in the outer portions of the
lane. The typical mat temperature behind the screed and prior to rolling was recorded as
270°F. The maximum temperature differential within the mat was observed to be as high
as 80°F and the average temperature differential on this site was 54.1°F on the first
monitoring day and 46.9°F on the second day. Figure A10 shows a temperature
differential of approximately 60°F in the uncompacted mat.
Figure A10. Temperature Differential in Mat Prior to Compaction on Route 178.
The cool spots observed in mats on Route 178 were typically not cyclic; however,
they appeared to occur in conjunction with spilled material in front of the paver. The
A - 17
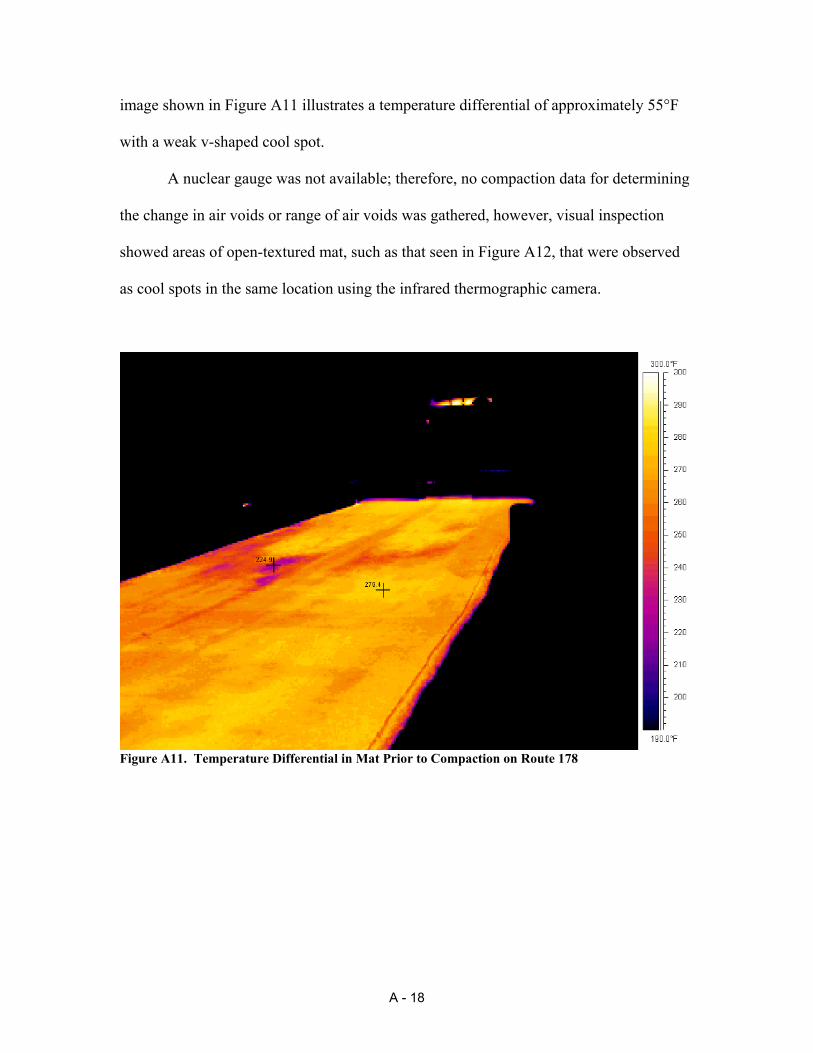
image shown in Figure A11 illustrates a temperature differential of approximately 55°F
with a weak v-shaped cool spot.
A nuclear gauge was not available; therefore, no compaction data for determining
the change in air voids or range of air voids was gathered, however, visual inspection
showed areas of open-textured mat, such as that seen in Figure A12, that were observed
as cool spots in the same location using the infrared thermographic camera.
Figure A11. Temperature Differential in Mat Prior to Compaction on Route 178
A - 18

Figure A12. Open-textured Mat Observed Prior to Compaction.
Monitored Site 3
This site was the resurfacing of Route 2 in Norwich, project number 172-327A.
The project was monitored on June 14th, 2001. The day was cloudy and ambient
temperatures were around 75°F. The material being placed was Superpave 12.5 mm and
it had a compacted thickness of 2.0 inches. This project placed HMA with a RAP content
of 10%. The material was hauled 5 miles from a plant in Montville. The hauling time for
the trucks was about 10 minutes. The contractor paved with a CAT model AP1055B
paver and two Ingersoll-Rand model DD110 rollers for breakdown and finish rolling.
The contractor also used a RoadTec model SB-2500 material transfer vehicle. At the
time, only images of cold spots were taken rather than every truck change therefore only
3 images were taken. The relatively small temperature differentials are indicative of a
remixing MTV. The average temperature differential observed on this project was
14.9°F. There were no densities observed or recorded for this project.
A - 19
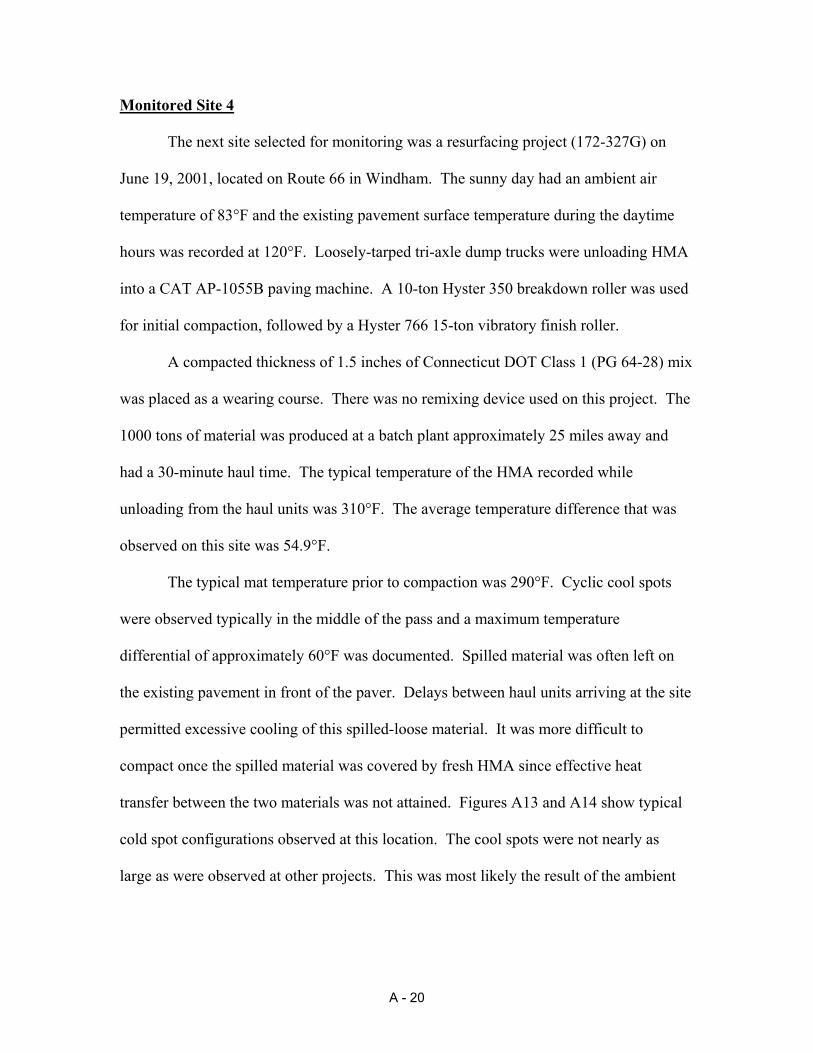
Monitored Site 4
The next site selected for monitoring was a resurfacing project (172-327G) on
June 19, 2001, located on Route 66 in Windham. The sunny day had an ambient air
temperature of 83°F and the existing pavement surface temperature during the daytime
hours was recorded at 120°F. Loosely-tarped tri-axle dump trucks were unloading HMA
into a CAT AP-1055B paving machine. A 10-ton Hyster 350 breakdown roller was used
for initial compaction, followed by a Hyster 766 15-ton vibratory finish roller.
A compacted thickness of 1.5 inches of Connecticut DOT Class 1 (PG 64-28) mix
was placed as a wearing course. There was no remixing device used on this project. The
1000 tons of material was produced at a batch plant approximately 25 miles away and
had a 30-minute haul time. The typical temperature of the HMA recorded while
unloading from the haul units was 310°F. The average temperature difference that was
observed on this site was 54.9°F.
The typical mat temperature prior to compaction was 290°F. Cyclic cool spots
were observed typically in the middle of the pass and a maximum temperature
differential of approximately 60°F was documented. Spilled material was often left on
the existing pavement in front of the paver. Delays between haul units arriving at the site
permitted excessive cooling of this spilled-loose material. It was more difficult to
compact once the spilled material was covered by fresh HMA since effective heat
transfer between the two materials was not attained. Figures A13 and A14 show typical
cold spot configurations observed at this location. The cool spots were not nearly as
large as were observed at other projects. This was most likely the result of the ambient
A - 20
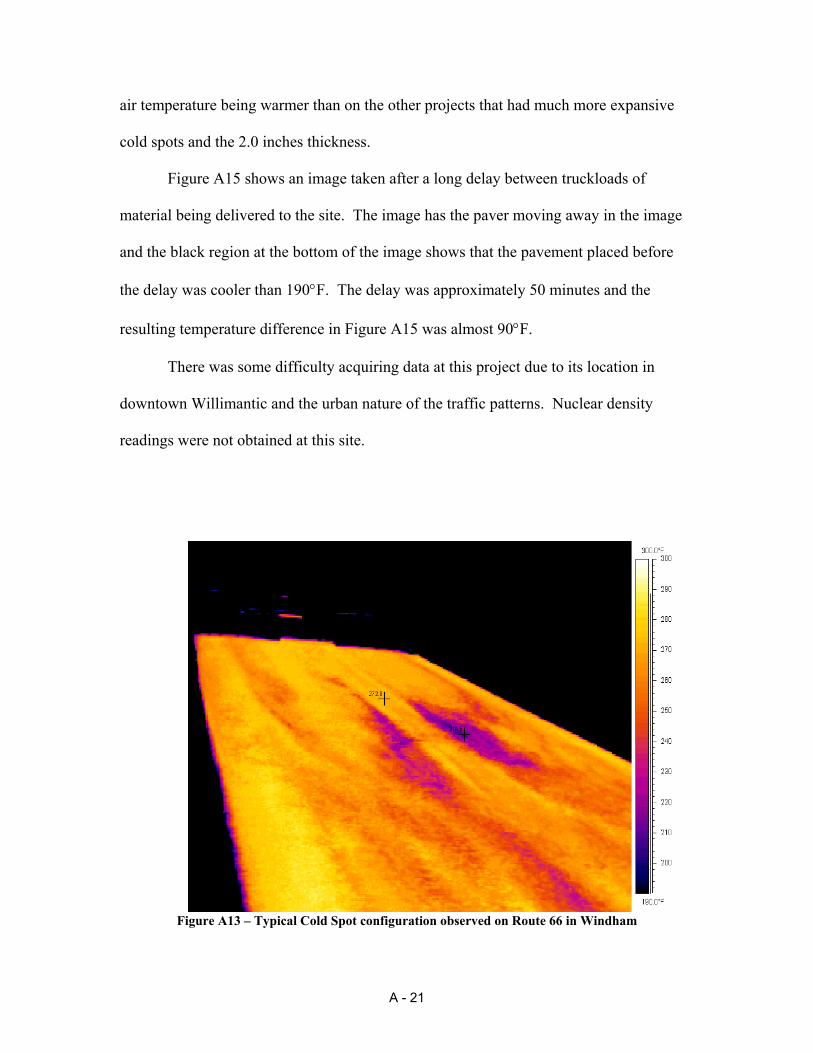
air temperature being warmer than on the other projects that had much more expansive
cold spots and the 2.0 inches thickness.
Figure A15 shows an image taken after a long delay between truckloads of
material being delivered to the site. The image has the paver moving away in the image
and the black region at the bottom of the image shows that the pavement placed before
the delay was cooler than 190°F. The delay was approximately 50 minutes and the
resulting temperature difference in Figure A15 was almost 90°F.
There was some difficulty acquiring data at this project due to its location in
downtown Willimantic and the urban nature of the traffic patterns. Nuclear density
readings were not obtained at this site.
Figure A13 – Typical Cold Spot configuration observed on Route 66 in Windham
A - 21
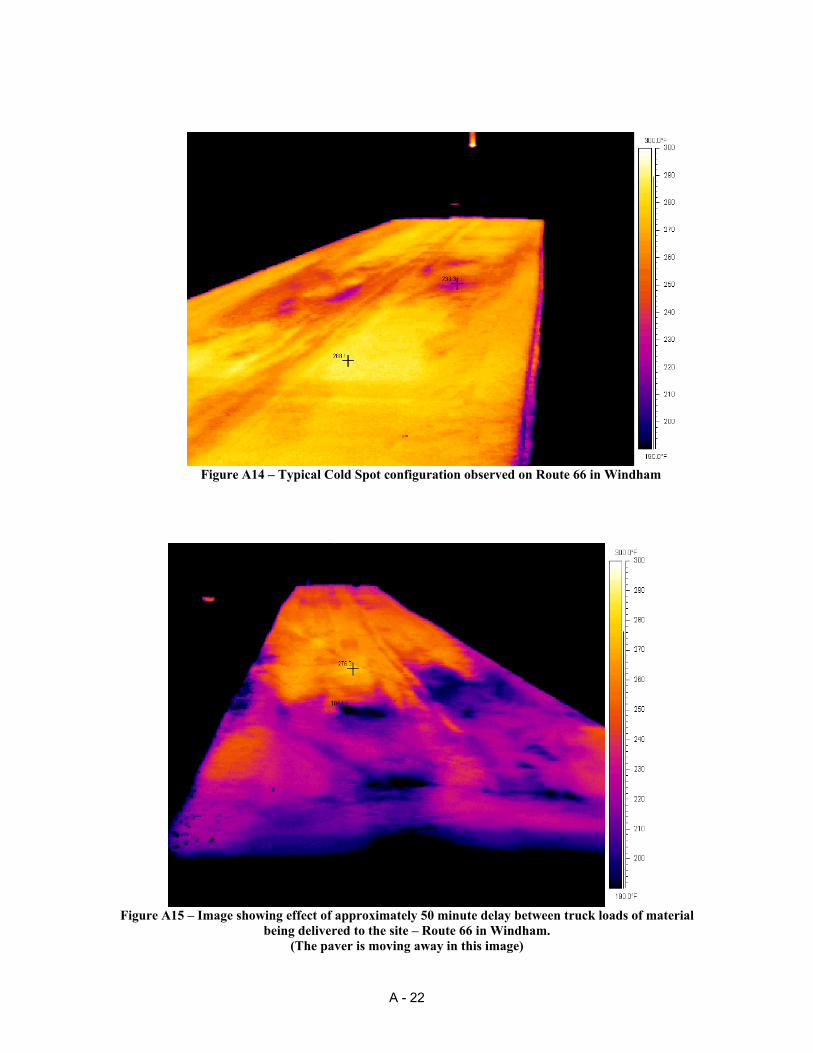
Figure A14 – Typical Cold Spot configuration observed on Route 66 in Windham
Figure A15 – Image showing effect of approximately 50 minute delay between truck loads of material
being delivered to the site – Route 66 in Windham. (The paver is moving away in this image)
A - 22
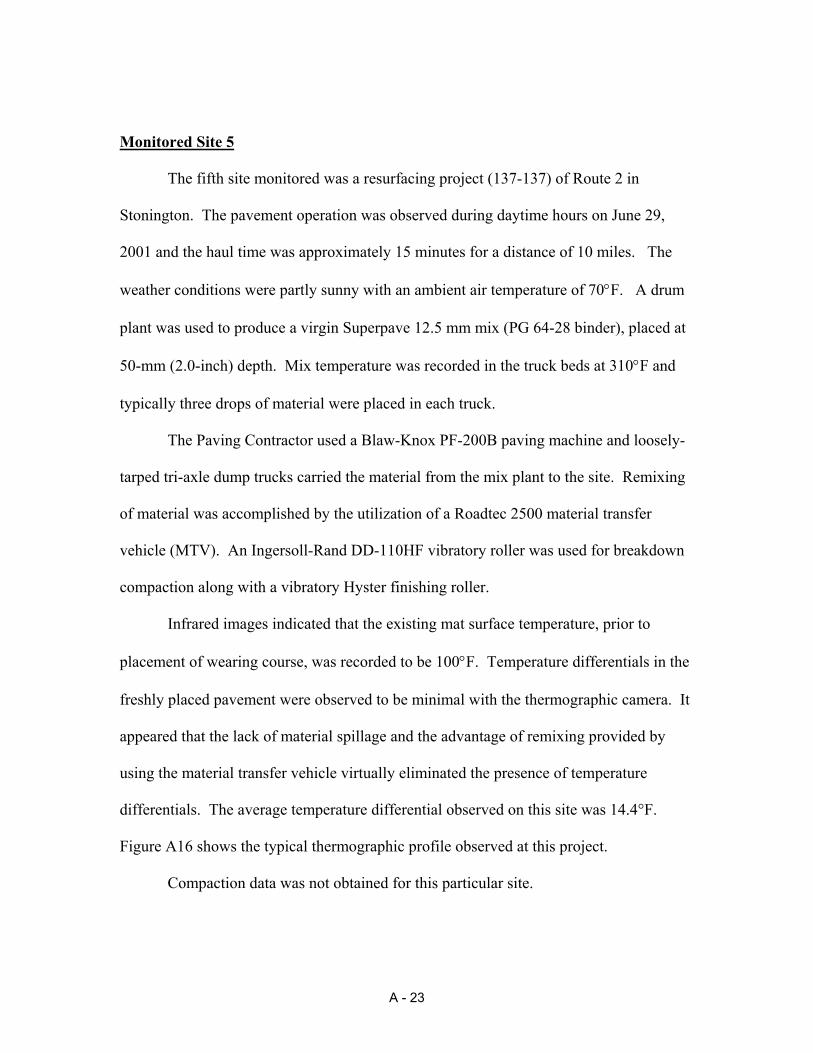
Monitored Site 5
The fifth site monitored was a resurfacing project (137-137) of Route 2 in
Stonington. The pavement operation was observed during daytime hours on June 29,
2001 and the haul time was approximately 15 minutes for a distance of 10 miles. The
weather conditions were partly sunny with an ambient air temperature of 70°F. A drum
plant was used to produce a virgin Superpave 12.5 mm mix (PG 64-28 binder), placed at
50-mm (2.0-inch) depth. Mix temperature was recorded in the truck beds at 310°F and
typically three drops of material were placed in each truck.
The Paving Contractor used a Blaw-Knox PF-200B paving machine and loosely-
tarped tri-axle dump trucks carried the material from the mix plant to the site. Remixing
of material was accomplished by the utilization of a Roadtec 2500 material transfer
vehicle (MTV). An Ingersoll-Rand DD-110HF vibratory roller was used for breakdown
compaction along with a vibratory Hyster finishing roller.
Infrared images indicated that the existing mat surface temperature, prior to
placement of wearing course, was recorded to be 100°F. Temperature differentials in the
freshly placed pavement were observed to be minimal with the thermographic camera. It
appeared that the lack of material spillage and the advantage of remixing provided by
using the material transfer vehicle virtually eliminated the presence of temperature
differentials. The average temperature differential observed on this site was 14.4°F.
Figure A16 shows the typical thermographic profile observed at this project.
Compaction data was not obtained for this particular site.
A - 23
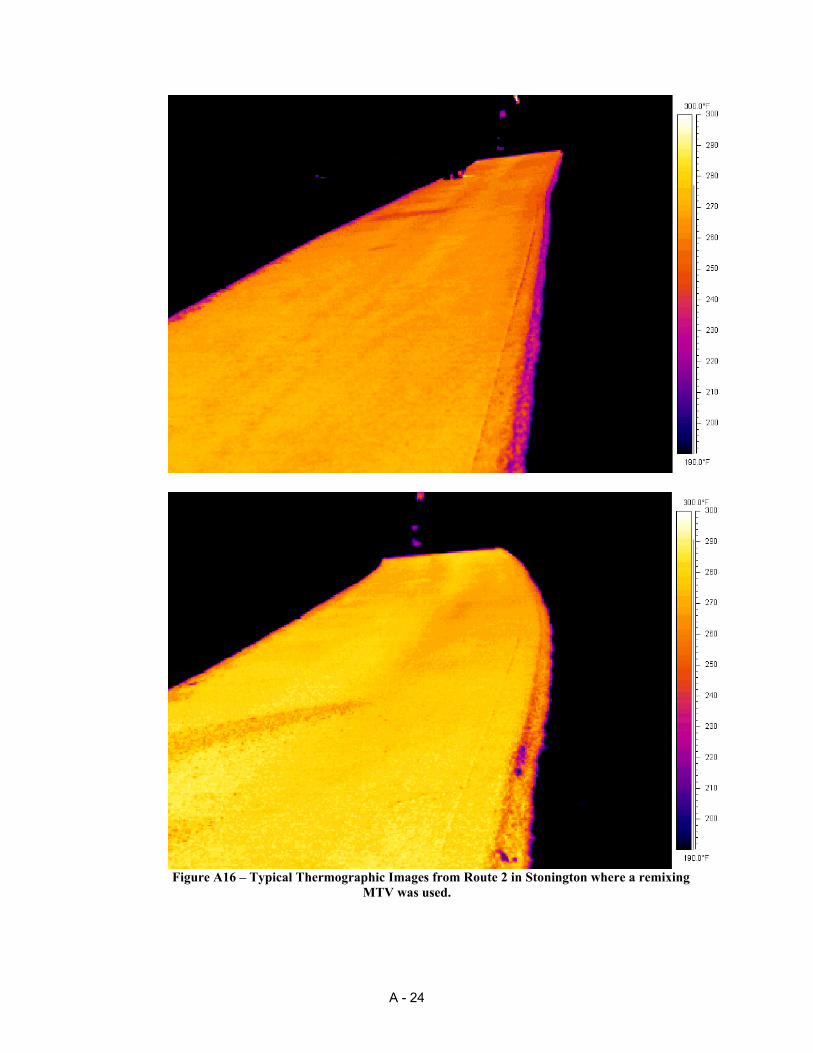
Figure A16 – Typical Thermographic Images from Route 2 in Stonington where a remixing
MTV was used.
A - 24
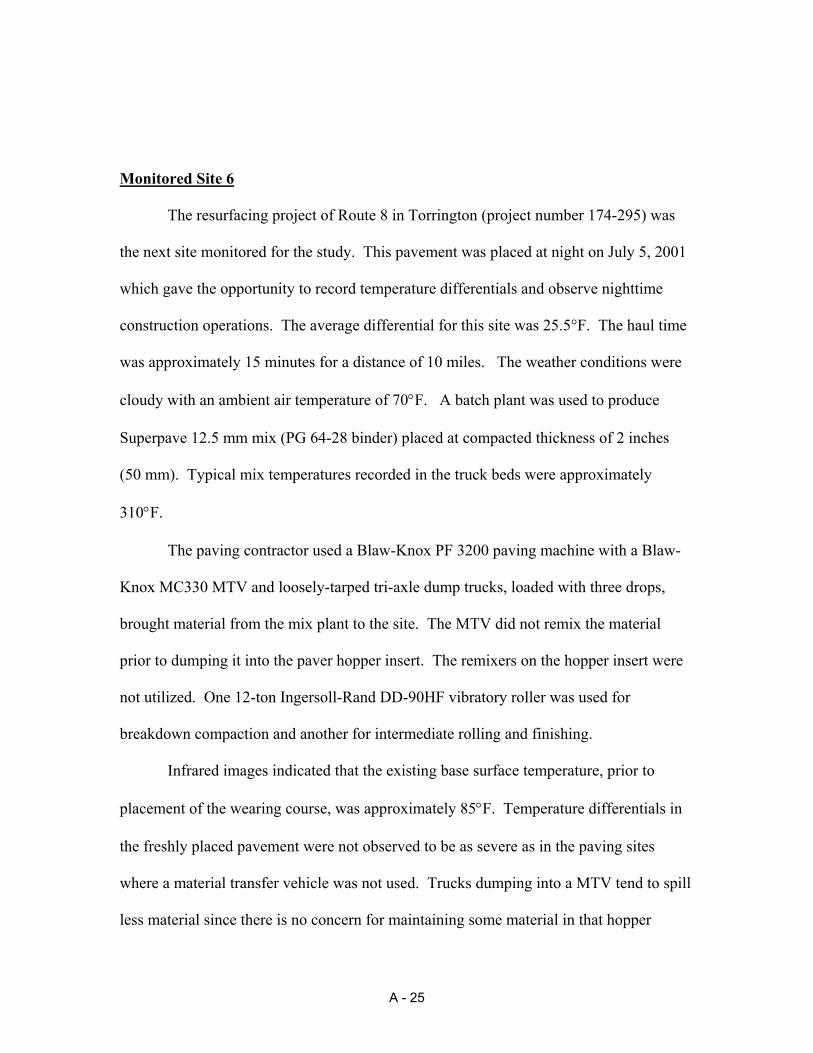
Monitored Site 6
The resurfacing project of Route 8 in Torrington (project number 174-295) was
the next site monitored for the study. This pavement was placed at night on July 5, 2001
which gave the opportunity to record temperature differentials and observe nighttime
construction operations. The average differential for this site was 25.5°F. The haul time
was approximately 15 minutes for a distance of 10 miles. The weather conditions were
cloudy with an ambient air temperature of 70°F. A batch plant was used to produce
Superpave 12.5 mm mix (PG 64-28 binder) placed at compacted thickness of 2 inches
(50 mm). Typical mix temperatures recorded in the truck beds were approximately
310°F.
The paving contractor used a Blaw-Knox PF 3200 paving machine with a Blaw-
Knox MC330 MTV and loosely-tarped tri-axle dump trucks, loaded with three drops,
brought material from the mix plant to the site. The MTV did not remix the material
prior to dumping it into the paver hopper insert. The remixers on the hopper insert were
not utilized. One 12-ton Ingersoll-Rand DD-90HF vibratory roller was used for
breakdown compaction and another for intermediate rolling and finishing.
Infrared images indicated that the existing base surface temperature, prior to
placement of the wearing course, was approximately 85°F. Temperature differentials in
the freshly placed pavement were not observed to be as severe as in the paving sites
where a material transfer vehicle was not used. Trucks dumping into a MTV tend to spill
less material since there is no concern for maintaining some material in that hopper
A - 25
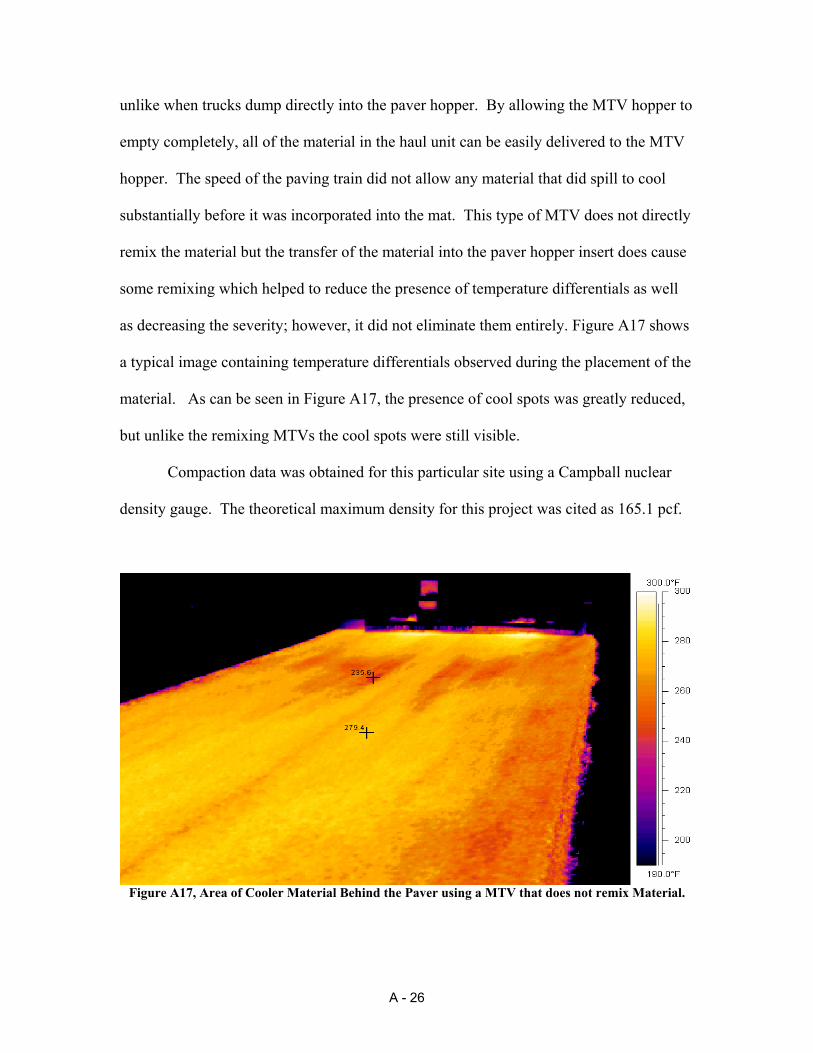
unlike when trucks dump directly into the paver hopper. By allowing the MTV hopper to
empty completely, all of the material in the haul unit can be easily delivered to the MTV
hopper. The speed of the paving train did not allow any material that did spill to cool
substantially before it was incorporated into the mat. This type of MTV does not directly
remix the material but the transfer of the material into the paver hopper insert does cause
some remixing which helped to reduce the presence of temperature differentials as well
as decreasing the severity; however, it did not eliminate them entirely. Figure A17 shows
a typical image containing temperature differentials observed during the placement of the
material. As can be seen in Figure A17, the presence of cool spots was greatly reduced,
but unlike the remixing MTVs the cool spots were still visible.
Compaction data was obtained for this particular site using a Campball nuclear
density gauge. The theoretical maximum density for this project was cited as 165.1 pcf.
Figure A17, Area of Cooler Material Behind the Paver using a MTV that does not remix Material.
A - 26
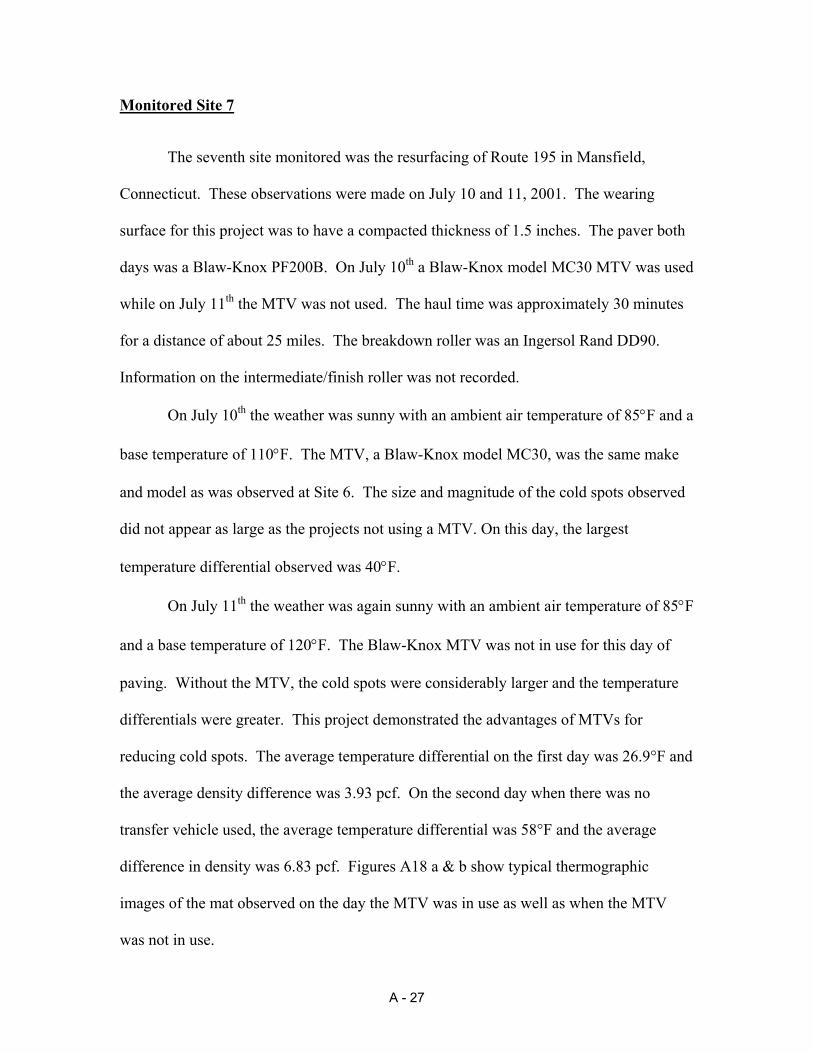
Monitored Site 7
The seventh site monitored was the resurfacing of Route 195 in Mansfield,
Connecticut. These observations were made on July 10 and 11, 2001. The wearing
surface for this project was to have a compacted thickness of 1.5 inches. The paver both
days was a Blaw-Knox PF200B. On July 10th a Blaw-Knox model MC30 MTV was used
while on July 11th the MTV was not used. The haul time was approximately 30 minutes
for a distance of about 25 miles. The breakdown roller was an Ingersol Rand DD90.
Information on the intermediate/finish roller was not recorded.
On July 10th the weather was sunny with an ambient air temperature of 85°F and a
base temperature of 110°F. The MTV, a Blaw-Knox model MC30, was the same make
and model as was observed at Site 6. The size and magnitude of the cold spots observed
did not appear as large as the projects not using a MTV. On this day, the largest
temperature differential observed was 40°F.
On July 11th the weather was again sunny with an ambient air temperature of 85°F
and a base temperature of 120°F. The Blaw-Knox MTV was not in use for this day of
paving. Without the MTV, the cold spots were considerably larger and the temperature
differentials were greater. This project demonstrated the advantages of MTVs for
reducing cold spots. The average temperature differential on the first day was 26.9°F and
the average density difference was 3.93 pcf. On the second day when there was no
transfer vehicle used, the average temperature differential was 58°F and the average
difference in density was 6.83 pcf. Figures A18 a & b show typical thermographic
images of the mat observed on the day the MTV was in use as well as when the MTV
was not in use.
A - 27
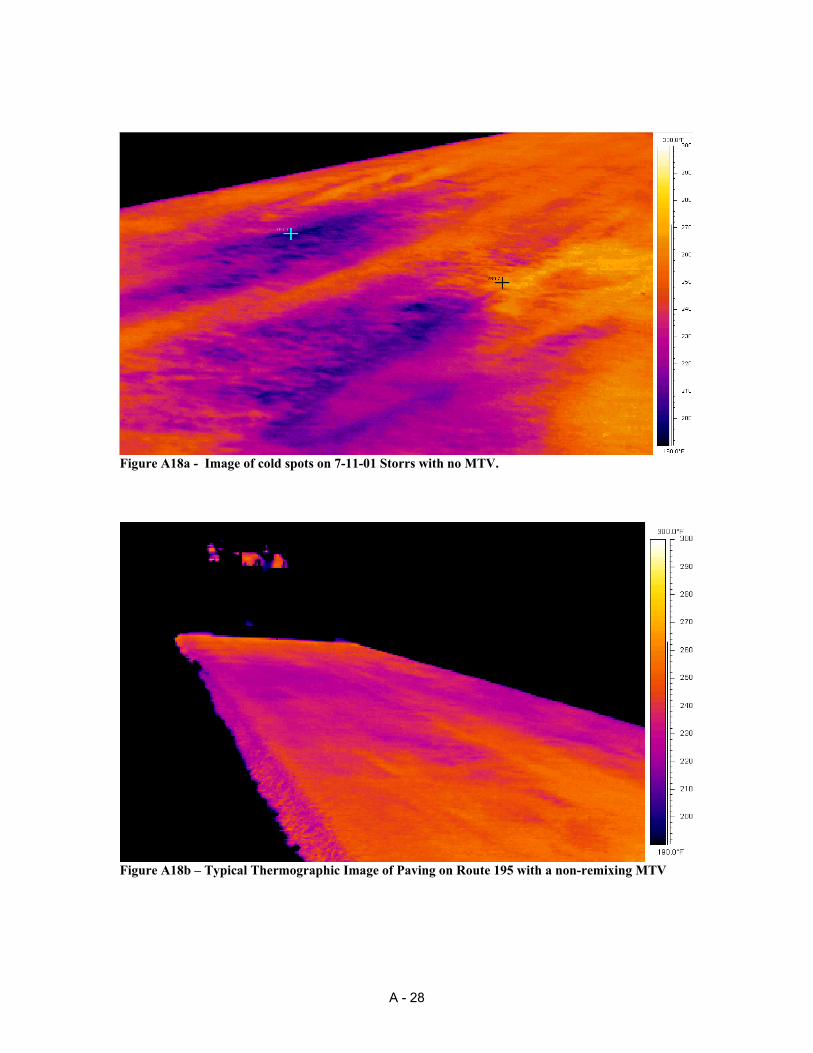
Figure A18a - Image of cold spots on 7-11-01 Storrs with no MTV.
Figure A18b – Typical Thermographic Image of Paving on Route 195 with a non-remixing MTV
A - 28
Monitored Site 8
This paving site was Interstate 91 in Enfield (Project 46 – 118) which took place
during night time hours on July 12, 2001. The haul distance was approximately 16 miles,
accounting for an average 20 minutes of haul time. The weather was cloudy with no
precipitation and the base pavement temperature was 75°F.
The paving equipment consisted of a Blaw-Knox Model PF3200 paver, an
Ingersoll Rand model DD90HF vibratory breakdown roller, a 28 ton CAT model PS360B
rubber tired intermediate roller, and an Ingersoll Rand model DD90HF finish roller. No
material transfer vehicle was used.
The thermographic images from this project indicate periodic cold spots with
corresponding drops in density at those relative locations as seen in Figures A19 and
A20. The average difference in temperature in the thermal images was observed to be
56.1°F and the average difference in density between warmer and cooler areas was 6.78
pcf for this site.
Figure A19 - Image of cold spot from shoulder of I-91
A - 29
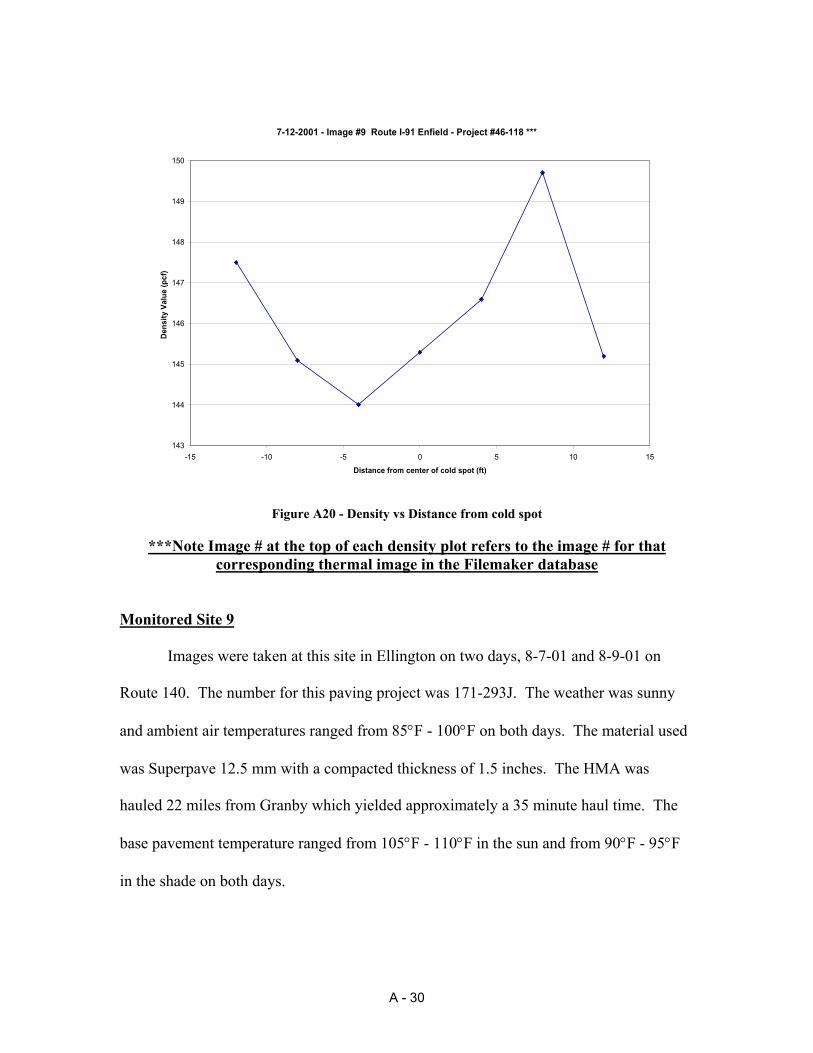
7-12-2001 - Image #9 Route I-91 Enfield - Project #46-118 ***
143
144
145
146
147
148
149
150
-15 -10 -5 0 5 10 15Distance from center of cold spot (ft)
Dens
ity V
alue
(pcf
)
Figure A20 - Density vs Distance from cold spot
***Note Image # at the top of each density plot refers to the image # for that corresponding thermal image in the Filemaker database
Monitored Site 9 Images were taken at this site in Ellington on two days, 8-7-01 and 8-9-01 on
Route 140. The number for this paving project was 171-293J. The weather was sunny
and ambient air temperatures ranged from 85°F - 100°F on both days. The material used
was Superpave 12.5 mm with a compacted thickness of 1.5 inches. The HMA was
hauled 22 miles from Granby which yielded approximately a 35 minute haul time. The
base pavement temperature ranged from 105°F - 110°F in the sun and from 90°F - 95°F
in the shade on both days.
A - 30
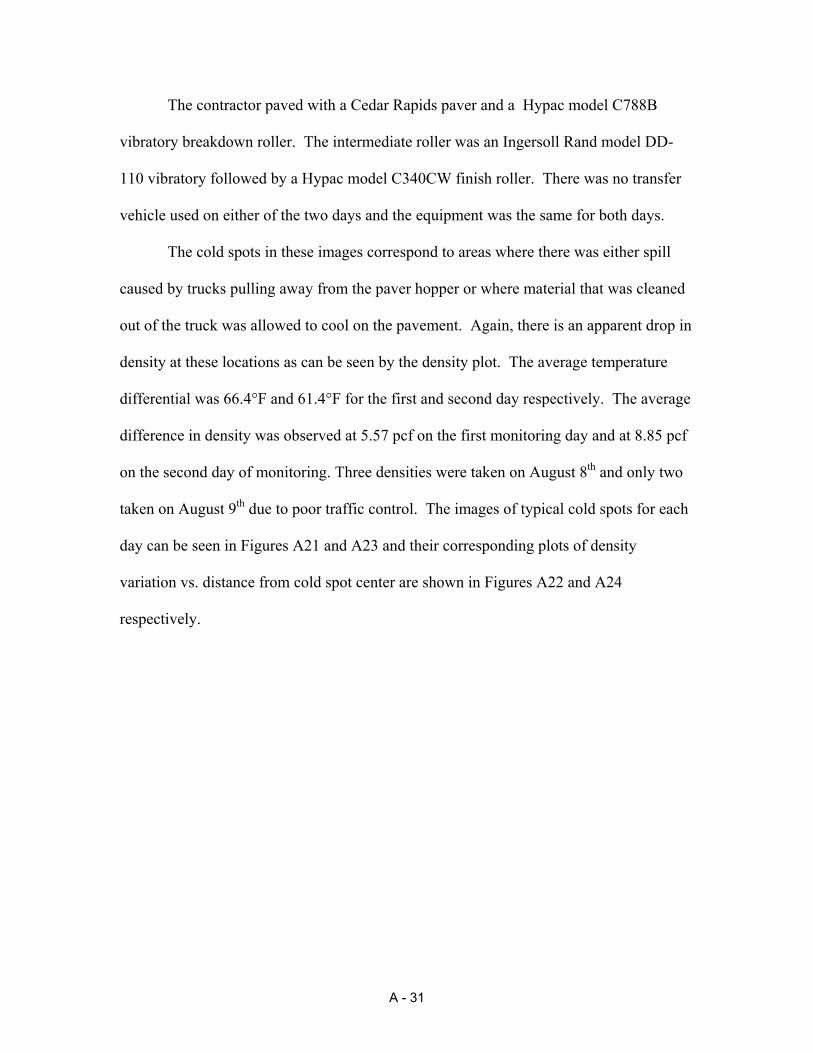
The contractor paved with a Cedar Rapids paver and a Hypac model C788B
vibratory breakdown roller. The intermediate roller was an Ingersoll Rand model DD-
110 vibratory followed by a Hypac model C340CW finish roller. There was no transfer
vehicle used on either of the two days and the equipment was the same for both days.
The cold spots in these images correspond to areas where there was either spill
caused by trucks pulling away from the paver hopper or where material that was cleaned
out of the truck was allowed to cool on the pavement. Again, there is an apparent drop in
density at these locations as can be seen by the density plot. The average temperature
differential was 66.4°F and 61.4°F for the first and second day respectively. The average
difference in density was observed at 5.57 pcf on the first monitoring day and at 8.85 pcf
on the second day of monitoring. Three densities were taken on August 8th and only two
taken on August 9th due to poor traffic control. The images of typical cold spots for each
day can be seen in Figures A21 and A23 and their corresponding plots of density
variation vs. distance from cold spot center are shown in Figures A22 and A24
respectively.
A - 31
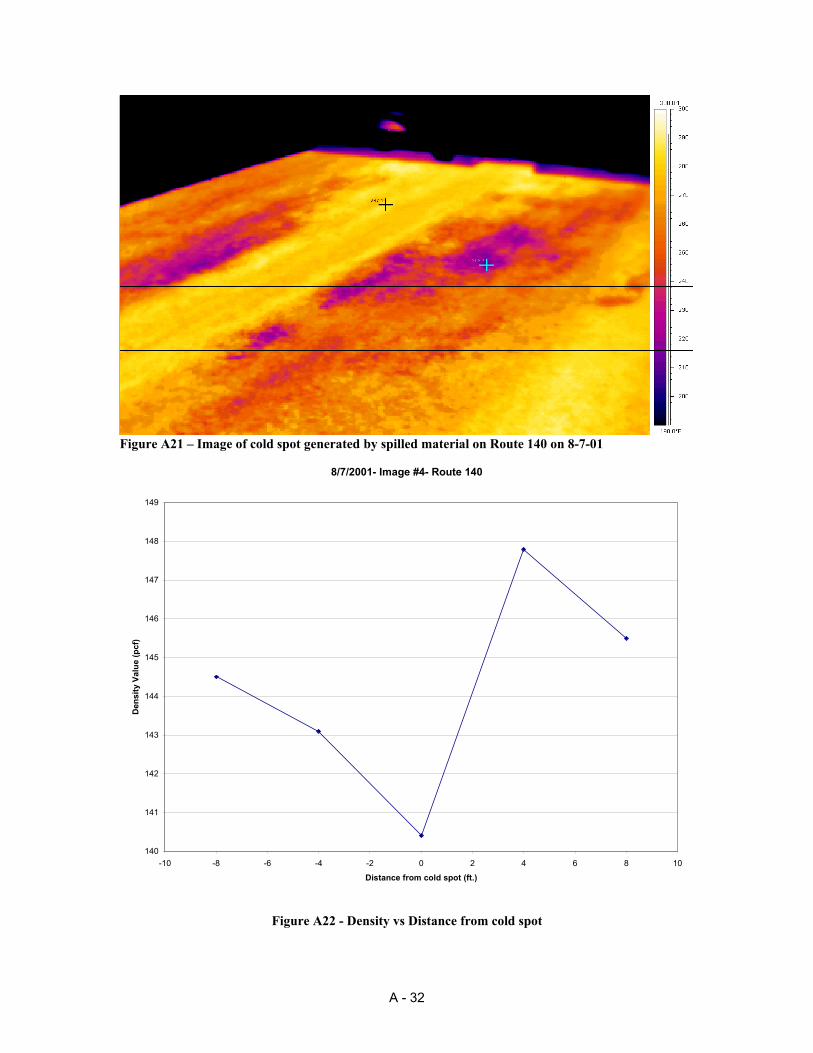
Figure A21 – Image of cold spot generated by spilled material on Route 140 on 8-7-01
8/7/2001- Image #4- Route 140
140
141
142
143
144
145
146
147
148
149
-10 -8 -6 -4 -2 0 2 4 6 8 10
Distance from cold spot (ft.)
Den
sity
Val
ue (p
cf)
Figure A22 - Density vs Distance from cold spot
A - 32
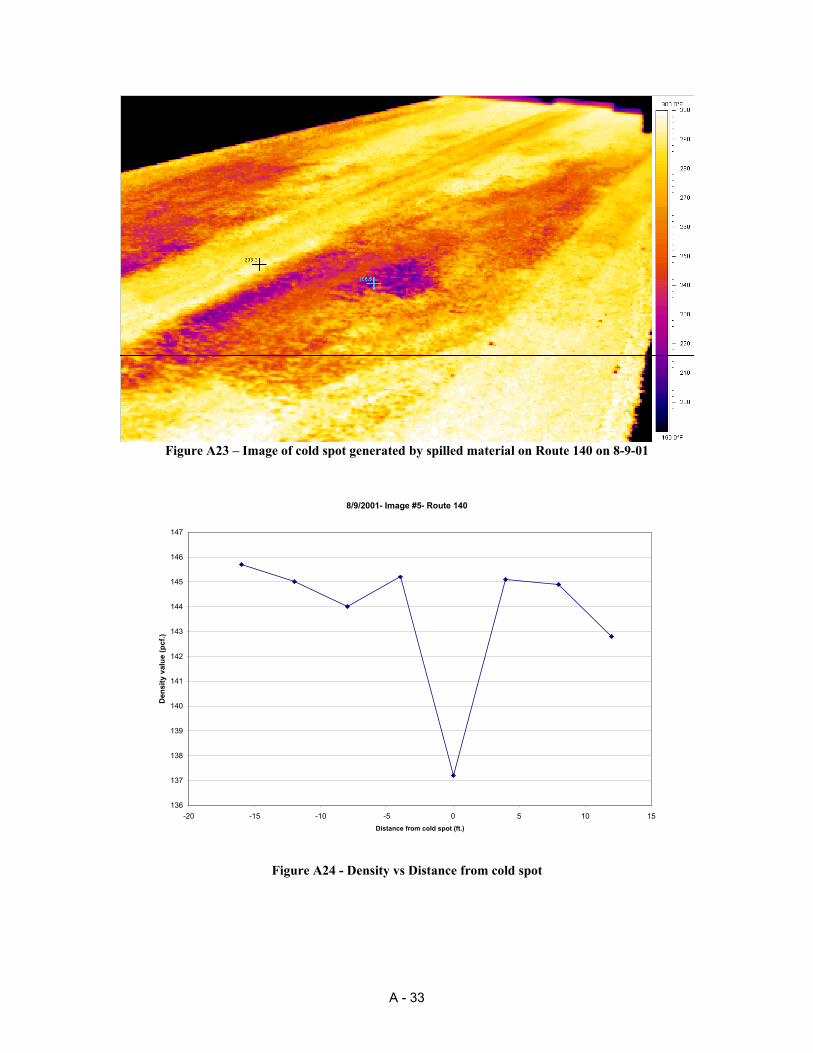
Figure A23 – Image of cold spot generated by spilled material on Route 140 on 8-9-01
8/9/2001- Image #5- Route 140
136
137
138
139
140
141
142
143
144
145
146
147
-20 -15 -10 -5 0 5 10 15Distance from cold spot (ft.)
Den
sity
val
ue (p
cf.)
Figure A24 - Density vs Distance from cold spot
A - 33
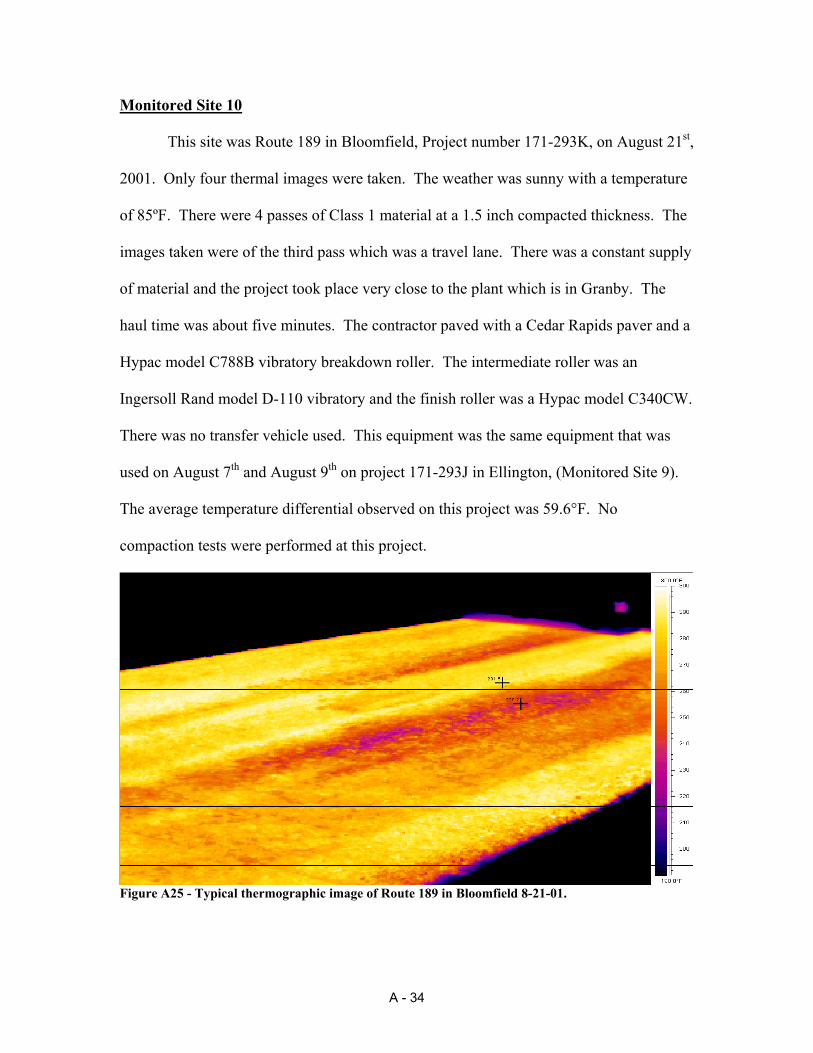
Monitored Site 10
This site was Route 189 in Bloomfield, Project number 171-293K, on August 21st,
2001. Only four thermal images were taken. The weather was sunny with a temperature
of 85ºF. There were 4 passes of Class 1 material at a 1.5 inch compacted thickness. The
images taken were of the third pass which was a travel lane. There was a constant supply
of material and the project took place very close to the plant which is in Granby. The
haul time was about five minutes. The contractor paved with a Cedar Rapids paver and a
Hypac model C788B vibratory breakdown roller. The intermediate roller was an
Ingersoll Rand model D-110 vibratory and the finish roller was a Hypac model C340CW.
There was no transfer vehicle used. This equipment was the same equipment that was
used on August 7th and August 9th on project 171-293J in Ellington, (Monitored Site 9).
The average temperature differential observed on this project was 59.6°F. No
compaction tests were performed at this project.
Figure A25 - Typical thermographic image of Route 189 in Bloomfield 8-21-01.
A - 34
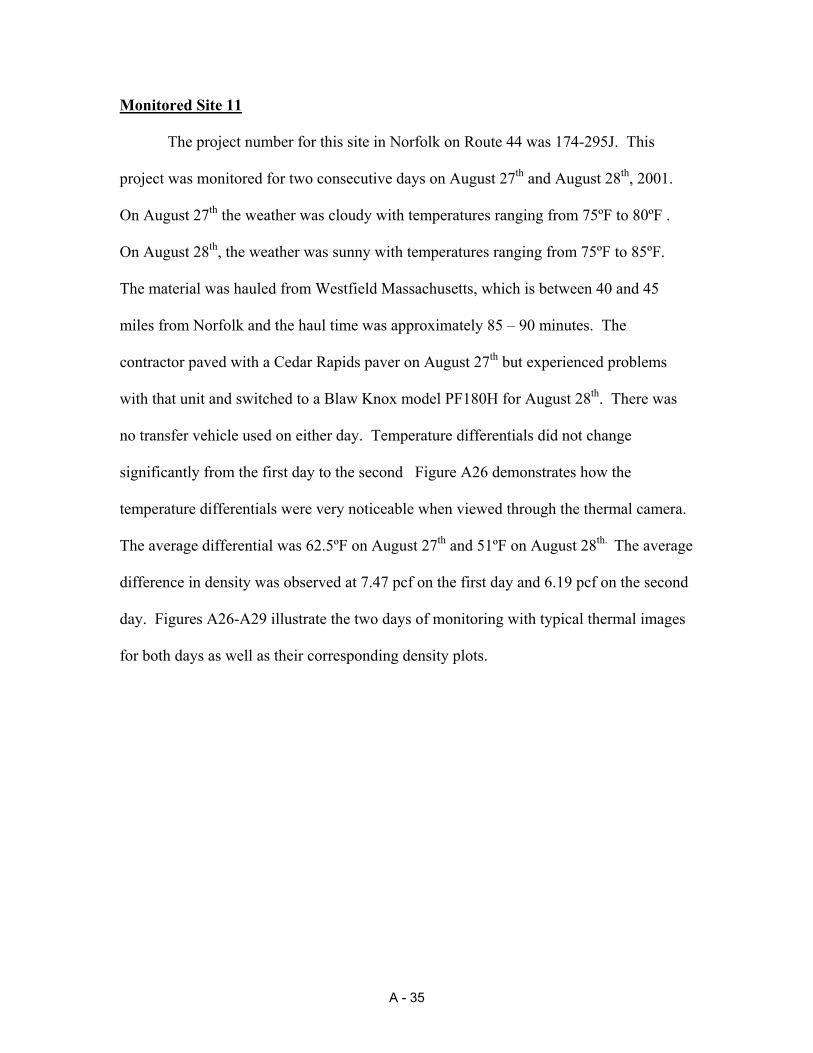
Monitored Site 11 The project number for this site in Norfolk on Route 44 was 174-295J. This
project was monitored for two consecutive days on August 27th and August 28th, 2001.
On August 27th the weather was cloudy with temperatures ranging from 75ºF to 80ºF .
On August 28th, the weather was sunny with temperatures ranging from 75ºF to 85ºF.
The material was hauled from Westfield Massachusetts, which is between 40 and 45
miles from Norfolk and the haul time was approximately 85 – 90 minutes. The
contractor paved with a Cedar Rapids paver on August 27th but experienced problems
with that unit and switched to a Blaw Knox model PF180H for August 28th. There was
no transfer vehicle used on either day. Temperature differentials did not change
significantly from the first day to the second Figure A26 demonstrates how the
temperature differentials were very noticeable when viewed through the thermal camera.
The average differential was 62.5ºF on August 27th and 51ºF on August 28th. The average
difference in density was observed at 7.47 pcf on the first day and 6.19 pcf on the second
day. Figures A26-A29 illustrate the two days of monitoring with typical thermal images
for both days as well as their corresponding density plots.
A - 35
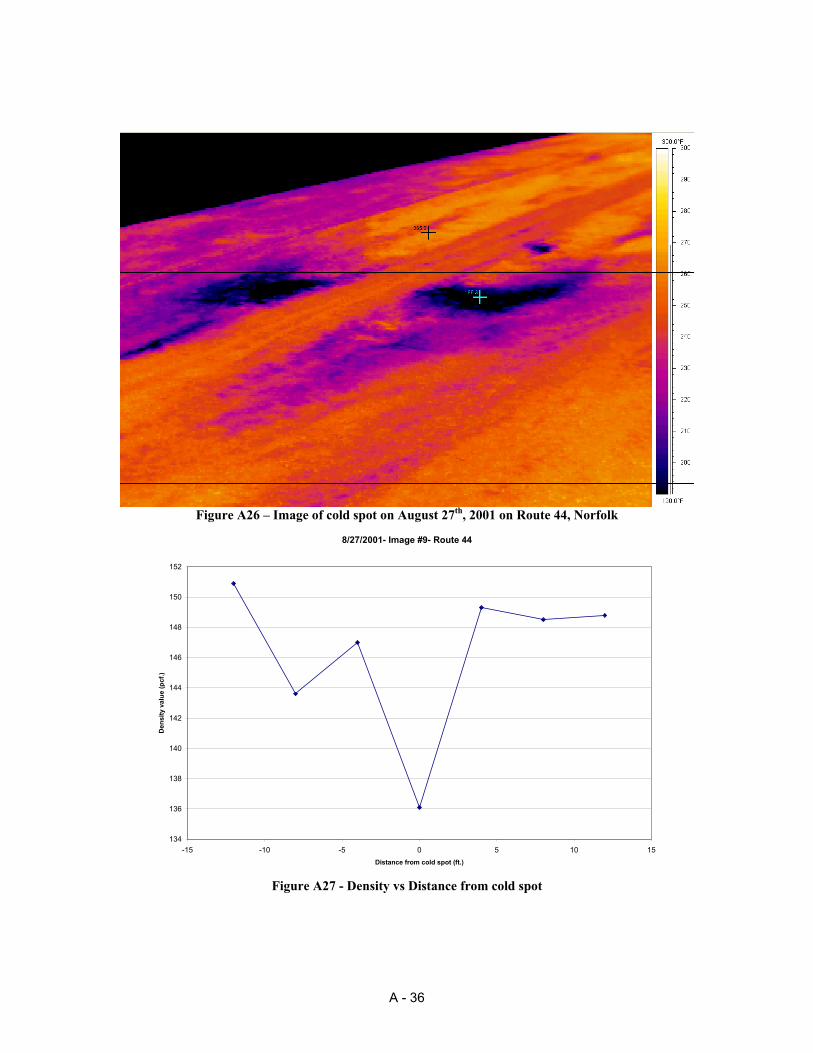
Figure A26 – Image of cold spot on August 27th, 2001 on Route 44, Norfolk
8/27/2001- Image #9- Route 44
134
136
138
140
142
144
146
148
150
152
-15 -10 -5 0 5 10 15Distance from cold spot (ft.)
Den
sity
val
ue (p
cf.)
Figure A27 - Density vs Distance from cold spot
A - 36
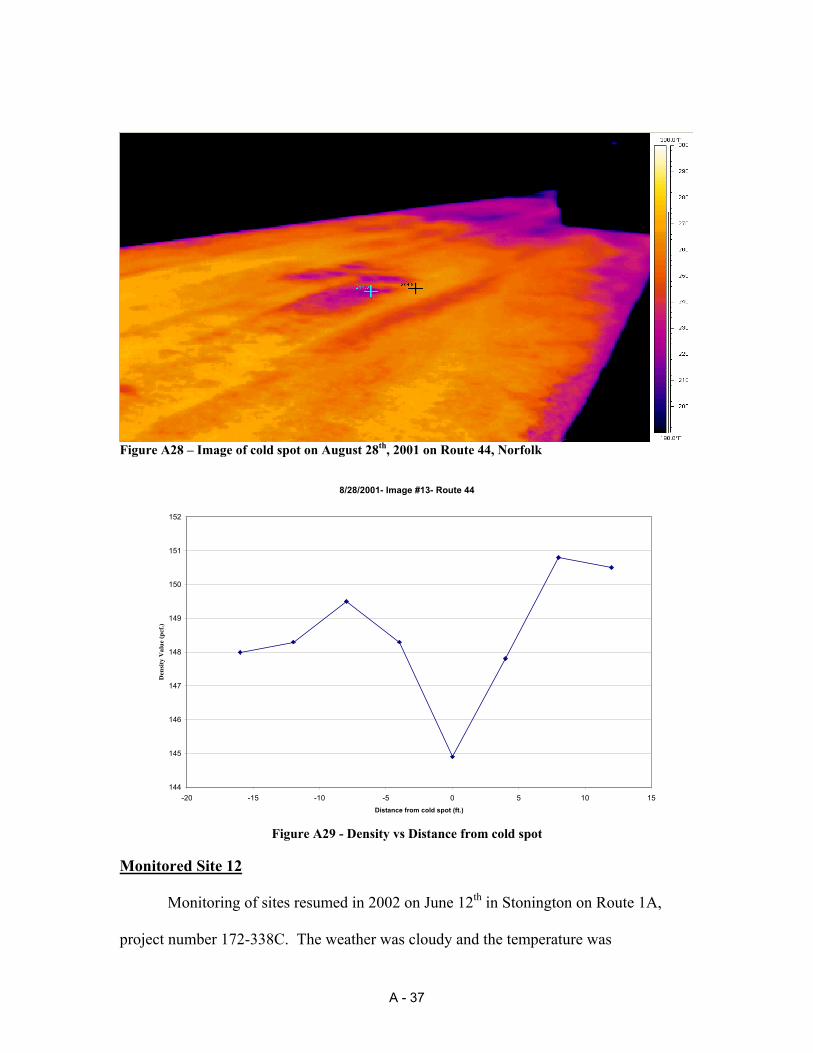
Figure A28 – Image of cold spot on August 28th, 2001 on Route 44, Norfolk
8/28/2001- Image #13- Route 44
144
145
146
147
148
149
150
151
152
-20 -15 -10 -5 0 5 10 15Distance from cold spot (ft.)
Den
sity
Val
ue (p
cf.)
Figure A29 - Density vs Distance from cold spot
Monitored Site 12
Monitoring of sites resumed in 2002 on June 12th in Stonington on Route 1A,
project number 172-338C. The weather was cloudy and the temperature was
A - 37
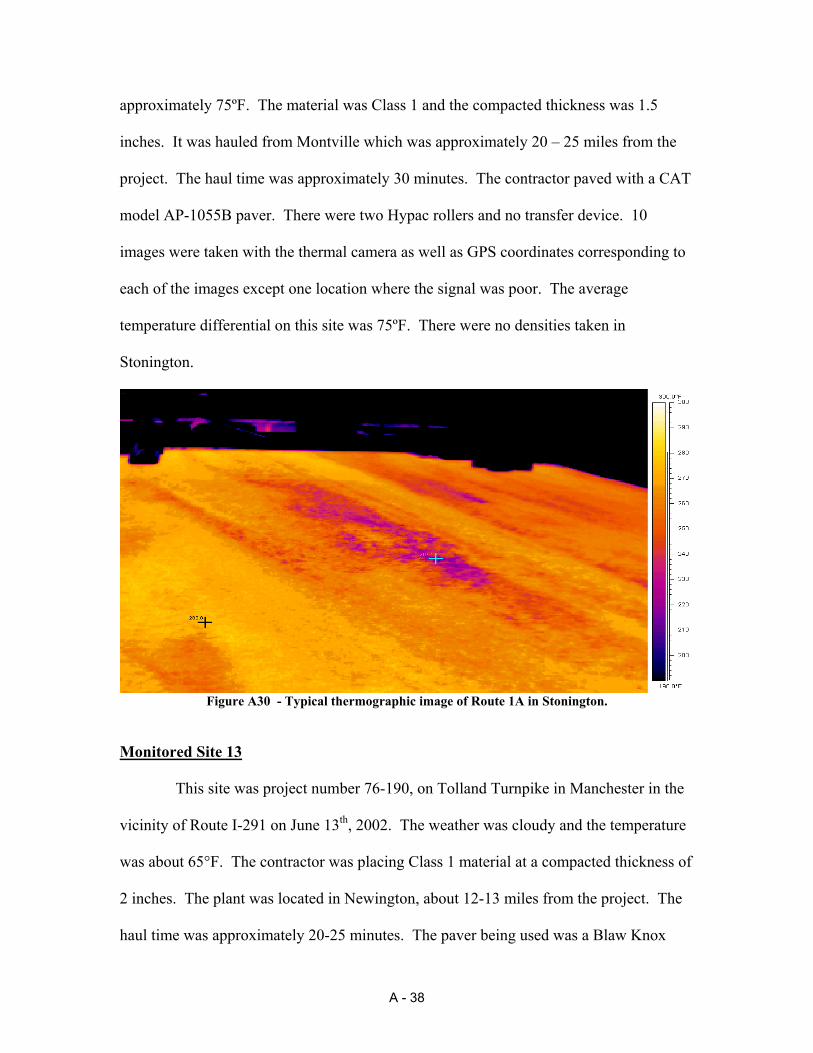
approximately 75ºF. The material was Class 1 and the compacted thickness was 1.5
inches. It was hauled from Montville which was approximately 20 – 25 miles from the
project. The haul time was approximately 30 minutes. The contractor paved with a CAT
model AP-1055B paver. There were two Hypac rollers and no transfer device. 10
images were taken with the thermal camera as well as GPS coordinates corresponding to
each of the images except one location where the signal was poor. The average
temperature differential on this site was 75ºF. There were no densities taken in
Stonington.
Figure A30 - Typical thermographic image of Route 1A in Stonington.
Monitored Site 13 This site was project number 76-190, on Tolland Turnpike in Manchester in the
vicinity of Route I-291 on June 13th, 2002. The weather was cloudy and the temperature
was about 65°F. The contractor was placing Class 1 material at a compacted thickness of
2 inches. The plant was located in Newington, about 12-13 miles from the project. The
haul time was approximately 20-25 minutes. The paver being used was a Blaw Knox
A - 38

PF3200. A CAT model CB634C vibratory roller was used for breakdown and a CAT
model CB534 was used for intermediate rolling as well as finish rolling. There was no
transfer vehicle used on this job. There were only 8 images taken on this particular day
because the plant broke down and the contractor was slowed considerably. The cold
spots seen in the images of this project correspond to truck change locations and there
were significant drops in density levels at these cold spots as seen in Figures A31 and
A32. The average temperature differential on this site was 47.4ºF and the average
density difference between warm and cool areas was 5.9 pcf.
A - 39
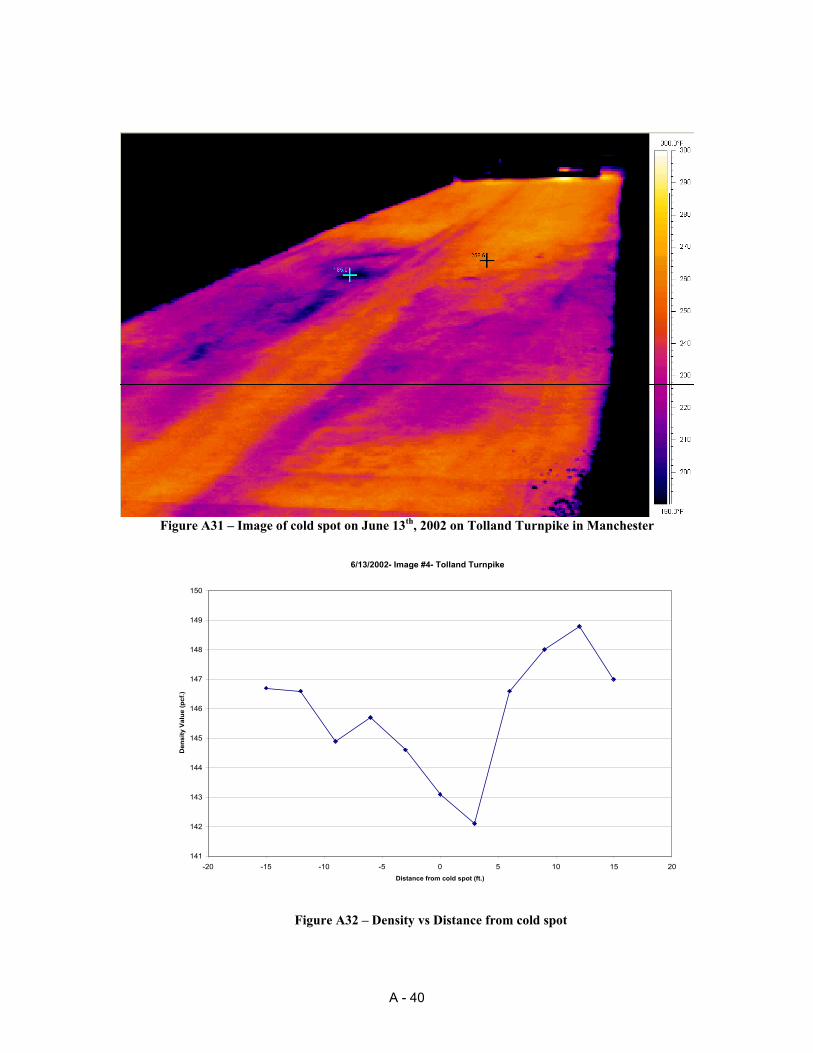
Figure A31 – Image of cold spot on June 13th, 2002 on Tolland Turnpike in Manchester
6/13/2002- Image #4- Tolland Turnpike
141
142
143
144
145
146
147
148
149
150
-20 -15 -10 -5 0 5 10 15 20Distance from cold spot (ft.)
Den
sity
Val
ue (p
cf.)
Figure A32 – Density vs Distance from cold spot
A - 40
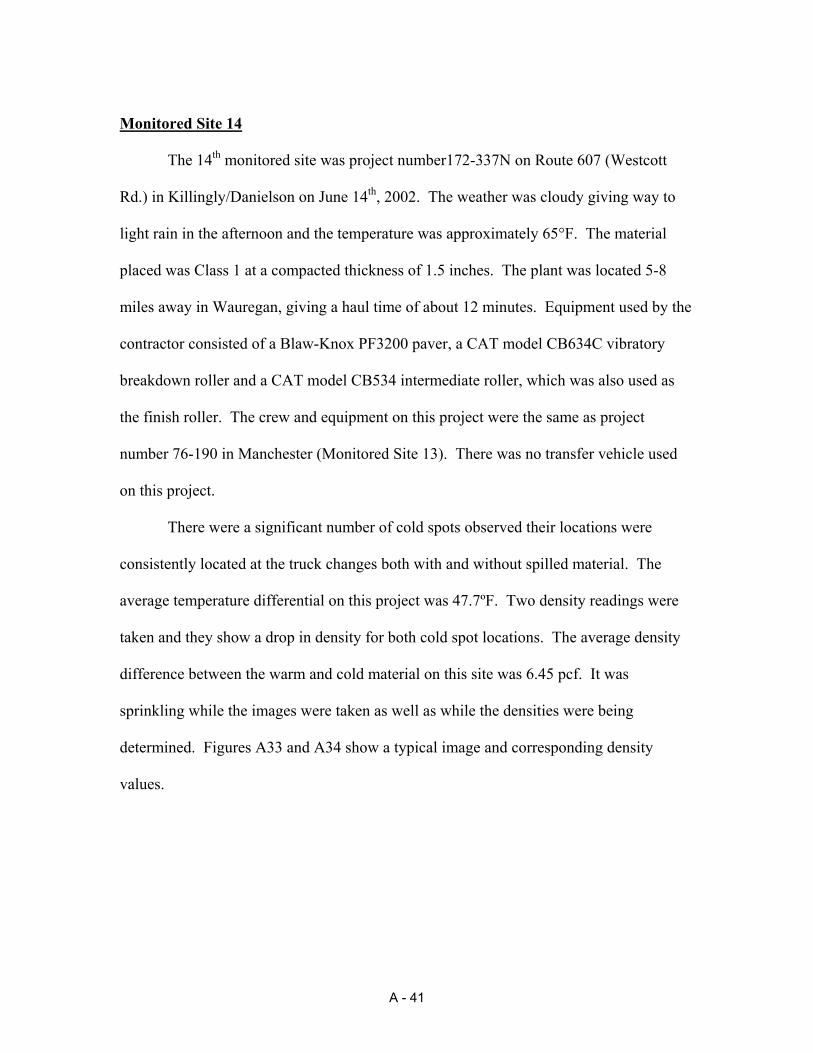
Monitored Site 14 The 14th monitored site was project number172-337N on Route 607 (Westcott
Rd.) in Killingly/Danielson on June 14th, 2002. The weather was cloudy giving way to
light rain in the afternoon and the temperature was approximately 65°F. The material
placed was Class 1 at a compacted thickness of 1.5 inches. The plant was located 5-8
miles away in Wauregan, giving a haul time of about 12 minutes. Equipment used by the
contractor consisted of a Blaw-Knox PF3200 paver, a CAT model CB634C vibratory
breakdown roller and a CAT model CB534 intermediate roller, which was also used as
the finish roller. The crew and equipment on this project were the same as project
number 76-190 in Manchester (Monitored Site 13). There was no transfer vehicle used
on this project.
There were a significant number of cold spots observed their locations were
consistently located at the truck changes both with and without spilled material. The
average temperature differential on this project was 47.7ºF. Two density readings were
taken and they show a drop in density for both cold spot locations. The average density
difference between the warm and cold material on this site was 6.45 pcf. It was
sprinkling while the images were taken as well as while the densities were being
determined. Figures A33 and A34 show a typical image and corresponding density
values.
A - 41
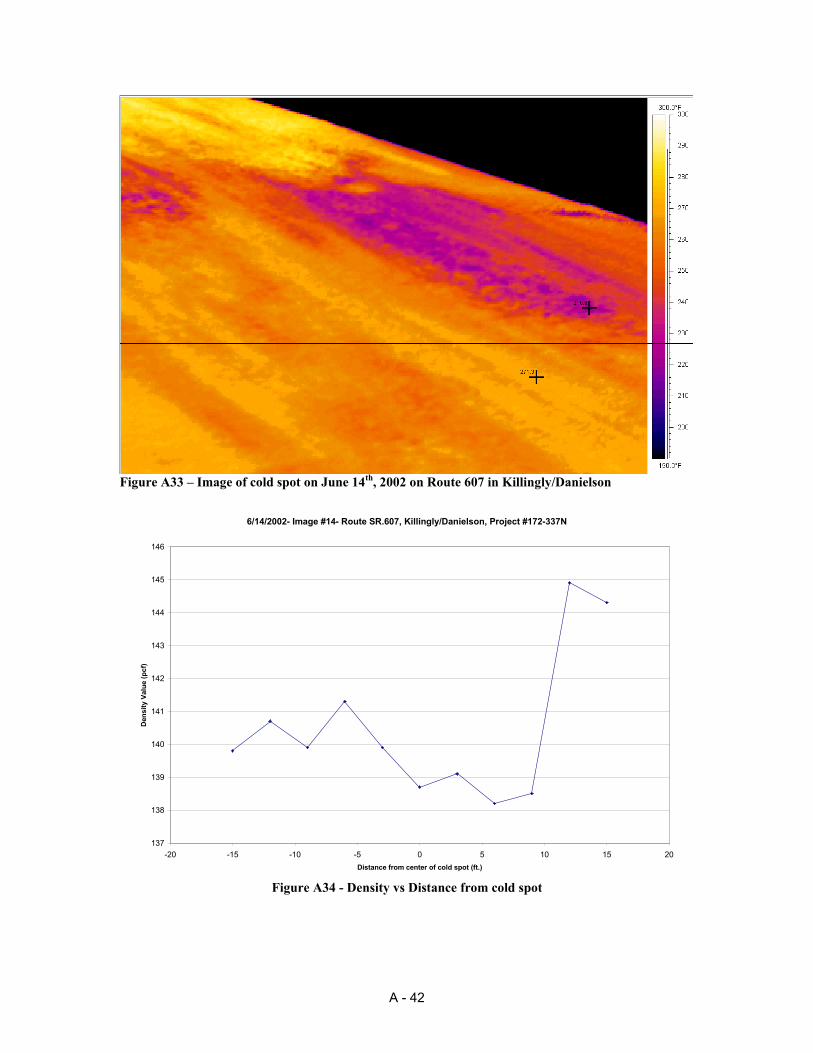
Figure A33 – Image of cold spot on June 14th, 2002 on Route 607 in Killingly/Danielson
6/14/2002- Image #14- Route SR.607, Killingly/Danielson, Project #172-337N
137
138
139
140
141
142
143
144
145
146
-20 -15 -10 -5 0 5 10 15 20Distance from center of cold spot (ft.)
Den
sity
Val
ue (p
cf)
Figure A34 - Density vs Distance from cold spot
A - 42

Monitored Site 15
This site was monitored on June 19th, as well as June 21st, 2002 on Route 16 in
Colchester/Lebanon. The project number was 172-337C. The weather was sunny with
temperatures approximately 65°F-70°F on June 19th. The base pavement temperature
was about 90°F. On June 21st, the weather was also sunny with temperatures ranging
from 75°F -85°F. The material being placed was Class 1 and the compacted thickness
was 2 inches. The plant was 15 miles away in Franklin, which yielded a 25 minute haul
time for the trucks. The contractor used a Blaw-Knox model PF-200B paver, a Hyster
breakdown roller and an Ingersoll-Rand model DD-110 for intermediate rolling as well as
finish rolling. The equipment did not change from June 19th to June 21st and there was no
material transfer vehicle involved. The trucks appeared to be loaded with a single drop at
the plant on both monitoring days. The frequency of cold spots did not appear to change
between the two days either. The average temperature differential on day one of
monitoring was 42°F and 52.5°F on the second day of monitoring. The densities
measurements taken show data resembling that of typical cold spots with density values
dropping at the cold spot location as shown in Figure A36. Figure A36 shows density
measured first at the cold spot center and then from increasing distances from the cold
spot center. The density values increase as the distance from the cold spot increases
which corresponds to increasing temperatures of the mat. The average difference in
density between warm and cool areas seen on this day was 1.8 pcf. The densities taken
of the cold spots on the second day, June 21, contain more complete data as there was
more time available for densities to be read. The average difference in density between
A - 43
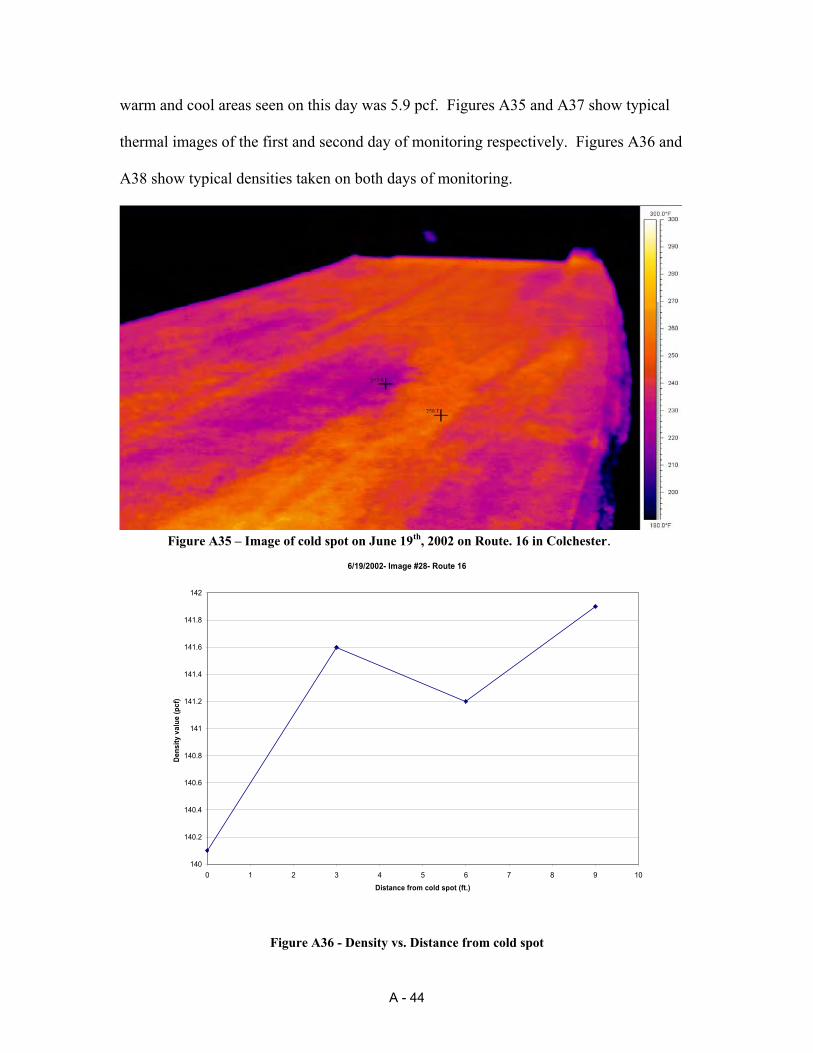
warm and cool areas seen on this day was 5.9 pcf. Figures A35 and A37 show typical
thermal images of the first and second day of monitoring respectively. Figures A36 and
A38 show typical densities taken on both days of monitoring.
Figure A35 – Image of cold spot on June 19th, 2002 on Route. 16 in Colchester.
6/19/2002- Image #28- Route 16
140
140.2
140.4
140.6
140.8
141
141.2
141.4
141.6
141.8
142
0 1 2 3 4 5 6 7 8 9 10Distance from cold spot (ft.)
Dens
ity v
alue
(pcf
)
Figure A36 - Density vs. Distance from cold spot
A - 44
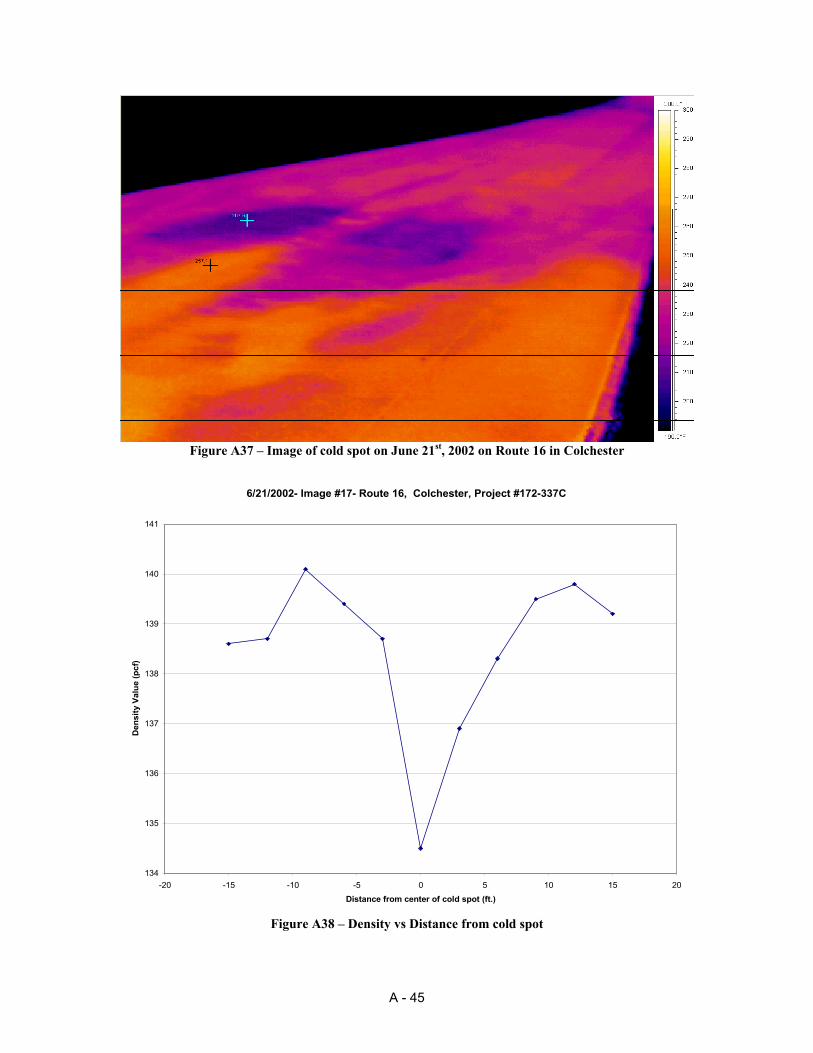
Figure A37 – Image of cold spot on June 21st, 2002 on Route 16 in Colchester
6/21/2002- Image #17- Route 16, Colchester, Project #172-337C
134
135
136
137
138
139
140
141
-20 -15 -10 -5 0 5 10 15 20Distance from center of cold spot (ft.)
Den
sity
Val
ue (p
cf)
Figure A38 – Density vs Distance from cold spot
A - 45
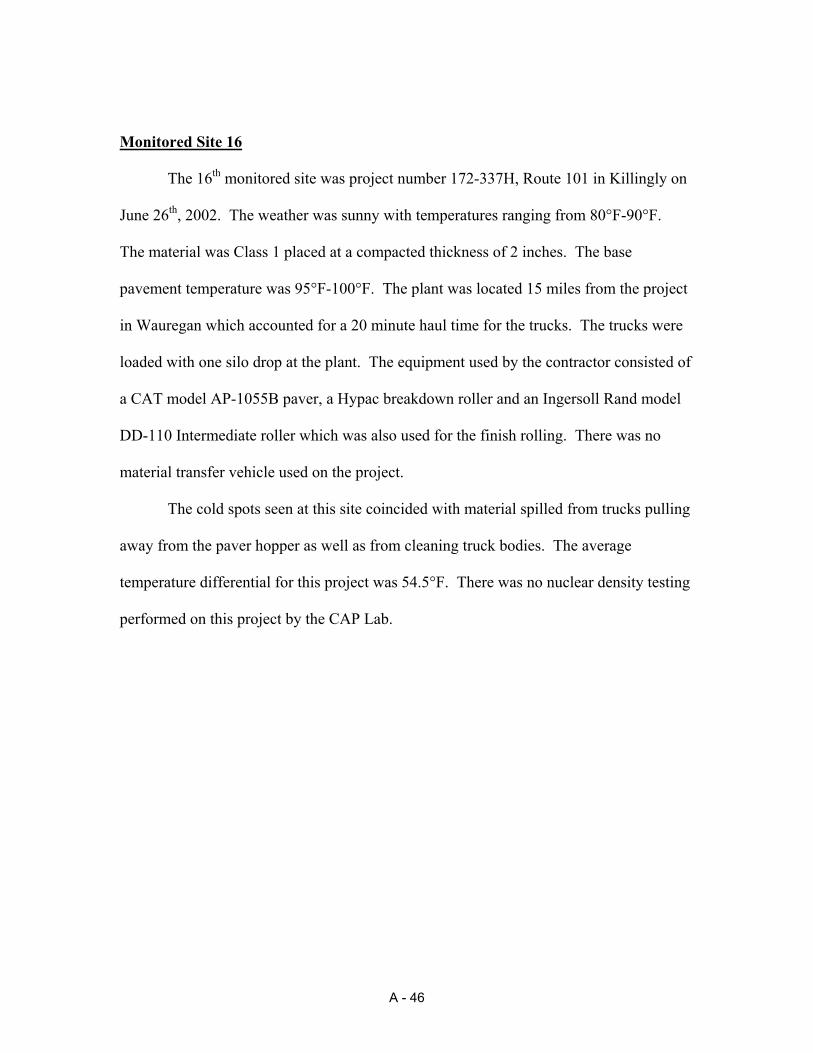
Monitored Site 16
The 16th monitored site was project number 172-337H, Route 101 in Killingly on
June 26th, 2002. The weather was sunny with temperatures ranging from 80°F-90°F.
The material was Class 1 placed at a compacted thickness of 2 inches. The base
pavement temperature was 95°F-100°F. The plant was located 15 miles from the project
in Wauregan which accounted for a 20 minute haul time for the trucks. The trucks were
loaded with one silo drop at the plant. The equipment used by the contractor consisted of
a CAT model AP-1055B paver, a Hypac breakdown roller and an Ingersoll Rand model
DD-110 Intermediate roller which was also used for the finish rolling. There was no
material transfer vehicle used on the project.
The cold spots seen at this site coincided with material spilled from trucks pulling
away from the paver hopper as well as from cleaning truck bodies. The average
temperature differential for this project was 54.5°F. There was no nuclear density testing
performed on this project by the CAP Lab.
A - 46
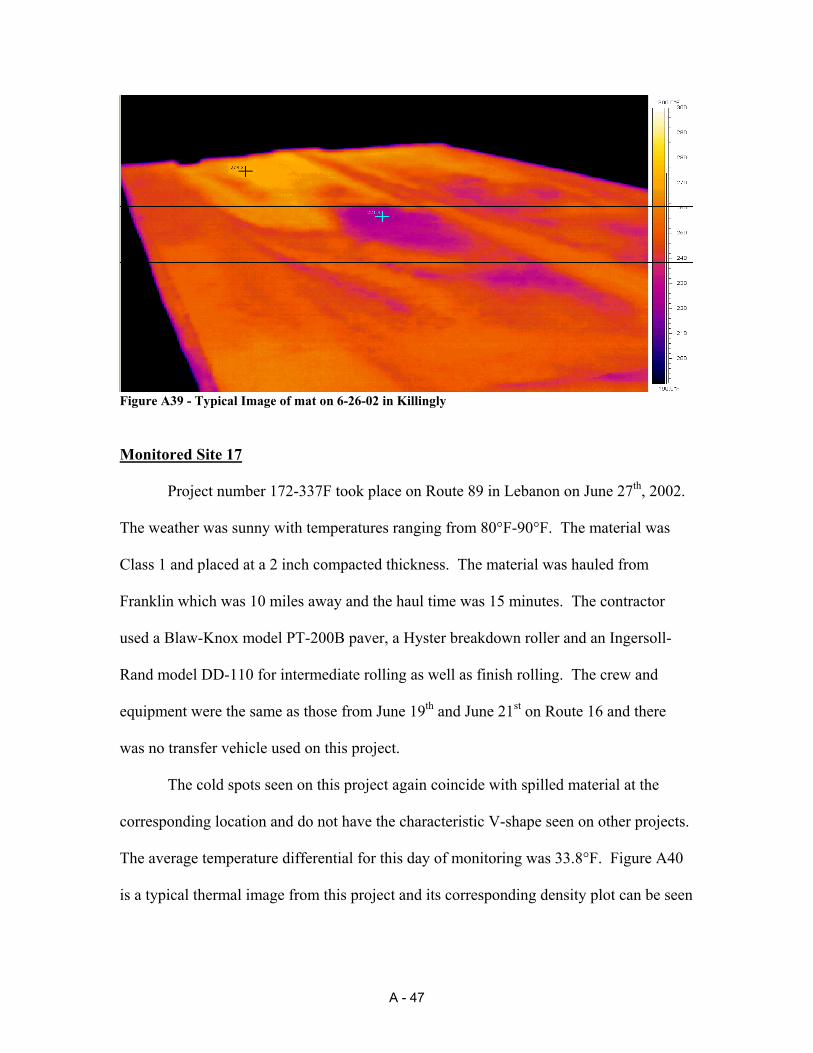
Figure A39 - Typical Image of mat on 6-26-02 in Killingly
Monitored Site 17
Project number 172-337F took place on Route 89 in Lebanon on June 27th, 2002.
The weather was sunny with temperatures ranging from 80°F-90°F. The material was
Class 1 and placed at a 2 inch compacted thickness. The material was hauled from
Franklin which was 10 miles away and the haul time was 15 minutes. The contractor
used a Blaw-Knox model PT-200B paver, a Hyster breakdown roller and an Ingersoll-
Rand model DD-110 for intermediate rolling as well as finish rolling. The crew and
equipment were the same as those from June 19th and June 21st on Route 16 and there
was no transfer vehicle used on this project.
The cold spots seen on this project again coincide with spilled material at the
corresponding location and do not have the characteristic V-shape seen on other projects.
The average temperature differential for this day of monitoring was 33.8°F. Figure A40
is a typical thermal image from this project and its corresponding density plot can be seen
A - 47
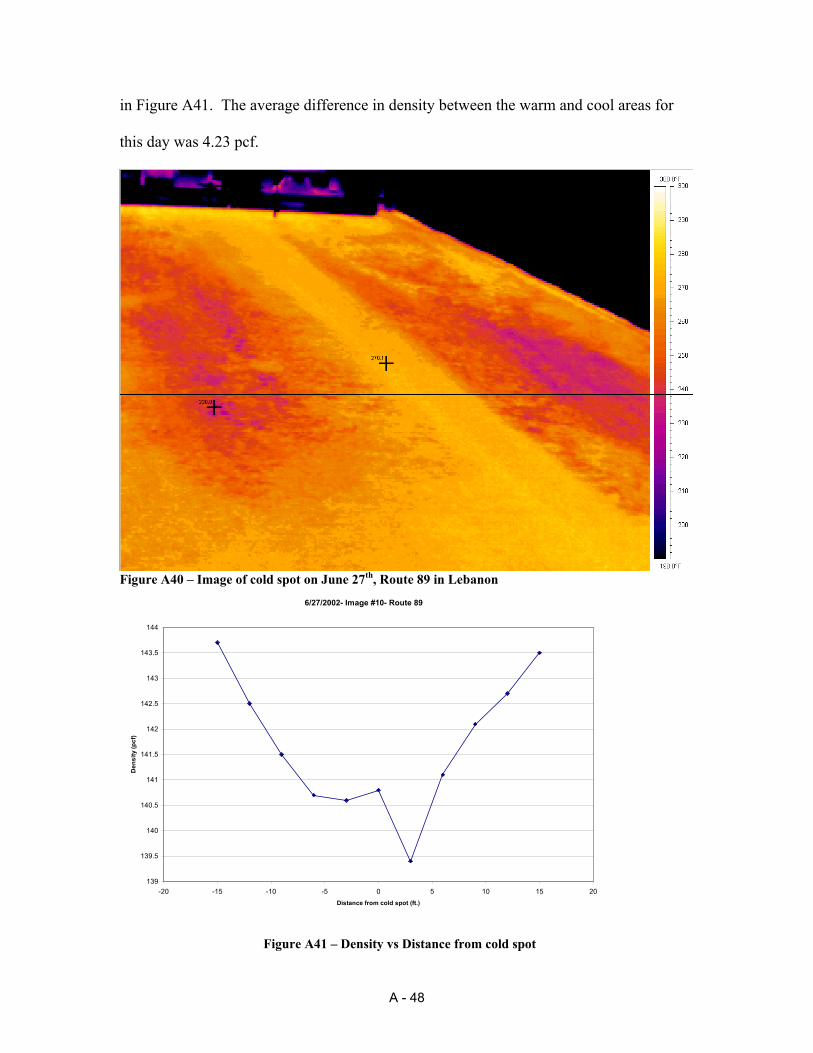
in Figure A41. The average difference in density between the warm and cool areas for
this day was 4.23 pcf.
Figure A40 – Image of cold spot on June 27th, Route 89 in Lebanon 6/27/2002- Image #10- Route 89
139
139.5
140
140.5
141
141.5
142
142.5
143
143.5
144
-20 -15 -10 -5 0 5 10 15 20Distance from cold spot (ft.)
Den
sity
(pcf
)
Figure A41 – Density vs Distance from cold spot
A - 48
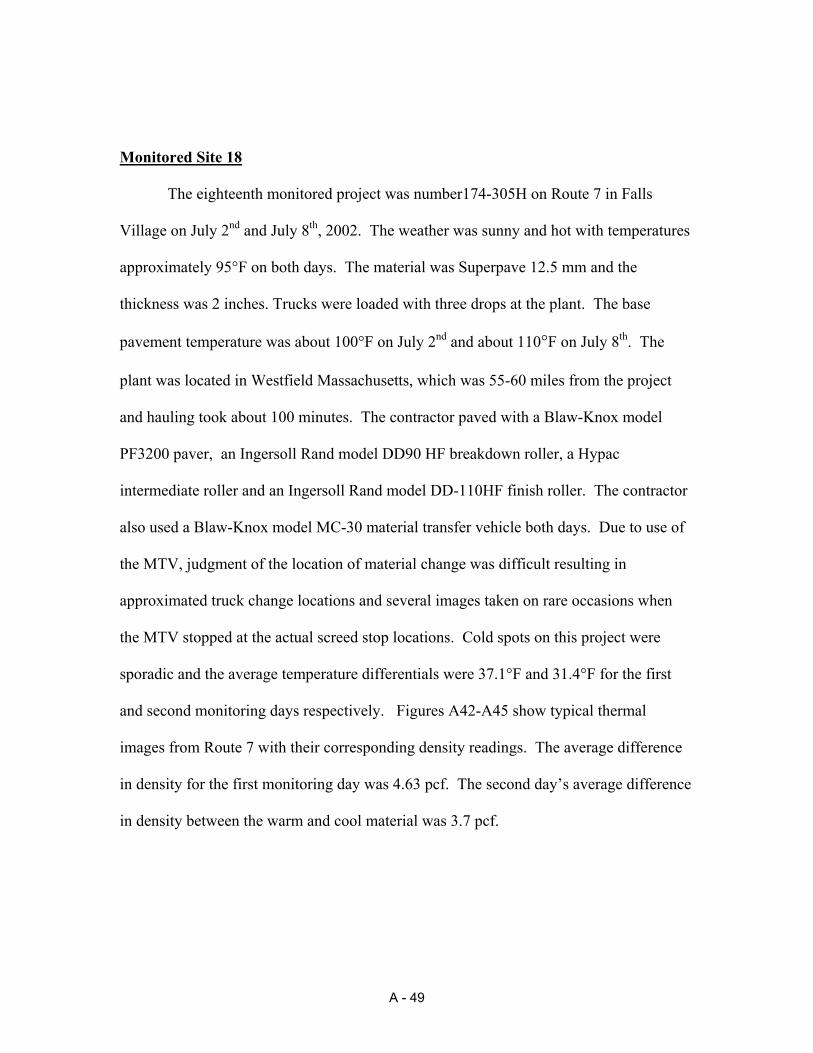
Monitored Site 18
The eighteenth monitored project was number174-305H on Route 7 in Falls
Village on July 2nd and July 8th, 2002. The weather was sunny and hot with temperatures
approximately 95°F on both days. The material was Superpave 12.5 mm and the
thickness was 2 inches. Trucks were loaded with three drops at the plant. The base
pavement temperature was about 100°F on July 2nd and about 110°F on July 8th. The
plant was located in Westfield Massachusetts, which was 55-60 miles from the project
and hauling took about 100 minutes. The contractor paved with a Blaw-Knox model
PF3200 paver, an Ingersoll Rand model DD90 HF breakdown roller, a Hypac
intermediate roller and an Ingersoll Rand model DD-110HF finish roller. The contractor
also used a Blaw-Knox model MC-30 material transfer vehicle both days. Due to use of
the MTV, judgment of the location of material change was difficult resulting in
approximated truck change locations and several images taken on rare occasions when
the MTV stopped at the actual screed stop locations. Cold spots on this project were
sporadic and the average temperature differentials were 37.1°F and 31.4°F for the first
and second monitoring days respectively. Figures A42-A45 show typical thermal
images from Route 7 with their corresponding density readings. The average difference
in density for the first monitoring day was 4.63 pcf. The second day’s average difference
in density between the warm and cool material was 3.7 pcf.
A - 49
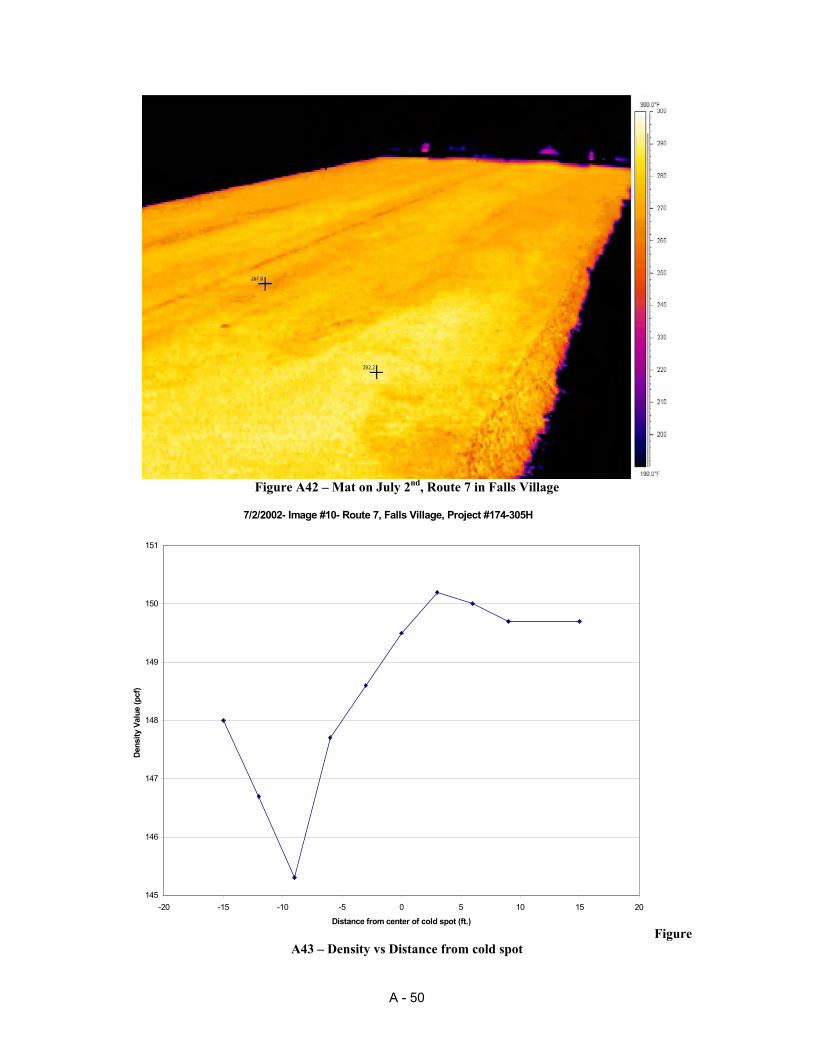
Figure A42 – Mat on July 2nd, Route 7 in Falls Village
7/2/2002- Image #10- Route 7, Falls Village, Project #174-305H
145
146
147
148
149
150
151
-20 -15 -10 -5 0 5 10 15 20
Distance from center of cold spot (ft.)
Dens
ity V
alue
(pcf
)
Figure A43 – Density vs Distance from cold spot
A - 50
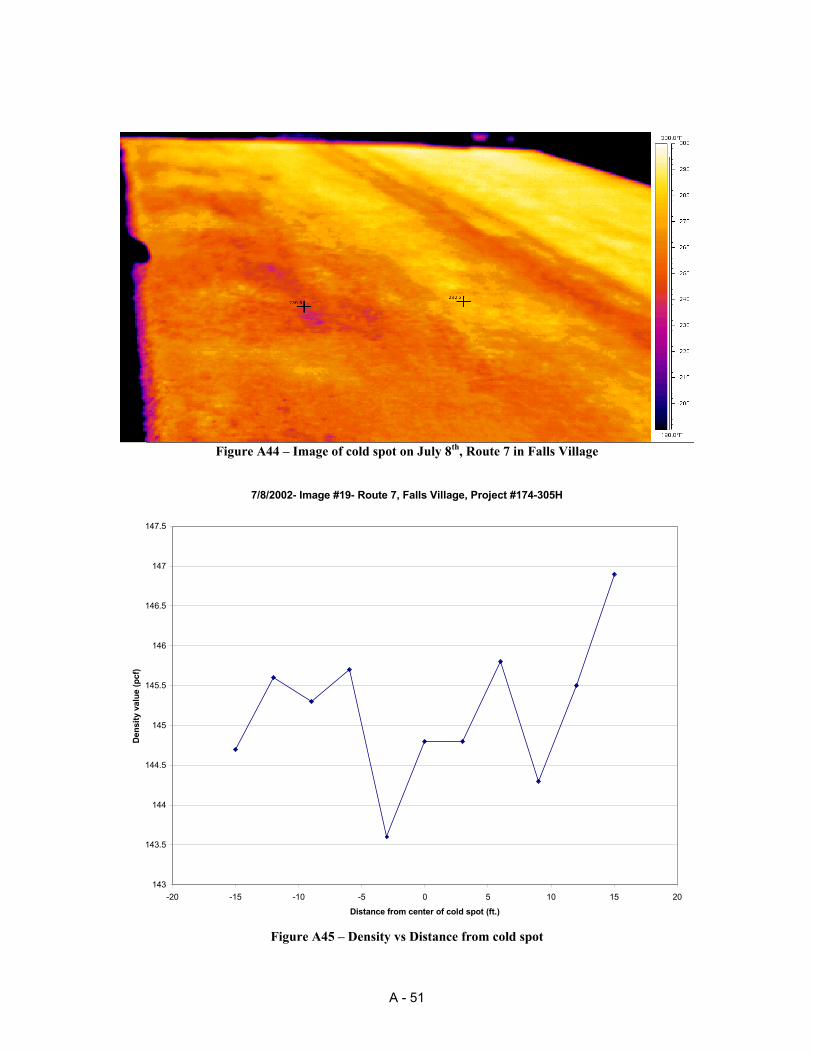
Figure A44 – Image of cold spot on July 8th, Route 7 in Falls Village
7/8/2002- Image #19- Route 7, Falls Village, Project #174-305H
143
143.5
144
144.5
145
145.5
146
146.5
147
147.5
-20 -15 -10 -5 0 5 10 15 20
Distance from center of cold spot (ft.)
Dens
ity v
alue
(pcf
)
Figure A45 – Density vs Distance from cold spot
A - 51
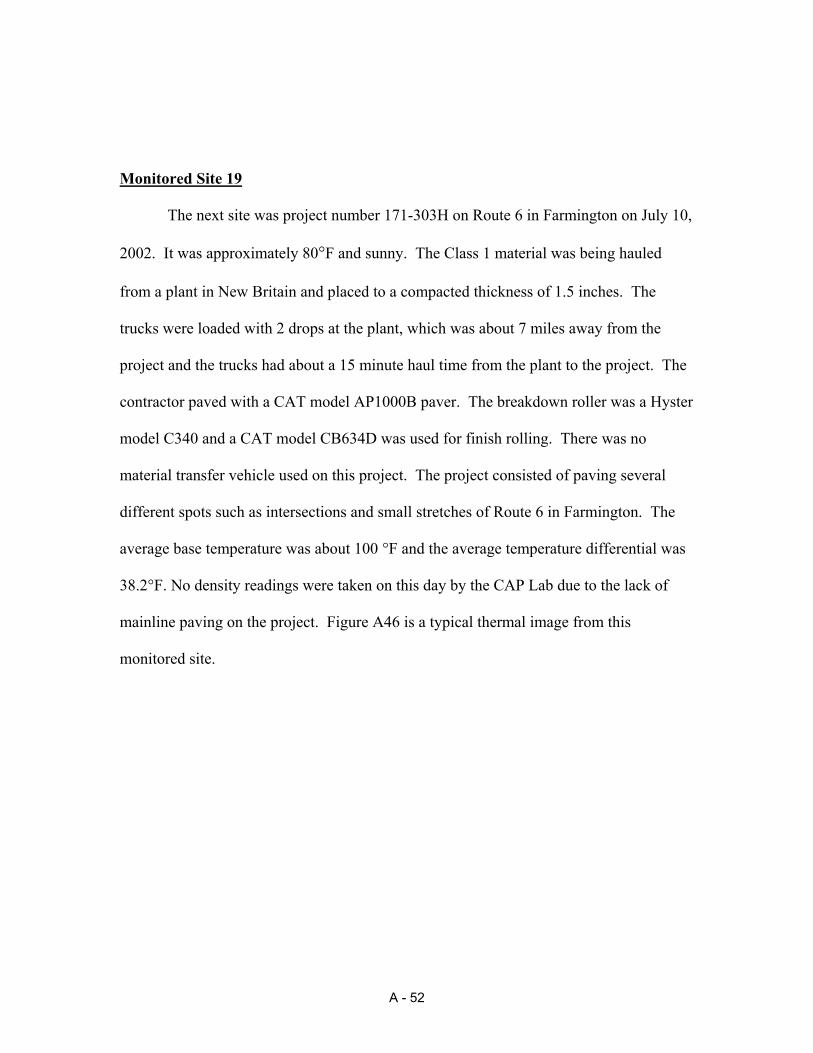
Monitored Site 19
The next site was project number 171-303H on Route 6 in Farmington on July 10,
2002. It was approximately 80°F and sunny. The Class 1 material was being hauled
from a plant in New Britain and placed to a compacted thickness of 1.5 inches. The
trucks were loaded with 2 drops at the plant, which was about 7 miles away from the
project and the trucks had about a 15 minute haul time from the plant to the project. The
contractor paved with a CAT model AP1000B paver. The breakdown roller was a Hyster
model C340 and a CAT model CB634D was used for finish rolling. There was no
material transfer vehicle used on this project. The project consisted of paving several
different spots such as intersections and small stretches of Route 6 in Farmington. The
average base temperature was about 100 °F and the average temperature differential was
38.2°F. No density readings were taken on this day by the CAP Lab due to the lack of
mainline paving on the project. Figure A46 is a typical thermal image from this
monitored site.
A - 52
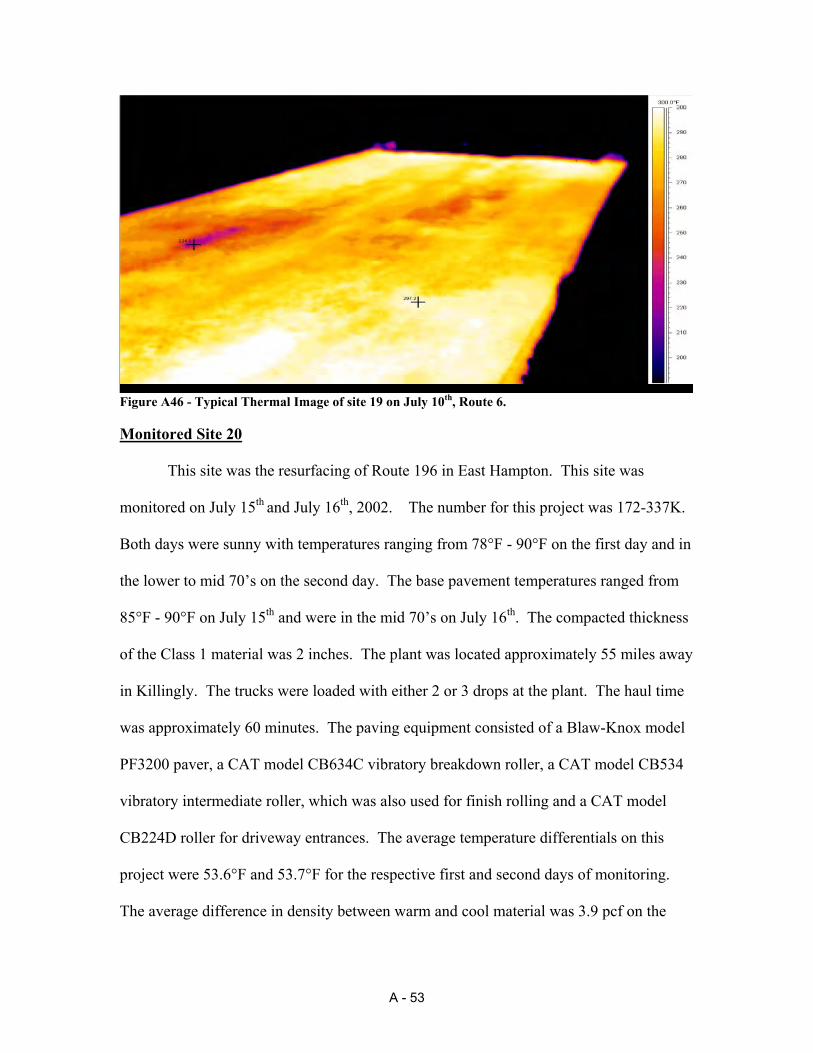
Figure A46 - Typical Thermal Image of site 19 on July 10th, Route 6.
Monitored Site 20
This site was the resurfacing of Route 196 in East Hampton. This site was
monitored on July 15th and July 16th, 2002. The number for this project was 172-337K.
Both days were sunny with temperatures ranging from 78°F - 90°F on the first day and in
the lower to mid 70’s on the second day. The base pavement temperatures ranged from
85°F - 90°F on July 15th and were in the mid 70’s on July 16th. The compacted thickness
of the Class 1 material was 2 inches. The plant was located approximately 55 miles away
in Killingly. The trucks were loaded with either 2 or 3 drops at the plant. The haul time
was approximately 60 minutes. The paving equipment consisted of a Blaw-Knox model
PF3200 paver, a CAT model CB634C vibratory breakdown roller, a CAT model CB534
vibratory intermediate roller, which was also used for finish rolling and a CAT model
CB224D roller for driveway entrances. The average temperature differentials on this
project were 53.6°F and 53.7°F for the respective first and second days of monitoring.
The average difference in density between warm and cool material was 3.9 pcf on the
A - 53
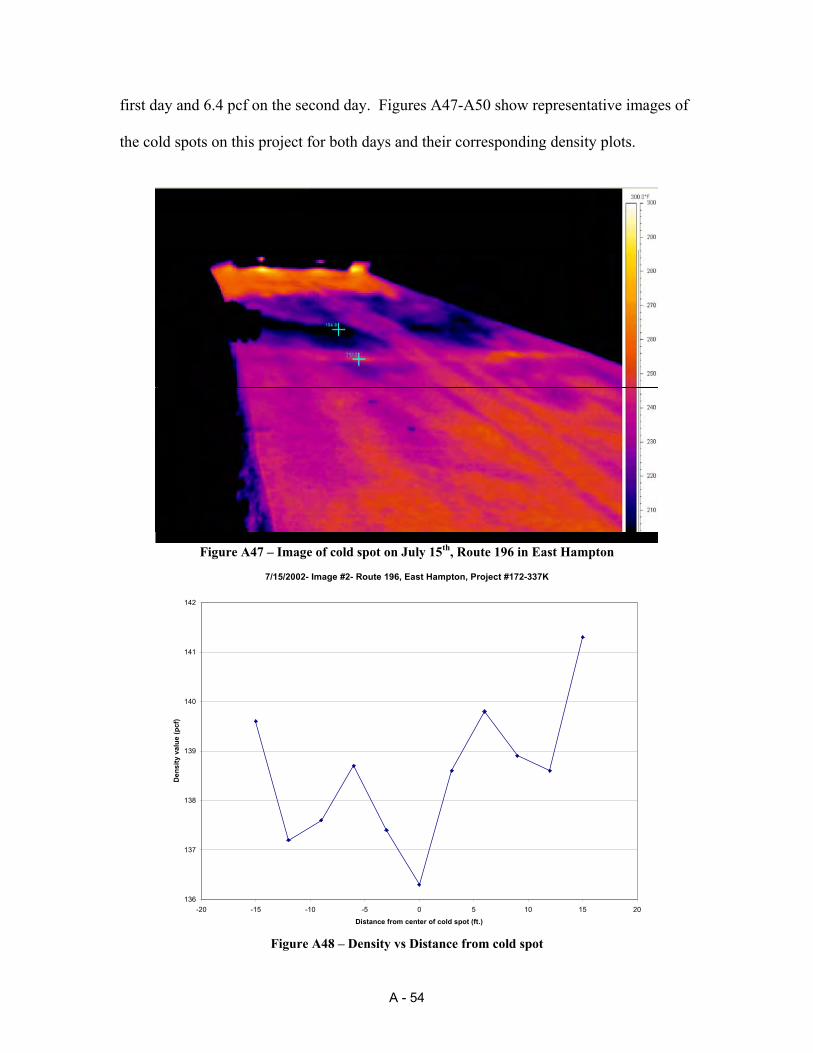
first day and 6.4 pcf on the second day. Figures A47-A50 show representative images of
the cold spots on this project for both days and their corresponding density plots.
Figure A47 – Image of cold spot on July 15th, Route 196 in East Hampton
7/15/2002- Image #2- Route 196, East Hampton, Project #172-337K
136
137
138
139
140
141
142
-20 -15 -10 -5 0 5 10 15 20
Distance from center of cold spot (ft.)
Den
sity
val
ue (p
cf)
Figure A48 – Density vs Distance from cold spot
A - 54
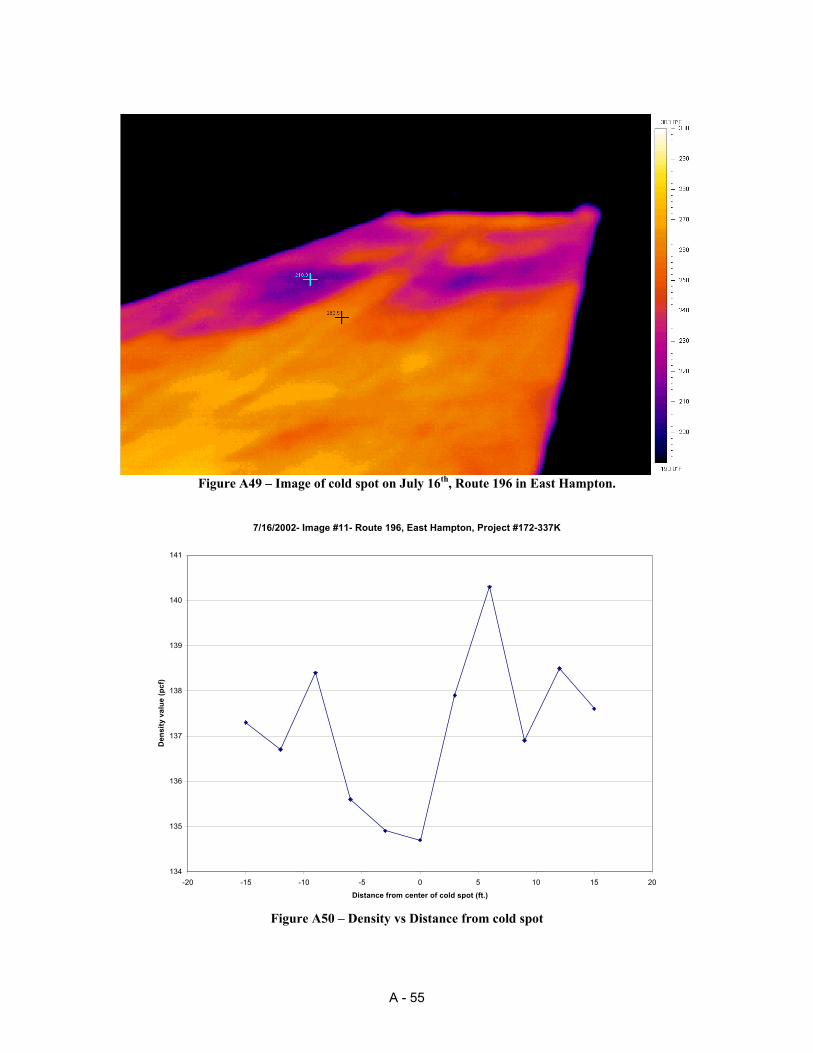
Figure A49 – Image of cold spot on July 16th, Route 196 in East Hampton.
7/16/2002- Image #11- Route 196, East Hampton, Project #172-337K
134
135
136
137
138
139
140
141
-20 -15 -10 -5 0 5 10 15 20
Distance from center of cold spot (ft.)
Den
sity
val
ue (p
cf)
Figure A50 – Density vs Distance from cold spot
A - 55

Monitored Site 21 This site was monitored on July 17, 2002 on Interstate I-91 Southbound in
Wallingford. The project number was 173-348. The weather was sunny with
temperatures ranging from 80°F - 90°F. The temperature of the base pavement was
100°F. The material was Superpave 12.5 mm and the compacted thickness of the mat
was 2 inches. The material was being hauled from a plant in Wallingford about 5 miles
from the project. Hauling time was about ten minutes. The contractor paved with a CAT
model AP-1000B paver. The breakdown roller was an Ingersoll Rand model DD90HF.
The intermediate and finish roller was a CAT model CB634C. The contractor also used a
Roadtec model SB2000B material transfer vehicle on this project. Although the
thermographic images appear to be very uniform in temperature, the densities varied
from point to point as can be seen in the density plot in Figure A52. The average
temperature differential on this project was 9.1°F and the average difference in density
was 1.75 pcf. Figure A51 is a typical thermal image with corresponding density readings
from this project.
A - 56
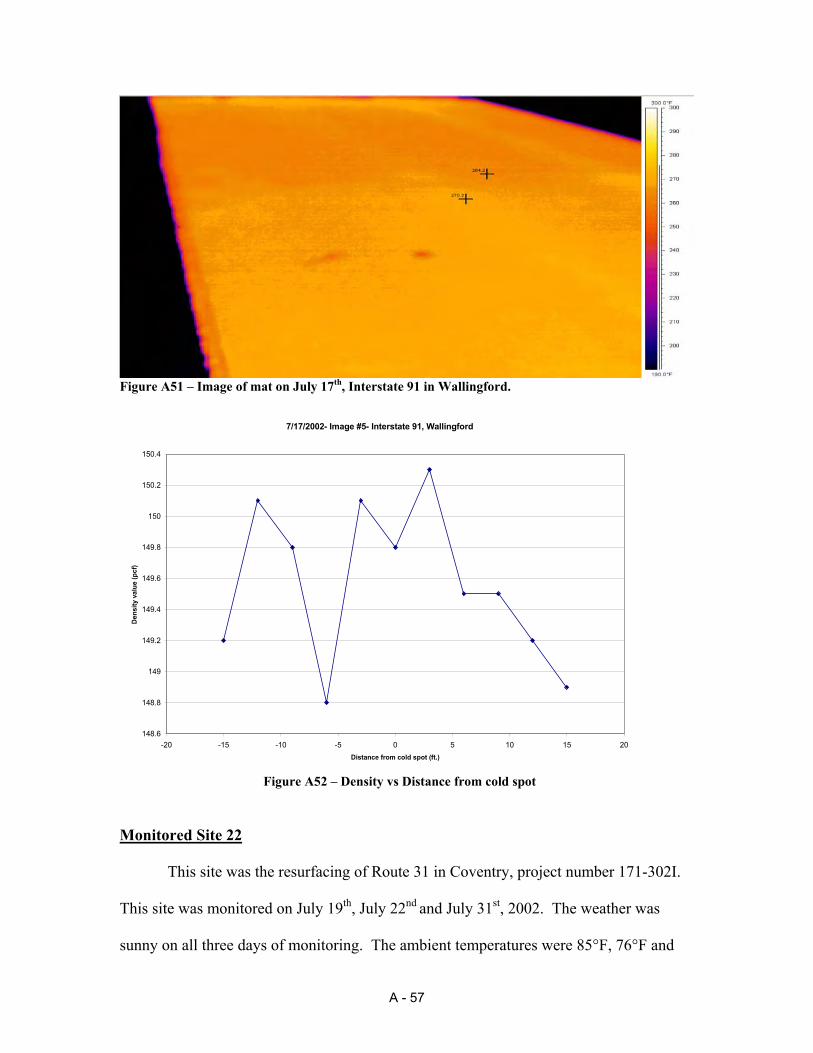
Figure A51 – Image of mat on July 17th, Interstate 91 in Wallingford.
7/17/2002- Image #5- Interstate 91, Wallingford
148.6
148.8
149
149.2
149.4
149.6
149.8
150
150.2
150.4
-20 -15 -10 -5 0 5 10 15 20Distance from cold spot (ft.)
Dens
ity v
alue
(pcf
)
Figure A52 – Density vs Distance from cold spot
Monitored Site 22 This site was the resurfacing of Route 31 in Coventry, project number 171-302I.
This site was monitored on July 19th, July 22nd and July 31st, 2002. The weather was
sunny on all three days of monitoring. The ambient temperatures were 85°F, 76°F and
A - 57
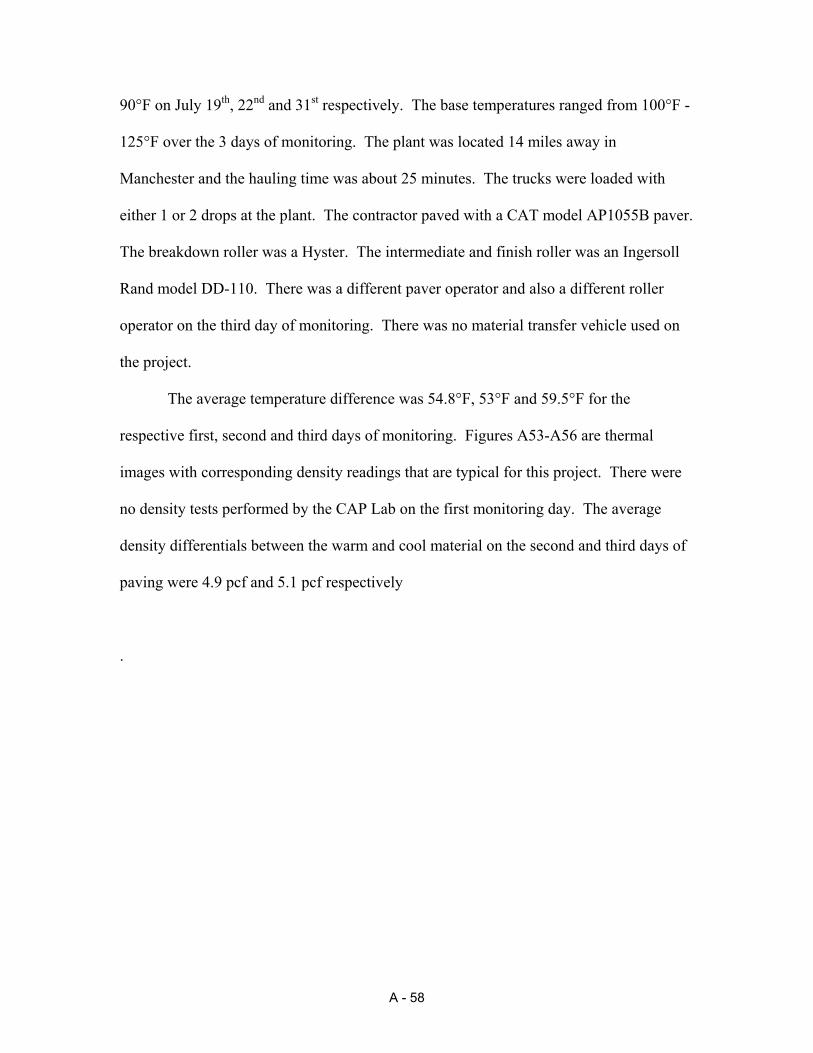
90°F on July 19th, 22nd and 31st respectively. The base temperatures ranged from 100°F -
125°F over the 3 days of monitoring. The plant was located 14 miles away in
Manchester and the hauling time was about 25 minutes. The trucks were loaded with
either 1 or 2 drops at the plant. The contractor paved with a CAT model AP1055B paver.
The breakdown roller was a Hyster. The intermediate and finish roller was an Ingersoll
Rand model DD-110. There was a different paver operator and also a different roller
operator on the third day of monitoring. There was no material transfer vehicle used on
the project.
The average temperature difference was 54.8°F, 53°F and 59.5°F for the
respective first, second and third days of monitoring. Figures A53-A56 are thermal
images with corresponding density readings that are typical for this project. There were
no density tests performed by the CAP Lab on the first monitoring day. The average
density differentials between the warm and cool material on the second and third days of
paving were 4.9 pcf and 5.1 pcf respectively
.
A - 58
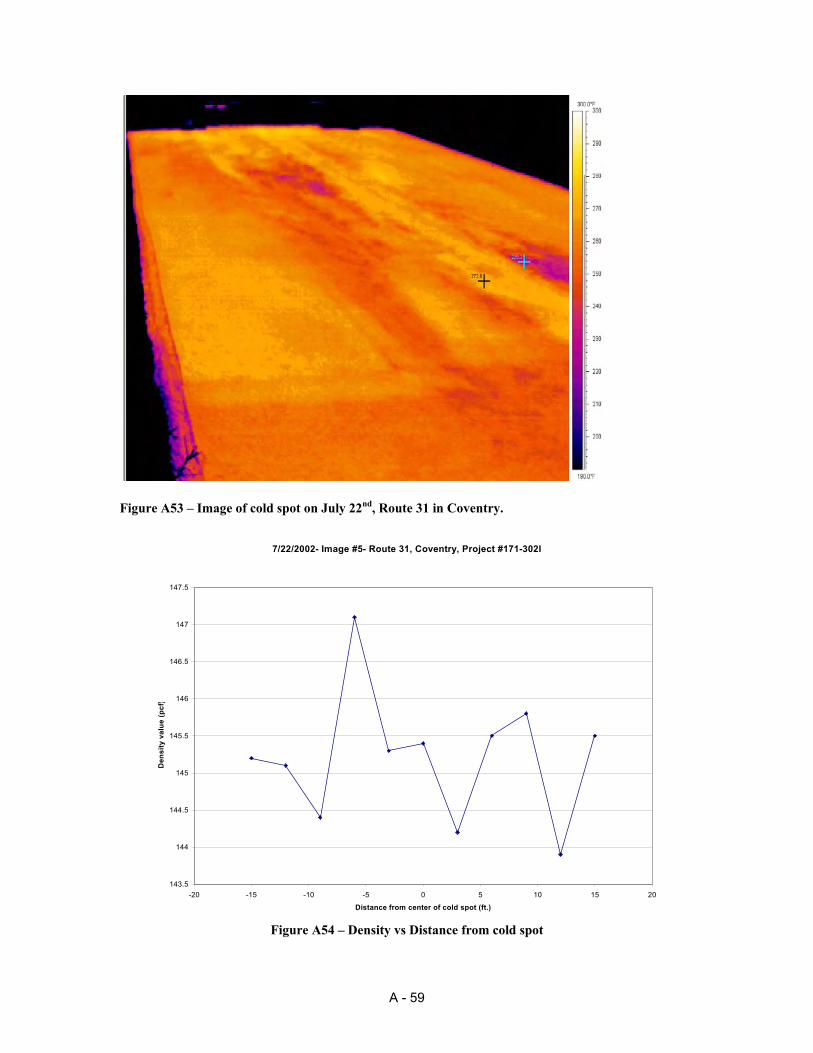
Figure A53 – Image of cold spot on July 22nd, Route 31 in Coventry.
7/22/2002- Image #5- Route 31, Coventry, Project #171-302I
143.5
144
144.5
145
145.5
146
146.5
147
147.5
-20 -15 -10 -5 0 5 10 15 20
Distance from center of cold spot (ft.)
Den
sity
val
ue (p
cf)
Figure A54 – Density vs Distance from cold spot
A - 59
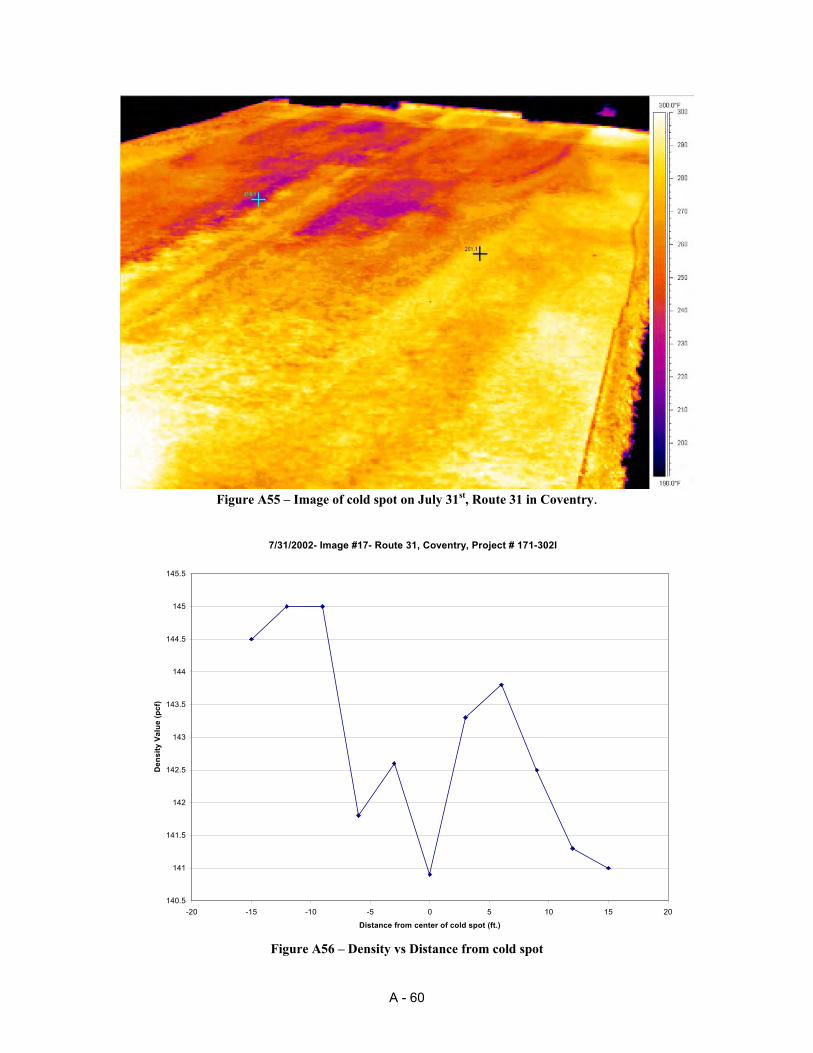
Figure A55 – Image of cold spot on July 31st, Route 31 in Coventry.
7/31/2002- Image #17- Route 31, Coventry, Project # 171-302I
140.5
141
141.5
142
142.5
143
143.5
144
144.5
145
145.5
-20 -15 -10 -5 0 5 10 15 20
Distance from center of cold spot (ft.)
Den
sity
Val
ue (p
cf)
Figure A56 – Density vs Distance from cold spot
A - 60
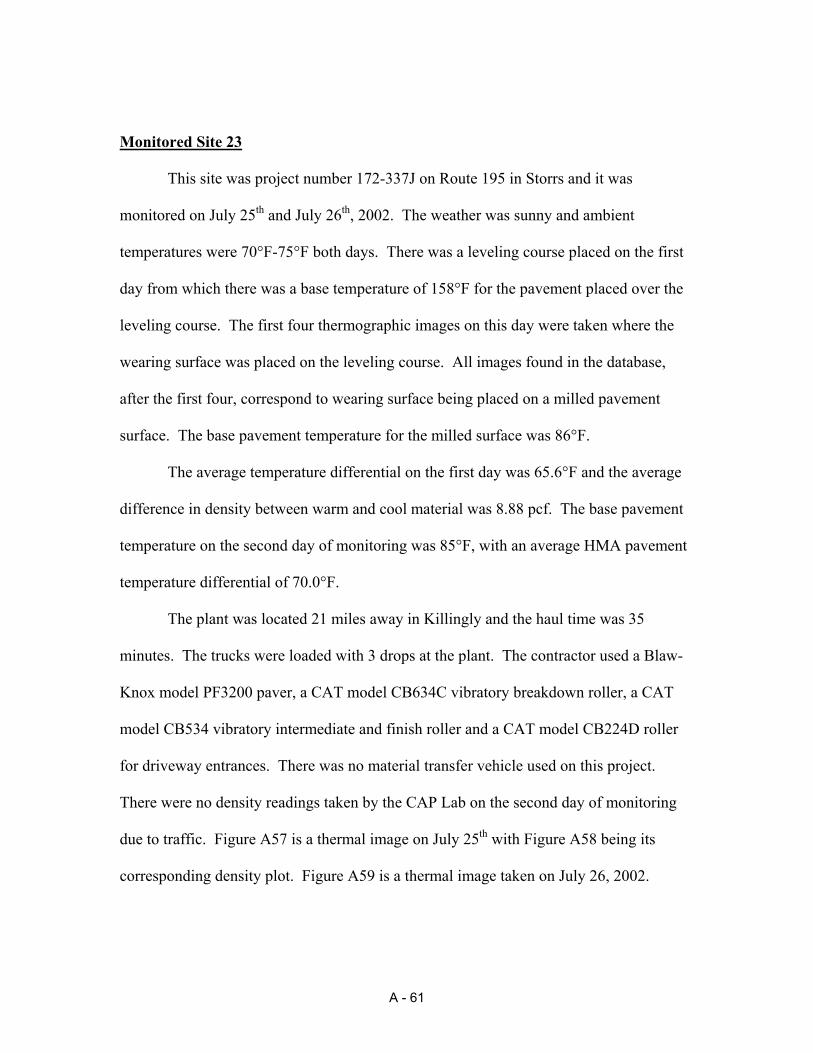
Monitored Site 23
This site was project number 172-337J on Route 195 in Storrs and it was
monitored on July 25th and July 26th, 2002. The weather was sunny and ambient
temperatures were 70°F-75°F both days. There was a leveling course placed on the first
day from which there was a base temperature of 158°F for the pavement placed over the
leveling course. The first four thermographic images on this day were taken where the
wearing surface was placed on the leveling course. All images found in the database,
after the first four, correspond to wearing surface being placed on a milled pavement
surface. The base pavement temperature for the milled surface was 86°F.
The average temperature differential on the first day was 65.6°F and the average
difference in density between warm and cool material was 8.88 pcf. The base pavement
temperature on the second day of monitoring was 85°F, with an average HMA pavement
temperature differential of 70.0°F.
The plant was located 21 miles away in Killingly and the haul time was 35
minutes. The trucks were loaded with 3 drops at the plant. The contractor used a Blaw-
Knox model PF3200 paver, a CAT model CB634C vibratory breakdown roller, a CAT
model CB534 vibratory intermediate and finish roller and a CAT model CB224D roller
for driveway entrances. There was no material transfer vehicle used on this project.
There were no density readings taken by the CAP Lab on the second day of monitoring
due to traffic. Figure A57 is a thermal image on July 25th with Figure A58 being its
corresponding density plot. Figure A59 is a thermal image taken on July 26, 2002.
A - 61
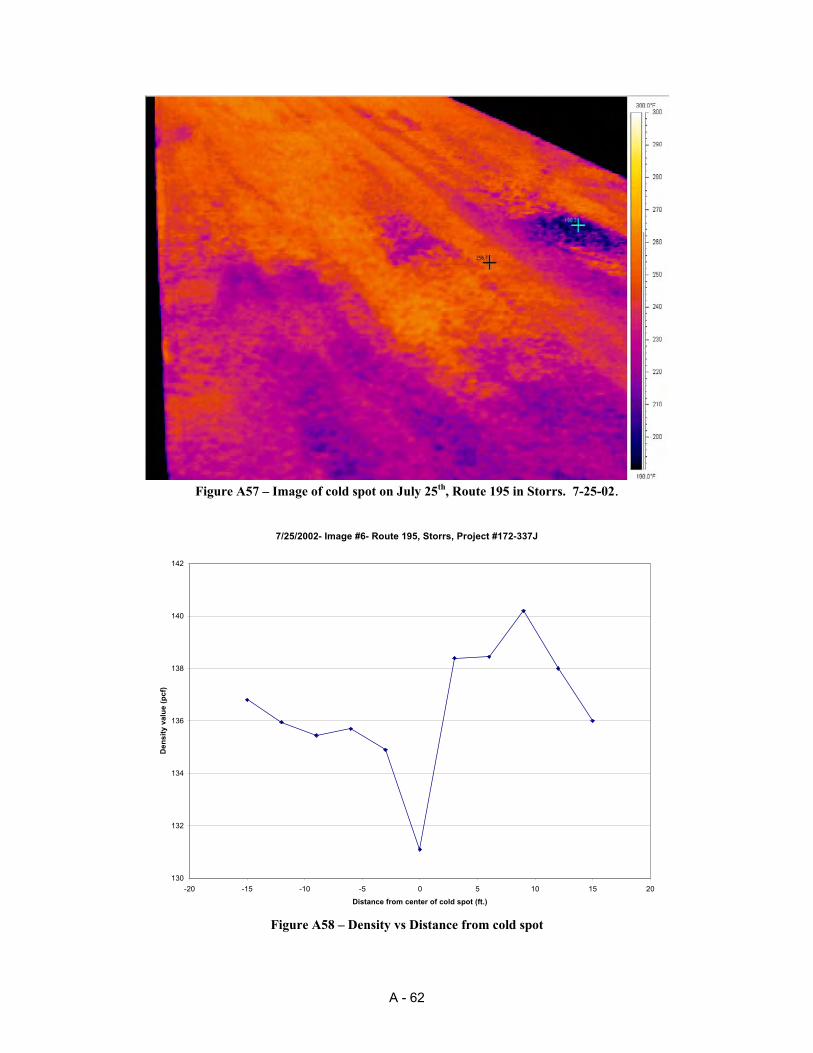
Figure A57 – Image of cold spot on July 25th, Route 195 in Storrs. 7-25-02.
7/25/2002- Image #6- Route 195, Storrs, Project #172-337J
130
132
134
136
138
140
142
-20 -15 -10 -5 0 5 10 15 20
Distance from center of cold spot (ft.)
Den
sity
val
ue (p
cf)
Figure A58 – Density vs Distance from cold spot
A - 62
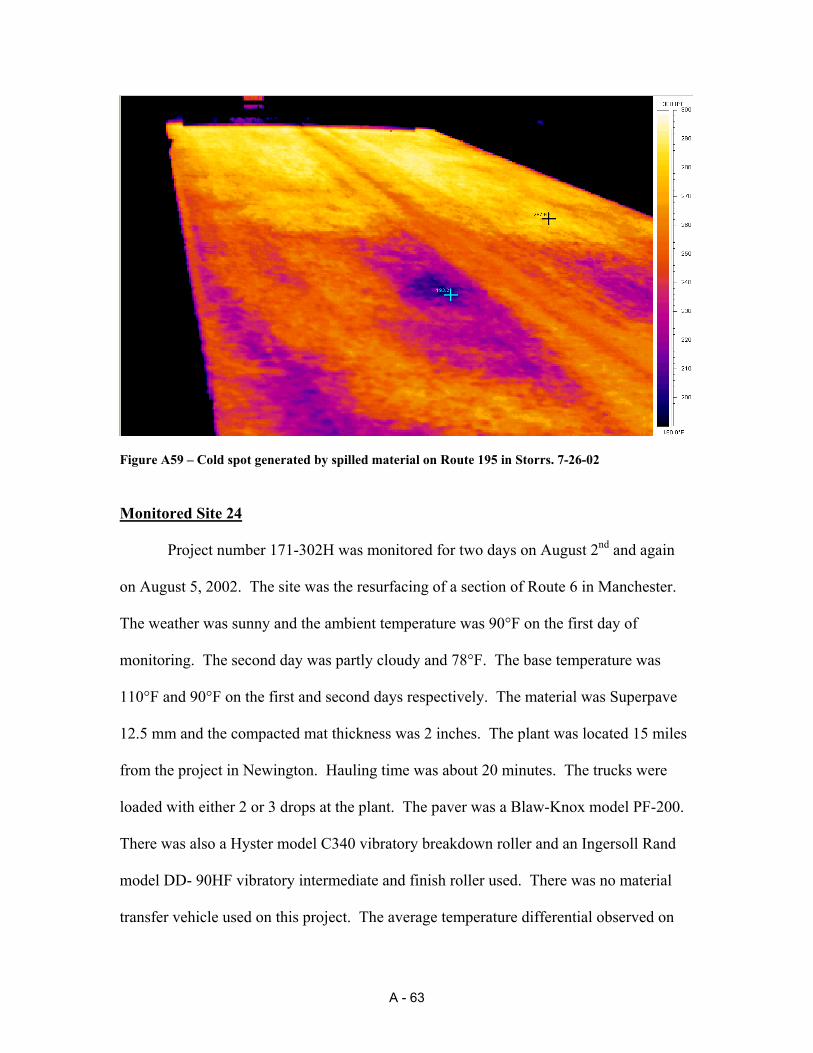
Figure A59 – Cold spot generated by spilled material on Route 195 in Storrs. 7-26-02
Monitored Site 24
Project number 171-302H was monitored for two days on August 2nd and again
on August 5, 2002. The site was the resurfacing of a section of Route 6 in Manchester.
The weather was sunny and the ambient temperature was 90°F on the first day of
monitoring. The second day was partly cloudy and 78°F. The base temperature was
110°F and 90°F on the first and second days respectively. The material was Superpave
12.5 mm and the compacted mat thickness was 2 inches. The plant was located 15 miles
from the project in Newington. Hauling time was about 20 minutes. The trucks were
loaded with either 2 or 3 drops at the plant. The paver was a Blaw-Knox model PF-200.
There was also a Hyster model C340 vibratory breakdown roller and an Ingersoll Rand
model DD- 90HF vibratory intermediate and finish roller used. There was no material
transfer vehicle used on this project. The average temperature differential observed on
A - 63

this project was 36.9°F on the first day and 45.9°F on the second day. The corresponding
average differences in density between warm and cool spots for the first and second
monitoring days were 8.75 pcf and 6.77 pcf respectively. Figures A60-A63 show typical
thermographic images for the two days monitored along with their corresponding density
plots.
A - 64
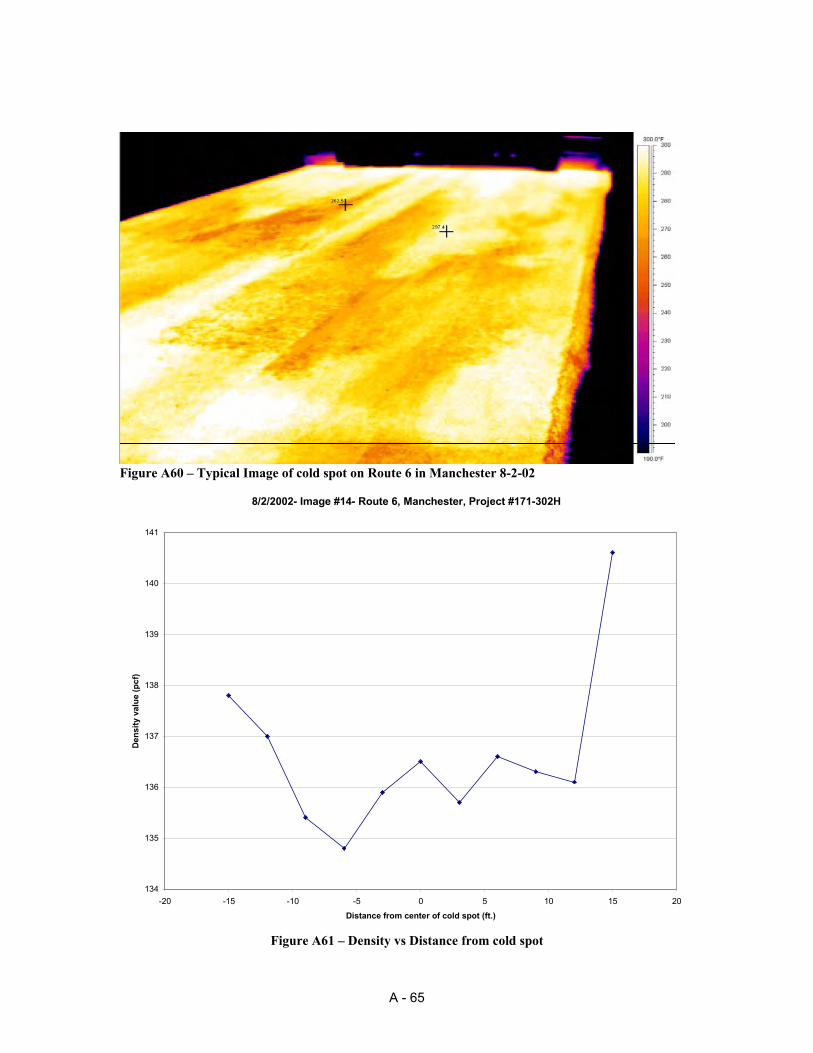
Figure A60 – Typical Image of cold spot on Route 6 in Manchester 8-2-02
8/2/2002- Image #14- Route 6, Manchester, Project #171-302H
134
135
136
137
138
139
140
141
-20 -15 -10 -5 0 5 10 15 20
Distance from center of cold spot (ft.)
Dens
ity v
alue
(pcf
)
Figure A61 – Density vs Distance from cold spot
A - 65
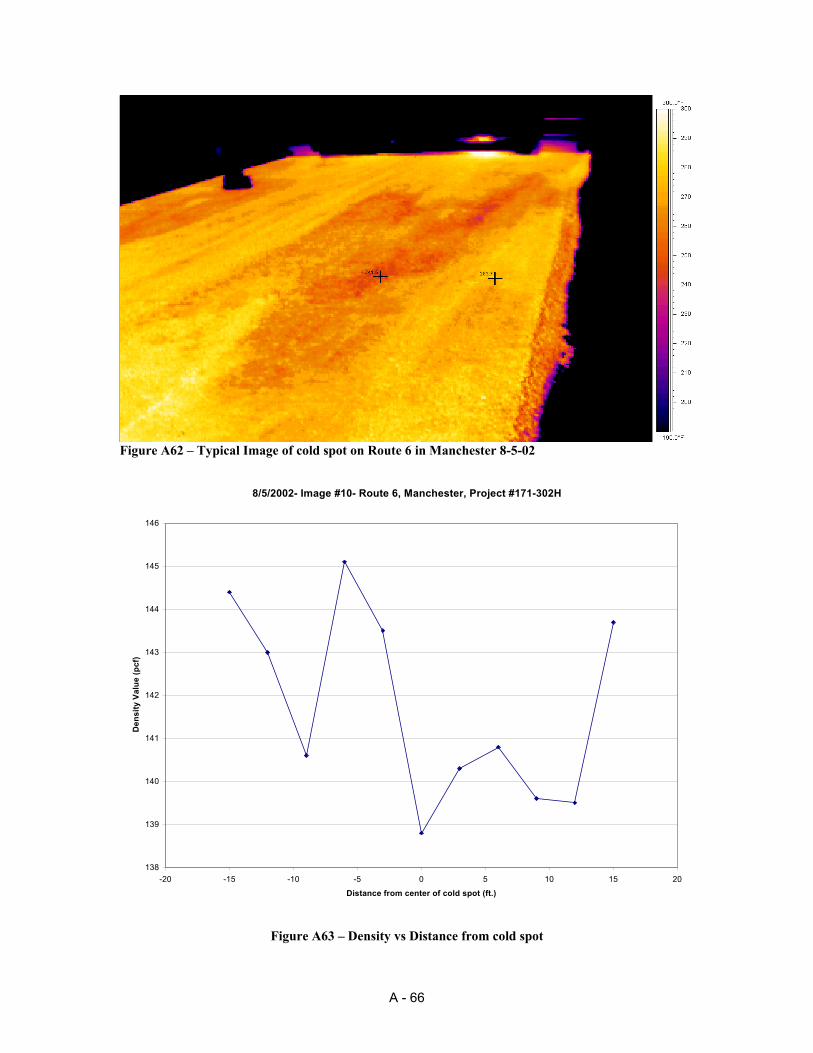
Figure A62 – Typical Image of cold spot on Route 6 in Manchester 8-5-02
8/5/2002- Image #10- Route 6, Manchester, Project #171-302H
138
139
140
141
142
143
144
145
146
-20 -15 -10 -5 0 5 10 15 20
Distance from center of cold spot (ft.)
Den
sity
Val
ue (p
cf)
Figure A63 – Density vs Distance from cold spot
A - 66
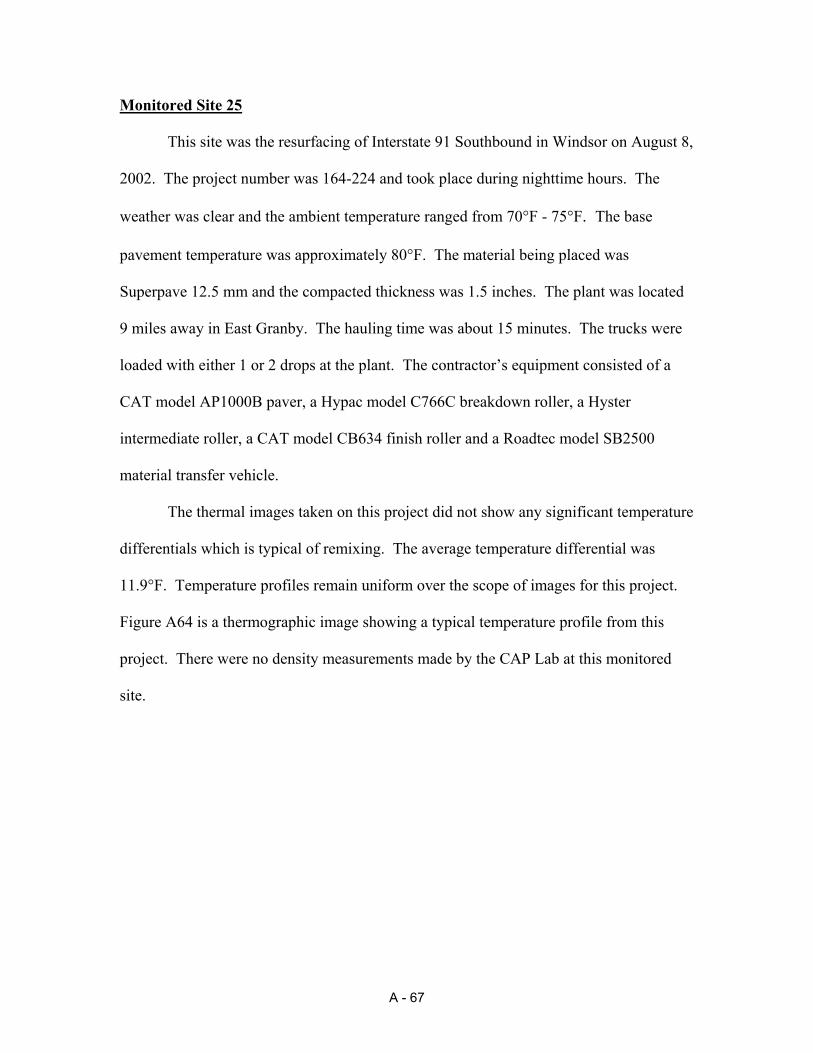
Monitored Site 25
This site was the resurfacing of Interstate 91 Southbound in Windsor on August 8,
2002. The project number was 164-224 and took place during nighttime hours. The
weather was clear and the ambient temperature ranged from 70°F - 75°F. The base
pavement temperature was approximately 80°F. The material being placed was
Superpave 12.5 mm and the compacted thickness was 1.5 inches. The plant was located
9 miles away in East Granby. The hauling time was about 15 minutes. The trucks were
loaded with either 1 or 2 drops at the plant. The contractor’s equipment consisted of a
CAT model AP1000B paver, a Hypac model C766C breakdown roller, a Hyster
intermediate roller, a CAT model CB634 finish roller and a Roadtec model SB2500
material transfer vehicle.
The thermal images taken on this project did not show any significant temperature
differentials which is typical of remixing. The average temperature differential was
11.9°F. Temperature profiles remain uniform over the scope of images for this project.
Figure A64 is a thermographic image showing a typical temperature profile from this
project. There were no density measurements made by the CAP Lab at this monitored
site.
A - 67
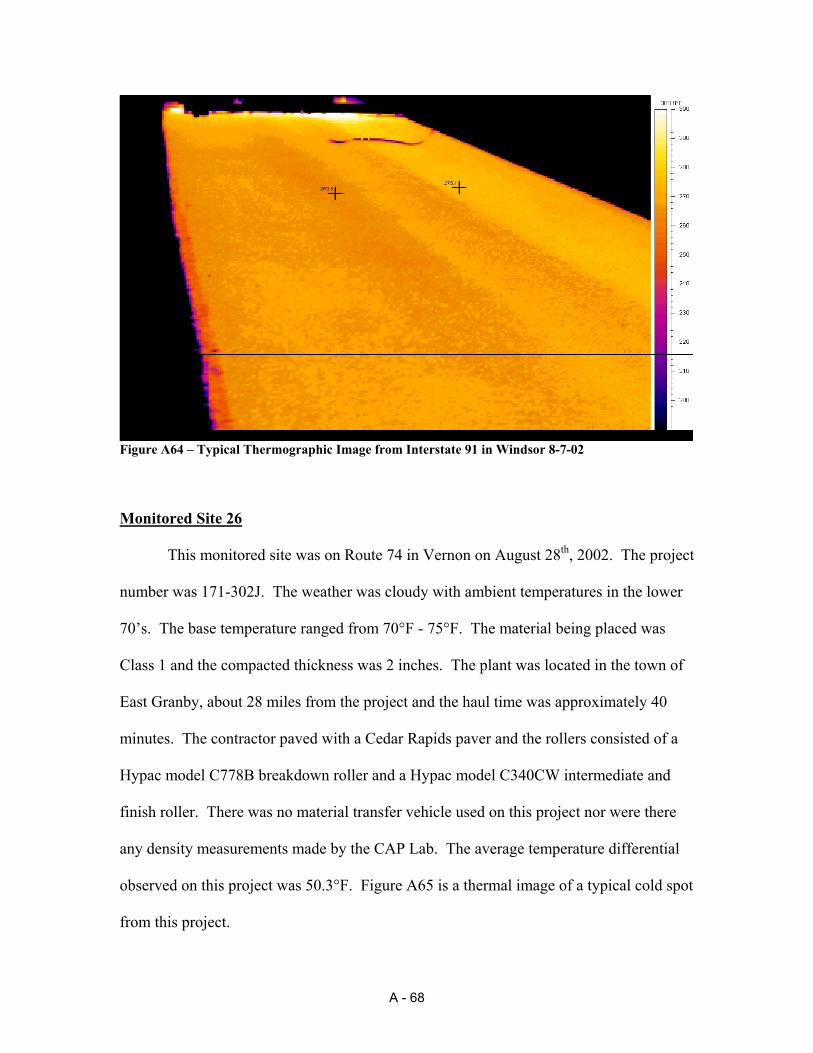
Figure A64 – Typical Thermographic Image from Interstate 91 in Windsor 8-7-02
Monitored Site 26
This monitored site was on Route 74 in Vernon on August 28th, 2002. The project
number was 171-302J. The weather was cloudy with ambient temperatures in the lower
70’s. The base temperature ranged from 70°F - 75°F. The material being placed was
Class 1 and the compacted thickness was 2 inches. The plant was located in the town of
East Granby, about 28 miles from the project and the haul time was approximately 40
minutes. The contractor paved with a Cedar Rapids paver and the rollers consisted of a
Hypac model C778B breakdown roller and a Hypac model C340CW intermediate and
finish roller. There was no material transfer vehicle used on this project nor were there
any density measurements made by the CAP Lab. The average temperature differential
observed on this project was 50.3°F. Figure A65 is a thermal image of a typical cold spot
from this project.
A - 68
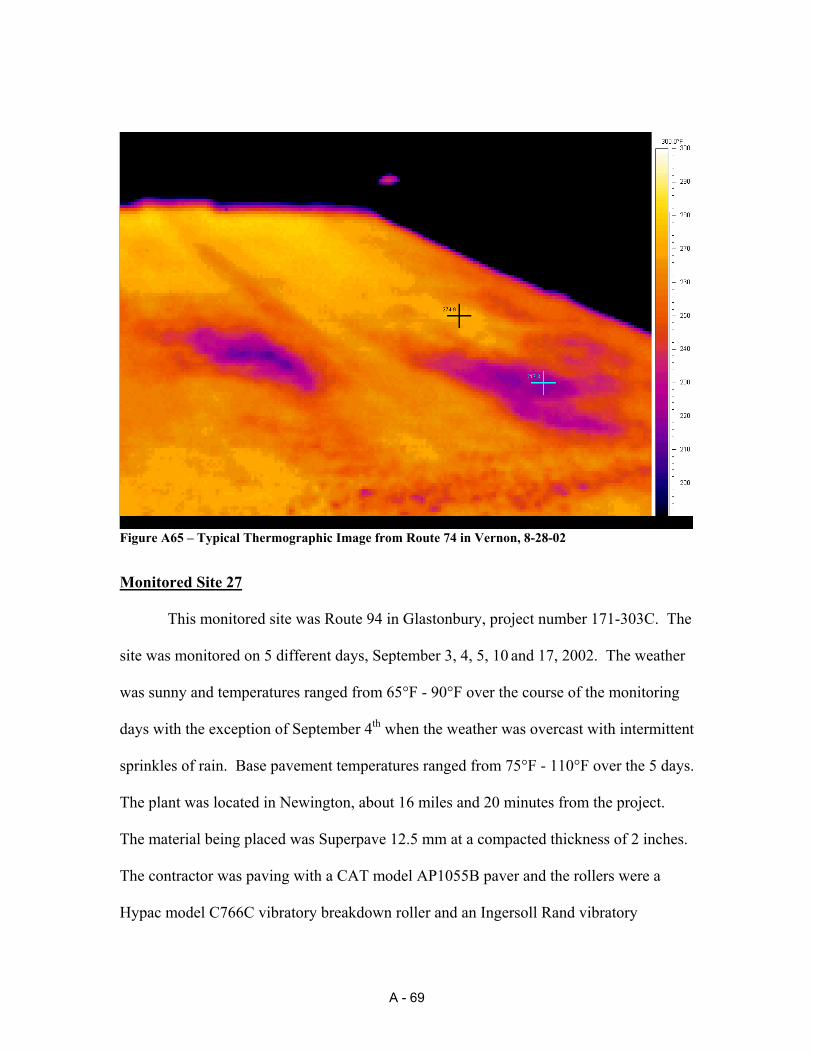
Figure A65 – Typical Thermographic Image from Route 74 in Vernon, 8-28-02
Monitored Site 27
This monitored site was Route 94 in Glastonbury, project number 171-303C. The
site was monitored on 5 different days, September 3, 4, 5, 10 and 17, 2002. The weather
was sunny and temperatures ranged from 65°F - 90°F over the course of the monitoring
days with the exception of September 4th when the weather was overcast with intermittent
sprinkles of rain. Base pavement temperatures ranged from 75°F - 110°F over the 5 days.
The plant was located in Newington, about 16 miles and 20 minutes from the project.
The material being placed was Superpave 12.5 mm at a compacted thickness of 2 inches.
The contractor was paving with a CAT model AP1055B paver and the rollers were a
Hypac model C766C vibratory breakdown roller and an Ingersoll Rand vibratory
A - 69
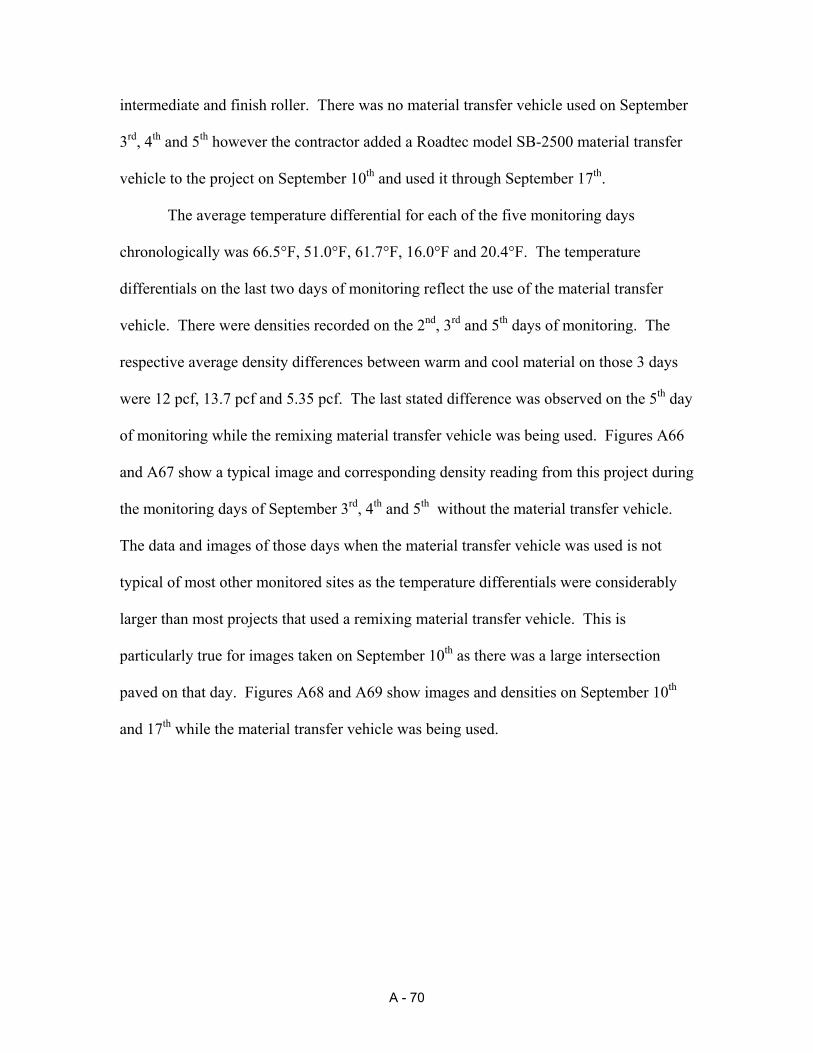
intermediate and finish roller. There was no material transfer vehicle used on September
3rd, 4th and 5th however the contractor added a Roadtec model SB-2500 material transfer
vehicle to the project on September 10th and used it through September 17th.
The average temperature differential for each of the five monitoring days
chronologically was 66.5°F, 51.0°F, 61.7°F, 16.0°F and 20.4°F. The temperature
differentials on the last two days of monitoring reflect the use of the material transfer
vehicle. There were densities recorded on the 2nd, 3rd and 5th days of monitoring. The
respective average density differences between warm and cool material on those 3 days
were 12 pcf, 13.7 pcf and 5.35 pcf. The last stated difference was observed on the 5th day
of monitoring while the remixing material transfer vehicle was being used. Figures A66
and A67 show a typical image and corresponding density reading from this project during
the monitoring days of September 3rd, 4th and 5th without the material transfer vehicle.
The data and images of those days when the material transfer vehicle was used is not
typical of most other monitored sites as the temperature differentials were considerably
larger than most projects that used a remixing material transfer vehicle. This is
particularly true for images taken on September 10th as there was a large intersection
paved on that day. Figures A68 and A69 show images and densities on September 10th
and 17th while the material transfer vehicle was being used.
A - 70
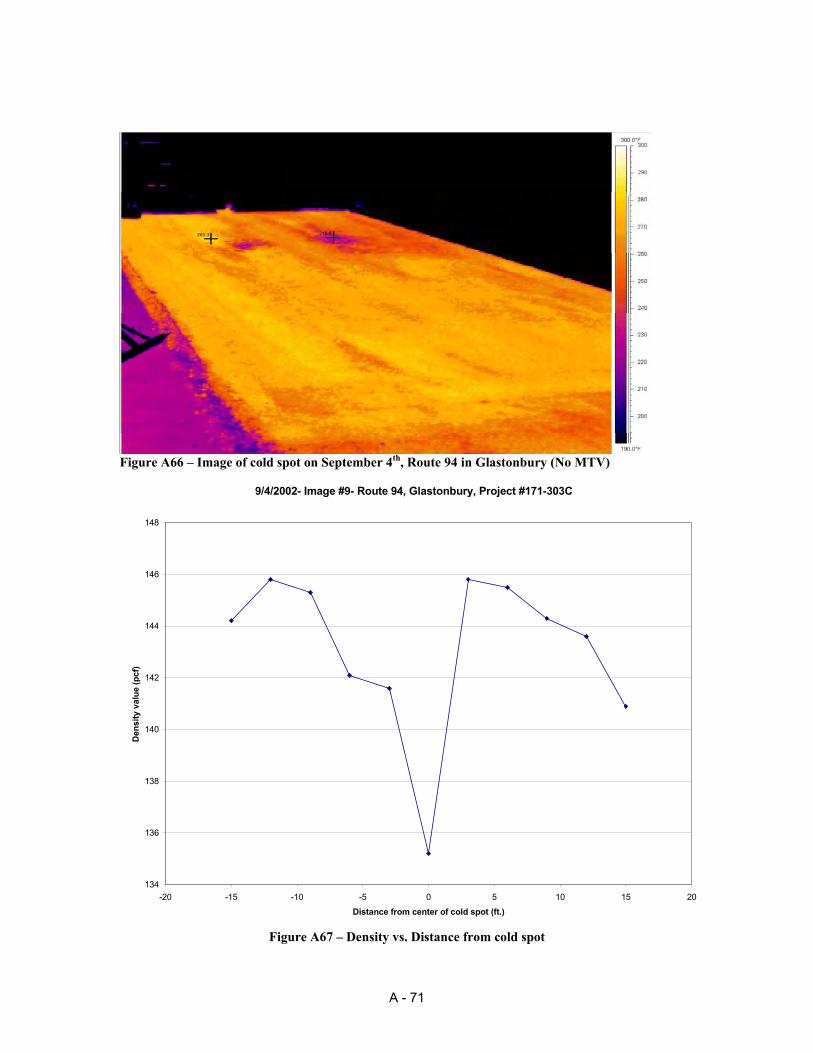
Figure A66 – Image of cold spot on September 4th, Route 94 in Glastonbury (No MTV)
9/4/2002- Image #9- Route 94, Glastonbury, Project #171-303C
134
136
138
140
142
144
146
148
-20 -15 -10 -5 0 5 10 15 20Distance from center of cold spot (ft.)
Den
sity
val
ue (p
cf)
Figure A67 – Density vs. Distance from cold spot
A - 71
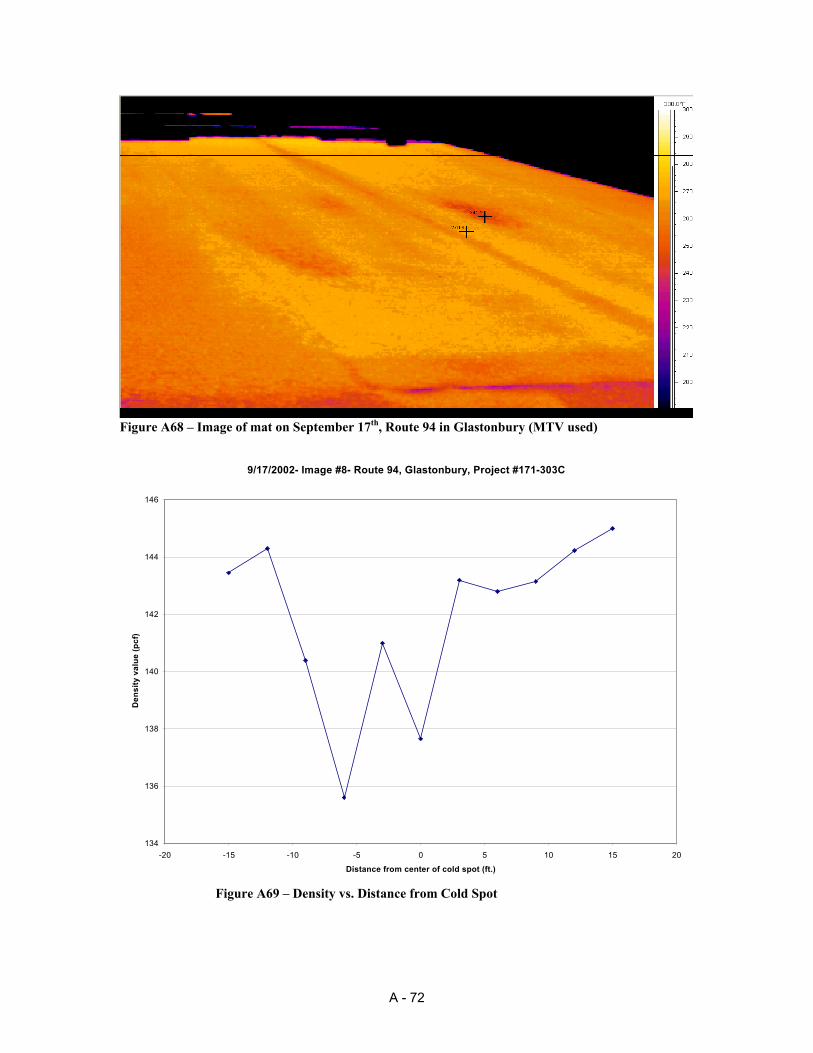
Figure A68 – Image of mat on September 17th, Route 94 in Glastonbury (MTV used)
9/17/2002- Image #8- Route 94, Glastonbury, Project #171-303C
134
136
138
140
142
144
146
-20 -15 -10 -5 0 5 10 15 20
Distance from center of cold spot (ft.)
Den
sity
val
ue (p
cf)
Figure A69 – Density vs. Distance from Cold Spot
A - 72
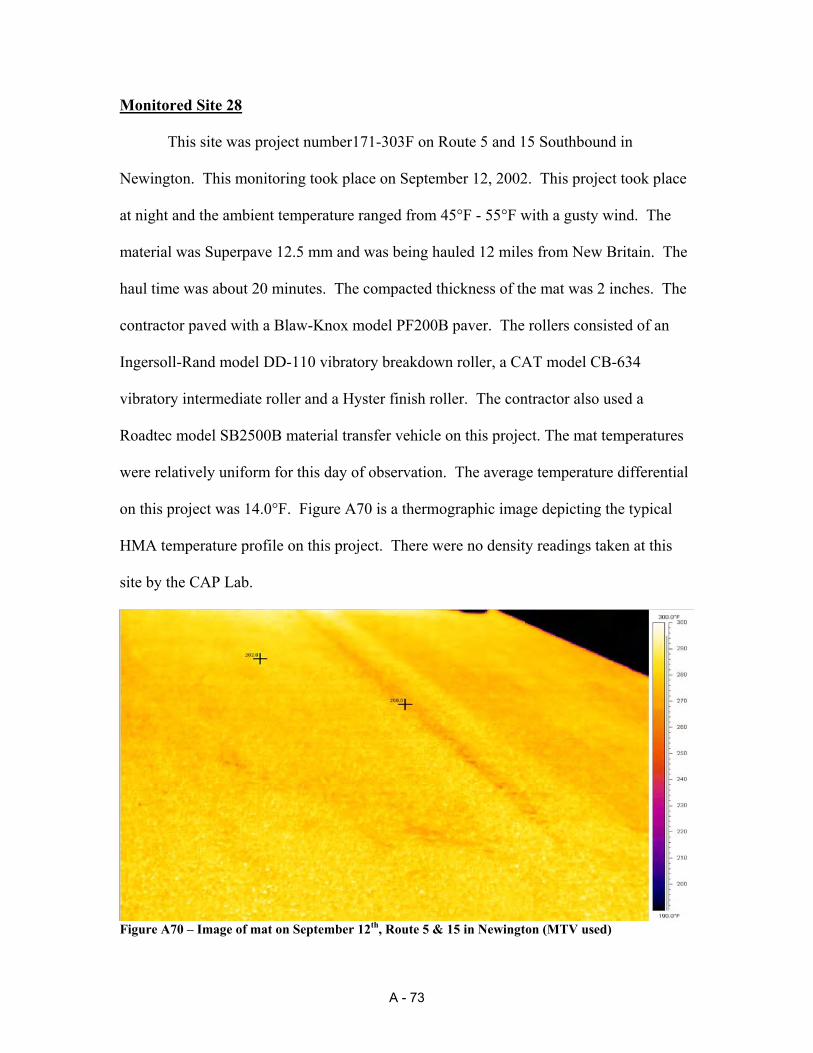
Monitored Site 28
This site was project number171-303F on Route 5 and 15 Southbound in
Newington. This monitoring took place on September 12, 2002. This project took place
at night and the ambient temperature ranged from 45°F - 55°F with a gusty wind. The
material was Superpave 12.5 mm and was being hauled 12 miles from New Britain. The
haul time was about 20 minutes. The compacted thickness of the mat was 2 inches. The
contractor paved with a Blaw-Knox model PF200B paver. The rollers consisted of an
Ingersoll-Rand model DD-110 vibratory breakdown roller, a CAT model CB-634
vibratory intermediate roller and a Hyster finish roller. The contractor also used a
Roadtec model SB2500B material transfer vehicle on this project. The mat temperatures
were relatively uniform for this day of observation. The average temperature differential
on this project was 14.0°F. Figure A70 is a thermographic image depicting the typical
HMA temperature profile on this project. There were no density readings taken at this
site by the CAP Lab.
Figure A70 – Image of mat on September 12th, Route 5 & 15 in Newington (MTV used)
A - 73
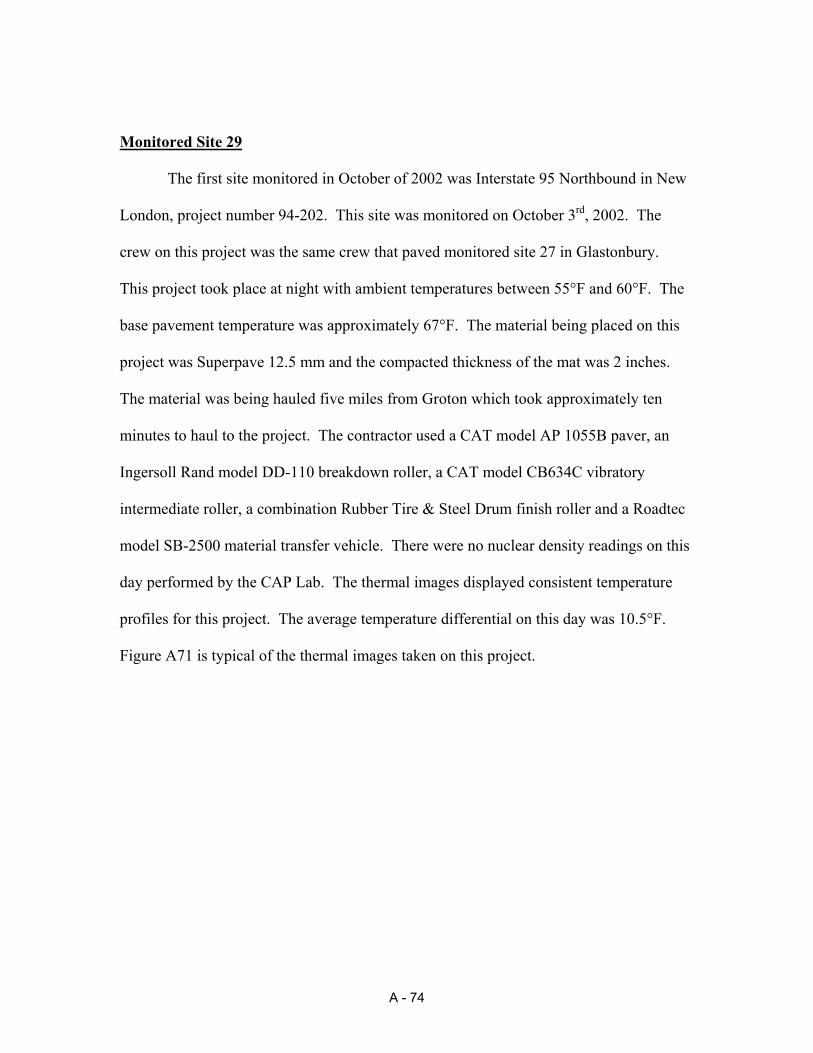
Monitored Site 29
The first site monitored in October of 2002 was Interstate 95 Northbound in New
London, project number 94-202. This site was monitored on October 3rd, 2002. The
crew on this project was the same crew that paved monitored site 27 in Glastonbury.
This project took place at night with ambient temperatures between 55°F and 60°F. The
base pavement temperature was approximately 67°F. The material being placed on this
project was Superpave 12.5 mm and the compacted thickness of the mat was 2 inches.
The material was being hauled five miles from Groton which took approximately ten
minutes to haul to the project. The contractor used a CAT model AP 1055B paver, an
Ingersoll Rand model DD-110 breakdown roller, a CAT model CB634C vibratory
intermediate roller, a combination Rubber Tire & Steel Drum finish roller and a Roadtec
model SB-2500 material transfer vehicle. There were no nuclear density readings on this
day performed by the CAP Lab. The thermal images displayed consistent temperature
profiles for this project. The average temperature differential on this day was 10.5°F.
Figure A71 is typical of the thermal images taken on this project.
A - 74
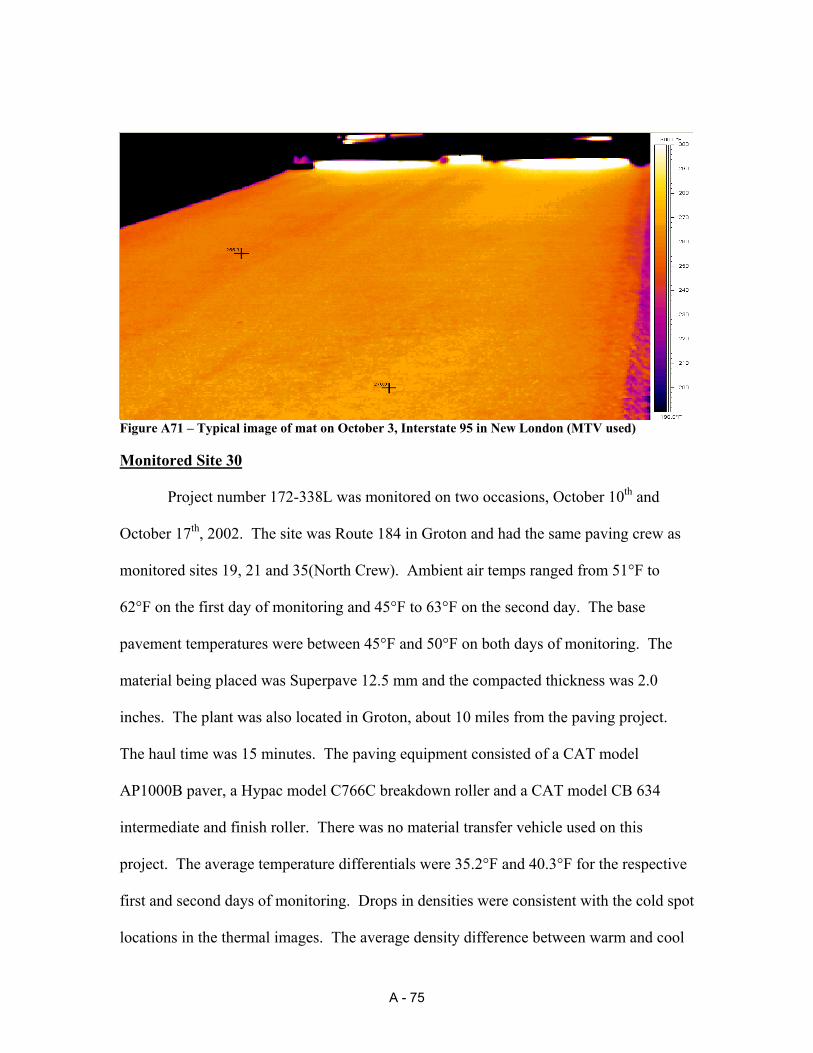
Figure A71 – Typical image of mat on October 3, Interstate 95 in New London (MTV used)
Monitored Site 30
Project number 172-338L was monitored on two occasions, October 10th and
October 17th, 2002. The site was Route 184 in Groton and had the same paving crew as
monitored sites 19, 21 and 35(North Crew). Ambient air temps ranged from 51°F to
62°F on the first day of monitoring and 45°F to 63°F on the second day. The base
pavement temperatures were between 45°F and 50°F on both days of monitoring. The
material being placed was Superpave 12.5 mm and the compacted thickness was 2.0
inches. The plant was also located in Groton, about 10 miles from the paving project.
The haul time was 15 minutes. The paving equipment consisted of a CAT model
AP1000B paver, a Hypac model C766C breakdown roller and a CAT model CB 634
intermediate and finish roller. There was no material transfer vehicle used on this
project. The average temperature differentials were 35.2°F and 40.3°F for the respective
first and second days of monitoring. Drops in densities were consistent with the cold spot
locations in the thermal images. The average density difference between warm and cool
A - 75
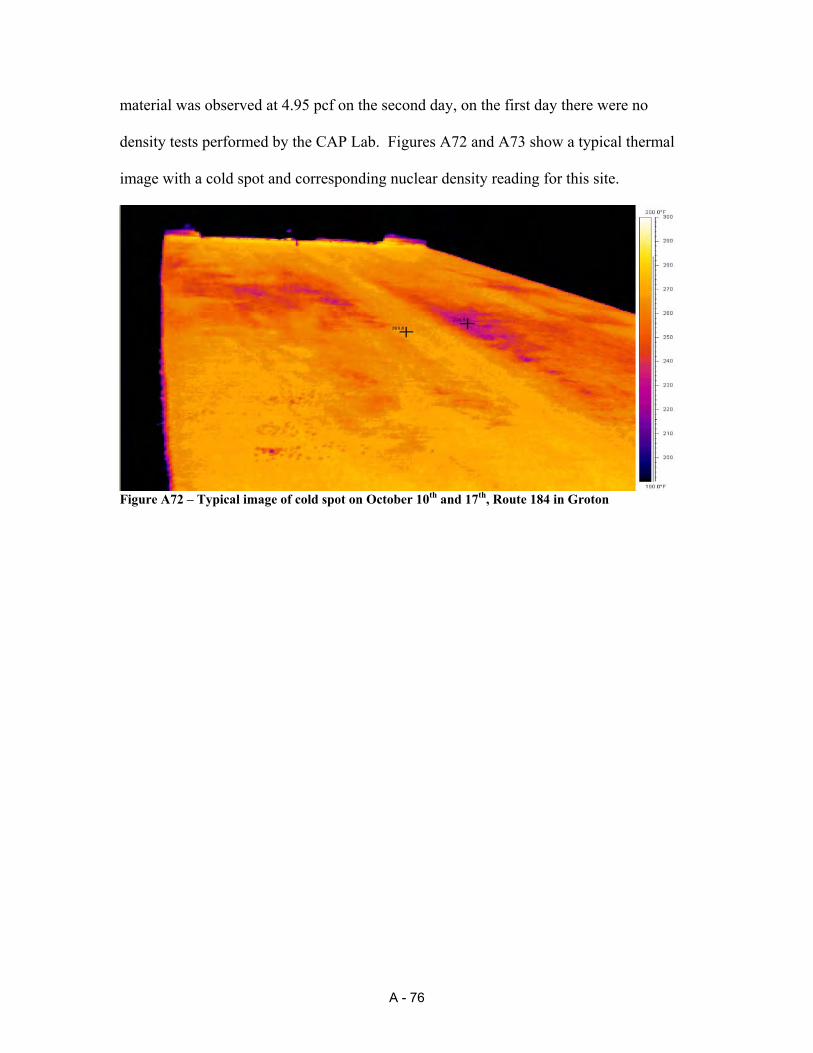
material was observed at 4.95 pcf on the second day, on the first day there were no
density tests performed by the CAP Lab. Figures A72 and A73 show a typical thermal
image with a cold spot and corresponding nuclear density reading for this site.
Figure A72 – Typical image of cold spot on October 10th and 17th, Route 184 in Groton
A - 76
10/17/2002- Image #10- Route 184, Groton, Project #172-338L
138
138.5
139
139.5
140
140.5
141
141.5
142
142.5
143
-20 -15 -10 -5 0 5 10 15 20
Distance from center of cold spot (ft.)
Den
sity
val
ue (p
cf)
Figure A73 – Density vs. Distance from cold spot
Monitored Site 31
This project, number 51-249, on Route 4 in Farmington was monitored on 2
different days, October 15th and October 22nd, 2002. The ambient temperature was 48°F
on the first day of monitoring. The second day was colder with ambient temperatures
approximately 45°F. It was sunny on both days. The base pavement temperature was
40°F-45°F on both monitoring days. The plant was also located in Farmington about 5
miles from the project. The trucks had a hauling time of about 10 minutes. The material
being placed was Class 1 and the compacted mat thickness was 1.5 inches. The
contractor paved both days with a Blaw-Knox model PF180H paver and the rollers
A - 77
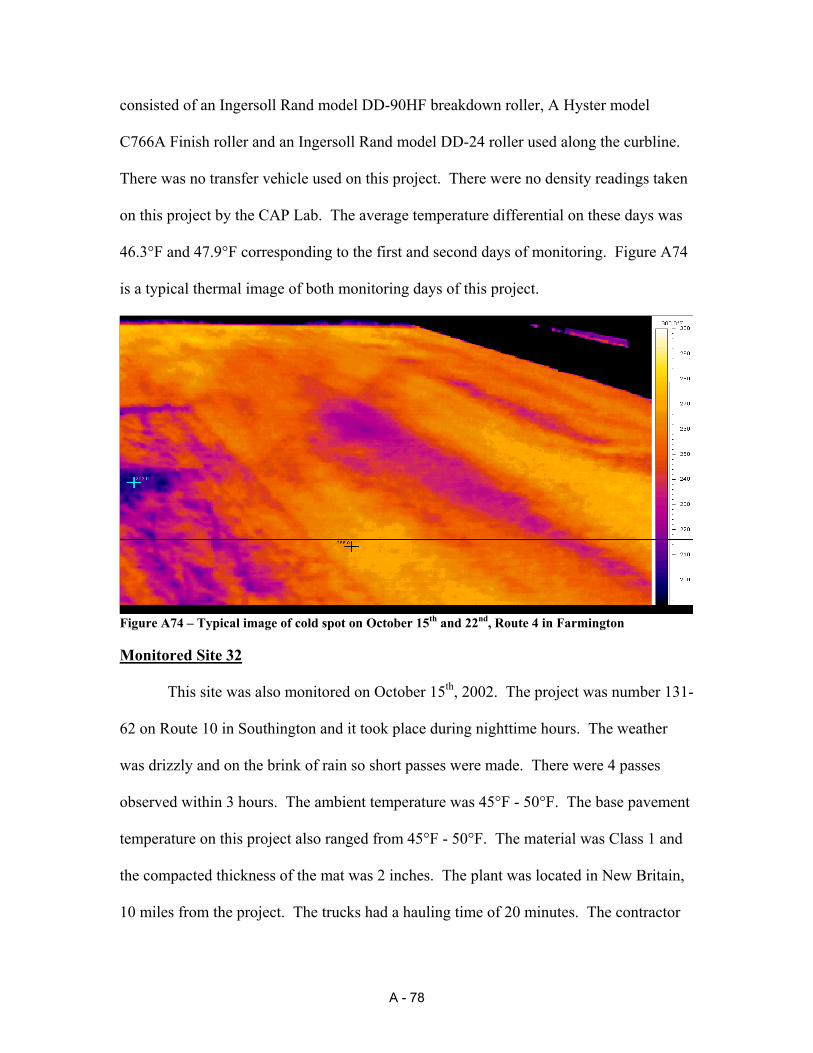
consisted of an Ingersoll Rand model DD-90HF breakdown roller, A Hyster model
C766A Finish roller and an Ingersoll Rand model DD-24 roller used along the curbline.
There was no transfer vehicle used on this project. There were no density readings taken
on this project by the CAP Lab. The average temperature differential on these days was
46.3°F and 47.9°F corresponding to the first and second days of monitoring. Figure A74
is a typical thermal image of both monitoring days of this project.
Figure A74 – Typical image of cold spot on October 15th and 22nd, Route 4 in Farmington
Monitored Site 32
This site was also monitored on October 15th, 2002. The project was number 131-
62 on Route 10 in Southington and it took place during nighttime hours. The weather
was drizzly and on the brink of rain so short passes were made. There were 4 passes
observed within 3 hours. The ambient temperature was 45°F - 50°F. The base pavement
temperature on this project also ranged from 45°F - 50°F. The material was Class 1 and
the compacted thickness of the mat was 2 inches. The plant was located in New Britain,
10 miles from the project. The trucks had a hauling time of 20 minutes. The contractor
A - 78
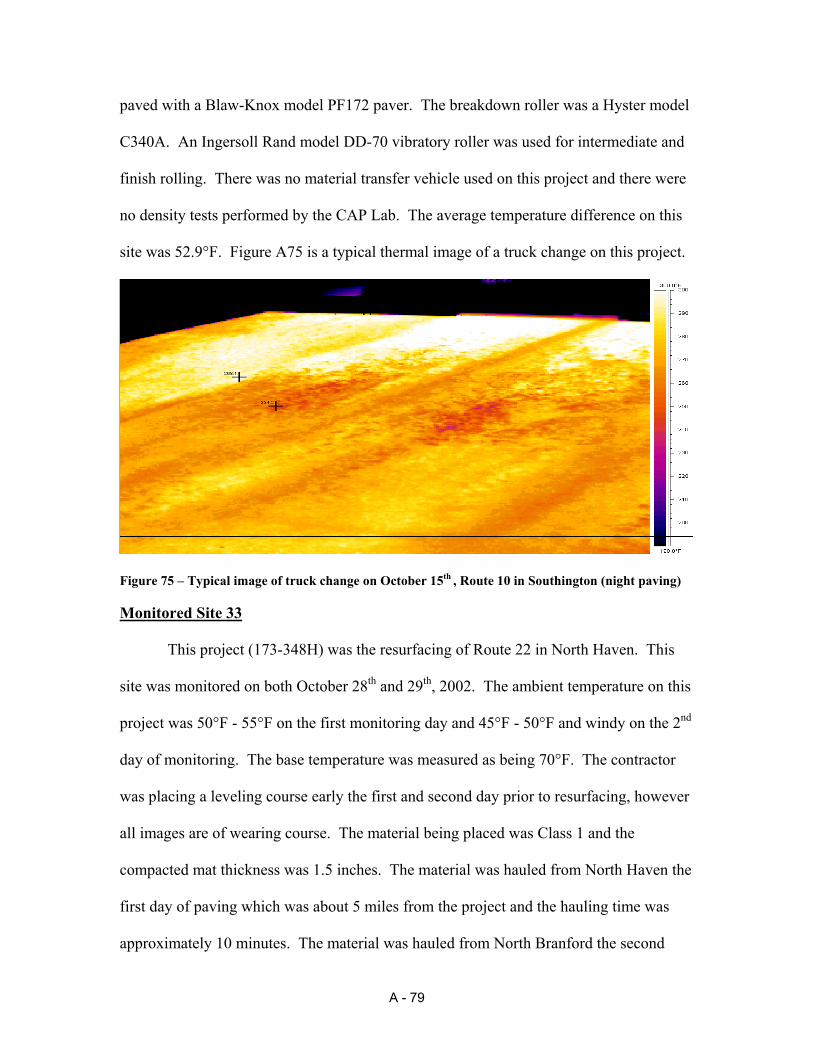
paved with a Blaw-Knox model PF172 paver. The breakdown roller was a Hyster model
C340A. An Ingersoll Rand model DD-70 vibratory roller was used for intermediate and
finish rolling. There was no material transfer vehicle used on this project and there were
no density tests performed by the CAP Lab. The average temperature difference on this
site was 52.9°F. Figure A75 is a typical thermal image of a truck change on this project.
Figure 75 – Typical image of truck change on October 15th , Route 10 in Southington (night paving)
Monitored Site 33
This project (173-348H) was the resurfacing of Route 22 in North Haven. This
site was monitored on both October 28th and 29th, 2002. The ambient temperature on this
project was 50°F - 55°F on the first monitoring day and 45°F - 50°F and windy on the 2nd
day of monitoring. The base temperature was measured as being 70°F. The contractor
was placing a leveling course early the first and second day prior to resurfacing, however
all images are of wearing course. The material being placed was Class 1 and the
compacted mat thickness was 1.5 inches. The material was hauled from North Haven the
first day of paving which was about 5 miles from the project and the hauling time was
approximately 10 minutes. The material was hauled from North Branford the second
A - 79
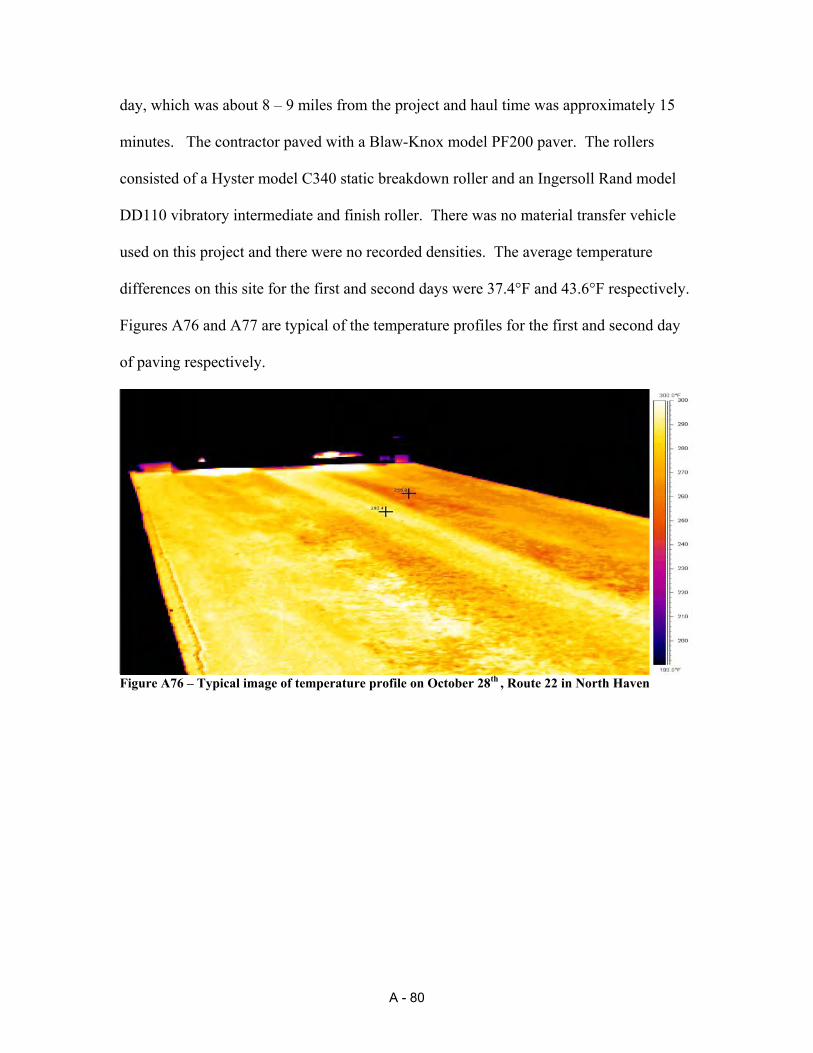
day, which was about 8 – 9 miles from the project and haul time was approximately 15
minutes. The contractor paved with a Blaw-Knox model PF200 paver. The rollers
consisted of a Hyster model C340 static breakdown roller and an Ingersoll Rand model
DD110 vibratory intermediate and finish roller. There was no material transfer vehicle
used on this project and there were no recorded densities. The average temperature
differences on this site for the first and second days were 37.4°F and 43.6°F respectively.
Figures A76 and A77 are typical of the temperature profiles for the first and second day
of paving respectively.
Figure A76 – Typical image of temperature profile on October 28th , Route 22 in North Haven
A - 80
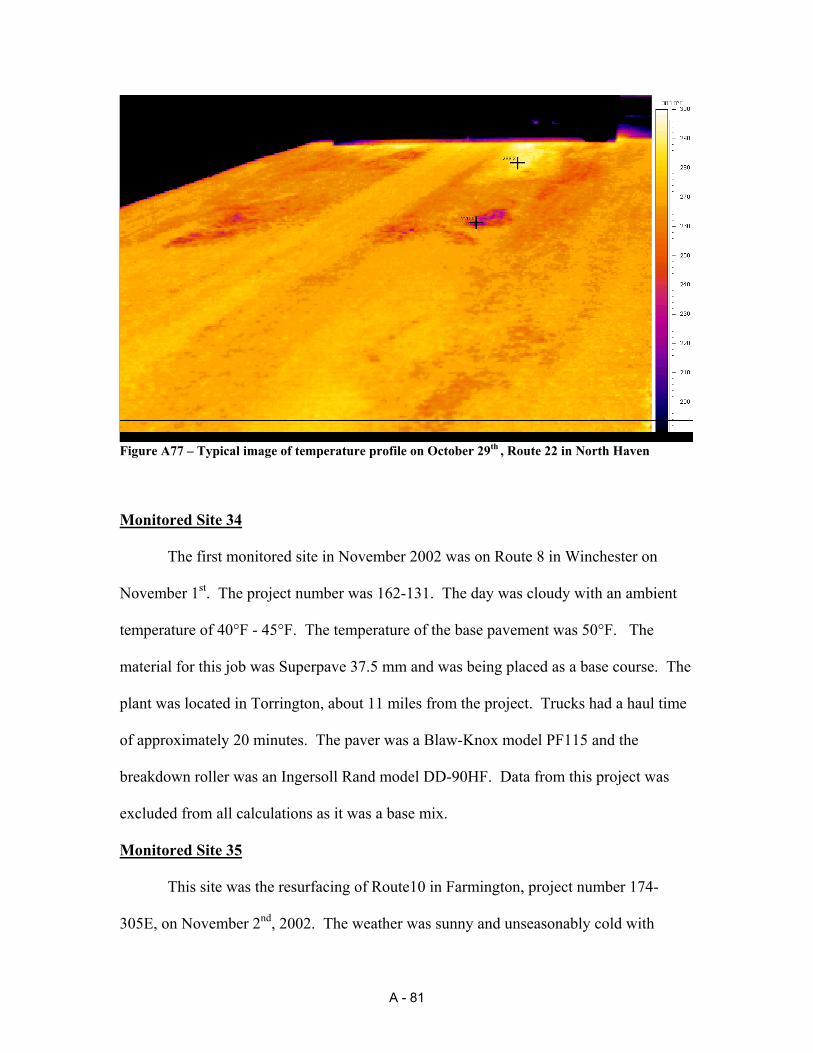
Figure A77 – Typical image of temperature profile on October 29th , Route 22 in North Haven
Monitored Site 34
The first monitored site in November 2002 was on Route 8 in Winchester on
November 1st. The project number was 162-131. The day was cloudy with an ambient
temperature of 40°F - 45°F. The temperature of the base pavement was 50°F. The
material for this job was Superpave 37.5 mm and was being placed as a base course. The
plant was located in Torrington, about 11 miles from the project. Trucks had a haul time
of approximately 20 minutes. The paver was a Blaw-Knox model PF115 and the
breakdown roller was an Ingersoll Rand model DD-90HF. Data from this project was
excluded from all calculations as it was a base mix.
Monitored Site 35
This site was the resurfacing of Route10 in Farmington, project number 174-
305E, on November 2nd, 2002. The weather was sunny and unseasonably cold with
A - 81
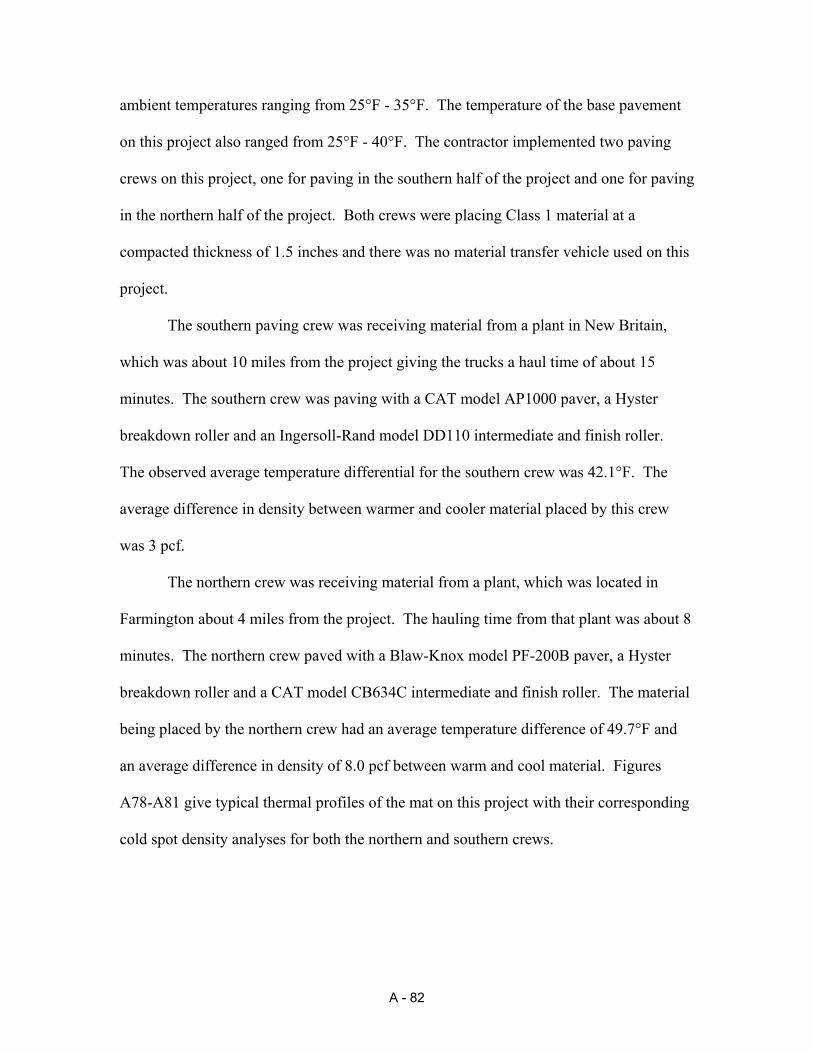
ambient temperatures ranging from 25°F - 35°F. The temperature of the base pavement
on this project also ranged from 25°F - 40°F. The contractor implemented two paving
crews on this project, one for paving in the southern half of the project and one for paving
in the northern half of the project. Both crews were placing Class 1 material at a
compacted thickness of 1.5 inches and there was no material transfer vehicle used on this
project.
The southern paving crew was receiving material from a plant in New Britain,
which was about 10 miles from the project giving the trucks a haul time of about 15
minutes. The southern crew was paving with a CAT model AP1000 paver, a Hyster
breakdown roller and an Ingersoll-Rand model DD110 intermediate and finish roller.
The observed average temperature differential for the southern crew was 42.1°F. The
average difference in density between warmer and cooler material placed by this crew
was 3 pcf.
The northern crew was receiving material from a plant, which was located in
Farmington about 4 miles from the project. The hauling time from that plant was about 8
minutes. The northern crew paved with a Blaw-Knox model PF-200B paver, a Hyster
breakdown roller and a CAT model CB634C intermediate and finish roller. The material
being placed by the northern crew had an average temperature difference of 49.7°F and
an average difference in density of 8.0 pcf between warm and cool material. Figures
A78-A81 give typical thermal profiles of the mat on this project with their corresponding
cold spot density analyses for both the northern and southern crews.
A - 82
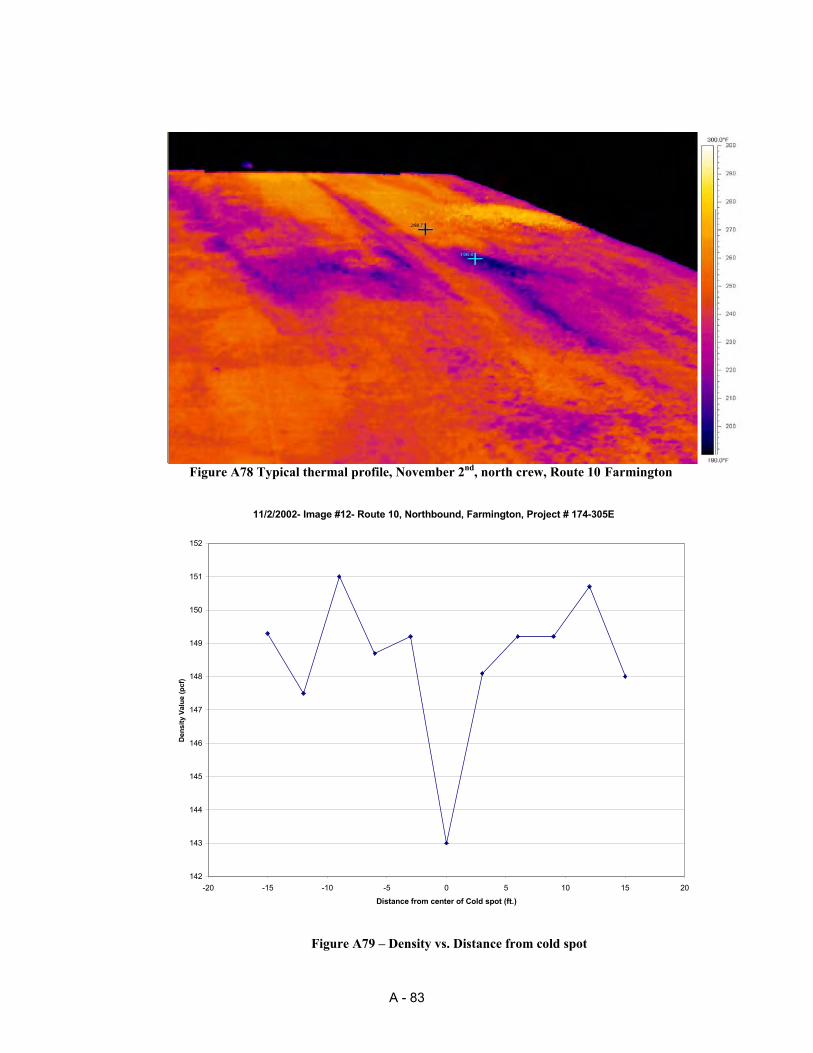
Figure A78 Typical thermal profile, November 2nd, north crew, Route 10 Farmington
11/2/2002- Image #12- Route 10, Northbound, Farmington, Project # 174-305E
142
143
144
145
146
147
148
149
150
151
152
-20 -15 -10 -5 0 5 10 15 20
Distance from center of Cold spot (ft.)
Dens
ity V
alue
(pcf
)
Figure A79 – Density vs. Distance from cold spot
A - 83
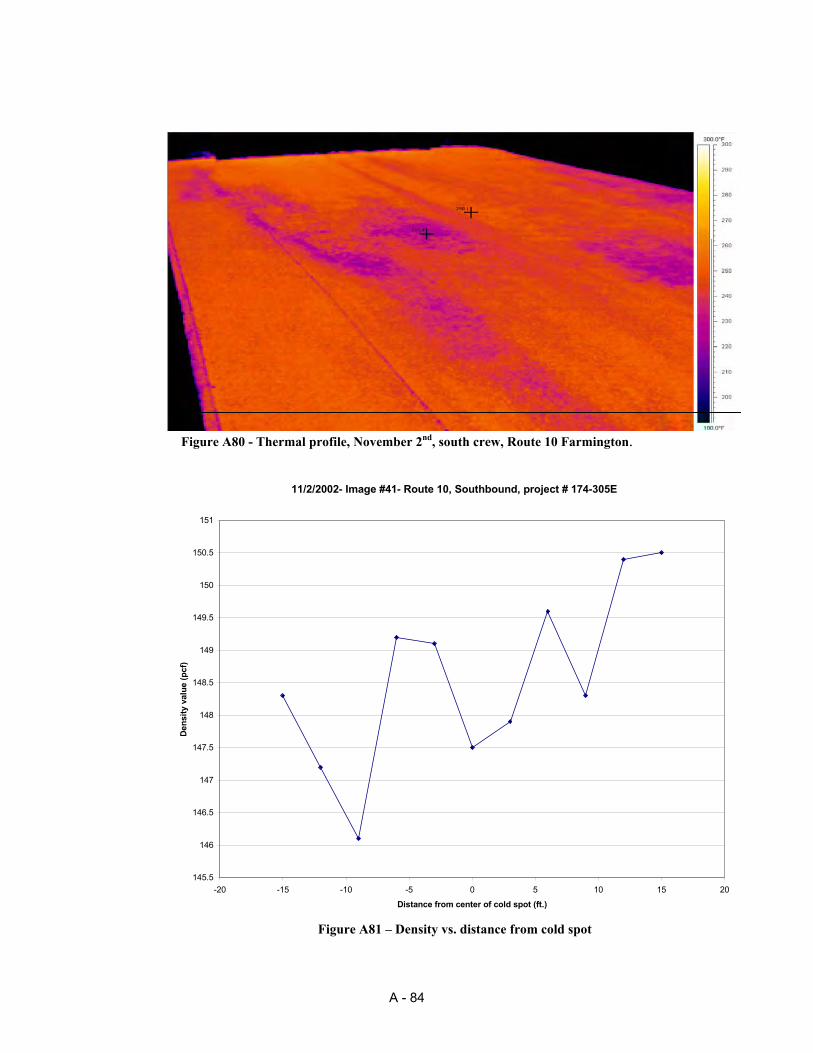
Figure A80 - Thermal profile, November 2nd, south crew, Route 10 Farmington.
11/2/2002- Image #41- Route 10, Southbound, project # 174-305E
145.5
146
146.5
147
147.5
148
148.5
149
149.5
150
150.5
151
-20 -15 -10 -5 0 5 10 15 20
Distance from center of cold spot (ft.)
Dens
ity v
alue
(pcf
)
Figure A81 – Density vs. distance from cold spot
A - 84
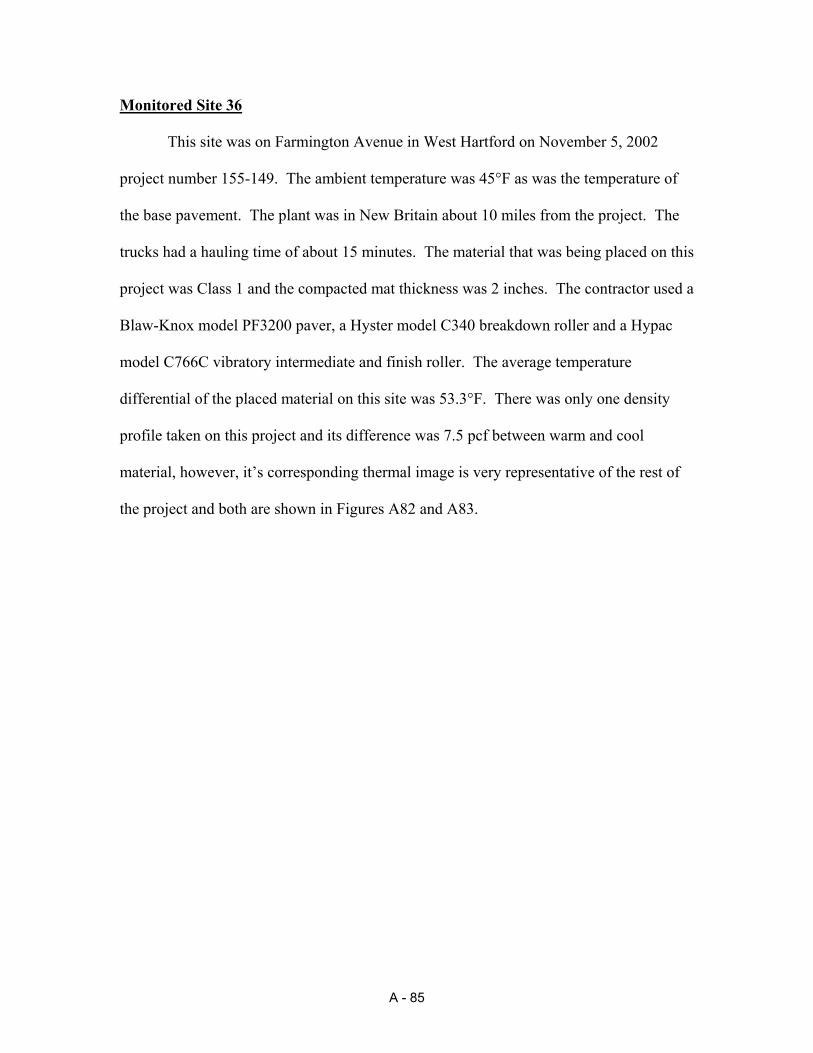
Monitored Site 36 This site was on Farmington Avenue in West Hartford on November 5, 2002
project number 155-149. The ambient temperature was 45°F as was the temperature of
the base pavement. The plant was in New Britain about 10 miles from the project. The
trucks had a hauling time of about 15 minutes. The material that was being placed on this
project was Class 1 and the compacted mat thickness was 2 inches. The contractor used a
Blaw-Knox model PF3200 paver, a Hyster model C340 breakdown roller and a Hypac
model C766C vibratory intermediate and finish roller. The average temperature
differential of the placed material on this site was 53.3°F. There was only one density
profile taken on this project and its difference was 7.5 pcf between warm and cool
material, however, it’s corresponding thermal image is very representative of the rest of
the project and both are shown in Figures A82 and A83.
A - 85

Figure A82 - Thermal profile, November 5th, Farmington Avenue, West Hartford.
11/5/2002- Image #6- Farmington Avenue, West Hartford, Project #155-149
136
137
138
139
140
141
142
143
144
145
146
-20 -15 -10 -5 0 5 10 15 20
Distance from cold spot (ft.)
Den
sity
val
ue (p
cf)
Figure A83 – Density vs. distance from cold spot
A - 86
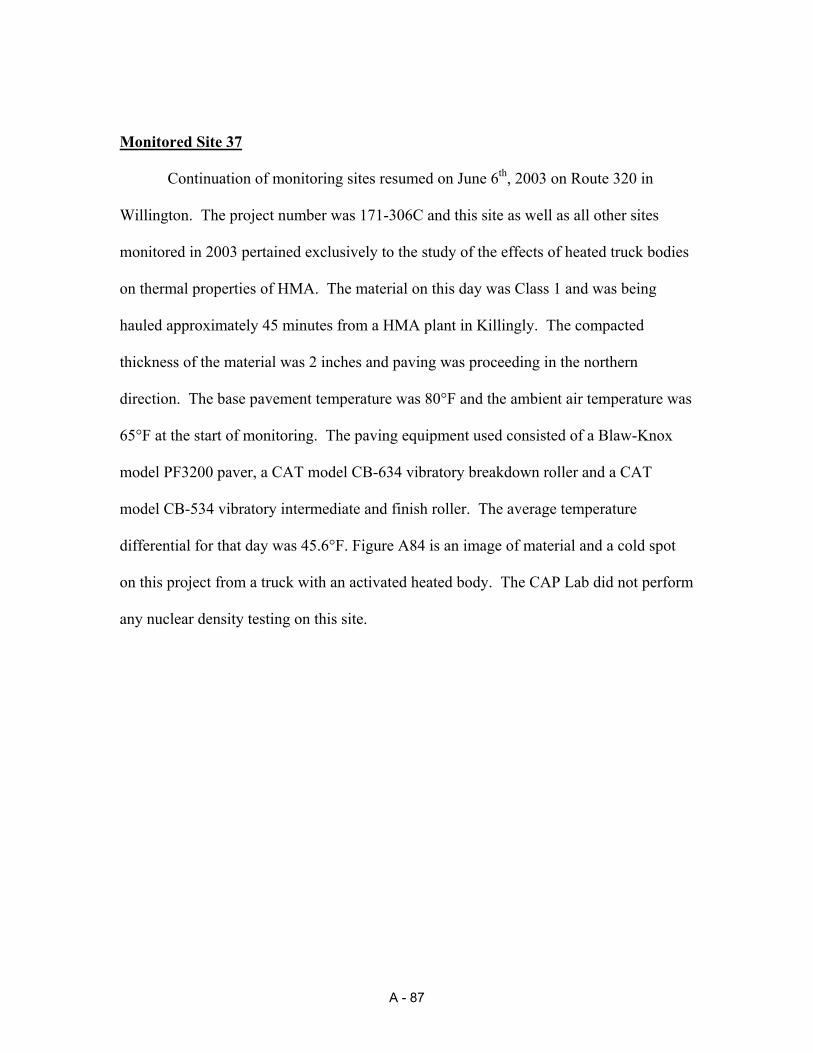
Monitored Site 37
Continuation of monitoring sites resumed on June 6th, 2003 on Route 320 in
Willington. The project number was 171-306C and this site as well as all other sites
monitored in 2003 pertained exclusively to the study of the effects of heated truck bodies
on thermal properties of HMA. The material on this day was Class 1 and was being
hauled approximately 45 minutes from a HMA plant in Killingly. The compacted
thickness of the material was 2 inches and paving was proceeding in the northern
direction. The base pavement temperature was 80°F and the ambient air temperature was
65°F at the start of monitoring. The paving equipment used consisted of a Blaw-Knox
model PF3200 paver, a CAT model CB-634 vibratory breakdown roller and a CAT
model CB-534 vibratory intermediate and finish roller. The average temperature
differential for that day was 45.6°F. Figure A84 is an image of material and a cold spot
on this project from a truck with an activated heated body. The CAP Lab did not perform
any nuclear density testing on this site.
A - 87
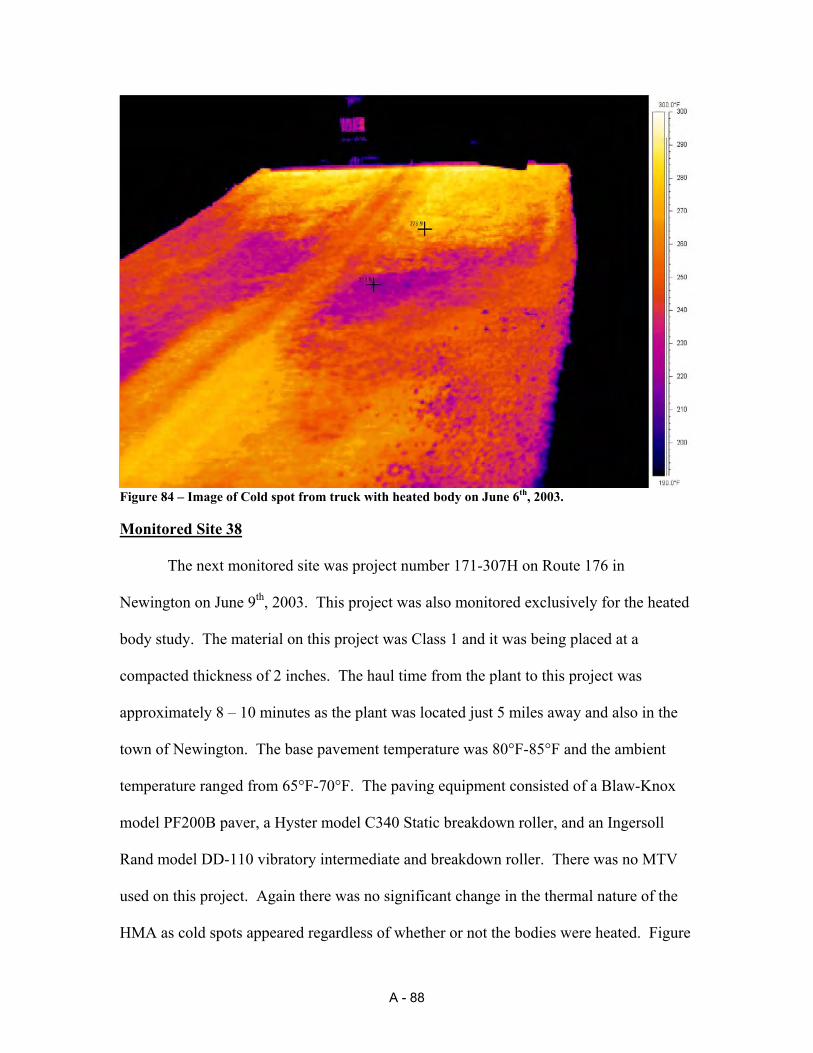
Figure 84 – Image of Cold spot from truck with heated body on June 6th, 2003.
Monitored Site 38
The next monitored site was project number 171-307H on Route 176 in
Newington on June 9th, 2003. This project was also monitored exclusively for the heated
body study. The material on this project was Class 1 and it was being placed at a
compacted thickness of 2 inches. The haul time from the plant to this project was
approximately 8 – 10 minutes as the plant was located just 5 miles away and also in the
town of Newington. The base pavement temperature was 80°F-85°F and the ambient
temperature ranged from 65°F-70°F. The paving equipment consisted of a Blaw-Knox
model PF200B paver, a Hyster model C340 Static breakdown roller, and an Ingersoll
Rand model DD-110 vibratory intermediate and breakdown roller. There was no MTV
used on this project. Again there was no significant change in the thermal nature of the
HMA as cold spots appeared regardless of whether or not the bodies were heated. Figure
A - 88
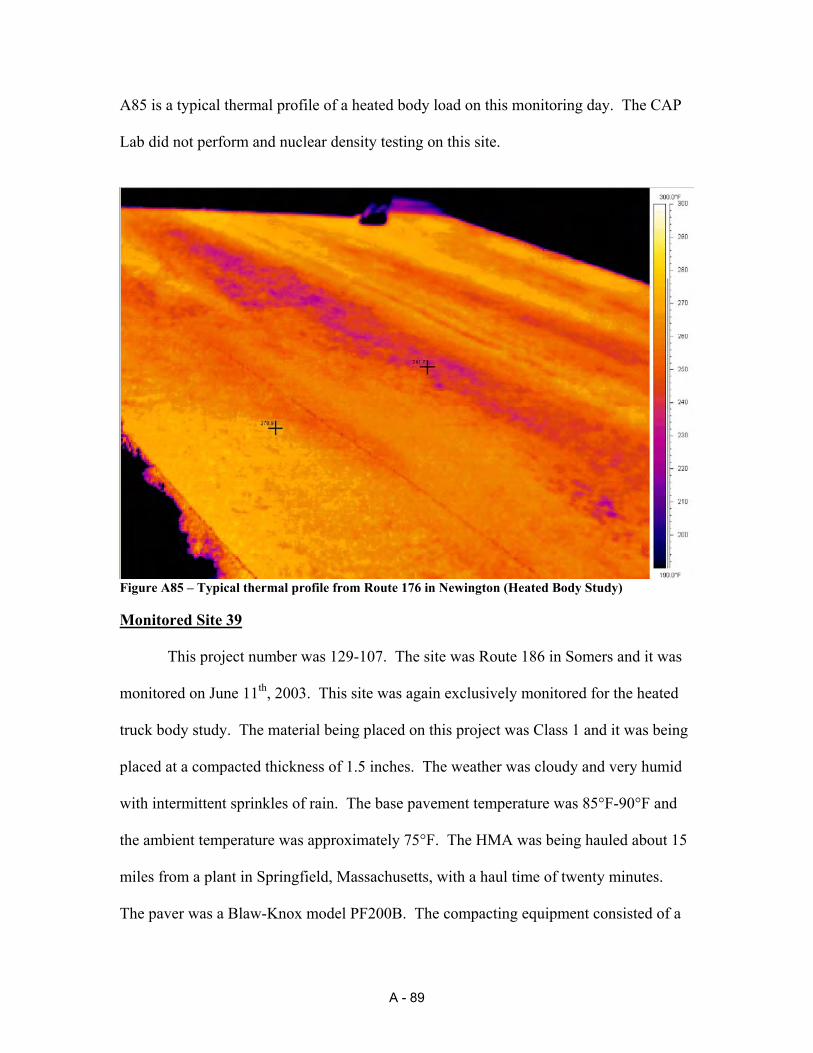
A85 is a typical thermal profile of a heated body load on this monitoring day. The CAP
Lab did not perform and nuclear density testing on this site.
Figure A85 – Typical thermal profile from Route 176 in Newington (Heated Body Study)
Monitored Site 39
This project number was 129-107. The site was Route 186 in Somers and it was
monitored on June 11th, 2003. This site was again exclusively monitored for the heated
truck body study. The material being placed on this project was Class 1 and it was being
placed at a compacted thickness of 1.5 inches. The weather was cloudy and very humid
with intermittent sprinkles of rain. The base pavement temperature was 85°F-90°F and
the ambient temperature was approximately 75°F. The HMA was being hauled about 15
miles from a plant in Springfield, Massachusetts, with a haul time of twenty minutes.
The paver was a Blaw-Knox model PF200B. The compacting equipment consisted of a
A - 89
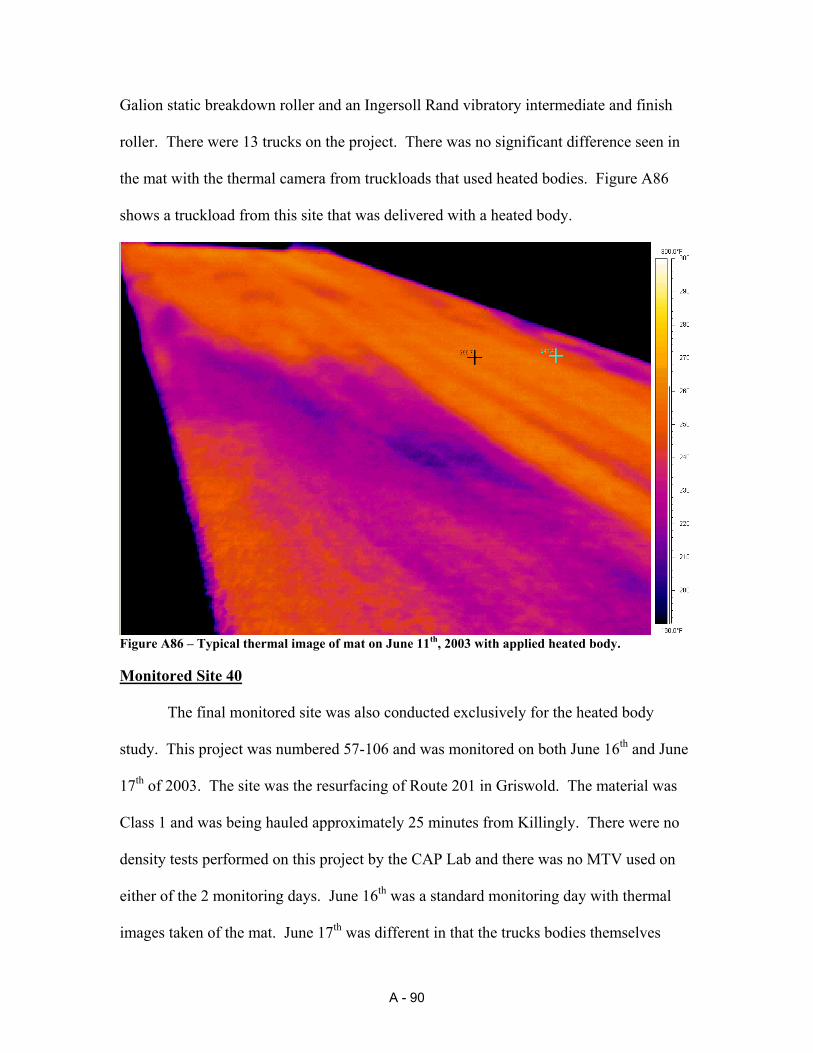
Galion static breakdown roller and an Ingersoll Rand vibratory intermediate and finish
roller. There were 13 trucks on the project. There was no significant difference seen in
the mat with the thermal camera from truckloads that used heated bodies. Figure A86
shows a truckload from this site that was delivered with a heated body.
Figure A86 – Typical thermal image of mat on June 11th, 2003 with applied heated body.
Monitored Site 40
The final monitored site was also conducted exclusively for the heated body
study. This project was numbered 57-106 and was monitored on both June 16th and June
17th of 2003. The site was the resurfacing of Route 201 in Griswold. The material was
Class 1 and was being hauled approximately 25 minutes from Killingly. There were no
density tests performed on this project by the CAP Lab and there was no MTV used on
either of the 2 monitoring days. June 16th was a standard monitoring day with thermal
images taken of the mat. June 17th was different in that the trucks bodies themselves
A - 90
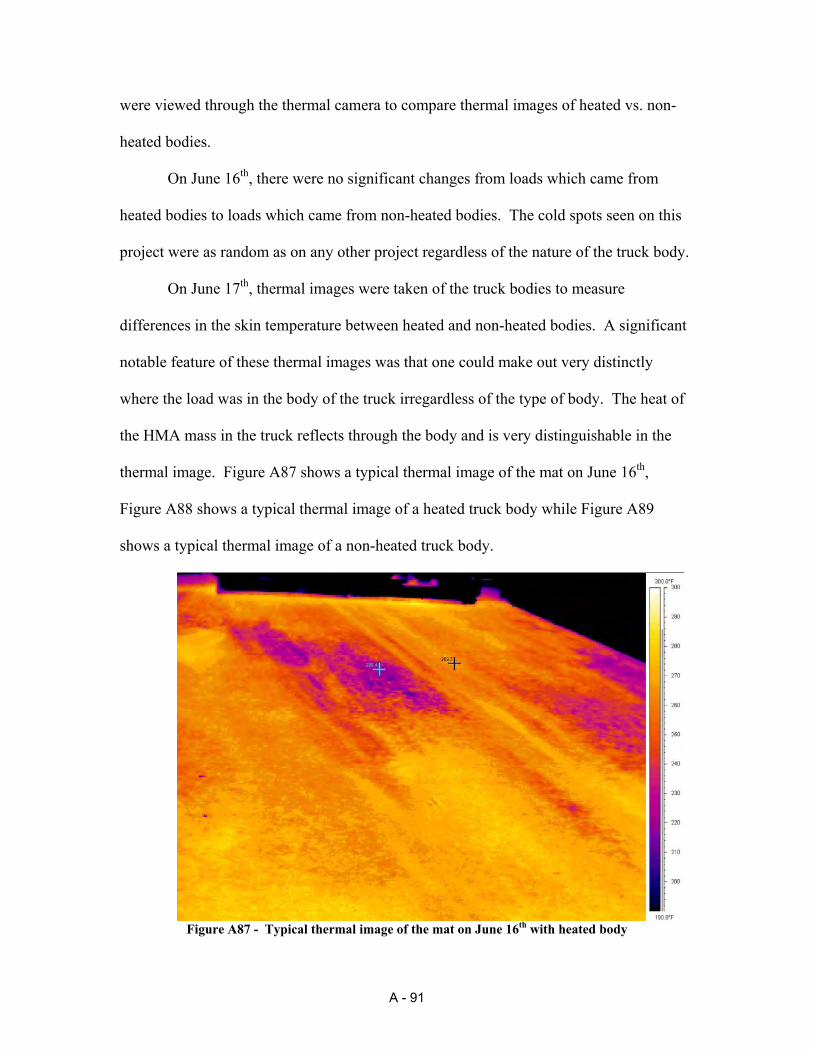
were viewed through the thermal camera to compare thermal images of heated vs. non-
heated bodies.
On June 16th, there were no significant changes from loads which came from
heated bodies to loads which came from non-heated bodies. The cold spots seen on this
project were as random as on any other project regardless of the nature of the truck body.
On June 17th, thermal images were taken of the truck bodies to measure
differences in the skin temperature between heated and non-heated bodies. A significant
notable feature of these thermal images was that one could make out very distinctly
where the load was in the body of the truck irregardless of the type of body. The heat of
the HMA mass in the truck reflects through the body and is very distinguishable in the
thermal image. Figure A87 shows a typical thermal image of the mat on June 16th,
Figure A88 shows a typical thermal image of a heated truck body while Figure A89
shows a typical thermal image of a non-heated truck body.
Figure A87 - Typical thermal image of the mat on June 16th with heated body
A - 91
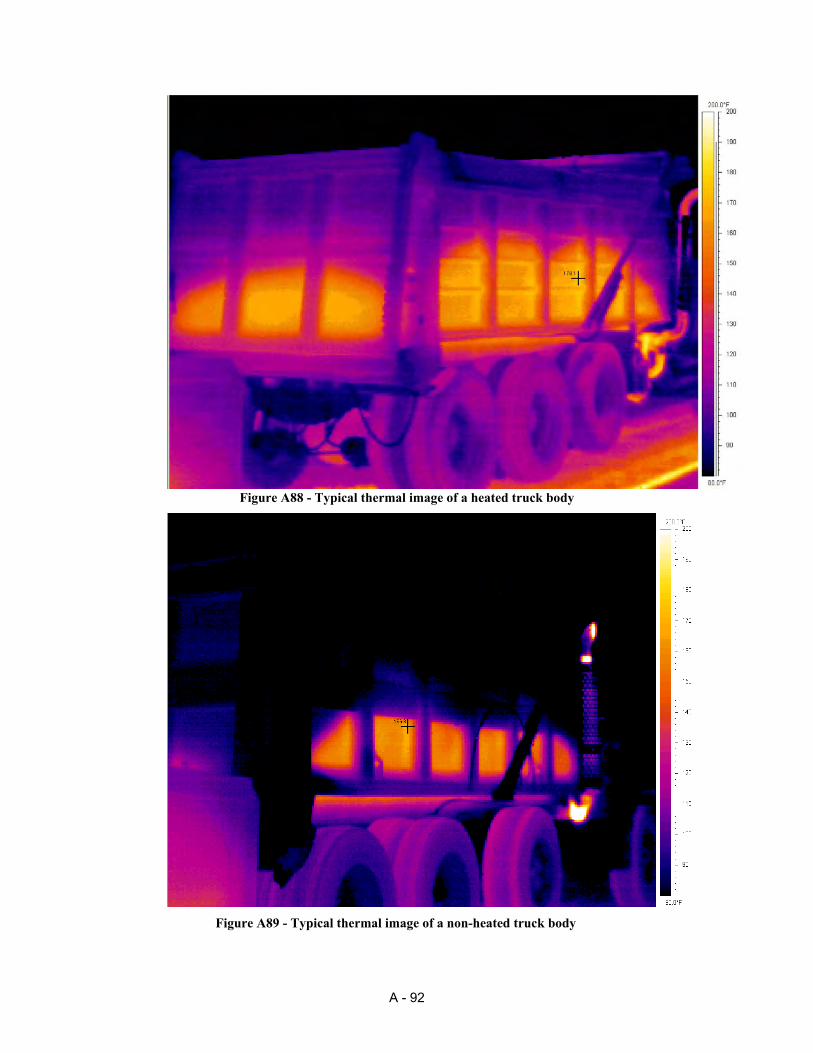
Figure A88 - Typical thermal image of a heated truck body
Figure A89 - Typical thermal image of a non-heated truck body
A - 92