Infrared Thermographic Systems - Lawrence Berkeley National
54
LBNL-46590 Infrared Thermographic Systems A Review of IR Imagers and Their Use by Brent Griffith, Daniel Türler, and Howdy Goudey Lawrence Berkeley National Laboratory Berkeley CA July 27, 2001 Manuscript for eventual publication as a chapter in the The Encyclopedia of Imaging Science and Technology Joseph P. Hornak, Editor-in-Chief, John Wiley and Sons.
Transcript of Infrared Thermographic Systems - Lawrence Berkeley National
LBNL-46590
Infrared Thermographic Systems
A Review of IR Imagers and Their Use
by
Brent Griffith, Daniel Türler, and Howdy Goudey
Lawrence Berkeley National Laboratory
Berkeley CA
July 27, 2001
Manuscript for eventual publication as a chapter in the
The Encyclopedia of Imaging Science and Technology
Joseph P. Hornak, Editor-in-Chief, John Wiley and Sons.
Infrared Thermographic Systems
INTRODUCTION
Infrared (IR) thermographic systems, or IR imagers, provide images that represent
surface temperatures, or thermograms, by measuring the magnitude of infrared radiation
emanating from the surface of an object. Because IR imagers see the radiation naturally
emitted by objects, imaging may be performed in the absence of any additional light
source. Modern IR imagers resolve surface temperature differences of 0.1ºC or less. With
this high sensitivity, they can evaluate subtle thermal phenomena, which are only
revealed in the form of slight temperature gradients. Some applications that employ IR
thermography include: inspections for predictive maintenance, non-destructive evaluation
of thermal and mechanical properties, building science, military reconnaissance and
weapons guidance, and medical imaging.
Infrared thermography can be used as both a qualitative and a quantitative tool. Some
applications do not require obtaining exact surface temperatures. In such cases, it is
sufficient to acquire thermal signatures, characteristic patterns of relative temperatures of
phenomena or objects. This method of qualitative visual inspection is expedient for
collecting a large number of detailed data and conveying them in a fashion that can be
easily interpreted. In contrast, accurate quantitative thermography demands a more
rigorous procedure to extract valid temperature maps from raw thermal images. However,
the extra effort can produce large arrays of high-resolution temperature data, which are
unrivaled by contact thermal measurement techniques, such as using thermocouple wires.
1
A skilled operator of an IR thermographic system, or thermographer, must be conscious
of the possibility that reflected or transmitted, rather than emitted, IR radiation may be
emanating from an object. These additional sources manifest themselves as signals that
appear to be, but are not actually, based exclusively on the temperature of the spot being
imaged.
To understand the challenges and possibilities of IR thermography, it is first necessary to
review the principles of physics on which it relies.
THEORY OF OPERATION
The fundamental principles that make IR thermal imaging possible begin with the
observation that all objects emit a distribution of electromagnetic radiation that is
uniquely related to the object temperature. Temperature is a measure of the internal
energy within an object, a macroscopic average of the kinetic energy (the energy of
motion) of the atoms or molecules of which the object is composed. Electromagnetic
radiation arises from the oscillation of electrostatically charged particles, such as the
charged particles found within an atom, the electron and the proton. Electromagnetic
radiation propagates by means of the interaction between oscillating electric and
magnetic fields and can sustain itself in the absence of any conveying media. The
wavelength, the distance between successive peaks in the oscillations of the electric and
magnetic field, can vary over a wide range representing a diverse range of phenomena
including radio transmissions, microwaves, infrared (IR), visible and ultraviolet (UV)
2
light, x-rays and gamma rays. The IR portion of the electromagnetic spectrum, which is
of primary in interest to thermographers, includes wavelengths from about 1 to 100 μm.
The interaction of materials with radiation of different wavelengths is extremely varied.
Electromagnetic radiation may be absorbed, reflected, or transmitted by a material,
depending on the material properties with respect to the wavelength in question. The IR
band of radiation is considered “thermal” in nature, mostly because it contains the
wavelengths of radiation emitted by objects of ordinary temperatures. However, if it
weren’t for the high absorption of IR by most objects, it would not be nearly as important
to heat transfer. For example, human skin absorbs well in the IR; for this reason we
perceive IR radiation as heat more readily than we perceive radiation of other
wavelengths, such as x-rays, which are mostly transmitted. Visible radiation is also
considered thermally important, because visibly dark objects absorb it well, and because
it is a substantial component of the radiation emitted by the sun.
An object with a single temperature does not simply emit a single wavelength of
electromagnetic radiation. Because temperature is a macroscopic average of molecular
scale oscillations, there is, in fact, a distribution of molecular kinetic energies underlying
a single temperature. Correspondingly, there is a distribution of wavelengths and
intensities of electromagnetic radiation emitted by an object of a single temperature, as a
result of the varied oscillation rates of the charged particles within. Using a theoretical,
idealized emitter termed a blackbody, Planck first derived a mathematical expression for
the emissive power of radiation as a function of wavelength and temperature, hence, it is
3
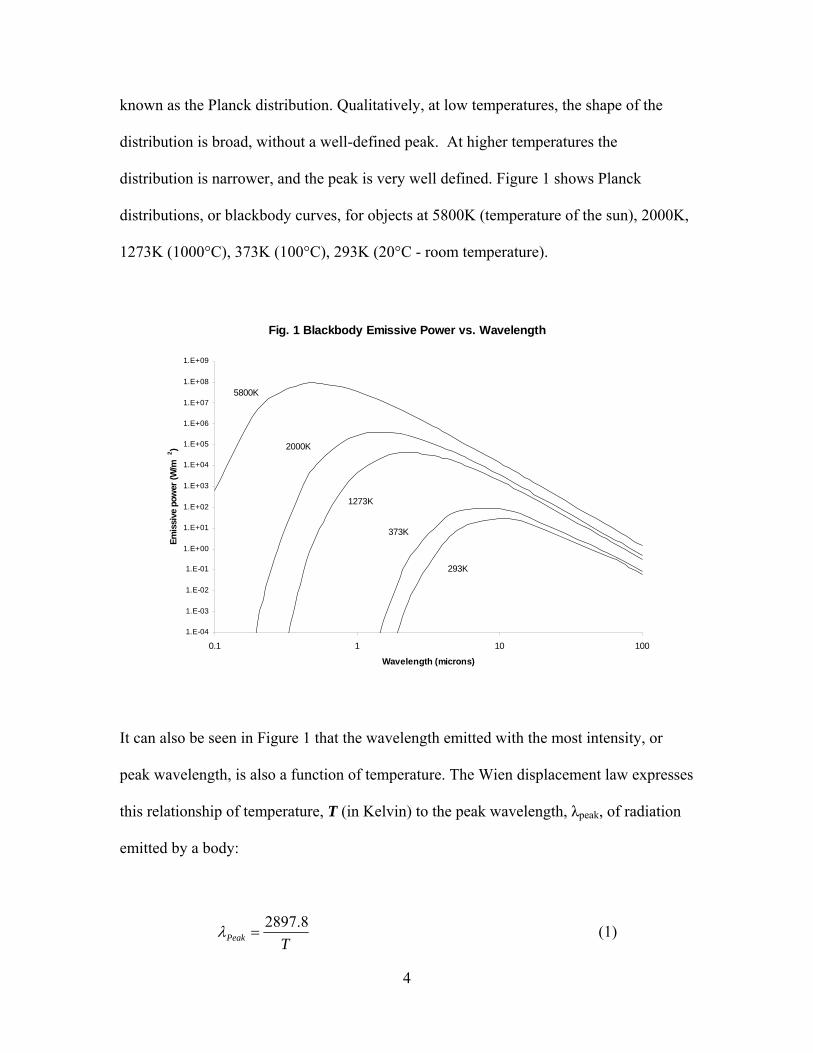
known as the Planck distribution. Qualitatively, at low temperatures, the shape of the
distribution is broad, without a well-defined peak. At higher temperatures the
distribution is narrower, and the peak is very well defined. Figure 1 shows Planck
distributions, or blackbody curves, for objects at 5800K (temperature of the sun), 2000K,
1273K (1000°C), 373K (100°C), 293K (20°C - room temperature).
Fig. 1 Blackbody Emissive Power vs. Wavelength
1.E-04
1.E-03
1.E-02
1.E-01
1.E+00
1.E+01
1.E+02
1.E+03
1.E+04
1.E+05
1.E+06
1.E+07
1.E+08
1.E+09
0.1 1 10 100
Wavelength (microns)
Emis
sive
pow
er (W
/m2 )
5800K
2000K
1273K
373K
293K
It can also be seen in Figure 1 that the wavelength emitted with the most intensity, or
peak wavelength, is also a function of temperature. The Wien displacement law expresses
this relationship of temperature, T (in Kelvin) to the peak wavelength, λpeak, of radiation
emitted by a body:
TPeak8.2897
=λ (1)
4
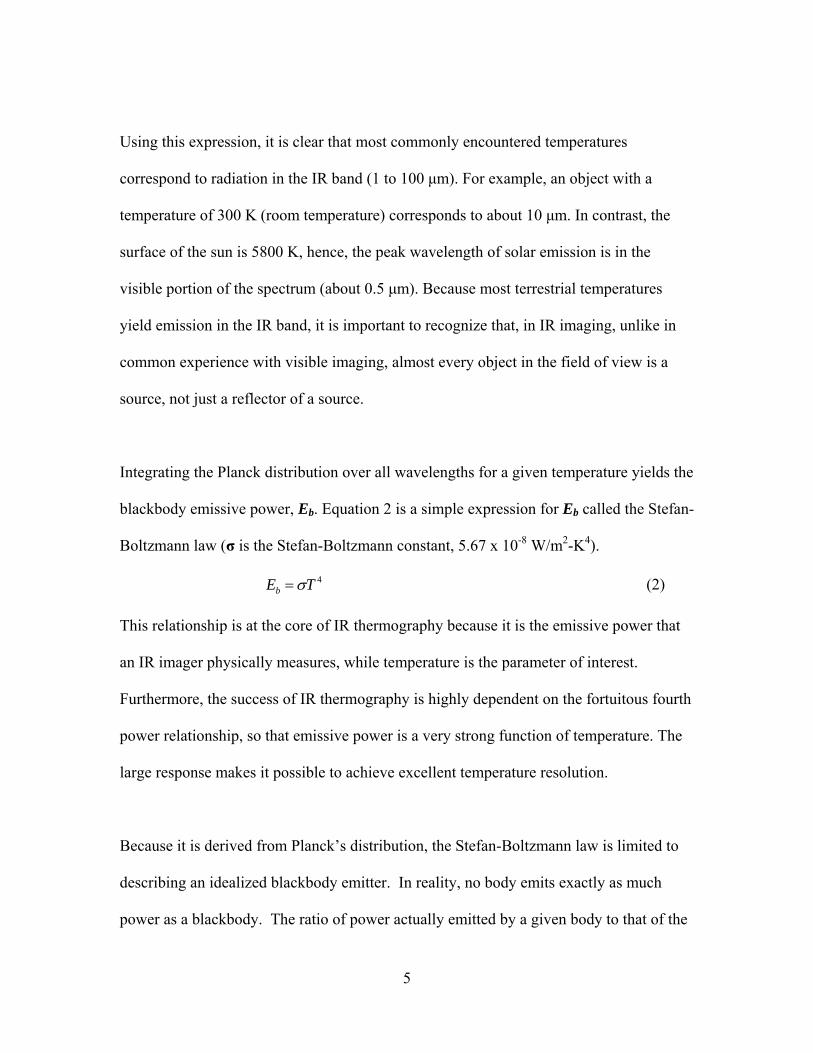
Using this expression, it is clear that most commonly encountered temperatures
correspond to radiation in the IR band (1 to 100 μm). For example, an object with a
temperature of 300 K (room temperature) corresponds to about 10 μm. In contrast, the
surface of the sun is 5800 K, hence, the peak wavelength of solar emission is in the
visible portion of the spectrum (about 0.5 μm). Because most terrestrial temperatures
yield emission in the IR band, it is important to recognize that, in IR imaging, unlike in
common experience with visible imaging, almost every object in the field of view is a
source, not just a reflector of a source.
Integrating the Planck distribution over all wavelengths for a given temperature yields the
blackbody emissive power, Eb. Equation 2 is a simple expression for Eb called the Stefan-
Boltzmann law (σ is the Stefan-Boltzmann constant, 5.67 x 10⁻⁸ W/m2-K4).
4TEb σ= (2)
This relationship is at the core of IR thermography because it is the emissive power that
an IR imager physically measures, while temperature is the parameter of interest.
Furthermore, the success of IR thermography is highly dependent on the fortuitous fourth
power relationship, so that emissive power is a very strong function of temperature. The
large response makes it possible to achieve excellent temperature resolution.
Because it is derived from Planck’s distribution, the Stefan-Boltzmann law is limited to
describing an idealized blackbody emitter. In reality, no body emits exactly as much
power as a blackbody. The ratio of power actually emitted by a given body to that of the
5
power emitted by a blackbody at the same temperature is referred to as the emissivity, and
is represented by a non-dimensional number between zero and one. Emissivity is a
wavelength, temperature and incidence angle dependent property specific to each
material. The term emittance, or e, is more useful to the thermographer because it is used
to describe the emissivity of object in aggregate, over a range of wavelengths,
temperatures and incident angles. Usually this simplified quantity is only valid over a
limited range of these parameters, within which the variation in emmisivity with respect
to each parameter is not highly significant. A surface that meets the criteria of nearly
constant emmisivity with respect to wavelength and incidence angle within a certain
regime is termed a gray surface and can be characterized with a single emittance for
simplified calculations. Published values of emittance should only be used when the
wavelength, temperature and angular parameters are in close agreement with those
concerning the IR imaging arrangement at hand. Surface emittance needs to be well
understood for successful operation of IR thermographic systems. Introducing emittance
into Equation 2 yields Equation 3, the Stephan-Boltzmann law modified with emittance,
e:
4TeE σ= (3)
Thermal radiation is largely a surface phenomenon, because most materials are not
transparent to IR. As a result, it is the material properties of the surface of an object that
determine emittance. Polished metals have low emittance, but a thin layer of paint can
transform them to high emittance. For materials that are opaque to IR radiation,
6
emittance can be considered the complement of reflectance (the amount of incident
radiation that is reflected by a surface), expressed by 1-e. It is important to realize that
because no real surface has an emittance e=1, the radiation that is viewed as coming from
an object is always a combination of emitted and reflected radiation, termed radiosity,
and it contains information regarding both the temperature of the object and its
surroundings. Special techniques described within this chapter are necessary to
distinguish the two components and obtain accurate surface temperatures for the object of
interest. When imaging outdoors, it should be taken into account that the sun is a
significant source of IR radiation, particularly in the shorter wavelengths of the IR band.
TYPES OF IMAGING SYSTEMS
General Characteristics
Infrared thermographic systems are essentially imaging IR radiometers. Often they
provide IR images continuously, in real time, similar to the “TV” image provided by
conventional video cameras. The imager itself contains, at a minimum, a detector and an
image formation component. Complete thermographic systems also integrate an image
processing and display system. An IR imager is often called radiometric when it is
designed for measuring temperatures. Non-radiometric IR imagers are used in
applications which do not require measuring quantitative temperatures differences, but
rather are satisfied by a qualitative image display. For example, this type of imager is
used for night vision and surveillance. Non-radiometric imagers do not need extensive
calibration, thermal stability, or image processing capabilities, making them less
expensive.
7
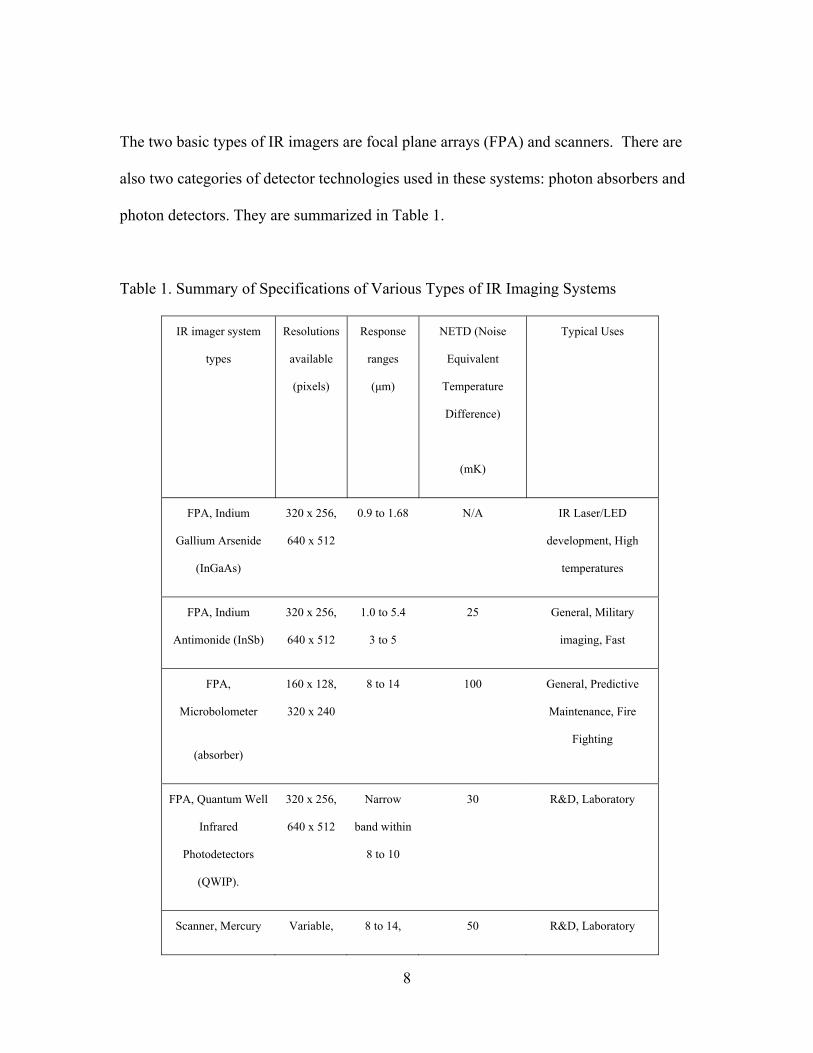
The two basic types of IR imagers are focal plane arrays (FPA) and scanners. There are
also two categories of detector technologies used in these systems: photon absorbers and
photon detectors. They are summarized in Table 1.
Table 1. Summary of Specifications of Various Types of IR Imaging Systems
IR imager system
types
Resolutions
available
(pixels)
Response
ranges
(μm)
NETD (Noise
Equivalent
Temperature
Difference)
(mK)
Typical Uses
FPA, Indium
Gallium Arsenide
(InGaAs)
320 x 256,
640 x 512
0.9 to 1.68 N/A IR Laser/LED
development, High
temperatures
FPA, Indium
Antimonide (InSb)
320 x 256,
640 x 512
1.0 to 5.4
3 to 5
25 General, Military
imaging, Fast
FPA,
Microbolometer
(absorber)
160 x 128,
320 x 240
8 to 14 100 General, Predictive
Maintenance, Fire
Fighting
FPA, Quantum Well
Infrared
Photodetectors
(QWIP).
320 x 256,
640 x 512
Narrow
band within
8 to 10
30 R&D, Laboratory
Scanner, Mercury Variable, 8 to 14, 50 R&D, Laboratory
8
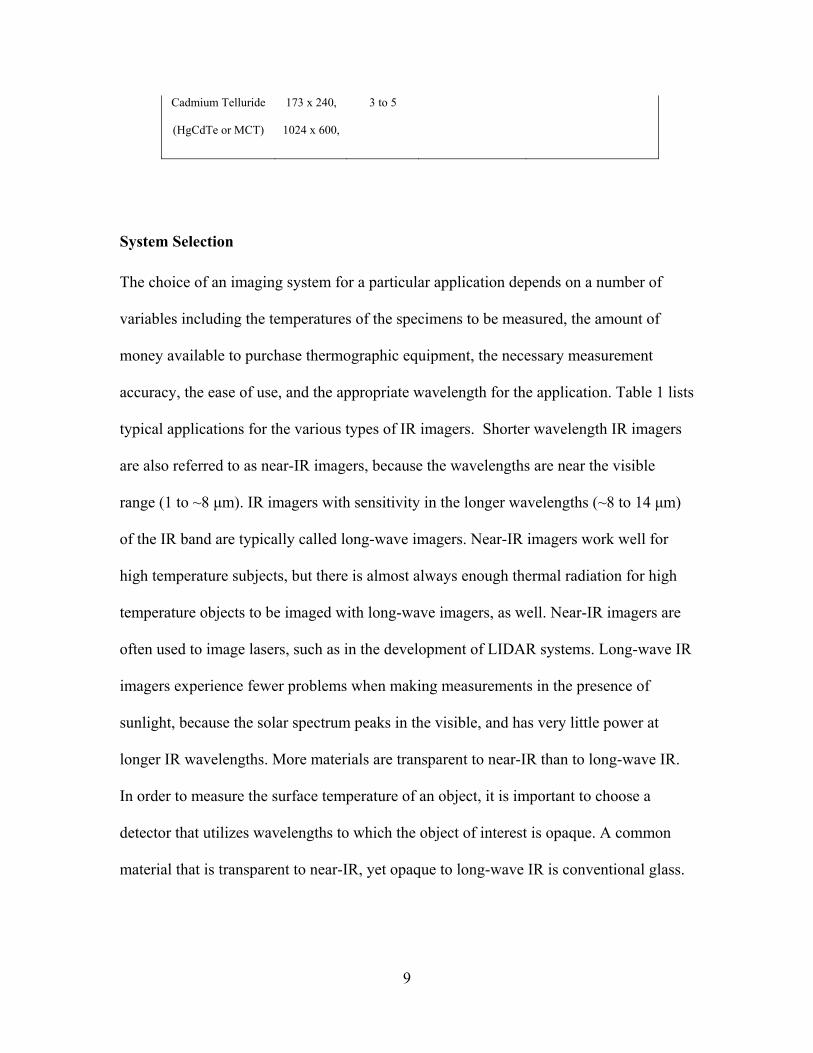
Cadmium Telluride
(HgCdTe or MCT)
173 x 240,
1024 x 600,
3 to 5
System Selection
The choice of an imaging system for a particular application depends on a number of
variables including the temperatures of the specimens to be measured, the amount of
money available to purchase thermographic equipment, the necessary measurement
accuracy, the ease of use, and the appropriate wavelength for the application. Table 1 lists
typical applications for the various types of IR imagers. Shorter wavelength IR imagers
are also referred to as near-IR imagers, because the wavelengths are near the visible
range (1 to ~8 μm). IR imagers with sensitivity in the longer wavelengths (~8 to 14 μm)
of the IR band are typically called long-wave imagers. Near-IR imagers work well for
high temperature subjects, but there is almost always enough thermal radiation for high
temperature objects to be imaged with long-wave imagers, as well. Near-IR imagers are
often used to image lasers, such as in the development of LIDAR systems. Long-wave IR
imagers experience fewer problems when making measurements in the presence of
sunlight, because the solar spectrum peaks in the visible, and has very little power at
longer IR wavelengths. More materials are transparent to near-IR than to long-wave IR.
In order to measure the surface temperature of an object, it is important to choose a
detector that utilizes wavelengths to which the object of interest is opaque. A common
material that is transparent to near-IR, yet opaque to long-wave IR is conventional glass.
9
IR imagers with large array sizes tend to be more expensive to produce largely because of
their increased complexity and the challenge of making large arrays without excessive
numbers of non-operational pixels. For many applications, it will be important to
consider the imager’s instantaneous field of view (IFOV) measured in milliradians; a
combination of array size and optical arrangement, that determines the physical
dimensions represented by any one pixel, for a given distance from the imager. Special
optics are available to allow IR imaging on the micron length scale, however, most IR
imagers have a wide field of view, resulting in pixels with physical dimensions on the
order of millimeters, for object distances in meters.
Some detectors require cooling to low temperatures with liquid nitrogen or a closed-cycle
Stirling cooler. The need for cooling can add inconvenience, expense, and start-up delay,
depending on the cooling method used. Stirling coolers are expensive and require several
minutes of operation before the imager can be used. Liquid nitrogen cooling is
inexpensive, however it can be inconvenient for field use where it may not be readily
available. There are also detector technologies that do not require cooling.
Focal Plane Arrays
Focal plane array (FPA) imagers are the most common types of systems today. They are
analogous to the CCD arrays found in hand-held video cameras but are sensitive to IR,
rather than visible radiation. In an FPA, each pixel that makes up an IR image is
measured with an individual detector. The detectors are arranged in a flat, two-
10
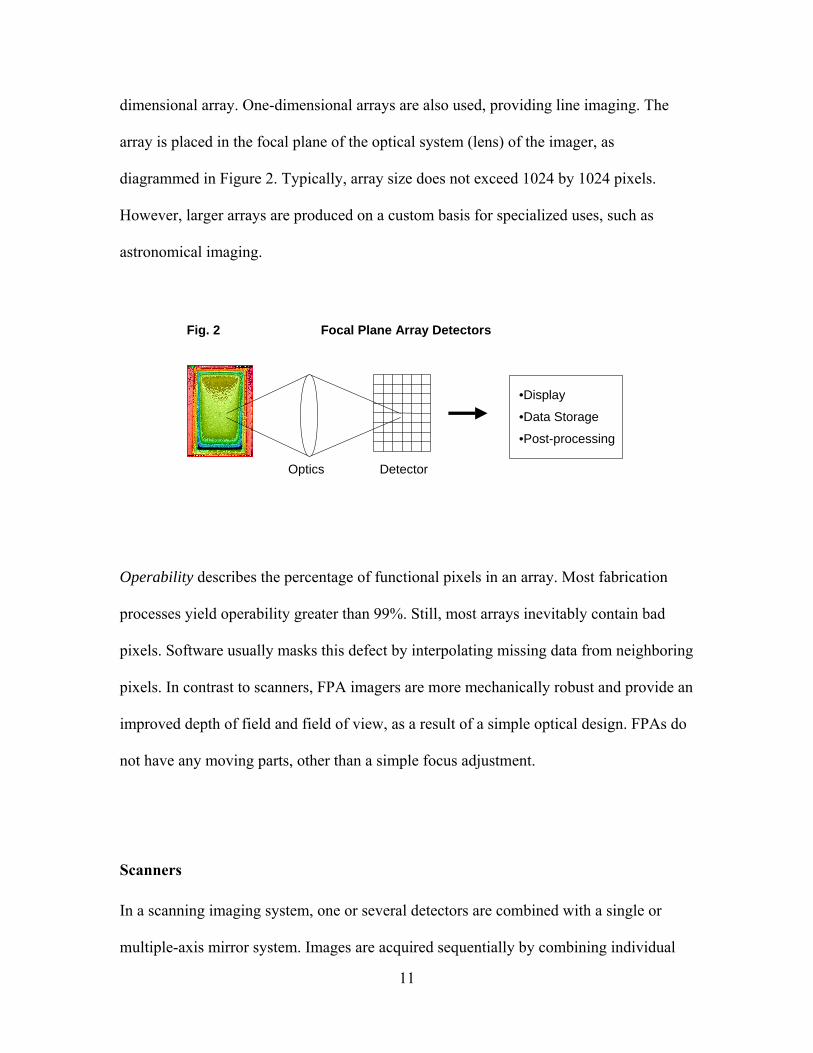
dimensional array. One-dimensional arrays are also used, providing line imaging. The
array is placed in the focal plane of the optical system (lens) of the imager, as
diagrammed in Figure 2. Typically, array size does not exceed 1024 by 1024 pixels.
However, larger arrays are produced on a custom basis for specialized uses, such as
astronomical imaging.
Fig. 2 Focal Plane Array Detectors
•Display
•Data Storage
•Post-processing
DetectorOptics
Operability describes the percentage of functional pixels in an array. Most fabrication
processes yield operability greater than 99%. Still, most arrays inevitably contain bad
pixels. Software usually masks this defect by interpolating missing data from neighboring
pixels. In contrast to scanners, FPA imagers are more mechanically robust and provide an
improved depth of field and field of view, as a result of a simple optical design. FPAs do
not have any moving parts, other than a simple focus adjustment.
Scanners
In a scanning imaging system, one or several detectors are combined with a single or
multiple-axis mirror system. Images are acquired sequentially by combining individual
11
measurements. Scanning mirror imagers were used before large FPAs became readily
available in the 3-12 μm range. Multiple detector units are used in multi-spectral imaging
systems; each detector records a certain band of the spectrum. Old Landsat satellites are
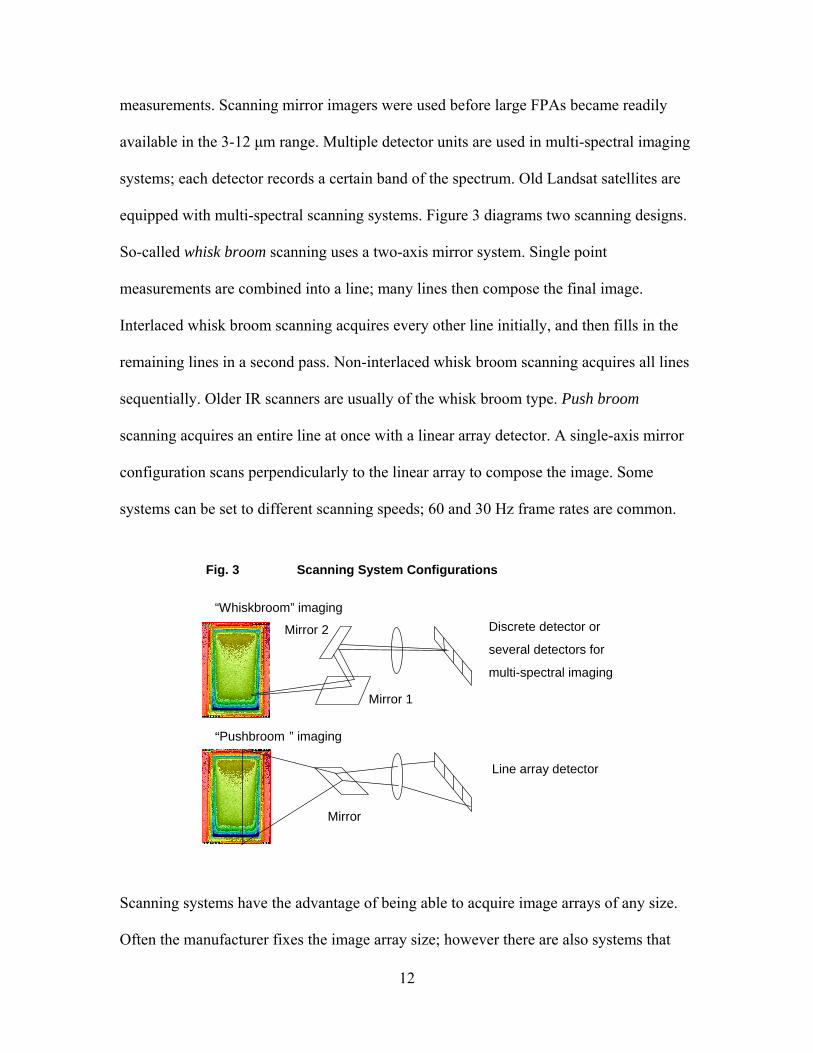
equipped with multi-spectral scanning systems. Figure 3 diagrams two scanning designs.
So-called whisk broom scanning uses a two-axis mirror system. Single point
measurements are combined into a line; many lines then compose the final image.
Interlaced whisk broom scanning acquires every other line initially, and then fills in the
remaining lines in a second pass. Non-interlaced whisk broom scanning acquires all lines
sequentially. Older IR scanners are usually of the whisk broom type. Push broom
scanning acquires an entire line at once with a linear array detector. A single-axis mirror
configuration scans perpendicularly to the linear array to compose the image. Some
systems can be set to different scanning speeds; 60 and 30 Hz frame rates are common.
Fig. 3 Scanning System Configurations
Mirror 1
Mirror 2 Discrete detector or
several detectors for
multi-spectral imaging
“Whiskbroom” imaging
Line array detector
“Pushbroom ” imaging
Mirror
Scanning systems have the advantage of being able to acquire image arrays of any size.
Often the manufacturer fixes the image array size; however there are also systems that
12
dynamically configure the scanning head to acquire the desired image array. Mercury
Cadmium Telluride detectors are the most frequently used single-element detectors in
handheld scanning systems, although any detector with a sufficiently fast dynamic
response could be used.
Scanners are delicate mechanical instruments that will not always tolerate vibration or
high instrument acceleration. Another disadvantage is that the dynamic response of the
detector limits the maximum gradient obtainable in an image at a given scanning speed.
As a result, the frame rates are relatively low compared FPAs. Also, the acquisition time
delay across the image may pose a problem when it is capturing rapid transient events.
Photon Absorbers
A microbolometer is an example of a photon absorber. The absorber is made of a passive
energy absorbing material that is simply warmed by the IR radiation. Incoming thermal
radiation results in an increase in absorber temperature that is proportional to the
radiosity of the surface being imaged. The detector temperature is then determined by
measuring a temperature dependent material property such as electrical resistance. The
absorber has to be thermally decoupled from the substrate and the environment for
maximum performance. Absorbing materials perform well over a large range of the
spectrum. Microbolometer arrays are temperature stabilized, but do not need to be cooled
to cryogenic temperatures, as is necessary for some photon detectors discussed in the
following section.
13
The pixels are typically 30 by 30 μm and are micro-machined in monolithic wafers that
also incorporate signal acquisition and processing. The individual pixels are suspended
and electrically connected by two arms. Heat exchange through gas convection is
suppressed by packing the array in a hard vacuum housing. The broad-band absorption
intrinsic to the detector is thus limited to 6 to 14 μm by the transmission of the vacuum
housing window. This technology will likely see further development in the near future
that will increase sensitivity (NETD below 50 mK).
Photon Detectors
Photon detectors are active elements. A photon striking the detector triggers a free
charge, which is collected and amplified by an electronic circuit. Detectors and read-out
circuits are constructed on different substrates and are electrically connected into a hybrid
assembly by Indium bump bonding. A variety of detector materials are used today, each
with a specific spectral range and specialized application. Some detectors require
cryogenic cooling to reduce the dark current (the amount of current passed by the
detector, in the absence of any photon signal) to acceptable levels. The following are the
most commonly used detectors (summarized in Table 2).
Table 2. Focal Plane Array (FPA) Devices
14
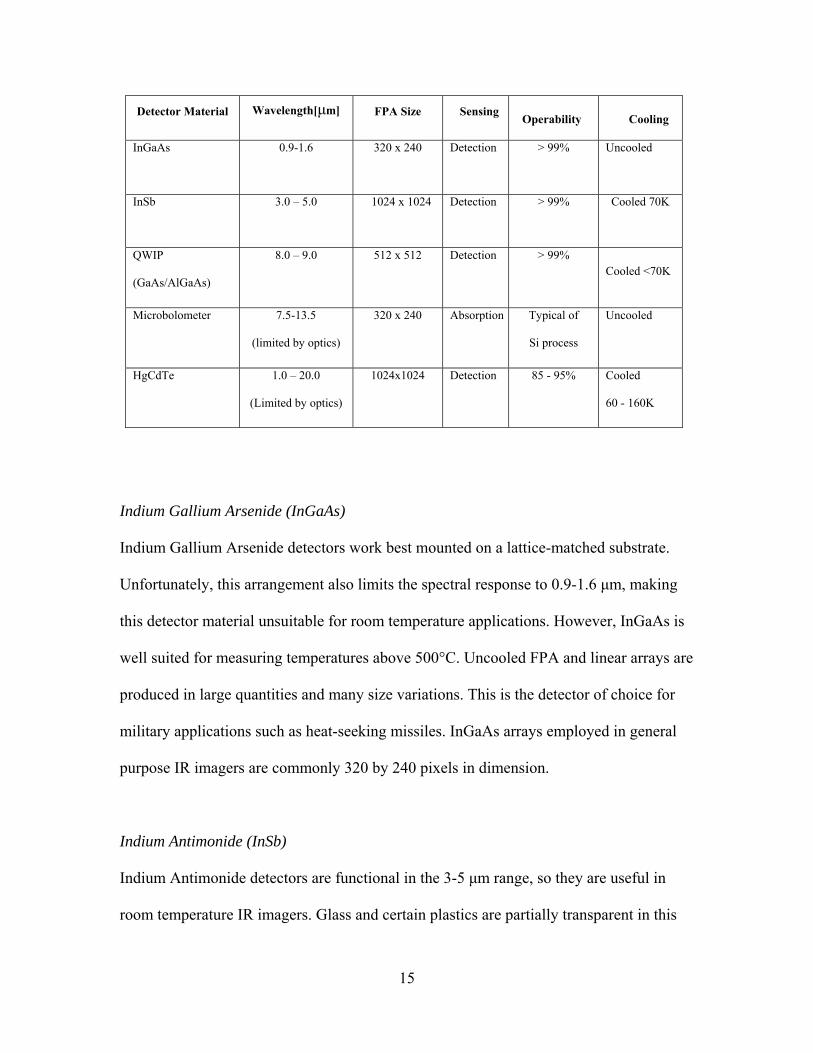
Detector Material Wavelength[μm] FPA Size Sensing Operability Cooling
InGaAs 0.9-1.6 320 x 240 Detection > 99% Uncooled
InSb 3.0 – 5.0 1024 x 1024 Detection > 99% Cooled 70K
QWIP
(GaAs/AlGaAs)
8.0 – 9.0 512 x 512 Detection > 99% Cooled <70K
Microbolometer 7.5-13.5
(limited by optics)
320 x 240 Absorption Typical of
Si process
Uncooled
HgCdTe 1.0 – 20.0
(Limited by optics)
1024x1024 Detection 85 - 95% Cooled
60 - 160K
Indium Gallium Arsenide (InGaAs)
Indium Gallium Arsenide detectors work best mounted on a lattice-matched substrate.
Unfortunately, this arrangement also limits the spectral response to 0.9-1.6 μm, making
this detector material unsuitable for room temperature applications. However, InGaAs is
well suited for measuring temperatures above 500°C. Uncooled FPA and linear arrays are
produced in large quantities and many size variations. This is the detector of choice for
military applications such as heat-seeking missiles. InGaAs arrays employed in general
purpose IR imagers are commonly 320 by 240 pixels in dimension.
Indium Antimonide (InSb)
Indium Antimonide detectors are functional in the 3-5 μm range, so they are useful in
room temperature IR imagers. Glass and certain plastics are partially transparent in this
15
range of the spectrum and need to be painted or covered with an opaque adhesive tape in
order for accurate radiometric data to be collected. Some materials exhibit a larger
reflectivity in this spectral range compared to the 8-12 μm range, so distinguishing
emitted radiation from reflected background radiation may prove more challenging.
Arrays up to 1024 by 1024 pixels and NETD as low as 10mK have been demonstrated
with InSb. These large arrays are not commonly produced and are primarily used in
observatory telescopes. InSb detectors are known for rapid acquisition, with frame rates
up to 80Hz. Cryogenic cooling is required to minimize the dark current.
Quantum Well Infrared Photodetectors (QWIP)
QWIP arrays were developed in the mid 1990s. Only in recent years have QWIP
detectors become commercially available in mass-produced, handheld IR imagers.
Enormous advances in crystal growth technology and processing techniques made it
possible to produce uniform large arrays. Quantum well detectors are characterized by a
sharp spectral absorption line. The well is tuned in depth and width, so it can only hold an
electron in the ground or first excited state. A photon whose energy is equal to the
difference between the energy level of the ground state and the first excited state will
promote a ground state electron to the first excited state. An externally applied voltage
then sweeps the excited electron out, resulting in a photo current. The spectral response
can be set during fabrication by adjusting the well width and depth. QWIP arrays can
typically have their absorption line anywhere in the 8-10 μm range, which is the ideal
range for observing room temperature objects. Sterling coolers are used to reduce the
16
temperature of these detectors to 70K. Quantum wells are made of layers of Aluminum-
Gallium-Arsenic and Gallium-Arsenic.
Mercury Cadmium Telluride (HgCdTe or MCT)
Mercury Cadmium Telluride is sensitive to wide range of wavelengths (1 to 20 μm),
which allows making detectors for highly varied applications. Large arrays up to 2000 by
2000 pixels are produced in very small numbers for astronomy applications.
Unfortunately, technical difficulties prevent such large arrays from being commercialized
in small handheld IR imagers. The fabrication process requires very toxic substances and
poses an environmental problem. In addition, the detector arrays are currently produced
with a poor operability of 85 to 95%. Cooling to between 60 and 160K is required,
depending on the selected bandwidth. MCT is commonly employed as a single-element
detector in scanning systems.
Data Acquisition/Image Processing
Collecting image data is an important part of operating a real-time imager. The data are
commonly recorded for later analysis, assembly into reports, etc. Continuous video
signals may be recorded on tape or with the aid of a computerized video digitizer. In
steady-state thermal situations a single IR image would be generated by averaging a
number of frames over a period of time. Transient thermal situations are usually
recorded continually, and a series of images are stored over time.
17
The resolution of acquired data is typically expressed in number of bits. An 8-bit system
will distinguish 256 different levels of temperature or radiosity; a 12-bit system
distinguishes 4096 levels.
GOOD PRACTICE/SYSTEM OPERATION GUIDANCE
Emittance and Background
The key to using an IR thermographic system well is to combine skilled operation of the
imaging system with a good understanding of how IR radiation interacts with the
object(s) being imaged and consideration of the movement of heat energy in and around
the object(s) by all modes of heat transfer (conduction, convection and radiation).
Emittance and its relation to reflected IR radiation from the background were discussed
briefly in the theory section of this article. However, this topic deserves a more thorough
treatment, because understanding how to interpret these effects is essential to successful
thermography. Variations in surface emittance can cause large changes in the appearance
of an IR image, so the thermographer must know the emittances of the various objects in
the image in order to distinguish genuine temperature differences from those resulting
from non-uniform emittance. Emittance describes the capability of a surface to emit IR
radiation; it is a non-dimensional value ranging from zero to one: zero for no emission
and complete reflection, one for complete emission and no reflection. As long as the
surface is opaque to radiation of the band of wavelengths measured by the imager’s
detector then reflectance and emittance are complementary and added together equal one.
Some published sources of emittance values may not be appropriate for IR thermography.
18
Accurate IR thermography results are best achieved by establishing emittances through
testing, as described later in this article in the Emittance Measurement section under
Scientific Temperature Mapping.
Because no real object has an emittance of one, background thermal radiation arriving at
a surface from the surroundings is in part reflected and becomes a component of the
apparent radiation emanating from the surface. The complete background thermal scene
is the combination of the geometry or orientation of surfaces (including the sky) that are
in view of the object being imaged and their effective temperatures. The sky has a very
cold effective temperature that is hard to quantify, and it is heavily dependant on cloud
cover and the moisture content of the air. IR thermography measurements should
therefore be made indoors, if possible, or the sky should be screened with large cloth
backdrops. A thermographer should not merely consider the emittance and temperature of
objects in the direct field of view, but also be aware of the entire background thermal
scene. What IR radiation is arriving at the surfaces being imaged? Is an observed hot spot
real or a reflection from a nearby object? IR radiation generated by emission gets
reflected and re-reflected and may eventually emanate from all directions with varying
magnitudes that are dependent on the temperatures, geometries, and emittances of the
walls, floors, lights, windows, open sky, trees, and everything else that surrounds the
objects or phenomena being imaged.
19
Specimen Considerations
For a specimen to be imaged, a thermographer should consider the physical properties of
emittance, reflectance, and transmittance/absorption coefficients, especially over the
wavelengths detected by the IR imager. Reflectance and emittance are closely related
and mathematically complementary, in the case of no transmission. In IR imaging, high
emittance is preferable. In this case, most of the apparent radiation is actually due to
emission from the object of interest. Low-emittance (low-e) surfaces are problematic
because the reflection of background radiation can be a more significant portion of the
apparent radiation than the emitted signal of interest. Table 3 lists some emittance values
for various materials. These measurements were made by the authors using the
procedures described in the Emittance Measurement section found later in this article.
20
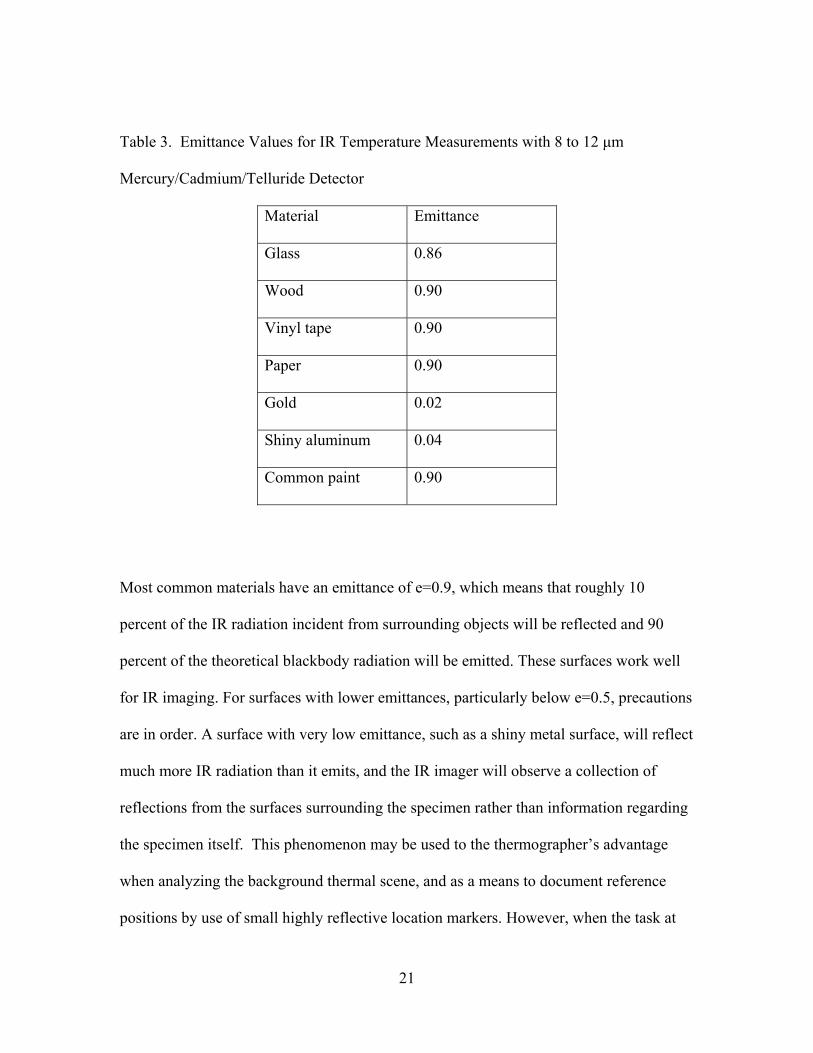
Table 3. Emittance Values for IR Temperature Measurements with 8 to 12 μm
Mercury/Cadmium/Telluride Detector
Material Emittance
Glass 0.86
Wood 0.90
Vinyl tape 0.90
Paper 0.90
Gold 0.02
Shiny aluminum 0.04
Common paint 0.90
Most common materials have an emittance of e=0.9, which means that roughly 10
percent of the IR radiation incident from surrounding objects will be reflected and 90
percent of the theoretical blackbody radiation will be emitted. These surfaces work well
for IR imaging. For surfaces with lower emittances, particularly below e=0.5, precautions
are in order. A surface with very low emittance, such as a shiny metal surface, will reflect
much more IR radiation than it emits, and the IR imager will observe a collection of
reflections from the surfaces surrounding the specimen rather than information regarding
the specimen itself. This phenomenon may be used to the thermographer’s advantage
when analyzing the background thermal scene, and as a means to document reference
positions by use of small highly reflective location markers. However, when the task at
21
hand is to collect temperature data from an object that has low emittance, the surface
needs to be modified by applying a thin layer of a higher-emittance material to the
surface. An opaque adhesive tape or paint can be applied to the surface to raise its
emittance. One quick way to check surface properties is to manipulate the background
thermal scene. For example, a thermographer may introduce a background object with a
temperature significantly different than ambient (e.g. the thermographer’s hand, a butane
lighter, or an ice-cube). Moving the background object laterally near the specimen and
observing any corresponding movement or changes in the IR image can identify highly
reflective surfaces. It is important to recognize that reflections off a specimen can be both
specular and diffuse. A diffuse reflection is angularly independent and blurs out non-
uniformities in the background thermal scene. Specular reflections are angularly
dependant and preserve the image of thermal non-uniformities in the background. It is
more difficult to evaluate the emittance of a specular surface by visual inspection. For
example, window glass is specular and, despite its high emittance (e=0.86), it can show
clear imaged reflections because of the high sensitivity of IR imagers. The distinction
becomes one of magnitude. If a specular surface is also low-e, the reflections appearing
as movement in the image will be more intense than for that of a higher emittance
surface.
A roll of paper/masking tape (e=0.90) is a valuable asset to a thermographer faced with a
specimen of unknown surface properties. A quick check for problematic low-emittance
or transmittance can be performed by applying tape to the specimen and then imaging the
22
specimen. The thermographer will know the specimen has an emittance different than 0.9
(or that the specimen exhibits measurable transmittance) if the piece of tape is apparent in
the image. The tape should be in good thermal contact with the specimen and should not
appreciably alter the true temperature. For example, if the background thermal scene has
an effective temperature colder than the specimen and the region with tape shows as
warmer, then it is very likely that the surface has low emittance and will need to be
modified by painting or being more completely covered with tape.
Painting low-e surfaces is a good idea if it is feasible. An even, opaque coating of paint
is often the best solution for imaging low-e, varying emittance, specular, or transmitting
surfaces when a clean, accurate image or an accurate temperature measurement is
desired. Water-based, temporary paint (e=0.9) applied as a spray is useful and relatively
easy to clean up and remove. Repeat the tests described above for determining whether a
surface is low-e or specular in order to be sure that the paint is applied sufficiently thick;
a coating that is too thin will not raise the emittance completely or uniformly. Location
markers can be applied to a specimen for later use in identifying geometry and spatial
locations in the thermogram. Small strips of aluminum adhesive tape are examples of
low-e surfaces that can be used as location markers in an IR image, if the background is
at a different temperature than the specimen.
Altering the emittance of surfaces for the purpose of IR imaging will also alter the heat
transfer situation. This can lead to significant changes in the real surface temperatures of
a test subject whose surface has been painted, especially when the radiative heat transfer
23
dominates convection and conduction. A thermographer should be careful to report any
modifications made for imaging purposes so that the results can be interpreted properly.
Repeat some measurements with and without paint to clarify the effect of modifying the
surface emittance. The usefulness of good quality IR data often offsets the drawback of
needing to extrapolate from measured results to account for altering the radiation heat
transfer situation. If altering emittance is not possible and high quality data are required
for a varied surface (such as a semiconductor), it is possible to use additional procedures
to obtain a pixel-by-pixel emittance map to use for correcting an image if the subject can
be fixed in place, made isothermal, and controlled to have two temperatures that differ
from the background (1).
Thermal setup
As a thermographer develops facility in accounting for emittance, reflection, and
transmission, the potential for collecting misleading IR images decreases. The challenge
is then to do a good job of interpreting the heat transfer phenomena that are revealed in
the information contained in the image. Because an IR imager displays surface
temperatures, and temperature differences drive heat flow, thermograms can also be used
to visualize where energy is flowing as it moves from hot to cold. Consideration of heat
transfer is important both when designing an experiment that will use IR imaging and
when interpreting thermal patterns in the image. IR images can reveal temperature
differences in a specimen; when there is a temperature difference, heat energy is moving.
If a thermographer wants to image something based on observing temperature
24
differences, then he or she will likely need to make heat energy move as part of that
effort.
In any IR imaging setup, there are two possible heat transfer situations, steady-state and
transient. In steady-state heat transfer, temperatures and heat flows in any one place are
constant over time. In transient heat transfer, temperatures and rates of heat flow change
over time. Steady-state heat transfer is dependent on varying thermal conductance, while
transient heat flow is also dependent on the varying thermal capacity of materials. Often
the objects being imaged will determine which situation is used because of a pre-existing
condition such as internal heat generation, a fabrication process, or other normally
occurring temperature difference. Most objects that consume energy are likely to be
imaged during actual or simulated operation.
However, a thermographer is frequently faced with an energetically passive situation
where heat flow must be induced in order to gather the desired information. The same
physical phenomenon that IR imagers rely on, thermal radiation, is an important vehicle
for heat transfer; conduction and convection being the other two. A thermographer can
use thermal radiation as a method of heating a surface in an imaging setup. Lamps can
provide a convenient source of thermal radiation when a thermographer needs to add heat
to a system. Non-destructive testing efforts often make use of high-powered flash lamps
to generate an abrupt pulse of radiant thermal energy that quickly heats a surface in
transient studies. Other techniques for generating a heat flow include mounting
25
specimens between warm and cold environmental chambers, attaching resistive contact
heaters, blowing hot or cold air on the specimen, scanning lasers, etc.
Features of the material being imaged can be observed based on the propagation of the
heat into the material, indicated by the temperatures as they evolve over time. To test the
effectiveness of a fluid-based cooling circuit in a heat exchanger using thermal imaging,
both the heat load and the cooling mechanism should be activated. Often, establishing a
known, repeatable heat-flow situation is the most challenging aspect of performing an IR
imaging measurement. Creativity and attention to all aspects of the thermal scene are
necessary to design and conduct an IR imaging effort that gathers valid and revealing
data.
An IR imager can also be used to gather information based on varying
transmission/absorption of IR by a material. For example, a gas may absorb IR
differently than air, so it can be detected or quantified using an IR imager. For accurate
surface temperature mapping, transmission of IR by the object of interest is a liability, but
there are applications where IR transmission can be beneficial. A material may be slightly
transparent in the IR (but not in the visible band), so an IR imager would be useful for
tasks such as aligning components. Spectral filters can be used to control the
wavelengths monitored during transmission/absorption measurements.
26
System Operation
It is impractical to try to describe the operation of all the different IR imagers available.
However, some important aspects of operation are relevant to most systems. The
magnitude of the temperature in a thermogram is represented by a color or gray scale.
For visual interpretation, it is not necessary to exceed 256 (8-bit) possible display colors,
and gray scale images often need only 16 (4-bit) shades of gray. The span adjustment of
an imaging system will allow the user to manipulate the maximum displayable
temperature difference by assigning a different temperature increment to each color step
(determining the width of the scale in temperature units). The center temperature
adjustment provides a means for shifting the absolute temperature of the middle of the
scale.
Random noise is inherent to IR detectors; it can be mitigated by averaging many frames
together, pixel by pixel. The standard error of the average of N “identical” measurements
with random noise is the standard deviation of those measurements divided by the square
root of N. Because the standard deviation of most imagers is small, it is not usually
necessary to average more than 15-50 frames before the random error is reduced to be a
much smaller component of the total error than the systematic error involved in using the
instrument. Most commercial thermographic systems provide a means to average frames
to remove random noise.
IR image data are essentially two-dimensional numerical arrays often with 12-bit
resolution (4096 temperature steps). Colors are assigned to levels, but there is no such
27
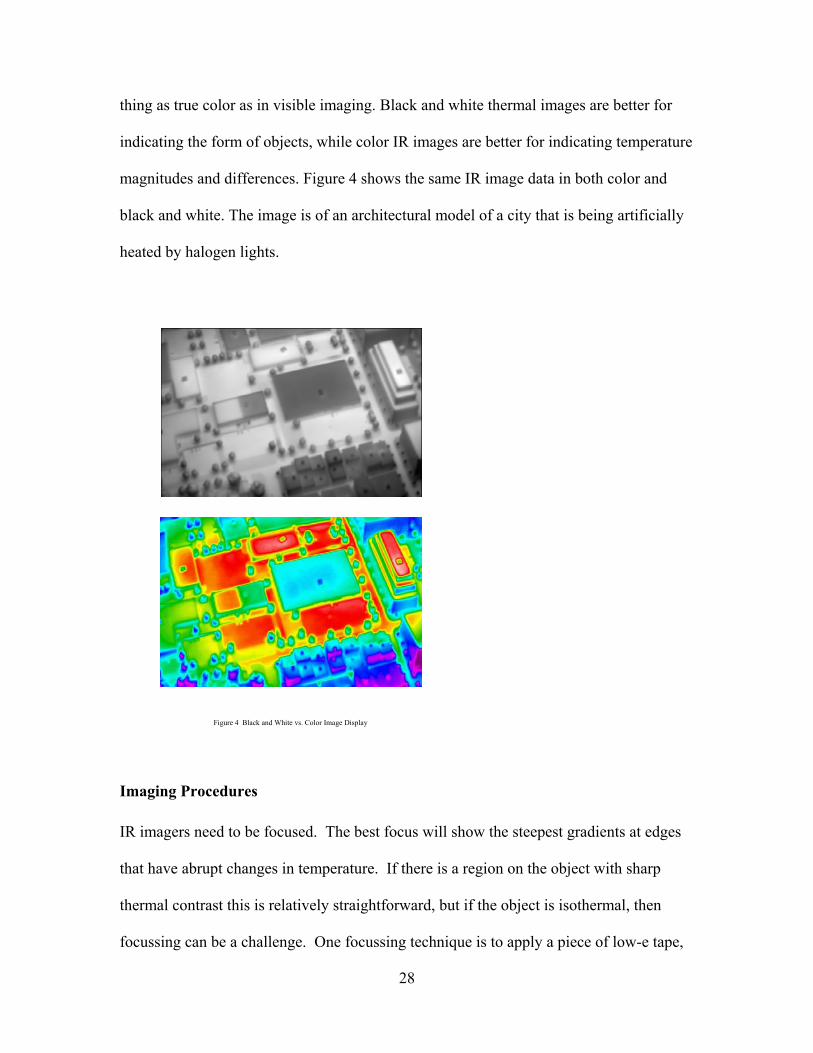
thing as true color as in visible imaging. Black and white thermal images are better for
indicating the form of objects, while color IR images are better for indicating temperature
magnitudes and differences. Figure 4 shows the same IR image data in both color and
black and white. The image is of an architectural model of a city that is being artificially
heated by halogen lights.
Figure 4 Black and White vs. Color Image Display
Imaging Procedures
IR imagers need to be focused. The best focus will show the steepest gradients at edges
that have abrupt changes in temperature. If there is a region on the object with sharp
thermal contrast this is relatively straightforward, but if the object is isothermal, then
focussing can be a challenge. One focussing technique is to apply a piece of low-e tape,
28
such as aluminum, and focus on the contrast created by the tape. The tape can then be
removed and the focus maintained.
The background thermal scene should be assessed early in the arrangement of an IR
imaging experiment. For this purpose an IR mirror is indispensable. Use a material with
a front surface that is highly reflective in the IR. Typical glass mirrors are inappropriate
because they usually have a glass front surface and the reflective metal is behind the
glass. A long-wave IR imager will image the surface temperatures of the glass more than
reflecting the background, since glass has a relatively high emittance. A piece of
metalized polyester film is a good choice for a background mirror. It can be placed on, or
in front of the specimen to be measured, and allows imaging the background radiation
which is incident on and hence may be reflected from the specimen. It is desirable to
establish a thermal background that is as uniform as possible. Non-uniformities in the
background can manifest themselves as non-uniformities in the specimen being
measured. A back-drop such as a sheet of foam or heavy cloth can provide a uniform
background. IR mirrors are usually specular, this is useful for identifying thermal
patterns in the background, but unless the mirror is very large, or the background
radiation very uniform, it may be difficult to collect a good average background
temperature to use in surface temperature corrections. Diffuse reflecting mirrors, special
highly reflective but convoluted surfaces, are available to provide thermal background
information which represents more of an average background temperature as incident on
the location of the mirror. This can be convenient for determining a single value for
background temperature, when it is not possible to attain good background uniformity.
29

THERMOGRAPHIC INSPECTION
Thermographic inspection primarily evaluates images for qualitative thermal signatures
(rather than absolute temperature levels) to discern the presence and proximity of a
feature of interest or defect. The status-of-operation or maintenance condition of a piece
of equipment may also be discerned. Thermographic inspections can be used in industry,
medicine, and aerospace to reveal malfunction, leaks, material loss, delamination,
contamination, friction, pain, and tumors, etc. It is important to recognize that there is a
distinction between radiometric imaging for absolute temperature accuracy, and thermal
imaging for relative temperature information or thermal signatures.
Radiometric Imaging
In radiometric imaging, IR imagers are used as non-contact temperature sensors. The
objective of the imaging is to monitor, check, or compare an object’s surface
temperatures or temperature differences. Most IR imagers sold today are radiometric
instruments. Although the imaging interface of a radiometric thermographic system will
provide quantitative temperatures, it is imperative to recognize that these temperatures
are only accurate when sufficient attention is given to the imaging setup, calibration,
surface emittance, and background radiation (see Scientific Temperature Mapping).
Examples requiring this approach are process temperature monitoring in activities such as
baking, or the evaluation of the heat dissipation behavior of a prototype electronic circuit.
30
Thermal Imaging
Most routine inspections only require simple thermal imaging, without consideration for
the parameters necessary to achieve accurate absolute temperatures. There are many
applications where the temperature difference of the thermal signature is large enough to
be distinct despite less than ideal imaging conditions. Also, given the basic criteria of
high, uniform specimen emittance and a uniform thermal background, the relative
temperatures displayed by the imager will be reasonably accurate. Qualitative visual
inspection is usually sufficient to resolve the thermal signatures in basic thermal imaging
applications, and numerical data collection and post processing is not necessary.
Typically, thermal imaging inspections focus on surface temperature differences;
however, a surface contamination might be revealed by an altered local surface
emittance. Differences in surface emittance of the imaged object can be determined only
if the energy levels of object and background are different and background radiation is
uniform.
Predictive Maintenance
Historically, most IR thermographic systems have been marketed and sold for predictive
maintenance activities using largely qualitative thermal imaging. Commercial training
and certification is available (Snell Infrared and Academy of Infrared Thermography).
The most common application is monitoring the condition of electrical power distribution
systems and infrastructure. Figure 5 shows an IR image of a circuit breaker panel with an
overloaded circuit and the heat generation at the electrical contact resistance where a wire
31

is attached to a circuit breaker. In this electrical example, the heat of electrical I2R losses
generates the observed thermal signature. However, any phenomenon with an impact on
heat flow is likely to be detectable. Bad bearings in a conveyer system will develop heat
from additional mechanical friction. A fluid leak might lead to localized cooling from
evaporation. And, missing or bad thermal insulation will cause an increase in heat flux.
All of these heat flow phenomenon can be imaged with IR thermography.
Figure 5 IR Image of Circuit Breaker Panel, One Circuit is Nearly Overloaded
Non-Destructive Evaluation (NDE)
Fast Transient NDE
Fast transient thermal imaging is based on the time-evolution of surface temperatures on
test specimen during heating or cooling. Variations in temperature depend on the heat
32
flow through the object; heat flow is sensitive to cracks, delaminations, voids, and
changes in material properties. In a typical setup, flash equipment is used to generate a
heat pulse, and the surface temperature of the test specimen is monitored with an IR
imager. The pulse duration and the total energy delivered over the length of the pulse
depend on the material properties and the nature of the defect to be detected. A series of
approximately 10 to 30 frames is recorded with frame rates up to 80 Hz with scanners or
1 kHz with FPA imagers. In the absence of thermal pulse equipment and a high speed
imager, transient NDE can be successfully performed on some specimens, particularly
those with low thermal conductivity. Figure 6 shows several frames taken at 10 second
intervals after a steady IR heat source was applied to the back side of a composite truck
bed panel. The well bonded portions warm faster on the opposite, imaged side. An image
sequence like this can already be very informative when visually inspected by a
technician experienced in interpreting thermograms. However, image post-processing can
greatly enhance images and reveal features that are hidden in the unprocessed image.
Post-processing includes averaging of image sequences, coloration with different
palettes, image subtraction and edge enhancement. Complex processing is possible,
including Fourier transformation of time sequence images and tomography, if sufficient
computer power is available to perform these tasks. Tomography analysis translates the
time image sequence into a three-dimensional object sequence; defects can then be
located in depth as well as in the image plane even though data are collected only at the
surface (2).
33
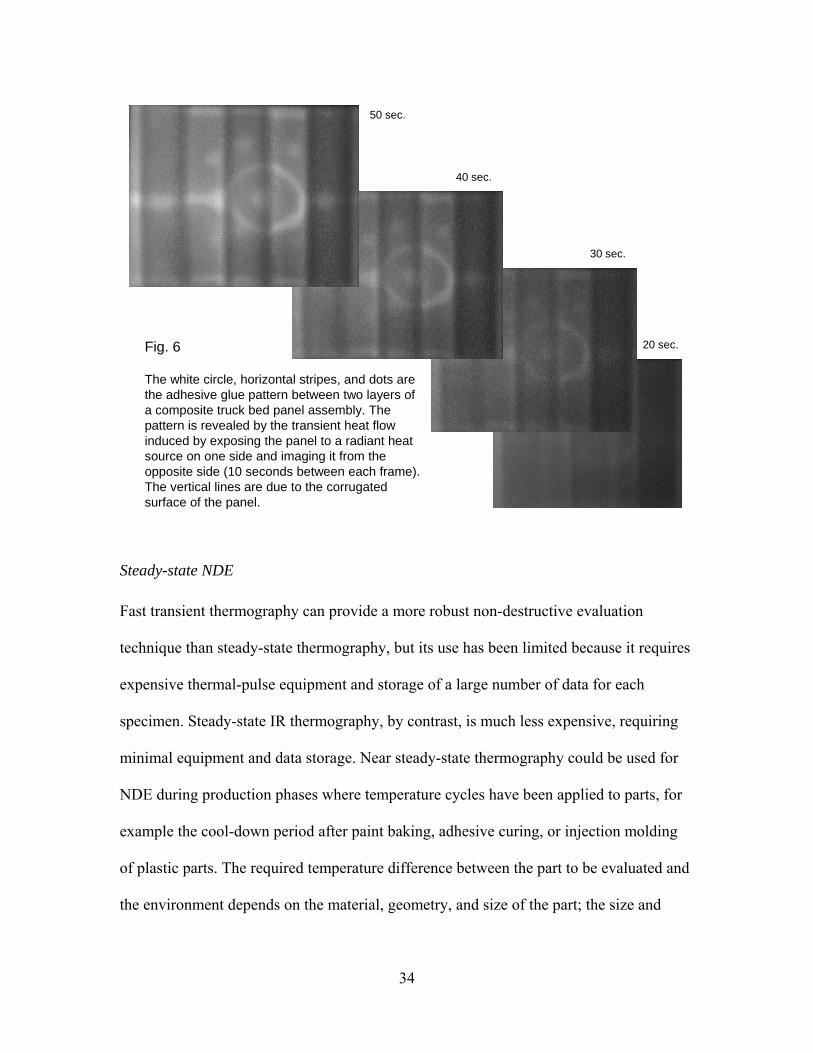
Fig. 6
The white circle, horizontal stripes, and dots are the adhesive glue pattern between two layers of a composite truck bed panel assembly. The pattern is revealed by the transient heat flow induced by exposing the panel to a radiant heat source on one side and imaging it from the opposite side (10 seconds between each frame). The vertical lines are due to the corrugated surface of the panel.
20 sec.
40 sec.
50 sec.
30 sec.
Steady-state NDE
Fast transient thermography can provide a more robust non-destructive evaluation
technique than steady-state thermography, but its use has been limited because it requires
expensive thermal-pulse equipment and storage of a large number of data for each
specimen. Steady-state IR thermography, by contrast, is much less expensive, requiring
minimal equipment and data storage. Near steady-state thermography could be used for
NDE during production phases where temperature cycles have been applied to parts, for
example the cool-down period after paint baking, adhesive curing, or injection molding
of plastic parts. The required temperature difference between the part to be evaluated and
the environment depends on the material, geometry, and size of the part; the size and
34
nature of the defects being sought; and the minimum resolvable temperature difference of
the IR imager being used. This difference can be as small as a few degrees Celsius.
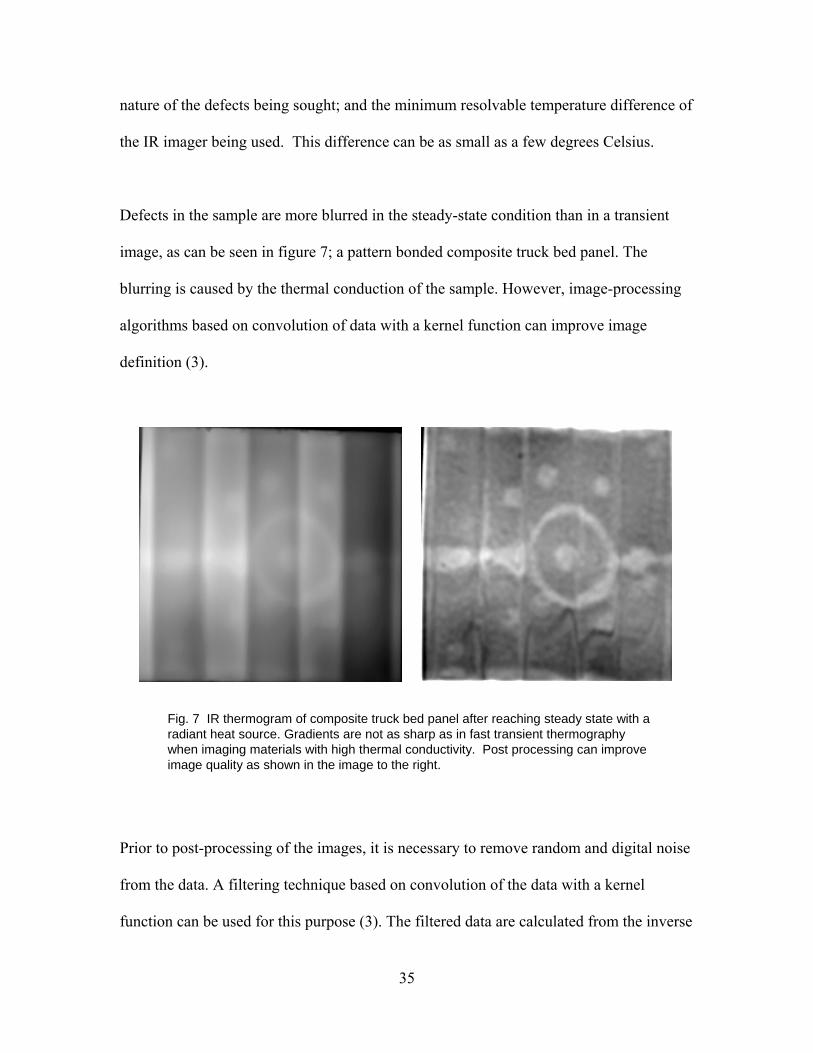
Defects in the sample are more blurred in the steady-state condition than in a transient
image, as can be seen in figure 7; a pattern bonded composite truck bed panel. The
blurring is caused by the thermal conduction of the sample. However, image-processing
algorithms based on convolution of data with a kernel function can improve image
definition (3).
Fig. 7 IR thermogram of composite truck bed panel after reaching steady state with a radiant heat source. Gradients are not as sharp as in fast transient thermography when imaging materials with high thermal conductivity. Post processing can improve image quality as shown in the image to the right.
Prior to post-processing of the images, it is necessary to remove random and digital noise
from the data. A filtering technique based on convolution of the data with a kernel
function can be used for this purpose (3). The filtered data are calculated from the inverse
35
Fourier transformation of the product of the discrete Fourier transforms of the
thermographic data and a kernel function. In the nomenclature of signal processing, the
kernel function is a low-pass or band-pass filter. The kernel function is adjusted to
provide the level of detail necessary for further image analysis, e.g. temperature gradients
or heat flow in a joint of the specimen. The final image may not represent valid
temperatures, but will likely reveal features of interest more prominently.
Medical Imaging: Breast Cancer
IR imaging of the exterior of the human body is straightforward and completely harmless.
Pain management doctors have long made use of thermography to assess inflammation
and other conditions. Breast cancer is a widespread problem that can be mitigated by
successful early detection. IR thermography offers a completely harmless method of
imaging tissue that can resolve subtle changes in blood vessel temperature and
configuration associated with the early stages of cancer development. Evidence suggests
that thermal imaging can detect the beginning stages of cancerous cell growth, up to 2
years earlier than would be detectable by other methods. The detection rate of the IR
method is 87%, while traditional mammography is 67% (4). Because they test for
different indicators, they are actually quite complementary, and used together attain
detection rates of 95% (4). IR imaging is particularly well suited to early detection in
young women whose higher hormone levels support fast cell growth, since the IR method
relies upon indicators that are much more pronounced under these circumstances. It is
also valuable to have reference images starting as early as possible, because an
individual’s thermal signatures are quite consistent over time, and any variations are
likely to be indicators of increased breast cancer risk. First, the thermal image is
36

analyzed for asymmetric temperature signatures between the left and right breast. Warm
spots are usually an indication that the person is at risk. By exposing the patient to a
thermal stress (a cold room) the response of their body’s sympathetic nervous system can
be evaluated. The sympathetic nervous system is responsible for adjusting the blood flow
near the skin surface when stimulated by external environmental conditions. Disfunction
in the sympathetic nervous system is associated with nerve damage in the region of tumor
development. Localized regions of different skin surface temperatures under conditions
of environmental thermal stress thus suggest cancer development. Sophisticated image
processing can be performed to enhance the patient’s blood vessels in the image. Often
tumors cause a change in the blood vessel density and orientation (or vascular pattern).
More vessels become apparent and the vessels are oriented in a circular manner, however
fibro-cystic cell growth can cause similar patterns and does not pose a threat to the
person’s health. Usually the tumor is located in the center of that circular pattern, and is
the cause of the altered blood vessels. Figure 8 shows a raw thermographic image, a
sympathetic disfunction processed image, and a vascular map processed image. IR
thermography as a breast cancer screening is a new and very promising field, as it
provides early detection, and imaging can be performed as often as desired without the
additional health concerns associated with the ionizing radiation of mammography.
37
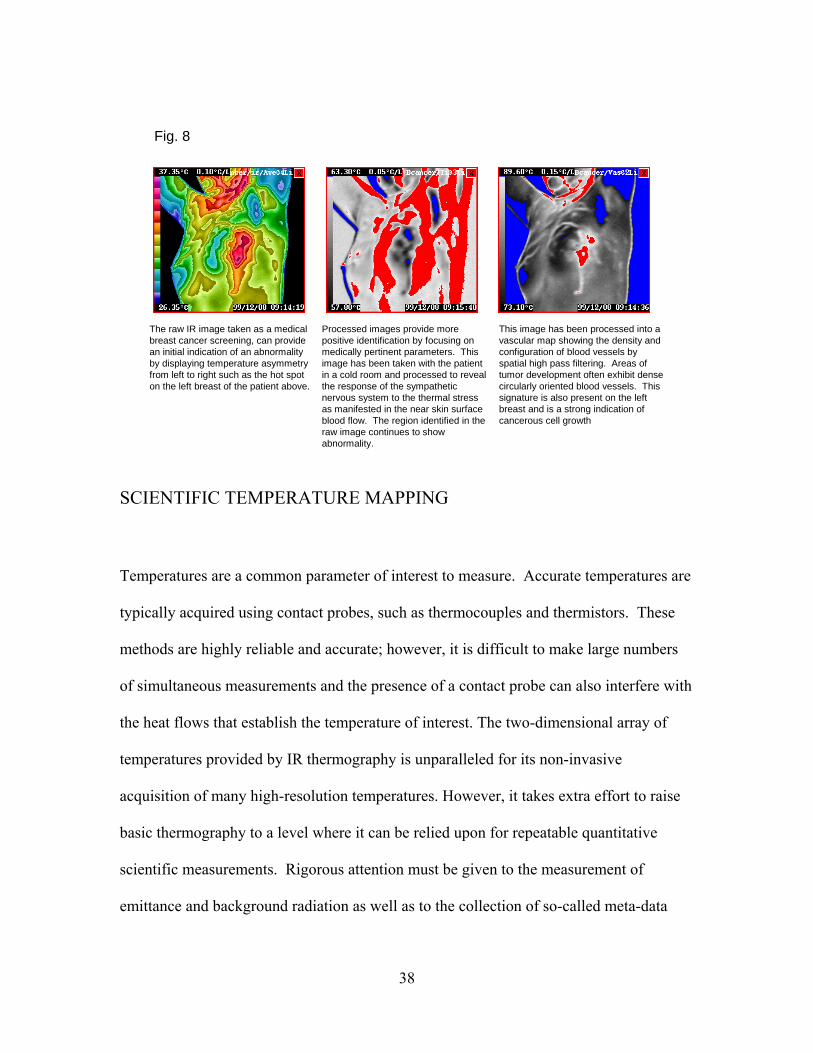
The raw IR image taken as a medical breast cancer screening, can provide an initial indication of an abnormality by displaying temperature asymmetry from left to right such as the hot spot on the left breast of the patient above.
Processed images provide more positive identification by focusing on medically pertinent parameters. This image has been taken with the patient in a cold room and processed to reveal the response of the sympathetic nervous system to the thermal stress as manifested in the near skin surface blood flow. The region identified in the raw image continues to show abnormality.
This image has been processed into a vascular map showing the density and configuration of blood vessels by spatial high pass filtering. Areas of tumor development often exhibit dense circularly oriented blood vessels. This signature is also present on the left breast and is a strong indication of cancerous cell growth
Fig. 8
SCIENTIFIC TEMPERATURE MAPPING
Temperatures are a common parameter of interest to measure. Accurate temperatures are
typically acquired using contact probes, such as thermocouples and thermistors. These
methods are highly reliable and accurate; however, it is difficult to make large numbers
of simultaneous measurements and the presence of a contact probe can also interfere with
the heat flows that establish the temperature of interest. The two-dimensional array of
temperatures provided by IR thermography is unparalleled for its non-invasive
acquisition of many high-resolution temperatures. However, it takes extra effort to raise
basic thermography to a level where it can be relied upon for repeatable quantitative
scientific measurements. Rigorous attention must be given to the measurement of
emittance and background radiation as well as to the collection of so-called meta-data
38
parameters (e.g. the environmental conditions at the time of the test) to ensure accurate
results.
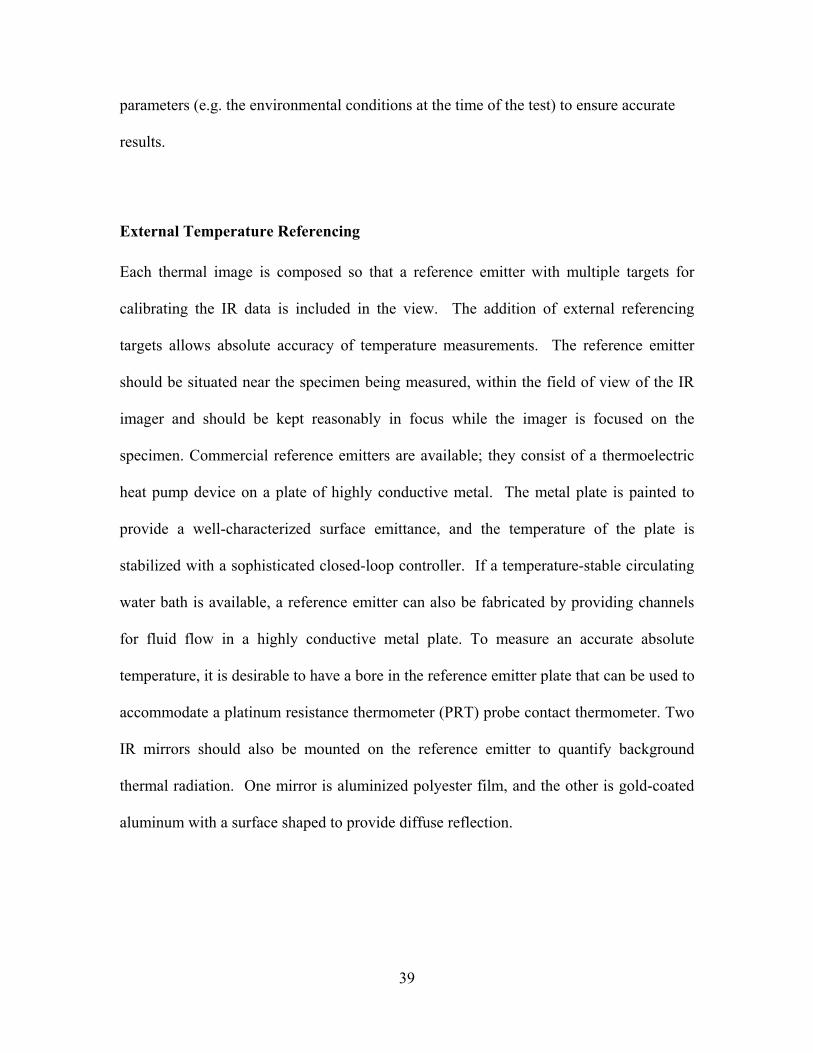
External Temperature Referencing
Each thermal image is composed so that a reference emitter with multiple targets for
calibrating the IR data is included in the view. The addition of external referencing
targets allows absolute accuracy of temperature measurements. The reference emitter
should be situated near the specimen being measured, within the field of view of the IR
imager and should be kept reasonably in focus while the imager is focused on the
specimen. Commercial reference emitters are available; they consist of a thermoelectric
heat pump device on a plate of highly conductive metal. The metal plate is painted to
provide a well-characterized surface emittance, and the temperature of the plate is
stabilized with a sophisticated closed-loop controller. If a temperature-stable circulating
water bath is available, a reference emitter can also be fabricated by providing channels
for fluid flow in a highly conductive metal plate. To measure an accurate absolute
temperature, it is desirable to have a bore in the reference emitter plate that can be used to
accommodate a platinum resistance thermometer (PRT) probe contact thermometer. Two
IR mirrors should also be mounted on the reference emitter to quantify background
thermal radiation. One mirror is aluminized polyester film, and the other is gold-coated
aluminum with a surface shaped to provide diffuse reflection.
39
View Arrangement
In contrast to flat or convex surfaces, concave or self-viewing surfaces are more complex
to image and require additional steps to gather background radiation levels and discern
accurate temperatures. After obtaining a first set of uncorrected IR data for the specimen,
data are gathered for the effective temperature of the reflected background at each
location by temporarily applying background mirrors (aluminized polyester film) to the
specimen in multiple stages. Thus, for the case of an interior corner (e.g. the sill of a
window frame), three sets of images would be collected: the unmodified surface, the
background levels for vertical surfaces, and the background levels for horizontal surfaces.
This technique allows for temperature corrections in only the area where the mirror is
applied, so it is difficult to image an entire object in this way. However, this procedure
can be useful for extracting accurate linear temperature profiles in complex areas of
interest. It is necessary to keep in mind that the addition of the low-e mirror alters the
thermal environment that determines the background, so it is important to keep the
mirrors as small as possible.
Emittance Measurement
Emittance describes the ability of a body to emit radiation. It is necessary to determine
the appropriate emittance value for each surface on a specimen with respect to
wavelength band of the IR imager being used and the temperature range on the object.
Emittance is a basic material property; however, the appropriate emittance value to use
for quantitative IR thermography is scaled by the wavelength-dependant response of the
detector used in the radiometer and the temperature range of the object being imaged.
40
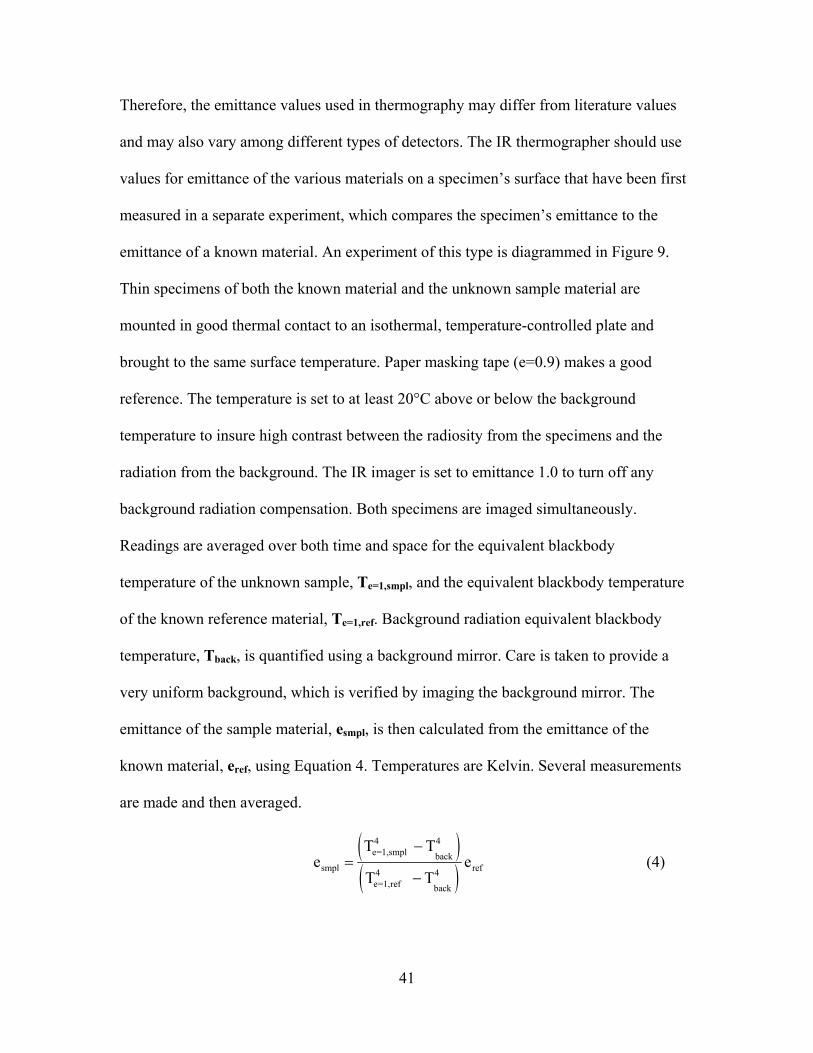
Therefore, the emittance values used in thermography may differ from literature values
and may also vary among different types of detectors. The IR thermographer should use
values for emittance of the various materials on a specimen’s surface that have been first
measured in a separate experiment, which compares the specimen’s emittance to the
emittance of a known material. An experiment of this type is diagrammed in Figure 9.
Thin specimens of both the known material and the unknown sample material are
mounted in good thermal contact to an isothermal, temperature-controlled plate and
brought to the same surface temperature. Paper masking tape (e=0.9) makes a good
reference. The temperature is set to at least 20°C above or below the background
temperature to insure high contrast between the radiosity from the specimens and the
radiation from the background. The IR imager is set to emittance 1.0 to turn off any
background radiation compensation. Both specimens are imaged simultaneously.
Readings are averaged over both time and space for the equivalent blackbody
temperature of the unknown sample, Te=1,smpl, and the equivalent blackbody temperature
of the known reference material, Te=1,ref. Background radiation equivalent blackbody
temperature, Tback, is quantified using a background mirror. Care is taken to provide a
very uniform background, which is verified by imaging the background mirror. The
emittance of the sample material, esmpl, is then calculated from the emittance of the
known material, eref, using Equation 4. Temperatures are Kelvin. Several measurements
are made and then averaged.
( )( )eT T
T Tesmpl
e=1,smpl 4
back
4
e=1,ref 4
back
4 ref=−
− (4)
41
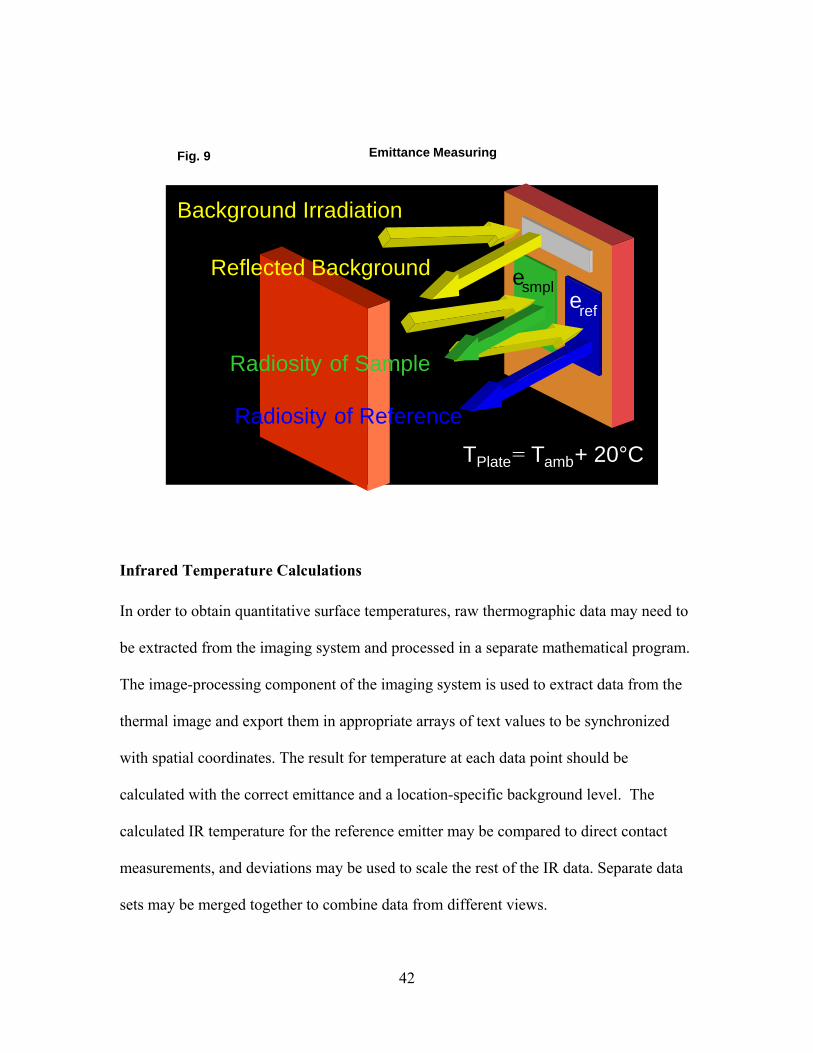
Fig. 9
TPlate= Tamb+ 20°C
Background Irradiation
eref
esmplReflected Background
Radiosity of Sample
Radiosity of Reference
Emittance Measuring
Infrared Temperature Calculations
In order to obtain quantitative surface temperatures, raw thermographic data may need to
be extracted from the imaging system and processed in a separate mathematical program.
The image-processing component of the imaging system is used to extract data from the
thermal image and export them in appropriate arrays of text values to be synchronized
with spatial coordinates. The result for temperature at each data point should be
calculated with the correct emittance and a location-specific background level. The
calculated IR temperature for the reference emitter may be compared to direct contact
measurements, and deviations may be used to scale the rest of the IR data. Separate data
sets may be merged together to combine data from different views.
42
Equation 5 shows an expression for calculating a surface temperature, TIR, from the total
thermal radiation represented by the variable Te=1, the emittance of the surface, esurf, and
the background radiation level represented by the variable Tback. Te=1 is an equivalent
blackbody temperature for the surface being measured. Tback is the equivalent blackbody
temperature for the background thermal radiation level as measured at each location with
the aid of an applied mirror. Values for both Te=1 and Tback are obtained from the
thermographic system by setting emissivity to unity. Conversely, setting emittance to
less than one should cause the IR image-processing component of the imaging system to
process the image data using the calculation in Equation 5. The thermographer should
consider performing this calculation him or herself, using varying values for Tback and
esurf.
T T e )TeIR
e 14
surf back4
surf
=− −⎛
⎝⎜
⎞⎠⎟=( ( )
/1
1 4
(5)
Equation 5 is used to determine both the apparent reference emitter temperature, TIR,Ref,
(as measured by IR imaging) and the apparent sample surface temperature, TIR,smpl. The
difference between TIR,Ref and the direct contact measured value, TDC,Ref, may be applied
to correct TIR,smpl and to arrive at the final IR surface temperature result, T, as shown in
Equation 6. This correction should be made for each temperature datum and for each IR
image, to produce arrays of temperature values.
T T T TIR,smpl IR,Ref DC,Ref= − −( ) (6)
Final data sets merge spatial location coordinates with temperature values. The real
distances between location markers on the specimen are measured, and a coordinate
system is used to create temperature/location data pairs. The temperatures may be
43
distributed linearly. Temperature data are then made a function of spatial coordinates,
mapped to the appropriate coordinate system.
Infrared Temperature Uncertainty
The thermographer will want to estimate the uncertainty in temperature data. A previous
publication by the authors discusses in detail the origin of the following equations used to
propagate uncertainty (5). Errors in esurf should be treated as a source of undefinable
systematic uncertainty, δesurf, and may be analyzed by propagating uncertainty in
Equation 4. Errors in Te=1 and Tback lead to random uncertainties, δTe=1 and δTback. δTe=1
and δTback are usually closely related to equipment specification for Noise Equivalent
Temperature Difference (NETD). To analyze error propagation in Equation 5, the sum of
the squares of partial differentials of Equation 5 are calculated with respect to variables
Te=1, Tback, and esurf, which leads to one possible solution, shown in Equation 7. The
uncertainty in TIR, δTIR, is then calculated using Equation 7.
⎟⎟⎟
⎠
⎞
⎜⎜⎜
⎝
⎛
⎟⎟⎠
⎞⎜⎜⎝
⎛−+⎟⎟
⎠
⎞⎜⎜⎝
⎛−+⎟⎟
⎠
⎞⎜⎜⎝
⎛⎟⎟⎠
⎞⎜⎜⎝
⎛−+= ==
=
−
=
2
41e2
surf
surf4back2
surf
surf2
3back
surf
backback
3back
2
31e
surf
1e
)43
(
surf
4back4
backsurf
41e
IR Tee
Tee
TeT
4T4TTeT
4eT
TeT
41T
δδδδ
δδ (7)
The total uncertainty in the measured surface temperature, δT, is obtained from Equation
8. Values for both δTIR,smpl and δTIR,Ref are obtained using Equation 7. The uncertainty
in the direct contact measurement of the reference emitter surface temperature, δTDC,Ref,
is determined from the overall system accuracy of the direct contact sensor combined
with any errors associated with adjustments that correct for gradients in the surface
material. The uncertainty arising from variations across the field of view, δTFOV, is
44
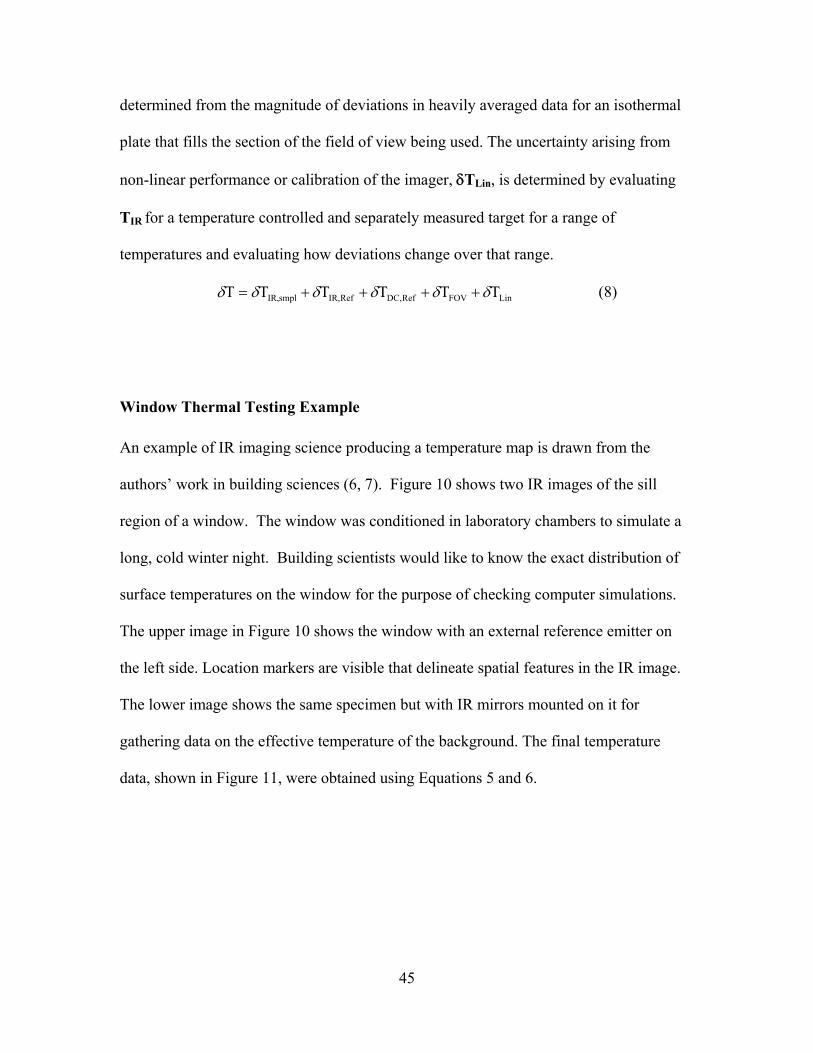
determined from the magnitude of deviations in heavily averaged data for an isothermal
plate that fills the section of the field of view being used. The uncertainty arising from
non-linear performance or calibration of the imager, δTLin, is determined by evaluating
TIR for a temperature controlled and separately measured target for a range of
temperatures and evaluating how deviations change over that range.
LinFOVRefDC,RefIR,smplIR, TTTTTT δδδδδδ ++++= (8)
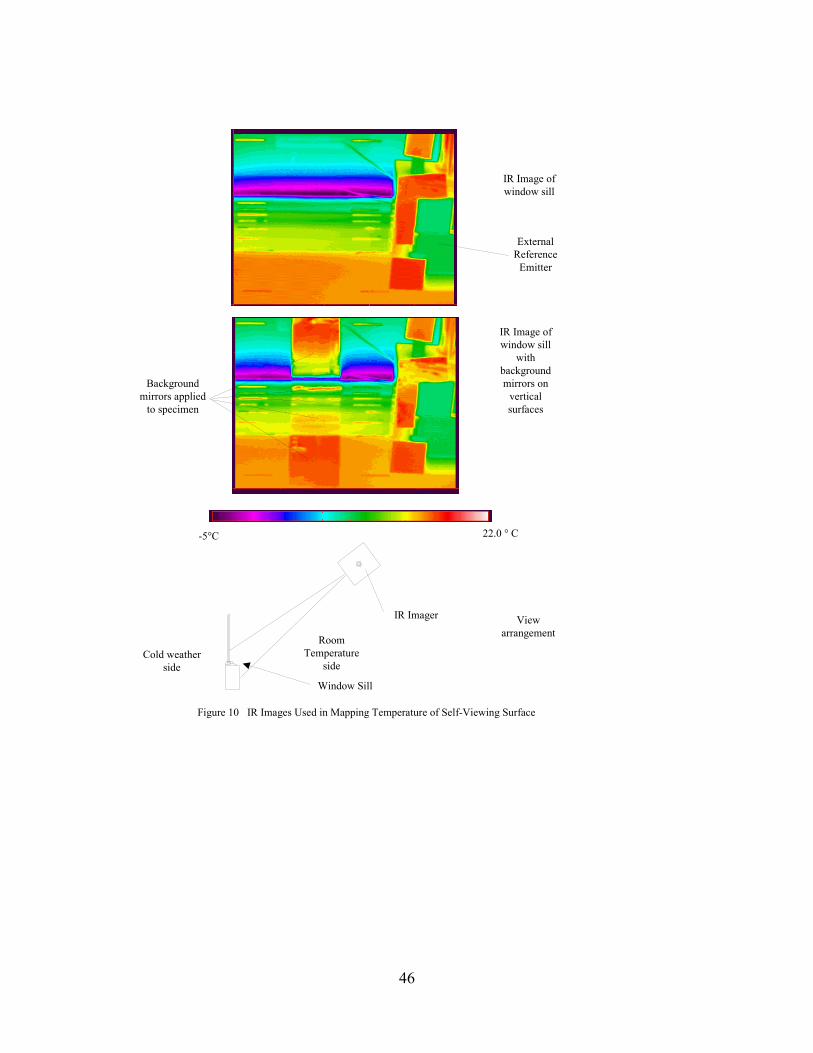
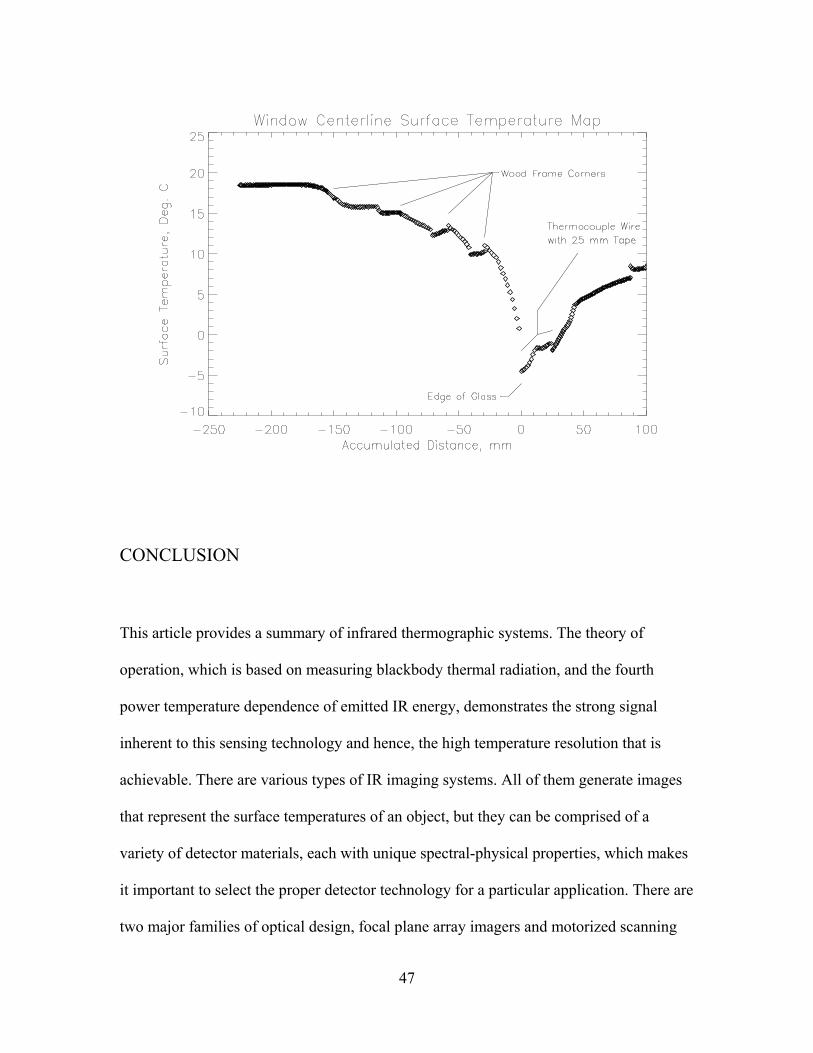
Window Thermal Testing Example
An example of IR imaging science producing a temperature map is drawn from the
authors’ work in building sciences (6, 7). Figure 10 shows two IR images of the sill
region of a window. The window was conditioned in laboratory chambers to simulate a
long, cold winter night. Building scientists would like to know the exact distribution of
surface temperatures on the window for the purpose of checking computer simulations.
The upper image in Figure 10 shows the window with an external reference emitter on
the left side. Location markers are visible that delineate spatial features in the IR image.
The lower image shows the same specimen but with IR mirrors mounted on it for
gathering data on the effective temperature of the background. The final temperature
data, shown in Figure 11, were obtained using Equations 5 and 6.
45
IR Imager
Window Sill
Cold weather side
Room Temperature
side
IR Image of window sill
IR Image of window sill
with background mirrors on
vertical surfaces
-5°C 22.0 ° C
View arrangement
Figure 10 IR Images Used in Mapping Temperature of Self-Viewing Surface
Background mirrors applied
to specimen
External Reference
Emitter
46
CONCLUSION
This article provides a summary of infrared thermographic systems. The theory of
operation, which is based on measuring blackbody thermal radiation, and the fourth
power temperature dependence of emitted IR energy, demonstrates the strong signal
inherent to this sensing technology and hence, the high temperature resolution that is
achievable. There are various types of IR imaging systems. All of them generate images
that represent the surface temperatures of an object, but they can be comprised of a
variety of detector materials, each with unique spectral-physical properties, which makes
it important to select the proper detector technology for a particular application. There are
two major families of optical design, focal plane array imagers and motorized scanning
47
mirror based imagers. For successful IR imaging, it is essential to be aware of the surface
property emittance. Knowledge of surface emittance, in the spectral band of the imager
being used, allows the thermographer to distinguish the emitted portion of the measured
radiation from the reflected portion. The thermal setup and environment also require
special considerations for successful thermography. The thermographer often
manipulates the overall heat transfer situation that leads to the temperature differences
imaged on the specimen of interest in order to produce the most accurate and informative
thermal data. Scientific temperature mapping is a methodology that improves upon the
absolute accuracy of quantitative thermography. The procedures employed include
external referencing targets and background mirrors. Typical applications of IR imaging
include: thermographic inspection for predictive maintenance, medical imaging, non-
destructive materials testing, and building component testing.
The future of IR imaging will likely see many more applications emerge, as this powerful
technology becomes more accessible with less expensive and more compact equipment.
New detector types such as microbolometers, QWIPS or direct sensing optical systems
(change of refraction due to temperature) will become more prominent. IR imagers will
be substantially smaller and more portable with reduced power requirements, as a result
of compact focal plane array optics and not being burdened by providing cryogenic
cooling for sensors. Increasing computing power will make image analysis and
processing possible for online usage. Image resolution of focal plane arrays is expected to
rise. Mega-pixel arrays will likely be available for thermal imaging. Faster image
acquisition speeds will open a new world of diagnostic possibilities for very fast thermal
48
phenomena such as combustion or blasting technology. The various detection
mechanisms may make IR imagers even more specialized for their intended application.
Selecting the appropriate technology for the job will continue to be important. For
instance, an imager with a very high frame rate may lack the ability to make absolute
temperature measurements as accurately as an imager designed for slower phenomenon,
where absolute accuracy is most crucial. Overall, there is much to be learned by “seeing”
temperatures with an IR imager, and this capability is likely to grow more powerful, and
become more accessible, in the future.
Acknowledgements
This work was supported by the Assistant Secretary for Energy Efficiency and
Renewable Energy, Office of Building Technology, State and Community Programs,
Office of Building Research and Standards of the U.S. Department of Energy under
Contract No. DE-AC03-76SF00098.
49
Bibliography
1. G.C. Albright, J.A. Stump, J. D. McDonald, H. Kaplan, “ ‘True’ temperature measurements on microscopic semiconductor targets,” Proceedings of the SPIE, Vol. 3700, Thermosense XXI, April 5-9, 1999
2. V. Vavilov, X. Maldague, J. Picard, R.L. Thomas, L.D. Favro, “Dynamic thermal
tomography: New NDE technique to reconstruct inner solids structure by using multiple IR image processing,” Review of Progress in Quantitative NDE, D.O. Thompson and D.E. Chimenti ed., Brunswick, Maine, 1991, 11A, Plenum Press, 1992, pp. 425-432
3. D. Turler, “Predicting the geometry and location of defects in adhesive and spot-welded lap joints using steady state thermographic techniques,” Proceedings of the SPIE, Vol. 3700, Thermosense XXI, April 5-9, 1999
4. N. Belliveau MD, J. Keyserlingk MD, et al, “Infrared Imaging of the Breast: Initial Reappraisal Using High-Resolution Digital Technology in 100 Successive Cases of Stage I and II Breast Cancer” Breast Journal, Vol. 4, No. 4, 1998
5. D. Turler, B.T. Griffith, D. Arasteh. “Laboratory procedures for using infrared
thermography to validate heat transfer models.” Insulation materials: Testing and Applications: Third Volume ASTM STP 1320. R. S. Graves and R. R. Zarr, ed. Philadephia, PA, American Society for Testing and Materials, 1997
6. B.T. Griffith, D. Arasteh, “Buildings Research Using Infrared Imaging
Radiometers with Laboratory Thermal Chambers,” Proceedings of the SPIE, Vol. 3700, Thermosense XXI, April 5-9, 1999
7. B.T. Griffith, H. Goudey, D. Arasteh, “Infrared Thermography Measurements of
Window Thermal Test Specimen Surface Temperatures” ASHRAE Transactions ?(not yet published) American Society of Heating, Refrigeration and Air-Conditioning Engineers Inc., 2002
50
Further Reading Heat transfer: A.F. Mills, Heat Transfer, Second Edition, Prentice-Hall, 1999. Predictive maintenance: W.L. Chan, A.T.P. So, L.L. Lai, “Three-dimensional thermal imaging for power equipment monitoring,” IEE Proceedings, Generation, Transmission, and Distribution, Vol. 147, Issue 6 November 2000, pp. 355-360. M. Cronholm, “Thermography’s impact on economic performace: Minimizing the cost of downtime and maintenance,” Proceedings of SPIE – The International Society of Optical Engineering, Vol. 4020, Thermosense XXII, April 2000, pp. 99-106 NDE/Tomography: S. Vallerand, X. Maldague, “Defect characterization in pulsed thermography: a statistical method compared with Kohonen and Perceptron neural networks,” NDT & E International, Vol. 33, Issue 5, July 2000 pp. 307-315 T. Inagaki, T. Ishii, T. Iwamoto, “On the NDT and E for the diagnosis of defects using infrared thermography,” NDT & E International, Vol 32, issue 5, July 1999, pp. 247-257. V. Szekely, M. Rencz. “Image processing procedures for the thermal measurements,” IEEE transactions on Components and Packaging Technologies, Vol. 22, Issue 2. 1999. pp. 259-265. V. Vavilov, "Dynamic Thermal Tomography: Perspective Field of Thermal NDT"', Proc. SPIE, 1313 Thermosense-XII, 1990, pp. 307 X. Maldague, P.O. Moore, Infrared and Thermal Testing. American Society for Non-destructive Testing, 3rd Ed. Columbus Ohio, 2001 X. Maldague ed., NDT Handbook on Infrared and Thermal Testing, Third ed., Vol. 3, American Society for Non-Destructive Testing Handbook series, ASNT Press, 2001 X. Maldague, “NDT by Infrared Thermography: Principles with Applications,” invited chapter in Topics on NDE, Vol. 1: Sensing for material Characterization, Processing, and Manufacturing, G. Birnbaum and B. A. Auld ed., American Society for Non-Destructive Testing – ASNT, 1998, pp. 385-398 Gas transmission/absorption applications: A. Tregoures, et. al. “Comparison of seven methods for measuring methane flux at a municipal solid waste landfill site,” Waste Management and Research. Vol. 17, Issue 6, Dec. 1999, pp. 453-458 Medical IR thermography: N. Koyama, K. Hirata, K. Hori, K. Dan, and T. Yokota, “Computer-assisted infrared thermographic study of axon reflex induced by intradermal melittin,” Pain, Vol. 84, issues 2-3, Feb. 2000, pp. 133-139 B.F. Jones, “Reappraisal of the use of infrared thermal image analysis in medicine,” IEEE Transactions on Medical Imaging, Vol 17, Issue 6, Dec. 1998, pp. 1019-1027
51
H.L. Silverman, and L.A. Silverman, Clinical thermographic technique: a primer for physicians and technicians. Rabun Chiropractic Clinic, Clayton, GA. 1987 General IR thermography: A.E. Rozlosnik, “ Bring up to date applications of infrared thermography in surveillance, safety and rescue,” Proceedings of SPIE – The International Society of Optical Engineering, Vol. 4020, Thermosense XXII, April 2000, pp. 387-404 H. Heinrich, “Thermography in Germany: State of the art,” Proceedings of SPIE – The International Society of Optical Engineering, Vol. 4020, Thermosense XXII, April 2000, pp. 310-313 T. Astarita, G. Cardone, G.M. Carlomango, C. Meola, “A survey of infrared thermography for convective heat transfer measurements,” Optics and Laser Technology Vol 32, 2000, pp. 593-610 T. Inagaki, Y. Okamoto, “Measurement of turbulent heat transfer using infrared thermography near ambient conditions and its quantitative error estimation,” Heat Transfer – Asian Research, Vol, 28, Issue 6, 1999, pp. 442-455 R. Mayer, R.A.W.M. Henkes, J.L. VanIngen, “Quantitative infrared-thermography for wall shear stress measurement in laminar flow,” International Journal of Heat and Mass Transfer, Vol. 41, Issue 15, August 1998, pp. 2347-2356 A. Shulz, “Infrared Thermography as applied to film cooling of gas turbine components,” Measurement Science and Technology, Vol. 11, Issue 7, July 2000, pp. 948-956 K. Atkin, C. Heyman, R. Scott. Thermal imaging markets, Coulsdon : Jane’s, 3rd Ed. 2001 P.W. Kruse, Uncooled thermal imaging arrays, systems and application. SPIE Optical Engineering Press, Bellingham, WA. 2001 R.A. Thomas, The thermography monitoring handbook. Coxmoor Publishing, Oxford, UK. 1999. G.C. Holst, Common sense approach to thermal imaging. SPIE Optical Engineering Press, Bellingham, WA, 2000 H. Kaplan, Practical applications of infrared thermal sensing and imaging equipment. SPIE Optical Engineering Press, Bellingham, WA, 1999 G. Gaussorgues, Infrared thermography. Chapman & Hall, London, 1994 Image processing/color data representation: G. Wyszecki, W.S. Stiles, Color Science: Concepts and Methods, Quantitative Data and Formula. John Wiley & Sons, New York, September 1982 R.C. Gonzalez, et. al., Digital Image Processing. Addison-Wesley, April 1992 A.K. Jain, Fundamentals of Digital Image Processing. Prentice-Hall, 1989 B. Fortner and T. E. Meyer, Number By Colors. Springer-Verlag, New York, 1996
52

Certification/Instruction: Snell infrared P.O. Box 6 Montpelier, VT 05601-0006 Phone: (802) 229-9820 or (800) 636-9820 Fax: (802) 223-0460 Academy of Infrared Thermography United States: (360) 676-1915 Canada: (250) 579-7677 Fax: (250) 579-5390
53


![Complex Regional Pain Syndrome (leg) - THOR Laser · interferential current in the therapy of complex regional pain syndrome by infrared thermographic camera]. Vojnosanit Pregl 2010](https://static.fdocuments.net/doc/165x107/5f13902fdafc99707f18bfbb/complex-regional-pain-syndrome-leg-thor-laser-interferential-current-in-the.jpg)