Anton Oilfield Services Group · Anton Oilfield Services Group (“Antonoil” or the “Company”...
169
(Incorporated in the Cayman Islands with limited liability) (Stock Code: 3337) 安東油田服務集團 Anton Oilfield Services Group 2018 Annual Report
Transcript of Anton Oilfield Services Group · Anton Oilfield Services Group (“Antonoil” or the “Company”...
(Incorporated in the Cayman Islands with limited liability)(Stock Code: 3337)
安東油田服務集團Anton Oilfield Services Group
2018Annual Report
About Antonoil 2
Financial Summary 6
Financial Highlight 8
Chairman’s Statement 10
Corporate Information 12
Management Discussions and Analysis 14
Directors’ Report 29
Profiles of Directors and Senior Management 42
Corporate Governance Report 44
Environmental, Social and GovernanceReport
56
Independent Auditor’s Report 72
Consolidated Statement of Financial Position 77
Consolidated Statement of Profit or Loss 79
Consolidated Statement of Profit or Loss and Other Comprehensive Income
80
Consolidated Statement of Changes in Equity
81
Consolidated Statement of Cash Flows 82
Notes to the Consolidated Financial Statements
83
CONTENTS

ABOUT ANTONOIL
2 Anton Oilfield Services Group Annual Report 2018
Anton Oilf ield Services Group (“Antonoil” or the “Company” and, together with its subsidiaries, the “Group”) is a leading independent integrated oilfield services provider. The Group provides products and services for the entire process of oil and gas development and production, including reservoir management, drilling technology, well completion, oil production and services. With its comprehensive product lines and integrated service capacity, the Group is empowered to help oil companies solve the challenges they encounter in oil and gas fields such as increasing production, improving drilling efficiency, lowering costs and optimizing waste management. Its fast growth benefits from the accelerating development of natural gas in China and the Group’s increased presence in the overseas markets. The Group’s strategic objective is to become a world leading integrated oilfield services provider.
The Group is headquartered in Beij ing and has established an international network across the global markets. In China, the markets cover the Tarim area, Erdos area, Southwest area and other areas of China, and the overseas markets include Iraq and other Middle East market, Central Asia and Africa market and the Americas mark etc. Antonoil is the best independent Chinese oilfield services partner, the best Chinese partner worldwide.
BUSINESS
The main business of the Group is oil and gas field development technical services. Oil and gas field development technical services refer to the solutions provided to and implemented for oil companies to help them complete oil and gas field development and enhance production and reduce costs against various technical problems in the wellbore during the drilling, completion and production stages of field development.
The profit centers of the Group are based on the business clusters and the Group reports its results based on three clusters including drilling technology cluster, well completion cluster, and oil production cluster. Each business cluster is detailed as follows:
DRILLING TECHNOLOGY CLUSTER
Dril l ing technology cluster provides engineering technical services and products during the drilling stage to solve problems encountered in directional drilling, drilling assessment, drilling acceleration, enhanced reservoir contact and integrated drilling, the Group is a leading drilling technical service provider in China.
About Antonoil
3Anton Oilfield Services Group Annual Report 2018
Integrated Services Management
It implements project organization and economic assessment through reservoir geological assessment and integrated geological and engineering design. Provides integrated oil and gas field development engineering and technical management services, f rom design, organize resources to the project implementat ion, provide geological , reservoir , engineering, and integration of one-stop turnkey service.
Integrated Drilling Services
I t integrates new technologies for dr i l l ing, wel l completion and special tools; provides comprehensive technical services from design to matching tools, product ion technique and related equipment; integrates individual competitive drilling technologies and provides integrated drilling and well completion technical solutions.
Directional Drilling
It engineers operate the drilling tool set to drill wellbores along the pre-set path to enhance the oil and gas recovery rate by reaching the best position in the reserves, the Group is a leading directional drilling service provider in China and its services include directional drilling technology, sidetracking drilling technology and steerable drilling technology.
Drilling and Completion Fluid Service
It provides drilling fluid system comprising oil-based muds and high-performance water-based muds, intended to address down-hole complications, shorten the drilling cycle and increase drilling speed. The Group has a team of senior drilling fluid technical experts, oil-based mud station, R&D center and the mud materials plant with first class equipment, providing customers with integrated services including drilling fluid on-site services, drilling fluid technology R&D, technical research and design, and sales services.
Drilling Tool Rental and Technical Services
It provides dril l ing tool rental, rehabilitation and anti -abrasion services, tubular processing and manufacturing and storage solutions.
Land Drilling Services
It operates rigs to complete drilling jobs, including the delivery of service with self-owned rigs and third party owned rigs under management.
Oilfield Waste Management
I t applies advanced technology and combines domestic and international resources to offer waste and pollutants management service throughout oil and gas exploration and development such as oil-based drilling fluid and drill cutting treatment and fracture fluid treatment.
Oil and Gas Production Facilities Inspection and Assessment Technology
It enjoys China National Accreditation Service (CNAS) lab status for instruments and Chinese and US Non-destructive Testing (NDT) qualif ications; adopts international standards to conduct site testing services for oil production equipment, devices and instruments for customers across petrochemical, pharmaceutical, machinery manufacturing and electronics. It also concludes tubular helium testing services which use the mixed gas of helium and nitrogen to test tubing threaded connector against helium leak in the natural gas wells, thus solving the problem of helium connector leak. It is important to guarantee production safety of high pressure wells, sulfur-rich wells and key natural gas wells.

About Antonoil
4 Anton Oilfield Services Group Annual Report 2018
WELL COMPLETION CLUSTER
It provides integrated well completion and stimulation services from integrated solutions for well cementing and complet ion, product ion wel l complet ion, equipment, tools and materials. The Group is a leading well completion technical service and tool provider in China, which provides technical services and products to solve various technical problems experienced by oil companies during well completion stage. It designs well completion solutions and techniques comprised of various well completion tools for different formations and reservoirs, thus completing the preparation works as necessary for wellbore completion and oil production. Its services include well completion integration, screen well completion, gravel packing completion and oil production tools.
Integrated Completion Services
It provides well completion engineering design and implementation service for low-permeability naturally fractured reservoirs and shale gas reservoirs; provides integrated services ranging from reservoir geological analysis consulting to well completion engineering design, well completion tools and liquid material; provides monitoring service for stimulation measures.
Completion Tools
It provides a host of well cementing and completion tools and production well completion tool services; addresses various kinds of technical complications in open-hole well completion and casing well completion. It also has capacity of production proprietary tools.
Sand Screen and Water Control services
It provides the most diverse range of sand control completion tools and integrated design for sand control well completion, sandscreen and water control; provides sand control well completion stimulation service with high-pressure gravel packing as the core offering; provides supporting services for AICD water control. The screen well completion tools of the Group include composite screens, punched slotted screens, sand screens, pack screens, wire wrapped screens, slotted screens and innovative water control screens.

About Antonoil
5Anton Oilfield Services Group Annual Report 2018
Fracturing/Acidizing Technique and Chemical materials
I t focus on acidizing and fracturing st imulation technologies development, provides integrated solutions from stimulation technology evaluation, des ign, down-hole chemicals and equipment engineering to enable integrated stimulation; provides R&D, manufacturing, marketing and technical services for down-hole chemicals for acidizing, fracturing, killing, and oil production (inflow and profile control) operations.
Fracturing and Pumping
It harnesses the hydraulic horsepower (HHP) of the pressure pumping equipment and other related operational capabilities to help clients implement pressure pumping design and solutions of varying scales, with the benefit of expanding the permeability of oil and gas reservoirs and improving production capacity. Pressure pumping has become the necessary measure to developing unconventional oil and gas reservoirs.
Coiled Tubing Services
It combines equipment and tools to form different processes and technologies with broad applications, including stimulation in low-permeability wells, special operations in ultra-complicated wells and regular operations in conventional wells including horizontal well cable testing and workover services such as sidetrack drilling, milling and fishing services.
Proppant
It is an important material in oil development process when applying fracturing to stimulate oil and gas production. Its role is to support the fractures and keep oil and gas passage in order to increase production
OIL PRODUCTION CLUSTER
It provides engineering services and products for oil companies during well completion and production; enables economic recovery based on reservoir geological conditions through production operation management and ground process services.
Production Operation Management
It provides production operation management services for oilfield ground stations, including power engineering construction, operation, inspection and maintenance, art i f ic ia l l i f t technology design, management, optimization operation support, water injection, profile control, ground equipment maintenance and rehabilitation, re-engineering, installation overhaul and oil and gas field ground construction projects.
Workover Services
It provides conventional and major workover for oil and gas wells, sidetrack, fishing, oil testing and well completion integrated operation and routine maintenance operation services.
Tubing/Casing Repair and Anti-corrosion Service
It provides featured tubing and casing technical services with Premium Thread Design as the core offering; a reputable supplier of specialized tubes and casings for Chinese and overseas customers.

FINANCIAL SUMMARY
6 Anton Oilfield Services Group Annual Report 2018
CONDENSED CONSOLIDATED INCOME STATEMENTSFor the year ended 31 December
2014 2015 2016 2017 2018RMB (’000)
Revenue 2,071,205 1,833,006 1,617,675 2,202,702 2,935,888
Other gains/(losses), net (1,839) 20,689 68,967 9,674 11,932
Operating costs (2,031,392) (1,761,221) (1,543,446) (1,738,682) (2,303,557)
Operating profit 37,974 92,474 143,196 473,694 644,263
Finance costs, net (178,464) (254,770) (173,379) (267,872) (297,454)
Profit/(loss) before income tax (159,550) (163,338) (30,591) 204,921 347,164
Profit/(loss) for the year (190,805) (195,248) (97,672) 171,274 250,721
Attributable to:Owners of the Company (198,213) (194,731) (160,450) 54,495 222,423
Non-controlling interests 7,408 (517) 62,778 116,779 28,298
Dividends — — — — 30,000
Earnings/(loss) per share for
profit/(loss) attributable to the ownersof the Company for the
year (expressed in RMB per share)
Basic (0.0902) (0.0878) (0.0720) 0.0206 0.0792Diluted (0.0902) (0.0878) (0.0720) 0.0205 0.0783
2018
2017
2016
2015
2014
2013
2012
2011
2010
2009
2008
2,935.9
2,202.7
1,617.7
1,833.0
2,071.2
2,533.5
2,004.6
1,258.9
950.7
690.0
763.3
REVENUE (RMB million)
2018
2017
2016
2015
2014
2013
2012
2011
2010
2009
2008
250.7
171.3
(97.7)
(195.2)
(190.8)
403.1
317.7
91.7
125.9
37.6
72.1
PROFIT/(LOSS) FOR THE YEAR (RMB million)

7Anton Oilfield Services Group Annual Report 2018
Financial Summary
CONDENSED CONSOLIDATED FINANCIAL POSITION
As at 31 December
2014 2015 2016 2017 2018RMB (’000)
Assets
Non-current assets 2,934,952 3,063,576 3,004,012 3,367,768 3,002,465
Current assets 3,556,215 3,119,584 3,657,269 4,379,707 4,244,136
Total Assets 6,491,167 6,183,160 6,661,281 7,747,475 7,246,601
Total Equity 2,148,756 1,959,612 1,976,897 2,946,992 2,694,562
Liabilities
Non-current liabilities 1,700,487 1,589,010 2,504,217 1,932,702 2,305,184
Current liabilities 2,641,924 2,634,538 2,180,167 2,867,781 2,246,855
Total liabilities 4,342,411 4,223,548 4,684,384 4,800,483 4,552,039
Total equity and liabilities 6,491,167 6,183,160 6,661,281 7,747,475 7,246,601
Net current assets 914,291 485,046 1,477,102 1,511,926 1,997,281
Total assets less current liabilities 3,849,243 3,548,622 4,481,114 4,879,694 4,999,746
FINANCIAL HIGHLIGHT
8 Anton Oilfield Services Group Annual Report 2018
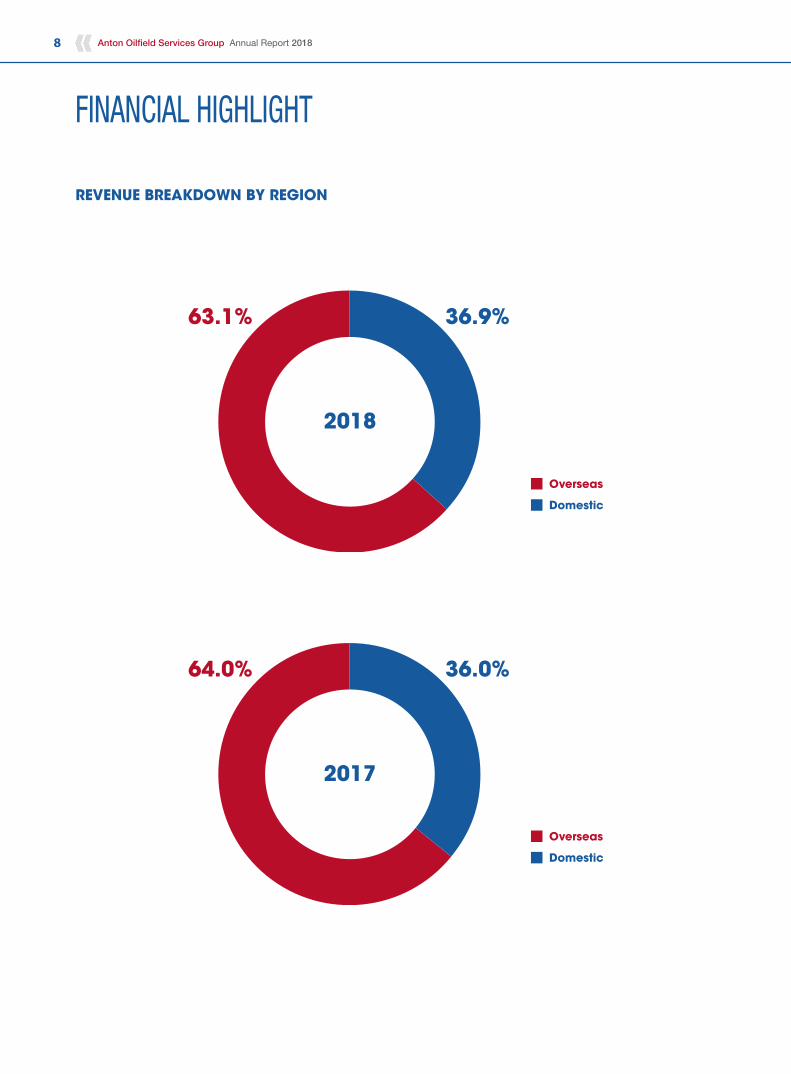
REVENUE BREAKDOWN BY REGION
2018
36.9%63.1%
Overseas
Domestic
2017
36.0%64.0%
Overseas
Domestic

Financial Highlight
9Anton Oilfield Services Group Annual Report 2018
REVENUE BREAKDOWN BY BUSINESS CLUSTERS
2018
25.3%45.6%
29.1%
Oil Production
Well Completion Technology
Drilling Technology
2017
25.6%43.6%
30.8%
Oil Production
Well Completion Technology
Drilling Technology

CHAIRMAN’S STATEMENT
10 Anton Oilfield Services Group Annual Report 2018
Dear Shareholders,
In 2018, the Group adjusted and optimized the operating concepts, the entire Group transferred from seeking raging growth in scale to pursuing more qualitative growth in cash flows and return on assets. Throughout the year, the operating concepts of the Group were implemented with good quality. Apart from achieving a historical new high level of sales orders and revenue, and a 300% growth in net profit attributable to shareholders, cash inflows from operations increased significantly through enhancing management and control of the entire operating process, the “light-asset” strategy was persistently implemented while the market business volume recorded significant growth. Utilization of drilling and workover rigs increased by 11 sets due to business needs throughout the year, but capital expenditure was strictly controlled and was reduced by approximately RMB318.7 million as compared to the same period of last year, positive free cash flows were achieved throughout the year. Moreover, the Group realized the strategic objective of “upgrading the business model”, being a turnkey management service provider, we successfully undertake the management of Majnoon oilfield, the third largest oilfield in Iraq. Under the management of the Group, the oilfield has been operating smoothly and efficiently for half a year, and has been highly commended by the owner. Thus, our integrated business model for oilfield management achieved an initial success. The Group also added a full range of ancillary services to the original system of full-cycle products and services, including standalone personnel service, procurement service for raw materials, and single equipment service to satisfy more refined demand from customers.
REVIEW
On review of 2018, in terms of market, the Group achieved an overall breakthrough, new orders increased by approximately RMB4,055.2 million during the year, and orders on hand as at the end of the year amounted to RMB4,350.3 million, both attained historical new high levels. In the domestic market, the Group captured the opportunities arising from the active response of customers in the China market to support the national policy of energy safety to push forward the development of oil and gas resources. By leveraging on the advantages of
LUO LinChairman

Chairman’s Statement
11Anton Oilfield Services Group Annual Report 2018
our presence in projects of natural gas and unconventional resources, we obtained the turnkey service provider qualification in the southwestern shale gas project and received works on a number of platforms. We also expanded successfully into the Mahu rim market in Xinjiang by leveraging on our technological advantages. In the Iraqi market, the Group made a significant breakthrough in winning a project on integrated management of oilfields, being the first Iraqi project awarded to a service company, and took over the management of the third largest oilfield in Iraq from an international oil company, thus realizing the upgrade of our business model in “light-asset” and “integrated” oilfield management. In the “Belt and Road” market, we successfully expanded into the new market of Chad in Africa to provide several technical service and light-asset management projects to customers. In our operations, with demand for services for highly complicated projects in domestic oilfields, our technical capabilities were further highlighted. In the shale gas market, we made a record for shortest single well drilling cycle in a Changning shale gas drilling block, which was 31.7% shorter than the average well drilling cycle of the drilling block, enabling customer to achieve improvement of development efficiency. In the deep well natural gas and tight gas market of Xinjiang, we provided high-end products and technologies to customers, such as the Zhongqiu #1 Well project, representing a significant discovery of a 100 billion m3 condensate gas reservoir in the Tarim region, we provided two important technologies, being oil-based drilling fluid and performance drilling, for the customer, helping the customer to develop resources efficiently. In the Mahu rim region of Xinjiang, our fracturing technique by dragging coiled tubing of above 30 sections also had a leading position in the industry. In terms of capital, the Group actively promoted deeper cooperation between industry and finance, and received more supporting credit facilities from commercial banks and developed cooperation with “Belt and Road” policy financial institutions to further broaden the capital channels to assist the Group’s business development.
OUTLOOK
Look ahead in 2019, we will continue to position at emerging markets for global oil and gas development, focus on enhancing cashflows and return on assets as our core objectives and pursue high quality development. We will seize the great opportunities in the development of key markets, such as China and Iraq, to further establish a comprehensive system of products and services to target at different needs of customers for the provision of a complete range of products and services. We will continue to develop sovereign oil company clients and international petroleum company clients by successfully replicating the Iraqi development model. Moreover, the Group will strengthen the efforts for collaboration between industry and finance, deepen cooperation with policy financial institutions in China, strengthen cooperation with “Belt and Road” financial institutions and overseas financial institutions, to ensure sufficient liquid capital support will be available for future development. Meanwhile, we will continue to optimize our operating concepts, to realize free cashflows with high quality profits, lower the gearing ratio and enhance our debt rating. In respect of personnel, the Group will focus on recruiting outstanding talents in the industry with oilfield management leadership and top-notch technical service talents to establish a global talent pool to optimize management, maximize the efficiency of existing talents, increase the variable portion of remuneration for staff, establish the Amoeba operation appraisal unit, as well as actively promote the Group’s working spirit of “hard-working and perseverance” as a Chinese company to enhance the management efficiency, safety and quality management level in our operations and improve our staff incentive mechanism continuously. With persistent development in the global business of the Group, we will actively pay attention to the development of resources in the place where the operations of our Group are located and our positive contribution to the community as a whole, and strive to be a role model for harmony between people and environment and efficient development.
ACKNOWLEDGEMENT
On behalf of the Board of Directors, I would like to express my heartfelt thanks to all our customers, employees, partners and shareholders. It is with your long-term trust and support that we are able to overcome difficulties and achieve higher results. As a leading technological service company in global oil and gas emerging markets, the Group will continue to uphold our mission of “help others succeed and make oil production easier”, stay true to our soul and temper forward despite difficulties, in order to advance forward to achieve its long-term strategic goal of becoming a leading oilfield technological service company in the world.
LUO LinChairman
22 March 2019
CORPORATE INFORMATION
12 Anton Oilfield Services Group Annual Report 2018
BOARD OF DIRECTORS
Executive Directors
Mr. LUO LinMr. PI ZhifengMr. FAN Yonghong (Appointed on 16 April, 2019)
Non-executive Director
Mr. John William CHISHOLM
Independent Non-executive Directors
Mr. ZHANG YongyiMr. ZHU XiaopingDato Wee Yiaw Hin
AUDIT COMMITTEE
Mr. ZHU Xiaoping (Chairman)Mr. ZHANG YongyiDato Wee Yiaw Hin
REMUNERATION COMMITTEE
Dato Wee Yiaw Hin (Chairman)Mr. ZHU XiaopingMr. LUO Lin
NOMINATION COMMITTEE
Mr. ZHANG Yongyi (Chairman)Dato Wee Yiaw HinMr. LUO Lin
QHSE (“QUALITY, HEALTH, SAFETY AND ENVIRONMENT”) COMMITTEE
Mr. PI Zhifeng (Chairman)Mr. LUO Lin
AUTHORIZED REPRESENTATIVES
Mr. LUO LinDr. NGAI Wai Fung
COMPANY SECRETARYDr. NGAI Wai Fung (FCIS, FCS (PE), CPA, FCCA)
COMPANY’S WEBSITE
www.antonoil.com
INVESTOR RELATIONS HOTLINE
+86 10 57397584Email: [email protected]
PRINCIPAL PLACE OF BUSINESS IN HONG KONG
40th FloorSunlight TowerNo. 248 Queen’s Road EastWanchaiHong Kong
PRINCIPAL PLACE OF BUSINESS IN PRC
No. 8, Pingcui West Road, DonghuquChaoyang DistrictBeijing, China 100102
REGISTERED OFFICE
PO Box 309, Ugland HouseGrand Cayman KY1-1104Cayman Islands

Corporate Information
13Anton Oilfield Services Group Annual Report 2018
PRINCIPAL SHARE REGISTRAR AND TRANSFER OFFICE
SMP Partners (Cayman) LimitedRoyal Bank House3rd Floor, 24 Shedden RoadP.O. Box 1586Grand Cayman KY1-1110Cayman Islands
HONG KONG BRANCH SHARE REGISTRAR AND TRANSFER OFFICE
Computershare Hong Kong Investor Services Limited Shops 1712-1716, 17th FloorHopewell Centre183 Queen’s Road East WanchaiHong Kong
AUDITORS
Deloitte Touche Tohmatsu
LEGAL ADVISERS
as to Hong Kong and U.S. law:
Sidley Austin LLP
as to PRC law:
BEIJING TIAN TAI LAW FIRM
as to Cayman Islands law:
Maples and Calder
PRINCIPAL BANKS
Shanghai Pudong Development BankChina Merchants BankBank of Beijing
STOCK CODE ON MAIN BOARD OF THE STOCK EXCHANGE OF HONG KONG LIMITED
3337
DATE OF LISTING
14 December 2007
MANAGEMENT DISCUSSIONS AND ANALYSIS
14 Anton Oilfield Services Group Annual Report 2018
BUSINESS REVIEW
In 2018, the in ternat ional o i l and gas market demonstrated a strong recovery momentum. Due to the widening gap between global production capacity and demand, both national and international oil companies had increased their investment in new capacity, and the demand for oil and gas development services was strong. In the fourth quarter, despite a temporary decline in international crude oil prices, the determination of long-term capacity building and project progress of major oil companies were not affected. During the reporting period, the Group recorded a significant increase in its new orders and accelerate its project execution pace. During the year, the Group recorded a significant overall increase in its orders, revenue as well as profit. More importantly, the Group recorded positive free cash flow, which was the fruit of the Group’s business strategy adjustment, operational efficiency improvement as well as cost control over the past few years.
In 2018, new orders of the Group amounted to RMB4,055.2 million, an increase of 53.1% as compared to that in 2017. As at the end of 2018, order backlog of the Group amounted to RMB4,350.3 million, an increase of 24.0% as compared to that at the end of 2017. In 2018, the Group recorded a revenue of RMB2,935.9 million, an increase of 33.3% as compared to that in 2017. The number of full-year new orders, year-end order backlog and full-year revenue of the Group all recorded a new high. In respect of order backlog as of 31 December 2018, orders from the Iraqi market amounted to RMB3,109.8 million, representing 71.5% of the total amount of order backlog, orders from PRC market amounted to RMB1,013.4 million, representing 23.3% of the total amount of order backlog, and orders from other overseas markets amounted to RMB227.1 million, representing 5.2% of the total amount of order backlog. Orders from the Iraqi market were mainly orders for oil well development projects and oilfield management. Among orders from the PRC market, the majority of them were orders for natural gas development projects, including deep well natural gas, shale gas and tight

Management Discussions and Analysis
15Anton Oilfield Services Group Annual Report 2018
gas. Orders from the other overseas markets were mainly orders for natural gas development projects. As the Iraqi market was aimed to rebuild the country and the PRC market to ensure energy security, both requiring national oil companies to fully promote oil and gas development. The sensitivity of the Group’s business to oil price fluctuations was relatively low, thus reducing the risk of business being affected by short-term fluctuations in oil prices and ensuring the continued steady growth of the Group’s business.
Along with the significant increase in business volume of the Group in 2018, the Group continued to exercise strict control over costs and expenses to maintain a continuous increase in its profitability. In 2018, the selling expenses and administrative expenses of the Group as a percentage of revenue continued to decline on the basis of 2017, and the net profit margin increased by 0.7 percentage points as compared to that in 2017. In addition, the Group recorded a three-time increase in profit attributable to the owners of the Company. Pursuant to the Anton Oilfield Services DMCC Share Repurchase Agreement entered into between the Group and China Oil HBP Science & Technology Co., Ltd. (華油惠博普科技股份有限公司) (“HBP”) on 22 December 2017, the profit attributable to the minority shareholders of RMB29.1 million was recorded as part of the reserves attributable to the owners of the Company upon the completion of the acquisition of the 40% equity interest in DMCC. Therefore, the total amount of RMB251.5 million, including the aforesaid amount of RMB29.1 million and RMB222.4 million of the profit attributable to the owners of the Company, had been included into the reserves attributable to the owners of the Company as at 31 December 2018.
Since 2018, the Group has fully adjusted its philosophy of operation and management from primary focus on business scale increase to comprehensive operation taking business quality improvement as the core. The Group made adjustment from the source of the business, the acquisition of orders, from the previous pursue for comprehensive bid to strive for quality orders. After winning the bid, the Group would negotiate with the customer in respect of the terms of the contract based on the principle of cash flow priority. If the terms of the contract do not meet the Group’s cash return and risk management and control requirements, even if it could bring in the scaled income and profits, the Group would choose to give up such contract, thus ensuring the Group’s capital will be invested in quality growth opportunities. In the fourth quarter of 2018, the Group won various kinds of domestic and overseas projects. Basing on the principle of “prioritize on cash return”, the Group only chose to accept part of those orders and recorded in its order book, for other orders, the Group
returned to customers through friendly negotiation. In addition to the source control, the Group also strengthened the management of project operations, and strictly monitored and assessed payment, inventory and collection of accounts receivable to promote efficiency improvement. Moreover, the Group actively sought the release of the performance bond of overseas customers to reduce the utilization of the Group’s own funds by overseas project operations, and during the year, the amount of release of the performance bond was approximately RMB52.7 million. In terms of the results of the management, the Group achieved significant results in its management and control during the year. The net inflow of operating cash flow in 2018 significantly increased by 100.3% to RMB481.1 million as compared to RMB240.2 million in 2017. Meanwhile, the Group continued to strictly implement the “light-asset” business strategy and strictly control capital expenditures. For the needs of conventional heavy equipment, the Group fully allocate industry resources through leasing or cooperation with industry partners. In 2018, the Group’s own main equipment — drilling rigs, workover rigs and fracturing equipment are under full operation. In order to meet the needs of new projects, the Group allocated another 11 drilling and workover rigs from the third parties to serve our customers in the Iraqi market, the Pakistani market and the Tarim market in the northwest of China and shale gas market in the southwest region of China. Although the demand for equipment resource increase, capital expenditures have decreased by RMB318.7 million compared to 2017, resulting in positive free cash flow throughout the year. Taking into account the demand for capital expenditure in the medium and long term, the Group adopts a strategy of integration of industry and finance and actively cooperates with financial institutions with “Belt and Road” resources. On 24 August 2018, the Group entered into a strategic cooperation agreement with CRCC Financial Leasing Co., Ltd., pursuant to which the parties were committed to jointly integrating the advantages of the industry, actively implementing the national “Belt and Road” strategy and cooperating in various fields. In addition, the Group actively promoted cooperation with financial institutions in respect of the performance bond of the Group’s overseas business. During the year, under the support of guarantee credit facilities of US$50.0 million from the China Export & Credit Insurance Corporation (Sinosure), the Group entered into an agreement with the Bank of Beijing in respect of the overseas performance bond to obtain a special credit facilities of RMB350.0 million. In addition to lower security deposit, the overseas business of the Group can use this special credit facilities and Sinosure will issue the performance bond to the Group’s customers. The cooperation would further provide strong support for the overseas business expansion of the Group.

Management Discussions and Analysis
16 Anton Oilfield Services Group Annual Report 2018
Results and Performance
In 2018, total revenue of the Group was approximately RMB2,935.9 million, an increase of approximately RMB733.2 million, or 33.3%, as compared to 2017. The Group’s operating profit was approximately RMB644.3 million, an increase of approximately RMB170.6 million, or 36.0% from approximately RMB473.7 million in the same period of 2017. Net profit was approximately RMB250.7 million, an increase of approximately RMB79.4 million or 46.4% from approximately RMB171.3 million in the same period of 2017. Profit attributable to the owners of the Company was approximately RMB222.4 million, an increase of approximately RMB167.9 million or 308.1% from approximately RMB54.5 million in the same period of 2017. Net margin attributable to the owners of the Company was 7.6%, an increase of 5.1 percentage points from 2.5% in the same period of 2017.
As at 31 December 2018, the Group’s average accounts receivable turnover days were 220 days, a decrease of 7 days as compared with the same period last year. The average inventory turnover days were 136 days, a decrease of 45 days as compared with the same period last year. Average accounts payable turnover days was 101 days, a decrease of 35 days as compared with the same period last year. Cash flow from operating activities was approximately RMB420.0 mill ion, a significant increase of approximately RMB224.4 million from approximately RMB195.6 million in the same period last year.
Geographical Market Analysis
In 2018, revenue from the overseas market was approximately RMB1,852.2 mi l l ion, an increase of approximately RMB443.4 mill ion or 31.5% from approximately RMB1,408.8 million in 2017, accounted for 63.1% of the total revenue of the Group. In the overseas markets, revenue from the Iraqi market was approximately RMB1,170.6 million, an increase of approximately RMB315.3 mill ion or 36.9% from approximately RMB855.3 million in 2017, accounted for 39.9% of the total revenue of the Group. Revenue from other overseas markets was approximately RMB681.6 million, an increase of approximately RMB128.1 million or 23.1% from approximately RMB553.5 million in 2017, accounted for 23.2% of the total revenue of the Group. Revenue from the domestic market was approximately RMB1,083.7 million, an increase of approximately RMB289.8 million or 36.5% from approximately RMB793.9 million in 2017, accounted for 36.9% of the total revenue of the Group.

Management Discussions and Analysis
17Anton Oilfield Services Group Annual Report 2018
Breakdown of Revenue by Market
Twelve months ended 31 December Share of total revenue of the Group2018 2017 Change Twelve months ended 31 December
(RMB’mn) (%) 2018 2017
Overseas 1,852.2 1,408.8 31.5% 63.1% 64.0%Domestic 1,083.7 793.9 36.5% 36.9% 36.0% Total 2,935.9 2,202.7 33.3% 100.0% 100.0%
Overseas Market
Twelve months ended 31 December Share of total revenue of the Group2018 2017 Change Twelve months ended 31 December
(RMB’mn) (%) 2018 2017
Iraq 1,170.6 855.3 36.9% 39.9% 38.8%Other overseas markets 681.6 553.5 23.1% 23.2% 25.2% Total 1,852.2 1,408.8 31.5% 63.1% 64.0%
Overseas Market
In 2018, overseas market of the Group maintained rapid growth, and a new breakthrough in the business model has been achieved. Revenue from overseas markets increased by 31.5% over the same period last year. With its broad market space and high-quality orders, the overseas market continues to help the Group achieve scaled-growth, optimized customer base structure, increased overall margin as well as improved cash flow situation.
Key overseas market — Iraqi Market
In 2018, the capacity building in the Iraqi market have fully commenced, and the overall oilfield service workload continued to grow. The Group has further expanded its market scale by leveraging its competitive advantages in this market and achieved an upgrade and new breakthrough in business models.
Management Discussions and Analysis
18 Anton Oilfield Services Group Annual Report 2018
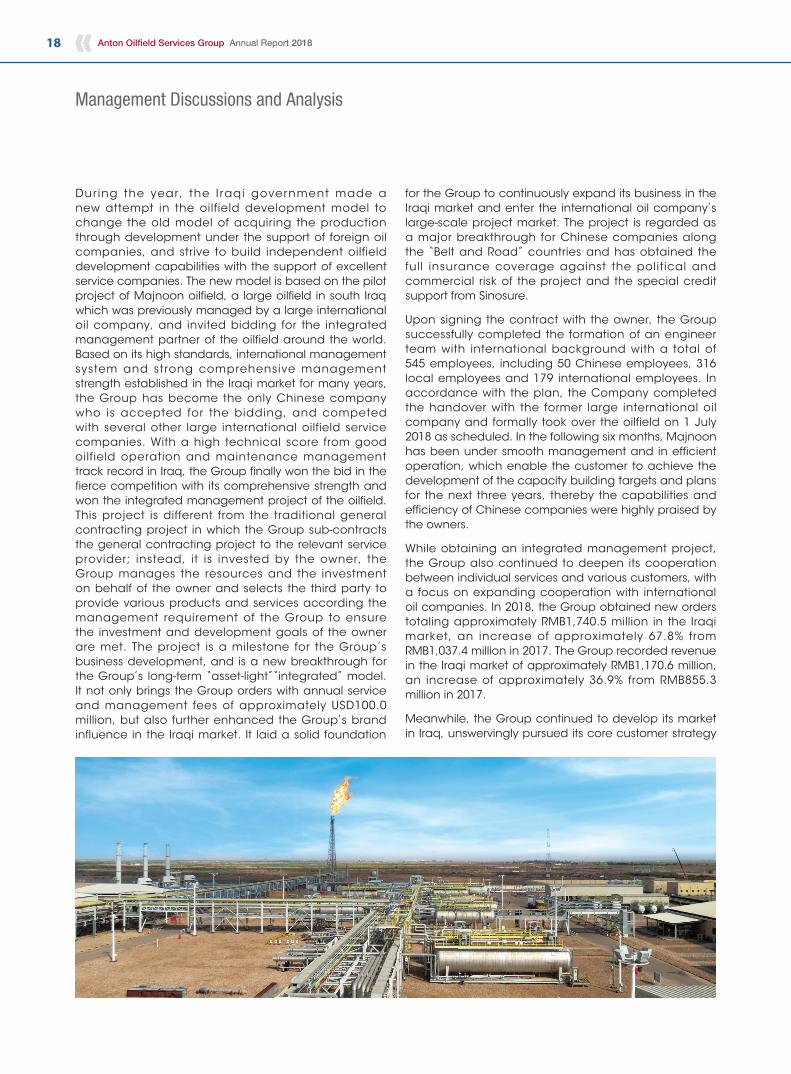
During the year, the I raqi government made a new attempt in the oilfield development model to change the old model of acquiring the production through development under the support of foreign oil companies, and strive to build independent oilfield development capabilities with the support of excellent service companies. The new model is based on the pilot project of Majnoon oilfield, a large oilfield in south Iraq which was previously managed by a large international oil company, and invited bidding for the integrated management partner of the oilfield around the world. Based on its high standards, international management system and strong comprehensive management strength established in the Iraqi market for many years, the Group has become the only Chinese company who is accepted for the bidding, and competed with several other large international oilfield service companies. With a high technical score from good oilfield operation and maintenance management track record in Iraq, the Group finally won the bid in the fierce competition with its comprehensive strength and won the integrated management project of the oilfield. This project is different from the traditional general contracting project in which the Group sub-contracts the general contracting project to the relevant service provider; instead, it is invested by the owner, the Group manages the resources and the investment on behalf of the owner and selects the third party to provide various products and services according the management requirement of the Group to ensure the investment and development goals of the owner are met. The project is a milestone for the Group’s business development, and is a new breakthrough for the Group’s long-term “asset-light”“integrated” model. It not only brings the Group orders with annual service and management fees of approximately USD100.0 million, but also further enhanced the Group’s brand influence in the Iraqi market. It laid a solid foundation
for the Group to continuously expand its business in the Iraqi market and enter the international oil company’s large-scale project market. The project is regarded as a major breakthrough for Chinese companies along the “Belt and Road” countries and has obtained the full insurance coverage against the political and commercial risk of the project and the special credit support from Sinosure.
Upon signing the contract with the owner, the Group successfully completed the formation of an engineer team with international background with a total of 545 employees, including 50 Chinese employees, 316 local employees and 179 international employees. In accordance with the plan, the Company completed the handover with the former large international oil company and formally took over the oilfield on 1 July 2018 as scheduled. In the following six months, Majnoon has been under smooth management and in efficient operation, which enable the customer to achieve the development of the capacity building targets and plans for the next three years, thereby the capabilities and efficiency of Chinese companies were highly praised by the owners.
While obtaining an integrated management project, the Group also continued to deepen its cooperation between individual services and various customers, with a focus on expanding cooperation with international oil companies. In 2018, the Group obtained new orders totaling approximately RMB1,740.5 million in the Iraqi market, an increase of approximately 67.8% from RMB1,037.4 million in 2017. The Group recorded revenue in the Iraqi market of approximately RMB1,170.6 million, an increase of approximately 36.9% from RMB855.3 million in 2017.
Meanwhile, the Group continued to develop its market in Iraq, unswervingly pursued its core customer strategy
Management Discussions and Analysis
19Anton Oilfield Services Group Annual Report 2018
and integration strategy, and prepared several large-scale projects to lay a solid foundation for its long-term development in Iraq.
Other overseas markets — Global Emerging Markets
Other overseas markets of the Group are mainly global emerging markets along the “Belt and Road” regions where the Group offers services, mainly including Ethiopia, Kazakhstan, and Pakistan etc. Core customers are Chinese independent oil companies investing in and developing oil and gas resources in these emerging markets. The Group adopts the principle of prudence in the regional market, and cooperation with customers is conditional upon collecting payments. Moreover, leveraging the “Belt and Road” policy, we conducted cooperation with China’s policy financial institutions to further reduce the Group’s operating risks in the region. By virtue of its strong technical strength and integrated service capabilities covering the entire life cycle of oil and gas field services, the Group has become the preferred partner of Chinese independent oil company customers. In recent years, the Group has gradually expanded the scale of cooperation with Chinese independent oil companies and established long-term strategic partnerships with key customers. In 2018, on top of maintaining the existing market, the Group won the bid for the order of the light-asset business model in the Chad market and the Albanian market. In respect of operations during this year, the Group continued to focus on the providing of “production-increasing, costs-reducing, and integrating” technical serivces in emerging markets around the world and efficiently carried out operations, which have created excess returns for customers in various projects, and were highly praised by customer for several times, built a good brand image for the Group, and laid a solid foundation for scaled expansion
in the future. During the year, the Group received a total of approximately RMB866.5 million of new orders in the other overseas markets, representing an increase of approximately 88.4% compared with RMB459.9 million during the same period last year. Revenue from the other overseas markets was approximately RMB681.6 million, representing an increase of approximately 23.1% compared with RMB553.5 million from the same period last year.
Domestic market
In the domestic market, the government actively promoted the development of domestic oil and gas resources in 2018 in order to safeguard the national energy security, resulting in full acceleration in the construction of upstream production capacity in the domestic market and significant increase of investment in the exploration and development of unconventional resources such as shale gas, thereby driving strong demand for oil and gas development services.
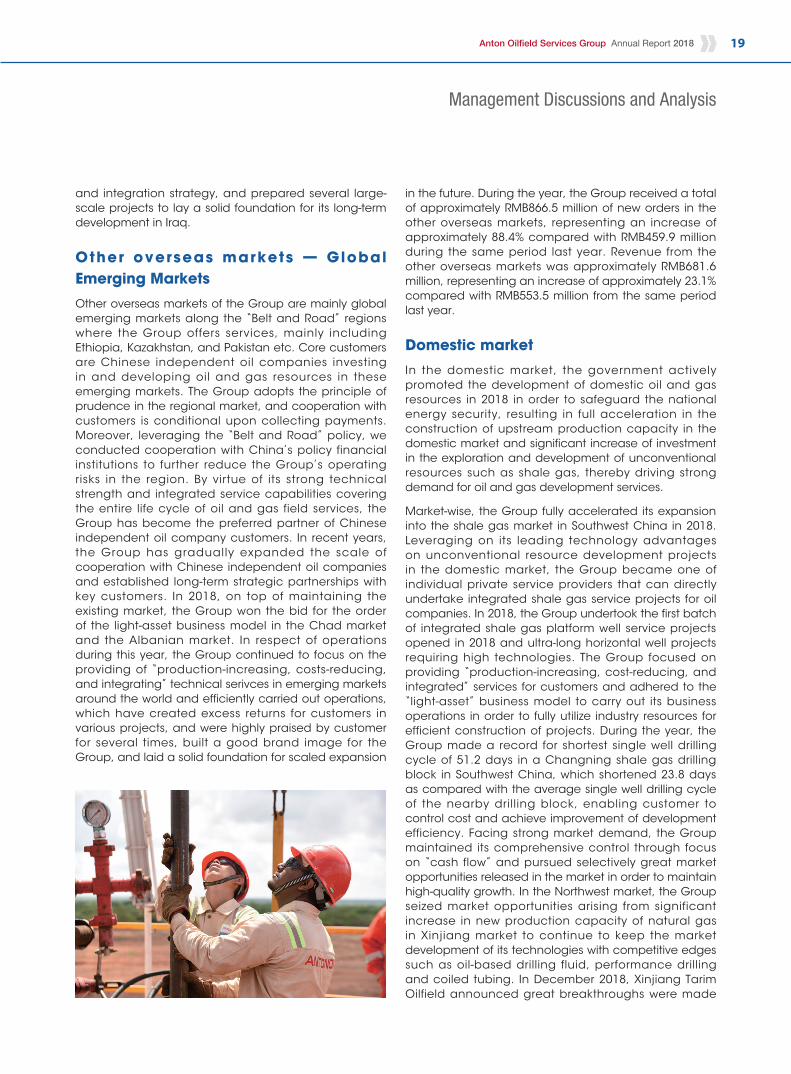
Market-wise, the Group fully accelerated its expansion into the shale gas market in Southwest China in 2018. Leveraging on its leading technology advantages on unconventional resource development projects in the domestic market, the Group became one of individual private service providers that can directly undertake integrated shale gas service projects for oil companies. In 2018, the Group undertook the first batch of integrated shale gas platform well service projects opened in 2018 and ultra-long horizontal well projects requiring high technologies. The Group focused on providing “production-increasing, cost-reducing, and integrated” services for customers and adhered to the “light-asset” business model to carry out its business operations in order to fully utilize industry resources for efficient construction of projects. During the year, the Group made a record for shortest single well drilling cycle of 51.2 days in a Changning shale gas drilling block in Southwest China, which shortened 23.8 days as compared with the average single well drilling cycle of the nearby drilling block, enabling customer to control cost and achieve improvement of development efficiency. Facing strong market demand, the Group maintained its comprehensive control through focus on “cash flow” and pursued selectively great market opportunities released in the market in order to maintain high-quality growth. In the Northwest market, the Group seized market opportunities arising from significant increase in new production capacity of natural gas in Xinjiang market to continue to keep the market development of its technologies with competitive edges such as oil-based drilling fluid, performance drilling and coiled tubing. In December 2018, Xinjiang Tarim Oilfield announced great breakthroughs were made

Management Discussions and Analysis
20 Anton Oilfield Services Group Annual Report 2018
for Zhongqiu #1 Well, a key risky drilling project in Kuqa region with discovering a 100 billion m3 condensate gas reservoir, opening a new oil and gas enrichment region. In the Zhongqiu #1 Well project, the Group provided two important technologies, being oil-based drilling fluid and performance drilling for the customer, helping the customer to enhance the exploration of natural gas and accomplish the historical mission to increase the production capacity of oil and gas in Xinjiang. In the Erdos region, the Group continued its operations of tight gas projects such as drilling and fracturing with full workload of equipment such as drilling rigs and pressure pumping. In 2018, the Group obtained new orders totaling approximately RMB1,448.2 million in the domestic market, an increase of approximately 25.8% from RMB1,150.9 million in 2017, the new orders from the customers who make payment within short period accounted for a good proportion of the total new orders. The quality of orders significantly increased as compared to 2017. In 2018, the Group recorded revenue of approximately RMB1,083.7 million in the domestic market, a significant increase of approximately 36.5% as compared to RMB793.9 million in 2017.
Business Cluster Analysis
In 2018, with the increase in upstream capital expenditure and the continued expansion of new capacity, the Group’s drilling business continued to maintain a strong growth. During the reporting period, the Group’s dril l ing technology cluster recorded revenue of RMB1,339.9 million, representing a significant increase of approximately 39.7% as compared to 2017, and accounted for 45.6% of the Group’s revenue in 2018. Well completion business of the Group achieved comprehensive recovery and re-entered the growth track. In 2018, revenue from the well completion business amounted to RMB741.8 million, up about 31.4% from 2017, and accounted for 25.3% of the Group’s total revenue. For production business, the Group’s large-scale oilfield integrated management project in the Iraqi market officially took over from July 1, 2018. During the year, the revenue from the oil production services cluster was RMB854.2 million, representing an increase of approximately 25.8% as compared to 2017, and accounted for 29.1% of the Group’s total revenue.
Revenue Breakdown by Cluster
Twelve months ended 31 December % of total revenue2018 2017 Change Twelve months ended 31 December
(RMB’mn) (%) 2018 2017
Drilling technology cluster 1,339.9 959.2 39.7% 45.6% 43.6%Well completion cluster 741.8 564.4 31.4% 25.3% 25.6%Oil production services cluster 854.2 679.1 25.8% 29.1% 30.8% Total 2,935.9 2,202.7 33.3% 100.0% 100.0%

Management Discussions and Analysis
21Anton Oilfield Services Group Annual Report 2018
Drilling technology cluster
In 2018, the Group’s revenue from drilling technology cluster amounted to RMB1,339.9 million, a significant increase of 39.7% as compared to RMB959.2 million in 2017. Increase in revenue from the cluster was mainly due to increase in capital expenditure of customers for new production capacity and significant increase in investment in the development of new wells.
Analysis of product lines in this cluster:
1) Integrated drilling services: during the year, the Group continued to cooperate with customers on integrated drilling in the Iraq and Kazakhstan markets with smooth operation of integrated drilling projects. The Group continuously made breakthroughs in the shale gas projects in Southwest China and recorded the shortest drilling cycle of a drilling block in Changning, enabling customer to control cost and achieve improvement of development efficiency. Such product line has been highly recognized for excellent completion quality and high quality safe operations. During the reporting period, revenue from integrated drilling services amounted to RMB428.0 million, a significant increase of 34.2% as compared to RMB318.9 million in 2017.
2) Directional drilling services: during the year, the Group maintained continuous cooperation with customers in the Iraqi market in addition to actively participating in bidding for new projects. In the Kazakhstan market, the Group continued to cooperate with independent Chinese oil companies and leveraged on its solid technical capacity to complete project construction with high quality. In the domestic market, the Company cooperated with international oilfield service companies to carry out business in many regional markets such as shale gas market in Southwest China. During the reporting period, revenue from directional drilling services amounted to RMB205.4 million, an increase of 7.3% as compared to RMB191.5 million in 2017.
3) Drilling fluid services: oil-based mud and high-performance water-based mud services are the Group’s services with traditional competitive edges in the Northwest China market, accounting for approximately 45% of market share in the Northwest China market. In the overseas markets, the Group provided drilling fluid services for customers in Ethiopia and the Iraqi markets, and newly expanded into the Chad market in Africa in the second half of 2018 and started to provide dril l ing fluid services for customers. In 2018, the Group’ revenue from drilling fluid services amounted to RMB136.5 million, an increase of 31.8% as compared to RMB103.6 million in 2017.
4) Land drilling services: with acceleration in new production capacity, land dri l l ing services embraced strong demand in this year. the Group’s drilling operations in the Iraq and Pakistan markets were under smooth construction. In the domestic market, the Group cooperated with state-owned oil companies in carrying out operations with high standards in Ordos and Xinjiang Mahu regions and providing high quality services for customers. During the reporting period, revenue from land drilling services amounted to RMB303.8 million, an increase of 41.8% as compared to RMB214.2 million in 2017.
5) Oilfield waste management services: in 2018, revenue from oilfield waste management services amounted to RMB36.4 million, an increase of 19.3% as compared to RMB30.5 million in 2017.
6) Dr i l l ing tool renta l and serv ices : w i th the comprehensive development of oil and gas fields in Xinjiang, China, the work of deep drilling has increase sharply, and customers’ demand for leasing of drilling tools also increased. The Group efficiently made relevant arrangements for allocation of drilling tools. During the reporting period, revenue from this product line amounted to RMB118.4 million, a significant increase of 196.7% as compared to RMB39.9 million in 2017.
7) Oil production facilities inspection and evaluation services: in 2018, the demand for the product line also continued to increase in line with market recovery. During the reporting period, revenue from oil production facilities inspection and evaluation services amounted to RMB108.6 million, a significant increase of 79.2% as compared to RMB60.6 million in 2017.

Management Discussions and Analysis
22 Anton Oilfield Services Group Annual Report 2018
The EBITDA of the drilling technology cluster increased significantly from RMB400.5 million in 2017 to RMB624.9 million in 2018, an increase of 56.0%. In 2018, the EBITDA rate was 46.6%,an increase of 4.8 percentage points as compared to 41.8% in 2017, primarily due to the Group’s active pursuing of high quality business orders and continuous control over costs and expenses.
Well completion cluster
In 2018, the well completion business of the Group returned to rapid growth tract with overall advancement of upstream development activities. During the reporting period, revenue from the well completion business amounted to RMB741.8 million, up from RMB564.4 million from last year, an increase of 31.4%.
Analysis of product lines in this cluster:
1) Well completion integration: during the reporting period, with the advancement of upstream development activities and the recovery of the traditional completion business market, the demand for this product line continuously rise. In 2018, the revenue from well completion integration was RMB216.5 million, representing a significant increase of 58.3% from RMB136.8 million for the same period last year.
2) Pressure pumping service: during the year, the Group mainly provided pressure pumping services in respect of fracturing and production stimulation in the southwestern shale gas and Ordos regional markets. During the reporting period, revenue from pressure pumping service was RMB172.6 million, an increase of 20.1% compared with RMB143.7 million for the same period last year.
3) Coiled tubing service: in the Iraqi market, the Group provided coiled tubing service to Chinese and international oil companies customers, and maintains stable construction during the year. In the domestic market, leveraging on its domestic leading coiled tubing technology, the Group conducts business in various markets such as Xinjiang, Erdos and Southwest region, and cooperated with internat ional oi l f ie ld service companies to provide quality services to customers. In 2018, revenue from this service was RMB234.7 million, representing an increase of 19.3% compared with RMB196.7 million for the same period last year.
4) Fracturing/acidizing technique and chemical materials: With good process design capability and chemical production stimulation technology, the Group continued to achieve revenue growth during the year and expanded its business to several new overseas markets such as Pakistan and Ethiopia, which have further growth potentials in the future. During the reporting period, revenue from this service was RMB44.2 million, compared with RMB36.7 million for the same period last year, an increase of 20.4%.
5) Gravel packing service: in 2018, revenue from this product line amounted to RMB73.8 million, up 64.0% from RMB45.0 million for the same period last year.
The EBITDA of the well completion cluster increased from RMB262.9 million for the same period last year to RMB329.3 million in 2018, an increase of 25.3%. In 2018, the EBITDA margin was 44.4%, a decrease of 2.2 percentage points from 46.6% for the same period last year. The decrease was principally due to the increase in proportion of revenue from well completion integration service in 2018 and the main cost of this product line is raw material cost, the EBITDA margin is relatively lower than other product lines.
Production services cluster
In 2018, revenue from the production services cluster was RMB854.2 million, up 25.8% from RMB679.1 million for the same period last year. During the year, the Group won the bid for the integrated oilfield management service of the Majnoon oilfield, a large oilfield in south Iraq and achieved a breakthrough in the new business model. In addition, the Group’s production service business has achieved breakthroughs in Chad, a new market in Africa, and has received orders of high-quality light-asset management service during the year, and it is expected to further develop in the future.

Management Discussions and Analysis
23Anton Oilfield Services Group Annual Report 2018
Analysis of product lines in this cluster:
1) Production operation service: In 2018, the Group won the bid for the integrated oilfield management service project of the Majnoon oilfield, a large oilfield in south Iraq, and provided customers with reservoir support services for the oilfield, overall operation and maintenance of the oilfield, third-party engineering service management, and HSE management to help customers maximize the value of oil and gas resources. Since 1 July 2018, the Group officially took over the oilfield from an international oil company, and commenced the operation. The operation of the oilfield has been carried out in an efficient and smooth manner and the production capacity has been gradually been improved, thus the Group has been highly praised by its customers; in addition, the Group has successfully made breakthrough in new African markets and Albanian market and received light-asset oilfield management projects. During the reporting period, the revenue from the production operation service was RMB605.1 million, representing a significant increase of 46.2% from RMB414.0 million for the same period last year;
2) Workover service: During the reporting period, affected by the adjustment of the construction s c h e m e o f s o m e c u s t o m e r s , r e v e n u e o f the workover service was RMB214.8 mil l ion, representing a decrease of 7.3% from RMB231.6 million for the same period last year;
3) Oi l tubing and cas ing and ant i -cor ros ion technology: during the reporting period, the business recorded revenue of RMB34.3 million, an increase of 2.4% as compared with RMB33.5 million for the same period last year.
The EBITDA of the production services cluster increased from RMB310.7 million for the same period last year to RMB360.8 million in 2018, an increase of 16.1%. The EBITDA margin of the production services cluster for 2018 was 42.2%, 3.6 percentage point lower than the 45.8% for last year. The decrease in EBITDA of the production services cluster was mainly due to the fact that the margin of the large-scale oilfield management project that the Group newly received during the year was slightly lower than that of the previous service projects, but such project was “light-asset” management project, and the Group was not required to incur capital expenditure, it uses less working capital and have good free cash flow and the return on capital is far better than other traditional projects that have higher margin, but require substantial investment.
Strategic Resources Alignment
In 2018, although the Group’s overall business volume has increased significantly, the Group continued to maintain strict control on incremental capital expenditure following its “asset-light” business model requirement and the overall control requirements of taking “cash flow” as the core, substituting non-essential investment with rental or by allocating resources from partners. Although the equipment used throughout the year increased by 11 units, capital expenditure throughout the year decreased by 76.3% from RMB417.9 million in 2017 to RMB99.2 million.
Alignment of Investment
In 2018, investment of the Group mainly includes supplementary investment in equipment for orders under execution and investment in research and development of new technology, and there was not any investment in large equipment.
Alignment of Research and Development (“R&D”)
In 2018, the Group focused on improvement and innovation of techniques or tools according to customers’ practical needs of production-increasing and cost-reducing, as well as promoting optimization and upgrade of products through technological cooperation. In 2018, R&D expense of the Group amounted to RMB28.0 million, representing an increase of 5.7% from RMB26.5 million last year. Key research and development pipelines include:
— Laboratory research and on-site application of “Ant-Druid” biosynthetic environmental friendly drilling fluid
— R&D and application of accessory tools for high-end well completion
— High- temp high-densi ty h igh-per formance environment-friendly water-based drilling fluid system
— Research of automatic fluid control technique and technologies
— R&D and application of “AB-III” continuous packer water control and well stimulation technology
The “AB-III” continuous packer water control technology is a result of the Group’s 10-year R&D, which had been successfully applicated on-site for some on-shore and off-shore wells and provided customers good stimulation results.

Management Discussions and Analysis
24 Anton Oilfield Services Group Annual Report 2018
Alignment of Human Resources
In 2018, the Group continued to focus on strategic development goals and promote the internationalization of personnel to support the rapid development of international business. At the same time, through incent ive mechanism, the Group cont inued to promote the Group’s talents to exert their initiative and create value for the Group’s business growth. Major developments in 2018 include:
— Comprehensively promote talent upgrading, and strengthen the introduction of core overseas operation and management talents according to the requirements for globalization, specialization and informationization constructions along with the rapid development of the Group’s overseas business. In 2018, the total headcount of the Group increased by 1,449, among which, 80% were “project-based” employees. For those incremental headcounts, 1,216 were for overseas markets and 233 were for domestic market. As of 31 December 2018, total headcount of the Group was 4,040, of which 2,256 were overseas market employees, which accounted for 55.8% of the Group’s total headcount. With the increase of large-scale overseas projects, the Group will continue to implement its “project-based” employee policy to ensure the efficient operation of the project and full use of talents. At the same time, the Group comprehensively strengthened its international training to improve the internationalization level of the company’s employees, and provide talent guarantee for the Group’s international development.
— The Group continued to decrease the proportion of fixed salary, and increase the performance-linked floating bonus through the incentive system. While controlling the overall staff costs of the Group, the Group increased the total amount of the performance-linked bonus of employees to enhance the enthusiasm of employees. Starting in 2018, the Group fully implemented the “amoeba” operation model, and proposed “amoeba” incentive system for all employees to give play to the subjective initiative of employees and promote management upgrades.
— The Group promoted the corporate culture of “hard struggle spirit” and encouraged all employees to not to be afraid of difficulties and hardships, and to go deep into the front line to give full play to the talent competitiveness as a Chinese company in emerging markets around the world.
— The Company continued to adopt long-term incentives with share options to encourage employees to develop with the Group in the long run. A total of 70,000,000 ordinary share options of the Company were granted to approximately 110 core employees and directors in April 2018 with exercise price of HK$1.02 per share. The grantees other than the independent non-executive directors may commence to exercise the share options after the first anniversary from the date of grant and thereafter one third of the options granted may be vested each year.
Outlook
The Group’s long term objective is “being a global leading oilfield technical service company”, and its 2019 objective is “becoming the leading production-increasing and cost-reducing integrated technical service company in the global emerging markets”. The focus of the Group in 2019 is to target global emerging markets of oil and gas development, provide production-increasing and cost-reducing integrated technical services, consistantly increase market share, continuously improve business quality, increase the return on assets and generate good free cash flow to achieve healthy leapfrog development.
In market strategy, the Group will continue to provide its integrated management in Majnoon oilfield in the Iraqi market, and help the customer expand the oilfield’s capacity rapidly, as well as bid for more projects led by this project operation. In addition, the Group will further strive to explore other international oil company customer markets and further pursue the “integrated general contracting” services to achieve new breakthroughs in scale. In other overseas markets, the Group will maintain the market of independent Chinese oil company customers and strengthen the exploration of international oil company customers markets and pursue large-scale project opportunities on the basis of controlling risks and ensuring the safety of funds. In the Chinese market, the Chinese government intends to increase efforts in the development of oil and gas resources in 2019 to ensure national energy security. The major oil company customers in China are expected to further increase capital expenditures in oil and gas development. The Group will seize this market opportunity to provide high-end technical services in new technology markets, natural gas markets, unconventional markets, and high-quality international oil company customer markets to help customers build capacity efficiently.

Management Discussions and Analysis
25Anton Oilfield Services Group Annual Report 2018
In products, technology and service capacity strategy, the Group will focus on the establishment of products, technology and capacity service platform. Integrate resources according to the market needs, and allocate resources such as human resources, raw materials and equipment assets for the customer, and provide all-round services to the customer which covers whole-process products, full-set resources and integrated services.
In strategic resources alignment, the Group will take production-increasing and cost-reducing integrated technology as the core to continuously build service capabilities. On the aspect of technology, it will mainly through technology cooperation and independent R&D. For equipment assets, it will focus on external cooperation or through rental. The Group will keep strict control on the scale of capital expenditure and keep a continuous generation of free cash flow to achieve higher return on net asset under “light-asset” business model. Regarding human resources, the Group will maintain a flexible employment structure, decrease its fixed labor ratio and lift the project-based labor ratio. At the same time, the Group will introduce leading talents in the industry with international vision to support the global development strategy of the Group.
In f inance strategy, the Group aims to achieve cont inuous improvement in bus iness qua l i t y . Managements and operations will be centered around sound return on assets and strong free cash flow generation which would further drive the growth of orders, revenue and profits. Meanwhile, the Group will strengthen the cooperation with financial institutions such as commercial banks to ensure profound liquidity, as well as deepening cooperation with policy financial institutions, strengthen the “combination of projects with financing” to acquire more financial supports and risk coverage under the “Belt and Road” initiative, and to capture more market share in the global markets and achieve good financial goals.
FINANCIAL REVIEW
Revenue
T h e G r o u p ’ s r e v e n u e i n 2 0 1 8 a m o u n t e d t o approximately RMB2,935.9 million, representing an increase of approximately RMB733.2 million, or 33.3%, from approximately RMB2,202.7 million in 2017. The increase in the Group’s revenue was mainly attributable to the recovery of the oil and gas industry, the rebound in oil prices and the warming-up of the market. The Group’s project execution fully accelerated on the basis of ample reserve of orders on-hand.
Cost of Sales
The costs of sales in 2018 increased to approximately RMB1,821.6 million, representing an increase of 32.7%, from approximately RMB1,373.0 million in 2017. The increase was mainly attributable to increased revenue.
Other Gains
Other gains increased from approximately RMB9.7 million in 2017 to approximately RMB11.9 million in 2018, representing an increase of approximately RMB2.2 million or 22.7%.
Impairment Loss of Financial Assets
The impairment loss of financial assets increased from approximately RMB22.8 million in 2017 to approximately RMB75.2 million in 2018, representing an increase of 229.8%, which was mainly due to changes in accounting standards which increased the corresponding range of impairment provisions.
Selling Expenses
The selling expenses in 2018 amounted to approximately RMB171.2 mi l l ion, represent ing an increase of approximately RMB18.6 million, or 12.2%, compared with approximately RMB152.6 million in 2017, which was mainly due to market recovery and business growth of the Group.
Administrative Expenses
Adminis t rat ive expenses in 2018 amounted to approximately RMB197.2 mill ion, representing an increase of approximately RMB44.5 million, or 29.1%, from approximately RMB152.7 million in 2017, which was mainly due to the increase of headcount of the Group.

Management Discussions and Analysis
26 Anton Oilfield Services Group Annual Report 2018
Research and Development Expenses
Research and development expenses in 2018 amounted to approximately RMB28.0 million, representing an increase of approximately RMB1.5 million, or 5.7%, from approximately RMB26.5 million in 2017.
Sales Tax and Surcharges
Sales tax and surcharges in 2018 amounted to approximately RMB10.3 million, representing a decrease of approximately RMB0.8 million or 7.2% as compared to approximately RMB11.1 million in 2017.
Operating Profit
As a result of the foregoing, the operating profit in 2018 amounted to approximately RMB644.3 million, representing an increase of approximately RMB170.6 million, or 36.0%, from approximately RMB473.7 million in 2017. The operating profit margin in 2018 was 21.9%, representing an increase of 0.4 percentage points from 21.5% in 2017, which was mainly attributable to the substantial increase in revenue of the Group and ongoing cost control measures.
Finance Costs, Net
In 2018, net finance costs amounted to approximately RMB297.5 mi l l ion, represent ing an increase of approximately RMB29.6 million from approximately RMB267.9 million in 2017, mainly due to the increased financial interest costs under the long-term bond item led by the Group’s newly-issued USD senior notes in December 2017.
Income Tax Expense
I n 2 0 1 8 , i n c o m e t a x e x p e n s e a m o u n t e d t o approximately RMB96.4 million, representing an increase of approximately RMB62.8 million from approximately RMB33.6 million in 2017, mainly due to the increase in operating profit of the Group.
Profit for the Year
As a result of the foregoing, the Group’s profit in 2018 was approximately RMB250.7 million, representing an increase of approximately RMB79.4 million, or 46.4%, from the profit of approximately RMB171.3 million in 2017.
Profit Attributable to the Owners of the Company
The Group’s profit attributable to the owners of the Company in 2018 amounted to RMB222.4 million, representing an increase of RMB167.9 mill ion as compared to 2017.
Trade and Notes Receivables
As at 31 December 2018, the Group’s net trade and notes receivables were RMB1,948.0 million, representing an increase of RMB187.6 million as compared to 31 December 2017. The average trade receivables turnover days (excluding quality guarantee deposits and other deposits) in 2018 were 220 days, representing a decrease of 7 days as compared to 2017. This was mainly attributable to strengthened trade receivables recovery management by the Group.
Inventories
As at 31 December 2018, the Group’s inventories amounted to RMB774.4 million, representing an increase of RMB177.2 million as compared with 31 December 2017.
LIQUIDITY AND CAPITAL RESOURCES
As at 31 December 2018, the Group’s cash and bank deposits amounted to approximately RMB1,017.6 million (including: restricted bank deposits, term deposits with initial terms of over three months, cash and cash equivalents), representing a decrease of approximately RMB530.6 million as compared to 31 December 2017. The decrease was mainly attributable to the repayment of the old outstanding USD bonds that were not involved in the bond exchange transaction in December 2017 at the beginning of the year.
As at 31 December 2018, the Group’s outstanding short-term borrowings amounted to approximately RMB879.2 mill ion. Credit facilit ies granted to the Group by domestic banks amounted to approximately RMB1,657.8 million, of which approximately RMB583.0 million were not used.
Management Discussions and Analysis
27Anton Oilfield Services Group Annual Report 2018
As at 31 December 2018, the gearing ratio of the Group was 59.7%, representing an increase of 1.6 percentage points from the gearing ratio of 58.1% as at 31 December 2017. The gearing ratio is calculated as total borrowings divided by total capital. Total borrowings include borrowings, bonds and trade and notes payables, as shown in the consolidated statement of financial position. Total capital is calculated as equity, as shown in the consolidated statement of financial position, plus total borrowings.
The equity attributable to the owners of the Company increased from RMB2,558.0 million as at 31 December 2017 to RMB2,645.9 million as at 31 December 2018.
ACQUISITON AND SALE OF MAJOR SUBSIDIARIES, ASSOCIATES AND JOINT VENTURES
For the twelve months ended 31 December 2018, the Group did not have any significant acquisitions or disposals of subsidiaries, associates and joint ventures.
EXCHANGE RISK
The Group mainly uses RMB and USD as its operating currency with certain imported goods settled in foreign currency. The Group believes the exchange risk from foreign-currency-denominated settlements is limited. The exchange risk of the Group mainly arises from its foreign currency deposits and trade receivables denominated in foreign currencies. Any fluctuations in RMB exchange rate against USD may have a negative impact on the Group’s operating results and financial position.
CASH FLOW FROM OPERATING ACTIVITIES
For the twelve months ended 31 December 2018, net cash inflow from operating activities of the Group amounted to RMB420.0 mil l ion, representing an increase of RMB224.4 million compared to the same period in 2017. This was mainly due to the increase in the collection of trade receivables benefiting from the recovery of the oil and gas industry and the accelerated execution of the Group’s projects, as well as strictly controlled payments to suppliers as per the payment schedule.
CAPITAL EXPENDITURE AND INVESTMENT
The Group’s capital expenditure in 2018 was RMB99.2 million, of which, investments in fixed assets were RMB36.0 million, and investments in intangible assets (including land use rights) were RMB63.2 million.
CONTRACTUAL LIABILITY
The Group’s contractual commitments mainly consist of payment obligations under the Group’s operating lease arrangements and capital commitments. The Group leases offices and certain equipment and machinery through operating leases. As at 31 December 2018, the Group’s operating lease commitments amounted to approximately RMB39.2 million. As at the balance sheet date (31 December 2018), the Group had capital commitments of approximately RMB20.9 million, which was not provided for in the balance sheet.
CONTINGENT LIABILITIES
As at 31 December 2018, the Group did not have any material contingent liabilities or guarantees.
PLEDGE OF ASSETS
As at 31 December 2018, the Group’s assets pledged for bank financing included building, plant, machinery and equipment with a net book value of RMB439.7 million, land use rights with a net book value of RMB5.9 million as well as trade receivable with a net book value of RMB357.1 million.
OFF-BALANCE SHEET ARRANGEMENTS
As at 31 December 2018, the Group did not have any off-balance sheet arrangement.
FINAL DIVIDENDS
At the Board meeting held on 22 March 2019, the Board recommended the payment of a final dividend of RMB0.01 per share with the total amount of RMB30.0 million for the year ended 31 December 2018 (2017: Nil). Such dividend, subject to approval at the 2019 annual general meeting, will be paid by the Company on or about 12 June 2019 to shareholders whose names appear on the register of members of the Company on 4 June 2019.
ANNUAL GENERAL MEETING
The annual general meeting of the Company (the “AGM”) will be held on 27 May 2019 (Monday), while the notice convening the AGM will be published and dispatched to the Company’s shareholders in the form required in the Rules Governing the Listing of Securities (the “Listing Rules”) on the Stock Exchange of Hong Kong Limited (the “Stock Exchange”) in due course.
Management Discussions and Analysis
28 Anton Oilfield Services Group Annual Report 2018
CLOSURE OF REGISTER OF MEMBERS
The register of members of the Company will be closed from 22 May 2019 (Wednesday) to 27 May 2019 (Monday), both days inclusive, during which period no share transfers will be registered. In order to be eligible for attending and voting at the 2019 AGM, all transfers accompanied by the relevant share certificates must be lodged with the Company’s Branch Share Registrar in Hong Kong, Computershare Hong Kong Investor Services Limited, at Shops 1712-1716, 17th Floor, Hopewell Centre, 183 Queen’s Road East, Wanchai, Hong Kong not later than 4:30 p.m. on 21 May 2019 (Tuesday).
For the purpose of ascertaining entitlement to the final dividend for the year ended 31 December 2018, the register of members of the Company will be closed from 31 May 2019 (Friday) to 4 June 2019 (Tuesday), both days inclusive. In order to be entitled to the final dividend for the year ended 31 December 2018, all transfer documents accompanied by the relevant share certificates must be lodged for registration with the Company’s Hong Kong share registrar and transfer office, Computershare Hong Kong Investor Services Limited, at Shops 1712-1716, 17th Floor, Hopewell Centre, 183 Queen’s Road East, Wanchai, Hong Kong for registration no later than 4:30 p.m. on 30 May 2019 (Thursday).
CORPORATE GOVERNANCE
The Company has complied with the code provisions set out in the Corporate Governance Code (the “Code”) under Appendix 14 to the Listing Rules during the year ended 31 December 2018.
DIRECTORS’ SECURITIES TRANSACTIONS
The directors (the “Directors”) of the Company has adopted the Model Code for Securities Transactions by Directors of Listed Issuers (the “Model Code”) under Appendix 10 to the Listing Rules as the code of practice for carrying out securities transactions by the Company’s directors. After specific enquiry with all members of the Board, the Company confirms that all Directors have fully complied with the relevant requirements stipulated in the above-mentioned rules during the reporting period.
PURCHASE, SALE OR REDEMPTION OF THE LISTED SECURITIES
Neither the Company nor any of its subsidiaries has purchased, sold or redeemed any of the Company’s listed securities during the year ended 31 December 2018.
AUDIT COMMITTEE
The Company has established an audit committee (the “Audit Committee”) comprising all three Independent Non-executive Directors, namely Mr. Zhu Xiaoping (Chairman of the Audit Committee), Mr. Zhang Yongyi and Dato Wee Yiaw Hin. The Audit Committee has reviewed the audited financial statements for the year ended 31 December 2018.

DIRECTORS’ REPORT
29Anton Oilfield Services Group Annual Report 2018
The Board of the Company is pleased to present the Directors’ Report together with the audited financial statements of the Group for the year ended 31 December 2018.
PRINCIPAL ACTIVITIES
The Company acts as an investment holding company. The Group provides integrated oil and gas field development technical services covering the entire life cycle of oil and gas field development, including drilling, completion and oil production stages.
The Company’s performance analysis based on segments is set out on Note 5.
RESULTS OF OPERATIONS
The financial results of the Group for 2018 are set out on pages 77 to 168 of this Annual Report.
FIVE YEAR FINANCIAL SUMMARY
The five year financial summary of the Group is set out on pages 6 to 7 in the section headed “Financial Summary” of this Annual Report.
FINAL DIVIDEND
At the Board meeting held on 22 March 2019, the Board recommended a payment of a final dividend for the year ended 31 December 2018 of RMB0.01per share, totaling RMB30 million (2017: Nil).
BUSINESS REVIEW
Overview
The fair review of the Group’s business is detailed in the Management Discussion and Analysis on pages 14 to 28 of this annual report. The discussion constitutes a part of this Director’s Report.
Principal Risks and Uncertainties
The Group provides oil and gas fields technical services, the main market risk and uncertainties come from the fluctuation of oil and gas price and oil and gas development activities. The Board of the Company pays close attention to the market condition and will change the Group’s market strategy according to the market changes to ensure a stable business development of the Group.
Important Events
The Board has not identified any important events affecting the Group that have occurred since the end of the financial year.

Directors’ Report
30 Anton Oilfield Services Group Annual Report 2018
Future Development
The future business development of the Group is detailed in the Management Discussion and Analysis on pages 14 to 28 of this annual report. The discussion constitutes a part of this Director’s Report.
Key Performance Indicators
The key performance indicators are detailed in the financial review set out in the Management Discussion and Analysis on pages 14 to 28 of this annual report. This discussion constitutes a part of this Directors’ Report.
Environmental Policies and Performance
For details of environmental policies and performance and compliance with relevant laws and regulations, please refer to the Environmental, Social and Governance Report of this Annual Report. The discussion is part of the report of the Board of Directors.
Compliance with Laws and Regulations
To the best of the knowledge of the Board and the management, the Group complied with the relevant laws and regulations which constitutes material impact on the business and operation of the Company and its subsidiaries in all material respects.
Relationships with Employees
For details of relationships with employees please refer to the Environmental, Social and Governance Report of this annual report. The discussion constitutes a part of this Director’s Report.
Relationships with Customers and Suppliers
Main customers of the Group are domestic and overseas oil companies. The Group aims to provide its customer with high quality services as well as low costs and high efficiency. Target of the Group is to make oil and gas development much easier through the services it provides. The Group has formed a long- term strategic partnership with its main customers.
Main providers of the Group are equipment, tools and chemicals providers of this industry. The Group keeps good communication with those providers and formed close cooperation for the production and delivery according to the Group’s business needs as well as lowering material costs according to long-term cooperation and batch purchases.

Directors’ Report
31Anton Oilfield Services Group Annual Report 2018
MAJOR CUSTOMERS AND SUPPLIERS
The largest customer and the five largest customers of the Group accounted for approximately 25.59% and 66.06% respectively of the Group’s revenues for the year ended 31 December 2018.
For the year ended 31 December 2018, the total amount of purchases made by the Group from its five largest suppliers amounted to RMB283.3 million, and accounted for 29.30% of the total purchases for the year. The amount of purchases from the largest supplier amounted to RMB97.1 million, and accounted for 10.04% of the total purchases for the year. As far as the Company is aware, none of the Directors, their associates and shareholders who are interested in more than 5% of the share capital of the Company has any interest in the five largest suppliers and customers.
SUBSIDIARIES
Particulars of the Company’s subsidiaries are set out in Note 37 to the consolidated financial statements.
PROPERTIES, PLANT AND EQUIPMENT
Additions to the property, plant and equipment of the Group for the year ended 31 December 2018 totaled RMB149.1 million. Details of movements are shown under Note 6 to the consolidated financial statements.
SHARE CAPITAL
Details of the movements in share capital of the Company during the year are set out in Note 16 to the consolidated financial statements.
Shares were issued during the year on subscription of new shares. Details about the issue of shares are also set out in Note 16 to the consolidated financial statements.
PRE-EMPTIVE RIGHTS
There is no provision regarding pre-emptive right under the Articles of Association of the Company and the Cayman Islands laws, which would oblige the Company to offer new shares on a pro rata basis to its existing shareholders.
PURCHASE, SALE OR REDEMPTION OF THE COMPANY’S LISTED SECURITIES
Save as disclosed, neither the Company nor any of its subsidiaries has purchased, sold or redeemed any of the Company’s listed securities during the year ended 31 December 2018.
RESERVES
Details of movements in the reserves of the Group and the Company during the year ended 31 December 2018 are set out in Notes 17 and 38 to the consolidated financial statements.
DISTRIBUTABLE RESERVES
As at 31 December 2018, the Company’s reserves available for distribution amounted to RMB1,073.7 million.

Directors’ Report
32 Anton Oilfield Services Group Annual Report 2018
BOND AND SENIOR NOTES
Details of the bonds and senior notes are set out in Note 18 to the consolidated financial statements.
EQUITY-LINKED AGREEMENTS
Save for the share option scheme of the Company disclosed in this Directors’ Report on pages 36 to 39 and Note 16 to the consolidated financial statements, no equity-linked agreements were entered into by the Company during the year.
DIRECTORS
The members of the Board during the year and up to the date of this Annual Report are:
Executive DirectorsMr. Luo Lin (appointed on 3 August 2007)Mr. Pi Zhifeng (appointed on 25 March 2015)Mr. Fan Yonghong (appointed on 16 April 2019)
Non-executive DirectorMr. John William Chisholm (appointed on 2 November 2016)
Independent Non-executive DirectorsMr. Zhang Yongyi (appointed on 17 November 2007)Mr. Zhu Xiaoping (appointed on 17 November 2007)Dato Wee Yiaw Hin (appointed on 19 April 2017)
The biographical details of the Directors and senior management are set out under the section headed “Profiles of Directors and Senior Management” of this Annual Report.
In accordance with Article 114 of the Articles of Association, Mr. Fan Yonghong, the Executive Director of the Company, shall retire and being eligible, will offer himself for re- election at the Annual General Meeting.
In accordance with Article 130 of the Articles of Association, one-third of the Directors shall retire from office by rotation provided that every Director (including those appointed for a specific term) shall be subject to retirement by rotation at least once every three years. Accordingly, Mr. Luo Lin shall retire and being eligible, will offer himself for re-election at the forthcoming annual general meeting (the “AGM”) of the Company.
In accordance with the letters of appointment for all the Independent Non-executive Directors, namely Mr. Zhang Yongyi, Mr. Zhu Xiaoping and Dato Wee Yiaw Hin, the Independent Non-executive Directors shall retire and being eligible, will offer themselves for re-election at the AGM.
DIRECTORS’ SERVICE CONTRACTS AND LETTERS OF APPOINTMENT
Mr. Luo Lin, being the Executive Director, has entered into a service contract with the Company for a term of three years commencing from 4 June 2016, which may be terminated by not less than three months’ notice in writing served by either party on the other.
Mr. Pi Zhifeng, being the Executive Director, has entered into a service agreement with the Company for a term of three years commencing from 26 May 2018, which may be terminated by not less than three months’ notice in writing served by either party on the other.
Mr. Fan Yonghong, being the Executive Director, has entered into a service contract with the Company for a term of three years commencing from 16 April 2019, which may be terminated by not less than three months’ notice in writing served by either party on the other.

Directors’ Report
33Anton Oilfield Services Group Annual Report 2018
Mr. John William Chisholm, being the Non-executive Director, has entered into a letter of appointment with the Company under which he will act as a Non-executive Director for a period of 3 years with effect from 2 November 2016, which may be terminated by not less than three months’ notice in writing served by either party on the other.
Dato Wee Yiaw Hin, being the Independent Non-executive Director, has entered into a letter of appointment with the Company under which he will act as an independent Non-executive Director for a period of 3 years with effect from 19 April 2017, which may be terminated by not less than three months’ notice in writing served by either party on the other.
The letter of appointment of each of Mr. Zhang Yongyi and Mr. Zhu Xiaoping, being the Independent Non-executive Directors, has been renewed by the Company for a term of one year commencing from 9 January 2019, which may be terminated by not less than three months’ notice in writing served by either party on the other.
Save as disclosed above, no Director for re-election at the AGM has a service contract with the Company or any of its subsidiaries which is not determinable by the employing company within one year without payment of compensation other than the normal statutory compensation.
DIRECTORS’ MATERIAL INTEREST IN TRANSACTIONS, ARRANGEMENT OR CONTRACTS
There was no transactions, arrangements or contract of significance connected to the business of the Group to which the Company, its subsidiaries, or its holding company or any of its fellow subsidiaries was a party and in which any Director and the Director’s connected party had a direct or indirect material interest, subsisting at the end of the year or at any time during the year.
PERMITTED INDEMNITY PROVISION
During the financial year, the Company has in force indemnity provisions as permitted under the relevant statutes for the benefit of the Directors. The permitted indemnity provisions are provided for in the Company’s Articles of Association in respect of potential loses and liability associated with legal proceedings that may be brought against such Directors and the payment of any sum primarily due from the Company that may be liable by the Directors.
MANAGEMENT CONTRACTS
No contracts concerning the management and administration of the whole or any substantial part of the business of the company were entered into or exited during the year.
DIRECTORS’ INTERESTS IN COMPETING BUSINESS
None of the Directors and their respective associates (as defined in the Rules Governing the Listing of Securities on the Stock Exchange (the “Listing Rules”)), had an interest in any business which competes or may compete with the business in which the Group is engaged during the year.
Pro Development Holdings Corp. is beneficially controlled by Mr. Luo Lin, the Executive Director, who is the controlling shareholder of the Company.
The controlling shareholder and the Executive Directors have provided the Company with annual confirmations in respect of the compliance with non-competition undertaking given by them.
The Independent Non-executive Directors have also reviewed the compliance by the controlling shareholder and the Executive Directors with the Non-competition Undertaking during the year. The Independent Non-executive Directors have confirmed that, as far as they can ascertain, there is no breach by any of the controlling shareholder and the Executive Directors of the non-competition undertaking given by them.

Directors’ Report
34 Anton Oilfield Services Group Annual Report 2018
REMUNERATION OF DIRECTORS
In compliance with the Corporate Governance Code (the “Code”) as set out in Appendix 14 to the Listing Rules, the Company has established a remuneration committee (the “Remuneration Committee”) to make recommendations to the Board on the Company’s policy and structure for all the Directors’ remuneration. The Director’s remuneration structure may include a director’s fee, a fixed salary, share options and performance bonus. The Directors’ remuneration is determined by the Board with reference to the Directors’ duties and responsibilities, the recommendations of the Remuneration Committee and the performance and results of the Group. Details of the remuneration of the Directors are set out in Note 39 to the consolidated financial statements of this Annual Report.
CONFIRMATION OF INDEPENDENCE OF INDEPENDENT NON-EXECUTIVE DIRECTORS
The Company has received an annual confirmation of independence pursuant to Rule 3.13 of the Listing Rules from each of the Independent Non-executive Directors and considers that all the Independent Non-executive Directors, namely Mr. Zhang Yongyi, Mr. Zhu Xiaoping and Dato Wee Yiaw Hin to be independent.
DIRECTORS’ AND CHIEF EXECUTIVE’S INTERESTS AND SHORT POSITIONS IN SHARES, UNDERLYING SHARES AND DEBENTURES OF THE COMPANY AND ITS ASSOCIATED CORPORATIONS
As at 31 December 2018, the interests and short positions of the Directors and chief executive of the Company, underlying shares and debentures of the Company and its associated corporations (within the meaning of Part XV of the Securities and Futures Ordinance (the “SFO”)) as recorded in the register required to be kept by the Company under Section 352 of the SFO or otherwise notified to the Company and The Stock Exchange of Hong Kong Limited (the “Stock Exchange”) pursuant to the Model Code for Securities Transaction by Directors of Listed Issuers (the “Model Code”) contained in Appendix 10 to the Listing Rules were as follows:
(i) Long positions in ordinary shares of HK$0.10 each:
Number ofordinary
Approximatepercentage of
Name of Director Note Capacity shares held shareholding
Luo Lin 1 Founder of a discretionary trust and beneficial owner
678,867,408 22.61%
Pi Zhifeng Beneficial owner 448,000 0.01%Zhang Yongyi Beneficial owner 440,000 0.01%
1. Mr. Luo Lin is the founder of the Loles Trust, which is indirectly interested in the entire issued share capital of Pro Development Holdings Corp., which in turn is interested in 664,140,740 shares of the Company. Mr. Luo Lin and his family members are the beneficiaries of the Loles Trust. Mr. Luo Lin also holds 14,726,668 shares of the Company in the capacity of a beneficial owner, in which interest of 5,672,000 shares are the total number of share options granted by the company to Mr. Luo Lin.
(ii) Long positions in underlying shares of share options:
The Directors have been granted share options under the Company’s share option scheme, details of which are set out in the section headed “Share Option Scheme” below.
Save as disclosed above, at no time during the year ended 31 December 2018, the Directors and chief executive (including their spouses and children under the age of 18) had any interests in, or had been granted, or exercised, any rights to subscribe for shares of the Company and its associated corporations required to be disclosed pursuant to the SFO or otherwise notified to the Company and the Stock Exchange pursuant to the Model Code.

Directors’ Report
35Anton Oilfield Services Group Annual Report 2018
SUBSTANTIAL SHAREHOLDERS’ INTERESTS AND SHORT POSITIONS IN THE SHARES AND UNDERLYING SHARES OF THE COMPANY
As at 31 December 2018, so far was known to any Director or the chief executive, the substantial shareholders, other than the Directors or the chief executive of the Company, who had an interest or short position in the shares or the underlying shares of the Company as recorded in the register required to be kept by the Company pursuant to Section 336 of the SFO were as follows:
Long/Short positions in the shares or underlying shares of the Company:
Name of substantialshareholders Notes Capacity
Long/shortPosition
Number ofordinary shares
held
Approximatepercentage ofshareholding
Credit Suisse Trust Limited 1 Beneficial Owner Long position 664,140,740 22.12%Seletar Limited 1 Interest of controlled
corporationLong position 664,140,740 22.12%
Serangoon Limited 1 Interest of controlled corporation
Long position 664,140,740 22.12%
Avalon Assets Limited 1 Interest of controlled corporation
Long position 664,140,740 22.12%
Pro Development Holdings Corp.
1 Beneficial Owner Long position 664,140,740 22.12%
China Oil HBP Science & Technology Co., Ltd.
Interest of controlledcorporation
Long position 356,000,009 11.86%
China Oil HBP Science & Technology Co., Ltd.
Interest of controlledcorporation
Short position 206,000,000 6.86%
Hong Kong Huihua Global Technology Limited
Beneficial Owner Long position 356,000,009 11.86%
Hong Kong Huihua Global Technology Limited
Beneficial Owner Short position 206,000,000 6.86%
UBS Group AG Interest of corporationcontrolled by you
Long position 150,953,960 5.03%
UBS AG Beneficial Owner Long position 455,960 0.015%UBS Fund Management (Switzerland) AG
Beneficial Owner Long position 36,000 0.001%
Nomura Holdings, Inc. Interest of controlledcorporation
Long position 507,652,400 16.91%
Nomura Holdings, Inc. Interest of controlled corporation
Short Position 356,840,400 11.88%
Nomura Europe Holdings plc Interest of controlled corporation
Long position 507,236,400 16.89%
Nomura Europe Holdings plc Interest of controlled corporation
Short position 356,840,400 11.88%
Nomura International plc Beneficial Owner Long position 507,236,400 16.89%Nomura International plc Beneficial Owner Short position 356,840,400 11.88%Nomura Asia Pacific Holdings Co., Ltd
Interest of controlled corporation
Long position 90,000 0.003%
Nomura Singapore Limited Beneficial Owner Long position 90,000 0.003%Nomura Asset Management Co., Ltd
Beneficial Owner Long position 326,000 0.011%
Notes:
1. The 664,140,740 shares referred to the same batch of shares.

Directors’ Report
36 Anton Oilfield Services Group Annual Report 2018
Save as disclosed above, as at 31 December 2018, so far was known to the Directors, no other persons (other than the Directors or the chief executive of the Company) had an interest or short position in the shares and underlying shares of the Company which would fall to be disclosed to the Company and the Stock Exchange under the provisions of Divisions 2 and 3 of Part XV of the SFO or as recorded in the register required to be kept by the Company under Section 336 of the SFO.
SHARE OPTION SCHEME
The existing share option scheme of the Company (the “Share Option Scheme”) was adopted by the Company at the annual general meeting of the Company held on 26 May 2017. For the year ended 31 December 2018, the group granted a total of 70,000,000 share options for the company’s ordinary share on 3 April 2018 according to the option scheme. The purpose of the Share Option Scheme is to grant option to the eligible participants in recognition and acknowledgement of their contributions made or to be made to the Group. Under the Share Option Scheme, the Board may offer to grant an option to any director or employee, or any advisor, consultant, suppliers, customers or agents.
The shares which may be issued upon exercise of all outstanding options granted and yet to be exercised under the Share Option Scheme and any other share option schemes of the Company at any time shall not exceed 30% of the shares in issue from time to time.
The maximum number of shares available for issue under options which may be granted under the Share Option Scheme or other share option scheme adopted by the Company must not in aggregate exceed 10% of the shares in issue as at the date of approval of the share option Scheme limit (i.e. 26 May 2017), being 266,006,925 shares.
As at the date of this Annual Report, the total number of shares available for issue which includes share options available to be granted and outstanding options under the Share Option Scheme was 460,174,925 shares, representing 15.3% of the issued share capital of the Company.
The total number of shares issued and which may fall to be issued upon exercise of the options granted pursuant to the Share Option Scheme to an eligible participant in any 12-month period shall not exceed 1% of the number of shares in issue as at the date of grant unless approved by the shareholders in general meeting.
The subscription price of a share in respect of any particular option granted under the Share Option Scheme shall be determined by the Board provided that it shall not be less than the highest of: (i) the closing price of the shares as stated in the Stock Exchange’s daily quotation sheet on the date of grant; (ii) the average of closing prices of the shares as stated in the Stock Exchange’s daily quotation sheets for the 5 business days immediately preceding the date of grant; and (iii) the nominal value of a share. Upon acceptance of the option, the grantee shall pay HK$1.00 to the Company by way of consideration for the grant. An option may be exercised in accordance with the terms of the Share Option Scheme at any time after the date upon which the option is deemed to be granted and accepted and prior to the expiry of 10 years from that date. The period during which an option may be exercised will be determined by the Board in its absolute discretion, save that no option may be exercised more than 10 years after it has been granted.

Directors’ Report
37Anton Oilfield Services Group Annual Report 2018
As at 31 December 2018, the Directors individually and other employees in aggregate of the Company had the following interests in options to subscribe for shares of the Company under the Share Option Scheme. Each option gives the holder the right to subscribe for one ordinary share of the Company of HK$0.10 each. Details of the movements in the number of share options during the year ended 31 December 2018 under the Share Option Scheme are as follows:
GranteesDate of grantof share options
Exercise period ofshare options
Exercise priceper share Notes
Number ofshare options
as at 1 January2018
Number ofshare options
granted duringthe period
Number ofshare options
exercised duringthe period
Number ofshare options
cancelled duringthe period
Number ofshare optionslapsed during
the period
Number ofshare option as
at 31 December2018
HK$
Directors
Zhang Yongyi 01 April 2016 01 April 2017 to31 March 2022
0.800 2,7 900,000 — — — — 900,000
23 May 2017 23 May 2018 to22 May 2023
0.810 2,9 700,000 — — — — 700,000
03 April 2018 03 April 2019 to02 April 2024
1.020 2,10 — 700,000 — — — 700,000
Subtotal: 1,600,000 700,000 — — — 2,300,000
Zhu Xiaoping 01 April 2016 01 April 2017 to31 March 2022
0.800 2,7 900,000 — — — — 900,000
23 May 2017 23 May 2018 to22 May 2023
0.810 2,9 700,000 — — — — 700,000
03 April 2018 03 April 2019 to02 April 2024
1.020 2,10 — 700,000 — — — 700,000
Subtotal: 1,600,000 700,000 — — — 2,300,000
Luo Lin 21 June 2013 21 June 2014 to20 June 2019
5.742 1,3 796,000 — — — — 796,000
2 December 2016 2 December 2017 to1 December 2022
1.100 1,8 2,216,000 — — — — 2,216,000
23 May 2017 23 May 2018 to22 May 2023
0.810 1,9 442,000 — — — — 442,000
03 April 2018 03 April 2019 to02 April 2024
1.020 1,10 — 2,218,000 — — — 2,218,000
Subtotal: 3,454,000 2,218,000 — — — 5,672,000
Wu Di 01 April 2016 01 April 2017 to31 March 2022
0.800 1,7 1,500,000 — — — — 1,500,000
23 May 2017 23 May 2018 to22 May 2023
0.810 1,9 1,000,000 — — — — 1,000,000
Subtotal: 2,500,000 — — — — 2,500,000
Pi Zhifeng 01 April 2016 01 April 2017 to31 March 2022
0.800 1,7 3,000,000 — — — — 3,000,000
23 May 2017 23 May 2018 to22 May 2023
0.810 1,9 3,000,000 — — — — 3,000,000
03 April 2018 03 April 2019 to02 April 2024
1.020 1,10 — 2,600,000 — — — 2,600,000
Subtotal: 6,000,000 2,600,000 — — — 8,600,000

Directors’ Report
38 Anton Oilfield Services Group Annual Report 2018
GranteesDate of grantof share options
Exercise period ofshare options
Exercise priceper share Notes
Number ofshare options
as at 1 January2018
Number ofshare options
granted duringthe period
Number ofshare options
exercised duringthe period
Number ofshare options
cancelled duringthe period
Number ofshare optionslapsed during
the period
Number ofshare option asat 31 December
2018HK$
John William Chisholm
23 May 2017 23 May 2018 to22 May 2023
0.810 1,9 700,000 — — — — 700,000
03 April 2018 03 April 2019 to02 April 2024
1.020 1,10 — 700,000 — — — 700,000
Subtotal: 700,000 700,000 — — — 1,400,000
Dato Wee Yiaw Hin 23 May 2017 23 May 2018 to22 May 2023
0.810 2,9 700,000 — — — — 700,000
03 April 2018 03 April 2019 to02 April 2024
1.020 2,10 — 700,000 — — — 700,000
Subtotal: 700,000 700,000 — — — 1,400,000
Employees in aggregate
21 June 2013 21 June 2014 to20 June 2019
5.742 1,3 480,000 — — — — 480,000
28 June 2013 28 June 2014 to27 June 2019
5.600 1,4 82,000 — — — — 82,000
20 November 2013 20 November 2014 to19 November 2019
4.960 1,5 76,000 — — — — 76,000
24 February 2016 24 February 2017 to23 February 2022
0.740 1,6 95,022,000 — 7,146,000 — 1,342,000 86,534,000
23 May 2017 23 May 2018 to22 May 2023
0.810 1,9 92,758,000 — 1,318,000 — 648,000 90,792,000
03 April 2018 03 April 2019 to02 April 2024
1.020 1,10 — 62,382,000 — — 350,000 62,032,000
Subtotal: 188,418,000 62,382,000 8,464,000 — 2,340,000 239,996,000
Total: 204,972,000 70,000,000 8,464,000 — 2,340,000 264,168,000

Directors’ Report
39Anton Oilfield Services Group Annual Report 2018
Notes:
1. The option period for the share options granted above commences on the date of grant and ends on the last day of seventy-two months counting respectively from the said date. The grantees are vested with, and entitled to exercise up to one-third of their share options during the option period commencing from each of the first, second and third anniversary of the date of grant.
2. The option period for the share options granted above commences on the date of grant and ends on the last day of seventy-two months counting respectively from the said date. The grantees are vested with, and entitled to exercise up to 50% of their share options during the option period commencing from each of the first and second anniversary of the date of grant.
3. The closing price of the Company’s shares listed on the Stock Exchange immediately before the date on which the options were granted was HK$5.73.*
4. The closing price of the Company’s shares listed on the Stock Exchange immediately before the date on which the options were granted was HK$5.47.*
5. The closing price of the Company’s shares listed on the Stock Exchange immediately before the date on which the options were granted was HK$4.99.*
6. The closing price of the Company’s shares listed on the Stock Exchange immediately before the date on which the options were granted was HK$0.77.*
7. The closing price of the Company’s shares listed on the Stock Exchange immediately before the date on which the options were granted was HK$0.81.*
8. The closing price of the Company’s shares listed on the Stock Exchange immediately before the date on which the options were granted was HK$1.12.*
9. The closing price of the Company’s shares listed on the Stock Exchange immediately before the date on which the options were granted was HK$0.84.*
10. The closing price of the Company’s shares listed on the Stock Exchange immediately before the date on which the options were granted was HK$0.97.*
* Source from Bloomberg

Directors’ Report
40 Anton Oilfield Services Group Annual Report 2018
SUFFICIENCY OF PUBLIC FLOAT
Based on the information publicly available to the Company and within the knowledge of the Directors, the Company has maintained a sufficient public float in compliance with the requirement of the Listing Rules during the year and to the date of this Annual Report.
ARRANGEMENTS TO ACQUIRE SHARES OR DEBENTURES
Save as disclosed under the section headed “Share Option Scheme” above, at no time during or at the end of the year was the Company or its subsidiaries a party to any arrangements which enabled the Directors (including their spouses or children under age of 18), to acquire benefits by means of acquisition of shares in, debentures of, the Company or any other body corporate.
TAXATION
For the year ended 31 December 2018, no foreign shareholder who is not resident of the PRC is liable for individual or Enterprise Income Tax, Capital Gains Tax, Stamp Duty or Estate Duty of the PRC in relation to their holding of shares of the Company. Shareholders are urged to consult their tax advisers regarding the PRC, Hong Kong and other tax consequences of owing and disposing of the Company’s shares.
RELATED PARTY/CONTINUING CONNECTED TRANSACTIONS
Schlumberger was a substantial shareholder of the Company, in February 2018, SLB sold all its stocks of the Company. Schlumberger was still a connected person of the Company for the purpose of the Listing Rules and the entering into of the 2015 Master Agreement between the Company and Schlumberger constituted continuing connected transactions for the Company under Chapter 14A of the Listing Rules.
The related party transactions for the year ended 31 December 2018 are set out in Note 36 to the Financial Statements of this Annual Report.
On 24 April 2013, the Company entered into a master mutual supply and purchase agreement (the “Master Agreement”) with Schlumberger NV (“Schlumberger”), pursuant to which the Group agreed to supply products and services to Schlumberger and Schlumberger agreed to supply and procure its affiliates to supply to the Group products and services for a period of three financial years until 31 December 2016. Please refer to the announcement of the Company dated 24 April 2013 and the circular of the Company dated 16 May 2013 for further details.
On 23 December 2015, the Company and Schlumberger entered into the 2015 Master Agreement to renew the Master Agreement. The 2015 Master Agreement has a fixed term of three years commencing from 1 January 2016 to 31 December 2018. Please refer to the announcement of the Company dated 23 December 2015 for further details.
On 13 April 2016, the Company and Schlumberger entered into the Supplemental Agreement to revise the annual caps of the continuing connected transactions under the 2015 Master Agreement. Please refer to the announcement of the Company dated 13 April 2016 for further details.
As the applicable percentage ratios as defined under Rule 14.07 of the Listing Rules for the revised annual caps under the Supplemental Agreement on an annual basis will exceed 5%, the revision to the annual caps is subject to the independent shareholders’ approval requirement under Chapter 14A of the Listing Rules.
The Supplemental Agreement to revise the annual caps was approved by the independent shareholders of the Company at an extraordinary general meeting of the Company held on 26 May 2016.
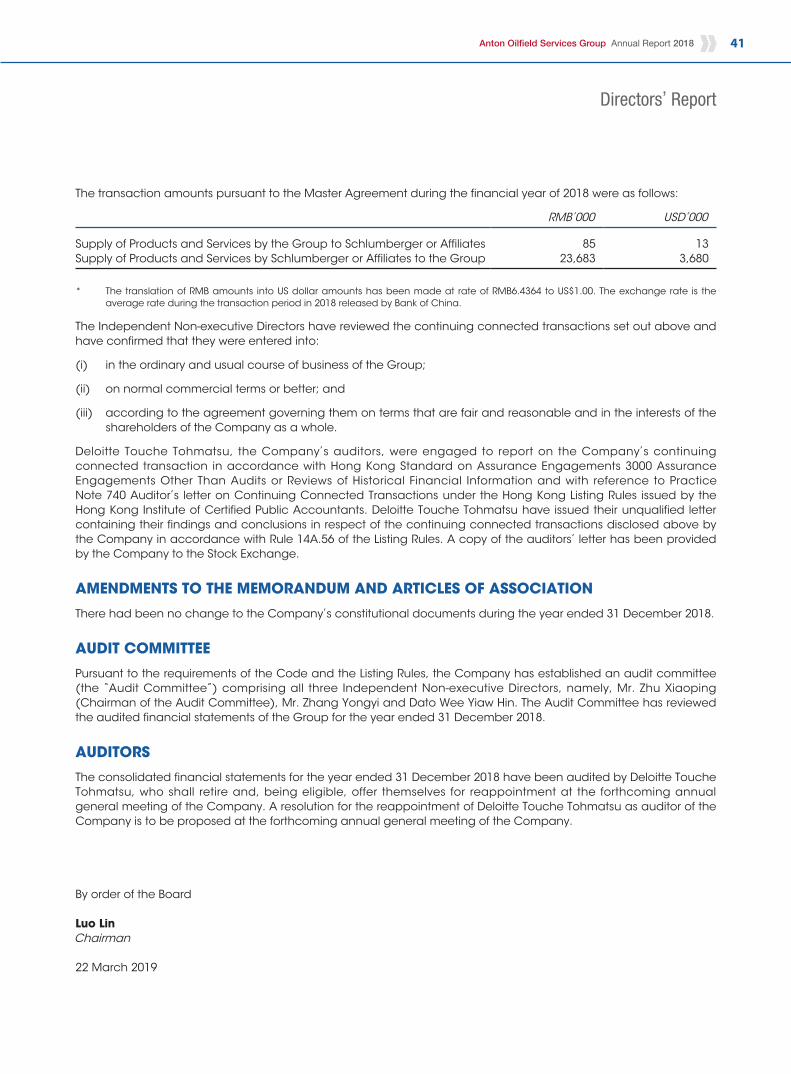
Directors’ Report
41Anton Oilfield Services Group Annual Report 2018
The transaction amounts pursuant to the Master Agreement during the financial year of 2018 were as follows:
RMB’000 USD’000
Supply of Products and Services by the Group to Schlumberger or Affiliates 85 13Supply of Products and Services by Schlumberger or Affiliates to the Group 23,683 3,680
* The translation of RMB amounts into US dollar amounts has been made at rate of RMB6.4364 to US$1.00. The exchange rate is the average rate during the transaction period in 2018 released by Bank of China.
The Independent Non-executive Directors have reviewed the continuing connected transactions set out above and have confirmed that they were entered into:
(i) in the ordinary and usual course of business of the Group;
(ii) on normal commercial terms or better; and
(iii) according to the agreement governing them on terms that are fair and reasonable and in the interests of the shareholders of the Company as a whole.
Deloitte Touche Tohmatsu, the Company’s auditors, were engaged to report on the Company’s continuing connected transaction in accordance with Hong Kong Standard on Assurance Engagements 3000 Assurance Engagements Other Than Audits or Reviews of Historical Financial Information and with reference to Practice Note 740 Auditor’s letter on Continuing Connected Transactions under the Hong Kong Listing Rules issued by the Hong Kong Institute of Certified Public Accountants. Deloitte Touche Tohmatsu have issued their unqualified letter containing their findings and conclusions in respect of the continuing connected transactions disclosed above by the Company in accordance with Rule 14A.56 of the Listing Rules. A copy of the auditors’ letter has been provided by the Company to the Stock Exchange.
AMENDMENTS TO THE MEMORANDUM AND ARTICLES OF ASSOCIATION
There had been no change to the Company’s constitutional documents during the year ended 31 December 2018.
AUDIT COMMITTEE
Pursuant to the requirements of the Code and the Listing Rules, the Company has established an audit committee (the “Audit Committee”) comprising all three Independent Non-executive Directors, namely, Mr. Zhu Xiaoping (Chairman of the Audit Committee), Mr. Zhang Yongyi and Dato Wee Yiaw Hin. The Audit Committee has reviewed the audited financial statements of the Group for the year ended 31 December 2018.
AUDITORS
The consolidated financial statements for the year ended 31 December 2018 have been audited by Deloitte Touche Tohmatsu, who shall retire and, being eligible, offer themselves for reappointment at the forthcoming annual general meeting of the Company. A resolution for the reappointment of Deloitte Touche Tohmatsu as auditor of the Company is to be proposed at the forthcoming annual general meeting of the Company.
By order of the Board
Luo LinChairman
22 March 2019

PROFILES OF DIRECTORS AND SENIOR MANAGEMENT
42 Anton Oilfield Services Group Annual Report 2018
EXECUTIVE DIRECTORS
LUO Lin (羅林), aged 52, is the Chairman and the founder of the Group. Prior to establishing the Group, Mr. Luo worked at the Tarim Basin from 1992 to 1999. Mr. Luo has 27 years of experience in the petroleum industry. He has an Executive Master of Business Administration (EMBA) degree from Tsinghua University and a bachelor’s degree in well bore engineering from Southwest Petroleum Institute (西南石油學院). Mr. Luo is also a certified lawyer and a chartered accountant in the PRC.
PI Zhifeng (皮至峰), aged 41, is the Executive Director and Chief Executive Officer of the Company, in charge of strategic management, the achievement of overall business operation target and capital market of the Group. Mr. Pi joined the Group in 2004, and was responsible for the strategis planning, M&A, marketing etc.. Prior to joining the Group, Mr. Pi was responsible for investment in China Chengxin Financial Consultancy Co., Ltd (中誠信財務顧問有限公司). Mr. Pi has a Master of Business Administration degree from the University of Chicago Booth School of Business in the U.S.
FAN Yonghong (范永洪), aged 48, is the Executive Director, President and Chief Technology Officer of the Company, and is in change of the Company’s business operation, product line management and technical construction. Mr. Fan joined the Group in 2004, and was responsible for the setup of the oilfield service business and the management of business clusters of the Group. Prior to joining the Group, Mr. Fan was employed by PetroChina Tarim Oilfield Company (中石油塔里木油田分公司) between 1991 and 2004. He has 28 years of experience in the petroleum industry. Mr. Fan has an Executive Master of Business Administration (EMBA) degree from China Europe International Business School (CEIBS).
NON-EXECUTIVE DIRECTOR
John William Chisholm, aged 64, is a Non-executive Director of the Company. Mr. Chisholm is currently the chairman of the board of directors, president and chief executive officer of Flotek Industries, Inc. (“Flotek”) (NYSE:FTK), Mr. Chisholm has served on the board of directors of NGSG, Inc. (NYSE:NGS) since December 2006. He serves on both the Compensation and Governance Committees of NGSG, Inc. Mr. Chisholm has also been selected to be on the editorial advisory board of Middle East Technology by the Oil and Gas Journal.
INDEPENDENT NON-EXECUTIVE DIRECTORS
ZHANG Yongyi (張永一), aged 83, is the Independent Non-executive Director of the Company. Mr. Zhang has extensive experience in the petroleum industry. Mr. Zhang was appointed as the Deputy General Manager of CNPC in 1992. Prior to this, he had taught in the Southwest Petroleum Institute (西南石油學院) for more than 32 years. Mr. Zhang was appointed as Chairman of the Supervisory Committee for State-owned Large and Medium Enterprises (國有大中型企業監事會主席) in 2000 and appointed by the State Council of the PRC as inspector (國務院稽察特派員) in 1998.
ZHU Xiaoping (朱小平), aged 70, is the Independent Non-executive Director. Mr. Zhu has extensive experience in corporate finance and is currently an Accounting Professor of the Renmin University of China (中國人民大學). He served as the Director of the China Accounting Society (中國會計學會理事) and Director of the China Audit Society (中國審計學會理事).
Wee Yiaw Hin, aged 60, is the Independent Non-executive Director. Dato Wee has more than 30 years of experience in the Oil & Gas Industry across the Exploration & Production and Gas & LNG value chain. His experience spans the Technical and Operational functions and Senior Management and Board Positions. He spent 21 years in Shell in Malaysia and Overseas, and joined PETRONAS as Executive Vice President and Chief Executive Officer of Upstream Business in May 2010. Dato Wee was Executive Director and Executive Committee member of the board of PETRONAS Group. Dato Wee graduated as a Civil Engineer and holds a Masters of Science Degree from Imperial College, UK.

Profiles of Directors and Senior Management
43Anton Oilfield Services Group Annual Report 2018
SENIOR MANAGEMENT
SHEN Haihong (沈海洪), aged 50, is an Executive Vice President of the Company, and is in charge of project operation management, knowledge mangement and management optimization. Mr. Shen joined the Group in 2007, and was in charge of the tubular service cluster as well as operational management of the Group. Prior to joining the Group, Mr. Shen was employed by CNPC between 1991 and 2006. He has more than 28 years of experience in the petroleum industry. Mr. Shen has a Master of Business Administration degree from Tsinghua University and a bachelor’s degree in well bore engineering from Southwest Petroleum Institute (西南石油學院), and is also a senior engineer in well bore engineering.
XU Hongjian (徐宏劍), aged 37, The financial controller of the Company, is in charge of the Group’s financial policy, finance working direction, investment and financial management. Mr. Xu joined the Group in 2006 and was responsible for the financial work, risk control and marketing of the Group. Prior to joining the Group, from 2003 to 2006, Mr. Xu worked at Deloitte & Touche LLP and was engaged in financial audit. Mr. Xu holds a bachelor’s degree in finance from Fudan University.
YAN Yonggang (嚴永剛), aged 36, is an Executive Vice President of the Company, supporting the Group’s strategic work. Mr. Yan joined the Group in 2007, used to be in charge of the Group’s well completion cluster, marketing and human resources work. Mr. Yan has a bachelor’s degree in Petroleum Engineering from Jianghan Petroleum Institute (江漢石油學院).
MA Jian (馬健), aged 51, is an Executive Vice President of the Company, and is in charge of the Middle East market. Mr. Ma joined the Group in 2002, and was responsible for business development of the Group in the early stage, marketing in the domestic market and various management operations. Prior to joining the Group, Mr. Ma worked at Halliburton China from 2000 to 2002. From 1991 to 1999, he worked as a Petroleum Engineer at the drilling company in Jianghan Oilfield (江漢油田鑽井工程處), and has 28 years of experience in the petroleum industry. Mr. Ma has a doctoral degree from China University of Petroleum and is a guest professor at Yangtze University (長江大學). Mr. Ma has a master’s degree in business administration from Huazhong University of Science and Technology (華中科技大學) and a bachelor’s degree in well bore engineering from Jianghan Petroleum Institute (江漢石油學院).
COMPANY SECRETARY
Dr. NGAI Wai Fung (魏偉峰), aged 57, is the Company Secretary of the Company. Dr. Ngai currently is the director and chief executive officer of SWCS Corporate Services Group (Hong Kong) Limited. Dr. Ngai has over 27 years’ experience and knowledge in senior management and professional matters in listed companies, including IPO, Merger and Acquisition, corporate financing, internal control, governance and company secretary etc. Dr. Ngai is a fellow of the Hong Kong Institute of Chartered Secretaries and a fellow of the Institute of Chartered Secretaries and Administrators in the United Kingdom. He also is a member of the Hong Kong Institute of Certified Public Accountants and a fellow member of the Association of Chartered Certified Accountants in the United Kingdom. Dr. Ngai obtained a Doctorate in Finance from the Shanghai University of Finance and Economics, a Master’s degree in Corporate Finance from the Hong Kong Polytechnic University, a Master’s degree in Business Administration (MBA) from Andrews University of the United States and a Bachelor’s degree (Honours) in Law from the University of Wolverhampton, the United Kingdom.

CORPORATE GOVERNANCE REPORT
44 Anton Oilfield Services Group Annual Report 2018
Since the listing of its shares on the Stock Exchange on 14 December 2007, the Company is committed to maintaining a high standard of corporate governance and has adopted the code provisions (the “Code Provision(s)”) under Appendix 14 to the Listing Rules as its own code. The Company has been in compliance with all the applicable Code Provisions for the year ended 31 December 2018.
Under the structure of the existing Board of Directors, there are three Executive Directors, one Non-executive Directors and three Independent Non-executive Directors to ensure the independent and objective running of the Board, and the relevant Board committees play an important role in the Company’s decision-making, monitoring and advisory work.
CORPORATE GOVERNANCE STRUCTURE
As the core of corporate governance for the Company, the Board has distinct duties from those of the management. The Board is responsible for providing direction to and effective supervision of the management, while the management is in charge of executing established strategies and directions. Generally speaking, the Board is responsible for:
• formulating long term strategies of the Group and supervising their execution, its subsidiaries and associated companies;
• approval of operational plan and financial budget;
• approval of the relevant annual and interim results;
• reviewing and monitoring the risk management and internal control of the Group; and
• ensuring good corporate governance and compliance.
The Board authorized the management to execute established strategies and directions of the Group, the management is in charge of the Group’s daily operation and reports to the Board. Accordingly, the Board has set out clear written guidelines, in particular, it clearly determined the scope of authority of the management, and those items requiring the Board’s approval.
There are agreed procedures for the Directors, upon reasonable request, to seek independent professional advice at the Company’s expense in appropriate circumstances.
BOARD OF DIRECTORS
Board Composition
The constitution of Board adheres strictly to the principle of ensuring balance, fairness and diversity in the backgrounds of our Board members, and the Board strives to recruit the most suitable candidates to lead the Group towards a rapid and healthy growth. As at the date of this Annual Report, the Board currently comprises three Executive Directors namely, Mr. Luo Lin, Mr. Pi Zhifeng and Mr. Fan Yonghong one Non-executive Director namely, John William Chisholm and three Independent Non-executive Directors namely, Mr. Zhang Yongyi, Mr. Zhu Xiaoping and Dato Wee Yiaw Hin. The Chairman of the Board is Mr. Luo Lin. The background of these Directors brings different expertise and experiences to the Board. The biographical details of all the Directors are set out under the section headed “Profiles of Directors and Senior Management” of this Annual Report.
To the best knowledge of the Company, there is no relationship (including financial, business, family or other material relationship) among members of the Board.

Corporate Governance Report
45Anton Oilfield Services Group Annual Report 2018
Board Diversity
The Board recognized the benefits of diversity in the Board in enhancing the Board’s effectiveness. In this regard, the Board has adopted a Board Diversity Policy (the “Board Diversity Policy”) in August 2013 which sets out the approach to achieve diversity on the Board. The Nomination Committee will give consideration to a number of factors as set out in the Board Diversity Policy when identifying suitably qualified candidates to become members of the Board, including but not limited to gender, age, cultural and educational background, ethnicity, professional experience, industry experience, skills, knowledge and length of service. The Board is considered well balanced and of a diverse mix appropriate for the needs of the Company. The Company will also take into account its own business model and specific needs from time to time to determine the optimal composition of the Board. The Nomination Committee will review the Board Diversity Policy on a regular basis to ensure its continued effectiveness.
Chairman and Chief Executive Officer
Code Provision A.2.1 stipulates that the roles of chairman and chief executive should be separate and should not be performed by the same individual. The division of responsibilities between the chairman and chief executive should be clearly established and set out in writing. The Company has been in compliance with Code Provision A.2.1 with Mr. Luo Lin serving as the Chairman of the Company and Mr. Pi Zhifeng serving as the Chief Executive Officer.
Independence of Independent Non-Executive Directors
The Company has received annual confirmation of independence from all the Independent Non-executive Directors pursuant to Rule 3.13 of the Listing Rules. Consequently, the Board is of the opinion that all the current Independent Non-executive Directors comply with the relevant guidelines set out in Rule 3.13 of the Listing Rules, thus the Company regards all the Independent Non-executive Directors as independent parties.
During the year, the Company has complied with the requirements of Rule 3.10 of the Listing Rules and has at least three Independent Non-executive Directors, including one Independent Non-executive Director, Mr. Zhu Xiaoping, with appropriate professional qualifications or accounting or related financial management expertise. Throughout the year, the Board has at least one-third in number of its members comprising Independent Non- executive Directors in compliance with Rule 3.10A of the Listing Rules.
Mr. Zhang Yongyi and Mr. Zhu Xiaoping have served the Board since 17 November 2007. They will serve as an Independent Non-executive Director for more than 10 years. Dato Wee Yiaw Hin have served the Board since 19 April 2017. During their years of appointment, Mr. Zhang Yongyi, Mr. Zhu Xiaoping and Dato Wee Yiaw Hin have demonstrated their ability to provide an independent view to the Company’s matters. Notwithstanding their years of service as Independent Non-executive Directors, the Board is of the view that they are able to continue to fulfill their role as required and thus recommends them for re-election at the annual general meeting of the Company.
Corporate Governance Report
46 Anton Oilfield Services Group Annual Report 2018
Appointment And Re-Election of The Directors
The term of the appointment for all three Executive Directors and one Independent Non-executive Director, Dato Wee Yiaw Hin, is three years and the term of the appointment for the another two Independent Non-executive Directors, Mr. ZHANG Yongyi and Mr. ZHU Xiaoping, is one year. According to the Company’s Articles of Association, at every annual general meeting of the Company, one-third of the current Directors shall retire from office by rotation (or if the number of the Directors is not three or a multiple of three, then the nearest but not less than one- third) provided that each Director (including those appointed for a specific term but not including those appointed to fill a casual vacancy or as an addition to the existing Board in accordance with Articles 114 and 115) must retire by rotation at least once every three years. The retiring Directors can be re-elected and continue to participate in the relevant meeting in the capacity as Director.
The newly appointed Directors will receive induction packages containing the duties and responsibilities of directors under the Listing Rules and other applicable rules and regulations.
The Company has arranged appropriate insurance cover to indemnify the Directors and officers of the Group for their potential liabilities incurred by them in discharging their duties.
Corporate Governance Functions
The Board has adopted the written terms of reference on corporate governance functions in March 2012 so as to perform corporate governance functions effectively. The relevant authority and duties are clearly set out in its terms of reference which are summarized as follows:
(a) To develop and review the Company’s corporate governance policies and implementation on corporate governance;
(b) To review and monitor the training and continuous professional development of Directors and senior management;
(c) To review and monitor the Company’s policies and implementation on compliance with legal and regulatory requirements;
(d) To develop, review and monitor the code of conduct and compliance manual (if any) applicable to employees and directors; and
(e) To review the Company’s compliance with the Code Provisions and disclosure in the Corporate Governance Report.
The following is a summary of the work performed by the Board on corporate governance functions during 2018:
(a) Reviewed the Company’s corporate governance policy and the implementation thereof;
(b) Reviewed and monitored the code of conduct and compliance manual applicable to the Directors and employees;
(c) Reviewed the Company’s compliance with the Code Provisions; and
(d) Reviewed the Board composition.

Corporate Governance Report
47Anton Oilfield Services Group Annual Report 2018
DIRECTORS’ SECURITIES TRANSACTIONS
The Directors have adopted the Model Code (the “Model Code”) set out in Appendix 10 to the Listing Rules as its own code of practice for carrying out securities transactions by the Directors. After specific enquiry with all members of the Board, the Company confirms that all the Directors have fully complied with the required standards stipulated in the Model Code during the year.
CONTINUOUS PROFESSIONAL DEVELOPMENT
During the year ended 31 December 2018, the Directors confirmed that they have complied with the Code Provision A.6.5 on Directors’ training. During the year, all the Directors have participated in continuous professional development by attending seminars and/or reading materials on the following topics to develop and refresh their knowledge and skills and provided a record of training to the Company.
Name of Directors Topics on training covered (Notes) Hours spent
Mr. Luo Lin C, L, R 7Mr. Wu Di C, L, R 7Mr. Pi Zhifeng C, L, R 7Mr. John William Chisholm C, L, R 7Mr. Zhang Yongyi C, L, R 7Mr. Zhu Xiaoping C, L, R 7Dato Wee Yiaw Hin C, L, R 7
Notes:
C: Corporate governance
L: Listing Rules updates
R: Other relevant regulatory updates
BOARD/BOARD COMMITTEE MEETINGS AND GENERAL MEETINGS
The Company has set up the Audit Committee, Remuneration Committee and Nomination Committee on 17 November 2007 and set up QHSE (Quality, Health, Safety, Environment) committee on 21 January 2013. During the reporting year, the Company had convened 13 Board meetings, 2 Audit Committee meetings, 1 Remuneration Committee meetings, 1 Nomination Committee meeting and 1 QHSE committee meeting. Also, the Company had convened an Annual General Meeting and an Extraordinary General Meeting during the reporting year.

Corporate Governance Report
48 Anton Oilfield Services Group Annual Report 2018
Attendances of meetings by the Directors during the year were set out in the table below:
Meeting attendance/number of meetingsAudit Remuneration Nomination QHSE Annual Extraordinary
Board Committee Committee Committee Committee General General Directors Meeting Meeting Meeting Meeting Meeting Meeting Meeting Executive DirectorsMr. Luo Lin (Chairman of the Board) 13/13 N/A 1/1 1/1 1/1 1/1 1/1Mr. Wu Di 13/13 N/A N/A N/A N/A 1/1 1/1Mr. Pi Zhifeng (Chief Executive Officer) 13/13 N/A N/A N/A 1/1 1/1 1/1
Non-executive DirectorMr. John William Chisholm 13/13 N/A N/A N/A N/A 1/1 1/1
Independent Non-executive DirectorsMr. Zhang Yongyi 13/13 2/2 N/A 1/1 N/A 1/1 1/1Mr. Zhu Xiaoping 13/13 2/2 1/1 N/A N/A 1/1 1/1Dato Wee Yiaw Hin 13/13 2/2 1/1 1/1 N/A 1/1 1/1
In addition to the Board Meetings for results announcement, which are held twice per year, the Company also holds Board Meetings every quarter (the “Quarterly Meetings”) to better exercise the strategic and monitoring roles of the Board. Senior management is invited to attend to enhance Board and management communications. The Quarterly Meetings mainly focus on key issues in four areas, i.e. strategic work, operation status, financial operation and budgeting, and capital market. Each quarter, a summary report is made on these four areas in the previous quarter and discussions are conducted on the plans in these areas for the next quarter. During the year, the dates of holding the Quarterly Meetings were set out as follows:
1st Quarterly 2nd Quarterly 3rd Quarterly 4th QuarterlyMeeting Meeting Meeting Meeting
Date 22 January 2018 23 April 2018 23 July 2018 22 October 2018

Corporate Governance Report
49Anton Oilfield Services Group Annual Report 2018
MONTHLY MANAGEMENT REPORT
During the inter-sessional period, each Executive Director receives a copy of the financial report and the management report each month, and holds business meetings with the management to obtain information of monthly operating conditions, monitor business progress, and mentor the management with effective planning.
BOARD COMMITTEES
The Board has established the Audit Committee, Remuneration Committee and Nomination Committee (all chaired by Independent Non-executive Director) with defined terms of reference (available on the Company’s website) since the listing of the Company, which are on no less exacting terms than those set out in the Corporate Governance Code.
In addition, the Board has also established QHSE (Quality, Health, Safety, Environment) Committee on 21 January 2013.
Membership: Three Independent
Non-executive Directors
Audit Committee
Membership: Two Independent
Non-executive Directors and one Executive
Director
RemunerationCommittee
Membership: Two Independent
Non-executive Directors and one Executive
Director
Nomination Committee
Membership: Two Executive Dirvectors
QHSE Committee
Membership: Three Independent Non-executive Directors,
one Non-executive Director, three Executive Directors
The Board of Directors
Each Committee has authority to engage outside consultants or experts as it considers necessary to discharge the Committee’s responsibilities. To further reinforce independence and effectiveness, all the Audit Committee members are the Independent Non-executive Directors, and the Nomination and Remuneration Committees have been structured with a majority of the Independent Non-executive Directors as members since their establishment in November 2007.

Corporate Governance Report
50 Anton Oilfield Services Group Annual Report 2018
Audit Committee
The Company has set up the Audit Committee since 17 November 2007 which took effect upon listing of the Company.
There are three members in the Audit Committee, all of them are the Independent Non-executive Directors, namely Mr. Zhu Xiaoping, Mr. Zhang Yongyi and Dato Wee Yiaw Hin. Mr. Zhu Xiaoping is the Chairman of the Audit Committee. Mr. Zhu Xiaoping has appropriate professional qualifications or accounting or related financial management expertise as required under Rule 3.10 (2) of the Listing Rules. The authority and duties of this Committee are clearly set out in its terms of reference.
The major roles and functions of the Audit Committee are as follows:
(a) To monitor the relationship between the Company and the external auditors, make proposals to the Board on the appointment, renewal and dismissal of the external auditors of the Group as well as the relevant remuneration and terms of appointment;
(b) To review the Company’s financial information; and
(c) To oversee of the Company’s financial reporting system and internal control procedures.
The Audit Committee held 2 meetings during 2018 and the following major matters were reviewed and discussed in the meetings:
(a) Reviewed the Group’s annual results of 2017 and the interim results of 2018 and made recommendations to the Board for approval;
(b) Made recommendation on the re-appointment of the auditor; and
(c) Reviewed the financial reporting system and the internal control system.
Remuneration Committee
The Company has set up the Remuneration Committee since 17 November 2007 which took effect upon listing of the Company. The Remuneration Committee comprises two Independent Non-executive Directors, Dato Wee Yiaw Hin and Mr. Zhu Xiaoping, and one Executive Director, Mr. Luo Lin. Dato Wee Yiaw Hin is the Chairman of the Remuneration Committee. The authority and duties of this Committee are clearly set out in its terms of reference.
The major roles and functions of the Remuneration Committee are as follows:
(a) To review and recommend the terms of remuneration, benefits, bonus and other allowances of the Directors and senior management;
(b) To submit proposals to the Board on the remuneration policy and structure of all the Directors and senior management; and
(c) To approve and monitor the execution of the Company’s Share Option Scheme.
The Board has authority to approve the recommendations made by the Remuneration Committee.
The Remuneration Committee held 1 meeting during 2018 and reviewed overall remuneration structure adjustment and the performance based incentive mechanism of the Group.

Corporate Governance Report
51Anton Oilfield Services Group Annual Report 2018
Nomination Committee
The Company has set up the Nomination Committee since 17 November 2007 which took effect upon listing of the Company. The Nomination Committee is composed of two Independent Non-executive Directors, Mr. Zhang Yongyi and Dato Wee Yiaw Hin, and one Executive Director, Mr. Luo Lin. Mr. Zhang Yongyi is the Chairman of the Nomination Committee. The authority and duties of this Committee are clearly set out in its terms of reference.
The major roles and functions of the Nomination Committee are as follows:
(a) To review the structure, number and composition and diversity of the Board and make recommendation to the Board on the policy and procedures for the nomination of Directors;
(b) To identify individuals suitably qualified to become Board members and may select individuals nominated for directorship, and consider individuals on merit and against the objective criteria, with due regard for the benefits of diversity on the Board;
(c) To make recommendations to the Board on the appointment or re-appointment of Directors, succession planning for Directors, in particular the chairman and the chief executive;
(d) To review the independence of the Independent Non-executive Directors and submit proposals to the Board; and
(e) To review the Board Diversity Policy in particular the measurable objectives contained therein to ensure their appropriateness and the progress made towards achieving those objectives will be ascertained.
The Nomination Committee held 1 meeting during 2018 and made recommendation to the board for the appointment of an Independent Non-executive Director.

Corporate Governance Report
52 Anton Oilfield Services Group Annual Report 2018
QHSE (QUALITY, HEALTH, SAFETY, ENVIRONMENT) COMMITTEE
The Company set up the QHSE Committee on 21 January 2013. The QHSE Committee is composed of two Executive Directors, Mr. Luo Lin and Mr. Pi Zhifeng. Mr. Pi Zhifeng is the Chairman of the QHSE Committee. The QHSE Committee is tasked with the responsibilities of providing guidance and advice on the quality, health, safety and environment (QHSE) strategies of the Group. QHSE represents an important standard for oilfield services industry. The Company strives to introduce international standards to enhance its service level at home and abroad. The QHSE Committee meets at least once every year.
The major roles and functions of the QHSE Committee are as follows:
(a) To assist the Board to review the current status of the Group’s QHSE performance;
(b) To assist the Board with oversight of the Group’s QHSE management, reporting processes and systems;
(c) To assist the Board to formulate the Group’s QHSE plans and supervise its effective implementation; and
(d) To make recommendations to the Board in respect of matters affecting the Group’s QHSE standards.
The QHSE Committee held 1 meeting during the year to reviewing and discuss the Company’s work on QHSE and planning the forthcoming work.
REMUNERATION OF THE MEMBERS OF THE SENIOR MANAGEMENT BY BAND
Pursuant to Code B.1.5 of the Code Provisions, the remuneration of the members of the senior management by band for the year ended 31 December 2018 was set out below:
Remuneration band Number of individuals
HK$2,000,000 - HK$2,500,000 2HK$2,500,001 - HK$3,000,000 2HK$4,000,000 - HK$4,500,000 1
ACCOUNTABILITY AND AUDIT
The Directors understand that they must assume the responsibility of preparing the financial accounts of each year. The Board was not aware of any material uncertainties relating to events or conditions that might cast significant doubt upon the Group’s ability to continue as a going concern and the Board has prepared the financial statements on a going concern basis.
The declaration of duties by the Auditors of the Group on the Group’s financial statements is contained on pages 74 and 76 of the Independent Auditor’s Report.

Corporate Governance Report
53Anton Oilfield Services Group Annual Report 2018
AUDITOR’S REMUNERATION
An analysis of the remuneration for audit and non-audit services provided by the auditor appointed by the Group during the year is as follows:
2018RMB ’000
Audit services 4,200Non-audit services 200 Total: 4,400
COMPANY SECRETARY
The Company Secretary is Dr. Ngai Wai Fung (“Dr. Ngai”), who has been appointed by the Board. Dr. Ngai is the director and chief executive officer of a corporate service provider, SWCS Corporate Services Group (Hong Kong) Limited. The primary corporate contact person at the Company is Mr. Pi Zhifeng, the Executive Director.
Dr. Ngai has taken no less than 15 hours of relevant professional training during the year ended 31 December 2018 in compliance with Rule 3.29 of the Listing Rules.
RISK MANAGEMENT AND INTERNAL CONTROL
The Board acknowledges its responsibility to maintain effective risk management and internal control systems of the Company in order to manage rather than eliminate risks of failure to achieve business objectives, and to provide reasonable but not absolute assurance against material misstatement or loss.
The Company implemented various policies and procedures to ensure effective risk management at each aspect of its operation, including the provision of construction operations management, on-site inspection, surveying and sampling services, administration of daily operation, financial reporting and recording, compliance with applicable laws and regulations on environmental protection and workplace safety.
During the year, the Group had reviewed its internal control system. Based on the review, the Board was satisfied with the effectiveness of the current internal control system of the Group, including the adequacy of resources, staff qualifications and experience, training programmes and budget of the Group’s activity and financial reporting function.
The Group has set up the Internal Audit Department, the Legal Department and the Quality Control Department in charge of the internal control and risk management duties. The Executive Directors of the Company receive internal financial report and management report every month for monitoring the operational progress of each business department and making reasonable planning.
The Group has put in place a set of policy for the disclosure of inside information which sets out the procedures and internal controls for the handling and dissemination of inside information in a timely manner and in compliance with the Securities and Futures Ordinance.

Corporate Governance Report
54 Anton Oilfield Services Group Annual Report 2018
SHAREHOLDERS’ RIGHTS
The Company encourages shareholders to attend shareholders’ meetings. Directors, chairman of each of Audit Committee, Remuneration Committee, Nomination Committee (or a delegated member of the Committee), chairman of the independent board committee (if any) and management will attend the annual general meeting of the Company to answer queries about the Group’s business.
In 2018, the Company had convened one annual general meeting (the “2018 AGM”). The 2018 AGM provided an ideal chance for communication between the Board and the shareholders. The Chairmen of the Board, Audit Committee, Remuneration Committee and Nomination Committee and the Company’s external auditor were all present at the AGM held on 28 May 2018, to answer shareholders’ inquiries.
THE PROCEDURES FOR SHAREHOLDERS TO CONVENE AN EXTRAORDINARY GENERAL MEETING (“EGM”)
Pursuant to the Article 79 of the Articles of Association of the Company, any two or more members of the Company or any one member of the Company which is a recognized clearing house (or its nominee (s)) holding at the date of the requisition not less than one-tenth of the paid up capital of the Company which carries the right of voting at general meetings of the Company shall deposit the written requisition at the principal office of the Company in Hong Kong, which is presently situated at 40/F, Sunlight Tower, 248 Queen’s Road East, Wanchai, Hong Kong, specifying the objects of the meeting and signed by the requisitionist(s) (the “Requisitionist(s)”).
The request will be verified with the Company’s branch share registrars in Hong Kong and upon their confirmation that the request is proper and in order, the company secretary of the Company will ask the Board to convene an EGM by serving sufficient notice in accordance with the statutory requirements to all the registered members. On the contrary, if the request has been verified is not in order, the shareholders will be advised of this outcome and accordingly, an EGM will not be convened as requested.
If within 21 days from the date of the deposit of the requisition the Board fails to proceed to convene such meeting to be held within a further 21 days, the Requisitionist(s) themselves or any of them representing more than one-half of the total voting rights of all of them, may convene a meeting in the same manner, as nearly as possible, as that in which meetings may be convened by the Board provided that any meeting so convened shall not be held after the expiration of three months form the date of deposit of the requisition, and all reasonable expenses incurred by the Requisitionist(s) as a result of the failure of the Board shall be reimbursed to them by the Company.
THE PROCEDURES AND CONTACT DETAILS FOR PUTTING FORWARD PROPOSALS AT SHAREHOLDERS’ MEETING
The annual general meeting and other general meetings provide an important opportunity for shareholders to express their views and the Company encourages and promotes shareholder attendance and participation at general meetings.
The Board members, in particular, the chairman or his delegates, appropriate members of management team and external auditors of the Company will attend annual general meetings to answer shareholders’ questions.
Shareholders attending at the annual general meeting and other general meetings are allowed to have a reasonable opportunity to ask questions regarding the items on the meeting agenda, including but not limiting to questions to the external auditor regarding the conduct of the audit and the preparation and content of the auditor’s report.

Corporate Governance Report
55Anton Oilfield Services Group Annual Report 2018
CONSTITUTIONAL DOCUMENTS
There was no change in the Company’s constitutional documents during the year ended 31 December 2018.
THE PROCEDURES BY WHICH ENQUIRIES MAY BE PUT TO THE BOARD AND SUFFICIENT CONTACT DETAILS TO ENABLE THESE ENQUIRIES TO BE PROPERLY DIRECTED
Shareholders, investors and members of the public should direct their questions about their shareholdings to the Company’s Branch Share Registrar in Hong Kong. The contact details for the Share Registrar are:
Computershare Hong Kong Investor Services Limited
17M Floor, Hopewell Centre183 Queen’s Road EastWanchai, Hong Kong Telephone: (852) 2862 8628Fax: (852) 2865 0990Website: www.computershare.com
To contact the Company in relation to your query about the Company, the contact details are as follows:
Tel: (86 10) 5739 7584Email: [email protected]
DISCLAIMERS
The information contained in the section headed “Shareholders’ Rights” in this Annual Report is for reference only and does not represent and shall not be regarded as legal or professional advice to the shareholders. Shareholders should seek their own independent legal advice as to their rights as shareholders of the Company. The Company disclaims any and all liabilities and losses that may be incurred by the shareholders for using or relying on any information contained in the section headed “Shareholders’ Rights” in this Annual Report.
FINANCIAL CALENDAR 2019
Announcement of 2018 Results
22 March 2019
Last Day to Register for Attending 2019 Annual General Meeting
21 May 2019
2019 Annual General Meeting
27 May 2019

ENVIRONMENTAL, SOCIAL AND GOVERNANCE REPORT
56 Anton Oilfield Services Group Annual Report 2018
ABOUT THIS REPORT
Anton Oilfield Services Group (hereinafter referred to as “Antonoil”, “the Company” or “the Group”) wishes to summarize and share its practices and results regarding social responsibilities of the Company in the form of the Environmental, Social and Governance Report (“ESG report”), in order to strengthen trust and cooperation, and jointly promote the sustainable development of the Company and society.
Anton Oilfield Services Group is responsible for the integrity and authenticity of the information and data in the report and promises that its content does not contain any false records, misleading statements or major omissions.
Scope of reported organizations
Anton Oilfield Services Group’s business operations in China and worldwide.
Time period of the report
1 January 2018 to 31 December 2018 in other part of the annual report with certain content outside of this range.
Basis of compiling
This report is mainly based on the relevant requirements of the “Environmental, Social and Governance (ESG) Reporting Guidelines” of the Stock Exchange of Hong Kong.
Reporting language
This report is published in Chinese Traditional and English versions. If there is any ambiguity, the Chinese Traditional version shall prevail.
Form of release
This report is published in both print and electronic formats. The electronic version can be found on the website of the Stock Exchange of Hong Kong (www.hkexnews.hk) and the website of the company (www.antonoil.com).
Contact information
Office of the Board of Directors, Anton Oilfield Services Group
Address: No. 8, Pingcui West Road, Donghuqu, Chaoyang District, Beijing, China (Postal Code: 100102) Phone: 0086-10-57397788Fax: 0086-10-57397799E-mail: [email protected]

Environmental, Social and Governance Report
57Anton Oilfield Services Group Annual Report 2018
CONCENTRATE OUR EFFORTS TO CREATE VALUES TOGETHER
There is an awesome group of animals in nature which are small and in obscurity, and yet they can adapt to any changes in environment with united cooperation, diligent work and persistent spirit no matter how severe the environment is, demonstrating a perennial spiritual motivation. This group is the ants, and “Ant on Oil” is where the name of Anton Oilfield Services Group comes from.
Antonoil takes the “ant culture” as the core of its corporate culture, follows the values of “honesty, compliance, dedication, paying back”, adheres to the corporate vision of “ becoming a world’s leading oilfield technology service company in China”, has grown from a domestic private company to an international company with operations spanning more than 10 countries, and is committed to creating values for all relevant stakeholders on the value chain.
While maintaining stable operations, Antonoil has constantly improved its responsibility management and practice at the social, environmental and governance levels. At the levels of environmental protection, safety and quality assurance, Antonoil adheres to the concept of “QHSE (Quality Health, Safety and Environment) before Antonoil” to implement the highest quality standards in the petroleum industry and has established a comprehensive QHSE management system in accordance with the OGP standards. At the level of employees, Antonoil is kind to talents, diverse and inclusive and helps them to grow, and promotes the advancement of both people and the enterprise. At the level of supply chain management, Antonoil focuses on and continuously reduces environmental and social risks in the supply chain. At the anti-corruption level, Antonoil eliminates corruption and is honest and upright, and guarantees its own clean operation. At the level of community investment, Antonoil always stays true to our soul, participates in public welfare, and actively fulfills its social responsibilities. Antonoil will continue to actively improve the existing sustainable development system, strengthen sustainable development management, and create more long-term values for all stakeholders.
1. ESG MANAGEMENT SYSTEM
1.1 ESG Concept and Management
Based on the corporate vision of “becoming a world’s leading oilfield technology service company in China”, Antonoil adheres to the concept of sustainable development, attaches great importance to environmental protection, energy conservation, ecological harmony and staff caring, actively listens to the appeals of interested parties from all circles and positively gives feedback. While pursuing the goal of being in the lead in performance, services and technology, it also aspires to become a model in the performance of enterprise social responsibility among peer companies and make the greatest contribution to the promotion of harmonious development of the enterprise, society and nature.
1.2 ESG Management Organization Structure
Antonoil has established an ESG management system with collaboration at different levels. The board of directors is responsible for considering and making decisions on the Group’s major ESG issues. A social responsibility working group covering the relevant departments in connection with ESG issues has been established within the headquarters to be responsible for the advancement of ESG work. Being the lead department of the working group, the capital market department is responsible for the coordination of ESG work. All departments at the headquarters have specified their ESG work contacts, as members of the group responsible for the advancement of specific work and the maintenance and reporting of annual ESG information on issues managed by the respective departments. The relevant department of each business segment carries out specific work in accordance with the requirements of the headquarters, and submits ESG information on a regular basis.

Environmental, Social and Governance Report
58 Anton Oilfield Services Group Annual Report 2018
Submit ESG information ona regular basis
Headquarters of the Group
ESG Working Group
Business segments
Board of Directors
To be responsible for the Company’s ESG strategy and reporting, assessing and identifying the Company’s ESG risks, and examining and approving the information disclosed during the Company’s ESG reporting period.
Lead Department
To be responsible for the daily management and coordination of ESG, managing the daily disclosure and reply of ESG information.
Departments at the Headquarters
Departments such as the QHSE management headquarters, the human resources headquarters, the supply chain centre, the audit and supervision headquarters and the brand and policy headquarters are responsible for the advancement of speci�c work of the respective departments.
Business Segments
All regional business segments have established corresponding ESG management departments to link with the management of the Group and guarantee the full implementation of ESG management.
Report on ESG matters
1.3 Participation of StakeholdersAntonoil commits itself to keeping good communication with stakeholders from all circles to promote the sustainable development of the Company in aspects of marketing operation, environmental protection, resource conservation, staff care, and community participation, etc. through participation of all stakeholders.
Stakeholders Description Communication method
G o v e r n m e n t a n d regulatory authorities
Tax administration, environmental p r o t e c t i o n , s a f e t y a n d o t h e r departments, local government, CSRC and other direct management and regulatory author i t ies with permission to execute national or local laws and regulations
Major conference, policy consultation, case report, organization investigation, document exchanges, information disclosure, etc.
Investors and shareholders Natural person with certain shares of Antonoil
Annual general meeting, annual report, announcement, press release, conference call and roadshow, etc.
Employees Personnel who have duly signed labor contract with Antonoil and served for the businesses of Antonoil for a long time
Employee sa t i s fac t ion su rvey , employee act iv i t ies , employee training, employee manual and corporate internal publications, etc.
Media Newspapers, TV stations, network companies and other related media institutes which have established with legal cooperative relationship with Antonoil Oilfield Services
Bus iness operat ion in te rv iews , enterprise culture propaganda, special subject activities and other activities attended or participated in based on invitation
Suppliers Enterprises, shops or self-employed bus inessmen legal ly supply ing product ion mater ia ls , aux i l iary materials and office necessities to Antonoil
Supp l ie r i nves t iga t ion , pub l ic tender ing & bidding meet ings, s t r a t e g i c c o o p e r a t i o n t a l k s , exchanges and visits, etc.
Customers Organizations/persons that have duly signed contract with Antonoil and acquired services from Antonoil
C o n t r a c t s i g n i n g , b u s i n e s s transaction, letter exchange, etc.
Surrounding communities of operation site
Communities of operation location, p u b l i c s o c i e t y a n d n o n - p r o f i t organizations
C h a r i t y a c t i v i t i e s , c o m m u n i t y activities, volunteer activities, social undertaking support projects, etc.
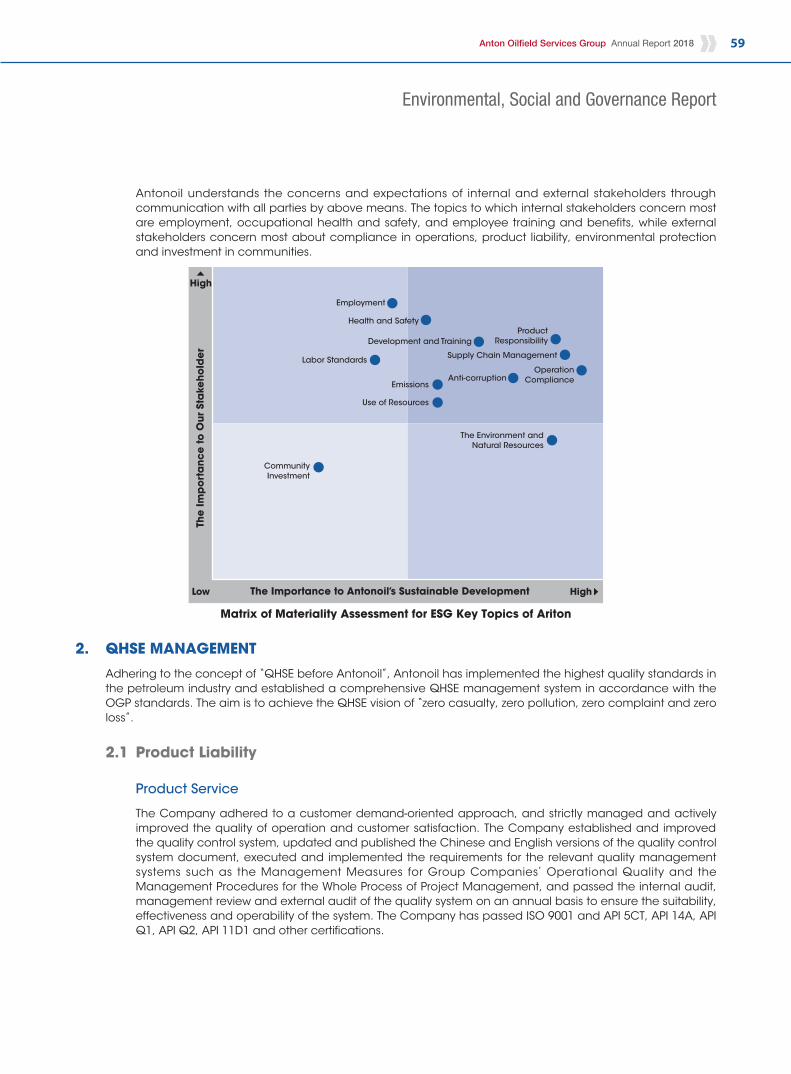
Environmental, Social and Governance Report
59Anton Oilfield Services Group Annual Report 2018
Antonoil understands the concerns and expectations of internal and external stakeholders through communication with all parties by above means. The topics to which internal stakeholders concern most are employment, occupational health and safety, and employee training and benefits, while external stakeholders concern most about compliance in operations, product liability, environmental protection and investment in communities.
The Importance to Antonoil’s Sustainable Development High
High
Anti-corruption
Health and Safety
Development and Training
Employment
ProductResponsibility
OperationCompliance
The Environment andNatural Resources
Supply Chain Management
Emissions
Use of Resources
CommunityInvestment
Labor Standards
The
Imp
ort
anc
e to
Our
Sta
keho
lde
r
Low
Matrix of Materiality Assessment for ESG Key Topics of Ariton
2. QHSE MANAGEMENT
Adhering to the concept of “QHSE before Antonoil”, Antonoil has implemented the highest quality standards in the petroleum industry and established a comprehensive QHSE management system in accordance with the OGP standards. The aim is to achieve the QHSE vision of “zero casualty, zero pollution, zero complaint and zero loss”.
2.1 Product Liability
Product Service
The Company adhered to a customer demand-oriented approach, and strictly managed and actively improved the quality of operation and customer satisfaction. The Company established and improved the quality control system, updated and published the Chinese and English versions of the quality control system document, executed and implemented the requirements for the relevant quality management systems such as the Management Measures for Group Companies’ Operational Quality and the Management Procedures for the Whole Process of Project Management, and passed the internal audit, management review and external audit of the quality system on an annual basis to ensure the suitability, effectiveness and operability of the system. The Company has passed ISO 9001 and API 5CT, API 14A, API Q1, API Q2, API 11D1 and other certifications.
Environmental, Social and Governance Report
60 Anton Oilfield Services Group Annual Report 2018
For product and service quality control, the Company’s leadership developed quality policies and objectives, ensured their compatibility with the organization’s environment and alignment with the strategic direction, and implemented quality responsibilities from top to bottom to ensure that quality control requirements were integrated into the Company’s business processes. Quality targets for 2018: customer satisfaction≥97%; first pass rate of product/service≥98%. The Company broke down the annual quality targets from top to bottom, implemented them through specific post execution, and ensured the achievement of targets through various target assessments. The Company strengthened the formulation and revision of standards, enhanced quality indicator training, and strengthened understanding. It organized the pursuit of excellence, improved the product, service and development quality, enhanced competitive advantages and promoted sustained development. In 2018, Antonoil formulated and revised a total of 84 operation standards and procedures, and completed 228 operation project proposals, with a coverage rate of 100%. It approved, reviewed and rejected 35 wrong procedures, started using the operation project weekly progress tracking management statement, and organized 13 management training sessions on the whole process of project management.
In terms of improving the product service quality, the Company is committed to strengthening production organization and coordination, and improving operation efficiency:
> The Third Drilling Team opened 12 wells and completed 12 wells in the year with an annual depth of 39,405.05 m, hitting a record high in both the number of wells and depth.
> The drilling cycle of 51.2 days of some area of Southwest Shale gas set a new shortest benchmark for drilling cycles of 5,000 m above in that Area, saving 23.8 days compared with the average drilling cycle of adjacent wells in the block.
> For the drilling coiled tubing drag fracturing project in western Xinjiang, through careful organization, the Company successfully completed the drag fracturing operation for 10 wells and the wiper trip and sand removal operation for 8 wells in the year. The construction quality was well received by Party A.
> The Company successfully implemented Zhongqiu 1 well drill bit EPC speed increase and mud technology services to help PetroChina make major breakthroughs in key risk prospecting wells.
> With respect to horizontal well dynamic temporary plugging multi-fracture spatial fracturing in Changqing Gas Field, the increase in yield of the two wells reached 170% and 270%, respectively, compared with horizontal wells in the block, which significantly exceeded the expected yield increase.
To increase customer satisfaction, Antonoil has established a sound preventive maintenance system to improve equipment integrity and utilization, ensure the normal running of production, and improve the product and operation service quality. The Company put emphasis on quality assessment and customer satisfaction evaluation, strengthened quality control improvement, enhanced customer satisfaction management, improved operation quality, and delivered added values to customers. Through the implementation of the Group’s “Measures for the Management of Customer Satisfaction”, operation project customer satisfaction for the whole year reached 98.08%.
In terms of internal control management, in 2018, the Company actively implemented the management improvement supervision mechanism, timely identified major management problems or systematic management problems, and formed a quarterly management improvement regular meeting mechanism to promote and advance the continuous improvement of the operation and service quality. In 2018, the Company organized 29 newly established management improvement projects, completed 25 projects, and had 4 projects under execution.

Environmental, Social and Governance Report
61Anton Oilfield Services Group Annual Report 2018
2.2 Occupational Health and Safety
Compliance commitment
Antonoil attaches great importance to the occupational health and safety of employees, and strictly abides by the occupational health and safety and environmental protection laws and regulations of the countries or regions where its operations are located or it operates, such as the state’s “Law on the Prevention and Control of Occupational Diseases”, the “Production Safety Law” and the “Regulation on Work Safety Licenses”. Each year, the headquarters and subsidiaries of the Group will identify the relevant laws and regulations of the regions and countries where their operations are located from top to bottom, conduct compliance evaluations on a regular basis, and effectively rectify the problems to promote and ensure the compliant and orderly running of various production and operation activities.
Policy guidance
The Company has always insisted on the core value concept of “QHSE before Antonoil”, insisting, on any moment, under any circumstances, to protect the health and safety employees (including contractors). Each operation must take into consideration the protection of the environment and minimizing the impact of the Company’s business on the environment. It actively cultivates the QHSE culture of leader demonstrations, full participation, intervention by everyone, and seeking excellence.
The Company has formulated Risk Management Procedures and Occupational Health Management Procedures to identify the sources of danger and carry out risk analysis and assessment on the aspects that may affect health and safety during the production and operation process, and also classify them according to the probability of risks and severity of consequences into different risk levels, formulate control measures and emergency plans to reduce and avoid employee health and safety incidents.
Support from the System
The Company implements the QHSE policy goal of “life, environment, customer, and excellence” (that is, protection of life is the most important in any situation, in each operation we must consider protecting the environment, do our best to satisfy customers, and always strive for excellence), In accordance with the latest version of ISO14001 and OHSAS18001 requirements, we established a comprehensive and effective occupational health and safety and environmental management system.
Implementation of Administration
Employee health is the prerequisite and guarantee of production safety. In 2018, the Company proposed the goal of the “healthy” development of Antonoil talents, with the coverage of health check-ups reaching 100%, and health information filing and evaluation for all employees reaching 100%.
The Company strengthened occupational disease prevention measures and surveillance, and conducted targeted interventions, including improving the operating environment and conditions, personal labor protection, and increasing employees’ occupational health awareness. Besides, it strengthened occupational health surveillance, pre-job, on-the-job and post-job health checks, occupational taboo handling and placement; and increased on-site occupational health hazard warning signs.

Environmental, Social and Governance Report
62 Anton Oilfield Services Group Annual Report 2018
In 2018, the Group strengthened employee health and safety management through the following initiatives:
> Implement the production safety responsibility system: By implementing the production safety responsibility system from top to bottom, the Company strengthened management and control of high-risk projects, organized and carried out the “well control safety management special activity”, improved the well control management system, highlighted the well control management of “three high” wells, key gas wells and key processes, and promoted the implementation of the well control management system.
> Conduct QHSE Hidden Trouble Checking: Through conducting Quarterly QHSE Hidden Trouble Checking, the rate of the completion of the rectification of non-compliance was over 90%. During the year, no major or above safety accident happened, and no employee occupational disease and environmental incidents occurred.
> Require employees to undergo health checks: The Company strictly organizes employee health checks as required and conducts occupational health checks on employees exposed to occupational hazards. The coverage rate of occupational health checks in 2018 was 100%. The coverage rate of regular medical examinations for employees was also 100%.
> Conduct regular occupational health training:
• The Company regularly conducts the treatment of environmental hazards of product line operational sites, recognises occupational hazard elements, and conducts occupational risks awareness campaign and risk management as required each year.
• The Company strictly implements laws and regulations, rules and regulations and operational procedures for occupational disease prevention and control, guides employees to understand the occupational disease hazard factors in the workplace, encourages employees to fully grasp the knowledge of preventing and controlling occupational diseases, and enhance employees’ awareness of self-protection.
• Each year, experts are invited to give lectures on health and first-aid knowledge, and internal QHSE instructors are regularly organized to carry out Health Management training on-site to popularize health knowledge in terms of mental health, dietary health, and physical health.
2.3 Pollution Reduction
Promise on compliance
The Group implements national environmental protection guidelines, policies and laws and regulations such as the Environmental Protection Law of the PRC, the Law on Prevention of Environmental Pollution Caused by Solid Waste of the PRC, the Law on Prevention of Water Pollution of the PRC, the Environmental Impact Assessment Law of the PRC and the Environmental Noise Pollution Prevention Law of the PRC, supervises and implements the requirements of the environmental emission standards and international conventions in the regions where the operation projects are located, and ensures that industrial waste-water and domestic sewage is discharged according to the standards. For production waste, the Company delivers them to qualified third parties for recycling and treatment, and keeps records of transshipment.
Environmental, Social and Governance Report
63Anton Oilfield Services Group Annual Report 2018
Policy guidance
Within the Group, Antonoil develops and improves the guidelines, targets and relevant systems for environmental protection. All employees have responsibilities and obligations towards environmental protection. The Company undertakes that protecting the environment has to be taken into consideration in each operation, and has timely reviewed and revised the Environmental Protection Management Procedures, the Emergency Management Procedures and the Risk Management Procedures and other systems to require the Group to pay attention to environmental protection issues while ensuring production safety at the system level. All operation projects are subject to relevant environmental risk identification and control in accordance with the Company’s risk management and control requirements before project establishment, during construction, and during site restoration after construction.
During the Reporting Period, Antonoil regulated the management of pollutant emissions and recycling and emergency pollution prevention during operations, and enhanced environmental protection work requirements for on-site operations. It regularly reviewed and updated the environmental protection management system, and constantly discovered and continuously improved the problems existing in environmental management through QHSE system internal and external audit and management review so as to continuously improve the management level.
Support from the system
As a guarantee of compliance operations, Antonoil established a QHSE management system that complies with international standards in accordance with the requirements of ISO14001 and OHSAS18001. The Group’s operation and QHSE management headquarters conducts comprehensive supervision and systematic control of QHSE work during the Company’s overall operations. In response to the Company’s global business scope, and in order to overcome the impact of complex product line structure on the implementation of QHSE management, the Company has set up corresponding QHSE management departments at project locations both at home and abroad, where it coordinates with the Group’s operation and QHSE management headquarters to strictly control pollutant levels, comprehensively carry out environmental protection inspections, and ensures compliance the Company’s global business.
Implementation of administration
Antonoil implements clean production and minimizes the impact of our business on the environment by preventing pollution and controlling emissions, effectively using natural resources, and reducing and recycling waste. During the Reporting Period, the Group strengthened the dynamic identification, assessment and potential hazard investigation of production and operation environmental risks, conducted environmental compliance evaluation on a regular basis, and proposed the informationized management and control requirements for operation maps. Besides, it carried out the dynamic tracking management of environmental risks on new operation areas and operation sites, strengthened environmental monitoring and risk assessment, and reduced the rate of environmental accidents and incidents.
Waste gas treatment
> The Company uses diesel that meets the national standard requirements, and at the same time, adopts effective diesel filter devices, and enhances the maintenance of equipment to reduce the impact of the emission of nitrogen oxides, carbon monoxide and sulphur oxides in exhaust gas emissions on the environment.
> Diesel consumption of on-site operation equipment is controlled, with some of the equipment connected to the local grid to convert the original diesel power generation into clean energy, which reduces carbon emissions by about 50%.

Environmental, Social and Governance Report
64 Anton Oilfield Services Group Annual Report 2018
Solid waste treatment
> With the basic principle of reducing and eliminating sources of hazards, in 2018, the Company cleaned up and shut down some chemical and chemical waste warehouses, and regulated, supervised and examined the discharge of wastewater generated from the well completion tool pressure test experiment, achieving discharge up to standard.
> On the work site, domestic waste and industrial waste are safely classified and stored, and then transported regularly to qualified processing units for treatment. Toxic and hazardous solid waste storage points are established in the designated area of the well site, and an impermeable membrane is laid;
> Solid waste (cuttings, etc.) generated by drilling and workover is carried out in accordance with the Law on Prevention of Environmental Pollution Caused by Solid Waste. Waste lithium batteries are handed over to professional institutions for recycling and processing;
> Through optimization of drilling design and the control of well-control risks, the environmental risks caused by overflow of drilling fluids are reduced, such as preventing the drilling fluid from leaking through the wells before drilling, and ensuring that the wells can be killed immediately when the overflow is discovered. The use of four-layered casing cementing completely isolates the borehole working environment from shallow groundwater systems to prevent contamination of water sources by sewage. Drilling fluids and fracturing fluids also have a waste water reuse rate of 100%.
> During the Reporting Period, the Group made full use of Mud-off-the-Ground technology in drilling to ensure that on-site drilling fluid does not reach the ground surface and is transferred to qualified third parties for recycling and treatment after treatment. The Company took the lead in using biosynthetic-based drilling fluids in shale gas field to increase the degradation rate of waste drilling fluids and reduce environmental pollution.
2.4 Energy Conservation Management
Laws, Regulations and Policies
Antonoil attaches importance to the identification of internal and external environmental risks and opportunities, pays attention to the impact of changes in national laws and regulations on enterprises, and regularly discusses and evaluates the Group’s strategic risks during management reviews and annual work meetings. The Group continuously complies with the national Energy Conservation Law and regional energy conservation and emission reduction regulations such as the Beijing Municipality on Water Conservation to carry out production operations.
Within the Group, the Group has formulated and promoted and implemented the Group’s “QHSE Management Regulations for Offices” requiring employees to implement initiatives such as water saving, electricity saving, paper saving and low-carbon travel, increased investment in energy conservation and emission reduction, and reduced energy and resource consumption so as to reduce greenhouse gas emissions.
Initiatives Implemented
During the Reporting Period, the Group actively implemented resource conservation and practiced resource conservation through initiatives such as encouraging employees to go for low-carbon travel, advocating electronic office, enhancing employees’ environmental protection concepts, and implementing water conservation.

Environmental, Social and Governance Report
65Anton Oilfield Services Group Annual Report 2018
> Low-carbon travel: The Company actively advocated green and low-carbon travel for all employees, strictly followed the Company’s car use management, implemented travel plan management to lower travel cost and reduced fuel consumption.
> Electronic office: The Company reduced the use of paper for the Group’s meeting materials, and use instant communication tools texts such as WeChat, QQ, and e-mail instead; use sub-meetings for largescale meetings of the Group to reduce energy consumption and greenhouse gases generated by employees due to travel;
> Awareness cultivation: The Group strengthened project management, and raised awareness of total cost control and awareness of energy conservation.
> Saving water: Recyling of fracture fluid to reduce the consumption of water for production use. Digging of water wells in the vicinity of the operating well site to obtain water for production and domestic uses so as to reduce conflicts with residents in using water.
2.5 Key Environmental Performance Indicators
Unless specified otherwise, all environmental performance indicators of Antonoil cover all domestic businesses directly managed by the Group, while data from overseas businesses is planned to be disclosed in the future as appropriate.
Key environmental performance indicators
Indicator Unit 2018
Total Greenhouse Gas Emission 1 (Scope 1 and Scope 2) 2 Tons 26,583Greenhouse Gas Emission per Million Yuan of Revenue Tons/Million Yuan 24.5Total Integrated Energy Consumption 3 MWh 88,899Total Energy Consumption per Million Yuan of Revenue MWh/Million Yuan 82.0Electricity MWh 7,710Gasoline/diesel MWh 81,189Total Water Used m3 177,077Total Water Used per Million Yuan of Revenue m3/Million Yuan 163.4Total office water consumption m3 44,948Total production water consumption m3 132,129Total hazardous wastes 4 Tons 35,899Total hazardous wastes per Million Yuan of Revenue Tons/Million Yuan 33.1
(1) Based on the business nature of Antonoil, its major gas emissions are greenhouse gases, which are mainly generated from the use of fossil fuel-converted electricity and fuels. The scope of greenhouse gas accounting for Antonoil mainly covers carbon dioxide, methane and nitrous oxide. Greenhouse gas emissions data are presented in CO2 equivalent. The calculation of greenhouse gas emissions is referred to the Greenhouse Gas Protocol published by the World Resources Institute (WRI) and the World Business Council for Sustainable Development (WBCSD), and the Fifth Assessment Report published by the Intergovernmental Panel on Climate Change (IPCC); the grid emission factors for the Scope 2 GHG calculation is based on the latest China regional grid emission factors released by the Department of Climate Change of Ministry of Ecology and Environment (2017).
(2) Scope 1: Covering the greenhouse gas emissions directly generated by the Company’s operations; Scope 2: Internal energy consumption (purchased, acquired or obtained) of electricity, heat and steam resulting in “indirect energy” greenhouse gas emissions.
(3) Total energy consumption is calculated through direct and indirect energy consumption with the conversion factor according to the General Principles of Comprehensive Energy Consumption Calculation (GB/T 2589-2008) published by the General Administration of Quality Supervision, Inspection and Quarantine of China and the China National Standardization Administration.
(4) The hazardous wastes involved in Antonoil’s operations mainly include: waste drilling fluid and oil-based cuttings.
(5) Emissions and energy consumption per million yuan of revenue are both calculated by the following formula: emissions and energy consumption/revenue (in RMB million yuan). The revenue date uses domestic market income of RMB1,083.7 million yuan.

Environmental, Social and Governance Report
66 Anton Oilfield Services Group Annual Report 2018
3. EMPLOYEE RIGHTS
3.1 Legal Hiring
Protection of Basic Rights
The Group strictly abides by the Labor Law and the Labor Contract Law of the PRC as well as relevant laws, regulations and systems of the countries in which it operates. It follows the principle of “equality, voluntariness, lawfulness, consensus, honesty and trustworthiness” with employees when signing contracts. The Group resists all forms of compulsory labor. It prohibits the use of child labor in all regions. It carefully verifies candidate identification information during recruitment to ensure no child labor was used. In 2018, Antonoil did not engage in child labor worldwide.
The Group promotes fair and equitable treatment of employees of different nationalities, races, genders, religious beliefs and cultural backgrounds. It earnestly implements the laws, regulations and rules regarding to labor protection for female employees in the countries where it operates, to protect the rights and benefits of female workers who are pregnant, child-bearing or breast-feeding her child. It forbids wage-cutting, benefits-cutting, dismissal or release of female employees during pregnancy, childbirth, and breastfeeding, to ensure that female employees are not discriminated against.
Workforce Diversity
One of the biggest advantages of Antonoil is workforce diversity, and employees from different countries and background with the same goal make progress together. In 2018, Antonoil recruited in more than 10 countries including the PRC, Iraq, Pakistan, India, Ethiopia, Kazakhstan, UAE, Albania and Venezuela, with employees of the Group coming from more than 30 countries and regions. According to the requirements of the Recruitment Management System Collection and Recruitment Management Handbook, the Group releases recruitment information through various channels, ensuring that all aspects of recruitment are open and transparent. Details of the relevant duties and compensation packages of vacant positions are accessible to candidates, to ensure both the candidates and the Group to make appropriate choices on a fully-informed basis. We strictly prohibit under table dealings. During the recruitment, the Group prohibits gender discrimination, prohibit questioning on the marriage and childbirth status of the candidates, and avoid discrimination against female candidates. A recruitment management system was adopted to achieve paperless office while optimize recruitment process and improve the efficiency. With the continuous expansion of overseas business, the Group will continue to accelerate the globalization process and continue to recruit and hire talents from all over the world.
As of December 31, 2018, the number of employees was 4,040, of which overseas employees increased from 1,216 to 2,256, and overseas employees accounted for 55.8% of the total number of employees.
3.2 Employee Welfare
According to the Social Insurance Law of the PRC and the Regulations on Mandatory Provident Fund Schemes and other laws and regulations of the regions where we operate, Antonoil contributes to the Five Social Insurance, House Fund, Mandatory Provident Fund and other welfare for employees as required by laws. In addition, Antonoil provides other benefits such as supplementary medical insurance and accident insurance. Moreover, the Company also provides benefits such as paid leave, health checkup, holiday welfare, telephone fee subsidy, cultural and sports activities, welfare for marriage, childbirth, hospitalization and condolences, reflecting the Company’s care and consideration for the balance between the work and life of employees, so as to increase the sense of belonging of employees.

Environmental, Social and Governance Report
67Anton Oilfield Services Group Annual Report 2018
In terms of incentives, Antonoil has deepened the reform of the compensation system, implemented the “Partner Program”, adopted the Amoeba business incentives, to share the operating results with employees, and promote the common development of employees and the Company. The Company share results with employees from different levels and in all aspects according to the value created by employees in different positions. The Group provides diversified and competitive remuneration. In addition to the basic salary, we also provide subsidies according to the working environment and performance-based incentive bonus. Moreover, we grant options to key employees.
3.3 Development Training
The rapid growth of Antonoil is benefited from the rapid development and cultivation of talents. It actively built a platform for the rapid growth of employees. Under the systematically talent training and nurturing regime, more development opportunities are accessible for employees at all levels. The Group established a global leader quality model focusing on “Talent developing in six directions”, emphasizing professionalization, health, informationization, entrepreneurship, management and globalization. At the same time, we also carried out full-cycle talent training, multi-channel career development and all-round talent output according to the requirements of business and talent development.
Antonoil has a comprehensive training system in place, establishes a business-oriented training system with staff development as its core, and forms and implements the Administrative Measures for Employee Further Education Overseas, Administrative Measures for Internal Trainers, and Clarification on Training Work Management Requirements and other series of institutional documents.
Cadre Training Camp (B4-B5)
“Lion Training Camp”Backbone Employee Training (B6/G10)
“Golden Ant Training Camp”Excellent Talent Training (G9 and below)
CulturalSystem
ProfessionalSkill
LanguageTraining
“Ant Training Camp”On Campus Recruits Orientation
Quality Safety Evidence Collection Training
SpecialTraining
Success
ion P
lan
Gra
ssro
ots
Apprentic
eship
Gro
up
Coord
inatio
n
SpecialTraining
On-the-JobTraining
BasicTraining
Antonoil established a comprehensive staff training system. It organized training in different hierarchies and categories, including professional safety evidence colleting trainings, general skills trainings, professional skills trainings and cultural system trainings. As for trainees recruited on campus, the Company organizes “Ant Training Camp” annually, covering orientation and training from corporate cultural and system to professional skills. As for the middle-level managers, the “Golden Ant Training Camp” and “Lion Training Camp” are carried out periodically, to effectively improve the business skills and leadership of middle managers. As for senior management, outstanding managers are selected for pursuing EMBA and MBA education every year.
Antonoil launched the “Trainee Program” in 2007, to help the new recruits on campus to fully understand the corporate culture and operation management of the Company, to cultivate professional attitude and behaviour, to learn about our business and industry knowledge through training, on-the-job learning and mentoring, to smoothly transit from students to the professionals.

Environmental, Social and Governance Report
68 Anton Oilfield Services Group Annual Report 2018
Picture: Trainee Program
Indicator Measurement 2018
Number of trainings program 1,288Of which: Evidence collection training program 301 General skills training program 375 Professional skills training program 612Total training hours hour 2,149Investment in trainings RMB0’000 523
4. RESPONSIBILITY MANAGEMENT
4.1 Supply Chain Management
Supplier Management System
Antonoil continued to improve the management level for the supply chain and implemented all-process supplier management mechanism, covering the development and admittance of suppliers, usage and supervision, assessment and termination process. Antonoil is willing to work together with partners to create green supply chain environment.
During the reporting period, Antonoil further improved supplier management, optimized organizational structure, and equipped professional supplier management talents. It comprehensively upgraded supplier management system with supplier information management as the core and established a sharable supplier resource pool. While emphasizing the internal social responsibility management, Antonoil also require suppliers to fulfil their social responsibilities, and incorporate their performance into the assessment system. Suppliers are assessed based on the social responsibility performance as well as quality, service level and price. Antonoil always insist on hierarchical management, multi-party participation, comprehensive checks and quick response. To further optimize the supplier management system, the Company upgraded and perfected the original Supplier Management Rules, formulated and issued Supplier Management Procedure, combined with the Procurement Management Measures and Tendering Management Measures, to provide clear standardized requirements for supplier management. The Company established a whole process supplier management mechanism, covering development and admittance before the process, the usage and supervision during the process as well as review, assessment and termination after the process.

Environmental, Social and Governance Report
69Anton Oilfield Services Group Annual Report 2018
Selection of suppliers
The Company provides suppliers with fair and transparent participation opportunities through public bidding and bidding invitation, and has established a unified supplier database. As the selection of suppliers has direct effects on the Company’s business and costs, we hold a cautious and stringent attitude towards the selection of suppliers. We consider not only their product qualities, prices and service standards, but also their business ethics, corporate reputation and fulfillment of social responsibilities.
Total number of suppliers and number of suppliers by region
Number of suppliers (1,690) and their regional distribution:
Types Number Regional distribution
Domestic 1,173 Region N o r t h China
Northwest China
Southwest China
EastChina
C e n t r a l China
Northeast China
S o u t h China
Number 325 303 208 179 72 67 19Overseas 517 Region M i d d l e
EastAsia Africa America Europe
Number 230 150 57 44 36
4.2 Intellectual Property Rights Protection
The Company attaches great importance to technological innovation and intellectual property rights protection. In 2018, we established a technological innovation system that integrates research institutes of the Company and closely combines production, academy and research branches to meet the needs of customers for technical services. During the reporting period, Antonoil received 16 domestically authorized patent rights, accumulated 339 in total. Through continuous technological accumulation and innovation, the Company obtained a number of important achievements and patents. Scientific research achievements play an important role in production and have achieved remarkable benefits.
4.3 Customer Privacy Protection
For privacy protection, the Company has formulated relevant policies and management rules to protect privacy and information security. In 2018, the Company formulated and promulgated, “Rules on Staff Information Security Examination and Management (Trial)”, “Rules on Staff Information Security Management (Trial)” and “Rules on Confidentiality Management of the Group Company (Trial)” and other regulations and required all units to implement such rules strictly.
All staff need to sign confidentiality agreement before taking work, and shall pay attention to protect the information resources of customers in daily work, and protect customer’s information from unauthorized access, use and leakage. We endeavor to ensure that customer’s information and business data are used preferably as limited by the authorized commercial use and only acquired by employees who are deemed to know.
4.4 Anti-corruption
To regulate operation and management and prevent management and employees to be involved in corruption, bribery, extortion, fraud, money laundering and other illegal activities, the Group strictly complied with the Company Law of the PRC, the Criminal Law, the Criminal Procedure Law, the Anti-Money Laundering Law, the Punishment Ordinance for Civil Servants Working in Administrative Organs and other laws, provisions and requirements for anticorruption and clean administration and the laws and regulations of the countries where we operate. We upheld strict corporate governance and made full efforts to boost our anticorruption works, strengthen the implementation of our management rules and give effect to our punishment and prevention mechanism with a view to build a clean enterprise and enhance employees’ awareness of anticorruption.

Environmental, Social and Governance Report
70 Anton Oilfield Services Group Annual Report 2018
The Company and its employees strictly complied with relevant legal norms and ethical standards. In 2018, to the best knowledge of the Company, there were no material violations of relevant standards, rules and regulations. In addition, no corruption cases involving the Company or its employees occurred in 2018; the Company maintained long-term strategic cooperation with suppliers for mutual benefit and win-win results, paid much attention on the relationship with suppliers and customers and stuck to integrity. During the reporting period, no breaches of honesty work by management personnel were found.
The Company attaches great importance to the moral construction of employees. To improve the internal management of the Company, enhance the self-restraint ability of employees and ensure the smooth progress of the Company’s production and operations without violating business ethics, the Company compiled the Staff Handbook of Antonoil, built up a systematic internal control system for various departments, established an effective system to punish and prevent frauds, and actively guided employees to learn, promote and implement Antonoil’s corporate culture. All new employees were trained in this respect and were required to sign a confirmation letter regarding the “Competition Restrictions for Employees” when joining the Company. Our HR Department organizes re-study and promotion sessions for the Staff Handbook from time to time every year. The Company publicizes its whistleblowing hotline and mailbox in its internal office system and keeps tour inspections on team construction works, so as to effectively exert the supervisory power of its employees. The Company is open to accept reporting clues and makes careful verifications for every whistleblowing letter.
Guided by the problems found in internal and external auditing and administrative supervision, the Company continued to improve its internal supervision and management systems, such as Internal Audit Management Measures and Implementation Rules for the Management of Audit Supervision Projects, conducted routine audits on important processes and system implementation every year and prepared audit reports to highlight risks and improve internal control system. In bidding invitation and bidding process, we made a full search for bribery and criminal records, strictly controlled the qualification examination of suppliers and the bidding and procurement management of overseas institutions, strengthened process supervision, maintained strict discipline and stringent accountability and effectively prevented and controlled the occurrence of illegal issues such as corruption, bribery and insider trading. We kept strict management on the sales activities of employees, advocated the “sunshine sales” system, conducted regular compliance audits on employees every year and firmly imposed punishment on employees who violated rules and regulations.
4.5 Community Investment
Antonoil adhered to the corporate mission of “achieving success by helping others to succeed” and took an active part in public welfare activities by participating in earthquake relief, poverty alleviation and other works. Meanwhile, the Group launched cultural branding activities in campuses to enhance students’ overall growth.
Case: Antonoil was listed in the “Top 100 Non-public Enterprises in Beijing’s 2018 Comprehensive Evaluation for Fulfillment of Social Responsibilities”

Environmental, Social and Governance Report
71Anton Oilfield Services Group Annual Report 2018
After unit declaration, sub-district recommendation, preliminary evaluation and recommendation by Chaoyang District Leadership Group Office for Social Construction Works and relevant industry associations at municipal level, expert evaluation and verification by Beijing Social Work Committee, Antonoil was listed in the “Top 100 Non-public Enterprises in Beijing’s 2018 Comprehensive Evaluation for Fulfillment of Social Responsibilities”, which represented a recognition from the Beijing city for Antonoil’s efforts in fulfilling social responsibilities. Over the years, Antonoil has made great efforts to safeguard the rights and interests of employees, operated in good faith, strived to safeguard national interests in the course of carrying out the “Belt & Road” initiative and actively participated in public welfare activities. We donated funds to primary and secondary schools, colleges and universities and sponsored various educational support activities, made donations to areas hit by disasters, such as Wenchuan Earthquake, and provided targeted poverty alleviation support to old revolutionary base areas and poverty-stricken areas, which gained good social results and high recognition from local governments and set an example for non-public enterprises to fulfill social responsibilities.
Case: The “Anton Forum” Held in Southwest Petroleum University
In 2018, we continued to launch the “Anton Forum” in Southwest Petroleum University and continued to explore topics that were preferred by students and broaden the channels for inviting guests. We invited a number of distinguished journalists, anchors, hosts and other guests to hold the forum. During the reporting period, a total of three sessions (sessions 25, 26 and 27) were held in the “Anton Forum” with more than 2,000 participants. The three sessions had distinct themes that were preferred by students and received hot response from participants. The sessions covered such contents as youthful dreams and career life, news events and news communication and methods to improve the reasoning ability of college students, with an aim to help students broaden their horizons, enrich their experiences and enhance their knowledge from different dimensions. With support from relevant departments and careful preparation, the “Anton Forum” was full of participants in every session and has stimulated strong response from students and influenced both inside and outside the university.

INDEPENDENT AUDITOR’S REPORT
72 Anton Oilfield Services Group Annual Report 2018
INDEPENDENT AUDITOR’S REPORTTO THE SHAREHOLDERS OF ANTON OILFIELD SERVICES GROUP(incorporated in the Cayman Islands with limited liability)
OPINION
We have audited the consolidated financial statements of Anton Oilfield Services Group (the “Company”) and its subsidiaries (collectively referred to as the “Group”) set out on pages 77 to 168, which comprise the consolidated statement of financial position as at 31 December 2018, and the consolidated statement of profit or loss, consolidated statement of profit or loss and other comprehensive income, consolidated statement of changes in equity and consolidated statement of cash flows for the year then ended, and notes to the consolidated financial statements, including a summary of significant accounting policies.
In our opinion, the consolidated financial statements give a true and fair view of the consolidated financial position of the Group as at 31 December 2018, and of its consolidated financial performance and its consolidated cash flows for the year then ended in accordance with International Financial Reporting Standards (“IFRSs”) issued by the International Accounting Standards Board (“IASB”) and have been properly prepared in compliance with the disclosure requirements of the Hong Kong Companies Ordinance.
BASIS FOR OPINION
We conducted our audit in accordance with International Standards on Auditing (“ISAs”) issued by the IASB. Our responsibilities under those standards are further described in the Auditor’s Responsibilities for the Audit of the Consolidated Financial Statements section of our report. We are independent of the Group in accordance with the International Ethics Standards Board for Accountants’ Code of Ethics for Professional Accountants (the “IESBA Code”), and we have fulfilled our other ethical responsibilities in accordance with the IESBA Code. We believe that the audit evidence we have obtained is sufficient and appropriate to provide a basis for our opinion.

Independent Auditor’s Report
73Anton Oilfield Services Group Annual Report 2018
INDEPENDENT AUDITOR’S REPORTTO THE SHAREHOLDERS OF ANTON OILFIELD SERVICES GROUP (Continued)(incorporated in the Cayman Islands with limited liability)
KEY AUDIT MATTERS
Key audit matters are those matters that, in our professional judgment, were of most significance in our audit of the consolidated financial statements of the current period. These matters were addressed in the context of our audit of the consolidated financial statements as a whole, and in forming our opinion thereon, and we do not provide a separate opinion on these matters.
Key audit matter How our audit addressed the key audit matter
Revenue recognition from provision of services
We identified revenue recognition from provision of services as a key audit matter due to the significance of revenue generated from provision of services and the inherent risk of manipulating revenue recognition from provision of services by the management.
As disclosed in Note 23, the Group has different revenue streams and is mainly engaged in provision of services through contracts with its customers. Revenue from provision of services amounting to RMB2,636,561,000 for the year ended 31 December 2018 accounted for 89.8% of the Group's total revenue in the consolidated statement of profit or loss.
Revenue performance from provision of services is a key performance indicator of the Group which affects the management's reward and also is a focus of investors.
Details of revenue recognition from provision of services and its accounting policies are set out in Note 23 and Note 3, respectively, to the consolidated financial statements.
Our procedures in relation to revenue recognition from provision of services included:
• understanding and evaluating the key internal controls relevant to the audit on revenue recognition from provision of services;
• examining, on a sample basis, the key terms set out in the Group’s contracts with its customers governing the performance obligations and the associated revenue recognition;
• obtaining confirmations for the services provided to the selected major customers; and
• inspecting, on a sample basis, the customer acceptance documents, the contracts and invoices evidencing that the performance obligations of services were satisfied and control was transferred.

Independent Auditor’s Report
74 Anton Oilfield Services Group Annual Report 2018
INDEPENDENT AUDITOR’S REPORTTO THE SHAREHOLDERS OF ANTON OILFIELD SERVICES GROUP (Continued)(incorporated in the Cayman Islands with limited liability)
OTHER INFORMATION
The directors of the Company are responsible for the other information. The other information comprises the information included in the annual report, but does not include the consolidated financial statements and our auditor’s report thereon.
Our opinion on the consolidated financial statements does not cover the other information and we do not express any form of assurance conclusion thereon.
In connection with our audit of the consolidated financial statements, our responsibility is to read the other information and, in doing so, consider whether the other information is materially inconsistent with the consolidated financial statements or our knowledge obtained in the audit or otherwise appears to be materially misstated. If, based on the work we have performed, we conclude that there is a material misstatement of this other information, we are required to report that fact. We have nothing to report in this regard.
RESPONSIBILITIES OF DIRECTORS AND THOSE CHARGED WITH GOVERNANCE FOR THE CONSOLIDATED FINANCIAL STATEMENTS
The directors of the Company are responsible for the preparation of the consolidated financial statements that give a true and fair view in accordance with IFRSs issued by the IASB and the disclosure requirements of the Hong Kong Companies Ordinance, and for such internal control as the directors determine is necessary to enable the preparation of consolidated financial statements that are free from material misstatement, whether due to fraud or error.
In preparing the consolidated financial statements, the directors are responsible for assessing the Group’s ability to continue as a going concern, disclosing, as applicable, matters related to going concern and using the going concern basis of accounting unless the directors either intend to liquidate the Group or to cease operations, or have no realistic alternative but to do so.
Those charged with governance are responsible for overseeing the Group’s financial reporting process.
Independent Auditor’s Report
75Anton Oilfield Services Group Annual Report 2018
INDEPENDENT AUDITOR’S REPORTTO THE SHAREHOLDERS OF ANTON OILFIELD SERVICES GROUP (Continued)(incorporated in the Cayman Islands with limited liability)
AUDITOR’S RESPONSIBILITIES FOR THE AUDIT OF THE CONSOLIDATED FINANCIAL STATEMENTS
Our objectives are to obtain reasonable assurance about whether the consolidated financial statements as a whole are free from material misstatement, whether due to fraud or error, and to issue an auditor’s report that includes our opinion solely to you, as a body, in accordance with our agreed terms of engagement, and for no other purpose. We do not assume responsibility towards or accept liability to any other person for the contents of this report. Reasonable assurance is a high level of assurance, but is not a guarantee that an audit conducted in accordance with ISAs will always detect a material misstatement when it exists. Misstatements can arise from fraud or error and are considered material if, individually or in the aggregate, they could reasonably be expected to influence the economic decisions of users taken on the basis of these consolidated financial statements.
As part of an audit in accordance with ISAs, we exercise professional judgment and maintain professional skepticism throughout the audit. We also:
‧ Identify and assess the risks of material misstatement of the consolidated financial statements, whether due to fraud or error, design and perform audit procedures responsive to those risks, and obtain audit evidence that is sufficient and appropriate to provide a basis for our opinion. The risk of not detecting a material misstatement resulting from fraud is higher than for one resulting from error, as fraud may involve collusion, forgery, intentional omissions, misrepresentations, or the override of internal control.
‧ Obtain an understanding of internal control relevant to the audit in order to design audit procedures that are appropriate in the circumstances, but not for the purpose of expressing an opinion on the effectiveness of the Group’s internal control.
‧ Evaluate the appropriateness of accounting policies used and the reasonableness of accounting estimates and related disclosures made by the directors.
‧ Conclude on the appropriateness of the directors’ use of the going concern basis of accounting and, based on the audit evidence obtained, whether a material uncertainty exists related to events or conditions that may cast significant doubt on the Group’s ability to continue as a going concern. If we conclude that a material uncertainty exists, we are required to draw attention in our auditor’s report to the related disclosures in the consolidated financial statements or, if such disclosures are inadequate, to modify our opinion. Our conclusions are based on the audit evidence obtained up to the date of our auditor’s report. However, future events or conditions may cause the Group to cease to continue as a going concern.
‧ Evaluate the overall presentation, structure and content of the consolidated financial statements, including the disclosures, and whether the consolidated financial statements represent the underlying transactions and events in a manner that achieves fair presentation.
‧ Obtain sufficient appropriate audit evidence regarding the financial information of the entities or business activities within the Group to express an opinion on the consolidated financial statements. We are responsible for the direction, supervision and performance of the group audit. We remain solely responsible for our audit opinion.

Independent Auditor’s Report
76 Anton Oilfield Services Group Annual Report 2018
INDEPENDENT AUDITOR’S REPORTTO THE SHAREHOLDERS OF ANTON OILFIELD SERVICES GROUP (Continued)(incorporated in the Cayman Islands with limited liability)
AUDITOR’S RESPONSIBILITIES FOR THE AUDIT OF THE CONSOLIDATED FINANCIAL STATEMENTS (Continued)
We communicate with those charged with governance regarding, among other matters, the planned scope and timing of the audit and significant audit findings, including any significant deficiencies in internal control that we identify during our audit.
We also provide those charged with governance with a statement that we have complied with relevant ethical requirements regarding independence, and to communicate with them all relationships and other matters that may reasonably be thought to bear on our independence, and where applicable, related safeguards.
From the matters communicated with those charged with governance, we determine those matters that were of most significance in the audit of the consolidated financial statements of the current period and are therefore the key audit matters. We describe these matters in our auditor’s report unless law or regulation precludes public disclosure about the matter or when, in extremely rare circumstances, we determine that a matter should not be communicated in our report because the adverse consequences of doing so would reasonably be expected to outweigh the public interest benefits of such communication.
The engagement partner on the audit resulting in the independent auditor’s report is Yam Siu Man.
Deloitte Touche TohmatsuCertified Public AccountantsHong Kong22 March 2019

CONSOLIDATED STATEMENT OF FINANCIAL POSITIONAs at 31 December 2018
(Amounts expressed in thousands of Renminbi (“RMB”), unless otherwise stated)
77Anton Oilfield Services Group Annual Report 2018
As at 31 DecemberNotes 2018 2017
ASSETSNon-current assetsProperty, plant and equipment 6 2,255,805 2,331,571Prepaid lease payments 7 75,635 77,567Goodwill 8 242,004 242,004Intangible assets 9 252,714 224,285Interest in a joint venture 10 3,046 2,691Prepayments and other receivables 14 112,810 121,063Other non-current assets 11 8,375 304,844Deferred income tax assets 22 52,076 63,743
3,002,465 3,367,768 Current assetsInventories 12 774,359 597,233Prepaid lease payments 7 1,932 1,932Trade and notes receivables 13 1,948,030 1,760,358Contract assets 23(ii) (a) 58,579 —Prepayments and other receivables 14 437,958 467,029Current portion of other non-current assets 11 5,694 4,923Restricted bank deposits 15 330,948 415,135Cash and cash equivalents 15 686,636 1,133,097
4,244,136 4,379,707 Total assets 7,246,601 7,747,475

Consolidated Statement of Financial Position (Continued)As at 31 December 2018(Amounts expressed in thousands of RMB, unless otherwise stated)
78 Anton Oilfield Services Group Annual Report 2018
As at 31 DecemberNotes 2018 2017
EQUITYCapital and reserves attributable to the owners of the CompanyShare capital 16 275,959 246,271Reserves 17 2,369,915 2,311,768
2,645,874 2,558,039Non-controlling interests 48,688 388,953 Total equity 2,694,562 2,946,992 LIABILITIESNon-current liabilitiesLong-term bonds 18 2,051,403 1,885,824Long-term borrowings 19 243,341 36,217Deferred income tax liabilities 22 10,440 10,661
2,305,184 1,932,702 Current liabilitiesShort-term borrowings 19 879,192 880,320Current portion of long-term bonds 18 14,498 461,588Current portion of long-term borrowings 19 82,214 141,105Trade and notes payables 20 714,091 685,147Accruals and other payables 21 455,278 658,224Contract liabilities 38,814 —Current income tax liabilities 62,768 41,397
2,246,855 2,867,781 Total liabilities 4,552,039 4,800,483 Total equity and liabilities 7,246,601 7,747,475
The consolidated financial statements on pages 77 to 168 were approved and authorised for issue by the Board of Directors on 22 March 2019 and were signed on its behalf by:
Chairman Executive Director
Luo Lin Pi Zhifeng
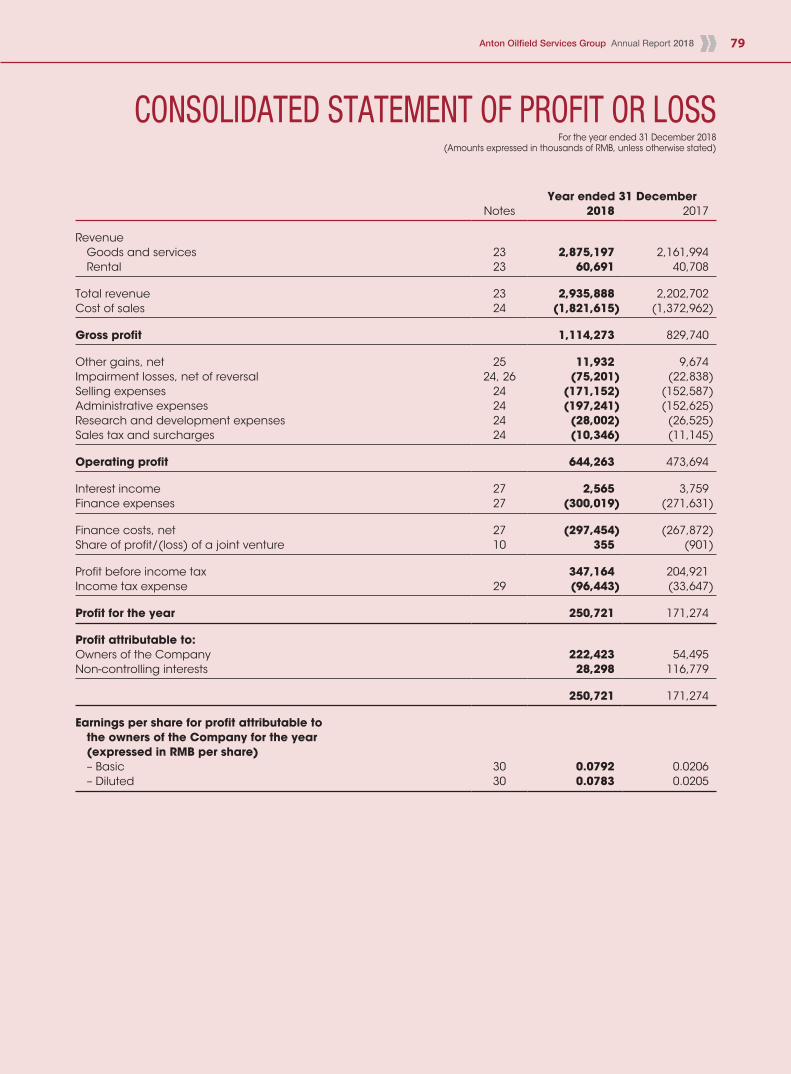
CONSOLIDATED STATEMENT OF PROFIT OR LOSSFor the year ended 31 December 2018
(Amounts expressed in thousands of RMB, unless otherwise stated)
79Anton Oilfield Services Group Annual Report 2018
Year ended 31 DecemberNotes 2018 2017
Revenue Goods and services 23 2,875,197 2,161,994 Rental 23 60,691 40,708 Total revenue 23 2,935,888 2,202,702Cost of sales 24 (1,821,615) (1,372,962) Gross profit 1,114,273 829,740 Other gains, net 25 11,932 9,674Impairment losses, net of reversal 24, 26 (75,201) (22,838)Selling expenses 24 (171,152) (152,587)Administrative expenses 24 (197,241) (152,625)Research and development expenses 24 (28,002) (26,525)Sales tax and surcharges 24 (10,346) (11,145) Operating profit 644,263 473,694 Interest income 27 2,565 3,759Finance expenses 27 (300,019) (271,631) Finance costs, net 27 (297,454) (267,872)Share of profit/(loss) of a joint venture 10 355 (901) Profit before income tax 347,164 204,921Income tax expense 29 (96,443) (33,647) Profit for the year 250,721 171,274 Profit attributable to:Owners of the Company 222,423 54,495Non-controlling interests 28,298 116,779
250,721 171,274 Earnings per share for profit attributable to the owners of the Company for the year (expressed in RMB per share) – Basic 30 0.0792 0.0206 – Diluted 30 0.0783 0.0205
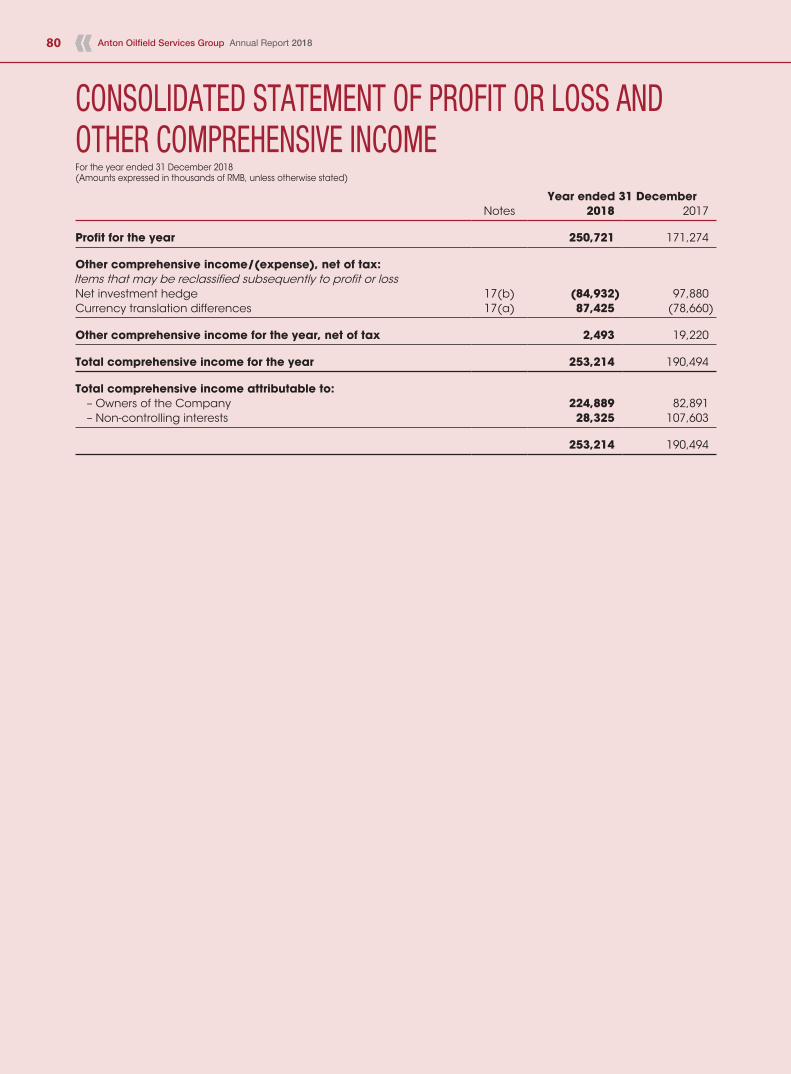
CONSOLIDATED STATEMENT OF PROFIT OR LOSS AND OTHER COMPREHENSIVE INCOMEFor the year ended 31 December 2018(Amounts expressed in thousands of RMB, unless otherwise stated)
80 Anton Oilfield Services Group Annual Report 2018
Year ended 31 DecemberNotes 2018 2017
Profit for the year 250,721 171,274 Other comprehensive income/(expense), net of tax:Items that may be reclassified subsequently to profit or lossNet investment hedge 17(b) (84,932) 97,880Currency translation differences 17(a) 87,425 (78,660) Other comprehensive income for the year, net of tax 2,493 19,220 Total comprehensive income for the year 253,214 190,494 Total comprehensive income attributable to: – Owners of the Company 224,889 82,891 – Non-controlling interests 28,325 107,603
253,214 190,494
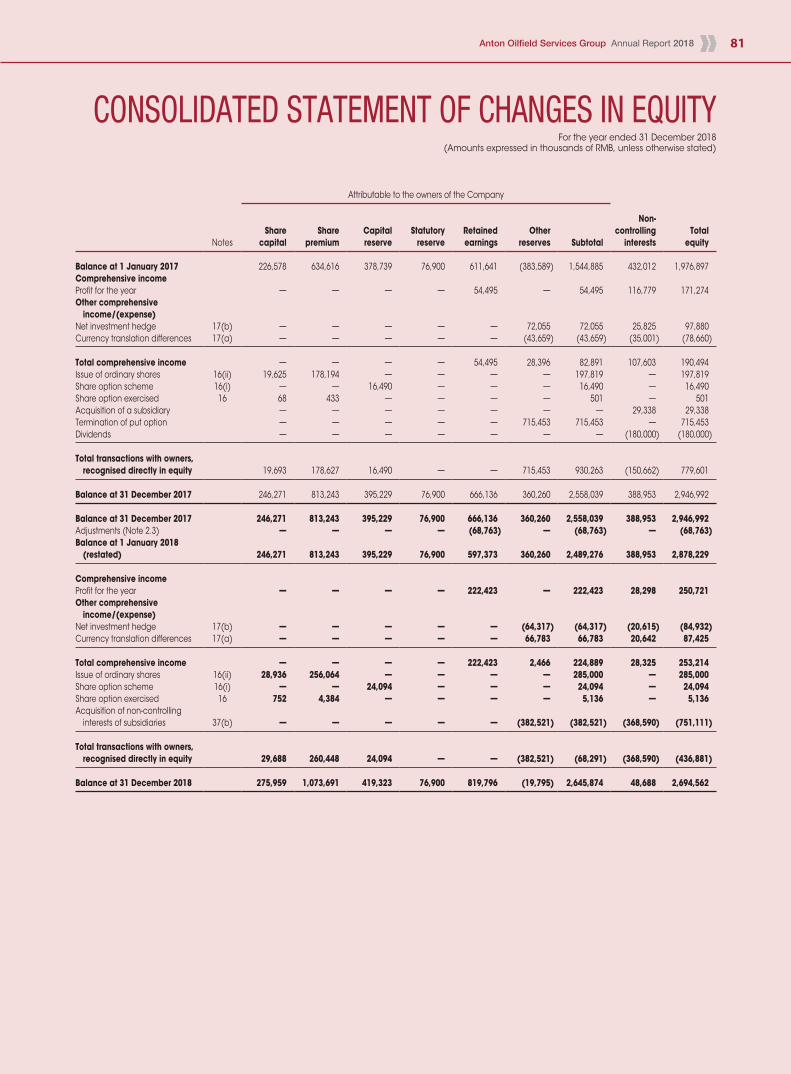
81Anton Oilfield Services Group Annual Report 2018
CONSOLIDATED STATEMENT OF CHANGES IN EQUITYFor the year ended 31 December 2018
(Amounts expressed in thousands of RMB, unless otherwise stated)
Attributable to the owners of the Company
NotesShare
capitalShare
premiumCapitalreserve
Statutoryreserve
Retainedearnings
Otherreserves Subtotal
Non-controlling
interestsTotal
equity
Balance at 1 January 2017 226,578 634,616 378,739 76,900 611,641 (383,589) 1,544,885 432,012 1,976,897Comprehensive incomeProfit for the year — — — — 54,495 — 54,495 116,779 171,274Other comprehensive income/(expense)Net investment hedge 17(b) — — — — — 72,055 72,055 25,825 97,880Currency translation differences 17(a) — — — — — (43,659) (43,659) (35,001) (78,660) Total comprehensive income — — — — 54,495 28,396 82,891 107,603 190,494Issue of ordinary shares 16(ii) 19,625 178,194 — — — — 197,819 — 197,819Share option scheme 16(i) — — 16,490 — — — 16,490 — 16,490Share option exercised 16 68 433 — — — — 501 — 501Acquisition of a subsidiary — — — — — — — 29,338 29,338Termination of put option — — — — — 715,453 715,453 — 715,453Dividends — — — — — — — (180,000) (180,000) Total transactions with owners, recognised directly in equity 19,693 178,627 16,490 — — 715,453 930,263 (150,662) 779,601 Balance at 31 December 2017 246,271 813,243 395,229 76,900 666,136 360,260 2,558,039 388,953 2,946,992 Balance at 31 December 2017 246,271 813,243 395,229 76,900 666,136 360,260 2,558,039 388,953 2,946,992Adjustments (Note 2.3) — — — — (68,763) — (68,763) — (68,763)Balance at 1 January 2018 (restated) 246,271 813,243 395,229 76,900 597,373 360,260 2,489,276 388,953 2,878,229 Comprehensive incomeProfit for the year — — — — 222,423 — 222,423 28,298 250,721Other comprehensive income/(expense)Net investment hedge 17(b) — — — — — (64,317) (64,317) (20,615) (84,932)Currency translation differences 17(a) — — — — — 66,783 66,783 20,642 87,425 Total comprehensive income — — — — 222,423 2,466 224,889 28,325 253,214Issue of ordinary shares 16(ii) 28,936 256,064 — — — — 285,000 — 285,000Share option scheme 16(i) — — 24,094 — — — 24,094 — 24,094Share option exercised 16 752 4,384 — — — — 5,136 — 5,136Acquisition of non-controlling interests of subsidiaries 37(b) — — — — — (382,521) (382,521) (368,590) (751,111) Total transactions with owners, recognised directly in equity 29,688 260,448 24,094 — — (382,521) (68,291) (368,590) (436,881) Balance at 31 December 2018 275,959 1,073,691 419,323 76,900 819,796 (19,795) 2,645,874 48,688 2,694,562

82 Anton Oilfield Services Group Annual Report 2018
CONSOLIDATED STATEMENT OF CASH FLOWSFor the year ended 31 December 2018(Amounts expressed in thousands of RMB, unless otherwise stated)
Year ended 31 DecemberNotes 2018 2017
Cash flows from operating activitiesNet cash inflows from operations 32 481,069 240,242Interest received 27 2,565 3,759Income tax paid (63,626) (48,391) Net cash generated from operating activities 420,008 195,610 Cash flows from investing activitiesPurchase of property, plant and equipment (36,005) (313,575)Proceeds from disposal of property, plant and equipment 968 7,361Purchase of intangible assets (63,159) (66,274)Net cash paid for acquisition of a subsidiary — (38,033)Decrease in term deposits — 11,011 Net cash used in investing activities (98,196) (399,510) Cash flows from financing activitiesProceeds from short-term borrowings 1,505,850 1,108,522Repayments of short-term borrowings (1,509,571) (967,844)Proceeds from long-term borrowings 357,280 —Repayments of long-term borrowings (197,204) (65,656)Proceeds from long-term bonds — 779,252Repayments of long-term bonds (490,893) —Repurchase of long-term bonds — (24,775)Proceeds from disposal of interests in a subsidiary without loss of control — 343,000Net cash paid to non-controlling interests for additional interest in subsidiaries 37(b) (165,191) (300,000)Proceeds from share options exercised 16(i) 5,136 501Issue of shares 16(ii) — 197,819Interest paid (278,452) (177,946)Dividends distribution (a) — —Placement of restricted bank deposits — (30,000)Withdrawal of restricted bank deposits 30,000 —Cash paid relating to other financing activities (52,500) — Net cash (used in)/generated from financing activities (795,545) 862,873 Net (decrease)/increase in cash and cash equivalents (473,733) 658,973Cash and cash equivalents at beginning of the year 1,133,097 507,263Exchange gain/(loss) on cash and cash equivalents 27,272 (33,139) Cash and cash equivalents at end of the year 686,636 1,133,097
Note (a):
During the year, pursuant to the agreement signed between the Group and China Oil HBP Science & Technology Co., Ltd. (“China Oil HBP”), trade receivables due from China Oil HBP amounting to RMB136,042,000 has been collected through the exemption of the payment of dividend due to China Oil HBP amounting to RMB136,042,000. Such non-cash transaction has been excluded from the operating activities and financing activities of the consolidated statement of cash flows above.

NOTES TO THE CONSOLIDATED FINANCIAL STATEMENTSFor the year ended 31 December 2018
(Amounts expressed in thousands of RMB, unless otherwise stated)
83Anton Oilfield Services Group Annual Report 2018
1. GENERAL INFORMATION
Anton Oilfield Services Group (the “Company”) was incorporated in the Cayman Islands on 3 August 2007 as an exempted company with limited liability under the Companies Law of Cayman Islands. The address of its registered office is PO Box 309, Ugland House, Grand Cayman, KY1-1104, Cayman Islands.
The Company is an investment holding company. The Company and its subsidiaries (the “Group”) are mainly engaged in providing oilfield technology services, manufacturing and trading of related products in the People’s Republic of China (the “PRC”) and other overseas countries. The Company listed its shares on the Main Board of The Stock Exchange of Hong Kong Limited (the “Stock Exchange”) on 14 December 2007.
The directors of the Company (the “Directors”) regard Pro Development Holdings Corp., a company incorporated in British Virgin Islands, as the immediate and ultimate holding company of the Company, which is controlled by Mr. Luo Lin, the Company’s controlling shareholder.
The consolidated financial statements are presented in RMB, which is also the functional currency of the Company.
2. APPLICATION OF NEW AND AMENDMENTS TO INTERNATIONAL FINANCIAL REPORTING STANDARDS (“IFRSs”)
New and Amendments to IFRSs that are mandatorily effective for the current year
In the current year, the Group has applied the following new and amendments to IFRSs issued by the International Accounting Standards Board (“IASB”) that are mandatorily effective for an accounting period that begins on or after 1 January 2018.
IFRS 9 Financial InstrumentsIFRS 15 Revenue from Contracts with Customers and the related AmendmentsIFRIC-Int 22 Foreign Currency Transactions and Advance ConsiderationAmendments to IFRS 2 Classification and Measurement of Share-based Payment TransactionsAmendments to IFRS 4 Applying IFRS 9 Financial Instruments with IFRS 4 Insurance ContractsAmendments to IAS 28 As part of the Annual Improvements to IFRSs 2014-2016 CycleAmendments to IAS 40 Transfers of Investment Property
In addition, the Group has early applied Amendments to IFRS 9 Prepayment Features with Negative Compensation which will be mandatorily effective for the Group for the financial year beginning on 1 January 2019.
Except as described below, the application of the new and amendments to IFRSs in the current year has had no material impact on the Group’s financial performance and positions for the current and prior years and/or on the disclosures set out in these consolidated financial statements.

Notes to the Consolidated Financial StatementsFor the year ended 31 December 2018(Amounts expressed in thousands of RMB, unless otherwise stated)
84 Anton Oilfield Services Group Annual Report 2018
2. APPLICATION OF NEW AND AMENDMENTS TO INTERNATIONAL FINANCIAL REPORTING STANDARDS (“IFRSs”) (Continued)
New and Amendments to IFRSs that are mandatorily effective for the current year (Continued)
2.1 IFRS 15 Revenue from Contracts with Customers
The Group has applied IFRS 15 for the first time in the current year. IFRS 15 superseded IAS 18 Revenue, IAS 11 Construction Contracts and the related interpretations.
The Group has applied IFRS 15 retrospectively with the cumulative effect of initially applying this Standard recognised at the date of initial application, 1 January 2018. Any difference at the date of initial application is recognised in the opening retained earnings (or other components of equity, as appropriate) and comparative information has not been restated. Furthermore, in accordance with the transition provisions in IFRS 15, the Group has elected to apply the Standard retrospectively only to contracts that are not completed at 1 January 2018 and has used the practical expedient for all contract modifications that occurred before the date of initial application, the aggregate effect of all of the modifications was reflected at the date of initial application. Accordingly, certain comparative information may not be comparable as comparative information was prepared under IAS 18 Revenue and IAS 11 Construction Contracts and the related interpretations.
The Group recognises revenue from the following major sources which arise from contracts with customers:
‧ Provision of oilfield technology services (excluding operation and maintenance services)
‧ Provision of oilfield-related operation and maintenance services
‧ Sales of oilfield-related goods
Information about the Group’s performance obligations and the accounting policies resulting from application of IFRS 15 are disclosed in Note 23(ii) and Note 3 respectively.
Summary of effects arising from initial application of IFRS 15
There is no material impact of transition to IFRS 15 on retained earnings at 1 January 2018.
The following adjustments were made to the amounts recognised in the consolidated statement of financial position at 1 January 2018. Line items that were not affected by the changes have not been included.

Notes to the Consolidated Financial StatementsFor the year ended 31 December 2018
(Amounts expressed in thousands of RMB, unless otherwise stated)
85Anton Oilfield Services Group Annual Report 2018
2. APPLICATION OF NEW AND AMENDMENTS TO INTERNATIONAL FINANCIAL REPORTING STANDARDS (“IFRSs”) (Continued)
New and Amendments to IFRSs that are mandatorily effective for the current year (Continued)
2.1 IFRS 15 Revenue from Contracts with Customers (Continued)
Summary of effects arising from initial application of IFRS 15 (Continued)
Carrying Carryingamounts amounts
previously underreported at 31 IFRS 15 at
December 1 JanuaryNotes 2017 Reclassification Remeasurement 2018*
Current AssetsTrade and notes receivables (a) 1,760,358 (27,513) — 1,732,845Contract assets (a) — 27,513 — 27,513
Current LiabilitiesContract liabilities (b) — 20,146 — 20,146Accruals and other payables (b) 658,224 (20,146) — 638,078
* The amounts in this column are before the adjustments from the application of IFRS 9.
Notes:
(a) At the date of initial application of IFRS 15 on 1 January 2018, retention money receivables of RMB27,513,000 arising from the services contracts are conditional on the Group’s achieving specified milestones as stipulated in the service contracts, and hence such balance was reclassified from trade and notes receivables to contract assets.
(b) At the date of initial application of IFRS 15 on 1 January 2018, advance from customers of RMB20,146,000 in respect of the services and sales of goods contracts previously included in accruals and other payables were reclassified to contract liabilities.

Notes to the Consolidated Financial StatementsFor the year ended 31 December 2018(Amounts expressed in thousands of RMB, unless otherwise stated)
86 Anton Oilfield Services Group Annual Report 2018
2. APPLICATION OF NEW AND AMENDMENTS TO INTERNATIONAL FINANCIAL REPORTING STANDARDS (“IFRSs”) (Continued)
New and Amendments to IFRSs that are mandatorily effective for the current year (Continued)
2.1 IFRS 15 Revenue from Contracts with Customers (Continued)
Summary of effects arising from initial application of IFRS 15 (Continued)
The following table summarises the impacts of applying IFRS 15 on the Group’s consolidated statement of financial position as at 31 December 2018 for each of the line items affected. Line items that were not affected by the changes have not been included.
Impact on the consolidated statement of financial position
Amounts without
application As reported Adjustments of IFRS 15
Current AssetsTrade and notes receivables 1,948,030 58,579 2,006,609Contract assets 58,579 (58,579) —
Current LiabilitiesContract liabilities 38,814 (38,814) —Accruals and other payables 455,278 38,814 494,092
Impact on the consolidated statement of cash flows
Amounts without
application As reported Adjustments of IFRS 15
Operating ActivitiesTrade and notes receivables (345,468) (58,579) (404,047)Contract assets (58,579) 58,579 —Accruals and other payables 4,666 38,814 43,480Contract liabilities 38,814 (38,814) —
Net cash inflows from operations 481,069 — 481,069
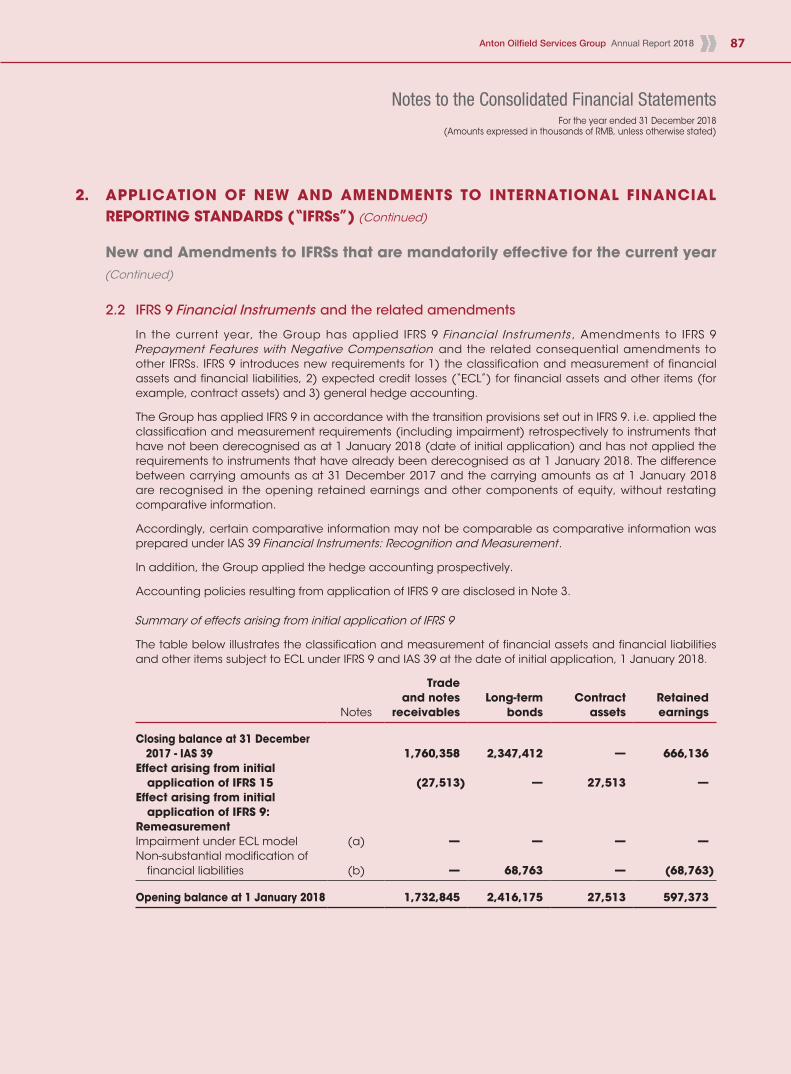
Notes to the Consolidated Financial StatementsFor the year ended 31 December 2018
(Amounts expressed in thousands of RMB, unless otherwise stated)
87Anton Oilfield Services Group Annual Report 2018
2. APPLICATION OF NEW AND AMENDMENTS TO INTERNATIONAL FINANCIAL REPORTING STANDARDS (“IFRSs”) (Continued)
New and Amendments to IFRSs that are mandatorily effective for the current year (Continued)
2.2 IFRS 9 Financial Instruments and the related amendments
In the current year, the Group has applied IFRS 9 Financial Instruments , Amendments to IFRS 9 Prepayment Features with Negative Compensation and the related consequential amendments to other IFRSs. IFRS 9 introduces new requirements for 1) the classification and measurement of financial assets and financial liabilities, 2) expected credit losses (“ECL”) for financial assets and other items (for example, contract assets) and 3) general hedge accounting.
The Group has applied IFRS 9 in accordance with the transition provisions set out in IFRS 9. i.e. applied the classification and measurement requirements (including impairment) retrospectively to instruments that have not been derecognised as at 1 January 2018 (date of initial application) and has not applied the requirements to instruments that have already been derecognised as at 1 January 2018. The difference between carrying amounts as at 31 December 2017 and the carrying amounts as at 1 January 2018 are recognised in the opening retained earnings and other components of equity, without restating comparative information.
Accordingly, certain comparative information may not be comparable as comparative information was prepared under IAS 39 Financial Instruments: Recognition and Measurement.
In addition, the Group applied the hedge accounting prospectively.
Accounting policies resulting from application of IFRS 9 are disclosed in Note 3.
Summary of effects arising from initial application of IFRS 9
The table below illustrates the classification and measurement of financial assets and financial liabilities and other items subject to ECL under IFRS 9 and IAS 39 at the date of initial application, 1 January 2018.
Tradeand notes Long-term Contract Retained
Notes receivables bonds assets earnings
Closing balance at 31 December 2017 - IAS 39 1,760,358 2,347,412 — 666,136Effect arising from initial application of IFRS 15 (27,513) — 27,513 —Effect arising from initial application of IFRS 9:RemeasurementImpairment under ECL model (a) — — — —Non-substantial modification of financial liabilities (b) — 68,763 — (68,763) Opening balance at 1 January 2018 1,732,845 2,416,175 27,513 597,373

Notes to the Consolidated Financial StatementsFor the year ended 31 December 2018(Amounts expressed in thousands of RMB, unless otherwise stated)
88 Anton Oilfield Services Group Annual Report 2018
2. APPLICATION OF NEW AND AMENDMENTS TO INTERNATIONAL FINANCIAL REPORTING STANDARDS (“IFRSs”) (Continued)
New and Amendments to IFRSs that are mandatorily effective for the current year (Continued)
2.2 IFRS 9 Financial Instruments and the related amendments (Continued)
Summary of effects arising from initial application of IFRS 9 (Continued)
Notes:
(a) Impairment under ECL model
The Group applies the IFRS 9 simplified approach to measure ECL which uses a lifetime ECL for all contract assets and trade receivables. Except for those which had been determined as credit impaired under IAS 39, contract assets and trade receivables from large multinational and state-owned oil companies have been assessed individually with significant balances, the remaining balances from private and relatively small customers are grouped based on past due analysis. The contract assets relate to retention money receivables have substantially the same risk characteristics as the trade receivables for the same types of contracts. The Group has therefore estimated the expected loss rates for the trade receivables and the contract assets on the same basis.
Except for those which had been determined as credit impaired under IAS 39, ECL for other financial assets at amortised cost, including notes receivable, other receivables, restricted bank deposits and cash and cash equivalents, are assessed on 12-month ECL basis as there had been no significant increase in credit risk since initial recognition.
As at 1 January 2018, the additional credit loss allowance and the related deferred income tax asset should have been recognised and the additional loss allowance is charged against the respective asset. However, the Directors consider the above impacts of applying IFRS 9 on the Group’s loss allowance and the related deferred income tax asset as at 1 January 2018 are immaterial and hence, no corresponding adjustments to loss allowance and the related deferred income tax asset were recognised against retained earnings at 1 January 2018.
(b) Non-substantial modification of financial liabilities
Under IAS 39, the Group revised the effective interest rates for non-substantial modification of long-term bonds (Note 18) with no gain or loss being recognised in profit or loss. At the date of initial application, the carrying amounts of long-term bonds previously modified were adjusted upward by RMB68,763,000 to reflect the change in accounting policies as stated in Note 3, with corresponding adjustments debited to the retained earnings as at 1 January 2018.
(c) Hedge accounting
The Group applies the hedge accounting requirements of IFRS 9 prospectively. At the date of the initial application, hedging relationships that qualified for hedge accounting in accordance with IAS 39 are regarded as continuing hedging relationship if all qualifying criteria under IFRS 9 are met, after taking into account any rebalancing of the hedging relationship on transition. As such, the application of the hedge accounting requirements of IFRS 9 had not resulted in adjustments to comparative figures.
Except as described above, the application of other amendments to IFRSs in the current year has had no material effect on the amounts reported and/or disclosures set out in these consolidated financial statements.

Notes to the Consolidated Financial StatementsFor the year ended 31 December 2018
(Amounts expressed in thousands of RMB, unless otherwise stated)
89Anton Oilfield Services Group Annual Report 2018
2. APPLICATION OF NEW AND AMENDMENTS TO INTERNATIONAL FINANCIAL REPORTING STANDARDS (“IFRSs”) (Continued)
New and Amendments to IFRSs that are mandatorily effective for the current year (Continued)
2.3 Impacts on opening consolidated statement of financial position arising from the
application of all new standards, amendments and interpretation
As a result of the changes in the entity’s accounting policies above, the opening consolidated statement of financial position had to be restated. The following table shows the adjustments recognised for each of the line items affected. Line items that were not affected by the changes have not been included.
31 December 1 January2017 2018
(Audited) IFRS 15 IFRS 9 (Restated)
Current AssetsTrade and notes receivables 1,760,358 (27,513) — 1,732,845Contract assets — 27,513 — 27,513
EquityReserves 2,311,768 — (68,763) 2,243,005
Current LiabilitiesCurrent portion of long-term bonds 461,588 — — 461,588Contract liabilities — 20,146 — 20,146Accruals and other payables 658,224 (20,146) — 638,078
Non-current LiabilitiesLong-term bonds 1,885,824 — 68,763 1,954,587

Notes to the Consolidated Financial StatementsFor the year ended 31 December 2018(Amounts expressed in thousands of RMB, unless otherwise stated)
90 Anton Oilfield Services Group Annual Report 2018
2. APPLICATION OF NEW AND AMENDMENTS TO INTERNATIONAL FINANCIAL REPORTING STANDARDS (“IFRSs”) (Continued)
New and amendments to IFRSs in issue but not yet effective
The Group has not early applied the following new and amendments to IFRSs that have been issued but are not yet effective:
IFRS 16 Leases1
IFRS 17 Insurance Contracts4
IFRIC-Int 23 Uncertainty over Income Tax Treatments1
Amendments to IFRS 3 Definition of a Business3
Amendments to IFRS 10 and IAS 28 Sale or Contribution of Assets between an Investor and its Associate or Joint Venture5
Amendments to IAS 1 and IAS 8 Definition of Material2
Amendments to IAS 19 Plan Amendment, Curtailment or Settlement1
Amendments to IAS 28 Long-term Interests in Associates and Joint Ventures1
Amendments to IFRSs Annual Improvements to IFRSs 2015-2017 Cycle1
1 Effective for annual periods beginning on or after 1 January 2019
2 Effective for annual periods beginning on or after 1 January 2020
3 Effective for business combinations and asset acquisitions for which the acquisition date is on or after the beginning of the first annual period beginning on or after 1 January 2020
4 Effective for annual periods beginning on or after 1 January 2021
5 Effective for annual periods beginning on or after a date to be determined
Except for the new and amendments to IFRSs mentioned below, the Directors anticipate that the application of all other new and amendments to IFRSs will have no material impact on the consolidated financial statements in the foreseeable future.
IFRS 16 Leases
IFRS 16 introduces a comprehensive model for the identification of lease arrangements and accounting treatments for both lessors and lessees. IFRS 16 will supersede IAS 17 Leases and the related interpretations when it becomes effective.
IFRS 16 distinguishes lease and service contracts on the basis of whether an identified assets is controlled by a customer. In addition, IFRS 16 requires sales and leaseback transactions to be determined based on the requirements of IFRS 15 as to whether the transfer of the relevant asset should be accounted as a sale. IFRS 16 also includes requirements relating to subleases and lease modifications.
Distinctions of operating leases and finance leases are removed for lessee accounting, and is replaced by a model where a right-of-use asset and a corresponding liability have to be recognised for all leases by lessees, except for short-term leases and leases of low value assets.
Notes to the Consolidated Financial StatementsFor the year ended 31 December 2018
(Amounts expressed in thousands of RMB, unless otherwise stated)
91Anton Oilfield Services Group Annual Report 2018
2. APPLICATION OF NEW AND AMENDMENTS TO INTERNATIONAL FINANCIAL REPORTING STANDARDS (“IFRSs”) (Continued)
New and amendments to IFRSs in issue but not yet effective (Continued)
IFRS 16 Leases (Continued)
The right-of-use asset is initially measured at cost and subsequently measured at cost (subject to certain exceptions) less accumulated depreciation and impairment losses, adjusted for any remeasurement of the lease liability. The lease liability is initially measured at present value of the lease payments that are not paid at that date. Subsequently, the lease liability is adjusted for interest and lease payments, as well as the impact of lease modifications, amongst others. For the classification of cash flows, the Group currently presents upfront prepaid lease payments as investing cash flows in relation to leasehold lands for owned use while other operating lease payments are presented as operating cash flows. Upon application of IFRS 16, leases payments in relation to lease liability will be allocated to a principal and an interest portion which will be presented as financing cash flows by the Group, upfront prepaid lease payments will continue to be presented as investing or operating cash flows in accordance to the nature, as appropriate.
Under IAS 17, the Group has already recognised prepaid lease payments for leasehold lands where the Group is a lessee. The application of IFRS 16 may result in potential changes in classification of these assets depending on whether the Group presents right-of-use assets separately or within the same line item at which the corresponding underlying assets would be presented if they were owned.
Other than certain requirements which are also applicable to lessor, IFRS 16 substantially carries forward the lessor accounting requirements in IAS 17, and continues to require a lessor to classify a lease either as an operating lease or a finance lease.
Furthermore, extensive disclosures are required by IFRS 16.
As at 31 December 2018, the Group has non-cancellable operating lease commitment of RMB39,173,000 as disclosed in Note 34(b). A preliminary assessment indicates that these arrangements will meet the definition of a lease. Upon application of IFRS 16, the Group will recognise a right-of-use asset and a corresponding liability in respect of all these leases unless they qualify for low value or short-term leases.
The application of new requirements may result in changes in measurement, presentation and disclosure as indicated above. The Group intends to elect the practical expedient to apply IFRS 16 to contracts that were previously identified as leases applying IAS 17 and IFRIC-Int 4 Determining whether an Arrangement contains a Lease and not apply this standard to contracts that were not previously identified as containing a lease applying IAS17 and IFRIC-Int 4. Therefore, the Group will not reassess whether the contracts are, or contain a lease which already existed prior to the date of initial application. Furthermore, the Group intends to elect the modified retrospective approach for the application of IFRS 16 as lessee and will recognise the cumulative effect of initial application to opening retained earnings without restating comparative information.
Amendments to IAS 1 and IAS 8 Definition of Material
The amendments provide refinements to the definition of material by including additional guidance and explanations in making materiality judgements. The amendments also align the definition across all IFRSs and will be mandatorily effective for the Group’s annual period beginning on 1 January 2020. The application of the amendments is not expected to have significant impact on the financial position and performance of the Group but may affect the presentation and disclosures in the consolidated financial statements.
Notes to the Consolidated Financial StatementsFor the year ended 31 December 2018(Amounts expressed in thousands of RMB, unless otherwise stated)
92 Anton Oilfield Services Group Annual Report 2018
3. SIGNIFICANT ACCOUNTING POLICIES
Statement of compliance
The consolidated financial statements of the Group have been prepared in accordance with IFRSs issued by IASB. In addition, the consolidated financial statements include applicable disclosures required by the Rules Governing the Listing of Securities on The Stock Exchange of Hong Kong Limited (“Listing Rules”) and by the Hong Kong Companies Ordinance (“CO”).
Basis of preparation
The consolidated financial statements have been prepared on the historical cost basis at the end of each reporting period, as explained in the accounting policies set out below.
Historical cost is generally based on the fair value of the consideration given in exchange for goods and services.
Fair value is the price that would be received to sell an asset or paid to transfer a liability in an orderly transaction between market participants at the measurement date, regardless of whether that price is directly observable or estimated using another valuation technique. In estimating the fair value of an asset or a liability, the Group takes into account the characteristics of the asset or liability if market participants would take those characteristics into account when pricing the asset or liability at the measurement date. Fair value for measurement and/or disclosure purposes in these consolidated financial statements is determined on such a basis, except for share-based payment transactions that are within the scope of IFRS 2 Share-based Payment, leasing transactions that are within the scope of IAS 17 Leases, and measurements that have some similarities to fair value but are not fair value, such as net realisable value in IAS 2 Inventories, or value in use in IAS 36 Impairment of Assets.
In addition, for financial reporting purposes, fair value measurements are categorised into Level 1, 2 or 3 based on the degree to which the inputs to the fair value measurements are observable and the significance of the inputs to the fair value measurement in its entirety, which are described as follows:
– Level 1 inputs are quoted prices (unadjusted) in active markets for identical assets or liabilities that the entity can access at the measurement date;
– Level 2 inputs are inputs, other than quoted prices included within Level 1, that are observable for the asset or liability, either directly or indirectly; and
– Level 3 inputs are unobservable inputs for the asset or liability.
The principal accounting policies are set out below.
Notes to the Consolidated Financial StatementsFor the year ended 31 December 2018
(Amounts expressed in thousands of RMB, unless otherwise stated)
93Anton Oilfield Services Group Annual Report 2018
3. SIGNIFICANT ACCOUNTING POLICIES (Continued)
Basis of consolidation
A subsidiary is an entity over which the Group has control. The Group controls an entity when the Group has the power over the entity, is exposed to, or has rights to, variable returns from its involvement with the entity and has the ability to affect those returns through its power over the entity. Subsidiaries are consolidated from the date on which control is transferred to the Group. They are deconsolidated from the date that control ceases.
Profit or loss and each item of other comprehensive income are attributed to the owners of the Company and to the non-controlling interests. Total comprehensive income of subsidiaries is attributed to the owners of the Company and to the non-controlling interests even if this results in the non-controlling interests having a deficit balance.
Intra-Group transactions, balances and unrealised gains on transactions between Group companies are eliminated. Unrealised losses are also eliminated unless the transaction provides evidence of an impairment of the transferred asset. When necessary, amounts reported by subsidiaries have been adjusted to conform with the Group’s accounting policies.
Non-controlling interests in subsidiaries are presented separately from the Group’s equity therein, which represent present ownership interests entitling their holders to a proportionate share of net assets of the relevant subsidiaries upon liquidation.
Changes in the Group’s ownership interests in existing subsidiaries
Transactions with non-controlling interests that do not result in loss of control are accounted for as equity transactions - that is, as transactions with the owners in their capacity as owners. The difference between fair value of any consideration paid and the relevant share acquired of the carrying value of net assets of the subsidiary is recorded in equity. Gains or losses on disposals to non-controlling interests are also recorded in equity. The carrying amounts of the Group’s relevant components of equity and the non-controlling interests are adjusted to reflect the changes in their relative interests in the subsidiaries, including re-attribution of relevant reserves between the Group and non-controlling interests according to the Group’s and the non-controlling interests’ proportionate interests.
When the Group loses control of a subsidiary, the assets and liabilities of that subsidiary and non-controlling interest (if any) are derecognised. A gain or loss is recognised in profit or loss and is calculated as the difference between (i) the aggregate of the fair value of the consideration received and the fair value of any retained interest and (ii) the carrying amount of the assets (including goodwill), and liabilities of the subsidiary attributable to the owners of the Company. All amounts previously recognised in other comprehensive income in relation to that subsidiary are accounted for as if the Group had directly disposed of the related assets or liabilities of the subsidiary (i.e. reclassified to profit or loss or transferred to another category of equity as specified/permitted by applicable IFRSs). The fair value of any investment retained in the former subsidiary at the date when control is lost is regarded as the fair value on initial recognition for subsequent accounting under IFRS 9/IAS 39 or, when applicable, the cost on initial recognition of an investment in an associate or a joint venture.

Notes to the Consolidated Financial StatementsFor the year ended 31 December 2018(Amounts expressed in thousands of RMB, unless otherwise stated)
94 Anton Oilfield Services Group Annual Report 2018
3. SIGNIFICANT ACCOUNTING POLICIES (Continued)
Basis of consolidation (Continued)
Separate financial statements
Investments in subsidiaries are accounted for at cost less impairment. Cost also includes direct attributable costs of investment. The results of subsidiaries are accounted for by the Company on the basis of dividend and receivable.
Impairment testing of the investments in subsidiaries is required upon receiving dividends from these investments if the dividend exceeds the total comprehensive income of the subsidiary in the period the dividend is declared or if the carrying amount of the investment in the separate financial statements exceeds the carrying amount in the consolidated financial statements of the investee’s net assets including goodwill.
Business combinations
The Group applies the acquisition method to account for business combinations. The consideration transferred for the acquisition of a subsidiary is the fair values of the assets transferred, the liabilities incurred to the former owners of the acquiree and the equity interests issued by the Group. Identifiable assets acquired and liabilities assumed in a business combination are measured initially at their fair values at the acquisition date.
The Group recognises any non-controlling interest in the acquiree on an acquisition-by-acquisition basis, either at fair value or at the non-controlling interest’s proportionate share of the recognised amounts of acquiree’s identifiable net assets.
Acquisition-related costs are expensed as incurred.
The excess of the consideration transferred, the amount of any non-controlling interest in the acquiree and the acquisition-date fair value of any previous equity interest in the acquiree over the fair value of the identifiable net assets acquired is recorded as goodwill. If, after re-assessment, the total of consideration transferred, non-controlling interest recognised and previously held interest measured is less than the fair value of the net assets of the subsidiary acquired in the case of a bargain purchase, the difference is recognised directly in the consolidated statement of profit or loss.

Notes to the Consolidated Financial StatementsFor the year ended 31 December 2018
(Amounts expressed in thousands of RMB, unless otherwise stated)
95Anton Oilfield Services Group Annual Report 2018
3. SIGNIFICANT ACCOUNTING POLICIES (Continued)
Joint arrangements
The Group has applied IFRS 11 to all joint arrangements. Under IFRS 11 investments in joint arrangements are classified as either joint operations or joint ventures depending on the contractual rights and obligations of each investor. The Group has assessed the nature of its joint arrangements and determined them to be joint ventures. Joint ventures are accounted for using the equity method.
Under the equity method of accounting, interests in joint ventures are initially recognised at cost and adjusted thereafter to recognise the Group’s share of the post-acquisition profits or losses and movements in other comprehensive income. When the Group’s share of losses in a joint venture equals or exceeds its interests in the joint ventures (which includes any long-term interests that, in substance, form part of the Group’s net investment in the joint ventures), the Group does not recognise further losses, unless it has incurred obligations or made payments on behalf of the joint ventures.
Unrealised gains on transactions between the Group and its joint ventures are eliminated to the extent of the Group’s interest in the joint ventures. Unrealised losses are also eliminated unless the transaction provides evidence of an impairment of the asset transferred. Accounting policies of the joint ventures have been changed where necessary to ensure consistency with the policies adopted by the Group.
The Group assesses whether there is an objective evidence that the interest in a joint venture may be impaired. When any objective evidence exists, the entire carrying amount of the investment (including goodwill) is tested for impairment in accordance with IAS 36 as a single asset by comparing its recoverable amount (higher of value in use and fair value less costs of disposal) with its carrying amount. Any impairment loss recognised forms part of the carrying amount of the investment. Any reversal of that impairment loss is recognised in accordance with IAS 36 to the extent that the recoverable amount of the investment subsequently increases.
Segment reporting
Operating segments are reported in a manner consistent with the internal reporting provided to the chief operating decision-maker. The chief operating decision-maker, who is responsible for allocating resources and assessing performance of the operating segments, has been identified as the chief executive officer, executive vice presidents and directors who make strategic decisions.

Notes to the Consolidated Financial StatementsFor the year ended 31 December 2018(Amounts expressed in thousands of RMB, unless otherwise stated)
96 Anton Oilfield Services Group Annual Report 2018
3. SIGNIFICANT ACCOUNTING POLICIES (Continued)
Foreign currency translation
Functional and presentation currency
Items included in the financial statements of each of the Group’s entities are measured using the functional currency. The financial statements are presented in RMB, which is the Company’s functional currency.
Transactions and balances
Foreign currency transactions are translated into the functional currency using the exchange rates prevailing at the dates of the transactions or valuation where items are re-measured. Foreign exchange gains and losses resulting from the settlement of such transactions and from the translation at year-end exchange rates of monetary assets and liabilities denominated in foreign currencies are recognised in the consolidated statement of profit or loss, except when deferred in other comprehensive income as qualifying net investment hedge.
Group companies
The results and financial position of all the Group entities (none of which has the currency of a hyperinflationary economy) that have a functional currency different from the presentation currency are translated into the presentation currency as follows:
(i) assets and liabilities for each consolidated statement of financial position presented are translated at the closing rate at the end of the financial period;
(ii) income and expenses for each consolidated statement of profit or loss are translated at average exchange rates (unless this average is not a reasonable approximation of the cumulative effect of the rates prevailing on the transaction dates, in which case income and expenses are translated at the rate on the dates of the transactions); and
(iii) all resulting exchange differences are recognised in other comprehensive income.
Goodwill and fair value adjustments arising on the acquisition of a foreign entity are treated as assets and liabilities of the foreign entity and translated at the closing rate. Exchange differences arising are recognised in other comprehensive income.
Notes to the Consolidated Financial StatementsFor the year ended 31 December 2018
(Amounts expressed in thousands of RMB, unless otherwise stated)
97Anton Oilfield Services Group Annual Report 2018
3. SIGNIFICANT ACCOUNTING POLICIES (Continued)
Property, plant and equipment
Property, plant and equipment, other than construction in progress, are stated at historical cost less accumulated depreciation and impairment losses. Historical cost includes expenditure that is directly attributable to the acquisition of the items.
Construction-in-progress represents property, plant and equipment under construction and is stated at cost. This includes the costs of construction, machinery and other expenditures necessary for the purpose of preparing the construction-in-progress for its intended use and those borrowing costs incurred before the assets ready for intended use that are eligible for capitalisation. Construction-in-progress is not depreciated until such time as the relevant asset is completed and ready for its intended use.
Subsequent costs are included in the asset’s carrying amount or recognised as a separate asset, as appropriate, only when it is probable that future economic benefits associated with the item will flow to the Group and the cost of the item can be measured reliably. The carrying amount of the replaced part is derecognised. All other repairs and maintenance are charged to the statement of profit or loss during the financial period in which they are incurred.
Depreciation of property, plant and equipment is calculated using the straight-line method except for drill pipes are depreciated using unit-of-production method, to allocate their costs to their residual values over their estimated useful lives, as follows:
Estimated useful life
Buildings 5-50 yearsMachinery and equipment 5-10 yearsMotor vehicles 5-10 yearsFurniture, fixtures and others 5 years
The assets’ residual values and useful lives are reviewed, and adjusted if appropriate, at the end of the financial period.
An asset’s carrying amount is written down immediately to its recoverable amount if the asset’s carrying amount is greater than its estimated recoverable amount.
Gains and losses on disposals are determined by comparing the proceeds with the carrying amount and are recognised within “other gains, net”, in the consolidated statement of profit or loss.
Prepaid lease payments
Prepaid lease payments represent upfront prepayments made for the land use rights and leasehold land located in the PRC, which are classified as operating lease, and are expensed in the consolidated statement of profit or loss on a straight-line basis over the periods of the leases or when there is impairment, the impairment is expensed in the consolidated statement of profit or loss.

Notes to the Consolidated Financial StatementsFor the year ended 31 December 2018(Amounts expressed in thousands of RMB, unless otherwise stated)
98 Anton Oilfield Services Group Annual Report 2018
3. SIGNIFICANT ACCOUNTING POLICIES (Continued)
Goodwill
Goodwill arises on the acquisition of subsidiaries, and represents the excess of the consideration transferred over the Group’s interest in net fair value of the net identifiable assets, liabilities and contingent liabilities of the acquiree and the fair value of the non-controlling interest in the acquiree.
For the purpose of impairment testing, goodwill acquired in a business combination is allocated to each of the cash generating units (“CGUs”), or groups of CGUs, that is expected to benefit from the synergies of the combination. Each unit or group of units to which the goodwill is allocated represents the lowest level within the entity at which the goodwill is monitored for internal management purposes. Goodwill is monitored at the operating segment level.
Goodwill impairment reviews are undertaken annually or more frequently if events or changes in circumstances indicate a potential impairment. The carrying value of the CGU containing the goodwill is compared to the recoverable amount, which is the higher of value in use and the fair value less costs to sell. Any impairment is recognised immediately as an expense and is not subsequently reversed.
Intangible assets
Computer software
Computer software are capitalised on the basis of the costs incurred to acquire and bring to use the specific software. These costs are amortised over their estimated useful lives of 5 to 10 years.
Patents
Patents are initially recorded at actual cost incurred to acquire and amortised on a straight-line basis over their estimated useful lives, ranging from 3 to 10 years. Development costs that are directly attributable to the design, development and application of patents are recognised as intangible assets when the following criteria are met:
‧ It is technically feasible to complete the patents so that it will be available for use;
‧ Management intends to complete the patents and use or sell it;
‧ There is an ability to use or sell the patents;
‧ It can be demonstrated how the patents will generate probable future economic benefits;
‧ Adequate technical, financial and other resources to complete the development and to use or sell the patents are available; and
‧ The expenditure attributable to the patents during its development can be reliably measured.
Directly attributable costs that are capitalised as part of the patent include material costs, patent development employee costs and an appropriate portion of relevant overheads. Other development expenditures that do not meet these criteria are recognised as an expense as incurred. Development costs previously recognised as an expense are not recognised as an asset in a subsequent period.

Notes to the Consolidated Financial StatementsFor the year ended 31 December 2018
(Amounts expressed in thousands of RMB, unless otherwise stated)
99Anton Oilfield Services Group Annual Report 2018
3. SIGNIFICANT ACCOUNTING POLICIES (Continued)
Impairment on tangible and intangible assets other than goodwill
At the end of the reporting period, the Group reviews the carrying amounts of its tangible, intangible assets with finite useful lives to determine whether there is any indication that these assets have suffered an impairment loss. If any such indication exists, the recoverable amount of the relevant asset is estimated in order to determine the extent of the impairment loss (if any).
The recoverable amount of tangible and intangible assets are estimated individually, when it is not possible to estimate the recoverable amount individually, the Group estimates the recoverable amount of the CGU to which the asset belongs. When a reasonable and consistent basis of allocation can be identified, corporate assets are also allocated to individual CGUs, or otherwise they are allocated to the smallest group of CGUs for which a reasonable and consistent allocation basis can be identified.
Recoverable amount is the higher of fair value less costs of disposal and value in use. In assessing value in use, the estimated future cash flows are discounted to their present value using a pre-tax discount rate that reflects current market assessments of the time value of money and the risks specific to the asset (or a CGU) for which the estimates of future cash flows have not been adjusted.
If the recoverable amount of an asset (or a CGU) is estimated to be less than its carrying amount, the carrying amount of the asset (or a CGU) is reduced to its recoverable amount. In allocating the impairment loss, the impairment loss is allocated first to reduce the carrying amount of any goodwill (if applicable) and then to the other assets on a pro-rata basis based on the carrying amount of each asset in the unit. The carrying amount of an asset is not reduced below the highest of its fair value less costs of disposal (if measurable), its value in use (if determinable) and zero. The amount of the impairment loss that would otherwise have been allocated to the asset is allocated pro rata to the other assets of the unit. An impairment loss is recognised immediately in profit or loss.
Where an impairment loss subsequently reverses, the carrying amount of the asset (or a CGU) is increased to the revised estimate of its recoverable amount, but so that the increased carrying amount does not exceed the carrying amount that would have been determined had no impairment loss been recognised for the asset (or a CGU) in prior years. A reversal of an impairment loss is recognised immediately in profit or loss.
Financial instruments
Financial assets and financial liabilities are recognised when a group entity becomes a party to the contractual provisions of the instrument. All regular way purchases or sales of financial assets are recognised and derecognised on a trade date basis. Regular way purchases or sales are purchases or sales of financial assets that require delivery of assets within the time frame established by regulation or convention in the market place.
Financial assets and financial liabilities are initially measured at fair value except for trade receivables arising from contracts with customers which are initially measured in accordance with IFRS 15 since 1 January 2018. Transaction costs that are directly attributable to the acquisition or issue of financial assets and financial liabilities (other than financial assets or financial liabilities at fair value through profit or loss) are added to or deducted from the fair value of the financial assets or financial liabilities, as appropriate, on initial recognition. Transaction costs directly attributable to the acquisition of financial assets or financial liabilities at fair value through profit or loss are recognised immediately in profit or loss.

Notes to the Consolidated Financial StatementsFor the year ended 31 December 2018(Amounts expressed in thousands of RMB, unless otherwise stated)
100 Anton Oilfield Services Group Annual Report 2018
3. SIGNIFICANT ACCOUNTING POLICIES (Continued)
Financial instruments (Continued)
The effective interest method is a method of calculating the amortised cost of a financial asset or financial liability and of allocating interest income and interest expense over the relevant period. The effective interest rate is the rate that exactly discounts estimated future cash receipts and payments (including all fees and points paid or received that form an integral part of the effective interest rate, transaction costs and other premiums or discounts) through the expected life of the financial asset or financial liability, or, where appropriate, a shorter period, to the net carrying amount on initial recognition.
Financial assets
Classification and subsequent measurement of financial assets (upon application of IFRS 9 in accordance with transitions in Note 2)
Financial assets that meet the following conditions are subsequently measured at amortised cost:
‧ the financial asset is held within a business model whose objective is to collect contractual cash flows; and
‧ the contractual terms of the financial asset give rise on specified dates to cash flows that are solely payments of principal and interest on the principal amount outstanding.
(i) Amortised cost and interest income
Interest income is recognised using the effective interest method for financial assets measured subsequently at amortised cost. Interest income is calculated by applying the effective interest rate to the gross carrying amount of a financial asset, except for financial assets that have subsequently become credit-impaired (see below). For financial assets that have subsequently become credit-impaired, interest income is recognised by applying the effective interest rate to the amortised cost of the financial asset from the next reporting period. If the credit risk on the credit-impaired financial instrument improves so that the financial asset is no longer credit-impaired, interest income is recognised by applying the effective interest rate to the gross carrying amount of the financial asset from the beginning of the reporting period following the determination that the asset is no longer credit impaired.
Impairment of financial assets (upon application of IFRS 9 in accordance with transitions in Note 2)
The Group recognises a loss allowance for ECL on financial assets which are subject to impairment under IFRS 9 (including trade and notes receivables, contract assets, other receivables, restricted bank deposits and cash and cash equivalents). The amount of ECL is updated at each reporting date to reflect changes in credit risk since initial recognition.
Lifetime ECL represents the ECL that will result from all possible default events over the expected life of the relevant instrument. In contrast, 12-month ECL (“12m ECL”) represents the portion of lifetime ECL that is expected to result from default events that are possible within 12 months after the reporting date. Assessment are done based on the Group’s historical credit loss experience, adjusted for factors that are specific to the debtors, general economic conditions and an assessment of both the current conditions at the reporting date as well as the forecast of future conditions.
Notes to the Consolidated Financial StatementsFor the year ended 31 December 2018
(Amounts expressed in thousands of RMB, unless otherwise stated)
101Anton Oilfield Services Group Annual Report 2018
3. SIGNIFICANT ACCOUNTING POLICIES (Continued)
Financial instruments (Continued)
Financial assets (Continued)
Impairment of financial assets (upon application of IFRS 9 in accordance with transitions in Note 2) (Continued)
The Group always recognises lifetime ECL for trade receivables and contract assets. For trade receivables and contract assets with significant balances mainly from large multinational and state-owned oil companies, the ECL are assessed individually. For trade receivables and contract assets from private and relatively small customers, the ECL are assessed collectively using a provision matrix with appropriate groupings.
For all other instruments, the Group measures the loss allowance equal to 12m ECL, unless when there has been a significant increase in credit risk since initial recognition, the Group recognises lifetime ECL. The assessment of whether lifetime ECL should be recognised is based on significant increases in the likelihood or risk of a default occurring since initial recognition.
(i) Significant increase in credit risk
In assessing whether the credit risk has increased significantly since initial recognition, the Group compares the risk of a default occurring on the financial instrument as at the reporting date with the risk of a default occurring on the financial instrument as at the date of initial recognition. In making this assessment, the Group considers both quantitative and qualitative information that is reasonable and supportable, including historical experience and forward-looking information that is available without undue cost or effort.
In particular, the following information is taken into account when assessing whether credit risk has increased significantly:
‧ an actual or expected significant deterioration in the financial instrument’s external (if available) or internal credit rating;
‧ significant deterioration in external market indicators of credit risk, e.g. a significant increase in the credit spread, the credit default swap prices for the debtor;
‧ existing or forecast adverse changes in business, financial or economic conditions that are expected to cause a significant decrease in the debtor’s ability to meet its debt obligations;
‧ an actual or expected significant deterioration in the operating results of the debtor;
‧ an actual or expected significant adverse change in the regulatory, economic, or technological environment of the debtor that results in a significant decrease in the debtor’s ability to meet its debt obligations.

Notes to the Consolidated Financial StatementsFor the year ended 31 December 2018(Amounts expressed in thousands of RMB, unless otherwise stated)
102 Anton Oilfield Services Group Annual Report 2018
3. SIGNIFICANT ACCOUNTING POLICIES (Continued)
Financial instruments (Continued)
Financial assets (Continued)
Impairment of financial assets (upon application of IFRS 9 in accordance with transitions in Note 2) (Continued)
(i) Significant increase in credit risk (Continued)
Despite the aforegoing, the Group assumes that the credit risk on a debt instrument has not increased significantly since initial recognition if the debt instrument is determined to have low credit risk at the reporting date. A debt instrument is determined to have low credit risk if i) it has a low risk of default, ii) the borrower has a strong capacity to meet its contractual cash flow obligations in the near term and iii) adverse changes in economic and business conditions in the longer term may, but will not necessarily, reduce the ability of the borrower to fulfil its contractual cash flow obligations. The Group considers a debt instrument to have low credit risk when it has an internal or external credit rating of ‘investment grade’ as per globally understood definitions.
The Group regularly monitors the effectiveness of the criteria used to identify whether there has been a significant increase in credit risk and revises them as appropriate to ensure that the criteria are capable of identifying significant increase in credit risk before the amount becomes past due.
(ii) Definition of default
For internal credit risk management, the Group considers an event of default occurs when information developed internally or obtained from external sources indicates that the debtor is unlikely to pay its creditors, including the Group, in full (without taking into account any collaterals held by the Group).
(iii) Credit-impaired financial assets
A financial asset is credit-impaired when one or more events of default that have a detrimental impact on the estimated future cash flows of that financial asset have occurred. Evidence that a financial asset is credit-impaired includes observable data about the following events:
‧ significant financial difficulty of the issuer or the borrower;
‧ a breach of contract, such as a default or past due event;
‧ the lender(s) of the borrower, for economic or contractual reasons relating to the borrower’s financial difficulty, having granted to the borrower a concession(s) that the lender(s) would not otherwise;
‧ it is becoming probable that the borrower will enter bankruptcy or other financial reorganisation; or
‧ the disappearance of an active market for that financial asset because of financial difficulties.
Notes to the Consolidated Financial StatementsFor the year ended 31 December 2018
(Amounts expressed in thousands of RMB, unless otherwise stated)
103Anton Oilfield Services Group Annual Report 2018
3. SIGNIFICANT ACCOUNTING POLICIES (Continued)
Financial instruments (Continued)
Financial assets (Continued)
Impairment of financial assets (upon application of IFRS 9 in accordance with transitions in Note 2) (Continued)
(iv) Write-off policy
The Group writes off a financial asset when there is information indicating that the counterparty is in severe financial difficulty and there is no realistic prospect of recovery, for example, when the counterparty has been placed under liquidation or has entered into bankruptcy proceedings. Financial assets written off may still be subject to enforcement activities under the Group’s recovery procedures, taking into account legal advice where appropriate. A write-off constitutes a derecognition event. Any subsequent recoveries are recognised in profit or loss.
(v) Measurement and recognition of ECL
The measurement of ECL is a function of the probability of default, loss given default (i.e. the magnitude of the loss if there is a default) and the exposure at default. The assessment of the probability of default and loss given default is based on historical data adjusted by forward-looking information. Estimation of ECL reflects an unbiased and probability-weighted amount that is determined with the respective risks of default occurring as the weights.
Generally, the ECL is the difference between all contractual cash flows that are due to the Group in accordance with the contract and the cash flows that the Group expects to receive, discounted at the effective interest rate determined at initial recognition.
Where ECL is measured on a collective basis or cater for cases where evidence at the individual instrument level may not yet be available, the financial instruments are grouped on the following basis:
‧ Nature of financial instruments (i.e. the Group’s trade receivables from private and relatively small customers are assessed as a separate group. Other financial instruments are assessed for expected credit losses on an individual basis);
‧ Past-due status;
‧ Nature, size and industry of debtors; and
‧ External credit ratings where available.
The grouping is regularly reviewed by management to ensure the constituents of each group continue to share similar credit risk characteristics.
Interest income is calculated based on the gross carrying amount of the financial asset unless the financial asset is credit impaired, in which case interest income is calculated based on amortised cost of the financial asset.
The Group recognises an impairment gain or loss in profit or loss for all financial instruments by adjusting their carrying amount, with the exception of trade receivables, contract assets and other receivables where the corresponding adjustment is recognised through a loss allowance account.
Notes to the Consolidated Financial StatementsFor the year ended 31 December 2018(Amounts expressed in thousands of RMB, unless otherwise stated)
104 Anton Oilfield Services Group Annual Report 2018
3. SIGNIFICANT ACCOUNTING POLICIES (Continued)
Financial instruments (Continued)
Financial assets (Continued)
Classification and subsequent measurement of financial assets (before application of IFRS 9 on 1 January 2018)
The Group classifies its financial assets as financial assets at fair value through profit or loss, held-to-maturity investments, available-for-sale financial assets and loans and receivables. The classification depends on the purpose for which the financial assets were acquired. Management determines the classification of its financial assets at initial recognition. The Group’s financial assets are loans and receivables.
Loans and receivables are non-derivative financial assets with fixed or determinable payments that are not quoted in an active market. They are included in current assets, except for maturities greater than 12 months after the end of the reporting period which are classified as non-current assets. The Group’s loans and receivables comprise “restricted bank deposits”, “trade and notes receivables”, part of “prepayments and other receivables” and “cash and cash equivalents” in the consolidated statement of financial position.
The effective interest method is a method of calculating the amortised cost of a debt instrument and of allocating interest income over the relevant period. The effective interest rate is the rate that exactly discounts estimated future cash receipts (including all fees and points paid or received that form an integral part of the effective interest rate, transaction costs and other premiums or discounts) through the expected life of the debt instrument, or, where appropriate, a shorter period, to the net carrying amount on initial recognition.
Interest income is recognised on an effective interest basis for debt instruments.
Regular way purchases and sales of financial assets are recognised on the trade-date - the date on which the Group commits to purchase or sell the asset. Investments are initially recognised at fair value plus transaction costs for all financial assets not carried at fair value through profit or loss. Loans and receivables are subsequently carried at amortised cost using the effective interest method.
Impairment of financial assets (before application of IFRS 9 on 1 January 2018)
Assets carried at amortised cost:
The Group assesses at the end of each reporting period whether there is objective evidence that a financial asset or a group of financial assets is impaired. A financial asset or a group of financial assets is (are) impaired and impairment losses are incurred only if there is objective evidence of impairment as a result of one or more events that occurred after the initial recognition of the asset (a “loss event”) and that loss event (or events) has (have) an impact on the estimated future cash flows of the financial asset or a group of financial assets that can be reliably estimated.
Evidence of impairment may include indications that the debtors or a group of debtors is experiencing significant financial difficulty, default or delinquency in interest or principal payments, the probability that they will enter bankruptcy or other financial reorganisation, and where observable data indicate that there is a measurable decrease in the estimated future cash flows, such as changes in arrears or economic conditions that correlate with defaults.

Notes to the Consolidated Financial StatementsFor the year ended 31 December 2018
(Amounts expressed in thousands of RMB, unless otherwise stated)
105Anton Oilfield Services Group Annual Report 2018
3. SIGNIFICANT ACCOUNTING POLICIES (Continued)
Financial instruments (Continued)
Financial assets (Continued)
Impairment of financial assets (before application of IFRS 9 on 1 January 2018) (Continued)
For loans and receivables category, the amount of the loss is measured as the difference between the asset’s carrying amount and the present value of estimated future cash flows (excluding future credit losses that have not been incurred) discounted at the financial asset’s original effective interest rate. The carrying amount of the asset is reduced and the amount of the loss is recognised in the consolidated statement of profit or loss. If a loan has a variable interest rate, the discount rate for measuring any impairment loss is the current effective interest rate determined under the contract.
If, in a subsequent period, the amount of the impairment loss decreases and the decrease can be related objectively to an event occurring after the impairment was recognised (such as an improvement in the debtor’s credit rating), the reversal of the previously recognised impairment loss is recognised in the consolidated statement of profit or loss.
Derecognition of financial assets
The Group derecognises a financial asset only when the contractual rights to the cash flows from the asset expire, or when it transfers the financial asset and substantially all the risks and rewards of ownership of the asset to another entity. If the Group retains substantially all the risks and rewards of ownership of a transferred financial asset, the Group continues to recognise the financial asset and also recognises a collateralised borrowing for the proceeds received.
On derecognition of a financial asset, the difference between the asset’s carrying amount and the sum of the consideration received and receivable and the cumulative gain or loss that had been recognised in other comprehensive income and accumulated in equity is recognised in profit or loss.
Offsetting financial instruments
Financial assets and liabilities are offset and the net amount reported in the statement of financial position when there is a legally enforceable right to offset the recognised amounts and there is an intention to settle on a net basis or realise the asset and settle the liability simultaneously. The legally enforceable right must not be contingent on future events and must be enforceable in the normal course of business and in the event of default, insolvency or bankruptcy of the group entity or the counterparty.

Notes to the Consolidated Financial StatementsFor the year ended 31 December 2018(Amounts expressed in thousands of RMB, unless otherwise stated)
106 Anton Oilfield Services Group Annual Report 2018
3. SIGNIFICANT ACCOUNTING POLICIES (Continued)
Financial instruments (Continued)
Financial liabilities and equity
Classification as debt or equity
Debt and equity instruments issued by a group entity are classified as either financial liabilities or as equity in accordance with the substance of the contractual arrangements and the definitions of a financial liability and an equity instrument.
Financial liabilities at amortised cost
Financial liabilities including long-term borrowings, short-term borrowings, long-term bonds, trade and notes payables and part of accruals and other payables are subsequently measured at amortised cost, using the effective interest method.
Derecognition/non-substantial modification of financial liabilities
The Group derecognises financial liabilities when, and only when, the Group’s obligations are discharged, cancelled or have expired. The difference between the carrying amount of the financial liability derecognised and the consideration paid and payable is recognised in profit or loss.
The Group accounts for an exchange with a lender of a financial liability with substantially different terms as an extinguishment of the original financial liability and the recognition of a new financial liability. A substantial modification of the terms of an existing financial liability or a part of it (whether or not attributable to the financial difficulty of the Group) is accounted for as an extinguishment of the original financial liability and the recognition of a new financial liability.
The Group considers that the terms are substantially different if the discounted present value of the cash flows under the new terms, including any fees paid net of any fee received and discounted using the original effective interest rate, is at least 10 percent different from the discounted present value of the remaining cash flows of the original financial liability. Accordingly, such exchange of debt instrument or modification of terms is accounted for as an extinguishment, any costs or fees incurred are recognised as part of the gain or loss on the extinguishment. The exchange or modification is considered as non-substantial modification when such difference is less than 10 percent.
Non-substantial modifications of financial liabilities (under IFRS 9 since 1 January 2018)
For non-substantial modifications of financial liabilities that do not result in derecognition, the carrying amount of the relevant financial liabilities will be calculated at the present value of the modified contractual cash flows discounted at the financial liabilities’ original effective interest rate. Transaction costs or fees incurred are adjusted to the carrying amount of the modified financial liabilities and are amortised over the remaining term. Any adjustment to the carrying amount of the financial liability is recognised in profit or loss at the date of modification.
Non-substantial modifications of financial liabilities (before application of IFRS 9 on 1 January 2018)
For non-substantial modifications of financial liabilities that do not result in derecognition, at the point of modification, the carrying amount of the relevant financial liabilities is revised for directly attributable transaction costs and any consideration paid to or received from the counterparty. The effective interest rate is then adjusted to amortise the difference between the revised carrying amount and the expected cash flows over the life of the modified instrument.

Notes to the Consolidated Financial StatementsFor the year ended 31 December 2018
(Amounts expressed in thousands of RMB, unless otherwise stated)
107Anton Oilfield Services Group Annual Report 2018
3. SIGNIFICANT ACCOUNTING POLICIES (Continued)
Hedging activities
The Group documents at the inception of the transaction the relationship between hedging instruments and hedged items, as well as its risk management objectives and strategy for undertaking various hedging transactions. The Group also documents its assessment, both at hedge inception and on an ongoing basis, of whether the derivatives that are used in hedging transactions are highly effective in offsetting changes in fair values or cash flows of hedged items.
Assessment of hedging relationship and effectiveness (under IFRS 9 since 1 January 2018)
For hedge effectiveness assessment, the Group considers whether the hedging instrument is effective in offsetting changes in fair values or cash flows of the hedged item attributable to the hedged risk, which is when the hedging relationships meet all of the following hedge effectiveness requirements:
‧ there is an economic relationship between the hedged item and the hedging instrument;
‧ the effect of credit risk does not dominate the value changes that result from that economic relationship; and
‧ the hedge ratio of the hedging relationship is the same as that resulting from the quantity of the hedged item that the Group actually hedges and the quantity of the hedging instrument that the entity actually uses to hedge that quantity of hedged item.
If a hedging relationship ceases to meet the hedge effectiveness requirement relating to the hedge ratio but the risk management objective for that designated hedging relationship remains the same, the Group adjusts the hedge ratio of the hedging relationship (i.e. rebalances the hedge) so that it meets the qualifying criteria again.
Assessment of hedging relationship and effectiveness (before application of IFRS 9 on 1 January 2018)
A hedge is regarded as highly effective only if both of the following conditions are met:
‧ at the inception and in subsequent periods, the hedge is expected to be highly effective; and
‧ the actual result of the hedge are within a range of 80 to 125 percent.
Net investment hedge
Any gain or loss on the hedging instrument relating to the effective portion of the hedge is recognised in other comprehensive income. The gain or loss relating to the ineffective portion is recognised in profit or loss.
Gains and losses accumulated in equity are included in the profit or loss when the foreign operation is partially disposed of or sold.
Notes to the Consolidated Financial StatementsFor the year ended 31 December 2018(Amounts expressed in thousands of RMB, unless otherwise stated)
108 Anton Oilfield Services Group Annual Report 2018
3. SIGNIFICANT ACCOUNTING POLICIES (Continued)
Inventories
Inventories are stated at the lower of cost and net realisable value. Cost is determined using the weighted average method. The cost of finished goods, work-in-progress and project-in-progress comprises design costs, raw materials, direct labour, other direct costs and related production overheads (based on normal operating capacity). Net realisable value is the estimated selling price in the ordinary course of business, less applicable variable selling expenses.
Cash and cash equivalents
In the consolidated statement of cash flows, cash and cash equivalents include cash on hand and bank deposits.
Share capital
Ordinary shares are classified as equity. Incremental costs directly attributable to the issue of new shares or options are shown in equity as a deduction, net of tax, from the proceeds.
Borrowing costs
General and specific borrowing costs directly attributable to the acquisition, construction or production of qualifying assets, which are assets that necessarily take a substantial period of time to get ready for their intended use or sale, are added to the cost of those assets, until such time as the assets are substantially ready for their intended use or sale.
All other borrowing costs are recognised in profit or loss in the period in which they are incurred.
Current and deferred income tax
The tax expense for the period comprises current and deferred tax. Tax is recognised in the consolidated statement of profit or loss, except to the extent that it relates to items recognised in other comprehensive income or directly in equity. In this case the tax is also recognised in other comprehensive income or directly in equity, respectively.
Current income tax
The current income tax charge is calculated on the basis of the tax laws enacted or substantively enacted at the end of the financial period in the countries where the Company’s subsidiaries and joint ventures operate and generate taxable income. Management periodically evaluates positions taken in tax returns with respect to situations in which applicable tax regulation is subject to interpretation. It establishes provisions where appropriate on the basis of amounts expected to be paid to the tax authorities.

Notes to the Consolidated Financial StatementsFor the year ended 31 December 2018
(Amounts expressed in thousands of RMB, unless otherwise stated)
109Anton Oilfield Services Group Annual Report 2018
3. SIGNIFICANT ACCOUNTING POLICIES (Continued)
Current and deferred income tax (Continued)
Deferred income tax
Deferred income tax is recognised, using the liability method, on temporary differences arising between the tax bases of assets and liabilities and their carrying amounts in the consolidated financial statements. However, deferred tax liabilities are not recognised if they arise from the initial recognition of goodwill, the deferred income tax is not accounted for if it arises from initial recognition of an asset or liability in a transaction other than a business combination that at the time of the transaction affects neither accounting nor taxable profit or loss. Deferred income tax is determined using tax rates (and laws) that have been enacted or substantively enacted by the end of financial period and are expected to apply when the related deferred income tax asset is realised or the deferred income tax liability is settled.
Deferred income tax assets are recognised only to the extent that it is probable that future taxable profit will be available against which the temporary differences can be utilised.
Deferred income tax liabilities are provided on temporary differences arising from investments in subsidiaries and joint ventures, except for deferred income tax liability where the timing of the reversal of the temporary difference is controlled by the Group and it is probable that the temporary difference will not reverse in the foreseeable future.
Deferred income tax assets are recognised on deductible temporary differences arising from investments in subsidiaries and joint ventures only to the extent that it is probable the temporary difference will reverse in the future and there is sufficient taxable profit available against which the temporary difference can be utilised.
Offsetting
Deferred income tax assets and liabilities are offset when there is a legally enforceable right to offset current tax assets against current tax liabilities and when the deferred income tax assets and liabilities relate to income taxes levied by the same taxation authority on either the taxable entity or different taxable entities where there is an intention to settle the balances on a net basis.
Employee benefits
Pension and other social obligations
The Group has various defined contribution plans for pensions, housing fund and other social obligations in accordance with the local conditions and practices in the municipalities and provinces in which they operate. A defined contribution plan is a pension and/or other social benefits plan under which the Group pays fixed contributions into a separate publicly administered pension and/or other social insurance plan on mandatory bases. The Group will have no legal or constructive obligations to pay further contributions if the fund does not hold sufficient assets to pay all employees benefits relating to employee service in the current and prior periods. The contributions are recognised as employee benefit expenses when incurred.

Notes to the Consolidated Financial StatementsFor the year ended 31 December 2018(Amounts expressed in thousands of RMB, unless otherwise stated)
110 Anton Oilfield Services Group Annual Report 2018
3. SIGNIFICANT ACCOUNTING POLICIES (Continued)
Employee benefits (Continued)
Share-based compensation
The Group operates a number of equity-settled share-based compensation plans, under which the Group receives services from employees as consideration for equity instruments (options) of the Group. The fair value of the employee services received in exchange for the grant of the options is recognised as an expense. The total amount to be expensed is determined by reference to the fair value of the options granted at the grant date:
• Including any market performance conditions;
• Excluding the impact of any service and non-market performance vesting conditions (for example, profitability, sales growth targets and remaining an employee of the entity over a specified time period); and
• Including the impact of any non-vesting conditions.
Non-market vesting conditions are included in assumptions about the number of options that are expected to vest. The total expense is recognised over the vesting period, which is the period over which all of the specified vesting conditions are to be satisfied. At the end of each reporting period, the Group revises its estimates of the number of options that are expected to vest based on the non-marketing vesting conditions. It recognises the impact of the revision to original estimates, if any, in the consolidated statement of profit or loss, with a corresponding adjustment to equity.
The cash subscribed for the shares issued when the options are exercised is credited to share capital (nominal value) and share premium, net of any directly attributable transaction costs.
The grant by the Company of options over its equity instruments to the employees of subsidiary undertakings in the Group is treated as a capital contribution. The fair value of employee services received, measured by reference to the grant date fair value, is recognised over the vesting period as an increase to investment in subsidiary undertakings, with a corresponding credit to equity in the parent entity accounts.

Notes to the Consolidated Financial StatementsFor the year ended 31 December 2018
(Amounts expressed in thousands of RMB, unless otherwise stated)
111Anton Oilfield Services Group Annual Report 2018
3. SIGNIFICANT ACCOUNTING POLICIES (Continued)
Revenue from contracts with customers (upon application of IFRS 15 in accordance with transitions in Note 2)
Under IFRS 15, the Group recognises revenue when (or as) a performance obligation is satisfied, i.e. when “control” of the goods or services underlying the particular performance obligation is transferred to the customer.
A performance obligation represents a good and service (or a bundle of goods or services) that is distinct or a series of distinct goods or services that are substantially the same.
Control is transferred over time and revenue is recognised over time by reference to the progress towards complete satisfaction of the relevant performance obligation if one of the following criteria is met
‧ the customer simultaneously receives and consumes the benefits provided by the Group’s performance as the Group performs;
‧ the Group’s performance creates and enhances an asset that the customer controls as the Group performs; or
‧ the Group’s performance does not create an asset with an alternative use to the Group and the Group has an enforceable right to payment for performance completed to date.
Otherwise, revenue is recognised at a point in time when the customer obtains control of the distinct good or service.
A contract asset represents the Group’s right to consideration in exchange for goods or services that the Group has transferred to a customer that is not yet unconditional. It is assessed for impairment in accordance with IFRS 9. In contrast, a receivable represents the Group’s unconditional right to consideration, i.e. only the passage of time is required before payment of that consideration is due.
A contract liability represents the Group’s obligation to transfer goods or services to a customer for which the Group has received consideration (or an amount of consideration is due) from the customer.
A contract asset and a contract liability relating to the same contract are accounted for and presented on a net basis.
Contracts with multiple performance obligations (including allocation of transaction price)
For contracts that contain more than one performance obligations, typically drilling technology service and well completion service (within oilfield technology services) in one contract, the Group allocates the transaction price to each performance obligation on a relative stand-alone selling price basis.
The stand-alone selling price of the distinct good or service underlying each performance obligation is determined at contract inception. It represents the price at which the Group would sell a promised good or service separately to a customer. If a stand-alone selling price is not directly observable, the Group estimates it using appropriate techniques such that the transaction price ultimately allocated to any performance obligation reflects the amount of consideration to which the Group expects to be entitled in exchange for transferring the promised goods or services to the customer.

Notes to the Consolidated Financial StatementsFor the year ended 31 December 2018(Amounts expressed in thousands of RMB, unless otherwise stated)
112 Anton Oilfield Services Group Annual Report 2018
3. SIGNIFICANT ACCOUNTING POLICIES (Continued)
Revenue from contracts with customers (upon application of IFRS 15 in accordance with transitions in Note 2) (Continued)
Over time revenue recognition: measurement of progress towards complete satisfaction of
a performance obligation
Output method
The progress towards complete satisfaction of a performance obligation is measured based on output method, which is to recognise revenue on the basis of direct measurements of the value of the goods or services transferred to the customer to date relative to the remaining goods or services promised under the contract, that best depict the Group’s performance in transferring control of goods or services.
Principal versus agent
When another party is involved in providing goods or services to a customer, the Group determines whether the nature of its promise is a performance obligation to provide the specified goods or services itself (i.e. the Group is a principal) or to arrange for those goods or services to be provided by the other party (i.e. the Group is an agent).
The Group is a principal if it controls the specified good or service before that good or service is transferred to a customer.
The Group is an agent if its performance obligation is to arrange for the provision of the specified good or service by another party. In this case, the Group does not control the specified good or service provided by another party before that good or service is transferred to the customer. When the Group acts as an agent, it recognises revenue in the amount of any fee or commission to which it expects to be entitled in exchange for arranging for the specified goods or services to be provided by the other party.
Revenue recognition (prior to 1 January 2018)
Revenue is measured at the fair value of the consideration received or receivable, and represents amounts receivable for goods and services supplied, stated net of value-added tax, returns, rebates and discounts.
The Group recognises revenue when the amount of revenue can be reliably measured, it is probable that future economic benefits will flow to the Group and specific criteria have been met for each of the Group’s activities as described below. The Group bases its estimates on historical results, taking into consideration the type of customer, the type of transaction and the specifics of each arrangement.
Sales of services
Sales of services are recognised in the accounting period in which the services are rendered.
Sales of goods
Revenue associated with the sales of goods is recognised when the title to the goods, such as drilling tools, tubing and casing, has been passed to the customer, which is at the date when the customer receives and accepts the goods and collectability of the related receivables is reasonably assured.

Notes to the Consolidated Financial StatementsFor the year ended 31 December 2018
(Amounts expressed in thousands of RMB, unless otherwise stated)
113Anton Oilfield Services Group Annual Report 2018
3. SIGNIFICANT ACCOUNTING POLICIES (Continued)
Interest income
Interest income is recognised on a time-proportion basis using the effective interest method.
Leases
The Group leases certain property, plant and equipment.
Leases in which a significant portion of the risks and rewards of ownership are retained by the lessor are classified as operating leases. Payments made under operating leases (net of any incentives received from the lessor) are charged to the consolidated statement of profit or loss on a straight-line basis over the period of the lease.
Government grants
Grants from the government are recognised at fair value where there is reasonable assurance that the grant will be received and the Group will comply with all attached conditions.
Government grants related to cost are deferred and recognised in the consolidated statement of profit or loss over the period necessary to match them with the related costs that they are intended to compensate.
Dividend distribution
Dividend distribution to the Company’s shareholders is recognised as a liability in the Group’s financial statements in the period in which the dividends are approved by the Company’s shareholders.

Notes to the Consolidated Financial StatementsFor the year ended 31 December 2018(Amounts expressed in thousands of RMB, unless otherwise stated)
114 Anton Oilfield Services Group Annual Report 2018
4. KEY SOURCES OF ESTIMATION UNCERTAINTY
In the application of the Group’s accounting policies, which are described in Note 3, the Directors are required to make judgements, estimates and assumptions about the carrying amounts of assets and liabilities that are not readily apparent from other sources. The estimates and associated assumptions are based on historical experience and other factors that are considered to be relevant. Actual result may differ from these estimates.
The estimates and underlying assumptions are reviewed on an on-going basis. Revisions to accounting estimates are recognised in the period in which the estimate is revised if the revision affects only that period, or in the period of the revision and future periods if the revision affects both current and future periods.
The following are the key assumptions concerning the future, and other key sources of estimation uncertainty at the end of the reporting period, that may have a significant risk of causing a material adjustment to the carrying amounts of assets and liabilities within the next financial year.
(a) Provision of ECL for trade receivables
The impairment of trade receivables under ECL model is determined by the management based on the Group’s historical credit loss experience, adjusted for factors that are specific to the debtors, general economic conditions and an assessment of both the current conditions at the reporting date as well as the forecast of future conditions.
The Group uses provision matrix to calculate ECL for the trade receivables from private and relatively small customers. The provision rates are based on past due analysis as groupings of various debtors that have similar loss patterns. The provision matrix is based on the Group’s historical default rates taking into consideration forward-looking information that is reasonable and supportable available without undue costs or effort. At every reporting date, the historical observed default rates are reassessed and changes in the forward-looking information are considered. In addition, trade receivables with significant balances from large multinational and state-owned oil companies or credit impaired are assessed for ECL individually.
The provision of ECL is sensitive to changes in estimates. In estimating the provision of ECL, the management is required to consider all relevant factors with reasonable and supportable assumptions to make significant accounting estimations. The information about the ECL and the Group’s trade receivables are disclosed in Note 35.2(b) (i) and Note 13.
(b) Impairment of property, plant and equipment and intangible assets
Property, plant and equipment and intangible assets are stated at cost or cost less depreciation or amortisation. The carrying amounts are reviewed for impairment whenever events or changes in circumstances indicate that the carrying amounts may not be recoverable. An impairment loss is recognised for the amount by which the asset’s carrying amount exceeds its recoverable amount. The recoverable amount is the higher of an asset’s fair value less costs of disposal and value in use.
In estimating the recoverable amount, management is required to consider all relevant factors with reasonable and supportable assumptions to make significant accounting estimations. In estimating the recoverable amounts of assets, major assumptions, including future cash flow projections associated with forecast revenue, forecast gross margin and a discount rate, are made. If future events do not correspond to such assumptions, the recoverable amounts will need to be revised, and this may have an impact on the Group’s financial position and results of operations.
The aggregate carrying amount of property, plant and equipment as at 31 December 2018 was RMB2,255,805,000 (31 December 2017: RMB2,331,571,000). The aggregate carrying amount of intangible assets as at 31 December 2018 was RMB252,714,000 (31 December 2017: RMB224,285,000).

Notes to the Consolidated Financial StatementsFor the year ended 31 December 2018
(Amounts expressed in thousands of RMB, unless otherwise stated)
115Anton Oilfield Services Group Annual Report 2018
4. KEY SOURCES OF ESTIMATION UNCERTAINTY (Continued)
(c) Impairment of inventory
Inventories are reviewed for impairment whenever events or changes in circumstances cause their cost to exceed their net realisable value. Cost is determined on the weighted average basis. The determination of net realisable value of the inventories requires the use of estimates. Net realisable value represents the estimated selling price for inventories less all estimated costs of completion and costs necessary to make the sale. Where the actual outcome or expectation in future is different from the original estimate, such difference will have an impact on the cost of inventories and a provision may be made or reversed in the year in which these estimates have been changed. As at 31 December 2018, the carrying amount of inventories was RMB774,359,000 (31 December 2017: RMB597,233,000), already net of accumulated impairment loss of RMB135,510,000 (31 December 2017: RMB119,157,000).
(d) Estimated impairment of goodwill
Determining whether goodwill is impaired requires an estimation of the value in use of the CGU to which goodwill has been allocated. The value in use calculations require the Group to estimate the future cash flows expected to arise from the CGU and a suitable discount rate in order to calculate the present value. Where the actual future cash flows are less than expected, or change in facts and circumstances which results in downward revision of future cash, a material impairment loss may arise. As at 31 December 2018 and 2017, the carrying amount of goodwill was RMB242,004,000, already net of accumulated impairment loss of RMB26,325,000. Details of the key assumptions used by the management in goodwill impairment assessment are set out in Note 8.
(e) Income taxes
The Group is subject to income taxes in different jurisdictions. Significant judgement is required in determining the worldwide provision for income taxes. There are many transactions and calculations for which the ultimate tax determination is uncertain. The Group recognises liabilities for anticipated tax audit issues based on estimates of whether additional taxes will be due. Where the final tax outcome of these matters is different from the amounts that were initially recorded, such differences will impact the current and deferred income tax assets and liabilities in the period in which such determination is made.
For deductible temporary differences which give rise to deferred income tax assets, the Group has assessed the likelihood that the deferred income tax assets could be recovered. Deferred income tax assets mainly relate to deductible tax losses and provision for impairment of receivables and inventories not yet deductible for tax purposes. Deferred income tax assets are recognised based on the Group’s estimates and assumptions that they will be recovered from taxable income arising from continuing operations in the foreseeable future.
The Group believes it has recorded adequate current tax provision and deferred income taxes based on the prevailing tax rules and regulations and its current best estimates and assumptions. In the event that future tax rules and regulations or related circumstances change, adjustments to current and deferred income taxation may be necessary which would impact the Group’s results or financial position.
As at 31 December 2018, deferred income tax assets of RMB52,076,000 (31 December 2017: RMB63,743,000) in relation to unused deductible tax losses and other deductible temporary difference have been recognised in the Group’s consolidated statement of financial position. No deferred tax assets have been recognised on the unused deductible tax losses and other deductible temporary difference of RMB284,816,000 (31 December 2017: RMB248,119,000) due to the unpredictability of future profit streams.

Notes to the Consolidated Financial StatementsFor the year ended 31 December 2018(Amounts expressed in thousands of RMB, unless otherwise stated)
116 Anton Oilfield Services Group Annual Report 2018
5. SEGMENT INFORMATION
The chief executive officer, executive vice presidents and Directors are the Group’s chief operating decision makers (the “CODM”). Management has determined the operating segments based on the information reviewed by the CODM for the purposes of allocating resources and assessing performance.
The Group’s reportable segments are entity or group of entities that offer different products and services, which is the basis by which the CODM make decisions about resources to be allocated to the segments and assesses their performance. Financial information of these entities has been separated to present discrete segment information to be reviewed by the CODM.
The CODM assess performance of three reportable segments: drilling technology, well completion and oil production services.
All of the three reportable segments include a number of direct service provision operations in various cities in China and overseas countries, each of which is considered as a separate operating segment by the CODM. For segment reporting, these individual operating segments have been aggregated into three single reportable segments based on their sharing of similar economic characteristics, including similar nature of the services and products, type of customer for their services and products and the method used to provide their services and distribute their products.
The measurement of profit or loss, assets and liabilities of the operating segments are the same as those described in the summary of significant accounting policies in Note 3. The CODM evaluate the performance of the operating segments based on profit or loss before income tax expense, certain depreciation and amortisation, interest income, finance expenses, share of profit/(loss) of a joint venture, asset impairment provisions and corporate overheads (“EBITDA”). The corporate overheads and corporate assets are the general management expenses incurred and assets held by the headquarters of the Group.

Notes to the Consolidated Financial StatementsFor the year ended 31 December 2018
(Amounts expressed in thousands of RMB, unless otherwise stated)
117Anton Oilfield Services Group Annual Report 2018
5. SEGMENT INFORMATION (Continued)
OilDrilling Well production
technology completion services Total
For the year ended 31 December 2018Revenue (Note) 1,339,850 741,820 854,218 2,935,888 EBITDA 624,858 329,273 360,792 1,314,923 Depreciation and amortisation (125,947) (122,784) (24,896) (273,627)Asset impairment provision of – Inventories (6,599) (2,282) (7,472) (16,353) – Trade receivables (25,962) (29,346) (3,148) (58,456) – Other receivables (9,518) (7,015) (212) (16,745)Interest income 136 211 421 768Finance expenses (5,335) (5,452) (3,934) (14,721)Share of profit of a joint venture 355 — — 355Income tax expense (17,807) (32,058) (46,578) (96,443) For the year ended 31 December 2017Revenue (Note) 959,201 564,450 679,051 2,202,702 EBITDA 400,582 262,876 310,658 974,116 Depreciation and amortisation (72,490) (111,247) (20,352) (204,089)Asset impairment provision of – Inventories — (5,389) (1,600) (6,989) – Trade and other receivables (3,136) (12,203) (7,499) (22,838)Interest income 47 150 230 427Finance expenses (5,758) (2,988) (8,250) (16,996)Share of loss of a joint venture (901) — — (901)Income tax expense 10,054 (6,413) (37,288) (33,647)
Note: Sales between segments are carried out at terms mutually agreed between relevant group entities. The revenue from external parties reported to the CODM is measured in a manner consistent with that in the consolidated statement of profit or loss.
OilDrilling Well production
technology completion services Total
As at 31 December 2018Total assets 2,082,006 2,679,875 545,808 5,307,689Total assets include:Capital expenditures 117,318 64,179 31,228 212,725 As at 31 December 2017Total assets 2,025,962 2,816,315 587,235 5,429,512Total assets include:Capital expenditures 149,412 81,737 39,772 270,921
Disclosure of liabilities has not been included here because these liabilities balances are not allocated to segments.

Notes to the Consolidated Financial StatementsFor the year ended 31 December 2018(Amounts expressed in thousands of RMB, unless otherwise stated)
118 Anton Oilfield Services Group Annual Report 2018
5. SEGMENT INFORMATION (Continued)
A reconciliation of total EBITDA to profit before income tax is provided as follows:
Year ended 31 December2018 2017
EBITDA for reportable segments 1,314,923 974,116Corporate overheads (588,980) (517,809)Depreciation (243,388) (185,306)Amortisation (30,239) (18,783)Asset impairment provisions (91,554) (29,827)Interest income 768 427Finance expenses (14,721) (16,996)Share of profit/(loss) of a joint venture 355 (901) Profit before income tax 347,164 204,921
Reportable segments’ assets are reconciled to total assets as follows:
As at 31 December2018 2017
Assets for reportable segments 5,307,689 5,429,512Corporate assets for general management 1,938,912 2,317,963 Total assets 7,246,601 7,747,475
The Group allocates revenue on the basis of the location in which the sales are originated.
Geographical Information
Revenue Non-current assets
Year ended 31 December As at 31 December2018 2017 2018 2017
PRC 1,083,690 793,903 2,025,979 2,290,221Republic of Iraq (“Iraq”) 1,170,562 855,328 706,029 661,359Other countries 681,636 553,471 204,881 338,445 Total 2,935,888 2,202,702 2,936,889 3,290,025
Client information
For the year ended 31 December 2018, revenues of approximately RMB1,208,999,000 (2017: RMB817,426,000) were derived from two external independent customers, which contributed 25.59% and 15.59% (2017: 21.84% and 15.27%) to the total revenue respectively. These revenues were mainly attributable to drilling technology and well completion segments (2017: drilling technology and oil production services segments).
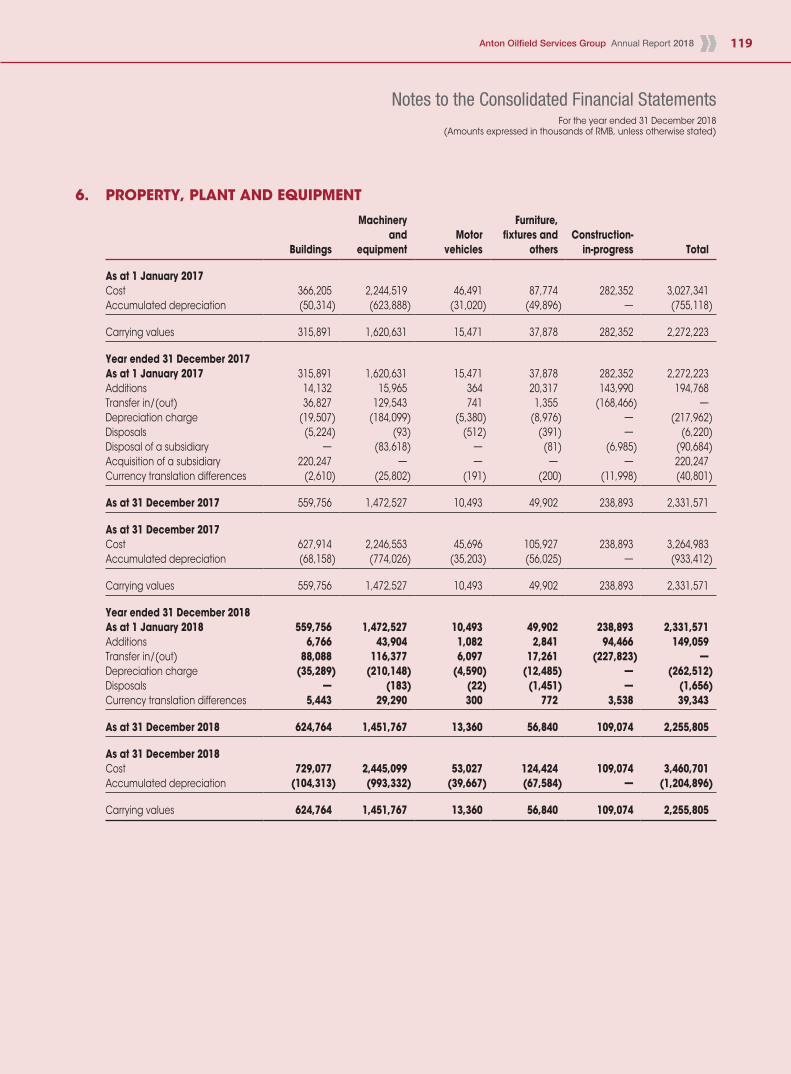
Notes to the Consolidated Financial StatementsFor the year ended 31 December 2018
(Amounts expressed in thousands of RMB, unless otherwise stated)
119Anton Oilfield Services Group Annual Report 2018
6. PROPERTY, PLANT AND EQUIPMENT
Machinery Furniture,and Motor fixtures and Construction-
Buildings equipment vehicles others in-progress Total
As at 1 January 2017Cost 366,205 2,244,519 46,491 87,774 282,352 3,027,341Accumulated depreciation (50,314) (623,888) (31,020) (49,896) — (755,118) Carrying values 315,891 1,620,631 15,471 37,878 282,352 2,272,223 Year ended 31 December 2017As at 1 January 2017 315,891 1,620,631 15,471 37,878 282,352 2,272,223Additions 14,132 15,965 364 20,317 143,990 194,768Transfer in/(out) 36,827 129,543 741 1,355 (168,466) —Depreciation charge (19,507) (184,099) (5,380) (8,976) — (217,962)Disposals (5,224) (93) (512) (391) — (6,220)Disposal of a subsidiary — (83,618) — (81) (6,985) (90,684)Acquisition of a subsidiary 220,247 — — — — 220,247Currency translation differences (2,610) (25,802) (191) (200) (11,998) (40,801) As at 31 December 2017 559,756 1,472,527 10,493 49,902 238,893 2,331,571 As at 31 December 2017Cost 627,914 2,246,553 45,696 105,927 238,893 3,264,983Accumulated depreciation (68,158) (774,026) (35,203) (56,025) — (933,412) Carrying values 559,756 1,472,527 10,493 49,902 238,893 2,331,571 Year ended 31 December 2018As at 1 January 2018 559,756 1,472,527 10,493 49,902 238,893 2,331,571Additions 6,766 43,904 1,082 2,841 94,466 149,059Transfer in/(out) 88,088 116,377 6,097 17,261 (227,823) —Depreciation charge (35,289) (210,148) (4,590) (12,485) — (262,512)Disposals — (183) (22) (1,451) — (1,656)Currency translation differences 5,443 29,290 300 772 3,538 39,343 As at 31 December 2018 624,764 1,451,767 13,360 56,840 109,074 2,255,805 As at 31 December 2018Cost 729,077 2,445,099 53,027 124,424 109,074 3,460,701Accumulated depreciation (104,313) (993,332) (39,667) (67,584) — (1,204,896) Carrying values 624,764 1,451,767 13,360 56,840 109,074 2,255,805

Notes to the Consolidated Financial StatementsFor the year ended 31 December 2018(Amounts expressed in thousands of RMB, unless otherwise stated)
120 Anton Oilfield Services Group Annual Report 2018
6. PROPERTY, PLANT AND EQUIPMENT (Continued)
During the year ended 31 December 2018, the depreciation charges of the Group were recorded in cost of sales with an amount of RMB221,414,000 (2017: RMB180,315,000), selling, general and administrative expenses with an amount of RMB23,858,000 (2017: RMB21,342,000), and cost of inventories which remained unsold as at year end with an amount of RMB17,240,000 (2017: RMB16,305,000), respectively.
As at 31 December 2018, long-term borrowings were secured by certain equipment with a carrying value of RMB319,311,000 (31 December 2017: RMB182,573,000) and certain buildings with a carrying value of RMB93,618,000 (31 December 2017: RMB126,865,000) (Note 19(a)).
As at 31 December 2018, the Group’s buildings with a carrying value of RMB26,804,000 (31 December 2017: RMB28,006,000) were pledged as counter-guarantee for short-term borrowings of RMB80,536,000 (31 December 2017: RMB80,000,000) (Note 19(b)).
As at 31 December 2017, the Group’s buildings with a carrying value of RMB128,279,000 were pledged as security of short-term borrowings of RMB150,000,000 (Note 19(b)).
As at 31 December 2018 and 2017, none of the Group’s property, plant and equipment were pledged as security of undrawn bank borrowing facilities.
7. PREPAID LEASE PAYMENTS
As at 1 January 2017Cost 56,332Accumulated amortisation (8,338) Carrying value 47,994 Year ended 31 December 2017As at 1 January 2017 47,994Acquisition of a subsidiary 33,249Amortisation charge (1,744) As at 31 December 2017 79,499 As at 31 December 2017Cost 89,581Accumulated amortisation (10,082) Carrying value 79,499 Year ended 31 December 2018As at 1 January 2018 79,499Amortisation charge (1,932) As at 31 December 2018 77,567 As at 31 December 2018Cost 89,581Accumulated amortisation (12,014) Carrying value 77,567

Notes to the Consolidated Financial StatementsFor the year ended 31 December 2018
(Amounts expressed in thousands of RMB, unless otherwise stated)
121Anton Oilfield Services Group Annual Report 2018
7. PREPAID LEASE PAYMENTS (Continued)
Analysed for reporting purpose as:
As at 31 December2018 2017
Current asset 1,932 1,932
Non-current asset 75,635 77,567
77,567 79,499
Prepaid lease payments represent the Group’s prepayments for the leasehold land located in the PRC.
As at 31 December 2018, prepaid lease payments with carrying amount of RMB5,860,000 (31 December 2017: RMB18,739,000) were pledged as guarantee for certain long-term borrowings (Note 19(a)).
As at 31 December 2018 and 2017, none of the prepaid lease payments were pledged as security of undrawn bank borrowing facilities.
8. GOODWILL
As at 1 January 2017, 31 December 2017 and 2018Cost 268,329Accumulated impairment (26,325) Carrying value 242,004
An operating segment-level summary of the goodwill allocation is presented below.
Drilling WellAs at 31 December 2018 and 2017 technology completion Total
Shandong Precede Petroleum Technology Co., Ltd. (山東普瑞思德石油技術有限公司, “Shandong Precede”) — 132,486 132,486Beijing Haineng Haite Petroleum Technology Development Co., Ltd. (北京海能海特石油科技發展有限公司, “Beijing Haineng Haite”) — 106,886 106,886Anton Machinery and Meter Testing Co., Ltd. (安東儀器儀表檢測服務有限公司, “Anton Testing”, formerly 四川誠量檢測服務有限公司) 2,632 — 2,632
2,632 239,372 242,004

Notes to the Consolidated Financial StatementsFor the year ended 31 December 2018(Amounts expressed in thousands of RMB, unless otherwise stated)
122 Anton Oilfield Services Group Annual Report 2018
8. GOODWILL (Continued)
Goodwill is allocated to the CGUs of the Group identified according to their operations.
The recoverable amount of the CGUs is determined based on value-in-use calculations. These calculations use pre-tax cash flow projections based on financial budgets approved by management covering a five-year period. The Company expects cash flow beyond the five-year period will be similar to that of the fifth year based on existing production capacity. Cash flows beyond the five-year period are extrapolated using zero growth rates. Based on the assessments, no goodwill was further impaired as at 31 December 2018.
The key assumptions used for value-in-use calculations in 2018 are as follows:
Shandong Beijing AntonAs at 31 December 2018 Precede Haineng Haite Testing
Gross margin 21.58% 15.05% 16.42%Discount rate 12.70% 12.70% 13.50%
Shandong Beijing AntonAs at 31 December 2017 Precede Haineng Haite Testing
Gross margin 34.25% 17.18% 15.79%Discount rate 12.70% 12.70% 13.50%
Management determined budgeted gross margin based on past performance and its expectations of market development. The discount rates used are pre-tax long-term weighted average costs of capital, which are based on the management’s best estimation of the investment returns that market participants would require for the relevant assets.
Except for the accumulated impairment loss already recognised, management believed that any reasonably possible change in any of these assumptions would not cause the aggregate carrying amount of the above CGUs to exceed their recoverable amount as of 31 December 2018.
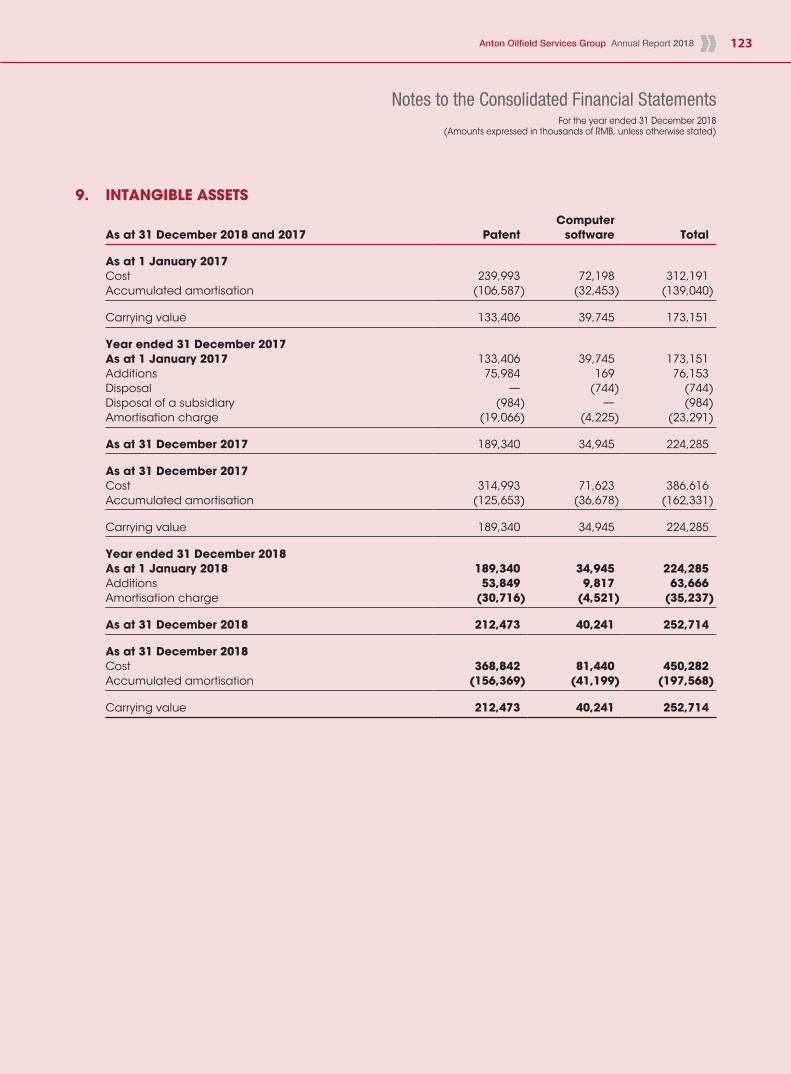
Notes to the Consolidated Financial StatementsFor the year ended 31 December 2018
(Amounts expressed in thousands of RMB, unless otherwise stated)
123Anton Oilfield Services Group Annual Report 2018
9. INTANGIBLE ASSETS
ComputerAs at 31 December 2018 and 2017 Patent software Total
As at 1 January 2017Cost 239,993 72,198 312,191Accumulated amortisation (106,587) (32,453) (139,040) Carrying value 133,406 39,745 173,151 Year ended 31 December 2017As at 1 January 2017 133,406 39,745 173,151Additions 75,984 169 76,153Disposal — (744) (744)Disposal of a subsidiary (984) — (984)Amortisation charge (19,066) (4,225) (23,291) As at 31 December 2017 189,340 34,945 224,285 As at 31 December 2017Cost 314,993 71,623 386,616Accumulated amortisation (125,653) (36,678) (162,331) Carrying value 189,340 34,945 224,285 Year ended 31 December 2018As at 1 January 2018 189,340 34,945 224,285Additions 53,849 9,817 63,666Amortisation charge (30,716) (4,521) (35,237) As at 31 December 2018 212,473 40,241 252,714 As at 31 December 2018Cost 368,842 81,440 450,282Accumulated amortisation (156,369) (41,199) (197,568) Carrying value 212,473 40,241 252,714

Notes to the Consolidated Financial StatementsFor the year ended 31 December 2018(Amounts expressed in thousands of RMB, unless otherwise stated)
124 Anton Oilfield Services Group Annual Report 2018
10. INTEREST IN A JOINT VENTURE
The amounts recognised in the consolidated statement of financial position are as follows:
A joint venture:
As at 31 December2018 2017
Cost of unlisted investment in a joint venture 4,000 4,000Share of undistributed post-acquisition reserves (954) (1,309) Total 3,046 2,691
Equity interestPlace and date Registered/ held by
Company name of establishment paid capital the Group (a) Principal activities
Xinjiang PengAn Energy Xinjiang Uygur RMB10,000,000 40% Oilfield technology Technology Co., Ltd. Autonomous Region, consulting service and (新疆鵬安能源科技有限責任公司, the PRC, sales of equipment “Xinjiang PengAn”) 22 January 2016
Notes:
(a) The Group has 40% of the equity interests in Xinjiang PengAn, the remaining equity interests of which are held by the other sole investor. Pursuant to the articles of association of Xinjiang PengAn, the board of directors of Xinjiang PengAn shall comprise five directors whereby the Group and the other sole investor shall appoint two and three directors each. Unanimous approvals by the directors of Xinjiang PengAn are required for decisions on directing the relevant activities of Xinjiang PengAn. In the opinion of the Directors, the Group has joint control over Xinjiang PengAn with the other sole investor and the investment in this joint arrangement has been accounted for as a joint venture of the Group.
(b) Xinjiang PengAn is an unlisted limited liability company.

Notes to the Consolidated Financial StatementsFor the year ended 31 December 2018
(Amounts expressed in thousands of RMB, unless otherwise stated)
125Anton Oilfield Services Group Annual Report 2018
10. INTEREST IN A JOINT VENTURE (Continued)
The following amounts represent 100% of the assets and liabilities, and sales and results of the joint venture.
As at 31 December2018 2017
Assets:Non-current assets 7,570 7,519Current assets 595 4,864
8,165 12,383 Liabilities:Current liabilities 549 5,655
549 5,655 Net assets 7,616 6,728 Revenue 4,280 3,922Profit/(loss) and total other comprehensive income/ (expense) for the year 888 (2,253)
Reconciliation of the above summarised financial information to the carrying amount of the interest in Xinjiang PengAn recognised in the consolidated financial statements:
As at 31 December2018 2017
Net assets 7,616 6,728Proportion of the Group’s ownership interest 40% 40% Carrying amount of the Group’s interest 3,046 2,691
There are no contingent liabilities relating to the Group’s interest in the joint venture.
11. OTHER NON-CURRENT ASSETS
As at 31 December2018 2017
CurrentLong-term deferred and prepaid expenses (a) 5,694 4,923 Non-currentLong-term deferred and prepaid expenses (a) 8,375 5,615Prepayment for acquisition of additional equity interest in a subsidiary (Note 33/Note 36(c)) — 299,229
8,375 304,844
Note:
(a) As at 31 December 2018, long-term deferred and prepaid expenses mainly represent prepayments for lease of logistics base and relevant renovation expenditure on it.

Notes to the Consolidated Financial StatementsFor the year ended 31 December 2018(Amounts expressed in thousands of RMB, unless otherwise stated)
126 Anton Oilfield Services Group Annual Report 2018
12. INVENTORIES
As at 31 December2018 2017
Raw materials 37,499 28,600Work-in-progress 1,423 773Finished goods 65,065 57,369Project materials and spare parts 427,489 302,778Project-in-progress 242,883 207,713
774,359 597,233
Movements of provision for inventory obsolescence during the year are analysed as follows:
2018 2017
As at 1 January (119,157) (118,717)Addition (16,353) (6,989)Disposal of a subsidiary — 3,403Write-off — 3,146 As at 31 December (135,510) (119,157)
13. TRADE AND NOTES RECEIVABLES
As at 31 December2018 2017
Trade receivables, net (a) – from related parties (Note 36(c)) 44,893 36,047 – others 1,851,173 1,651,713
1,896,066 1,687,760 Trade receivables, net (a) – goods and services 1,896,066 1,687,760Notes receivable (g) 51,964 72,598
1,948,030 1,760,358

Notes to the Consolidated Financial StatementsFor the year ended 31 December 2018
(Amounts expressed in thousands of RMB, unless otherwise stated)
127Anton Oilfield Services Group Annual Report 2018
13. TRADE AND NOTES RECEIVABLES (Continued)
Notes:
(a) Ageing analysis of carrying value of trade receivables at the reporting date was as follows:
As at 31 December2018 2017
1 - 6 months 1,242,571 1,055,6406 months - 1 year 427,329 468,0121 - 2 years 198,697 110,9272 - 3 years 27,469 52,451Over 3 years — 730
1,896,066 1,687,760
(b) As at 31 December 2018 and 1 January 2018, trade receivables from contracts with customers amounted to RMB1,896,066,000 and RMB1,660,247,000 respectively.
(c) Most of the Group’s past-due trade receivables were those receivables aged over one year. As at 31 December 2018, included in the Group’s trade receivables balance are debtors with aggregate carrying amount of RMB226,166,000 which are past due but not considered as in default as at the reporting date because the management considered such long ageing items were receivables from customers with good cooperation and would be collected subsequently.
As at 31 December 2017, trade receivables amounting to RMB1,523,652,000 aged within one year, which were neither past due nor impaired according to the Group’s credit policy.
As at 31 December 2017, trade receivables with carrying value of RMB164,108,000 were past due but not impaired.
(d) Most of the trade receivables are with credit terms of one year or less, except for retention money which would be collected one year after the completion of the services. As at 31 December 2017, included in the trade receivables are retention money amounting to RMB27,513,000, of which RMB6,275,000 are due after one year. Upon application of IFRS 15, the retention money receivables were reclassified to contract assets. The maximum exposure to credit risk at the reporting date is the carrying value of the trade receivables.
As at 31 December 2018, trade receivables of RMB357,123,000 (31 December 2017: RMB203,369,000) were pledged as security for short-term borrowings of RMB266,450,000 (31 December 2017: RMB181,320,000) (Note 19(b)).
(e) Movements of impairment of trade receivables are as follows:
2018 2017
As at 1 January (63,664) (40,826)Addition (65,645) (22,838)Reversal 7,189 — As at 31 December (122,120) (63,664)
Details of impairment assessment of trade receivables and notes receivable for the year ended 31 December 2018 are set out in Note 35.2(b) (i) and Note 35.2(b) (iii) respectively.
(f) As at 31 December 2017, included in the impairment of trade receivables are individually impaired trade receivables with an aggregate balance of RMB63,664,000 which are generally not recoverable based on the management’s historical experience and understanding of the customers’ financial status.
(g) As at 31 December 2018, total notes received amounting to RMB51,964,000 (31 December 2017: RMB72,598,000) are held by the Group for future settlement of corresponding trade receivables. As at 31 December 2018 and 2017, notes receivable are all bank acceptance bills with maturity dates within six months.

Notes to the Consolidated Financial StatementsFor the year ended 31 December 2018(Amounts expressed in thousands of RMB, unless otherwise stated)
128 Anton Oilfield Services Group Annual Report 2018
13. TRADE AND NOTES RECEIVABLES (Continued)
Notes: (Continued)
(h) Trade and notes receivables were denominated in the following currencies:
As at 31 December2018 2017
RMB 755,673 740,246United States dollar (“US$”) 978,961 836,761Others 213,396 183,351
1,948,030 1,760,358
14. PREPAYMENTS AND OTHER RECEIVABLES
As at 31 December2018 2017
CurrentAdvances to suppliers 130,809 87,251Other receivables 263,464 278,980Amounts due from related parties (Note 36(c)) 28,116 4,489Value-added tax recoverable 15,569 96,309
437,958 467,029 Non-currentValue-added tax recoverable 35,620 44,033Advances to engineering equipment suppliers 63,690 63,030Other receivables (Note 33) 13,500 14,000
112,810 121,063
Ageing analysis of prepayments and other receivables at the reporting date was disclosed as follows:
As at 31 December2018 2017
1 - 6 months 284,845 241,5126 months - 1 year 24,223 147,7131 - 2 years 86,206 41,6452 - 3 years 30,730 29,886Over 3 years 32,825 10,399
458,829 471,155Less: allowance for impairment (a) (20,871) (4,126) Prepayments and other receivables, net 437,958 467,029

Notes to the Consolidated Financial StatementsFor the year ended 31 December 2018
(Amounts expressed in thousands of RMB, unless otherwise stated)
129Anton Oilfield Services Group Annual Report 2018
14. PREPAYMENTS AND OTHER RECEIVABLES (Continued)
Note:
(a) Movements of allowance for impairment are as follows:
2018 2017
As at 1 January (4,126) (4,332)Addition (16,745) —Write-off — 206 As at 31 December (20,871) (4,126)
Details of impairment assessment of other receivables for the year ended 31 December 2018 are set out in Note 35.2(b) (ii).
15. CASH AND BANK
As at 31 December2018 2017
Restricted bank deposits (a) 330,948 415,135Cash and cash equivalents – Cash on hand 8,680 9,547 – Deposits in bank 677,956 1,123,550
1,017,584 1,548,232
Notes:
(a) As at 31 December 2018, bank deposits amounting to RMB330,948,000 (31 December 2017: RMB385,135,000) were held as securities for letter of guarantee and issuance of notes payable. As at 31 December 2017, bank deposits amounting to RMB30,000,000 were held as securities for securing short-term bank borrowings (Note 19(b)). The restricted bank deposits carried a fixed interest rate at 0.35% per annum as at 31 December 2018 (2017: 0.35% per annum).
(b) Cash and bank were denominated in the following currencies:
As at 31 December2018 2017
RMB 486,999 411,330US$ 467,522 1,053,924Hong Kong dollar (“HK$”) 13,132 14,178Others 49,931 68,800
1,017,584 1,548,232
(c) As at 31 December 2018, cash and cash equivalents were bank deposits bearing market interest rate at 0.35% per annum (31 December 2017: 0.35% per annum).
(d) Details of impairment assessment of restricted bank deposits and cash and cash equivalents for the year ended 31 December 2018 are set out in Note 35.2(b) (iii).

Notes to the Consolidated Financial StatementsFor the year ended 31 December 2018(Amounts expressed in thousands of RMB, unless otherwise stated)
130 Anton Oilfield Services Group Annual Report 2018
16. SHARE CAPITAL AND SHARE OPTIONS
Number ofshares issuedand fully paid
of HK$0.1 each(thousands) Share capital
HK$’000 RMB’000
Ordinary shares issued and fully paid:As at 1 January 2017 2,437,816 243,781 226,578Issue of new shares (ii) 221,620 22,162 19,625Exercise of share options (i) 798 80 68 As at 31 December 2017 2,660,234 266,023 246,271Issue of new shares (ii) 334,225 33,423 28,936Exercise of share options (i) 8,464 846 752 As at 31 December 2018 3,002,923 300,292 275,959
Notes:
(i) Share options
During the year ended 31 December 2018, options to subscribe for 70,000,000 shares at the exercise price of HK$1.020 (2017: 100,000,000 shares at the exercise price of HK$0.810) have been conditionally granted to three independent non-executive directors, other executive directors and certain key employees. 2,100,000 shares granted to independent non-executive directors have a 2-year vesting period, 50% each exercisable per year and the other 67,900,000 shares have a 3-year vesting period, 33.33% each exercisable per year, on the premises of achieving the performance conditions of the Group set out in the share option scheme. The options have an option period of 6 years.
Movements in the number of share options outstanding and their related weighted average exercise prices are as follows:
Averageexercise Number of
price in HK$ share optionsper share (thousands)
As at 1 January 2017 132,643Granted (on 23 May 2017) 0.810 100,000Forfeited 0.901 (9,850)Exercised 0.740 (798)Expired 3.878 (17,023) As at 1 January 2018 204,972Granted (on 03 April 2018) 1.020 70,000Forfeited 0.801 (2,340)Exercised 0.751 (8,464) As at 31 December 2018 264,168

Notes to the Consolidated Financial StatementsFor the year ended 31 December 2018
(Amounts expressed in thousands of RMB, unless otherwise stated)
131Anton Oilfield Services Group Annual Report 2018
16. SHARE CAPITAL AND SHARE OPTIONS (Continued)
Notes: (Continued)
(i) Share options (Continued)
Share options outstanding (in thousands) at the end of the year have the following expiry dates and exercise prices:
Number ofshare options
(thousands)As at
Exercise price 31 DecemberExpiry date HK$ per share 2018
20 June 2019 5.742 1,27627 June 2019 5.600 8219 November 2019 4.960 7623 February 2022 0.740 86,53431 March 2022 0.800 6,3001 December 2022 1.100 2,21622 May 2023 0.810 98,0342 April 2024 1.020 69,650
264,168
The exercise price of the granted options is equal to the highest of (i) the closing price of the shares of the Company in the daily quotation sheet issued by the Stock Exchange on the date of grant; (ii) the average closing price of the shares as stated in the daily quotation sheets issued by the Stock Exchange for the five business days immediately preceding the date of grant; and (iii) the par value of the shares. Options are conditional on the employee completing one to three years’ service (the vesting period) and have a contractual option term of six years. The Group has no legal or constructive obligation to repurchase or settle the options in cash.
As of 31 December 2018, out of the 264,168,000 options (31 December 2017: 204,972,000 options), 96,702,000 options (31 December 2017: 35,715,000 options) were exercisable. Options exercised in 2018 resulted in 8,464,000 shares (31 December 2017: 798,000 shares) being issued at a weighted average price of HK$0.751(31 December 2017: HK$0.740) each. The related weighted average share price at the time of exercise was HK$1.221 per share in 2018 (2017: HK$0.933).
The fair value of the options granted during the year ended 31 December 2018 was determined using the Binomial Option Pricing Model. The major assumptions used in the pricing model for options granted on 3 April 2018 were the exercise prices shown above and other parameters are shown below:
Options granted Options grantedParameters in 2018 in 2017
Share price as of the valuation date (HK$) 1.02 0.81Expected dividend yield — —Forfeiture rate 0.50% 0.34%Exercise multiples 3.39-3.54 3.39-3.54Maturity years 6 6Risk free rate 1.83% 1.14%Annualised volatility 58.95% 56.91%
The weighted average fair value of options granted during the year determined using the Binomial valuation model was HK$0.540 per option (2017: HK$0.410 per option). The volatility measured at the standard deviation of continuously compounded share returns is derived from historical volatility of the share price over the last 6 years.
The total expense recognised in the consolidated statement of profit or loss for the year ended 31 December 2018 for share options amounted to RMB24,094,000 (31 December 2017: RMB16,490,000), with a corresponding amount credited in capital reserve (Note 17).

Notes to the Consolidated Financial StatementsFor the year ended 31 December 2018(Amounts expressed in thousands of RMB, unless otherwise stated)
132 Anton Oilfield Services Group Annual Report 2018
16. SHARE CAPITAL AND SHARE OPTIONS (Continued)
Notes: (Continued)
(ii) On 22 December 2017, the Company, Anton Oilfield Services Company International Limited (“Anton International”) and Anton Oilfield Services DMCC (“DMCC”) entered into an agreement with China Oil HBP and Hong Kong Huihua Global Technology Limited (“Huihua”), a wholly-owned subsidiary of China Oil HBP, pursuant to which the Group will acquire from Huihua 40% of the issued share capital of DMCC for the consideration of RMB735,000,000. The consideration for the acquisition was settled as to RMB450,000,000 by cash and as to RMB285,000,000 by the issuance of an aggregate of 334,224,599 new shares of the Company to Huihua at the issue price of HK$1.014 per share. The issuance of new shares was completed on 27 July 2018. The issuance shares represent approximately 12.54% of the then existing issued share capital of the Company and approximately 11.14% of the Company’s then issued share capital as enlarged by the issuance, respectively. The new shares rank pari passu with other existing shares in all respects.
On 15 December 2016, the Company entered into a subscription agreement with a third party pursuant to which the third party agreed to subscribe new shares of 221,620,000 at HK$1.008 per share. The subscription was completed on 25 January 2017. The subscription shares represent approximately 9.09% of the then existing issued share capital of the Company and approximately 8.33% of the Company’s then issued share capital as enlarged by the subscription, respectively. The new shares rank pari passu with other existing shares in all respects.
17. RESERVES
Share Capital Statutory Retained Otherpremium reserve reserve(c) earnings reserves Total
As at 1 January 2017 634,616 378,739 76,900 611,641 (383,589) 1,318,307Profit for the year — — — 54,495 — 54,495Net investment hedge (b) — — — — 72,055 72,055Currency translation differences (a) — — — — (43,659) (43,659)Issue of ordinary shares (Note16 (ii)) 178,194 — — — — 178,194Share option exercised 433 — — — — 433Share option scheme (Note16 (i)) — 16,490 — — — 16,490Termination of put option — — — — 715,453 715,453 As at 31 December 2017 813,243 395,229 76,900 666,136 360,260 2,311,768 Adjustments (Note 2.3) — — — (68,763) — (68,763)Balance at 1 January 2018 (restated) 813,243 395,229 76,900 597,373 360,260 2,243,005Profit for the year — — — 222,423 — 222,423Net investment hedge (b) — — — — (64,317) (64,317)Currency translation differences (a) — — — — 66,783 66,783Issue of ordinary shares (Note16 (ii)) 256,064 — — — — 256,064Share option exercised 4,384 — — — — 4,384Share option scheme (Note16 (i)) — 24,094 — — — 24,094Acquisition of non-controlling interests (Note 37(b)) — — — — (382,521) (382,521) As at 31 December 2018 1,073,691 419,323 76,900 819,796 (19,795) 2,369,915

Notes to the Consolidated Financial StatementsFor the year ended 31 December 2018
(Amounts expressed in thousands of RMB, unless otherwise stated)
133Anton Oilfield Services Group Annual Report 2018
17. RESERVES (Continued)
Notes:
(a) Translation reserve
2018 2017
Items that may be reclassified subsequently to profit or loss:At 1 January 147,937 191,596Currency translation differences 66,783 (43,659) At 31 December 214,720 147,937
Currency translation differences relating to the translation of the Group’s foreign operations from their functional currencies to the Group’s presentation currency are recognised directly in other comprehensive income and accumulated in the translation reserve which is shown in other reserves. Currency translation differences accumulated in the translation reserve are reclassified to profit or loss on the disposal/partial disposal of the foreign operations.
(b) Hedging reserve
2018 2017
Items that may be reclassified subsequently to profit or loss:At 1 January (54,108) (126,163)Net investment hedge (64,317) 72,055 At 31 December (118,425) (54,108)
The net investment hedging reserve represents the cumulative effective portion of gains and losses arising on changes in exchange rate of hedging instruments entered into for net investment hedge. The cumulative gain and loss arising on changes in exchange rate of the hedging instrument that are recognised and accumulated under the heading of net investment hedging reserve which is further shown in other reserves will be reclassified to profit or loss on the disposal/partial disposal of the foreign operations.
During the year ended 31 December 2018, a proportion of the Group’s US$ denominated long-term bonds amounting to US$256,364,000 (2017: US$241,654,000) has been designated as hedging instrument for the US$ denominated net investment in the Group’s overseas subsidiaries. For the year ended 31 December 2018, foreign exchange translation loss of RMB64,317,000 (2017: gain of RMB72,055,000) on the hedging instrument was recognised in other comprehensive income as deduction in other reserves.
(c) Statutory reserve
Subsidiaries established in the PRC shall appropriate 10% of their annual statutory net profit (after offsetting any prior years’ losses) to the statutory reserve fund account in accordance with the PRC Company Law and their articles of association. When the balance of such reserve fund reaches 50% of each entity’s share capital, any further appropriation is optional. The statutory reserve fund can be utilised to offset prior years’ losses or increase capital after approval. However, except for offsetting prior years’ losses, the statutory reserve fund must be maintained at a minimum of 25% of share capital after such usage.

Notes to the Consolidated Financial StatementsFor the year ended 31 December 2018(Amounts expressed in thousands of RMB, unless otherwise stated)
134 Anton Oilfield Services Group Annual Report 2018
18. LONG-TERM BONDS
As at As at31 December 31 December Effective
Issue date Par value Coupon rate 2018 2017 interest rate
31 October 2013 (a) US$71 million 7.50% — 461,588 8.31%5 December 2017 (b) US$176.4 million 9.75% 1,234,145 1,108,990 8.31%5 December 2017 (b) US$123.6 million 9.75% 831,756 776,834 11.62% Subtotal 2,065,901 2,347,412 Less: Current portion (14,498) (461,588)
2,051,403 1,885,824
Notes:
(a) The Company issued US$250 million 7.50% senior notes at par value on 31 October 2013, in which US$2 million, US$1 million and US$3.75 million were repurchased during the year ended 31 December 2015, 2016 and 2017, respectively. In addition to which, US$172.2 million of these senior notes were settled by exchanging with part of the senior notes as described in Note (b) below. The notes mature in 5 years from the issue date at their nominal value. Interest is payable on a semi-annually basis. The Company has fully repaid the rest of the senior notes during the year ended 31 December 2018. As at 31 December 2018, no interest payable for the senior notes (31 December 2017: RMB5.3 million).
(b) The Company issued US$300 million 9.75% senior notes at discount of par value on 5 December 2017 with direct transaction costs amounting to RMB39,989,000, in which US$176.4 million were arranged to exchange the senior notes issued on 31 October 2013 in the amount of US$172.2 million during the year ended 31 December 2017. The exchange is accounted as a non-substantial modification of financial liabilities. The notes mature in 3 years from the issue date at their nominal value. Interest is payable on a semi-annually basis. As at 31 December 2018, interest payable amounted to approximately RMB14.5 million (31 December 2017: RMB13.8 million).
19. BORROWINGS
As at 31 December
2018 2018 2017 2017Amount Interest Rate Amount Interest Rate
Long-term borrowings – Secured – RMB denominated (a) 325,555 8.41%-9.70% 177,322 5.94%-10.73%Less: Current portion (82,214) (141,105)
243,341 36,217 Short-term bank borrowings – Unsecured – RMB denominated 248,393 5.66%-6.53% 359,000 5.22%-6.53% – Secured – RMB denominated (b) 444,408 5.22%-7.50% 441,320 5.22%-6.89% – USD denominated (b) 85,720 4.70% —Other short-term borrowings – Unsecured – RMB denominated (c) 100,671 5.66% 80,000 5.66%
879,192 880,320
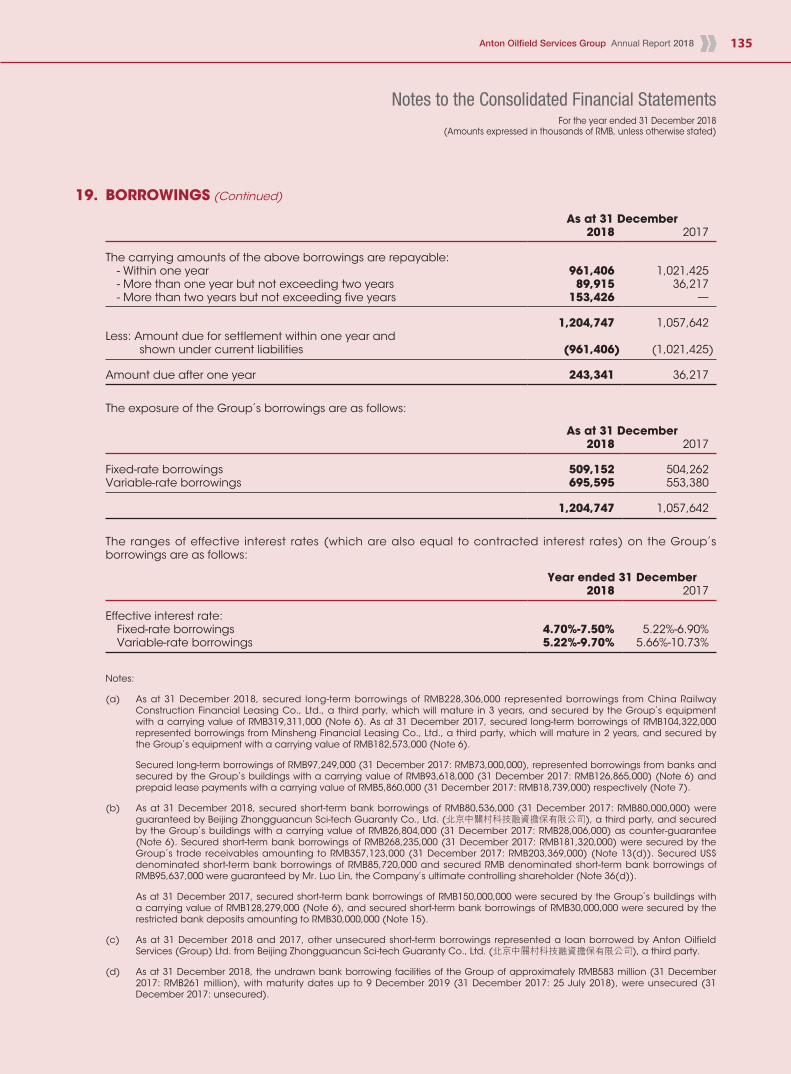
Notes to the Consolidated Financial StatementsFor the year ended 31 December 2018
(Amounts expressed in thousands of RMB, unless otherwise stated)
135Anton Oilfield Services Group Annual Report 2018
19. BORROWINGS (Continued)
As at 31 December2018 2017
The carrying amounts of the above borrowings are repayable: - Within one year 961,406 1,021,425 - More than one year but not exceeding two years 89,915 36,217 - More than two years but not exceeding five years 153,426 —
1,204,747 1,057,642Less: Amount due for settlement within one year and shown under current liabilities (961,406) (1,021,425) Amount due after one year 243,341 36,217
The exposure of the Group’s borrowings are as follows:
As at 31 December2018 2017
Fixed-rate borrowings 509,152 504,262Variable-rate borrowings 695,595 553,380
1,204,747 1,057,642
The ranges of effective interest rates (which are also equal to contracted interest rates) on the Group’s borrowings are as follows:
Year ended 31 December2018 2017
Effective interest rate: Fixed-rate borrowings 4.70%-7.50% 5.22%-6.90% Variable-rate borrowings 5.22%-9.70% 5.66%-10.73%
Notes:
(a) As at 31 December 2018, secured long-term borrowings of RMB228,306,000 represented borrowings from China Railway Construction Financial Leasing Co., Ltd., a third party, which will mature in 3 years, and secured by the Group’s equipment with a carrying value of RMB319,311,000 (Note 6). As at 31 December 2017, secured long-term borrowings of RMB104,322,000 represented borrowings from Minsheng Financial Leasing Co., Ltd., a third party, which will mature in 2 years, and secured by the Group’s equipment with a carrying value of RMB182,573,000 (Note 6).
Secured long-term borrowings of RMB97,249,000 (31 December 2017: RMB73,000,000), represented borrowings from banks and secured by the Group’s buildings with a carrying value of RMB93,618,000 (31 December 2017: RMB126,865,000) (Note 6) and prepaid lease payments with a carrying value of RMB5,860,000 (31 December 2017: RMB18,739,000) respectively (Note 7).
(b) As at 31 December 2018, secured short-term bank borrowings of RMB80,536,000 (31 December 2017: RMB80,000,000) were guaranteed by Beijing Zhongguancun Sci-tech Guaranty Co., Ltd. (北京中關村科技融資擔保有限公司), a third party, and secured by the Group’s buildings with a carrying value of RMB26,804,000 (31 December 2017: RMB28,006,000) as counter-guarantee (Note 6). Secured short-term bank borrowings of RMB268,235,000 (31 December 2017: RMB181,320,000) were secured by the Group’s trade receivables amounting to RMB357,123,000 (31 December 2017: RMB203,369,000) (Note 13(d)). Secured US$ denominated short-term bank borrowings of RMB85,720,000 and secured RMB denominated short-term bank borrowings of RMB95,637,000 were guaranteed by Mr. Luo Lin, the Company’s ultimate controlling shareholder (Note 36(d)).
As at 31 December 2017, secured short-term bank borrowings of RMB150,000,000 were secured by the Group’s buildings with a carrying value of RMB128,279,000 (Note 6), and secured short-term bank borrowings of RMB30,000,000 were secured by the restricted bank deposits amounting to RMB30,000,000 (Note 15).
(c) As at 31 December 2018 and 2017, other unsecured short-term borrowings represented a loan borrowed by Anton Oilfield Services (Group) Ltd. from Beijing Zhongguancun Sci-tech Guaranty Co., Ltd. (北京中關村科技融資擔保有限公司), a third party.
(d) As at 31 December 2018, the undrawn bank borrowing facilities of the Group of approximately RMB583 million (31 December 2017: RMB261 million), with maturity dates up to 9 December 2019 (31 December 2017: 25 July 2018), were unsecured (31 December 2017: unsecured).

Notes to the Consolidated Financial StatementsFor the year ended 31 December 2018(Amounts expressed in thousands of RMB, unless otherwise stated)
136 Anton Oilfield Services Group Annual Report 2018
20. TRADE AND NOTES PAYABLES
As at 31 December2018 2017
Trade payables – related parties (Note 36(c)) 13,094 87,796 – others 468,297 453,367Notes payable 232,700 143,984
714,091 685,147
Ageing analysis of trade and notes payables at the reporting date was as follows:
As at 31 December2018 2017
Less than 1 year 596,564 559,8871 - 2 years 43,527 83,8452 - 3 years 34,465 27,582Over 3 years 39,535 13,833
714,091 685,147
Trade and notes payables were denominated in the following currencies:
As at 31 December2018 2017
RMB 607,052 496,993US$ 80,536 86,026Others 26,503 102,128
714,091 685,147

Notes to the Consolidated Financial StatementsFor the year ended 31 December 2018
(Amounts expressed in thousands of RMB, unless otherwise stated)
137Anton Oilfield Services Group Annual Report 2018
21. ACCRUALS AND OTHER PAYABLES
As at 31 December2018 2017
Advance from customers — 20,146Payroll and welfare payables 33,406 27,750Taxes other than income taxes payable 14,053 64,247Payables to equipment venders 226,969 192,601Dividend payable (Note) 55,711 191,753Others 125,139 161,727
455,278 658,224
Note:
During the current year, dividend due to China Oil HBP amounting to RMB136,042,000 was settled by non-cash transaction. For detailed information, please refer to Note (a) of the consolidated statement of cash flows.
22. DEFERRED INCOME TAX
For the purpose of presentation in the consolidated statement of financial position, certain deferred income tax assets and liabilities have been offset. The following is the analysis of the deferred income tax balances for financial reporting purposes:
As at 31 December2018 2017
Deferred income tax assets 52,076 63,743 Deferred income tax liabilities 10,440 10,661
41,636 53,082

Notes to the Consolidated Financial StatementsFor the year ended 31 December 2018(Amounts expressed in thousands of RMB, unless otherwise stated)
138 Anton Oilfield Services Group Annual Report 2018
22. DEFERRED INCOME TAX (Continued)
Deferred tax assets:
Impairmentprovision ofreceivables
Taxable and Unrealisedlosses inventories profit Total
As at 1 January 2017 47,160 5,174 — 52,334Credited to the consolidated statement of profit or loss 7,314 1,106 2,989 11,409 As at 31 December 2017 54,474 6,280 2,989 63,743 (Debited)/credited to the consolidated statement of profit or loss (23,169) 7,509 3,993 (11,667) As at 31 December 2018 31,305 13,789 6,982 52,076
Deferred income tax assets are recognised to the extent that the realisation of the related tax benefit through future taxable profits is probable. As at 31 December 2018, the Group did not recognise deferred income tax assets of RMB81,540,000 (31 December 2017: RMB66,912,000) in respect of accumulated tax losses and temporary difference amounting to RMB284,816,000 (31 December 2017: RMB248,119,000) that can be carried forward against taxable income as the Group is going to dissolve the subsidiaries or the losses are considered as unrecoverable in 5 years.
Deferred tax liabilities:
Fair valueadjustment from Withholding tax
acquisition of on investment Capitalisedsubsidiaries income borrowing costs Total
As at 1 January 2017 16 3,717 585 4,318Credited to the consolidated statement of profit or loss (181) — (585) (766)Acquisition of a subsidiary 7,109 — — 7,109 As at 31 December 2017 6,944 3,717 — 10,661Credited to the consolidated statement of profit or loss (221) — — (221) As at 31 December 2018 6,723 3,717 — 10,440
As at 31 December 2018, deferred income tax liabilities of RMB33,515,000 (31 December 2017: RMB28,815,000) have not been recognised for the withholding tax relating to the unremitted earnings of subsidiaries. Deferred income tax liability is not recognised where the timing of the reversal of the temporary difference is controlled by the Group and it is probable that the temporary difference will not reverse in the foreseeable future.

Notes to the Consolidated Financial StatementsFor the year ended 31 December 2018
(Amounts expressed in thousands of RMB, unless otherwise stated)
139Anton Oilfield Services Group Annual Report 2018
23. REVENUE
Year ended 31 December2018 2017
Sales of goods 238,636 113,723Provision of services 2,636,561 2,048,271Rental 60,691 40,708
2,935,888 2,202,702
(i) Disaggregation of revenue
For the year ended 31 December 2018Oil
Drilling Well productionSegments technology completion services
Types of goods or serviceSales of goods 90,374 115,515 32,747Provision of services 1,190,277 624,813 821,471 Total 1,280,651 740,328 854,218 Geographical marketsPRC 529,454 378,773 114,772Iraq 309,772 202,626 658,164Other countries 441,425 158,929 81,282 Total 1,280,651 740,328 854,218 Timing of revenue recognitionA point in time 1,280,651 740,328 307,529Over time — — 546,689 Total 1,280,651 740,328 854,218
Set out below is the reconciliation of the revenue from contracts with customers with the amounts disclosed in the segment information.
For the year ended 31 December 2018Oil
Drilling Well productiontechnology completion services
Revenue disclosed in segment informationExternal customers 1,339,850 741,820 854,218Inter-segment 1,421,758 901,348 241,938 Total 2,761,608 1,643,168 1,096,156 Inter-segment eliminations (1,421,758) (901,348) (241,938)Rental income (59,199) (1,492) — Revenue from contracts with customers 1,280,651 740,328 854,218

Notes to the Consolidated Financial StatementsFor the year ended 31 December 2018(Amounts expressed in thousands of RMB, unless otherwise stated)
140 Anton Oilfield Services Group Annual Report 2018
23. REVENUE (Continued)
(ii) Performance obligations for contracts with customers
a. Provision of oilfield technology services (excluding operation and maintenance
services)
The Group provides oilfield technology services (excluding operation and maintenance services) which include drilling technology, well completion and part of oil production services to customers like large multinational and state-owned oil companies.
Such services are each recognised as a performance obligation in different stages of a contract, with transaction price allocated to the different and separate performance obligations on a relative stand-alone price basis. Revenue will be recognised for each of these performance obligations when control over the corresponding services is transferred to the customer. Since the services are expected to meet certain specified technological criteria which are not simply based on size and weight characteristics, the Group cannot objectively determine that the services provided to the customer are in accordance with the agreed-upon specifications in the contract and then the Group would not be able to conclude that the customer has obtained control until it receives the customer’s acceptance. Therefore, the revenue from oilfield technology services (excluding operation and maintenance services) is recognised at a point when the customer acceptance is concluded.
The Group’s contracts for such services include the Group’s entitlement to payment which requires customer acceptance.
The contract assets (retention money receivables from large multinational and state-owned oil companies), net of contract liabilities related to the same contract, primarily relate to the Group’s right to consideration for services completed and not billed because the rights are conditioned on the Group’s achieving specified milestones as stipulated in the contracts at the reporting date. The contract assets are transferred to trade receivables when the rights become unconditional. The Group typically agrees to a one-year retention period for 5% of the transaction price for certain customers like some large multinational and state-owned oil companies. This amount is included in contract assets until the end of the retention period as the Group’s entitlement to this final payment is conditional on achieving specified milestones as stipulated in the contracts. The Group classifies these contract assets as current because the Group expects to realise them in its normal operating cycle. The Group typically bills the retention money receivables in one year after the completion of relevant services when trade receivables will be recognised.

Notes to the Consolidated Financial StatementsFor the year ended 31 December 2018
(Amounts expressed in thousands of RMB, unless otherwise stated)
141Anton Oilfield Services Group Annual Report 2018
23. REVENUE (Continued)
(ii) Performance obligations for contracts with customers (Continued)
b. Provision of oilfield-related operation and maintenance services
The Group provides oilfield-related operation and maintenance services which include oil production services to customers.
Such services are recognised as a performance obligation satisfied over time as the customer simultaneously receives and consumes the benefits during the course of operation and maintenance services provided by the Group based on the fact that these services are routine with no complicated processes involved and customer acceptance is a formality. Revenue from these services is recognised based on hours and unit labour cost using output method.
Payment of the transaction price will be settled monthly over the period of service.
c. Sales of oilfield-related goods
The Group sells oilfield-related goods, such as drilling tools, tubing and casing to customers.
Since the goods are not self-manufactured and the Group is not entitled to payment until the customer receives and accepts the goods, revenue will be recognised at a point when control over the corresponding goods is transferred to the customer.
The Group’s contracts for such sales of goods include payment in the normal credit term granted to customers.
(iii) Transaction price allocated to the remaining performance obligation for contracts with customers
The transaction price allocated to the remaining performance obligations (unsatisfied or partially unsatisfied) as at 31 December 2018 and the expected timing of recognising revenue are as follows:
PRC Iraq Other countries
Within one year 488,499 1,391,645 152,434More than one year but not more than two years 406,347 1,233,367 44,500More than two years 118,594 484,798 30,146
1,013,440 3,109,810 227,080

Notes to the Consolidated Financial StatementsFor the year ended 31 December 2018(Amounts expressed in thousands of RMB, unless otherwise stated)
142 Anton Oilfield Services Group Annual Report 2018
24. EXPENSE BY NATURE
Operating profit is arrived at after charging the following:
Year ended 31 December2018 2017
Materials and services purchased 835,697 726,523Staff costs 576,029 377,151In which: – Salaries and other staff expenses 551,935 360,661 – Share-based compensation (Note 16(i)) 24,094 16,490Depreciation 278,817 217,962Less: Capitalised in inventories 17,240 16,305
261,577 201,657 Amortisation 39,434 25,035Less: Capitalised in inventories 2,992 2,265
36,442 22,770 In which: – Cost of sales 29,030 17,866 – Administrative expenses 2,006 2,857 – Selling expenses — 70 – Research and development expenses 5,406 1,977Sales tax and surcharges 10,346 11,145Auditor’s remuneration – Audit and related services 4,200 3,900 – Other services 200 500Other operating expenses 579,066 395,036In which: – Impairment of trade receivables 58,456 22,838 – Impairment of other receivables 16,745 — – Impairment of inventories 16,353 6,989

Notes to the Consolidated Financial StatementsFor the year ended 31 December 2018
(Amounts expressed in thousands of RMB, unless otherwise stated)
143Anton Oilfield Services Group Annual Report 2018
25. OTHER GAINS, NET
Year ended 31 December2018 2017
Government grants and subsidies (a) 3,155 5,193(Loss)/gain on disposal of property, plant and equipment (688) 1,141Donation (184) —Others 9,649 3,340
11,932 9,674
Note:
(a) Government grants and subsidies of RMB3,155,000 (2017: RMB5,193,000) were received in the current year towards awarding of research and development expenditures.
26. IMPAIRMENT LOSSES, NET OF REVERSAL
Year ended 31 December2018 2017
Impairment losses recognised on: – Trade receivables - goods and services 58,456 22,838 – Other receivables 16,745 —
75,201 22,838
Details of impairment assessment for the year ended 31 December 2018 are set out in Note 35.2(b).
27. FINANCE COSTS, NET
Year ended 31 December2018 2017
Interest expenses – on bank borrowings (83,977) (61,010) – on bonds (200,755) (148,467)Exchange gain/(loss), net 1,401 (42,207)Others (16,688) (19,947) Finance expenses (300,019) (271,631) Interest income 2,565 3,759
(297,454) (267,872)
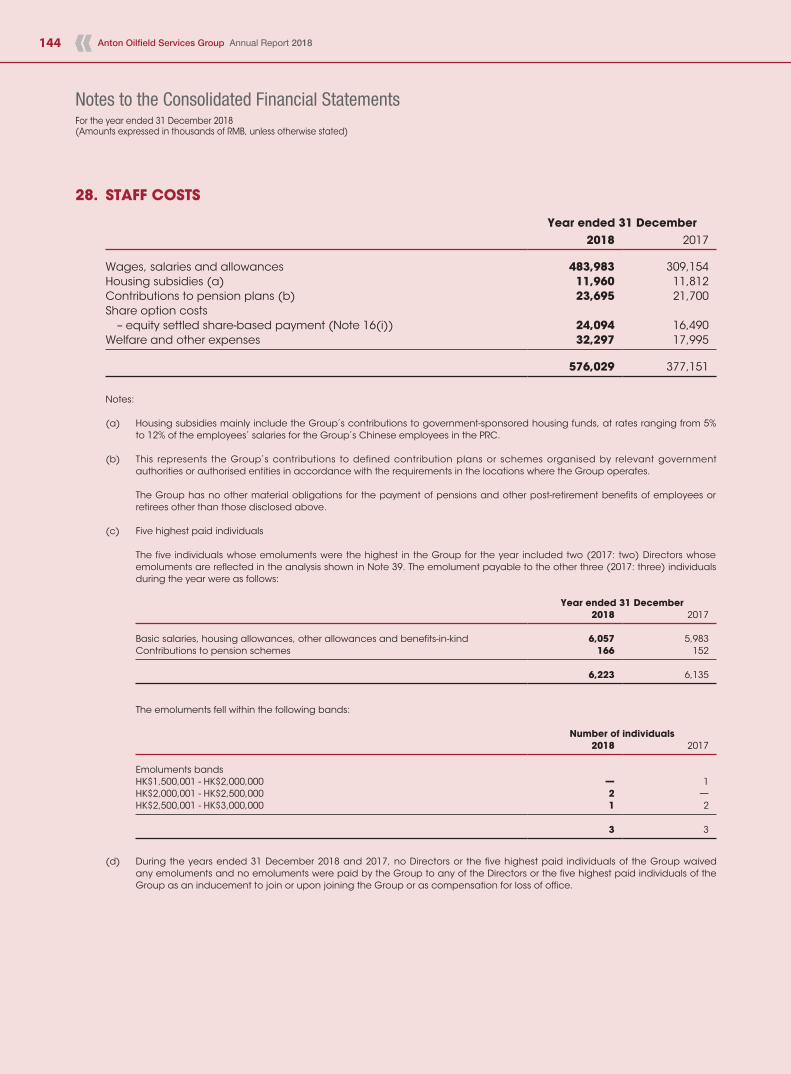
Notes to the Consolidated Financial StatementsFor the year ended 31 December 2018(Amounts expressed in thousands of RMB, unless otherwise stated)
144 Anton Oilfield Services Group Annual Report 2018
28. STAFF COSTS
Year ended 31 December2018 2017
Wages, salaries and allowances 483,983 309,154Housing subsidies (a) 11,960 11,812Contributions to pension plans (b) 23,695 21,700Share option costs – equity settled share-based payment (Note 16(i)) 24,094 16,490Welfare and other expenses 32,297 17,995
576,029 377,151
Notes:
(a) Housing subsidies mainly include the Group’s contributions to government-sponsored housing funds, at rates ranging from 5% to 12% of the employees’ salaries for the Group’s Chinese employees in the PRC.
(b) This represents the Group’s contributions to defined contribution plans or schemes organised by relevant government authorities or authorised entities in accordance with the requirements in the locations where the Group operates.
The Group has no other material obligations for the payment of pensions and other post-retirement benefits of employees or retirees other than those disclosed above.
(c) Five highest paid individuals
The five individuals whose emoluments were the highest in the Group for the year included two (2017: two) Directors whose emoluments are reflected in the analysis shown in Note 39. The emolument payable to the other three (2017: three) individuals during the year were as follows:
Year ended 31 December2018 2017
Basic salaries, housing allowances, other allowances and benefits-in-kind 6,057 5,983Contributions to pension schemes 166 152
6,223 6,135
The emoluments fell within the following bands:
Number of individuals2018 2017
Emoluments bandsHK$1,500,001 - HK$2,000,000 — 1HK$2,000,001 - HK$2,500,000 2 —HK$2,500,001 - HK$3,000,000 1 2
3 3
(d) During the years ended 31 December 2018 and 2017, no Directors or the five highest paid individuals of the Group waived any emoluments and no emoluments were paid by the Group to any of the Directors or the five highest paid individuals of the Group as an inducement to join or upon joining the Group or as compensation for loss of office.

Notes to the Consolidated Financial StatementsFor the year ended 31 December 2018
(Amounts expressed in thousands of RMB, unless otherwise stated)
145Anton Oilfield Services Group Annual Report 2018
29. INCOME TAX EXPENSE
Year ended 31 December2018 2017
Current income tax – PRC enterprise income tax 2,297 2,512 – Iraq corporate income tax 80,562 41,659 – Others 2,138 1,651Deferred income tax (Note 22) 11,446 (12,175)
96,443 33,647
The Company is incorporated in the Cayman Islands as an exempted company with limited liability under the Companies Law of the Cayman Islands and, accordingly, is exempted from payment of Cayman Islands income tax.
PRC enterprise income tax (“EIT”) is provided on the basis of estimated taxable profits of PRC established subsidiaries at applicable tax rate of 25% in 2018 (2017: 25%), based on the relevant PRC tax laws and regulations. Certain subsidiaries have been granted a preferential rate of 15% as high technology enterprises or as enterprises set up in western area of the PRC. Certain entities were qualified for a tax holiday of 2-year exemption and 3-year 50% reduction in 2017, pursuant to Caishui [2008] No.1.
The corporate income tax of Iraq entities is levied at the higher of 7% on the total turnover, or 35% on the net taxable profit.
The taxation of the Group’s profit before income tax differs from the theoretical amount that would arise using applicable tax rates of the Group companies as follows:
Year ended 31 December2018 2017
Profit before income tax 347,164 204,921Tax calculated at applicable tax rates 77,857 22,311Income not subject to taxation (62) (2,718)Expenses not deductible for taxation purposes 6,048 1,143Additional deduction of research and development expense (1,568) (1,583)Tax losses and deductible temporary difference for which no deferred income tax was recognised 21,018 35,387Utilisation of unused deductible tax losses previously not recognised as deferred income tax (6,390) (105)Recognition of the deferred income tax assets for unused deductible tax losses from prior years — (21,224)Effect of share of (profit)/loss of a joint venture (53) 135Others (407) 301
96,443 33,647

Notes to the Consolidated Financial StatementsFor the year ended 31 December 2018(Amounts expressed in thousands of RMB, unless otherwise stated)
146 Anton Oilfield Services Group Annual Report 2018
30. EARNINGS PER SHARE
(a) Basic
Basic earnings per share is calculated by dividing the profit attributable to the owners of the Company by the weighted average number of ordinary shares in issue during the year.
Year ended 31 December2018 2017
Profit attributable to the owners of the Company 222,423 54,495Weighted average number of ordinary shares in issue (thousands of shares) 2,807,453 2,644,785 Basic earnings per share (expressed in RMB per share) 0.0792 0.0206
(b) Diluted
Diluted earnings per share is calculated adjusting the weighted average number of ordinary shares outstanding to assume conversion of all dilutive potential ordinary shares. For the year ended 31 December 2018 and 2017, the only dilutive factor of the Company was the outstanding share options.
Year ended 31 December2018 2017
Profit attributable to the owners of the Company 222,423 54,495Weighted average number of ordinary shares in issue (thousands of shares) 2,807,453 2,644,785Adjustments for assumed conversion of share options (thousands of shares) 34,154 9,456 Weighted average number of ordinary shares for computation of diluted earnings per share (thousands of shares) 2,841,607 2,654,241 Diluted earnings per share (expressed in RMB per share) 0.0783 0.0205
31. DIVIDENDS
Subsequent to the end of the reporting period, a final dividend in respect of the year ended 31 December 2018 of RMB1 cent (2017: Nil) per ordinary share, in an aggregate amount of RMB30,000,000 (2017: Nil), has been proposed by the Directors and is subject to approval by the shareholders in the forthcoming general meeting.

Notes to the Consolidated Financial StatementsFor the year ended 31 December 2018
(Amounts expressed in thousands of RMB, unless otherwise stated)
147Anton Oilfield Services Group Annual Report 2018
32. NOTES TO THE CONSOLIDATED STATEMENT OF CASH FLOWS
(a) Reconciliation of profit for the year to net cash inflows generated from operations:
Year ended 31 DecemberNotes 2018 2017
Profit for the year 250,721 171,274Adjustments for: Property, plant and equipment – Depreciation charge 261,577 201,657 – Loss/(gain) on disposals 688 (1,141) Amortisation of prepaid lease payments of land and intangible assets 36,442 22,770 Amortisation of long-term deferred and prepaid expenses 5,694 4,923 Addition of impairment of receivables 75,201 22,838 Addition of impairment of inventories 16,353 6,989 Charge of share option scheme 24,094 16,490 Share of (profit)/loss of a joint venture (355) 901 Gains on acquisition of a subsidiary — (121) Net foreign exchange (gain)/loss (1,401) 42,207 Interest income (2,565) (3,759) Interest expenses on bank borrowings and bonds 284,732 209,477 Income tax expense 96,443 33,647 Operating cash flows before movements in working capital 1,047,624 728,152Changes in working capital: (ii) – Inventories (173,247) 120,270 – Trade and notes receivables (i) (345,468) (486,556) – Contract assets (58,579) — – Prepayments and other receivables and value-added tax recoverable 2,797 (129,620) – Trade and notes payables (89,725) (119,700) – Accruals and other payables 4,666 131,506 – Contract liabilities 38,814 — – Restricted bank deposits 54,187 (3,810) Net cash inflows from operations 481,069 240,242
Note (i): For detailed non-cash transaction information, please refer to Note (a) of the consolidated statement of cash flows.
Note (ii): For the purpose of reporting cash flows from operating activities under indirect method for the year ended 31 December 2018, movements in working capital have been computed based on opening statement of financial position as at 1 January 2018 as disclosed in Note 2.3.

Notes to the Consolidated Financial StatementsFor the year ended 31 December 2018(Amounts expressed in thousands of RMB, unless otherwise stated)
148 Anton Oilfield Services Group Annual Report 2018
33. RECONCILIATION OF ASSETS AND LIABILITIES ARISING FROM FINANCING ACTIVITIES
The table below details changes in the Group’s assets and liabilities arising from financing activities, including both cash and non-cash changes. Liabilities arising from financing activities are those for which cash flows were, or future cash flows will be, classified in the Group’s consolidated statement of cash flows as cash flows from financing activities.
Accruals Prepayments OtherLong-term and other and other non-current Restricted
Borrowings bonds payables receivables assets bank deposits TotalNote 19 Note 18 Note (i) Note 14 Note 11 Note 19(b)
As at 31 December 2017 1,057,642 2,347,412 270,418 (14,000) (299,229) (30,000) 3,332,243Adjustment upon application of IFRS 9 (Note 2.3) — 68,763 — — — — 68,763As at 1 January 2018 1,057,642 2,416,175 270,418 (14,000) (299,229) (30,000) 3,401,006Financing cash flows 63,128 (650,453) (78,665) 500 (165,191) 30,000 (800,681)Acquisition of non-controlling Interests (Note 37(b)) — — 920 — 465,191 — 466,111Currency translation differences — 99,424 — — (771) — 98,653Interest expenses 83,977 200,755 — — — — 284,732Other changes (Note ii) — — (136,042) — — — (136,042) As at 31 December 2018 1,204,747 2,065,901 56,631 (13,500) — — 3,313,779
Accruals Prepayments OtherLong-term and other and other non-current Restricted
Borrowings bonds payables receivables assets bank deposits Total
As at 1 January 2017 890,871 1,694,940 19,965 (343,000) — — 2,262,776Financing cash flows 75,022 754,477 (177,946) 343,000 (300,000) (30,000) 664,553Acquisition of a subsidiary 74,000 — 39,000 — — — 113,000Dividend declared — — 180,000 — — — 180,000Currency translation differences — (98,334) — — 771 — (97,563)Interest expenses 3,749 21,205 184,523 — — — 209,477Other changes 14,000 (24,876) 24,876 (14,000) — — — As at 31 December 2017 1,057,642 2,347,412 270,418 (14,000) (299,229) (30,000) 3,332,243
Notes:
(i) Included in the balance of accruals and other payables, dividend payable (Note 21), other payables in relation to acquisition of non-controlling interests (Note 37(b)) and direct transaction costs of issuance of long-term bonds are liabilities arising from financing activities.
(ii) Other changes mainly represent the non-cash transaction of decrease of those liabilities arising from financing activities. For detailed non-cash transaction information, please refer to Note (a) of the consolidated statement of cash flows.

Notes to the Consolidated Financial StatementsFor the year ended 31 December 2018
(Amounts expressed in thousands of RMB, unless otherwise stated)
149Anton Oilfield Services Group Annual Report 2018
34. COMMITMENTS
(a) Capital commitments
Capital commitments related to investments in property, plant and equipment at the reporting date but not yet provided for in the consolidated statement of financial position were as follows:
As at 31 December2018 2017
Contracted but not provided for 20,887 23,496
(b) Operating lease commitments - where the Group as lessee
The Group leases various offices and warehouses under non-cancellable operating lease agreements.
The future aggregate minimum lease payments under non-cancellable operating leases are as follows:
As at 31 December2018 2017
No later than 1 year 17,511 6,1741 to 5 years 21,662 25,219
39,173 31,393
35. FINANCIAL RISK MANAGEMENT
35.1 Categories of financial instruments
As at 31 December2018 2017
Financial assetsLoans and receivables – Cash and cash equivalents 686,636 1,133,097 – Restricted bank deposits 330,948 415,135 – Trade and notes receivables 1,948,030 1,760,358 – Included in prepayments and other receivables 280,446 270,587
3,246,060 3,579,177
As at 31 December2018 2017
Financial liabilitiesLoans and payables – Trade and notes payables 714,091 685,147 – Included in accruals and other payables 441,225 594,816 – Borrowings 1,204,747 1,057,642Long-term bonds 2,065,901 2,347,412
4,425,964 4,685,017
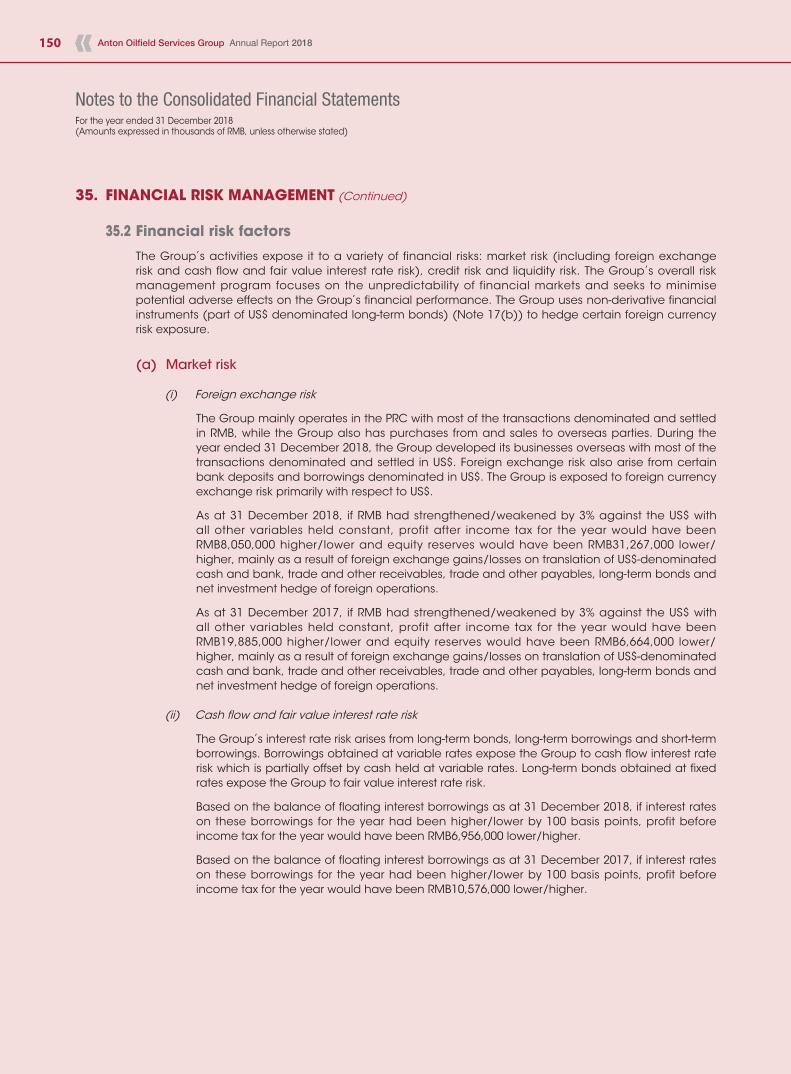
Notes to the Consolidated Financial StatementsFor the year ended 31 December 2018(Amounts expressed in thousands of RMB, unless otherwise stated)
150 Anton Oilfield Services Group Annual Report 2018
35. FINANCIAL RISK MANAGEMENT (Continued)
35.2 Financial risk factors
The Group’s activities expose it to a variety of financial risks: market risk (including foreign exchange risk and cash flow and fair value interest rate risk), credit risk and liquidity risk. The Group’s overall risk management program focuses on the unpredictability of financial markets and seeks to minimise potential adverse effects on the Group’s financial performance. The Group uses non-derivative financial instruments (part of US$ denominated long-term bonds) (Note 17(b)) to hedge certain foreign currency risk exposure.
(a) Market risk
(i) Foreign exchange risk
The Group mainly operates in the PRC with most of the transactions denominated and settled in RMB, while the Group also has purchases from and sales to overseas parties. During the year ended 31 December 2018, the Group developed its businesses overseas with most of the transactions denominated and settled in US$. Foreign exchange risk also arise from certain bank deposits and borrowings denominated in US$. The Group is exposed to foreign currency exchange risk primarily with respect to US$.
As at 31 December 2018, if RMB had strengthened/weakened by 3% against the US$ with all other variables held constant, profit after income tax for the year would have been RMB8,050,000 higher/lower and equity reserves would have been RMB31,267,000 lower/higher, mainly as a result of foreign exchange gains/losses on translation of US$-denominated cash and bank, trade and other receivables, trade and other payables, long-term bonds and net investment hedge of foreign operations.
As at 31 December 2017, if RMB had strengthened/weakened by 3% against the US$ with all other variables held constant, profit after income tax for the year would have been RMB19,885,000 higher/lower and equity reserves would have been RMB6,664,000 lower/higher, mainly as a result of foreign exchange gains/losses on translation of US$-denominated cash and bank, trade and other receivables, trade and other payables, long-term bonds and net investment hedge of foreign operations.
(ii) Cash flow and fair value interest rate risk
The Group’s interest rate risk arises from long-term bonds, long-term borrowings and short-term borrowings. Borrowings obtained at variable rates expose the Group to cash flow interest rate risk which is partially offset by cash held at variable rates. Long-term bonds obtained at fixed rates expose the Group to fair value interest rate risk.
Based on the balance of floating interest borrowings as at 31 December 2018, if interest rates on these borrowings for the year had been higher/lower by 100 basis points, profit before income tax for the year would have been RMB6,956,000 lower/higher.
Based on the balance of floating interest borrowings as at 31 December 2017, if interest rates on these borrowings for the year had been higher/lower by 100 basis points, profit before income tax for the year would have been RMB10,576,000 lower/higher.
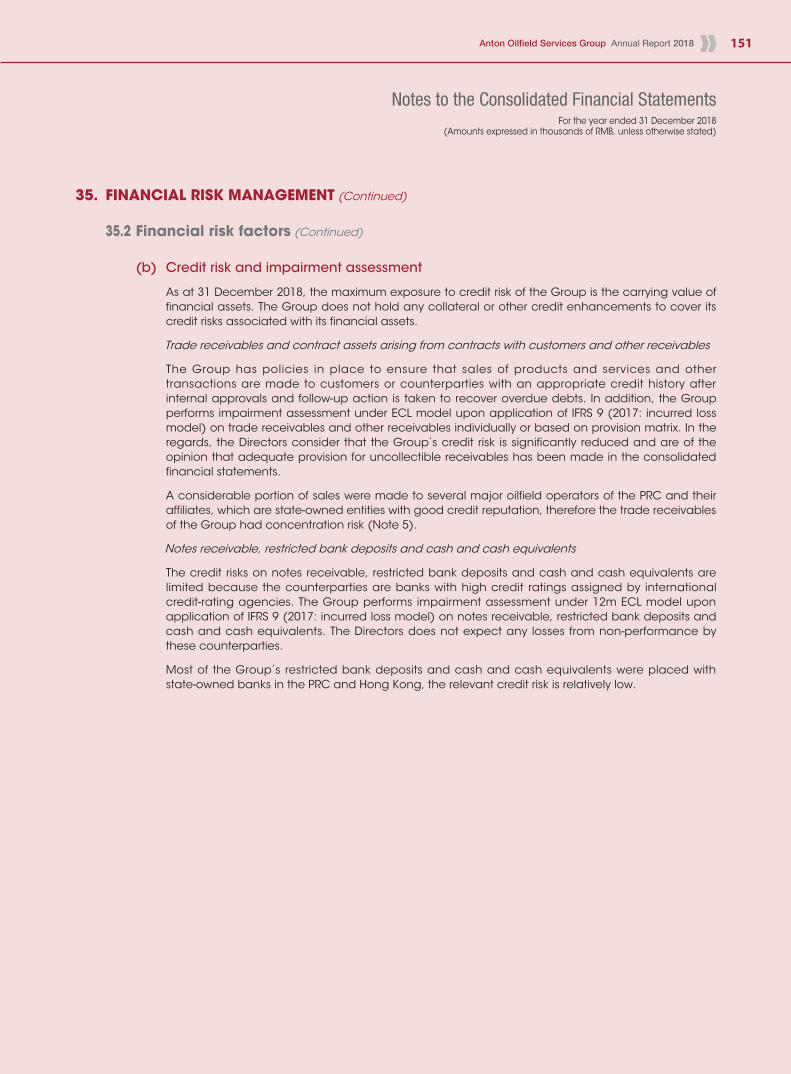
Notes to the Consolidated Financial StatementsFor the year ended 31 December 2018
(Amounts expressed in thousands of RMB, unless otherwise stated)
151Anton Oilfield Services Group Annual Report 2018
35. FINANCIAL RISK MANAGEMENT (Continued)
35.2 Financial risk factors (Continued)
(b) Credit risk and impairment assessment
As at 31 December 2018, the maximum exposure to credit risk of the Group is the carrying value of financial assets. The Group does not hold any collateral or other credit enhancements to cover its credit risks associated with its financial assets.
Trade receivables and contract assets arising from contracts with customers and other receivables
The Group has policies in place to ensure that sales of products and services and other transactions are made to customers or counterparties with an appropriate credit history after internal approvals and follow-up action is taken to recover overdue debts. In addition, the Group performs impairment assessment under ECL model upon application of IFRS 9 (2017: incurred loss model) on trade receivables and other receivables individually or based on provision matrix. In the regards, the Directors consider that the Group’s credit risk is significantly reduced and are of the opinion that adequate provision for uncollectible receivables has been made in the consolidated financial statements.
A considerable portion of sales were made to several major oilfield operators of the PRC and their affiliates, which are state-owned entities with good credit reputation, therefore the trade receivables of the Group had concentration risk (Note 5).
Notes receivable, restricted bank deposits and cash and cash equivalents
The credit risks on notes receivable, restricted bank deposits and cash and cash equivalents are limited because the counterparties are banks with high credit ratings assigned by international credit-rating agencies. The Group performs impairment assessment under 12m ECL model upon application of IFRS 9 (2017: incurred loss model) on notes receivable, restricted bank deposits and cash and cash equivalents. The Directors does not expect any losses from non-performance by these counterparties.
Most of the Group’s restricted bank deposits and cash and cash equivalents were placed with state-owned banks in the PRC and Hong Kong, the relevant credit risk is relatively low.

Notes to the Consolidated Financial StatementsFor the year ended 31 December 2018(Amounts expressed in thousands of RMB, unless otherwise stated)
152 Anton Oilfield Services Group Annual Report 2018
35. FINANCIAL RISK MANAGEMENT (Continued)
35.2 Financial risk factors (Continued)
(b) Credit risk and impairment assessment (Continued)
The tables below detail the credit risk exposures of the Group’s financial assets, including trade receivables, contract assets, other receivables, notes receivable, restricted bank deposits and cash and cash equivalents, which are subject to ECL assessment:
2018 NotesExternalcredit rating
Internalcredit rating 12m or lifetime ECL Gross carrying amount
Financial assets at amortised cost and contract assets
Trade receivables and contract assets - goods and services
13/23(ii) (a) N/A Note (i) Lifetime ECL (provision matrix) 824,040
Lifetime ECL (individually, not credit-impaired) 1,196,250Lifetime ECL (individually, credit-impaired) 56,475
Other receivables 14 N/A Note (ii) 12m ECL 192,000Lifetime ECL (not credit-impaired) 94,927Lifetime ECL (credit-impaired) 14,390
Notes receivable 13 A1 N/A 12m ECL 51,964
Restricted bank deposits 15 A1 N/A 12m ECL 330,948
Cash and cash equivalents 15 A1 N/A 12m ECL 686,636
Notes:
(i) Trade receivables and contract assets - goods and services
For trade receivables and contract assets, the Group has applied the simplified approach in IFRS 9 to measure the loss allowance at lifetime ECL. Except for debtors with significant outstanding balances or credit-impaired, the Group determines the expected credit losses on these items by using a provision matrix, grouped by past due status.
As part of the Group’s credit risk management, the Group uses debtors’ ageing to assess the impairment for part of its customers in relation to its oilfield technology services, oilfield related operation and maintenance services and sales of oilfield-related goods operation because these customers consist of a large number of small customers with common risk characteristics that are representative of the customers’ abilities to pay all amounts due in accordance with the contractual terms. The following table provides information about the exposure to credit risk for trade receivables from private and relatively small customers which are assessed based on provision matrix as at 31 December 2018 within lifetime ECL (not credit impaired). Debtors with significant outstanding balances from large multinational and state-owned oil companies and credit impaired with gross carrying amounts of RMB1,196,250,000 and RMB56,475,000 respectively as at 31 December 2018 were assessed individually.

Notes to the Consolidated Financial StatementsFor the year ended 31 December 2018
(Amounts expressed in thousands of RMB, unless otherwise stated)
153Anton Oilfield Services Group Annual Report 2018
35. FINANCIAL RISK MANAGEMENT (Continued)
35.2 Financial risk factors (Continued)
(b) Credit risk and impairment assessment (Continued)
Notes: (Continued)
(i) Trade receivables and contract assets - goods and services (Continued)
Trade receivables from private and relatively small customers
Average Gross Impairmentloss rate carrying amount loss allowance
Current (not past due) 4.28% 650,492 27,815Within 1 year past due 11.46% 152,554 17,4771-2 years past due 77.00% 10,821 8,332More than 2 years past due 100.00% 10,173 10,173
824,040 63,797
The estimated loss rates are estimated based on historical observed default rates over the expected life of the debtors and are adjusted for forward-looking information that is available without undue cost or effort. The grouping is regularly reviewed by management to ensure relevant information about specific debtors is updated.
During the year ended 31 December 2018, the Group provided RMB63,797,000 impairment allowance for trade receivables from private and relatively small customers based on the provision matrix. Impairment allowance of RMB1,848,000 and impairment reversal of RMB7,189,000 were made on debtors with significant balances from large multinational and state-owned oil companies and credit impaired debtors respectively.
For contract assets, i.e. the retention money receivables from large multinational and state-owned oil companies, the Group performed impairment assessment and conclude that the probability of defaults of the counterparties are insignificant and accordingly, no allowance for credit losses is provided.
The following table shows the movements in lifetime ECL that has been recognised for trade receivables under the simplified approach:
Lifetime ECL Lifetime ECL(not credit- (credit-
impaired) impaired) Total
As at 31 December 2017 under IAS 39 — 63,664 63,664Adjustment upon application of IFRS 9 — — — As at 1 January 2018 — 63,664 63,664Changes due to financial instruments recognised as at 1 January: – Impairment losses recognised 65,645 — 65,645 – Impairment losses reversed — (7,189) (7,189) – New originated or purchased — — — As at 31 December 2018 65,645 56,475 122,120
Changes in the loss allowance for trade receivables are mainly due to impairment losses recognised under lifetime ECL and settlement in full of trade debtors impaired before under IAS 39 which results in impairment losses reversal.
The Group writes off a trade receivable when there is information indicating that the debtor is in severe financial difficulty and there is no realistic prospect of recovery, for example, when the debtor has been placed under liquidation or has entered into bankruptcy proceedings.

Notes to the Consolidated Financial StatementsFor the year ended 31 December 2018(Amounts expressed in thousands of RMB, unless otherwise stated)
154 Anton Oilfield Services Group Annual Report 2018
35. FINANCIAL RISK MANAGEMENT (Continued)
35.2 Financial risk factors (Continued)
(b) Credit risk and impairment assessment (Continued)
Notes: (Continued)
(ii) Other receivables
For the purposes of internal credit risk management, the Group uses past due information to assess whether credit risk has increased significantly since initial recognition.
Past due
Not past due/No fixed
repayment terms Total
Other receivables 29,860 271,457 301,317
The following tables show reconciliation of loss allowances that has been recognised for other receivables:
Lifetime ECL Lifetime ECL(not credit- (credit-
12m ECL impaired) impaired) Total
As at 31 December 2017 under IAS 39 — — 4,126 4,126Adjustment upon application of IFRS 9 — — — — As at 1 January 2018 — — 4,126 4,126Changes due to financial instruments recognised as at 1 January: – Impairment losses recognised — 6,481 10,264 16,745 – New originated or purchased — — — — As at 31 December 2018 — 6,481 14,390 20,871
Changes in the loss allowance for other receivables are mainly due to impairment losses recognised under lifetime ECL.
(iii) Notes receivable, restricted bank deposits and cash and cash equivalents
At the end of the reporting period, the Directors have performed impairment assessment under 12m ECL model for notes receivable, restricted bank deposit and cash and cash equivalents, and concluded that there has been no significant increase in credit risk since initial recognition. Since the counterparties are banks with high credit ratings assigned by international credit-rating agencies, the probability of defaults of the counterparties are insignificant and accordingly, no allowance for credit losses is provided for these financial assets.

Notes to the Consolidated Financial StatementsFor the year ended 31 December 2018
(Amounts expressed in thousands of RMB, unless otherwise stated)
155Anton Oilfield Services Group Annual Report 2018
35. FINANCIAL RISK MANAGEMENT (Continued)
35.2 Financial risk factors (Continued)
(c) Liquidity risk
The liquidity risk of the Group is controlled by maintaining sufficient cash and cash equivalents, which is generated primarily from operating and financing activities.
The table below analyses the Group’s financial liabilities that will be settled into relevant maturity groupings based on the remaining period at the end of the financial period to the contractual maturity date. The amounts disclosed in the table are the contractual undiscounted cash flows.
31/12/2018
Weighted Totalaverage On demand or undiscounted Carrying
interest rate less than 1 year 1-5 years cash flows amount
Non-derivative financial liabilitiesTrade and notes payables — 714,091 — 714,091 714,091Included in accruals and other payables — 441,225 — 441,225 441,225Short-term borrowings 5.740% 903,207 — 903,207 879,192Long-term borrowings 9.315% 108,539 259,989 368,528 325,555Long-term bonds 9.643% 215,247 2,259,709 2,474,956 2,065,901
2,382,309 2,519,698 4,902,007 4,425,964
31/12/2017
Weighted Totalaverage On demand or undiscounted Carrying
interest rate less than 1 year 1-5 years cash flows amount
Non-derivative financial liabilitiesTrade and notes payables — 685,147 — 685,147 685,147Included in accruals and other payables — 594,816 — 594,816 594,816Short-term borrowings 6.020% 908,415 — 908,415 880,320Long-term borrowings 7.346% 148,693 37,292 185,985 177,322Long-term bonds 9.308% 672,458 2,342,511 3,014,969 2,347,412
3,009,529 2,379,803 5,389,332 4,685,017

Notes to the Consolidated Financial StatementsFor the year ended 31 December 2018(Amounts expressed in thousands of RMB, unless otherwise stated)
156 Anton Oilfield Services Group Annual Report 2018
35. FINANCIAL RISK MANAGEMENT (Continued)
35.3 Capital risk management
The Group’s objectives when managing capital are to safeguard the Group’s ability to continue as a going concern in order to provide returns for shareholders and benefits for other stakeholders and to maintain an optimal capital structure to reduce the cost of capital.
The Group monitors capital on the basis of the gearing ratio. This ratio is calculated as total borrowings divided by total capital. Total borrowings include borrowings, bonds and trade and notes payables, as shown in the consolidated statement of financial position. Total capital is calculated as equity, as shown in the consolidated statement of financial position, plus total borrowings.
The gearing ratios at 31 December 2018 and 2017 were as follows:
As at 31 December2018 2017
Total borrowings 3,984,739 4,090,201Total equity 2,694,562 2,946,992Total capital 6,679,301 7,037,193 Gearing ratio 60% 58%
35.4 Fair value estimation
The carrying amounts of long-term borrowings and long-term bonds approximated their fair values as the fluctuation of comparable interest rates with similar terms is relatively low.
Financial liabilities
As at 31 December 2018 Carrying value Fair value
Long-term borrowings (non-current) — —Long-term bonds (non-current) 2,051,403 2,083,529
2,051,403 2,083,529
As at 31 December 2017 Carrying value Fair value
Long-term borrowings (non-current) 36,217 35,201Long-term bonds (non-current) 1,885,824 1,901,931
1,922,041 1,937,132

Notes to the Consolidated Financial StatementsFor the year ended 31 December 2018
(Amounts expressed in thousands of RMB, unless otherwise stated)
157Anton Oilfield Services Group Annual Report 2018
36. RELATED PARTY TRANSACTIONS
Parties are considered to be related if one party has the ability, directly or indirectly, control the other party or exercise significant influence over the other party in making financial and operation decisions. Parties are also considered to be related if they are subject to common control. Members of key management of the Group are also considered as related parties.
(a) The following companies are related parties of the Group during the year ended 31 December 2018:
Names of related parties Nature of relationship
Mr. Luo Lin The ultimate controlling shareholder of the CompanyChina Oil HBP The second largest shareholder of the Company
(Note)Beijing HBP Energy Technology Co., Ltd. (“HBP Beijing”)
Controlled by China Oil HBP
Xinjiang PengAn Joint venture invested by Anton Oilfield Services (Group) Ltd.
China Nanhai Magcobar Mud Co., Ltd. (“Nanhai Magcobar”)
Controlled by the same ultimate parent company of Schlumberger NV (“SLB NV”) (Note)
Schlumberger Oilfield China (“SLB China”) Controlled by the same ultimate parent company of SLB NV
Smith Drilling Equipment (Changzhou) Ltd. (“Smith Drilling”)
Controlled by the same ultimate parent company of SLB NV
Dowell Schlumberger (Western) S.A. (“Dowell SLB”) Controlled by the same ultimate parent company of SLB NV
Schlumberger Technologies (Beijing) Ltd. (“SLB Beijing”)
Controlled by the same ultimate parent company of SLB NV
Schlumberger Reservoir Products FZE (“SLB FZE”) Controlled by the same ultimate parent company of SLB NV
SCP Oilfield Company (“SCP”) Controlled by the same ultimate parent company of SLB NV
Schlumberger Technologies (Shandong) Ltd. (“SLB Shandong”)
Controlled by the same ultimate parent company of SLB NV
Schlumberger Technologies (Chengdu) Ltd. (“SLB Chengdu”)
Controlled by the same ultimate parent company of SLB NV
SCHLUMBERGER LOGELCO INC (“SMITH KZ”) Controlled by the same ultimate parent company of SLB NV
Schlumberger Technology Corporation (“SLB Tech”)
Controlled by the same ultimate parent company of SLB NV
North Schlumberger Oilfield Technologies (Xi’an) Co., Ltd. (“SLB Xi’an”)
Controlled by the same ultimate parent company of SLB NV
Schlumberger Middle East S.A. (“SLB S.A.”)
Controlled by the same ultimate parent company of SLB NV
Note:
SLB NV sold all of its shares of the Company in February 2018 and is not the related party of the Group as at 31 December 2018. It was the second largest shareholder of the Company as at 31 December 2017.
China Oil HBP is the second largest shareholder of the Company as at 31 December 2018, and was the non-controlling shareholder of DMCC as at 31 December 2017.

Notes to the Consolidated Financial StatementsFor the year ended 31 December 2018(Amounts expressed in thousands of RMB, unless otherwise stated)
158 Anton Oilfield Services Group Annual Report 2018
36. RELATED PARTY TRANSACTIONS (Continued)
(b) Transactions with related parties
Year ended 31 December2018 2017
Purchases of goods or servicesSLB China — 47,037Smith Drilling — 4,923SLB Chengdu 22,260 4,360Xinjiang PengAn 1,160 184SLB Shandong 109 —SMITH KZ 1,314 —
24,843 56,504 Sales of goodsSLB China 85 323China Oil HBP 17,353 25,053HBP Beijing — 70SCP — 8,280
17,438 33,726
(c) Balances with related parties
As at 31 December2018 2017
Trade and notes receivables (Note 13)Xinjiang PengAn 2,225 2,619China Oil HBP 42,668 23,945
44,893 26,564

Notes to the Consolidated Financial StatementsFor the year ended 31 December 2018
(Amounts expressed in thousands of RMB, unless otherwise stated)
159Anton Oilfield Services Group Annual Report 2018
36. RELATED PARTY TRANSACTIONS (Continued)
(c) Balances with related parties (Continued)
As at31 December
2017
Trade and notes receivables (Note 13)SLB China 834SLB Chengdu 9SCP 8,640
9,483
As at 31 December2018 2017
Trade and notes payables (Note 20)HBP Beijing 13,094 13,094Xinjiang PengAn — 184
13,094 13,278
As at31 December
2017
Trade and notes payables (Note 20)Nanhai Magcobar 14,008SLB China 38,628SLB Beijing 262Smith Drilling 58SLB Chengdu 68SMITH KZ 21,494
74,518

Notes to the Consolidated Financial StatementsFor the year ended 31 December 2018(Amounts expressed in thousands of RMB, unless otherwise stated)
160 Anton Oilfield Services Group Annual Report 2018
36. RELATED PARTY TRANSACTIONS (Continued)
(c) Balances with related parties (Continued)
As at 31 December2018 2017
Prepayments and other receivables (Note 14)Xinjiang PengAn 479 —China Oil HBP 27,637 —
28,116 —
As at31 December
2017
Prepayments and other receivables (Note 14)SLB Tech 1,867SCP 2,622
4,489
As at 31 December2018 2017
Other non-current assets (Note 11)China Oil HBP — 299,229
As at 31 December2018 2017
Accruals and other payablesChina Oil HBP 43,957 195,200
As at31 December
2017
Accruals and other payablesSLB FZE 1,762Smith Drilling 2,300
4,062
Balances with related parties were unsecured, non-interest bearing and had no fixed repayment terms.

Notes to the Consolidated Financial StatementsFor the year ended 31 December 2018
(Amounts expressed in thousands of RMB, unless otherwise stated)
161Anton Oilfield Services Group Annual Report 2018
36. RELATED PARTY TRANSACTIONS (Continued)
(d) Short-term bank borrowings guaranteed by related parties
As at 31 December2018 2017
Short-term borrowingsMr. Luo Lin (Note 19(b)) 181,357 —
(e) Key management compensation
Year ended 31 December2018 2017
Salaries and other short-term employee benefits 17,623 15,841Pension scheme 400 403Share-based payments 5,235 3,489
23,258 19,733
37. SUBSIDIARIES
(a) The following is a list of principal subsidiaries in which the Company directly or indirectly holds equity interests as at 31 December 2018:
Company name
Place and date ofincorporation/establishment
Registeredcapital
Equity interestheld by the
Group Principal activities
Directly held:
Anton Oilfield Services Hong Kong, HK$100 100% Investment holding Company Limited 17 August 2007
Anton International Hong Kong, HK$100 100% Investment holding17 July 2008
Indirectly held:
Anton Oilfield Services (Group) Ltd. Beijing, the PRC, 28 US$151,000,000 100% Oilfield services andJanuary 2002 sales of equipment
Xinjiang Tong’ao Oilfield Services Xinjiang Uygur RMB51,000,000 100% Oilfield services Co., Ltd. (新疆通奥油田技術 Autonomous 服務有限公司, “Xinjiang Tong’ao”) Region, the PRC,
21 February 2002

Notes to the Consolidated Financial StatementsFor the year ended 31 December 2018(Amounts expressed in thousands of RMB, unless otherwise stated)
162 Anton Oilfield Services Group Annual Report 2018
37. SUBSIDIARIES (Continued)
(a) The following is a list of principal subsidiaries in which the Company directly or indirectly holds equity interests as at 31 December 2018: (Continued)
Company name
Place and date ofincorporation/establishment
Registeredcapital
Equity interestheld by the
Group Principal activities
Anton Tong’ao Technological Xinjiang Uygur RMB90,000,000 90% Manufacturing of rod Products Co., Limited Autonomous casing (“Anton Tong’ao”) Region, the PRC,
15 December 2005
Shandong Precede Shandong Province, RMB55,000,000 100% Oilfield services andthe PRC, sales of equipment2 September 2008
Anton International FZE The United Arab US$7,300,000 100% Oilfield services (“Anton Dubai”) Emirates,
12 April 2009
Sichuan Anton Oil Gas Sichuan Province, the RMB400,000,000 100% Oilfield services and Engineering and Technology PRC, 14 July 2009 sales of equipment Services Co., Ltd. (四川安東油氣工程技術服務 有限公司,”Sichuan Anton”)
DMCC The United Arab US$54,462,150 100% Oilfield servicesEmirates,28 March 2011
Sichuan Tongsheng Drilling Sichuan Province, RMB100,000,000 100% Construction and Technology Co., Ltd. (四川通盛 the PRC, 13 February drilling services, sales 鑽探工程有限公司, “Sichuan 2012 of drilling product Tongsheng”)
Xinjiang Anton Oilfield Services Xinjiang Uygur RMB80,000,000 100% Oilfield services Co., Ltd. (新疆安東石油技術 Autonomous 服務有限責任公司, Region, the PRC, “Xinjiang Anton”) 24 February 2012
The above table lists the subsidiaries of the Company which, in the opinion of the Directors, principally affected the results or assets of the Group. To give details of other subsidiaries would, in the opinion of the Directors, result in particulars of excessive length.
None of the subsidiaries had issued any debt securities at the end of the year.

Notes to the Consolidated Financial StatementsFor the year ended 31 December 2018
(Amounts expressed in thousands of RMB, unless otherwise stated)
163Anton Oilfield Services Group Annual Report 2018
37. SUBSIDIARIES (Continued)
(b) Changes in ownership interest in subsidiaries
Acquisition of non-controlling interests in DMCC
During the year, the Group finished the acquisition from Huihua, a wholly-owned subsidiary of China Oil HBP, 40% of the issued share capital of DMCC for the consideration of RMB735,000,000. DMCC was a non-wholly owned subsidiary of the Group which was owned as to 60% by the Group and as to 40% by Huihua previously and became a wholly-owned subsidiary of the Group as at 31 December 2018.
The consideration for the acquisition in the amount of RMB735,000,000 was settled as to RMB450,000,000 by cash and as to RMB285,000,000 by the issuance of an aggregate of 334,224,599 new shares of the Company to Huihua at the issue price of HK$1.014 per share. The acquisition-related costs amounting to RMB4,691,000 have been settled by cash.
An amount of RMB356,587,000 (being the proportionate share of the carrying amount of the net assets of DMCC) has been reduced from non-controlling interests. The difference of RMB383,104,000 between the decrease in the non-controlling interests and the consideration and acquisition-related costs paid has been debited to reserves.
Acquisition of non-controlling interests in Suining Anheng Industrial Co.,Ltd. (“Suining
Anheng”)
During the year, the Group acquired 10% of its interest in Suining Anheng, increasing its continuing interest to 90%. The consideration for the acquisition in the amount of RMB11,420,000 will be settled by cash. As at 31 December 2018, the unpaid consideration amounting to RMB920,000 has been included in accruals and other payables.
An amount of RMB12,003,000 (being the proportionate share of the carrying amount of the net assets of Suining Anheng) has been reduced from non-controlling interests. The difference of RMB583,000 between the decrease in the non-controlling interests and the consideration paid has been credited to reserves.

Notes to the Consolidated Financial StatementsFor the year ended 31 December 2018(Amounts expressed in thousands of RMB, unless otherwise stated)
164 Anton Oilfield Services Group Annual Report 2018
37. SUBSIDIARIES (Continued)
(c) Material non-controlling interests
The total non-controlling interest as at 31 December 2018 was RMB48,688,000 (31 December 2017: RMB388,953,000), of which RMB Nil (31 December 2017: RMB301,622,000) was attributable to DMCC and RMB36,206,000 (31 December 2017: RMB34,828,000) was attributable to Anton Tong’ao. The non-controlling interests in respect of other subsidiaries are not material.
Set out below are the summarised financial information for each subsidiary that has non-controlling interests that are material to the Group.
Summarised statement of financial position
DMCCAs at
31 DecemberAnton Tong’ao
As at 31 December2017 2018 2017
CurrentAssets 3,431,074 806,901 673,603Liabilities (3,022,156) (715,002) (681,865) Total net current assets/(liabilities) 408,918 91,899 (8,262) Non-currentAssets 661,364 333,566 356,570Liabilities — (63,401) (26) Total net non-current assets 661,364 270,165 356,544 Net assets 1,070,282 362,064 348,282 Net assets attributable to non-controlling interests 301,622 36,206 34,828

Notes to the Consolidated Financial StatementsFor the year ended 31 December 2018
(Amounts expressed in thousands of RMB, unless otherwise stated)
165Anton Oilfield Services Group Annual Report 2018
37. SUBSIDIARIES (Continued)
(c) Material non-controlling interests (Continued)
Summarised statement of profit or loss and other comprehensive income
DMCCYear ended
31 DecemberAnton Tong’ao
Year ended 31 December2017 2018 2017
Revenue 1,027,541 322,702 237,912Profit before income tax 388,871 16,091 13,306Income tax expense (60,124) (2,311) (2,142) Post-tax profit 328,747 13,780 11,164 Other comprehensive expense (87,501) — — Total comprehensive income 241,246 13,780 11,164 Total comprehensive income attributable to non-controlling interests 85,065 1,378 1,116 Dividends paid to non-controlling interests 180,000 — —
Summarised statement of cash flows
DMCCYear ended
31 DecemberAnton Tong’ao
Year ended 31 December2017 2018 2017
Cash flows from operating activitiesCash generated from/(used in) operations 60,426 (33,741) 45,446Income tax paid (42,876) (3,448) (1,544) Net cash generated from/(used in) operating activities 17,550 (37,189) 43,902Net cash used in investing activities (292,392) (22,325) (19,460)Net cash generated from/(used in) financing activities — 58,444 (2,815) Net (decrease)/increase in cash and cash equivalents (274,842) (1,070) 21,627 Cash and cash equivalents at beginning of year 256,357 29,642 8,030Exchange gain/(loss) on cash and cash equivalents 58,249 52 (15) Cash and cash equivalents at end of year 39,764 28,624 29,642
The information above is the amount before inter-company eliminations.

Notes to the Consolidated Financial StatementsFor the year ended 31 December 2018(Amounts expressed in thousands of RMB, unless otherwise stated)
166 Anton Oilfield Services Group Annual Report 2018
38. STATEMENT OF FINANCIAL POSITION AND RESERVES OF THE COMPANY
As at 31 December2018 2017
AssetsNon-current assetsInvestments in subsidiaries 5,397,857 5,590,534
5,397,857 5,590,534 Current assetsTrade and notes receivables 70,754 47,887Prepayments and other receivables 180 117,346Cash and cash equivalents 60,283 123,651
131,217 288,884 Total assets 5,529,074 5,879,418 Equity and liabilitiesEquityShare capital 275,959 246,271Other reserves (a) 2,857,532 2,924,949 Total equity 3,133,491 3,171,220 LiabilitiesNon-current liabilitiesLong-term bonds 2,051,403 1,885,824 Current liabilitiesCurrent portion of long-term bonds 14,498 461,588Trade and notes payables 1,600 —Accruals and other payables 328,082 360,786
344,180 822,374 Total liabilities 2,395,583 2,708,198 Total equity and liabilities 5,529,074 5,879,418

Notes to the Consolidated Financial StatementsFor the year ended 31 December 2018
(Amounts expressed in thousands of RMB, unless otherwise stated)
167Anton Oilfield Services Group Annual Report 2018
38. STATEMENT OF FINANCIAL POSITION AND RESERVES OF THE COMPANY (Continued)
Note:
(a) Reserve movements of the Company
Share Capital Accumulatedpremium reserve losses Total
At 1 January 2017 634,616 3,005,709 (789,770) 2,850,555Loss for the year — — (120,723) (120,723)Share option scheme — 16,490 — 16,490Issue of ordinary shares 178,194 — — 178,194Share option exercised 433 — — 433 At 31 December 2017 813,243 3,022,199 (910,493) 2,924,949 Adjustments (Note 2.3) — — (68,763) (68,763)Balance at 1 January 2018 (restated) 813,243 3,022,199 (979,256) 2,856,186Loss for the year — — (283,196) (283,196)Share option scheme — 24,094 — 24,094Issue of ordinary shares 256,064 — — 256,064Share option exercised 4,384 — — 4,384 At 31 December 2018 1,073,691 3,046,293 (1,262,452) 2,857,532
39. BENEFITS AND INTERESTS OF DIRECTORS
(a) Directors’ and chief executive’s emoluments
The remuneration of every director and the chief executive is set out below:
For the year ended 31 December 2018:
Emolumentspaid or
receivable inrespect of
director’s otherservices in
Remunerations connectionEmployer’s paid or with the
contribution receivable in managementEstimated to a respect of of the affairs of
money value retirement accepting the CompanyDiscretionary Housing of other benefit office as or its subsidiary
Name Fees Salary bonuses allowance benefits (i) scheme director undertaking Total
Executive DirectorsMr. Luo Lin — 2,348 1,368 — 30 55 — — 3,801Mr. Pi Zhifeng (chief executive) — 1,894 352 — 65 55 — — 2,366Mr. Wu Di — 898 — — 17 13 — — 928Non-executive DirectorMr. John William Chisholm — 663 — — — — — — 663Independent Non-executive DirectorsMr. Zhang Yongyi (ii) 287 — — — — — — — 287Mr. Zhu Xiaoping (ii) 287 — — — — — — — 287Dato Wee Yiaw Hin (ii) 663 — — — — — — — 663

Notes to the Consolidated Financial StatementsFor the year ended 31 December 2018(Amounts expressed in thousands of RMB, unless otherwise stated)
168 Anton Oilfield Services Group Annual Report 2018
39. BENEFITS AND INTERESTS OF DIRECTORS (Continued)
(a) Directors’ and chief executive’s emoluments (Continued)
The remuneration of every director and the chief executive is set out below: (Continued)
For the year ended 31 December 2017:
Emolumentspaid or
receivable inrespect of
director’s otherservices in
Remunerations connectionEmployer’s paid or with the
contribution receivable in managementEstimated to a respect of of the affairs of
money value retirement accepting the CompanyDiscretionary Housing of other benefit office as or its subsidiary
Name Fees Salary bonuses allowance benefits (i) scheme director undertaking Total
Executive DirectorsMr. Luo Lin — 2,385 193 — 32 51 — — 2,661Mr. Pi Zhifeng (chief executive) — 2,020 156 — 64 51 — — 2,291Mr. Wu Di — 844 107 — 61 48 — — 1,060Non-executive DirectorMr. John William Chisholm — 674 — — — — — — 674Independent Non-executive DirectorsMr. Zhang Yongyi (ii) 287 — — — — — — — 287Mr. Zhu Xiaoping (ii) 287 — — — — — — — 287Dato Wee Yiaw Hin (ii) 462 — — — — — — — 462
Notes:
(i) Other benefits include other insurance premium.
(ii) 2,100,000 share options in aggregate were granted to three independent non-executive directors during the year ended 31 December 2018 (2017: 2,100,000 share options), and the total expense recognised in the consolidated statement of profit or loss for year ended 31 December 2018 amounted to RMB921,000, the same amount for each independent non-executive director (31 December 2017: RMB1,227,000 in total and RMB560,000 each for Mr. Zhang Yongyi and Mr. Zhu Xiaoping and RMB107,000 for Dato Wee Yiaw Hin) which are not included in this summary.