Annual PRSP Progress Report FY2012/13 - Finance · Annual PRSP Progress Report FY2012/13 ......
66
Annual PRSP Progress Report FY2012/13 PRSP Secretariat Finance Division Government of Pakistan
Transcript of Annual PRSP Progress Report FY2012/13 - Finance · Annual PRSP Progress Report FY2012/13 ......
Annual PRSP Progress Report FY2012/13�
PRSP Secretariat Finance Division
Government of Pakistan
i
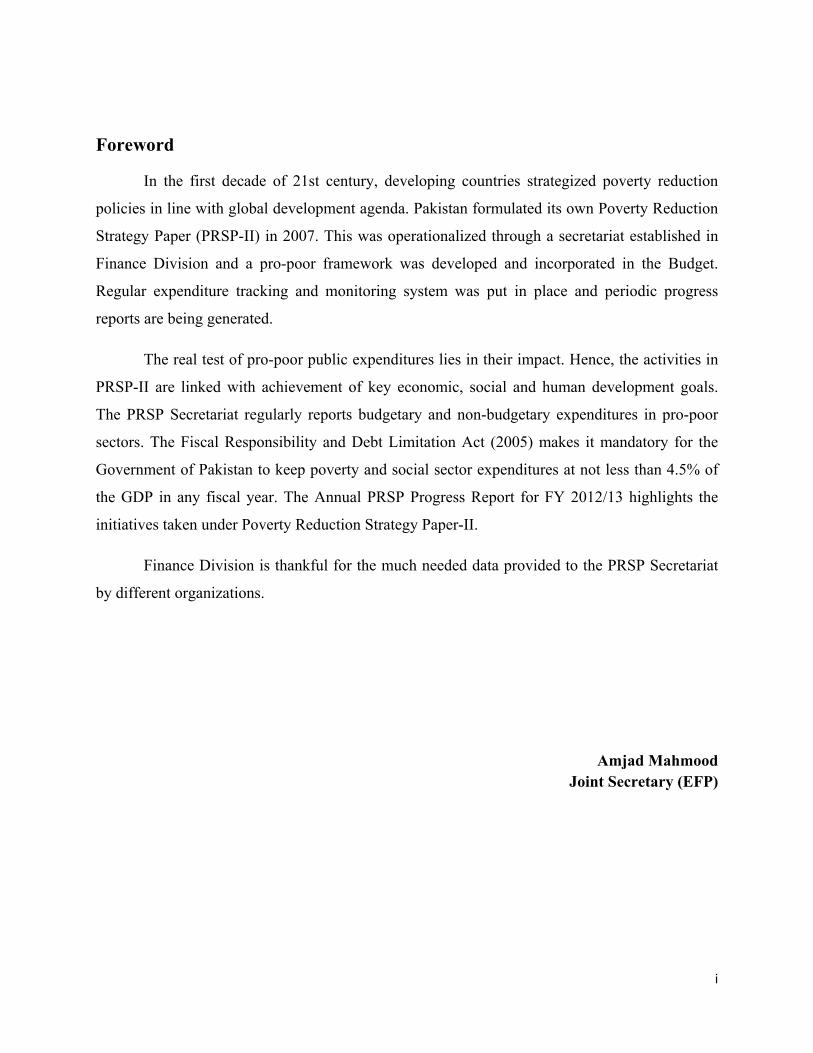
Foreword
In the first decade of 21st century, developing countries strategized poverty reduction
policies in line with global development agenda. Pakistan formulated its own Poverty Reduction
Strategy Paper (PRSP-II) in 2007. This was operationalized through a secretariat established in
Finance Division and a pro-poor framework was developed and incorporated in the Budget.
Regular expenditure tracking and monitoring system was put in place and periodic progress
reports are being generated.
The real test of pro-poor public expenditures lies in their impact. Hence, the activities in
PRSP-II are linked with achievement of key economic, social and human development goals.
The PRSP Secretariat regularly reports budgetary and non-budgetary expenditures in pro-poor
sectors. The Fiscal Responsibility and Debt Limitation Act (2005) makes it mandatory for the
Government of Pakistan to keep poverty and social sector expenditures at not less than 4.5% of
the GDP in any fiscal year. The Annual PRSP Progress Report for FY 2012/13 highlights the
initiatives taken under Poverty Reduction Strategy Paper-II.
Finance Division is thankful for the much needed data provided to the PRSP Secretariat
by different organizations.
Amjad Mahmood Joint Secretary (EFP)
ii
Acronyms
AJ&K Azad Jammu & Kashmir BISP Benazir Income Support Programme CPI Consumer Price Index CSP Child Support Program EOBI Employees Old Age Benefit Institution FANA Federally Administered Northern Areas FATA Federally Administered Tribal Areas FBR Federal Board of Revenue FBS Federal Bureau of Statistics FED Federal Excise Duty FSP Food Support Programme FRDLA Fiscal Responsibility and Debt Limitation Act FY Fiscal Year GDP Gross Domestic Product GOP Government of Pakistan ICT Islamabad Capital Territory IFA Individual Finance Assistance IR Institutional Rehabilitation KP Khyber Pakhtunkhawa LFS Labour Force Survey LHWs Lady Health Workers LSM Large Scale Manufacturing MFBs Micro Finance Banks MFIs Micro Finance Institutions NCRCL National Centre for Rehabilitation of Child Labour NER Net Enrolment Rate NGO Non-Government Organizations PBM Pakistan Bait-ul-Maal PFY Previous Fiscal Year PWP People Works Program PRSP Poverty Reduction Strategy Paper PSC Poverty Score Card PMN Pakistan Micro-Finance Network PSH Pakistan Sweet Homes RSPs Rural Support Programs SPI Sensitive Price Index SBP State Bank of Pakistan TVET Technical & Vocational Education and Training TT Tetanus Toxoid WPI Wholesale Price index WWF Workers Welfare Fund
iii
Executive Summary
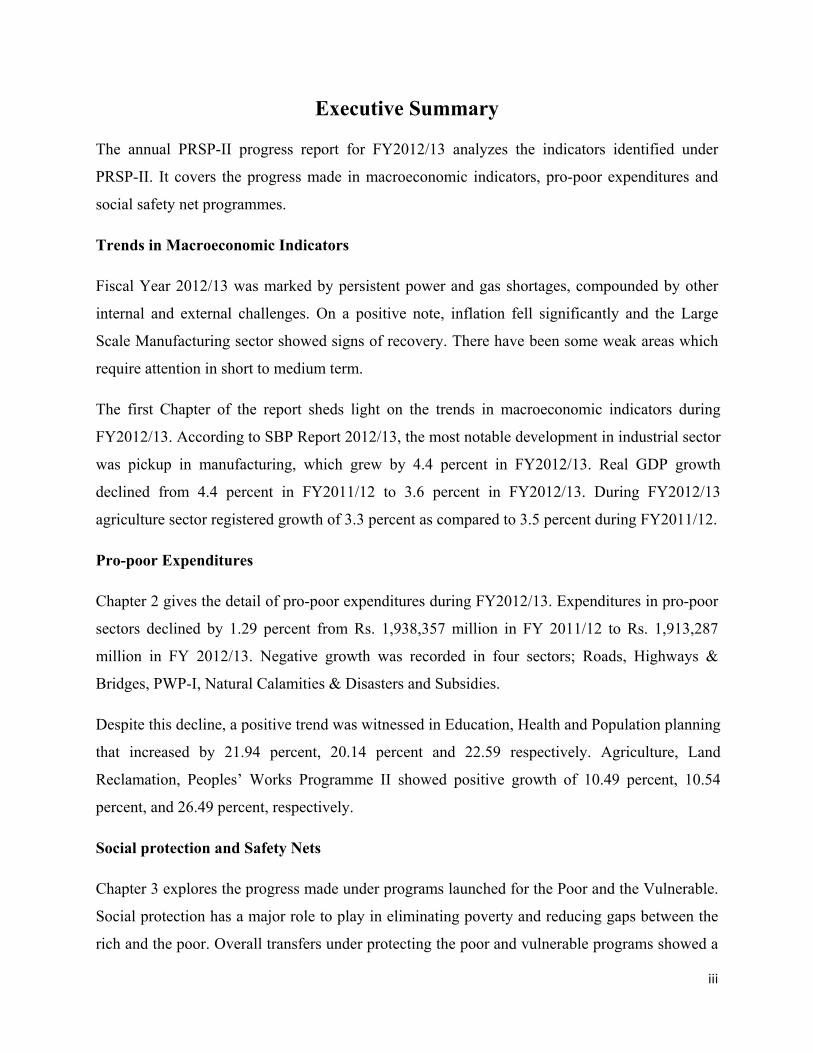
The annual PRSP-II progress report for FY2012/13 analyzes the indicators identified under
PRSP-II. It covers the progress made in macroeconomic indicators, pro-poor expenditures and
social safety net programmes.
Trends in Macroeconomic Indicators
Fiscal Year 2012/13 was marked by persistent power and gas shortages, compounded by other
internal and external challenges. On a positive note, inflation fell significantly and the Large
Scale Manufacturing sector showed signs of recovery. There have been some weak areas which
require attention in short to medium term.
The first Chapter of the report sheds light on the trends in macroeconomic indicators during
FY2012/13. According to SBP Report 2012/13, the most notable development in industrial sector
was pickup in manufacturing, which grew by 4.4 percent in FY2012/13. Real GDP growth
declined from 4.4 percent in FY2011/12 to 3.6 percent in FY2012/13. During FY2012/13
agriculture sector registered growth of 3.3 percent as compared to 3.5 percent during FY2011/12.
Pro-poor Expenditures
Chapter 2 gives the detail of pro-poor expenditures during FY2012/13. Expenditures in pro-poor
sectors declined by 1.29 percent from Rs. 1,938,357 million in FY 2011/12 to Rs. 1,913,287
million in FY 2012/13. Negative growth was recorded in four sectors; Roads, Highways &
Bridges, PWP-I, Natural Calamities & Disasters and Subsidies.
Despite this decline, a positive trend was witnessed in Education, Health and Population planning
that increased by 21.94 percent, 20.14 percent and 22.59 respectively. Agriculture, Land
Reclamation, Peoples’ Works Programme II showed positive growth of 10.49 percent, 10.54
percent, and 26.49 percent, respectively.
Social protection and Safety Nets
Chapter 3 explores the progress made under programs launched for the Poor and the Vulnerable.
Social protection has a major role to play in eliminating poverty and reducing gaps between the
rich and the poor. Overall transfers under protecting the poor and vulnerable programs showed a
iv
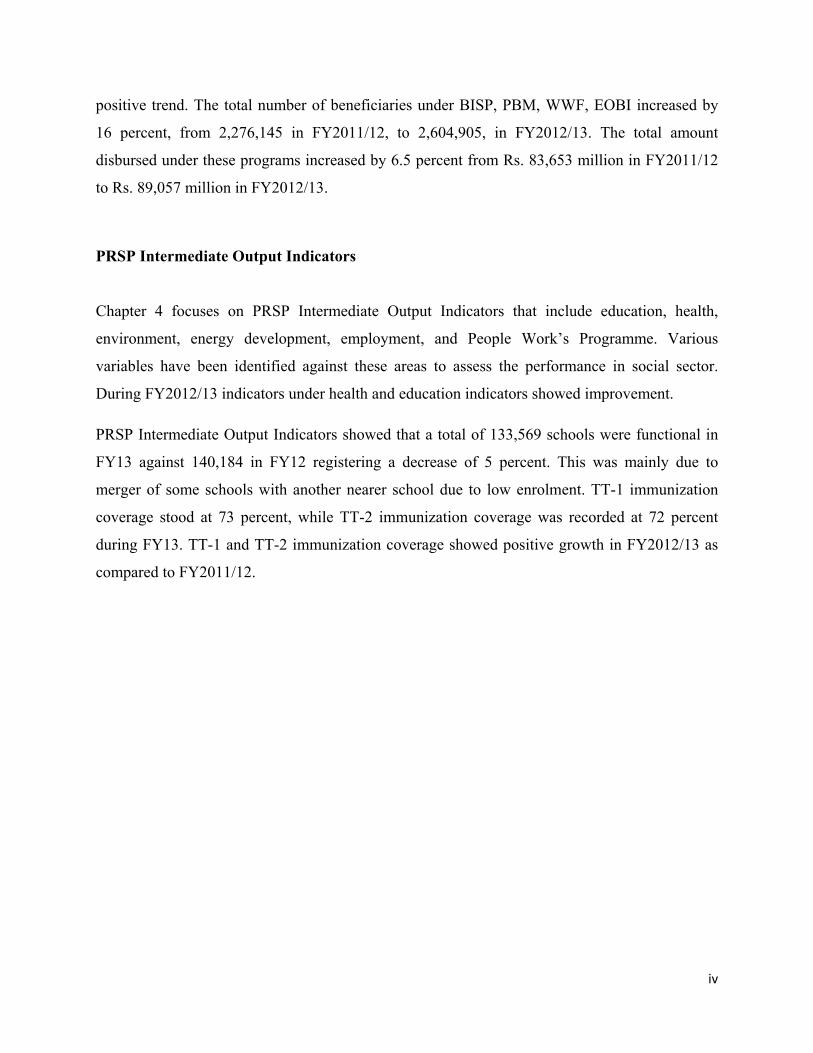
positive trend. The total number of beneficiaries under BISP, PBM, WWF, EOBI increased by
16 percent, from 2,276,145 in FY2011/12, to 2,604,905, in FY2012/13. The total amount
disbursed under these programs increased by 6.5 percent from Rs. 83,653 million in FY2011/12
to Rs. 89,057 million in FY2012/13.
PRSP Intermediate Output Indicators
Chapter 4 focuses on PRSP Intermediate Output Indicators that include education, health,
environment, energy development, employment, and People Work’s Programme. Various
variables have been identified against these areas to assess the performance in social sector.
During FY2012/13 indicators under health and education indicators showed improvement.
PRSP Intermediate Output Indicators showed that a total of 133,569 schools were functional in
FY13 against 140,184 in FY12 registering a decrease of 5 percent. This was mainly due to
merger of some schools with another nearer school due to low enrolment. TT-1 immunization
coverage stood at 73 percent, while TT-2 immunization coverage was recorded at 72 percent
during FY13. TT-1 and TT-2 immunization coverage showed positive growth in FY2012/13 as
compared to FY2011/12.
1
Table of Contents
Introduction ………………………………………………………………………………………………2
Chapter 1 Trends in Macroeconomic Indicators ............................................................................... 3
1.1 Agriculture: ........................................................................................................................... 4
1.2 Services ................................................................................................................................. 5
1.3 Inflation ................................................................................................................................. 6
1.4 Fiscal Balance ....................................................................................................................... 8
1.5 External Account................................................................................................................... 9
Chapter 2 Pro-Poor Budgetary Expenditures .................................................................................. 10
2.1 Pro-poor Budgetary Expenditures ....................................................................................... 11
2.1 Distribution of Expenditure .................................................... Error! Bookmark not defined.
2.2 Comparison of Proportional Contribution by Sector .......................................................... 13
2.3 PRSP Budgetary Expenditures by Province and Sectors .................................................... 15
2.4 Current and Development Expenditures ............................................................................. 17
2.5 Effect of Subsidies on PRSP Budgetary Expenditures ....................................................... 19
2.6 PRSP Expenditures in Sub Sectors Education: .................................................................. 21
2.7 PRSP Expenditures in sub-sector Health ........................................................................... 23
Chapter 3 Protecting the Poor and the Vulnerable ............................................................................... 26
3.1 Programmes of Pakistan Bait-ul-Mal (PBM) ...................................................................... 28
3.2 Zakat and Ushar .................................................................................................................. 29
3.2.I Zakat Programme in Punjab Province ................................................................................. 29
3.2.II Zakat Programme in Sindh Province .................................................................................. 31
3.2.III Zakat Programme in Khyber Pakhtunkhwa Province ......................................................... 32
3.2.IV. Zakat Programme in Balochistan Province ......................................................................... 34
3.5 Employees’ Old Age Benefit Institution (EOBI) ................................................................ 35
3.6 Workers Welfare Fund (WWF) .......................................................................................... 35
3.7 Microfinance ....................................................................................................................... 37
3.7.I Active Borrowers, Active Savers and Active Policy Holders ............................................. 38
Chapter 4 Monitoring the PRSP Intermediate (Output) Indicators .............................................. 44
4.1.I Functional Schools .............................................................................................................. 44
4.1.II Percentage of Trained Teachers .......................................................................................... 46
4.1.III Basic Facilities in Public Schools ....................................................................................... 48
2
4.1. IV Private Schools and Deeni-Madrassahs .............................................................................. 52
4.2 Health Sector ....................................................................................................................... 53
4.2.I TT- Immunization Coverage for Pregnant Women Programme: ........................................ 53
4.2. II Population Covered by Lady Health Workers (LHWs) ...................................................... 55
4.3 Environment ........................................................................................................................ 56
4.3. I Land Area Covered by Forest ............................................................................................. 56
4.3. II Land Area Protected ............................................................................................................ 57
4.4 Integrated Energy Development Programme ...................................................................... 58
4.5 People Works Programme-I ................................................................................................ 58
4.6 Labour Force, Employed Labour Force and Unpaid Family Helpers ................................. 60
Conclusion ………………………………………………………………..……………………………61
3
Chapter 1. Trends in Macroeconomic Indicators
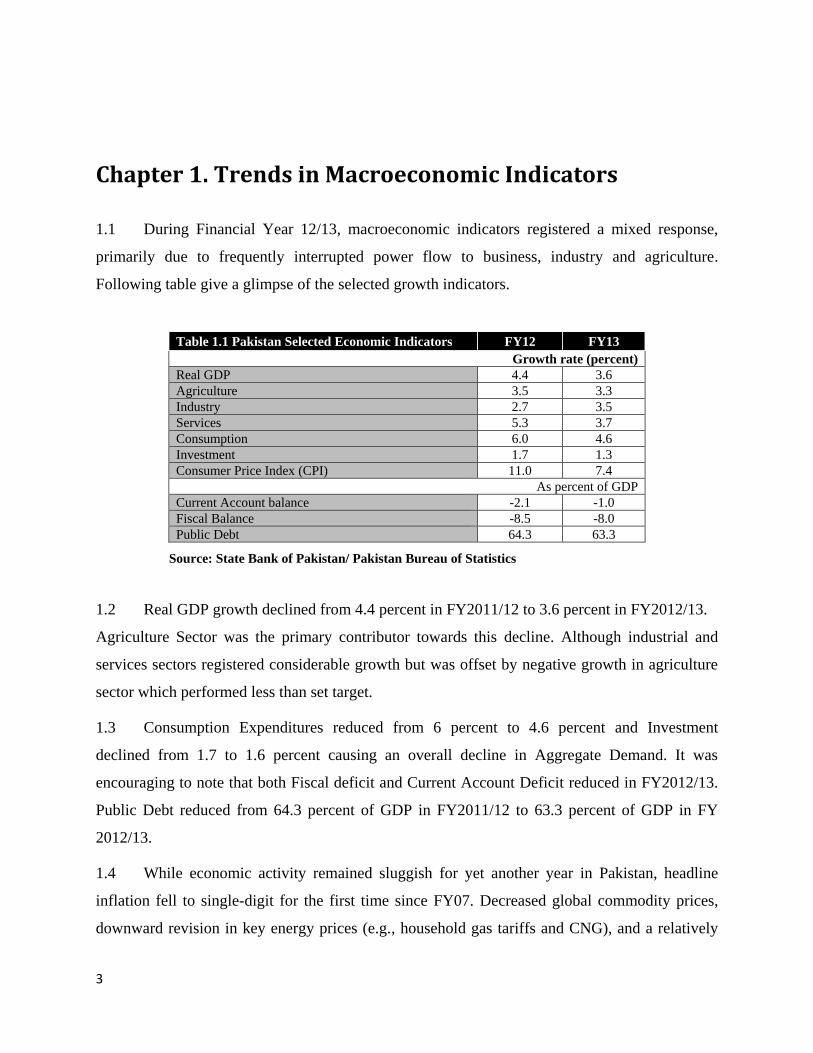
1.1 During Financial Year 12/13, macroeconomic indicators registered a mixed response,
primarily due to frequently interrupted power flow to business, industry and agriculture.
Following table give a glimpse of the selected growth indicators.
Table 1.1 Pakistan Selected Economic Indicators FY12 FY13
Growth rate (percent)
Real GDP 4.4 3.6
Agriculture 3.5 3.3
Industry 2.7 3.5
Services 5.3 3.7
Consumption 6.0 4.6
Investment 1.7 1.3
Consumer Price Index (CPI) 11.0 7.4
As percent of GDP
Current Account balance -2.1 -1.0
Fiscal Balance -8.5 -8.0
Public Debt 64.3 63.3
Source: State Bank of Pakistan/ Pakistan Bureau of Statistics
1.2 Real GDP growth declined from 4.4 percent in FY2011/12 to 3.6 percent in FY2012/13.
Agriculture Sector was the primary contributor towards this decline. Although industrial and
services sectors registered considerable growth but was offset by negative growth in agriculture
sector which performed less than set target.
1.3 Consumption Expenditures reduced from 6 percent to 4.6 percent and Investment
declined from 1.7 to 1.6 percent causing an overall decline in Aggregate Demand. It was
encouraging to note that both Fiscal deficit and Current Account Deficit reduced in FY2012/13.
Public Debt reduced from 64.3 percent of GDP in FY2011/12 to 63.3 percent of GDP in FY
2012/13.
1.4 While economic activity remained sluggish for yet another year in Pakistan, headline
inflation fell to single-digit for the first time since FY07. Decreased global commodity prices,
downward revision in key energy prices (e.g., household gas tariffs and CNG), and a relatively
4
stable exchange rate allowed the average inflation rate to fall to 7.4 percent against the set target
of 9.5 percent for the year. In FY2011/12, recorded inflation was 11 percent.
1.1 Agriculture:
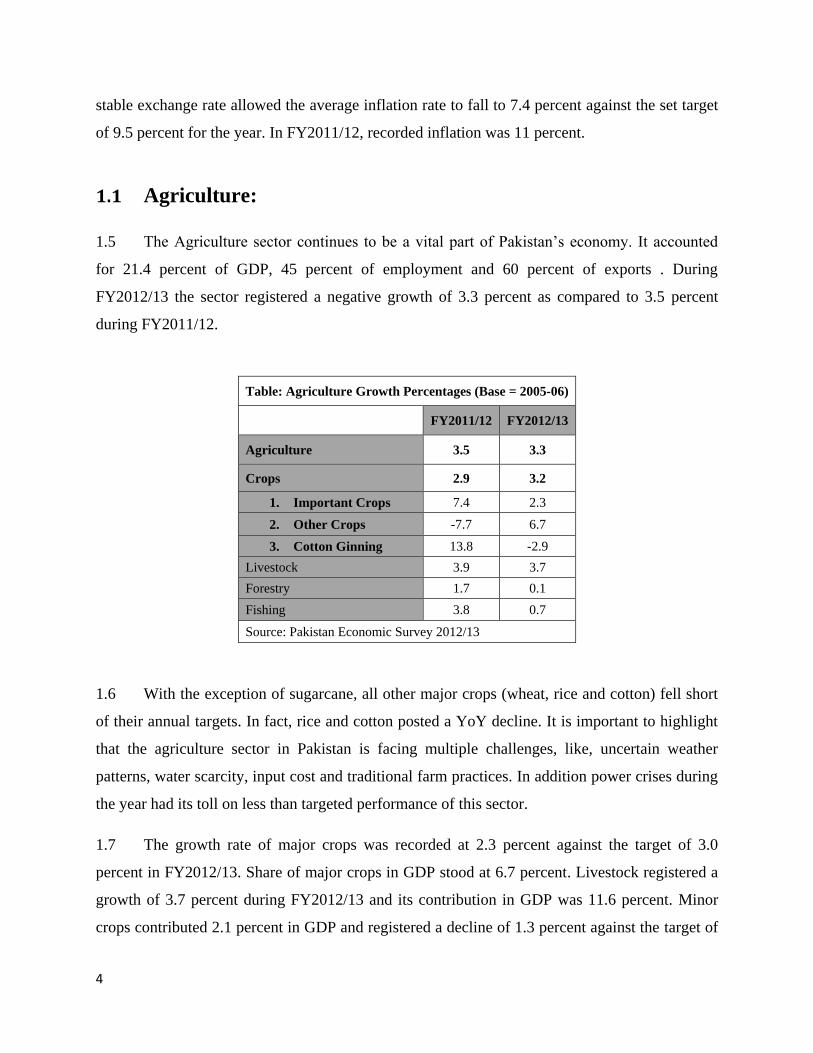
1.5 The Agriculture sector continues to be a vital part of Pakistan’s economy. It accounted
for 21.4 percent of GDP, 45 percent of employment and 60 percent of exports . During
FY2012/13 the sector registered a negative growth of 3.3 percent as compared to 3.5 percent
during FY2011/12.
Table: Agriculture Growth Percentages (Base = 2005-06)
FY2011/12 FY2012/13
Agriculture 3.5 3.3
Crops 2.9 3.2
1. Important Crops 7.4 2.3
2. Other Crops -7.7 6.7
3. Cotton Ginning 13.8 -2.9
Livestock 3.9 3.7
Forestry 1.7 0.1
Fishing 3.8 0.7
Source: Pakistan Economic Survey 2012/13
1.6 With the exception of sugarcane, all other major crops (wheat, rice and cotton) fell short
of their annual targets. In fact, rice and cotton posted a YoY decline. It is important to highlight
that the agriculture sector in Pakistan is facing multiple challenges, like, uncertain weather
patterns, water scarcity, input cost and traditional farm practices. In addition power crises during
the year had its toll on less than targeted performance of this sector.
1.7 The growth rate of major crops was recorded at 2.3 percent against the target of 3.0
percent in FY2012/13. Share of major crops in GDP stood at 6.7 percent. Livestock registered a
growth of 3.7 percent during FY2012/13 and its contribution in GDP was 11.6 percent. Minor
crops contributed 2.1 percent in GDP and registered a decline of 1.3 percent against the target of
5
2.0 percent during FY2012/13. During FY2012/13 Livestock sector exhibited a growth of 3.7
percent, forestry, 0.1 percent and Fishery, 0.7 percent.
1.8 Preliminary data suggests that minor crops have performed well during the Kharif season
primarily due to timely rains in September 20121. Adequate rainfall improved yield of pulses,
bajra, jawar and corn.
1.1 Industry
1.9 According to SBP Report 2012/13, the most notable development in industrial sector was
the pick-up in manufacturing, which grew at 4.4 percent in FY2012/13 – the highest rate in the
past five years. The revival in manufacturing was broad-based as a large number of industries
contributed to this recovery. Large Scale Manufacturing grew by 9.32 percent according to
Pakistan Economic Survey 2012/13. The increase in capacity enhancement of iron & steel,
rubber & plastic, and paper & paperboard was encouraging. Manufacturing sector also gained
from strong spillovers from a vibrant construction sector.
1.10 Manufacturing sector is considered to be the main source of economic growth having
forward and backward linkages with other sectors of the economy. It accounts for 13.2 percent of
GDP and 13.8 percent of total employed labour force2. Large Scale Manufacturing (LSM)
constituting 10.6 percent of GDP dominates the sector and accounts for 81 percent. Small Scale
Manufacturing (SSM), accounts for 1.6 percent of the GDP.
1.2 Services
1.11 Pakistan’s economy has gone through a major structural transformation. According to
Economic Survey 2012/13, the share of services sector has increased from 56 percent of GDP in
2005-06 to 57.7 percent in FY2012/13. In developed countries the share of services sector in
GDP is around 75 percent. This share is 73 percent in Singapore, 65 percent in India, and 54
percent in Bangladesh.
1Pakistan Economic Survey FY12/13 2State Bank of Pakistan Second Quarterly Report for FY12/13
6
1.12 Finance & insurance posted higher growth compared to the previous year, this mainly
reflects government borrowing from commercial banks which was necessitated by capital
injection in power sector.. Telecom sector did not perform very well, primarily because of Strong
competition amongst service providers, increased use of grey channels, regulatory issues like
interruption of mobile services dictated by law and order needs and additional taxes.
1.13 According to SBP Report 2012/13 the investment-to-GDP ratio was 14.2 percent which
is lower than the 14.9 percent realized in FY2011/12. More importantly, private investment fell
to 8.7 percent of GDP. With a young population that is still growing at 2.0 percent per annum,
job creation in the private sector must be prioritized to absorb the number of people who are
entering the market every year. Given this, sustained economic growth of 7 percent is required to
improve social indicators and reduce poverty levels.
1.3 Inflation
1.14 According to Economic Survey 2012/13, inflation rate on a year on year basis continued
its downward trend in the ten consecutive months i.e. July 2012 to April 2013. Food inflation
and non-food inflation also witnessed similar trend of a single digit inflation during the period
under review.
1.15 Headline inflation decelerated from 9.6 percent in July 2012 to 5.8 percent in April 2013.
Food and non-food inflation reduced from 9.1 percent and 10.0 percent in July 2012 to 5.5
percent and 6.1 percent respectively in April 2013. The current CPI inflation of 5.8 percent is the
110 month lowest since March 2004 when it was 5.3. The current Food inflation of 5.5 percent
(barring April 2006 3.6 percent) is 85 month lowest and that of non-food inflation at 6.1 percent
is 66 month lowest from November 2007 when it was 5.9 percent. The declining trend in global
commodity prices, improved supply of local consumable items coupled with prudent
macroeconomic management contributed towards arresting the spiraling inflation.
7
1.16 Single-digit inflation in FY2012/13 was well below the anticipated target set at the
beginning of the year. Better administered prices and soft global commodity prices were
primarily responsible for this positive outcome which in turn helped ease inflationary pressures.
Surveys conducted by SBP show that while households anchor their inflationary outlook to retail
fuel prices, commercial enterprises focus on current and expected value of the Pak Rupee. Since
both POL and the PKR were relatively stable during FY2012/13, inflationary expectations
remained soft during the year.
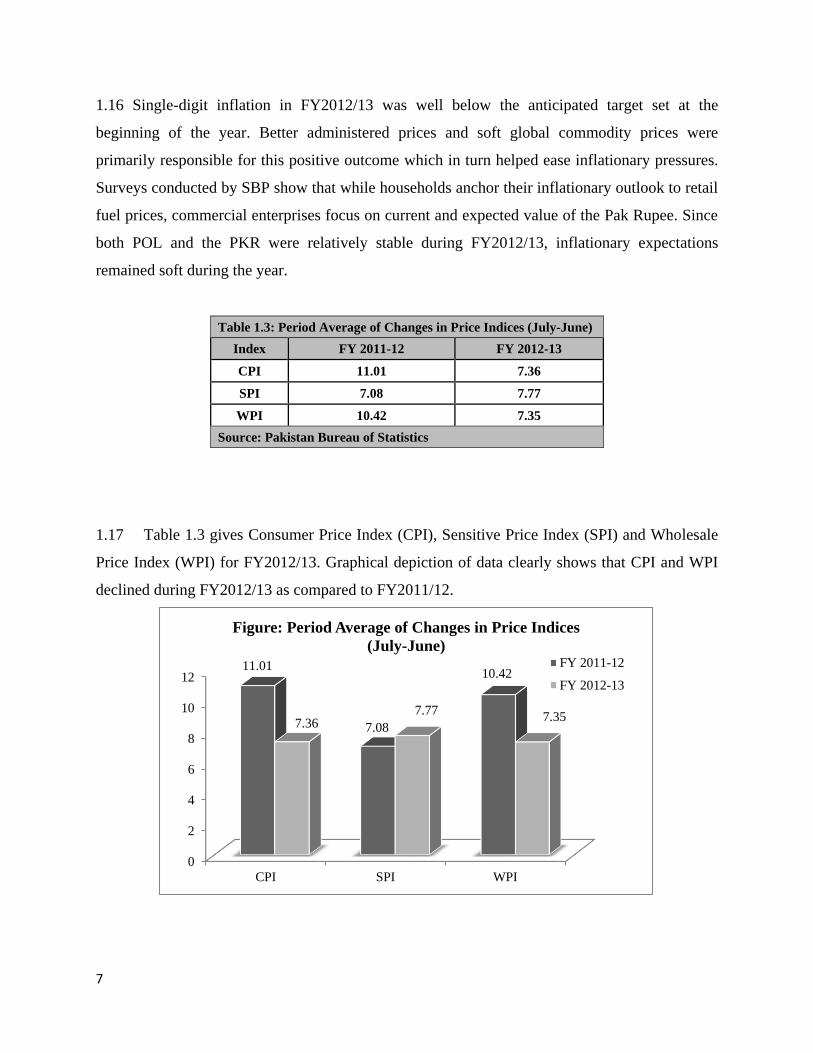
Table 1.3: Period Average of Changes in Price Indices (July-June)
Index FY 2011-12 FY 2012-13
CPI 11.01 7.36
SPI 7.08 7.77
WPI 10.42 7.35
Source: Pakistan Bureau of Statistics
1.17 Table 1.3 gives Consumer Price Index (CPI), Sensitive Price Index (SPI) and Wholesale
Price Index (WPI) for FY2012/13. Graphical depiction of data clearly shows that CPI and WPI
declined during FY2012/13 as compared to FY2011/12.
0
2
4
6
8
10
12
CPI SPI WPI
11.01
7.08
10.42
7.367.77
7.35
Figure: Period Average of Changes in Price Indices
(July-June)FY 2011-12
FY 2012-13
8
1.4 Fiscal Balance
1.18 Fiscal consolidation planned at the beginning of the year could not achieve the targeted
revenues. On expenditure side, actual spending exceeded the budgetary allocations. The
deviation from initial estimates was largely on account of three factors: underestimation of
subsidies, underestimation of interest payments and overestimation of FBR tax revenue.
According to SBP Report 2012/13, the budget deficit for FY13 was 8.0 percent of GDP
against the target of 4.7 percent despite impressive combined surplus by provinces of Rs 52.7
billion in FY2012/13 as compared to Rs 39.1 billion deficit in FY2011/12.
1.19 Tax revenues did not gain momentum as planned tax measures in the FY2012/13 budget
could not be implemented. Perennial structural and governance issues in the national revenue
system require a broad based national effort in order to ensure healthy revenue streams.
Although overall weak performance by economy sets the stage for fall in tax-to-GDP ratio from
10.2 percent in FY2011/12 to 9.8 percent in FY2012/13. In fact tax revenue collection could not
even keep pace with the subdued growth in nominal GDP. The stagnant tax-to-GDP ratio (one of
the lowest in the world) was the biggest impediment to a stable macro economy which was
required to deliver higher economic growth. Without a broad-based political and administrative
will to address structural bottlenecks and enforcement handicaps to increase tax collection in a
more equitable manner, fiscal consolidation is likely to remain elusive as was the case in
FY2012/13.
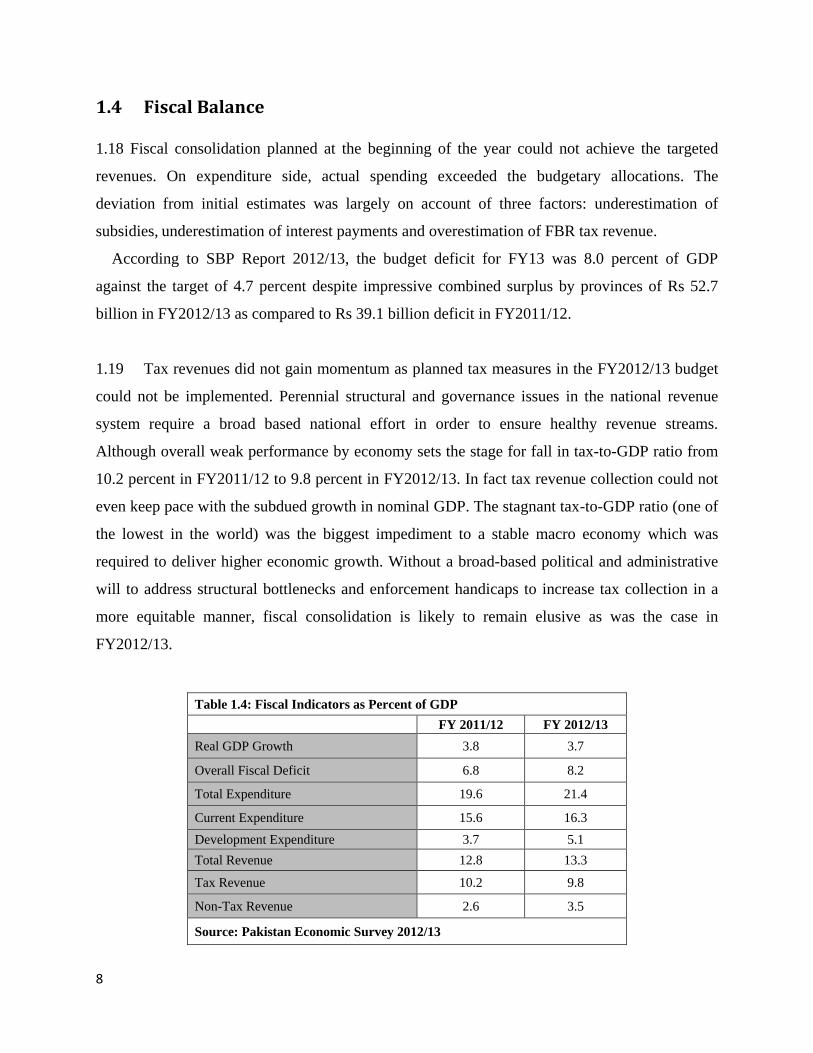
Table 1.4: Fiscal Indicators as Percent of GDP
FY 2011/12 FY 2012/13
Real GDP Growth 3.8 3.7
Overall Fiscal Deficit 6.8 8.2
Total Expenditure 19.6 21.4
Current Expenditure 15.6 16.3
Development Expenditure 3.7 5.1
Total Revenue 12.8 13.3
Tax Revenue 10.2 9.8
Non-Tax Revenue 2.6 3.5
Source: Pakistan Economic Survey 2012/13
9
1.20 Table 1.4 shows main fiscal indicators as percentage of GDP. Data reveals that
Development and Current expenditures increased while Tax revenues declined. Fiscal deficit
showed increase from 6.8 percent of GDP in FY2011/12 to 8.2 percent of GDP in FY2012/13.
According to SBP Report 2012/13, the revenue deficit (the gap between total revenues and
current expenditures) reached 3.0 percent of GDP in FY2012/13. This implies that the Federal
Government was not only borrowing to finance all its development expenditures but was also
borrowing to finance 10.4 percent of its current expenditures.
1.5 External Account
1.21 Pakistan’s exports grew by 3.5 percent in FY2012/13 (based on PBS3 data), compared to
negative growth of 4.8 percent last year. This was largely because of duty free access of certain
items (mainly textiles) to the EU market and increased demand for cotton yarn and fabric from
both China and Hong Kong. This, along with an almost stagnant import bill helped narrow the
trade deficit4.
1.22 The real positive in the country’s BoP was worker remittances, which has become the
most critical source of foreign exchange receipts. In absolute terms, worker remittances reached
US$ 13.9 billion in FY2012/13 which effectively financed one-third of the country’s import bill.
The realization of CSF and increase in remittances narrowed the current account deficit to US$
2.5 billion in FY2012/13 against US$ 4.7 billion deficit in the previous year (see, table 1.5).
3Pakistan Bureau of Statistics 4 State Bank of Pakistan Report 2012/13
10
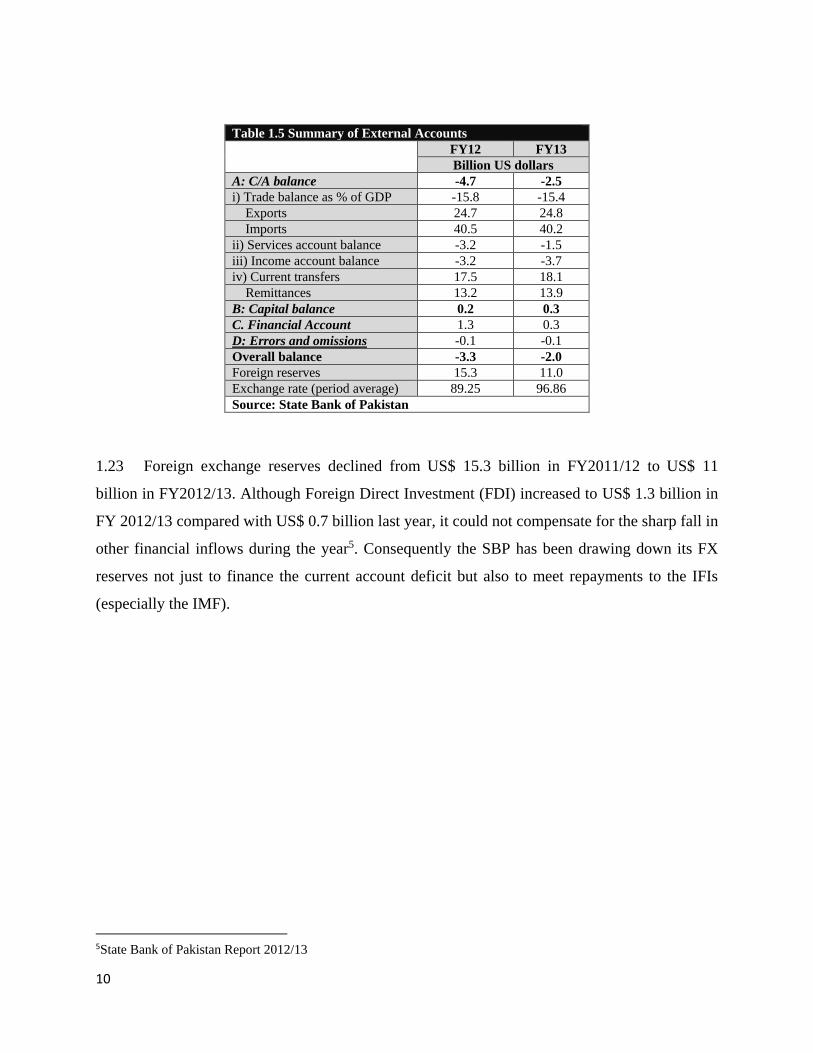
1.23 Foreign exchange reserves declined from US$ 15.3 billion in FY2011/12 to US$ 11
billion in FY2012/13. Although Foreign Direct Investment (FDI) increased to US$ 1.3 billion in
FY 2012/13 compared with US$ 0.7 billion last year, it could not compensate for the sharp fall in
other financial inflows during the year5. Consequently the SBP has been drawing down its FX
reserves not just to finance the current account deficit but also to meet repayments to the IFIs
(especially the IMF).
5State Bank of Pakistan Report 2012/13
Table 1.5 Summary of External Accounts
FY12 FY13
Billion US dollars
A: C/A balance -4.7 -2.5
i) Trade balance as % of GDP -15.8 -15.4
Exports 24.7 24.8
Imports 40.5 40.2
ii) Services account balance -3.2 -1.5
iii) Income account balance -3.2 -3.7
iv) Current transfers 17.5 18.1
Remittances 13.2 13.9
B: Capital balance 0.2 0.3
C. Financial Account 1.3 0.3
D: Errors and omissions -0.1 -0.1
Overall balance -3.3 -2.0
Foreign reserves 15.3 11.0
Exchange rate (period average) 89.25 96.86
Source: State Bank of Pakistan
11
Chapter 2.Pro-Poor Budgetary Expenditures
Pro-poor Budgetary Expenditures 2.1 A positive trend was recorded in Education, Health and Population planning that
increased by 21.94 percent, 20.14 percent and 22.59 percent respectively. Agriculture, Land
Reclamation, Peoples’ Works Programme II recorded growth of 10.49 percent, 10.54 percent,
and 26.49 percent, respectively. Comparing with the previous year, overall expenditures in pro-
poor sectors declined by 1.29 percent from Rs. 1,938,357 million to Rs. 1,913,287 million. This
decline was recorded specifically in four sectors; Roads, Highways & Bridges, PWP-I, Natural
Calamities & Disasters and Subsidies at a rate of 15 percent, 22 percent, 57 percent and 19
percent respectively..
2.2 The Government policies have been geared towards effective governance, better
infrastructure, facilitating market access, improvement in Human Development, strengthening
Safety Nets for the vulnerable and destitute. Justice Administration and Law & Order have also
experienced positive growth of 31.79 percent and 13.29 percent respectively during FY2011/12
and FY2012/13 (see Table 2.1).
12
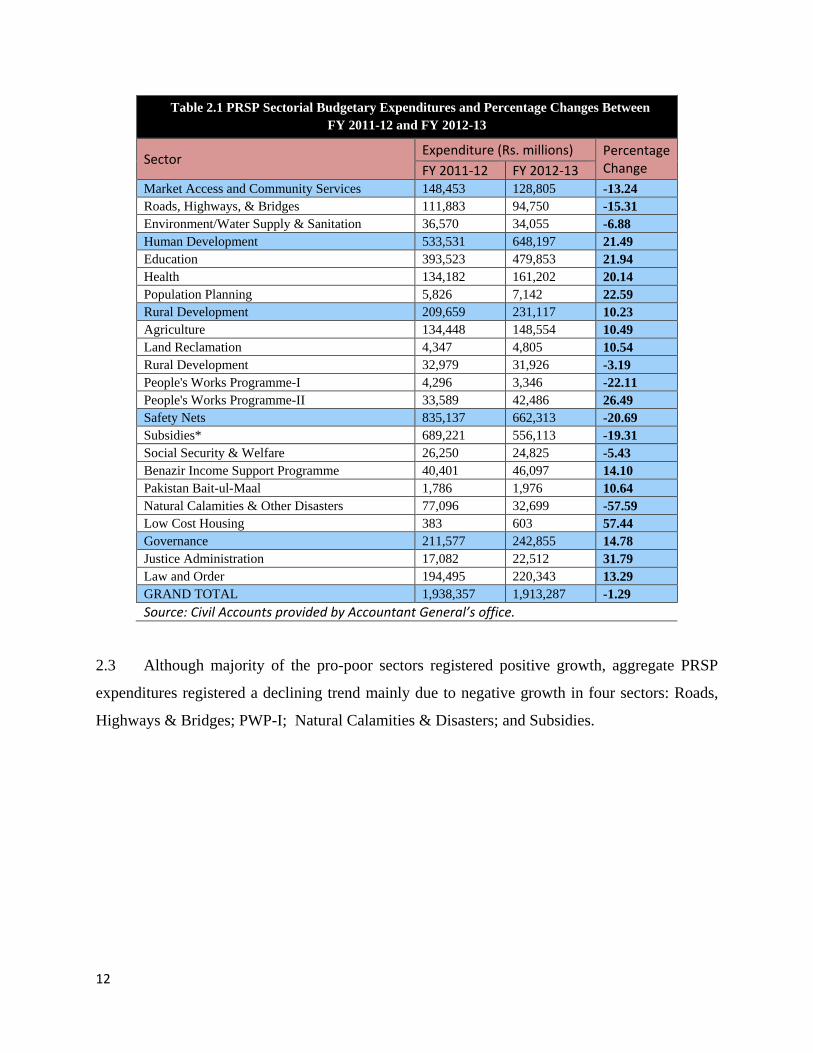
Table 2.1 PRSP Sectorial Budgetary Expenditures and Percentage Changes Between
FY 2011-12 and FY 2012-13
Sector Expenditure (Rs. millions) Percentage
Change FY 2011-12 FY 2012-13 Market Access and Community Services 148,453 128,805 -13.24
Roads, Highways, & Bridges 111,883 94,750 -15.31
Environment/Water Supply & Sanitation 36,570 34,055 -6.88
Human Development 533,531 648,197 21.49
Education 393,523 479,853 21.94
Health 134,182 161,202 20.14
Population Planning 5,826 7,142 22.59
Rural Development 209,659 231,117 10.23
Agriculture 134,448 148,554 10.49
Land Reclamation 4,347 4,805 10.54
Rural Development 32,979 31,926 -3.19
People's Works Programme-I 4,296 3,346 -22.11
People's Works Programme-II 33,589 42,486 26.49
Safety Nets 835,137 662,313 -20.69
Subsidies* 689,221 556,113 -19.31
Social Security & Welfare 26,250 24,825 -5.43
Benazir Income Support Programme 40,401 46,097 14.10
Pakistan Bait-ul-Maal 1,786 1,976 10.64
Natural Calamities & Other Disasters 77,096 32,699 -57.59
Low Cost Housing 383 603 57.44
Governance 211,577 242,855 14.78
Justice Administration 17,082 22,512 31.79
Law and Order 194,495 220,343 13.29
GRAND TOTAL 1,938,357 1,913,287 -1.29
Source: Civil Accounts provided by Accountant General’s office.
2.3 Although majority of the pro-poor sectors registered positive growth, aggregate PRSP
expenditures registered a declining trend mainly due to negative growth in four sectors: Roads,
Highways & Bridges; PWP-I; Natural Calamities & Disasters; and Subsidies.
13
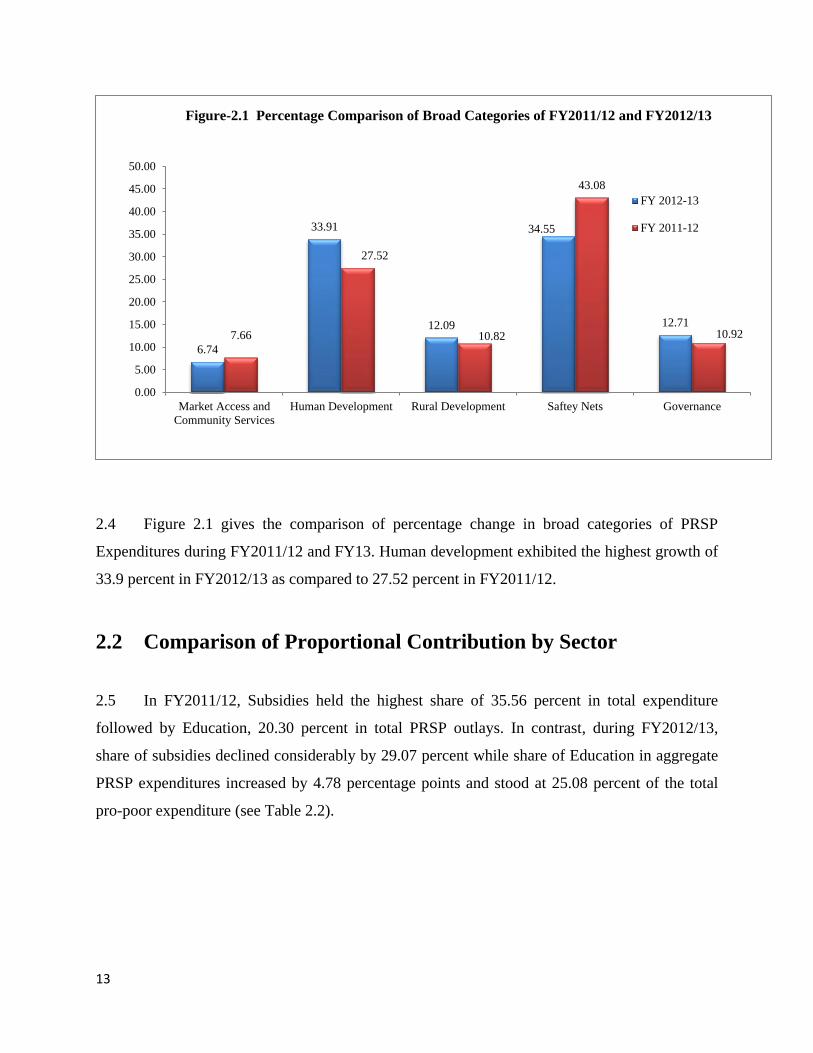
2.4 Figure 2.1 gives the comparison of percentage change in broad categories of PRSP
Expenditures during FY2011/12 and FY13. Human development exhibited the highest growth of
33.9 percent in FY2012/13 as compared to 27.52 percent in FY2011/12.
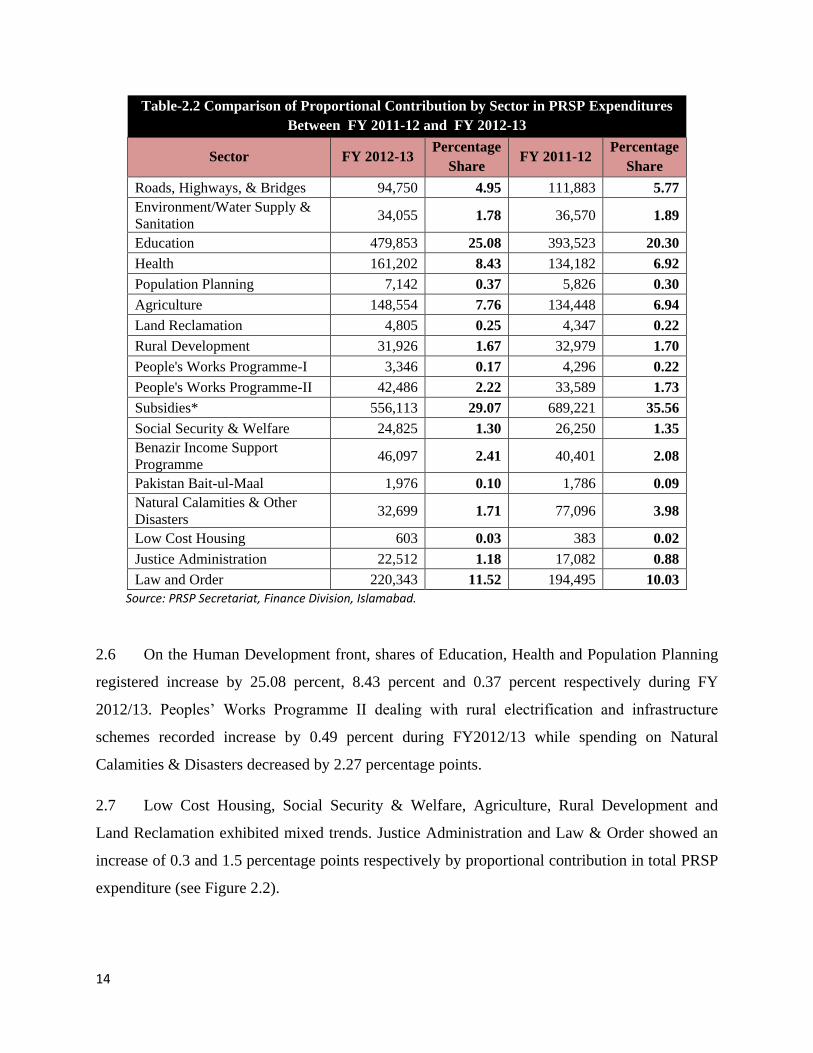
2.2 Comparison of Proportional Contribution by Sector
2.5 In FY2011/12, Subsidies held the highest share of 35.56 percent in total expenditure
followed by Education, 20.30 percent in total PRSP outlays. In contrast, during FY2012/13,
share of subsidies declined considerably by 29.07 percent while share of Education in aggregate
PRSP expenditures increased by 4.78 percentage points and stood at 25.08 percent of the total
pro-poor expenditure (see Table 2.2).
6.74
33.91
12.09
34.55
12.717.66
27.52
10.82
43.08
10.92
0.00
5.00
10.00
15.00
20.00
25.00
30.00
35.00
40.00
45.00
50.00
Market Access and
Community Services
Human Development Rural Development Saftey Nets Governance
Figure-2.1 Percentage Comparison of Broad Categories of FY2011/12 and FY2012/13
FY 2012-13
FY 2011-12
14
Table-2.2 Comparison of Proportional Contribution by Sector in PRSP Expenditures
Between FY 2011-12 and FY 2012-13
Sector FY 2012-13 Percentage
Share FY 2011-12
Percentage
Share
Roads, Highways, & Bridges 94,750 4.95 111,883 5.77
Environment/Water Supply &
Sanitation 34,055 1.78 36,570 1.89
Education 479,853 25.08 393,523 20.30
Health 161,202 8.43 134,182 6.92
Population Planning 7,142 0.37 5,826 0.30
Agriculture 148,554 7.76 134,448 6.94
Land Reclamation 4,805 0.25 4,347 0.22
Rural Development 31,926 1.67 32,979 1.70
People's Works Programme-I 3,346 0.17 4,296 0.22
People's Works Programme-II 42,486 2.22 33,589 1.73
Subsidies* 556,113 29.07 689,221 35.56
Social Security & Welfare 24,825 1.30 26,250 1.35
Benazir Income Support
Programme 46,097 2.41 40,401 2.08
Pakistan Bait-ul-Maal 1,976 0.10 1,786 0.09
Natural Calamities & Other
Disasters 32,699 1.71 77,096 3.98
Low Cost Housing 603 0.03 383 0.02
Justice Administration 22,512 1.18 17,082 0.88
Law and Order 220,343 11.52 194,495 10.03
Source: PRSP Secretariat, Finance Division, Islamabad.
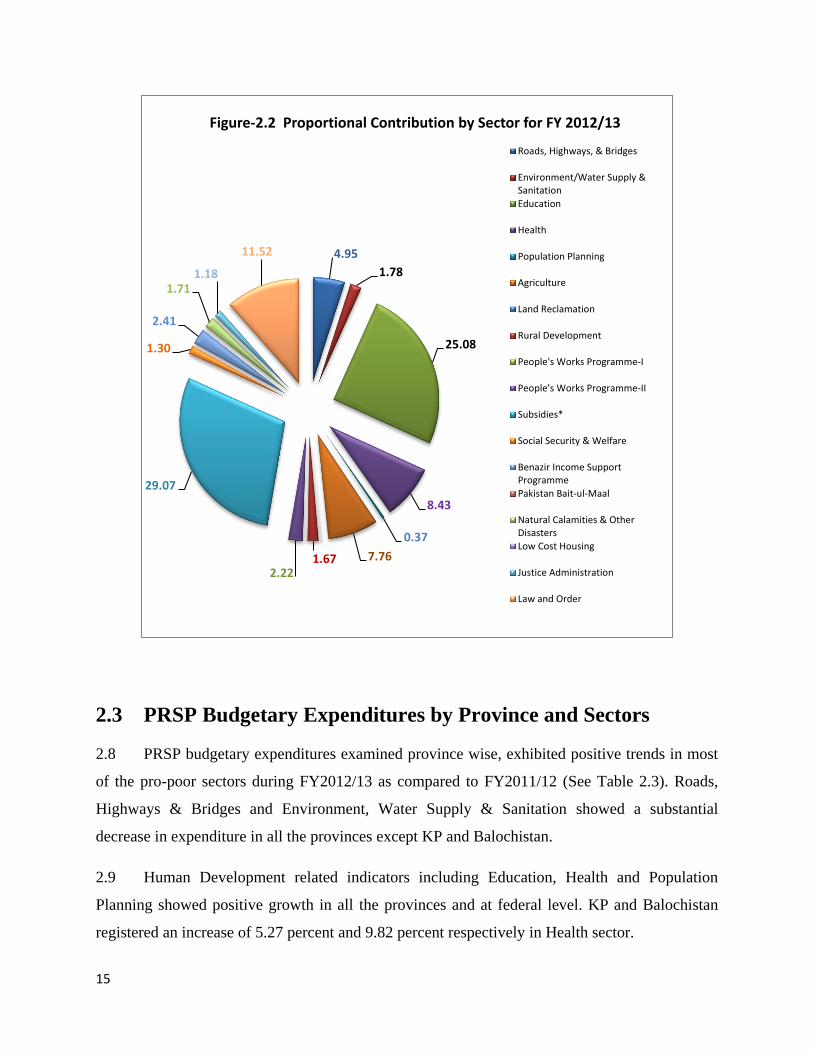
2.6 On the Human Development front, shares of Education, Health and Population Planning
registered increase by 25.08 percent, 8.43 percent and 0.37 percent respectively during FY
2012/13. Peoples’ Works Programme II dealing with rural electrification and infrastructure
schemes recorded increase by 0.49 percent during FY2012/13 while spending on Natural
Calamities & Disasters decreased by 2.27 percentage points.
2.7 Low Cost Housing, Social Security & Welfare, Agriculture, Rural Development and
Land Reclamation exhibited mixed trends. Justice Administration and Law & Order showed an
increase of 0.3 and 1.5 percentage points respectively by proportional contribution in total PRSP
expenditure (see Figure 2.2).
15
2.3 PRSP Budgetary Expenditures by Province and Sectors
2.8 PRSP budgetary expenditures examined province wise, exhibited positive trends in most
of the pro-poor sectors during FY2012/13 as compared to FY2011/12 (See Table 2.3). Roads,
Highways & Bridges and Environment, Water Supply & Sanitation showed a substantial
decrease in expenditure in all the provinces except KP and Balochistan.
2.9 Human Development related indicators including Education, Health and Population
Planning showed positive growth in all the provinces and at federal level. KP and Balochistan
registered an increase of 5.27 percent and 9.82 percent respectively in Health sector.
4.95
1.78
25.08
8.43
0.37
7.761.672.22
29.07
1.30
2.41
1.711.18
11.52
Figure-2.2 Proportional Contribution by Sector for FY 2012/13
Roads, Highways, & Bridges
Environment/Water Supply &Sanitation
Education
Health
Population Planning
Agriculture
Land Reclamation
Rural Development
People's Works Programme-I
People's Works Programme-II
Subsidies*
Social Security & Welfare
Benazir Income SupportProgramme
Pakistan Bait-ul-Maal
Natural Calamities & OtherDisasters
Low Cost Housing
Justice Administration
Law and Order
16
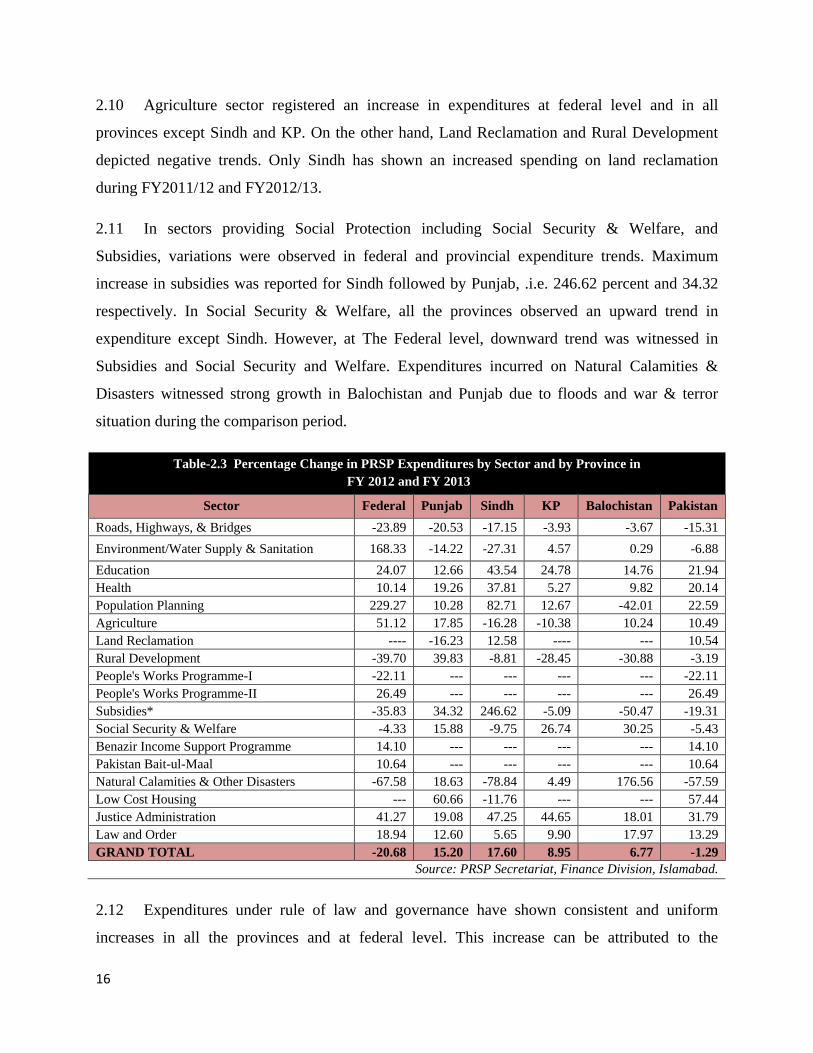
2.10 Agriculture sector registered an increase in expenditures at federal level and in all
provinces except Sindh and KP. On the other hand, Land Reclamation and Rural Development
depicted negative trends. Only Sindh has shown an increased spending on land reclamation
during FY2011/12 and FY2012/13.
2.11 In sectors providing Social Protection including Social Security & Welfare, and
Subsidies, variations were observed in federal and provincial expenditure trends. Maximum
increase in subsidies was reported for Sindh followed by Punjab, .i.e. 246.62 percent and 34.32
respectively. In Social Security & Welfare, all the provinces observed an upward trend in
expenditure except Sindh. However, at The Federal level, downward trend was witnessed in
Subsidies and Social Security and Welfare. Expenditures incurred on Natural Calamities &
Disasters witnessed strong growth in Balochistan and Punjab due to floods and war & terror
situation during the comparison period.
Table-2.3 Percentage Change in PRSP Expenditures by Sector and by Province in
FY 2012 and FY 2013
Sector Federal Punjab Sindh KP Balochistan Pakistan
Roads, Highways, & Bridges -23.89 -20.53 -17.15 -3.93 -3.67 -15.31
Environment/Water Supply & Sanitation 168.33 -14.22 -27.31 4.57 0.29 -6.88
Education 24.07 12.66 43.54 24.78 14.76 21.94
Health 10.14 19.26 37.81 5.27 9.82 20.14
Population Planning 229.27 10.28 82.71 12.67 -42.01 22.59
Agriculture 51.12 17.85 -16.28 -10.38 10.24 10.49
Land Reclamation ---- -16.23 12.58 ---- --- 10.54
Rural Development -39.70 39.83 -8.81 -28.45 -30.88 -3.19
People's Works Programme-I -22.11 --- --- --- --- -22.11
People's Works Programme-II 26.49 --- --- --- --- 26.49
Subsidies* -35.83 34.32 246.62 -5.09 -50.47 -19.31
Social Security & Welfare -4.33 15.88 -9.75 26.74 30.25 -5.43
Benazir Income Support Programme 14.10 --- --- --- --- 14.10
Pakistan Bait-ul-Maal 10.64 --- --- --- --- 10.64
Natural Calamities & Other Disasters -67.58 18.63 -78.84 4.49 176.56 -57.59
Low Cost Housing --- 60.66 -11.76 --- --- 57.44
Justice Administration 41.27 19.08 47.25 44.65 18.01 31.79
Law and Order 18.94 12.60 5.65 9.90 17.97 13.29
GRAND TOTAL -20.68 15.20 17.60 8.95 6.77 -1.29
Source: PRSP Secretariat, Finance Division, Islamabad.
2.12 Expenditures under rule of law and governance have shown consistent and uniform
increases in all the provinces and at federal level. This increase can be attributed to the
17
Government’s efforts to curb terrorist activities necessitating greater expenditure outlays on
security forces.
2.4 Current and Development Expenditures
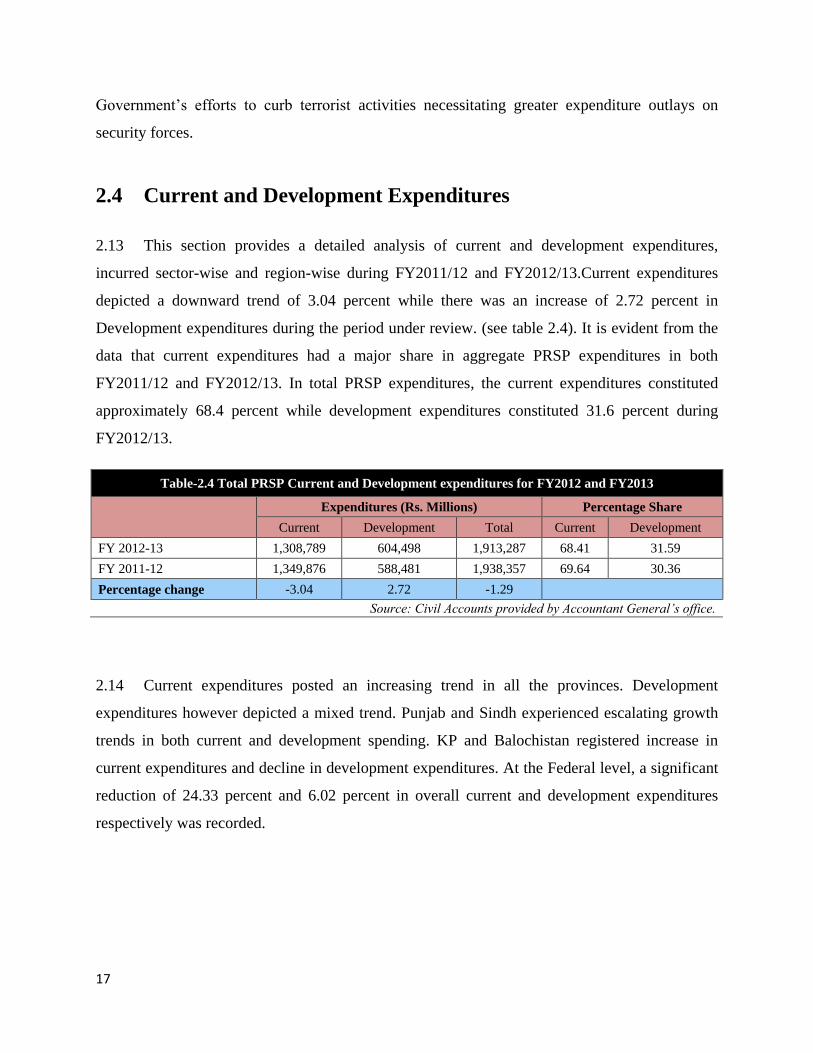
2.13 This section provides a detailed analysis of current and development expenditures,
incurred sector-wise and region-wise during FY2011/12 and FY2012/13.Current expenditures
depicted a downward trend of 3.04 percent while there was an increase of 2.72 percent in
Development expenditures during the period under review. (see table 2.4). It is evident from the
data that current expenditures had a major share in aggregate PRSP expenditures in both
FY2011/12 and FY2012/13. In total PRSP expenditures, the current expenditures constituted
approximately 68.4 percent while development expenditures constituted 31.6 percent during
FY2012/13.
Table-2.4 Total PRSP Current and Development expenditures for FY2012 and FY2013
Expenditures (Rs. Millions) Percentage Share
Current Development Total Current Development
FY 2012-13 1,308,789 604,498 1,913,287 68.41 31.59
FY 2011-12 1,349,876 588,481 1,938,357 69.64 30.36
Percentage change -3.04 2.72 -1.29
Source: Civil Accounts provided by Accountant General’s office.
2.14 Current expenditures posted an increasing trend in all the provinces. Development
expenditures however depicted a mixed trend. Punjab and Sindh experienced escalating growth
trends in both current and development spending. KP and Balochistan registered increase in
current expenditures and decline in development expenditures. At the Federal level, a significant
reduction of 24.33 percent and 6.02 percent in overall current and development expenditures
respectively was recorded.
18
(see Table 2.5).
Table-2.5 Percentage Change in PRSP Current and Development Expenditures by Province
for FY2012 and FY2013
Province FY 2012/13 FY 2011/12 Percentage change
Current Development Current Development Current Development
Federal 518,125 160,378 684,730 170,652 -24.33 -6.02
Punjab 395,130 228,064 327,964 212,980 20.48 7.08
Sindh 198,816 116,724 168,293 100,018 18.14 16.70
KP 131,474 58,487 110,474 63,880 19.01 -8.44
Balochistan 65,244 40,845 58,415 40,951 11.69 -0.26
Pakistan 1,308,789 604,498 1,349,876 588,481 -3.04 2.72
Source: Civil Accounts provided by Accountant General’s office.
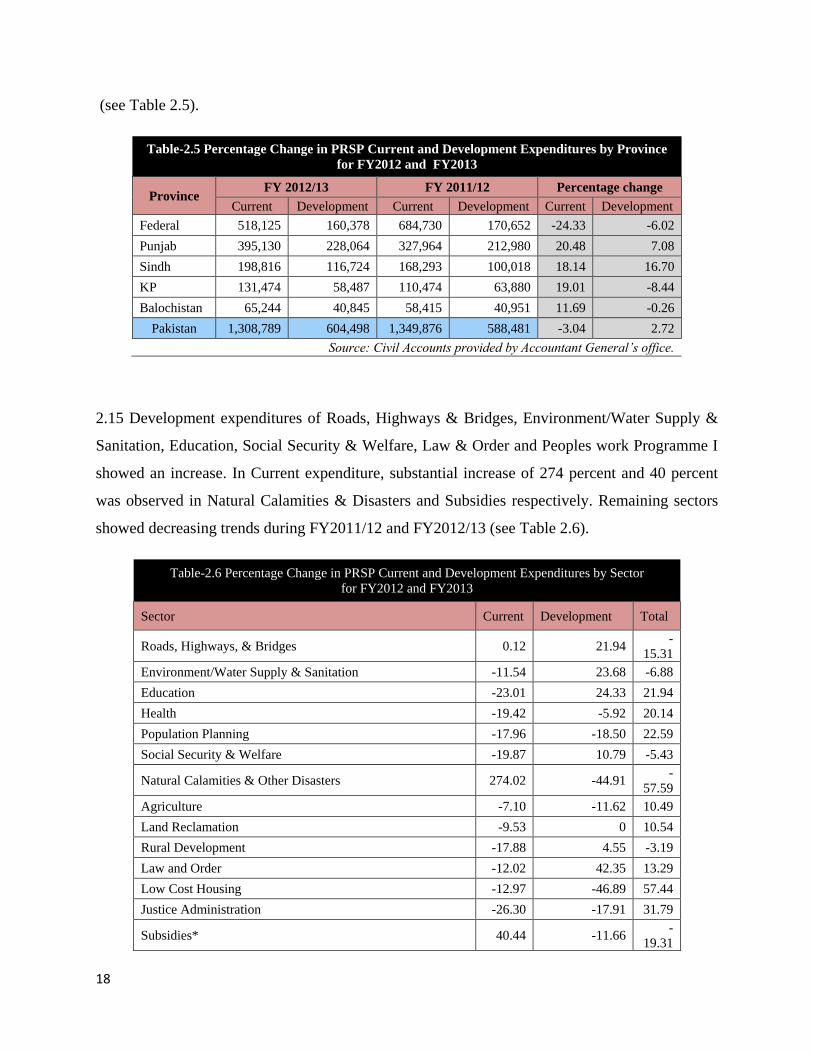
2.15 Development expenditures of Roads, Highways & Bridges, Environment/Water Supply &
Sanitation, Education, Social Security & Welfare, Law & Order and Peoples work Programme I
showed an increase. In Current expenditure, substantial increase of 274 percent and 40 percent
was observed in Natural Calamities & Disasters and Subsidies respectively. Remaining sectors
showed decreasing trends during FY2011/12 and FY2012/13 (see Table 2.6).
Table-2.6 Percentage Change in PRSP Current and Development Expenditures by Sector
for FY2012 and FY2013
Sector Current Development Total
Roads, Highways, & Bridges 0.12 21.94 -
15.31
Environment/Water Supply & Sanitation -11.54 23.68 -6.88
Education -23.01 24.33 21.94
Health -19.42 -5.92 20.14
Population Planning -17.96 -18.50 22.59
Social Security & Welfare -19.87 10.79 -5.43
Natural Calamities & Other Disasters 274.02 -44.91 -
57.59
Agriculture -7.10 -11.62 10.49
Land Reclamation -9.53 0 10.54
Rural Development -17.88 4.55 -3.19
Law and Order -12.02 42.35 13.29
Low Cost Housing -12.97 -46.89 57.44
Justice Administration -26.30 -17.91 31.79
Subsidies* 40.44 -11.66 -
19.31
19
People's Works Programme-I - 28.39 -
22.11
People's Works Programme-II - -20.94 26.49
Benazir Income Support Programme - -12.36 14.10
Pakistan Bait-ul-Maal -9.62 - 10.64
GRAND TOTAL -3.04 2.72 -1.29
Source: PRSP Secretariat, Finance Division, Islamabad.
2.5 Effect of Subsidies on PRSP Budgetary Expenditures
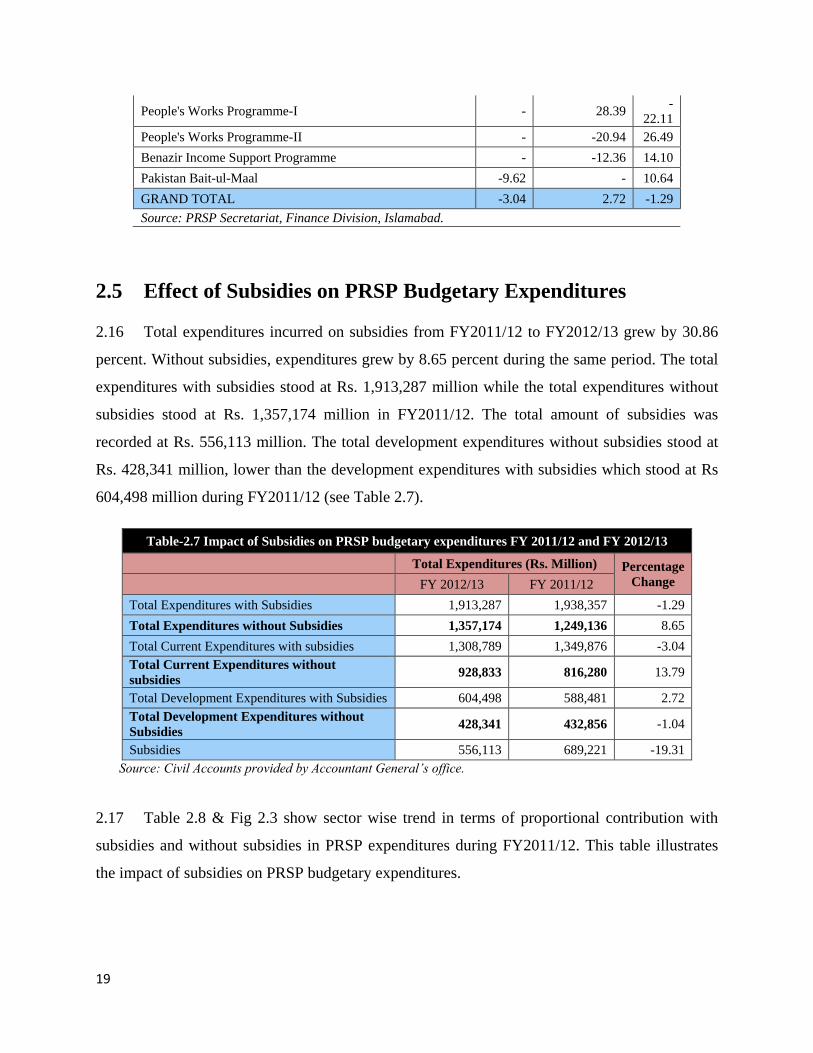
2.16 Total expenditures incurred on subsidies from FY2011/12 to FY2012/13 grew by 30.86
percent. Without subsidies, expenditures grew by 8.65 percent during the same period. The total
expenditures with subsidies stood at Rs. 1,913,287 million while the total expenditures without
subsidies stood at Rs. 1,357,174 million in FY2011/12. The total amount of subsidies was
recorded at Rs. 556,113 million. The total development expenditures without subsidies stood at
Rs. 428,341 million, lower than the development expenditures with subsidies which stood at Rs
604,498 million during FY2011/12 (see Table 2.7).
Table-2.7 Impact of Subsidies on PRSP budgetary expenditures FY 2011/12 and FY 2012/13
Total Expenditures (Rs. Million) Percentage
Change FY 2012/13 FY 2011/12
Total Expenditures with Subsidies 1,913,287 1,938,357 -1.29
Total Expenditures without Subsidies 1,357,174 1,249,136 8.65
Total Current Expenditures with subsidies 1,308,789 1,349,876 -3.04
Total Current Expenditures without
subsidies 928,833 816,280 13.79
Total Development Expenditures with Subsidies 604,498 588,481 2.72
Total Development Expenditures without
Subsidies 428,341 432,856 -1.04
Subsidies 556,113 689,221 -19.31
Source: Civil Accounts provided by Accountant General’s office.
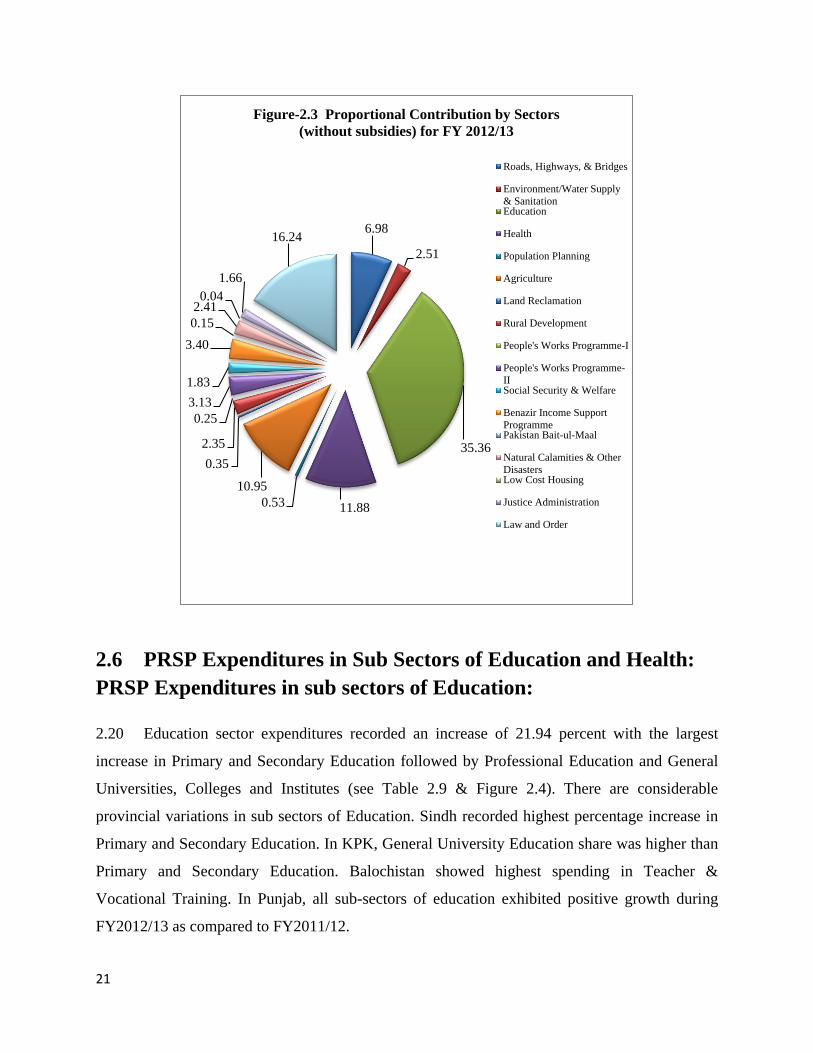
2.17 Table 2.8 & Fig 2.3 show sector wise trend in terms of proportional contribution with
subsidies and without subsidies in PRSP expenditures during FY2011/12. This table illustrates
the impact of subsidies on PRSP budgetary expenditures.
20
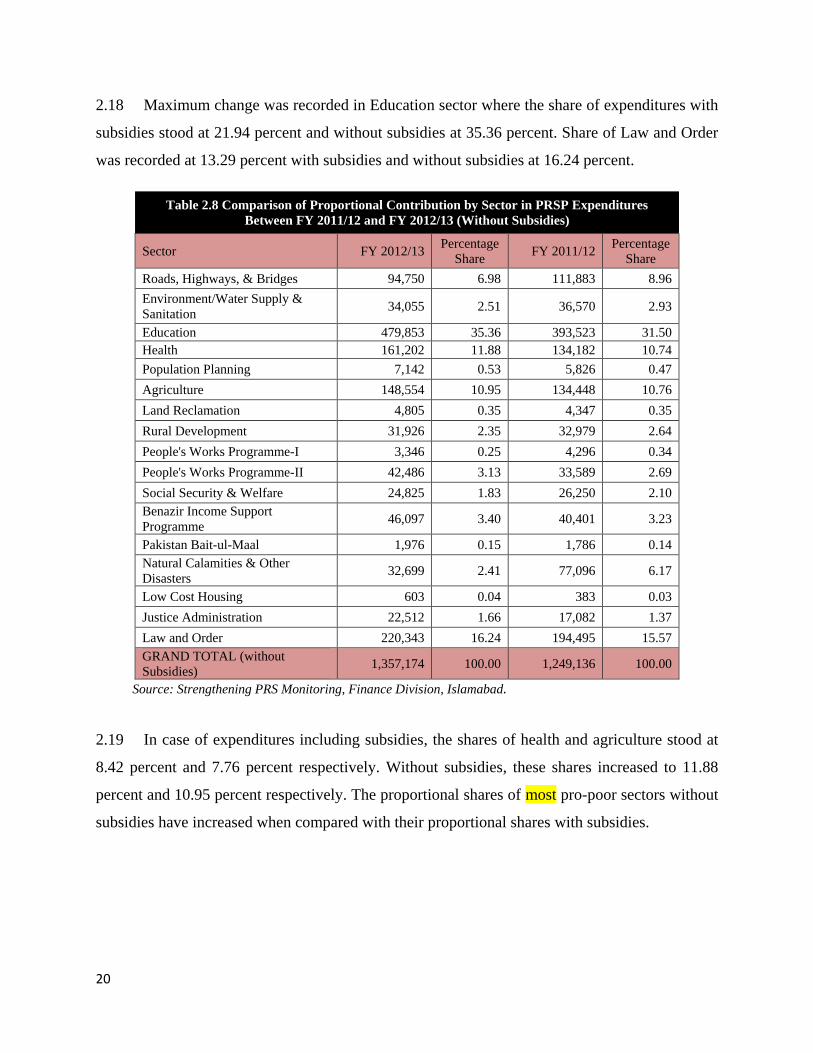
2.18 Maximum change was recorded in Education sector where the share of expenditures with
subsidies stood at 21.94 percent and without subsidies at 35.36 percent. Share of Law and Order
was recorded at 13.29 percent with subsidies and without subsidies at 16.24 percent.
Table 2.8 Comparison of Proportional Contribution by Sector in PRSP Expenditures
Between FY 2011/12 and FY 2012/13 (Without Subsidies)
Sector FY 2012/13 Percentage
Share FY 2011/12
Percentage
Share
Roads, Highways, & Bridges 94,750 6.98 111,883 8.96
Environment/Water Supply &
Sanitation 34,055 2.51 36,570 2.93
Education 479,853 35.36 393,523 31.50
Health 161,202 11.88 134,182 10.74
Population Planning 7,142 0.53 5,826 0.47
Agriculture 148,554 10.95 134,448 10.76
Land Reclamation 4,805 0.35 4,347 0.35
Rural Development 31,926 2.35 32,979 2.64
People's Works Programme-I 3,346 0.25 4,296 0.34
People's Works Programme-II 42,486 3.13 33,589 2.69
Social Security & Welfare 24,825 1.83 26,250 2.10
Benazir Income Support
Programme 46,097 3.40 40,401 3.23
Pakistan Bait-ul-Maal 1,976 0.15 1,786 0.14
Natural Calamities & Other
Disasters 32,699 2.41 77,096 6.17
Low Cost Housing 603 0.04 383 0.03
Justice Administration 22,512 1.66 17,082 1.37
Law and Order 220,343 16.24 194,495 15.57
GRAND TOTAL (without
Subsidies) 1,357,174 100.00 1,249,136 100.00
Source: Strengthening PRS Monitoring, Finance Division, Islamabad.
2.19 In case of expenditures including subsidies, the shares of health and agriculture stood at
8.42 percent and 7.76 percent respectively. Without subsidies, these shares increased to 11.88
percent and 10.95 percent respectively. The proportional shares of most pro-poor sectors without
subsidies have increased when compared with their proportional shares with subsidies.
21
2.6 PRSP Expenditures in Sub Sectors of Education and Health:
PRSP Expenditures in sub sectors of Education:
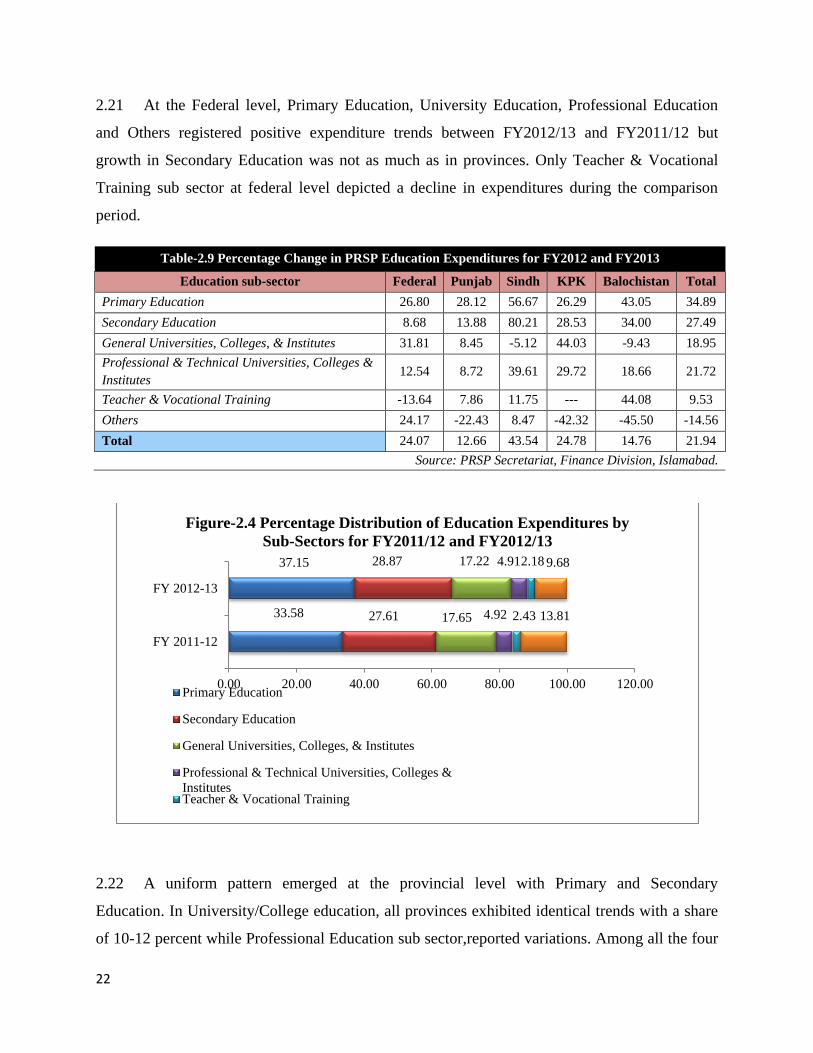
2.20 Education sector expenditures recorded an increase of 21.94 percent with the largest
increase in Primary and Secondary Education followed by Professional Education and General
Universities, Colleges and Institutes (see Table 2.9 & Figure 2.4). There are considerable
provincial variations in sub sectors of Education. Sindh recorded highest percentage increase in
Primary and Secondary Education. In KPK, General University Education share was higher than
Primary and Secondary Education. Balochistan showed highest spending in Teacher &
Vocational Training. In Punjab, all sub-sectors of education exhibited positive growth during
FY2012/13 as compared to FY2011/12.
6.98
2.51
35.36
11.880.53
10.95
0.35
2.35
0.25
3.13
1.83
3.40
0.15
2.410.04
1.66
16.24
Figure-2.3 Proportional Contribution by Sectors
(without subsidies) for FY 2012/13
Roads, Highways, & Bridges
Environment/Water Supply
& SanitationEducation
Health
Population Planning
Agriculture
Land Reclamation
Rural Development
People's Works Programme-I
People's Works Programme-
IISocial Security & Welfare
Benazir Income Support
ProgrammePakistan Bait-ul-Maal
Natural Calamities & Other
DisastersLow Cost Housing
Justice Administration
Law and Order
22
2.21 At the Federal level, Primary Education, University Education, Professional Education
and Others registered positive expenditure trends between FY2012/13 and FY2011/12 but
growth in Secondary Education was not as much as in provinces. Only Teacher & Vocational
Training sub sector at federal level depicted a decline in expenditures during the comparison
period.
Table-2.9 Percentage Change in PRSP Education Expenditures for FY2012 and FY2013
Education sub-sector Federal Punjab Sindh KPK Balochistan Total
Primary Education 26.80 28.12 56.67 26.29 43.05 34.89
Secondary Education 8.68 13.88 80.21 28.53 34.00 27.49
General Universities, Colleges, & Institutes 31.81 8.45 -5.12 44.03 -9.43 18.95
Professional & Technical Universities, Colleges &
Institutes 12.54 8.72 39.61 29.72 18.66 21.72
Teacher & Vocational Training -13.64 7.86 11.75 --- 44.08 9.53
Others 24.17 -22.43 8.47 -42.32 -45.50 -14.56
Total 24.07 12.66 43.54 24.78 14.76 21.94
Source: PRSP Secretariat, Finance Division, Islamabad.
2.22 A uniform pattern emerged at the provincial level with Primary and Secondary
Education. In University/College education, all provinces exhibited identical trends with a share
of 10-12 percent while Professional Education sub sector,reported variations. Among all the four
33.58
37.15
27.61
28.87
17.65
17.22
4.92
4.91
2.43
2.18
13.81
9.68
0.00 20.00 40.00 60.00 80.00 100.00 120.00
FY 2011-12
FY 2012-13
Figure-2.4 Percentage Distribution of Education Expenditures by
Sub-Sectors for FY2011/12 and FY2012/13
Primary Education
Secondary Education
General Universities, Colleges, & Institutes
Professional & Technical Universities, Colleges &
InstitutesTeacher & Vocational Training
23
provinces, only in KPK, Professional Education depicted highest share of 8.16 percent in
FY2012/13. Teacher &Vocational Training had the least contribution in all but two provinces i.e.
Balochistan with 4.96 percent and Punjab with 3.97 percent of aggregate education expenditure.
Table-2.10 Percentage Distribution of Education Expenditures for FY2011/12 and FY2012/13
Federal Punjab Sindh KPK Balochistan Total
FY 2011-12
Primary Education 8.70 38.39 43.35 35.58 25.53 33.58
Secondary Education 12.14 29.85 20.86 39.34 34.40 27.61
General Universities, Colleges, & Institutes 50.64 10.65 16.61 10.61 12.14 17.65
Professional & Technical Universities, Colleges &
Institutes 14.20 0.96 4.68 7.85 3.71 4.92
Teacher & Vocational Training 1.75 4.15 0.48 0.00 3.95 2.43
Others 12.57 16.00 14.02 6.62 20.27 13.81
Total 100.00 100.00 100.00 100.00 100.00 100.00
FY 2012-13
Primary Education 8.89 43.66 47.31 36.01 31.83 37.15
Secondary Education 10.63 30.17 26.19 40.52 40.17 28.87
General Universities, Colleges, & Institutes 53.80 10.25 10.98 12.24 9.58 17.22
Professional & Technical Universities, Colleges &
Institutes 12.88 0.93 4.55 8.16 3.84 4.91
Teacher & Vocational Training 1.22 3.97 0.38 0.00 4.96 2.18
Others 12.58 11.02 10.59 3.06 9.63 9.68
Total 100.00 100.00 100.00 100.00 100.00 100.00
Source: PRSP Secretariat, Finance Division, Islamabad.
2.23 Proportional contribution of sub sectors of Education in aggregate expenditures (Fig 2.4)
depicted that Primary and Secondary Education held major shares. Professional Education and
Teacher & Vocational Training held the least shares during FY2012/13.
2.7 PRSP Expenditures in sub-sectors of Health
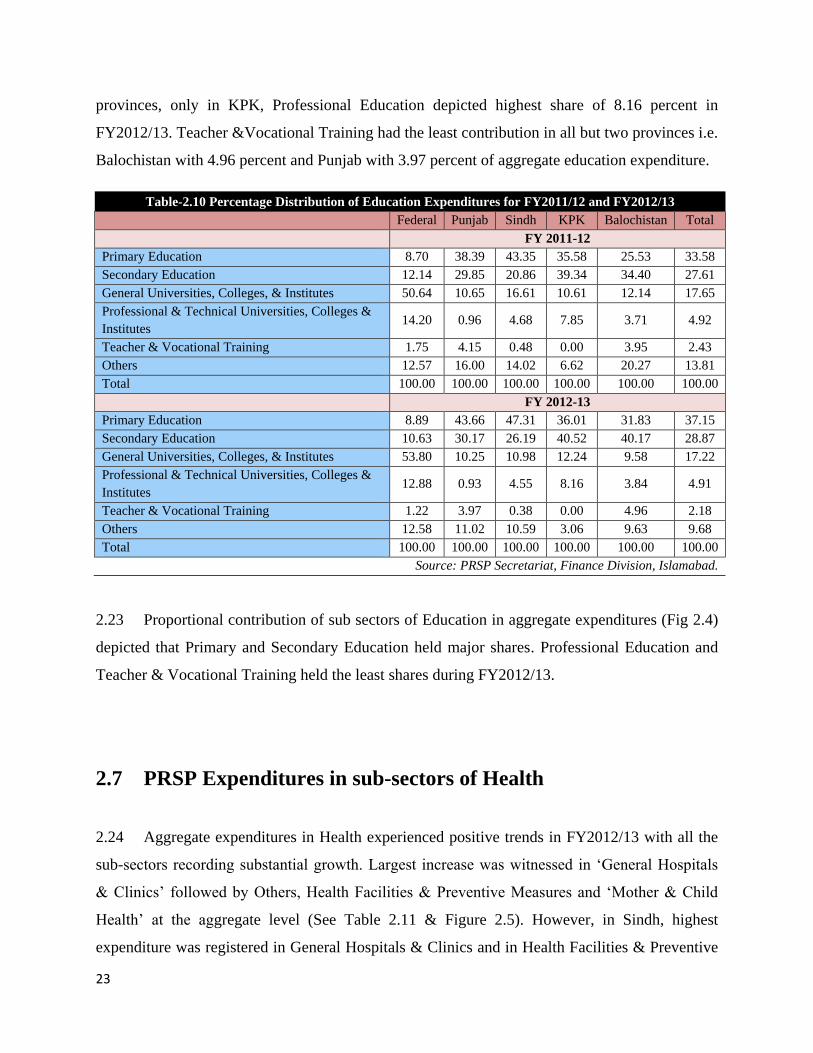
2.24 Aggregate expenditures in Health experienced positive trends in FY2012/13 with all the
sub-sectors recording substantial growth. Largest increase was witnessed in ‘General Hospitals
& Clinics’ followed by Others, Health Facilities & Preventive Measures and ‘Mother & Child
Health’ at the aggregate level (See Table 2.11 & Figure 2.5). However, in Sindh, highest
expenditure was registered in General Hospitals & Clinics and in Health Facilities & Preventive
24
Measures. In KPK, Mother & Child Health and Others recorded highest growth during the
comparison period. At the federal level, expenditures in two sub-sectors of Health registered
positive percentage change.
Table-2.11 Percentage Change in PRSP Health Expenditures for FY2012 and FY2013
Health sub-sector Federal Punjab Sindh KPK Balochistan Total
General Hospitals & Clinics 14.97 21.24 38.14 1.41 21.10 21.68
Mother & Child Health --- -0.50 --- 18.18 --- 2.85
Health Facilities & Preventive Measures -3.03 8.10 57.26 11.82 -20.36 12.58
Others 26.46 7.44 19.28 51.06 8.75 14.96
Total 10.14 19.26 37.81 5.27 9.82 20.14
Source: PRSP Secretariat, Finance Division, Islamabad.
2.24 Identical trends were observed in proportional contribution by sub sectors of Health over
the two years, FY2012/13 and FY2011/12. General Hospitals & Clinics contributed 80 percent
in aggregate Health expenditures followed by others while Mother & Child Health recorded
minimum contribution in FY2012/13 (see table 2.12).
80.77
81.80
0.18
0.16
9.57
8.96
9.48
9.08
0.00 20.00 40.00 60.00 80.00 100.00 120.00
FY 2011-12
FY 2012-13
Figure- 2.5 Percentage of Distribution of Health Expenditures by Sub-Sectors
FY2011/12 and FY2012/13
General Hospitals & Clinics Mother & Child Health
Health Facilities & Preventive Measures Others
25
Table 2.12-Percentage Distribution of Health Expenditures for FY2012 and FY2013
Health sub-sector Federal Punjab Sindh KPK Balochistan Pakistan
FY 2011-12
General Hospitals & Clinics 67.51 85.65 79.38 82.29 64.45 80.77
Mother & Child Health 0.00 0.32 0.00 0.22 0.00 0.18
Health Facilities & Preventive Measures 29.02 3.38 9.38 12.37 23.65 9.57
Others 3.47 10.65 11.23 5.12 11.89 9.48
Total 100.00 100.00 100.00 100.00 100.00 100.00
FY 2012-13
General Hospitals & Clinics 70.47 87.07 79.57 79.27 71.07 81.80
Mother & Child Health 0.00 0.27 0.00 0.24 0.00 0.16
Health Facilities & Preventive Measures 25.55 3.06 10.71 13.14 17.15 8.96
Others 3.99 9.59 9.72 7.35 11.78 9.08
Total 100.00 100.00 100.00 100.00 100.00 100.00
Source: PRSP Secretariat, Finance Division, Islamabad.
2.25 In Punjab, percentage share of Health Facilities & Preventive Measures in aggregate
health expenditure was nominal in both the financial years, FY2012/13 and FY 2011/12.
26
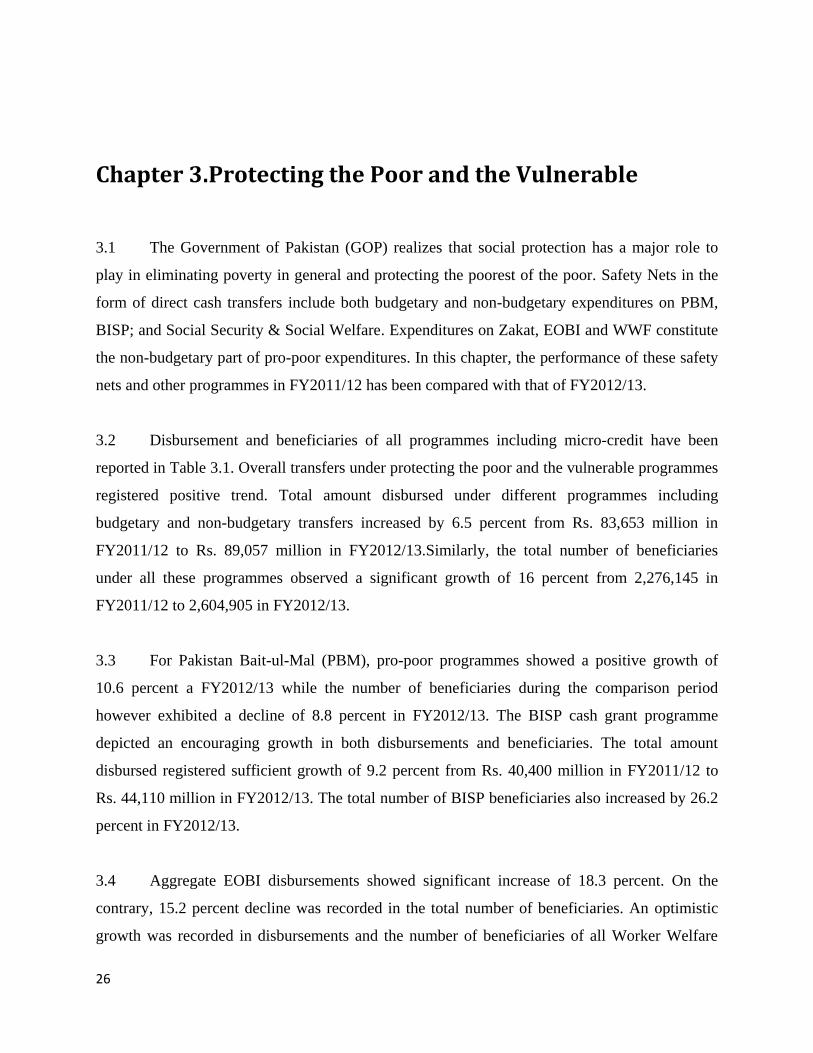
Chapter 3.Protecting the Poor and the Vulnerable
3.1 The Government of Pakistan (GOP) realizes that social protection has a major role to
play in eliminating poverty in general and protecting the poorest of the poor. Safety Nets in the
form of direct cash transfers include both budgetary and non-budgetary expenditures on PBM,
BISP; and Social Security & Social Welfare. Expenditures on Zakat, EOBI and WWF constitute
the non-budgetary part of pro-poor expenditures. In this chapter, the performance of these safety
nets and other programmes in FY2011/12 has been compared with that of FY2012/13.
3.2 Disbursement and beneficiaries of all programmes including micro-credit have been
reported in Table 3.1. Overall transfers under protecting the poor and the vulnerable programmes
registered positive trend. Total amount disbursed under different programmes including
budgetary and non-budgetary transfers increased by 6.5 percent from Rs. 83,653 million in
FY2011/12 to Rs. 89,057 million in FY2012/13.Similarly, the total number of beneficiaries
under all these programmes observed a significant growth of 16 percent from 2,276,145 in
FY2011/12 to 2,604,905 in FY2012/13.
3.3 For Pakistan Bait-ul-Mal (PBM), pro-poor programmes showed a positive growth of
10.6 percent a FY2012/13 while the number of beneficiaries during the comparison period
however exhibited a decline of 8.8 percent in FY2012/13. The BISP cash grant programme
depicted an encouraging growth in both disbursements and beneficiaries. The total amount
disbursed registered sufficient growth of 9.2 percent from Rs. 40,400 million in FY2011/12 to
Rs. 44,110 million in FY2012/13. The total number of BISP beneficiaries also increased by 26.2
percent in FY2012/13.
3.4 Aggregate EOBI disbursements showed significant increase of 18.3 percent. On the
contrary, 15.2 percent decline was recorded in the total number of beneficiaries. An optimistic
growth was recorded in disbursements and the number of beneficiaries of all Worker Welfare
27
Funds (WWF) programmes, i.e. 7 percent and 35 percent respectively during the comparison
period.
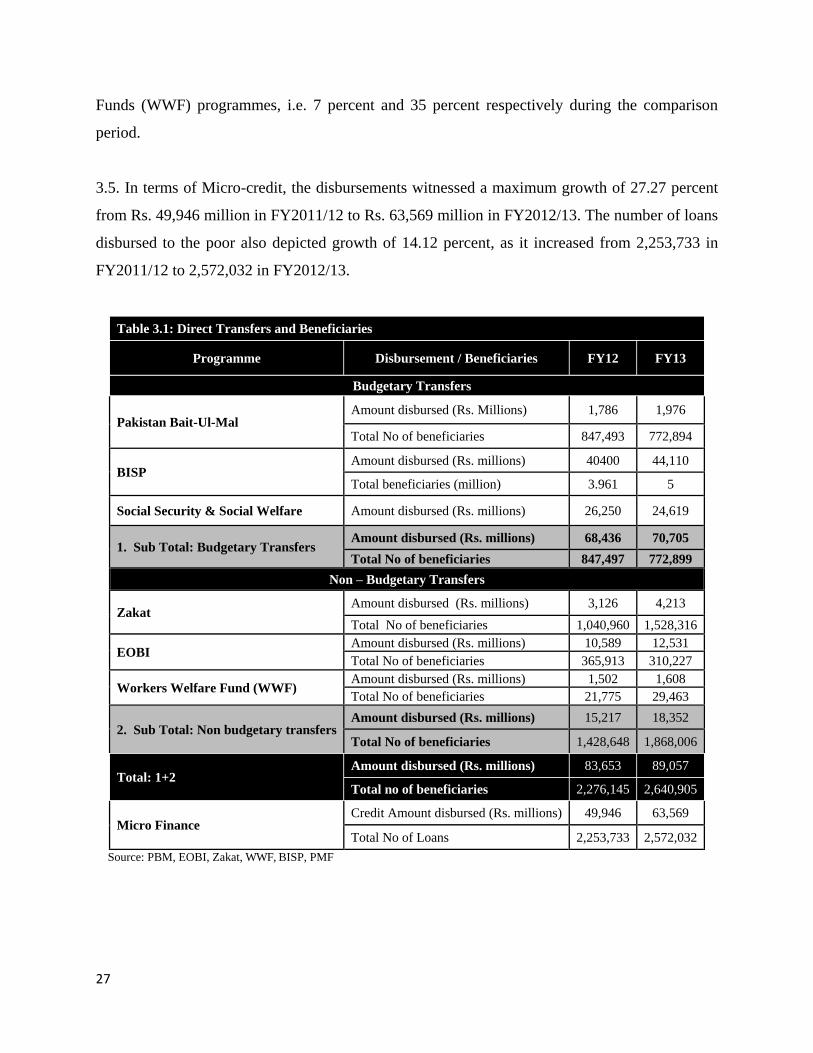
3.5. In terms of Micro-credit, the disbursements witnessed a maximum growth of 27.27 percent
from Rs. 49,946 million in FY2011/12 to Rs. 63,569 million in FY2012/13. The number of loans
disbursed to the poor also depicted growth of 14.12 percent, as it increased from 2,253,733 in
FY2011/12 to 2,572,032 in FY2012/13.
Table 3.1: Direct Transfers and Beneficiaries
Programme Disbursement / Beneficiaries FY12 FY13
Budgetary Transfers
Pakistan Bait-Ul-Mal Amount disbursed (Rs. Millions) 1,786 1,976
Total No of beneficiaries 847,493 772,894
BISP Amount disbursed (Rs. millions) 40400 44,110
Total beneficiaries (million) 3.961 5
Social Security & Social Welfare Amount disbursed (Rs. millions) 26,250 24,619
1. Sub Total: Budgetary Transfers Amount disbursed (Rs. millions) 68,436 70,705
Total No of beneficiaries 847,497 772,899
Non – Budgetary Transfers
Zakat Amount disbursed (Rs. millions) 3,126 4,213
Total No of beneficiaries 1,040,960 1,528,316
EOBI Amount disbursed (Rs. millions) 10,589 12,531
Total No of beneficiaries 365,913 310,227
Workers Welfare Fund (WWF) Amount disbursed (Rs. millions) 1,502 1,608
Total No of beneficiaries 21,775 29,463
2. Sub Total: Non budgetary transfers Amount disbursed (Rs. millions) 15,217 18,352
Total No of beneficiaries 1,428,648 1,868,006
Total: 1+2 Amount disbursed (Rs. millions) 83,653 89,057
Total no of beneficiaries 2,276,145 2,640,905
Micro Finance Credit Amount disbursed (Rs. millions) 49,946 63,569
Total No of Loans 2,253,733 2,572,032
Source: PBM, EOBI, Zakat, WWF, BISP, PMF
28
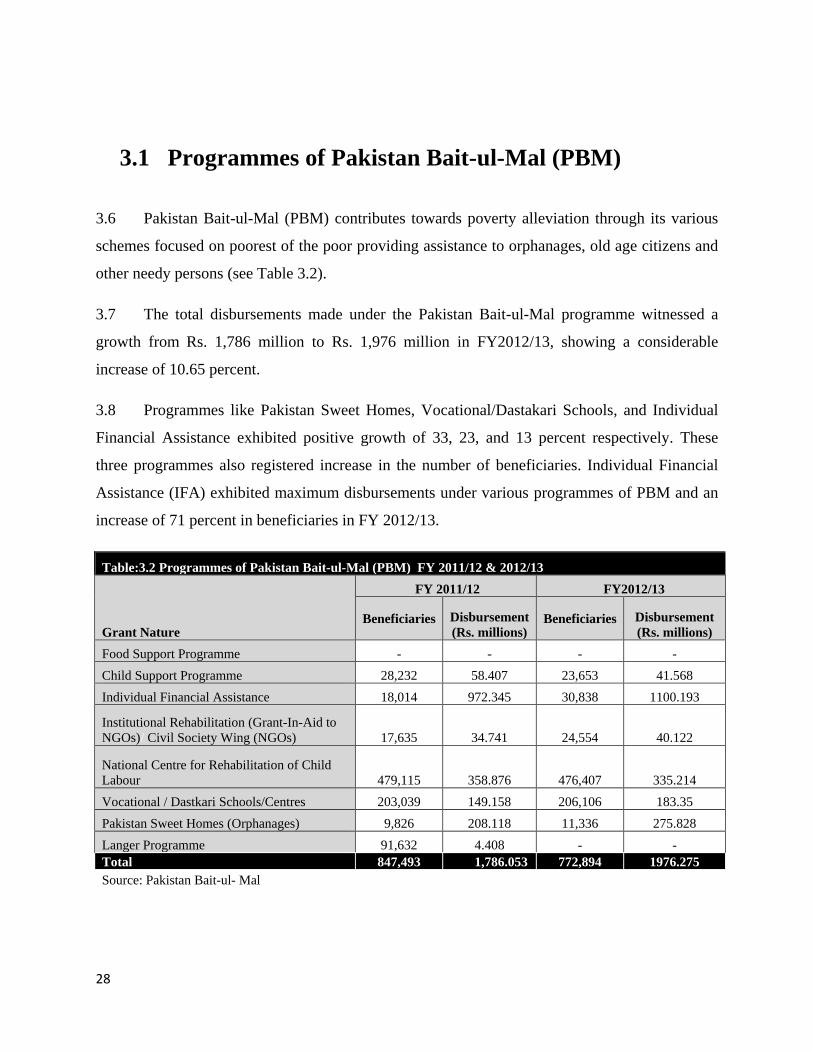
3.1 Programmes of Pakistan Bait-ul-Mal (PBM)
3.6 Pakistan Bait-ul-Mal (PBM) contributes towards poverty alleviation through its various
schemes focused on poorest of the poor providing assistance to orphanages, old age citizens and
other needy persons (see Table 3.2).
3.7 The total disbursements made under the Pakistan Bait-ul-Mal programme witnessed a
growth from Rs. 1,786 million to Rs. 1,976 million in FY2012/13, showing a considerable
increase of 10.65 percent.
3.8 Programmes like Pakistan Sweet Homes, Vocational/Dastakari Schools, and Individual
Financial Assistance exhibited positive growth of 33, 23, and 13 percent respectively. These
three programmes also registered increase in the number of beneficiaries. Individual Financial
Assistance (IFA) exhibited maximum disbursements under various programmes of PBM and an
increase of 71 percent in beneficiaries in FY 2012/13.
Table:3.2 Programmes of Pakistan Bait-ul-Mal (PBM) FY 2011/12 & 2012/13
Grant Nature
FY 2011/12 FY2012/13
Beneficiaries Disbursement
(Rs. millions) Beneficiaries Disbursement
(Rs. millions)
Food Support Programme - - - -
Child Support Programme 28,232 58.407 23,653 41.568
Individual Financial Assistance 18,014 972.345 30,838 1100.193
Institutional Rehabilitation (Grant-In-Aid to
NGOs)/ Civil Society Wing (NGOs) 17,635 34.741 24,554 40.122
National Centre for Rehabilitation of Child
Labour 479,115 358.876 476,407 335.214
Vocational / Dastkari Schools/Centres 203,039 149.158 206,106 183.35
Pakistan Sweet Homes (Orphanages) 9,826 208.118 11,336 275.828
Langer Programme 91,632 4.408 - -
Total 847,493 1,786.053 772,894 1976.275
Source: Pakistan Bait-ul- Mal
29
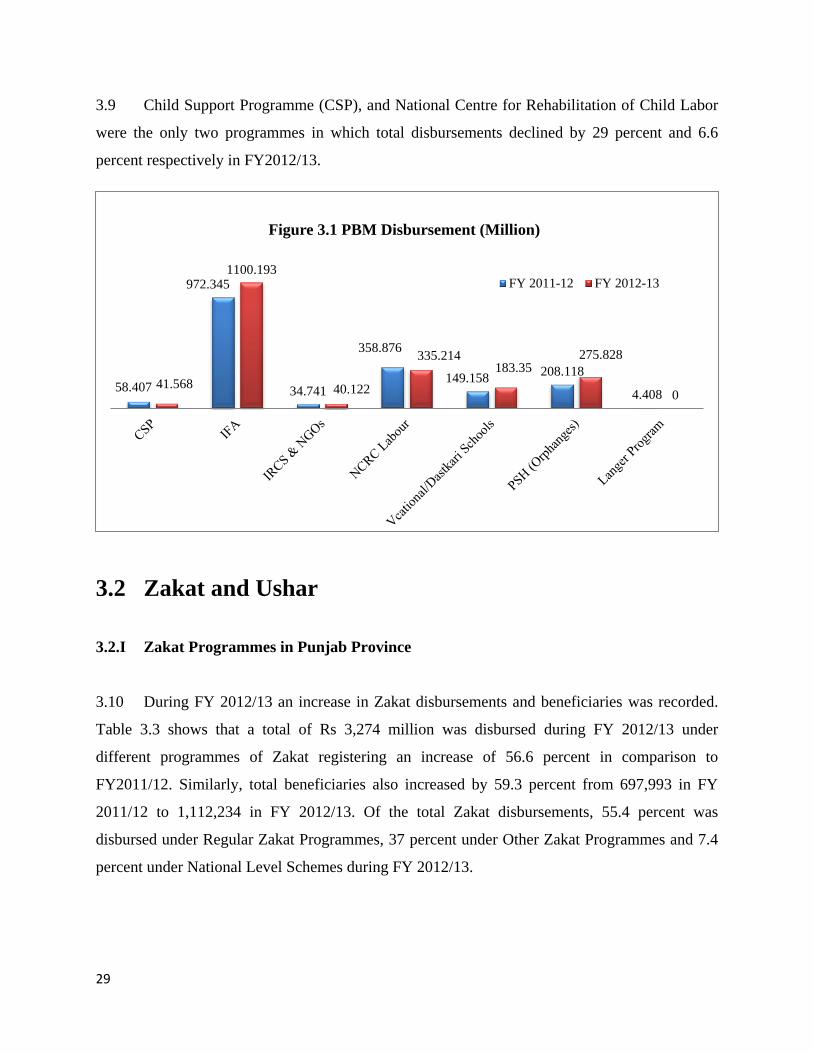
3.9 Child Support Programme (CSP), and National Centre for Rehabilitation of Child Labor
were the only two programmes in which total disbursements declined by 29 percent and 6.6
percent respectively in FY2012/13.
3.2 Zakat and Ushar
3.2.I Zakat Programmes in Punjab Province
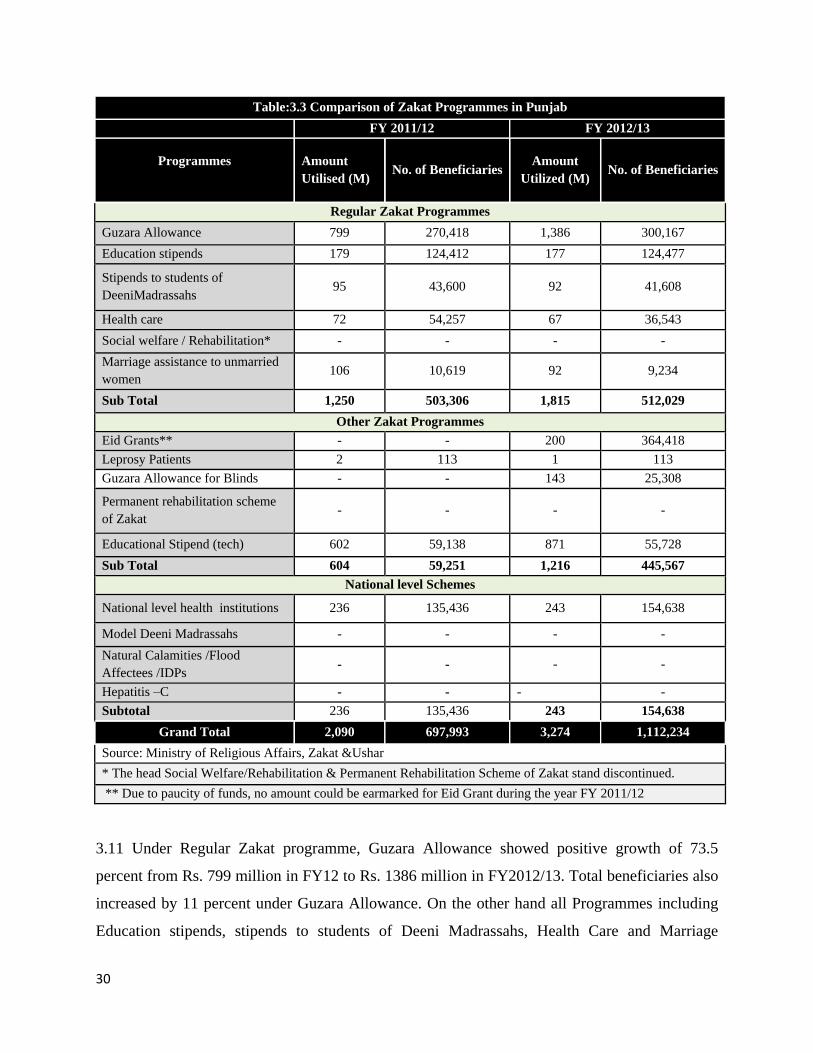
3.10 During FY 2012/13 an increase in Zakat disbursements and beneficiaries was recorded.
Table 3.3 shows that a total of Rs 3,274 million was disbursed during FY 2012/13 under
different programmes of Zakat registering an increase of 56.6 percent in comparison to
FY2011/12. Similarly, total beneficiaries also increased by 59.3 percent from 697,993 in FY
2011/12 to 1,112,234 in FY 2012/13. Of the total Zakat disbursements, 55.4 percent was
disbursed under Regular Zakat Programmes, 37 percent under Other Zakat Programmes and 7.4
percent under National Level Schemes during FY 2012/13.
58.407
972.345
34.741
358.876
149.158208.118
4.40841.568
1100.193
40.122
335.214183.35
275.828
0
Figure 3.1 PBM Disbursement (Million)
FY 2011-12 FY 2012-13
30
Table:3.3 Comparison of Zakat Programmes in Punjab
FY 2011/12 FY 2012/13
Programmes
Amount
Utilised (M) No. of Beneficiaries
Amount
Utilized (M) No. of Beneficiaries
Regular Zakat Programmes
Guzara Allowance 799 270,418 1,386 300,167
Education stipends 179 124,412 177 124,477
Stipends to students of
DeeniMadrassahs 95 43,600 92 41,608
Health care 72 54,257 67 36,543
Social welfare / Rehabilitation* - - - -
Marriage assistance to unmarried
women 106 10,619 92 9,234
Sub Total 1,250 503,306 1,815 512,029
Other Zakat Programmes
Eid Grants** - - 200 364,418
Leprosy Patients 2 113 1 113
Guzara Allowance for Blinds - - 143 25,308
Permanent rehabilitation scheme
of Zakat - - - -
Educational Stipend (tech) 602 59,138 871 55,728
Sub Total 604 59,251 1,216 445,567
National level Schemes
National level health institutions 236 135,436 243 154,638
Model Deeni Madrassahs - - - -
Natural Calamities /Flood
Affectees /IDPs - - - -
Hepatitis –C - - - -
Subtotal 236 135,436 243 154,638
Grand Total 2,090 697,993 3,274 1,112,234
Source: Ministry of Religious Affairs, Zakat &Ushar
* The head Social Welfare/Rehabilitation & Permanent Rehabilitation Scheme of Zakat stand discontinued.
** Due to paucity of funds, no amount could be earmarked for Eid Grant during the year FY 2011/12
3.11 Under Regular Zakat programme, Guzara Allowance showed positive growth of 73.5
percent from Rs. 799 million in FY12 to Rs. 1386 million in FY2012/13. Total beneficiaries also
increased by 11 percent under Guzara Allowance. On the other hand all Programmes including
Education stipends, stipends to students of Deeni Madrassahs, Health Care and Marriage
31
Assistance to unmarried women reflected decrease in disbursements and number of beneficiaries
in comparison to previous year.
3.12 Under the category of Other Zakat Programmes, Rs.200 million was disbursed among
364,418 beneficiaries in FY2012/13. Regarding Education Stipend, Zakat disbursements showed
an upward trend of 44.6 percent. Under National Level Schemes, Rs. 243 million was disbursed
among 154,638 beneficiaries depicting upward trend.
3.2. II Zakat Programmes in Sindh Province
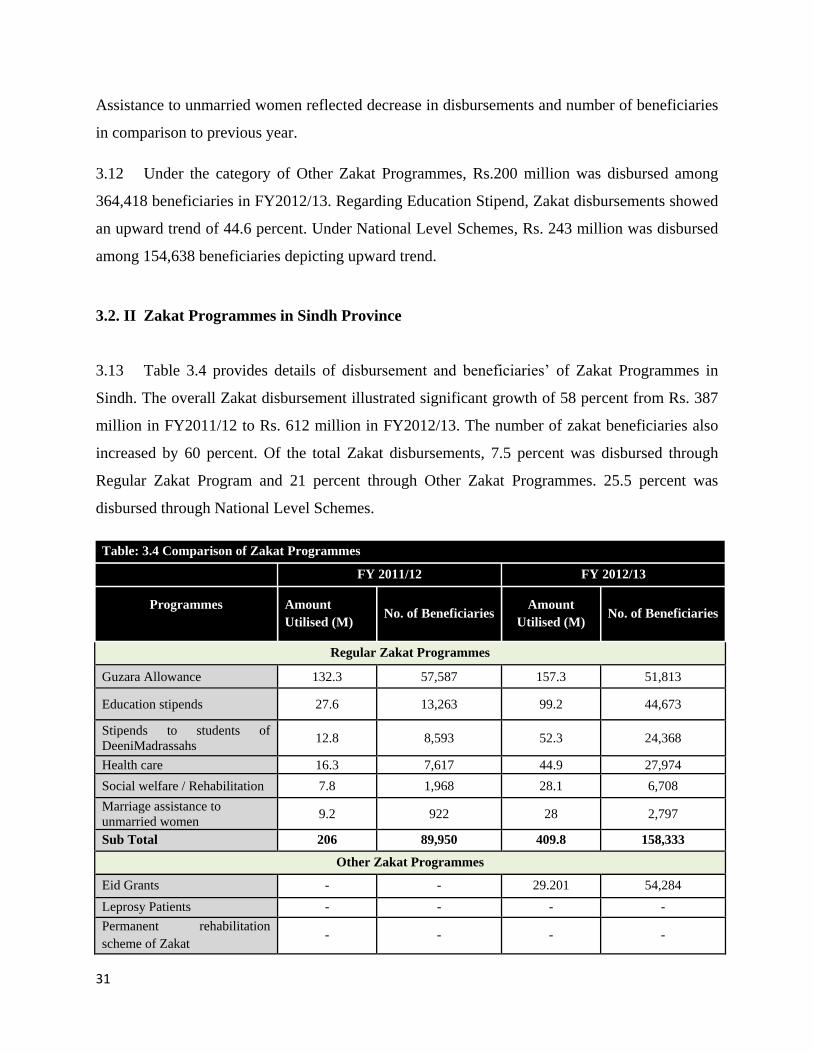
3.13 Table 3.4 provides details of disbursement and beneficiaries’ of Zakat Programmes in
Sindh. The overall Zakat disbursement illustrated significant growth of 58 percent from Rs. 387
million in FY2011/12 to Rs. 612 million in FY2012/13. The number of zakat beneficiaries also
increased by 60 percent. Of the total Zakat disbursements, 7.5 percent was disbursed through
Regular Zakat Program and 21 percent through Other Zakat Programmes. 25.5 percent was
disbursed through National Level Schemes.
Table: 3.4 Comparison of Zakat Programmes
FY 2011/12 FY 2012/13
Programmes
Amount
Utilised (M) No. of Beneficiaries
Amount
Utilised (M) No. of Beneficiaries
Regular Zakat Programmes
Guzara Allowance 132.3 57,587 157.3 51,813
Education stipends 27.6 13,263 99.2 44,673
Stipends to students of
DeeniMadrassahs 12.8 8,593 52.3 24,368
Health care 16.3 7,617 44.9 27,974
Social welfare / Rehabilitation 7.8 1,968 28.1 6,708
Marriage assistance to
unmarried women 9.2 922 28 2,797
Sub Total 206 89,950 409.8 158,333
Other Zakat Programmes
Eid Grants - - 29.201 54,284
Leprosy Patients - - - -
Permanent rehabilitation
scheme of Zakat - - - -
32
Educational Stipend (tech) 38.5 4,106 17.2 1,508
Sub Total 38.5 4,106 46.4 55,792
National level Schemes
National level health
institutions 108 64,968 150 50,170
Model Deeni Madrassahs - - - -
Natural Calamities/Flood
Affectees/IDPs 35 6,778 6 1,189
Hepatitis –C - - - -
Subtotal 143 71,746 156 51,359
Grand Total 387 165,802 612 265,484
Source: Provincial Zakat & Ushar Departments
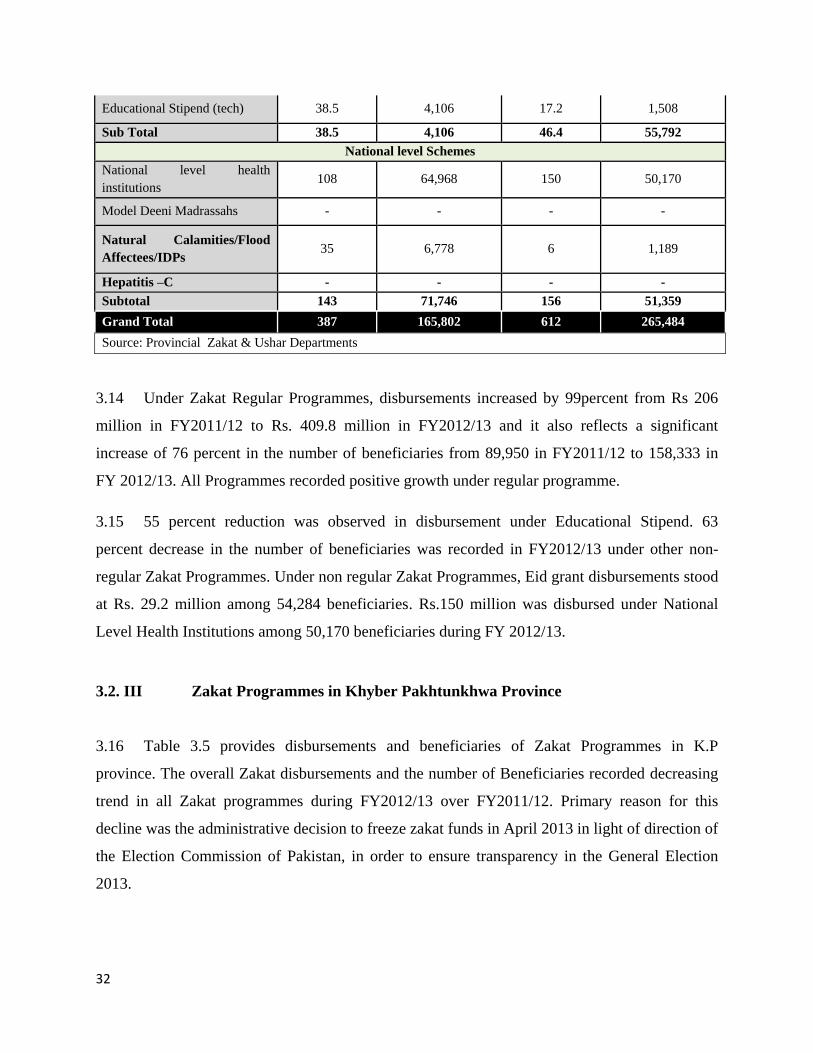
3.14 Under Zakat Regular Programmes, disbursements increased by 99percent from Rs 206
million in FY2011/12 to Rs. 409.8 million in FY2012/13 and it also reflects a significant
increase of 76 percent in the number of beneficiaries from 89,950 in FY2011/12 to 158,333 in
FY 2012/13. All Programmes recorded positive growth under regular programme.
3.15 55 percent reduction was observed in disbursement under Educational Stipend. 63
percent decrease in the number of beneficiaries was recorded in FY2012/13 under other non-
regular Zakat Programmes. Under non regular Zakat Programmes, Eid grant disbursements stood
at Rs. 29.2 million among 54,284 beneficiaries. Rs.150 million was disbursed under National
Level Health Institutions among 50,170 beneficiaries during FY 2012/13.
3.2. III Zakat Programmes in Khyber Pakhtunkhwa Province
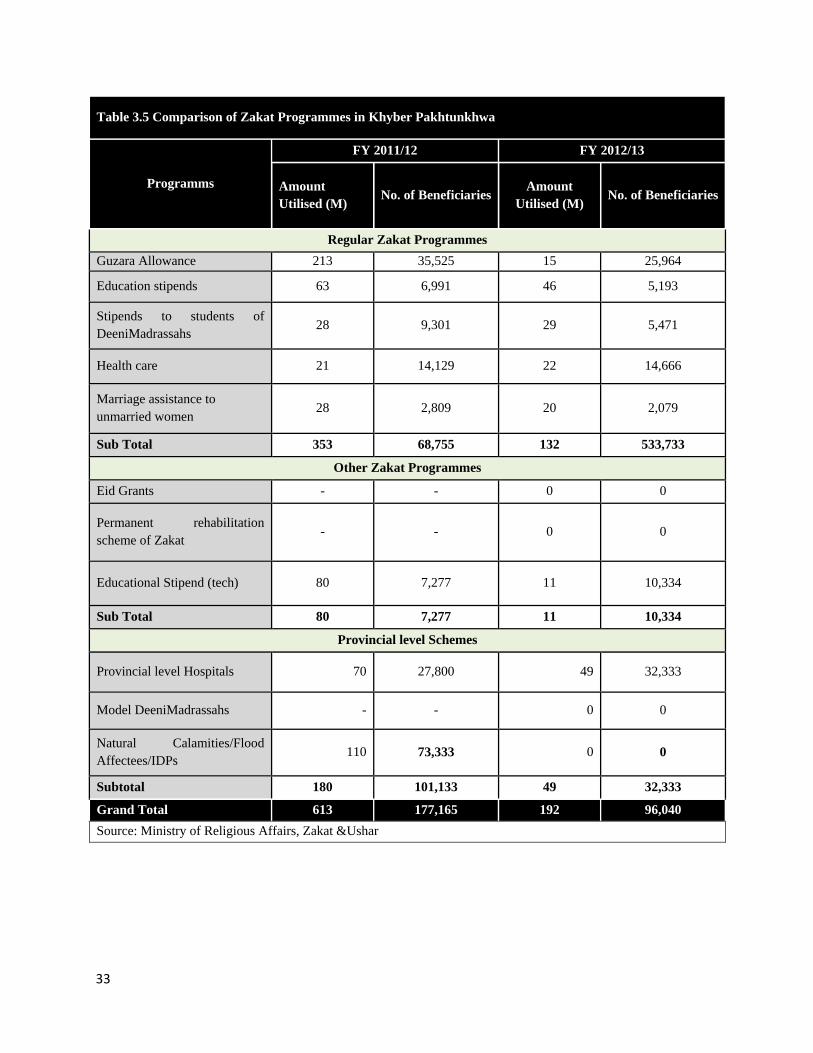
3.16 Table 3.5 provides disbursements and beneficiaries of Zakat Programmes in K.P
province. The overall Zakat disbursements and the number of Beneficiaries recorded decreasing
trend in all Zakat programmes during FY2012/13 over FY2011/12. Primary reason for this
decline was the administrative decision to freeze zakat funds in April 2013 in light of direction of
the Election Commission of Pakistan, in order to ensure transparency in the General Election
2013.
33
Table 3.5 Comparison of Zakat Programmes in Khyber Pakhtunkhwa
Programms
FY 2011/12 FY 2012/13
Amount
Utilised (M) No. of Beneficiaries
Amount
Utilised (M) No. of Beneficiaries
Regular Zakat Programmes
Guzara Allowance 213 35,525 15 25,964
Education stipends 63 6,991 46 5,193
Stipends to students of
DeeniMadrassahs 28 9,301 29 5,471
Health care 21 14,129 22 14,666
Marriage assistance to
unmarried women 28 2,809 20 2,079
Sub Total 353 68,755 132 533,733
Other Zakat Programmes
Eid Grants - - 0 0
Permanent rehabilitation
scheme of Zakat - - 0 0
Educational Stipend (tech) 80 7,277 11 10,334
Sub Total 80 7,277 11 10,334
Provincial level Schemes
Provincial level Hospitals 70 27,800 49 32,333
Model DeeniMadrassahs - - 0 0
Natural Calamities/Flood
Affectees/IDPs 110 73,333 0 0
Subtotal 180 101,133 49 32,333
Grand Total 613 177,165 192 96,040
Source: Ministry of Religious Affairs, Zakat &Ushar
34
3.2. IV. Zakat Programmes in Balochistan Province
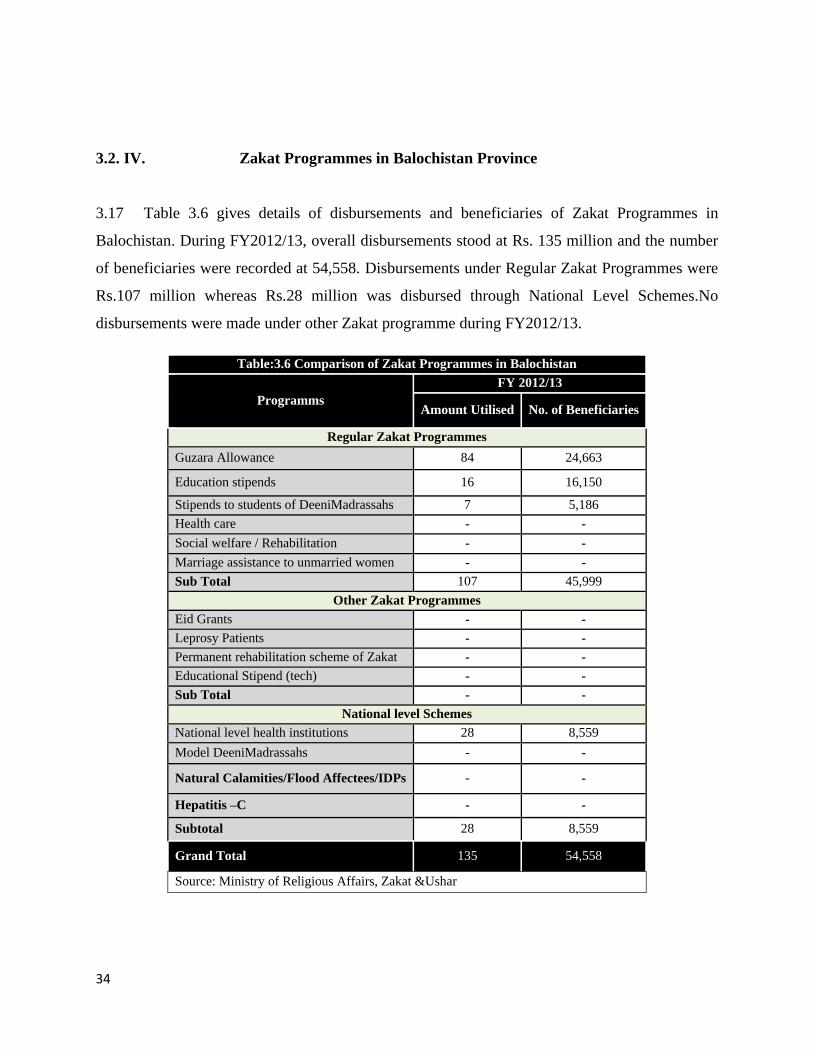
3.17 Table 3.6 gives details of disbursements and beneficiaries of Zakat Programmes in
Balochistan. During FY2012/13, overall disbursements stood at Rs. 135 million and the number
of beneficiaries were recorded at 54,558. Disbursements under Regular Zakat Programmes were
Rs.107 million whereas Rs.28 million was disbursed through National Level Schemes.No
disbursements were made under other Zakat programme during FY2012/13.
Table:3.6 Comparison of Zakat Programmes in Balochistan
Programms
FY 2012/13
Amount Utilised No. of Beneficiaries
Regular Zakat Programmes
Guzara Allowance 84 24,663
Education stipends 16 16,150
Stipends to students of DeeniMadrassahs 7 5,186
Health care - -
Social welfare / Rehabilitation - -
Marriage assistance to unmarried women - -
Sub Total 107 45,999
Other Zakat Programmes
Eid Grants - -
Leprosy Patients - -
Permanent rehabilitation scheme of Zakat - -
Educational Stipend (tech) - -
Sub Total - -
National level Schemes
National level health institutions 28 8,559
Model DeeniMadrassahs - -
Natural Calamities/Flood Affectees/IDPs - -
Hepatitis –C - -
Subtotal 28 8,559
Grand Total 135 54,558
Source: Ministry of Religious Affairs, Zakat &Ushar
35
3.18 Under Regular Zakat Programmes, disbursements stood at Rs.107 million and the
number of beneficiaries were recorded at 45,999 during the review period. Under Guzara
Allowance, an amount of Rs.84 million was disbursed to 24,663 beneficiaries while education
stipends stood at Rs.16 million among 16,150 beneficiaries. An amount of Rs. 28 million was
disbursed under National Level Schemes among 8,559 beneficiaries.
3.5 Employees’ Old Age Benefit Institution (EOBI)
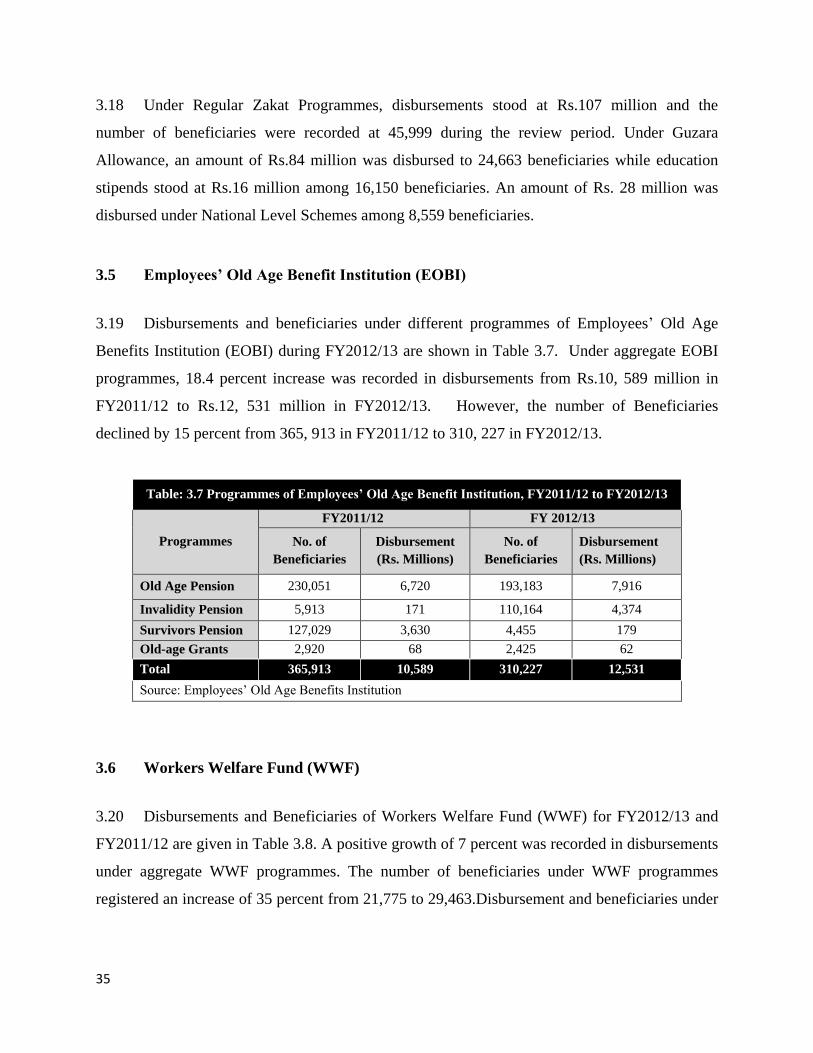
3.19 Disbursements and beneficiaries under different programmes of Employees’ Old Age
Benefits Institution (EOBI) during FY2012/13 are shown in Table 3.7. Under aggregate EOBI
programmes, 18.4 percent increase was recorded in disbursements from Rs.10, 589 million in
FY2011/12 to Rs.12, 531 million in FY2012/13. However, the number of Beneficiaries
declined by 15 percent from 365, 913 in FY2011/12 to 310, 227 in FY2012/13.
Table: 3.7 Programmes of Employees’ Old Age Benefit Institution, FY2011/12 to FY2012/13
Programmes
FY2011/12 FY 2012/13
No. of
Beneficiaries
Disbursement
(Rs. Millions)
No. of
Beneficiaries
Disbursement
(Rs. Millions)
Old Age Pension 230,051 6,720 193,183 7,916
Invalidity Pension 5,913 171 110,164 4,374
Survivors Pension 127,029 3,630 4,455 179
Old-age Grants 2,920 68 2,425 62
Total 365,913 10,589 310,227 12,531
Source: Employees’ Old Age Benefits Institution
3.6 Workers Welfare Fund (WWF)
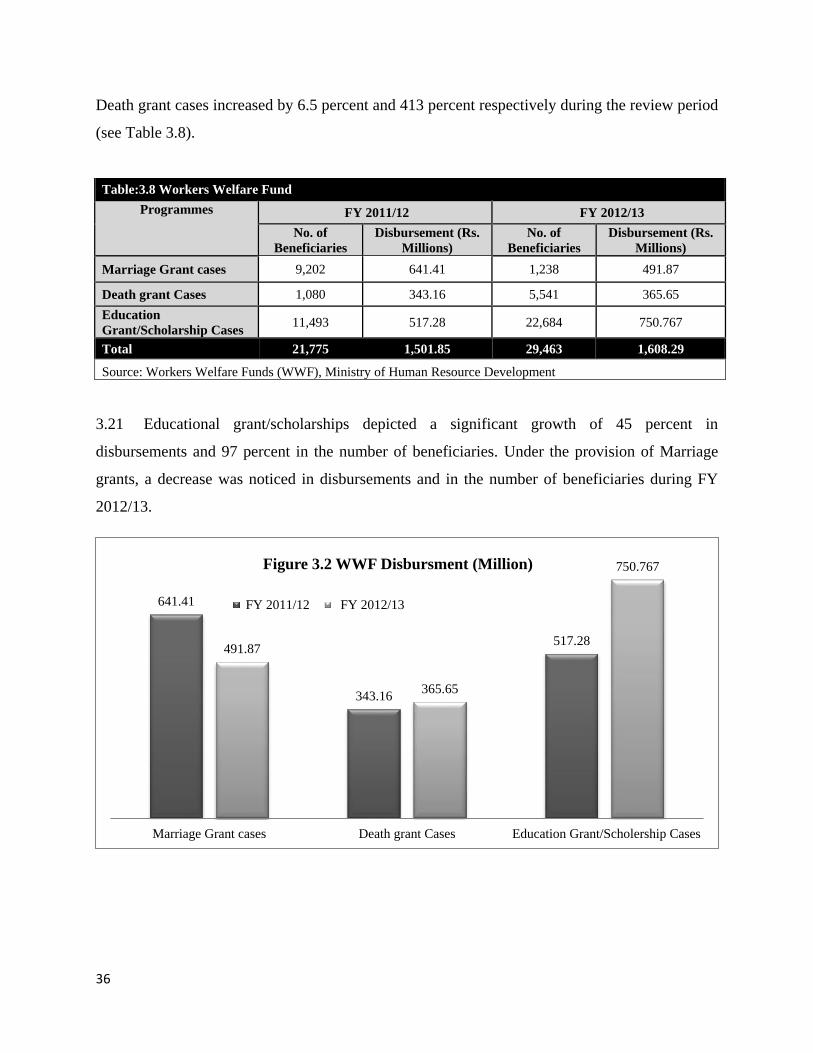
3.20 Disbursements and Beneficiaries of Workers Welfare Fund (WWF) for FY2012/13 and
FY2011/12 are given in Table 3.8. A positive growth of 7 percent was recorded in disbursements
under aggregate WWF programmes. The number of beneficiaries under WWF programmes
registered an increase of 35 percent from 21,775 to 29,463.Disbursement and beneficiaries under
36
Death grant cases increased by 6.5 percent and 413 percent respectively during the review period
(see Table 3.8).
Table:3.8 Workers Welfare Fund
Programmes
FY 2011/12 FY 2012/13
No. of
Beneficiaries
Disbursement (Rs.
Millions)
No. of
Beneficiaries
Disbursement (Rs.
Millions)
Marriage Grant cases 9,202 641.41 1,238 491.87
Death grant Cases 1,080 343.16 5,541 365.65
Education
Grant/Scholarship Cases 11,493 517.28 22,684 750.767
Total 21,775 1,501.85 29,463 1,608.29
Source: Workers Welfare Funds (WWF), Ministry of Human Resource Development
3.21 Educational grant/scholarships depicted a significant growth of 45 percent in
disbursements and 97 percent in the number of beneficiaries. Under the provision of Marriage
grants, a decrease was noticed in disbursements and in the number of beneficiaries during FY
2012/13.
641.41
343.16
517.28491.87
365.65
750.767
Marriage Grant cases Death grant Cases Education Grant/Scholership Cases
Figure 3.2 WWF Disbursment (Million)
FY 2011/12 FY 2012/13
37
3.7 Microfinance
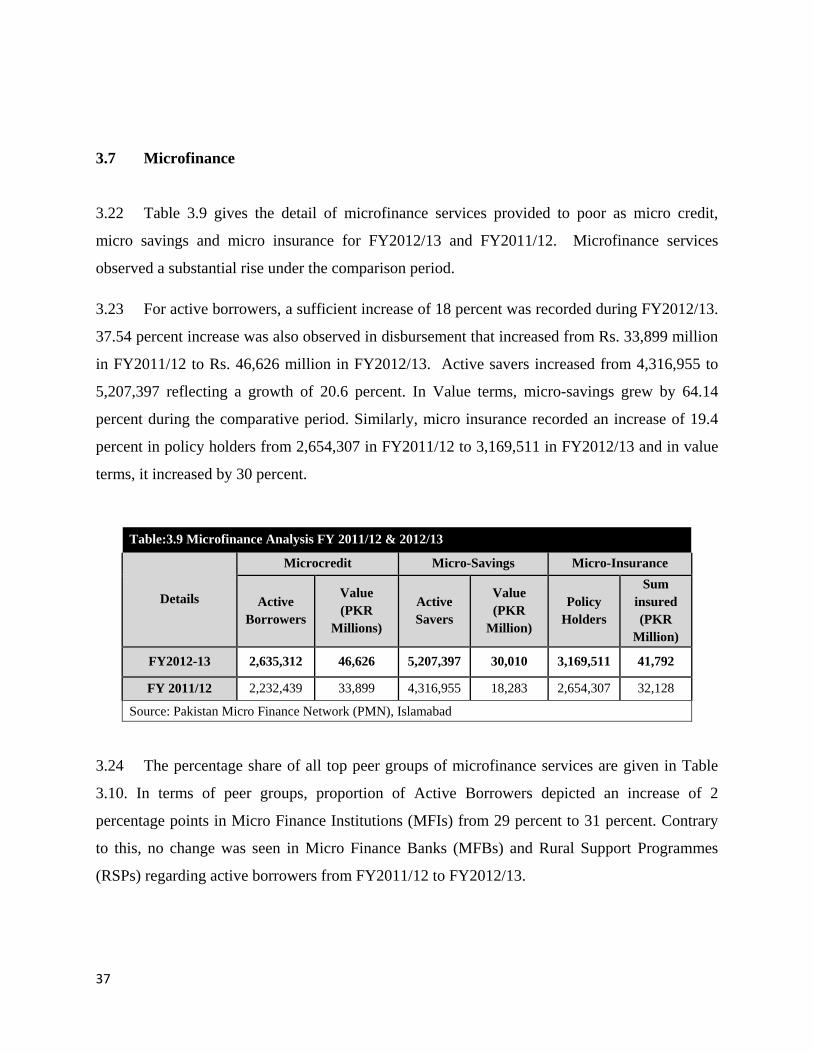
3.22 Table 3.9 gives the detail of microfinance services provided to poor as micro credit,
micro savings and micro insurance for FY2012/13 and FY2011/12. Microfinance services
observed a substantial rise under the comparison period.
3.23 For active borrowers, a sufficient increase of 18 percent was recorded during FY2012/13.
37.54 percent increase was also observed in disbursement that increased from Rs. 33,899 million
in FY2011/12 to Rs. 46,626 million in FY2012/13. Active savers increased from 4,316,955 to
5,207,397 reflecting a growth of 20.6 percent. In Value terms, micro-savings grew by 64.14
percent during the comparative period. Similarly, micro insurance recorded an increase of 19.4
percent in policy holders from 2,654,307 in FY2011/12 to 3,169,511 in FY2012/13 and in value
terms, it increased by 30 percent.
Table:3.9 Microfinance Analysis FY 2011/12 & 2012/13
Details
Microcredit Micro-Savings Micro-Insurance
Active
Borrowers
Value
(PKR
Millions)
Active
Savers
Value
(PKR
Million)
Policy
Holders
Sum
insured
(PKR
Million)
FY2012-13 2,635,312 46,626 5,207,397 30,010 3,169,511 41,792
FY 2011/12 2,232,439 33,899 4,316,955 18,283 2,654,307 32,128
Source: Pakistan Micro Finance Network (PMN), Islamabad
3.24 The percentage share of all top peer groups of microfinance services are given in Table
3.10. In terms of peer groups, proportion of Active Borrowers depicted an increase of 2
percentage points in Micro Finance Institutions (MFIs) from 29 percent to 31 percent. Contrary
to this, no change was seen in Micro Finance Banks (MFBs) and Rural Support Programmes
(RSPs) regarding active borrowers from FY2011/12 to FY2012/13.

38
Table 3.10 Active Borrowers, Active Savers and Active Policy Holders
by Peer Group FY 2011/12 to FY 2012/13
Details Percentage of Peer Groups
MFBs MFIs RSPs Others
Active Borrowers FY 2011/12 40% 29% 24% 7%
Active Borrowers FY 2012/13 40% 31% 24% 5%
Active Savers FY 2011/12 36% 1% 61% 2%
Active Savers FY 2012/13 43% 0% 57% 0%
Active Policy holders FY 2011/12 27% 28% 39% 6%
Active Policy holders FY 2012/13 27% 27% 42% 4%
Source: Pakistan Micro Finance Network (PMN), Islamabad
3.25 Under the saving program, Active Savers category, MFB’s continued to increase by 7
percentage points from 36 percent to 43 percent while in rest of the peer groups, active savers
declined by 1 and 2 percentage points in MFI’s and others respectively. RSPs witnessed a
decline of 4 percentage points from 57 percent to 61 percent in active savers during the period
under review.
3.26 In terms of Active Policy holders, RSPs observed an increase of 3 percentage points from
39 percent to 42 percent. On the other hand, a negative trend was observed in MFIs and others
while MFBs noticed the same percentage of 27 during the period under review.
3.7. I Active Borrowers, Active Savers and Active Policy Holders
3.27 Summary of microcredit indicators in Table 3.11 covers data for FY2012/13 and FY
2011/12. The micro finance services showed progress in areas of almost all micro finance
indicators. The industry expanded its outreach with a positive growth in terms of more branches,
higher gross loan portfolio, and higher average loan balance, higher number of loans, higher
overall credit disbursements and higher average loan size.
3.28 The number of branches registered growth in case of MFIs, MFBs and RSPs except
‘others’ (small micro credit providers). Credit disbursement and number of loans disbursed
revealed decline in all peer groups. In rest of the programmes increasing trend for all peer groups
39
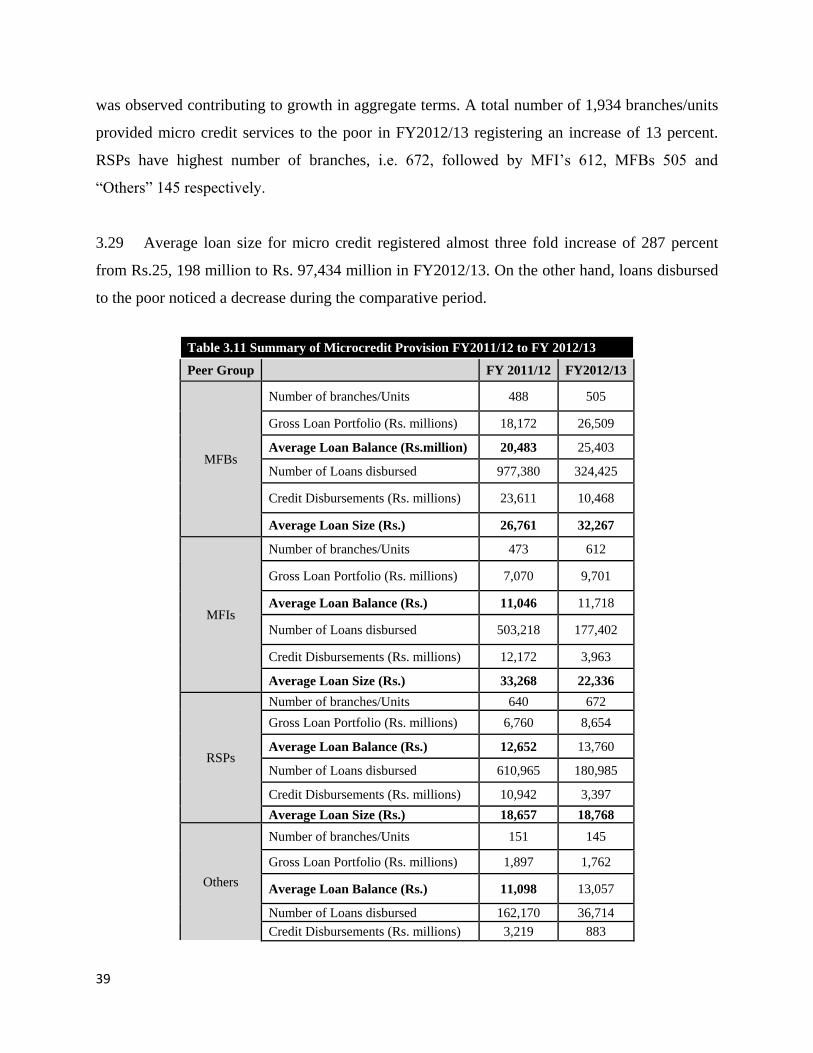
was observed contributing to growth in aggregate terms. A total number of 1,934 branches/units
provided micro credit services to the poor in FY2012/13 registering an increase of 13 percent.
RSPs have highest number of branches, i.e. 672, followed by MFI’s 612, MFBs 505 and
“Others” 145 respectively.
3.29 Average loan size for micro credit registered almost three fold increase of 287 percent
from Rs.25, 198 million to Rs. 97,434 million in FY2012/13. On the other hand, loans disbursed
to the poor noticed a decrease during the comparative period.
Table 3.11 Summary of Microcredit Provision FY2011/12 to FY 2012/13
Peer Group FY 2011/12 FY2012/13
MFBs
Number of branches/Units 488 505
Gross Loan Portfolio (Rs. millions) 18,172 26,509
Average Loan Balance (Rs.million) 20,483 25,403
Number of Loans disbursed 977,380 324,425
Credit Disbursements (Rs. millions) 23,611 10,468
Average Loan Size (Rs.) 26,761 32,267
MFIs
Number of branches/Units 473 612
Gross Loan Portfolio (Rs. millions) 7,070 9,701
Average Loan Balance (Rs.) 11,046 11,718
Number of Loans disbursed 503,218 177,402
Credit Disbursements (Rs. millions) 12,172 3,963
Average Loan Size (Rs.) 33,268 22,336
RSPs
Number of branches/Units 640 672
Gross Loan Portfolio (Rs. millions) 6,760 8,654
Average Loan Balance (Rs.) 12,652 13,760
Number of Loans disbursed 610,965 180,985
Credit Disbursements (Rs. millions) 10,942 3,397
Average Loan Size (Rs.) 18,657 18,768
Others
Number of branches/Units 151 145
Gross Loan Portfolio (Rs. millions) 1,897 1,762
Average Loan Balance (Rs.) 11,098 13,057
Number of Loans disbursed 162,170 36,714
Credit Disbursements (Rs. millions) 3,219 883
40
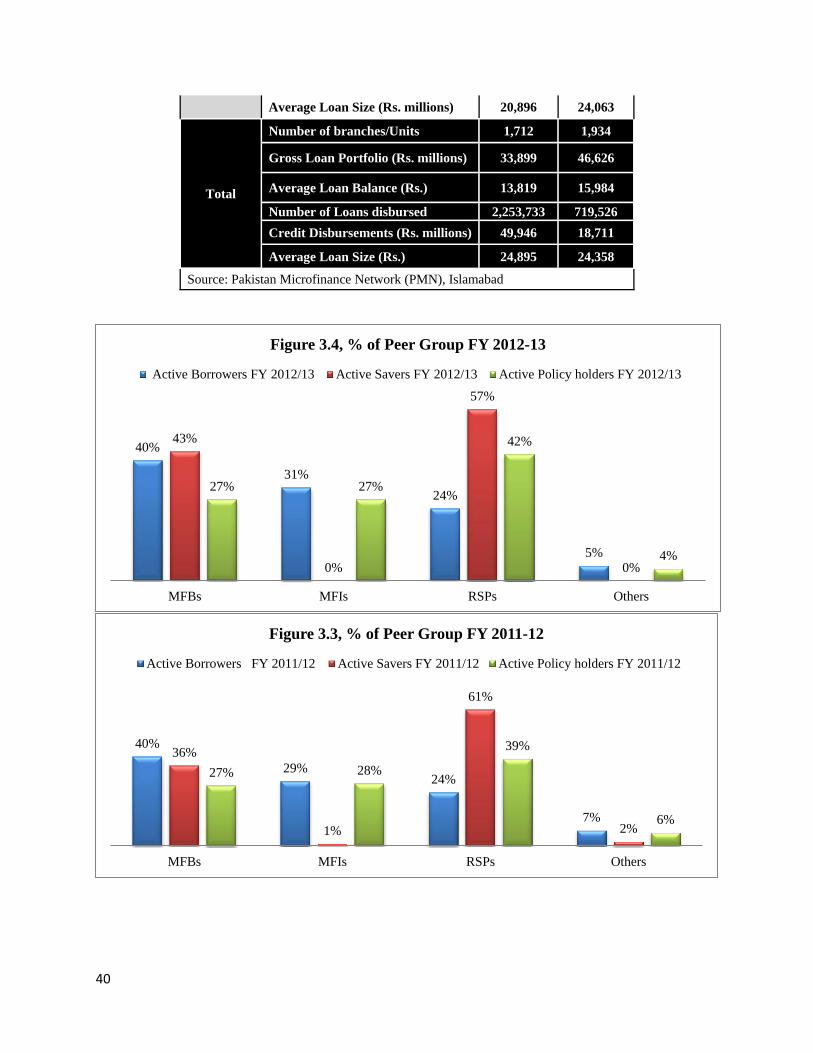
Average Loan Size (Rs. millions) 20,896 24,063
Total
Number of branches/Units 1,712 1,934
Gross Loan Portfolio (Rs. millions) 33,899 46,626
Average Loan Balance (Rs.) 13,819 15,984
Number of Loans disbursed 2,253,733 719,526
Credit Disbursements (Rs. millions) 49,946 18,711
Average Loan Size (Rs.) 24,895 24,358
Source: Pakistan Microfinance Network (PMN), Islamabad
40%
31%
24%
5%
43%
0%
57%
0%
27% 27%
42%
4%
MFBs MFIs RSPs Others
Figure 3.4, % of Peer Group FY 2012-13
Active Borrowers FY 2012/13 Active Savers FY 2012/13 Active Policy holders FY 2012/13
40%
29%24%
7%
36%
1%
61%
2%
27% 28%
39%
6%
MFBs MFIs RSPs Others
Figure 3.3, % of Peer Group FY 2011-12
Active Borrowers FY 2011/12 Active Savers FY 2011/12 Active Policy holders FY 2011/12
41
3.30 Gross Loan Portfolio (GLP) has also recorded a positive growth in FY2012/13 by 37.54
percent from Rs. 33, 899 million to 46,626 million. MFBs, MFIs and RSPs are the peer groups
which witnessed an increase of 45.8 percent, 37.2 percent and 28 percent respectively. Small size
service providers “others” recorded a negative growth of. 7.1 percent during the comparative
period.
3.8 Benazir Income Support Programme (BISP)
3.31 The Government of Pakistan initiated the Benazir Income Support Program (BISP) in
2008. The purpose of this program is to provide income support to the poor in short term with a
long-term objective of establishing national safety net platform that protects the poor and
vulnerable groups. The identification of beneficiaries was done through Proxy Means Test based
targeting instruments. The Poverty Score Card (PSC) has been rolled out through a door to door
national census. It is being implemented across Pakistan. BISP has introduced a number of
technological innovations in social assistance payment system by using smart cards and mobile
banking. The cash amount is being disbursed through three major modes of payment which
include post offices, smart cards and mobile banking.
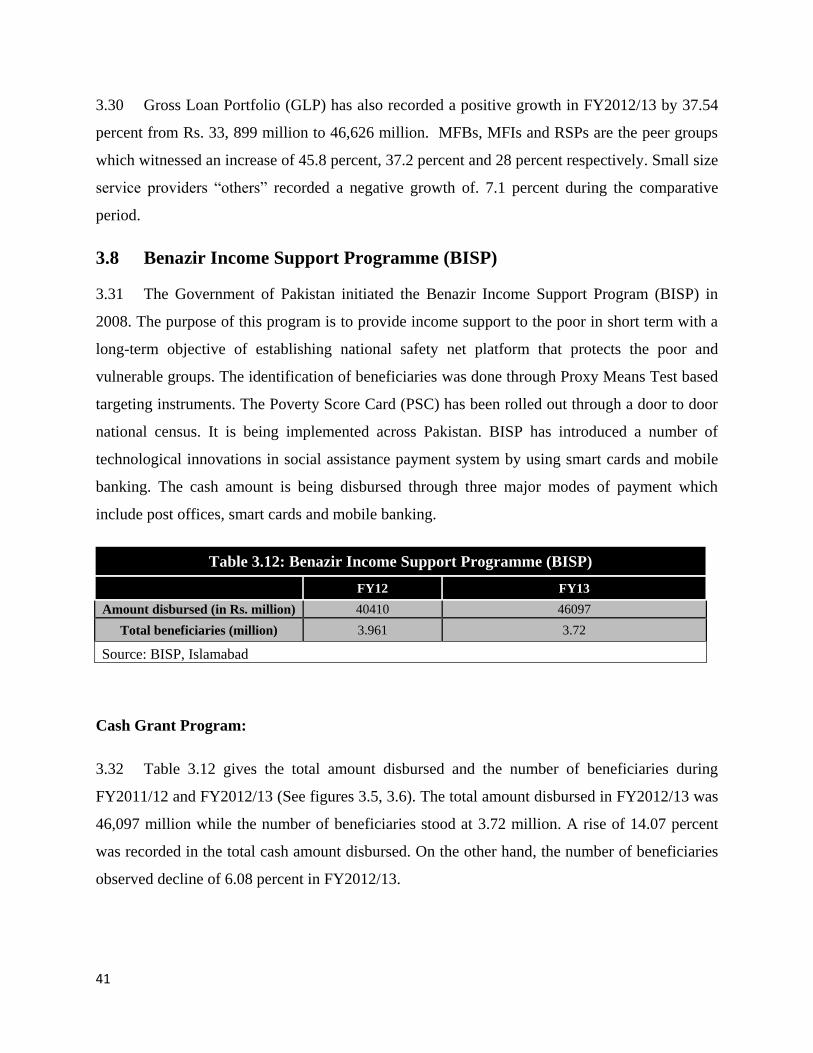
Table 3.12: Benazir Income Support Programme (BISP)
FY12 FY13
Amount disbursed (in Rs. million) 40410 46097
Total beneficiaries (million) 3.961 3.72
Source: BISP, Islamabad
Cash Grant Program:
3.32 Table 3.12 gives the total amount disbursed and the number of beneficiaries during
FY2011/12 and FY2012/13 (See figures 3.5, 3.6). The total amount disbursed in FY2012/13 was
46,097 million while the number of beneficiaries stood at 3.72 million. A rise of 14.07 percent
was recorded in the total cash amount disbursed. On the other hand, the number of beneficiaries
observed decline of 6.08 percent in FY2012/13.
42
3.33 BISP has also initiated three graduation programmes i.e. Waseela-e-Haq (microfinance
for entrepreneurship development), Waseela-e-Rozgar (vocational training for improved
livelihoods) and Waseela-e-Sehat (Life, accident and health insurance). The description of each
program is given below:
3.8. II Waseela-e-Haq
3.34 This is a self-employment initiative under BISP. Beneficiaries of this programme are
selected through a monthly computerized random draw and are provided handsome financial
support for setting up small businesses. This component of BISP was launched in October 2009.
41 draws have been held and a total of 24,656 beneficiaries have been declared as eligible. As of
June, 2013, an amount of Rs. 2.61 billion was disbursed to 16,120 beneficiaries who have started
their own businesses.
3.8. III Waseela-e-Taleem
3.35 This initiative was launched in October 2012. Children of beneficiary families aged 5-12
years are supported for primary education with cash transfer of Rs. 200 per child (up-to a
maximum of three children) subject to compliance with the required school attendance. Waseela-
e-Taleem has a target of 3 million children in four years. So far more than 74,065 children have
been enrolled in primary education.
3.8. IV Waseela-e-Sehat:
3.36 It is designed to improve access to health services and reduce income loss of the already
marginalized due to health related expenditure. Under the Waseela-e- sehat programme, Rs.225
million was disbursed among 4,168,350 beneficiaries including both initiatives; group life
insurance and health insurance.
1. Life insurance:
Life insurance cover of Rs. 100,000 for the breadwinners of recipient families was
launched from January 1, 2011.
43
As of June 30, 2013, over 4.07 million beneficiary families now have their bread earners
covered for three years under the life insurance scheme in collaboration with State Life
Insurance Corporation of Pakistan (SLIC).
Over 10,484 deaths were reported. Claims have been paid to 5,441 claimants in
FY2012/13.
2. Health Insurance
Full hospitalization, pregnancy care, diagnostic tests, and accident compensation for
earning members of the family. (A maximum limit of Rs. 25,000/- per family per year).
Benazir Health Cards are issued to the enrolled families (Premium Rs 1,800/family/year)
A pilot phase was launched at Faisalabad in April, 2012 in collaboration with SLIC. It
covers a population of 0.35 million and at the close of the report period, cards have been
issued to 58,688 families. A total of 6,683 cases were reported of which 1,408 are
admitted cases, 807 medical cases and 602 surgeries.
3.8. V Waseela-e Rozgar:
Under Waseela-e- Rozgar, demand driven, free of cost, technical & vocational training is
offered to one individual per beneficiary family. BISP signed MOUs with 69 training/service
organizations in both public and private sectors and Certificate courses of 4-6 months
duration skill trainings are offered in 52 trades. 3,495 individuals have been trained while
49,611are currently enrolled. An amount of Rs. 1703 million was disbursed among 61340
beneficiaries during FY 2012/13.
44
Chapter 4. Monitoring the PRSP Intermediate
(Output) Indicators
PRSP Intermediate Output Indicators include education, health, environment, energy
development, employment, and People Work’s Programme. Various variables have been
identified against these areas to assess the performance in social sector. During FY2012/13,
indicators under health and education registered improvement.
4.1 Education Sector
4.1 Education sector intermediate output indicators include information about public schools,
percentage of teachers trained and an update on basic facilitates in these schools. Progress of
these indicators during FY2012/13 and FY2011/12 is discussed below:
4.1. I Functional Schools
4.2 Number of functional primary and middle schools including mosque schools in
Pakistan are reported in Table 4.1. A total of 133,569 schools were functional in FY2012/13
against 140,184 in FY2011/12 registering a decrease of 5 percent (See Figure 4.1). A decline of
5.9 percent was observed in the number of primary functional schools. On the contrary, middle
functional school figures depicted a modest increase of 1 percent from 15,432 in FY2011/12 to
15,588 in FY2012/13. Merger of more than one primary school into another primary school or
up gradation to middle school explains the trend.
4.3 The province wise analysis has been reported in Table 4.1. Punjab, the most populous
province, reported the largest number of functional schools i.e. 47,043 in FY2012/13 followed
by 39,638 in Sindh, 25,650 in KP, 10,798 in Balochistan, 5,080 in AJK, 4,127 in FATA, 982 in
GB, and 251 in Federal area. It is encouraging to see the increase in KP and Federal area. On the
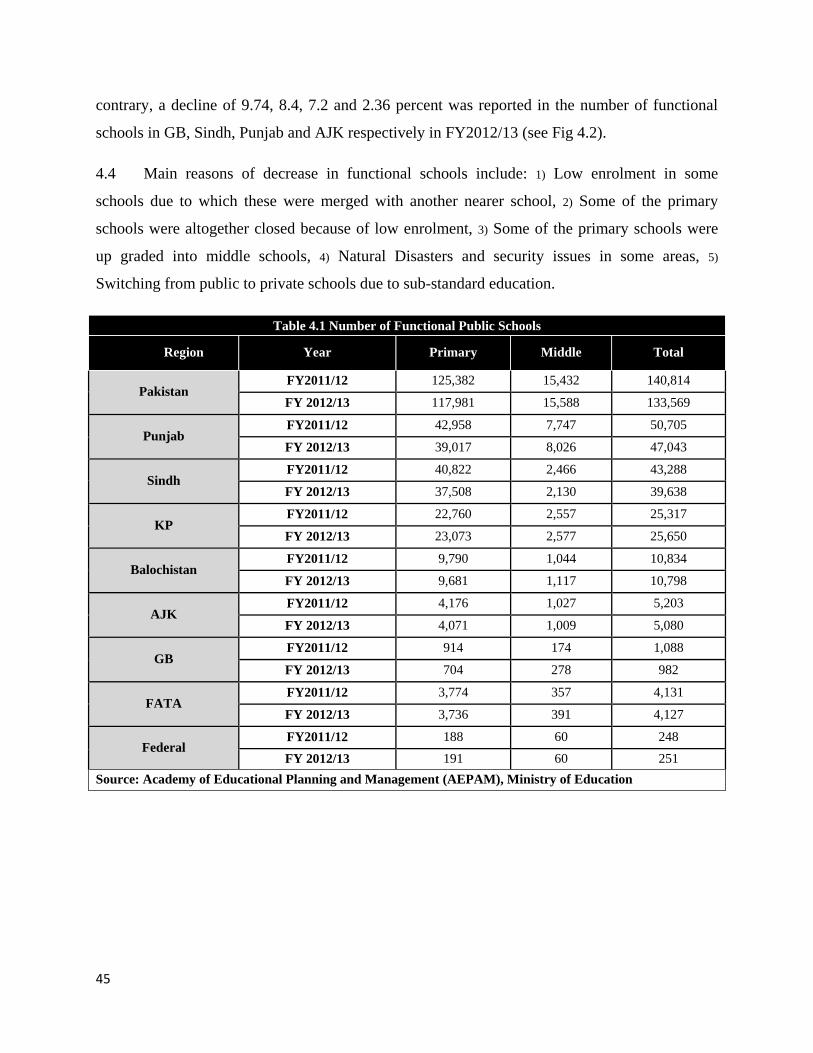
45
contrary, a decline of 9.74, 8.4, 7.2 and 2.36 percent was reported in the number of functional
schools in GB, Sindh, Punjab and AJK respectively in FY2012/13 (see Fig 4.2).
4.4 Main reasons of decrease in functional schools include: 1) Low enrolment in some
schools due to which these were merged with another nearer school, 2) Some of the primary
schools were altogether closed because of low enrolment, 3) Some of the primary schools were
up graded into middle schools, 4) Natural Disasters and security issues in some areas, 5)
Switching from public to private schools due to sub-standard education.
Table 4.1 Number of Functional Public Schools
Region Year Primary Middle Total
Pakistan FY2011/12 125,382 15,432 140,814
FY 2012/13 117,981 15,588 133,569
Punjab FY2011/12 42,958 7,747 50,705
FY 2012/13 39,017 8,026 47,043
Sindh FY2011/12 40,822 2,466 43,288
FY 2012/13 37,508 2,130 39,638
KP FY2011/12 22,760 2,557 25,317
FY 2012/13 23,073 2,577 25,650
Balochistan FY2011/12 9,790 1,044 10,834
FY 2012/13 9,681 1,117 10,798
AJK FY2011/12 4,176 1,027 5,203
FY 2012/13 4,071 1,009 5,080
GB FY2011/12 914 174 1,088
FY 2012/13 704 278 982
FATA FY2011/12 3,774 357 4,131
FY 2012/13 3,736 391 4,127
Federal FY2011/12 188 60 248
FY 2012/13 191 60 251
Source: Academy of Educational Planning and Management (AEPAM), Ministry of Education
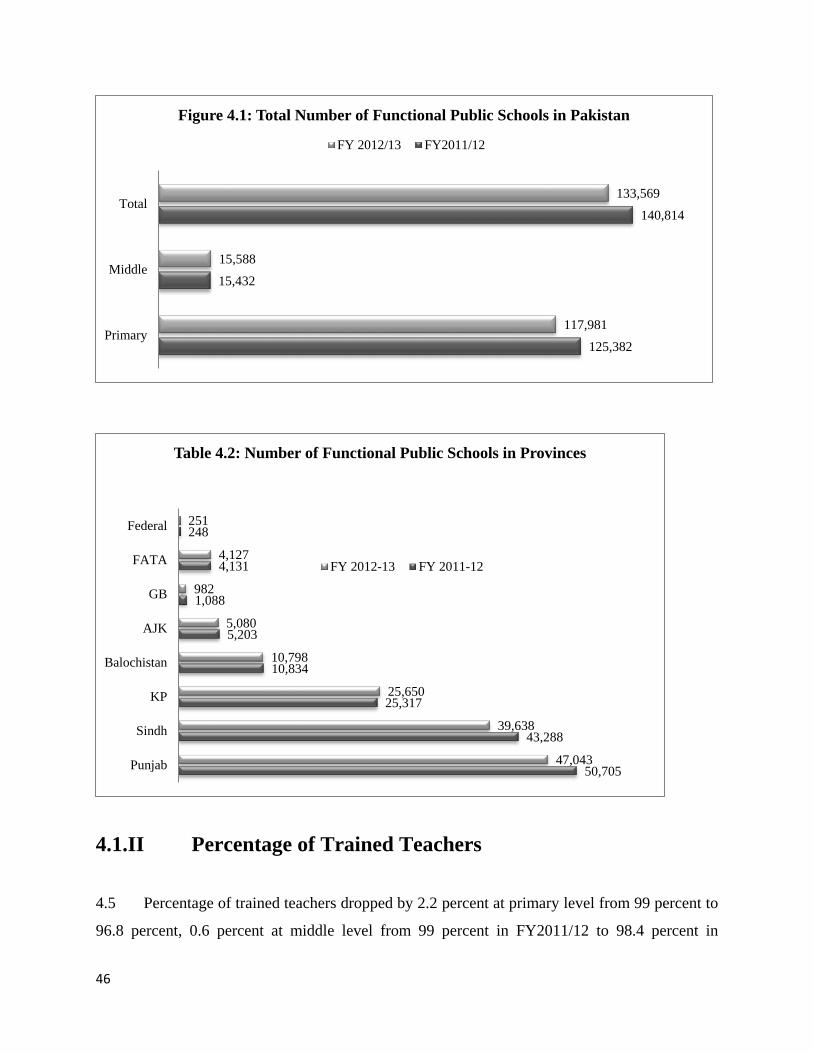
46
4.1.II Percentage of Trained Teachers
4.5 Percentage of trained teachers dropped by 2.2 percent at primary level from 99 percent to
96.8 percent, 0.6 percent at middle level from 99 percent in FY2011/12 to 98.4 percent in
125,382
15,432
140,814
117,981
15,588
133,569
Primary
Middle
Total
Figure 4.1: Total Number of Functional Public Schools in Pakistan
FY 2012/13 FY2011/12
50,705
43,288
25,317
10,834
5,203
1,088
4,131
248
47,043
39,638
25,650
10,798
5,080
982
4,127
251
Punjab
Sindh
KP
Balochistan
AJK
GB
FATA
Federal
Table 4.2: Number of Functional Public Schools in Provinces
FY 2012-13 FY 2011-12
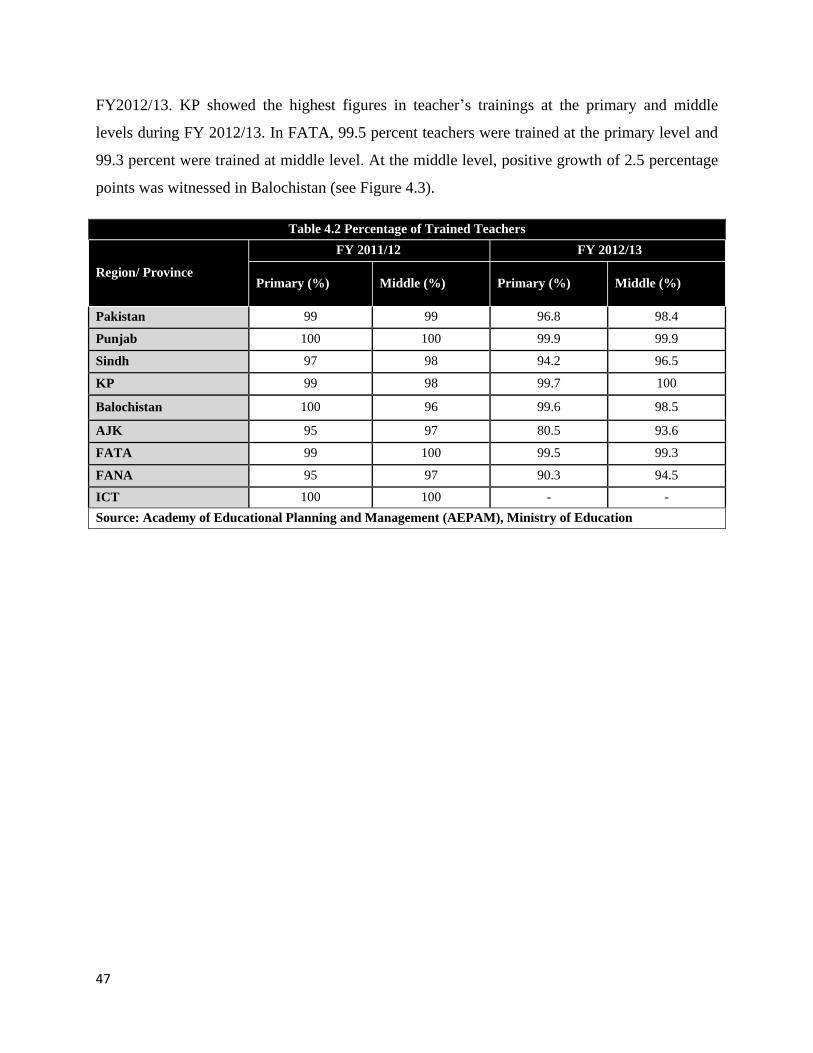
47
FY2012/13. KP showed the highest figures in teacher’s trainings at the primary and middle
levels during FY 2012/13. In FATA, 99.5 percent teachers were trained at the primary level and
99.3 percent were trained at middle level. At the middle level, positive growth of 2.5 percentage
points was witnessed in Balochistan (see Figure 4.3).
Table 4.2 Percentage of Trained Teachers
Region/ Province
FY 2011/12 FY 2012/13
Primary (%) Middle (%) Primary (%) Middle (%)
Pakistan 99 99 96.8 98.4
Punjab 100 100 99.9 99.9
Sindh 97 98 94.2 96.5
KP 99 98 99.7 100
Balochistan 100 96 99.6 98.5
AJK 95 97 80.5 93.6
FATA 99 100 99.5 99.3
FANA 95 97 90.3 94.5
ICT 100 100 - -
Source: Academy of Educational Planning and Management (AEPAM), Ministry of Education
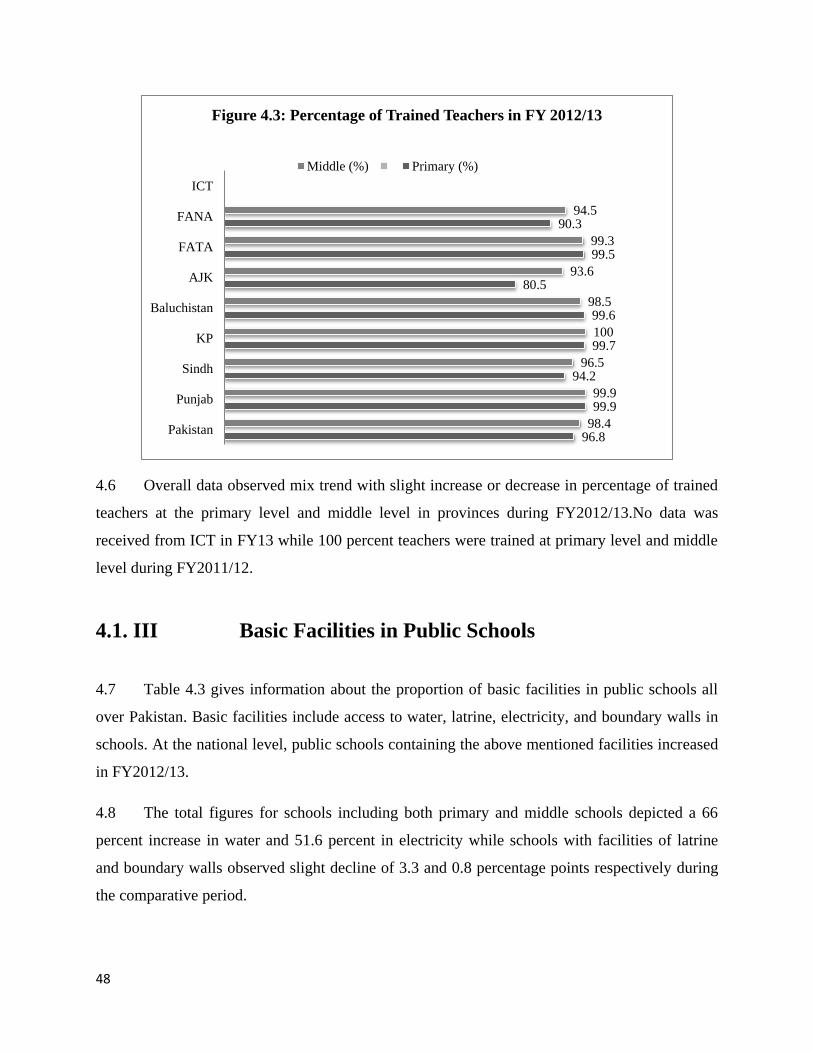
48
4.6 Overall data observed mix trend with slight increase or decrease in percentage of trained
teachers at the primary level and middle level in provinces during FY2012/13.No data was
received from ICT in FY13 while 100 percent teachers were trained at primary level and middle
level during FY2011/12.
4.1. III Basic Facilities in Public Schools
4.7 Table 4.3 gives information about the proportion of basic facilities in public schools all
over Pakistan. Basic facilities include access to water, latrine, electricity, and boundary walls in
schools. At the national level, public schools containing the above mentioned facilities increased
in FY2012/13.
4.8 The total figures for schools including both primary and middle schools depicted a 66
percent increase in water and 51.6 percent in electricity while schools with facilities of latrine
and boundary walls observed slight decline of 3.3 and 0.8 percentage points respectively during
the comparative period.
96.8
99.9
94.2
99.7
99.6
80.5
99.5
90.3
98.4
99.9
96.5
100
98.5
93.6
99.3
94.5
Pakistan
Punjab
Sindh
KP
Baluchistan
AJK
FATA
FANA
ICT
Figure 4.3: Percentage of Trained Teachers in FY 2012/13
Middle (%) Primary (%)
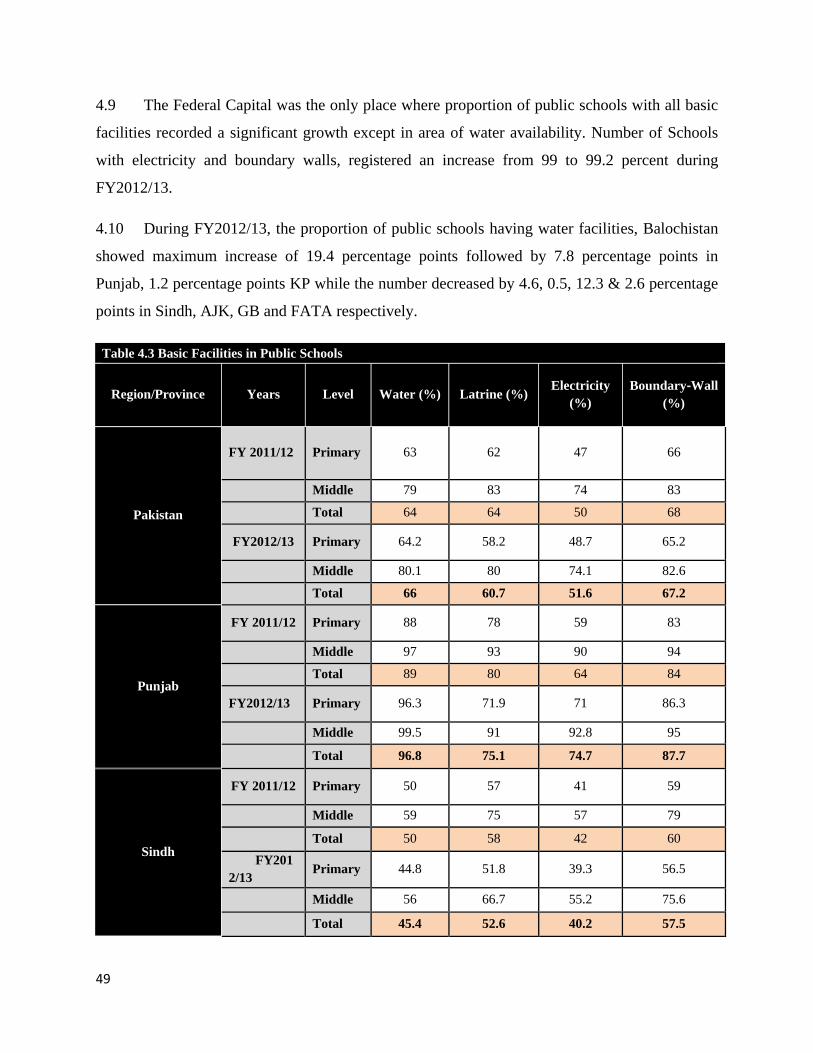
49
4.9 The Federal Capital was the only place where proportion of public schools with all basic
facilities recorded a significant growth except in area of water availability. Number of Schools
with electricity and boundary walls, registered an increase from 99 to 99.2 percent during
FY2012/13.
4.10 During FY2012/13, the proportion of public schools having water facilities, Balochistan
showed maximum increase of 19.4 percentage points followed by 7.8 percentage points in
Punjab, 1.2 percentage points KP while the number decreased by 4.6, 0.5, 12.3 & 2.6 percentage
points in Sindh, AJK, GB and FATA respectively.
Table 4.3 Basic Facilities in Public Schools
Region/Province Years Level Water (%) Latrine (%) Electricity
(%)
Boundary‐Wall
(%)
Pakistan
FY 2011/12 Primary 63 62 47 66
Middle 79 83 74 83
Total 64 64 50 68
FY2012/13 Primary 64.2 58.2 48.7 65.2
Middle 80.1 80 74.1 82.6
Total 66 60.7 51.6 67.2
Punjab
FY 2011/12 Primary 88 78 59 83
Middle 97 93 90 94
Total 89 80 64 84
FY2012/13 Primary 96.3 71.9 71 86.3
Middle 99.5 91 92.8 95
Total 96.8 75.1 74.7 87.7
Sindh
FY 2011/12 Primary 50 57 41 59
Middle 59 75 57 79
Total 50 58 42 60
FY201
2/13 Primary 44.8 51.8 39.3 56.5
Middle 56 66.7 55.2 75.6
Total 45.4 52.6 40.2 57.5
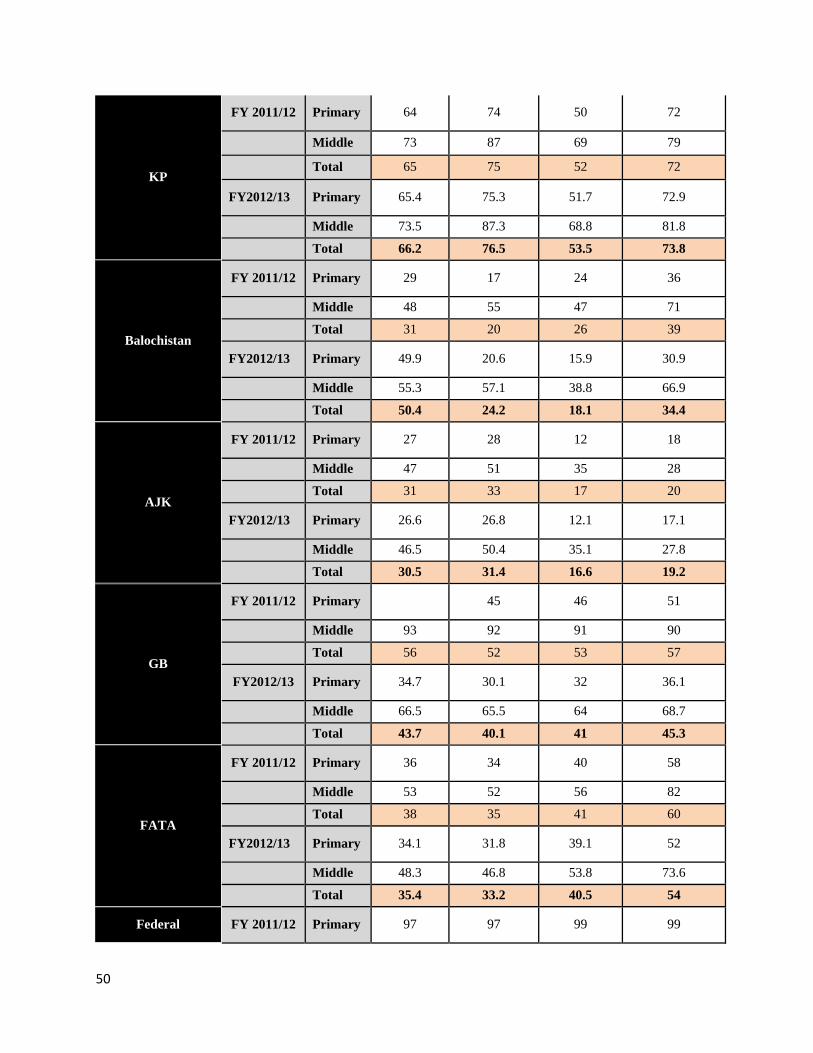
50
KP
FY 2011/12 Primary 64 74 50 72
Middle 73 87 69 79
Total 65 75 52 72
FY2012/13 Primary 65.4 75.3 51.7 72.9
Middle 73.5 87.3 68.8 81.8
Total 66.2 76.5 53.5 73.8
Balochistan
FY 2011/12 Primary 29 17 24 36
Middle 48 55 47 71
Total 31 20 26 39
FY2012/13 Primary 49.9 20.6 15.9 30.9
Middle 55.3 57.1 38.8 66.9
Total 50.4 24.2 18.1 34.4
AJK
FY 2011/12 Primary 27 28 12 18
Middle 47 51 35 28
Total 31 33 17 20
FY2012/13 Primary 26.6 26.8 12.1 17.1
Middle 46.5 50.4 35.1 27.8
Total 30.5 31.4 16.6 19.2
GB
FY 2011/12 Primary
45 46 51
Middle 93 92 91 90
Total 56 52 53 57
FY2012/13 Primary 34.7 30.1 32 36.1
Middle 66.5 65.5 64 68.7
Total 43.7 40.1 41 45.3
FATA
FY 2011/12 Primary 36 34 40 58
Middle 53 52 56 82
Total 38 35 41 60
FY2012/13 Primary 34.1 31.8 39.1 52
Middle 48.3 46.8 53.8 73.6
Total 35.4 33.2 40.5 54
Federal FY 2011/12 Primary 97 97 99 99

51
Middle 100 97 100 100
Total 98 97 99 99
FY201
2/13 Primary 96.9 99.5 99 99
Middle 98.3 100 100 100
Total 97.2 99.6 99.2 99.2
Source: Academy of Educational Planning and Management (AEPAM), Ministry of Education
4.11 Schools with latrine facilities registered an increase of 1.5 percentage points in KP and
4.2 percentage points in Balochistan whereas they decreased by 4.9 percentage points in
Punjab,5.4 percentage points in Sindh, 1.6 percentage points in AJK, 11.9 percentage points in
GB, and 1.8 percentage points in FATA. Proportion of schools with electricity facilities recorded
significant growth of 10.7 percentage points in Punjab and 1.5 percentage points in KP while the
remaining provinces had sizeable decline during the comparison period.
4.12 Percentage of public schools having boundary walls depicted encouraging trend of 3.7
percentage points in Punjab and 1.8 percentage points in KP. On the contrary, it decreased by
2.5, 4.6, 0.8, 11.7, 6 percentage points in Sindh, Baluchistan, AJK, GB and FATA respectively in
FY2012/13 when compared to FY2011/12.
6464
50
68
6660.7
51.667.2
Figure 4.4: Basic Facilities in Public Schools in
Pakistan (in percentage
FY 2011/12 FY2012/13
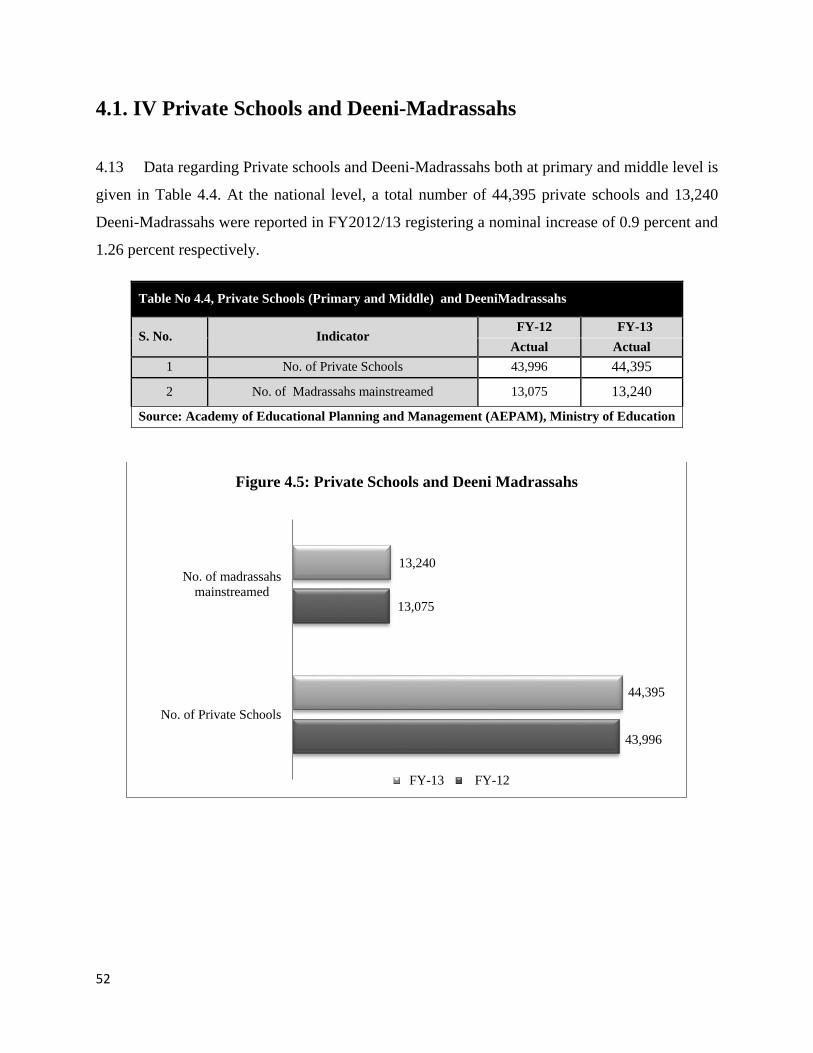
52
4.1. IV Private Schools and Deeni-Madrassahs
4.13 Data regarding Private schools and Deeni-Madrassahs both at primary and middle level is
given in Table 4.4. At the national level, a total number of 44,395 private schools and 13,240
Deeni-Madrassahs were reported in FY2012/13 registering a nominal increase of 0.9 percent and
1.26 percent respectively.
Table No 4.4, Private Schools (Primary and Middle) and DeeniMadrassahs
S. No. Indicator FY-12 FY-13
Actual Actual
1 No. of Private Schools 43,996 44,395
2 No. of Madrassahs mainstreamed 13,075 13,240
Source: Academy of Educational Planning and Management (AEPAM), Ministry of Education
43,996
13,075
44,395
13,240
No. of Private Schools
No. of madrassahs
mainstreamed
Figure 4.5: Private Schools and Deeni Madrassahs
FY-13 FY-12
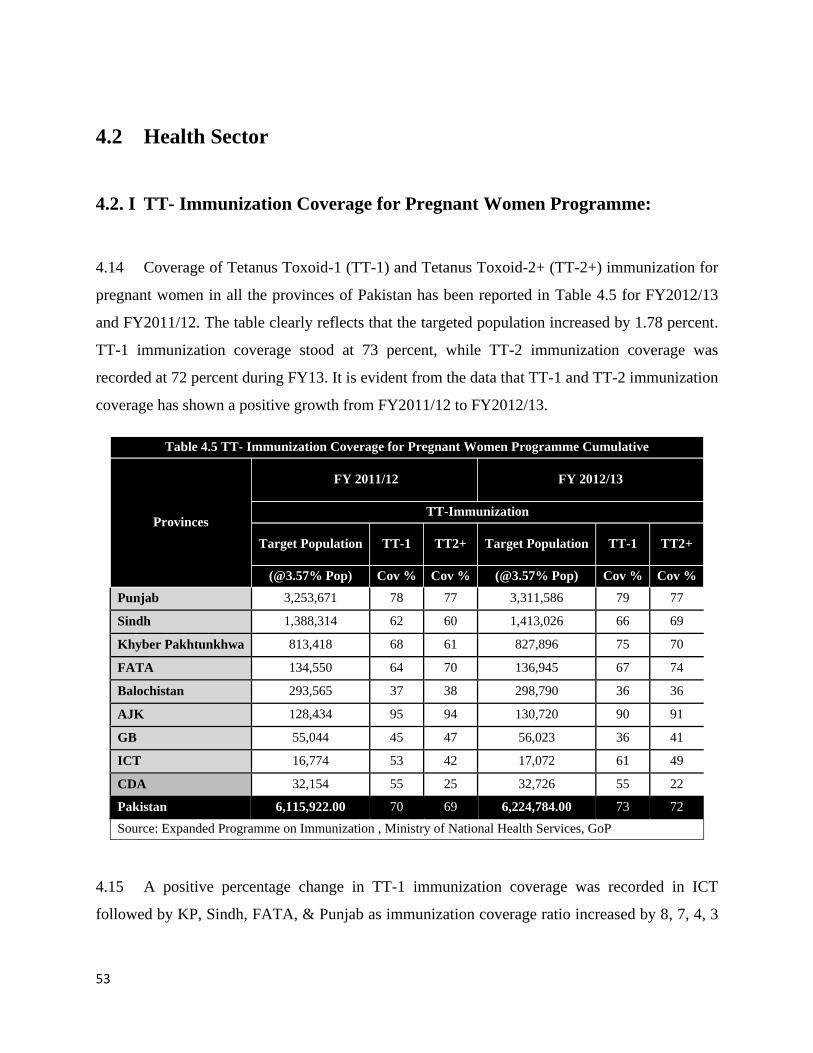
53
4.2 Health Sector
4.2. I TT- Immunization Coverage for Pregnant Women Programme:
4.14 Coverage of Tetanus Toxoid-1 (TT-1) and Tetanus Toxoid-2+ (TT-2+) immunization for
pregnant women in all the provinces of Pakistan has been reported in Table 4.5 for FY2012/13
and FY2011/12. The table clearly reflects that the targeted population increased by 1.78 percent.
TT-1 immunization coverage stood at 73 percent, while TT-2 immunization coverage was
recorded at 72 percent during FY13. It is evident from the data that TT-1 and TT-2 immunization
coverage has shown a positive growth from FY2011/12 to FY2012/13.
Table 4.5 TT- Immunization Coverage for Pregnant Women Programme Cumulative
Provinces
FY 2011/12 FY 2012/13
TT-Immunization
Target Population TT-1 TT2+ Target Population TT-1 TT2+
(@3.57% Pop) Cov % Cov % (@3.57% Pop) Cov % Cov %
Punjab 3,253,671 78 77 3,311,586 79 77
Sindh 1,388,314 62 60 1,413,026 66 69
Khyber Pakhtunkhwa 813,418 68 61 827,896 75 70
FATA 134,550 64 70 136,945 67 74
Balochistan 293,565 37 38 298,790 36 36
AJK 128,434 95 94 130,720 90 91
GB 55,044 45 47 56,023 36 41
ICT 16,774 53 42 17,072 61 49
CDA 32,154 55 25 32,726 55 22
Pakistan 6,115,922.00 70 69 6,224,784.00 73 72
Source: Expanded Programme on Immunization , Ministry of National Health Services, GoP
4.15 A positive percentage change in TT-1 immunization coverage was recorded in ICT
followed by KP, Sindh, FATA, & Punjab as immunization coverage ratio increased by 8, 7, 4, 3
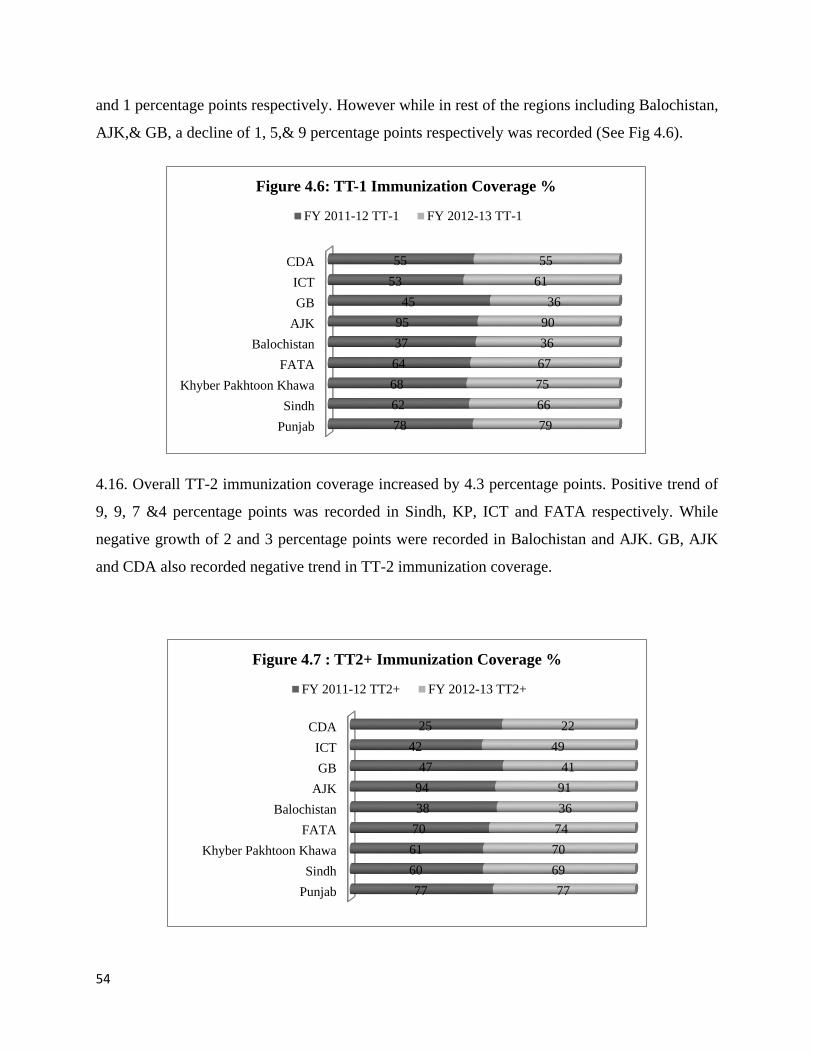
54
and 1 percentage points respectively. However while in rest of the regions including Balochistan,
AJK,& GB, a decline of 1, 5,& 9 percentage points respectively was recorded (See Fig 4.6).
4.16. Overall TT-2 immunization coverage increased by 4.3 percentage points. Positive trend of
9, 9, 7 &4 percentage points was recorded in Sindh, KP, ICT and FATA respectively. While
negative growth of 2 and 3 percentage points were recorded in Balochistan and AJK. GB, AJK
and CDA also recorded negative trend in TT-2 immunization coverage.
Punjab
Sindh
Khyber Pakhtoon Khawa
FATA
Balochistan
AJK
GB
ICT
CDA
78
62
68
64
37
95
45
53
55
79
66
75
67
36
90
36
61
55
Figure 4.6: TT-1 Immunization Coverage %
FY 2011-12 TT-1 FY 2012-13 TT-1
Punjab
Sindh
Khyber Pakhtoon Khawa
FATA
Balochistan
AJK
GB
ICT
CDA
77
60
61
70
38
94
47
42
25
77
69
70
74
36
91
41
49
22
Figure 4.7 : TT2+ Immunization Coverage %
FY 2011-12 TT2+ FY 2012-13 TT2+
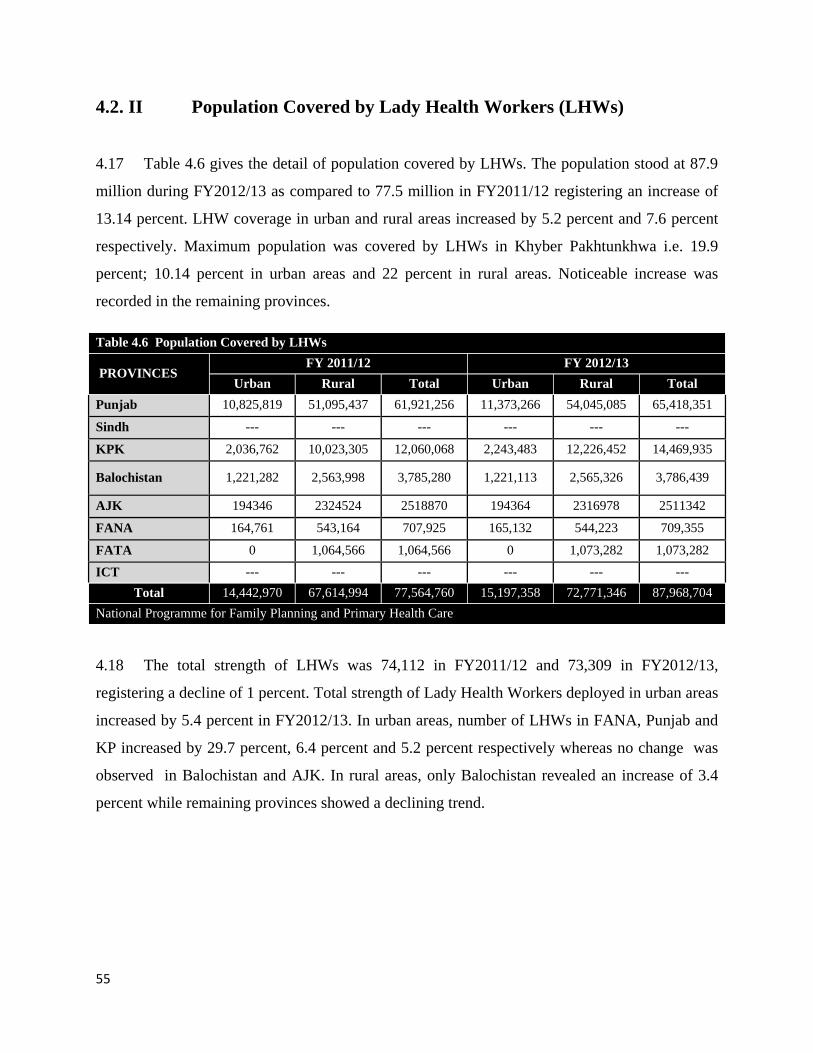
55
4.2. II Population Covered by Lady Health Workers (LHWs)
4.17 Table 4.6 gives the detail of population covered by LHWs. The population stood at 87.9
million during FY2012/13 as compared to 77.5 million in FY2011/12 registering an increase of
13.14 percent. LHW coverage in urban and rural areas increased by 5.2 percent and 7.6 percent
respectively. Maximum population was covered by LHWs in Khyber Pakhtunkhwa i.e. 19.9
percent; 10.14 percent in urban areas and 22 percent in rural areas. Noticeable increase was
recorded in the remaining provinces.
Table 4.6 Population Covered by LHWs
PROVINCES FY 2011/12 FY 2012/13
Urban Rural Total Urban Rural Total
Punjab 10,825,819 51,095,437 61,921,256 11,373,266 54,045,085 65,418,351
Sindh --- --- --- --- --- ---
KPK 2,036,762 10,023,305 12,060,068 2,243,483 12,226,452 14,469,935
Balochistan 1,221,282 2,563,998 3,785,280 1,221,113 2,565,326 3,786,439
AJK 194346 2324524 2518870 194364 2316978 2511342
FANA 164,761 543,164 707,925 165,132 544,223 709,355
FATA 0 1,064,566 1,064,566 0 1,073,282 1,073,282
ICT --- --- --- --- --- ---
Total 14,442,970 67,614,994 77,564,760 15,197,358 72,771,346 87,968,704
National Programme for Family Planning and Primary Health Care
4.18 The total strength of LHWs was 74,112 in FY2011/12 and 73,309 in FY2012/13,
registering a decline of 1 percent. Total strength of Lady Health Workers deployed in urban areas
increased by 5.4 percent in FY2012/13. In urban areas, number of LHWs in FANA, Punjab and
KP increased by 29.7 percent, 6.4 percent and 5.2 percent respectively whereas no change was
observed in Balochistan and AJK. In rural areas, only Balochistan revealed an increase of 3.4
percent while remaining provinces showed a declining trend.
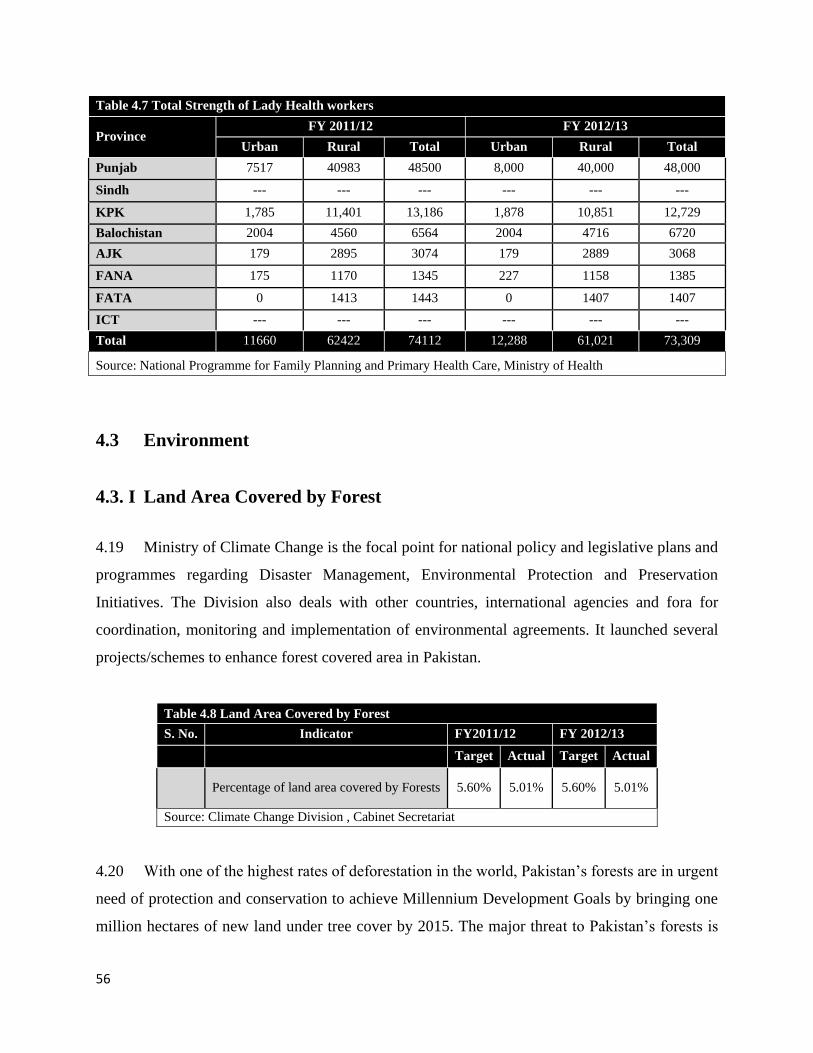
56
Table 4.7 Total Strength of Lady Health workers
Province FY 2011/12 FY 2012/13
Urban Rural Total Urban Rural Total
Punjab 7517 40983 48500 8,000 40,000 48,000
Sindh --- --- --- --- --- ---
KPK 1,785 11,401 13,186 1,878 10,851 12,729
Balochistan 2004 4560 6564 2004 4716 6720
AJK 179 2895 3074 179 2889 3068
FANA 175 1170 1345 227 1158 1385
FATA 0 1413 1443 0 1407 1407
ICT --- --- --- --- --- ---
Total 11660 62422 74112 12,288 61,021 73,309
Source: National Programme for Family Planning and Primary Health Care, Ministry of Health
4.3 Environment
4.3. I Land Area Covered by Forest
4.19 Ministry of Climate Change is the focal point for national policy and legislative plans and
programmes regarding Disaster Management, Environmental Protection and Preservation
Initiatives. The Division also deals with other countries, international agencies and fora for
coordination, monitoring and implementation of environmental agreements. It launched several
projects/schemes to enhance forest covered area in Pakistan.
Table 4.8 Land Area Covered by Forest
S. No. Indicator FY2011/12 FY 2012/13
Target Actual Target Actual
1 Percentage of land area covered by Forests 5.60% 5.01% 5.60% 5.01%
Source: Climate Change Division , Cabinet Secretariat
4.20 With one of the highest rates of deforestation in the world, Pakistan’s forests are in urgent
need of protection and conservation to achieve Millennium Development Goals by bringing one
million hectares of new land under tree cover by 2015. The major threat to Pakistan’s forests is
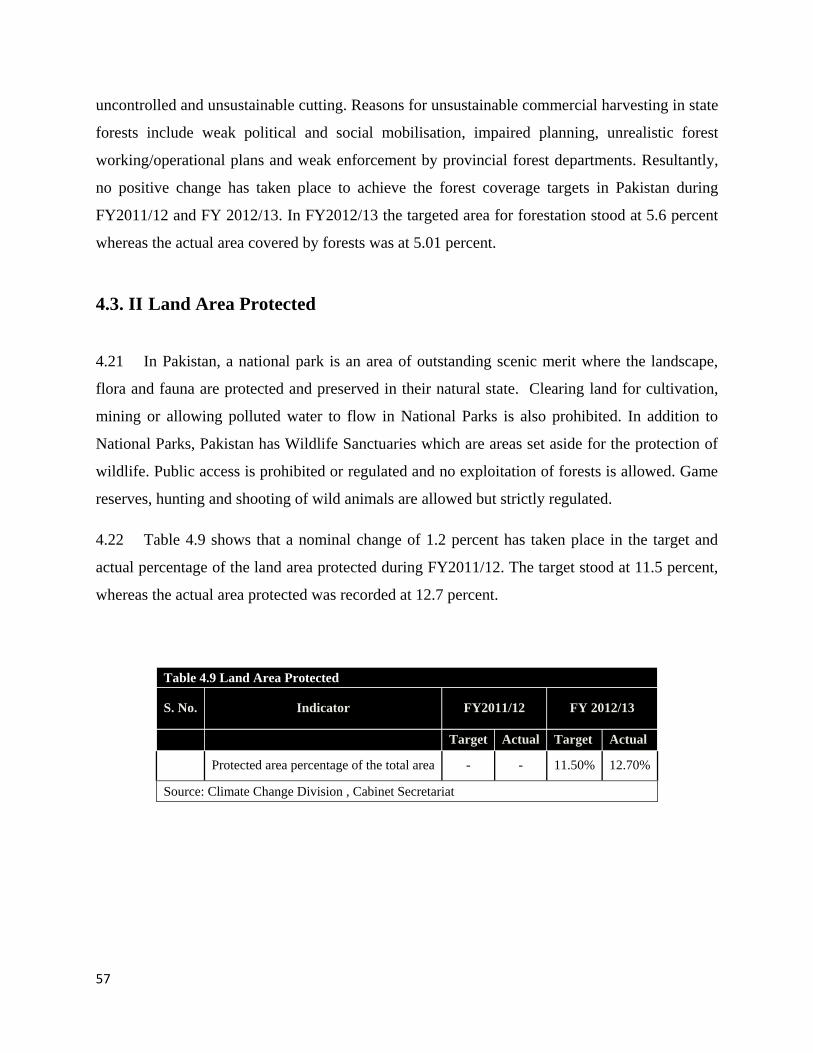
57
uncontrolled and unsustainable cutting. Reasons for unsustainable commercial harvesting in state
forests include weak political and social mobilisation, impaired planning, unrealistic forest
working/operational plans and weak enforcement by provincial forest departments. Resultantly,
no positive change has taken place to achieve the forest coverage targets in Pakistan during
FY2011/12 and FY 2012/13. In FY2012/13 the targeted area for forestation stood at 5.6 percent
whereas the actual area covered by forests was at 5.01 percent.
4.3. II Land Area Protected
4.21 In Pakistan, a national park is an area of outstanding scenic merit where the landscape,
flora and fauna are protected and preserved in their natural state. Clearing land for cultivation,
mining or allowing polluted water to flow in National Parks is also prohibited. In addition to
National Parks, Pakistan has Wildlife Sanctuaries which are areas set aside for the protection of
wildlife. Public access is prohibited or regulated and no exploitation of forests is allowed. Game
reserves, hunting and shooting of wild animals are allowed but strictly regulated.
4.22 Table 4.9 shows that a nominal change of 1.2 percent has taken place in the target and
actual percentage of the land area protected during FY2011/12. The target stood at 11.5 percent,
whereas the actual area protected was recorded at 12.7 percent.
Table 4.9 Land Area Protected
S. No. Indicator FY2011/12 FY 2012/13
Target Actual Target Actual
Protected area percentage of the total area - - 11.50% 12.70%
Source: Climate Change Division , Cabinet Secretariat
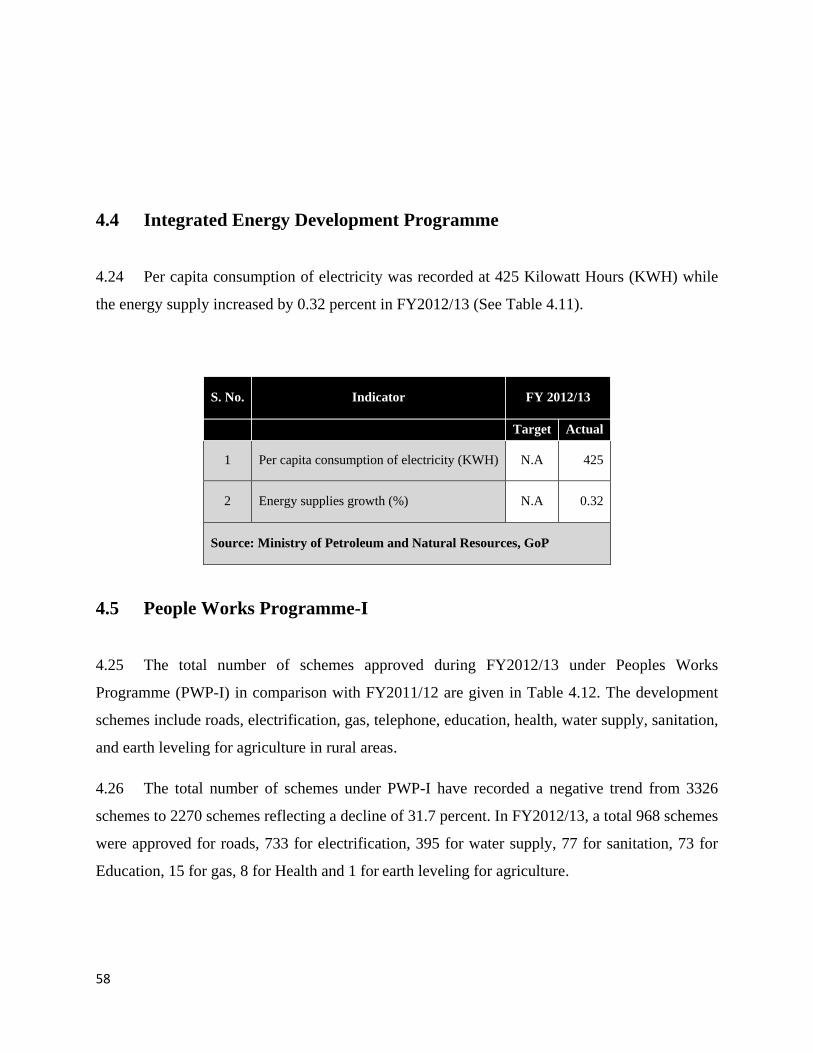
58
4.4 Integrated Energy Development Programme
4.24 Per capita consumption of electricity was recorded at 425 Kilowatt Hours (KWH) while
the energy supply increased by 0.32 percent in FY2012/13 (See Table 4.11).
S. No. Indicator FY 2012/13
Target Actual
1 Per capita consumption of electricity (KWH) N.A 425
2 Energy supplies growth (%) N.A 0.32
Source: Ministry of Petroleum and Natural Resources, GoP
4.5 People Works Programme-I
4.25 The total number of schemes approved during FY2012/13 under Peoples Works
Programme (PWP-I) in comparison with FY2011/12 are given in Table 4.12. The development
schemes include roads, electrification, gas, telephone, education, health, water supply, sanitation,
and earth leveling for agriculture in rural areas.
4.26 The total number of schemes under PWP-I have recorded a negative trend from 3326
schemes to 2270 schemes reflecting a decline of 31.7 percent. In FY2012/13, a total 968 schemes
were approved for roads, 733 for electrification, 395 for water supply, 77 for sanitation, 73 for
Education, 15 for gas, 8 for Health and 1 for earth leveling for agriculture.
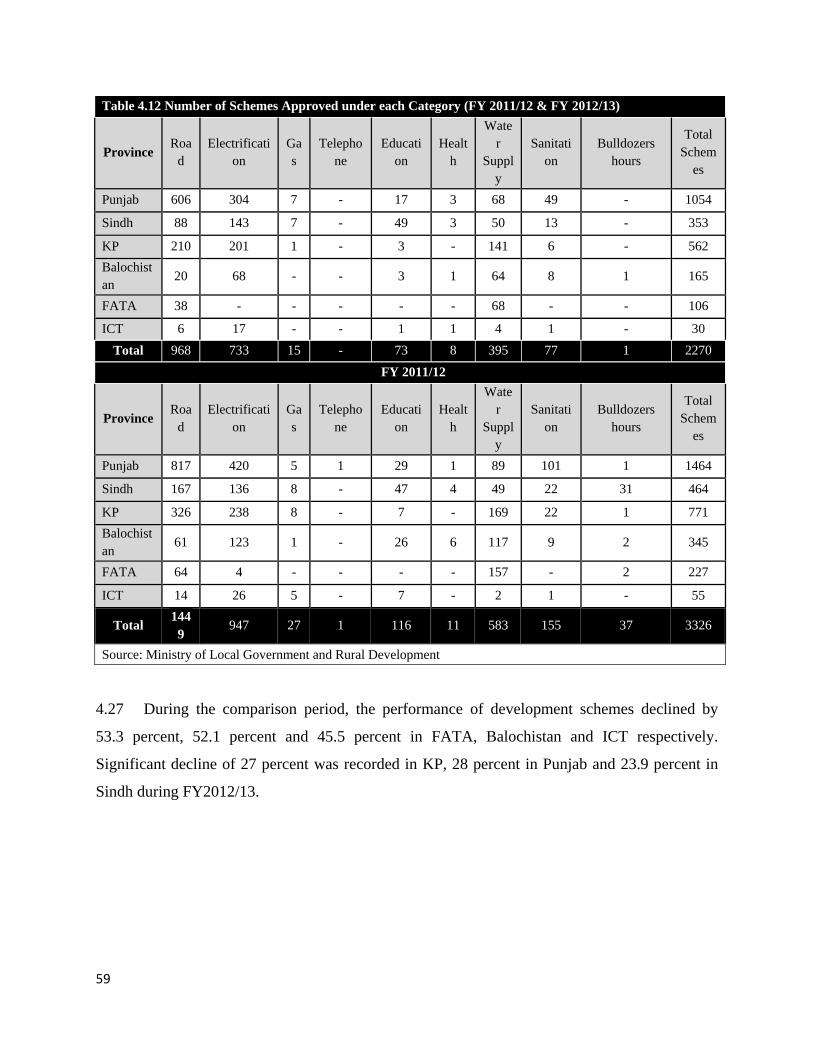
59
Table 4.12 Number of Schemes Approved under each Category (FY 2011/12 & FY 2012/13)
Province Roa
d
Electrificati
on
Ga
s
Telepho
ne
Educati
on
Healt
h
Wate
r
Suppl
y
Sanitati
on
Bulldozers
hours
Total
Schem
es
Punjab 606 304 7 - 17 3 68 49 - 1054
Sindh 88 143 7 - 49 3 50 13 - 353
KP 210 201 1 - 3 - 141 6 - 562
Balochist
an 20 68 - - 3 1 64 8 1 165
FATA 38 - - - - - 68 - - 106
ICT 6 17 - - 1 1 4 1 - 30
Total 968 733 15 - 73 8 395 77 1 2270
FY 2011/12
Province Roa
d
Electrificati
on
Ga
s
Telepho
ne
Educati
on
Healt
h
Wate
r
Suppl
y
Sanitati
on
Bulldozers
hours
Total
Schem
es
Punjab 817 420 5 1 29 1 89 101 1 1464
Sindh 167 136 8 - 47 4 49 22 31 464
KP 326 238 8 - 7 - 169 22 1 771
Balochist
an 61 123 1 - 26 6 117 9 2 345
FATA 64 4 - - - - 157 - 2 227
ICT 14 26 5 - 7 - 2 1 - 55
Total 144
9 947 27 1 116 11 583 155 37 3326
Source: Ministry of Local Government and Rural Development
4.27 During the comparison period, the performance of development schemes declined by
53.3 percent, 52.1 percent and 45.5 percent in FATA, Balochistan and ICT respectively.
Significant decline of 27 percent was recorded in KP, 28 percent in Punjab and 23.9 percent in
Sindh during FY2012/13.
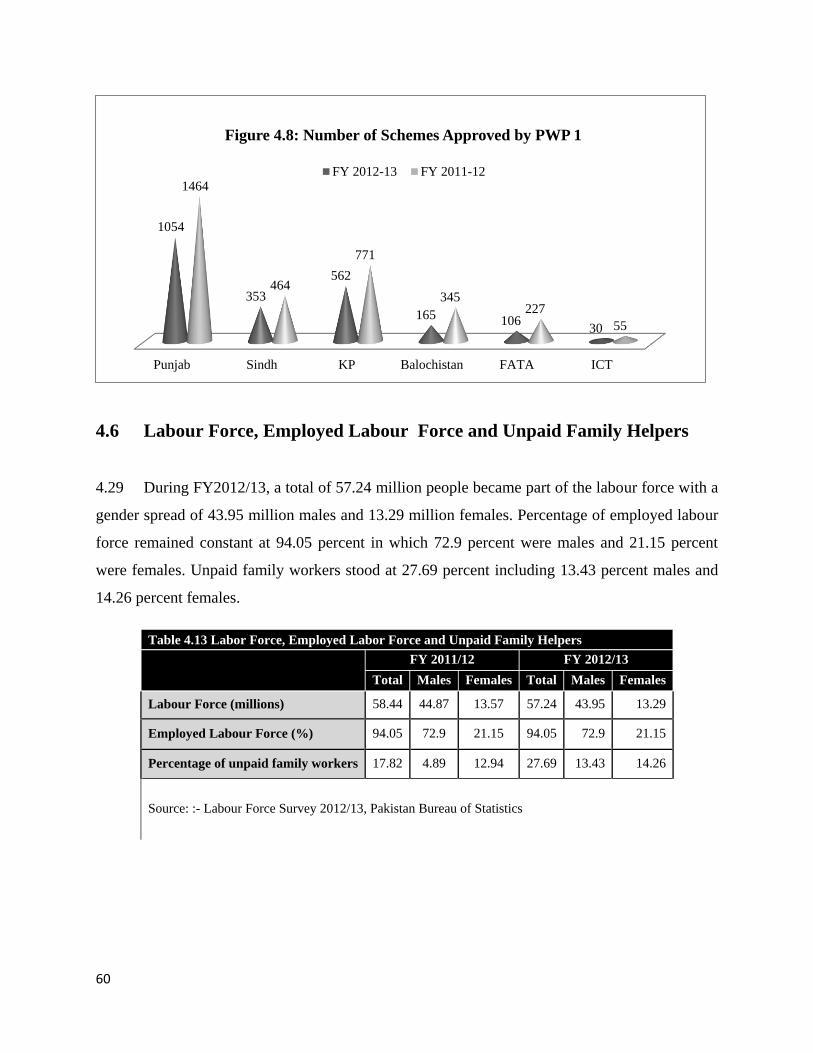
60
4.6 Labour Force, Employed Labour Force and Unpaid Family Helpers
4.29 During FY2012/13, a total of 57.24 million people became part of the labour force with a
gender spread of 43.95 million males and 13.29 million females. Percentage of employed labour
force remained constant at 94.05 percent in which 72.9 percent were males and 21.15 percent
were females. Unpaid family workers stood at 27.69 percent including 13.43 percent males and
14.26 percent females.
Table 4.13 Labor Force, Employed Labor Force and Unpaid Family Helpers
FY 2011/12 FY 2012/13
Total Males Females Total Males Females
Labour Force (millions) 58.44 44.87 13.57 57.24 43.95 13.29
Employed Labour Force (%) 94.05 72.9 21.15 94.05 72.9 21.15
Percentage of unpaid family workers 17.82 4.89 12.94 27.69 13.43 14.26
Source: :- Labour Force Survey 2012/13, Pakistan Bureau of Statistics
Punjab Sindh KP Balochistan FATA ICT
1054
353
562
165 10630
1464
464
771
345227
55
Figure 4.8: Number of Schemes Approved by PWP 1
FY 2012-13 FY 2011-12
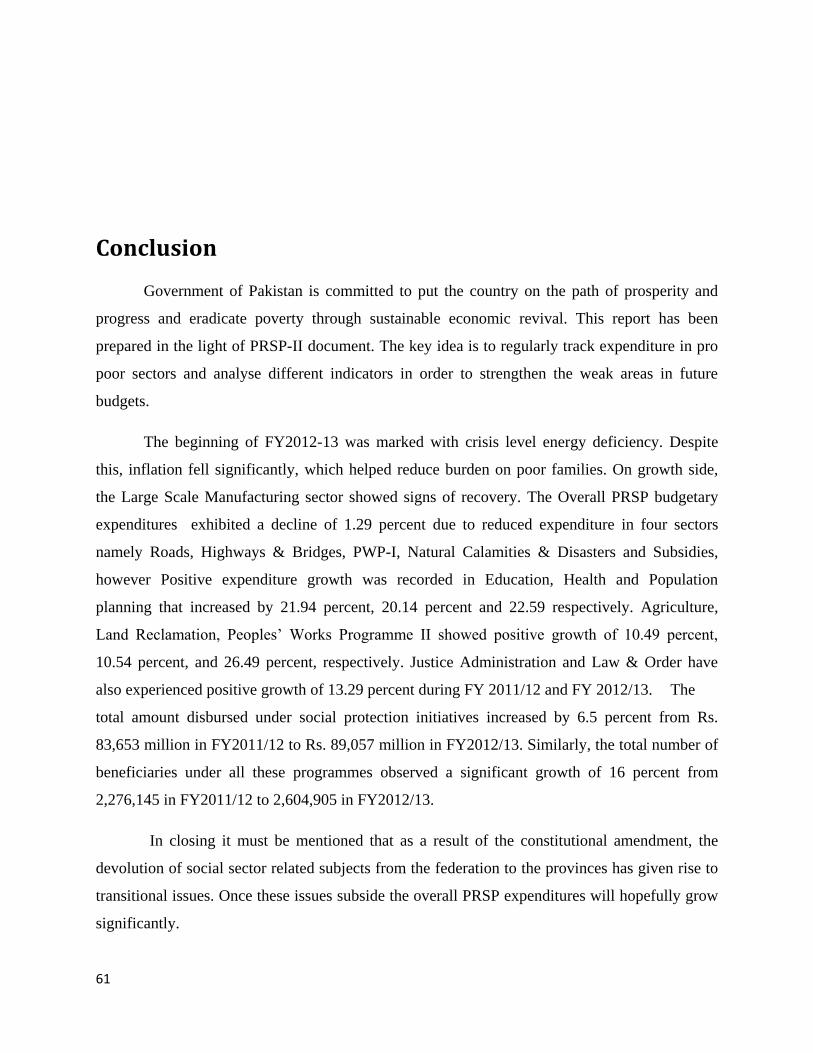
61
Conclusion
Government of Pakistan is committed to put the country on the path of prosperity and
progress and eradicate poverty through sustainable economic revival. This report has been
prepared in the light of PRSP-II document. The key idea is to regularly track expenditure in pro
poor sectors and analyse different indicators in order to strengthen the weak areas in future
budgets.
The beginning of FY2012-13 was marked with crisis level energy deficiency. Despite
this, inflation fell significantly, which helped reduce burden on poor families. On growth side,
the Large Scale Manufacturing sector showed signs of recovery. The Overall PRSP budgetary
expenditures exhibited a decline of 1.29 percent due to reduced expenditure in four sectors
namely Roads, Highways & Bridges, PWP-I, Natural Calamities & Disasters and Subsidies,
however Positive expenditure growth was recorded in Education, Health and Population
planning that increased by 21.94 percent, 20.14 percent and 22.59 respectively. Agriculture,
Land Reclamation, Peoples’ Works Programme II showed positive growth of 10.49 percent,
10.54 percent, and 26.49 percent, respectively. Justice Administration and Law & Order have
also experienced positive growth of 13.29 percent during FY 2011/12 and FY 2012/13. The
total amount disbursed under social protection initiatives increased by 6.5 percent from Rs.
83,653 million in FY2011/12 to Rs. 89,057 million in FY2012/13. Similarly, the total number of
beneficiaries under all these programmes observed a significant growth of 16 percent from
2,276,145 in FY2011/12 to 2,604,905 in FY2012/13.
In closing it must be mentioned that as a result of the constitutional amendment, the
devolution of social sector related subjects from the federation to the provinces has given rise to
transitional issues. Once these issues subside the overall PRSP expenditures will hopefully grow
significantly.